Pro Convent National velopm - IEI
190
-
Upload
khangminh22 -
Category
Documents
-
view
0 -
download
0
Transcript of Pro Convent National velopm - IEI


‘Tre
Me
35th Nat
ends an
Th
echan
tional C
N
nd Dev
4
e Inst
ical En
HOS
Pro
Convent
National
velopm
th – 5th S
Dr. J.Dr. L.
Or
titutioUn
nginee
H
SUR L
oceedin
tion of M&
l Confer
ments in
SeptemOrganized by
Editors
ArivudainShakeel A
rganized
on of Ender the aegering D
Hosted b
LOCAL
ngs
Mechan
rence o
n Auto
ber 201
nambi Ahmed
by
Enginegis of Divisio
by
L CENT
nical En
on
omotive
19
eers (I
on Boa
TRE
gineers
e Indus
India)
ard of I
s
stry’
)
IEI

Natio
ISBN: 9
Copyrig
For Aut
As soon
article (o
widest p
regulatio
For Rea
While th
date of
respons
warranty
All articl
rights to
Material
microfilm
the orga
tradema
are not
send req
Road, K
Copyrig
As per B
full or in
The Inst
The Inst
as well
necessa
reproduc
means,
The 8 Gokhal
Ph: +91 (
E-mail: te
Website:
Proonal Seminar
78-81-93970
ght informat
hors
n as an articl
or to grant ex
possible prot
ons for this T
aders
he advice an
its publicat
ibility for any
y, express or
e published
o reproduce
published
m, in electron
anizer (respe
arks, etc., in t
protected by
quest addres
Kolkata 70002
ght
By-Laws 118
abstract at i
titution of E
titution of En
as online ed
arily reflect t
ced may be
without prior
Institule Road, Kolka
(033) 2223-83
echnical@iein
http://www.ie
oceedings: 35on ‘Trends an
09-8-0
tion
le is accepte
xclusive publ
ection and d
Technical Vol
d information
ions neither
y errors or om
r implied, wit
in this Tech
and distribu
in this Tec
nic data base
ective the co
this publicati
y the relevan
ssed to: The
20 (Tel.: 033
8, Copyright
ts Centres s
Engineers [In
ngineers (Ind
dition of pro
those of the
reproduced
r written perm
ution ofata 700 020
3211 /14/15/16
dia.org; iei.tec
india.org
5th IEI Nationand Developme
ed for publica
lication and d
dissemination
lume is avail
n in this Tec
r the author
missions that
h respect to
hnical Volum
ute the articl
hnical Volum
es, on videos
opyright owne
on, even if n
nt laws and
e Director (Te
3-40106213 o
of each pap
hall lie with t
ndia] 2019
dia) has exclu
oceeding wo
e institution.
d, stored in a
mission of the
f Engin
6; +91 (033) 2
chnical@gmai
.
ii
l Convention oents in Automo
ation authors
disseminatio
n under copy
able at: www
chnical Volum
rs, the edito
t may have b
the material
me are protec
e (e.g., as o
me may be
s disks, etc, w
er). The use
not specifical
regulations.
echnical), Th
or Email: tec
per published
the Institution
usive rights a
rldwide. The
All rights re
a retrieval s
e Institution o
neers (I
223-8345 Fax
il.com
of Mechanicaotive Industry
s will be req
on rights) to t
yright laws. M
w.ieindia.org
me is believe
ors nor the
been made.
contained h
cted by copy
offprint), as
reproduced
without first
e of general d
ly identified,
For permiss
he Institution
hnnical@iein
d in the insti
n.
and license
e views expr
eserved. No
system or tra
of Engineers
India)
x: +91 (033) 22
l Engineers any’ during Septe
uested to as
he organizer
More informa
ed to be true
publisher ca
The publishe
erein.
yright which
well as all t
d photograp
obtaining wr
description n
does not im
sion to reuse
n of Enginee
ndia.org)
itution journa
to publish an
ressed in th
part of this
ansmitted in
s (India).
223 -8345
nd ember 4 ‐ 5, 2
ssign copyrig
r. This will en
ation about c
e and accura
an accept a
er/organizer
covers the e
translation ri
hically or st
ritten permiss
names, trade
ply that thes
e our conten
rs (India), 8
als or procee
nd distribute
is publicatio
s publication
any form o
019.
ght of the
nsure the
copyright
ate at the
any legal
make no
exclusive
ghts. No
tored on
sion from
e names,
se names
nt please
Gokhale
edings in
the print
n do not
may be
or by any

Natio
69
Dr. J. AChairm
The Natiosuch as aindustry unskilledRs 16.16‐2019.
This is thinceptionCentre bcaliber oorganizin
At this poLocal Cena very me
I am sureresult in
I am certTechnoloin Mechaoverall d
I wish
Phone
Proonal Seminar
T, Kamaraja N
Arivudainamman
onal Conferenavailability ofalso provides labour. India‐18.18 trillion
he fifth ‘Megan, approved bby IEI Headquof Hosur Locang this import
oint of time, ntre Dr. G. Raeticulous way
e that the delbetter unders
tain that the ogy and thus hanical Engineeevelopment o
h the National
es : + 91‐33‐2223
oceedings: 35on ‘Trends an
The InsNagar, Near A
“100Enginee
mbi, FIE.,
nce aims inprf skilled labou great opportan automotivn (US$ 251.4‐2
’ event hosteby IEI, Kolkataarters at Kolkal Centre. I ant event suc
I am failing innganath, whoy.
iberations onstanding and k
National Conhelp in undersering sector, of our Nation.
l Convention a
38311/14/15/16
5th IEI Nationand Developme
stitutio HOSUR
Adhiyamaan C
0 Years of Rering Adva
It giConvon ‘the a05 S(IndEngiAero
rojecting the aur at low costunities for invve industry (in282.8 billion)
d by Hosur Loa to host the kata and the am sure thatccessfully.
n my duty if I o had laid a ve
the topics wknowledge sh
nvention woustanding the fattracting inv
a great succes
IEI, 8, Gokhale
6/34 Facsimile
.
iii
l Convention oents in Automo
on of ER LOCAL CCollege of En
Relentless Jncement fo
FOREWives me immvention of M‘Trends and Daegis of MechSeptember 20ia), Kolkata neering, Adho Wing Semin
automobile int, robust R&Dvestment andncluding comby 2026. Two
ocal Centre wevent. This sChairman, Mt my bustling
not thank myery strong fou
ould cover allharing among
ld pave way future trends vestment in a
ss.
HEADQUARTe Road, Kolkat; +91‐33‐2223 8
of Mechanicaotive Industry
EngineCENTRE gineering, Ku
ourney towor Nation B
WORD mense pleasurechanical EngDevelopmentshanical Engine019 organizedin associatioiyamaan Collear Hall of Adh
ndustry, whichD centres and direct and in
mponent manuo‐wheelers are
ithin a very shshows the conMechanical Eng team will p
y predecessorundation to or
l aspects of Athe Engineeri
for enhancingand developmutomotive in
TERS a – 700 020 8345 Web : http
l Engineers any’ during Septe
eers (Iumudepalli, H
wards Building”
re in hostinggineers and Ns in Automoteering Divisiond by The Instion with Deege of Enginehiyamaan Colle
h is supportedd low cost stedirect employufacturing) is e expected to
hort period ofnfidence repongineering Divrove its capa
r and founderrganize such m
Automotive teng fraternity.
g the knowlement requiremdustry, ultima
(D
p://www.ieindia
nd ember 4 ‐ 5, 2
India) Hosur – 635 1
g the 35th NaNational Confetive Industry’ n Board of IEI tution of Engpt. of Mecheering, Hosur ege of Engine
d by various feel productioyment to skilleexpected to
o grow 9 per c
f four years frosed on Hosuvision Board oacity once ag
r Chairman of mammoth eve
chnology whi
dge on Automment of our coately leading
Dr. J. Arivudain
a.org. Gram : EN
019.
30.
ational erence under on 04‐gineers hanical in the
eering.
factors n. The ed and reach
cent in
rom its r Local on the ain by
Hosur ents in
ch will
motive ountry to the
Sd/‐ nambi)
NJOIND

Natio
Chairma
Co-Cha
Conven
Member
Proonal Seminar
an :
irman :
nor :
rs :
oceedings: 35on ‘Trends an
Na
Dr. T. M. G
Er. Jagroop
Dr. ChananProfessor anAdhiyamaan
Er. Arvinde
Dr. Swapan
Dr. Arun Ku
Prof. K. Ven
Prof. (Dr.) R
Prof. (Dr.) R
Dr. Sashind
Dr. Wooday
Prof. (Dr.) K
Dr. Pradeep
Er. S K Ban
Prof. (Dr.) K
Er. A Mukhe
Dr. G.Ranga
Er. Enti Ran
Er. Kiran Ch
Ms. K.Padm
Dr. O. Ram
Er. V. Vijaya
Er. Prabhak
Dr. R. Venk
Dr. R. L.Shr
Er. S. S. Ya
Dr. Neeraj D
Mr. R. Ramd
Er. P. Goma
Er. R. Peria
Er. S. Karup
Er. D. Kuma
Dr. P. Udha
Prof. (Dr.). V
5th IEI Nationand Developme
ational A
unaraja, FIE
p Singh, FIE
kaiah, FIE.,nd Head Depn College of E
erSingh Ba
n Bhaumik, F
umar Shriva
nkatasubba
R Suresh, FI
Rajat Gupta,
dra Kumar K
y P Krishna,
K Palani Kum
p Chaturved
nerji, FIE., M
K Brahma Ra
erjee, FIE., M
anath, FIE.,
nga Reddy,
hander Seth
mini, FIE., Me
Mohan Rao
achandran N
kar Singh, F
katesan, FIE
rivastava, F
dav, FIE., M
Dave, FIE., M
doss, FIE., C
athinayagam
asamy, Comm
ppasamy, C
ar, Committe
ayakumar, C
V. Manivasa
.
iv
l Convention oents in Automo
Advisory
E., President,
., Chairman,
pt. of MechanEngineering,
kshi, FIE., V
FIE., Vice Pr
astava, FIE.,
iah, FIE., Me
E, Member,
, FIE., Memb
Kakoty, FIE.,
, FIE., Memb
mar, FIE., M
di, FIE., Mem
Member, MCD
aju, FIE., Me
Member, MC
Chairman, C
FIE., Membe
hi, FIE., Mem
ember, MCD
o, FIE., Memb
Nair, FIE., M
FIE., Member
., Member, M
IE., Member
Member, MCD
Member, MC
Chairman, IE
m, MIE., Hon
mittee Memb
Committee Me
ee Member,
Committee M
agan, MIE., H
of Mechanicaotive Industry
Committ
, IEI
, MCDB, IEI
nical Engine, Hosur
Vice Presiden
resident & M
Member, MC
ember, MCD
MCDB, IEI
ber, MCDB, I
, Member, M
ber, MCDB, I
Member, MCD
mber, MCDB,
DB, IEI
ember, MCD
CDB, IEI
CATE & Mem
er, MCDB, IE
mber, MCDB,
DB, IEI
ber, MCDB,
Member, MCD
r, MCDB, IEI
MCDB, IEI
r, MCDB, IEI
DB, IEI
CDB, IEI
EI, TNSC
norary Secre
ber,TNSC, IE
ember, TNSC
TNSC, IEI
ember, TNS
Honorary Se
l Engineers any’ during Septe
tee
ering,
nt & Member
Member, MCD
CDB, IEI
DB, IEI
IEI
MCDB, IEI
IEI
DB, IEI
IEI
DB, IEI
mber, MCDB,
EI
, IEI
IEI
DB, IEI
I
tary, TNSC,
EI
C, IEI
C, IEI
cretary, HLC
nd ember 4 ‐ 5, 2
r, MCDB, IEI
DB, IEI
, IEI
IEI
C, IEI
019.
I

Natio
Chairma
Organiz
Member
Chairma
Co-Cha
Member
Conven
Proonal Seminar
an
zing Secreta
rs
an :
irman :
rs :
nor :
oceedings: 35on ‘Trends an
: Prof
aries: Dr. IEI, Priy
Er. P
: Dr.
Dr. T
Dr.
Er. V
Er. V
Dr.
Dr. A
Er. M
Er. S
Er. T
Er. V. Senth
Dept. of Pro
Dr. A. Sidha
Anna Univer
Er. S, Madh
Dr. S. Moha
Pondicherry
Dr. P .Marim
Dr.S.V. Sure
Adhiyamaan
Dr. K. Senth
Adhiyamaan
Er. P. Senth
Adhiyamaan
Dr. L. Shake
Adhiyamaan
5th IEI Nationand Developme
Organiz
f. (Dr.) J. Ar
P. NatarajanHosur Local
yadharshini E
P. Murugesa
N.S. Bhadri
T. Menakad
S. Sujatha,
V. Kannagi,
V. Anitha, A
K. Saranya,
A. Krishna M
M. Harish K
S.Suganthi
T. Anand, A
Techn
hilkumar, Pr
oduction Engi
arthan, Profe
rsity, Chenna
husudhanan
ammed Ali, P
y Engineering
muthu, Princ
esh, Babu, D
n College of E
hil Kumar, D
n College of E
hil Kumar, D
n College of E
eel Ahmed,
n College of E
.
v
l Convention oents in Automo
zing Com
rivudainamb
n, FIE., Meml Centre and
Engineering C
a Pandian, M
narayanan,
evi, MIE., M
FIE., Membe
MIE., Memb
AMIE., Memb
AMIE., Mem
Mohan Redd
Kumar, AMIE
AMIE, Memb
AMIE., Memb
ical Com
rofessor,
ineering, Na
fessor, Depar
ai
n, Deputy Ge
Professor, D
g College, Po
cipal, Karaiku
Department
Engineering,
Department o
Engineering,
Department o
Engineering,
Associate P
Engineering,
of Mechanicaotive Industry
mmittee
bi, FIE., Chai
mber(MC), Principal,
College, Van
MIE., Membe
FIE., Immed
Member(ET),
er(EL), IEI, H
ber(EL), IEI,
ber(ET), IEI, H
mber(CH), IE
dy, MIE., Me
E., Member(C
ber (CV), IEI
ber(AS), IEI, H
mmittee
tional Institut
rtment of Me
eneral Manag
Department o
ondicherry
udi Institute o
of Mechanic
, Hosur
of Mechanica
, Hosur
of Mechanica
, Hosur
Professor,
, Hosur
l Engineers any’ during Septe
irman, IEI, H
niyambadi
er, IEI(MC), H
diate Past Ch
IEI, HLC
HLC
HLC
HLC
EI, HLC
ember(CV), I
CP), IEI, HLC
I, HLC
HLC
te of Techno
echanical Eng
ger, Ashok Le
of Mechanica
of Technolog
cal Engineerin
al Engineerin
al Engineerin
nd ember 4 ‐ 5, 2
HLC
HLC
hairman, IEI,
IEI, HLC
C
ology, Tiruchi
gineering,
eyland, Hosu
al Engineering
gy, Karaikudi
ng,
ng,
ng,
019.
HLC
irappalli
ur
g,
i

Natio
DrPre
Proonal Seminar
The
r. T.M. GUNesident
I am happy
hosting the 3
Conference
September 0
Board of IEI
I am confide
various eng
together and
emerge out
provide usef
I wish the N
Local Centre
oceedings: 35on ‘Trends an
e InstiAN
(ESTABLISH8, G
NARAJA, F
“100Engineer
to note that
35th Nationa
on “Trend
04-05, 2019
.
ent that the N
gineering dis
d discuss th
of the delibe
ful inputs for
National Con
e.
5th IEI Nationand Developme
itutionN ISO 9001: 200
HED 1920, INCOGOKHALE ROA
http
IE
0 Years of Rring Advan
M
Hosur Loca
l Convention
s and Dev
at Hosur un
National Conv
sciplines, es
he subject.
erations will
policy frame
vention a gr
.
vi
l Convention oents in Automo
n of En08 CERTIFIED
ORPORATED BAD, KOLKATAp://www.ieindia.
Relentless Joncement fo
MESSAG
al Centre of t
n of Mechani
elopments
der the aegis
vention will p
pecially from
I am certain
be the learn
ework.
rand success
of Mechanicaotive Industry
ngineerORGANIZATIO
BY ROYAL CHAA – 700 020, IND
org
PhE-We
ourney towr Nation B
E
the Institutio
cal Enginee
in Automoti
s of Mechan
provide a pla
m Mechanica
n that the re
ing points to
s and glorify
l Engineers any’ during Septe
rs (IndON ARTER 1935) DIA
h: +91-33-2223mail: presidenebsite: http://w
ards uilding”
on of Enginee
rs followed b
ve Enginee
ical Enginee
atform to the
al Engineeri
commendati
o the particip
y the efforts o
(Dr. T.M
nd ember 4 ‐ 5, 2
dia)
3 1979 [email protected]
ers (India) is
by a Nationa
ering” during
ering Division
experts from
ing to come
ions that wil
ants and wil
of the Hosur
. Gunaraja)
019.
g rg
s
l
g
n
m
e
l
l
r

Natio
Er.ChaMec
FolCo(Indinfr
The“TrCoof ato eme
Duon on amtec
Onmethis
I amprewh
I w
The
Proonal Seminar
The
. Jagroop Sairman chanical Engin
llowing evernvention, thidia) and heldrastructure fa
e overwhelmends and Dnvention andadvances in express my
embers of all
ring the Conthe advancehow to colla
m sure that wechnological co
behalf of thembers of thes Convention
m sure, the esent knowleo are concer
ish 35th Natio
e success of
oceedings: 35on ‘Trends an
e InstA
(ESTABLISH8,
Singh, FIE.
neering Divisio
“100Enginee
On beThe Inis my Conve“TrendHosur
ry year’s ves time is beid at the Adhacilities to org
ming responsDevelopmend confirms thtechnology ithanks to allthe Committ
nvention the ement in Autaborate on ae will have aomponents,
e Board, I we board, Awan.
Convention edge and exprned with the
onal Conven
f the Conven
5th IEI Nationand Developme
titutionN ISO 9001: 20
HED 1920, INCOGOKHALE RO
htt
, on Board
0 Years of Rering Adva
M
ehalf of the nstitution of great honor
ention of Mds and Dever Local Centr
ery successing hosted biyamaan Coganize this c
se to our cants in Automhat IEI’s MCDin the field ofl authors fortees for their
participants tomotive Tecadvanced arean excellent ptechnologica
wish to thank ardees and n
Proceedingsperience ande subjects pre
ntion of Mech
ntion will be y
.
vii
l Convention oents in Automo
n of En008 CERTIFIEDORPORATED B
OAD, KOLKATAp://www.ieindia
Relentless Jncement fo
MESSAG
Mechanical Engineers (Ir and pleasu
Mechanical elopments inre on 04-05S
sful conventiby Hosur Locllege of Eng
colossal even
all-for-papersmotive InduDB has becof Mechanicatheir outstan
r contribution
not only havchnology, paeas of Mechpresentation al progress in
all the authonumerous oth
s will serve d will be of besented at th
hanical Engin
your success
of Mechanicaotive Industry
ngineer ORGANIZATIO
BY ROYAL CHAA – 700 020, IND.org
Ph: E-m Web
ourney towor Nation B
E
EngineeringIndia) and thure to welcomEngineers an AutomotiveSeptember 20
ions in eaccal Centre ofineering, Hont.
s indicates tstry” identifi
ome the worll Engineeringnding contrib
n to organize
ve excellent articularly onhanical Engin
which will pn the field of
ors, invited shers who hel
as a compreenefit to enghe Conventio
neers a grand
s!
l Engineers any’ during Septe
rs (IndON ARTER 1935) DIA
+91-33-2223 ail: president@bsite: http://ww
wards Building”
Division Bohe Organizinme you to thand Nationae Industry” b019.
ch State/Locf the Institutiosur, an Instit
he popularitied for discd-wide forumg related topbutions and this spectac
discussions the theme,
neering will brovide soundAutomation
speakers, seslped to shap
ehensive cogineers, scieon.
d success.
(Er. J
nd ember 4 ‐ 5, 2
dia)
1979 @ieindia.org ww.ieindia.org
oard (MCDBg Committee
he 35th Natioal Seminar being hosted
cal Centre, on of Enginetution having
ty of the thecussion at m for all aspepics. I would in particular
cular event.
and exchangbut also iss
be addressed informationEngineering
ssion chairme the conten
mpilation of ntists, stude
Jagroop Sin
019.
) of e, it onal
on d by
our eers g all
eme this ects like the
ges ues
ed. I n on g.
men, nt of
the nts,
gh)

Natio
Proonal Seminar
The
Maj. Gen. SSecretary &
I am happy
hosting the
Conference
September 0
Board of IEI
College of E
I am sure th
subject and
the policy m
I convey my
oceedings: 35on ‘Trends an
e InstA
(ESTABLISH8,
“100Enginee
S. BhattachaDirector Gen
to learn that
35th Nation
on “Trend
04-05, 2019
in associati
Engineering,
hat participa
the recomm
akers and im
y greetings to
5th IEI Nationand Developme
titutionN ISO 9001: 20
HED 1920, INCOGOKHALE RO
htt
0 Years of Rering Adva
arya, VSM (Rneral
M
t Hosur Loca
nal Convent
s and Dev
at Hosur un
on with Dep
Hosur.
nts will mak
endations th
mplementing
o the organiz
.
viii
l Convention oents in Automo
n of En008 CERTIFIEDORPORATED B
OAD, KOLKATAp://www.ieindia
Relentless Jncement fo
Retd)
MESSAG
al Centre of
tion of Mec
elopments
der the aegis
artment of M
ke best use
at will emerg
agencies.
ers and wish
Maj.
of Mechanicaotive Industry
ngineer ORGANIZATIO
BY ROYAL CHAA – 700 020, IND.org
ourney towor Nation B
Ph: Fax
E-m
E
the Institutio
chanical Eng
in Automoti
s of Mechan
Mechanical E
of the oppor
ge out of the
h the event a
Gen. S. Bha
l Engineers any’ during Septe
rs (IndON ARTER 1935) DIA
wards Building”
Direct: (91) : (91) (3
ail : sdg@i
on of Enginee
gineers and
ve Enginee
ical Enginee
Engineering,
rtunity to dis
deliberation
a grand succe
attacharya, V
nd ember 4 ‐ 5, 2
dia)
(33) 2223 8233) 2223 8345ieindia.org
ers (India) is
d a Nationa
ering” during
ering Division
Adhiyamaan
scuss on the
s would help
ess.
VSM (Retd.)
019.
230 5
s
l
g
n
n
e
p
)

Natio
Proonal Seminar
The
Dr. G. RangCouncil MemCommittee fo
From its inenergeticallymembers. success.
Hosur LocaASDB, ARDetc. as per tmaintaining As the Founmy successtriumph.
The theme National Cotaking placeserve as a cbe immensethe subjectsI wish the 35
oceedings: 35on ‘Trends an
e InstA
(ESTABLISH8,
“100Enginee
ganath, FIE.,mber & Chairr Advanceme
IICCIFecGe
nception, I y organizing I am sure th
l Centre haDB, MNDB an
he norms sethe same tem
nder Chairmasor Dr. J. A
‘‘Trends annference is v
e in Automatcomplete coely benefited presented a5th National
5th IEI Nationand Developme
titutionN ISO 9001: 20
HED 1920, INCOGOKHALE RO
htt
0 Years of Rering Adva
, rman nt of Technolo
I feel extremInstitution ofConventionConferenceIndustry’ onFollowing theeach State/chosen HosuGarden Cityexertion of Ham fully awthe activitie
hat this time
s hosted Nand MCDB of et by Headqumpo to raisean of Hosur
Arivudainamb
nd Developmvery much ation Technolompilation of
d to engineeat the NationaConvention o
.
ix
l Convention oents in Automo
n of En008 CERTIFIEDORPORATED B
OAD, KOLKATAp://www.ieindia
Relentless Jncement fo
ogy and Engi
ely happy tof Engineers of Mechnon ‘Trends
n 04-05 Septee successfuLocal Centrur, the Indiay to organi
Hosur Local Cware that H
es under the e also the Ce
ational ConvIE, and org
uarters. I wise to the highe
Local Centrbi, who will
ments in Aupt to the todaogy. I am suthe present
ers, scientistsal Conventioof Mechanica
of Mechanicaotive Industry
ngineer ORGANIZATIO
BY ROYAL CHAA – 700 020, IND.org
ourney towor Nation B
ineering
o note that Ho(India) is ho
nical Enginand Develoember 2019l conduct of res every y
a’s busiest Inze this Co
Centre.
Hosur Locaharmonious
entre will em
ventions undanized All Inh the Centre
est level.
re I am doublead the tea
utomotive Inay’s concepture, the Cont knowledge s, students w
on.
al Engineers
l Engineers any’ during Septe
rs (IndON ARTER 1935) DIA
wards Building”
osur Local Costing the 35eers and t
opments in at Hosur.
National Coyear, Headqndustrial hubnvention wi
l Centre has cooperationmerge with a
der the aegidia Seminar
e to gear up t
bly proud to am to touch
ndustry’ chot on the dras
nvention procand experiewho are con
s a grand suc
(Dr. G.
nd ember 4 ‐ 5, 2
dia)
Centre of The5th Nationathe NationaAutomotive
onventions inquarters hadb and Flowerth the able
as been son of its teama blossom of
s of MRDBr, Workshopsthe acitivities
congratulateh the cliff of
osen for thisstic changesceedings wilence and wilncerned with
ccess.
Ranganath)
019.
e l l
e
n d r e
o m
f
, s s
e f
s s l l
h
)

Natio
M
Proonal Seminar
The
No.69, Kamaraj
Mobile: 989444598
Dr. J. ArivuChairman
This state-o
different are
in this grand
participation
I specially th
to host this
Chairman, M
to launch th
Organizing
Convention
Advisory Co
We will do o
your graciou
oceedings: 35on ‘Trends an
e InstAN I
(Establi
Nagar, Kumudepa
88 (Chairman) 9865
dainambi, F
of-the-art eve
as of Mecha
d event will u
n can make th
hank the Inst
s National C
MCDB and m
he event, for
committee
a Grand su
ommittee for t
our best to m
us presence.
5th IEI Nationand Developme
titutionISO 9001:200ished 1920, in
HOSUR alli, Near Adhiyama
5373358(Secretary
FIE
It is my ple
faculty, dis
National C
Conference
Industry’.
ent will have
anical Engine
utilize this op
his event a g
titution of En
Convention
members; ou
their suppo
and my co
uccess. I th
their spontan
make this Co
.
x
l Convention oents in Automo
n of En08 CERTIFIEDncorporated by
LOCAL aan College of Engi
) E-mail: ieihlc15@
MESSAG
easure and p
tinguished g
Convention
e on ‘Trend
e deliberatio
eering. I hope
pportunity. W
grand succes
gineers (Indi
and my he
r Founder C
rt and direct
olleagues fo
ank the Pre
neous guidan
onvention un
of Mechanicaotive Industry
ngineerD ORGANIZATy Royal Charte
CENTREneering, Hosur – 6
@gmail.com&hosurl
Dr. V Hono
GE
privilege to w
guests and w
of Mechan
ds and Dev
ns by learne
e each and e
We also inten
ss.
ia), Kolkata f
eartfelt thank
hairman Dr.
tions. I also
r their untir
esident and
nce for maki
forgettable a
l Engineers any’ during Septe
rs (IndTION er 1935)
E 635 109, Krishnagir
V. Manivasagorary secretary
welcome all
well-wishers t
ical Engine
velopments
ed technocr
every membe
nsely believe
for giving us
ks to Er. Ja
G. Rangana
o thank all th
ring efforts
the membe
ng it a great
and are look
Dr. V. H
IEI, Hosu
nd ember 4 ‐ 5, 2
dia)
ri District, Tamilnad
bsite: www.ieihlc.or
gan, MIE y
the delegate
to the Thirtie
ers &Nation
in Automoti
rats working
er participati
e that only yo
an opportun
agroop Sing
ath, the kingp
he members
to make th
ers of Nation
event.
ing forward f
ManivasagHon. Secretaur Local Cent
019.
u
rg
es,
eth
nal
ive
in
ng
our
nity
gh,
pin
of
his
nal
for
an ary tre

Natio
S.No
1.
2.
3.
4.
5.
6.
7.
8.
9.
10.
11.
Proonal Seminar
Study of additive(2NOX‐SOMulti‐obje
Dr. Swapa
Natural FMechanic
K. Palani K
InvestigaPassenge
Avik Chak
FormulatCerium OApplicatio
Chacko PrBhageerad
ExperimeCoconut Applicatio
Chacko Pr
TribologicinCoconu
Chacko Pr
A RevieCombust
Siddharth.
ProgressEpoxy Co
H Muralidh
SynthesiswithRecy
S.Ponsuriy
Future As
Er. Pravin
Adoption
S. Sabaris
oceedings: 35on ‘Trends an
Performance2‐EHN) bleOT‐BTHE Tective Optim
an Bhaumik.
Fiber Reinforcal and Tribo
Kumar and A.
tive Study er Cars.
kraborty, Abhin
ion of LithiuOxide and Mons.
reno Koshy, Adhan, AslamS
ental EvaluatOil Added
ons.
reno Koshy, O
cal and Synut Oil at Elev
reno Koshy, R
ew of Heat tion Engines.
. S.S and Kart
ive Damageomposites.
hara and Dr. R
s, Characteyclable Mater
yaprakash and
spects of Au
V. Tembe, AM
of Additive M
sh, T. Subhava
5th IEI Nationand Developme
e, Combustioends in Drade‐off chaization Tech
rced Polymeological Prop
Shadrach Jey
of Variatio
nav Atul, Kous
um Based BMolybdenum
AjumalShamsuShadh, Reuben
tion of Thermwith Tungs
Oswin Lazar a
nergetic Effeated Tempe
Reuben Thoma
Transfer S.
thick. S
e Characteriz
R Suresh.
erization andrial used in A
d P.Udhayaku
tomobile Ind
MIE, CEng (In
Manufacturin
aishnavi and P
.
xi
l Convention oents in Automo
Content
Title
on and EmissDI‐Diesel en
racteristics tnique.
r Compositeperties: A view
ya Sekaran.
on of Static
stav Basu and
io‐Grease frDisulphide
udeen, Abhiran Thomas and
mo‐Physical sten Disulfid
nd M D Mathe
ect of Synthrature for Au
as and M D M
Studies on
zation of Bia
d ProductionAutomotive In
umar.
ustry.
ndia)
ng in Automo
P. Udhayakum
of Mechanicaotive Industry
t
sions of biodngine and through Tagu
es forAutomow
c Stability
d Aniket Maiti.
rom CoconutNanoparticle
m Anil Kumard M D Mathew
and Tribologe Nanoparti
ew.
esized MoSutomotive Ap
Mathew.
Hydrogen
axial Glass
n of Abs Mndustry.
otive Supply
mar.
l Engineers any’ during Septe
diesels and Dcalibrations
uchi‐ Fuzzyb
otive Applicat
Factor of S
t Oil Added es for Autom
r, Harikrishnanw.
gical Propertiiclesfor Lubr
S2 Nano‐Parplications.
Fuelled Int
Fiber Reinfo
Material Ble
Chain ‐ A Re
nd ember 4 ‐ 5, 2
P
Diesel s of based
tions:
Small
With motive
n
ies of ricant
rticles
ternal
orced
ended
eview
019.
Page No
1
28
29
45
53
68
80
98
107
114
121

Natio
12
13.
14.
15.
16.
17.
18.
19.
20.
21.
22.
23.
24.
25.
Proonal Seminar
Modal anusing Ful
Sanjay Sh
Effect of Methyl Es
C.SivakanM.V.B.Kal
MechanicComposit
T. Haripra
Applicatioproduced
Rajesh Ku
A Brief gAuto‐com
Soumya M
MechanicComposit
Rajesh Ku
Internet o
Soumya M
Effect of
P. Arjunraj
Statistica
Balaji A, N
Impact oPerformaCalophyll
V.Dattatre
MechanicTiO2 Par
T. Haripra
Electro‐oImage Pr
C J Jagad
Progress
Prof V J L
Challeng
Prof V J L
oceedings: 35on ‘Trends an
nd Frequencll Car Model.
harma, Manoj
Diethyl Ethester‐Eucalyp
ndhan, R.Silamlyan.
cal and Tribotes.
sad, L. Shake
on of machind by modified
umar Behera,
glimpse on Cmponent Fab
Mukherjee and
cal Behaviotes through P
umar Behera.
of Things (IO
Mukherjee, Mo
Intake Manif
j, P.D. Jeyaku
al Analysis of
Naresh G, Sara
of thermal ance and lumInophyllu
eya, B.R.Rame
cal and Triboreicles.
sad and L. Sh
ptical systemrocessing on
deesha FIE.
of Emission
awrence, Step
es to Electric
awrence, Anth
5th IEI Nationand Developme
cy Response.
Chouksey, Vin
er on LHR Eptus Oil Blend
mbarasan, I.Sa
ological Beh
eel Ahmed, K.
ne learning td stir casting
Birajendu Pra
Coating techrication.
d Rajib Ranjan
ural AspectP/M Route
OT) for New G
ohammed Sha
fold Material
umar, M.Bhara
f Biodiesel U
ranya K, Maniv
barrier coemissions
um biodiesel
esh Bapu and
ological Prop
hakeel Ahmed
ms in ISRO R Satellite Da
n Pollution Co
phin Janvel an
c car adoptio
hony Felix and
.
xii
l Convention oents in Automo
e Analysis of
nod Pare and
Engine Charad.
atyanarayana,
havior of Al 5
Srinivasan an
to optimize Mmethod.
asad Samal, S
hniques, prop
n Pal.
ts of Sinter
Generation A
ahnawaz and R
on Engine P
athiraja and D
tilization by v
vasagan V and
ating applicof a die
oil–diesel bl
d B.Durga Pras
perties of Al 5
d.
Remote Senata for Natura
ontrol
nd Mounika A
on in India
d Bosco Sylve
of Mechanicaotive Industry
f Vehicle Su
Pranay Jain.
acteristics of
, P.Vijay Kum
5083‐ Gr /Si
nd S.V. Suresh
Mg recovery
Sarat Chandra
perties for M
red Aluminiu
Automobiles.
Rajib Ranjan P
Performance.
r.Ragupathy K
various coun
d Ramesh Ba
cation on esel enginends.
sad.
5083 Reinfor
sing Programal Resources
ester
l Engineers any’ during Septe
spension Sy
f a Using Pa
ar and
O2/B4C HY
h Babu.
in the Al‐Mg
Panigrahi.
Materials use
um Metal M
Pal.
.
Karu.
ntries – Revie
bu N.G
the combue fuelled
rcedwith B4C
m and Signas.
nd ember 4 ‐ 5, 2
ystem
apaya
BRID
galloy
ed for
Matrix
ew.
stion, with
C and
al and
019.
133
141
158
159
160
161
162
163
164
165
166
167
168
169

Natio
24.
25.
26.
27.
Proonal Seminar
StructuraEngineer
Mahaboob
Study oApplicatio
P.K. Mand
Effects oEmission
B.Venkata
Design a
S.Venkate
oceedings: 35on ‘Trends an
al Analysis ars) Car
b Tabriz B, Sa
n Friction ons
dal.
on Variable Cn characterist
a Subbaiah, M
nd Fabricatio
esh and R. Jag
5th IEI Nationand Developme
and Design o
andeep B. S, D
Stir Proces
Compressiontics in Corn B
M. Nagaphani S
on of ‘Ovateg
gadeesh Kum
.
xiii
l Convention oents in Automo
of FSAE (Fo
Dr.Muzzamil A
ssing of Al‐
n Ratio DiesBio Diesel Fu
Sastry and K.H
go’
mar.
of Mechanicaotive Industry
ormula Socie
Ahamed S.and
‐Zn‐Mg Allo
sel Engine Pueled.
Hemachandra
l Engineers any’ during Septe
ety of Autom
d Dinesh H. A.
oyfor Autom
Performance
a Reddy.
nd ember 4 ‐ 5, 2
motive
mobile
e and
019.
170
171
173
174

Natio
Proonal Seminar
oceedings: 35on ‘Trends an
5th IEI Nationand Developme
.
xiv
l Convention oents in Automo
of Mechanicaotive Industry
l Engineers any’ during Septe
nd ember 4 ‐ 5, 2019.

NatioPro
onal Seminar oceedings: 35on ‘Trends an
5th IEI Nationand Developme
.
l Convention oents in Automo
of Mechanicaotive Industry
l Engineers any’ during Septe
nd ember 4 ‐ 5, 2019.
1
Study of Performance, Combustion and Emissions of biodiesels and Diesel additive(2‐EHN) blends in DI‐Diesel engine and calibrations of NOX‐SOOT‐BTHE Trade‐off characteristics through Taguchi‐Fuzzy
based Multi‐objective Optimization Technique
Dr. Swapan Bhaumik
Vice President, IEI & Former Head, Dept of Mech Engg, NIT Agartala
Introduction
The variation of world energy graph has logically attributed to the retribution of
painless world energy trade and professions. Presently, 7 billion people model the entire
world energy structure and have an undeviating impact on the foundation of energy
demand. The effects of the world economy, security and environmental design are the
impact of energy. Energy is the first principles to the modern world, and as the
population increases from 7 billion to 9 billion by 2040, a challenged to overcome energy
crisis to build superior lives achievable. The Country like China, India and the Middle
East has projected for the rise of energy requirement beyond one-third from 2035 to
2045 by 60% of the growth. Pollution vandalization and passing fossils fuel reservoir
forced many scientist, researchers, and engineers to undertake the investigation on the
substitution to fossil fuel. Effects of increased environmental pollution from motors and
increased fossils fuel price enforced biodiesel platform as a substitute to fossils fuel.
Worldwide biodiesel production has risen practically sevenfold since 2005. Besides the
world biofuel production of 127.7 bills/liters in 2014, bioethanol considered to be 74%
and biodiesel considered to be 23%.
Currently, the ongoing inquiry and found inspection effects about the substitution of the
diesel fuel with the fusion of biodiesel and ethyl alcohol like diesel supplements in diesel
engine was found victorious due to the closer fuel properties to diesel fuel and biodiesel
content. Diesel additive plays a vital role in the world of motors combustion. The
utilization of the diesel additive, intake fuel temperature and inlet air temperature are
the contemporary recommendation to excel viscosity, tribology and completion in fuel
vaporization. Blending alcohol with the commercial diesel is an authentic technique for
decoding lubricity and vaporization complication. Nevertheless, the immiscible
character of diesel and alcohol could be intricate because of splash blending, thermal

NatioPro
onal Seminar oceedings: 35on ‘Trends an
5th IEI Nationand Developme
.
l Convention oents in Automo
of Mechanicaotive Industry
l Engineers any’ during Septe
nd ember 4 ‐ 5, 2019.
2
cracking, and dissociation by another process. This complication can overcome by the
emulsifiers or co-solvent.
Biodiesel as an alternative fuel.
Vegetable oils are an organic oil (triglycerides) extracted directly from the plant product,
animal product, and waste product. Vegetable oil for the diesel engine is not a new
thought. Scientist Dr Diesel in 1911 ran his diesel engine on pure vegetable oil extracted
from peanut. However, the vegetable oil has employed in the compression ignition
engine until1920s. Throughout the 1920s, the manufacturer of the diesel engine
redesigns their diesel engine to run on the lower viscosity (petrodiesel) instead of
vegetable oil, which attribute to some disadvantage of vegetable oils properties. With
the expanding of time before the world war-II in South Africa, the first everutilization of
trans esterified vegetable oil (biodiesel) was effortlessly powering heavy-duty motor
Vehicles.
Generally, since biodiesel came in to picture, its application extended for combustion in
the diesel engine after meeting the specification of ASTM-D6751 standard.
Experimental engine test with methyl and ethyl ester have manifested that methyl
ester released higher power and torque when related to ethyl ester. Methyl ester
(biodiesel) obtained from net-vegetable oil is brown or amber-yellow colour, viscosity
similar to diesel fuel, non-flammable, non-explosive, biodegradable, non-toxic and reduce
emissions when burning in the diesel engine. Under many circumstances, biodiesel has
an advantage as well as disadvantage given below.
The Advantage of biodiesel is its availability, portability, renewability, underneath
sulfur, excessive combustion efficiency and aromatic content, excessive biodegradability
and unreasonable cetane number. Besides all the advantages of biodiesel, domestic
origination is the central advantage of biodiesel, which would diminish local energy
demand, biodegradability, sky-high flash point, and lubricity.
The main drawbacks of biodiesel are predominantly its excessive viscosity and density,
beneath energy content, high pour point and cloud point, lower power and engine speed,
engine affinity, fuel injector coking, greater engine scratch, excessive NOX emissions,
and significantly high cost. Another demerit is the technical complications due to the
biodiesel and diesel blends leading to fuel chilling in winter, minimised energy density,

NatioPro
onal Seminar oceedings: 35on ‘Trends an
5th IEI Nationand Developme
.
l Convention oents in Automo
of Mechanicaotive Industry
l Engineers any’ during Septe
nd ember 4 ‐ 5, 2019.
3
fuel degradation under lengthy periods of storage, and layers deposits inside the tank,
hoses and blocks the fuels filters. Nevertheless, this blocked fuel filter can be
maintained and replaced.
Concerning to this climax, this present experimental investigation significantly
manifests the ability of methyl ester in compression ignition engine. Biodiesel utilisation
in the diesel engine is the successful technique of exchanging petrodiesel in the long run.
Since biodiesel is environmentally friendly, it has outstanding prospective to utilise as a
substitute in diesel engine
Significant Confidential of 2-ethyl-hexyl-nitrate.
Ignition quality in a compression ignition engine gambols all the important parameter
predicting how the quality performances and emissions delivered by a diesel engine.
Thus the improvement of combustion quality can be obtain by the various approach. The
present experimental work adopts 2-Ethyl-hexyl-nitrate (2-EHN) as cetane improver to
achieve quality combustion.
Chemically, 2-Ethyl-hexyl-nitrate (2-EHN) is an organic compound called ester of nitric
acid shown in Fig. 1(Test tube-D), where, test tube-A, B, C, and D are filtered neem
biodiesel, filtered cotton biodiesel, diesel and 2-Ethylhexyl nitrate. 2-EHN is 99% purity
which is built by a chemical reaction of HNO3 (nitric acid) with C8H18O (2-Ethylhexanol)
as detailed below.
HNO3 + C8H18O = C8H17 NO3 + H2O↓
The industry work group of 2-ethyl-hexyl-nitrate (2-EHN) was organised in the year
2002 in Europe by the manufacturers of the technical committee of petroleum additive
(ATC), members affiliated by the council of European chemical industry (CEFIC). It
incorporates of various members of ATC companies including all the European and
North American producers of 2-EHN, along with the auxiliary input from the oil
manufacturing companies, European Federation for health, environment, and security
in concentrating and dispensation.
2-Ethyl hexyl nitrate, when blended with petrodiesel fuel is predominantly to increase
cetane number, to accelerate the diesel fuel auto-ignition properties, shorten the
duration of combustion and improve combustion characteristics.

NatioPro
onal Seminar oceedings: 35on ‘Trends an
5th IEI Nationand Developme
.
l Convention oents in Automo
of Mechanicaotive Industry
l Engineers any’ during Septe
nd ember 4 ‐ 5, 2019.
4
1. Miscibility test and blend preparation.
In this experimental investigation filtered neem seed methyl ester (NSME) and filtered
cotton seed methyl ester (CSME) were fused with pure diesel and most significantly
with 2-ethyl-hexyl-nitrate (2-EHN) as an emulsifier in volume fraction (3:2:1) V/V%
basis. The significant footprint of this miscibility test was base on the questions of the
blending ability of pure diesel and 2-EHN with a much higher concentration of biodiesel.
This comprehensive miscibility test in a volume fraction (3:2:1) basis was equivalently
states as (U:V:W) in test tube- A, and (X:Y:Z) in test tube- B. where, ‘U’, ‘V’ and ‘W’ are
2-EHN, Diesel and Neem biodiesel, simultaneously X, Y, and Z are 2-EHN, Diesel and
cotton biodiesel respectively.
These two blends were compared with 100%NSME and 100%CSME and finally with
100%Diesel as a whole. After obtaining the complete requirements, the properties of the
required fuel of the net-diesel, net- methyl esters and additive blends were obtained by
IS: 1448 (Protocol) within the ASTM standards limits.
Experimental setup and methodology.
The experimental setup is a single cylinder, four strokes and water cooled DI-Diesel
engine (Make- Kirloskar, IS-No. IS: 11170-1985) as shown in Fig. 1.
Fig. 1 Experimental Setup completes Circuit Diagram.
The diesel engine connected to an eddy current type dynamometer (Make- Kirloskar) is
for loading. It is connected with the necessary sensing device for measuring combustion
pressure inside the cylinder and also for measuring Crank Angle. These two sensing
NatioPro
onal Seminar oceedings: 35on ‘Trends an
5th IEI Nationand Developme
.
l Convention oents in Automo
of Mechanicaotive Industry
l Engineers any’ during Septe
nd ember 4 ‐ 5, 2019.
5
devices connected to a computer is for obtaining P-Ɵ diagram. Other interfaces are also
made for fuel flow, air flow, and load measurement and also sensing the temperature at
different loading conditions. The experimental set up has stand-alone panel box
consisting of air box, two fuel tanks, manometer, vertical buerate attached to control
panel, transmitters, process indicator and engine indicator. Rotameters was provided for
measuring water flow and also for cooling the engine. The experimental setup enables
the study of VCR engine performance for all the developed power, pressure, efficiency,
specific fuel consumption, A/F ratio, and heat balance. Engine Performance Analysis
software provided was for measuring all the performance and combustion evaluation.
Experimental Methodology
Initially, the experimentation of this present works was run by the pure Diesel, filtered
Neem biodiesel, filtered cotton biodiesel, 2-EHN, and its blends at different
compositions. The experiment was run on VCR engine at various loading conditions with
a constant speed of 1500 rpm (± 2%). The variable load test was conducted at the
injection timing of 230 BTDC, and at the fixed injection pressures of 200 bars.
Initially, the engine was warm-up with Net-diesel (D100) for 30 minutes for stabling the
diesel engine. After that, the data was taken for the reference and also for the
comparison of performance and emissions characteristics with various chosen blends.
All the instruments interfaced to the control panel was for revealing the desired data.
Once the base data obtained from the base fuel, the blended fuels were injected once at a
time for experimentation. The blended fuels were also allowed to settle down for the
proper and homogenous mixture. Technically all the instruments were interfaced to a
computer DAQ system as well as synchronized with a crank angle encoder to software.
The experimental data were so obtained was by the DAQ system. The standalone control
panel fitted and connected with sensing devices helps to regulate the entire machine.
The eddy current dynamometer was connected to a voltage controller for adjusting the
loads (from 0% to 100%). In additions, for acquiring an accurate reading for every blend,
the fuel flow line was thoroughly cleaned with acetone. Further, the experimentation
was continued base on the same technique and process. The NOX emissions sampled was
obtained with the 5-gas analyzer (Make: AVL India, Model: 444).
Uncertainty analysis.

NatioPro
onal Seminar oceedings: 35on ‘Trends an
5th IEI Nationand Developme
.
l Convention oents in Automo
of Mechanicaotive Industry
l Engineers any’ during Septe
nd ember 4 ‐ 5, 2019.
6
Error analysis is a part of experimentation. It safeguard the repeatability of the
experiment and also acknowledge the gentility of the instruments of the manufacturer.
Uncertainty analysis or error identifications of any specific apparatus of an
experimental engine explicitly manifest the requirement and repeatability of the
experimental work paradigm. Vitally, the Uncertainty analysis of performance and
emissions parameters are found out by the root mean square method given by Eq. (1).
∆ ∆ ∆ ∆ (1)
Where, ∆U the total uncertainty of the projected number Q is accountable on the various
variables Q = f (X1, X2,…,Xn) possessing ∆X1, ∆X2,…, ∆Xn aswell defined errors.
Results and Discussion
Different blended fuels prepared are experimentally investigated in the DI-Diesel
engine at a constant speed of 1500 rpm. The effect of the tested fuels has been
determined by the engine performance parameter, combustion characteristics and
emissions characteristics as enormously described below.
Combustion characteristics.
In-cylinder pressure.
In-cylinder pressure of a diesel engine has directly attributed to the fraction of fuel
burned during the initial combustion stages (premixed combustion). At 0.8kw load,
D100 attained the maximum pressure (46.50 bar) registered around 3700 crank angle
(TDC) than others tested fuels. Simultaneously the ignition delay of all the tested fuels
in this same load was prolonged from 3600 to 3640 crank angle which indicates late
combustion.
Pure cotton seed methyl ester (100% CSME) at 1.4kw load shows maximum in-cylinder
pressure (49.91 bar) registered at 3700 crank angle (TDC). The increased in in-cylinder
pressure is directly attributed to oxygen content in biodiesel molecules resulting in
maximum pressure. Diesel additive (2-EHN) concentration in the tested fuels shows
maximum pressure at higher loads. 5%EHN1 attained consistent in-cylinder pressure
rise (maximum) from 2kw to 3.2kw are 54.25bar, 56.87bar and 57.72bar respectively.
Whereas, 5%EHN2 follow the same trends as 5%EHN1 from 2.6kw to 3.2kw loads are

NatioPro
onal Seminar oceedings: 35on ‘Trends an
5th IEI Nationand Developme
.
l Convention oents in Automo
of Mechanicaotive Industry
l Engineers any’ during Septe
nd ember 4 ‐ 5, 2019.
7
56.25bar and 57.03bar. Most significantly, the maximum in-cylinder pressure of
5%EHN1 than others fuels is the effective result of 2-EHN addition in the blends which
forced the pressure near the TDC. This maximum pressure rise is attributed to low
auto-ignition temperature, shorter ignition delay.
NOx emission.
Figure 8shows the effect of diesel, Net-biodiesels, and 2-EHN additive on the NOx
emissions concerning various engine brake power. Exhaust NOx emissions increases
with the increase in engine brake power. Exhaust emissions contain eight oxides of
nitrogen which are composed of 5% NO2 by volume, 5% N2O+N2O3+N2O5 by volume and
90% NO by volume. The combustion temperature inside the cylinder, duration of high
temperature and in-cylinder oxygen concentration are the vital factors for NOx
generation.
Soot emission
Soot emissions is the major complication of the diesel engine. Even though, Diesel fuel
being the top contender for compression ignition engine, its particulates consist of
carbonaceous materials directly indicated as Soot and some organic or inorganic
compounds were also discovered.
in brake power. Whereas, 5%EHN1 crack the overall prominent BTHE, lowest SOOT
emissions with the penalty of NOX emissions as shown in point Fat higher load (2.6kw).
The increased or decreased of NOX, SOOT and BTHE are being undeviatingly ascribed
to combustion efficiency of the test fuels.
When differentiated with 100%diesel, 100%NSME and 100%CSME, 2-EHN
concentration in the blends enhance combustion model revealing the increasing trend of
BTHE, reducing trends of UHC and SOO Temissions and quantum of NOX emissions
penalty.
Optimum Input Parameters Selection by Taguchi-Fuzzy based Approach.
The current experimental investigation data’s are being governed by L25 orthogonal
arrangement of the Taguchi artistry by utilizing 25 permutations of five engine brake
power and five tested fuel which are noted as A and B in the Table 6. The center of
attention of the present investigation was not on the design of collection and inspection

NatioPro
onal Seminar oceedings: 35on ‘Trends an
5th IEI Nationand Developme
.
l Convention oents in Automo
of Mechanicaotive Industry
l Engineers any’ during Septe
nd ember 4 ‐ 5, 2019.
8
of experimental data’s, but on the signals to noise ratio (S/N) to grasp the experimental
data are in Taguchi orthogonal ordering. The integrated governable set of parameters by
an orthogonal arrangement in Taguchi technique can yield undeviating complication
effect. The number of experiment and the accuracy of the experimental analysis results
can be optimized by implementing the Taguchi technique. Thus, the Taguchi technique
minimizes the duration and caliber the lone character of the experimental analysis.
“Larger-the-better” and “Smaller-the-better” are numerically investigated based on the
outcomes of the factor to achieve the signals to noise ratios (S/N). So, the operation
factors by model arrangement for sole characteristics like BTHE, UHC, NOX and SOOT
can be attained. The characteristics of the value of signals to noise ratios (S/N) of
“Larger-the-better” have implemented. Thus, BTHE is the focus in these sorts of
analysis. As for conveyingin Eq. (3)
10Ʃ
(3)
Besides that, “Smaller-the-better” is implemented for the characteristics like UHC, NOX
and SOOTas shown in Eq. (4)
10Ʃ
(4)
Where, n = number of measurement taken.
Y = numbered ith characteristic.
Conclusion
The ultimate focus of the contemporary experimental investigation was to exploit
filtered methyl ester of neem seed oil, cottonseed oil and its blend with diesel along with
the diesel additive (2-EHN) concentration and analyze the combustion, performance and
emissions characteristics of a diesel engine at non-identical loads and blend.
Concurrently, the succeeding focus on this experimental investigation was multi-
objective optimization to minimize the experimental endeavor, to blueprint the
experiments and simultaneously to optimize the performance and emissions parameters
of a particular DI-Diesel engine. The consecutive effects drawn from the experimental
investigations are attested below.

NatioPro
onal Seminar oceedings: 35on ‘Trends an
5th IEI Nationand Developme
.
l Convention oents in Automo
of Mechanicaotive Industry
l Engineers any’ during Septe
nd ember 4 ‐ 5, 2019.
9
1. The outcome of the filtered methyl ester of neem seed oil and filtered cotton seed oil
with and without diesel and also with the minor diesel additive (2-EHN)
concentration manifest the future substitute to diesel fuel.
2. Improvement of Brake thermal efficiency (BTHE) has been distinguished for non-
identical blends point of view when compared to D100 at different loading
conditions.
3. Tri-ingredients blends of NSME, Diesel, and 2-EHN showed reduced UHC and
SOOT at various load condition when compared to D100.
4. The overall verified conclusion notify that the particular method is suitable for
optimizing the performance and emissions parameters of a diesel engine.
This present experimental investigation narrates a multi-objective optimization
approach to ascertain the optimum engine constrain when fueled with filtered methyl
ester (neem and cotton oil) - 2-EHN (additive) - Diesel fuel blends for the performance
and emissions characteristics improvement exhibit that the 5%EHN1 at higher loads
will deliver optimum outcomes.

NatioPro
onal Seminar oceedings: 35on ‘Trends an
5th IEI Nationand Developme
.
l Convention oents in Automo
of Mechanicaotive Industry
l Engineers any’ during Septe
nd ember 4 ‐ 5, 2019.
2
Naturl Fiber Reinforced Polymer Composites for Automotive Applications: Mechanical and Tribological Properties: A view
K. Palani Kumar1 and A.Shadrach Jeya Sekaran2 1Department of Mechanical Engineering, Sri Sai Ram Institute of Technology, West Tambaram, Chennai, India.
[email protected] 2Department of Mechanical Engineering, St. Peter’s College of Engineering and Technology, Chennai, India.
Abstract
Natural fiber reinforced composite materials are finding improved applications in many fields.
Especially these composites are used in automotive industry. The use of natural fiber reduces the
weight of the components; on the other hand it reduces the adverse environmental impact of
polymer based composites. In the present work, the importance of the natural fiber reinforced
composite materials is reviewed. The importance and need for the requirement of the natural fiber
reinforced composite materials is reviewed in conjunction with the mechanical properties and
tribological properties. Finally the growth prospectus of the natural fiber reinforced composite
materials is discussed and presented.
Keywords: Natural fibers, mechanical properties, Tribological performance, automotive
applications.
1. Introduction
The interest in natural fiber-reinforced polymer composite materials is rapidly growing
both in terms of their industrial applications and fundamental research. They are
renewable, cheap, completely or partially recyclable, and biodegradable. Plants, such as
flax, cotton, hemp, jute, sisal, kenaf, pineapple, ramie, bamboo, banana, etc., as well as
wood are used from time immemorial as a source of lignocellulosic fibers. Hence they are
often applied as the reinforcement of composites. Their availability, renewability, low
density, and price as well as satisfactory mechanical properties make them an attractive
ecological alternative to glass, carbon and man-made fibers, which are used for the
manufacturing of composites. The natural fiber-containing composites are more
environmentally friendly, and are used in transportation (automobiles, railway coaches
and aerospace) military applications, building and construction industries (ceiling
paneling, partition boards), packaging and consumer products. Natural fiber reinforced
biodegradable polymer composites are the materials, that have the capability to fully

NatioPro
onal Seminar oceedings: 35on ‘Trends an
5th IEI Nationand Developme
.
l Convention oents in Automo
of Mechanicaotive Industry
l Engineers any’ during Septe
nd ember 4 ‐ 5, 2019.
3
degrade and compatible with the environment (Sahari 2011). However, there is still
uncertain prevails on which type of manufacturing processes is suitable for producing
these natural composites. For small to medium sized components, injection and
compression mouldings are preferred due to their simplicity and fast processing cycle.
However, for large structures, they are typically manufactured by open moulding and
autoclave processes.
Similar to other plastic products, the complexity of shape of a product also influences the
type of manufacturing processes to be used. For example, filament winding is the most
suitable method for manufacturing pressure vessels and cylinders. Pultrusion is mainly
used for producing long and uniform cross section parts. In some extent, optic fiber is
integrated into the pultrusion process to produce self-structural-health monitored
composite structures (Mei-po Ho et al. 2012).
Mounting global environmental and social concern, high rate of decline of petroleum
resources, and novel environmental policy have enforced the search for green composite
materials, attuned with the environment. The strategy is discussed in this report; it
aims to add value to the crops by processing the fibers into so called natural fiber
composites (Abilash & Sivapragash 2013).The success of natural fiber reinforced
polymeric composites is always dependent on the appropriate processing techniques and
modification of fibers is to improve the adhesion between fiber and the biopolymer.
Matrix modification and after treatment is also be adapted to improve the performance
as well as long-term durability and fire retardancy for the composites (Omar et al.
2014).
Agricultural wastes such as rice husk, rice straw and the waste extracted from sugar
cane, pineapple, banana and coconut have produced huge quantity of biomass, which are
denoted as natural fibers in various industries as an alternative to the raw materials for
producing biocomposites, automotive component, biomedical and others (Rudi et al.
2016). Palmyra epoxy composite is fabricated with the volume fraction of 40-60, and it is
suggested for the sound absorbing application (Nithyakalyani et al. 2016). Helmet outer
sell manufacturing is carried out by hybrid natural fiber composite, instead of plastic.
This is due to its high stiffness (Prasannasrinivas & Chandramohan 2012). Applications
of natural fibers, natural fiber composite and hybrid natural fiber composite are

NatioPro
onal Seminar oceedings: 35on ‘Trends an
5th IEI Nationand Developme
.
l Convention oents in Automo
of Mechanicaotive Industry
l Engineers any’ during Septe
nd ember 4 ‐ 5, 2019.
4
reviewed and discussed for various applications in engineering sectors such as
automotive, aerospace, marine, sporting goods and electronic industries (Sanja et al.
2016).
2. Classification of natural fibers
Fibers are a class of hair like material, that are continuous filaments or in discrete
elongated pieces, similar to pieces of thread. They can be spun into filaments, thread, or
rope. They are used as a component of composites materials. They are also matted into
sheets to make products such as paper or felt. Fibers are of two types, natural fiber and
man made or synthetic fiber. Fig. 1 illustrates the woven natural fibre mats produced
from aloevera and sisal plants and Fig. 2 shows the classification of natural fibers.
Natural fibers are those made from plant, animal and mineral sources. Natural fibers
are classified according to their origin. Animal fiber generally comprises proteins;
examples mohair, wool, silk, alpaca, angora. These fibers are extracted from animals or
hairy mammals, for example sheep’s wool, goat hair (cashmere, mohair), alpaca hair and
horse hair.
Silk Fibers are collected from dried saliva of bugs or insects during the preparation of
cocoons, and the examples include silk from silk worms. Avian Fibers are taken from
birds, example feathers and feather fiber. Mineral fibers are naturally occurring fiber or
slightly modified fiber procured from minerals. The Asbestos is the only naturally
occurring mineral fiber. Ceramic fibers are glass fibers (Glass, wood and Quartz),
aluminum oxide, silicon carbide, and boron carbide, where as aluminum fiber is one of
the metal fibers.

NatioPro
onal Seminar oceedings: 35on ‘Trends an
5th IEI Nationand Developme
.
l Convention oents in Automo
of Mechanicaotive Industry
l Engineers any’ during Septe
nd ember 4 ‐ 5, 2019.
5
Fig. 1 Woven natural fibre mats produced from aloevera and sisal plants (Source: Shadrach et al. 2015)
Fig.2 Classification of natural fibers which can be used as reinforcement of Polymer (Source: Shehu et al. 2014)
Plant fibers are generally comprises cellulose, and the examples include cotton, jute,
flax, ramie, sisal and hemp. Cellulose fibers are used in the manufacture of paper and
cloth. Fibers are collected from the seed and seed case example cotton and kapok. Fibers
are collected from the leaves example sisal, aloevera and agave. Fibers are collected
from the skin or bast surrounding the stem of their respective plant. These fibers have
higher tensile strength than other fibers. Therefore, these fibers are used for durable
yarn, fabric, packaging, and paper. Some examples of plant fibers are flax, jute, banana,
hemp, and soybean. A typical fiber and its microbril are presented in Fig. 3. Fibers are

NatioPro
onal Seminar oceedings: 35on ‘Trends an
5th IEI Nationand Developme
.
l Convention oents in Automo
of Mechanicaotive Industry
l Engineers any’ during Septe
nd ember 4 ‐ 5, 2019.
6
collected from the fruit of the plant, example coconut (coir) fiber. Fibers are actually the
stalks of the plant example straws of wheat, rice, barley, and other crops including
bamboo and grass. Tree wood is also a fiber.
The natural fibers are used to reinforce both thermosetting and thermoplastic matrices.
Thermosetting resins, such as epoxy, polyester, polyurethane, phenolic, etc. are
commonly used today in natural fiber composites, inwhich, the composites require
higher performance applications. They provide sufficient mechanical properties, in
particular stiffness and strength, at acceptable low price levels. Considering the
ecological aspects of material selection, replacing synthetic fibers by natural ones is the
first step to support our environment. The emission of green house effect is restricted to
avoid gases such as CO2 into the atmosphere and an increasing awareness of the
depletion of fossil energy resources. It leads to develop new materials that are entirely
based on renewable resources.
Fig. 3. Typical fiber (kenaf): Scanning electron micrograh (a) schematic macrofibril (b) and natural plant microfibril (c) (Source: Baillie, 2004 and Mei-po Ho et al. 2012)
3. Applications and advantages of natural fibers as automotive components
The natural fiber composites have very cost effective material for following
applications.The reasons for the application of natural fibers in the automotive industry
include:

NatioPro
onal Seminar oceedings: 35on ‘Trends an
5th IEI Nationand Developme
.
l Convention oents in Automo
of Mechanicaotive Industry
l Engineers any’ during Septe
nd ember 4 ‐ 5, 2019.
7
Low density, which leads to a weight reduction of 10 to 30 %.
Acceptable mechanical properties, good acoustic properties.
Favorable processing properties, for instance low wear on tools.
Options for new production technologies and materials.
Favorable accident performance, high stability, less splintering.
Favorable eco balance for part production.
Favorable eco balance during vehicle operation due to weight savings.
Occupational health benefits, when it is compared to glass fibers during production.
No off-gassing of toxic compounds. Reduction of fogging behavior.
Price advantages both for the fibers and the applied technologies.
The main advantages of natural fiber composite are,
Low specific weight results in a higher specific strength and stiffness than glass
fiber.
It is a renewable source, the production requires little energy, where CO2 is
used..
Producible, with low investment at low cost.
Minimal wear of tooling, healthier working condition, and no skin irritation.
Thermal recycling is possible, because glass causes problem in combustion
furnaces.
Good thermal and acoustic insulating properties.
In construction, automobile and manufacturing industries, composites with natural
fibers are highly expected because of its high tensile strength and modulus, as well as
for its low density and low elongation. The proper research right now always focuses and
attracts various sectors to move towards these natural fiber composites
(Venkateshwaran & Elayaperumal 2010).Industrial waste, mainly seeds and fibers, of
acai fruit and these fibers are used to obtain composites with natural rubber from
different clones and it is investigated for its mechanical and thermal properties. They
are comparable to those with other fibers used in polymer composite industries (Martins
et al. 2008). Recently, human hair fiber is used as an alternative reinforcement for fiber

NatioPro
onal Seminar oceedings: 35on ‘Trends an
5th IEI Nationand Developme
.
l Convention oents in Automo
of Mechanicaotive Industry
l Engineers any’ during Septe
nd ember 4 ‐ 5, 2019.
8
reinforced polymer due to its well characterized microstructures (Akarsh et al.
2016).The components made by the natural fiber reinforced composite for Mercedes-
Benz car is presented in Fig. 4.The mechanical properties of the natural fibers are
presented in Table 1.The natural fiber composites used in various automobiles are
presented in Table 2.
Fig.4 Components made by natural fibers for Mercedes-Benz E-Class components (source: Sue Elliott-Sink, 2005)
Table 1 Mechanical properties of natural fibers
Fiber Density (g/cm3)
Diameter (µm)
Tensile strength
(MPa)
Young’s modulus
(GPa)
Elongation at break (%)
Jute 1.3 -1.45 25-200 393-773 13-26.5 1.16-1.5
Hemp - - 690 - 1.6
Kenaf - - - - 2.7
Flax 1.5 - 345-1100 27.6 2.7-3.2
Ramie 1 - 400-938 61.4-128 1.2-3.8
Sunn - - 1.17-1.9 - 5.5
Sisal 1.45 50-200 468-640 9.4-22 3-7
Cotton 1.5-1.6 - 287-800 5.5-12.6 7-8
Kapok - - - - 1.2
Coir 1.15 100-450 131-175 4-6 15-40
Banana - - 1.7-7.9 - 1.5-9.0
PALF - 20-80 413-1627 34.5-82.5 1.6
Source: Ramakrishna et al. 2009

NatioPro
onal Seminar oceedings: 35on ‘Trends an
5th IEI Nationand Developme
.
l Convention oents in Automo
of Mechanicaotive Industry
l Engineers any’ during Septe
nd ember 4 ‐ 5, 2019.
9
Table 2 Automotive models, manufacturers, and components using natural fiber composites
Model Manufacturer Components
A2,A3,A4, A4 Avant, A6, A8 Road star, Coupe
Audi Seat back,side and back door panel, boot lining, hat rack, spare tyre liner
C5 Citroen Interior door paneling
3,5,7 series BMW Door panels, headliner panel, boot-lining, seat back, noise insulation panels, molded foot well linings
Eco Elise Lotus Body panels, spoiler, seats, interior carpets
Punto, Brava, Marea, Alfa Romeo 146,156
Fiat Door panel
Astra, Vectra, Zafira Opel Instrumental panel, headliner panel, door panels, Pillar cover panel
406 Peugeot Front and rear door panels
2000 and others Rover Insulation, rear storage shelf/panel
Raum, Brevis, Harrier, Celsior
Toyota Door panels, seat backs, floor mats, spare tier cover
Golf A4, Passat, Variant, Bora
Volkswagen Door panel, seat back, boot-lid finish panel,boot-liner
Space star, Colt Mitsubishi Cargo area floor, door panels, instrumental panels
Clio, Twingo Renault Rear parcel shelf
Mercedes A,C,E,S class, Trucks EvoBus (exterior)
Daimler-Benz Door panels, windshield/dashboard, business table, Piller cover panel, glove box, instrumental panel support, insulation, molding rod/apertures, seat backrest panel, trunk panel, seat surface/backrest, internal engine cover, engine insulation, sun visor, bumper, wheelbox, roof cover
Pilot Honda Cargo area
C70,V70 Volvo Seat padding, natural foams, cargo floor tray
Cadillac Deville, Chevrolet Trial Blazer
General Motors Seat backs, cargo area floor
L3000 Saturn Package trays and door panel
Mondeo CD 162, Focus, freestar
Ford Floor trays, door panels, B-piller, boot liner
Source: Omar et al. 2014

NatioPro
onal Seminar oceedings: 35on ‘Trends an
5th IEI Nationand Developme
.
l Convention oents in Automo
of Mechanicaotive Industry
l Engineers any’ during Septe
nd ember 4 ‐ 5, 2019.
10
3. Mechanical Properties of Natural Fiber Reinforced Composites
Composites made from short sun hemp, banana, and sisal are studied for its tensile
properties and it identifies the sun hemp, which shows favorable tensile strength
(Udaya et al. 2007).Increment of tensile strength up to 90 % is noted on the composite,
which is made from pseudo-stem banana woven fabric reinforced into epoxy resin, when
it is compared with virgin epoxy (Maleque et al. 2007). Mechanical properties of particle
size, short fiber and long fiber are randomly oriented and are intimately mixed with
Hibiscus sabadariffa natural fiber reinforced along with urea formaldehyde resin
composite. This is tested for its tensile and compressive strength for its various fiber
loadings and the mechanical behavior of this composite is observed to be more effective
(Singha & Vijay 2008).
The cellulosic content of the fibers varies from fiber to fiber, influences the mechanical
properties of composites mainly by the adhesion between matrix and fibers. Chemical
and physical modification methods are incorporated to improve the fiber–matrix
adhesion resulting in the enhancement of mechanical properties of the composites
(Ramakrishna et al. 2009). Flax fiber reinforced epoxy composites are arranged by
quasi-unidirectional method, which shows an increment of tensile and flexural strength
(Igor et al. 2010). The alkali treatment is found to be an effective for improving the
tensile and flexural properties, while the impact strength is decreased for Roystonea
regia (royal palm) natural-fiber-reinforced epoxy composites (Govardhan & Rao
2011).Hybrid composites of sisal/banana and its tensile properties are determined by the
Rule of hybrid mixture. Its values are found to be higher when compared with
experimental values. Variations of tensile properties are also observed due to the
occurrence of micro voids in the composites during the fabrication (Venkateshwaran et
al. 2012).
Fibers obtained from rice husk, jute, banana, and coconut have an excellent physical
and mechanical property. Among this, mechanical properties of banana fiber reinforced
composite are optimally good (Naresh & Kumar 2012). Higher tensile strength is
observed for the treated fibers by Silane and Alkali in plantain empty fruit bunch fiber
than that of untreated fibers (Chimekwene et al. 2012). The mechanical properties of the
hybrid composites are found to be enhanced linearly with the volume fraction of high
strength fibers up to certain maximum value, beyond which a negative hybrid effect has

NatioPro
onal Seminar oceedings: 35on ‘Trends an
5th IEI Nationand Developme
.
l Convention oents in Automo
of Mechanicaotive Industry
l Engineers any’ during Septe
nd ember 4 ‐ 5, 2019.
11
been observed because of the formation of agglomerates (Srinivas Nunna 2012). Fig. 5
shows the typical stress strain curve for some the omposites tested.
Fig. 5 Typical stress-strain curve observed for tensile and flexural loading of different composites (AK alovera and kenaf, SK sisal and kenaf, ASK alovera, sisal and kenaf)
(Source: Shadrach et al. 2017)
Resin transfer moulding and compression moulding methods are used to make banana
fiber phenol formaldehyde resin composites and its tensile properties are determined as
a function of fiber length and fiber loading. Fiber loading values are found to be higher
for RTM when compared with CM composites for its tensile properties (Indira et al.
2013). The mechanical properties for some of the natural fiber composites with GFRPS
are evaluated and their comparisons are presented in Table 3.

NatioPro
onal Seminar oceedings: 35on ‘Trends an
5th IEI Nationand Developme
.
l Convention oents in Automo
of Mechanicaotive Industry
l Engineers any’ during Septe
nd ember 4 ‐ 5, 2019.
12
Table 3 Mechanical properties of natural fibre composites compared with regenerated cellulose composites and GFRPS
Fibre Matrix Fibre
content
(m%)
Tensile
strength
(MPa)
Stiffness
/Young’s
Modulus
(GPa)
Flexural
Strength
(MPa)
Flexural
Modulus
(GPa)
Impact
strength
(KJ/m2
or J/m)
Notes: Processing
/length/treatment
Sisal (aligned) Epoxy 73 410 6 320 27 Alkali treated
bundles CM/leaky
mould
Sisal (aligned) Epoxy 77 330 10 290 22 Untreated bundles
CM/leaky mould
Enzyme extracted
RTM
Flax (aligned) Epoxy 46/54 280/279 35/39 223 14 CM
Harakeke
(aligned)
Epoxy 50/55 223 17
Harakeke
(aligned)
Epoxy 52 211 15 CM
Sisal (aligned) Epoxy 48 211 20 RTM
Sisal (aligned) Epoxy 37 183 15 RTM
Flax yarn
(aligned)
Epoxy 45 311 25 Not stated
Hemp (aligned) Epoxy 65 165 17 180 9 15 (c) CM
Flax yarn
(aligned)
Epoxy 31 160 15 190 15 Hand lay up
(Knitted yarn)
Flax yarn
(aligned)
Epoxy 45 133 28 218 18 Autoclave
Flax (aligned) Epoxy 37 132 15 RTM
Flax hackled
(aligned)
Epoxy 28 182 20 Pultruded
Flax yarn
(aligned)
VE 24 248 24 RTM
Flax (silver)
(aligned)
UP 58 304 30 Soxhlet extracted
Vacuum
impregnated/CM
Flax yarn
(aligned)
UP 34 143 14 198 17 RTM (knitted yarn)

NatioPro
onal Seminar oceedings: 35on ‘Trends an
5th IEI Nationand Developme
.
l Convention oents in Automo
of Mechanicaotive Industry
l Engineers any’ during Septe
nd ember 4 ‐ 5, 2019.
13
Alfa (aligned) 48 149 12 Alkali treated then
bleached
Flax yarn
(aligned)
UP 72 321 29 Filament wound
Flax yarn
(aligned)
PP 30 89/70 7/6 88/115
(c)
Pultrude flax/PP
yarn
Flax (aligned) PP 50 40 7 751 (i) Needle punched
flax/PP mats CM
Kenaf (aligned) PHB 40 70 6 101 7 10(c) CM
Flax silver
biaxial/major
axis
Epoxy 46 200 17 194 13 Wrap spun, silver
woven,weft:warp
strength 10:1
Flax (woven) Epoxy 50 104 10 Sized and dried
prior to pre-preg
Flax yarn
(woven)
VE 35 111 10 128 10 RTM
Jute (woven) UP 35 50 8 103 7 11(c) RTM
Harakeke
(DSF)
PLA 30 102 8 Alkali treated CM
Hemp (DSF) PLA 25 87 9 Alkali treated CM
Source: Pickering et al. 2016
Flax fiber reinforced polymeric composites show the improvement in the interface
between fibers and matrix, where the flax fibers have under gone chemical treatments,
such as mercerization, silane treatment and benzoylation etc., Also, the use of
nanotechnology flax nanofibers and the addition of nanoclays in flax composites highly
improves the mechanical performances (Jinchun et al. 2013). Different weight ratios
such as 100/0, 75/25, 50/50, 25/75 and 0/100 for jute and banana fibers are reinforced
into epoxy matrix. Increment of mechanical and thermal properties is noted, where 50 %
of banana fiber are added into jute/epoxy composites. Moreover, moisture absorption is
also found to be decreased (Boopalan et al. 2013). Tensile strength of hemp shive
composite is increased upto 40 % of its content, after that, decrement takes place due to
the formation of particles agglomerations after that, the filler exceeds the optimal filler
content value (Marcel et al. 2013).

NatioPro
onal Seminar oceedings: 35on ‘Trends an
5th IEI Nationand Developme
.
l Convention oents in Automo
of Mechanicaotive Industry
l Engineers any’ during Septe
nd ember 4 ‐ 5, 2019.
14
A green composite Oil Palm Trunk Lumber is made by reinforcing oil palm shell with
formaldehyde resin. The changes in mechanical properties are observed by keeping it in
natural weathering for the period of 6 to 12 months. This investigation makes the way
for natural composites to be improved in outdoor conditions (Nazrul et al. 2013). Tensile
strength, flexural stress, flexural strain and tangent modulus of the bamboo fiber and
PVC foam sheet composites are increased, while the tensile strain decreases with the
subsequent fiber addition to the PVC sheets (Humayun et al. 2014). Banana and flax
hybrid composites are fabricated with lamination of glass fiber reinforcement polymer
on either side. Mechanical and surface properties have increased due to the lamination.
As well as, hybrid composite has observed to have good strength than individual fiber
composites (Srinivasan et al. 2014). Silicon carbide is added as a filler material for the
natural fiber composite, and it shows an increase in its mechanical properties such as
hardness, tensile strength, interlaminar strength, flexural strength and impact strength
(Madhusudhan & Keerthi 2016). Young’s modulus and ultimate tensile strength have
been increased in the epoxy composite, when it is reinforced with fermented degraded
wheat straw while compare with non-degraded straw (Maria et al. 2016). Fig. 6 shows
the typical scanning electron microscope observed for the alovera and kenaf, SK sisal
and kenaf, ASK alovera, sisal and kenaf composites.
Treatment of the natural fibers shows an improvement in adhesion and reduction of
water absorption by beating and heating in physical treatments and alkalization, silane,
acetylation and benzoylation in chemical treatments, and hence there is an
improvement in the mechanical properties of the natural fiber composites
(Venkatachalam et al. 2016).Mechanical properties such as impact, flexural and
compression strength on the pseudo stem banana woven fabric reinforced unsaturated
polyester composite is found to be good compared to virgin unsaturated polyester
composite (Bushra et al. 2010). Impact strength of natural fiber has been gradually
increased along with its stiffness by including the effect of moisture and weathering on
these properties. This is due to the improvements in selecting, treating, extracting and
processing the fiber to composites, made its applications to a greater extension
(Pickering et al. 2016). Tensile, compressive, flexural and hardness strength are
observed to be varied in human hair fiber reinforced epoxy composite by varying fiber
and resin percentage (Prakash & Christu 2016).

NatioPro
onal Seminar oceedings: 35on ‘Trends an
5th IEI Nationand Developme
.
l Convention oents in Automo
of Mechanicaotive Industry
l Engineers any’ during Septe
nd ember 4 ‐ 5, 2019.
15
Fig. 6 SEM micrograph observed for the alovera and kenaf, SK sisal and kenaf, ASK alovera, sisal and kenaf (Source: Shadrach et al. 2017)
4. Tribological Properties of Natural Fiber Reinforced Composites
The wear over the material is simply defined as the loss of mass on a surface of a solid
progressively during relative motion, leads to surface damage or rupture (Bressan et al.
2007). With the drastic improvement in material science, particularly natural fibers,

NatioPro
onal Seminar oceedings: 35on ‘Trends an
5th IEI Nationand Developme
.
l Convention oents in Automo
of Mechanicaotive Industry
l Engineers any’ during Septe
nd ember 4 ‐ 5, 2019.
16
which are light in weight and have high mechanical properties, research on tribological
properties is carried out by reducing the weight of various wear components, thereby
reducing weight of machines (Semenov 2007). Natural fibers are utilized in various
applications of wear and friction. The advantage of natural fibers over traditional
reinforcing materials includes low density, low cost, biodegradability and recyclability.
Figure 7 Pin on disc wear tester used for dry sliding wear test
Abrasive wear rate is tested by using a two body abrasion wear tester and the bagasse
fiber reinforced epoxy composite strongly depends upon load and abrasive grit size. With
an increase of load and grit size, the wear rate increases. The orientation of fiber in
composites has a significant influence on the wear rate of composite (Punyapriya &
Acharya 2010).The importance of natural fibre with the advent of sustainable
development is narrated, and the composite material has now become more prominent
in many applications. Many natural fibres in polymeric composites are being introduced
in aviation industry, construction, industrial applications, automotive parts, bearing
and many others, making tribo-testing more demanding (Nirmal et al. 2011). The
typical wear testing machine used is presented in Fig. 7. Natural fibres application is an
important material substitution, which traditionally takes place also in automotive
industry. This paper from the application point of view, deals with the friction
properties, analysis of polypropylene and polyactide, which are filled by selected natural

NatioPro
onal Seminar oceedings: 35on ‘Trends an
5th IEI Nationand Developme
.
l Convention oents in Automo
of Mechanicaotive Industry
l Engineers any’ during Septe
nd ember 4 ‐ 5, 2019.
17
fibres of vegetable and animal origin mainly coconut, fleece, flax and cellulose fibres
(Lubos 2012). Abrasive wear behavior of Lantana camara fiber reinforced in epoxy
matrix is experimented. Wear tests are carried out in dry conditions on a pin-on-disc
machine against 400 grit size abrasive paper with the test speed of 0.314 m/s and
normal load 5,10,15,20 and 25 N. The optimum wear reduction is obtained, when the
fiber content is 40wt %. It is observed that, abrasive wear loss increases with an
increase in the normal load (Chittaranjan & Acharya 2010).
Wear studies are carried out on bio-waste coir dust reinforced Polymer composites in
erosive and abrasive mode ,it is found that, coir dust loading influences the erosive and
abrasive wear behaviour of the composite (Aireddy & Mishra 2011). The friction and
wear behaviors of polyimide composites sliding against GCr15 steel rings are evaluated
on an M-2000 model ring-on-block test rig. The results show that, the surface of the
treated carbon fiber becomes rougher and it forms lots of active groups after rare earth
treatment. The friction coefficient and wear rate of polyimide composites with rare earth
treated carbon fiber are lower than the untreated carbon fiber (Zhang et al. 2007).
The effect of the reinforcement of thermosetting polyester with short glass fibers has
been investigated for its tribological behavior. The wear rate of polyester composites is
much lower than that of the unreinforced polyester. The wear rate and the coefficient of
friction are both at a minimum with a fiber-glass proportion of 10 percent weight, and
they both increase, when this proportion is made either lower or higher. With increasing
sliding speeds, the wear rate increases but there is no significant effect on the coefficient
of friction (Bahadur & Zheng 1990). The incorporation of rice husk in to epoxy
significantly reduces the abrasive wear loss. The optimal wear resistance property is
obtained at a fiber content of 10 percent weight fraction. Wear resistance of the rice
husk reinforced epoxy composite is increased, if the surface of the rice husk is treated
suitably (SudhakarMajhi et al. 2012). Many types of nano- filling martials, including
SiC, Si3N4, SiO2, ZrO2, ZnO, CaCO3, Al2O3, TiO2, and nano-CuO, have been used to
different types of polymers such as PEEK; PMMA; PTFE and epoxy. Good tribological
properties are obtained for polymers filled with nano-scale fillers, when it is compared

NatioPro
onal Seminar oceedings: 35on ‘Trends an
5th IEI Nationand Developme
.
l Convention oents in Automo
of Mechanicaotive Industry
l Engineers any’ during Septe
nd ember 4 ‐ 5, 2019.
18
with the filled micro-scale particles. The friction and wear resistance of these composites
are found to increase by increasing the filler concentration (Ayman et al. 2012).
Hybrid bamboo/glass fiber reinforced epoxy composites are fabricated by simple hand
lay- up technique. In steady, state erosion rate is concerned with respect to impact
velocity and so all the composites show gradual increase in erosion rate except in 0wt. %
of bamboo/glass fiber reinforced epoxy composites which shows quite reverse in trend at
higher impact velocity. This is due to the neat epoxy, which losses its properties and
then starts melting. It is also clear that, neat epoxy shows maximum erosion rate and
15wt. % of bamboo/glass fiber shows least erosion rate, whereas 30wt. % and 45wt. % of
hybrid composites lie in between the other two composites. Similarly, as far as
impingement angle is concerned, all the hybrid composites show maximum erosion rate
at 60° impingement angle irrespective of fiber loading. So the mode of wear is neither a
ductile erosion mode nor brittle erosion wear mode, it behaves like semi-brittle mode of
erosion wear (Sandhyarani & Prity 2012).
The use of natural fibers increases due to their unique property by increasing the
strength in the composite material. Sudhakar majhi, has developed a polymer matrix
composite (epoxy resin) using modified and unmodified rice husk as reinforcement and
has studied their tribological properties by using pin-on disc machine. The modified RH
composite is found to give better tribological properties than unmodified RH composite
(Sudhakar et al. 2012).Tensile analyses are done for E glass woven roving and chopped
strand mat composites. Finite element results naturally involve in some deviations from
exact solutions due to characteristics of composites. Matrix crack, fiber failures and
increasing stiffness are considered in deformation mechanics of real testing process, and
it is not considered in theoretical approach (Gutu 2012).
Rice straw is treated with alkali and acids to remove impurities and waxy substance and
it gets improvement in the quality of fiber by using statistical analysis and design of
experiments. This has shown an enhancement in the mechanical properties (Irene et al.
2012). The surface behaviors of boiled egg shell and rice husk particulates are studied.
The maximum surface roughness value (Ra) is obtained in coir length of 10 mm, 10 % wt.
of fiber content and 15 % wt. of hybrid particles (rice husk and boiled egg shell each).

NatioPro
onal Seminar oceedings: 35on ‘Trends an
5th IEI Nationand Developme
.
l Convention oents in Automo
of Mechanicaotive Industry
l Engineers any’ during Septe
nd ember 4 ‐ 5, 2019.
19
The least surface roughness value (Ra) is obtained in coir length of 30 mm, 10 % wt. of
fiber content and15 % wt of hybrid particles (Karthik et al. 2014).Hand layup technique
is employed for preparing the glass fiber based epoxy hybrid composite samples, by
varying weight fraction of bi-directional glass fiber (40 % wt., 60 % wt. and 80 % wt.).
The ratio of filler is fixed with/without 10 % wt. and it is observed that, wear rate
decreases with an increase in the fiber weight percentage. Mechanical properties of
composites increase with an increase in the fiber loading. The mechanical and wear
behavior of filled composites are more superior than unfilled composites (Sandeep et al.
2013). Percentage of fiber with respect to weight shows difference in tensile and flexural
strength of glass fiber reinforced epoxy composites than unreinforced epoxy. Tensile
strength is increased by 14.5 % and flexural is about to 123.65 %, when 20 % of fiber
weight is added over pure epoxy. Because of high flexural strength, stiffness of the
composite is improved drastically. Maximum stresses are observed for tensile and
flexural at the middle of the specimen, where the fracture is originated, and it is proved
by the results of finite element analysis (Satnam et al. 2013).
Tribological behavior of Short PALF reinforced Bisphenol-A composite is investigated.
The composites reinforced with the fiber length of 2, 4, 6, 8, 10, 12 and 14 mm are
subjected to wear test. The wear behavior of the composites is performed using pin on
disc machine at varying loads of 5 N, 10 N and 15 N and at constant sliding distance,
velocity and speed. The result shows that, the wear rate increases with an increase in
load for the composite specimen, which has less interfacial bond strength. From this
experimental study, it is observed that, the fiber length greatly influences the wear
properties of reinforced composites (Supreeth et al. 2014).There-body abrasive wear of
the hybrid composites are studied under different filler loading, treatment of the coir
sheath, and abrading distance. The results of the abrasive wear test have revealed that,
the wear volume increases with an increase in the abrading distance and specific wear
rate is high for the untreated composites, when it is compared to alkali treated
composites and silane treated composites (Divya et al. 2014).Fig. 8 shows the typical
three D response graph for wear loss and co. efficient of friction for kenaf fiber
reinforced composites.

NatioPro
onal Seminar oceedings: 35on ‘Trends an
5th IEI Nationand Developme
.
l Convention oents in Automo
of Mechanicaotive Industry
l Engineers any’ during Septe
nd ember 4 ‐ 5, 2019.
20
a. d.
b. e.
c. f.
Fig. 8 Typical three D response graph for wear loss and co. efficient of friction for kenaf fiber reinforced composites with respect to two different parameters by keeping the third parameter at
constant middle level
1.44
1.8
2.16
2.52
2.88
9.81 13.08
16.35 19.62
22.89 26.16
29.43
0.1
0.2
0.3
0.4
0.5
0.6
Wea
r lo
ss f
or k
enaf
com
posi
te m
m3/
m
A: Load (N)B: Sliding speed (m/s)1.44
1.8
2.16
2.52
2.88
9.81 13.08
16.35 19.62
22.89 26.16
29.43
0.3
0.36
0.42
0.48
0.54
0.6
Co.
eff
of
fric
tion
of k
enaf
com
posi
te
A: Load (N)B: Sliding speed (m/s)
ed value
1000
1500
2000
2500
3000
9.81 13.08
16.35 19.62
22.89 26.16
29.43
0.1
0.22
0.34
0.46
0.58
0.7
Wea
r lo
ss f
or k
enaf
com
posi
te m
m3/
m
A: Load (N)C: Sliding Distance (m)
ted value
1000
1500
2000
2500
3000
9.81 13.08
16.35 19.62
22.89 26.16
29.43
0.3
0.36
0.42
0.48
0.54
0.6
Co.
eff
of
fric
tion
of k
enaf
com
posi
te
A: Load (N)C: Sliding Distance (m)
ed value
1000
1500
2000
2500
3000
1.44
1.8
2.16
2.52
2.88
0.1
0.2
0.3
0.4
0.5
0.6
Wea
r lo
ss f
or k
enaf
com
posi
te m
m3/
m
B: Sliding speed (m/s)C: Sliding Distance (m)1000
1500
2000
2500
3000
1.44
1.8
2.16
2.52
2.88
0.3
0.36
0.42
0.48
0.54
0.6
Co.
eff
of
fric
tion
of k
enaf
com
posi
te
B: Sliding speed (m/s)C: Sliding Distance (m)

NatioPro
onal Seminar oceedings: 35on ‘Trends an
5th IEI Nationand Developme
.
l Convention oents in Automo
of Mechanicaotive Industry
l Engineers any’ during Septe
nd ember 4 ‐ 5, 2019.
21
Mechanical properties for the fabricated wool fiber reinforced polypropylene composites
is optimized by using Box-Behnken method with three levels and three variables using
temperature, time, and pressure, as independent variables and tensile, flexural, and
impact strengths as dependent variables. Molding pressure and time are significant for
tensile and flexural strengths, while they are insignificant for impact strength
(Rajkumar et al. 2014). Ultra-high molecular weight polyethylene composites with talc
and glass fiber as particulates are fabricated. Pin-on-disc tribometer is used to
determine the wear and friction properties of these hybrid composites with different
operating conditions of applied loads, sliding speeds and sliding distances based on
response surface Box–Behnken design. GF/ZnO/UHMWPE has exhibited better wear
performance, when it is compared to talc/ZnO/ UHMWPE hybrid composites. (Boon et
al. 2014). Groundnut Shell Vinyl Ester Composites are prepared with different process
parameters, namely, particle size, filler loading and alkali treatment of particles From
parametric analysis, it is revealed that tensile strength and tensile modulus increase
with an increase in the filler loading up to 50-wt % and beyond 5 % NaOH treatment of
particles (Raju et al. 2015).
Woven flax/PLA composite mechanical properties are optimized with the application of
RSM using Box Behnken design The ANOVA data shows that, the variables have
affected the impact strength significantly. (Mat Kandar & Akil 2016).Short palmyra
fiber reinforced epoxy composites are tested for dry sliding wear and it is observed that,
the fiber content and the sliding velocity are the most significant, factors that affect the
wear performance of the composites. ANN specific wear rate is predicted beyond the
experimental domain (Somen & Alok 2016). Hence, silicon carbide is used as a filler
material in the hybrid glass and basalt epoxy composite, and its flexural modulus and
flexural strength are found to be increased. Specific wear rate decreases with an
increase in the sliding distance for all the samples. When 6 % Silicon carbide is used as
filler material, it shows better dry sliding wear resistance (Prasanna et al. 2016).
Carbon and coir fibre polyester composite are filled with graphite and coconut shell
powder, and they are used as particulate reinforcements. Wear rate and co efficient
friction are calculated by using Pin on disc tribometer for various speed and loads and
wear resistance is higher for fiber loaded composite (Ibrahem 2016). Natural fiber
reinforced composites have comparable mechanical properties and also have

NatioPro
onal Seminar oceedings: 35on ‘Trends an
5th IEI Nationand Developme
.
l Convention oents in Automo
of Mechanicaotive Industry
l Engineers any’ during Septe
nd ember 4 ‐ 5, 2019.
22
improvement in tribological properties. Experimental study reveals that, normal
oriented fibers exhibit better friction and wear behavior than the treated fibers. Normal
orientation of fibers against sliding direction is found to be the best orientation and it is
one of the factors, that affects wear and friction behavior. Fiber and matrix selection
based on volume fraction and applied load vary in friction and wear performance.
Generally, the wear rate increases by increasing the applied load (Emad et al. 2016).Fig.
9 shows the US composite industry revenue based on the fiber used. The figure clearly
indicates the trend of future usage of natural fibers and hence the natural fibers are
playing vital role in the parts manufacturing of the automotive industry.
Fig. 9US composite industry revenue based on the fiber used (Source: Grand View research)
Conclusions
In the present work, the use of natural fiber composite materials in automotive
industries and related trends are discussed and reviewed.
Natural fiber reinforced composite materials posses good strength and triblogical
properties and hence, these composites can be used as a replacing materials for
plastics which is commonly used.
Many composnents related to the automotives are manufactured by means of
natural fibres. World car manufacturers are using natural fibers in their cars
and related vehicles.

NatioPro
onal Seminar oceedings: 35on ‘Trends an
5th IEI Nationand Developme
.
l Convention oents in Automo
of Mechanicaotive Industry
l Engineers any’ during Septe
nd ember 4 ‐ 5, 2019.
23
The natural fibers are environmental friendly and are able to replace the
synthetic fibers.
The trends in usage of natural fibers indicate that the natural fiber industries
are growing world wide rapidly.
References
1. Abilash, N & Sivapragash, M 2013, ‘Environmental benefits of eco- friendly natural fiber
reinforced polymeric composite materials’, International Journal of Application or Innovation
in Engineering & Management, vol. 2, pp. 53-59.
2. Aireddy, H & Mishra, SC 2011, ‘Tribological behavior and mechanical properties of Bio-waste
reinforced polymer matrix composites’,Journal of Metallurgy and Materials Science, vol. 53,
no. 2, pp. 139-152.
3. Akarsh Verma, Singh, VK, Verma, SK & Anshul Sharma 2016, ‘Human Hair: A
Biodegradable Composite Fiber – A Review’, International Journal of Waste, vol. 6, issue 2,
pp. 1-4.
4. Ayman A Aly 2012, ‘Friction and wear of polymer composites filled by nano-particles: A
review’, World Journal of Nano Science and Engineering, vol. 2, pp. 32-39.
5. Bahadur, S & Zheng, Y 1990, ‘Mechanical and Tribological Behavior of Polyester Reinforced
with Short Glass Fibers’, Wear, vol. 137, pp. 251-266.
6. Baillie C. Green composites: polymer composites and the environment. CRC Press; 2004.
7. Boon Peng Chang, Hazizan Md Akil, Muhammad Ghaddafy Affendy, Abbas Khan &
Ramdziah Bt Md Nasir 2014, ‘Comparative study of wear performance of particulate and
fiber-reinforced nano-ZnO/ultra-high molecular weight polyethylene hybrid composites using
response surface methodology’, Materials and Design, vol. 63, pp. 805-819.
8. Boopalan, M, Niranjanaa, M & Umapathy, MJ 2013, ‘Study on the mechanical properties and
thermal properties of jute and banana fiber reinforced epoxy hybrid composites’, Composites:
Part B, vol. 51, pp. 54-57.
9. Bressan, JD, Daros, DP, Sokolowski, A, Mesquits, RA & Barbosa, CA 2007, ‘Influence of
hardness on the wear resistance of 17-4 PH stainless steel evaluated by the pin-on-disc
testing’, Journal of Materials Processing and Technology, vol. 205, pp. 353-359.
10. Bushra H Musa, Rafah A Nassif & Enass M Hadi 2010, ‘Study of the mechanical properties
for unsaturated polyester reinforced by natural fibers’, Journal of Al-Nahrain University, vol.
13, no. 3, pp. 65-68.
11. Chimekwene, CP, Fagbemi, EA & Ayeke, PO 2012, ‘Mechaical properties of plantain empty
fruit bunchfiber reinforced epoxy composite’, International Journal of Research in
Engineering, vol. 2, issue 6, pp. 86-94.
NatioPro
onal Seminar oceedings: 35on ‘Trends an
5th IEI Nationand Developme
.
l Convention oents in Automo
of Mechanicaotive Industry
l Engineers any’ during Septe
nd ember 4 ‐ 5, 2019.
24
12. Chittaranjan Deo & Acharya, SK 2010, ‘Effects of fiber content on abrasive wear of Lantana
camara fiber reinforced polymer matrix composite’, Indian Journal of Engineering & Material
sciences, vol. 17, pp. 219-223.
13. Divya, GS, Anand Kakhandaki & Suresha, B 2014, ‘Wear behavior of coir reinforced treated
and untreated hybrid composites’, International Journal of Innovative Research &
Development, vol. 3, no. 5, pp. 632-639.
14. Emad Omrani, Pradeep L Menezes & Pradeep K Rohatgi 2016, ‘State of the art on
tribological behavior of polymer matrix composites reinforced with natural fibers in the green
materials world’, Engineering Science and Technology, an International Journal, vol. 19, pp.
717-736.
15. Govardhan Goud & Rao, RN 2011, ‘Effect of fiber content and alkali treatment on mechanical
properties of Roystonea regia-reinforced epoxy partially biodegradable composites’, Bulletin
of Materials Science, vol. 34, no. 7, pp. 1575-1581.
16. Grand View research: https://www.grandviewresearch.com/industry-analysis/natural-fiber-
composites-market
17. Gutu, M 2012, ‘Experimental and numerical analysis of stresses and strain in specimen of
composite material’, Merdian Ingineresc, vol. 4, pp. 24-27.
18. Humayun Kabir, Abdul Gafur Md, Farid Ahmed, Farhana Begum & Rakibul Qadir Md 2014,
‘Investigation of physical and mechanical properties of bamboo fiber and PVC foam sheet
composites’, Universal Journal of Materials Science, vol. 2, no.6, pp. 119-124.
19. Ibrahem, RA 2016, ‘Friction and Wear Behaviour of Fibre / Particles Reinforced Polyester
Composites’, International Journal of Advanced Materials Research, vol. 2, no. 2, pp. 22-26.
20. Igor Maria De Rosa, Carlo Santulli & Fabrizio Sarasini 2010, ‘Mechanical and thermal
characterization of epoxy composites reinforced with random and quasi-unidirectional
untreated Phormium tenax leaf fibers’, Materials and Design, vol. 31, pp. 2397-2405.
21. Indira, KN, Jyotishkumar Parameswaranpillai & Sabu Thomas 2013, ‘Mechanical properties
and failure topography of banana fiber pf macrocomposites fabricated by RTM and CM
techniques’, ISRN Polymer Science, Article ID 936048, 8 pages, Hindawi Publishing
Corporation.
22. Irene S Fahim, Salah M Elhaggar & Hatem Elayat 2012, ‘Experimental Investigation of
Natural Fiber Reinforced Polymers’, Materials Sciences and Applications, vol. 3, pp. 59-66.
23. Jinchun Zhu, Huijun Zhu, James Njuguna & Hrushikesh Abhyankar 2013, ‘Recent
development of flax fibers and their reinforced composites based on different polymeric
matrices’, Materials, vol. 6, pp. 5171-5198.

NatioPro
onal Seminar oceedings: 35on ‘Trends an
5th IEI Nationand Developme
.
l Convention oents in Automo
of Mechanicaotive Industry
l Engineers any’ during Septe
nd ember 4 ‐ 5, 2019.
25
24. Karthik, R, Sathiyamurthy, S, Jayabal, S & Chidambaram, K 2014, ‘Tribological behaviour of
rice husk and egg shell hybrid particulated coir-polyester composites’, IOSR Journal of
Mechanical and Civil Engineering, e- ISSN: 2278-1684, p-ISSN : 2320–334X, pp. 75-80.
25. Lubos Behalek 2012, ‘Friction properties of composites with natural fibres, Synthetic and
biodegradable polymer matrix’, NANOCON, Brno, Czech Republic, EU.
26. Madhusudhan, T & Keerthi Swaroop, G 2016, ‘A Review on Mechanical Properties of Natural
Fiber Reinforced Hybrid Composites’, International Research Journal of Engineering and
Technology, vol. 03, no. 04, pp. 2247-2251.
27. Maleque, MA, Belal, FY & Sapuan, SM 2007, ‘Mechanical properties study of pseudo-stem
banana fiberreinforced epoxy composite’, The Arabian Journal for Science and Engineering,
vol. 32, no. 2B, pp.359-364.
28. Marcel Ionel Popa, Silvia Pernevan, Cecilia Sirghie, Iuliana Spiridon, Dorina Chambre, Dana
Maria Copolovici & Niculina Popa 2013, ‘Mechanical properties and weathering behavior of
polypropylene-hemp shives composites, Hindawi Publishing Corporation, Journal of
Chemistry, vol. 2013, Article ID 343068, 8 pages http://dx.doi.org/ 10.1155/2013/343068.
29. Maria Sotenko, Stuart R Coles, Iain McEwen, Rejane DeCampos, Guy Barker & Kerry
Kirwan 2016, ‘Biodegradation as natural fibre pre-treatment in composite manufacturing’
Green Materials, vol. 4, no.1, pp. 8-17.
30. Martins, MA, Pessoa, JDC, Goncalves, PS, Souza, FI & Mattoso, LHC 2008, ‘Thermal and
mechanical properties of the acaı´ fiber/natural rubber composites’, Journal of Material
Science, vol. 43, no. 19, pp. 6531-6538.
31. Mat Kandar, MI & Akil, HM 2016, ‘Application of Design of Experiment (DoE) for
Parameters Optimization in Compression Moulding for Flax Reinforced Biocomposites’,
Procedia Chemistry, vol. 19, pp. 433-440.
32. Mei-po Ho, Hao Wang, Joong-Hee Lee, Chun-kit Ho, Kin-tak Lau, Jinsong Leng & David Hui
2012, ‘Critical factors on manufacturing processes of natural fiber composites’, Composites:
Part B, vol. 43, pp. 3549-3562.
33. Naresh Kr Sharma & Kumar, V 2012, ‘Studies on properties of banana fiber reinforced green
composite’, Journal of Reinforced Plastics and Composites, vol. 32, no. 8, pp. 525-532.
34. Nazrul Islam Md, Rudi Dungani, Abdul Khalil HPS, Siti Alwan M, Wan Nadirah, WO &
Mohammad Fizree, H 2013, ‘Natural weathering studies of oil palm trunk lumber (OPTL)
green polymer composites enhanced with oil palm shell (OPS) nanoparticles’, Springer Plus
2: 592, pp. 1-12.
35. Nirmal, U, Hashim, J & Lau, STW 2011, ‘Testing methods in tribology of polymeric
composites’, International Journal of Mechanical and Materials Engineering, vol. 6, no. 3, pp.
367-373.

NatioPro
onal Seminar oceedings: 35on ‘Trends an
5th IEI Nationand Developme
.
l Convention oents in Automo
of Mechanicaotive Industry
l Engineers any’ during Septe
nd ember 4 ‐ 5, 2019.
26
36. Nithyakalyani, P, Dhandapani, N & Megalingam Murugan, A 2016, ‘Experimental
Investigation of Propertiesand Sound Absorption Test on Reinforced Composite Material of
Raw Palmyra Fiber’, International Journal of Mechanical Engineering and Information
Technology, vol. 4, issue 6, pp. 1664-1670.
37. Omar Faruk, Andrzej K. Bledzki, Hans-Peter Fink & Mohini Sain 2014, ‘Progress Report on
Natural Fiber Reinforced Composites’ Macromolecular Materials and Engineering, vol. 299,
pp. 9-26.
38. Pickering, KL, Aruan Efendy, MG & Le, TM 2016, ‘A review of recent developments in
natural fibre composites and their mechanical performance’, Composites: Part A, vol. 83, pp.
98-112.
39. Prakash, S & Christu Paul, R 2016, ‘Experimental investigation of natural fiber Reinforced
polymer composite’, International Journal of Advanced Engineering Technology, vol. 7, issue
2, pp. 937-941.
40. Prasanna, SM, Vitala, HR, Madhusudhan, T & Raju, BR 2016, ‘Evaluation of mechanical and
tribological Characterization of glass-basalt hybrid composites’, International Journal of
Engineering Research and Advanced Technology, vol. 02, issue 01, pp. 27-34.
41. Prasannasrinivas, R & Chandramohan, D 2012, ‘Analysis of Natural Fiber Reinforced
Composite Material for the Helmet Outershell - A Review’, International Journal of Current
Research, vol. 4, issue 03, pp. 137-141.
42. Punyapriya Mishra & Acharya, SK 2010, ‘Anisotropy abrasive wear behavior of bagasse fiber
reinforced polymer composite’, International Journal of Engineering, Science and Technology,
vol. 2, no. 11, pp. 104-112.
43. Rajkumar Govindaraju, Srinivasan Jagannathan, Mohanbharathi Chinnasamy &
Kandhavadivu, P 2014, ‘Optimization of Process Parameters for Fabrication of Wool Fiber-
Reinforced Polypropylene Composites with Respect to Mechanical Properties’, Journal of
Engineered Fibers and Fabrics, vol. 9, issue 3, pp. 126-133.
44. Raju, GU, Kumarappa, S & Gaitonde, VN 2015, ‘Study on Effect of Process Parameters on
Tensile Properties of Groundnut Shell-Vinyl Ester Composites: Analysis Using Design of
Experiments’, International Journal of Materials Science and Engineering, vol. 3, no. 3, pp.
193-207.
45. Ramakrishna Malkapuram, Vivek Kumar & Yuvraj Singh Negi 2009, ‘Recent development in
natural fiber reinforced polypropylene composites’, Journal of Reinforced Plastics and
Composites, vol. 28, pp. 1169-1189.
46. Rudi Dungani, Myrtha Karina, Subyakto A Sulaeman, Dede Hermawan & Hadiyane, 1A
2016, ‘Agricultural Waste Fibers Towards Sustainability and Advanced Utilization: A
Review’, Asian Journal of Plant Sciences, vol. 15, no. 1-2, pp. 42-55.

NatioPro
onal Seminar oceedings: 35on ‘Trends an
5th IEI Nationand Developme
.
l Convention oents in Automo
of Mechanicaotive Industry
l Engineers any’ during Septe
nd ember 4 ‐ 5, 2019.
27
47. Shadrach Jeya Sekaran. A, Palanikumnar K, and Pitchanti K, Evaluation on mechanical
properties of woven aloevera and sisal fibre hybrid reinforced epoxy composites, Bull. Mater.
Sci., 38(5), 2015: 1183–1193.
48. Shadrach Jeya Sekaran. A, Palanikumnar K, and Pitchanti K, Investigation on mechanical
properties of woven alovera/sisal/kenaf fibres and their hybrid composites, Bull. Mater. Sci.,
40(1), 2017: 117-128.
49. Sahari, J & Sapuan, SM 2011, ‘Natural Fiber Reinforced Bio degradable Polymer
Composites’, Reviews on Advanced Materials Science, vol. 30, pp. 166-174.
50. Sandeep kumar, Amit joshi & Brijesh Gangil 2013, ‘Physio-Mechanical and tribological
properties glass fiber based epoxy hybrid natural composite’, Proceedings of International
Conference on Emerging Trends in Engineering and Technology, ISBN: 978-1-63439-120-7,
pp. 378-383.
51. Sandhyarani Biswas & Prity Aniva Xess 2012, ‘Erosion wear behaviour of bamboo/glass fiber
reinforced epoxy based hybrid composites’, International Journal of Mechanical and
Industrial Engineering, vol. 1, no. 4, pp. 79-83.
52. Sanja, MR, Arpitha, GR, Laxmana Naik, L, Gopalakrishna, K & Yogesha, B 2016,
‘Applications of Natural Fibers and Its Composites: An Overview’, Natural Resources,
Scientific Research Publishing, vol. 7, pp. 108-1.
53. Satnam Singh, Pardeep Kumar & Jain, SK 2013, ‘An experimental and numerical
investigation of mechanical properties of glass fiber reinforced epoxy composites’, Adv. Mat.
Lett., vol. 4, no. 7, pp. 567-572.
54. Semenov, VI, Shuster, LSH, Chertovskikh, CV, Jeng, Huang & Dao Hwang 2007, ‘Tribology
of composite materials on the basis of magnesium alloy with powder filler of SiC’, Tribology
in industry, vol. 29, no. 1&2, pp. 37-40.
55. Shehu, U, Audu, HI, Nwamara, MA, Ade-Ajayi, AF, Shittu, UM & Isa, MT 2014, ‘Natural
Fibre As Reinforcement For Polymers: A Review’, South pacific Journal of Technology and
Science, vol. 2, no. 1, pp. 238-253.
56. Singha, AS & Vijay Kumar Thakur 2008, ‘Mechanical properties of natural fiber reinforced
polymer composites’, Bulletin of Materials Science, vol. 31, no. 5, pp. 791-799.
57. Somen Biswal & Alok Satapathy 2016, ‘Dry sliding wear behavior of epoxy composite
reinforced with short palmyra fibers’, IOP Conf. Series: Materials Science and Engineering,
vol. 115, 012028 doi:10.1088/1757-899X/115/1/012028, pp. 1-7.
58. Srinivas Nunna, Ravi Chandra, P, Sharad Shrivastava & Jalan, AK 2012, ‘A review on
mechanical behavior of natural fiber based hybrid composites’, Journal of Reinforced Plastics
and Composites, vol. 31, no. 11, pp. 759-769.

NatioPro
onal Seminar oceedings: 35on ‘Trends an
5th IEI Nationand Developme
.
l Convention oents in Automo
of Mechanicaotive Industry
l Engineers any’ during Septe
nd ember 4 ‐ 5, 2019.
28
59. Srinivasan, K 2009 ‘Composite Materials Production, Properties, Testing And Applications’,
Narosa, New Delhi.
60. Sudhakar Majhi, Samantarai, SP & Acharya, SK 2012, ‘Tribological behavior of modified rice
husk filled epoxy composite’, International Journal of Scientific & Engineering Research, vol.
3, no. 6, pp. 1-5. ISSN 2229-5518.
61. Sue Elliott-Sink, “Special Report: Cars Made of Plants” (12 April 2005),
ww.edmunds.com/advice/fueleconomy/articles/105341/article.html (downloaded 28 August
2006).
62. Supreeth, S, Vinod, B & Sudev, LJ 2014, ‘Influence of fiber length on the tribological
behaviour of short palf reinforced bisphenol- A composite’, International Journal of
Engineering Research and General Science, vol. 2, no. 4, pp. 825-830.
63. Udaya Kiran, C, Ramachandra Reddy, G, Dabade, BM & Rajesham, S 2007, ‘Tensile
properties of sun hemp, banana and sisal fiber reinforced polyester composites’, Journal of
Reinforced Plastics and Composites, vol. 26, no. 10, pp. 1043-1050.
64. Venkatachalam, N, Navaneethakrishnan, P, Rajsekar, R & Shankar, S 2016, ‘Effect of
Pretreatment Methods on Properties of Natural Fiber Composites: A Review’, Polymers &
Polymer Composites, vol. 24, no. 7, pp. 555-566.
65. Venkateshwaran, N & Elayaperumal, A 2010, ‘Banana fiber reinforced polymer composites -
A review’, Journal of Reinforced Plastics and Composites, vol. 29, no. 15, pp. 2387-2396.
66. Zhang, XR et al. 2007, ‘Flexural strength and tribological properties of rare earth treated
short carbon fiber/polyimide composites’, Express Polymer Letters, vol. 1, no. 10, pp. 667-672.

NatioPro
onal Seminar oceedings: 35on ‘Trends an
5th IEI Nationand Developme
.
l Convention oents in Automo
of Mechanicaotive Industry
l Engineers any’ during Septe
nd ember 4 ‐ 5, 2019.
37
Investigative Study of Variation of Static Stability Factor of Small Passenger Cars
Avik Chakraborty, Abhinav Atul, Koustav Basu and Aniket Maiti
Department of Mechanical Engineering, Techno International New Town,
Block ‐ DG 1/1, Action Area 1,New Town, Rajarhat, Kolkata – 700156
Corresponding author’s email: [email protected]
Abstract:
Indian auto industries is booming day by day. India has overtaken Germany to become the fourth
largest automobile market in the world. In current Indian scenario the top selling segment of
vehicles is small passenger cars specifically light motor vehicles (engine capacity of 1000cc or less).
Indian consumers are mainly concerned with budget friendly and fuel efficient cars only. While
considering safety of a vehicle the static stability factor of the vehicle is one of the most vital
factors. So the purpose of this report is to track the static stability factor of various vehicles and to
determine how prone they are to rollover. If the consumer use this information to purchase vehicles
with higher rollover reliability ratings, then manufacturers would presumably produce vehicles to
meet that public demand. So in this report 5cars under 1000cc engine capacity and ex-showroom
price of up to 5lacs have been selected. And their static stability factor at various conditions have
been derived. In this report a comparison of the static stability factors of different cars have been
graphically depicted.
Keywords: Centre of gravity; track width; static stability factor; vehicle rollover.
Introduction
The Indian automotive safety standards have been criticized as being insufficient and
ineffective. India has the world's fourth-largest car market, but is still the only country
among the global top ten car markets without a testing program that measures the
safety of vehicles.
India has seen more road deaths per year than any other nation since 2006, costing lives
at the rate of 230,000 annually. The number of deaths due to road accidents in India is
around three to four times that of European countries like France, Germany and Spain.
Rollover crashes kill more than 10,000 occupants of passenger vehicles each year. It has
been defined that ‘rollover’ as a 1/4 axial rotation, or equivalently at the point where the
mass center reaches its highest position above the ground. The analysis shows that the
SSF is a prominent term in the governing equations of motion.

NatioPro
onal Seminar oceedings: 35on ‘Trends an
5th IEI Nationand Developme
.
l Convention oents in Automo
of Mechanicaotive Industry
l Engineers any’ during Septe
nd ember 4 ‐ 5, 2019.
38
One of the primary means of assessing rollover risk is the static stability factor (SSF), a
measurement of a vehicle’s resistance to rollover. The higher the SSF, the lower the
rollover risk. The SSF of a vehicle is an at-rest calculation of its rollover resistance,
based on its most important geometric properties. Basically, SSF is a measure of how
top-heavy a vehicle is.
For this project it has been decided to evaluate the location of centre of gravity and its
relation with roll over propensity of a vehicle considering its track width so 5 different
vehicles have been selected that are most commonly used by middle class population of
the country. All the 5 different vehicles have ex-showroom price of less than 5 lacs. The
data related to the vehicles physical structure have been acquired from credible online
sources. Most of the data were collected by conducting physical measurement on real
models of the car. For this measurement process measuring tape and steel rule were
used. Most of the data related to track width and wheel base were acquired by
conducting such physical measurements. After collecting all the data, we have put them
in an organized manner by using MS excel.
After that the location of Centre of gravityof all the cars were calculated by using tilting
method (explained in further report). The changes in Location of Centre of gravity at
different conditions were also calculated. Stating ‘different conditions’ means changing
the number of passengers and changing the location inside the vehicles.
After all the locations of the Centre of gravity have been calculated. Their respective
static stability factor related to location of Centre of gravity and the track width were
calculated.
After all this data were calculated, collected and organized in a proper way then all the
data were graphically represented for understanding the variation of static stability
factor of a car in different situations.
Static Measure of Roll Over Propensity
Vehicle roll over is a complex event that has been a subject of investigation since 1950s.
The term “roll over” is described to condition of at least 90 degree rotation of the vehicle
about its longitudinal axis. When lateral forces create a large enough moment about the
vehicles Centre of gravity for a sufficient amount of time the vehicle will roll over. A
wide variety of testing has been performed to understand the event of roll over properly.
The testing generally falls into one of the two major categories:

NatioPro
onal Seminar oceedings: 35on ‘Trends an
5th IEI Nationand Developme
.
l Convention oents in Automo
of Mechanicaotive Industry
l Engineers any’ during Septe
nd ember 4 ‐ 5, 2019.
Static
centre
yield st
Alterna
may be
Dynam
Althoug
are exp
Furthe
Static
When a
it is ali
model,
straigh
enough
To cond
Taking
F*h> W
{Where
gravity
We kno
F=M*a
{Where
And,
testing: it
of gravity
tatic metric
atively stat
e performed
mic testing:
gh dynami
pensive and
rmore repe
Stability
a vehicle h
igned the t
that is a
ht forward p
h for a suffi
dition of top
g the mome
W * t / 2
e F is later
y of the car
ow that,
a
e M is the m
involves t
from the g
cs related t
tic tests of
d to obtain
: it is perf
ic tests are
d required s
eatability is
Factor:
as a large
tires interf
model tha
physics yie
ciently sus
ppling of th
nt around p
ral force. W
from the gr
mass of the
the measur
ground and
o vehicles r
entire vehi
data relate
formed on
e very help
safety prec
s very diffic
velocity ve
face can ge
at does no
elds the ins
tained peri
he car is po
point A:
W is the we
round. T is
car and a i
39
rement of
d track wid
roll over pr
icles such a
ed with the
n a test tr
pful in und
autions for
cult to achi
ectors at a l
nerate larg
ot deflect u
sight that i
iod of time
ossible if:
eight of th
s the track w
is lateral a
vehicles p
dth. These
ropensity (f
as tilt table
vehicles ro
rack and i
derstanding
r the test dr
ieve in such
large angle
ge lateral f
under the
if the sum
the vehicle
he car. h is
width}
cceleration
parameter
parameter
for ex: stati
e ratio test
oll over pro
nvolves dr
g the event
rivers.
h testing sit
e from the
forces assu
influence
of the late
e will roll ov
(1)
the heigh
n.}
such as he
rs are comb
ic stability
t and side p
opensity.
riving man
t of roll ove
tuation.
direction in
uming a rig
of applied
eral forces
ver.
ht of the Ce
eight of
bined to
factor).
pull test
neuvers.
er, they
n which
gid body
d forces,
is large
entre of

NatioPro
onal Seminar oceedings: 35on ‘Trends an
5th IEI Nationand Developme
.
l Convention oents in Automo
of Mechanicaotive Industry
l Engineers any’ during Septe
nd ember 4 ‐ 5, 2019.
40
W= M*g
{Where g is acceleration due to gravity}
So, equation (1) becomes,
M*a*h > M*g*t/2
a*h > g*t/2
a/g> t/2h (2)
This relationship is a scientifically valid statement of the physics of the motion of this
vehicle model and cornerstone of the utility of the static stability factor.
In some real life scenario (not involving a smooth road surface) the large lateral force
resulting in rollover can be generated by interactions between the tires and a curb, a
pothole, a roadside slope, a furrow ploughed during an off road manoeuvre, or some
other tripping mechanisms.
Table I
CAR Alto 800 ALTO K10 WAGON R KWID
800CC
KWID
999CC
Height 1475 1475 1700 1513 1513
Wheel Base 2360 2360 2400 2422 2422
Length 3430 3545 3599 3697 3697
Track Front 1295 1295 1295 1420 1420
Track Rear 1290 1290 1290 1400 1400
Kerb Weight 695 740 870 669 699
Type of Drive front front front front front
Kerb Weight in Newton 6817.95 7259.4 8534.7 6562.89 6857.19
Weight With Driver 7455.6 7897.05 9172.35 7200.54 7494.84
Tyre Size 145/80R12 155/65R13 145/80R13 155/80R13 155/80R13
Distribution of mass or weight in front side &
rear side
65-35 65-35 65-35 65-35 65-35
SSF of vehicle without passenger 1.3741 1.4157 1.4321 1.4711 1.4836
SSF of vehicle with driver 1.3352 1.3798 1.4052 1.4357 1.4496
SSF of vehicle with driver + 1 passenger 1.3045 1.3451 1.3648 1.3963 1.4056
SSF of vehicle with driver + 2 passengers 1.3169 1.3628 1.3957 1.4212 1.4243
SSF of vehicle with driver + 3 passengers 1.3369 1.3788 1.4011 1.4294 1.4387
SSF of vehicle with driver + 4 passengers 1.3657 1.4015 1.4147 1.4421 1.4577

NatioPro
onal Seminar oceedings: 35on ‘Trends an
5th IEI Nationand Developme
.
l Convention oents in Automo
of Mechanicaotive Industry
l Engineers any’ during Septe
nd ember 4 ‐ 5, 2019.
41
Fig. 1 Variation of SSF of Alto K10 Fig. 2 Variation of SSF of Alto 800
Fig. 3 Variation of SSF of WagonR Fig. 4 Variation of SSF of Kwid 800
1.3741
1.3352
1.3045
1.3169
1.3369
1.3657
1.26
1.28
1.3
1.32
1.34
1.36
1.38SSF of vehichle
without passenger
SSF of vehichle with
driver
SSF of vehichle with
driver +1
passenger
SSF of vehichle with
driver +2
passenger
SSF of vehichle with
driver +3
passenger
SSF of vehichle with
driver +4
passenger
SSF
Alto 800
1.4157
1.3798
1.3451
1.3628
1.3788
1.4015
1.3
1.32
1.34
1.36
1.38
1.4
1.42
1.44
SSF of vehichle
without …
SSF of vehichle
with driver
SSF of vehichle
with driver +1
…
SSF of vehichle
with driver +2
…
SSF of vehichle
with driver +3
…
SSF of vehichle
with driver +4
…
SSF
ALTO k10
1.4321
1.4052
1.3648
1.39571.4011
1.4147
1.32
1.34
1.36
1.38
1.4
1.42
1.44
SSF of vehichle
without passenger
SSF of vehichle with
driver
SSF of vehichle with
driver +1
passenger
SSF of vehichle with
driver +2
passenger
SSF of vehichle with
driver +3
passenger
SSF of vehichle with
driver +4
passenger
SSF
WAGON R
1.4711
1.4357
1.3963
1.4212
1.42941.4421
1.34
1.36
1.38
1.4
1.42
1.44
1.46
1.48
SSF of vehichle
without …
SSF of vehichle
with driver
SSF of vehichle
with driver +1
…
SSF of vehichle
with driver +2
…
SSF of vehichle
with driver +3
…
SSF of vehichle
with driver +4
…
SSF
KWID 800

NatioPro
onal Seminar oceedings: 35on ‘Trends an
5th IEI Nationand Developme
.
l Convention oents in Automo
of Mechanicaotive Industry
l Engineers any’ during Septe
nd ember 4 ‐ 5, 2019.
42
Fig. 5 Variation of SSF of Kwid 999 Fig. 6 SSF of various cars in their kerb weight condition.
The following graphs(Figure1 to Figure5) shows the relationship of static stability
factor of various cars in accordance with the number passenger in vehicle such as, in
curb weight of car, with driver, with driver and one passenger, with driver and two
passenger, with driver and three passenger, with driver and four passenger.
The graphs show that SSF of vehicle is maximum in case of curb weight and it
decreases with number of passenger in front seats. That is as the reaction force on the
front wheel increases the car becomes statically more unstable. Again it starts
increasing with the number of passenger in rear seats. . That is the reaction force on the
rear wheel increases the difference between the reaction force on front wheel and the
rear wheel decreases and the static stability factor increases.
The following graph( Figure6: SSF of various cars in their kerb weight condition)gives a
comparative analysis of static stability factor of various cars. We can see that SSF is
lower in case of Alto 800. For Alto K10 and WAGON R the value of SSF are nearly same.
1.4836
1.4496
1.4056
1.4243
1.4387
1.4577
1.36
1.38
1.4
1.42
1.44
1.46
1.48
1.5
SSF of vehichle
without …
SSF of vehichle
with driver
SSF of vehichle
with driver +1
…
SSF of vehichle
with driver +2
…
SSF of vehichle
with driver +3
…
SSF of vehichle
with driver +4
…
SSF
KWID 999
1.3741
1.4157
1.4321
1.47111.4836
1.3
1.32
1.34
1.36
1.38
1.4
1.42
1.44
1.46
1.48
1.5
Alto
800
ALTO
K10
WAGO
N R
KWID
800CC
KWID
999CC
SSF

NatioPro
onal Seminar oceedings: 35on ‘Trends an
5th IEI Nationand Developme
.
l Convention oents in Automo
of Mechanicaotive Industry
l Engineers any’ during Septe
nd ember 4 ‐ 5, 2019.
43
Again for KWID 800 and KWID 999 the value of SSF are highest and nearly same. The
SSF of any vehicle under 1000cc should be ranging between 1.3 to 1.5.
Through a rigid-body model, SSF relates a vehicle’s track width, T, and center of gravity
height, H, to a clearly defined level of the sustained lateral acceleration that will result
in the vehicle’s rolling over. The rigid-body model is based on the laws of physics and
captures important vehicle characteristics related to rollover.
Conclusion:
The experimental study of the Static Stability Factor is an excellent concept. This
concept is easy to understand and it produces data which permits a straight forward
analysis of the data. In addition, a simple analysis can be performed to define the
mean and standard deviation about a point and provide an understanding of the
nature of the trend (when done on a large sample set).
The SSF of a vehicle is maximum in case of kerb weight and it decreases with
number of passenger in front seats. That is as the reaction force on the front wheel
increases the car becomes statically more unstable.
Again it starts to increase as the number of passenger in rear seats increases. That
is the reaction force on the rear wheel increases the difference between the reaction
force on front wheel and the rear wheel decreases and the static stability factor
increases.
By comparatively analyzing the results of the experiment conducted on this very
small sample set of vehicles it can be stated that Renault Kwid 1000 has the
highest value of Static Stability Factor under kerb weight. So it is very clear that it
is the most stable car among the sample set of five shortlisted vehicles.
In this report the variation of static stability factor in different conditions have been
evaluated on a small sample set of just five small passenger vehicles.
This project model can be applied to a larger sample set that is each and every vehicle
present in the market. By doing so the variation in the value of the static stability factor
of each and every vehicle in different conditions can be compared.
And by considering proper standardization, a star rating can be assigned to each car
based on its propensity to rollover. Which in due course will help the customers to
choose the best (safest) option available.

NatioPro
onal Seminar oceedings: 35on ‘Trends an
5th IEI Nationand Developme
.
l Convention oents in Automo
of Mechanicaotive Industry
l Engineers any’ during Septe
nd ember 4 ‐ 5, 2019.
44
References
1. Fundamentals of vehicle dynamics by Thomas D. Gillespie.
2. Automobile Engineering by Er. A.K. Babu and Er. Ajit Pal Singh.
3. International Research Journal of Engineering and Technology (IRJET). [ www.irjet.net]
4. Wong, J. (1978)." Theory of ground vehicles. 1st Ed. New York: Wiley.
5. Automobile Mechanics by N.K. Giri.
6. Trends in the Static Stability Factor of Passenger Cars, Light Trucks, and Vans (DOT HS
809 868 NHTSA Technical Report).
7. Physics of Automobile Rollovers by L. David Roper (http://arts.bev.net/roperldavid),

NatioPro
onal Seminar oceedings: 35on ‘Trends an
5th IEI Nationand Developme
.
l Convention oents in Automo
of Mechanicaotive Industry
l Engineers any’ during Septe
nd ember 4 ‐ 5, 2019.
45
Formulation of Lithium Based Bio‐Grease from Coconut Oil Added With Cerium Oxide and Molybdenum Disulphide Nanoparticles
for Automotive Applications
Chacko Preno Koshy1, Ajumal Shamsudeen1, Abhiram Anil Kumar1, Harikrishnan Bhageeradhan1,
Aslam Shadh1, Reuben Thomas1 and M D Mathew1 1Advanced Measurement Laboratory, Department of Mechanical Engineering,
Saintgits College of Engineering, Pathamuttom P.O., Kottayam ‐ 686532, Kerala, India
E‐Mail: [email protected], [email protected]
Abstract
This paper presents the preparation of nano-grease with the combination of ceria (CeO2) and
molybdenum disulphide (MoS2) nanoparticles. The ceria nanoparticles are found to be a potential
semi-lubricant additive due to its higher oxygen storage capacity (OSC). The molybdenum
nanoparticles are quite flexible. It has low shear strength and layered structure. CeO2
nanoparticles are synthesized by chemical precipitation and MoS2 nanoparticles are synthesised
using solvo-thermal process. The characterization techniques, namely, Scanning Electron
Microscopy (SEM) and Energy Dispersive Spectroscopy (EDS) are carried out. Coconut oil is used
as the base-stock and lithium hydroxide (LiOH) is used as the thickener. A uniform colloidal
dispersion of coconut oil added with optimized concentration of CeO2 and MoS2 nanoparticles is
prepared using an ultra-sonicator. Further, the fatty acids in coconut oil are treated with LiOH
salt in definite proportion resulted in formation of the desired Nano-Lithium Grease (NLG).
Tribological properties such as coefficient of friction (COF) and wear scar diameter (WSD) of the
formulated nano-greases are evaluated using a four-ball tester in accordance with ASTM
standards. Moreover, the cone penetration test and the rheological properties are also estimated.
The results from the current experimental study envisaged the credibility of bio-based nano-
greases for future prospect
Keywords: Chemical precipitation; Solvothermal process; cone penetration test.
Introduction
Friction is inevitable in every mechanical system. It cannot be eliminated, but can only
be reduced. The effective method to reduce friction is lubrication. Lubrication can be
effectively done by using lubricating oil or greases. There are mainly three components
present in a grease system; base oil, thickener and additives. Here we selected base oil
as coconut oil and thickener as lithium hydroxide and additive as cerium oxide
nanoparticle [1-2]. To create a sustainable and eco-friendly environment, bio-greases can
meet the challenges with suitable modifications. The recent research around the globe

NatioPro
onal Seminar oceedings: 35on ‘Trends an
5th IEI Nationand Developme
.
l Convention oents in Automo
of Mechanicaotive Industry
l Engineers any’ during Septe
nd ember 4 ‐ 5, 2019.
46
concentrates on nanoparticles and their applications to many areas including
lubrication. Studied about tribofilms formed from nanoparticles in the nano-lubricant
under boundary/thin film lubrication conditions were done [3-4]. The tribological
performance is linked to the tribofilms properties and consequently to the lubricating
conditions. The addition of nanoparticles into the greases is found to significantly reduce
the friction coefficient and increase the load-bearing capacity of the sliding parts in
mechanical systems [5-7]
A. Experimental methodology
1) Synthesis of CeO2 nanoparticles: CeO2 nanoparticles can be synthesized from
homogeneous precipitation of alcohol/water mixed solvents. It is found that the CeO2
nanoparticles obtained from alcohol/water mixed solvent were primary particles
confirmed by quite good consistency in the particle sizes [8]. The various precursors used
in the synthesis of CeO2 nanoparticle are, Cerium nitrate hexahydrate, Iso propanol and
Distilled water. The reagent used is ammonia solution. Firstly the precursors are mixed
in a definite ratio. Then the solution is mixed thoroughly using a magnetic stirrer at 60
°C which makes the solution transparent. Then aqueous ammonia solution (ammonium
hydroxide) is added to the solution in order to maintain the pH level above 10, so that
the solution will be always acidic. When the value of the pH don’t alters with time and
the colour of the solution changes i.e. the colour turns deep red and then to pale yellow
precipitate, then the solution completely turns basic. After a certain period of time the
precipitate formed is taken out and filtered using filter paper. The slurry of the
precipitate formed after filtering is collected in a crucible. Then it is subjected to
calcinations at 600 °C for 5 hours. Then particle thus formed is crushed in to fine
powders and again it is subjected to calcinations at 600 °C.
2) Synthesis of MoS2 nanoparticles: 1.6 g of AHM tetra hydrate and 0.92 g of citric acid
were dissolved in distilled water under magnetic stirring and kept at 120° C on a hot
plate for 30 min. The white suspension was continuously stirred with a final pH of 4.
Then, 3.34 mL of Ammonium polysulfide in water was added drop-wise to the solution.
Finally, the solution was transferred to a Teflon-lined stainless-steel autoclave. The
autoclave was maintained at 180 °C for 12 h, and left to cool down to 25 °C. Finally, the
black precipitates were collected through centrifugation. Then filtered and washed four
times with distilled water and acetone. The final precipitates were dried under vacuum
at 120 0C for 6 h.

NatioPro
onal Seminar oceedings: 35on ‘Trends an
5th IEI Nationand Developme
.
l Convention oents in Automo
of Mechanicaotive Industry
l Engineers any’ during Septe
nd ember 4 ‐ 5, 2019.
47
3) Formulation of nano-grease: The basic component of any lubricant is base oil. The
base oil used is coconut oil and the additive used is cerium oxide nanoparticle and
molybdenum disulphide nanoparticles. The required amount of base-oil (500mL) is
mixed with the nanoparticle additives in proper proportion and mixed thoroughly using
a magnetic stirrer/ ultra-sonicator for a period of 1hr to get the required nano-lubricant.
Then the required amount of LiOH is added to the nanolubricant. After stirring it for a
while the solution gets hard to obtain the required grease. The formulated nano-grease
is then stored in air tight glass containers.
B. Results and Discussions
In this work, the various types of advanced laboratory devices including SEM, EDS and
DLS analysis techniques are used to characterize the nanoparticles.
1.Scanning Electron Microscopy (SEM)
In SEM a monochromatic electron beam is passed over the surface of the specimen
which creates different changes in the sample. The final particles from the sample are
used to create an image of the specimen. The information is derived from the surface of
the sample can be recorded. The novel feature of SEM is its large depth of field. Typical
SEM (Hitachi, JAPAN, SU6600) is used to analyze the topography and morphology of
the specimen 2D images are available.The SEM image of the CeO2 and MoS2
nanoparticles produced by the solvothermal method is shown in Figure 1
Fig. 1 SEM images of synthesized (a) CeO2& (b) MoS2 nanoparticles
(a)
(b)

NatioPro
onal Seminar oceedings: 35on ‘Trends an
5th IEI Nationand Developme
.
l Convention oents in Automo
of Mechanicaotive Industry
l Engineers any’ during Septe
nd ember 4 ‐ 5, 2019.
48
From the SEM analysis we inferred that the produced cerium oxide particle size are in
the nanometer scale. And most of the CeO2 and MoS2 nanoparticles size lies between 20-
30 nm and30-40 nm range. From the SEM analysis we concluded that the produced
CeO2 and MoS2 nanoparticles are suitable for further experimental procedures.
2. Energy dispersive spectrum
EDS analysis was done on the synthesized cerium oxide and molybdenum disulphide
nanoparticle. The EDS spectrum of the synthesized cerium oxide and molybdenum
disulphide nanoparticle is shown in Fig. 2. The formation of CeO2 and MoS2 confirmed
from the spectra which shows the peaks for cerium and oxygen atoms.
Fig.2 EDS spectrum obtained from synthesized (a) CeO2& (b) MoS2 nanoparticles
3.Analysis of Coefficient of frictionon nano-grease
The tribological studies to determine the frictional and wear properties of the prepared
nano-greases were performed using a four ball tester. The test method is used to
determine the relative wear preventive properties and load bearing capacity of grease in
sliding contact under the prescribed test conditions. Coefficient of friction and wear scar
diameter is determined by this method. Eight different sample of grease are selected for
tests, Grease without and with nanoparticles. Also there is a composition variation in
the selected grease. Fig. 3 shows the difference in the coefficient of friction obtained by
using different sample.
Fig.3 Coefficient of friction
(a) (b)

NatioPro
onal Seminar oceedings: 35on ‘Trends an
5th IEI Nationand Developme
.
l Convention oents in Automo
of Mechanicaotive Industry
l Engineers any’ during Septe
nd ember 4 ‐ 5, 2019.
49
Initially coconut oil with 7.5% lithium hydroxide is selected as the sample. Additive is
not added in this sample. From the result shows that, coefficient of friction is high
nearly up to 0.95%. This is because when additive is not added anti wear property of the
grease is not increased. Grease is act only as semi-solid substances between the meshing
components. Second sample consist of coconut oil and 10% lithium hydroxide. In this
sample also additive is not added. But weight percentage of lithium hydroxide is varied.
Amount of LiOH is increased by 2.5%. From the plot it is clear that coefficient of friction
is decreased by more than 10%. This due to that when more amount of thickener is
added film formation around the meshing surface is stable for more time. But when
amount of thickener is less then semi solid grease at initial stage is rapidly converted
into liquid phase this will increase the friction and the use of grease is ineffective. Third
sample consist of coconut oil and 15% of thickener. From the plot it shows that the
coefficient of friction of this sample is greater than that of second one. This is because of
that when the amount of thickener is increased then it is difficult to convert the
thickener in solid phase into a film formation around the meshing surface. Grease does
not reach the entire surface when the amount of thickener is increased. And also high
temperature is required to convert the solid phase grease into film formation of grease
around the meshing surface. In fourth sample, 0.5% cerium oxide were added along with
coconut oil and lithium hydroxide. So the new grease possesses additional properties
because of the presence of nanoparticle. When nanoparticle is added anti wear and
thermal properties of grease will increase. Part of the grease flows next to the running
tracks, where it will stay due to its consistency and part of the grease finds it way inside
the bearing, such as under the cage bars or in the cage pocket. It is clear that, while
adding 0.5% CeO2 nanoparticles the coefficient of friction was 0.63.In fifth sample we
added cerium oxide along with coconut oil and lithium hydroxide. Here 1% of cerium
oxide was added. When adding 1% CeO2 nanoparticles the coefficient of friction is 0.67.
In sixth sample, molybdenum disulphide is added along with coconut oil and lithium
hydroxide. Here also the grease possesses additional properties because of the presence
of nanoparticles. It is clear that while adding 0.5% MoS2 nanoparticles the coefficient of
friction was reduced 0.58. In seventh sample is added with 1% molybdenum disulphide
along with coconut oil and lithium hydroxide. While adding 1% MoS2 nanoparticles the

NatioPro
onal Seminar oceedings: 35on ‘Trends an
5th IEI Nationand Developme
.
l Convention oents in Automo
of Mechanicaotive Industry
l Engineers any’ during Septe
nd ember 4 ‐ 5, 2019.
50
coefficient of friction was reduced 0.42. In eighth sample molybdenum disulphide and
cerium oxide were added along with coconut oil and lithium hydroxide. Here also the
grease possess additional properties because of the presence of nanoparticles. It is
clearly is visible that while adding 1% MoS2 and 0.5% CeO2 nanoparticles, the coefficient
of friction was reduced 0.38.
4. Analysis of Wear scar diameteron nano-grease
Table 1 shows the value of wear scar diameter obtained while using different
composition of grease. From the obtained wear scar images and the wear scar diameter
values it can be observed that the nano-greases possess a greater lead over the greases
without nanoparticles. The friction and wear properties were found to be better due to
the presence of CeO2 nanoparticles. Wear scar diameter were found to be better for
nano-grease with 0.5% CeO2 and 1% MoS2 particles. When the amount of nanoparticles
increases the wear scar diameter also varies which implies that the percentage of
nanoparticles is also an important factor. As the amount of particles increases
agglomeration of particles occurs and particles are no longer in nano scale and it does
not shows the properties of nanoparticles.
TABLE 1 Wear scar diameters of nano-grease
Grease Composition (%) Wear scar diameter (mm)
Coconut oil + 7.5% LiOH (without nanoparticles) 0.82
Coconut oil + 10% LiOH (without nanoparticles) 0.71
Coconut oil + 15% LiOH (without nanoparticles) 0.85
Coconut oil + 10% LiOH + 0.5% CeO2 nanoparticles 0.63
Coconut oil + 10% LiOH + 1% CeO2 nanoparticles 0.67
Coconut oil + 10% LiOH + 0.5% MoS2 nanoparticles 0.58
Coconut oil + 10% LiOH + 1% MoS2 nanoparticles 0.42
Coconut oil + 10% LiOH + 0.5% CeO2 + 1% MoS2
nanoparticles
0.38

NatioPro
onal Seminar oceedings: 35on ‘Trends an
5th IEI Nationand Developme
.
l Convention oents in Automo
of Mechanicaotive Industry
l Engineers any’ during Septe
nd ember 4 ‐ 5, 2019.
51
Fig.4 SEM images of wear scar diameter of nano grease (Coconut oil + 10% LiOH + 0.5% CeO2 + 1% MoS2 nanoparticles)
Wear scar diameter were found to be better for nano-grease with 0.5% CeO2 and 1%
MoS2 particles. When the amount of nanoparticles increases the wear scar diameter also
increases as shown in Fig. 4 which implies that the percentage of nanoparticles is also
an important factor. As the amount of particles increases agglomeration of particles
occurs and particles are no longer in nano scale and it does not shows the properties of
nanoparticles.
Conclusions
The following conclusions are derived from the experimental study.
Nanoparticles with uniform size distribution is prepared by the chemical process like precipitation method and solvo-thermal process
From characterization of nanoparticles using SEM and EDS the below detailed results are obtained:
(a) The sizes of nanoparticles are less than 100 nm.
(b) The particles possess spherical and sheet layered morphology.
(c) The presence of Cerium, Oxygen, Molybdenum and Sulphur in the composition is confirmed using EDS analysis.
The four ball tester results confirmed that efficiency of nanogrease is comparable with mineral oil based greases.
Coconut oil and lithium hydroxide with 0.5% CeO2 and 1% MoS2 nanoparticles give wear scar diameter value of 0.38 which is remarkable among all.
Coefficient of friction in case of nanogreases was also comparatively less.

NatioPro
onal Seminar oceedings: 35on ‘Trends an
5th IEI Nationand Developme
.
l Convention oents in Automo
of Mechanicaotive Industry
l Engineers any’ during Septe
nd ember 4 ‐ 5, 2019.
52
The reduction in wear and friction can be due to the application of both sliding and rolling motion by the presence of spherical ceria and layered molybdenum nanoparticles.
Acknowledgment
We would like to convey our heartfelt gratitude to Centre for Engineering Research and
Development (CERD), Trivandrum for providing the financial assistance for this
initiative.
References
1. Jayadas, N. H., & Nair, K. P. (2006). Coconut oil as base oil for industrial lubricants-
evaluation and modification of thermal, oxidative and low temperature properties. Tribology
international, 39(9), 873-878.
2. Jayadas, N. H., Nair, K. P., &Ajithkumar, G. (2007). Tribological evaluation of coconut oil as
an environment-friendly lubricant. Tribology International, 40(2), 350354.
3. Koshy, C. P., Rajendrakumar, P. K., &Thottackkad, M. V. (2014). Experimental Evaluation of
the Tribological Properties of CuONanoLubricants at Elevated Temperatures. In Proceedings
of International Conference on Advances in Tribology and Engineering Systems (pp. 391-402).
Springer India.
4. Koshy, C. P., Rajendrakumar, P. K., &Thottackkad, M. V. (2015). Analysis of Tribological and
Thermo-Physical Properties of SurfactantModified Vegetable Oil-Based CuO Nano-
Lubricants at Elevated Temperatures-An Experimental Study. Tribology Online, 10(5), 344-
353.
5. Koshy, C. P., Rajendrakumar, P. K., &Thottackkad, M. V. (2015). Evaluation of the
tribological and thermo-physical properties of coconut oil added with MoS2 nanoparticles at
elevated temperatures. Wear, 330, 288-308.
6. GuangpingZh, Jianlin S, Bing W, Yizhu W (2011) Study on tribological properties of the
rolling fluid containing nano-MoS2 for cold rolling of steel strip. China Petro Proc Petrochem
Technol 13(1):64–69
7. Prabhakar S V, Vattikuti, Chan Byon, Venkata Reddy, B. Venkatesh, Jaesool Shim -
Synthesis and structural characterization of MoS2 nanospheres and nanosheets using
solvothermal method J Mater Sci (2015) 50:5024–5038
8. Chen, H. I., & Chang, H. Y. (2004). Homogeneous precipitation of cerium dioxide
nanoparticles in alcohol/water mixed solvents. Colloids and Surfaces A: Physiochemical and
Engineering Aspects, 242(1),61-69.

NatioPro
onal Seminar oceedings: 35on ‘Trends an
5th IEI Nationand Developme
.
l Convention oents in Automo
of Mechanicaotive Industry
l Engineers any’ during Septe
nd ember 4 ‐ 5, 2019.
53
Experimental Evaluation of Thermo‐Physical and Tribological Properties of Coconut Oil Added with Tungsten Disulfide Nanoparticles
for Lubricant Applications
Chacko Preno Koshy1, Oswin Lazar1 and M D Mathew1 1Advanced Measurement Laboratory, Department of Mechanical Engineering, Saintgits College of Engineering
Kottukulam Hills, Pathamuttom P.O., Kottayam‐686532, Kerala.
[email protected],[email protected]
Abstract
The present work aims to synthesize and characterize tungsten disulfide (WS2) nanoparticles for
lubricant applications. WS2 nanoparticles are synthesized by reverse micelle technique. The
synthesized WS2 nanoparticles are characterized by Field Emission Scanning Electron Microscopy
(FESEM), Energy Dispersive Spectroscopy (EDS), Dynamic Light Scattering (DLS) technique and
X-ray Diffraction (XRD) analysis. Nanoparticles are added separately to coconut oil and
ultrasonic agitation is carried out to formulate the required nano-lubricant at different
concentrations of nanoparticles. The tribological properties, viz., coefficient of friction (COF) and
specific wear rate (SWR) of the formulated lubricants have been experimentally studied for a
temperature range of 30 - 120 °C, for various concentrations of nanoparticles. Based on the
experimental data from pin-on-disk tribometer, a Response Surface Model (RSM) is formulated
using Box Behnken Design (BBD). ANOVA and regression analyses are performed to check the
adequacy of the model and the simulation results are used to optimize the concentration of
nanoparticles for the best tribological properties. Enhancements of thermo-physical properties
such as kinematic viscosity, flash and fire-point of the base-oil and nano-lubricants at various
temperatures have been evaluated for different nanoparticle concentrations.
Keywords: Nanoparticles; Nano-lubricants; Micelle; Microscopy; Tribological
1. Introduction
Nanotechnology is thought to be the foremost revolutionary technology of the twenty-
first century. It will be employed in several fields and ushers material science into a
brand new era. There have been several investigations on the tribological properties of
the lubricants added with different nanoparticles [1-8]. A large variety of papers have
reported the addition of nanoparticles to lubricants is effective in reducing wear and
friction. Nanoparticles including WS2 and MoS2 used as additives in lubricating oils

NatioPro
onal Seminar oceedings: 35on ‘Trends an
5th IEI Nationand Developme
.
l Convention oents in Automo
of Mechanicaotive Industry
l Engineers any’ during Septe
nd ember 4 ‐ 5, 2019.
54
exhibits good friction reduction and anti-wear behaviour. The physical and chemical
properties of nanoparticles determine the behaviour of lubricants to a large extent [9-
11]. Particular attention has been given on metal dichalcogenides nanomaterials such as
MoS2 and WS2 due to their layered structure. This layered structure provides lamellar
lubrication between contacting surfaces resulting in reduction of friction and wear [12-
13].The literature has proved that the concentration of nanoparticle has a major role
when compared to other significant factors affecting lubrication by nano-lubricants
[14,15]. The efficiency of nanoparticles to be a potential candidate in the formulation of
nano-lubricants, from the literature were identified to be the following: (i) the small
particle size which helps them to stay dispersed in the base medium by brownian motion
and pass through the filters, (ii) less interaction with the other additives (iii) ability to
form films on different types of surfaces [16] (iv) the ability to adapt different
mechanisms of motion and activity to reduce wear and friction [17] (v) high thermal
stability [18,19].
There are many physical processes such as high energy ball milling [20], flame spray
pyrolysis [21], inert gas condensation [22] etc. and chemical processes namely
precipitation method [23,24], solvothermal synthesis [25], electrochemical synthesis [26]
etc. for the preparation of nanoparticles of which the latter holds preference for its
better control on the particle size and ease of procedure.. In this work, tungsten disulfide
nanoparticles are prepared by reverse micelle method [27]. The synthesized
nanoparticles are then subjected to various advanced characterization techniques to
determine its shape, size, and chemical composition.
A theoretical prediction based on experimental observations is the essence of useful
research. Proper use of statistical methods greatly improves the efficiency of the
experiments and helps to draw meaningful conclusions from the experimental data.
There are two basic aspects of concern in scientific experimentation: the design of
experiment and the statistical analysis of the data. The RSM technique finds application
in problems where the output is affected by a number of input variables. RSM can be
employed as two distinguished designs namely Central Composite Design (CCD) and
Box Behnken Design (BBD). The former is known for its complexity and adequacy while
the latter for its simplicity and ease of analysis [28-31].

NatioPro
onal Seminar oceedings: 35on ‘Trends an
5th IEI Nationand Developme
.
l Convention oents in Automo
of Mechanicaotive Industry
l Engineers any’ during Septe
nd ember 4 ‐ 5, 2019.
55
2. Experimental methodology
2.1 Synthesis of nanoparticles
Reverse micelle method is employed in the present work for the synthesis of WS2
nanoparticles. In this method, anionic surfactant AOT (bis (2-ethylhexyl)
sulfosuccinate), ammonium tetra thiotungstate ((NH4)2WS4), sulfuric acid, n-hexane and
de-ionized water are used as the starting materials. All the chemicals are purchased
from M/s Sigma-Aldrich, USA and are used without further purification. In order to
obtain the optimum conditions for the synthesis of WS2 nanoparticles, a series of trials
are conducted by changing the molar ratio of water-to surfactant, the weight of the
precursors and aging time of the reaction. The synthesis methodology is done with an
optimized 0.5 M sulfuric acid aqueous solution and the AOT concentration is kept
constant to 0.1 M with respect to the total microemulsion volume. The procedure for the
synthesis of WS2 nanoparticles is carried out in two steps. At ambient temperature and
pressure during the first step of synthesis, reverse microemulsions are prepared by
dissolving 8.9 g of AOT in n-hexane (200 ml) and adding precisely 0.34 ml 0.5 M sulfuric
acid aqueous solution to this mixture in order to have the desired water-to-surfactant
molar ratio. The sample is sealed in containers and is vigorously shaken using an
ultrasonicator for 2 h to reach the thermodynamic equilibrium. In the second step of
process to synthesize WS2 nanoparticles, 200 ml of the 0.1 M AOT/n-hexane/sulfuric acid
microemulsion is added with 6.9 ml of a 0.005 M (NH4)2WS4 aqueous solution. This
process is carried out while stirring and the solution gives a yellowish optically clear
color. The solution is vigorously stirred using the magnetic stirrer for 24 h and the
yellowish color completely disappears progressively during the aging time as the
tungsten disulfide nanoparticles form. During the process of aging time, the production
of H2S gas is observed which clearly shows the physical evidence for the production of
WS2 nanoparticles. The advantage of synthesis of WS2 nanoparticles by microemulsion
technique is that it does not require extreme conditions of pressure and temperature
leading to lower cost in contrast to the quartz reactor method. Prepared WS2
nanoparticles are stored in air tight glass containers, separately for further
characterization and formulation of nano-lubricants.

NatioPro
onal Seminar oceedings: 35on ‘Trends an
5th IEI Nationand Developme
.
l Convention oents in Automo
of Mechanicaotive Industry
l Engineers any’ during Septe
nd ember 4 ‐ 5, 2019.
56
Fig.1 Synthesized WS2 nanoparticles
2.2 Formulation of nano-lubricant
500mL of coconut oil is used for making the nano-lubricant. Specific gravity of coconut
oil is measured on weight to volume basis using pycnometer and a precision balance.
Weighted WS2 nanoparticles are added to the coconut oil. The coconut oil with WS2
nanoparticles is agitated using ultra-sonicator for 30 minutes. The formulated nano-
lubricants are then stored in air tight glass containers. Fig. 2 shows the photographs of
prepared coconut oil nano-lubricants at atypical concentration of 0.5% WS2
nanoparticles along with pure coconut oil.
Fig. 2 Photographs of (a) Pure coconut oil (b) coconut oil with 0.5 wt.% WS2 nanoparticles before ultra-sonification (c) coconut oil with 0.5 wt.% WS2 nanoparticles after ultrasonification
2.3 Tribological studies
Tribological studies of the nano-lubricant has been conducted using pin-on-disc (P-O-D)
tribometer in accordance with ASTM G99-05 standards. An aluminium alloy (Al-86%, Si
12% and other elements-2%) and steel (EN-31, 60 HRC) were chosen as the pin and disk
materials respectively of the pin-on-disk tribometer. Diameter and length of the pin are
8 mm and 27 mm, respectively. Similarly, the diameter and the thickness of the steel
disk were chosen to be 90 mm and 5 mm respectively. The sliding distance is taken as

NatioPro
onal Seminar oceedings: 35on ‘Trends an
5th IEI Nationand Developme
.
l Convention oents in Automo
of Mechanicaotive Industry
l Engineers any’ during Septe
nd ember 4 ‐ 5, 2019.
1000 m
acetone
sliding
advanc
conditio
3. Resu
3.1 Cha
The mo
FESEM
other a
layered
Fig. 4 C
Fig. 5 [
percent
and tun
F
m; the slidi
e washed to
interface i
ced pin-on-
ons.
ults and d
aracteriza
orphology o
M images o
at 1 μm. Im
d lamellar f
Characteriza
[(a) and (b)
tage of con
ngsten.
Fig. 5 (a) ED
ing surface
o remove a
in small qu
disc tribom
discussion
ation of na
of the parti
of the WS2
mages from
flaky struct
ation of WS2
)] reveals t
nstituents)
DS spectrum
e is polishe
any wear de
uantities be
meter in or
s
anopartic
icles is ver
nanopartic
m FESEM
ture.
(a)
2 nanopartictwo m
he EDS an
on the WS
m of WS2 nan
57
ed after ea
ebris. The l
etween alu
rder to ma
cles
rified using
cles at two
clearly ind
cles (a) and (magnification
nalysis carr
S2 nanopar
noparticles (b
ach cycle u
lubricant w
uminium al
aintain bou
g FESEM.
magnificat
dicating th
(b)
(b) FESEM n levels
ried out (in
ticles show
b) Composit
using emer
was supplie
lloy pin and
undary/thin
Fig.4 [(a) a
tion levels.
hat WS2 na
image of W
n terms of a
wing the pr
tion of WS2 n
ry paper an
ed drop-wis
d steel disc
n film lub
and (b)] sh
. One at 5
anoparticle
WS2 nanopart
atomic and
resence of
nanoparticle
nd then
e at the
c on the
rication
ows the
μm and
s has a
ticles at
d weight
sulphur
es

NatioPro
onal Seminar oceedings: 35on ‘Trends an
5th IEI Nationand Developme
.
l Convention oents in Automo
of Mechanicaotive Industry
l Engineers any’ during Septe
nd ember 4 ‐ 5, 2019.
The par
size var
WS2 na
Fign
XRD pa
shown
be inde
3.2 Tri
Theore
researc
effect o
on COF
The tr
heating
of the f
cell wh
wear va
The obt
output
tabulat
rticle size o
ries from 2
anoparticles
g. 6 Particle nanoparticle
attern of th
in Fig. 7. T
exed to the
ib-test dat
tical conclu
ch. The Bo
of the factor
F and SWR
ibological
g arrangem
formulated
hich measu
alue was m
tained wea
parameter
ted in Table
of the WS2 n
0 to 70 nm
s synthesiz
size distribs measured
he prepared
These reflec
hexagonal
ta analysis
usion based
ox Behnken
rs such as
R which dete
studies co
ment was p
nano-lubri
ures and pr
measured by
ar value is t
r values of C
e I.
nanopartic
m and the av
zed by reve
ution of WS using DLS
d WS2 nan
ctions matc
WS2 nanop
s and opti
d on experi
n Design (B
load, speed
ermine the
onducted u
phenomenal
icant. The
rovides the
y weighting
then conver
COF and S
58
cles are ver
verage part
rse micelle
2 F
noparticles
ch with the
particles wi
imization
mental res
BBD) of th
d, temperat
e tribologica
using the a
l in determ
frictional f
e output th
g the alumi
rted to spec
SWR corres
rified using
ticle size is
e method.
Fig. 7 XRD p
shows refle
e JCPDS ca
ith high cry
sults is the
he RSM ha
ture and co
al behaviou
advanced p
mining the
force was d
hrough a di
inium alloy
cific wear r
ponding to
DLS as sh
found to b
pattern of W
ections at d
ard numbe
ystallinity.
most basic
as been us
oncentratio
ur of the na
pin-on-disk
friction an
directly obta
isplay scre
y pin before
rate using A
o the variou
hown in Fig
be 36.57 nm
WS2 nanopar
different pl
er 08-0237 a
c way to va
sed to anal
on of nanop
ano-lubrican
k tribomete
nd wear pro
ained using
een. Moreov
e and after
Archad’s La
us experime
g. 6. The
m for the
rticles
lanes as
and can
alidate a
lyse the
particles
nt.
er with
operties
g a load
ver, the
sliding.
aw. The
ents are

NatioPro
onal Seminar oceedings: 35on ‘Trends an
5th IEI Nationand Developme
.
l Convention oents in Automo
of Mechanicaotive Industry
l Engineers any’ during Septe
nd ember 4 ‐ 5, 2019.
59
TABLE I Experimental Design and Results (Un-coded Factors)
Run Order
A - Load (N)
B - Speed (rpm)
C - Temp. (˚C)
D - Conc. (%)
COF WEAR RATE (mm3/Nm)
1 150 100 30 0.5 0.048 4.87E-06
2 200 100 75 0.5 0.053 4.72E-06
3 200 200 120 0.5 0.059 4.71E-06
4 200 200 30 0.5 0.048 4.74E-06
5 150 200 120 1 0.073 4.55E-06
6 150 300 120 0.5 0.063 4.89E-06
7 150 200 30 1 0.073 4.55E-06
8 100 300 75 0.5 0.057 4.53E-06
9 150 300 75 1 0.073 4.54E-06
10 200 300 75 0.5 0.071 4.71E-06
11 150 100 75 0 0.11 6.04E-06
12 200 200 75 0 0.11 5.87E-06
13 100 200 120 0.5 0.057 4.53E-06
14 150 200 75 0.5 0.063 4.89E-06
15 150 300 30 0.5 0.063 4.88E-06
16 150 200 75 0.5 0.063 4.89E-06
17 150 200 30 0 0.11 6.02E-06
18 150 100 75 1 0.073 4.54E-06
19 100 200 30 0.5 0.057 4.53E-06
20 100 200 75 1 0.066 4.18E-06
21 100 100 75 0.5 0.057 4.52E-06
22 150 300 75 0 0.11 6.04E-06
23 150 200 120 0 0.11 6.03E-06
24 150 200 75 0.5 0.063 4.89E-06
25 150 100 120 0.5 0.063 4.87E-06
26 100 200 75 0 0.11 5.68E-06
27 150 200 75 0.5 0.063 4.89E-06
28 200 200 75 1 0.079 4.38E-06
29 150 200 75 0.5 0.063 4.87E-06

NatioPro
onal Seminar oceedings: 35on ‘Trends an
5th IEI Nationand Developme
.
l Convention oents in Automo
of Mechanicaotive Industry
l Engineers any’ during Septe
nd ember 4 ‐ 5, 2019.
60
3.3 Analysis of COF and SWR
The ANOVA table showing the significant factors corresponding to COF of the lubricant
is as shown in Table II, where A, B, C, D corresponds to load, speed, temperature and
concentration of nanoparticles respectively. The model F-values for COF is 109.01,
implying that model is significant.
TABLE II ANOVA table for COF of the nano-lubricant
Source Sum of squares Df Mean square F-Value p-value
Model 0.0118 10 0.0012 109.01 < 0.0001
A 0.0000 1 0.0000 1.97 0.1770
B 0.0001 1 0.0001 8.40 0.0096
C 0.0001 1 0.0001 5.21 0.0348
D 0.0041 1 0.0041 383.62 < 0.0001
AB 0.0001 1 0.0001 7.50 0.0135
AD 0.0000 1 0.0000 3.91 0.0635
BC 0.0001 1 0.0001 5.21 0.0349
A² 0.0001 1 0.0001 5.62 0.0292
C² 0.0001 1 0.0001 5.62 0.0292
D² 0.0065 1 0.0065 603.17 < 0.0001
Residual 0.0002 18 0.0000 - -
Lack of Fit 0.0002 14 0.0000 - -
Pure Error 0.0000 4 0.0000 - -
Cor Total 0.0120 28 - - -
Further, p-value, < 0.0001 implies that model terms are significant with negligible
influence of noise for nano-lubricants. On careful examination of the F and p-values for
each input parameter, it is seen that factor D (concentration) has the most significant
effect on COF for coconut-oil based nano-lubricants. Further, the regression analysis
data for COF of the nano-lubricant is as shown in Table III. The Predicted R² of 0.9541
is in reasonable agreement with the Adjusted R² of 0.9747.
TABLE III Regression analysis table for COF of nano-lubricant
R - Squared 0.9838
Adjusted R - Squared 0.9747
Predicted R - Squared 0.9541
Adequate Precision 31.6787

NatioPro
onal Seminar oceedings: 35on ‘Trends an
5th IEI Nationand Developme
.
l Convention oents in Automo
of Mechanicaotive Industry
l Engineers any’ during Septe
nd ember 4 ‐ 5, 2019.
61
Similarly, the ANOVA table showing the significant factors corresponding to SWR of the
lubricant is as listed in Table IV. The model F-values for SWR is 27395.1, implying that
model is significant. Further, p-value, < 0.0001 implies that model terms are significant
with negligible influence of noise for nano-lubricants. On careful examination of the F
and p-values for each input parameter, it is seen that factor A (load) and factor D
(concentration) have the most significant effect on COF for coconut-oil based nano-
lubricants.
TABLE IV ANOVA table for SWR of nano-lubricant
Source Sum of squares Df Mean square F Value p-value
Model 8.606E-12 4 2.151E-12 27395.10 < 0.0001
A 1.121E-13 1 1.121E-13 1427.81 < 0.0001
D 6.660E-12 1 6.660E-12 84806.39 < 0.0001
A² 4.649E-13 1 4.649E-13 5920.17 < 0.0001
D² 1.135E-12 1 1.135E-12 14447.46 < 0.0001
Residual 1.885E-15 24 7.854E-17 - -
Lack of Fit 1.565E-15 20 7.824E-17 0.9780 0.5803
Pure Error 3.200E-16 4 8.000E-17 - -
Cor Total 8.608E-12 28 - - -
Further, the regression analysis data for SWR of the nano-lubricant is as shown in
Table V. The R-Squared and Adjusted R-Square values corresponding to the
experimental data was found to be convincing for the generated model to be valid.
Adequate precision is found to be 501.7218.
TABLE V Regression analysis table for SWR of nano-lubriicant
R - Squared 0.9998
Adjusted R - Squared 0.9997
Predicted R - Squared 0.9997
Adequate Precision 501.7218
Fig. 8 shows the normal probability plots of COF and SWR for coconut oil nano-
lubricants. The normal probability plot is the result of testing of the normality of the
experimental results and it shows the predicted versus actual values for the design
matrix. For any ANOVA analysis, normal probability plot should be checked for the
range of residuals which should lie close to the mean line. From Fig. 8 it is evident that

NatioPro
onal Seminar oceedings: 35on ‘Trends an
5th IEI Nationand Developme
.
l Convention oents in Automo
of Mechanicaotive Industry
l Engineers any’ during Septe
nd ember 4 ‐ 5, 2019.
62
the values of residuals are very small and the data closely fitted for both the cases, the
Box-Cox plot does not suggest a power transform for the models generated and hence a
quadratic model is sufficient for developing the equations for COF and SWR. Otherwise,
the model should be power transformed to other higher levels polynomials for accurate
results.
Fig. 8 Normal probability plots of (a.) COF and (b.) SWR for coconut oil nano-lubricants
Fig. 9 Influence of concentration of nanoparticles and load on COF of the nano-
lubricant
Fig. 10 Influence of speed and temperature on COF of the nano-lubricant
Parametric variations of COF and SWR in terms of the significant input variables are
graphically represented in Figs. 9 to 12, for coconut oil nano-lubricants. Fig. 9 (a) shows
the response surface plot as a function of load and concentration on COF at mean speed

NatioPro
onal Seminar oceedings: 35on ‘Trends an
5th IEI Nationand Developme
.
l Convention oents in Automo
of Mechanicaotive Industry
l Engineers any’ during Septe
nd ember 4 ‐ 5, 2019.
63
of 200 rpm and mean temperature of 75 °C. Within the chosen range of concentrations
(0-1%), COF decreases to a minimum value and increases with further addition of WS2
nanoparticles. The trend is more visible in contour plot as shown in Fig. 9(b). At low
temperature and minimum load, optimum value of COF is obtained which is shown in
Fig. 10.
Surface and contour plots representing the influence of influencing variables on SWR
show that a minimum value of applied load coupled with an optimum value of WS2
nanoparticle concentration results in minimum SWR for the tribo-pair. This condition is
predicted for coconut oil nano-lubricants as illustrated in Fig. 11(a) and (b). It may be
noted that nano-lubricant temperature within the operating range has no influence on
SWR. Fig. 12 shows a slight increase in SWR when load increases to its maximum
value. Increasing speed of tribometer doesn’t affect SWR of the lubricant. Temperature
has no effect on SWR of the lubricant.
Fig. 11 Influence of concentration of nanoparticles and load on SWR of the nano-
lubricant
Fig. 12 Influence of speed and load on SWR of the nano-lubricant
Finally, the optimization of the concentration of WS2 nanoparticles in the prepared
coconut oil based lubricant for maximum efficient performance is achieved using
desirability function. The values of COF and SWR is at optimal minimum when the

NatioPro
onal Seminar oceedings: 35on ‘Trends an
5th IEI Nationand Developme
.
l Convention oents in Automo
of Mechanicaotive Industry
l Engineers any’ during Septe
nd ember 4 ‐ 5, 2019.
64
concentration of WS2 nanoparticles in the lubricant is at 0.76 wt% with a desirability of
98.24%.
Fig. 13 Influence of concentration of nanoparticles and load on desirability of the nano-lubricant
3.4 Analyses of thermo-physical properties
The thermo-physical property analyses viz. viscosity, flash and fire-point tests were
conducted using Saybolt Viscometer and Cleveland Open Cup (COC) apparatus
respectively. The results obtained are as detailed below.
The rheological property (viz., kinematic viscosity) and thermo-physical properties (viz.,
flash-point and fire-point) are determined for WS2 nano-lubricants with varying
concentrations. Fig. 14 shows the variation of kinematic viscosity of nano-lubricants
with operating temperature. The addition of nanoparticles suppresses the rate of
reduction of viscosity with increase in temperature, making the oil more suitable for
high temperature applications. An appreciable increase in viscosity with WS2
nanoparticle concentration is observed for coconut oil, particularly at high temperature.
Fig. 14 Kinematic viscosity with temperature for coconut oil nano-lubricants

NatioPro
onal Seminar oceedings: 35on ‘Trends an
5th IEI Nationand Developme
.
l Convention oents in Automo
of Mechanicaotive Industry
l Engineers any’ during Septe
nd ember 4 ‐ 5, 2019.
65
Fire-point of coconut oil nano-lubricants shows that an increase with increase in
concentration of WS2 nanoparticles whereas a distinct trend is observed for flash-point
in Fig. 15. A possible reason for the monotonous increase in fire-point is the
inflammability of WS2 nanoparticles which requires a much higher temperature for its
continuous burning. Flash-point of of coconut oil nano-lubricants is centered around 278
°C for the entire range of WS2 nanoparticle concentration.
Fig. 15 Flash and fire-points with concentration for coconut oil nano-lubricants
4. Conclusions
Synthesized WS2 nanoparticles has layered lamellar flaky structure.
Reverse micelle method does not require extreme conditions of pressure and
temperature leading to lower cost in contrast to the quartz reactor method.
EDS analysis of WS2 nanoparticles shows the presence of sulphur and tungsten.
Average particle size is found to be 36.57 nm for the WS2 nanoparticles
synthesized by reverse micelle method.
XRD pattern of the prepared nanoparticles can be indexed to hexagonal WS2
nanoparticles with high crystallinity.
The ANOVA, regression analysis and normal probability plots proved the credibility of the model developed by employing RSM.
The analysis of experimental values of COF and SWR obtained using pin-on-disk tribometer conducted by BBD method confirmed that the most significant parameter was found to be the concentration of WS2 nanoparticles in the lubricant.

NatioPro
onal Seminar oceedings: 35on ‘Trends an
5th IEI Nationand Developme
.
l Convention oents in Automo
of Mechanicaotive Industry
l Engineers any’ during Septe
nd ember 4 ‐ 5, 2019.
66
The optimized concentration of WS2 nanoparticles for minimum value of COF and SWR determined using desirability function was 0.76 wt% of the lubricant.
The viscosity, flash and fire point test results proved the credibility of surfactant modified WS2 added coconut oil nano-lubricant over the other samples due to its high viscosity, flash and fire-point values.
Acknowledgments
We would like to convey our sincere gratitude to CERD-KTU with Reference No.
KTU/RESEARCH 2/2743/2017 for providing the financial assistance for this initiative.
References
1. Koshy, C. P., Rajendrakumar, P. K., &Thottackkad, M. V. (2015). "Analysis of tribological
and thermo-physical properties of surfactant-modified vegetable oil-based CuOnano-
lubricants at elevated temperatures-an experimental study", Tribology Online, 10(5), 344-
353.
2. Philip, J., & Koshy, C. (2016), "Surface morphology and stability analysis of ceria-based
nanoparticles for its utilization as a lubricant additive", In International Conference on
Communication and Signal Processing 2016 (ICCASP 2016), Atlantis Press.
3. Li, B., Wang, X., Liu, W., &Xue, Q. (2006), "Tribochemistry and antiwear mechanism of
organic–inorganic nanoparticles as lubricant additives", Tribology Letters, 22(1), 79-84.
4. Zhmud, B., &Pasalskiy, B. (2013), "Nanomaterials in lubricants: an industrial perspective on
current research", Lubricants, 1(4), 95-101.
5. Dietzel, D., Schwarz, U. D., &Schirmeisen, A. (2014), "Nanotribological studies using
nanoparticle manipulation: Principles and application to structural lubricity", Friction, 2(2),
114-139.
6. Ali, M. K. A., &Xianjun, H. (2015), "Improving the tribologicalbehavior of internal
combustion engines via the addition of nanoparticles to engine oils", Nanotechnology Reviews,
4(4), 347-358.
7. Grobelny, J., Pradeep, N., Kim, D. I., & Ying, Z. C. (2006), "Quantification of the meniscus
effect in adhesion force measurements", Applied physics letters, 88(9), 091906.
8. Alves, S. M., Mello, V. S., Faria, E. A., & Camargo, A. P. P. (2016), "Nanolubricants developed
from tiny CuO nanoparticles" Tribology International, 100, 263-271.
9. Aldana, P. U., Vacher, B., Le Mogne, T., Belin, M., Thiebaut, B., &Dassenoy, F. (2014),
"Action mechanism of WS2 nanoparticles with ZDDP additive in boundary lubrication
regime", Tribology Letters, 56(2), 249-258.

NatioPro
onal Seminar oceedings: 35on ‘Trends an
5th IEI Nationand Developme
.
l Convention oents in Automo
of Mechanicaotive Industry
l Engineers any’ during Septe
nd ember 4 ‐ 5, 2019.
67
10. Chen, Z., Liu, X., Liu, Y., Gunsel, S., & Luo, J. (2015), "Ultrathin MoS2 nanosheets with
superior extreme pressure property as boundary lubricants", Scientific reports, 5, 12869.
11. Zhou W. & Wang Z.L. (2007). "Scanning microscopy for nanotechnology: techniques and
applications", Springer science & business media.
12. Aldana, P. U. (2016), Tungsten disulfide nanoparticles as lubricant additives for the
automotive industry (Doctoral dissertation, Universite de Lyon).
13. Joly-Pottuz, L., Dassenoy, F., Belin, M., Vacher, B., Martin, J. M., & Fleischer, N. (2005),
Ultralow-friction and wear properties of IF-WS2 under boundary lubrication. Tribology
letters, 18(4), 477-485.
14. Zhang, L. L., Tu, J. P., Wu, H. M., and Yang, Y. Z. (2007). WS2 nanorods prepared by self-
transformation process and their tribological properties as additive in base oil. Materials
Science and Engineering: A, 454, 487-491.
15. Rapoport, L., Moshkovich, A., Perfilyev, V., Laikhtman, A., Lapsker, I., Yadgarov, L., and
Tenne, R. (2012). High lubricity of re-doped fullerene-like MoS2 nanoparticles. Tribology
Letters, 45(2), 257-264.
16. Spikes, H. (2015). Friction Modifier Additives. Tribology Letters, 60(1), 1-26.
17. Mosleh, M., Atnafu, N. D., Belk, J. H., and Obles, O. M. (2009). Modification of Sheet Metal
Forming Fluids with Dispersed Nanoparticles for Improved Lubrication. Wear, 267(5–8), pp.
1220–1225.
18. Chou, C. C., and Lee, S. H. (2010). TribologicalBehavior of Nanodiamond Dispersed
Lubricants on Carbon Steels and Aluminum Alloy. Wear, 269(11–12), pp. 757–762.
19. Ito, K., Martin, J. M., Minfray, C., and Kato, K. (2007). Formation mechanism of a low
friction ZDDP tribofilm on iron oxide. Tribology transactions, 50(2), 211-216.
20. Yadav, T. P., and Srivastava, O. N. (2012). Synthesis of nanocrystalline cerium oxide by high
energy ball milling. Ceramics International, 38(7), 5783-5789.
21. Mädler, L., Stark, W. J., and Pratsinis, S. E. (2002). Flame-made ceria nanoparticles. Journal
of Materials Research, 17(06), 1356-1362.
22. Hahn, H. (1997). Gas phase synthesis of nanocrystalline materials. Nanostructured
Materials, 9(1), 3-12.
23. Chen, H. I., and Chang, H. Y. (2004). Homogeneous precipitation of cerium dioxide
nanoparticles in alcohol/water mixed solvents. Colloids and Surfaces A:Physicochemical and
Engineering Aspects, 242(1), 61-69.
24. Chen, H. I., and Chang, H. Y. (2005). Synthesis of nanocrystalline cerium oxide particles by
the precipitation method. Ceramics International, 31(6), 795-802.

NatioPro
onal Seminar oceedings: 35on ‘Trends an
5th IEI Nationand Developme
.
l Convention oents in Automo
of Mechanicaotive Industry
l Engineers any’ during Septe
nd ember 4 ‐ 5, 2019.
68
25. Verdon, E., Devalette, M., and Demazeau, G. (1995). Solvothermal synthesis of cerium
dioxide microcrystallites: effect of the solvent. Materials letters, 25(3), 127-131.
26. Zhou, F., Zhao, X., Xu, H., and Yuan, C. (2007). CeO2 spherical crystallites: synthesis,
formation mechanism, size control, and electrochemical property study. The Journal of
Physical Chemistry C, 111(4), 1651-1657.
27. S.M. Ghoreishi, S.S. Meshkat, M. Ghiaci, A.A. Dadkhah (2012), “Nanoparticles synthesis of
tungsten disulfide via AOT-based microemulsions”, Materials Research Bulletin 47, 1438–
1441.
28. D.C. Montgomery, Design and Analysis of Experiments, fifth ed., Wiley, Singapore (2007)21–
46.
29. H.Oktem, T.Erzurumlu, H.Kurtaran, Application of response surface methodology in the
optimization of cutting conditions for surface roughness, J. Mater. Process. Technol.170
(2005)11–16.
30. T.L.Ginta, A.K.M.N.Amin, H.C.D.M. Radzi, M.A.Lajis, Tool life prediction by response
surface methodology in end milling titanium alloy Ti–6Al–4V using uncoated WC–Co inserts,
Eur.J.Sci.Res.28(2009)533–541.
31. G.E.P. Box, K.B. Wilson, On the experimental attainment of optimum conditions, J.R. Stat.
Soc.13(1951)1–45.

NatioPro
onal Seminar oceedings: 35on ‘Trends an
5th IEI Nationand Developme
.
l Convention oents in Automo
of Mechanicaotive Industry
l Engineers any’ during Septe
nd ember 4 ‐ 5, 2019.
69
Tribological and Synergetic Effect of Synthesized MoS2 Nano‐Particles in Coconut Oil at Elevated Temperature for Automotive Applications
Chacko Preno Koshy1, Reuben Thomas1 and M D Mathew1 1Advanced Measurement Laboratory, Department of Mechanical Engineering,
Saintgits College of Engineering, Pathamuttom P.O., Kottayam ‐ 686532, Kerala, India
E‐Mail: [email protected], reubenz410@gmail.
Abstract
Molybdenum disulfide nanoparticles have been successfully synthesized, for lubricant
applications, by solvothermal method. Energy Dispersive Spectroscopy (EDS), X-Ray Diffraction
(XRD) & Dynamic light scattering (DLS) are used to find the characterization of synthesized
MoS2. Nanoparticles (surfactant modified and unmodified) are added separately to coconut oil
and ultrasonic agitation is carried out to formulate the required lubricant at different
concentrations of nanoparticles. Tribological properties of the nano-lubricants have been
estimated using pin-on-disc tribometer and four-ball tester in accordance with respective ASTM
standards. Comprehensive variation in properties with respect to various process parameters such
as speed, load, the concentration of nanoparticles and temperature of the lubricants have been
evaluated for the major output tribological parameters, viz. coefficient of friction (COF) and
specific wear rate (SWR).The friction-reduction and anti-wear properties of the nano-lubricants
have been experimentally evaluated between 30°C & 120°C, for various concentrations of
nanoparticles. The experimental data are used to formulate a response surface methodology (RSM)
model in ANOVA using Box Behnken Design (BBD).The simulation results are used to optimize
the concentration of nanoparticles for the best tribological properties. The optimum concentration
of MoS2 nanoparticles in coconut oil is estimated to be 0.52 weight percentage.
Keywords: Nanoparticle; Molybdenum disulfide (MoS2); Solvothermal; Ammonium
heptamolybdate.
Introduction
In recent years, there has been worldwide attention towards preparing high-
performance nano-materials and coatings for tribological applications for reducing
friction to a greater extent. In addition, nanomaterials and nanostructures, because of
their special dimensional effects, reveal totally different tribological and mechanical
properties compared with traditional materials [1-3]. The combination of nanoparticle
additives and base lubricants is a promising way to achieve the optimization of

NatioPro
onal Seminar oceedings: 35on ‘Trends an
5th IEI Nationand Developme
.
l Convention oents in Automo
of Mechanicaotive Industry
l Engineers any’ during Septe
nd ember 4 ‐ 5, 2019.
70
lubricating materials [4-7]. Molybdenum disulfide (MoS2) nanoparticles perform very
well in lubricant application. MoS2 has a layered close-packed hexagonal crystal
(honeycomb) structure (strong covalent bond) surrounded by vertically stacked
monolayers bond (S-S bonds) together by weak van der Waals forces[8,9]. This flexible
structure is the most important feature for solid lubrication as well as lubricating oils.
The utilization of MoS2 nanoparticles as inorganic lubricant activities has also raised
much focus over recent years due to their outstanding properties as well as chemical
inertness, even at elevated temperature [10-14].
A. Experimental Procedure
A series of trials were carried out to derive the optimal conditions. The concentration of
the starting materials, the solvent volume ratio, the reaction time, and temperature
were changed. All the substances used in this method were of analytical grade.
1. Synthesis of MoS2 nanoparticles
To generate the nanoparticles of MoS2, ammonium heptamolybdate (AHM) tetrahydrate
(NH4)6Mo7O24.4H2O), citric-acid (C6H8O7), and thiourea (CH4N2S) were used as the
initial chemicals and the sulfur source. Here, 4.8 g of AHM tetrahydrate and 2.92 g of
citric acid (or keep AHM and citric acid in the molar ratio 1:1, 1:2, and 1:4) were
dissolved in 400 ml waterby means of magnetic stirring and kept at 80 ºC for half an
hour. Adjust the pH level at 4 with the precise and careful addition of ammonia water
drop wise. The obtained white suspension must be continuously stirred. Then, 7g of
thiourea completely dissolved (20 wt% solution) in water, added drop-wise to the above
solution and carried to the muffle furnace. Then the muffle furnace was sustained at a
temperature of 180ºC for 12 h. Then the reactor was left to cool down normally to room
temperature 25 ºC. Finally, through centrifugation the black precipitates were
cumulated and washed 4-5 times with water and followed by acetone. The final
precipitates were kept dried under vacuum at 120 ºC for 6h.
2. Formulation of Nano-Lubricant
In this present work, lubricants added with MoS2 nanoparticles as additives at
variousconcentrations are termed as 'nano-lubricants' and are prepared by two-step
method. Ananolubricant is prepared by adding nanoparticles to the base lubricant and
agitating using anultra-sonicator.500mL of coconut oil is used for making the nano-
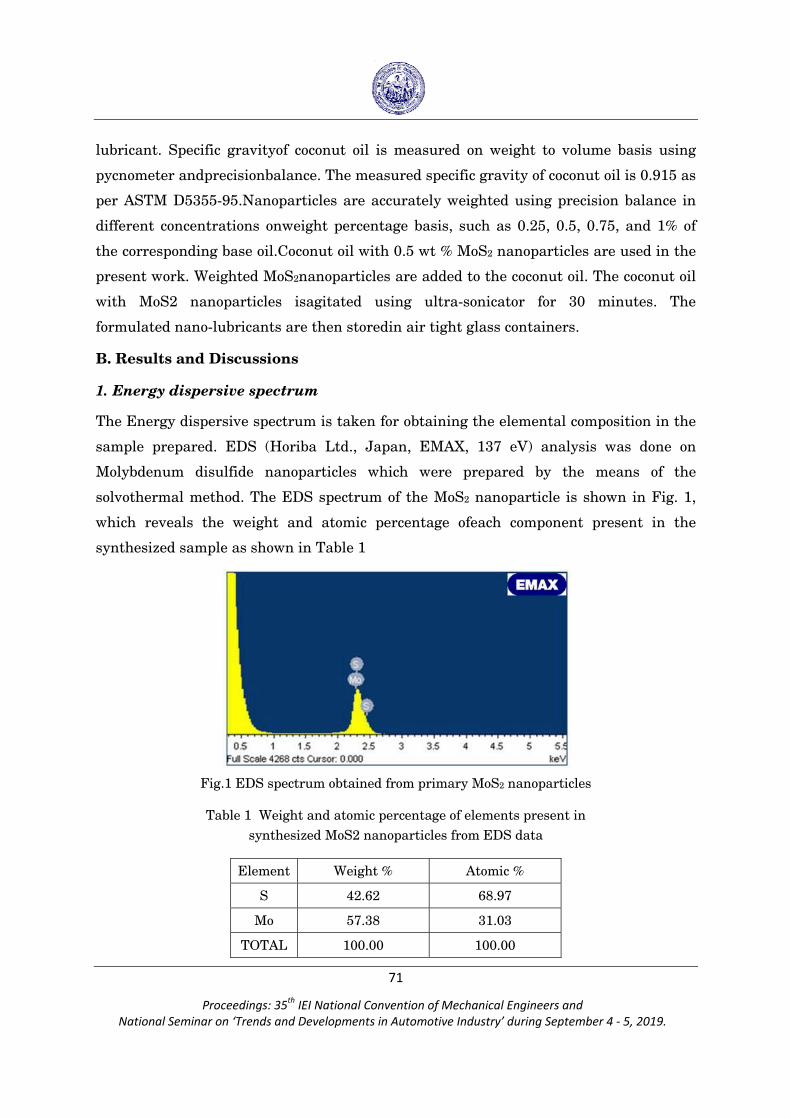
NatioPro
onal Seminar oceedings: 35on ‘Trends an
5th IEI Nationand Developme
.
l Convention oents in Automo
of Mechanicaotive Industry
l Engineers any’ during Septe
nd ember 4 ‐ 5, 2019.
71
lubricant. Specific gravityof coconut oil is measured on weight to volume basis using
pycnometer andprecisionbalance. The measured specific gravity of coconut oil is 0.915 as
per ASTM D5355-95.Nanoparticles are accurately weighted using precision balance in
different concentrations onweight percentage basis, such as 0.25, 0.5, 0.75, and 1% of
the corresponding base oil.Coconut oil with 0.5 wt % MoS2 nanoparticles are used in the
present work. Weighted MoS2nanoparticles are added to the coconut oil. The coconut oil
with MoS2 nanoparticles isagitated using ultra-sonicator for 30 minutes. The
formulated nano-lubricants are then storedin air tight glass containers.
B. Results and Discussions
1. Energy dispersive spectrum
The Energy dispersive spectrum is taken for obtaining the elemental composition in the
sample prepared. EDS (Horiba Ltd., Japan, EMAX, 137 eV) analysis was done on
Molybdenum disulfide nanoparticles which were prepared by the means of the
solvothermal method. The EDS spectrum of the MoS2 nanoparticle is shown in Fig. 1,
which reveals the weight and atomic percentage ofeach component present in the
synthesized sample as shown in Table 1
Fig.1 EDS spectrum obtained from primary MoS2 nanoparticles
Table 1 Weight and atomic percentage of elements present in synthesized MoS2 nanoparticles from EDS data
Element Weight % Atomic %
S 42.62 68.97
Mo 57.38 31.03
TOTAL 100.00 100.00

NatioPro
onal Seminar oceedings: 35on ‘Trends an
5th IEI Nationand Developme
.
l Convention oents in Automo
of Mechanicaotive Industry
l Engineers any’ during Septe
nd ember 4 ‐ 5, 2019.
2. Dyn
The pa
with he
100 nm
synthes
MiniFle
nanopa
charact
JCPDS
crystall
(002) p
orienta
3.Tribo
Theore
are sea
most ap
Box Be
such as
which d
account
Furthe
namic Lig
article size
exane as th
m and the a
sized by so
ex 600) sh
articles sh
teristic of
S card num
linity of th
plane of M
ation.
Fig 2 (a) P
o-Test Dat
tical conclu
arch. RSM
ppropriate
ehnken D e
s load, spee
determine t
t three valu
r, the ext
ght Scatte
of the MoS
he base flui
average par
olvotherma
hows the
how main
MoS2 cryst
mber 37149
he MoS2 nan
MoS2 mean
(a)
Particle size(b
ta analysis
usion based
provides s
and adequ
esign (BBD
ed, temper
the tribolog
ues of each
treme valu
ering an
S2 nanopart
d. For MoS
rticle size i
al method. T
XRD patte
reflections
talline nat
92. The str
noparticles
ns that a
e distributionb) XRD patte
s and Opt
d on exper
olution for
uate set us
D) of the R
rature and
gical behav
h factor for
ues of each
72
d X-Ray D
ticles is ve
S2 nanopart
is found to
The XRD a
ern shown
s at (002
ure, consis
rong and cl
s. The stron
large num
n of MoS2 naern of MoS2
timization
imental re
limiting th
ing mathem
RSM was us
concentrat
viour of the
computati
h factor a
Diffractio
erified usin
ticles, the p
be 68.46 n
analyser (R
n in Fig 2
2), (100),
stent with
lear peaks
ngest diffra
mber of gr
anoparticles nanoparticl
n
sults is the
he large nu
matical an
sed to ana
tion of nan
e nanolubri
ion (minimu
re selected
on
g DLS as s
particle size
m for the M
Rigaku Cor
2 (b) of th
(103), (00
the corres
reveal the
action peak
rains are
(b)
s measured ules
e most bas
umber of e
nd statistica
alyse the ef
oparticles
icant. This
um, averag
d based on
shown in F
e varies fro
MoS2nanop
rporation, J
he prepared
6) and (1
sponding st
e high pur
k is indexed
in the pa
using DLS
sic way to v
experiment
al techniqu
ffect of the
on COF an
method tak
ge and max
n the trib
Fig 2 (a)
om 40 to
particles
JAPAN,
d MoS2
110) as
tandard
rity and
d to the
articular
validate
s to the
ues. The
e factors
nd SWR
kes into
ximum).
bological

NatioPro
onal Seminar oceedings: 35on ‘Trends an
5th IEI Nationand Developme
.
l Convention oents in Automo
of Mechanicaotive Industry
l Engineers any’ during Septe
nd ember 4 ‐ 5, 2019.
73
conditions which have to be encounteredwhen the lubricant will be employed practically
in an engine. The factors and the variouslevels for experimentation is as detailed in
Table 2
Table 2 Factors and Levels for experiments.
Factors Parameters (Unit) Levels for BBD
-1 0 1
A Load (N) 100 150 200
B Speed (rpm) 100 200 300
C Concentration (%) 0 0.5 1
D Temperature (ºC) 30 75 120
The total number of experiments required to be conducted is 34 i.e. 81 experiments. But,
using the BBD method of the RSM the 81 experiments required to model the boundary
lubrication with the developed nanolubricant was minimized to 29 experiments. The
tribological studies conducted using the advanced pin-on-disk tribometer with heating
arrangement was phenomenal in determining the friction and wear properties of the
formulated nanolubricant. The frictional force was directly obtained using a load cell
which measures and furnishes the output through a display screen. Moreover, the wear
value was measured by weighting the aluminium alloy pin before and after sliding. The
procured wear value is then converted to specific wear rate using Archad’s Law. The
output parameter values of COF and SWR corresponding to the various experiments are
tabulated in Table 3
Table 3 Experimental Design and Results (Un-coded Factors)
Run Order A-Load
(N)
B -Speed
(rpm)
C – Conc.
(wt%)
D –Temp
( )
COF SWR
(mm3/Nm)
1 100 200 0 75 0.0995 6.07E-06
2 150 100 0 75 0.1005 6.16E-06
3 200 300 0.5 75 0.0503 5.65E-06
4 100 100 0.5 75 0.0473 5.47E-06
5 200 200 0.5 120 0.0623 5.71E-06
6 200 200 0.5 30 0.0588 5.60E-06

NatioPro
onal Seminar oceedings: 35on ‘Trends an
5th IEI Nationand Developme
.
l Convention oents in Automo
of Mechanicaotive Industry
l Engineers any’ during Septe
nd ember 4 ‐ 5, 2019.
74
7 150 200 0 120 0.1115 6.21E-06
8 100 200 0.5 120 0.0613 5.53E-06
9 150 200 0.5 75 0.0423 5.56E-06
10 200 200 1 75 0.0867 6.13E-06
11 150 300 1 75 0.1047 6.08E-06
12 150 200 1 120 0.0987 6.13E-06
13 100 300 0.5 75 0.0403 5.47E-06
14 150 300 0 75 0.0985 6.17E-06
15 150 300 0.5 30 0.0618 5.51E-06
16 150 200 0.5 75 0.0433 5.56E-06
17 150 200 0.5 75 0.0433 5.55E-06
18 150 100 0.5 30 0.0538 5.51E-06
19 150 200 1 30 0.0952 6.02E-06
20 150 300 0.5 120 0.0643 5.62E-06
21 150 100 1 75 0.0977 6.07E-06
22 150 100 0.5 120 0.0603 5.61E-06
23 100 200 1 75 0.0827 5.99E-06
24 150 200 0 30 0.108 6.11E-06
25 150 200 0.5 75 0.0423 5.57E-06
26 150 200 0.5 75 0.0423 5.56E-06
27 200 200 0 75 0.1025 6.25E-06
28 100 200 0.5 30 0.0598 5.42E-06
29 200 100 0.5 75 0.0483 5.65E-06
4. Tests for Model Significance
The ANOVA table showing the significant factors corresponding to COF of the lubricant
is as shown in Table4, where A, B, C, D corresponds to load, speed, concentration
andtemperature respectively. It can be seen that the concentration of the nanoparticles
and thetemperature are the most significant deciding parameters compared to the other
factors. Thefactor C corresponding to speed was eliminated as it doesn’t show any
significance in themodel.

NatioPro
onal Seminar oceedings: 35on ‘Trends an
5th IEI Nationand Developme
.
l Convention oents in Automo
of Mechanicaotive Industry
l Engineers any’ during Septe
nd ember 4 ‐ 5, 2019.
75
Table 4 ANOVA table for SWR of the nanolubricant
Similarly, the ANOVA table showing the significant factors corresponding to SWR of the
lubricant is as listed in Table 6. It can be seen that temperature and concentration are
the most significant deciding factors along with load. The speed factor was eliminated as
it showed no significance. Moreover, the Predicted R-Squared value for the COF and
SWR data was obtained to be around 0.9which clearly depicts the adequacy of the
model.
Table 6 ANOVA table for SWR of the nanolubricant
Source Sum of Squares DoF Mean Square F-value p-value
Model 2.309E-12 5 4.619E-13 9986.85 < 0.0001
A-LOAD 9.013E-14 1 9.013E-14 1948.87 < 0.0001
C-CONC 2.521E-14 1 2.521E-14 545.06 < 0.0001
D-TEMP 3.413E-14 1 3.413E-14 738.04 < 0.0001
AC 4.000E-16 1 4.000E-16 8.65 0.0073
C² 2.160E-12 1 2.160E-12 46693.62 < 0.0001
Residual 1.064E-15 23 4.625E-17 - -
Lack of Fit 8.637E-16 19 4.546E-17 0.9092 0.6148
Pure Error 2.000E-16 4 5.000E-17 - -
Cor Total 2.310E-12 28 - - -
Source Sum of Squares DoF Mean Square F-value p-value
Model 0.0144 6 0.0024 139.52 < 0.0001
B-SPEED 0.0000 1 0.0000 0.6004 0.4467
C-CONC 0.0002 1 0.0002 12.67 0.0018
D-TEMP 0.0000 1 0.0000 1.81 0.1928
B² 0.0001 1 0.0001 6.82 0.0159
C² 0.0139 1 0.0139 807.64 < 0.0001
D² 0.0010 1 0.0010 55.60 < 0.0001
Residual 0.0004 22 0.0000 - -
Lack of Fit 0.0004 18 0.0000 87.07 0.0003
Pure Error 9.654E-07 4 2.413E-07 - -
Cor Total 0.0148 28 - - -
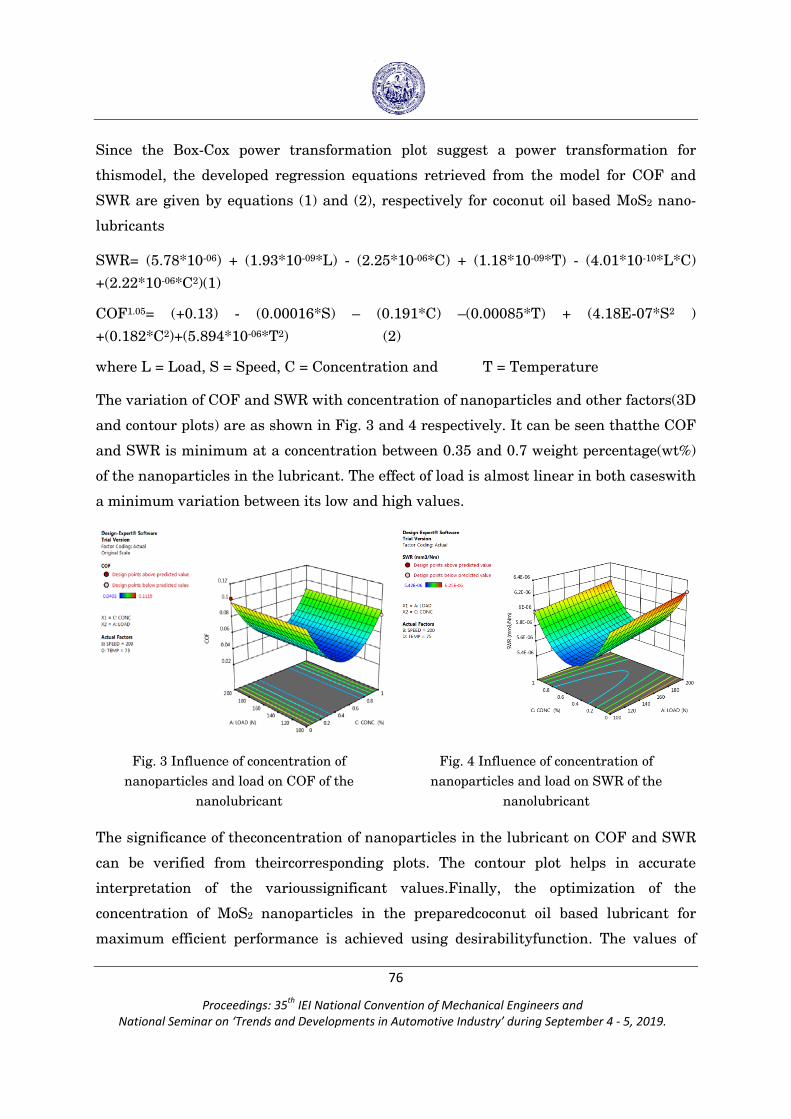
NatioPro
onal Seminar oceedings: 35on ‘Trends an
5th IEI Nationand Developme
.
l Convention oents in Automo
of Mechanicaotive Industry
l Engineers any’ during Septe
nd ember 4 ‐ 5, 2019.
76
Since the Box-Cox power transformation plot suggest a power transformation for
thismodel, the developed regression equations retrieved from the model for COF and
SWR are given by equations (1) and (2), respectively for coconut oil based MoS2 nano-
lubricants
SWR= (5.78*10-06) + (1.93*10-09*L) - (2.25*10-06*C) + (1.18*10-09*T) - (4.01*10-10*L*C)
+(2.22*10-06*C2)(1)
COF1.05= (+0.13) - (0.00016*S) – (0.191*C) –(0.00085*T) + (4.18E-07*S2 )
+(0.182*C2)+(5.894*10-06*T2) (2)
where L = Load, S = Speed, C = Concentration and T = Temperature
The variation of COF and SWR with concentration of nanoparticles and other factors(3D
and contour plots) are as shown in Fig. 3 and 4 respectively. It can be seen thatthe COF
and SWR is minimum at a concentration between 0.35 and 0.7 weight percentage(wt%)
of the nanoparticles in the lubricant. The effect of load is almost linear in both caseswith
a minimum variation between its low and high values.
Fig. 3 Influence of concentration of nanoparticles and load on COF of the
nanolubricant
Fig. 4 Influence of concentration of nanoparticles and load on SWR of the
nanolubricant
The significance of theconcentration of nanoparticles in the lubricant on COF and SWR
can be verified from theircorresponding plots. The contour plot helps in accurate
interpretation of the varioussignificant values.Finally, the optimization of the
concentration of MoS2 nanoparticles in the preparedcoconut oil based lubricant for
maximum efficient performance is achieved using desirabilityfunction. The values of

NatioPro
onal Seminar oceedings: 35on ‘Trends an
5th IEI Nationand Developme
.
l Convention oents in Automo
of Mechanicaotive Industry
l Engineers any’ during Septe
nd ember 4 ‐ 5, 2019.
77
COF and SWR are at optimal minimum when the concentration ofMoS2 nanoparticles in
the lubricant is at 0.52 wt% with desirability of 94.6%.Based on the above, it can be
noted that the concentration of nanoparticles plays asignificant role in the friction and
wear behaviour of lubricants. The increase or decrease inthe quantity of nanoparticles
can drastically affect its efficiency. So their quantity should bemaintained at an
optimum level derived using desirability function. In addition, the effect ofspeed on COF
and SWR is found to be negligible from the ANOVA, regression analysis, 3Dsurface and
contour plots. Although, the load and temperature has a greater influence, theireffect is
linear and can be controlled by suitable measures. Overall, the reduction in frictionand
wear by the presence of MoS2 nanoparticles in the lubricant can be due to change
insliding to rolling motion of parts, tribo-film formation, filling of asperities.
Conclusions
The following conclusions are derived on the basis of the synthesis processes carried out
for preparation of MoS2 nanoparticles and the various surface morphology analyses
conducted on them:
MoS2 nanoparticles are synthesized by the solvothermal method. Particle size
varies from 40-100 nm & average sizes of the nanoparticles were found to be
68.46 nm.
Analyses of the synthesized nanoparticles were conducted using characterization
techniques such as EDS, XRD, and DLS. The uniform distribution of spherical
nanoparticles is proved using EDS analysis.
The Solvothermal method is proven to be a simple and cost-effective method for
the formulation MoS2 nanoparticles. The production cost of the synthesized
nanoparticles was found to be very economical compared to their market prices.
Nanolubricant is formulated (coconut oil with 0.5 wt %MoS2 nanoparticle
additive)
The ANOVA, regression analysis and normal probability plots proved the
credibilityof the model developed by employing RSM.
The analysis of experimental values of COF and SWR obtained using pin-on-disk
tribometer conducted by BBD method confirmed that the effect of speed on both
the factors considered was insignificant. The most significant parameter was
found to bethe concentration of MoS2 nanoparticles in the lubricant.

NatioPro
onal Seminar oceedings: 35on ‘Trends an
5th IEI Nationand Developme
.
l Convention oents in Automo
of Mechanicaotive Industry
l Engineers any’ during Septe
nd ember 4 ‐ 5, 2019.
78
The optimized concentration of MoS2 hybrid nanoparticles for minimum value
ofCOF and SWR determined using desirability function was 0.52 wt% of the
lubricant.
Acknowledgment
We would like to convey our heartfelt gratitude to Centre for Engineering Research and
Development (CERD), Trivandrum for providing the financial assistance for this
initiative.
References
1. L. Rapoport, Y. Feldman, M. Homyonfer, H. Cohen, J. Sloan, J.L. Hutchison, R. Tenne,
“Inorganic fullerene-like material as additives to lubricants: structure–function relationship”,
Wear 225–229 (1999) 975–982.
2. L. Rapoport, V. Leshchinsky, I. Lapsker, Y. Volovik, O. Nepomnyashchy, M. Lvovsky, R.
Popovitz-Biro, Y. Feldman, R. Tenne, “Tribological properties of WS2 nanoparticles under
mixed lubrication”, Wear 255 (2003) 785–793.
3. H.D. Wang, B.S. Xu, J.J. Liu, D.M. Zhuang, “Characterization and anti-friction on the solid
lubrication MoS2 film prepared by chemical reaction technique”, Sci. Tech. Adv. Mater. 6
(2005) 535–539.
4. Y. S. Zhang, L. T. Hu, J. M. Chen, and W. M. Liu, “Lubrication behavior of Y-TZP/Al2O3/Mo
nanocomposites at high temperature,” Wear, vol. 268, pp. 1091–1094, 2010
5. Philip JT, Koshy CP. Synthesis and characterization of ceria, ceria-zirconia hybrid and surfactant-modified
hybrid nanoparticles for lubricant applications.
6. Koshy, Chacko Preno, P. K. Rajendrakumar, and Manu V. Thottackkad. "Experimental Evaluation of the Tribological Properties of CuO Nano-Lubricants at Elevated Temperatures." Proceedings of International
Conference on Advances in Tribology and Engineering Systems. Springer, New Delhi, 2014.
7. Koshy CP, Rajendrakumar PK, Thottackkad MV. Analysis of Tribological and Thermo-Physical Properties
of Surfactant-Modified Vegetable Oil-Based CuO Nano-Lubricants at Elevated Temperatures-An
Experimental Study. Tribology Online. 2015 Nov 15;10(5):344-53.
8. Kadantsev, Eugene S., and PawelHawrylak. "Electronic structure of a single MoS2 monolayer." Solid State Communications 152.10 (2012): 909-913.
9. [24] Scalise, Emilio, et al. "Strain-induced semiconductor to metal transition in the two-dimensional
honeycomb structure of MoS2." Nano Research 5.1 (2012): 43-48.
10. Sahoo RR, Biswas SK (2014) Effect of layered MoS2 nanoparticles on the frictional behavior and
microstructure of lubricating greases. TribolLett 53:157

NatioPro
onal Seminar oceedings: 35on ‘Trends an
5th IEI Nationand Developme
.
l Convention oents in Automo
of Mechanicaotive Industry
l Engineers any’ during Septe
nd ember 4 ‐ 5, 2019.
79
11. GuangpingZh, Jianlin S, Bing W, Yizhu W (2011) Study on tribological properties of the rolling fluid
containing nano-MoS2 for cold rolling of steel strip. China Petro Proc Petrochem Technol 13(1):64–69
12. Praveena M, Jayaram V, Biswas SK (2012) Friction between a Steel Ball and Steel Flat Lubricated by
MoS2 Particles Suspended in Hexadecane at 150°C. IndEngChem Res 51:1232
13. Kogovsˇek J, Remsˇkar M, Kalin M (2013) Lubrication of DLCcoated surfaces with MoS2 nanotubes in all
lubrication regimes: surface roughness and running-in effects. Wear 303:361
14. Chacko Preno Koshy, Perikinalil Krishnan Rajendrakumar, Manu Varghese Thottackkad, “Evaluation of
the tribological and thermo-physical properties of coconut oil added with MoS2 nanoparticles at elevated
temperatures”, Wear, 2015, 330-331, pp, 288-308.

NatioPro
onal Seminar oceedings: 35on ‘Trends an
5th IEI Nationand Developme
.
l Convention oents in Automo
of Mechanicaotive Industry
l Engineers any’ during Septe
nd ember 4 ‐ 5, 2019.
80
A Review of Heat Transfer Studies on Hydrogen Fuelled Internal Combustion Engines
Siddharth S S and Karthick S
Department of Mechanical Engineering, Amrita School of Engineering,
Amrita Vishwa Vidyapeetham Amritanagar, Ettimadai, Coimbatore, Tamil Nadu – 641112
Abstract
The transportation sector generates the largest share of greenhouse gas emissions by burning fossil
fuels. These activities lead to the increase in the air pollution which also increases the global
temperature. Many alternative fuels have been experimented to replace the fossil fuels, one of the
alternative being Hydrogen. Hydrogen fuelled internal combustion engines offer the potential of
near zero greenhouse gas emissions. Due to this, design and development of hydrogen based
internal combustion engines is important. Designing the hydrogen fuel based internal combustion
engines varies drastically from the fossil fuels based internal combustion engines. One of the vital
factor which needs to be addressed during the engine development is Heat Transfer studies in the
Internal Combustion Engines. The heat loss is a major limiting factor for the efficiency of internal
combustion engines. The heat flux to the fossil fuel based engine's surface varies from zero to as
high as I0 MW/m2 and back to zero again in less man 10 msec. The flux also varies dramatically
with position and varies cycle-to-cycle. This adds to the complexity of modeling the heat transfer in
engines. This research article is a review of various literature dealing with the study and modeling
of heat transfer during the design and development of hydrogen fueled internal combustion
engines.
Keywords: hydrogen, internal combustion engine, heat transfer, measurement methods, design
and development
References
1. MirkoBovo (2014) "Principles of Heat Transfer in Internal Combustion Engines from a Modelling standpoint", Doctoral Thesis, Department of Applied Mechanics, Chalmers University of Technology,Sweden.
2. Fayaz, H., Saidur, R., Razali, N., Anuar, F. S., Saleman, A. R., & Islam, M. R. (2012). "An overview of hydrogen as a vehicle fuel." Renewable and Sustainable Energy Reviews, 16(8),5511–5528.
3. Verhelst, S., Verstraeten, S., &Sierens, R. (2007). "A comprehensive overview of hydrogen engine designfeatures."
4. Proceedings of the Institution of Mechanical Engineers, Part D: Journal of Automobile Engineering, 221(8), 911–920.

NatioPro
onal Seminar oceedings: 35on ‘Trends an
5th IEI Nationand Developme
.
l Convention oents in Automo
of Mechanicaotive Industry
l Engineers any’ during Septe
nd ember 4 ‐ 5, 2019.
81
Effect of Diethyl Ether on LHR Engine Characteristics of a using Papaya Methyl Ester‐Eucalyptus Oil Blend
C.Sivakandhan1, R.Silambarasan2, I.Satyanarayana3, P.Vijay Kumar4 and M.V.B.Kalyan5 1,3,4,5.Department of Mechanical Engineering, Sri Indu Institute of Engineering and Technology, Hyderabad.
2Department of Mechanical Engineering, J.K.K.Nattraja College of Engineering and Technology, Kumarapalayam.
Abstract :
The present experiment deals the study of addition of diethyl ether on the performance and
emission characteristics of LHR engine using papaya methyl ester-eucalyptus oil blends. The test
blends are CPME30Eu70 (Carica papaya methyl ester 30% and Eucalyptus oil 70%),
CPME30Eu70+10%DEE and diesel. The optimum results we get with presence of DEE in
CPME30Eu70 in LHR engine. The presence of DEE creates a lean mixture and its low viscosity,
high cetane number and volatility improves performance for a large degree. The graph depicts
that addition of 10% diethyl ether gives the best performance in BSEC, BSFC, BTE and emission
wise when coupled with LHR engine. Most notably NOx emission rate is decreased by the presence
of the DEE and BSFC is brought under acceptable limit. BSEC decreases in CPME30Eu70+10%
DEE and betters the performance of diesel in conventional engine. It also said to improve the cold
flow properties of the CPME-eucalyptus oil blend
Keywords: Diethyl ether; Papaya methyl ester; LHR; emission and combustion characteristics
1. Introduction
With the Paris Agreement behind us, There has been increasing awareness of climate
change, which will create an atmosphere very open to research and preventive measures
regarding climate change, even at the cost of national interests. If the Agreement’s
ambitious vision of reducing the temperature increase to 2% is to become a reality, it
would largely depend on how we deal with usage of fossil fuels and especially of the
transportation sector. The world still depends on fossil fuels for 88% of its energy. And
though in recent years there has been an increase in production of biodiesels, it has also
been a time of simultaneous increase in the consumption of fossil fuels. Any substantial
improvement in this regard has to come by the aid progressive governmental policies to
fund research and possible subsidies on biodiesel production. With the creeping of far-
right parties in Western Europe and a president of a country, which accounts for one-
fifth of emissions, having anti-environmental policies, we have legitimate reasons to be

NatioPro
onal Seminar oceedings: 35on ‘Trends an
5th IEI Nationand Developme
.
l Convention oents in Automo
of Mechanicaotive Industry
l Engineers any’ during Septe
nd ember 4 ‐ 5, 2019.
82
concerned. Climate change is quite evident with 2016 being named the hottest year ever
[1-3]
Research for alternative fuels is not something new. It is as old as the engine itself. It
seems Rudolph Diesel operated the engine using peanut oil in 1900s. Much has changed
though since. After 1920s, Fossil fuel was made readily available, cheaper with
governments playing a positive part promoting it. Because of availability of fossil fuels,
the use of vegetable oils declined and went into oblivion. Until 1970s oil embargo
imposed by OPEC, the need for alternate fuel sources was not taken seriously. Now the
problem lied in the fact the engines were designed for running fuels with high volatility
and low viscosity. Straight Vegetable oils which have characteristically high viscosity
and low heating value was not suited for to be used in the engines.
Biodiesel also known as FAME (fatty acid methyl ester) is created from oil extracted
from animal and vegetable fats. The biodiesel production primarily depends on source.
The source is in accordance with both availability and economy. The most common
source of vegetable oils is plants of jatropha, rapeseed, mustard, cotton, neem etc.
Western Europe was a leader in cultivation of crops for biodiesel, because of ambitious
government policies from respective governments. Lately we have seen others
challenging this hegemony, with Asia closing the gap by accounting for 28% in 2010.
Biodiesel have properties very near to that of diesel. Hence it can be utilized without
even changing the engine design. Types of production of biodiesel are pyrolysis, micro-
emulsification, supercritical production and transesterificaton. The most powerful
method of production of Biodiesel is transesterificaton, because of its good conversion
rate. It is done by reacting triglyceride of the base oil with alcohol in the presence of
catalyst at high temperatures [4-10].
On running biodiesel on standard engine, research has shown a decrease in emissions of
CO, unburned HC, and soot formation except for NOx. There is a slight increase in bsfc
and a relatively smaller decrease in full load power. This researchers have attributed to
the presence of oxygen in biodiesel, which gives complete combustion and to that to the
almost absence of sulphur content gives good emission characteristics [13-16]

NatioPro
onal Seminar oceedings: 35on ‘Trends an
5th IEI Nationand Developme
.
l Convention oents in Automo
of Mechanicaotive Industry
l Engineers any’ during Septe
nd ember 4 ‐ 5, 2019.
83
LHR engines are engine which are supplied with ceramic coating of cylinder chamber
wall and head long with inlet and exhaust valve. The idea is to decrease the heat lost
through chamber walls to the cooling system will be available heat inside the cylinder to
be converted in to useful work. This also increases the thermal efficiency of the engine
[17, 18]
The main reason behind the NOx emission rates is the presence of oxygen and
temperature. Higher the temperature and oxygen content, higher is the NOx emission
rate. This is the main reason behind its increase in biodiesel and LHR engine with its
characteristics oxygen content and high combustion chamber wall temperature.
Researchers have tried to reduce NOx emissions by altering injection timing of both
diesel and LHR engines using biodiesel with varied success [24-26].
The performance, emission characteristics can be changed by changing the operation
conditions or changing the fuel properties. Fuel properties can be changed by adding
chemical additives. Anti-oxidant additives such as DEE are added to reduce NOx
formation inside the cylinder. Several researches have been done on performance of
LHR engine but not extensively. Some of them slight improvements in NOx [27-34]. R.
Senthil et al. reports that DEE when added with blends of biodiesel-eucalyptus oils
(B20E70DEE10) have properties very near that of diesel [29].
The authors humbly hope that the present experiment adds to existing scholarship and
assists further study. The present experiment deals the effect of DEE on the
performance, combustion and emission characteristics of LHR engine using papaya
methyl ester-eucalyptus oil blends. The test blends are CPME30Eu70 with and without
10% DEE and diesel as reference fuel.
2. Concept and Procedure
2.1 Biodiesel and its production
To improve the engine performance, modifications can be done either in the engine
design or the fuel characteristics. The change in diesel engine design is not feasible and
might be expensive. Hence modifying the fuel properties, so that it is compatible with
the engine design is the commonly held position. Biodiesel fits these criteria perfectly.
Biodiesel are long chain methyl esters derived from edible resources such as animal and

NatioPro
onal Seminar oceedings: 35on ‘Trends an
5th IEI Nationand Developme
.
l Convention oents in Automo
of Mechanicaotive Industry
l Engineers any’ during Septe
nd ember 4 ‐ 5, 2019.
84
vegetable fats. The absolute decrease in sulphur content and increase in oxygen content
helps in reducing harmful emissions and gives complete combustion. The viscosity is
brought near acceptable limits for the diesel engine Vegetable oil, which has very low
calorific value and high viscosity is not suited for diesel engine. These vegetable oils are
converted into biodiesel by processes like pyrolysis, micro-emulsification or
transesterificaton. Of which transesterificaton has the highest rate of conversion
complimented by an relatively simple process. Fuels are usually composed of HC and
other impurities such as sulphur, dust etc. By changing the structure of these HC and
its position, fuel properties are altered. Transesterification the triglyceride structure of
HC of oils, derived from animal and vegetable fats, is treated with alcohol in the
presence of a catalyst. The alcohol used usually is methanol, ethanol or butanol. For the
biodiesel to be renewable, it is necessary that the alcohol used is also renewable.
Catalyst can be of acid, alkali or lipase. The one we have used for our purpose is an
alkali catalyst. The end product is layer of methyl ester and glycerine. Glycerine is
removed, and then water content is removing to attain biodiesel. The one we have used
for our purpose is an alkali catalyst. Carica Papaya is usually found in parts of India,
South America, Mexico and Indonesia. Tropical climates favour its production. They are
growing as tall as 10m. The size of the seeds that it contains is very small. Vegetable oil
is extracted by using conventional mechanical screw type expellers. Papaya methyl ester
is reacted with methanol in a ratio (5:1). 0.5% of sodium hydroxide is used as catalyst.
The mixture is heated for 2 hours at around 70oC and 80oC. As the fractional
distillation, the papaya methyl ester is removed after of glycerine. It has methyl oleate
and methyl linoleate as major contents, with composition of around 65% and
20%..Aromatic and other unstable compounds are almost non-existent.
2.2 Eucalyptus oil
Eucalyptus trees can be found in tropical and temperate climate. Oil distilled from
leaves of eucalyptus, of which there is many times, is known commonly as eucalyptus
oil. These have high heating value, a low viscosity and agreeable flash point. The
drawback lies in it having a very low cetane number, which will result in poor starting
characteristics. This can be compensated by blending it with biodiesel. Blend, it seems
gives properties very near to that of diesel.

NatioPro
onal Seminar oceedings: 35on ‘Trends an
5th IEI Nationand Developme
.
l Convention oents in Automo
of Mechanicaotive Industry
l Engineers any’ during Septe
nd ember 4 ‐ 5, 2019.
85
2.3 LHR engine
An engine coated with insulating ceramic material inside combustion chamber walls is
called LHR engine. In a standard engine, of the heat released by the fuel one-third is
converted into useful work. Of the remaining heat release half goes as EGT and the
remaining passes through the cooling system. By using thermal barrier coating inside
the cylinder, we can enhance BTE which depends primarily on engine design and
introduce the ability to use fuels with low cetane rating. This is the case because of
increased in-cylinder temperature, which will result in shortening of ignition delay. It
enhances fuel economy. The BTE is better, but not drastic. LHR results in increase in
EGT. The standard diesel engine is converted into LHR (low heat rejection) engine by
plasma spray method. The coating is applied on the inner cylinder chamber wall, piston
head, chamber head and inlet and exhaust valves. The coating is of two layers: bond coat
and the thermal barrier coat. Over the substrate a bond coat is applied, over which the
thermal barrier coating is applied. The bond coat is used to relax thermal stresses
between the substrate and thermal barrier coat.
2.4 DEE
An engine is also filled with additives. Additives it is combustion of numerous chemical
it is used to improve the performance of the engine. The additives will help to overcome
the limitations of the biodiesel fuel such as the properties like density, toxicity, viscosity,
auto ignition, cetane number and flash point. The additives protect the engine from
corrosion. The types of additives are metal based additive, oxygenated additives, ethers,
antioxidants and fuel dyes. In the metal based it is used as catalytic effect., by using this
the emission is reduced and the reason is metal react with water vapour to form
hydroxyl and react with carbon atom so that the discharging of the oxidation of
temperature is formed .the oxygenated additives useful for the combustion process and
cetane rating. The cetane number is for minimizing the ignition delay.
3. Experimental setup
The testing engine is a kirloskar tv1 model single cylinder four stroke water-cooled
diesel engine developing 5.2 kW at a speed of 1500 rpm. Thermal barrier coating of PSZ
is applied on the cylinder head, combustion chamber wall, piston head and on the
surface of inlet and outlet valves. The specifications of the engine mentioned below in
the Table 1. This engine is directly coupled and connected to an AG10 model water

NatioPro
onal Seminar oceedings: 35on ‘Trends an
5th IEI Nationand Developme
.
l Convention oents in Automo
of Mechanicaotive Industry
l Engineers any’ during Septe
nd ember 4 ‐ 5, 2019.
86
cooled eddy-current dynamometer (MakeSaj Test Plant Pvt.Ltd.) with a control system.
Lab view based Engine Performance Analysis software package “EnginesoftLV” is used
for on line performance evaluation. There is a orifice meter where there is surge tank
placed on the inlet side of an engine is to maintains constant air flow. The exhaust
temperature is measured by using a thermocouple, which is a K type thermocouple in
conjunction with a digital temperature indicator. The fuel flow rate is measured on
volume basis using a burette and stop watch. On the basis of NDIR (non-dispersive
infrared) selective absorption principle by using the AVL 444 DI gas analyzer the
exhaust gas emission HC (hydro carbon), CO (carbon monoxide), CO2 (carbon dioxide)
and NOX (oxides of nitrogen) has been measured from the engine. AVL 444 DI gas
analyzer technical specification is given in Table 2. By using AVL437C smoke meter the
smoke level is measured. And the smoke emission is measured based on principle of
light extinction wherein, the amount of light blocked by the sample of exhaust gas from
the engine.
Table 1. Specification of engine design
Sl. No Details specifications
1 Type
Four stroke, kirloskar make, Compression ignition, Direct injection and water cooled
2 Rated power & speed 5.2 kW & 1500 rpm
3 Number of cylinder Single cylinder
4 Compression ratio 17.5: 1
5 Bore & stroke 87.5 mm & 110 mm
6 Method of loading Eddy current dynamometer
7 Dynamometer arm length 0.185 m
8 Type of injection Mechanical pump-nozzle Injection
9 Inlet valve opening 4.5 ° before TDC
10 Inlet valve closing 35.55 ° after TDC
11 Exhaust valve opening 35.55 ° before BDC
12 Exhaust valve closing 450 after TDC
13 Injection timing 230 after TDC
14 Injection pressure 220 bar
15 Lubrication oil SAE40

NatioPro
onal Seminar oceedings: 35on ‘Trends an
5th IEI Nationand Developme
.
l Convention oents in Automo
of Mechanicaotive Industry
l Engineers any’ during Septe
nd ember 4 ‐ 5, 2019.
4. Test
The en
Initiall
blends
minute
engine
current
engine
constan
conditio
conditio
reading
results
engine
the fue
for 10 m
by usin
oxides
pipe lin
ting proce
ngine perfor
y the engin
after 20 m
es to get sta
was loade
t supplied
the rack p
nt speed is
on and al
on. The ex
gs were tak
. At last of
was kept r
l line and t
minutes bu
ng smoke m
of nitrogen
ne and it is
edure
rmance ma
ne was per
minutes. W
able conditi
ed from 0 k
to the edd
position of f
maintaine
so when t
xperiments
ken, and us
f the engine
running fo
the injectio
ut value is t
meter. The c
n these are
analyzed b
aintained c
rformed us
When, the
ion with th
kg to15 kg
dy current
fuel pump
ed as 1500
the engine
s are repe
sed for calc
e test, the f
r a while b
on system.
taken at th
carbon mon
the exhau
b exhaust g
Table 2. Bef
87
constant wi
sing diesel
fuel is ale
he new fuel
progressiv
Dynamom
is adjusted
rpm. The r
e was stab
ated for th
culations to
fuel was sw
before shut
The data h
he last 4 mi
noxide, car
st gases wh
gas analyze
fore Transes
ithout any
and then i
erted the e
l before me
vely in step
meter. Duri
d to regulat
readings ha
bilized and
hree times
o increase t
witched bac
t-down to f
have been c
inutes. The
rbon dioxide
hich have b
er.
sterification
y modificati
it was late
engine was
easurement
ps of 3 kg
ing the loa
te the supp
ad been re
d has attai
s and aver
the efficien
ck to stand
flush out th
collected in
e smoke cap
e, un burnt
been taken
n:
ion on the
er used by
run for ab
ts were tak
by controll
ad changes
plied fuel so
corded at a
ined stead
rage value
ncy of the o
dard diesel
he test fu
n which eng
pacity is me
t hydrocarb
n from the e
engine.
bio fuel
bout 10
ken. The
ling the
s in the
o that a
ambient
dy state
e of the
obtained
and the
uel from
gine run
easured
bon and
exhaust

NatioPro
onal Seminar oceedings: 35on ‘Trends an
5th IEI Nationand Developme
.
l Convention oents in Automo
of Mechanicaotive Industry
l Engineers any’ during Septe
nd ember 4 ‐ 5, 2019.
88
Sl. No Properties Diesel Papaya oil Eucalyptus oil
1 Density @ 150C (kg/m3) 840 910 895.5
2 Kinematic viscosity @ 400C (Cst) 2.9 36 2
3 Flash Point (oC) 54 162 58
4 Fire point (oC) 64 280 64
5 Gross heating value (kJ/kg) 42700 41570 43270
6 Cetane number 49 60 18
Table 3. After Transesterification:
Sl. No Properties Diesel Papaya oil Eucalyptus oil
1 Density @ 150C (kg/m3) 840 867 713
2 Kinematic viscosity @ 400C (Cst) 2.9 4.5 0.23
3 Flash Point (oC) 54 152 -45
4 Fire point (oC) 64 158 -
5 Gross heating value (kJ/kg) 42700 42000 33900
6 Cetane number 49 63 49
4.1Test fuels
Fuel properties where measured by standard ASM methods. Table 2 and 3 shows the
fuel properties before and after transesterificaton. The sole biodiesel blend being used is
CPME30Eu70. Eucalyptus oil and CPME have mutual complimenting properties.
Eucalyptus oil has high calorific value but a low cetane index, which dents its cold flow
properties, whereas CPME has a good cetane number. DEE will be added for only 10%
of the total quantity of the blend. DEE has low viscosity, good volatility. This improves
cold flow properties and gives better atomization and better combustion. DEE is an
oxygenated additive but moreover because of cold flow properties it might bring down
Nox emission rate.
5. Result and discussion
5.1 Brake Specific Energy Consumption
The Figure 2 shows the variation of BSEC with respect to brake power for
CPME30Eu70 and neat diesel in LHR and standard CI engine. Brake specific energy
consumption measures the amount of input energy required to develop 1 kilowatt power.

NatioPro
onal Seminar oceedings: 35on ‘Trends an
5th IEI Nationand Developme
.
l Convention oents in Automo
of Mechanicaotive Industry
l Engineers any’ during Septe
nd ember 4 ‐ 5, 2019.
89
It tries to show how efficiently fuel energy content has been converted into power. Now,
the factors that might affect the BSEC are density, viscosity, heating value of the fuel
employed and volumetric fuel injection system. Generally in LHR engine, BSEC is
reduced because of decrease in ignition delay caused by high in-cylinder temperature. At
full load condition, BSEC for CPME30Eu70 added with 10% DEE is 11.5 kg/kw.hr,
which is lesser than all other testing conditions. The BSEC for CPME30Eu70 with
added 10% DEE, which is run in LHR engine, is 4% lesser compared to that for diesel
run in conventional engine, this is because of the better combustion process resulting
from addition of DEE. This might be also attributed to high energy content of the fuel
because of high calorific value of eucalyptus oil.
Fig.2 Shows variation of BSEC with brake power
5.2 Brake Specific Fuel Consumption
The Figure 3 shows the variation of BSFC with respect to brake power for
CPME30Eu70 and neat diesel in LHR and standard CI engine. The BSFC is the amount
of fuel consumed for generating 1kW of power per unit hour per kg. The graph indicates
that BSFC decreases with increase in load. It can be seen that fuel consumption is less
for diesel compared to other fuels. This is because of higher calorific value of diesel
compared to other fuels. Of the five tests LHR CPME30Eu70 added with 10% DEE and
LHR diesel have the best BSFC rates. At full load, LHR CPME30Eu70 added with 10%
DEE exhibits BSFC which is 6%, 13% and 14.5% lesser than that of LHR diesel, diesel
in conventional engine and CPME30Eu70 in conventional engine. DEE added to
0
5
10
15
20
25
30
0 1 2 3 4 5
DIESELCPME30EU70LHR DIESELLHR CPME30E70LHR CPME30EU70+10%DEE
BP(kW)
BSEC (kg/kW.hr)

NatioPro
onal Seminar oceedings: 35on ‘Trends an
5th IEI Nationand Developme
.
l Convention oents in Automo
of Mechanicaotive Industry
l Engineers any’ during Septe
nd ember 4 ‐ 5, 2019.
90
CPME30Eu70 decreases the BSFC because of its higher volatility, which speeds up the
mixing velocity of fuel air mixture and results in good combustion process.
Fig.3 Shows variation of BSFC with brake power
5.3 Brake Thermal Efficiency
The Figure 4 shows the variation of BTE with respect to brake power for CPME30Eu70
and neat diesel in LHR and standard CI engine. Off the total heat energy generated by
the chemical reaction of the fuel is, in a conventional engine, (1) 1/3rd passes as heat
transfer through combustion chamber walls; (2) 1/3rd flows through exhaust gas as
exhaust gas temperature and the remaining (3) 1/3rd is utilized as work. This is the case
irrespective of the fuel used. By changing the fuel the fuel economy can be improved but
not BTE. Improvement in BTE can be brought by only engine design modification. The
LHR engine because of its ceramic coating helps in reducing heat loss through cooling
medium and it results in increasing fuel energy utilization. At full load, the LHR
CPME30Eu70 with added 10% DEE has thermal efficiency of 32.9%, which is 1.2%,
2.73%, 7.3% and 10.3% greater than LHR CPME30Eu70, LHR diesel, diesel and
CPME30Eu70 in standard engine respectively. DEE has lower kinematic viscosity,
which when mixed with CPME30 helps in better atomization and mixing of fuels which
will decrease ignition delay and has a positive effect (though negligible) in BTE.
0
0.1
0.2
0.3
0.4
0.5
0.6
0.7
0.8
0.9
0 1 2 3 4 5
DIESEL
CPME30Eu70
LHR DIESEL
LHR CPME30Eu0
LHR CPME30Eu70+10%DEE
BP(kW)
BSFC(kg/kW
.hr)

NatioPro
onal Seminar oceedings: 35on ‘Trends an
5th IEI Nationand Developme
.
l Convention oents in Automo
of Mechanicaotive Industry
l Engineers any’ during Septe
nd ember 4 ‐ 5, 2019.
91
Fig.4 Shows variation of BTE with brake power
5.4 Exhaust Gas Temperature
The Figure 5 shows the variation of EGT with respect to brake power for CPME30Eu70
and neat diesel in LHR and standard CI engine. The EGT is an indication of heating
capacity of the fuel used and also the engine design. Usually 1/3rd of the heating
capacity comes out as EGT. In LHR, EGT increases considerably because of the decrease
in heat transfer through combustion chamber walls. The graph shows clearly that in a
conventional engine EGT is low when compared to LHR engines. At full load condition,
the EGT of CPME30Eu70 with added 10% DEE used in LHR engine is 415oC which is
1.2%, 3.6%, 8.4%, 12% higher than LHR CPME30Eu70 and diesel, CPME30Eu70 and
diesel in a conventional engine respectively. The addition of DEE seems to increase the
peak cylinder temperature and hence has higher EGT than others
Fig.5 Shows variation of EGT with brake power
0
5
10
15
20
25
30
35
0 1 2 3 4 5
DIESELCPME30Eu70LHR DIESELLHR CPME30E70
BP(kW)
BTE (%)
0
50
100
150
200
250
300
350
400
450
0 1 2 3 4 5
DIESEL
CPME30Eu70
BP(kW)
EGT (�C)

NatioPro
onal Seminar oceedings: 35on ‘Trends an
5th IEI Nationand Developme
.
l Convention oents in Automo
of Mechanicaotive Industry
l Engineers any’ during Septe
nd ember 4 ‐ 5, 2019.
92
5.5 CO emission
The Figure 6 shows the variation of CO emission rate with respect to brake power for
CPME30Eu70 and neat diesel in LHR and standard CI engine. CO is an intermediate
combustion product that is formed, mainly because of incomplete combustion. At the
completion of the combustion process, CO2is formed. This is caused because of lack of
oxygen and low gas temperature. So at lean gas mixtures the CO emission will be low.
This is why biodiesel have remarkably low CO emission characteristics; the abundant
oxygen content available in the fuel improves the combustion process. It can be seen
from the graph that diesel because of relatively lower oxygen content observes high CO
emission rates on both standard and LHR engine. At full load, CO emission rate for
CPME30Eu70 with added 10% DEE is 20% and 42% less than diesel in LHR and
conventional engine respectively. CPME30Eu70 with added 10% DEE in LHR engine
shows the optimum results because DEE creates a relatively lean mixture with low
viscosity suited for improved atomization and combustion of the fuel.
Fig.6 Shows variation of CO emission with brake power
5.6 HC emission
The Figure 7 shows the variation of UHC emission rate with respect to brake power for
CPME30Eu70 and neat diesel in LHR and standard CI engine. The fuel used for
combustion is largely composed of HC (hydrocarbons) structure and other impurities.
These fuels need oxygen content with sufficient temperature and pressure to mix with
air supply. It should be also noted that air-fuel mixture in CI engine is heterogeneous,
0
0.05
0.1
0.15
0.2
0.25
0.3
0.35
0.4
0 1 2 3 4 5
DIESEL
CPME30Eu70
LHR DIESEL
LHR CPME30Eu70
LHR CPME30Eu70+10%DEE
CO(%
)
BP(kW)

NatioPro
onal Seminar oceedings: 35on ‘Trends an
5th IEI Nationand Developme
.
l Convention oents in Automo
of Mechanicaotive Industry
l Engineers any’ during Septe
nd ember 4 ‐ 5, 2019.
93
which there both lean mixture and rich mixture portions are of fuel content in the
engine. At lean mixture portions the HC emission is low and vice versa for rich mixture
portions. From the chart it is clearly discerned that diesel in both conventional engine
and LHR engine have high UHC emissions. In general with increasing load the HC
emission rate increases. At the full load condition, LHR CPME30Eu70 added with 10%
DEE has only 37 ppm for HC emission, which is 32% less than that for diesel in
conventional engine.
Fig.7 Shows variation of HC emission with brake power
5.7 NOx emission
The Figure 8 shows the variation of NOx emission rate with respect to load for various
test fuels in LHR and conventional engine. The oxygen doesn’t readily react with
nitrogen to form NOx. It is a endothermic reaction, and hence high temperature is
required to form NOx. The graph shows in general that the NOx emission rate increases
with increasing load. DEE addition relatively decreases the NOx emission in
CPME30Eu70. This is because DEE acts as a cooling agent. At full load condition, diesel
exhibits NOx emission, when run by standard diesel engine, of 800 ppm which is lesser
than LHR CPME30Eu70 by 21.2%. DEE slightly decreases the NOx emission for LHR
CPME30Eu70 with added DEE by 9.2% compared to CPME30Eu70 run on LHR engine
without DEE.
0
10
20
30
40
50
60
0 1 2 3 4 5
DIESEL
CPME30Eu70
LHR DIESEL
BP(kW)
HC (ppm)

NatioPro
onal Seminar oceedings: 35on ‘Trends an
5th IEI Nationand Developme
.
l Convention oents in Automo
of Mechanicaotive Industry
l Engineers any’ during Septe
nd ember 4 ‐ 5, 2019.
94
Fig.8 Shows variation of NOx emission with brake power
5.8 Smoke emission
The Figure 9 shows the variation of smoke opacity with respect to brake power for
CPME30Eu70 and neat diesel in LHR and standard CI engine Smoke emission is an
indication of incomplete combustion. CPME has absolutely no sulphur content and has
more lean mixture portions of the fuel, this is the reason behind the lower smoke
emission compared to diesel. DEE exists in gaseous form in room temperature with a
flash point of merely -45oC. This leads again to an increase in the smoke emissions in
the presence of high in-cylinder temperature of LHR engine. This is why at full load
condition, LHR CPME30Eu70 added with 10% observes an increase in smoke opacity of
7% compared to CPME30Eu70 run in standard engine.
Fig.9 Shows variation of smoke with brake power
0
200
400
600
800
1000
1200
0 1 2 3 4 5
DIESEL
CPME30Eu70
LHR DIESEL
LHR CPME30Eu70
LHR CPME30Eu70+10%DEE
BP(kW)
NOx (ppm)
0
10
20
30
40
50
60
0 1 2 3 4 5
DIESELCPME30Eu70LHR‐DIESELLHR‐CPME30Eu70LHR‐CPME30Eu70+10DEE
BP(kW)
SMOKE (HSU
)

NatioPro
onal Seminar oceedings: 35on ‘Trends an
5th IEI Nationand Developme
.
l Convention oents in Automo
of Mechanicaotive Industry
l Engineers any’ during Septe
nd ember 4 ‐ 5, 2019.
95
6. Conclusion
The present study arrives at the conclusion, confirming the previous scholarship, that
diethyl ether can be added as a fuel property improver in biodiesel as a replacement for
fossil fuels. That being further investigation on the formation of emissions while using
DEE and its possible side effects has to be done. Some of the highlighting conclusions
are
NOx emission rate while using diethyl ether decreased the emission by 90ppm
when compared to blend without diethyl ether.
BSFC, BSEC performance while using diethyl ether is better than diesel. This is
attributed to physical properties of diethyl ether, which improves cold flow
properties and atomization because of low viscosity and good cetane number.
CO and HC emission is 32% (absolute terms) and 42% lesser than diesel
emission.
References
1. Lin Lin, Zhou Cunshan, SaritpornVittaapadung, ShenXiangqian and Dong Mingdong. Opportunities and challenges for biodiesel fuel. AppliedEnergy, 88, 2011, 1020-1031.
2. MaginLapuerta, Octavio Amas, Jose Rodriguez-Fernandez. Effect of biodiesel fuels on diesel engine emissions. Progress in Energy and Combustion Science, 34, 2008, 198-223.
3. LakshmananSingaram. Biodiesel - An eco-friendly alternative fuel for the future – A Review. Thermal Science, Vol. 13, 2009, No. 3, pp. 185-199.
4. Adriana Gog, Marius Roman, Monica Toşa, CsabaPaizs and Florin Dan Irimie. Biodiesel production using enzymatic transesterificaion – Current State and perspectives. Renewable Energy, 39, 2012, 10-16.
5. Mehdi Atapour, Hamid –Reza Kariminia. Characterization and transesterification of Iranian bitter almond oil for biodiesel production. AppliedEnergy, 88, 2011, 2377-2381.
6. PurnanandVishwanathraoBhale, Nishikant . Deshpande, Shashikant B. Thombre. Improving the low temperature properties of biodiesel fuel. Renewableenergy, 34, 2009, 794-800.
7. AlemayehuGashaw, TewodrosGetachew and AbileTeshita. A Review on Biodiesel Production as Alternative Fuel. Journal of Forest Products and Industries, 2015, (2), 80-85.
8. Deepak Verma, Janmit Raj, Amit Pal and Manish Jain. A critical review on production of biodiesel from various feedstocks. Journal of Scientific and Innovative Research, 2016, 5(2), 51-58.
9. Avinash Kumar Agarwal. Biofuels (alcohols and biodiesel) applications as fuels for internal combustion engines. Progress in Energy and Combustion Science, 33, 2007, 233-271.

NatioPro
onal Seminar oceedings: 35on ‘Trends an
5th IEI Nationand Developme
.
l Convention oents in Automo
of Mechanicaotive Industry
l Engineers any’ during Septe
nd ember 4 ‐ 5, 2019.
96
10. WuttichaiRoschat,TheeranunSritanon, BoonawanYoosuk, TaweesakSudyoadsuk and VinichPromarak. Rubber seed oil as potential non-edible feedstock for biodiesel production using heterogeneous catalyst in Thailand. Renewable Energy, 101, 2017, 937-944.
11. B.P. Singh. Performance and emission characteristics of conventional engine running on jatropha oil. Journal of Mechanical Science and Technology, 27(8), 2013, 2569-2574.
12. OrhanArpa, RecepYumrutas and OnderKaska. Desulfurization of diesel-like fuel produced from waste lubrication oil and its utilization on engine performance and exhaust emissions. Applied Thermal Engineering, 58, 2013, 374-381.
13. Md. NurunNabi, Md. Mustafizur Rahman and Md. Shamim Akhter. Biodiesel from cotton seed oil and its effect on engine performance and exhaust emissions. Applied Thermal Engineering, 29, 2009, 2265-2270.
14. N.R. Banapurnath, P.G. Tewari and R.S. Hosmath. Performance and emission characteristics of a DI compression ignition engine operated on Honge, Jatropha and sesame oil methyl ester. Renewable Energy, 33, 2008, 1982-1988.
15. K. Suresh Kumar, R. Velraj and R. Ganesan. Performance and exhaust emission characteristics of a CI engine fueled with Pongamiapinnata methyl ester (PPME) and its blends with diesel. Renewable Energy, 33, 2008, 2294-2302.
16. N. Saravanan, SukumarPuhan, G. Nagarajan and B. RajendraPrasath. An experimental investigation on mahua oil (madhuacaindica oil) methyl and ethyl ester as a renewable fuel for diesel engine system. Proceedings of the 19th National Conference on I.C. Engines and Combustion, Annamalai University, Chidambaram. Dec21-23, 2005. pp. 65-69.
17. M.J. Abedin, H.H. Masjuki, M.A. Kalam, A. Sanjid, A.M. Ashraful. Combustion, performance and emission characteristics of low heat rejection engine operating on various biodiesels and vegetable oils. Energy Conversion and Management, 85, 201,173-189.
18. B. RajendraPrasath, P.Tamilporai and Mohd. F. Shabir. Analysis of combustion, performance and emission characteristic of low heat rejection engine using biodiesel. International Journal of Thermal Science, 9, 2010, 283-2490.
19. R. Senthil, E. Siakumar, R. Silambarasan and G. Mohan. Performance and emission characteristics of a low heat rejection engine using Nerium biodiesel and its blends.International Journal of Ambient Energy, DOI: 10.1080/0130750.2015.1076517
20. N.Venkateshwara Rao, M.V.S. Murali Krishna and P.V.K. Murthy. Investigation on performance parameters of ceramic coated diesel engine with tobacco seed oil biodiesel. International Journal Of Advances in Engineering and Technology, Nov. 2013, Vol. 6, Issue 5, pp.2286-2300.
21. M.V.S. Murali Krishna, N. DurgaPrasada Rao, A. Anjeneya Prasad and P.V.K. Murthy.Performance Evaluation of Rice Brown Oil in Low Grade Low Heat Rejection Diesel Engine. International Journal of Engineering and Science. ISSN: 2278-721, Vol. 1, Issue 5 ( October 2012), PP1-12.

NatioPro
onal Seminar oceedings: 35on ‘Trends an
5th IEI Nationand Developme
.
l Convention oents in Automo
of Mechanicaotive Industry
l Engineers any’ during Septe
nd ember 4 ‐ 5, 2019.
97
22. Can Hasimoglu, Murat Ciniviz, Ibrahim Ozsert, YakupIcingur, Adnan Parlak and M. Sahir Salman. Performance characteristics of a low heat rejection diesel engine operating with biodiesel. Renewable Energy, 33, 2008, 1709-1715.
23. HanbeyHazar and UgurOzturk. The effects of Al2O3-TiO2 coating in a diesel engine on performance and emission of corn oil methyl ester. Renewable Energy, 35, 2010, 2211-2216.
24. EkremBuyuukkaya and MuhammedCerit. Experimental study of NOx emissions and injection timing of a low heat rejection diesel engine. International Journal of Thermal Science, 47, 2008, 1096-1106.
25. Adnan Parlak, HalitYasar, Can Hasimoglu and AhmetKolip. The effects of injection timing on NOx emissions of a low heat rejection indirect diesel injection engine. Applied Thermal Science, 25, 2005, 3042-3052.
26. T. Ganapathy, R.P. Gakkhar, K.Murugesan. Influence of injection timing on performance, combustion and emission characteristics of Jatropha oil. Applied Energy, 88, 2011, 4376-4386.
27. M. Mohamed Mushtafa. Synthetic lubrication oil influences on performance and emission characteristic of coated diesel engine fuelled by biodiesel blends. Applied Thermal Engineering, 96, 2016, 607-612.
28. H.K. Rashedul, H.H. Masjuki, M.A. Kalam, A.M. Ashraful, S.M. Ashrafur Rahman and S.A. Shahir. The effect of additives on properties, performance and emission of biodiesel fuelled compression ignition engines. Energy Conversion and Management, 88, 2014, 348-364.
29. R. Senthil, E. Sivakumar and R. Silambarasan. Effect of diethyl ether on the performance and emission characteristics of a diesel engine using biodiesel-eucalyptus oil in blends. RSC Adv., 2015, 5, 54019.
30. D.H. Qi, H. Chen, L.M. Geng and Y.Z. Bian. Effect of diethyl ether and ethanol additives on the combustion and emission characteristics of biodiesel –diesel blended fuel engine. Renewable Energy, 36, 2011, 1252-1258.
31. Amr Ibrahim. Investigating the effect of using diethyl ether as a fuel additive on diesel engine performance and combustion. Applied Thermal Engineering, 107, 2016, 853-862.
32. Obed Ali, RizwanaMamat, H.H. Masjuki, Abdul Adam Abdullah. Analysis of blended fuel properties and cycle-to-cycle variation in a diesel engine with a diethyl ether additive. Energy Conversion and Management, 108, 2016, 511-519.
33. S.Imtenan, H.H. Masjuki, M. Varman, M.I. Arbab, H.Sajjad, I.M. Rizwanul Fattah, M.J. Abedin and Abu Saeed Md. Hasib. Emission and performance improvement analysis of biodiesel-diesel blends with additives. Procedia Engineering, 90, 2014, 472-477.
34. Effect of Butanol addition on performance and emission characteristics of a DI diesel engine fueled with pongamia-ethanol blend. International Journal of ChemTech Research, 2015, Vol. 8, No. 2, pp 59-67.

NatioPro
onal Seminar oceedings: 35on ‘Trends an
5th IEI Nationand Developme
.
l Convention oents in Automo
of Mechanicaotive Industry
l Engineers any’ during Septe
nd ember 4 ‐ 5, 2019.
98
Progressive Damage Characterization of Biaxial Glass Fiber Reinforced Epoxy Composites
H Muralidhara and Dr. R Suresh
Department of Industrial Automation Engineering, VTU P.G Studies, VTU, VTU PG Centre, Mysuru‐570029
Email: [email protected]
Abstract:
The objective of the work was to investigate bi-axial characteristics of composite materials with
cruciform geometry in both experimental and numerical techniques. The glass reinforced fibers
with epoxy composites prepared by hand lay-up technique with various stacking sequences such as
0°/90°, 45°/45°, 15°/75° and 30°/60°. The fabricated composites were machined in cruciform
shape, having different notches namely circular, square and rhomboidal according to ASTM –
D6856 standard by abrasive water jet machining to ensure dimensional accuracy of ± 0.1mm. The
prepared cruciform specimens were tested using a biaxial fixture developed indigenously by taking
the specifications of universal testing machine. The Young’s modulus, proof stress, ultimate tensile
strength and fracture toughness were evaluated for 16 specimens of different fibre orientations and
notches using software.. The response from the biaxial tensile test showed highest stress
developing in [0/90] GFRP composites of 61.37 MPa with highest ultimate tensile strength of
71.93 MPa experimentally. Numerical simulation with ANSYS was showing maximum stresses
developing in [0/90] GFRP composites 65.37 MPa.
Keywords: Biaxial tensile test, GFRP, Youngs modulus, Numerical analysis.
Introduction
Polymer composites having high strength to weight ratio along with cost effective nature
showing better performance than conventional material such as Aluminium,
increasingly used in aerospace, marine industries, automotive, research and
development sector etc. [1].In general, laminates in composites exposed to in plane
forces or out-plane forces in a range of application such as uniaxial or biaxial loading,
twisting or bending moment. Need of biaxial testing with application in real structures
showing higher performance than uniaxial testing becauseDesign engineer requires a
multi axial experimental data for designing structure and generally composites
structure in real working condition are subjected to biaxial/multi-axial loading
conditions so performance showing in uniaxial condition will not give approximate
results as compared to biaxial loading conditions[2-3]. This suggests that finding

NatioPro
onal Seminar oceedings: 35on ‘Trends an
5th IEI Nationand Developme
.
l Convention oents in Automo
of Mechanicaotive Industry
l Engineers any’ during Septe
nd ember 4 ‐ 5, 2019.
99
strength of new material in composites which contains many research areas in previous
studies[4]. Considering various research on finding mechanical properties of new
material like elastic strength, hardness etc. have been made showing immense practice
in variety sector like aerospace ,marine, R&D industries[6-7].
To derive from complex stress state leads to give an understanding of advanced
composite materials, showing importance of studying behaviour of structures under
multi axial loading conditions precisely. Taking well-known biaxial or multi-axial test is
not at all straight forward process which may require expensive experimental setup for
performing that test and there are large techniques available for in plane and out-plane
loading[8-9]. Studies concerning the multi axial loading condition have been poorly
assumed by experimental data just because difficulty in fabricating and modelling of
complex test specimen as well as exposing them to such loading conditions need
expensive multi axial loading machines. Any integration of tensile-tensile stress in a 2D
stress state can be generated in biaxial stress test. The significance of biaxial test is that
its configuration of fixture can be employed with singleset up prepared on any uniaxial
material system machine[10-12]. The main objective of this project was to perform
biaxial tensile test and study the biaxial behaviour of cruciform shaped composites with
and without notches. It includesfabrication of glass / epoxy composites with different
fibre orientations (0/90, 15/75, 30/60, 45/-45) anddevelopment of biaxial test rig.
Experimental Study
Epoxy resins are thermoset resins which are widely used for easy fabrication of several
complicated parts. In this work LY556 (Bisphenol-A-Diglycidyl-Ether) epoxy resin was
chosen for its good quality for fabrication of GFRP composite. The HY-951(Tri-ethylene
Tetramine) hardener is a curing agent to be properly mixed with LY 556 epoxy resin.
Both the epoxy resin and hardener procured from the market.
Epoxy resins are thermoset resins which are widely used for easy fabrication of several
complicated parts. In this work LY556 (Bisphenol-A-Diglycidyl-Ether) epoxy resin was
chosen for its good quality for fabrication of GFRP composite. The HY-951(Tri-ethylene
Tetramine) hardener is a curing agent to be properly mixed with LY 556 epoxy resin.
Both the epoxy resin and hardener procured from the market. In this work, S-glass

NatioPro
onal Seminar oceedings: 35on ‘Trends an
5th IEI Nationand Developme
.
l Convention oents in Automo
of Mechanicaotive Industry
l Engineers any’ during Septe
nd ember 4 ‐ 5, 2019.
100
woven fibres were taken as the reinforcement material for fabrication of cruciform
specimens. For fabrication of woven GFRP composite hand lay-up technique is chosen.
Fig 1 Used for simulation and analysis (i) cruciform specimen without notches (ii) circular notch (iii) square notch (iv) rhomboid notch
(a)
(b)
(c)
(d)
Fig 2. 1Load vs. deflection curves of specimen of orientation 0/90 and for different notches and fiber oreinttiona) 45/45, b) 15/75, c)0/90 & d) 30/60.

NatioPro
onal Seminar oceedings: 35on ‘Trends an
5th IEI Nationand Developme
.
l Convention oents in Automo
of Mechanicaotive Industry
l Engineers any’ during Septe
nd ember 4 ‐ 5, 2019.
101
During biaxial tensile experiments the specimens are set-up in biaxial retrofittine with
followed by a procedure which is followed during the experiment and explained below.
This experimental procedure is undertaken with proper care and leading to successful
experimentation. Gripper plate which is placed between cruciform specimen and H block
of gripper, that is locked by nut and bolt assembly and tightened by LN key. Sandpaper
is also used in gripper below the gripper plate for giving better friction to cruciform
specimen so that slipping of specimen from gripper will be avoided or small rubber wrap
can be used.Then all arms of a test H-bar is attached by not and bolt assembly and then
the retrofit is gently placed in UTM machine.
Experimental and FE Study
To study numerical analysis is approached for FRP composites in biaxial tensile loading.
It includes study of material behavior for different fiber orientations as well as various
notched cruciform specimens shown in Fig. 1. The macro-mechanics analysis of woven
epoxy/glass composites is used to compute stress analysis and stress concentration
factor. This analysis estimates in ANSYS and Modelling of specimen for different
notches is done by Solid-works. In this analysis composite specimen is layered with
desired thickness and fibre orientation in worksheet. Mesh concept is used before
structural analysis of specimens.They are subjected with equal loads in 3 directions and
one edge is fixed to perform successful simulation.`
Result and Discussion
Load and deflection data for all cruciform specimens which was subjected to biaxial
tensile experiment in UTM is plotted in graphs for different notches and fibre
orientations. Regressions models are taken for measurement of properties of woven
glass/epoxy composites. The readings from UTM are subjected to graphs which are
shown in below figure. These curves are manipulated with approximate polynomial
graph having similar characteristics. By considering curve fitting method i.e. “Least
Square Technique” these characteristics equation is established. From below graphs
blue and red curves are shown which shows approximate characteristics and actual
characteristics of woven glass/epoxy composite in biaxial tensile experiment. From these
graphs behaviour of specimens with respect to fibre orientation and with respect to
notches can be analysed. From above curves load vs. deflection are plotted until failure

NatioPro
onal Seminar oceedings: 35on ‘Trends an
5th IEI Nationand Developme
.
l Convention oents in Automo
of Mechanicaotive Industry
l Engineers any’ during Septe
nd ember 4 ‐ 5, 2019.
102
of specimen. In this graphs it is seen that initially it is behaving linear until peak then
showing nonlinear behaviour till failure. Circular notches among all the notches is
showing highest load bearing capacity against deformations and square notch is
showing maximum deformation at failure.
From Fig. 2(a) are plotted until failure of specimen. In this graphs it is seen that
initially it is behaving linear until peak then showing nonlinear behaviour till failure.
Circular notches among all the notches is showing highest load bearing capacity against
deformations and square notch is showing maximum deformation at failure.
From Fig. 3(b) are plotted until failure of specimen. In this graphs it is seen similar way
as before that initially it is behaving linear until peak then showing nonlinear behaviour
till failure. Circular notches among all the notches is showing highest load bearing
capacity against deformations and square notch is showing maximum deformation at
failure.
From Fig.3(c) are plotted until failure of specimen. In this graphs it is seen similar way
as before that initially it is behaving linear until peak then showing nonlinear behaviour
till failure. Circular notches among all the notches is showing highest load bearing
capacity against deformations and square notch is showing maximum deformation at
failure.
From Fig 3(d) are plotted until failure of specimen. In this graphs it is seen similar way
as before that initially it is behaving linear until peak then showing nonlinear behaviour
till failure. Circular notches among all the notches is showing highest load bearing
capacity against deformations and square notch is showing maximum deformation at
failure.
Effect of stress concentration factor
Fig. 3(a) shows notchless cruciform specimen is subjected to biaxial loading where one
edge is fixed. Stack sequence is given as 0/90 with 6 layers to get 0.88mm thickness. It
is observed that fillet edges are subjected to high stress zone where crack will propagate.
This is generating 65.941 MPa of stresses with same load, material property and size as
per experimental conditions.

NatioPro
onal Seminar oceedings: 35on ‘Trends an
5th IEI Nationand Developme
.
l Convention oents in Automo
of Mechanicaotive Industry
l Engineers any’ during Septe
nd ember 4 ‐ 5, 2019.
Fig. 3(
where
thickne
will pr
propert
specime
Fig. 3(
where
thickne
will pr
propert
specime
Fig. 3(d
edge is
is obser
This is
per exp
Fi
b) shows c
one edge is
ess. It is ob
ropagate. T
ty and siz
en.
c) shows r
one edge is
ess. It is ob
ropagate. T
ty and size
en.
d) square n
fixed. Stac
rved that fi
generating
perimental
ig. .2 (a) Equ
circular no
s fixed. Sta
bserved tha
This is gen
e as per e
rhombus n
s fixed. Sta
bserved tha
This is gen
e as per exp
notched cru
ck sequence
illet edges a
g 75.476 M
conditions
uivalent stre c) Rhombus
otched cru
ack sequen
at fillet edg
nerating 67
experiment
notched cru
ack sequen
at fillet edg
nerating 70
perimental
uciform sp
e is given a
are subject
Mpa of stres
which is h
103
ess of 0/90s and d) squa
ciform spe
ce is given
ges are sub
7.941 Mpa
tal conditio
uciform spe
ce is given
ges are sub
0.476 Mpa
conditions
ecimen is
as 0/90 wi
ted to high
sses with sa
higher than
a) notch-lesare specimen
ecimen is s
n as 0/90
bjected to h
of stresse
ons which
ecimen is
n as 0/90
bjected to h
of stresse
s which is h
subjected t
ith 6 layers
stress zone
ame load, m
rhomboid
ss , b) circulan
subjected t
with 6 laye
high stress
es with sam
is higher
subjected t
with 6 laye
high stress
es with sam
higher than
to biaxial l
s to get 0.8
e where cra
material pr
notched sp
ar,
to biaxial
ers to get 0
zone wher
me load, m
than un-n
to biaxial
ers to get 0
zone wher
me load, m
n circular n
loading wh
88mm thick
ack will pro
roperty and
pecimen.
loading
0.88mm
re crack
material
notched
loading
0.88mm
re crack
material
notched
here one
kness. It
opagate.
d size as

NatioPro
onal Seminar oceedings: 35on ‘Trends an
5th IEI Nationand Developme
.
l Convention oents in Automo
of Mechanicaotive Industry
l Engineers any’ during Septe
nd ember 4 ‐ 5, 2019.
104
As it is discussed about effect of stress concentration factor in numerical calculation
using equation no stress concentration factor is calculated shown in Fig. 4. SCF value of
woven GFRP is changing with increase in fibre orientation of laminates. This is also
changing with notch geometry of specimen. Then this is validated with finite element
analysis. Effect of stress concentration factor in cruciform specimen is shown through
numerical simulation. It is observed that square notch is giving lesser stress
concentration effect, then followed by rhombus and square notch in cruciform specimen
is getting high stress concentration effect.
Fig. 4. Comparison of theoretical to FEA of stress values
To validate experimental results from biaxial tensile test numerical simulation has done
which is shown in chapter5. Numerical results from simulation are changing with
respect to fibre orientation of composite laminates. In numerical simulation same load
is applied to cruciform specimen under biaxial loading with notches (circular, square,
rhombus) and without notch. As expected, stresses are coming higher at stress
concentration zone area i.e. central zone area of cruciform specimens. It is observed that
notched specimen is creating lesser stress than notched specimen. Though central zone
area is larger in un-notched specimen it is giving lesser stress than others.
In numerical simulation it is observed that woven fibre-glass /epoxy composite with
0°/90 fibre orientation yields high strength when compared to 45°/-45 of orientations
for the same load, size & shape. Stresses are being generated less in un-notched

NatioPro
onal Seminar oceedings: 35on ‘Trends an
5th IEI Nationand Developme
.
l Convention oents in Automo
of Mechanicaotive Industry
l Engineers any’ during Septe
nd ember 4 ‐ 5, 2019.
105
specimen and square notched specimen is giving higher stress than other notches. This
analysis from theoretical to FEA is giving 4to5% error.
Conclusion
It is concluded that biaxial behaviour of woven GFRP composite via FEA was validated
with experimental results with (4-5) % error which was an acceptable percentage of
error with same size, property and load. It was observed that woven glass/epoxy
composite with 0°/90 fibre orientation was yielding high strength and 45°/-45 of
orientation was giving least strength. It was also concluded that stress concentration
value was showing lesser effect on circular notches then rhomboid notches and then
square notches. From morphological studies it was observed that failed specimen was
contributing mechanism of failure with various kinds of damages in fibre-matrix
interface. So the biaxial tensile rig which helped to successfully complete this project
work can be adapted to any kind of material not only composites.
References
1. Welsh J.S., Mayes J.S. and Biskne A.C., 2-D Biaxial Testing and Failure Predictions of
IM7/977-2 Carbon/Epoxy Quasi-Isotropic Laminates, Composite Structures, Vol. 75, (2006)
No. 1-4, pp. 60-66,.
2. Rashedi A., Sridhar I., K.J. Tseng b– “Fracture characterization of glass fiber composite
laminate under experimental biaxial loading”, School of Mechanical and Aerospace
Engineering, Nanyang Technological University, composite structures 138, (2016) pp 17-29,
Singapore 639798.
3. Smits A., Van Hemelrijcka D., Philippidisb T.P. and Cardona A., Design of a Cruciform
Specimen for Biaxial Testing of Fibre Reinforced Composite Laminates, Composites Science
and Technology, vol. 66, 7-8, (2006) pp. 964-975.
4. Andrusca L, Goanta V, P D Barsanescu and R Steigmann, “Numerical and experimental
study of cruciform specimens subjected to biaxial tensile test” Materials Science and
Engineering 147 (2016) 012091, Mechatronics and Robotics Department, National Institute
of R&D for Technical Physics, Iasi, Romania.
5. K KMahato, M Biswal, D K Rathore, R K Prusty, K Dutta, B C Ray, “Effect of loading rate on
tensile properties and failure behavior of glass fibre/epoxy composite”, Composite Materials
Group, Materials Science and Engineering 115 (2016), 012017, Metallurgical and Materials
Engineering Department, National Institute of Technology, Rourkela-769008, India.
NatioPro
onal Seminar oceedings: 35on ‘Trends an
5th IEI Nationand Developme
.
l Convention oents in Automo
of Mechanicaotive Industry
l Engineers any’ during Septe
nd ember 4 ‐ 5, 2019.
106
6. H. Kumazawa and T. Takatoya, “Biaxial Strength Investigation of CFRP Composite
Laminates by Using Cruciform Specimens” Airframes and Structures Group, Japan
Aerospace Exploration Agency 6-13-1,(2012), Ohsawa, Mitaka, Tokyo, JAPAN 181-0015
7. A. Barroso, E. Correa, J. Freire, M.D. Pérez, F. París, “Biaxial Testing Of Composites In
Uniaxial Machines”: European Conference on Composite Materials, Venice, Italy, 24-28 June
(2012), School Of Engineering, University Of Seville, Camino De Los Descubrimientos S/N
41092 Sevilla.
8. M. Brieu, J. Diani, “A New Biaxial Tension Test Fixture for Uniaxial Testing Machine- a
Validation for Hyper elastic Behaviour of Rubber-Like Materials” Published in Journal of
Testing and Evaluation (2007) vol. 35(4) pp. 1-8, Department of Mechanical Engineering,
Indian Institute of Technology – Delhi, New Delhi 110016, India.
9. Luis Fernando Puente Medellina, Jose Angel Diosdado De la Penaa, “Design of a biaxial test
module for uniaxial testing machine” Departamento de IngenieríaMecánica , (2017) 7911–
7920 Universidad de Guanajuato, Salamanca, GTO36885, México.
10. Yong Yu, Min Wan, Xiang-Dong Wu, Xiang-Bin Zhou, “Design of a cruciform biaxial tensile
specimen for limit strain analysis by FEM” school of mechanical engineering and automation
, received 26 February (2001), Beijing university of aeronautics and astronautics, P. O. Box
703, 37 Xueyuan Road, HaidianDistrcit, Beijing100083, and P R China.
11. D V Hemelrijck, A Makris, C Ramult, “Biaxial testing of fiber-reinforced composite
laminates”, Journal of Materials: Design and Application, Vol. 222 Part L, (2007), pg. 209-
218.
12. A. Escárpita1, H. Elizalde, R.A.Ramírez, E. Ledezma, S.T.Pinho, “Modified Cruciform
Specimen for Biaxial Testing of Fibre-Reinforced Composites” Composites: Part A 37 (2006)
165–176.

NatioPro
onal Seminar oceedings: 35on ‘Trends an
5th IEI Nationand Developme
.
l Convention oents in Automo
of Mechanicaotive Industry
l Engineers any’ during Septe
nd ember 4 ‐ 5, 2019.
107
Synthesis, Characterization and Production of ABS Material Blended with Recyclable Material used in Automotive Industry
S.Ponsuriyaprakash1 and P.Udhayakumar2
1Research Scholar, Department of Mechanical Engineering, KLN College of Engineering, Pottapalayam.
[email protected] 2Professor & Head of the Department, Department of Mechanical Engineering, KLN College of Engineering,
Pottapalayam. [email protected]
Abstract
In Automobile Industry, Plastics play 66% of their role in Production. The current economic and
environmental needs are the use of modern materials like aluminum and carbon fiber, but the
wise allocations of plastics are making an increasing difference in automobile industry and the
light weight of plastics makes for more fuel efficient vehicles. On those plastics, Acrylonitrile-
Butadiene-Styrene (ABS) is a durable thermoplastic, resistant to weather and some chemicals. It
is a rigid plastic with rubber like characteristics having high impact and energy absorption
properties and itredistribute energy during an impact. Therefore, the role of ABS in Automobile
Industry is more pronounced. On the other hand, ABS is mostly used in the Additive
manufacturing technology on the process of Fused Deposition Modeling (FDM) as a principal
material. Therefore, Incorporating AM technology in automotive industry will be the next stage in
production. By using FDM, ABS could be made into wide variety of service parts in automotive
industry, but such wide spread application needs specific performance enhancements as
demanded by the various usage conditions. The objective of this research is the enhancement of
mechanical and metallurgical properties of ABS by synthesizing with compatible recyclable
materials for use in FDM.
Keywords: Automotive Engineering, ABS Material, FDM Machine, Additive Manufacturing,
1.Introduction
The present investigation on ABS material is to blended with an Cellulose i.e.,
Recyclable and Bio-degradable material which enhance themechanical, metallurgical
characterization and their properties. ABScomposited with cellulose in the form of wire
(1.75mm dia) for the purpose of Fused deposition modeling (FDM)Additive
Manufacturing technology. It could be used in all automobile, aero, marine and
mechanical spare parts or secondary components. Here comes the followings are the
objectives of this research,

NatioPro
onal Seminar oceedings: 35on ‘Trends an
5th IEI Nationand Developme
.
l Convention oents in Automo
of Mechanicaotive Industry
l Engineers any’ during Septe
nd ember 4 ‐ 5, 2019.
108
To fabricate a number of cellulose based ABS composites with different weight
percentages (wt. %) of Matrix and filler reinforcement materials by using
polymer dissolution and mold casting method were used for the fabrication of
cellulose based ABS composite materials. Here, ABS is used as the base matrix
material, recyclable material is the primary reinforcement.
To perform mechanical (tensile, flexural), metallurgical (SEM, XRD, EDX),
thermal and thermo gravimetric analysis of the ABS composite materials.
To identify and optimize the ABS composite materials based on above mentioned
analysis.
To fabricate the optimized ABS composite materials with the form of 3d printing
wire for the application of automobile spare parts and secondary parts
production.
Therefore in Automobile industry, ABS with Cellulose composites helps the body to
absorb and redistribute energy during an impact and keeping passengers safe and it
gives good impact resistance. Producing these blended composites with biodegradable
materials will give rise to non-expensive, natural, renewable materials with a piece of no
negative impacts on the environment.
2. Materials and Methods
2.1 Bonding Material Identification
By means of several literature review, which are the materials are having blending
properties with ABS could be absorbed is studied. After the survey the Cellulose is
selected as a primary reinforcement because of their blending properties and their
thermal stability and also based on easy availability, environment friendly, cost wise
lower than other materials and the cellulose available on powder form it makes easy to
mixture the materials.
2.3 Optimizing by Ratio of Mixing
Before it turns to solid manner, by tabulating the different ratios of adding cellulose
with ABS to find the best ratio for rich properties. The ratio of mixturing the ABS with
cellulose on the basis of ABS: Cellulose manner, the ratios taken as per kg of ABS and
the %of cellulose.
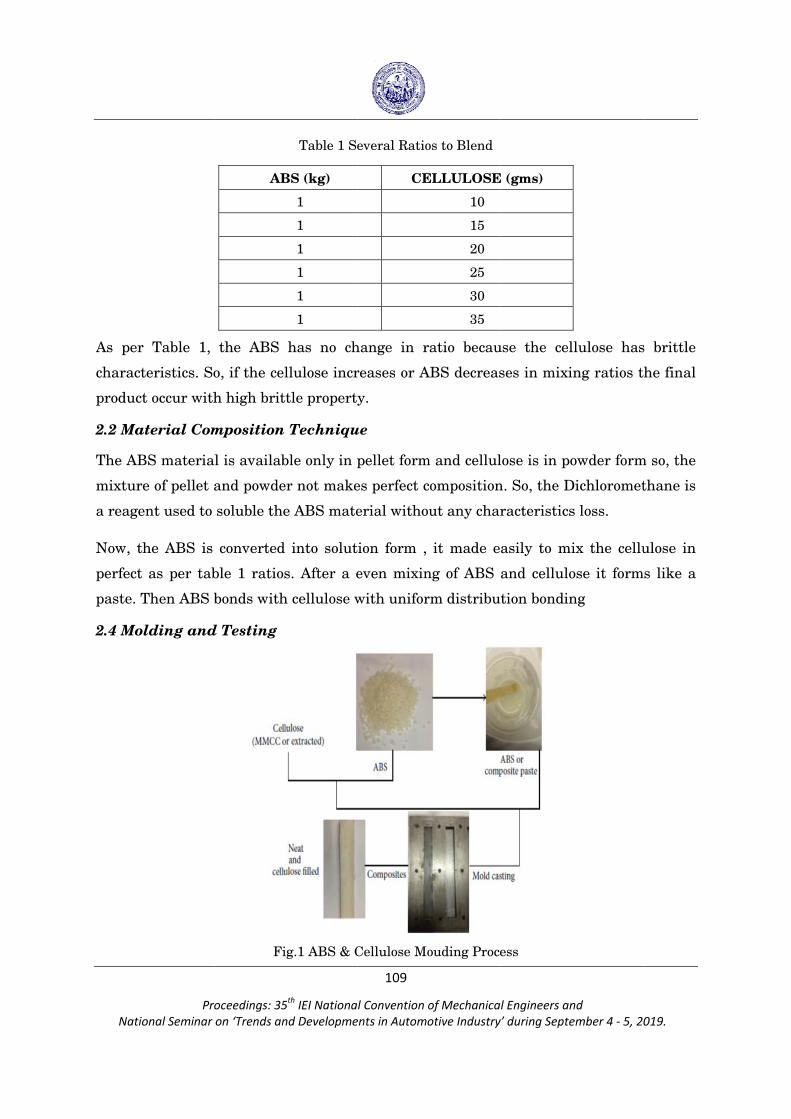
NatioPro
onal Seminar oceedings: 35on ‘Trends an
5th IEI Nationand Developme
.
l Convention oents in Automo
of Mechanicaotive Industry
l Engineers any’ during Septe
nd ember 4 ‐ 5, 2019.
As per
charact
product
2.2 Ma
The AB
mixture
a reage
Now, th
perfect
paste. T
2.4 Mo
r Table 1,
teristics. So
t occur with
aterial Com
BS materia
e of pellet a
ent used to
he ABS is
as per tab
Then ABS b
lding and
AB
the ABS
o, if the cel
h high britt
mposition
l is availab
and powde
soluble the
converted
ble 1 ratios
bonds with
d Testing
Fi
Table 1 Se
BS (kg)
1
1
1
1
1
1
has no ch
llulose incr
tle property
Techniqu
ble only in p
r not make
e ABS mate
into solut
s. After a e
h cellulose w
g.1 ABS & C
109
everal Ratio
CE
hange in r
reases or A
y.
ue
pellet form
es perfect c
erial withou
ion form ,
even mixin
with unifor
Cellulose Mo
os to Blend
ELLULOSE
10
15
20
25
30
35
atio becau
ABS decreas
m and cellul
composition
ut any char
it made e
ng of ABS
rm distribu
ouding Proce
E (gms)
use the cel
ses in mixi
lose is in po
n. So, the D
racteristics
asily to mi
and cellulo
tion bondin
ess
llulose has
ing ratios t
owder form
Dichloromet
s loss.
ix the cellu
ose it form
ng
s brittle
he final
m so, the
thane is
ulose in
s like a
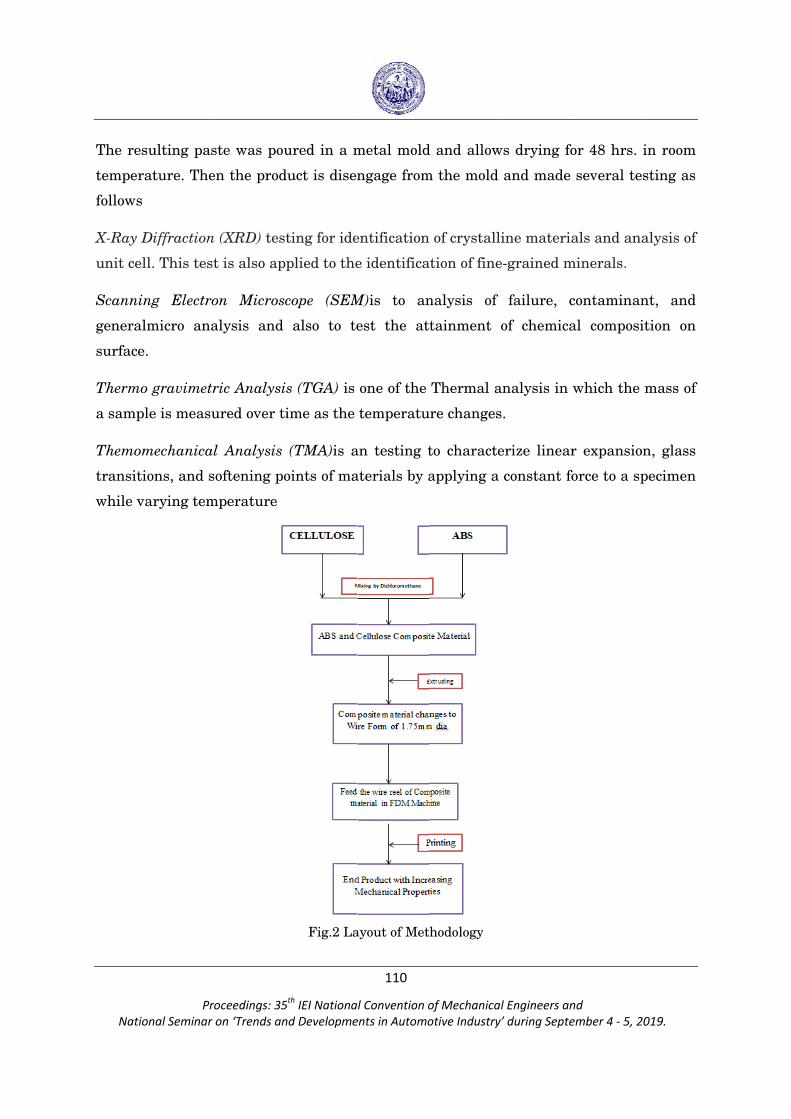
NatioPro
onal Seminar oceedings: 35on ‘Trends an
5th IEI Nationand Developme
.
l Convention oents in Automo
of Mechanicaotive Industry
l Engineers any’ during Septe
nd ember 4 ‐ 5, 2019.
The res
temper
follows
X-Ray D
unit cel
Scanni
general
surface
Thermo
a samp
Themom
transiti
while v
sulting pas
rature. The
Diffraction
ll. This test
ng Electro
lmicro ana
e.
o gravimetr
ple is measu
mechanical
ions, and s
varying tem
ste was pou
en the prod
n (XRD) test
t is also ap
on Microsc
alysis and
ric Analysi
ured over ti
l Analysis
oftening po
mperature
ured in a m
duct is disen
ting for ide
plied to the
cope (SEM
also to te
s (TGA) is
ime as the
(TMA)is a
oints of ma
Fig.2 La
110
metal mold
ngage from
entification
e identifica
M)is to an
est the at
one of the
temperatu
an testing t
aterials by a
ayout of Met
d and allow
m the mold
n of crystall
ation of fine
nalysis of
tainment
Thermal a
ure changes
to characte
applying a
thodology
ws drying fo
and made
ine materia
e-grained m
failure, c
of chemica
analysis in
s.
erize linear
constant fo
or 48 hrs. i
several tes
als and ana
minerals.
contaminan
al composi
which the
r expansion
force to a sp
in room
sting as
alysis of
nt, and
ition on
mass of
n, glass
pecimen

NatioPro
onal Seminar oceedings: 35on ‘Trends an
5th IEI Nationand Developme
.
l Convention oents in Automo
of Mechanicaotive Industry
l Engineers any’ during Septe
nd ember 4 ‐ 5, 2019.
111
2.5 Comparing samples with Existing Properties
After the above testing, we have to find which ratio withstand their best properties
among them all ratios mentioned in table1. Now the best ratio could be compared to
normal ABS mold and tabulate normal and existing ABS properties and Cellulose
bonded ABS properties.
2.6 Methodology of 3D printing
After all the process and finalized ratio could be again mouldedand crushed into pellet
formats. The fig.2 intimates the second half of research.
2.6 Extruding
Extruding is the process of making wire form for 3D printing by FDM process. The wire
is to be 1.75mm of dia. For making wire DIY method of 3D printer. The Fig.3 shows the
extruders construction and working principles.
Fig.3 DIY method of Filament Extruder
The hopper contains the ABS with cellulose composite pellets. With the help of motor
the shaft inhibits screw which gets pellets from hopper to heater. On heater the pellets
get melts and pushes out via 1.75mm diameter feed pipe. The feeding wire is make cool
and roll via feeder. Finaly the Wire reel looks like Fig.4.The colour ABS pellets makes a
reel also colorful.
Fig.4 ABS with Cellulose wire reel as 1.75 dia

NatioPro
onal Seminar oceedings: 35on ‘Trends an
5th IEI Nationand Developme
.
l Convention oents in Automo
of Mechanicaotive Industry
l Engineers any’ during Septe
nd ember 4 ‐ 5, 2019.
112
2.7 Additive manufacturing
The Additive manufacturing is also known as 3D printing and Rapid Prototyping too.In
additive manufacturing there are lot of process. Among those process FDM i.e, Fused
deposition modelling is wide range of using process .
Fused Deposition Modelling (FDM)is an process in which a physical object is created
directly from a computer-aided design (CAD) model using layer-by-layer deposition of a
feedstock ABS blended with cellulose filament material extruded through a nozzle.
Fig.5. FDM Process
With Cellulose having an effect of properties of ABS was not lowered, which is the great
quality of manufacturing.
3. Applications of ABS based composites in Automobiles
Front and Rear Bumpers in cars ,
Dashboard console,
Wing Mirror cover, Interior and some Exterior parts specially made on ABS,
Door Outer panel,
Spoiler,
Wheel Covers,
Radiator guard,

NatioPro
onal Seminar oceedings: 35on ‘Trends an
5th IEI Nationand Developme
.
l Convention oents in Automo
of Mechanicaotive Industry
l Engineers any’ during Septe
nd ember 4 ‐ 5, 2019.
113
Steering Wheel,
Etc.,
4. Conclusion
From this research, it is concluded that extraction and dryingprocedures of cellulose
have a dramatic effect on dispersion and thermal stability of polymer matrices. It also
discovered that polymer dissolution is a very useful technique for the improvement of
cellulose filled ABS composites.
References
1. K.Crews,C.Huntley,Influence of cellulose on Mechanical and thermal stability of ABS
composites,Inrenational Journal of Polymer science,2016
2. I. Vroman and L. Tighzert, “Biodegradable polymers,” Materials, vol. 2, no. 2, pp. 307–344,
2009.
3. R. J. Moon, A. Martini, J. Nairn, J. Simonsen, and J. Youngblood, “Cellulose nanomaterials
review: structure, properties and nanocomposites,” Chemical Society Reviews, vol. 40, no.
7,pp. 3941–3994, 2011
4. Jian Zhang,” Research on Thermostability of Flame-retardant PC / ABS-Blends with PyGC
“Procedia Engineering 135 (2016) 83 – 89.
5. R. MerijsMeri, J. Zicans , T. Ivanova, R. Berzina, R. Saldabola, R. Maksimovs,” The effect of
introduction of montmorillonite clay (MMT) on the elastic properties of polycarbonate (PC)
composition with acrylonitrile-butadiene styrene (ABS)” Contents lists available at Science
Direct
6. Nowadays most of the automotive parts are manufactured by FDM process only as per fig.5.
7. So, Plastics plays an main role in Automobile industry.

NatioPro
onal Seminar oceedings: 35on ‘Trends an
5th IEI Nationand Developme
.
l Convention oents in Automo
of Mechanicaotive Industry
l Engineers any’ during Septe
nd ember 4 ‐ 5, 2019.
114
Future Aspects of Automobile Industry
Er. Pravin V. Tembe, AMIE, CEng (India)
Proprietor of Tembe Competent Services, & Dy. Manager at Hallmark Boilers Pvt. Ltd., Baramati.
43B, BhikobaTambe Nagar, Bhigwanroad M.I.D.C., Baramati
Corresponding author’s email: [email protected]
Abstract:
Upcoming decade will be the golden decade in the future of automobile sector, in the world.
Various revolutions in automobile industries are carried out day by day. This paper is deals with
various concepts of future vehicle. Advance propulsion systems of Electric Vehicles (EVs), Water
Fueled Vehicles are discussed in this paper. Newly concept like driverless cars (self-driving cars)
& Flying Cars are also discussed in this paper. This paper is also highlights of new concept of Air
Fueled Vehicles. Effect on national economy & lifestyle of peoples are discussed in this paper.
Merits, demerits & challenges for researchers have been briefly discussed which is followed by
conclusion.
Keywords: Electrical Vehicles (EVs); Water Fueled Vehicles; Driverless Car; Flying Cars; Air
Fueled Cars.
Introduction
Now a day, India & rest of world is fighting against greenhouse effect & pollution.
Emission of greenhouse gases like CO & SO2 from automobiles is main cause of
greenhouse effect. Conventional fuels also have very limited resources on earth. This is
why non-conventional fuel system vehicles are required to be adopted. Adoption of
automobiles having advance propulsion system like EVs (electrical vehicles), water
fueled cars reduce emission of these greenhouse gases.
World is working on new advanced revolutionary cars like driverless cars & flying cars.
Preliminary tests on driverless car & flying cars have been successfully carried out. Now
days, we can make water from atmospheric air. Such water can be utilized in water
fueled vehicles & in this way we can run the vehicles in future on air. There is lot of
scope of research to develop air fuel cars.
Electrical Vehicles (EVs)
One of the solutions to reduce & control over greenhouse gases is accepting, launching &
adoption of electrical vehicles on road. Govt. of India planned to make infrastructure &
runs EVs on road by 2020.

NatioPro
onal Seminar oceedings: 35on ‘Trends an
5th IEI Nationand Developme
.
l Convention oents in Automo
of Mechanicaotive Industry
l Engineers any’ during Septe
nd ember 4 ‐ 5, 2019.
115
In coming days electric cars are going to run on Indian roads.
Electrotherm India Ltd. have already introduces electric scooters like YoBikes. Pune
based Tork Motors have introduced T6X e-bike. Atom Motors are famous for their e-
cycles which amplify pedaling & go faster.
India’s first electric bus was launched in Bengaluru in 2014 by BMTC. Ashok Leyland,
Tata Motors and M&M have already launched their electric & hybrid buses. They also
launched their mini pick-up trucks. Bengaluru is also famous for first electric taxi
services in country.
Indian railways have successfully tested solar panel mounted trains where power
generated will be used for fans & lights inside the train. GOI announced that entire rail
network in country will be electrified by 2022.
Types of Electric Vehicles: Main types of EVs are: (i) Battery Electric Vehicles (BEV) in
which only electric battery is used as an energy source. Here high traction powered
batteries are required & no use of IC engine, (ii) Plug in Hybrid Electric Vehicle (PHEV)
or Hybrid Electric Vehicles (HEV)where electric motor powered by battery, plug into
electric grid to charge, and use alternative fuel to run IC engine.
Primary Components:
Important components of electric cars shown in “Fig. 1”: (i) Battery, (ii) Power inverter,
(iii) Motor, (iv) BMS

NatioPro
onal Seminar oceedings: 35on ‘Trends an
5th IEI Nationand Developme
.
l Convention oents in Automo
of Mechanicaotive Industry
l Engineers any’ during Septe
nd ember 4 ‐ 5, 2019.
116
i. Battery: Lithium-Ion batteries are used to store DC charge. DC charging will
charge battery directly.
ii. Power Inverter: It converts DC to AC which is input of electric motor to drive the
vehicle.
iii. Electric Motor: High traction electric motor runs on AC is used to drive EV.
iv. Battery Management System (BMS) / Controller: It’s called as a brain of vehicle.
It manages charging & discharging of batteries. Every model of vehicle have
unique BMS controller.
Even though we are going towards bullet trains & EVs it is required to mentioned that
we are very far from global growth where world is using magnetic trains & marching
towards driverless cars, flying cars, water fuel & air fueled cars.
Water fueled vehicles:
Now days, world have concentrates on lot of research on this water fuel technology. As
name suggest water is used as fuel in these vehicles. Water is a compound of hydrogen
& oxygen. Water is electrolyzed to form H2 & O2 by means of electrolyzer. Electricity
from solar panel on vehicle or from battery is used to split water into H2 & O2, reaction
is shown in “Fig. 2”.
Electrolysis
2H2O 2H2 + O2
Brown’s gas is common ducted oxy-hydrogen; it can be produced in an electrolyzer as
shown in “Fig. 3”, below. Series cell parallel plate electrolyzer is most efficient common
ducted electrolyzer. Plates are made of stainless steel; it avoids corrosion due to water.
Both gases mixed to form Brown’s gas.

NatioPro
onal Seminar oceedings: 35on ‘Trends an
5th IEI Nationand Developme
.
l Convention oents in Automo
of Mechanicaotive Industry
l Engineers any’ during Septe
nd ember 4 ‐ 5, 2019.
When B
IC engi
liter Br
Brown
demand
greenh
getting
in heav
Driver
Driverl
science
vehicle
like Ta
deploy.
Brown’s ga
ine & in th
rown’s gas
gas is co
d. It is v
ouse effect
g success in
vy vehicles
rless Cars:
less cars a
e fiction bu
s does not i
ata Motors,
as get ignite
his way veh
which bur
onsumed im
very clean
t & byprod
n this type
like buses.
:
lso known
ut it is rea
involve any
Tesla, BM
e H2 get bu
hicle runs o
rns at low t
mmediately
fuel & gre
ducts othe
of propulsi
Hope we w
as autono
ady to com
y human in
MW, Merced
117
urned whil
on water fu
temperatur
y after pr
een techno
r than wa
ion system
will see this
omous cars
me into tru
nteraction,
des-Benz, G
le O2 burns
uel. One lit
re which in
oduction. H
ology as th
ater vapour
more deve
s in coming
s or self-dri
uth by inn
it can be ru
Google, and
s H2. Blast
ter water c
ncreases eff
Hence it p
here is no
r. Even th
elopment is
g decade.
iving cars,
novative te
un without
d Audi hav
t take plac
creates abo
fficiency of
produced o
formation
hough rese
s required t
these look
echnologies
t driver. Ind
ve system r
e inside
ut 1800
vehicle.
only on
of any
earchers
to use it
k like a
. These
dustries
ready to

NatioPro
onal Seminar oceedings: 35on ‘Trends an
5th IEI Nationand Developme
.
l Convention oents in Automo
of Mechanicaotive Industry
l Engineers any’ during Septe
nd ember 4 ‐ 5, 2019.
118
There is several systems that works together to control a driverless car as shown in “Fig.
4”. Destination to reach is feed into map. Positions of nearby vehicles are shown on the
car monitor by various dots with the aid of radar sensors. Video camera detect traffic
light, read road signals & keep track of other vehicles, while also looking for other
obstacles. Sensor helps to detect the edges of roads and identify lane markings by
bouncing pulses of light off the car’s surrounding. At the time of parking, sensors in
wheels can detect the position of curbs & other vehicles inside of parking. Finally central
computer gather & analyse all these data from various sensors to manipulate
acceleration, braking and steering. In this way driverless car can run on road.
Flying Cars:
Flying car is a car that can be run on the ground as well as in the air whenever wants. It
must be capable of safe, reliable & ecofriendly operation. To create large market it
should fly without any qualified pilot.
Flying car has folded wings which are folded during runs on road while these wings get
open at the time of fly into sky, as shown in “Fig. 5”.Some companies like Kitty Hawk
Corporation, Uber Technologies, Boeing, Airbus, and Dubai Hover Bikes are working on
realizing their dream of flying cars.
In case of power failure batter supply support is provided to these cars. This vehicle can
accommodate 3 passengers & size is of standard SUV.Dutch firm PAL-V show off their
liberty flying car in Geneva Motor Show 2018 and claimed it is a world’s first flying car.

NatioPro
onal Seminar oceedings: 35on ‘Trends an
5th IEI Nationand Developme
.
l Convention oents in Automo
of Mechanicaotive Industry
l Engineers any’ during Septe
nd ember 4 ‐ 5, 2019.
119
AIR FUELED CARS:
Author is indicated here a principle on which this car works. Recently Bharat Electronic
Ltd. has being successfully manufactured atmospheric water generator (AWG) in
collaboration with CSIR-IICT &Maithri, a start-up company in Hyderabad. It is a large
unit. If we can manufacture it in small size then generated water can be utilized as a
fuel by using water fuel car technology. However there is requirement of lot of research
& development in this field.
Effect on National Economy & Lifestyle of People:
As all discussed future technology is ecofriendly, there is no any polluted byproduct of
propulsion system. These maintain & increase average health of peoples. Since
commercial fuel like oil is not required nation can save lot of money on oil import. It
decrease fiscal deficit & increase economic wealth of nation.
Merits:
(i) No use of conventional fuel increases economic wealth of nation. (ii) We can generate
pollution free atmosphere which increases life span of national citizens. (iii) Clean
energy resources are utilized. (iv) Driverless car can reduces number of accidents. (v) It
reduces traffic jam problems. (vi) Driverless car & flying cars enhance the lifestyle of
people.
Limitation:
(i) Still lot of research is required in each & every field of discussed vehicles for adoption
of future cars. (ii) Speed of installation of charging station for EV is not at satisfactory
level in India, it requires lot of infrastructure. (iii) Initial purchase Cost of EV is high, it
requires to control. (iv) Government should adopt simplicity in scraping policy of
conventional vehicles & also properly encourage buying by giving tax concessions in all
type of EVs. (v) Water fuel cars are unable to use where water is not easily available e.g.
desert like Sahara,(vi) There are some chances of hacking of driverless cars. (vii)
Driverless car reduces job opportunity to work as driver. (viii) In driverless car sensors
can fails in drastically weather condition which lead to unexpected accidents. (ix) Space
required by flying cars is somewhat large. (x) Air traffic control & its rules are required
to draft and apply on flying cars.

NatioPro
onal Seminar oceedings: 35on ‘Trends an
5th IEI Nationand Developme
.
l Convention oents in Automo
of Mechanicaotive Industry
l Engineers any’ during Septe
nd ember 4 ‐ 5, 2019.
120
Challenges to Researcher:
Researchers have to do lot of research to increase life span of Lithium-Ion batteries.
They have to develop such a system that no one can hack central computer of driverless
cars. Space taken by flying car is high it requires to reduce. Scientist should work on
reduce size of atmospheric water generator to such extent that it can be utilize for air
fueled cars.
Conclusion:
After all we are coming to the following conclusions:
All discussed future cars can change the face of world. Life style of people dramatically
gets changed. Peoples will get clean & pollution free air that increase average health of
country. Nation can save money by reducing fuel import cost & reducing fiscal deficit,
increase economic health of nation.
References:
1. Pravin V. Tembe, “Water as a fuel – an invention,” Technical volume, The Institution of
Engineers (India) , Convocation 2008.
2. Online news, News18.com, June 21, 2019.
3. https://en.wikipedia.org/wiki/Electric_vehicle_industry_in_India.
4. Peter Campbell, “Motor Industry Correspondent,” Financial Times, March 15, 2018; pp. 11.
5. The Telegraph, 2 November 2018,on website www.telegraph.co.uk

NatioPro
onal Seminar oceedings: 35on ‘Trends an
5th IEI Nationand Developme
.
l Convention oents in Automo
of Mechanicaotive Industry
l Engineers any’ during Septe
nd ember 4 ‐ 5, 2019.
121
Adoption of Additive Manufacturing in Automotive Supply Chain ‐ A Review
S. Sabarish1, T. Subhavaishnavi2 and P. Udhayakumar3
1Research scholar, Department of Mechanical Engineering K.L.N College of Engineering Sivagangai,
Tamil Nadu, India, [email protected] 2P.G Scholar, Department of Mechanical Engineering K.L.N College of Engineering Sivagangai,
Tamil Nadu, India, [email protected] 3Professor & Head of the Department, Mechanical Engineering, K.L.N College of Engineering Sivagangai,
Tamil Nadu, Indiam, [email protected]
Abstract:
Additive Manufacturing (AM) is fast evolving to become one of the predominant methods for production of
parts and products. This includes production of complex parts and simplification of complex product designs
constrained previously by traditional manufacturing technologies. AM has highly potential applications in
various fields such as healthcare, automotive, food, textile, robotics industries, etc. AM have a huge positive
impact on logistics and supply chain activities towards improving the Supplier Consolidation, Distributed
Manufacturing, and Increased Responsiveness, Reduce the Inventory on demand production and also to
reduce or skip the many steps of traditional manufacturing process. This review presents the challenges and
implications of implementing AM in existing supply chain networks in the automotive spare parts industry. A
literature survey was sought for analyzing the scientific and technical literature, available published
research results to investigate the impact of additive manufacturing technologies adoption in the automotive
supply chain. Specifically, the paper aims to explore the influence of additive manufacturing technologies
adoption on lean and agile concepts of supply chain management in the automotive industry. The results
illuminate the existing barriers towards implementing AM in existing Supply Chain Networks.
Keywords: Additive Manufacturing; 3D Printing; Automotive Industry; Supply Chain Simplification; Lean
Manufacturing
1. Introduction
AM has steadily potential to replace subtractive production technologies. It is capable of
joining various materials and creating a product from computer modeled data by
building them up in layer by layer fashion. This technology enables to customized goods
to be made at the behest of the customers` specific needs. In addition, AM offers the
ability to construct complex geometry parts allows to make a component with several
parts be consolidated into a single, lighter component. Furthermore, the product`s
functionality can be further improved by exploiting the surface optimized designs that
AM is capable of realizing, thereby reducing the amount of energy, fuel, or natural

NatioPro
onal Seminar oceedings: 35on ‘Trends an
5th IEI Nationand Developme
.
l Convention oents in Automo
of Mechanicaotive Industry
l Engineers any’ during Septe
nd ember 4 ‐ 5, 2019.
122
resources required for its operation (Chu et al.2008). Customers tend to pay more and
wait for customized product than they would for standards products (Lee et al.2002).
But then customized products calls for tighter integration of customers into the
production process and production costs may become higher due to expensive AM
machinery costs and utilization efficiency. The change of the production technology will
lead to a redesign of production and its processes such as product life-cycle planning,
supply chain design, logistics and also consumer behavior. Because customized products
require high levels of flexibility in the production process, an agile supply chain is
warranted rather than a lean supply chain (Christopher et al 2000; Gosling & Nain
2009). Currently a few industries are looking to capitalize on the advantages of AM by
incorporating them in their respective fields with Aviation and Automotive industries
being the frontrunners adopting AM, cf.AM Platform (2014). Particularly in Automotive
sector, the design flexibility is one of the most important arguments to move to AM, next
to the fast realization of prototyped or low-volume car parts. Experimentation with large
scale prints may motivate further applications and indicate the interest to secure weight
and thus fuel savings very much like in the aerospace sector, cf. Ford (2017). In regards
to the aforementioned industries customer value is related to keeping the products in
operational condition with high reliability. To lessen the costs and improve efficiency the
maintenance and repair operations must be closely related to the accessibility of proper
parts and skills at whatever demand occurs. However, the ability to provide the required
parts with at high demand rates at low costs is a big challenge to overcome [Zanoni et
al.2005] and it is the one that digital manufacturing technologies are expected to solve
[Holmstrom et al.2010]. Traditionally, firms should invest heavily in their spare parts
supply chain operations to meet their high demand and reliability goals [Cohen et
al.2006]. The reason to hold such a relatively large inventory of parts nearer to the
demand location leads to side effects such as a high warehousing and inventory
obsolescence costs and capital costs related to slow-moving parts. These problems are
now being steadily addressed using product lifecycle management tools such as
Enterprise Resource Planning (ERP)softwares. Now it’s high time to utilize these tools
in incorporating AM with the automotive supply chain networks. The objective of this
paper is to find, investigate, sort and review the information relevant to the implications
of adopting additive manufacturing in the automotive spare parts supply chain. This
paper is organized as follows. Section 2 provides a brief background of additive
manufacturing technologies and their characteristics. Section 3 explores the impact of
NatioPro
onal Seminar oceedings: 35on ‘Trends an
5th IEI Nationand Developme
.
l Convention oents in Automo
of Mechanicaotive Industry
l Engineers any’ during Septe
nd ember 4 ‐ 5, 2019.
123
AM in supply chain management wile Section 4 offers a comparative study on
traditional supply chain network with an AM adopted supply chain. Finally, a summary
analysis is presented in Section 5.
2. Additive Manufacturing
A general explanation of the production process in AM is as follows. The process begins
with the generation of a detailed three-dimensional Computer Aided Model (CAD) model
of the part with the specified dimensions. Then, the three-dimensional CAD file is
converted into slices of two-dimensional (2D) cross sections (layers) by a specialized
computer program. These 2D layers are then sent via a computer terminal connected to
the three-dimensional printing machine one layer at a time. Then the machine prints
the object by building each layer on top of the previous one, employing various methods
to ‘cure’ (solidification) the raw material in its process bed (Gibson et al.2009). The
production process may take time from a few hours to days to be made depending upon
the design, process and the material involved.
These following points illustrate the benefits of AM over conventional manufacturing methods.
No need for tooling (economies of scale does not exist, which makes customization
and design revisions possible).
The ability to produce small product batches economically.
Product design optimization for optimal function.
Ability to support quick changes in design.
Potential for allowing smaller inventories and benefitting from lesser lead times
and agile supply chains.
Moreover the possibility of reducing material waste is significant (Markillie. 2012) by
additive manufacturing. These characteristics enable to produce a part at any time on
any given location in batch sizes given the required machine setup and material as
opposed to traditional means which would incur expensive tooling and lead time.
In its present state, AM cannot provide a complete alternative to conventional
manufacturing technology (Stein A. 2012). This situation pertains to most industrial
field especially in the mass production field because of the following drawbacks

NatioPro
onal Seminar oceedings: 35on ‘Trends an
5th IEI Nationand Developme
.
l Convention oents in Automo
of Mechanicaotive Industry
l Engineers any’ during Septe
nd ember 4 ‐ 5, 2019.
124
Size limitations. The raw materials for AM processes generally are liquid polymers,
or powdered resin or plaster, or polymers in the form of wire spools. Large-sized
objects also often are impractical due to the extended amount of time need to
complete the build process.
Imperfections. Generally the parts produced using AM processes often possess a
rough and ribbed surface finish due to plastic beads or large-sized powder particles
that are stacked on top of each other. This leads to another post production surface
finishing process.
Cost. AM equipment is considered an expensive investment. Entry level 3D printers
average approximately $5,000 and can go as high as $50,000 for higher-end models,
not including the cost of accessories and resins or other operational materials.
A lot of research is undergoing to offset the aforementioned setbacks which gear AM
towards an important role in manufacturing as a complementing technology.Since AM
still being relatively in its infancy it might soon enough become a revolutionary
production technology not only in automotive sphere but in almost every aspects of the
consumer product industry,
3. Impact of AM in Supply Chain
Previous studies have analyzed the potential for a spare parts supply chain (5.
Holmstrom et al.2010) and have pointed out the implications of introducing a production
system utilizing AM technology (Pe´re`s et al.2006). Specifically, AM technology offers
two opportunities: (1) to redesign products with fewer components and (2) to
manufacture products near the customers (i.e., distributed manufacture). The net effect
is the reduction in the need for warehousing, transportation, and packaging. AM can
improve the efficiency of an automotive lean supply chain through just in time (JIT)
manufacture and waste elimination (Tuck et al.2007). Because AM only requires 3D
data and raw materials in order to produce a complex part, it will reduce setup and
changeover time thereby results in the reduction of the part assembly and lower
inventory holding. Also JIT being induced in the shop floor further builds upon the
savings achieved by JIT through parts suppliers. This results in a lean supply chain
with low cost. For example Bugatti Veyron automobile dashboards are customized
andprinted by using AM. By doing so, Bugatti enables the purchaser to customize their
low-volume production car while simultaneously reducing assembly time. BMW also
offers several 3D printed components in their high-end models (Campbell et al.2013).

NatioPro
onal Seminar oceedings: 35on ‘Trends an
5th IEI Nationand Developme
.
l Convention oents in Automo
of Mechanicaotive Industry
l Engineers any’ during Septe
nd ember 4 ‐ 5, 2019.
125
AM can improve the responsiveness of an agile supply chain by implementing a build-to-
order strategy to ensure that no stock out would occur. Moreover in AM the labor cost is
greatly reduced therefore the only overriding costs are of the machines and materials.
This is crucial as it is economical for facility for AM production is not labor but the
machines and raw materials, which makes it economical to locate production facilities
near the end customers. In addition, it is possible to customize products to meet
individual customer needs. This will facilitate the implementation of a build-to-order
strategy and increase responsiveness.
4. Traditional Supply Chain versus AM Supply Chain
AM significantly streamlines traditional methods and has the potential to be-come the
norm over the decade to come. AM is a powerful tool of customization of products. By
involving clients in the design and production, stages and tailoring individualized offers
to each customer, AM has the potential to reduce costs and increase profits. Due to this
a typical automotive supply can react quickly to the unexpected changes in the market.
As Fig 1 illustrates, the removal of assembly and pre-assembly steps, and the potential
to reduce the supplier base of the company have also been mentioned as other AM
benefits. Table 1 highlights the advantages of AM impacted supply chain over
traditional supply chain.
Table 1: Advantages of AM implemented supply chain over Traditional supply chain
Key factors Advantages
Cost savings Eliminate need for large inventory
Reduction in transportation cost
Elimination of redesign cost
Economical mass customization
Reduction of labour inputs
Response speed Shorter lead time
Improved product flexibility
On demand manufacturing
Quality improvement
Reduction in production waste
Optimum product design and performance
Less demand uncertainty
Environmental impact
Improved sustainability
Less carbon emission footprint

NatioPro
onal Seminar oceedings: 35on ‘Trends an
5th IEI Nationand Developme
.
l Convention oents in Automo
of Mechanicaotive Industry
l Engineers any’ during Septe
nd ember 4 ‐ 5, 2019.
The au
Automo
technol
costs fo
The ret
phase u
vehicle
reducin
being
lightwe
airflow
in stan
perform
strive t
interior
manufa
car to
parts t
develop
The Ur
effectiv
Anothe
tooling
perform
Figure
utomotive i
otive comp
logies in or
or prototypi
turn of inv
using tradi
componen
ng product
made usin
eight aerod
to engine
ndard prod
mance spor
to tailor th
r and exter
actured by
have its ex
that cause
ping efficien
rbee 2 for
vely change
er major ap
equipmen
m specific ta
e 1: Traditionprinting su
industry w
panies hav
rder to spee
ing. This re
vestment ha
tional meth
nts, now fu
developme
ng AM su
dynamic sp
and such a
duction car
rts cars an
he vehicle c
rior designs
AM. In 20
xterior and
drag and
nt vehicles
consumer
e the way c
pplication of
nt to make
asks that a
nal versus 3upply chain
was the for
ve been ma
ed up the d
educes the
as also bee
hods. Thou
unctioning
ent time. F
uch as im
oilers, win
are being m
rs, these
d such. He
characteris
s. Even ma
011, Kor Ec
d interior c
d add weig
, the compa
use. The
cars will lo
f AM is too
custom to
are develop
126
3D printing s by Çetinkay
rerunner in
aking a lo
design and
investmen
en significa
ugh AM was
test capab
Furthermo
mpact abso
g mirrors,
made. Altho
make a lo
ere the ma
stics as per
ajor parts o
cologic unv
completely
ght. While
any hopes t
use of AM
ook and fun
oling. AM h
ools and pa
ped specific
supply chainya and Özce
n the appl
ot of their
testing ph
nt costs and
ant when co
s used to p
ble parts ar
ore, comple
orbing mu
complex gr
ough these
ot, more s
arket dynam
r the custom
of a fully fu
veiled the U
printed. T
the car i
to release
M for autom
nction in th
has the capa
arts. Speci
ally by a co
n (adapted freyla., 2015)
lication of
prototype
ase also re
d eliminate
ompared to
reviously d
re produce
ex producti
ulti layer
rille design
are expens
sense in th
mic varies
mer`s need
unctioning
Urbee. The
This helped
is currently
motive ma
he future (
ability to pr
alized tool
ompany, as
from 3D
AM techn
e parts usi
educing the
s the exces
o the devel
do only moc
ed thereby
ion parts a
vehicle bu
ns that con
sive to mak
he world
as the com
ds such as
automobile
Urbee is t
d eliminate
y a protot
anufacturin
(Bargmann
roduce cust
ls can be m
s in the pro
nologies.
ing AM
e tooling
ss parts.
lopment
ckups of
greatly
are also
umpers,
ntrol the
ke use of
of high
mpanies
various
e can be
the first
e excess
type for
ng could
n. 2013).
tomized
made to
oduction

NatioPro
onal Seminar oceedings: 35on ‘Trends an
5th IEI Nationand Developme
.
l Convention oents in Automo
of Mechanicaotive Industry
l Engineers any’ during Septe
nd ember 4 ‐ 5, 2019.
of pate
thereby
chains
is usin
license
tooling
To expl
analyze
2). Foll
“the ac
betwee
(2) Man
(4) Or
Manag
Figure
The pro
ented part
y AM is abl
by reducin
g the tech
plates (Ho
, and mach
lore the im
e how these
lowing the
ctivities tha
n five diffe
nufacturing
rder Fulfil
ement, (5)R
2: A framewo
ocesses are
Supplier re
of the relat
s. These t
le to bridge
ng the numb
nology to p
olmstrom e
hining cent
mpact of AM
e two SCM
understan
at produce
erent types
g Flow Man
llment, D
Returns Ma
ork of a typica2014 [o
e defined as
elationship
tionships to
tools canno
e this gap e
ber of as-as
print hand
et al.2010).
ters and inv
M technolo
elements h
nding of La
a specific
s of SCM p
nagement,
emand, C
anagement
al AM implemoriginally pu
s follows (cp
p managem
o the suppl
127
ot be mad
efficiently. A
ssembly ste
dheld tools
The poten
ventory cou
ogy usage o
have chang
ambert (201
output of
processes: (
(3) Produc
Customer
t.
mented (adaptublished in C
p. Lambert
ment focuses
liers.
de economi
AM has the
eps that a p
that are u
ntial of AM
uld change
on SCM pr
ged due to A
14, p. 20),
value to th
1) Supplier
ct Developm
Relationsh
ted from theCooper et al.
t, 2014):
s on the de
ically by t
e potential
product mu
used to att
M to minimi
e the future
rocesses an
AM technol
we define
he custome
r Relations
ment and C
hip and C
e SCM frame., 1997])
evelopment
raditional
to simplify
ust undergo
tach bump
ize labor, r
e of auto in
nd compone
logy adopti
SCM proce
er.”We dist
ship Manag
Commercial
Customer
ework by La
t and maint
means,
y supply
o. BMW
ers and
required
ndustry.
ents, we
ion (Fig.
esses as
tinguish
gement,
lization,
Service
ambert,
tenance

NatioPro
onal Seminar oceedings: 35on ‘Trends an
5th IEI Nationand Developme
.
l Convention oents in Automo
of Mechanicaotive Industry
l Engineers any’ during Septe
nd ember 4 ‐ 5, 2019.
128
Manufacturing flow management comprises of the activities needed for
obtaining, implementing and managing the manufacturing flexibility and the
flow of goods in the supply chain.
Product development and commercialization refers to the activities involved in
the joint development and launch of products with suppliers and customers.
Order fulfillment, demand, customer relationship and customer service
management deal with the development and maintenance of the relationships
with customers, the administration of product and service agreements, the
balancing of customer demand with supply chain capabilities as well as the
activities needed to fulfill customer requests.
Returns management comprises all activities in the supply chain concerned with
reverse logistics and returns, including the avoidance of unwanted returns as
well as the management of reusable assets (e.g. reusable packaging or materials).
5. Summary Analysis
The advantage of AM technology break the barrier of integral and modular product
architectures so that the efficiency of production can be further upgraded. Another
insight is that AM reshapes the SC structure to become flat due to the simplicity of
manufacturing process. This reduces the complexity of management and increase the
flexibility as well as resilience of SC operation. A supply chain includes suppliers,
assemblers and after service as described in this paper. The decision about the location
of the companies’ production is very important and influential in the profitability and
sustainability aspects of the business. More and more companies start thinking about
switching their production closer to the customer and many are already in this process.
Situation in Economy and also political issues especially in cross international sphere c
and political further intensify the process. The desire to increase internal production or
economic sanctions introduces additional obstacles in a current supply chain with
overseas production.
Based on our literature analysis, we developed propositions of AM technology adoption
in customized parts production. It is evident that AM has extensive implications on
automotive supply chain management, but also on various fronts such as supplier
relationship management, product development, order fulfillment, demand, customer

NatioPro
onal Seminar oceedings: 35on ‘Trends an
5th IEI Nationand Developme
.
l Convention oents in Automo
of Mechanicaotive Industry
l Engineers any’ during Septe
nd ember 4 ‐ 5, 2019.
129
relationship and customer service management, as well as on returns management.
Therefore, similar to manufacturers, suppliers and customers alike are affected by the
changeover to AM induced supply chain network. On the supply-side, AM technology
adoption needs close collaboration between material and machine suppliers, because the
materials and machines for AM need to be compatible with each other in order to
achieve the expected optimum results. This is highly important in potential fields of AM
application, such as spare parts or lightweight construction. Due to a switchover from
manual production to AM, Original Equipment Manufacturers (OEMs) have to develop
new selection criteria that are specific to the procurement of AM machines. Similarly
long-term calculations such as strategic production plans also have to be considered,
since a potential transition from single unit to batch production needs to fit in well with
the overall production system within optimal performance. Furthermore, an experience
in AM seems to be a vital factor assessing and distribution of quality control tasks
between manufacturers and AM suppliers. In contrast, firms with short-term AM
experience tend to leave more quality control related tasks towards their suppliers.
This may be attributed to these firms` stronger focus on other AM affected activities,
which cannot easily be transferred, such as tasks in manufacturing flow management.
Once the corresponding processes run smoothly, firms have the capacity to redirect their
resources to the internalization of previously outsourced tasks. The maturity of the
adopted AM technology seems to be another relevant situational factor for explaining
the degree to which AM related quality control measures are transferred to suppliers. It
is possible that the impact of AM technology adoption on SCM processes and
components in supplier relationship management will be different for firms, which do
not engage in AM themselves, but source customized AM parts from contract
manufacturers. A greater product variety and the higher need for manual labor
compared to mass manufacturing make it harder to ensure object replicability and a
consistent product quality in such areas. On the demand-side, AM of custom products
may increase the level to which customers are virtually integrated in a manufacturer’s
supply chain. This can eliminate certain inbound or outbound deliveries and reduce
order lead time.

NatioPro
onal Seminar oceedings: 35on ‘Trends an
5th IEI Nationand Developme
.
l Convention oents in Automo
of Mechanicaotive Industry
l Engineers any’ during Septe
nd ember 4 ‐ 5, 2019.
130
Conclusion
The next disruptive step is considered to be connected with Industry 4.0 realization. The
emergence of new manufacturing technologies oriented on facilitating the local
production adds additional value. For example, AM including 3D printing became one of
the instrument of Industry 4.0. AM is a fast-paced technology. Every day, the quality
and/or speed of printing improves gradually. With regard to returns management, AM
not only increases material utilization, but it also speeds up replacement processing by
replicating custom products based on stored digital representations of the object. The
level of virtual integration with customers in ordering and replacement processes seems
to be contingent upon a firm’s experience with AM.
References
1. Chu C, Graf G, Rosen DW (2008) Design for additive manufacturing of cellular structures.
Computer Aided Des Applications 5:686–696.
2. Lee, S.-E., Kunz, G., Fiore, A.M. and Campbell, J.R. (2002), “Acceptance of mass
customization of apparel: merchandising issues associated with preference for product,
process, and place”, Clothing and Textiles Research Journal, Vol. 20 No. 3, pp. 138-46.
3. Gosling, J. and Naim, M.M. (2009), “Engineer-to-order supply chain management: A
literature review and research agenda”, International Journal of Production Economics, Vol.
122 No. 2, pp. 741-754.
4. Christopher, M. (2000), “The agile supply chain: competing in volatile markets”, Industrial
Marketing Management, Vol. 29 No. 1, pp. 37-44.
5. Ford (2017). Ford Tests Large-Scale 3D Printing with Light-Weighting and Personalization
in Mind. url: https://media.ford.com/content/fordmedia/fna/us/en/news/2017/03/06/ford-tests-
large-scale-3d-printing.html.
6. S. Zanoni, I. Ferretti, L. Zavanella, Multi echelon spare parts inventory optimisation: a
simulative study, in: Proceedings 19th European Conference on Modelling and Simulation,
2005.
7. J. Holmstro¨m, J. Partanen, J. Tuomi, M. Walter, Rapid manufacturing in the spare parts
supply chain: alternative approaches to capacity deployment, Journal of Manufacturing
Technology Management 21 (6) (2010) 687–697.
8. M.A. Cohen, N. Agrawal, V. Agrawal, Winning in the aftermarket, Harvard Business Review
84 (5) (2006) 129.

NatioPro
onal Seminar oceedings: 35on ‘Trends an
5th IEI Nationand Developme
.
l Convention oents in Automo
of Mechanicaotive Industry
l Engineers any’ during Septe
nd ember 4 ‐ 5, 2019.
131
9. Jaarsveld& Dekker (2011).On the use of installed base information for spare parts logistics:
A review of ideas and industry practice. International Journal of Production Economics,
143(2), pp/ 536-545
10. Walter, M., Holström, J., &Yijölä, H. (2004). Rapid manufacturing and its impact on supply
chain management. Logistics Research Network Annual Conference. Dublin
11. P. Markillie, A third industrial revolution, The Economist, 2012, Available at:
http://www.economist.com/node/21552901 (accessed 05.12.12).
12. I. Gibson, D.W. Rosen, B. Stucker, Additive manufacturing technologies: rapid prototyping to
direct digital manufacturing, Springer, New York, USA, 2009.
13. J.P. Kruth, M.C. Leu, T. Nakagawa, Progress in additive manufacturing and rapid
prototyping, CIRP Annals-Manufacturing Technology 47 (2) (1998) 525–540.
14. D.L. Bourell, J.B. Beaman, M.C. Leu, D.W. Rosen, A brief history of additive manufacturing
and the 2009 roadmap for additive manufacturing: looking back and looking ahead, in: US-
Turkey Workshop on Rapid Technologies, 2009.
15. G.N. Levy, R. Schindel, J.P. Kruth, Rapid manufacturing and rapid tooling with layer
manufacturing (LM) technologies, state of the art and future perspectives, CIRP Annals-
Manufacturing Technology 52 (2) (2003) 589–609.
16. Schumpeter, Additive manufacturing: Print me a jet engine, The Economist, 2012, Available
at:http://www.economist.com/blogs/schumpeter/2012/11/additive- manufacturing (accessed
05.12.12).
17. W. Cole, Breaking the Mold: Boeing engineers and technologists are constantly developing
better ways to design and make products, Frontiers, 2004, Available at:
http://www.boeing.com/news/frontiers/archive/2004/december/ts_sf03.html (accessed
10.03.13).
18. I. Gibson, D.W. Rosen, B. Stucker, Additive manufacturing technologies: rapid prototyping to
direct digital manufacturing, Springer, New York, USA, 2009.
19. J.P. Kruth, M.C. Leu, T. Nakagawa, Progress in additive manufacturing and rapid
prototyping, CIRP Annals-Manufacturing Technology 47 (2) (1998) 525–540.
20. J. Holmstro¨m, J. Partanen, J. Tuomi, M. Walter, Rapid manufacturing in the spare parts
supply chain: alternative approaches to capacity deployment, Journal of Manufacturing
Technology Management 21 (6) (2010) 687–697.
21. F. Pe´ re` s, D. Noyes, Envisioning e-logistics developments: making spare parts in situ and
on demand: state of the art and guidelines for future developments, Computers in Industry
57 (6) (2006) 490–503.

NatioPro
onal Seminar oceedings: 35on ‘Trends an
5th IEI Nationand Developme
.
l Convention oents in Automo
of Mechanicaotive Industry
l Engineers any’ during Septe
nd ember 4 ‐ 5, 2019.
132
22. P. Markillie, A third industrial revolution, The Economist, 2012, Available at:
http://www.economist.com/node/21552901.
23. Stein A (2012) Disadvantages of 3D printers.eHow TECH.http://www.ehow.com/facts_
7652991_disadvantages-3d-printers.html.
24. Tuck C, Hague R, Burns N (2007) Rapid manufacturing: impacton supply chain
methodologies and practice. IJSOM 3:1–22
25. Campbell, T.A.; Ivanova, O.S. Additive manufacturing as a disruptive technology:
Implications ofthree-dimensional printing. Technol. Innov. 2013, 15, 67–79. [CrossRef]
26. Çetinkaya, C.; Özceylan, E. Impacts of 3D printing on supply chain management.In
Proceedings of the 13thInternational Logistics and Supply Chain Conference, ˙Izmir, Turkey,
22–23 October 2015; pp. 649–657.
27. Bargmann, J. (2013) Urbee 2, the 3D-Printed Car That Will Drive Across the Coun-try.
Popular Mechanics, Hearst Communications, 4 November 2013.
28. AM Platform (2014). Additive Manufacturing: Strategic Research Agenda 2014

NatioPro
onal Seminar oceedings: 35on ‘Trends an
5th IEI Nationand Developme
.
l Convention oents in Automo
of Mechanicaotive Industry
l Engineers any’ during Septe
nd ember 4 ‐ 5, 2019.
133
Modal and Frequency Response Analysis of Vehicle Suspension System using Full Car Model
Sanjay Sharma1, Manoj Chouksey2, Vinod Pare3 and Pranay Jain4
1,2,3Department of Mechanical Engineering, SGSITS, 23, Park Road, Indore, 452003, M.P., India 4VECV Commercial Vehicles, Pithampur
Corresponding author’s email: [email protected]
Abstract
This work attempts simulated studies in modal analysis and frequency response analysis for a
vehicle suspension system. Ride comfort and vehicle handling are two important considerations
while finalizing the design of the vehicle suspension. However, both of these are conflicting to each
other. Ride comfort and vehicle handling depend on dynamic characteristics of the vehicle (i.e.
natural frequencies, mode shapes, frequency response functions etc.) too among other parameters.
Hence it is very important to carry out modal analysis of the vehicle suspension system to find out
the natural characteristics of the system. The same has been attempted in this work using full car
model having seven degree of freedoms. The degrees of freedom include pitching, bouncing and
rolling motion along with motion of the un-sprung masses. The software tools namely ANSYS
Workbench and MATLAB has been employed for the modal analysis. In ANSYS Workbench the
block diagram based approach is used for the modal analysis, whereas in MATLAB a code has
been written for the same. The two tools has been used to establish the validity of the results.
Natural frequencies and mode shapes of the vehicle has been analysed.
Keywords: Natural Frequency; Modal Analysis; Frequency Response; Ride Comfort.
1. Introduction
A vehicle suspension system is a complex vibration system, which can be conveniently
modelled using multiple degrees of freedom. The purpose of the suspension system is to
isolate the vehicle body from the road inputs. Suspension system serves a dual purpose
— contributing to the vehicle's road holding and handling. It is important from the point
of view of vehicle stability during braking, driving pleasure and comfort, and isolation
from road noise, bumps, and vibrations, etc.
Today, there are many challenges to automobile companies in the cutting edge competition to survive and excel in the market. The competition among automobile companies has forced them to
seek better alternative strategies in suspension systems through research studies.One of
the performance requirements is advanced suspension systems which aims to achieve better ride comfort and handling while increasing riding capabilities and performing smooth drive. The purpose

NatioPro
onal Seminar oceedings: 35on ‘Trends an
5th IEI Nationand Developme
.
l Convention oents in Automo
of Mechanicaotive Industry
l Engineers any’ during Septe
nd ember 4 ‐ 5, 2019.
134
of the suspension system is to provide a smooth ride and to maintain vehicle control over rough terrain or in case of sudden stops. Larger suspension stroke and smaller damping in the wheel hop mode leads better ride comfort [1].
Suspensions systems may be classified on various basis. On the basis of control, it is
classified into three types, namely (i) Passive suspension systems, (ii) Semi active
suspension system, and (iii) Active suspension system. Most of the vehicles are
suspended in passive manner, where the suspension system includes basically springs
and dampers. In passive suspension system, the characteristics of the components, i.e.
the values of spring constant and damping coefficients, are fixed. The disadvantage of
the passive suspensions system is that their performance remains effective only over a
certain frequency range. Semi active suspensions were proposed in the early 1970’s and
can be almost as effective as fully active suspension in order to improve the quality of
vehicle behavior. A semi-active system is a combination of passive spring element and a
controllable damper element. It enables automatic adjustment/control of the damping
coefficient based on control strategy. The controllable damper operates through an
embedded controller and a set of sensors using external power. When the control system
fails, the semi active suspension maycontinue to operate on a passive condition. An
active suspension system enables variation/adjustment of damper element as well as
spring element. The force actuator in such systems is able to both add and dissipate
energy from the system, unlike in passive systems which can only dissipate energy.
Unlikely to the passive suspension, the active suspension can improve the performance
of the suspension system on a comprehensive frequency range. Aly and Salem [2]
discussed the application of intelligent technique to control a continuously varying
damping automotive suspension system. An active suspension system has been proposed
to improve the ride comfort in their study. Many studies have been carried out on
suspensions system models to make it function efficiently by optimizing its parameters.
Active and Semi-active suspensions have been used for many years to increase stability
and handling of all types of vehicles. Bose, Daimler Chrysler, Land Rover, and Delphi
have used these types of systems either as factory or aftermarket applications
successfully. Controlling or aiding in stabilizing a car’s roll, pitch, and yaw through the
suspension would be especially beneficial for vehicles with a high center of gravity such
as SUVs, trucks, and ATV [3].

NatioPro
onal Seminar oceedings: 35on ‘Trends an
5th IEI Nationand Developme
.
l Convention oents in Automo
of Mechanicaotive Industry
l Engineers any’ during Septe
nd ember 4 ‐ 5, 2019.
135
Griffin [4] has discussed the human response to vibration excitation discussing about
both whole body vibration and hand-transmitted vibration using analytical as well as
experimental studies while considering various aspects like psychology, physiology etc.
The author reports that the human whole-body fundamental Natural frequency is in the
range of 3 Hz – 7 Hz.
Provision of cabin suspension may be a good option in heavy duty vehicles, as drivers of
such vehicles spend about 12-14 hours on wheels a day [5]. A good ride is a prime
requirement of these vehicles. Cabin suspension isolate cabin and driver much better
than fixed cab mounting. Jain [5] worked to improve the ride comfort of heavy duty
vehicle by introducing cabin suspension system.
Gillespie [6] in his book ‘fundamental of vehicle dynamics’ described that a soft
suspension helps in ride isolation as the sprung mass acceleration was found to be
minimum for lower values of natural frequencies. In the case considered, the sprung
mass acceleration was found to be minimum at 1 Hz natural frequency. However, other
practical considerations constrain the natural frequencies for most cars in the range of 1
to 1.5 Hz. In performance cars, where vehicle handling is more important than ride
comfort, the natural frequency is in the range of 2 to 2.5 Hz.
Correct estimation of such frequencies is very important. Hence, it becomes necessary to
model the vehicle suspension system accurately. This paper, therefore, discusses
modelling of the vehicle suspension system through developing own code (MATLAB in
this work) and using ready software tools (in this work ANSYS workbench
environment). The results produced in this way have also been compared and validated.
Bode plots are also drawn to study frequency response of the system.
2.Modelling of the Suspension System
The numerical problem as considered in this work is shown in the Fig. 1. The
Suspension System and wheels are considered as spring and Damper System. It may be
noted that MU1, MU2, MU3, MU4 denotes the Un-sprung masses while MS denotes the
Sprung mass of the vehicle. The notations ZU1, ZU2, ZU3, and ZU4 denote the vertical
displacement of the un-sprung masses while ZS denotes the vertical displacement of
sprung mass. Ɵ and Ø denote the degree of freedom corresponding to pitching and
rolling motion respectively. The notations KS1, KS2, KS3, KS4 and CS1, CS2, CS3, CS4 denotes

NatioPro
onal Seminar oceedings: 35on ‘Trends an
5th IEI Nationand Developme
.
l Convention oents in Automo
of Mechanicaotive Industry
l Engineers any’ during Septe
nd ember 4 ‐ 5, 2019.
the stif
KW3, K
Wheels
wheels
right an
Table I
ffness and
KW4 and CW
s of vehicle
from the c
nd left whe
I shows the
damping p
W1, CW2, CW
e. The nota
center of g
eel distance
Fig. 1.
e values of p
S. No
1
2
3
4
5
6
7
8
9
10
parameters
W3, CW4 are
ations 'a' a
gravity (CG
e from CG o
. Seven degr
parameters
Table I (P
Model Pa
MU1,MU2,
M
KS1,KS2,
CS1,CS2,
KW1,KW2,
CW1,CW2,
a=
c=
Ix
Iy
136
s of the Su
e the stiffn
and 'b' den
G) of Sprun
of Sprung m
ree of freedo
s considere
Parameters
arameter
,MU3,MU4
MS
,KS3,KS4
,CS3,CS4
,KW3,KW4
,CW3,CW4
=b
=d
xx
yy
uspension
ness and d
note the dis
ng mass, w
mass.
om Full Car
d for the nu
of System)
Value
62.8
1005
55000
0
37000
0
1.4
0.8
689.37
225.15
System, Si
damping pa
stance of t
while 'c' and
Model.
umerical Si
Unit
kg
kg
N/m
N-s/m
N/m
N-s/m
m
m
Kg-m2
Kg-m2
imilarly KW
arameters
the front a
d 'd' repres
imulation.
W1, KW2,
of Four
nd rear
sent the

NatioPro
onal Seminar oceedings: 35on ‘Trends an
5th IEI Nationand Developme
.
l Convention oents in Automo
of Mechanicaotive Industry
l Engineers any’ during Septe
nd ember 4 ‐ 5, 2019.
137
2.1 Equations of Motion
below as: . .
0M Z K Z (1)
M, K denotes Mass and Stiffness Matrix respectively.
Where;
1
2
3
4
0 0 0 0 0 00 0 0 0 0 00 0 0 0 0 00 0 0 0 0 00 0 0 0 0 00 0 0 0 0 00 0 0 0 0 0
S
XX
YY
U
U
U
U
M
I
I
M M
M
M
M
(2)
..
..
..
.. ..
1 1..
2 2..
3 3..
4 4
S S
U U
U U
U U
U U
Z Z
Z ZZ Z
Z Z
Z Z
Z Z
(3)
1 2 3 4 1 2 3 4 1 2 3 4 1 2 3 42 2 2 2
1 2 3 4 1 2 3 4 1 2 3 4 1 2 3 4
1 2 3 4 1
( ) ( ) ( )( ) ( ) ( )( ) (
S S S S S S S S S S S S S S S S
S S S S S S S S S S S S S S S S
S S S S S
K K K K aK aK bK bK cK dK cK dK K K K K
aK aK bK bK a K a K b K b K acK adK bcK bdK aK aK bK bK
cK dK cK dK acK ad
K
2 2 2 22 3 4 1 2 3 4 1 2 3 4
1 1 1 1 1
2 2 2 2 2
3 3 3 3 3
4 4 4 4 4
) ( )( ) 0 0 0
0 ( ) 0 00 0 ( ) 00 0 0 ( )
S S S S S S S S S S S
S S S S W
S S S S W
S S S S W
S S S S W
K bcK bdK c K d K c K d K cK dK cK dK
K aK cK K K
K aK dK K K
K bK cK K K
K bK dK K K
2.2 Ansys Workbench Model
Line body elements of “Ansys Workbench" software have been used for modal analysis of
the Suspension System to obtain the natural frequencies and mode shapes of the
system. The use of line body elements enables accurate modelling of the system with
lesser degrees of freedom as compare to the use solid elements. It may be noted that the

NatioPro
onal Seminar oceedings: 35on ‘Trends an
5th IEI Nationand Developme
.
l Convention oents in Automo
of Mechanicaotive Industry
l Engineers any’ during Septe
nd ember 4 ‐ 5, 2019.
degrees
tool. Si
environ
2.3 The
Modal
shapes
degrees
vectors
frequen
about t
[V, D] =
column
The res
and val
2.4 Res
The re
Table-I
through
almost
approa
of the m
rolling
s of freedo
imilar anal
nment and
F
e Code for
analysis i
of the sys
s of freedom
s of the s
ncies and d
the mode sh
= eig (A) pr
ns are the c
sults as ob
lidated in t
sults
sults obtai
II along wit
h the two d
negligible.
ches can be
mode shape
and pitchi
m, which
lysis has a
the results
ig. 2. Ansys
r Modal An
s used to
stem [7, 8]
m model. T
suspension
damping in
hapes. The
roduces a d
orrespondi
btained thr
the next sec
ined in AN
th percenta
different ap
. This also
e reliable e
es showed t
ing of the
are not con
also been c
s have been
Workbench
nalysis
find out n
. A MATL
he code can
n systems.
n various m
“eig” comm
diagonal m
ing Eigenve
rough ANSY
ction.
NSYS Wor
age differen
pproaches a
establishes
employed fo
that the fir
vehicle res
138
nsidered, h
arried out
n listed in t
h Model with
natural fre
LAB code h
n be used t
Eigenval
modes, whe
mand has b
matrix D of
ectors so th
YS Workbe
rkbench an
nce. It may
are in close
s the valida
for the mod
rst, second
spectively.
have been
by develop
the next sec
h seven degr
quencies, d
has also b
to compute
ues give
ereas eigen
een used fo
Eigenvalue
hat "A*V = V
ench and M
nd using M
y be noted t
e agreemen
ation of the
dal analysis
and third
The positi
constraine
ping a code
ction.
ree of freedom
damping f
een develo
the Eigen-
informatio
nvectors pr
or this purp
es and a fu
V*D".
MATLAB a
MATLAB co
that the re
nt, as the p
e work. Hen
s of the sys
mode corre
ion of pitch
ed in the s
e in the M
m.
factors and
oped for th
-values and
on about
rovide infor
pose [9].
ull matrix V
are also cor
ode are sh
esults as co
percentage
nce, any of
stem. The a
esponds to
h, bounce a
software
MATLAB
d modes
e seven
d Eigen-
natural
rmation
V whose
rrelated
hown in
omputed
error is
the two
analysis
bounce,
and roll

NatioPro
onal Seminar oceedings: 35on ‘Trends an
5th IEI Nationand Developme
.
l Convention oents in Automo
of Mechanicaotive Industry
l Engineers any’ during Septe
nd ember 4 ‐ 5, 2019.
center
shapes
the veh
S
2.5 Fre
Fig.3 sh
system
frequen
Fig. 4 s
in Tabl
mentio
of the veh
(eigen-vec
hicle.
S.No Mo
1 1
2 2
3 3
4 4
5 5
6 6
7 7
equency R
hows the S
. Bode plo
ncies. The
shows the B
le II, are cl
ned in the
Fig. 3
icle affects
tors) may a
ode
1
2
3
4
5
6
7
Response (
SIMULINK
ots are us
Simulink m
Bode plot fo
learly visib
plot.
3. SIMULINK
s the ride c
also be use
Table II (
Fre
Ansys Work
1.396
2.218
2.218
6.091
6.359
6.930
6.930
(Bode Dia
K model for
sed to find
model is em
or the syste
ble in the p
K diagramfo
139
comfort an
ed to compu
(Natural Fre
equency (Hz
kbench
1
6
8
6
3
1
3
agram)
r the Seven
d out the
mployed to
em. The pea
lot. The ac
or seven deg
nd vehicle h
ute the pitc
equencies)
z)
Matla
1.3962
2.2186
2.2188
6.0916
6.3593
6.930
6.9303
n degree of
response
o study the
aks, at the
celeration
gree of freed
handling. F
ch, bounce
%
ab
2
6
8
6
3
1
3
f freedom fu
of the sy
e Bode plo
natural fre
values at t
omFull Car
Further, th
and roll ce
Difference
0.00716
0.0
0.0
0.0
0.0
0.0
0.0
full car sus
ystem at d
ts for the
equencies a
these peaks
model
he mode
nters of
pension
different
system.
as listed
s is also

NatioPro
onal Seminar oceedings: 35on ‘Trends an
5th IEI Nationand Developme
.
l Convention oents in Automo
of Mechanicaotive Industry
l Engineers any’ during Septe
nd ember 4 ‐ 5, 2019.
140
Fig. 4. Bode plot for the system
3. Conclusion
The work presented studies in modal and frequency response analysis of a vehicle using
seven degrees of freedom full car model. The results have been computed using two
different approaches, i.e. first writing a code and second using a software tool. The
results obtained by the two approaches are found to be in close agreement. Hence, it is
concluded that any of the two approaches can be reliably employed for the modal
analysis of the system. In Bode plot the peaks are observed at the natural frequencies as
found out from the results of modal analysis.
References
1. S. K. Sharma, Vinod Pare, Manoj Chouksey, B.R. Rawal. "Numerical studies using full car
model for combined primary and cabin suspension" Procedia Technology 23, 171-178
2. Aly, A. A. and F. A. Salem (2013). "Vehicle suspension system control: A Review."
International Journal of control, automation& system: 46-53.
3. Rabun Wallace, Bikiran Guha, Aniruddha Mitra, PhD, PE, "Suspension Simulation Model
Verification Through Experimental Data For Lateral Force In Figure-8 Testing”.
4. Griffin, M J. Handbook of Human Vibration, Academic Press; 2012.
5. Jain, P. Design and Analysis of a Tractor-Trailer Cabin Suspension, No. 2007-26-047. SAE
Technical Paper; 2007.
6. Book:-Thomas D. Gillespie - “fundamentals of vehicle dynamics”.
7. M Chouksey, JK Dutt, SV Modak “Model updating of rotors supported on journal bearings”.
Mechanism and Machine Theory 71, 52-63
8. M Chouksey, SV Modak, JK Dutt “Influence of rotor-shaft material damping on modal and
directional frequency response characteristics”. Proceedings of ISMA-2010, 1543-1557
9. MATLAB: help, ‘éig function’, ver. R2018a’.

NatioPro
onal Seminar oceedings: 35on ‘Trends an
5th IEI Nationand Developme
.
l Convention oents in Automo
of Mechanicaotive Industry
l Engineers any’ during Septe
nd ember 4 ‐ 5, 2019.
141
Effect of Diethyl Ether on LHR Engine Characteristics of a using Papaya Methyl Ester‐Eucalyptus Oil Blend
C.Sivakandhan1, R.Silambarasan2, I.Satyanarayana3, P.Vijay Kumar4 and M.V.B.Kalyan5 1,3,4,5.Department of Mechanical Engineering, Sri Indu Institute of Engineering and Technology, Hyderabad.
2Department of Mechanical Engineering, J.K.K.Nattraja College of Engineering and Technology, Kumarapalayam.
Email: [email protected]
Abstract
The present experiment deals the study of addition of diethyl ether on the performance and
emission characteristics of LHR engine using papaya methyl ester-eucalyptus oil blends. The test
blends are CPME30Eu70 (Carica papaya methyl ester 30% and Eucalyptus oil 70%),
CPME30Eu70+10%DEE and diesel. The optimum results we get with presence of DEE in
CPME30Eu70 in LHR engine. The presence of DEE creates a lean mixture and its low viscosity,
high cetane number and volatility improves performance for a large degree. The graph depicts
that addition of 10% diethyl ether gives the best performance in BSEC, BSFC, BTE and emission
wise when coupled with LHR engine. Most notably NOx emission rate is decreased by the presence
of the DEE and BSFC is brought under acceptable limit. BSEC decreases in
CPME30Eu70+10%DEE and betters the performance of diesel in conventional engine. It also said
to improve the cold flow properties of the CPME-eucalyptus oil blend
Keywords: Diethyl ether; Papaya methyl ester ; LHR ; emission and combustion characteristics
1. Introduction
With the Paris Agreement behind us, There has been increasing awareness of climate
change, which will create an atmosphere very open to research and preventive measures
regarding climate change, even at the cost of national interests. If the Agreement’s
ambitious vision of reducing the temperature increase to 2% is to become a reality, it
would largely depend on how we deal with usage of fossil fuels and especially of the
transportation sector. The world still depends on fossil fuels for 88% of its energy. And
though in recent years there has been an increase in production of biodiesels, it has also
been a time of simultaneous increase in the consumption of fossil fuels. Any substantial
improvement in this regard has to come by the aid progressive governmental policies to
fund research and possible subsidies on biodiesel production. With the creeping of far-
right parties in Western Europe and a president of a country, which accounts for one-

NatioPro
onal Seminar oceedings: 35on ‘Trends an
5th IEI Nationand Developme
.
l Convention oents in Automo
of Mechanicaotive Industry
l Engineers any’ during Septe
nd ember 4 ‐ 5, 2019.
142
fifth of emissions, having anti-environmental policies, we have legitimate reasons to be
conc
Research for alternative fuels is not something new. It is as old as the engine itself. It
seems Rudolph Diesel operated the engine using peanut oil in 1900s. Much has changed
though since. After 1920s, Fossil fuel was made readily available, cheaper with
governments playing a positive part promoting it. Because of availability of fossil fuels,
the use of vegetable oils declined and went into oblivion. Until 1970s oil embargo
imposed by OPEC, the need for alternate fuel sources was not taken seriously. Now the
problem lied in the fact the engines were designed for running fuels with high volatility
and low viscosity. Straight Vegetable oils which have characteristically high viscosity
and low heating value was not suited for to be used in the engines.
Biodiesel also known as FAME (fatty acid methyl ester) is created from oil extracted
from animal and vegetable fats. The biodiesel production primarily depends on source.
The source is in accordance with both availability and economy. The most common
source of vegetable oils is plants of jatropha, rapeseed, mustard, cotton, neem etc.
Western Europe was a leader in cultivation of crops for biodiesel, because of ambitious
government policies from respective governments. Lately we have seen others
challenging this hegemony, with Asia closing the gap by accounting for 28% in 2010.
Biodiesel have properties very near to that of diesel. Hence it can be utilized without
even changing the engine design. Types of production of biodiesel are pyrolysis, micro-
emulsification, supercritical production and transesterificaton. The most powerful
method of production of Biodiesel is transesterificaton, because of its good conversion
rate. It is done by reacting triglyceride of the base oil with alcohol in the presence of
catalyst at high temperatures [4-10].
On running biodiesel on standard engine, research has shown a decrease in emissions of
CO, unburned HC, and soot formation except for NOx. There is a slight increase in bsfc
and a relatively smaller decrease in full load power. This researchers have attributed to
the presence of oxygen in biodiesel, which gives complete combustion and to that to the
almost absence of sulphur content gives good emission characteristics [13-16]

NatioPro
onal Seminar oceedings: 35on ‘Trends an
5th IEI Nationand Developme
.
l Convention oents in Automo
of Mechanicaotive Industry
l Engineers any’ during Septe
nd ember 4 ‐ 5, 2019.
143
LHR engines are engine which are supplied with ceramic coating of cylinder chamber
wall and head long with inlet and exhaust valve. The idea is to decrease the heat lost
through chamber walls to the cooling system will be available heat inside the cylinder to
be converted in to useful work. This also increases the thermal efficiency of the engine
[17, 18]
The main reason behind the NOx emission rates is the presence of oxygen and
temperature. Higher the temperature and oxygen content, higher is the NOx emission
rate. This is the main reason behind its increase in biodiesel and LHR engine with its
characteristics oxygen content and high combustion chamber wall temperature.
Researchers have tried to reduce NOx emissions by altering injection timing of both
diesel and LHR engines using biodiesel with varied success [24-26].
The performance, emission characteristics can be changed by changing the operation
conditions or changing the fuel properties. Fuel properties can be changed by adding
chemical additives. Anti-oxidant additives such as DEE are added to reduce NOx
formation inside the cylinder. Several researches have been done on performance of
LHR engine but not extensively. Some of them slight improvements in NOx [27-34]. R.
Senthil et al. reports that DEE when added with blends of biodiesel-eucalyptus oils
(B20E70DEE10) have properties very near that of diesel [29].
The authors humbly hope that the present experiment adds to existing scholarship and
assists further study. The present experiment deals the effect of DEE on the
performance, combustion and emission characteristics of LHR engine using papaya
methyl ester-eucalyptus oil blends. The test blends are CPME30Eu70 with and without
10% DEE and diesel as reference fuel.
2. Concept and Procedure
2.1 Biodiesel and its production
To improve the engine performance, modifications can be done either in the engine
design or the fuel characteristics. The change in diesel engine design is not feasible and
might be expensive. Hence modifying the fuel properties, so that it is compatible with
the engine design is the commonly held position. Biodiesel fits these criteria perfectly.
Biodiesel are long chain methyl esters derived from edible resources such as animal and

NatioPro
onal Seminar oceedings: 35on ‘Trends an
5th IEI Nationand Developme
.
l Convention oents in Automo
of Mechanicaotive Industry
l Engineers any’ during Septe
nd ember 4 ‐ 5, 2019.
144
vegetable fats. The absolute decrease in sulphur content and increase in oxygen content
helps in reducing harmful emissions and gives complete combustion. The viscosity is
brought near acceptable limits for the diesel engine Vegetable oil, which has very low
calorific value and high viscosity is not suited for diesel engine. These vegetable oils are
converted into biodiesel by processes like pyrolysis, micro-emulsification or
transesterificaton. Of which transesterificaton has the highest rate of conversion
complimented by an relatively simple process. Fuels are usually composed of HC and
other impurities such as sulphur, dust etc. By changing the structure of these HC and
its position, fuel properties are altered. Transesterification the triglyceride structure of
HC of oils, derived from animal and vegetable fats, is treated with alcohol in the
presence of a catalyst. The alcohol used usually is methanol, ethanol or butanol. For the
biodiesel to be renewable, it is necessary that the alcohol used is also renewable.
Catalyst can be of acid, alkali or lipase. The one we have used for our purpose is an
alkali catalyst. The end product is layer of methyl ester and glycerine. Glycerine is
removed, and then water content is removing to attain biodiesel. The one we have used
for our purpose is an alkali catalyst. Carica Papaya is usually found in parts of India,
South America, Mexico and Indonesia. Tropical climates favour its production. They are
growing as tall as 10m. The size of the seeds that it contains is very small. Vegetable oil
is extracted by using conventional mechanical screw type expellers. Papaya methyl ester
is reacted with methanol in a ratio (5:1). 0.5% of sodium hydroxide is used as catalyst.
The mixture is heated for 2 hours at around 70oC and 80oC. As the fractional
distillation, the papaya methyl ester is removed after of glycerine. It has methyl oleate
and methyl linoleate as major contents, with composition of around 65% and
20%..Aromatic and other unstable compounds are almost non-existent.
2.2 Eucalyptus oil
Eucalyptus trees can be found in tropical and temperate climate. Oil distilled from
leaves of eucalyptus, of which there is many times, is known commonly as eucalyptus
oil. These have high heating value, a low viscosity and agreeable flash point. The
drawback lies in it having a very low cetane number, which will result in poor starting
characteristics. This can be compensated by blending it with biodiesel. Blend, it seems
gives properties very near to that of diesel.

NatioPro
onal Seminar oceedings: 35on ‘Trends an
5th IEI Nationand Developme
.
l Convention oents in Automo
of Mechanicaotive Industry
l Engineers any’ during Septe
nd ember 4 ‐ 5, 2019.
145
2.3 LHR engine
An engine coated with insulating ceramic material inside combustion chamber walls is
called LHR engine. In a standard engine, of the heat released by the fuel one-third is
converted into useful work. Of the remaining heat release half goes as EGT and the
remaining passes through the cooling system. By using thermal barrier coating inside
the cylinder, we can enhance BTE which depends primarily on engine design and
introduce the ability to use fuels with low cetane rating. This is the case because of
increased in-cylinder temperature, which will result in shortening of ignition delay. It
enhances fuel economy. The BTE is better, but not drastic. LHR results in increase in
EGT. The standard diesel engine is converted into LHR (low heat rejection) engine by
plasma spray method. The coating is applied on the inner cylinder chamber wall, piston
head, chamber head and inlet and exhaust valves. The coating is of two layers: bond coat
and the thermal barrier coat. Over the substrate a bond coat is applied, over which the
thermal barrier coating is applied. The bond coat is used to relax thermal stresses
between the substrate and thermal barrier coat.
2.4 DEE
An engine is also filled with additives. Additives it is combustion of numerous chemical
it is used to improve the performance of the engine. The additives will help to overcome
the limitations of the biodiesel fuel such as the properties like density, toxicity, viscosity,
auto ignition, cetane number and flash point. The additives protect the engine from
corrosion. The types of additives are metal based additive, oxygenated additives, ethers,
antioxidants and fuel dyes. In the metal based it is used as catalytic effect., by using this
the emission is reduced and the reason is metal react with water vapour to form
hydroxyl and react with carbon atom so that the discharging of the oxidation of
temperature is formed .the oxygenated additives useful for the combustion process and
cetane rating. The cetane number is for minimizing the ignition delay.
3. Experimental setup
The testing engine is a kirloskar tv1 model single cylinder four stroke water-cooled
diesel engine developing 5.2 kW at a speed of 1500 rpm. Thermal barrier coating of PSZ
is applied on the cylinder head, combustion chamber wall, piston head and on the
surface of inlet and outlet valves. The specifications of the engine mentioned below in
the Table 1. This engine is directly coupled and connected to an AG10 model water

NatioPro
onal Seminar oceedings: 35on ‘Trends an
5th IEI Nationand Developme
.
l Convention oents in Automo
of Mechanicaotive Industry
l Engineers any’ during Septe
nd ember 4 ‐ 5, 2019.
146
cooled eddy-current dynamometer (Make Saj Test Plant Pvt. Ltd.) with a control system.
Lab view based Engine Performance Analysis software package “Engine soft LV” is used
for on line performance evaluation. There is a orifice meter where there is surge tank
placed on the inlet side of an engine is to maintains constant air flow. The exhaust
temperature is measured by using a thermocouple, which is a K type thermocouple in
conjunction with a digital temperature indicator. The fuel flow rate is measured on
volume basis using a burette and stop watch. On the basis of NDIR (non-dispersive
infrared) selective absorption principle by using the AVL 444 DI gas analyzer the
exhaust gas emission HC (hydro carbon), CO (carbon monoxide), CO2 (carbon dioxide)
and NOX (oxides of nitrogen) has been measured from the engine. AVL 444 DI gas
analyzer technical specification is given in Table 2. By using AVL437C smoke meter the
smoke level is measured. And the smoke emission is measured based on principle of
light extinction wherein, the amount of light blocked by the sample of exhaust gas from
the engine.
Table 1. Specification of engine design
Sl. No Details specifications
1 Type
Four stroke, kirloskar make, Compression ignition, Direct injection and water cooled
2 Rated power & speed 5.2 kW & 1500 rpm
3 Number of cylinder Single cylinder
4 Compression ratio 17.5: 1
5 Bore & stroke 87.5 mm & 110 mm
6 Method of loading Eddy current dynamometer
7 Dynamometer arm length 0.185 m
8 Type of injection Mechanical pump-nozzle Injection
9 Inlet valve opening 4.5 ° before TDC
10 Inlet valve closing 35.55 ° after TDC
11 Exhaust valve opening 35.55 ° before BDC
12 Exhaust valve closing 450 after TDC
13 Injection timing 230 after TDC
14 Injection pressure 220 bar
15 Lubrication oil SAE40

NatioPro
onal Seminar oceedings: 35on ‘Trends an
5th IEI Nationand Developme
.
l Convention oents in Automo
of Mechanicaotive Industry
l Engineers any’ during Septe
nd ember 4 ‐ 5, 2019.
4. Test
The en
Initiall
blends
minute
engine
current
engine
constan
conditio
conditio
reading
results
engine
the fue
for 10 m
by usin
oxides
pipe lin
ting proce
ngine perfor
y the engin
after 20 m
es to get sta
was loade
t supplied
the rack p
nt speed is
on and al
on. The ex
gs were tak
. At last of
was kept r
l line and t
minutes bu
ng smoke m
of nitrogen
ne and it is
edure
rmance ma
ne was per
minutes. W
able conditi
ed from 0 k
to the edd
position of f
maintaine
so when t
xperiments
ken, and us
f the engine
running fo
the injectio
ut value is t
meter. The c
n these are
analyzed b
aintained c
rformed us
When, the
ion with th
kg to15 kg
dy current
fuel pump
ed as 1500
the engine
s are repe
sed for calc
e test, the f
r a while b
on system.
taken at th
carbon mon
the exhau
b exhaust g
147
constant wi
sing diesel
fuel is ale
he new fuel
progressiv
Dynamom
is adjusted
rpm. The r
e was stab
ated for th
culations to
fuel was sw
before shut
The data h
he last 4 mi
noxide, car
st gases wh
gas analyze
ithout any
and then i
erted the e
l before me
vely in step
meter. Duri
d to regulat
readings ha
bilized and
hree times
o increase t
witched bac
t-down to f
have been c
inutes. The
rbon dioxide
hich have b
er.
y modificati
it was late
engine was
easurement
ps of 3 kg
ing the loa
te the supp
ad been re
d has attai
s and aver
the efficien
ck to stand
flush out th
collected in
e smoke cap
e, un burnt
been taken
ion on the
er used by
run for ab
ts were tak
by controll
ad changes
plied fuel so
corded at a
ined stead
rage value
ncy of the o
dard diesel
he test fu
n which eng
pacity is me
t hydrocarb
n from the e
engine.
bio fuel
bout 10
ken. The
ling the
s in the
o that a
ambient
dy state
e of the
obtained
and the
uel from
gine run
easured
bon and
exhaust

NatioPro
onal Seminar oceedings: 35on ‘Trends an
5th IEI Nationand Developme
.
l Convention oents in Automo
of Mechanicaotive Industry
l Engineers any’ during Septe
nd ember 4 ‐ 5, 2019.
148
Table 2. Before Transesterification:
Sl. No Properties Diesel Papaya oil Eucalyptus oil
1 Density @ 150C (kg/m3) 840 910 895.5
2 Kinematic viscosity @ 400C (Cst) 2.9 36 2
3 Flash Point (oC) 54 162 58
4 Fire point (oC) 64 280 64
5 Gross heating value (kJ/kg) 42700 41570 43270
6 Cetane number 49 60 18
Table 3. After Transesterification:
Sl. No Properties Diesel Papaya oil Eucalyptus oil
1 Density @ 150C (kg/m3) 840 867 713
2 Kinematic viscosity @ 400C (Cst) 2.9 4.5 0.23
3 Flash Point (oC) 54 152 -45
4 Fire point (oC) 64 158 -
5 Gross heating value (kJ/kg) 42700 42000 33900
6 Cetane number 49 63 49
4.1Test fuels
Fuel properties where measured by standard ASM methods. Table 2 and 3 shows the
fuel properties before and after transesterificaton. The sole biodiesel blend being used is
CPME30Eu70. Eucalyptus oil and CPME have mutual complimenting properties.
Eucalyptus oil has high calorific value but a low cetane index, which dents its cold flow
properties, whereas CPME has a good cetane number. DEE will be added for only 10%
of the total quantity of the blend. DEE has low viscosity, good volatility. This improves
cold flow properties and gives better atomization and better combustion. DEE is an
oxygenated additive but moreover because of cold flow properties it might bring down
Nox emission rate.

NatioPro
onal Seminar oceedings: 35on ‘Trends an
5th IEI Nationand Developme
.
l Convention oents in Automo
of Mechanicaotive Industry
l Engineers any’ during Septe
nd ember 4 ‐ 5, 2019.
149
5. Result and discussion
5.1 Brake Specific Energy Consumption
The Figure 2 shows the variation of BSEC with respect to brake power for
CPME30Eu70 and neat diesel in LHR and standard CI engine. Brake specific energy
consumption measures the amount of input energy required to develop 1 kilowatt power.
It tries to show how efficiently fuel energy content has been converted into power. Now,
the factors that might affect the BSEC are density, viscosity, heating value of the fuel
employed and volumetric fuel injection system. Generally in LHR engine, BSEC is
reduced because of decrease in ignition delay caused by high in-cylinder temperature. At
full load condition, BSEC for CPME30Eu70 added with 10% DEE is 11.5 kg/kw.hr,
which is lesser than all other testing conditions. The BSEC for CPME30Eu70 with
added 10% DEE, which is run in LHR engine, is 4% lesser compared to that for diesel
run in conventional engine, this is because of the better combustion process resulting
from addition of DEE. This might be also attributed to high energy content of the fuel
because of high calorific value of eucalyptus oil.
Fig.2 Shows variation of BSEC with brake power
5.2 Brake Specific Fuel Consumption
The Figure 3 shows the variation of BSFC with respect to brake power for
CPME30Eu70 and neat diesel in LHR and standard CI engine. The BSFC is the amount
of fuel consumed for generating 1kW of power per unit hour per kg. The graph indicates
that BSFC decreases with increase in load. It can be seen that fuel consumption is less
for diesel compared to other fuels. This is because of higher calorific value of diesel
0
5
10
15
20
25
30
0 2 4 6
DIESEL
CPME30EU70
BP(kW)
BSEC
(kg/kW
.hr)

NatioPro
onal Seminar oceedings: 35on ‘Trends an
5th IEI Nationand Developme
.
l Convention oents in Automo
of Mechanicaotive Industry
l Engineers any’ during Septe
nd ember 4 ‐ 5, 2019.
150
compared to other fuels. Of the five tests LHR CPME30Eu70 added with 10% DEE and
LHR diesel have the best BSFC rates. At full load, LHR CPME30Eu70 added with 10%
DEE exhibits BSFC which is 6%, 13% and 14.5% lesser than that of LHR diesel, diesel
in conventional engine and CPME30Eu70 in conventional engine. DEE added to
CPME30Eu70 decreases the BSFC because of its higher volatility, which speeds up the
mixing velocity of fuel air mixture and results in good combustion process.
Fig.3Shows variation of BSFC with brake power
5.3 Brake Thermal Efficiency
The Figure 4 shows the variation of BTE with respect to brake power for CPME30Eu70
and neat diesel in LHR and standard CI engine. Off the total heat energy generated by
the chemical reaction of the fuel is, in a conventional engine, (1) 1/3rd passes as heat
transfer through combustion chamber walls; (2) 1/3rd flows through exhaust gas as
exhaust gas temperature and the remaining (3) 1/3rd is utilized as work. This is the case
irrespective of the fuel used. By changing the fuel the fuel economy can be improved but
not BTE. Improvement in BTE can be brought by only engine design modification. The
LHR engine because of its ceramic coating helps in reducing heat loss through cooling
medium and it results in increasing fuel energy utilization. At full load, the LHR
CPME30Eu70 with added 10% DEE has thermal efficiency of 32.9%, which is 1.2%,
2.73%, 7.3% and 10.3% greater than LHR CPME30Eu70, LHR diesel, diesel and
CPME30Eu70 in standard engine respectively. DEE has lower kinematic viscosity,
which when mixed with CPME30 helps in better atomization and mixing of fuels which
will decrease ignition delay and has a positive effect (though negligible) in BTE.
0
0.1
0.2
0.3
0.4
0.5
0.6
0.7
0.8
0.9
0 1 2 3 4 5
DIESEL
CPME30Eu70
LHR DIESEL
BP(kW)
BSFC(kg/kW
.hr)

NatioPro
onal Seminar oceedings: 35on ‘Trends an
5th IEI Nationand Developme
.
l Convention oents in Automo
of Mechanicaotive Industry
l Engineers any’ during Septe
nd ember 4 ‐ 5, 2019.
151
Fig.4 Shows variation of BTE with brake power
5.4 Exhaust Gas Temperature
The Figure 5 shows the variation of EGT with respect to brake power for CPME30Eu70
and neat diesel in LHR and standard CI engine. The EGT is an indication of heating
capacity of the fuel used and also the engine design. Usually 1/3rd of the heating
capacity comes out as EGT. In LHR, EGT increases considerably because of the decrease
in heat transfer through combustion chamber walls. The graph shows clearly that in a
conventional engine EGT is low when compared to LHR engines. At full load condition,
the EGT of CPME30Eu70 with added 10% DEE used in LHR engine is 415oC which is
1.2%, 3.6%, 8.4%, 12% higher than LHR CPME30Eu70 and diesel, CPME30Eu70 and
diesel in a conventional engine respectively. The addition of DEE seems to increase the
peak cylinder temperature and hence has higher EGT than others
Fig.5 Shows variation of EGT with brake power
0
5
10
15
20
25
30
35
0 1 2 3 4 5
DIESELCPME30Eu70LHR DIESELLHR CPME30E70
BP(kW)
BTE (%)
0
50
100
150
200
250
300
350
400
450
0 1 2 3 4 5
DIESEL
CPME30Eu70
BP(kW)
EGT (�C)

NatioPro
onal Seminar oceedings: 35on ‘Trends an
5th IEI Nationand Developme
.
l Convention oents in Automo
of Mechanicaotive Industry
l Engineers any’ during Septe
nd ember 4 ‐ 5, 2019.
152
5.5 CO emission
The Figure 6 shows the variation of CO emission rate with respect to brake power for
CPME30Eu70 and neat diesel in LHR and standard CI engine. CO is an intermediate
combustion product that is formed, mainly because of incomplete combustion. At the
completion of the combustion process, CO2is formed. This is caused because of lack of
oxygen and low gas temperature. So at lean gas mixtures the CO emission will be low.
This is why biodiesel have remarkably low CO emission characteristics; the abundant
oxygen content available in the fuel improves the combustion process. It can be seen
from the graph that diesel because of relatively lower oxygen content observes high CO
emission rates on both standard and LHR engine. At full load, CO emission rate for
CPME30Eu70 with added 10% DEE is 20% and 42% less than diesel in LHR and
conventional engine respectively. CPME30Eu70 with added 10% DEE in LHR engine
shows the optimum results because DEE creates a relatively lean mixture with low
viscosity suited for improved atomization and combustion of the fuel.
Fig.6 Shows variation of CO emission with brake power
5.6 HC emission
The Figure 7 shows the variation of UHC emission rate with respect to brake power for
CPME30Eu70 and neat diesel in LHR and standard CI engine. The fuel used for
combustion is largely composed of HC (hydrocarbons) structure and other impurities.
These fuels need oxygen content with sufficient temperature and pressure to mix with
air supply. It should be also noted that air-fuel mixture in CI engine is heterogeneous,
which there both lean mixture and rich mixture portions are of fuel content in the
0
0.05
0.1
0.15
0.2
0.25
0.3
0.35
0.4
0 1 2 3 4 5
DIESEL
CPME30Eu70
LHR DIESEL
LHR CPME30Eu70
LHR CPME30Eu70+10%DEE
CO(%
)
BP(kW)
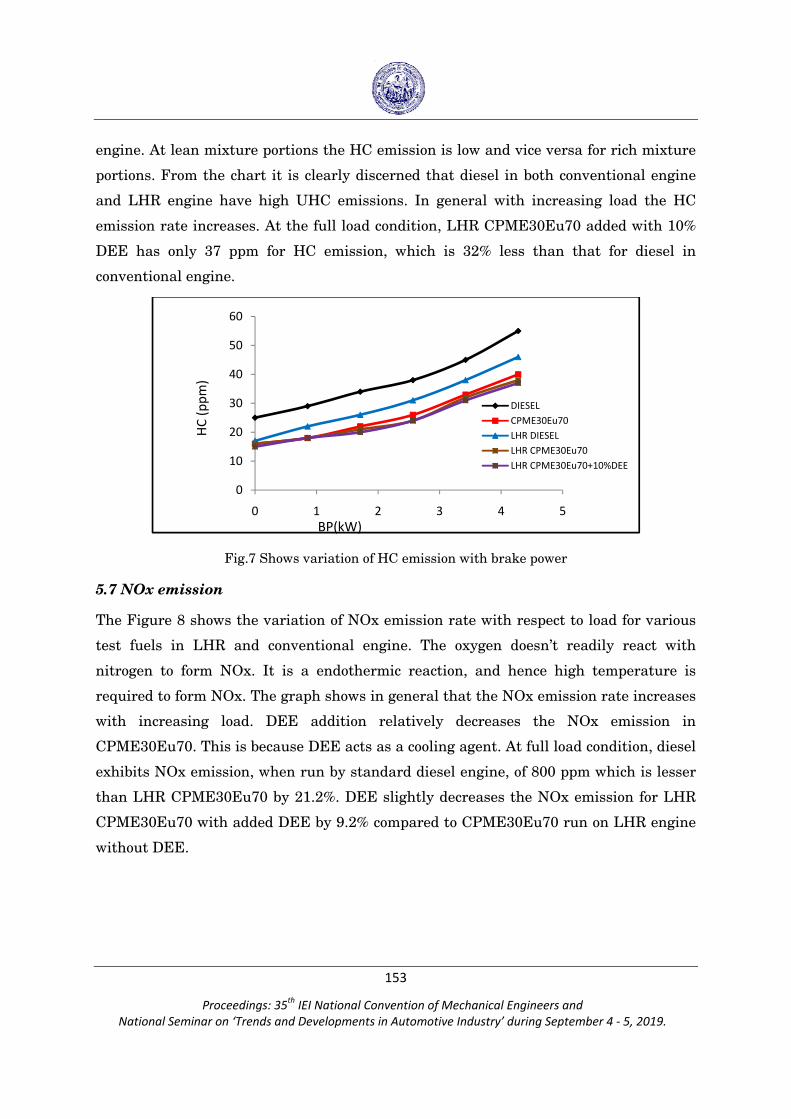
NatioPro
onal Seminar oceedings: 35on ‘Trends an
5th IEI Nationand Developme
.
l Convention oents in Automo
of Mechanicaotive Industry
l Engineers any’ during Septe
nd ember 4 ‐ 5, 2019.
153
engine. At lean mixture portions the HC emission is low and vice versa for rich mixture
portions. From the chart it is clearly discerned that diesel in both conventional engine
and LHR engine have high UHC emissions. In general with increasing load the HC
emission rate increases. At the full load condition, LHR CPME30Eu70 added with 10%
DEE has only 37 ppm for HC emission, which is 32% less than that for diesel in
conventional engine.
Fig.7 Shows variation of HC emission with brake power
5.7 NOx emission
The Figure 8 shows the variation of NOx emission rate with respect to load for various
test fuels in LHR and conventional engine. The oxygen doesn’t readily react with
nitrogen to form NOx. It is a endothermic reaction, and hence high temperature is
required to form NOx. The graph shows in general that the NOx emission rate increases
with increasing load. DEE addition relatively decreases the NOx emission in
CPME30Eu70. This is because DEE acts as a cooling agent. At full load condition, diesel
exhibits NOx emission, when run by standard diesel engine, of 800 ppm which is lesser
than LHR CPME30Eu70 by 21.2%. DEE slightly decreases the NOx emission for LHR
CPME30Eu70 with added DEE by 9.2% compared to CPME30Eu70 run on LHR engine
without DEE.
0
10
20
30
40
50
60
0 1 2 3 4 5
DIESEL
CPME30Eu70
LHR DIESEL
LHR CPME30Eu70
LHR CPME30Eu70+10%DEE
BP(kW)
HC (ppm)

NatioPro
onal Seminar oceedings: 35on ‘Trends an
5th IEI Nationand Developme
.
l Convention oents in Automo
of Mechanicaotive Industry
l Engineers any’ during Septe
nd ember 4 ‐ 5, 2019.
154
Fig.8 Shows variation of NOx emission with brake power
5.8 Smoke emission
The Figure 9 shows the variation of smoke opacity with respect to brake power for
CPME30Eu70 and neat diesel in LHR and standard CI engine Smoke emission is an
indication of incomplete combustion. CPME has absolutely no sulphur content and has
more lean mixture portions of the fuel, this is the reason behind the lower smoke
emission compared to diesel. DEE exists in gaseous form in room temperature with a
flash point of merely -45oC. This leads again to an increase in the smoke emissions in
the presence of high in-cylinder temperature of LHR engine. This is why at full load
condition, LHR CPME30Eu70 added with 10% observes an increase in smoke opacity of
7% compared to CPME30Eu70 run in standard engine.
Fig.9 Shows variation of smoke with brake power
0
200
400
600
800
1000
1200
0 1 2 3 4 5
DIESEL
CPME30Eu70
LHR DIESEL
LHR CPME30Eu70
LHR CPME30Eu70+10%DEE
BP(kW)
NOx (ppm)
0
10
20
30
40
50
60
0 1 2 3 4 5
DIESEL
CPME30Eu70
LHR‐DIESEL
LHR‐CPME30Eu70
LHR‐CPME30Eu70+10DEE
BP(kW)
SMOKE (HSU
)

NatioPro
onal Seminar oceedings: 35on ‘Trends an
5th IEI Nationand Developme
.
l Convention oents in Automo
of Mechanicaotive Industry
l Engineers any’ during Septe
nd ember 4 ‐ 5, 2019.
155
6. Conclusion
The present study arrives at the conclusion, confirming the previous scholarship, that
diethyl ether can be added as a fuel property improver in biodiesel as a replacement for
fossil fuels. That being further investigation on the formation of emissions while using
DEE and its possible side effects has to be done. Some of the highlighting conclusions
are
NOx emission rate while using diethyl ether decreased the emission by 90ppm when
compared to blend without diethyl ether.
BSFC, BSEC performance while using diethyl ether is better than diesel. This is
attributed to physical properties of diethyl ether, which improves cold flow
properties and atomization because of low viscosity and good cetane number.
CO and HC emission is 32% (absolute terms) and 42% lesser than diesel emission.
References
1. Lin Lin, Zhou Cunshan, Saritporn Vittaapadung, Shen Xiangqian and Dong Mingdong. Opportunities and challenges for biodiesel fuel. Applied Energy, 88, 2011, 1020-1031.
2. Magin Lapuerta, Octavio Amas, Jose Rodriguez-Fernandez. Effect of biodiesel fuels on diesel engine emissions. Progress in Energy and Combustion Science, 34, 2008, 198-223.
3. Lakshmanan Singaram. Biodiesel - An eco-friendly alternative fuel for the future – A Review. Thermal Science, Vol. 13, 2009, No. 3, pp. 185-199.
4. Adriana Gog, Marius Roman, Monica Toşa, Csaba Paizs and Florin Dan Irimie. Biodiesel production using enzymatic transesterificaion – Current State and perspectives. Renewable Energy, 39, 2012, 10-16.
5. Mehdi Atapour, Hamid –Reza Kariminia. Characterization and transesterification of Iranian bitter almond oil for biodiesel production. Applied Energy, 88, 2011, 2377-2381.
6. Purnanand Vishwanathrao Bhale, Nishikant. Deshpande, Shashikant B. Thombre. Improving the low temperature properties of biodiesel fuel. Renewableenergy, 34, 2009, 794-800.
7. Alemayehu Gashaw, Tewodros Getachew and Abile Teshita. A Review on Biodiesel Production as Alternative Fuel. Journal of Forest Products and Industries, 2015, (2), 80-85.
8. Deepak Verma, Janmit Raj, Amit Pal and Manish Jain. A critical review on production of biodiesel from various feedstocks. Journal of Scientific and Innovative Research, 2016, 5(2), 51-58.
9. Avinash Kumar Agarwal. Biofuels (alcohols and biodiesel) applications as fuels for internal combustion engines. Progress in Energy and Combustion Science, 33, 2007, 233-271.

NatioPro
onal Seminar oceedings: 35on ‘Trends an
5th IEI Nationand Developme
.
l Convention oents in Automo
of Mechanicaotive Industry
l Engineers any’ during Septe
nd ember 4 ‐ 5, 2019.
156
10. Wuttichai Roschat, Theeranun Sritanon, Boonawan Yoosuk, Taweesak Sudyoadsuk and Vinich Promarak. Rubber seed oil as potential non-edible feedstock for biodiesel production using heterogeneous catalyst in Thailand. Renewable Energy, 101, 2017, 937-944.
11. B.P. Singh. Performance and emission characteristics of conventional engine running on jatropha oil. Journal of Mechanical Science and Technology, 27(8), 2013, 2569-2574.
12. Orhan Arpa, Recep Yumrutas and Onder Kaska. Desulfurization of diesel-like fuel produced from waste lubrication oil and its utilization on engine performance and exhaust emissions. Applied Thermal Engineering, 58, 2013, 374-381.
13. Md. NurunNabi, Md. Mustafizur Rahman and Md. Shamim Akhter. Biodiesel from cotton seed oil and its effect on engine performance and exhaust emissions. Applied Thermal Engineering, 29, 2009, 2265-2270.
14. N.R. Banapurnath, P.G. Tewari and R.S. Hosmath. Performance and emission characteristics of a DI compression ignition engine operated on Honge, Jatropha and sesame oil methyl ester. Renewable Energy, 33, 2008, 1982-1988.
15. K. Suresh Kumar, R. Velraj and R. Ganesan. Performance and exhaust emission characteristics of a CI engine fueled with Pongamiapinnata methyl ester (PPME) and its blends with diesel. Renewable Energy, 33, 2008, 2294-2302.
16. N. Saravanan, Sukumar Puhan, G. Nagarajan and B. Rajendra Prasath. An experimental investigation on mahua oil (madhuacaindica oil) methyl and ethyl ester as a renewable fuel for diesel engine system. Proceedings of the 19th National Conference on I.C. Engines and Combustion, Annamalai University, Chidambaram. Dec21-23, 2005. pp. 65-69.
17. M.J. Abedin, H.H. Masjuki, M.A. Kalam, A. Sanjid, A.M. Ashraful. Combustion, performance and emission characteristics of low heat rejection engine operating on various biodiesels and vegetable oils. Energy Conversion and Management, 85, 201,173-189.
18. B. Rajendra Prasath, P.Tamilporai and Mohd. F. Shabir. Analysis of combustion, performance and emission characteristic of low heat rejection engine using biodiesel. International Journal of Thermal Science, 9, 2010, 283-2490.
19. R. Senthil, E. Siakumar, R. Silambarasan and G. Mohan. Performance and emission characteristics of a low heat rejection engine using Nerium biodiesel and its blends.International Journal of Ambient Energy, DOI: 10.1080/0130750.2015.1076517
20. N.Venkateshwara Rao, M.V.S. Murali Krishna and P.V.K. Murthy. Investigation on performance parameters of ceramic coated diesel engine with tobacco seed oil biodiesel. International Journal Of Advances in Engineering and Technology, Nov. 2013, Vol. 6, Issue 5, pp.2286-2300.
21. M.V.S. Murali Krishna, N. DurgaPrasada Rao, A. Anjeneya Prasad and P.V.K. Murthy.Performance Evaluation of Rice Brown Oil in Low Grade Low Heat Rejection Diesel Engine. International Journal of Engineering and Science. ISSN: 2278-721, Vol. 1, Issue 5 ( October 2012), PP1-12.

NatioPro
onal Seminar oceedings: 35on ‘Trends an
5th IEI Nationand Developme
.
l Convention oents in Automo
of Mechanicaotive Industry
l Engineers any’ during Septe
nd ember 4 ‐ 5, 2019.
157
22. Can Hasimoglu, Murat Ciniviz, Ibrahim Ozsert, YakupIcingur, Adnan Parlak and M. Sahir Salman. Performance characteristics of a low heat rejection diesel engine operating with biodiesel. Renewable Energy, 33, 2008, 1709-1715.
23. Hanbey Hazar and Ugur Ozturk. The effects of Al2O3-TiO2 coating in a diesel engine on performance and emission of corn oil methyl ester. Renewable Energy, 35, 2010, 2211-2216.
24. Ekrem Buyuukkaya and Muhammed Cerit. Experimental study of NOx emissions and injection timing of a low heat rejection diesel engine. International Journal of Thermal Science, 47, 2008, 1096-1106.
25. Adnan Parlak, Halit Yasar, Can Hasimoglu and Ahmet Kolip. The effects of injection timing on NOx emissions of a low heat rejection indirect diesel injection engine. Applied Thermal Science, 25, 2005, 3042-3052.
26. T. Ganapathy, R.P. Gakkhar, K.Murugesan. Influence of injection timing on performance, combustion and emission characteristics of Jatropha oil. Applied Energy, 88, 2011, 4376-4386.
27. M. Mohamed Mushtafa. Synthetic lubrication oil influences on performance and emission characteristic of coated diesel engine fuelled by biodiesel blends. Applied Thermal Engineering, 96, 2016, 607-612.
28. H.K. Rashedul, H.H. Masjuki, M.A. Kalam, A.M. Ashraful, S.M. Ashrafur Rahman and S.A. Shahir. The effect of additives on properties, performance and emission of biodiesel fuelled compression ignition engines. Energy Conversion and Management, 88, 2014, 348-364.
29. R. Senthil, E. Sivakumar and R. Silambarasan. Effect of diethyl ether on the performance and emission characteristics of a diesel engine using biodiesel-eucalyptus oil in blends. RSC Adv., 2015, 5, 54019.
30. D.H. Qi, H. Chen, L.M. Geng and Y.Z. Bian. Effect of diethyl ether and ethanol additives on the combustion and emission characteristics of biodiesel –diesel blended fuel engine. Renewable Energy, 36, 2011, 1252-1258.
31. Amr Ibrahim. Investigating the effect of using diethyl ether as a fuel additive on diesel engine performance and combustion. Applied Thermal Engineering, 107, 2016, 853-862.
32. Obed Ali, Rizwana Mamat, H.H. Masjuki, Abdul Adam Abdullah. Analysis of blended fuel properties and cycle-to-cycle variation in a diesel engine with a diethyl ether additive. Energy Conversion and Management, 108, 2016, 511-519.
33. S.Imtenan, H.H. Masjuki, M. Varman, M.I. Arbab, H.Sajjad, I.M. Rizwanul Fattah, M.J. Abedin and Abu Saeed Md. Hasib. Emission and performance improvement analysis of biodiesel-diesel blends with additives. Procedia Engineering, 90, 2014, 472-477.
34. Effect of Butanol addition on performance and emission characteristics of a DI diesel engine fueled with pongamia-ethanol blend. International Journal of Chem Tech Research, 2015, Vol. 8, No. 2, pp 59-67.

NatioPro
onal Seminar oceedings: 35on ‘Trends an
5th IEI Nationand Developme
.
l Convention oents in Automo
of Mechanicaotive Industry
l Engineers any’ during Septe
nd ember 4 ‐ 5, 2019.
158
Mechanical and Tribological Behavior of Al 5083‐ Gr /SiO2/B4C Hybrid Composites
T. Hariprasad, L. Shakeel Ahmed, K. Srinivasan and S.V. Suresh Babu 1234Department of Mechanical Engineering, Adhiyamaan College of Engineering, Hosur‐635109, India.
Abstract
In this present study, an attempt is made to compare the microstructural, mechanical&
tribological properties of Al-B4C-Gr, Al-SiO2-Gr hybrid composite fabricated by stir
casting technique with constant 5% B4C, 5 % SiO2 and 2, 4 and 6 % of Gr. The hardness
gradually increased with the presence of SiO2-Gr, compare to B4C-Gr the hardness of
11% of hybrid composite reinforced with Al-SiO2-Gr is 64 HRC is higherthan all other
samples. The tensile strength of the hybrid composite was better to compare to
reinforcement B4C-Gr, the microstructural analysis reviews the presenceof
reinforcement; the distribution of reinforcement particles was uniformly distributed.
The wear test was carried out by using a pin-on-disc wear tribometer by varying
parameters like normal load (5, 10N), sliding speed (1, 1.5m/s) with constant sliding
distance (2000m). The worn surface of the samples is examined by using SEM, and the
wear properties of the hybrid composite are found to be exhibit superior wear resistance
properties than composites. The Al-SiO2-Gr wear rate was better than the Al-B4C-Gr.
Keywords: Al 5083, Gr, SiO2, B4C, Wear, Pin-On-Disc.
*******

NatioPro
onal Seminar oceedings: 35on ‘Trends an
5th IEI Nationand Developme
.
l Convention oents in Automo
of Mechanicaotive Industry
l Engineers any’ during Septe
nd ember 4 ‐ 5, 2019.
159
Application of machine learning to optimize Mg recovery in the Al‐Mg alloy produced by modified stir casting method
Rajesh Kumar Behera1*, Birajendu Prasad Samal2 and Sarat Chandra Panigrahi3
1*Research Scholar, Biju Patnaik University of Technology, Odisha, [email protected] 2Dept. of Mechanical Engineering, Orissa Engineering College, Bhubaneswar, [email protected]
3Ex‐Prof., IIT Kharagpur, Professor and Head R&D, R.E College, Bhubaneswar, India. [email protected]
Generally Al-Mg alloy are used for its light weight and high strength properties in
automobile and aeronautical fields. Conventional methods used for preparing Al-Mg
alloys are associated with low mg recovery. Loss of magnesium during the process
makes it uneconomical and environmental unfriendly. However modified stir casting
method facilitates high recovery of magnesium in molten aluminum to meet desirable
mechanical properties. In the present study an attempt is made to investigate the
optimum magnesium recovery during the preparation of Al-Mg alloy. The process
involves a modified stir casting method where plungers are used to feed magnesium
turnings into the molten aluminium metal for Al-Mg alloy production. Use of artificial
intelligence technique has been the recent trends in various fields. In the present study,
Genetic algorithm has been used as an optimization technique to calculate Mg recovery
in the Al-Mg alloys using experimental data. Different genetic operators like crossover
and mutation has been used in the computational algorithm for optimized solution.
Genetic algorithms (GAs) are biologically inspired computing techniques, based on
Darwinian concepts of natural selection. They are highly robust and efficient for most
engineering optimizing studies. GAs based studies are increasingly making their
presence felt in many different aspects of this discipline. In recent times, GAs have been
successfully used in numerous problems in the areas of atomistic material design, alloy
design, polymer processing, powder compaction and sintering, ferrous production
metallurgy, continuous casting, metal rolling, metal cutting, welding, and so on. In the
present study, an effort has been made to use this technique in evaluation of Mg
recovery in Al-Mg alloy.A fuzzy logic technique is also introduced as the part of
investigation for determination of Mg recovery in the alloys produce using temperature,
rpm and percentage of magnesium addition as the input parameters to the fuzzy model.
The result from the fuzzy model has been compared with the experimental result and
was found to be in good agreement.
Keywords: Al-Mg Alloys, Mg recovery, Genetic Algorithm, Fuzzy logy, Modified Stir
Casting Method.

NatioPro
onal Seminar oceedings: 35on ‘Trends an
5th IEI Nationand Developme
.
l Convention oents in Automo
of Mechanicaotive Industry
l Engineers any’ during Septe
nd ember 4 ‐ 5, 2019.
160
A Brief glimpse on Coating techniques, properties for Materials used for Auto‐component Fabrication
Soumya Mukherjee1 and Rajib Ranjan Pal2
Department of Metallurgical Engineering, School of Mining & Metallurgy, Kazi Nazrul University,
Asansol‐713340, India
Department of Electronics & Telecommunication Engineering, Heritage Institute of Technology,
Kolkata‐700107, India
Abstract:
Fuel saving, low energy-reduction of CO2 emission, corrosion resistance; wear resistance
are important desirable characteristics for materials used in Automobile component
manufacturing. Material properties are dominant for quality, sustainable application for
auto components and for modern automobile engineering. Coating techniques plays a
major role for fabricating various components like engine cam, engine cylinder liners,
piston, brakes, piston skirts of automobile engine and others. Various coating process
like CVD, PVD, Diamond Like coating, screen printing of different materials/composite
based material are practised for enhanced wear, tribological, corrosion properties for
better performance of automotive components. Material substrate preparation and some
specific types of heat treatment also induced textural/morphology reformation for
enhanced performances. In the present article, focus is done on some of the techniques
carried for different materials to improve the engine life, reduction of failure for
automobile components.
Keywords: Coating, Automobile, tribology, wear-corrosion,
*******

NatioPro
onal Seminar oceedings: 35on ‘Trends an
5th IEI Nationand Developme
.
l Convention oents in Automo
of Mechanicaotive Industry
l Engineers any’ during Septe
nd ember 4 ‐ 5, 2019.
161
Mechanical Behavioural Aspects of Sintered Aluminium Metal Matrix Composites through P/M Route
Rajesh Kumar Behera
Research Scholar, Biju Patnaik University of Technology, Odisha, India. E‐mail: [email protected]
The present material world requires a new variety of composite materials. Aluminium
metal matrix composites (AMMC's) has been replaced the present composites for its
attractive mechanical behavioral aspects due to its light weight, high strength, ductility,
corrosion resistance, ease of assembly, low cost and offering unique combinations of both
strength, stiffness, wear resistance, and elevated temperature stability. They are
produced by powder metallurgy route. The main objective in developing aluminium
metal matrix composites is to provide enhanced characteristic performances and
properties from the currently available materials. AMMCs have gained its wide
applications in automotive, aerospace and electronic equipments etc. Based on the
literature, a new type of aluminium composite is developed which may offer attractive
mechanical properties such as high strength, light weight, less corrosion, easy
machinability, appreciable density and low manufacturing cost etc. In the present study,
aluminum powders of 99.55% purity and 325 mesh sizes are mixed with alloying metal
powders like Copper, Magnesium, Silicon and Silicon Carbide in a precisely controlled
quantity. During the process of powder metallurgy (P/M) product preparation, it was
minutely observed to attain the maximum efficiency and accuracy. Aluminium used
here as a main raw material called as matrix material and was reinforced with Cu, Mg,
Si, SiC. The composite material was developed with the process starting with selection
of metal powders, weighing, mixing/blending, compacting and sintering. Thecompaction
was carried out with help of a C-45 steel die by power compaction press with a load of
150KN to 250KN. The obtained green products were sintered in a Muffle furnace to
produce the final aluminium metal matrix composites product.The composites were
under gone different mechanical properties tests and found it has better and high
performance material properties for industrial applications due to its appreciable
properties over the traditional aluminium or its alloys.
Keywords: Aluminium Metal Matrix Composite, Powder Metallurgy, Sintering,
Microstructure, Mechanical Properties.

NatioPro
onal Seminar oceedings: 35on ‘Trends an
5th IEI Nationand Developme
.
l Convention oents in Automo
of Mechanicaotive Industry
l Engineers any’ during Septe
nd ember 4 ‐ 5, 2019.
162
Internet of Things (IOT) for New Generation Automobiles
Soumya Mukherjee1, Mohammed Shahnawaz2 and Rajib Ranjan Pal2
Department of Metallurgical Engineering, Kazi Nazrul University, Asansol‐713340, India
Department of Electronics & Telecommunication Engineering, Heritage institute of technology,
Kolkata‐70107, India
Abstract:
IOT is a new term that revolutionizes modern concept of manufacturing, service sectors
in global and national scenario. IOT actually gives birth to fourth generation of
industrial revolution with modern approach to the concept of product, processing and its
utility. IOT is a further step to the concept of autonomous car and industrial
automation. Smart car of present time which consists of myriads of modern entities like
navigation, cab services, entertainment is already a step towards high end automation,
driverless car concept. IOT actually helps in more advancement of such concept leading
to communication between devices and sensors installed in car for better traffic control,
positioning, navigation, anti-theft and others. Due to IOT there will be possibility of
connected cars playing a major role in the roads and for economy in future. IOT will also
cause a major shift in automobile industry from concept focussing on products to
services, experiences, from hardware to software, functionality to information as key
objective for value creation along with industry silos to complex connected systems.
Keywords: IOT, automation, automobile.
*******

NatioPro
onal Seminar oceedings: 35on ‘Trends an
5th IEI Nationand Developme
.
l Convention oents in Automo
of Mechanicaotive Industry
l Engineers any’ during Septe
nd ember 4 ‐ 5, 2019.
163
Effect of Intake Manifold Material on Engine Performance
P. Arjunraj1, P.D. Jeyakumar2, M.Bharathiraja3 and Dr. RagupathyKaru4 1Research Scholar, 2Associate Professor,
Department of Mechanical Engineering, B.S. Abdur Rahman Crescent Institute of Science and Technology,
Vandalur, Chennai, Tamilnadu‐ 600048 3, 4Associate Professor, Department of Automobile Engineering, Bannari Amman Institute of
Technology,Sathyamangalam, Tamilnadu, India – 638401 [email protected], [email protected], [email protected],
Abstract
The breathing of the engine is important for power production and it is controlled by
intake manifold. The flow in the intake manifold is considered as pipe flow where in the
frictional losses will be more. The finishing and surface roughness of the material is
important and can be attained by manufacturing process. This project intends to
compare the performance of an engine with three different intake manifolds with
different materials. The materials are PA6GF30, PA66GF30 and AlSi8Cu3. The original
engine manifold is made up of AlSi8Cu3. The manifold of other two materials are
prepared to the required dimensions and conducted the performance analysis on the
engine by keeping other parameters as constant. The results have shown better
improvement in the power and torque developed with Intake manifold material of
PA6GF30.The brake specific fuel consumption decreases for PA6GF30 manifold for all
loads when compared to PA66GF30 and AlSi8Cu3 manifolds. The volumetric efficiency
and airflow rate increases for PA6GF30 manifold for all loads when compared to
PA66GF30 and AlSi8Cu3 manifolds. The results show the suitability of PA6GF30
material for manifold in order to get better performance.
Keywords: PA6GF30, PA66GF30, AlSi8Cu3, Performance, BSFC
*******

NatioPro
onal Seminar oceedings: 35on ‘Trends an
5th IEI Nationand Developme
.
l Convention oents in Automo
of Mechanicaotive Industry
l Engineers any’ during Septe
nd ember 4 ‐ 5, 2019.
164
Statistical Analysis of Biodiesel Utilization by various countries –Review
Balaji A, Naresh G, Saranya K, Manivasagan V and Ramesh Babu N.G
Department of Biotechnology, Adhiyamaan college of Engineering, Hosur‐635130, Tamilnadu
Email: [email protected]
Abstract
The rises in population as created a drastic demand on conventional fuels because of
their sources are finite. This causes the consumption rates as low by 2040 it is believed
to be exhausted. It is therefore, necessary to develop a alternative renewable source
using oils extracted from plant, vegetable, cooking and animal fats. This review
describes about an alternative source for the production of biodiesel gained from
sunflower oil, economic analysis and its properties. According to reports 3920 kg of
sunflower seeds is required for the extraction of 1000 litres of sunflower oil for the
production of biodiesel. Energy value for 1000 L was estimated as 9 million kcal
.Sunflower as 26% oil content which is quite high when compared to the soybean oil. The
cost for the production of one litre is Rs. 80-120.The countries which produce major
biodiesel are European union countries like Germany (28%) where, 2.2 million tons per
year is utilized(2015) ,France (22%),Spain(9.5%),Italy (8%) and some other countries
contributing in less .European union is believed to share more than 10 % of bio fuels
by 2020.European countries use sunflower as their major feedstock for the biodiesel
production which plays a role in reducing green houses gases. The process is carried out
by subjecting sunflower oil to transesterification reaction and NAOH as catalyst,
improves efficiency with ethanol resulting in the by product of glycerine. These
processes were developed on focussing simple, cost effective and environmentally
friendly. Therefore, sunflower oil derived biodiesel can be used as a substitute for the
conventional fuels.
Keywords: Transesterification, NAOH catalyst, biodiesel, statistical analysis, green
house gases
*******

NatioPro
onal Seminar oceedings: 35on ‘Trends an
5th IEI Nationand Developme
.
l Convention oents in Automo
of Mechanicaotive Industry
l Engineers any’ during Septe
nd ember 4 ‐ 5, 2019.
165
Impact of thermal barrier coating application on the combustion, Performance and emissions of a diesel engine fuelled with
Calophyllum Inophyllum biodiesel oil–diesel blends
V.Dattatreya1,, B.R.Ramesh Bapu2 and B.Durga Prasad3 1Research scholar JNTUniversity, Anantapur, Andhra Pradesh
2Prof., Department of Mechanical Engineering, Chennai Institute of Technology, Chennai, India. 3Prof., Dept. of Mechanical Engg., JNTUniversity, Anantapur, Andhra Pradesh, India.
*corresponding author e‐mail id : [email protected]
Abstract
The rapid increase in fuel price, decreasing supply of high grade fuels in the market and
environmental concerns stimulated research on more efficient engines and also led to
revolution of using alternative fuels. The efficiency of IC engines can be enhanced by
reducing the heat loss. Lower heat rejection from the combustion chamber through
thermal insulated components can be achieved by thermal barrier coatings. The
Calophyllum Inophyllummethyl ester(CIME) biodiesel blends, were tested for their
alternate resource in diesel engines. The piston crown was coated with the partially
stabilized ZrO2 and Cr3C2 coatings over the piston crown to provide thermal insulation
which leads to better combustion performance and wear resistance. Coating was done by
thermal sprary and by HVOF methods. Experimental investigation on combustion
characteristics, such as, heat release, peak pressure and brake thermal efficiency, is
studied for varying loads 0%, 25%, 50%, 75%, 100% for both coated and uncoated piston.
The biodiesel blends prepared from CIME oil is prepared through esterification process.
From the combustion study, the results reveal that, combustion parameters (peak
pressure and heat release ) is improved by 10 % on a compression ratio of 18:1for the
coated piston with CIME biodiesel blends. The hardness of piston was increased from
1.4 to 24.5 GPa by coating Cr3C2 and this could increase the load capacity of the piston.
Keywords Calophyllum Inophyllum, HVOF, thermal spray, compression ratio,
Biodiesel,
*******

NatioPro
onal Seminar oceedings: 35on ‘Trends an
5th IEI Nationand Developme
.
l Convention oents in Automo
of Mechanicaotive Industry
l Engineers any’ during Septe
nd ember 4 ‐ 5, 2019.
166
Mechanical and Tribological Properties of Al 5083 Reinforced with B4C and TiO2 Pareicles
T. Hariprasad and L. Shakeel Ahmed 12 Department of Mechanical Engineering, Adhiyamaan College of Engineering, Hosur‐635109, India.
Abstract:
In this study, the Al 5083 matrix hybrid composites is fabricated with 3, 5 & 7 weight
percentage of Boron Carbide (B4C) particle along with constant 5 weight percentage of
Titanium Dioxide (TiO2). The microstructural analysis of the samples were studied by
using SEM, EDX. The reinforcement particles are uniformly distributed through the
matrix alloy. The EDX reviews the presence of reinforcement. The wear properties of the
samples were investigated by pin-on-disc wear tribometer, with different parameters
like load (10, 20, 30 N), speed (525 rpm). The corrosion behavior of the samples were
analyzed by Immersion Test and Potentiodynamic Polarization Test in 3.5 wt. % of NaCl
solution. Increasing the volume fraction of B4C reduces significantly corrosion rate of the
hybrid composites. The corroded surface of hybrid composites were studied through
SEM.
Keywords: Al 5083, TiO2, B4C, Wear, Pin-On-Disc, NaCl.
*******

NatioPro
onal Seminar oceedings: 35on ‘Trends an
5th IEI Nationand Developme
.
l Convention oents in Automo
of Mechanicaotive Industry
l Engineers any’ during Septe
nd ember 4 ‐ 5, 2019.
167
Electro‐optical systems in ISRO Remote Sensing Program and Signal and Image Processing on Satellite Data for Natural Resources
C J Jagadeesha FIE
Former Scientist ISRO, Bengaluru
Abstract
Indian remote sensing satellite systems are under the umbrella of National Natural
Resources Management System (NNRMS) and is coordinated at the national level by
planning committee of NNRMS which comprises of Indian Space Research Organisation
and various other ministries representatives like department of agriculture, water,
minerals, telecommunications, urban, rural development, forests, environment and
many more. In electro-optical systems for sensing the earth resources we have visible
and near-infrared sensors, thermal infrared sensors, microwave sensors, spectroscopy
methods of sensing. These are also called as spectral data systems as compared to
photographic systems. The principles of radiometry is applied in these remote sensing of
spectral regions of electromagnetic radiation. Indian Space Research Research
Organisation has put most of the remotely sensed electro-optical sensors data gathered
from remote sensing satellites in ISRO and other governmental websites like BHUVAN,
MOSDAC, India WRIS, NDEM, NRDMS and even in State Remote Sensing Centres.
Both signal processing and image processing are playing increasingly important roles in
remote sensing. As most data from satellites are in image form, image processing has
been used most often, whereas signal processing contributes significantly in extracting
information from the remotely sensed waveforms or time series data. The basic
principles of image processing of satellite images like image compression, restoration,
segmentation and classification will be highlighted with practical examples on earth
resources exploration and sustainable management point of view in this paper. Image
processing methods and their utilisation on satellite multispectral images, hyper
spectral images and microwave images will be explained briefly. Real time systems of
image processing may need advanced techniques using VLSI (VHDL). Theses will be
discussed.
*******

NatioPro
onal Seminar oceedings: 35on ‘Trends an
5th IEI Nationand Developme
.
l Convention oents in Automo
of Mechanicaotive Industry
l Engineers any’ during Septe
nd ember 4 ‐ 5, 2019.
168
Progress of Emission Pollution Control
Prof V J Lawrence1, Stephin Janvel2 and Mounika A3
SJIM, Bangalore, [email protected] 2&3Student, SJIM
The adverse impact of emissions on the planet has been established beyond doubt. The
vehicular population has been seeing a spiraling increase. The vehicle density is leading
to lot of emanations on the roads. The emission norms have been revised periodically to
help in control of the vehicular emissions. There are huge challenges to the auto
industry to continually upgrade to ensure that the conformance to standards are
adhered to. The aim of this paper is to track the history of emission controls and what is
happening currently, besides understanding the various controls for vehicular pollution
within India and also comparing it to benchmark standards worldwide
*******

NatioPro
onal Seminar oceedings: 35on ‘Trends an
5th IEI Nationand Developme
.
l Convention oents in Automo
of Mechanicaotive Industry
l Engineers any’ during Septe
nd ember 4 ‐ 5, 2019.
169
Challenges to Electric car adoption in India
Prof V J Lawrence1, Anthony Felix2 and Bosco Sylvester3
SJIM, Bangalore, [email protected] 2&3Student, SJIM
The automotive industry has grown by leaps and bounds in our country. The impact of
the traditional automobiles on the environment is being monitored vigorously. It is in
this context that the advent of the electric vehicles was welcomed with open hands. The
world is looking forward to the large scale migration of the current players to switch
over to manufacture of electric vehicles. There are several bottlenecks to the
implementation of the electric vehicles both in India and elsewhere. One, is the large
scale investment by the existing players by way of created facilities for the regular
vehicles manufacture. Besides, the infrastructure availability may not comply with the
readiness for launch of electric vehicles. The aim of this paper is to identify the various
bottlenecks that can hamper the launch of electric vehicles in India in the near future.
*******

NatioPro
onal Seminar oceedings: 35on ‘Trends an
5th IEI Nationand Developme
.
l Convention oents in Automo
of Mechanicaotive Industry
l Engineers any’ during Septe
nd ember 4 ‐ 5, 2019.
170
Structural Analysis and Design of FSAE (Formula Society of Automotive Engineers) Car
Mahaboob Tabriz B1, Sandeep B. S2, Dr.Muzzamil Ahamed S.3 and Dinesh H. A4 1Professor and Head, Dept. of Mechanical Engineering, H.K.B.K. College of Engineering,
Visvesvaraya Technological University, Bangalore, India, 2Assistant professor, H.K.B.K. College of Engineering Visvesvaraya Technological University, Bangalore, India,
3Principal, H.K.B.K. College of Engineering, Visvesvaraya Technological University, Bangalore, India, 4Assistant professor, H.K.B.K. College of Engineering Visvesvaraya Technological University, Bangalore, India,
Abstract
Design model was prepared using anthropometric parameters of tallest driver (95th
percentile male), SAE rules book and previous design knowledge. Static and dynamic
load distributions were calculated analytically followed by extensive study of various
boundary conditions to be applied during diverse FEA tests. Stress distributions, lateral
displacements during static, dynamic and frequency modes were analyzed and found
considerable factor of safety as required.
The tubular space frame chassis fabricated for the car is safe as it has been analyzed to
withstand all possible forces that it might encounter in a racing circuit. It has been
made as light as possible while not compromising on the strength of the chassis. The
manufacturing of the chassis has been carried out in a very professional manner and the
final product adheres to thedesign. The chassis has also been validated for its torsional
rigidity to ensure the final chassis is in tandem with the analysis.
Keywords: Chassis, FSAE car, Structural Analysis and Dynamic load.
*******

NatioPro
onal Seminar oceedings: 35on ‘Trends an
5th IEI Nationand Developme
.
l Convention oents in Automo
of Mechanicaotive Industry
l Engineers any’ during Septe
nd ember 4 ‐ 5, 2019.
171
Study on Friction Stir Processing of Al‐Zn‐Mg Alloy for Automobile Applications
P.K. Mandal
Department of Metallurgical and Materials Engineering, Amal Jyothi College of Engineering,
Kanjirapally‐686518, Kerala, India. E‐mail: [email protected]
Abstract
The high strength Al-Zn-Mg alloys (7xxx series) have many important properties such
as spontaneous age-hardening nature, high strength-to-weight ratio as well as grain
refinement achieve by scandium (Sc) addition during solidification. The high strength
aluminium alloy is broadly used in aircraft, marine, aerospace and automobile
industries. The addition of minor Sc (<0.25 wt.%) rapidly precipitates high volume
fraction of coherent Al3Sc dispersoids in cast aluminium alloys. Due to limited solubility
of Sc in aluminium can suppress the free migration of vacancies because they diminish
the diffusion rate in the matrix. The specific behavior of Al3Sc precipitates and its
substantial influence on the microstructure and properties of aluminium alloys will
subject of intensive research. Friction stir processing (FSP) is an emerging surface-
engineering technique which locally eliminate casting defects and refines microstructure
to enhance specific properties to some considerable depth. The severe plastic
deformation and thermal exposure of material significantly enhance microstructural
changes during FSP. FSP results in significant temperature rise (400-500oC) within and
around the processed zone. Generally, FSP creates three different microstructural
regions namely nugget zone or stir zone (SZ), thermo-mechanically affected zone
(TMAZ) and heat affected zone (HAZ). The processed zone is characterized by a
recrystallized fine grains (2-15 μm) with uniformly distributed MgZn2 and Al3Sc
particles. The tool design, rotational speed and traverse speed are the main parameters
which have to optimize the sound and defects free processed area thereby improving
mechanical properties of aluminium alloy. FSP resulted in a significant improvement in
tensile properties, particularly in the ductility and toughness. The significant
improvement in mechanical properties of FSP for aluminium alloy is attributed to
microstructural refinement and homogenization and elimination of porosity. It is
important to note that the modification and heat-treatment techniques followed in this
task can eliminate the porosity effectively in Al-Zn-Mg castings and redistributed the

NatioPro
onal Seminar oceedings: 35on ‘Trends an
5th IEI Nationand Developme
.
l Convention oents in Automo
of Mechanicaotive Industry
l Engineers any’ during Septe
nd ember 4 ‐ 5, 2019.
172
second-phase particles uniformly into the matrix. But optimum mechanical properties
have been achieved at T4 + FSP + Post aged at 140 oC for 2h condition. It has to mention
this works have conducted by double passes friction stir processing of aluminium alloys.
The experimental materials have been picked up from the processed zone and
investigated through Vicker’s hardness measurements, optical microscopy, SEM,
FESEM, DSC, and TEM analysis. The goal of the present work has to focus on
strengthening mechanisms responsible for the formation of microstructural refinement,
and effects of FSP parameters on resultant microstructure and final mechanical
properties.
Keywords: Al-Zn-Mg alloy, FSP, Al3Sc particles, TEM, mechanical properties.
*******

NatioPro
onal Seminar oceedings: 35on ‘Trends an
5th IEI Nationand Developme
.
l Convention oents in Automo
of Mechanicaotive Industry
l Engineers any’ during Septe
nd ember 4 ‐ 5, 2019.
173
Effects on Variable Compression Ratio Diesel Engine Performance and Emission characteristics in Corn Bio Diesel Fuel
B.Venkata Subbaiah1, M. Nagaphani Sastry2 and K.Hemachandra Reddy3
1Research Scholar, Department of Mechanical Engineering, JNTU‐Ansnthapur, Andrapradesh‐India 2 Associate Professor, Department of Mechanical Engineering, GPulla Reddy Engineering College,
Kurnool,Andrapradesh‐India 3Professor, Department of Mechanical Engineering,JNTU‐Ansnthapur, Andrapradesh‐India
*Corresponding Email.id:[email protected]
Abstract:
Environmental degradation and scarcity are the main problems associated with
petroleum-derived diesel fuel. Biodiesels have emerged as an alternative in recent days.
Many biodiesels obtained from edibles oils giving good performance and less emission
compared to diesel but it will cause the hike in the price of edible oils and food crisis.
Present work concentrated on producing biodiesel from non-edible oil (Corn oil) by two-
stage transesterification process. The biodiesel properties compared with diesel.
Conventional engines work on Fixed compression ratio. The compression ratio has been
varied to achieve the higher efficiency and good performance. The effect of compression
ratio was studied on diesel engine without any modification with Corn biodiesel as a
fuel. The optimum parameters were found to prepare biodiesel from the crude Corn oil.
The prepared biodiesel has 20.12% less calorific value than the diesel and 35.5 % higher
kinematic viscosity. UHC and CO2 were less in the case of biodiesel. Higher compression
ratio is better for biodiesel as it is showing better performance and less emission.
Keywords: Corn oil; VCR CI engine; combustion; emission; diesel engine
*******

NatioPro
onal Seminar oceedings: 35on ‘Trends an
5th IEI Nationand Developme
.
l Convention oents in Automo
of Mechanicaotive Industry
l Engineers any’ during Septe
nd ember 4 ‐ 5, 2019.
174
Design and Fabrication of ‘Ovatego’
S.Venkatesh1 and R. Jagadeesh Kumar2
Mechanical Engineering dept., Lendi Inst. of Engg. & Technology, [email protected]
Mechanical Engineering Dept., Lendi Inst. of Engg. & Technology
Abstract
An OVATE’GO’ is a device that uses a running-like elliptical motion to propel a bicycle.
Elliptical cycling combines the best of running, cycling and the elliptical trainer to give
you a fun and effective way to exercise outdoors. Because it is a low-impact exercise,
elliptical cycling builds cardiovascular fitness, while being easy on the joints,
which makes it great for everyone – young or old, health conscious to elite. Elliptical
cycling is a great way to revolutionize your fitness. Elliptical bicycle is a completely new
kind of exercise device and performs differently from other machines you may have used
in the past. “We treat it with respect, keep it maintained, and use it as intended, our
OVATE GO bike should provide with many advantages of enjoyable outdoor exercise as
well as travelling usage.”
Customization design is a trend for developing a bicycle in recent years. Thus, the
comfort of riding a bicycle is an important factor that should be paid much attention to
while developing a bicycle. From the viewpoint of ergonomics, the concept of “fattiness
object to the human body” is designed into the bicycle frame in this study. Firstly the
important feature points like riding posture, frame design, wheel size, and materials
required method of manufacture and types of failures are discussed. Further this study
proposes a detailed methodology which is helpful for the designer to develop an elliptical
bicycle in an efficient and economical manner.
Keywords: elliptical bicycle, customization design, travelling usage, fitness, materials.
*******