36th 36 - IEI
116
36 th 36 Organized by The Institution of Engineers (India) Jharkhand State Centre Under the aegis of Civil Engineering Division, IEI in association with Birla Institute of Technology, Mesra, Ranchi Proceedings Naonal Convenon of Civil Engineers & Naonal Conference on 'Innovaon, Mechanizaon and Modern Techniques in Civil Engineering' 23-24 October, 2021 The Institution of Engineers (India) A Century of Service to the Nation
-
Upload
khangminh22 -
Category
Documents
-
view
0 -
download
0
Transcript of 36th 36 - IEI

36th36
Organized by
The Institution of Engineers (India)Jharkhand State Centre
Under the aegis ofCivil Engineering Division, IEI
in association with
Birla Institute of Technology, Mesra, RanchiPro
ceed
ings
National Convention of Civil Engineers&
National Conference on
'Innovation, Mechanization and Modern Techniques in Civil Engineering'
23-24 October, 2021
The Institution of Engineers (India)A Century of Service to the Nation


Proceedings
36th National Convention of Civil Engineers &
National Conference
on
‘Innovation, Mechanization and Modern Techniques
in Civil Engineering’
organized by
Jharkhand State Centre 23-24 October, 2021
The Institution of Engineers (India)


CO
NT
EN
T
3D Concrete Printing: A Road Map for Future of Automated Construction in India
Raman Shaw, Kundan K Maurya and Damodar Maity
1
A Review on Seismic Response of Concrete Arch Dam
Rinku John and Deepa Balakrishnan S
7
Adoption of Modern Technology in Irrigation Projects A Case Study of Ongoing
Polavaram Project in Andhra Pradesh
I Satyanarayana Raju
12
Analytical Study on the Behaviour of Concrete In-filled FRP Tubular Columns
Subjected to Lateral Cyclic Loading
Varunkumar V, Gajalakshmi P and Revathy J
26
Application of Fly Ash Cenosphere in Cement Composites: A Comprehensive Review
S K Patel, C R Mohanty and A N Nayak
34
Durability Properties of Pervious Concrete using Nanosilica
D Tarangini, P Sravana and P Srinivasa Rao
39
Ecosystem Restoration A Holistic Approach
S Gnanasekaran
44
Feasibility of Plastic Waste as Reinforcement in the Mechanical Properties of
Stabilized Lateritic Soil Blocks
M G Sreekumar and Deepa G Nair
48
Modelling and Exploring the Impacts of E-Grocery Shopping on Trip Generation in
India
Suprava Jena, Momi Deb and Manish Dutta
55
Optimum Location of Shear Wall in High Rise Building with Comparison of Lateral
Displacement, Drift, Base Shear and Stiffness
A Shanmugam
61
Promoting the Reuse of C&D Wastes with Better Properties via Construction Made
from Recycled Concrete Aggregates
Pradyut Anand and Swagata Chakraborty
75
Risk Assessment of Earthquake on Historical Structures and Monuments
P K Tiwari, G Pandey and V Kumar
82
Seismic Performance of Precast Steel Reinforced Concrete Building
Mohammad Arastu and Khalid Moin
88
Statistical Modelling for Rainfall Time Series Analysis: Khurdha District of Odisha,
India
Ankita Bohidar, Anil Kumar Kar and Pradeep Kumar Das
95
Thermal/Fire Resistance Studies on Cermabond-569 and Ldam Coated Concrete
Structures at Elevated Temperature
Bishwajeet Chaubey and Sekhar Chandra Dutta
102


Proceedings of 36th National Convention of Civil Engineers & National Conference
on ‗Innovation, Mechanization and Modern Techniques in Civil Engineering‘
organized by Jharkhand State Centre, 23-24 October, 2021
1
DOI: https://10.36375/prepare_u.iei.a133 ISBN 978-81-952159-1-1
3D Concrete Printing: A Road Map for Future of Automated
Construction in India
Raman Shaw, Kundan K Maurya and Damodar Maity
Department of Civil Engineering, Indian Institute of Technology Kharagpur, Kharagpur, West Bengal
Abstract: 3D Concrete Printing (3DCP) is the potential future of total automation in Building and Construction (B&C)
industry. 3D Concrete Printing which works on the principle of additive manufacturing, has gained significant attention
due to its promising benefits such as formwork free and efficient construction, high flexibility in architecture and
customized design and minimized waste production etc. However, it is still at primitive stage due to lack of fundamental
and comprehensive research on its various components such as printable materials, printed shape of structure, the forces
acting on the structure and the printing methods itself. At first, this paper reviews the progress of 3DCP in B&C industry
and academia across the world. The paper also highlights the current challenges in the path of use of 3DCP in Building
& Construction sector particularly in India. Finally, the authors present their idea to accelerate the use of 3DCP in
construction in India.
Keywords: 3D Concrete Printing, Automation, Building & Construction Industry, Additive Manufacturing
INTRODUCTION
3D printing is a new technology that works on the principle of additive manufacturing. According to the American
Society for Testing and Materials (ASTM) ‗Additive Manufacturing (AM) is a process of joining materials to make
objects from 3D model data, usually layer upon layer‘[1]. Thus, 3D printing can be defined as ‗an additive manufacturing
process where materials are deposited, usually layer upon layer, to create a 3D solid object from a predefined digital
model‘. 3D printing provides sufficient flexibility to customize an object with complex shape, it reduces the need of
intensive labour and minimizes the waste generation. Many industries such as Medical, Aerospace and Manufacturing
are quite successful today in terms of adoption of automation such as 3D printing. However, 3D printing in building and
construction which is also known as 3D Concrete Printing (3DCP), has been under the novice stage till date. The
underdevelopment stage of 3DCP may be attributed to lack of research on printable material & mix design, complex
shape of the structure and the complex loading etc. As a result, even though some buildings have been constructed
through printing techniques, various challenges and possibilities need to be explored properly. Starting from the concepts
of 3D printing process, this paper critically reviews the progress of 3D concrete printing across the world. Also, major
challenges in adoption of 3DCP in India are discussed and finally, the authors present their own ideas to accelerate the
process of 3DCP in the large-scale construction.
3D CONCRETE PRINTING
3D concrete printing can be defined as ‗an additive manufacturing process where cementitious materials are deposited,
usually layer upon layer, to create a 3D solid object from a predefined digital model‘. The typical process of 3D concrete
printing is shown in (Figure 1)
In last few years, different 3DCP technologies have been developed to adopt AM in concrete construction. These
technologies are mainly based on two principles, namely extrusion-based and powder-based. The Extrusion-based
printing is done layer by layer deposition of the printable mix, whereas Powder based printing is prepared by spreading
the dry base materials first and binding it selectively by cementitious material. Though the first cement based additive
process was suggested by Pegna in 1997[2] in form of free form construction, the first popular 3DCP method based on
extrusion technique was developed by Prof. B Khoshnevis and his team through a series of works at university of
southern California and named as ‗Contour Crafting (CC) method‘[3,4]. Contour Crafting is a method of layered
manufacturing, using polymer, ceramic slurry, cement, and a variety of other materials and mixes to build large scale
objects with smooth surface finish. A relatively new printing techniques but similar to CC method was started by a team

Proceedings of 36th National Convention of Civil Engineers & National Conference
on ‗Innovation, Mechanization and Modern Techniques in Civil Engineering‘
organized by Jharkhand State Centre, 23-24 October, 2021
2
at Loughborough University, United Kingdom, led by Dr. R. Buswell and Prof. Simon Austin and it is known as
‗Concrete Printing‘[5-8]. This technique however, has a smaller resolution of deposition to achieve higher 3-dimensional
freedom, as it allows greater control of internal and external geometries. ‗CONCPrint3D‘ is one of latest extrusion-based
printing technique used for monolithic large-scale construction and it is being explored as a part of Project led by Prof.
Günter Kunze at Technical University, Dresden, Germany[9]. D-shape technology developed by Enrico Dini uses the
powder-based technique to selectively harden a large-scale sand-bed by deposition of a binding agent[10].
Figure 1 Typical Process in 3DCP
Since, materials and their compositions are one of the important elements of the 3D printed concrete, Lim, et al.[6] have
defined four critical characteristics of the printable materials and mix to predict the performance of 3DCP, namely:
1. Pumpability: The ease and reliability with which material is moved through the delivery system.
2. Printability: The ease and reliability of depositing material through a deposition device.
3. Buildability: The resistance of deposited wet material to deformation under load.
4. Open time: The period where these three properties are consistent within acceptable tolerances.
LITERATURE REVIEW
Material and Mix Design
Le, et al.[7] and Le, et al.[8], selected sand with a maximum size of 2 mm to manufacture concrete paste used for a small
nozzle with a diameter of 9 mm. The optimum mixture of a high-performance printing concrete was found to have a 3:2
sand-binder ratio with the latter comprising 70% cement, 20% fly ash and 10% silica fume. Mechtcherinea, et al.[9], used
mix design of concrete for the maximum aggregate size 8 mm. Concrete compositions for large-size filament
(rectangular, 150 mm 50 mm) printing were developed in compliance with the requirements of both the 3D-printing
technology and valid concrete standards (European Codes). Malaeb, et al.[11] used maximum aggregate size 2 for the
size of printer nozzle 2 cm. Other dry constituents include cement type I and sand. The optimum ratio of fine aggregate to
cement is 1.28 and minimum w/c ratio 0.48 for extrudability. Gosselin, et al.[12] presented a novel premixcomposed of
original Portland cement CEM I 52.5N (30−40%w), crystalline silica (40− 50%w), silica fume (10%w) and limestone
filler (10%w) for high-performance printing concrete paste. Rushing et al.[13] investigated the ability of conventional
mix with various type of additive and fibers for 3DCP. This study demonstrated that Coarse Aggregate can be used for
3DCP but with very low amount as compared to Fine Aggregate. Rahul, et al.[14] used Portland cement, fly ash (Class F)
and silica fume as the binders, PCE based superplasticizer and methyl cellulose based VMA. Panda, et al.[15] used a
novel fiber reinforced geopolymer mortar and the compositions (in percentage of total weight) are fly-ash (class F) 23%,
slag (Ground granulated blast-furnace slag) 5%, micro silica 3%, fine (river) sand with maximum 1.18 mm in size 47%,
liquid potassium silicate (molar ratio 2.0) 15%, hydroxypropyl methylcellulose (HPMC) 2% and tap water 5%.
Mechanical Properties and Structural Behavior
Lim, et al.[6] developed a high-performance cementitious mixture for concrete printing. The compressive strengths of
extruded and deposited paste are between 80% and 100% of the standard cast specimen. While the flexural strength of

Proceedings of 36th National Convention of Civil Engineers & National Conference
on ‗Innovation, Mechanization and Modern Techniques in Civil Engineering‘
organized by Jharkhand State Centre, 23-24 October, 2021
3
extruded samples is close to the standard cast specimen. Le, et al.[8] found from their experimental studies that the 1-d,
7-d and 28-d compressive strength of printed material was 20,80 and 110 MPa, respectively. Malaeb, et al.[11] tested the
compressive strength of 3D printed cubes. The strength for samples were in the range of 41.5 to 55.4 MPa. Gosselin, et
al.[12] found from their studies that Flexural strength of printed samples ranges from 11.7 MPa to 16.9 MPa. They also
suggested to employ fibres to strengthen the printed structures. Feng, et al.[16] studied the mechanical behaviour of 3D
printed structures using cementitious powder. The average compressive strength of printed cubic specimens ranges from
7.23 MPa to 16.8 MPa, which are not suitable for structural members Rahul, et al.[14] studies on the mechanical
characterization of the 3D printed structure and they found that the porosity was high at the layer interface and bond
strength were significantly low (22-30%) at these areas compare to the bulk. On the basis of the mechanical
characterization of the unreinforced concrete masonry, the authors presented the structural design procedure for 3D
printed concrete wall.
PROGRESS AND CHALLENGES OF 3DCP IN INDIA
Current Progress of 3DCP in India
Only a handful of construction companies are working towards 3DCP either independently or with collaboration with
academia. There are only two residential houses constructed using this methodology in India so far.
1) Single Story Structure
Tvasta Manufacturing Solutions, a start-up founded by alumni of IIT Madras, has made India‘s first single storey 3D-
printed house of 600 square feet area (Figure 2). The team has printed the structure in collaboration with Habitat for
Humanity‘s Terwilliger Centre for Innovation in Shelter. The concrete mix is based on ordinary Portland cement,
having a lower water-cement ratio which is an extrudable concrete consisting of cement, sand, geopolymers, and
fibres.
2) Double Story Structure
Larsen & Toubro Construction (L&T), has completed a 3D printed two-storey building of a floor space of 65 m2
(Figure 3). The building was fabricated using a large-format concrete 3D printer supplied by OEM COBOD. The
double-storey structure is built by a locally sourced 3D printable concrete mix developed by L&T‘s own in-house
team. The structure is located at L&T‘s Kanchipuram facility near the city of Chennai.
Figure 2 One story house 3D printed house by Tsvasta[21] Figure 3 Two story house 3D printed house by L&T[22]
Key Challenges for use of 3DCP in India
There are certain challenges before the Indian construction industry while adopting the 3DCP. Some of them are:
1) Printer Setting
When a particular set of printing material and design methodology is used to print an object, it is proven to be quite
efficient as compare to conventional construction techniques. However, once the design changes or new materials
become available, the process of eachactivity involve in the printing has to start all over again and the printer settings

Proceedings of 36th National Convention of Civil Engineers & National Conference
on ‗Innovation, Mechanization and Modern Techniques in Civil Engineering‘
organized by Jharkhand State Centre, 23-24 October, 2021
4
have to be varied in an exhaustive way to find these new, proper attributes. Thus, the printing process may not be as
efficient as it should be.
2) Properties of Printed Structure
During the printing process, it is quite challenging to make the structure isotropic as the literature suggests that 3D
printed layered structure shows anisotropic behavior, moreover, bond strength at the interface is the one of those areas
that needs to be explored in much details.
3) Cost Benefit Ratio
In spite of being a promising technology, 3DCP is not a first choice of the construction companies in India and it may be
attributed to cost associated with equipment, software and skilled workers. Since, there is no comprehensive study
available on the cost benefit analysis on the use of 3DCP and Indian market, it become the need of an hour to explore the
cost benefits of the technology.
4) Lack of Standards/Codes
There are numerous researches being carried out for the development of 3DCP. But unfortunately, there is no standard or
the code available to construction industry. As construction involves a number of variables at the site, Indian construction
companies are not ready to take the risk of new technology.
PROPOSAL
Utilization of Waste Paper Sludge
Literature on the properties of the waste paper sludge[17-19] suggests that waste paper has high potential to be
substituted specially as a binder for concrete production. Waste paper also shows pozzolanic behavior after the treatment
at higher temperature. At one end, it will solve the problem of wastage, on the other hand, it will be used in concrete
production.
Investigation on the Properties of Fibers
Inclusion of fiber improves the hardened properties of the concrete in significant amount in case of conventional method
of concreting. So, it may be useful in the printing techniques[20] also. Concrete production through printing process
depends on the fresh properties such as extrudability and pumpability. Inclusion of fiber may degrade the desired fresh
property of printable mix. So, a comprehensive study is needed to fix the role of various fibers
Investigation on Locally Available Material
3D concrete printing uses specially customized material. Generally, the 3D printing companies offer the mix proportion
needed for the particular work, thus most of the time a common user has to rely on the specific market. It is one of the
reasons why 3DCP is not as much popular as it should be. Therefore, broad and comprehensive study on the properties
and applicability of the locally available construction material needs to be done.
Approach towards Actual Construction
One of the impediments in concrete 3D printing is the usage of present design codes for the design of structures. Many
approaches depending on the importance, size and utility can be adopted to print a structure. To explain it, Water Closet
of size (1200 mm 1000 mm 2400 mm) taken from IS 2064[23] as a part of the structure and it is shown in (Figure 4).
Also, (Figure 5) shows a single module which would be printed in one go. The structure will be printed in different
modules and later on the different modules will be assemble, this process is known as off-shore 3D printing.

Proceedings of 36th National Convention of Civil Engineers & National Conference
on ‗Innovation, Mechanization and Modern Techniques in Civil Engineering‘
organized by Jharkhand State Centre, 23-24 October, 2021
5
Figure 4 Assembly of 4 modules for the base of the
structure
Figure 5 Single module for the base of the structure
CONCLUSION
3D concrete printing is the need of an hour in the age of technological advancement, however, there are many areas that
requires detailed study for any further decision as construction at site is more difficult if all the variables involved in the
printing process are not defined and known clearly. The research on the applicability of the locally available material is
equally important especially for the developing big economies like India. To make the 3D concrete printing more
sustainable, possibilities of use of various wastes like paper sludge also needs to be investigated thoroughly. To improve
the structural performance of the 3D printed structure, inclusion of different types of fiber is another area of research.
REFERENCES
1. ASTM, ASTM F2792-12a, Standard terminology for additive manufacturing technologies (withdrawn 2015), West
Conshohocken: ASTM International, 2009.
2. J. Pegna, Exploratory investigation of solid freeform construction. Automation in Construction, vol. 5, no. 5,
February 1997, pp. 427-437.
3. B. Khoshnevis, Automated construction by contour crafting related robotics and information technologies.
Automation in Construction, vol. 13, no. 1, January 2004, pp. 5-19.
4. B. Khoshnevis, D. Hwang, K.T. Yao and Z. Yeh, Mega-scale fabrication by contour crafting, International Journal
of Industrial and Systems Engineering, vol. 1, no. 3, May 2006, pp. 301-320.
5. R.A. Buswell, R.C. Soar, A.G. Gibb and A. Thorpe, Freeform construction application research, Advances in
Engineering Structure. Mechanics & Construction, 2006, pp. 773-780.
6. S. Lim, R.A. Buswell, T.T. Le, S.A. Austin, A.G.F. Gibb and T. Thorpe, Developments in construction-scale
additive manufacturing processes, Automation in Construction vol. 21, no. 1, January 2012, pp. 262-268.
7. T.T. Le, S.A. Austin, S. Lim and R.A. Buswell, Mix design and fresh properties for high-performance printing
concrete, Materials and Structures, vol. 45, no. 8, January 2012, pp. 1221-1232.
8. T.T. Le, S.A. Austin, S. Lim and R.A. Buswell, R. Law, A.G.F. Gibb and T. Thorpe, Hardened properties of high-
performance printing concrete, Cement and Concrete Research, vol. 42, no. 3, March 2012, pp. 558-566.
9. V. Mechtcherine, V.N. Nerella, F. Will, M. Nather, J. Otto and M. Krause, Large-scale digital concrete
construction-CONPrint3D concept for on-site, monolithic 3D printing, Automation in Construction, vol. 107,
November 2019.
10. G. Cesaretti, E. Dini, X. De Kestelier, V. Colla and L. Pambaguian, Building components for an outpost on the
Lunar soil by means of a novel 3D printing technology. Acta Astronautica, vol. 93, January 2014, pp. 430-450.
11. Z. Malaeb, H. Hachem, A. Tourbah, T. Maalouf, N.I. Zarwi and F. Hamzeh, 3D concrete printing: machine and mix
design, International Journal of Civil Engineering and Technology, vol. 6, no. 6, June 2015, pp. 14-22.
12. C. Gosselin, R. Duballet, Ph. Roux, N. Gaudillière, J. Dirrenberger and Ph. Morel, Large-scale 3D printing of ultra-
high-performance concrete – a new processing route for architects and builders, Materials & Design, vol. 100, June
2016, pp. 102-109.
13. T.S. Rushing, G.K. Al-Chaar, B.A. Eick, J.F. Burroughs, J. Shannon, L.A. Barna and M.P. Case, Investigation of
concrete mixtures for additive construction, Rapid Prototyping Journal, vol. 23 no. 1, pp.74-80, January 2017.
14. A.V. Rahul, M. Santhanam, H. Meena and Z. Ghani, 3D printable concrete mixture design and test methods,
Cement & Concrete Composite, vol. 97, March 2019, pp. 13-23.

Proceedings of 36th National Convention of Civil Engineers & National Conference
on ‗Innovation, Mechanization and Modern Techniques in Civil Engineering‘
organized by Jharkhand State Centre, 23-24 October, 2021
6
15. B. Panda, S.C. Paul, N.A.N. Mohamed, Y.W.D. Tay and M.J. Tan, Measurement of tensile bond strength of 3D
printed geopolymer mortar. Measurement, vol. 113, January 2018, pp. 108-116.
16. P. Feng, X. Meng, J.F. Chen, and L. Ye, Mechanical properties of structures 3D printed with cementitious powders,
Construction and Building Materials, vol. 93, September 2015, pp. 486-497.
17. S. Jain, Utilization of waste paper sludge in construction industry, Report 1, 2015
18. R. García, R.V. de la Villa, I. Vegas and M. Frías, The pozzolanic properties of paper sludge waste, Construction
and Building Materials, vol. 22, no. 7, pp. 1484-1490, July 2008
19. M. Frías, O. Rodríguez and M.S. de Rojas, Paper sludge, an environmentally sound alternative source of MK-based
cementitious materials. A review. Construction and Building Materials, vol. 74, pp. 37-48, January 2015.
20. M. Hambach, M. Rutzen and D. Volkmer, Properties of 3D-printed fiber-reinforced Portland cement paste.
Cementand Concrete Composite, vol. 79, pp. 73-113, May 2017.
21. https://tvasta.construction/the-story-of-indias-first-3d-printed-house/
22. https://www.business-standard.com/article/companies/l-t-construction-3d-prints-india-s-first-building-with-
reinforcement-120122400454_1.html
23. IS 2064: Selection, Installation and Maintenance of Sanitary Appliances Code of Practice (Second Revision),
1993.

Proceedings of 36th National Convention of Civil Engineers & National Conference
on ‗Innovation, Mechanization and Modern Techniques in Civil Engineering‘
organized by Jharkhand State Centre, 23-24 October, 2021
7
DOI: https://10.36375/prepare_u.iei.a121 ISBN 978-81-952159-1-1
A Review on Seismic Response of Concrete Arch Dam
Rinku John and Deepa Balakrishnan S
Department of Civil Engineering, School of Engineering, Cochin University of Science and Technology, Cochin, Kerala
Abstract: Seismic safety of concrete arch dams are of significant concern as it may exhaust the social and economic
wellbeing of humanity. Dam-Foundation and Dam-Reservoir interactions greatly influenced the dynamic behavior of
arch dams. Under earthquake excitations, geological features of dam systems behave rigorously. Therefore, the
evaluation of concrete arch dam involves the comprehensive inquisition of responses from the far-field and free-field
boundaries. Models developed so far with simplified assumptions explicit the need for the identification of factors in the
analysis and design of dam structures. Traditional analytical methods result in over-rigid dam structures that can upshot
over-estimated stresses and strains. In the earlier researches, the foundation rocks were assumed massless. It easily
simplifies the uncertainty in inertia and damping but gives inaccurate solutions. Thus, approximations in the dam-water-
foundation system by ignoring the mainframe parameters play a crucial role in analyzing structure. Finite Element
Method with relevant factors under consideration brings up the solution with most negligible errors. FE model
calibrated with appropriate parameters will predict the exact behavior of dam structures under seismic excitations. This
paper presents the review of research conducted on the concrete arch dam focusing on dam-foundation, dam–water
interactions, massed and massless foundation, water compressibility, thermal variations, spatial variations in the ground
motion, etc.
Keywords: Concrete Arch Dam, Dynamic Analysis, Earthquake Excitations, Foundation
INTRODUCTION
Arch dam are the structures constructed across the canons for various purposes like irrigation, electricity. Under
International Humanitarian Law, massive structures like dams should consider as ‗installations containing dangerous
forces‘ as their impact may result in the extermination of humanity. Therefore, seismic assessment of these structures is
of prime importance in the current scenario. Dam structures primarily consist of three domains- Reservoir domain,
Foundation domain, and Dam structure domain. During earthquake excitation this domain behaves unpredictably,
resulting in a coupling system. Thus, the interactions of this system govern the seismic safety assessment of concrete arch
dam.
Figure 1 Morrow Point Dam, Colorado

Proceedings of 36th National Convention of Civil Engineers & National Conference on ‗Innovation, Mechanization and Modern Techniques in Civil Engineering‘
organized by Jharkhand State Centre, 23-24 October, 2021
8
Fok and Chopra[1] studied the effect of dam-water interaction in the dynamic responses of Morrow Point arch dam
subjected to Taft ground motion. Nowak and Hall[2] investigated the effects of non-uniform earthquake input on the
response of concrete arch dams. Maeso, et al.[3] presented Boundary Element (BE) technique to analyze the seismic
response of dam structures. This technique incorporated various masked parameters in the previous studies. However,
most of the standard analysis introduced in the determination of concrete arch dam considered only the effect of
foundation flexibility. Tan and Chopra[4] identified a new analytical technique to point out the importance of foundation
inertia and damping effect in the interaction studies of an arch dam. Maeso, et al.[5] discussed influence of the spatial
distribution of earthquake wave input on the performance of dam structures. Chopra[6] investigated on the various
factors, which have to study for the entire dynamic behaviour of concrete arch dam. He found that dam-water interaction,
dam-foundation interaction, water compressibility, spatial variation of earthquake excitation has a profound impact on
the realistic response of arch dam.
Effect of Dam -Foundation Interaction
Maeso and Dominguez[3] investigated the seismic response of Morrow Point arch dam in 1993, considering the dam-
foundation interaction in empty reservoir conditions. Boundary Element (BE) technique was developed in the frequency
domain for the earthquake analysis of the dam foundation system. Boundary elements of the dam structure were idealized
as triangular and quadrilateral elements. The foundation rock of the structure was assumed linear viscoelastic and
damping, mass properties was incorporated in the study. Vertically Incident P waves and S waves were applied to the
structure to stimulate the condition. It was concluded from the study that the fundamental resonant frequency of the
compliant foundation dam was considerably reduced compared to the rigid foundation. Peak response of the dam was
also reduced due to the foundation interaction and travelling -wave effects.
Tan and Chopra[4] proposed a Morrow Point Arch dam model with dam body as combined finite element, reservoir as
continuum idealization of the impounded water body, and foundation rock idealized with Boundary element formulation.
The dam system was excited to Taft ground motion with upstream (x), vertical (y), and cross-stream (z) components of
accelerations. The analytical procedure presented in the paper concluded that standard procedure of analysis only
considered the flexibility feature of the foundation rock, which overestimates earthquake-induced peak stresses on the
dam body. Dam-foundation interaction increases the tensile stresses, but it does not affect the overall stress distribution
on the dam faces. The impounded reservoir behind the dam has more significant influence in determining stresses
induced in the dam body but had the least hand once the foundation rock interactions was considered.
Du, et al.[5] investigated the influence of foundation properties in the non-linear seismic response of arch dams. The
study was carried out on the Xiaowan arch dam and discussed the influences of energy dispersion, nonlinearity, and non-
homogeneity of foundation rock in the seismic responses of an arch dam. The dam -foundation system discretized into an
interior region for dam body, and its near field foundation is idealized with natural geological properties and infinite far-
field foundation with homogeneous features. The proposed model was a combination of explicit FEM and transmitting
boundaries. It is concluded that energy dispersion in infinite foundation reduced the arch and cantilever by 20-40% and
also increases the principal stresses in the upstream and downstream surfaces near the abutments.
Ferdousi[6] performed a non-linear dynamic analysis on the seismic performance of arch dam, considering the effect of
material properties of a discontinuous foundation. Karun-4 Dam was chosen for the case study analysis. A 3D model was
set up in ANSYS to simulate the geometric characteristics and dimensions of the dam. FE models created was applied
with both static and dynamic loads. Several cases of the massive foundation were modeled in the time domain to study
the effect of foundation interaction during seismic excitations. The results obtained from the study concluded that seismic
responses of dam-reservoir foundation system were significantly influenced by the material nonlinearity, presence of
various discontinuities and its non-homogeneity and far field boundary condition.
Zhang, et al.[7] investigated the stability analysis of the Baihetan arch dam using the comprehensive analysis method. A
geo-mechanical model test and 3D finite element analysis set up to study the arch dam‘s failure pattern and deformation
behavior. A comprehensive method of analysis coupled the effect of overload from upstream and strength reduction
effects of weak structural planes. The results from the study showed that the Baihetan arch dam meets the stability
criterion but proposed reinforcement treatment in the middle-upper part of the left dam abutment
Effect of Dam- Reservoir Interaction
Fok and Chopra[1] investigated hydrodynamic effects in the seismic response of arch dams. Response of Morrow point
Dam to the Taft motion subjected to study for various reservoir boundary materials. The study focused mainly on the
effects of reservoir boundary by taking various assumptions and disregarded the effect of inertial and damping effects.

Proceedings of 36th National Convention of Civil Engineers & National Conference on ‗Innovation, Mechanization and Modern Techniques in Civil Engineering‘
organized by Jharkhand State Centre, 23-24 October, 2021
9
Hydrodynamic effects can increase the displacements and stress responses in upstream and downstream faces. The study
concluded that Dam-water interaction increases the responses of arch dam subjected to seismic forces, whereas the
reservoir boundary absorption decreases the same. Assumption of rigid reservoir boundary condition overestimates the
arch stresses and cantilever stresses in both sides of an arch dam.
Yang, et al.[8] presented a study on the far-field modeling of the impounded reservoir in the dam-reservoir interaction of
arch dam. Reservoir region of dam modeled as newer field with nonlinear properties and far-field with a linear and
uniform cross-section. This transmitting boundary developed for 3D analysis could take up radiation conditions and
water compressibility. Idealization of near end of reservoir with far end need better discretization in terms of static load
and boundary nonlinearity. The incorporation of transmitting boundaries in the finite element model represents the exact
boundary condition to a certain level.
Maeso and Dominquez[3] investigated the response of arch dam under the influence of dam-water interaction by
incorporating BE technique. The reservoir domain in the finite element model was studied with infinite open reservoir
and closed symmetric and unsymmetric reservoir. The size of the domain was determined based on the wavelength of
water waves. Responses observed had greater influences when the reservoir is in full condition. Different geometry
conditions of the reservoir with rigid and compliant foundations must be studied with greater importance as it can upshot
the responses of an arch dam.
Xiuli and Ting[9] investigated the effect of water compressibility in the earthquake response of the Xiaowan Arch dam.
The study focused on comparing f added mass model and compressible reservoir model in terms of absolute maximum
tensile and compressive stresses, displacement, and acceleration. Reservoir modelled for average water level and low
water level in the history of the dam site. The study concluded that the absolute maximum displacement and acceleration
of the dam at both water levels were substantial in added mass model. Maximum compressive and tensile stresses were
overestimated compared to the compressible water model. Moreover, arch tensile stresses at the crown portion were
found to be 20% more than the conventional method of analysis.
Sevim, et al.[10] studied the finite element calibration of Berke Arch Dam using Operational Modal Testing. The study
involved both experimental and analytical parts in which a 3D finite element model of the Berke arch dam modelled
using ANSYS software. In order to find the natural frequencies, mode shapes, and damping ratios, Enhanced Frequency
Domain Decomposition Technique was used experimentally. Differences in analytical and experimental methods
minimized after calibrating the FE model with real material properties. Calibrating FE model with actual material
properties minimizes the difference in analytical and experimental results.
Effect of Spatially Varying Ground Motion
Maeso, et al.[11] investigated the influence of the spatial distribution of seismic excitation and geometry of canon on the
seismic response of Morrow point arch dam. A three-dimensional boundary element model was set up for understanding
the interaction effects in arch dams. P waves, SV waves, SH waves, and Rayleigh waves were allowed to impinge on the
dam from different directions. It was found from the study that the direction of propagation had profound influence on
the seismic response of arch dam when the reservoir is in modelled full condition. Displacement values of uniform
canyon geometry massively altered canyon geometry was modeled irregular. From the study, it was concluded that stress
pattern on the dam surfaces was similar. However spatial variations in ground motion caused larger values of cantilever
stresses in the region of the dam closer to the dam foundation rock.
Chopra and Wang[10] studied the responses of two arch dam, namely; Mauvoisin Dam and Pacoima dam, to spatially
varying excitations. A linear analysis program was developed in EACD-3D-2008 model that included foundation mass
and water compressibility. Compression and shear wave excitations have impinged on dam system, and appropriate time
delay was also applied. Peak values of tensile and cantilever stresses were prominent in spatially varying ground motion.
Jin-Ting, et al.[12] studied the non-linear response of arch dam to spatially varying ground input. A comprehensive
model developed which accommodates radiation damping in the canyon and non-homogeneity in foundation rock. The
seismic damage of the Pacoima dam was analyzed with the model and found to agree precisely with the actual crack
pattern on the dam surface. Incident waves and free waves are introduced in the model at the foundation rock bottom and
the dam foundation interface, respectively. Studies showed that the earthquake input mechanism had a profound
influence on the dam failure pattern..
Zacchei, et al.[13] investigated degradation analysis of Arch dam blocks using deterministic and probabilistic earthquake
excitations. Earthquake input generated from the probabilistic and deterministic seismic analysis. A plasticity model has
Proceedings of 36th National Convention of Civil Engineers & National Conference on ‗Innovation, Mechanization and Modern Techniques in Civil Engineering‘
organized by Jharkhand State Centre, 23-24 October, 2021
10
been generated with a reduced value of elasto-plastic modulus. The studies concluded that reduced elastic-plastic
modulus could increase the flexibility of the dam in 3D analysis.
Effect of Vertical Contraction Joints in Concrete Arch Dam
Mays and Roehm[14] found the effect of vertical joints in arch dams using a discrete crack model in ADINA software. A
linear and non-linear analysis of East canyon Dam with three vertical contraction joints modeled in the study. In the
linear analysis, water load was applied as the hydrostatic load applied in a single step whereas several step loads have
impinged on the dam in non-linear analysis. The three components of Koyna earthquake, factored to some scale was used
as seismic excitations. The study concluded that nonlinear analysis with vertical contraction joints reduced the arch
tensile stresses from11.6 N/mm2 to 6.9 N/mm
2.
Ahmadi, et al.[15] investigated the non-linear dynamic response of Morrow point Arch Dam using the discrete crack
joint model. Half of the dam model modeled with three contraction joints in ANSYS software. It was revealed from the
study that the dam body with contraction joints was shifted up to 8 cm permanently in the upstream face.
CONCLUSIONS
From the comprehensive literature review, the following conclusions can be drawn
Neglecting the effect of nonlinearity and discontinuity on the foundation strata, damping effect can overestimate the
principal stresses in the dam system by a factor of 2-3. Flexibility parameters in foundation strata reduce the
amplitude and fundamental frequency in dam structure. Foundation modelled as non-homogenous and discontinuous
can induce maximum sliding joints in the system.
Reservoir with the empty and full condition has more significant influence in the seismic response of arch dam. The
inclusion of impounded water in the dam system can increase crest displacement, and arch/ cantilever stresses,
especially on the upstream face.
Angle of incidence of seismic waves has profound influence in response of arch dam since the fundamental frequency
can be altered up to 20%[14]. Stress pattern on the dam surfaces was found similar in both uniform and non-uniform
excitations, but peak values of stresses increase in spatial non-uniform excitations.
Literature surveys show that incorporating vertical contraction joints make the dam responses more realistic to the
actual conditions.
REFERENCES
1. K.L. Fok and A.K. Chopra, Water compressibility in earthquake response of arch dams. J. Struct. Engg., vol 113, no
5, ASCE, 1987, pp. 958-975.
2. S. Nowak and J. Hall, Arch dam response to non-uniform seismic input, J. Eng. Mech., vol 116, no 1, 1990, pp.
125–139.
3. O. Maeso and J. Domı´nguez, Earthquake analysis of arch dams. I: Dam-foundation interaction. J. Eng. Mech., vol
119, no 3, 1993, pp. 496–512.
4. H. Tan and A.K. Chopra, Earthquake analysis of arch dams.
5. O. Maeso, J. Juan and J. Domı´nguez, Effects of space distribution of excitation on seismic response of arch dams,
J. Eng. Mech., vol 128, no 7, July 1, 2002. ©ASCE, ISSN 0733-9399/2002/7-759–768.
6. A. Ferdousi, Earthquake analysis of arch dam including the effect pf foundation discontinuities and proper boundary
conditions, J. theoretical and applied mechanics, vol 52, no 3, 2014, pp. 579-594.
7. L. Zhang, Y.R. Liu, Q. Yang and Y. Chen, Analysis of stability of the Baihetan arch dam based on the
comprehensive method, Bulletin of Engineering Geology and the Environment, vol 80, 2021, pp. 1219–1232,
doi.org/10.1007/s10064-020-02009-0.
8. Rihui Yang, C.S. Tsai and G.C. Lee, Far-field modelling in 3D dam-reservior interaction analysis, J.Engg.
Mechanics, vol 119, no 8, August 1993, 9 ISSN 0733-9399/93/0008.
9. Du Xiuli and Wang Jinting, Seismic response analysis of arch dam-water-rock foundation systems, Earthquake
Engineering and Engineering Vibration, vol 3, no 2, 2004.
10. Baris Sevim, Alemdar Bayraktar and Ahmet Can Altunisik, Finite element model calibration of berke arch dam
using operational modal testing, J. Viberation and Control, vol 17, no 7, 2006, pp 1065–1079, DOI:
10.1177/1077546310377912.
11. Anil K Chopra and Jin-Ting Wang, Earthquake response of arch dam to spatial varying ground motion, Earthquake
Engng Struct. Dyn., vol 39, 2010, pp 887–906.

Proceedings of 36th National Convention of Civil Engineers & National Conference on ‗Innovation, Mechanization and Modern Techniques in Civil Engineering‘
organized by Jharkhand State Centre, 23-24 October, 2021
11
12. J. Wang, D. Lv, F Jin and C. Zhang. Nonlinear seismic response analysis of high arch dams to spatially-varying
ground motions, J. Civil Engineering, 2018, doi.org/10.1007/s40999-018-0310-3.
13. E. Zacchei, J.L. Molina, MLRF Brasil, Nonlinear degradation analysis of arch‑ dam blocks by using deterministic
and probabilistic seismic input, J. Vibration Engineering & Technologies, vol 7, 2019, pp. 301–309,
doi.org/10.1007/s42417-019-00112-5.
14. J.R. Mays and L.H. Roehm, Effect of vertical contraction joints in concrete arch dams, Computers & Structures vol
47, no 4/5, 1993, pp. 615-627, Dyn., vol 39, 2010, pp. 731–750.
15. M.T. Ahmadi, M. Izadinia and H. Bachmann, A discrete crack joint model for nonlinear dynamic analysis of
concrete arch dam, Computers and Structures, vol 79, 2001, pp 403±420.

Proceedings of 36th National Convention of Civil Engineers & National Conference on ‗Innovation, Mechanization and Modern Techniques in Civil Engineering‘
organized by Jharkhand State Centre, 23-24 October, 2021
12
DOI: https://10.36375/prepare_u.iei.a112 ISBN 978-81-952159-1-1
Adoption of Modern Technology in Irrigation Projects A Case
Study of Ongoing Polavaram Project in Andhra Pradesh
I Satyanarayana Raju
Former Chief Engineer & Past Chairman IEI, Andhra Pradesh &Telangana State Centres, Hyderabad and Former
Council Member IEI (CVDB)
Abstract: Andhra Pradesh state has taken up Polavaram Irrigation Project across Godavari River with a gross storage
capacity of 195TMC (utilization-322TMC) which is presently in progress. The main dam components are Spillway
and the main Earth Cum Rock Fill Dam (ECRFD) of 1.75 km length and to a height of 48 M. The major Challenge is to
build ECRF Dam over deep permeable sand bed of about 60-90 M. Since conventional Cut off for such dams is
problematic, Plastic Concrete Diaphragm cut off wall utilizing modern international technology and machinery was now
resorted to by Project. Another challenge that was faced in the project is “building upstream and downstream coffer
dams” that has to facilitate construction main ECRF Dam on Godavari River which usually experience flashy floods. In
order to overcome permeable sandy foundation strata for the Cofferdams, in place of conventional Z-type Sheet pile cut
off of 20M-30M, an alternate foundation soil stabilization technique by Get-Grouting, an international technology was
adopted for cofferdams’ foundation to facilitate the construction of main ECRF Dam for early completion of project to
accrue its intended benefits.
GET-GROUTING Soil Stabilization
The construction of cofferdam on granular soils involves geo-technical problems of water seepage and potential piping
below temporary cofferdams. As per requirement of coffer dam design, Z-Sheet pile steel cut off with 18-20 mm thick
metal specification for 29 M depth for upstream Coffer dam (2.3 km length) and 16 M depth for downstream Cofferdam
of (1.57 km length) are needed. There was a problem of availability of 18-20 mm thick Z-type Sheet Piles, otherwise to
import of which likely will cause delay in the project in construction. An alternate Get- Grouting Soil stabilization for
cofferdams was proposed being the modern technology. In order to control the seepage below coffer dams, Jet Grouting
technique has been chosen based on overall exit gradient and duly conducting seepage analysis.
PASTIC CONCRETE DIAPHRAGM Cut off Wall for Earth Cum Rock Fill Dam
A Diaphragm wall is a civil engineering technique used to build reinforced concrete walls in areas of soft earth or sand
close to open water, or with a high groundwater table. This technique is typically used to build diaphragm (water-
blocking) walls in open cuts, to lay foundations and arrest seepage through foundation. This modern technology was
adopted for execution of main Earth Cum Rock Fill Dam of 48 M height and 1.75 km long across Godavari River having
deeper sandy bed needing 60-90 M deep as Cut off Wall (COW) with embedment in to impervious strata to overcome the
technology challenge in the project. For smaller depth of impervious strata, conventional cut off trench beneath Earth
dam is a general practice. But in the present case an order of 90 M cut of is to be done where seepage permeability is an
about 3-6 cum per day per meter width. In order to overcome this technical problem, Plastic Concrete Diaphragm wall
technology with deployment of imported machinery was resorted to.
The Polavaram ongoing Irrigation project across Godavari River in Andhra Pradesh has been the conceived over 8
decades back and delayed due to Geo-Technical Engineering Problems. Eminent international experts viz. Dr Karl
Terzaghi, Professor of Soil Mechanics; Dr JL Savage Chief Engineer from USA and Sir Murdole Macdonald, a famous
Consulting Engineer (ASWAN Dam) of London have either visited site or imparted technical advice on foundation
problems of the project. Finally the project is becoming a reality with adoption modern technology of this century by
overcoming foundation problems with adoption of JET-Grouting soil stabilization for coffer dam foundations and Plastic
Concrete Diaphragm Cut Off Wall (COT) beneath Earth Cum Rock Fill (ECRF) Dam during 2019. This Multipurpose
Dam is becoming a reality and making it possible by adoption of Modern Technology in civil engineering construction to
benefit seven (7) lakh hectares new command and Hydro-Power generation of 960 MW to enhance GDP of not only the
State but also the Nation.

Proceedings of 36th National Convention of Civil Engineers & National Conference on ‗Innovation, Mechanization and Modern Techniques in Civil Engineering‘
organized by Jharkhand State Centre, 23-24 October, 2021
13
PREAMBLE
Water is one of the five life sustaining elements called ‗Panchbhutas‘ and is a renewable Natural resource that can be
exploited for benefit of mankind and society at large. Water is called ‗Jivanam‘ in Sanskrit means the way of life and is a
priceless gift given by nature for sustenance of all kinds of life in the universe. Water plays an important role for
Drinking water, Agriculture, Production of essential commodities, Hydro Power generation, Industrial production,
Recreation, Transport, and Environment. Water is responsible for Global civilization and culture which ultimately led to
present economic growth and enhanced living standards of people. Hydrosphere is the combined mass of water found
below and over the surface of planet Earth. On earth there is 1386 million cubic kilometers of water which includes
liquid and frozen forms of ground water; oceans; lakes; and streams. Salt water accounts for 97.5% of total water and rest
2.5% is fresh water. Even in this total fresh water, about 68.7% is locked up in Glaciers and 29.9% exists as fresh ground
water ultimately making only 0.26% of total amount of fresh water on planet earth. It is easily accessible as surface water
in the reservoirs, lakes, water bodies and river systems.
WATER RESOURCES IN INDIA
India has 16% of the world's population, 4% of the world's water and only 2% of land area. The country receives about
4000 km3 of precipitation in a year. However, as much as 3000 km
3 of this comes as a rainfall in a short monsoon period
of 3 to 4 months from June to September. Even this availability of water is not uniform and is highly uneven in both
space and time. Average annual water resource potential of the country is estimated as 1869 cubic km. Considering the
constraints of hydrology, topography and geological limitations, only 690 cubic km. of surface water can be utilised by
conventional storage and diversion structures for optimal use of water. Turning to (dynamic) groundwater, the quantity
that can be extracted annually has been estimated to 432 km3.The systematic water resources development works have
been carried out through successive Five-Year Plans that followed since 1950. Presently the mechanism of financial
resources mobilization for irrigation development is looked after by Niti-Ayog of Government of India.
The National Commission on Water has made various assumptions in regard to these matters (high, medium and low
rates of change), and came to the conclusion that by the year 2050, the total water requirement of the country will be 973
km3 to 1180 km
3 under `low‘ and `high‘ demand projections, which means that supply will barely match demand. It is the
Commission‘s view that there will be a difficult situation but no crisis, provided that a number of measures on both the
demand side and the supply side are effectively taken on time.
The concept of ‗water stress‘ may not be out of place in this context. Dr Malin Falken mark, the leading Swedish expert,
has calculated the ‗water stress‘ situation of different countries with reference to ‗Annual Water Resources per Capita‘
(AWR). An AWR of 1700 m3
means that only occasional and local stress may be experienced; an AWR of less than 1000
m3 indicates a condition of stress; and one of 500 m
3 or less means a serious constraint and a threat to life. But the present
situation in India will be adversely change with the growing population by 2050. India is likely to join the ranks of
`water-stressed‘ countries in the future if counter measures are not taken up in right earnest.
The Indian rivers are carrying water of an order of 1953 billion cum with country‘s average rainfall of 1170 mm which is
accounting for 400 milion Ha Mts in volume. The utilizable water resource is order of 1086 BCM (Billion Cubic Metres)
against which present utilization is of the order of 600 BCM and the reason being for want of additional Storage Dams.
The present storage capacity of all reservoirs in India accounts for only175 BCM or 6180 TMC (Thousand Million Cubic
Feet) requiring to build more dams to accommodate total storage of 400 BCM or 14126 TMC for future needs of the
country.
ONGOING POLAVARAM IRRIGATION PROJECT IN ANDHRA PRADESH
In the endeavour to build large storage Dam, the State of Andhra Pradesh has taken up Polavaram Irrigation Project
across Godavari River on upstream of Sir Arthur Cotton Barrage (Dowlaiswaram Barrage) near Polavaram (v) in West
Godavari District with another flank in East Godavari District. The gross storage capacity of Polavaram project is
195TMC (utilization-322TMC) and this is an ongoing project. The project is intended to benefit 2.95 lakh Ha. (7.2 lakh
acres) of new ayacut, stabilization of 4.00 lakh Ha. of stabilization and drinking water supply to 540 villages with a
population of 28.5 lakhs. This dam also generates Hydro Power of 960MW.

Proceedings of 36th National Convention of Civil Engineers & National Conference on ‗Innovation, Mechanization and Modern Techniques in Civil Engineering‘
organized by Jharkhand State Centre, 23-24 October, 2021
14
Table 1 Salient Features of Polavaram Project
ADOPTION OF MODERN TECHNOLOGY IN POLAVARAM PROJECT
The major head work components of Polavaram project are Spillway of 1.128 km length to pass a flood discharge of
50lakh cusecs, main Earth Cum Rock Fill Dam (ECRFD) in the river portion is of 1.75 km length with a height of 48 Mts
and 960 MW generation capacity Hydro Power House. The major technical challenge is to build ECRF Dam over deep
permeable sand bed of about 60-90 M deep. Since conventional Cut off underneath of dam foundation such as Sheet pile
driving to such greater depth for such dams is problematic, a Plastic Concrete Diaphragm Cut Off Wall (COW) utilizing
modern international technology and machinery has been adopted.
Another technical challenge that was faced in the project is ―Building upstream and downstream Coffer dams‖ that has to
facilitate construction of main ECRF Dam in one working season is very critical on Godavari River which usually
experience flashy floods. In order to overcome the permeable sandy foundation strata for the Cofferdams, conventional
Z-type Sheet pile cut off of 20 M to 30 M deep have been originally proposed in the design. This process is very much
time taking to procure required Z-Sheet Pile material of that specification of 18-20 mm thick requiring import by placing
a special indent, which the project cannot afford such for its early completion. Hence an alternate foundation soil
stabilization technique for Coffer Dams by JET-GROUTING soil stabilization, an international technology was adopted
for the cofferdams foundations for further taking up main ECRF Dam having a length of 1.75 km length across main
River.
Figure 1 Index Map of Polavaram Project

Proceedings of 36th National Convention of Civil Engineers & National Conference on ‗Innovation, Mechanization and Modern Techniques in Civil Engineering‘
organized by Jharkhand State Centre, 23-24 October, 2021
15
Figure 2 Location Map & History of Polavaram Project
Figure 3 Site Plan showing location of Coffer Dams and Main Earth cum Rock Fill Dam
JET-GROUTING SOIL STABILIZATION TO OVERCOME PERMEABLE FOUNDATION (SANDY
STRATA) FOR COFFERDAMS
Jet Grouting is a process consisting of disaggregation of soil and mixing it with a cementing agent or binder. This is
achieved by high energy jets of grout comprising of a water/binder suspension injected through a nozzle, by which the
soil around the borehole is eroded. The eroded soil is brought into suspension, the soil particles rearranged and mixed
with the cement suspension, which subsequently sets and hardens to form a stabilized column of jet grout. Different
geometrical configurations of jet grout columns can be produced based on the project requirement with a minimum
diameter of 130 mm extending 200 mm to suit site conditions. The primary requirement of the jet grouting in this

Proceedings of 36th National Convention of Civil Engineers & National Conference on ‗Innovation, Mechanization and Modern Techniques in Civil Engineering‘
organized by Jharkhand State Centre, 23-24 October, 2021
16
instance is to reduce the permeability of the granular soil in the cut-off wall to less than 1 10-6
m/sec beneath the
cofferdams which facilitate to construct main Earth Cum Rock Fill (ECRF) Dam on the run of the river.
The construction of cofferdams on granular soils involves geotechnical problems of heavy water seepage and potential
piping below temporary cofferdams. The typical width and height of cofferdam at Upstream is about 173 m and 31.5 m
and that of downstream is of order of 118 m and 20.5 m at Downstream. As per requirement of coffer dam design, Z-
Sheet pile cut off with 18-20 mm thick metal specification for 29M depth for upstream Coffer dam (2.3 km length) and
16 M depth for downstream Cofferdam (1.57 km length) are needed. But the major Indian steel manufacturer, M/s SAIL
is manufacturing only 10 mm thick Z-type Sheet Piles and alternate importing of required design specification sheet pile
of 18-20 mm thick will be very much time consuming there by cause delay of project completion by more than a year or
two.
Hence the project authorities have finally decided to go in for Jet- Grouting Soil stabilization for cofferdams which is the
modern technology with imported machinery. To control the seepage, Jet Grouting technique has been chosen based on
overall exit gradient and duly conducting seepage analysis.
Figure 4 Coffer dam section
Figure 5 Basic concept of jet grouting

Proceedings of 36th National Convention of Civil Engineers & National Conference on ‗Innovation, Mechanization and Modern Techniques in Civil Engineering‘
organized by Jharkhand State Centre, 23-24 October, 2021
17
Jet Grouting Process
Jet grouting comprises of two prime processes, being the drilling and grouting process. The proposed jet grout cut-off
curtain comprises of a single row of over-lapping large diameter jet grout columns, spaced to ensure that the grout
column body formations will overlap with each other to form a continuous cut-off barrier.
Drilling is performed by rotary drilling methods, using a water or grout flush to form a hole in the order of 130 to 200
mm in diameter. This assists with the return of jetting spoil during the jetting operations.
Jetting is carried out from the ―bottom up‖ through controlled extraction of the drill rods which are fitted with specialized
Double Fluid (D) Jetting equipment. The two fluids being employed include: water/binder grout suspension and air. The
fluids are injected through a two-fluid monitor and nozzle. The water/binder grout suspension is injected through the
center of the nozzle under high pressure while air is introduced as a shroud around the high-pressure grout to aid the
penetration and mixing efficiency of the grout with the sands. The air also facilitates the release of the spoil return to the
surface.
The jetting is carried out as a ‗bottom-up‘ operation in which the drill string, with the jetting monitor attached at the base,
is slowly raised and rotated while injecting the grout to form a column of soil/cement. During jetting, the spoil returns
(excess material from the soil/grout mix) rise to the top of the drill hole, aided by the air from the air shroud, from where
they are diverted from the jetting position site.
The jet grout column characteristics (diameter, composition, permeability, strength of the columns, effective thickness of
the cut-off wall etc.) are dependent on the jetting parameters employed. These include rotation and extraction speeds,
jetting pressure and grout flow rate, the grout mix, as well as soil type, grain size distribution and consistency of the in-
situ soils.
The jetting parameters are dependent on the prevailing site conditions and as such are determined and verified on site
during the initial stages of the project. Jetting parameters and grout mixes will be reviewed and may be refined
throughout the production phase based on site observations and the outcome of test and Quality Assurance (QA)/Quality
Control (QC) data.
Figure 6 Jet grouting installation and nozzle flowing

Proceedings of 36th National Convention of Civil Engineers & National Conference on ‗Innovation, Mechanization and Modern Techniques in Civil Engineering‘
organized by Jharkhand State Centre, 23-24 October, 2021
18
Figure 7 Method of Jet Grouting Process
Grouting operation will be carried out by installing successive grout columns using a ‗Fresh in Fresh‘ sequence working
continuously in one direction where possible. This will ensure maximum erosion of the recently installed grout column
and building the new column thereby optimizing the interlocking and overlapping of the columns. The drilling/grouting
equipment will be marched in a direction working away from the completed columns and spoils returns. However,
alternative columns installation may be adopted in specific ground conditions where there is no possibility of employing
a successive method of installation of columns, termed as‖ Fresh in Fresh‖ installation.
Grout Mix Materials
The grout slurry will consist of a homogeneous mixture of Portland Pozzolana Cement (PPC), and Water, with the
possible addition of bentonite and/or other additives. It is noted that this proposal is based on the assumption that the on-
site water source (river flow) is free of deleterious materials and suitable for jet grouting purposes. The water will be
tested to ensure this assumption is correct and has no adverse effect on the setting or hardening the jet grout mix.
Mixing of Binder
The powdered binder (comprising cement and possibly pulverized fly ash / PPC, bentonite or other additives) and water
will be mixed in recirculated colloidal or jet valve grout mixers. With both of these systems, the powder is introduced
into a high-pressure stream of water and the components mixed into a cementitious grout suspension. The cement flow
and water flow can both be adjusted to generate the grout consistency and quantity desired. The mix proportions will be
measured by specific gravity of the grout which will be measured and monitored through a mass flow meter and checked
by mud balance.
Jet Grout Column
The diameter of the formed jet grout column will be checked during initial stage of works by excavating the treatment
area up to 2-3 m. The exposed columns will be visually inspected and the diameters and overlap measured and checked
to ensure that the operational parameters have achieved the design dimensions. The column identification shall be
verified once the drill rig is set up on the designlocation.
Drilling and Grouting Process
1. The Jet Grout Column identification shall be verified once the drill is set up on the design location.
2. The inclination of the mast will be checked for verticality to ensure the hole is drilled in a vertical alignment.
3. The depth encoder will be reset to zero based on the location of grout nozzle monitor location relative to the
working platform level (not with the tip of the drill bit depth).
4. Drilling will be carried out up to the specified design depth (base of cut-off wall level) relative to the starting level

Proceedings of 36th National Convention of Civil Engineers & National Conference on ‗Innovation, Mechanization and Modern Techniques in Civil Engineering‘
organized by Jharkhand State Centre, 23-24 October, 2021
19
5. The depth of drilling will be monitored and recorded continuously in the Data Acquisition (DAQ) system.
6. Grout pressure at design flow will be initiated once drilling is completed with the design flow and pressure
regulated and monitored throughout the grouting process.
7. The jet grout monitor will be withdrawn at specified withdrawal rate while maintaining the constant rotation speed
(rpm).
8. After completing the treatment at the cut-off level, grout flow will be stopped to allow pressure to dissipate.
9. DAQ recording of the column installation will be stopped and the monitor removed from the column location.
10. The project engineer will review jet grout column DAQ reports to ensure that the columns are installed in
accordance with the submitted and verified parameters.
11. The Engineer may revise and refine the production parameter throughout the works as confirming quality results are
achieved.
However, all these operating parameters will be defined after installation of initial columns to suit site specific conditions
before commencement of the main works.
Table 2 Proposed Operational Parameters for Jet Grouting
Description Parameter Range
Grout flow 250 to 450 ITS/minute
Grout pressure 300 to 450 bars
Withdrawal rate 10 to 30 cm/minute
Rotation per minute 4 to 12 RPM
Grouting Process starts upon completion of a jet grout column, the column location shall be topped up with jet grout
spoils to ensure the required design cut-off level is maintained. Spoil Handling is an important operation in Jet Grouting
since large amount of spoil returns are generated during the jetting of the columns. The composition of the spoil is a
mixture of the grout and the in-situ soil and has an initial fluid/ paste consistency which sets after a period of 24 to 72
hours.
The volume of spoil returns is expected to be of the order of 30-50 m3 for a 20 m long 2 m diameter column. The spoil
returns will be diverted away from the jetting operations to an area close to the working platform from where they will
need to be removed and disposed of by others on a regular daily basis.
Quality Control Tests
During production of Jet Grout columns, the spoil return will be usually observed with regard to volume, appearance,
flowability and consistency. Any variation will be recorded on the Jet logs and brought to notice of Project Engineer in
Charge.
Wet Grab Soil Cement return samples will be collected from ‗Spoil Return‘ for testing duly collected from jetting of
Upper, Middle and Lower sections of selected columns. The Cylinder of size 50 mm 120 mm test samples after curing
have to be tested for permeability in QC Laboratory of appropriate standards.
CONCRETE DIAPHRAGM CUT OFF WALL FOR MAIN EARTH CUM ROCK FILL (ECRF) DAM
A Diaphragm wall is a civil engineering technique used to build reinforced concrete walls in areas of soft earth or sand
close to open water, or with a high groundwater table. This technique is typically used to build diaphragm (water-
blocking) walls in open cuts, to lay foundations and arrest seepage through foundation of dams. The Construction of
main Earth Cum Rockfill dam of 48 M height and 1.75 km long across Godavari River with deeper sandy bed needing
60-90 Mts deep cut off wall with embedment in to impervious strata is another Technology challenge in the project. For
smaller depth of impervious strata, conventional cut off trench beneath Earth Dam is a general practice. But in the present
case, 60-90 Mts cut of is to be done where seepage permeability is an order of 3-6 cum per day per meter width. In order
to overcome this technical problem, Plastic Concrete Diaphragm wall of deeper depth technology with deployment of
imported machinery was resorted to.

Proceedings of 36th National Convention of Civil Engineers & National Conference on ‗Innovation, Mechanization and Modern Techniques in Civil Engineering‘
organized by Jharkhand State Centre, 23-24 October, 2021
20
Figure 8 Machinery of diaphragm wall and placement at dam site
Materials for Diaphragm Wall
Cement, Bentonite and admixtures, Crushed aggregates (max. size 12.5 mm) and river sand (0 to 4.75 mm).
Bentonite
The proportions of the slurry supporting fluid shall be altered to meet construction conditions by adding appropriate
admixtures at the discretion of Project for the proper consistency of the slurry and for the stability of the trench
excavation. The Bentonite used to produce the slurry shall be in accordance with the latest edition of the American
Petroleum Institute Standard 13A or any other known and appropriate standard.
Testing of Bentonite Slurry
For any 1 ton of bentonite used, it shall be tested and shall not deviate by more than 2% for moisture content; 2cP for
the apparent viscosity and a gel strength at 10 minutes after batching of 2 N/m² measured by ball harp method as per DIN
EN 4126.
Admixtures for Bentonite Slurry
Sodium-Bi-carbonate in case of cement contamination
CMC / PHPA types for adjusting viscosity, filtrateloss
Polyacrylate for plasticizing, de-sanding improvement
The Cut of Wall (COW) consists of approx. 68,112 m2 of area with a length of approx. 1,440 m (from Chainage CH-
58.80 m to CH-1550 m). The average depth from working platform level is approx. 47 m including 2 m rock socketing
whereas the maximum depth to 110 m from working platform level is considered at approx. CH-500 in Stage-2 area. One
special hydro-cutter for a max depth of 150 m is considered for the project. The thickness of the wall is specified with
nominal 1500 mm. COW embedded two (2) meter into alluvium/rock contact surface and concreted up to the top of the
guide wall. The effective cut-off wall will end at the bottom of the guide wall, allowing to prepare and install the head of
the COW / Diaphragm. For the Cut-off wall alignment, the nominal COW-thickness of dCOW = 1.50 m may be reduced at
depth due to the system intrinsic verticality deviations of up to 0.3%. The overall system permeability is not jeopardized
with possible verticality deviation of the individual panel.

Proceedings of 36th National Convention of Civil Engineers & National Conference on ‗Innovation, Mechanization and Modern Techniques in Civil Engineering‘
organized by Jharkhand State Centre, 23-24 October, 2021
21
Table 3 Statement showing the proposed bottom levels of diaphragm wall
Chainage
(M)
Length
(m)
Ground Level/River Bed
Level (M)
Fresh Rock
Level
2 m Anchoring in Fresh
Rock
Total Depth
(m)
0
30
150 120 8.40 -29.72 -31.72 40.12
270 120 6.78 -29.73 -31.73 38.51
390 120 12.46 -42.90 -44.90 57.36
500 110 15.61 -82.39 -84.39 100.00
540 40 15.09 -56.83 -58.83 73.92
640 100 13.52 -29.43 -31.43 44.95
750 110 14.39 -25.31 -27.31 41.70
915 165 15.25 -31.15 -33.15 48.40
1050 135 16.16 -15.34 -17.34 33.50
1200 150 16.09 -13.97 -15.97 32.06
1350 150 17.36 -15.79 -17.79 35.15
1445 95 26.32 -2.44 -4.44 30.76
1730 285 53.99
1750 20
Figure 9 Construction arrangement for diaphragm wall
Plastic Concrete
For good workability and flowability of the COW concrete, the proposed concrete properties are based on the experience
of more than 20 years of designing and installing plastic concrete in diaphragm walls forming concrete cut-off walls.
Deviating from these properties could jeopardize the quality of the COW for the project.

Proceedings of 36th National Convention of Civil Engineers & National Conference on ‗Innovation, Mechanization and Modern Techniques in Civil Engineering‘
organized by Jharkhand State Centre, 23-24 October, 2021
22
Figure 10 Typical earth cum rock fill dam section
Properties of concrete requirements for samples at the age of 28 days:
Unconfined compressive strength ≥ 1.0 MPa*
Confined compressive strength (c0.4 MPa) ≥ 1.5 MPa**
Strain at failure(unconfined test) ≥1%*
Permeability < 10-8 m/s*
* For acceptance testing a 10-point moving average shall apply;
** to be tested only for suitability trial and in case of doubt
Mix Design – Development
Trial tests shall be carried out to specify a mix design for plastic concrete which meets the requirements aforesaid. The
maximum grain size shall not exceed 12.5 mm. During construction, the actual composition shall be recorded for each
batch of concrete and batching shall not deviate by more than 5% per ingredients.
Concreting Placing of Plastic Concrete in the Cut Off Trench
Concrete will be supplied to the trench locations by concrete trucks at a sequence sufficient to ensure a minimum
required pouring rate per hour via tremie pipe, sufficient to ensure a minimum rising of the concrete level in the panel of
3 m per hour. The plastic concrete will be poured directly from the truck mixer into the hopper of the tremie pipe string.
For panels up to 7 M, two tremie pipes shall be used and concrete to be poured simultaneously. During concreting the
tremie pipes will be kept continuously immersed in the fresh concrete by a minimum of 3 m. While the concrete is rising
from bottom to top, sections of the tremie pipe string will be removed fulfilling the requirement of a minimum 3M
embedment of the bottom of the string into fresh concrete on one side and ensuring constant flow of fresh concrete on the
other side.
Concreting will be carried out typically at maximum to top of guide wall in order not to unduly spoil the working

Proceedings of 36th National Convention of Civil Engineers & National Conference on ‗Innovation, Mechanization and Modern Techniques in Civil Engineering‘
organized by Jharkhand State Centre, 23-24 October, 2021
23
platforms with concrete overflow. Some concrete mixed with bentonite slurry may remain within the upper layer of the
cut off wall. Any slurry and/or COW concrete remaining within the guide wall perimeter after COW completion will be
removed during demolition of the actually existent working platform and guide wall down to the specified depth from the
top of existent working platform including the Blinding Concrete. For trimming the wall head while removing the guide
walls particular care shall be taken.
Figure 11 Earth cum rock fill dam cross section
Figure 12 Cut off wall construction set up for ECRF Dam
Proceedings of 36th National Convention of Civil Engineers & National Conference on ‗Innovation, Mechanization and Modern Techniques in Civil Engineering‘
organized by Jharkhand State Centre, 23-24 October, 2021
24
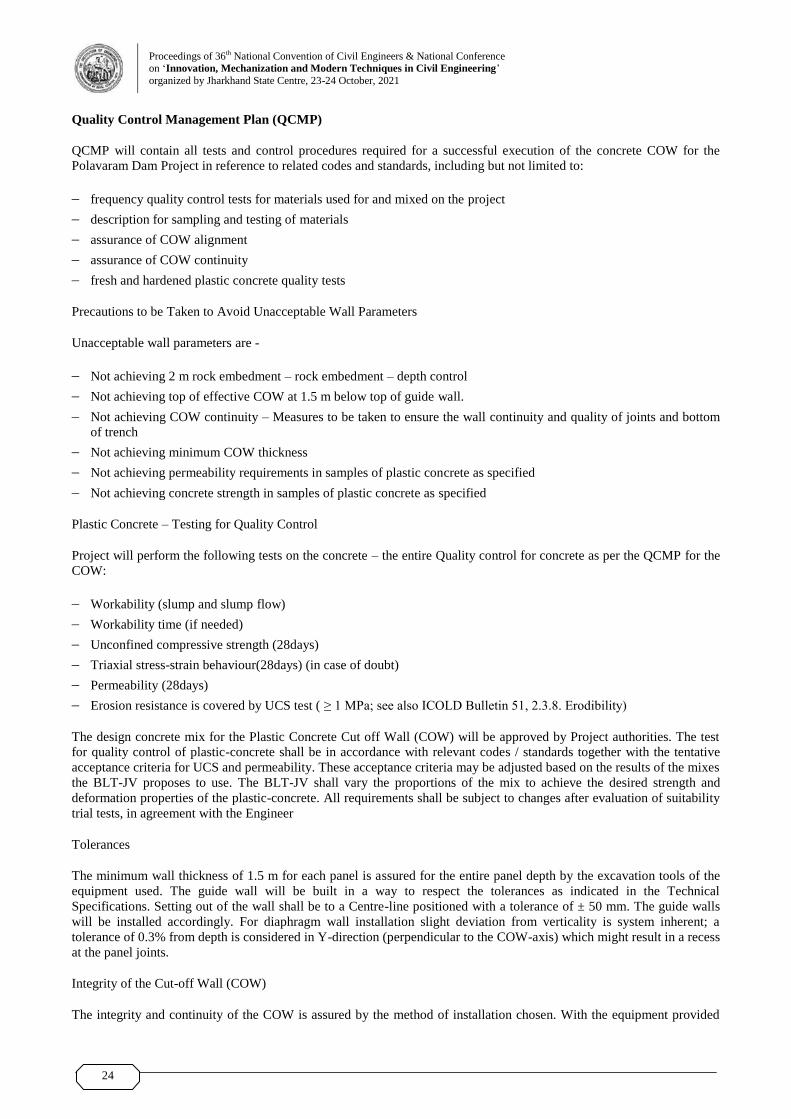
Quality Control Management Plan (QCMP)
QCMP will contain all tests and control procedures required for a successful execution of the concrete COW for the
Polavaram Dam Project in reference to related codes and standards, including but not limited to:
frequency quality control tests for materials used for and mixed on the project
description for sampling and testing of materials
assurance of COW alignment
assurance of COW continuity
fresh and hardened plastic concrete quality tests
Precautions to be Taken to Avoid Unacceptable Wall Parameters
Unacceptable wall parameters are -
Not achieving 2 m rock embedment – rock embedment – depth control
Not achieving top of effective COW at 1.5 m below top of guide wall.
Not achieving COW continuity – Measures to be taken to ensure the wall continuity and quality of joints and bottom
of trench
Not achieving minimum COW thickness
Not achieving permeability requirements in samples of plastic concrete as specified
Not achieving concrete strength in samples of plastic concrete as specified
Plastic Concrete – Testing for Quality Control
Project will perform the following tests on the concrete – the entire Quality control for concrete as per the QCMP for the
COW:
Workability (slump and slump flow)
Workability time (if needed)
Unconfined compressive strength (28days)
Triaxial stress-strain behaviour(28days) (in case of doubt)
Permeability (28days)
Erosion resistance is covered by UCS test ( ≥ 1 MPa; see also ICOLD Bulletin 51, 2.3.8. Erodibility)
The design concrete mix for the Plastic Concrete Cut off Wall (COW) will be approved by Project authorities. The test
for quality control of plastic-concrete shall be in accordance with relevant codes / standards together with the tentative
acceptance criteria for UCS and permeability. These acceptance criteria may be adjusted based on the results of the mixes
the BLT-JV proposes to use. The BLT-JV shall vary the proportions of the mix to achieve the desired strength and
deformation properties of the plastic-concrete. All requirements shall be subject to changes after evaluation of suitability
trial tests, in agreement with the Engineer
Tolerances
The minimum wall thickness of 1.5 m for each panel is assured for the entire panel depth by the excavation tools of the
equipment used. The guide wall will be built in a way to respect the tolerances as indicated in the Technical
Specifications. Setting out of the wall shall be to a Centre-line positioned with a tolerance of ± 50 mm. The guide walls
will be installed accordingly. For diaphragm wall installation slight deviation from verticality is system inherent; a
tolerance of 0.3% from depth is considered in Y-direction (perpendicular to the COW-axis) which might result in a recess
at the panel joints.
Integrity of the Cut-off Wall (COW)
The integrity and continuity of the COW is assured by the method of installation chosen. With the equipment provided

Proceedings of 36th National Convention of Civil Engineers & National Conference on ‗Innovation, Mechanization and Modern Techniques in Civil Engineering‘
organized by Jharkhand State Centre, 23-24 October, 2021
25
each individual panel element will have the specified thickness given by the defined size of the excavation tooling –
whether size of the grab or dimensions of the pair of cutter wheels. Positioning of the individual panels and the real
overlap between neighbouring panels will be controlled and mapped. Position-control during excavation with cutter-
inbuilt inclinometer is cross-controlled with equipment which is equivalent to the Cutter Inclination-System (CIS). Final
position control will be with a state-of-the-art sonic-measuring device like Bauer Ultrasonic System or KODEN.
Cleaning of the trench bottom will be executed by the cutter installed high performance pump typically while exchanging
working slurry to concreting slurry to clean the contact with the bedrock at the bottom of the Diaphragm wall. A
compliance check together with the Engineer will take place at the de-sanding unit checking sand content of the
concreting slurry and that no large size cuttings are still pumped from the bottom of the fully excavated panel. The cutter
excavated secondary panel assures the best possible contact to the neighbouring primary panels by creating a serrated
surface for perfect interlocking. Concreting as per Technical Specification with the approved concrete mix will be
controlled during concreting and recorded. Uninterrupted concreting by the tremie-method will assure a continuous
monolithic concrete panel of the full cross-section.
CONCLUSION
The Polavaram Major Dam is an ongoing Irrigation project across Godavari River in Andhra Pradesh has been conceived
over 8 decades back in erstwhile MADRAS state and now going to be completed by 2022. The main reason of delay in
taking up execution is due to the difficult Geo-technical engineering problems in the of sandy river bed as deep as 60-90
mts below. Eminent international experts viz. Dr Karl Terzaghi, Professor of Soil Mechanics; Dr J L Savage Chief
Engineer from USA and Sir Murdole Macdonald, a famous Consulting Engineer (ASWAN Dam) of London have either
visited site or imparted technical advice on foundation problems of the project. Finally, the project is becoming a reality
with the advent and adoption of modern technology of this century by overcoming the foundation problem of Coffer
dams both on upstream and downstream with the adoption of JET-Grouting soil stabilization to facilitate construction of
main Earth Cum Rock Fill Dam. Similarly, modern technology of Plastic Concrete Diaphragm cut off wall beneath Earth
Cum Rock Fill Dam was implemented during 2019. This Multipurpose Dam is programmed for completion by 2022 and
could make it possible only by adoption of Modern Technology in the difficult project construction scenario. The floods
of mighty Godavari River in 2021 season arepresently passing over 1.13 km long commissioned Spillway of project
located on the right flank of main River and simultaneously the Earth Cum Rock Fill Dam (ECRF) is progressing in the
main River Course. Thus, ultimately the projectis reaping benefits of 2.95 lakh Hectares of new command and stabilizes
lower riparian 4 lakh hectares of Godavari Delta ayacut under existing Sir Arthur Cotton Barrage at Dowlaiswaram in the
downstream. In addition, 960 MW of Hydel Power will be generated adding GDP not only to state of Andhra Pradesh but
also that of INDIA.
REFERENCES
1. Gutberle, Slurry Walls. Virginia Tech. Archived from the original on 2007-08-24, Retrieved 2012-01-05, 1994.
2. M. Bahrami, M.I. Khodakarami, A. Haddad, Seismic behavior and design of strutted diaphragm walls in sand.
Computers and Geotechnics, vol. 108, April 2019, pp. 75–87, doi:10.1016/j.compgeo 2018.12.019.
3. M/S Keller Report on Jet Grouting Works under Coffer Dam of Polavaram dated 19-09-2017.
4. BAUER, Specialized Foundation Contractor India and L&T Geo-Structures Report of Cut Off Wall (COW) Works
with Grab & Trench Cutter of Polavaram Project dated 05-01-2017.
5. Polavaram Irrigation Project Reports with Courtesy of Senior Project Engineers during 2017-2019.

Proceedings of 36th National Convention of Civil Engineers & National Conference on ‗Innovation, Mechanization and Modern Techniques in Civil Engineering‘
organized by Jharkhand State Centre, 23-24 October, 2021
26
DOI: https://10.36375/prepare_u.iei.a123 ISBN 978-81-952159-1-1
Analytical Study on the Behaviour of Concrete In-filled FRP
Tubular Columns Subjected to Lateral Cyclic Loading
Varunkumar V, Gajalakshmi P and Revathy J
Department of Civil Engineering, B S Abdur Rahman Crescent Institute of Science and Technology, Seethakathi Estate,
GST Road, Vandalur, Chennai, Tamil Nadu
Abstract: The purpose of this paper is to present a three-dimensional non-linear finite element analysis of concrete in-
filled Fiber-Reinforced Polymer (FRP) tubular columns subjected to lateral cyclic loading. Stress-Strain Confined
model, Hashin’s damage failure model, and plasticity model were used to model concrete, fiber-reinforced polymer tubes
and steel reinforcement inside the tubes. The parameters involved in this study are strength of concrete, fiber orientation,
thickness of the tube, and interfacial bonding. The load-deflection behaviour and failure patterns were investigated using
finite element analysis. The results obtained from this numerical study that concrete in-filled FRP tubular columns with
5mm tube thickness showed higher load carrying capacity compared to columns with 3 mm tube thickness. The results
revealed that concrete in-filled FRP tubular columns with fiber orientation in hoop direction (0) have higher load
carrying capacity and ductility when compared to columns with fiber orientation of 30 and 53. The results showed that
there is no considerable difference in interfacial bonding of the concrete in-filled FRP tubular columns with different co-
efficient of friction between FRP tubes and concrete.
Keywords: Finite Element Analysis, Fiber Reinforced Polymer Tubes, Fiber Orientation, Thickness of the FRP Tube,
Interfacial Bonding
INTRODUCTION
Fiber Reinforced Polymer (FRP) tubular columns are used to improve the strength and ductility of the structural members
and provide several advantages, including a low weight-to-strength ratio, a high degree of confinement, and corrosion
resistance. The FRP tube functions as a stay-in-place formwork, confining and strengthening the concrete structural
element. Because of the linear elastic stress-strain behaviour of FRP, the confinement pressure generated by it increases
continuously with the lateral strain of concrete, unlike steel-confined concrete, where the confining pressure remains
constant when the steel is in plastic flow[1]. Due to the significant improvement in ductility and strength of confined
concrete columns over the last two decades, their application has expanded dramatically, particularly in construction of
structural members which are built to withstand seismic loading.
This research involves the non-linear Finite Element Analysis of concrete in-filled FRP tubular column, with different
fiber orientations, thickness of FRP tube and interfacial bonding between the FRP tube and concrete surface. These
parameters are chosen to understand the influence of these parameters on the behaviour of Concrete in-filled FRP tubular
columns. To accurately reflect the non-linear behaviour of such structural members, numerical approaches must be used
to make such predictions. It takes into account cracking and plasticity in concrete, as well as the effect of material and
geometrical non-linearity.
FINITE ELEMENT MODELLING
Finite element analysis [FEA] is critical in modern structural engineering research for interpreting experimental results
and gaining insight into the structural behaviour of concrete in-filled FRP tubular columns. During this research, the
impact of the fiber orientation, thickness of the FRP tube and interfacial bonding on the behaviour of the concrete in-
filled FRP tubular columns subjected to lateral cyclic loading were examined. The geometrical properties of the concrete
in-filled FRP tubular column specimens were listed in Table 1.

Proceedings of 36th National Convention of Civil Engineers & National Conference on ‗Innovation, Mechanization and Modern Techniques in Civil Engineering‘
organized by Jharkhand State Centre, 23-24 October, 2021
27
Table 1 Geometrical properties of the specimens
Specimen
Label
Height of
the Column
(mm)
Diameter of
the Column
(mm)
Internal
Longitudinal
Reinforcement
Lateral
Confinement
Thickness of
the FRP Tube
(mm)
Fiber
Orientation
C3F0 1000 150 Steel GFRP 3 0
C5F0 1000 150 Steel GFRP 5 0
C3F53 1000 150 Steel GFRP 3 53
C5F53 1000 150 Steel GFRP 5 53
C3F30 1000 150 Steel GFRP 3 30
C5F30 1000 150 Steel GFRP 5 30
MODELLING
Modeling of Concrete
The confined concrete is modeled as 3-Dimensional Deformable 8-nodded solid brick element with reduced integration
(C3D8R) by using Concrete Damaged Plasticity (CDP) model [2]. It encompasses all aspects of 3-dimensional non-linear
inelastic behaviour of the confined concrete including confinement, damage mechanisms, as well as compressive, tensile,
and plastic properties in the inelastic range. Up to 50% of the ultimate strength of confined concrete can be attributed to
the linear elastic component of the stress-strain curve, which can be defined using two parameters as elastic modulus and
Poisson's ratio.
The compressive strength of confined concrete (fcc) and the corresponding constrained deformation (fco) can be
determined by Equations (1) and (2), respectively. Equation (1) proposed by Richart, et al. [3] and Equation (2) modified
by Lam and Teng [4] which are used in this study to model stress-strain behaviour of concrete.
fcc/fco = 1 + 3.3 fl,a /fco (1)
cu/co = 1.75 + 12 (fl,a /fco) (h,rup /co)0.45 (2)
Where fl,a is the lateral confining pressure of FRP, fl,a = 2fftf/D; ff is the tensile strength in hoop direction and tf is the
thickness of the FRP tube.
The Poisson's ratio was assumed to be 0.2 for confined concrete core material, and the elastic modulus was calculated
using Equation (3) from the American Concrete Institute (ACI 318 code) [5].
Ecc = 4700√fcc (3)
Where Ecc is the elastic modulus and fcc is the compressive strength of concrete. The grade of concrete used to model the
concrete is M-25.
The equivalent axial stress-strain curve of the confined concrete is defined by distinguishing between the parabolic and a
straight section of the curve is shown in Figure 1 [4].
Solid homogeneous section was assigned to the confined concrete under section assignment manager. Further modeling
of confined concrete was done in the assembly of the other materials.
Modelling FRP Tube
The FRP tubes were modeled with 3-D deformable 4-noded doubly curved shell elements, and reduced integration
(S4R), with six degrees of freedom at each node [2]. FRP tubes were modeled under the classical laminate theory with
the elastic properties. The laminate strength, elastic properties, and damage progression are required to characterize the
behaviour of FRP tubes. Material type ―Lamina‖ is assigned to model the elastic behaviour of FRP tube, and the elastic
modulus of hoop direction of FRP tube obtained from the Table 2 [6]. The Poisson‘s ratio was calculated to be 0.3.

Proceedings of 36th National Convention of Civil Engineers & National Conference on ‗Innovation, Mechanization and Modern Techniques in Civil Engineering‘
organized by Jharkhand State Centre, 23-24 October, 2021
28
In this study, the Hashin damage criterion [7] was utilized to describe all modes of failure of FRP tubes, including
strength and damage behaviour, because this model accurately predicts fiber and matrix tensile and compressive damage.
Table 3 shows various parameters used to characterize the Hashin damage model of FRP tubes [6].
Figure 1 Axial stress-strain curve of confined concrete [4].
Table 2 Elastic properties of GFRP Tubes [6]
Elastic Modulus,
E1 (MPa)
Elastic Modulus,
E2 (MPa)
Poisson’s
Ratio
Shear Modulus,
G1 (MPa)
Shear Modulus,
G2 (MPa)
Shear Modulus,
G3 (MPa)
28000 1040 0.3 5200 5200 3400
Table 3 Hashin Damage model variables for GFRP tubes [6]
Tensile Strength
in Longitudinal
Direction (MPa)
Compressive
Strength in
Longitudinal
Direction (MPa)
Tensile
Strength in
Transverse
Direction
(MPa)
Compressive
Strength in
Transverse
Direction
(MPa)
Shear Strength in
Longitudinal
Direction (MPa)
Shear Strength
in Transverse
Direction
(MPa)
1200 140 40 40 20 20
The homogeneous shell section had been assigned to the FRP tube by the section assignment manager. For FRP tubes,
the composite layup property had been assigned in order to provide the shell thickness, fiber orientation and the
integration points.
Modeling Steel Reinforcement Bars and Steel Plates
The longitudinal and transverse reinforcement bars had been modeled using 3-Dimensional truss components with
reduced integration. The longitudinal reinforcement was of 12 mm diameter and transverse reinforcement was of 8mm
diameter with 120 mm c/c spacing. The elastic material properties were assigned to the steel bars with the elastic
modulus of 200 GPa and the poisson‘s ratio of 0.3. The plastic material properties were assigned with the yield stress of
500 MPa and the ultimate strain of 0.2. The steel plates were modeled on the top and bottom of the concrete in-filled FRP
tubular columns in order to improve the rigidity while loading. These plates were also provided the same elastic and
plastic properties as that of reinforcement steel bars.
Surface Interactions and Boundary Conditions
The accuracy of Finite Element Analysis is determined by the boundary conditions and material simulations. In order to
avoid surface penetration, the interaction between the outer surface of the concrete and the inner surface of the FRP tube
is treated as a normal hard contact, and frictional contact in the tangential direction of the component is specified and
using the coefficient of friction of 0.25 and 0.5. The normal and tangential friction coefficients were 0.35 to simulate the

Proceedings of 36th National Convention of Civil Engineers & National Conference on ‗Innovation, Mechanization and Modern Techniques in Civil Engineering‘
organized by Jharkhand State Centre, 23-24 October, 2021
29
connection between the concrete surface and the rigid steel plate surface using hard contact interactions and friction
contact interactions. The surface of the concrete core material is the master surface and the surface of the steel plate is the
slave surface. The surface of the rigid steel plate was used as the master surface by providing reference points in the plate
to connect the node areas of the FRP tube. One constraint is provided for the steel plate as the rigid body and the other
constraint is provided for the reinforcement as the embedded part in the confined concrete. The top of the columns
remain unconstrained, while the bottom is constrained with all the degrees of freedom. The typical sectional view of
concrete in-filled FRP tubular columns modeled using Finite Element Analysis software is shown in Figure 2.
Figure 2 Typical sectional view of concrete in-filled FRP tubular column modeled using Finite Element Analysis
software.
Loading Pattern
The axial compressive and lateral cyclic loading ensures that the GFRP tube, Concrete core, and Steel plates are in
constant contact. The displacement increment was used to apply axial and lateral cyclic loading to the top and lateral
surfaces of the column. The displacement was applied to all nodes on the top and lateral surface of the concrete core
confining them together, to imitate the stiff condition of the loading plate in the testing machine. The outputs of stresses,
strains, deflections, and reaction forces at most important sites were saved and processed after the solution converged at
each sub-step to obtain the axial and lateral load-deflection response, ultimate stress and strain for the specimens. The
loading pattern applied to the concrete in-filled FRP tubular columns was presented in Figure 3.
Figure 3 Loading pattern applied to the concrete in-filled FRP tubular column
RESULTS AND DISCUSSION
Load-deflection Behaviour
The Load-deflection curves of the concrete in-filled FRP tubular column specimens of different fiber orientations,
thickness of the FRP tube and interfacial bonding between the FRP tube and concrete core were presented in Figure 3. In
the early stages of loading, a linear part was observed between load and the deflection of the FRP tube column. But after
yielding, the load increased linearly, forming the second linear part of the curve. After that, the load reached the

Proceedings of 36th National Convention of Civil Engineers & National Conference
on ‗Innovation, Mechanization and Modern Techniques in Civil Engineering‘
organized by Jharkhand State Centre, 23-24 October, 2021
30
maximum capacity with the rupture of FRP tubes causing the load capacity to decrease rapidly as shown in Figure 4. The
load carrying capacity of column C5F0 was 2.08 times higher than the column C3F0, column C5F30 was 1.89 times
higher than the column C3F30, column C5F53 was 3.17 times higher than the column C3F53. The FRP tube of greater
thickness exhibits enhanced load carrying capacity and good confinement to the concrete core.
The load carrying capacity of column C3F0 was 1.29 times higher than the column C3F30 and 3.51 times the column
C3F53 and column C5F0 was 1.43 times higher than the column C5F30 and 2.31 times the column C5F53.
Failure Pattern
The Load-deflection responses of the columns exhibits a linear relationship up to about 70-80% of the failure load as
presented in Figure4. It is observed that column C5F0 has contributed substantially resulting in higher load carrying
capacity and lesser deflection than other concrete in-filled FRP tubular columns as shown in Figure 4. The Finite
element analysis model crack mode is visualized by the maximum positive plastic deformation, and the concrete material
that accurately represents the crack mode where the cracking pattern is perpendicular to the principal cracks. When the
concrete cracks with its volumetric expansion, confinement of the concrete relieves the stress on the confined FRP tube
until they fail simultaneously. Such failures results in sudden drop in the loading shown in Figure 4.
Figure 4 Load-deflection behaviour of concrete in-filled FRP tubular column.
Effect of GFRP Tube Thickness
GFRP tubes with thicknesses of 3 mm and 5 mm were examined to observe their effect on column load carrying capacity
and corresponding deflection. The columns with 5mm thickness (C5F0, C5F30, and C5F53) exhibits increase in load
carrying capacity than columns with 3 mm thickness (C3F0, C3F30, and C3F53) as presented in Figure 5(a), (b), and
(c). Load carrying capacity of column C5F0 was 2.08 times higher than that of column C3F0 as shown in Figure 5(a).
The load carrying capacity of column C5F30 was 1.89 times higher than that of column C3F30 as presented in Figure
5(b). The column C5F53 exhibits 3.17 times higher load carrying capacity than column C3F53 as shown in Figure 5(c).
As observed, the concrete in-filled FRP tubular column of thickness 5 mm has the higher load capacity and lesser
deflection of compared to the column thickness of 3 mm. From Figures 5 (a), (b), and (c), FRP tube with lesser thickness
exhibit better ductility compare to other columns.
Effect of Fiber Orientation
The behaviour of concrete in-filled FRP tubular columns is significantly affected by the orientation of confined fibers. It
is important to understand and to simulate the influence of fiber angle on the behaviour of FRP confined concrete. From
the Figure 6(a), the load carrying capacity of column C3F0 was 1.29 times than the column C3F30 and 3.51 times than
the column C3F53. The load carrying capacity of column C5F0 was 1.43 times higher than the column C5F30 and 2.31
times higher than the column C5F53 as shown in Figure 6(b). It can be seen that the failure load of the specimen
increases as the ply laminate angle increases in the length direction. It is observed that the fiber orientation in the hoop
direction (0) contributes to the higher ultimate load. Therefore, it is concluded that as the arrangement of the fibers
concerning the direction of the hoop increases, the efficiency of the fiber decreases significantly which is consistently
reported in the previous research.

Proceedings of 36th National Convention of Civil Engineers & National Conference
on ‗Innovation, Mechanization and Modern Techniques in Civil Engineering‘
organized by Jharkhand State Centre, 23-24 October, 2021
31
5(a) 5(b)
5(c)
Figure 5 Effect of thickness of the FRP tube with 3 mm and 5 mm specimens (a) 0, (b) 30, and (c) 53
6(a) 6(b)
Figure 6 Effect of fiber orientation in 0, 30, and 53 specimens (a) 3 mm, and (b) 5 mm.
Effect of Interfacial Bonding
In this section, the influence of interfacial bonding on the load-deflection response of the concrete in-filled FRP tubular
columns was considered. The coefficient of friction between FRP and concrete core was chosen to be 0.25 and 0.5 for the
different thickness and fiber orientations of the FRP tube. From the Figures 7(a) and (b), there is no changes in the Load-
deflection behaviour with the frictional co-efficient of 0.25 and 0.5. It can be concluded there is not much changes in the
interfacial bonding on the load-deflection behaviour of concrete in-filled FRP tubular columns.
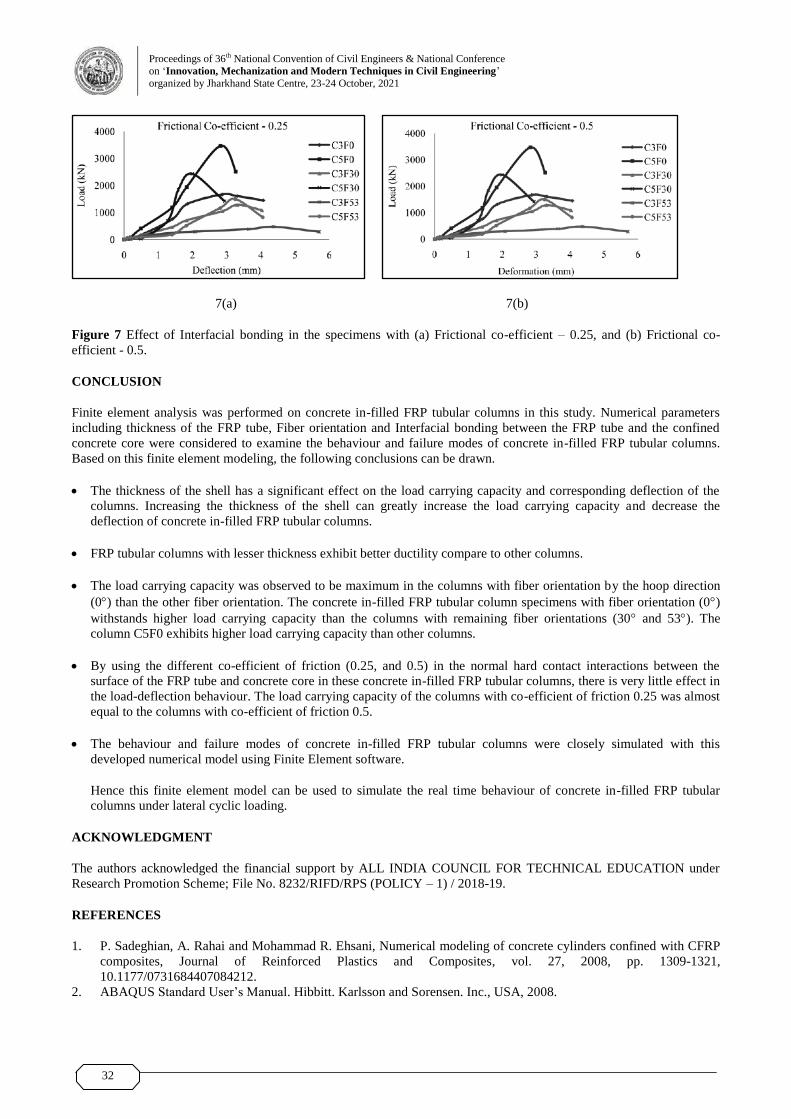
Proceedings of 36th National Convention of Civil Engineers & National Conference
on ‗Innovation, Mechanization and Modern Techniques in Civil Engineering‘
organized by Jharkhand State Centre, 23-24 October, 2021
32
7(a) 7(b)
Figure 7 Effect of Interfacial bonding in the specimens with (a) Frictional co-efficient – 0.25, and (b) Frictional co-
efficient - 0.5.
CONCLUSION
Finite element analysis was performed on concrete in-filled FRP tubular columns in this study. Numerical parameters
including thickness of the FRP tube, Fiber orientation and Interfacial bonding between the FRP tube and the confined
concrete core were considered to examine the behaviour and failure modes of concrete in-filled FRP tubular columns.
Based on this finite element modeling, the following conclusions can be drawn.
The thickness of the shell has a significant effect on the load carrying capacity and corresponding deflection of the
columns. Increasing the thickness of the shell can greatly increase the load carrying capacity and decrease the
deflection of concrete in-filled FRP tubular columns.
FRP tubular columns with lesser thickness exhibit better ductility compare to other columns.
The load carrying capacity was observed to be maximum in the columns with fiber orientation by the hoop direction
(0) than the other fiber orientation. The concrete in-filled FRP tubular column specimens with fiber orientation (0)
withstands higher load carrying capacity than the columns with remaining fiber orientations (30 and 53). The
column C5F0 exhibits higher load carrying capacity than other columns.
By using the different co-efficient of friction (0.25, and 0.5) in the normal hard contact interactions between the
surface of the FRP tube and concrete core in these concrete in-filled FRP tubular columns, there is very little effect in
the load-deflection behaviour. The load carrying capacity of the columns with co-efficient of friction 0.25 was almost
equal to the columns with co-efficient of friction 0.5.
The behaviour and failure modes of concrete in-filled FRP tubular columns were closely simulated with this
developed numerical model using Finite Element software.
Hence this finite element model can be used to simulate the real time behaviour of concrete in-filled FRP tubular
columns under lateral cyclic loading.
ACKNOWLEDGMENT
The authors acknowledged the financial support by ALL INDIA COUNCIL FOR TECHNICAL EDUCATION under
Research Promotion Scheme; File No. 8232/RIFD/RPS (POLICY – 1) / 2018-19.
REFERENCES
1. P. Sadeghian, A. Rahai and Mohammad R. Ehsani, Numerical modeling of concrete cylinders confined with CFRP
composites, Journal of Reinforced Plastics and Composites, vol. 27, 2008, pp. 1309-1321,
10.1177/0731684407084212.
2. ABAQUS Standard User‘s Manual. Hibbitt. Karlsson and Sorensen. Inc., USA, 2008.

Proceedings of 36th National Convention of Civil Engineers & National Conference
on ‗Innovation, Mechanization and Modern Techniques in Civil Engineering‘
organized by Jharkhand State Centre, 23-24 October, 2021
33
3. F.E. Richart, A. Brandtzaeg and R.L. Brown. A study of the failure of concrete under combined compressive
stresses. Bulletin no. 185, University of Illinois, Eng. Experimental Station, Champaign, 1928.
4. L. Lam and J.G. Teng, Design-Oriented Stress-Strain Model for FRP-Confined Concrete, Construction and
Building Materials, vol.17, 2003, pp. 471-489, 10.1016/S0950-0618(03)00045-X.
5. ACI (American Concrete Institute). Building code requirements for structural concrete and commentary, ACI
318M-08, USA, 2008.
6. M.H. Abdallah, M. Shazly, H.M. Mohamed, R. Masmoudi and A. Mousa, Nonlinear finite element analysis of short
and long reinforced concrete columns confined with GFRP tubes, Journal of Reinforced Plastics and Composites,
vol. 36, 2017, 073168441769875. 10.1177/0731684417698758.
7. Z. Hashin, Failure criteria for unidirectional fiber composites. J. Appl. Mech. vol. 47, no. 2, 1980, pp. 329–334.
8. W-K Hong and H-C Kim, Behaviour of concrete columns confined by carbon composite tube, Canadian Journal of
Civil Engineering, vol. 31, 2011, 178-188. 10.1139/l03-078
9. H-T Hu, C.S. Huang, M-H Wu and Y-M Wu, Nonlinear analysis of axially loaded concrete-filled tube columns
with confinement effect, Journal of Structural Engineering, J Struct Eng, ASCE, vol. 129, 2003,
10.1061/(ASCE)0733-9445(2003)129:10(1322).
10. ASCE (American Society of Civil Engineers), Task committee on concrete and masonry structure, State of the art
report on finite element analysis of reinforced concrete, New York, 1982.
11. J.G. Teng and L. Lam, Behaviour and modeling of fiber reinforced polymer-confined concrete, J Struct Engng
ASCE, vol. 130, no. 11, 2004, pp.713-723.
12. A. Parvin and A.S. Jamwal. Effects of wrap thickness and ply configuration on composite-confined concrete
cylinders. Compos Struct, vol. 67, no. 4, 2005, pp. 437–442.

Proceedings of 36th National Convention of Civil Engineers & National Conference
on ‗Innovation, Mechanization and Modern Techniques in Civil Engineering‘
organized by Jharkhand State Centre, 23-24 October, 2021
34
DOI: https://10.36375/prepare_u.iei.a107 ISBN 978-81-952159-1-1
Application of Fly Ash Cenosphere in Cement Composites: A
Comprehensive Review
S K Patel1, C R Mohanty
2 and A N Nayak1
1 Department of Civil Engineering, VSS University of Technology, Burla, Odisha
2 Department of Civil Engineering, Parala Maharaja Engineering College, Berhampur, Odisha
Abstract: Fly Ash Cenosphere (FAC) is an abundantly produced waste material generated from the coal based thermal
power plants in India. Its utilization has received a great deal of attention over the past two decades as sustainable
solutions to disposal problems. The lightweight nature of the FAC makes it suitable for the design of light weight
composite materials. A range of different composites have been evaluated starting from its incorporation into polymers
and resins to concrete composite. This paper reviews the past works/research carried out on the use of FAC as a
substitute of fine-grained aggregate in cement composite. The exhaustive overview on the utilization of cenosphere in
cement composite include effect of FAC on the properties of cement composite such as density, workability, flexural
strength, compressive strength, tensile strength, acoustic property, thermal conductivity etc. It is also concluded that the
FAC can be utilized in cement composite without compromising the strength of the structures.
Keywords: Fly Ash Cenosphere, Cenosphere Cement Composite (CCC), Fine-Grained Aggregate, Acoustic Property
INTRODUCTION
Coal fly ash (CFA) is an industrial by-product generated during the combustion of pulverised coal at 1200-1700C in
coal-fired thermal power stations and recognized as an ecological pollutant[1-4]. CFA predominantly contains mixture of
glass, quartz-mullite, Ca silicate-oxyhydroxide, char, iron and salt fractions including hollow spherical particles in a
separable form called as cenospheres[5]. These fly ash cenospheres (FAC) are considered to be one of the most important
value-added components of CFA[6]. Due to its sphericity, non-toxicity, high strength and low density relative to water,
make it amenable to a variety of different applications such as in the fields of electromagnetic wave absorbance,
electromagnetic interference shielding and high light reflectivity etc[7-9]. Figure 1 shows a typical SEM image of
cenopshere.
Figure 1 SEM images of flyash cenosphere
Although several reviews of FAC utilization have been carried out, the objective of this review is to examine its potential
applications of cenosphere as a substitute of fine grained aggregates in cement composite. This work shall certainly
provide an insight to the implementation of a most valuable component of CFA which shall enhance global industrial
ecology practices and address a wide range of sustainability issues in the field of construction sector.

Proceedings of 36th National Convention of Civil Engineers & National Conference
on ‗Innovation, Mechanization and Modern Techniques in Civil Engineering‘
organized by Jharkhand State Centre, 23-24 October, 2021
35
EFFECT OF FAC ON CEMENT COMPOSITE
Effect on Workability
Wang, et al.[10] conducted the flow spread test to assess the effect of FAC content on the workability of cenosphere
cement composite (CCC). The FAC content was varied from 0 to 60 % with an increment of 20% by volume and the
water content (W/C) ratio was varied between 0.1 and 0.3. The test results revealed that the flow spread increased with
the increase in W/C ratio and FAC content. However, at a fixed W/C ratio, the flow spread increased with increase in
FAC content up to 40 % and decreased thereafter. The slurry effect caused due to the flowing of FAC with water and ball
bearing effect of FAC was reported to be the cause of increase of flow spread with increase in FAC content [11-13].
Effect on Density
The effect of FAC on the density of CCC was studied by varying the volume fraction of FAC from 0 to 70% with a W/C
ratio of 0.4 and found that the density varied from 1900 to 1110 kg/m3
[14]. Brandt, et al.[15] used polypropylene (PP)
and polyvinyl fibers (PVA) to prepare CCC having fiber volume 0.67, 1.33, 2.67 and 20, 40, 60% volume fraction of
FAC. They concluded that the density of concrete reduced due to the increase of FAC and fibre content. The reduction in
density of composite with poly propylene was more due to the lower density of the fiber as compared to polyvinyl fibres.
With 60 % by volume of FAC added to CCC, the bulk density recorded was 1170 kg/m3
which was 70 % of the density
of composite without FAC. By using a constant mass of Type 1 Portland cement, ClassF fly ash (FA), and PVA
(polyvinyl alcohol) fibre with varying volume fraction of FAC showed a 18-31% reduction in density of CCC as
compared to normal concrete[16]. Wu, et al.[17] established that even if the chemical admixtures were used, the density
of CCC reduced with the increase in percentage of FAC and PE fiber in the composite.
McBRIDE, et al.[18] used Portland cement type II, sand, 19 mm size coarse aggregate with W/C ratio 0.44 to prepare the
CCC. They replaced the sand with 50%, 75% and 100% of FAC to study the properties of CCC. The test result revealed
that the 100% replacement of sand with FAC reduced the density of concrete by 22% as compared to the concrete
without FAC. Liu et al.[19] carried out similar study using OPC type I cement, sand, and 20 mm size coarse aggregate
with W/C ratio 0.45, to prepare the control cube. The test result showed that density due to the addition of FAC, silica
fume and PVA fiber was reduced by 37.66% as compared to the control cube.
Effect on Compressive Strength
The studies revealed that as the FAC content in the CCC reduced, the compressive strength of the composite also
reduced[11-13]. The compressive strength also increased as the diameter of the FAC increased due to the higher volume
of cement paste required to fill up the voids. Wu et al.[17] proved that a specific strength of 0.047 MPa/kg/m3, equivalent
to the compressive strength of normal weight concrete could be achieved by using FAC, cement, super plasticizer,
shrinkage reducing admixture with water binder ratio of 0.35. Kwan and Chen[20] used ordinary Portland cement (OPC)
of 52.5 grade, FAC, polycarboxylate ether-based polymer super plasticizer to prepare CCC. The test result revealed that
with 20 % FAC and W/C ratio of 0.16 and super plasticizer, the 28 days cube strength of the specimen could be
achieved up to a maximum of 153.5 Mpa which was 13.6 % more than the 28 days cube strength of the specimen with no
FAC and W/C ratio 0.2.
When the coarse aggregates were used in CCC and fine aggregate replaced by FAC, then the specific compressive
strength reduced but mode of failure was shear type failure[18]. This indicates a poor interfacial bonding between the
FAC and cement binder. At same time the addition of 12 % silica fume by weight of cement to the CCC with 100 % FAC
increased the specific compressive strength by 80 %. The reduction in compressive strength was 13.2 % as compared to
the control specimen[19].
Effect on Flexural Strength
The flexural strength of the CCC decreased due to the decrease in cement paste content because of the increase in volume
of voids[12]. Also the increase in the diameter of the FAC reduced the flexural strength. The increase in FAC in cement
proportion reduced the flexural strength because the increase in FAC content increased the surface area of solid due to
which the W/C ratio increased and simultaneously the capillary pore increased[13]. The addition of water proofing
admixture formed a hydrophobic layer on the surface of unhydrated and partially hydrated cement grains which
prevented the cement from hydration. Hence the addition of water proofing admixture again reduced the flexural
strength.

Proceedings of 36th National Convention of Civil Engineers & National Conference
on ‗Innovation, Mechanization and Modern Techniques in Civil Engineering‘
organized by Jharkhand State Centre, 23-24 October, 2021
36
Brandt, et al.[15] studied that the inclusion of FAC reduced the flexural strength of CCC but the addition of fiber
increases the flexural strength as the fiber can take the tensile stress developed after the cracking of the brittle cement
matrix.
When the CCC was prepared by adding the cement, coarse aggregate, sand, FAC and silica fume, it did not show any
reduction in specific flexural strength for the CCC with 50% and 75% FAC but the specific flexural strength reduced for
100% replacement of sand with FAC. The addition of 12% silica fume by weight of cement to the CCC with 100% FAC
increased the flexural strength by 40%[18].
Effect on Tensile Strength
Direct tensile tests were conducted for numbers of dogbone specimens with different percentages of FAC [20]. It was
concluded that the specimen with FAC showed numbers of micro cracks which indicated the increase in tensile strain
capacity.
The split tensile strength was conducted for the specimens prepared with cement, sand, coarse aggregate and FAC [18].
The specific tensile strength reduced for the specimen with 50% FAC replacement but marginally increased for the
specimens having 75% and 100% FAC as a replacement of sand. The popping out of aggregate in the failure plane
indicated poor interface strength between FAC and binder. Latter on 12% silica fume by mass of cement was added to
achieve an increase in tensile strength of 35%.
Effect on Creep and Shrinkage
Losiewicz, et al.[11] reported that the shrinkage in CCC increased as the cement content in CCC increased. The creep
and shrinkage of CCC up to 450 days were compared with that of the normal weight concrete having similar 28 days
compressive strength. They concluded that almost 95% of the autogenous shrinkage occurs within 28 days. The total
shrinkage of CCC before 180days was more than the concrete prepared with expanded clay but beyond 180 days the
CCC has the lowest shrinkage. The CCC has a total creep strain of 80 % with a basic creep to total creep ratio of 70% at
450 days. By comparing with the normal concrete, it was found that the 450 days creep coefficient of CCC had 47%
lower value than normal weight concrete.
Effect on Alkali Aggregate Reaction
Wang et al.[21] evaluated the deleterious nature of cenoshoeheres and CCC due to alkali-silica reaction (ASR). The
expansion of the CCC bar with N2Oeq of 0.80 and 1.25 % found to be less than the prescribed limit of 0.05 in 3 months
and 0.10 % in 6 months. Similarly, the expansion at 14 days of CCC conditioned in 1 N NaOH was found to be less than
0.1%. It was concluded that the FAC was not deleterious to alkali silica reaction.
Effect on Chloride Ion Penetration
Liu et al.[19] prepared the normal weight concrete and CCC specimens by curing it for 7 and 28 days in moist condition
respectively. The test results showed that the chloride penetration was more in normal weight concrete compared to CCC
specimens. The higher resistance to chloride ion penetration of CCC as compared to normal weight concrete may be due
to the longer duration of curing and the use of silica fume in it.
Effect on Thermal Conductivity
Losiewicz, et al.[11] found that the thermal conductivity of CCC to be in the range of 0.11 Wm-1
K-1
to 0.15 Wm-1
K-1
,
which increased with decrease in percentage of FAC. Blanco at al.[12] conducted the thermal conductivity test on
different specimens with different size of FAC. They concluded that the thermal conductivity reduced with decrease in
diameter of FAC. Use of FAC with wider range of diameter can reduce the thermal conductivity. Kwan and Chen [20]
observed that the thermal conductivity of FAC (0.065W m-1
K-1
) was lower compared to the thermal conductivity of
quartz (3.826 W m-1
K-1
) which might be due to the hollow structure of the FAC. The comparison of thermal conductivity
of CCC with normal cement paste and concrete showed that the thermal conductivity of CCC is 54% and 80% of that of
cement paste and concrete respectively.
The effect of fiber volume in composite has very small effect on the thermal conductivity as compared to the effect of
FAC [15]. The use of 60% FAC by volume and PP fiber in CCC can reduce the thermal conductivity by 67%.

Proceedings of 36th National Convention of Civil Engineers & National Conference
on ‗Innovation, Mechanization and Modern Techniques in Civil Engineering‘
organized by Jharkhand State Centre, 23-24 October, 2021
37
Effect on Acoustic Property
Blanco et al.[12] performed the sound proofing test and reported that the property of CCC was similar to the property of
concrete manufactured with expanded clay and to the property of wall of same thickness prepared with traditional
material. The sound absorption or noise reduction property of CCC was optimum when the FAC content in FAC was
40% volume fraction of cement[14].
CONCLUSIONS
In this review, the use of fly ash cenospheres (FAC) in different composites of cement are summarised as follows:
Replacement of coarse or fine aggregate of cement composite can eliminate the ill effect of sand/gravel mining,
crusher dust on environment and human health.
Reduction in density of cement composite will impart lesser self weight on the structure, which leads to an
economical structure.
Compressive and tensile strength of the CCC similar to normal concrete can be achieved by using silica fume.
The flexural strength of CCC can be enhanced by addition of fibers along with FAC.
The thermal resistance, noise reduction property can be improved as compared to normal concrete.
Better creep and shrinkage property then normal concrete.
ACKNOWLEDGMENT
The authors acknowledge Department of Science and Technology (DST), Government of India and VSS University of
Technology, Burla for the support.
REFERENCES
1. S.V. Vassilev and C.G. Vassileva, Methods for characterization of composition of fly ashes from coal-fired power
stations: a critical overview, Energy Fuels, vol.19, no.3, April 2005, pp.1084-1098.
2. M. Ahmaruzzaman, A review on the utilization of fly ash, Prog. Energy Combust. Sci., vol.36, no.3, June 2010, pp.
327-363.
3. S. Wang, Application of solid ash based catalysts in heterogeneous catalysis, Environ. Sci. Technol. vol.42, no.19,
August 2008, pp.7055-7063.
4. K.G. Mathias, Geomorphic and environmental effects of in stream gravel mining, Landscape and Urban Planning,
vol. 28, no.2-3, April 1994, pp. 225-243.
5. G.L. Fisher, D.P.Y. Chang and M. Brummer, Fly ash collected from electrostatic precipitators: microcrystalline
structures and the mystery of the spheres, Sci., vol. 192, no. 4239, May 1976, pp. 553-555.
6. A.F. Sarofim, J.B. Howard and A.S. Padia, The physical transformation of the mineral matter in pulverized coal
under simulated combustion conditions, Combust. Sci. Technol. vol. 16, no.3-6, May 2007, pp.187-204.
7. Z. Aixiang, X. Weihao and X. Jian, Electroless Ni-P coating of cenospheres using silver nitrate activator, Surf.
Coat. Technol. vol.197, no.2-3, July 2005, pp. 142-147.
8. W. Wang, Q. Li, Y. Li, H. Xu and J. Zhai, Electroless Ag coating of fly ash cenospheres using polyaniline activator,
J. Phy. D Appl. Phys. vol.42, no.21, October 2009, pp. 215-306.
9. Y. Xiaozheng, S. Zhigang and X. Yushan, A comparison of two methods for metallizing fly-ash cenosphere
particles: electroless plating and magnetron sputtering, J. Phys. D Appl. Phys. vol.40, no.19, September 2007, pp.
6023-6026.
10. J.Y. Wang, K.S. Chia, J.Y.R. Liew and M.H. Zhang, Flexural performance of fiber-reinforced ultra lightweight
cement composites with low fiber content, Cem. Concr. Compos. vol. 43, October 2013, pp. 39-47.
11. M. Losiewicz, D.P. Halsey, S.J. Dews, P. Olomaiye and F.C. Harris, An investigation into the properties of micro-
sphere insulating concrete, Constr. Build. Mater. vol. 10, no. 8, December 1996, pp. 583-588.
12. F. Blanco, P. García, P. Mateos and J. Ayala, Characteristics and properties of lightweight concrete manufactured
with cenospheres, Cem. Concr. Res. vol.30, no.11, November 2000, pp. 1715-1722.
13. A. K. Suryavanshi and R.N. Swamy, Development of lightweight mixes using ceramic microspheres as fillers, Cem.
Concr. Res. vol. 32, no.11, November 2002, pp.1783-1789.
14. V. Tiwari, A. Shukla and A. Bose, Acoustic properties of cenosphere reinforced cement and asphalt concrete, Appl.
Acoust. vol. 65, no.3, March 2004, pp. 263-275.

Proceedings of 36th National Convention of Civil Engineers & National Conference
on ‗Innovation, Mechanization and Modern Techniques in Civil Engineering‘
organized by Jharkhand State Centre, 23-24 October, 2021
38
15. A.M. Brandt, J. Olek and I.H. Marshall, Properties of fiber reinforced cement composites with cenospheres from
coal ash, Proc. Int. Symp. Brittle Matrix Composite 9, IFTR & Woodhead Publ. Warsaw, 2009.
16. X. Huang, R. Ranade, Q. Zhang, W. Ni and V.C. Li, Mechanical and thermal properties of green lightweight
engineered cementitious composites, Constr. Build. Mater. vol.48, November 2013, pp. 954-960.
17. Y. Wu, J.Y. Wang, P.J.M. Monteiro and M.H. Zhang, Development of ultra-lightweight cement composites with
low thermal conductivity and high specific strength for energy efficient buildings, Constr. Build. Mater. vol.87,
July 2015, pp.100-112.
18. S.P. McBride, A. Shukla and A. Bose, Processing and characterization of a lightweight concrete using cenospheres,
J. Mater. Sc. vol. 37, October 2002, pp. 4217-4225.
19. X. Liu, K.S. Chia, M.H. Zhang and J.Y. Liew, Water and chloride ion penetration resistance of high strength ultra
lightweight cement composite, Int. Congress on Durability of Concrete (ICDC), Norwegian Concrete Association,
2012.
20. A.K.H. Kwan and J. Chen, Adding fly ash microsphere to improve packing density, flowability and strength of
cement paste, Powder Technol. vol.234, January 2013, pp.19-25.
21. J.Y. Wang, M.H. Zhang, W. Li, K.S. Chia and R.J.Y. Liew, Stability of cenospheres in lightweight cement of
alkali-silica reaction, Cem. Concr. Res . vol. 42, no.5, May 2012, pp. 721–727.

Proceedings of 36th National Convention of Civil Engineers & National Conference
on ‗Innovation, Mechanization and Modern Techniques in Civil Engineering‘
organized by Jharkhand State Centre, 23-24 October, 2021
39
DOI: https://10.36375/prepare_u.iei.a113 ISBN 978-81-952159-1-1
Durability Properties of Pervious Concrete using Nanosilica
D Tarangini, P Sravana and P Srinivasa Rao
Department of Civil Engineering, Jawaharlal Nehru Technical University, Kukatpally, Hyderabad, Telangana
Abstract: The durability qualities of porous concrete created with a cement, Nanosilica (NS), and a minimum of 5%
natural river sand as a partial replacement for coarse aggregate were investigated in this work. This study used two
coarse aggregate sizes, 20 mm and 10 mm, in a 50:50 ratio. The pervious mixes for w/b ratios 0.34 and 0.30 were
subjected to durability tests such as acid impact, alkali impact, and can tabro abrasion loss. The chemical resistance test
revealed that the mass decrease percentage was 20.56% at 5% HCl solution, 4.23% at 5% H2SO4 solution, and 0.27
percent for Na2So4 solutions after 180 days of immersion. Sulphuric acid was discovered to be the most harmful of the
three chemical environments for all concrete mixtures. The abrasion loss found to be in the range of 18 to 28%.The
durability of concrete mixes using nano silica was demonstrated.
Keywords: Porous, Nanosilica, Durability, Abrasion
INTRODUCTION
With rapid expansion and an ever-increasing population, there is an urgent need to focus on sustainable practises in
construction-related development. The most pressing issue resulting from urbanisation is the development in the amount
of impervious surfaces such as sidewalks, built-up areas, road networks, and so on, all of which have a direct impact on
the environment. These impervious surfaces cause a variety of issues, including storm water runoff, which, if properly
managed, can result in an efficient water management technique. Using impervious surfaces diminishes soil-atmosphere
interaction, increases heat absorption and radiation, and affects the adjustment of temperature and humidity on the earth's
surface. It is also a major cause of ground water depletion.
In recent years, several industrial by-products with high silica and alumina content, including as fly ash (FA), rice husk
ash (RHA), ground granulated blast furnace slag (GGBS), silica fume (SF), alccofine (AL), red mud, and others, that are
harmful to the environment, have been used as replacement for OPC in concrete[1-6]. Through the use of nanoparticles,
extensive research is being conducted to improve the efficiency of building materials and to manufacture durable
concrete for the construction sector[7-9]. Nanomaterials with high pozzolanic character, such as nanosilica (NS), can
greatly improve the qualities of concrete in all aspects.It was discovered that utilising NS in concrete can expedite the
pozzolanic process and generate more C-S-H gel in the concrete, and that NS can also improve the density of the
concrete's interfacial transition zone (ITZ) by filling the pores[10,11].
LITERATURE REVIEW
Pervious concrete's strength and permeability have been the subject of several research. Some studies were also
conducted to evaluate the performance of polymer added pervious concrete, and it was discovered the addition of fibres
can increase permeability and compressive strength, as well as the splitting tensile strength [12,13]. According to
research on the properties of porous concrete with varying cement paste contents, there are strong relationships between
compressive strength, porosity, and critical pore size [14]. Abrasion, durability, and ravelling under continuous traffic
loads are all issues with pervious concrete pavement, in addition to strength and permeability.Sulphuric acid (H2SO4) and
hydrochloric acid (HCL) are the two most potent natural threats to concrete structures[15]. The usage of pozzolanic
materials such as rice husk ash, fly ash, and silica fume increases the strength and weight loss against sulphate attack due
to a decrease in the porosity of concrete specimens and the development of ettringite[16,17]. The quality of particle
dispersion in the transition zone, as well as the features of C-S-H, are critical factors in the permeability of concrete
specimens, which impacts the resistance of concrete to sulphate attack[18]. The strength and abrasion resistance of
pervious concrete were reduced when palm oil clinker, an industrial by-product, was used as coarse aggregate at varied
replacement amounts ranging from 0 to 100% [19]. As the nanoparticle concentration increased, the wear resistance of
concrete containing nano-particles such as nano-TiO2 and nano-SiO2 in addition to polypropylene fibre decreased [20].

Proceedings of 36th National Convention of Civil Engineers & National Conference
on ‗Innovation, Mechanization and Modern Techniques in Civil Engineering‘
organized by Jharkhand State Centre, 23-24 October, 2021
40
OBJECTIVE AND SCOPE
The purpose of this research is to see how acids such as HCL and H2SO4 affect the characteristics of pervious concrete.
The study also looks at Cantabro's abrasion of Pervious Concrete (PC). For the evaluation, four PC mixtures with two
distinct aggregate sizes and various w/b were casted and tested.
Experimental Program
1. Materials Used: Ordinary Portland Cement (OPC) 53 grade, coarse aggregate of sizes 10 mm and 20 mm, river sand
at 5% by weight of coarse aggregate, 3% nanosilica addition by weight of cement and superplasticizer Consplast SP
430, and water were used to make pervious concrete.Granite was employed as the aggregate in this investigation.
Four mixes were employed with total aggregate to cement 3.5:1, each with a 50:50 mixtures of two sizes of coarse
aggregate and a 5% replacement of total material. With and without the addition of 3% Nanosilica, two w/b ratios of
0.34 and 0.30 are applied (NS).
2. Mix Proportions: The following Table 1 gives the details of pervious mix.
Table 1 Details of mix proportions of pervious concrete
Mix Cement (kg/m3) Sand (kg/m
3) CA (kg/m
3) W/B Ns (kg/m
3) SP (%)
CPC1 450 79 1568 0.30 - 0.7
CPC2 450 79 1568 0.34 - 0.7
NPC1 450 79 1568 0.30 13.5 0.7
NPC2 450 79 1568 0.34 13.5 0.7
3. Casting of Specimens: As per the mix proportions designed using ACI 522 R specimens were casted.The components
were first blended dry and then added to the pan mixture with water and SP. After mixing, the concrete is poured into
cubes and compacted with a tamping rod. The next day, the cubes are demolded and left to cure normally until the
day of testing.
4. Testing Procedure: PC cube specimens are cured for 28 days under normal conditions before being immersed in 5%
HCL solution, 5% H2SO4 solution, and 5% sodium sulphate solution (Na2SO4) for further 28, 90 and 180 days of
chemical curing. Figure 1 shows the chemical curing of PC specimens.The cubes are weighed before being immersed
in the chemical. For acid curing, the PH maintained 4.5 to 5, while for alkali curing, it was kept at 8.5 to 9. These are
checked every 15 days and PH is thus kept up to date. According to prior literature, the Cantabro test with up to 300
cycles can be used to assess the abrasion resistance of pervious concrete[24].The Cantabro test is performed without
the steel ball charges in the Los Angeles (LA) abrasion machine and the amount of weight lost throughout the test
was used to characterise PC‘s abrasion resistance. Figure 4 shows the PCPC specimens before and after the Cantabro
test.
Figure 1 Showing the variations in PC specimens after immersion in acid and alkali

Proceedings of 36th National Convention of Civil Engineers & National Conference
on ‗Innovation, Mechanization and Modern Techniques in Civil Engineering‘
organized by Jharkhand State Centre, 23-24 October, 2021
41
RESULTS AND DISCUSSIONS
1) Weight Loss in HCL & H2So4
The mass loss for specimens subjected to 5% hydrochloric acid and 5% sulphuric acid solutions are shown in Figure
2. When comparing CPC and NPC concrete, it was discovered that CPC mixtures without nanosilica (NS) packing
addition had the maximum mass loss of 20.56% for 180 days in hydrochloric acid immersion for w/b ratio of 0.34.In
hydrochloric acid immersion, the NPC mixtures with NS addition exhibited the mass loss of 7.98% for w/b ratio 0.34.
From pozzolanic activity and portlandite, hydrates arising from cement hydration reduce the size of capillary pores
when NS is added [25]. In sulphuric acid solutions, mass loss is smaller as 1.54% for PC combinations using NS as a
filler. In sulphuric acid solutions, the concrete mixes lose more mass than in hydrochloric acid solutions.Degradation
mechanisms caused by H2SO4 and HCl assaults differ for the same type of concrete. Sulphuric acid leaches paste
layers from exposed surfaces, whereas hydrochloric acid penetrates the concrete through the exterior porosity
interval.
2) Weight Loss in Na2So4
For both CPC and NPC, Figure 2 depicts the % weight loss of PC mixes. The mass loss for sodium sulphate curing
was found to be in the range of 0.03% to 0.32%. It is clear from the mechanism of attack of sodium sulphate on
concrete structures that the two main reactions that result in expanding ettringite and gypsum are to blame. The first is
the reaction of sodium sulphate (Na2SO4) with the calcium hydroxide produced during cement hydration to make
gypsum, and the second is the reaction of formed gypsum with calcium aluminate hydrates to produce ettringite
[26,27].The synthesis of gypsum and ettringite causes concrete constructions to expand, crack, deteriorate, and be
disrupted.
3) Effect on Compressive Strength
Figure 3 shows the compressive strength loss of PC mixes exposed to HCl, H2SO4, and Na2so4. It is clear that
sulphuric acid exposure has resulted in the greatest loss of strength. At a 28-day concrete age, the percentage decrease
in compressive strength was found to be 6.89% for PC without NS whereas 3.26% for PC mix with NS for w/b ratio
of 0.34. For later eras of concrete, a similar pattern has been followed. It's worth noting that adding NS to concrete
has significantly reduced concrete deterioration by generating a larger C-S-H gel and lowering the open pore structure
to some extent.
Figure 2 Graph showing the percentage mass loss of PC
mixes after immersion in acid and alkali
Figure 3 Graph showing the variations in compressive
strengths of PC mixes after immersion in acid and alkali
4) Cantabro Abrasion Loss
Figure 4 shows the specimens after Cantabro abrasion testing on the Los angles machine. As shown in Figure 5,
the proportion of mass loss for PC mix, there was a maximum weight loss of 28.24% for concrete mix without NS
at w/b ratio of 0.34. The abrasion mass loss for PC mix on addition of NS for same w/b was 25.66 at concrete age of
28 days. The As a result, adding Nanosilica to the cement mix increased its quality by making it denser and less
prone to abrasion. The blends that included NS had improved abrasion resistance and minimal weight loss. As a
result, the results reveal that the specimen‘s compressive strength has a significant impact on abrasion

Proceedings of 36th National Convention of Civil Engineers & National Conference
on ‗Innovation, Mechanization and Modern Techniques in Civil Engineering‘
organized by Jharkhand State Centre, 23-24 October, 2021
42
resistance.The reason for this is that during Cantabro testing, the specimen is damaged by impact between the
specimens collision and the inside side the Los Angeles machine, rather than by surface abrasion. For PC blends,
the mass loss due to abrasion was between 20 and 35%.This could be because some of the specimens broke due to
their poor strength during the first few strikes, rather than aggregate particles being abraded away from the
specimen surface.Similarly, the higher specific surface area of nanosilica-replaced mixes explains their improved
resilience, resulting in a larger region of additive dispersion and a more compact cement matrix.
Figure 4 showing the variation in specimens of PC mix
before and after abrasion
Figure 5 Graph showing the weight loss of PC mixes
after abrasion test at different ages of concrete
CONCLUSIONS
Based on the experimental results presented in this study, the following conclusions have been formed.
1. The pervious mix with w/b ratio 0.30 performs better against chemical and abrasion loss when compared to 0.34.
2. Sulphuric acid and hydrochloric acid medium aggressions are better tolerated by pervious concrete with nanosilica
added than by standard pervious mix.
3. Chemical resistance has improved in pervious combinations when 3 percent Nanosilica was partially added,
according to the pozzolanic reaction of NS and its contribution of strength continuing up to 180 days.
4. For all four combinations, the abrasion resistance of Pervious mix with Nanosilica increased with increasing curing
age.
5. In terms of abrasion resistance values, the Cantabro test has clearly delimited PC mixtures with NS at all ages, and it
may be used as one of the ways to determine abrasion resistance of porous concrete pavements.
REFERENCES
1. V. Malhotra, Introduction: Sustainable development and concrete technology, Concrete Intelligence, vol. 24, no. 7,
2002, pp. 235-242.
2. P. Moncarz, Sustainable concrete: impacts of existing and emerging materials and technologies on the construction
industry. Architectural Engineering Conference, June 19-20, 2011.
3. B. Suhendro, Toward green concrete for a better sustainable environment, Procedia Engineering, vol. 95, 2014, pp.
305–320.
4. P. Kathirvel, V. Saraswathy, S.P. Karthik and A.S.S. Sekar, Strength and durability properties of quaternary cement
concrete made with fly ash, rice husk ash and limestone powder, Arabian journal of science and technology, vol. 38,
2012, pp. 589–598.
5. J. Temuujin, A. Van Riessen and MacKenzie. K, Preparation and characterization of fly ash-based geopolymer
mortars, Construction and Building Materials, vol. 24, no. 10, 2010, pp. 1906– 1910.
6. E. Worrell, L. Price, N. Martin, C. Hendriks and L.O. Meida, Carbon-dioxide emissions from the global cement
industry, Annual Review of Environment and Resources, vol. 26, no.1, 2001, pp. 303–329.
7. F.T. Isfahani, E. Redaelli, W. Li and Y. Sun, Effects of nanosilica on early age stages of cement hydration, Journal
of Nanomaterials, vol. 24, 2017, pp. 1-9.
8. Mochamad Solikin, Alfian Nur Zaini, Budi Setiawan and Ali Asroni, Flexural strength analysis of styrofoam
concrete hollow panel walls incorporated with high volume fly ash, Civil Engineering and Architecture, vol. 8, no.
3, 2020, pp. 320-325, DOI: 10.13189/cea.2020.080316.

Proceedings of 36th National Convention of Civil Engineers & National Conference
on ‗Innovation, Mechanization and Modern Techniques in Civil Engineering‘
organized by Jharkhand State Centre, 23-24 October, 2021
43
9. Dalia Elghezanwy and Sara Eltarabily, A review of translucent concrete as a new innovative material in
architecture, Civil Engineering and Architecture, vol. 8, no. 4, 2020, pp.571-579, DOI: 10.13189/cea.2020.080421.
10. P. Hou, S. Kawashima, D. Kong, D.J. Corr, J. Qian and S.P. Shah, Modification effects of colloidal nanosilica on
cement hydration and its gel properties, Composites Part B: Engineering, vol. 45, 2013, pp. 440-448.
11. S. Chithra, S.R.R. Senthil Kumar and K. Chinnaraju, The effect of Colloidal Nano-silica on workability, mechanical
and durability properties of high-performance concrete with copper slag as partial fine aggregate, Construction and
Building Materials, vol. 113, 2016, pp. 794-804.
12. J.T. Kevern, Advancements in pervious concrete. Ph.D.dissertation, Iowa State Univ., Ames, IA, 2008, pp 85–99.
13. B. Huang, H. Wu, X. Shu, and E.G. Burdette. Laboratory evaluation of permeability and strength of polymer–
modified pervious concrete. Constr. Build. Mater., vol 24, no 5, 2010, pp 818–823.
14. O. Deo and N Neithalath. Compressive response of pervious concretes proportioned for desired porosities. Constr.
Build. Mater., vol 25, no 11, 2011, pp 4181–4189.
15. S. Turkel, B. Felekoglu and S. Dulluc. Influence of various acids on the physico–mechanical properties of
pozzolanic cement mortars. Sadhana, vol 32, no 6, 2007, pp 683–691, doi:10.1007/s12046-007-0048-0.
16. T. Ji, Preliminary study on the water permeability and microstructure of concrete incorporating nano-SiO2, Cement
and Concrete Research, vol 35, no 10, 2005, pp 1943-1947.
17. B. Chatveera and P. Lertwattanaruk, Evaluation of sulfate resistance of cement mortars containing black rice husk
ash. Journal of Environmental Management,vol 90, no 3, 2009, pp 1435-1441
18. B.W. Jo, et al., Characteristics of cement mortar with nano-SiO2 particles. Construction and Building Materials, vol
21, no 6, 2007, pp 1351-1355.
19. H.A. Ibrahim, H.A. Razak and F. Abutaha, Strength and abrasion resistance of palm oil clinker pervious concrete
under different curing method. Construction and Building Materials, vol 147, 2017, pp 576–587, doi:
10.1016/j.conbuildmat.2017.04.072
20. H. Li, M. Zhang and J. Ou, Abrasion resistance of concrete containing nano-particles for pavement.Wear, vol 260,
2006, pp 1262–1266. doi: 10.1016/j.wear.2005.08.006
21. F.E. Perez-Jimenez and J. Gordillo, Optimization of porous mixes through the use of special binders. Transportation
Research Record 1265, Transportation Research Board, Washington, DC, 1990, pp 59–68.
22. A. Ruiz, R. Alberola, F. Perez and B. Sanchez, Porous asphalt mixtures in Spain, Transportation Research Record
1265, Transportation Research Board, Washington, DC, 1990, pp 87–94.
23. Sabita. Porous asphalt, Manual 17, Sabita Ltd., Roggebaai, South Africa, 1995
24. H. Wu, B. Huang, X. Shu and Q. Dong, Laboratory evaluation of abrasion resistance of Portland cement pervious
concrete, J. Mater. Civ. Eng., vol 23, no 5, 2011, pp 697–702.
25. M. Ghrici, S. Kenai, M. Said-Mansour and E. Kadri, Some engineering properties of concrete containing natural
pozzolana and silica fume. Journal of Asian Architecture and Building Engineering, vol 5, no 2, 2006, pp 349–354.
doi:10.3130/jaabe.5.349.
26. M. Santhanam, M.D. Cohen and J.Olek, Mechanism of sulfate attack: a fresh look part 2: Proposed Mechanisms.
Cement and Concrete Research, vol 33, no 3, 2003, pp. 341-346
27. A.A. Ramezanianpour, P. Pourbeik and F.Moodi. Sulphate attack of concretes containing rice husk ash, Amirkabir
Journal of Science and Research (Civil and Environmental Engineering), vol. 45, no. 1, 2012, pp. 3-5

Proceedings of 36th National Convention of Civil Engineers & National Conference
on ‗Innovation, Mechanization and Modern Techniques in Civil Engineering‘
organized by Jharkhand State Centre, 23-24 October, 2021
44
DOI: https://10.36375/prepare_u.iei.a118 ISBN 978-81-952159-1-1
Ecosystem Restoration – A Holistic Approach
S Gnanasekaran
Former Deputy General Manager (Civil), M/s. ONGC Ltd, Kuttalam
Abstract: The ecosystem restoration is highly need of the hour as survival of our future generation to some extent
depends on if ecosystem is properly restored. In stratosphere, ozone layer (O3) is rapidly depleting and thus forming
holes in the ozone layer, pollution of troposphere (O2), pollution of land by mindless application of toxic chemical
fertilizers & pesticides, merciless dumping of trash in to all water bodies like ponds, lakes, rivers, canals and drains as
well as in to Ocean, uncontrollable emissions in to air, excess radiation emanation from communication towers beyond
tolerable limit, littering on roads and streets, mercilessly cutting of big age old trees in mass numbers on the name of
road widening projects etc. All the above caused maximum damage to the ecosystem and the result is evident like
Greenhouse effect, Global Warming, premature glacier melting in polar and hill regions (cryosphere damage), torrential
rains inunusual manner, drought etc.
Keywords: Use of Renewable Energy, Afforestation, Rain Water Harvesting, Recycling of Plastic Waste, Biofuel, Biogas,
Protection of Bio Diversity and Organic Agriculture
INTRODUCTION
The major causes of damages to ecosystem like global warming, cryosphere melting (glacier melting in polar
andhillregions), rise of sea level, climate changes like drought, scarcity of drinking water, formation of severe cyclone as
well as torrential rain in short span of time, human caused hole in ozone layer which led to disruption in natural filtering
of ultraviolet rays from sunlight. These are few to namethat are very well known to everyone by this time. Now, it is a
high time to think about and a holistic approachfor ecosystem restoration needs to be implemented urgently are
discussed.
Causes of damages to ecosystem and remedial measures in practice and further suggested to restore ecosystem:
Air
The major contributors of emission of carbon dioxide (CO2),
From fossil fuel-based power generation plants, factories like Cement & Steel etc., decaying & living organisms, and
Volcanos,
Water vapours blocks heat from escaping (H2O),
Methane gas released from wetlands, paddy fields, raising cattle and mining coal. (CH4),
Close to ground the ozone (O3) acts as greenhouse gas formed due to running of automobile vehicles,
Nitrous oxide is released by some types of factories and plant fertilizer and it damages the protective ozone layer at
the top of the stratosphere. (N2O),
The emissions of CO2 from the stacks of all coal fired power stations & from the Steel and Cement Industries need to
be captured before letting into atmosphere, same shall be compressed into liquid carbon dioxide, injected into the
selected & porous deep geological formations of abandoned oil /gas wells. (Carbon Sink/Carbon Sequestration),
Merciless cutting of trees in all road widening projects, and as well as in development of other Infrastructure projects.
(Trees = Major source of oxygen production on land forsupport of survival of all living beings),
Excess radiation emanation fromcommunication towers beyond tolerable limit caused extinct of certain species.Strict
compliance of radiation norms from all communication towers needs to be ensured,

Proceedings of 36th National Convention of Civil Engineers & National Conference
on ‗Innovation, Mechanization and Modern Techniques in Civil Engineering‘
organized by Jharkhand State Centre, 23-24 October, 2021
45
Dry thunderstorms occur essentially in dry conditions, and lightning strike associated with it is a major cause of
wildfires. Theselightning strikes caused forest fires causes multiple damages. (1. Loss of aged trees, plants and all
living being in the forest, 2. Mass emission of CO2 from forest fire which adds further to global warming. 3.
Subsequent Mass reduction in Oxygen production from such forest due to the loss of trees and plants in the wildfires),
(Note: Forest fire in California has devastated human life, many houses are engulfed in it. It is in every summer
season.)
Water
Compulsory re-possession of all types of water bodies like lakes, ponds, tributaries, rivers, distributaries, canals, field
channels, drains etc. from the encroachments needs to be exercised and shall be restored to its original condition.
Rain water harvesting practices from residential buildings, commercial buildings, Industrial buildings and from public
infrastructures needs to be made compulsory. Wherever possible mass water harvesting infrastructures should be
developed by the local bodies. This will help in increasing the ground water table substantially.
Construction of more check dams/Regulators at many possible places needs to be done across all the rivers/rivuletsin
order to raise ground water table.
Educating users for importance of conserving water and its resources by using water for certain essential purposesand
encourage saving of water by reduced usage.
Educating and encouraging mass towards disposal of plastic wastes. Collection of all existing plastic waste dumped in
any types of water bodies needs to be ensured and thus preventing them to discharge into Ocean. Modern solar
powered Interceptors with the aid of floating containment booms and conveyor belts may be deployed for this
purpose.
Making suitable infrastructure for collection of household and biomedical waste. Law with strict punishments may be
made for banning of merciless dumping/littering of all trashes including bio-medical waste into any types of water
bodies like tributaries, rivers, distributaries, canals, dams, reservoirs, drains, oceans, lakes and ponds etc needs to
imposed.
Interestingly to mention that heaps of plastic waste caused garbage patches in the oceans endangering marine life.
The Great Pacific Garbage Patch caused by human is a serious matter of concern for environmentalists. Seriousness
of the matter can be understood by the opinion of the specialists thatcleaning up of this garbage patch may ―bankrupt
any country‖ that tries it.
Ocean‘s contribution for the benefit of survival of human race & other living being is countless like sea foods,
seasonal rains, wind and more over production of 65% to 70% of total demand of oxygen supply. Hence Protection of
ocean, it‘s flora and fauna is one of the very important and major steps of Ecosystem Restoration.
Making arrangementsfor mass education and making necessarylegislation with strict punishments with the aim to
protect all oceans from excess fishing, conservation and promotion of Coral Reef for the safe habitats of the marine
biodiversity.
Conservation of existing salt tolerant mangrove forest and creating natural promotion of mangrove forest along
coastal lines of ocean which is very important, as the same is providing comfortable habitat for crabs, shrimps and
other marine species in addition to protection from sea shore erosion in coastal areas.
Land
A steady stream of organic waste, chemicals and antibiotics from shrimp farms can pollute groundwater or coastal
areas. Salt from the ponds can also seep into the groundwater and onto agricultural land. This has had lasting effects,
changing the hydrology that provides the foundation of wetland ecosystems. Shrimp Culture completely needs to be
avoided on land.
Dumping trash/littering on streets, roads and public places like parks, beaches, railway stations, bus stations and
especially in reserved forest areas needs to be banned. Enforcing the common public for compulsory practice of
dumping trash in the common bins of respective categories like bio-degradable and non-bio-degradable needs to be
done. Necessary legislation can be made and necessary programme for mass education can be launched.
Strictly, sorted out collection of both bio-degradable and non-bio-degradable waste from the source/ residences/
commercial complex needs to be ensured for saving time, man power for sorting and ensuring proper disposal.

Proceedings of 36th National Convention of Civil Engineers & National Conference
on ‗Innovation, Mechanization and Modern Techniques in Civil Engineering‘
organized by Jharkhand State Centre, 23-24 October, 2021
46
Also, zero dischargeconcept of all industries needs to be strictly exercised by all respective pollution control bodies.
The industries need to make their own arrangement of their solid and liquid waste processing like reduction/
recycling/ reusing/ safe disposal. It needs to be assured that no tributary/ river/ distributary/ canal/ drain/ reservoirs/
ocean/ water bodies will receive nothing from any industry to prevent pollution of water bodies.
All infrastructures required for Municipal liquid waste management needs to be installed in all villages, panchayats,
towns and major cities throughout the Nation and shall be operated effectively. The treated sewage water can be
used/recycled for flushing of toilets, farm forestry, horticulture, Industrial use as in non-human contact cooling
towers, fish culture etc.
The three ―R‖ (Reduce, Reuse & Recycle) concept especially for plastic waste management needs to be made aware
among the common public by wide publicity.
For effective functioning ofSolid Waste management systems, modern automated machineries, equipment and all
relevant infrastructures needs to be installed and operated very strictly in all villages, panchayats, towns and major
cities throughout the country.
Thus, Municipal solid waste of non-biodegradable type shall undergo for separation, sorting and recycling forplastic,
ferrous & non-ferrous metals, paper, textiles, glass, special alloys, stainless steel, tyres/rubber wastesand e-scarp etc.
Followed by the safe disposal of residual wastes needs to be done.
The biomass collection of municipal waste from perishable item markets, shops and from residential buildings,
schools, colleges, temples etc. and the bio-degradable waste from poultry litter, Slaughter houses, swine litter, cattle
dung from farm and from the settled solids of waste water treatment plant shall be processed through well-established
Biogas Plants.
The Biogas/Biomethane plant uses combined heat and power (in internal combustion engines/combustion gas
turbines, alternators) to produce electricity.
Apart from production of electricity from biogas, the valuable by-product is bio compost which is good manure for
organic agriculture. The main aim of converting Biogas/Biomethaneinto electrical energy and bio compost will help
in reduction of greenhouse gas Methane, CH4 which is many times potent of heat trapping compared to CO2.
CBG – The compressed biogas can also be completely used as an alternative, renewable automotive fuel.
The Ethanol is a less polluting biofuel, and offers equivalent efficiency at lower cost than petrol. Availability of large
arable land, rising production of food grains and sugarcane leading to surpluses, availability of technology to produce
ethanol from plant-based sources, and feasibility of making both passenger and transport vehicles compliant to
ethanol blended petrol up to 20% (E20) will alleviateReduced usages of fossil-based fuel and thus reduction in
atmospheric pollution.
Planning and implementation of rapid phase out of fossil fuelled automobiles with the Electrical power-driven
vehicles in all two and four-wheeler sectors for the transportation is needed. This action will only help in actual
reduction of global warming.
In a Rapid way, phase wise shifting from the conventional energy resources using fossil fuel and coal/coke for power
production to implementation of tapping of Sustainable and as well as Renewable Energy sources like Solar, Wind
and Tidal powers (also hydroelectric power) for the power production at least to the tune of 90% of gross power
demand.
Planning and phase wise implementation of high speed (800 to 900 km/hour) Mass Rapid Transit System using the
concept of Hyperloop pods works in an evacuated tube over the rails of magnetic levitations, between long distanced
major Cities. This will substitute the fossil fuel used Aeroplanes.
The practise of mass floating solar power plant production over waters of existing lakes, big reservoirs of dams can be
implemented for nearby towns which will reduce costly land use, prevent evaporation of water of reservoirs and
water-cooled environment solar panel envisages more efficient power production.
All types of automobile vehicles shall be compulsorily prevented from using on all Sundays (or) alternatively on any
one agreed day of every week, except ambulance, milk van, carriers of perishable goods and the vehicles of Medical
Officials. (Stop rotating all automobile wheels one day/week).
All the urban bus terminals, all Railway stations of Mass Rapid Transit System (Electrical train service system) need
to have automated multi-level parking lot for parking of both four & two wheelers. If not available, then it is required
to be created by compulsory acquisition of land nearby at any cost. These parking lot will promote more usage of

Proceedings of 36th National Convention of Civil Engineers & National Conference
on ‗Innovation, Mechanization and Modern Techniques in Civil Engineering‘
organized by Jharkhand State Centre, 23-24 October, 2021
47
MRTS by the commuters by parking their personal automobiles at stations and thus led to at least partial reduction in
emission of greenhouse gas.
The carbon dioxide emission in the automotive vehicular traffic congestion/jam is much more than the emissions that
produce during normal running. In metropolitan cities, after identifying the major 4/3 road junctions, implementation
of infrastructures like Clover Leaf Type Interchanges and Trumpet Type Interchanges by going compulsory
acquisition of land in such junctions at any cost needs to be done. This will achieve free unobstructed flow of all
directional traffic in such crucial junctions, and thus mitigate the traffic congestion/jam.
Energy star certified home appliances can only be allowed to use.
Automobile vehicle meeting emission norms and fuel-efficient vehicles only shall be allowed to use.
Lights, fans, electronic equipment, AC and motors in home, office, school, college and in Industries shall be turned
off when not in use and the same shall be practised ever to reduce electricity demand.
Expediting the implementation of planting trees & maintain to achieve increased area of afforestation.
Added to above, rewilding of forest animals needs to be done
Avoiding the conversion of forest land to otherland uses, such assettlements, croplands, or grasslands will also
enhance natural carbon sink.
Promotion of Organic Agriculture/Horticulture using ecofriendly manures and drip irrigation system/using treated
sewage water to conserve water wherever possible shall be ensured.
Immediately mass tree cutting needs to be stopped for any road widening project. One must be wise enough to keep
the existing row of trees as median of such road widening project and develop on other side of land for proposed road
widening even at any cost of land.
This suggestion is meant really to prevent forest fire: May be premature idea. The bigger balloon like weather
balloons shall be floated in the forest at a height of 150 – 200 m over the trees and plants, with clusters of Lightning
arrestors fitted at top of such balloon and shall be secured at ground with all directional anchors. The flexible
conductors from lightning arrestors shall connect and run up to proper earthing/ grounding tackles erected at ground.
The height of 200 m will cover a circle in the ground approximately for a radius of 200 m. The area of trees covered
under circle of diameter 400 m in the ground will have protection from lightning strike. If this becomes successful can
be extended to entire area of forest.
CONCLUSION
It is up to the provocative of policy framing authorities and the administrators of all Government Machineries to
implement whatever above feasible suggestions for Ecosystem restoration with a holistic approach, (in addition to
measures which are already in practice) immediately for the sake of survival of future generations to come.
ACKNOWLEDGEMENT
My profound thanks to Er O.K. Sharma, Veteran in Civil Engineering, my senior, who guided me to bring the best in this
article.
REFERENCES
1. Contents related to Ecosystem Restoration is Collected from various relevant web sites by using internet accesses.

Proceedings of 36th National Convention of Civil Engineers & National Conference
on ‗Innovation, Mechanization and Modern Techniques in Civil Engineering‘
organized by Jharkhand State Centre, 23-24 October, 2021
48
DOI: https://10.36375/prepare_u.iei.a141 ISBN 978-81-952159-1-1
Feasibility of Plastic Waste as Reinforcement in the Mechanical
Properties of Stabilized Lateritic Soil Blocks
M G Sreekumar and Deepa G Nair
Department of Civil Engineering, School of Engineering, Cochin University of Science and Technology, Kochi, Kerala
Abstract: The popularity of earthen construction increases nowadays due to its sustainability features. Stabilized earthen
blocks are much accepted as an alternative building material from earthen building products against energy-intensive
conventional building blocks. The mechanical properties of stabilized earthen blocks can be further improved by the
inclusion of waste materials. This study aimed to check the feasibility of using polypropylene and polythene plastic waste
in stabilized masonry blocks manufacturing using locally available lateritic soil. Soil samples from two nearby locations
and depths were collected and used in this study. An initial study conducted by manufacturing stabilized lateritic block
specimens were made out of these samples with different mix proportions and tested. The optimized specimens based on
strength were selected for further investigations using plastic wastes. Prospective results were obtained by this study.
Both the plastic wastes inclusion showed enhanced strength and durability properties. The improvement can be much
pronounced for polypropylene waste inclusion.
Keywords: Stabilized Earthen Blocks; Lateritic Soil, Polypropylene Waste, Polyethylene Waste, Weathering Test
INTRODUCTION
Earthen construction is one of the oldest construction techniques used to fulfill the housing demands of millions of
people throughout the world [1,2]. The different techniques and methods practicing in earthen construction are adobe,
rammed earth, cob, wattle, and daub, etc. Compressed stabilized earthen masonry building block (CSEB) is the refined
form of the adobe building blocks. The technique adopted in CSEB is the modification of properties of a selected soil
sample by adding another material (stabilizer) and compressing using a manual or mechanical press[3]. The stabilized
earthen blocks consume less energy and proved to be an alternative to conventional building blocks from burnt bricks
and concrete blocks[4]. The engineering properties of the stabilized blocks can be further improved by the introduction of
fibrous material as reinforcement in stabilized soil building blocks[5-7].
The popularity of earthen construction increases nowadays due to its sustainability features. The sustainability aspects of
earthen construction rely on the use of locally available resources such as material and labor. Laterite soil is abundantly
available in India but the potential of this resource is not properly explored for masonry building blocks. Accumulation of
unmanaged industrial or agricultural solid waste in developing countries has resulted in an increased environmental
concern. Recycling such wastes as a sustainable construction material appears to be a viable solution not only to the
pollution problem but also an economical option to design green buildings[8].
This research aims to utilize the locally available lateritic soil as source material for making masonry building blocks and
to check the feasibility of plastic waste as a reinforcement element for improving its mechanical properties
MATERIALS AND METHODS
Lateritic soils from two nearby locations in Cochin (Kerala, India) were collected and subjected to characterization
studies. Stabilized lateritic block specimens were made out of these samples with different mix proportions and tested.
The optimized specimens based on strength were selected for further investigations using plastic wastes. Details of
experimental programs are illustrated in the following sections.
Materials
Lateritic soil (source material), quarry waste cement, and lime (stabilizers) were used. Properties of the materials are
detailed below.

Proceedings of 36th National Convention of Civil Engineers & National Conference
on ‗Innovation, Mechanization and Modern Techniques in Civil Engineering‘
organized by Jharkhand State Centre, 23-24 October, 2021
49
Lateritic Soil
Two different lateritic soil samples were collected from nearby locations in Kalamassery, Kerala, India, and designated
as S2 and S4. The S2 sample was collected from an average depth of 1.50 m and S4 from an average depth of 4.50 m.
The samples were sieved through a 4.75 mm sieve. The properties of soil samples are tabulated in Table 1.
Table 1 Physical properties of soil samples
Properties S2 S4
Color Often red Blush
Specific gravity 2.42 2.58
Liquid limit (%) 60 55
Plastic limit (%) 30 34
Shrinkage limit (%) 29 32
Plasticity index (%) 30 21
pH value 4.49 4.22
Clay (%) 23 21
Silt (%) 15 20
Fine sand (%) 14 8
Medium sand (%) 32 34
Corse sand (%) 16 17
Dry density (gm/cc) 1.64 1.67
Optimum moisture content 21 20
Quarry Waste
Quarry waste passing through a 2 mm IS sieve and retaining on a 425 micron IS sieve was used for modifying the
gradation of soil samples as an initial stabilizer.
Cement and Lime
Commercially available 53 grade ordinary Portland cement and locally available shell lime were used as stabilizers.
Plastic Waste
Two types of plastic waste were tried in this research (polypropylene and polyethylene). Shredded polyethylene plastic
with an average length of 40 mm from the municipal waste processing plant was used as one type of plastic waste.
Polypropylene waste material was taken from the waste of discarded cement bags dumped in construction sites, cleaned,
and used as another type of plastic waste. The woven layers of the bags were cut to an average length of 40 mm and were
used. The physical and chemical properties of these waste additives are presented in Table 2 and illustrated in Figure 1.
Figure 1 Optical and SEM images of plastic waste additive material

Proceedings of 36th National Convention of Civil Engineers & National Conference
on ‗Innovation, Mechanization and Modern Techniques in Civil Engineering‘
organized by Jharkhand State Centre, 23-24 October, 2021
50
Table 2 Properties of plastic waste materials
Material Melting Point Ash Content Width (mm ) Thickness ( mm ) Polymer Identified
Cement bag waste (PP) 164 -167 9 2.57 0.04 Polypropylene
Shredded plastic (PE) 109 -115 15 Not uniform 0.02 – 0.06 Polyethylene
Specimen Preparation and Testing
Studies were conducted in two phases. In the first stage masonry block specimens of size 190 mm 110 mm 100 mm
were prepared using the ASTRAM manual press developed by the Indian Institute of Science, Bangalore, India. In this
stage, specimens were preparedwith varying mix proportions of lateritic soil and quarry dust (0 -25%) in combination
with cement and lime. Stabilizers, by weight of soil, were mixed thoroughly in a dry state until a homogeneous mix is
obtained. Required water content based on the OMC of the soil sample was added to this mix and mixed thoroughly for
uniform consistency. The dosage of cement (8%, lime 4%) was fixed based on earlier studies [9-12]. The measured
quantities of the mix were transferred to the manual press and compacted. Prepared blocks were stacked in a level
platform for 24 hours for ambient curing and then cured under wet gunny bags for 28 days.
The specimens were tested for compressive strength and water absorption. Specimens prepared using the S2 soil sample
showed maximum strength with 80% soil and 20% quarry waste. Whereas the S4 soil sample showed maximum strength
without modification of its gradation among all combinations tried. The maximum strength gained specimens from each
soil sample were selected for further study with the addition of plastic wastes. The designation and mix proportion of
reference specimens are tabulated in Table 3.
Table 3 Mix Designation of stabilized lateritic blocks
Soil Type Designation Mix Proportion by Weight (%)
(Soil: Quarry Dust: Cement: Lime: Plastic Waste)
Type of Plastic Waste
S2 S2R 80 : 20 : 8: 4 Nil
S4 S4R 100 : 0 : 8: 4 Nil
S2 S2PP 80 : 20 : 8: 4 : 0.50 Polypropylene
S2 S2PE 80 : 20 : 8: 4 : 0.50 Polyethylene
S4 S4PP 100 : 0 : 8: 4 : 0.50 Polypropylene
S4 S4PE 100 : 0 : 8: 4 : 0.50 Polyethylene
In the second phase, 0.50% of plastic wastes (PP and PE) corresponding to the total mass of the soil was selected as the
dosage based on the results of an earlier study [13].Plastic waste reinforced masonry blocks specimens were prepared for
further investigation.Table 3 presents the designations and mix proportions.
LABORATORY TESTS
Stabilized lateritic blocks were subjected to different strength and durability tests as discussed in the succeeding sections.
A. Density
Dry density tests were carried out as per IS: 1725 -2013 [13].
B. Wet Compressive Strength
These tests were carried out according to the IS:3495 (Part I)[14]. Specimens were immersed in clean water for 72 hours
before testing, taken out, wiped dry, and tested in a universal testing machine. Axial load was applied centrally on each
specimen at a uniform rate (14 N/mm2) up to failure after placing it in the machine between packing sheets (plywood of
thickness 3mm at top and bottom). Failure load was noted and compressive strength was calculated based on the average
bed face area.
C. Tensile Splitting Strength
The test was carried out as per IS 15658: 2006[15]. Three samples at the age of 28 days were tested and an average is
reported. Completely cured specimens were immersed in water for 24 hours, taken out, wiped dry, and placed on the

Proceedings of 36th National Convention of Civil Engineers & National Conference
on ‗Innovation, Mechanization and Modern Techniques in Civil Engineering‘
organized by Jharkhand State Centre, 23-24 October, 2021
51
universal testing machine with packing pieces on the upper face and bed face. The load was smoothly and progressively
applied at a rate corresponding to an increase in stresses of 0.05 ± 0.01 MPa. The failure load was recorded in N, to the
nearest 0.01 N.
D. Water Absorption Test
This test was carried out according to the IS:3495 (Part II)[16]. In this test, five specimens of each combination were
dried in a ventilated oven at a temperature of 105 to 115C till attain constant mass and noted their mass. Completely
dried blocks were then immersed in clean water for 24 hours and noted the new mass. The average difference of masses
was expressed in percentage.
E. Weathering
This test was carried out according to IS 1725:2013[13]. The test consists of dry the specimens in the oven at 60 ± 5C
till they attain constant weight immersing the blocks in water for a period of 5hours and then oven drying at 70± 5C for
42 hours. The procedure is repeated for 12 cycles; samples were brushed after every cycle to remove the fragment of the
material affected by the wetting and drying cycles. After completion of 12 cycles dry the specimen at 60 ± 5C till they
attain constant weight. For every sample, the variation in weight was computed after 12 cycles and the average
percentage weight loss of specimens was reported.
RESULTS AND DISCUSSION
The results of different experiments conducted are presented in Table 4. The significance of plastic waste on the strength
and durability characteristics of stabilized lateritic masonry blocks are discussed based on their results.
Strength Characteristics
The density of the blocks was verified before and after reinforcing with plastic waste. are tabulated in Table 4. A slight
improvement was observed corresponding to the reference block of each soil type.
Table 4 Average measured strength and durability properties of Stabilized Earthen blocks
The compressive strength of the reference blocks made from the S4 soil sample showed much higher strength than the S2
soil sample. This may be due to the chemical and mineralogical variation in lateritic soil along with the depth of
extraction however this may be verified with more samples with varying depth. The compressive strength of both the
samples further improved after adding the plastic waste as reinforcement. The details are illustrated in Figure 2. The
improvement in strengthover the reference blocks of each soil sample is illustrated in Figure 3. PP waste added
specimens showed much higher compressive strength than PE waste. The improvement is more significant for the S4 soil
sample with the PP waste.
Designation Dry Density
(g/cc)
Wet Compressive
Strength (MPa)
Tensile Splitting Strength Water
Absorption
(%)
Weathering
Mass Loss
(%)
28days Tensile
strength
(MPa)
Failure load per
Length (N/mm)
S2R 1.72 3.13 0.28 44.21 14.14 2.88
S4R 1.73 4.68 0.42 66.32 14.17 2.86
S2PP 1.74 3.58 0.31 48.42 13.82 2.81
S4PP 1.75 5.80 0.51 80.00 13.85 2.80
S2PE 1.74 3.28 0.29 45.26 13.82 2.83
S4PE 1.74 4.94 0.44 68.42 13.84 2.81

Proceedings of 36th National Convention of Civil Engineers & National Conference
on ‗Innovation, Mechanization and Modern Techniques in Civil Engineering‘
organized by Jharkhand State Centre, 23-24 October, 2021
52
Figure 2 Compressive strength comparison of stabilized
earthen blocks
Figure 3 Compressive strength of improvement over
reference block
Tensile strength showed a similar trend as seen in the compressive strength study.The tensile strength improvement over
the reference block is illustrated in Figure 4. Plastic waste inclusion showed an enhanced tensile strength for both soil
samples. The PP waste added specimens showed more tensile strength improvement than the PE waste added specimens.
Figure 4 Tensile strength of improvement over reference block
The plastic reinforced specimen showed enhanced compressive and tensile strength characteristics. The S4 soil sample
with plastic waste reinforcement exhibited much more strength than specimens made from the S2 soil sample with plastic
waste. The improvement of the strength after the inclusion of plastic waste can be explained that, when fibers of
relatively high tensile strength are embedded in a soil matrix, the shear stresses generated between the soil particles are
transferred to the fibers in the form of tensile strength resulting in a transition from brittle to ductile behavior and
contributing to significant improvement in compressive strength [17]. It can be seen that the strength gain is more
significant for polypropylene waste (PP) than polyethylene waste ( PE). This is due to the uniform size of PP waste from
the cement bag strip (Figure 1) have a better aspect ratio than the PE shredded waste collected from the waste treatment
plant. Moreover, polypropylene polymer is stiffer than polyethylene and exerting more tensile strength in the soil fiber
matrix.
Durability Characteristics
Durability characteristics are verified by Water Absorption and weathering test. Test results are tabulated in Table 5.
Improved water absorption characteristics can be observed in all cases after the inclusion of plastic waste in the masonry
block specimens. Both types of the PP and PE waste reinforced specimens showed little affinity towards water absorption
and less water absorbent than the reference block of each soil type. The water absorption observed for all types of
specimens is well within the 18% limit insisted in the Indian standard.

Proceedings of 36th National Convention of Civil Engineers & National Conference
on ‗Innovation, Mechanization and Modern Techniques in Civil Engineering‘
organized by Jharkhand State Centre, 23-24 October, 2021
53
Figure 5 illustrates the specimens before and after 12 cycles of the weathering test. The accepted value of mass loss after
12 cycles of alternate wetting and drying tests is 3% as per the Indian code practice. The test result of specimens is well
within the accepted value. It can be observed from the results that, the plastic waste reinforced specimens showed better
performance against weathering action than unreinforced specimens of both soil samples.
Figure 5 Stabilized lateritic soil blocks before and after weathering test
CONCLUSIONS
This research could establish utilization of locally available lateritic soil as source material for making masonry building
blocks and viability of plastic waste as a reinforcement element in enhancing its properties. Based on the experimental
study following conclusions are drawn.
1. Plastic waste inclusion in soil samples showed enhanced compressive and tensile strength for both the soil samples
and justifies its usage in the production of the stabilized lateritic soil masonry blocks.
3. Among the plastic waste tried the polypropylene waste showed significant improvement than the polyethylene waste
inclusion in the soil samples.
4. Plastic waste reinforced specimens showed better durability properties (water absorption and weathering resistance)
than unreinforced specimens.
5. S4 soil samples taken from the higher depth showed much higher strength than S2 soil samples from shallow depth.
This may be due to the chemical and mineralogical variation in lateritic soil along with the depth of extraction
however this may be verified with more samples with varying depth.
REFERENCES
1. Parisi, Fulvio, Domenico Asprone, Luigi Fenu and Andrea Prota. Experimental characterization of Italian composite
adobe bricks reinforced with straw fibers, Composite Structures, vol 122, 2015, pp 300–307,
https://doi.org/10.1016/j.compstruct.2014.11.060.
2. H.B. Nagaraj A. Rajesh and M.V. Sravan, influence of soil gradation, proportion and combination of admixtures on
the properties and durability of CSEBs. Construction and Building Materials, vol 110, 2016,
https://doi.org/10.1016/j.conbuildmat.2016.02.023.
3. E.A. Adam and P.J. Jones. Thermophysical properties of stabilised soil building blocks. Building and Environment
30, no. 2, 1995, pp 245–53, https://doi.org/10.1016/0360-1323(94)00041-P.
4. B.V. Reddy and K.S. Jagadish, Embodied energy of common and alternative building materials and technologies,
Energy and Buildings, vol 35, no 2, 2003, pp 129-137.
5. Binici, Hanifi, Orhan Aksogan and Tahir Shah, Investigation of fibre reinforced mud brick as a building material,
Construction and Building Materials 19, no. 4, 2005, pp 313–18. https://doi.org/10.1016/j.conbuildmat.2004.07.013.
6. Danso, Humphrey, D. Brett Martinson, Muhammad Ali and John B. Williams, Physical, mechanical and durability

Proceedings of 36th National Convention of Civil Engineers & National Conference
on ‗Innovation, Mechanization and Modern Techniques in Civil Engineering‘
organized by Jharkhand State Centre, 23-24 October, 2021
54
properties of soil building blocks reinforced with natural fibres, Construction and Building Materials, vol 101, 2015,
pp 797–809, https://doi.org/10.1016/j.conbuildmat.2015.10.069.
7. Hejazi, Sayyed Mahdi, Mohammad Sheikhzadeh, Sayyed Mahdi Abtahi and Ali Zadhoush, A simple review of soil
reinforcement by using natural and synthetic fibers, Construction and Building Materials, vol 30, 2012, pp 100–116.
https://doi.org/10.1016/j.conbuildmat.2011.11.045.
8. S.P. Raut, R.V. Ralegaonkar and S.A. Mandavgane, Development of sustainable construction material using
industrial and agricultural solid waste: a review of waste-create bricks, Construction and Building Materials, 2011.
https://doi.org/10.1016/j.conbuildmat.2011.04.038.
9. James L Eades and Ralph E Grim, A quick test to determine lime requirements for lime stabilization, The 45th
Annual Meeting of the Committee on Lime and Lime-Fly Ash Stabilization, 1960.
10. B.V. Venkatarama Reddy and Ajay Gupta. Strength and elastic properties of stabilized mud block masonry using
cement-soil mortars, Journal of Materials in Civil Engineering, 2006, https://doi.org/10.1061/(ASCE)0899-
1561(2006)18:3(472).
11. B.V. Venkatarama Reddy and P. Prasanna Kumar, Embodied energy in cement stabilised rammed earth walls,
Energy and Buildings, vol 42, 2010, pp 380–85, https://doi.org/10.1016/j.enbuild.2009.10.005.
12. M.G. Sreekumar and Deepa G Nair, Stabilized lateritic blocks reinforced with fibrous coir wastes methodology of
research, International Journal of Sustainable Construction Engineering & Technology, vol 4, no 2, 2013, pp 23–32.
13. M.G. Sreekumar and Deepa G Nair, Mechanical properties of stabilized lateritic soil blocks with fibrous waste
additives, International Journal of Sciences, Basic and Applied Research, IJSBAR 8, no. 12, 2018, pp 336–350.
14. Bureau of Indian Standards. IS 1725 : 2013 (Reaffirmed Year: 2019) Stabilized Soil Blocks Used in General
Building Construction - Specification. New Delhi: Bureau of Indian Standards, 2013.
15. Bureau of Indian Standards. IS 1725 : 2013 (Reaffirmed Year: 2019) Stabilized Soil Blocks Used in General
Building Construction Specification. New Delhi: Bureau of Indian Standards, 2013.
16. Bureau of Indian Standards. IS 15658:2006. Indian Standard Precast Concrete Blocks for Paving – Specification.
New Delhi: Bureau of Indian Standards, 2006.
17. Bureau of Indian Standards. Burnt Clay Building Bricks — Methods of Tests Part 2 Determination of Water
Absorption (Fourth Revision). In IS 3495 : Part 2: 2019. New Delhi: Bureau of Indian Standards, 2019.
18. Tan, Teingteing, Bujang B K Huat, Vivi Anggraini, Sanjay Kumar Shukla, Teingteing Tan, Bujang B K Huat, Vivi
Anggraini and Sanjay Kumar, Strength behavior of fly ash-stabilized soil reinforced with coir fibers in alkaline
environment strength behavior of fly ash-stabilized soil reinforced with coir fibers in alkaline environment. Journal
of Natural Fibers, vol 00, no 00, 2019, pp 1–14, https://doi.org/10.1080/15440478.2019.1691701.

Proceedings of 36th National Convention of Civil Engineers & National Conference
on ‗Innovation, Mechanization and Modern Techniques in Civil Engineering‘
organized by Jharkhand State Centre, 23-24 October, 2021
55
DOI: https://10.36375/prepare_u.iei.a126 ISBN 978-81-952159-1-1
Modelling and Exploring the Impacts of E-Grocery Shopping on
Trip Generation in India
Suprava Jena1, Momi Deb
2 and Manish Dutta3
1Assistant Professor Department of Civil Engineering, National Institute of Technology Silchar, Assam
2 PhD Student, Department of Civil Engineering, National Institute of Technology Silchar, Assam
3 Assistant Professor, Department of Civil Engineering, Institute of Technology, Nirma University, Ahmedabad, Gujarat
Abstract: The limited space for the road widening and an increasing number of vehicles leads to never ending congestion
in the peak hours. However, the trip generation can be reduced or manipulated by targeting any essential activity such as
grocery shopping (which has been carried out even in the strictest lockdown due to the COVID-19 pandemic). In this
study, a questionnaire survey is done and data of 434 respondents are analysed to see how the grocery shopping trip
behaviour of the people residing in tier I cities of India is influenced by the chosen demographic variables and online
grocery shopping. A linear model is formulated by multiple linear regression to forecast the number of grocery shopping
trips, which is validated with the observed number of trips. The model reveals that purchasing groceries from online
shopping do reduce the number of shopping trips generated and the same can be used by urban planners while sketching
out the plans for transportation infrastructure
Keywords: Online Grocery Shopping, Shopping Trips, Trip Generation, Multiple Linear Regression, India
INTRODUCTION
The expansion of road widths on limited and expensive urban lands would not be feasible after a stage in a populous and
dense country like India. The intent of reducing congestion in urban areas by constructing flyovers or limited- access
high capacity roads has gone in vain with the passage of time as from practical experience and researchers have
demonstrated that when highway capacity increases, vehicle travel also increases as it attracts potential demand as well as
reduces public and non-motorised transportation use due to compromised access for these modes of transport.
Ref [1] Reveals India is the fastest growing E-commerce market and is expected to grow at approximately 1,200% by
2026 with grocery and fashion/apparels likely to be the key drivers. Also, grocery is the largest consumer segment and
Indians spend more than 50% of their monthly income on groceries and is conducted frequently with high repeat rate, so
much so that it was carried out even during the lockdown. Studying the activity and travel pattern of grocery shopping
and considering the same while modelling to forecast the grocery shopping trips, then not only the congestion in the
markets can be reduced but also suggestions can be put forward for planning an infrastructure for trip reduction which
will counteract the booming number of private vehicles on urban roads.
Ref.[2] demonstrated that ICT could influence leisure activities in four ways: substitution, complementary, modification
and neutrality. The positive relationship between ICT usage and travel were found by a few researchers [3-6]. Ref.[7]
found that men between the ages of 25 and 40 who were highly educated, had a high income, living in a less urbanised
region are mostly the online buyers. Ref.[8] concluded that online shopping might facilitate changing travel behaviour by
employing eco-friendly means of transportation in Sweden. Individuals in developing countries prefer in-store shopping
practises, according to evidence from Bandung by Ref.[9]. Few researchers showed that frequency of online purchases
was positively related to the frequency of shopping trips[10,11].
The aforesaid previous studies were done in the European countries, USA, and China. Few studies were done on the
transportation impacts of ICT use[5,6]. While few others explored the impacts of online shopping on travel
behaviour[7,8]. The relationship between online searching, online buying and in-store shopping were also investigated by
some researchers[10-13]. However, none of them have focussed particularly on online grocery shopping, which is an
indispensable activity, that too keeping the current pandemic in view.

Proceedings of 36th National Convention of Civil Engineers & National Conference
on ‗Innovation, Mechanization and Modern Techniques in Civil Engineering‘
organized by Jharkhand State Centre, 23-24 October, 2021
56
In India, transportation impacts of teleworking have been studied till now[14-16], but online shopping impacts on travel
behaviour are yet to be explored. Impacts of online grocery shopping in particular on travel behaviour is also not
explored anywhere across the globe The economically and culturally diverse population and the largest middle-class
section of Indian society might respond different to the transforming grocery shopping (physical to virtual) and thus can
give valuable inputs to the planners.
The objective of this study is to investigate the impacts of e-grocery shopping on grocery shopping trip generation by
developing a model which will predict the number of grocery shopping trips generated. The paper is structured in the
following ways. The next section consists of methodology which includes selection of study areas and input variables,
data collection and modelling approach. Results and analysis are presented in the final section which is succeeded by
concluding remarks.
METHODOLOGY
Selection of Study Areas & Input Variables
The study areas are the tier I cities of India i.e., Delhi, Mumbai, Bangalore, Kolkata, Pune, Ahmedabad and Hyderabad.
They are chosen based on the availability of online grocery shopping services like Big Basket, Jiomart etc.
The input variables i.e., dependent variable chosen is number of trips generated for grocery shopping even after they have
purchased online and the independent variables include socio demographic factors and grocery shopping information.
Figure 1 Input variables
Data Collection
The data was collected from the above shown cities though questionnaire survey by sharing the google forms via social
media sites, messenger apps and mails.
The Questionnaire survey consists of three sections. The first section contains demographic information of the grocery
shopper of the family like age, gender, educational background, type of work and the city they inhabit. The second
section comprises of household information of the grocery shopper like monthly household income, no. of kids (<5
years) and no. of senior citizens (> 60 years) in the family, no. of family members with driving license ownership, and
no. of two wheelers and four wheelers. The last section inquires grocery shopping information whether they make the
purchase online or offline, how many times a month they opted for store shopping, how and when they make the
purchase in a day, how many times they went on their foot or in a vehicle.
Modelling Approach
Since the dependent variable (number of trips) was continuous and there were six independent variables, multiple linear
regression is used for modelling expressed in the following equation:
Y= β0 + β1X1 + ... + βn Xn + ε(1)
Where, β0 is the intercept, β1, β2…... βn are the corresponding coefficients to be calculated, X1, X2…...Xn are the independent
variables, ε is the standard error.

Proceedings of 36th National Convention of Civil Engineers & National Conference
on ‗Innovation, Mechanization and Modern Techniques in Civil Engineering‘
organized by Jharkhand State Centre, 23-24 October, 2021
57
RESULTS AND ANALYSIS
Analysis from the Survey
543 responses were received and got updated in the google sheet simultaneously, from which, after screening, 434(80%)
have been selected for analysis.Once the data were received, the independent or predictor variables were finalised.
Gender, type of work (fixed/flexible/ work from home/ student/homemaker), number of kids below five years of age,
number of senior citizens, number of two wheelers and online grocery shopping time (not applicable, before/after work,
while working) were selected for further analysis.
It is observed from the data that out of 434 respondents, the higher income groups (50k-100k and >100k) indulge more in
e-grocery shopping (57% and 55% respectively). The middle- and lower-income groups do purchase groceries from
online sites but the percentage is lower than those who do not at all(less than 45%). It must be due to the financial
capability and hectic working hours of the respondents that make them opt for e-grocery shopping. Another tendency was
seen in respondents who go for the in-store grocery shopping mostly in the evening (69%), followed by morning (17%)
and afternoon (14%). This might be because people finish off their work mostly by evening (in Indian scenario) and goes
for purchasing groceries post-work. Also, the heat in the daytime might discourage shoppers to go to the stores in the
afternoon and thus purchasing starts as the sun sets. This finding can be used to suggest for encouraging masses to use
public transportation by improvising the infrastructure, solely for the purpose of shopping in the evening. This would
decrease congestion to quite a significant extent in the peak hours of evening. Upon asking the reason for not opting the
E-grocery shopping, 33% o gave the reason of intangibility which is missing in the virtual platforms. 15% claim that
groceries are cheaper in stores than in online sites which contradicts our assumption of discounts and cash backs being
the magnetic reason for increase in online grocery shopping. High delivery charge prevents 10% to make online grocery
purchase.
Outcomes of Multiple Linear Regression
Table 1 shows if the overall regression model is significant or not which is determined by checking if the p value is less
than 0.05 or not. The ANOVA test results shows that the model is significant since p ≤ 0.05. In Table 2 the R Square
value is interpreted first. R square value indicates that 77% percentage of variance is accounted for in number of trips
generated by all the independent variables or predictors included in the model. The Standard error of estimate shows the
measure of accuracy of the prediction is 69.1%.
Table 3 describes how the predictor variables impact the dependent variables. The intercept of the model is found to be
3.991. All the independent variables are significant since p value is less than 0.05.The coefficient of gender is 1.614
which suggests that if the grocery shopper is male, then the trips generated will be 1.614 times more than that of female.
This justifies that woman has multiple roles to play and going multiple number of times from their tight schedule for
grocery shopping purpose is least expected from them.
Table 1 ANOVA test results
Model Sum of Squares df Mean Square Sig.
1 Regression 688.623 6 114.770 0.000b
Residual 203.764 427 0.477
Total 892.387 433
Table 2 Summary of the model
Model R R Square Adjusted R Square Std. Error of the Estimate
1 0.878 0.772 0.768 0.691

Proceedings of 36th National Convention of Civil Engineers & National Conference
on ‗Innovation, Mechanization and Modern Techniques in Civil Engineering‘
organized by Jharkhand State Centre, 23-24 October, 2021
58
Table 3 Model parameters
Model Unstandardized Coefficients Standardized Coefficients t Sig.
B Std. Error B
(Constant) 3.991 0.156 25.565
Gender 1.614 0.072 0.548 22.330 0.000
Type_of_Work -0.211 0.025 -0.205 -8.418 0.000
No_of_Kids 0.812 0.041 0.474 19.608 0.000
No_of_Senior_Citizens -0.881 0.041 -0.517 -21.517 0.000
No_of_Two_Wheelers -0.887 0.035 -0.629 -25.353 0.000
Online_Shopping_Time -0.383 0.046 -0.206 -8.341 0.000
The type_of_work variable has the coefficient of -0.211 which means that the one with the most liberal working hours
(homemaker = 4, student = 3) will generate lesser trips than that of fixed timing workers (fixed = 0, flexible = 1, WFH =
2) i.e., if a homemaker is the grocery shopper of the home, the shopping trips generation decreases by 84.4%. This
indicates that the respondents who have fixed working schedule tend to generate more grocery shopping trips. The
coefficient of no_of_kids is 0.812 and keeping the values assigned into account (0 kid=3, 1 kid=2, 2 kids =1 and >2 kids
=0), it can be interpreted that the number of shopping trips increases by 2.44 if a household has no kid below 5 years of
age. The presence of kids below 5 years of age requires constant attention which does not let the adults in families
(mostly nuclear in structures) make too many frequent trips to grocery stores Whereas no_of_senior_citizens has a
coefficient of -0.881 which shows as the number of senior citizens in a household increases, the shopping trip generation
increases by 88.1. This positive co-relation between dependent and independent variables in spite of the negative sign
associated with the coefficient is because of ordinal nature of independent variable (no_of_senior_citizens: - 0 = 3,1 = 2,2
= 1, > 2 = 0). This depicts that those households which have a greater number of senior citizens are more inclined
towards in-store shopping and thus more trips will be generated. The coefficient of no_of_two_wheelers indicates that
with the increasing number of two wheelers, the trip generation will decrease by 88.7%. This is quite contradictory since
the greater number of two wheelers should have made the grocery shopping trips more convenient and easier but here the
decrease in trip generation is justified after analysing data (from our questionnaire survey) that a household with a greater
number of two wheelers indicates a higher monthly household income and thus they are more inclined towards online
grocery. The last predictor variable Online_shopping_time has a negative association with the dependent variable with a
coefficient of -0.383. This coefficient clearly indicates the negative relationship between online grocery shopping and in-
store grocery shopping trips generated.
The t-test associated with a b-value is significant (sig.<0.05)then the predictor is making a significant contribution to the
model. All are significant independent variables for this model. The larger the value of t, the greater the contribution of
that predictor.
Since B-values indicate the individual contribution of each predictor to the model, the model obtained by replacing B-
values in (1) is as follows:
NOT = 3.991 + 1.614G − 0.211TOW + 0.812NOK − 0.881NOS − 0.887NOTW − 0.383OST + error (2)
Where, NOT= Number of grocery shopping trips generated, G = Gender, TOW= Type of work, NOK= Number of kids
below 5 years of age, NOS= Number of senior citizens, NOTW= Number of kids two wheelers, OST= Online grocery
shopping.
Validation of the Regression Model
The model obtained after applying multiple linear regression on the input variables is validated by plotting a scattered
graph between observed number of shopping trips and predicted number of shopping trips, after choosing 20% data
randomly from the response sheet. Figure 2 shows that there is 80.13% similarity between the predicted number of
shopping trips, which is obtained after putting the assigned values of the independent value in (2) and observed number
of trips obtained from the questionnaire data.

Proceedings of 36th National Convention of Civil Engineers & National Conference
on ‗Innovation, Mechanization and Modern Techniques in Civil Engineering‘
organized by Jharkhand State Centre, 23-24 October, 2021
59
Figure 2 Graph between observed and predicted trips
CONCLUSION
This study explores the grocery shopping trip behaviour of people of tier I cities of India and how the shopping trip
generation gets impacted by the different independent variables. Afterthe literature review and gap identification, the
determination of the objective followed. The study area was chosen, and data collection was done using a questionnaire
survey. The modelling approach employed on the collected data was the multiple linear regression. The results from this
project work and their applications are summarised below:
E-grocery shopping is done more by the middle- and higher-income groups which justifies their financial capability
as obtained from the data.
The in-store grocery shopping is done mostly in the evening(72%). So, the probable congestion due to this activity
can be solved by providing public transportation facilities by the urban planners meant specifically for shopping
purposes in the dusk hours.
The model developed shows that online grocery shopping decreases the grocery shopping trip generation. This will
provide an insight to those entrepreneurs who want to build start-ups on online grocery delivery from the local
grocery shops and malls.
This study can be extended to the shopping of all products to predict the shopping trip generation in India. The impacts of
trip generation due to shopping activity on environment (in terms of emission of harmful pollutants) can be examined.
REFERENCES
1. Https://Www.Ibef.Org/Download/E-Commerce-October-2020.Pdf,‖," [Online].
2. P.L. Mokhtarian, I. Salomon and S. L. Handy, The impacts of ict on leisure activities and travel: a conceptual
exploration, Transportation, vol 33, no 3, 2006, pp 263-289.
3. M. Senbil and R. Kitamura, Simultaneous relationships between telecommunications and activities, 10th
International Conference on Travel Behaviour Research, Lucerne, 2003.
4. F. Zhang, K. J. Clifton and Q. Shen, Reexamining ICT impact on travel using the 2001 nhts data for baltimore
metropolitan area, 2005.
5. D. Wang and F.Y.T. Law, Impacts of information and communication technologies (ICT) on time use and travel
behaviour: a structural equations analysis, Transportation, vol. 34, 2007, pp. 513-527.
6. S. Choo, I. Kim and H. Lee, Exploring relationships between information and communication technology (ICT) use
and travel, Journal of The Eastern Asian Society for Transportation Studies, vol. 8, 2010.
7. S. Farag, M. Djist and M. Lanzendorf, Exploring the use of e-shopping and its impact on personal travel behavior in
the Netherlands, Transportation Research Record, vol 1858, 2003, pp. 03-3058.
8. L.W. Hiselius, L.S. Rosqvist and E. Adell, Travel behaviour of online shopper in Sweden, Transport and
Telecommunication, vol. 16, pp. 21-33, 2015.
9. T.B. Joewono, A.K. Tarigan and M. Rizki, Segmentation, classification, and determinants of in-store shopping
activity and travel behaviour in the digitalisation era: the context of a developing country, Sustainability, 2019.

Proceedings of 36th National Convention of Civil Engineers & National Conference
on ‗Innovation, Mechanization and Modern Techniques in Civil Engineering‘
organized by Jharkhand State Centre, 23-24 October, 2021
60
10. S. Farag, T. Schwanen and M. Dijst, Shopping online and/or in-store? a structural equation model of the
relationships between e-shopping and in-store shopping, 45th Congress of the European Regional Science
Association: Land Use and Water, Amsterdam, 2005.
11. Z.F.X. Du, J. Cao and P.L. Mokhtarian, The association between spatial attributes and e-shopping in the shopping
process for search goods and experience goods: evidence from Nanjing, Journal of Transport Geography, vol 66,
2018, pp 291-299.
12. G. Xi, F. Zhen, X. Cao and F. Xu, The interaction between e-shopping and store shopping: empirical evidence from
Nanjing, China, Transportation Letters, 2018.
13. K. Shi, J.D. Vos, Y.Yang and F. Witlox, Does e-shopping replace shopping trips? Empirical evidence from
Chengdu, China, Transportation Research Part A, vol 122, 2019, pp 21-33.
14. L.P.C and M.V.L. Anjaneyulu, Modeling the choice of tele-work and its effects on travel behaviour in indian
context, Procedia - Social And Behavioral Sciences, vol 104, 2013.
15. L.P.C and M.V.L. Anjaneyulu, Modeling the impact of ICT on the activity and travel behaviour of urban dwellers
in indian context, Transportation Research Procedia, vol 17, 2016, pp. 418-427.
16. L.P.C and M.V.L. Anjaneyulu, Networkwide impact of telework in urban areas: case study of Bangalore, India,
Journal of Transportation Engineering, Part A: Systems, 2017.

Proceedings of 36th National Convention of Civil Engineers & National Conference
on ‗Innovation, Mechanization and Modern Techniques in Civil Engineering‘
organized by Jharkhand State Centre, 23-24 October, 2021
61
DOI: https://10.36375/prepare_u.iei.a142 ISBN 978-81-952159-1-1
Optimum Location of Shear Wall in High Rise Building with
Comparison of Lateral Displacement, Drift, Base Shear and
Stiffness
A Shanmugam
Additional Engineer G II, Department of Civil Engineering, Bharat Heavy Electricals Limited, Tuticorin
Abstract: In urban area, rate of increase in human population is drastically very high compare to rural area.
Consequently, construction of high-rise building is inevitable to maintain the economy and affordability of people need.
The foremost response of structural engineer is to design high rise building/structure with durable, stable, safe and
economical. Usually, Tall building are vulnerable to lateral loads which are induced by wind and earthquake. These
forces are encountered by provision of shear wall. The location of shear wall is playing main role.
This paper prepared by comparison of results of lateral displacement, drift, base shear and stiffness by providing the two
different location of shear walls.The structure is designed by Extended Three-dimensional Analysis of Building Systems
(ETABS). The results show provision of shear wall at middle is feasible for this type of 21 storey structure, which is
effectively reduce the displacement and drift.
Keywords: Shear Wall, Optimization, Displacement, Drift, Wind Load, Seismic (Zone III)
INTRODUCTION
Structural engineers‘ role is to design a tall building with minimized lateral displacement and Inter storey drift, it should
be always with in limit and in line with Indian Standards.
In my study in addition to core shear wall periphery shear wall provision at two different locations.
First Case
Core shear wall with corner portion shear wall provision in all four sides.
Second Case
Core shear wall with middle portion shear wall provision in all four sides.
Shear wall system is one of the very popular and economical system for tall building. Placing of Shear wall will play the
significant role in Design of structure with economic and durably, hence my study is to find out the optimum location of
shear wall provision.
Aim of the Study
The wind load was calculated as per IS 875 [part 3] – 2015 and Seismic Analysis was performed as per IS 1893 -2016.
The following three criteria was taken for arriving the optimum location of shear wall by provision of shear wall in the
frame structure with two different set of locations.
a) To determine the Maximum Lateral Displacement.
b) To study the effect of Maximum Drift.
c) To study the Base shear

Proceedings of 36th National Convention of Civil Engineers & National Conference
on ‗Innovation, Mechanization and Modern Techniques in Civil Engineering‘
organized by Jharkhand State Centre, 23-24 October, 2021
62
d) To study the Stiffness
STRUCTURAL MODELLING
This tall building has been designed with the Special Moment Resistant Frame (SMRF) of thirty-six floor (G+20)
building situated in seismic zone III. In this study the plan layout is similar for my two cases under investigation. Layout
plan 1 story to 10 story having the L shape from 11 to 21 story having rectangular plan (refer Figures 2 and 3).
All side Corner shear wall and all side Middle shear wall are provided for my study to get the optimization of structural
design.
For provision of shear wall at corner location length = 13+13+15+15.63 = 56.63 m and for provision of shear wall at
middle location length = 14+16+16+10.63 = 56.63 m, hence the length of shear wall is exactly same for my two cases.
In addition to periphery shear wall [ all side corner or all side middle portion] center DUAL SHEAR WALL is also
provided in the core of the structure {lift area wall used as a core shear wall}
BUILDING DETAILS / DESCRIPTIONS
a. Material
Grade of concrete M35 & M 40 (40 N/mm2)
Grade of Steel Fe 550 (550 N/mm2)
Youngs modulus Concrete 25 1000 kN/M2
Youngs modulus Rebar 2 105 kN/M
2
b. Building Details
Table A
Plan area of building 48 72 m
Exact area of building (L Shape) 28 m 72 m – Grid D-H, 1-11 & 20 X 19 Grid A-D, 8-11.
No of floors G + 21
Type of building Commercial
Typical floor height 4 M & 3.6 M
Total height of building 80.4 m (G+20+head room and water tank)
Span in X direction 7 & 6 m
Span in Y direction 8 m & 5 m
c. Member Properties (Sizes in mm)
Table B
Thickness of roof slab 175
Column size upto 12 th floor 900 600
Column size from 13th to 21nd 750 450
Column grid A,B,C & 9,10,11 800 500
Water tank column 500 500
Beam size B1 400 900
Beam size B2 300 500
Beam size B3 outrigger tie beam 350 600
Span in X direction max 7000 & 6000
Span in Y direction max 8000 & 5000
Wall thickness P2 250
Wall thickness P3 450
Wall thickness P4 150

Proceedings of 36th National Convention of Civil Engineers & National Conference
on ‗Innovation, Mechanization and Modern Techniques in Civil Engineering‘
organized by Jharkhand State Centre, 23-24 October, 2021
63
d. Loading Details
Seismic Parameters
Table C
Importance factor, I 1.2
Type of structure SMRF
Response reduction factor, R 5.0
Seismic zones III
Seismic zone factore 0.16
Type of soil Medium or stiff soil
Limit State Method of Design
Pictorial Representation
Figure 1 Response spectrum IS 1893:2016 (ETABS screen shot)

Proceedings of 36th National Convention of Civil Engineers & National Conference
on ‗Innovation, Mechanization and Modern Techniques in Civil Engineering‘
organized by Jharkhand State Centre, 23-24 October, 2021
64
Figure 2 Typical floor plan: from base to 12 story level:
shear wall at middle portion
Figure 3 Typical floor plan: from base to 12 story level:
shear wall at corner portion
Figure 4 Typical floor plan: from 13 to 21 story level:
shear wall at middle portion
Figure 5 Typical floor plan: from 13 to 21 story level:
shear wall at corner portion

Proceedings of 36th National Convention of Civil Engineers & National Conference
on ‗Innovation, Mechanization and Modern Techniques in Civil Engineering‘
organized by Jharkhand State Centre, 23-24 October, 2021
65
Figure 6 Loading Details
Figure 7 3 D view Details
MODEL PARTICIPATION MASS RATIO
Table 1 Modal Participating Mass Ratios
Case Mode Period in sec Sum UX Sum UY Sum UZ Sum RX Sum RY Sum RZ
Modal 33 0.07 0.99 0.99 0.72 0.82 0.88 0.93
Modal 34 0.05 0.99 1.00 0.72 0.82 0.88 0.93
Modal 35 0.05 1.00 1.00 0.72 0.82 0.89 0.93
Modal 36 0.03 1.00 1.00 0.72 0.82 0.90 0.93
Modal 37 0.02 1.00 1.00 0.72 0.83 0.90 0.93
MAX LATERAL DISPLACEMENT
Shear Wall Located at Corner
Name Story Resp1
Display Type Max Story displ Story Range All Stories
Load Combo DCon7 Top Story Story 22
Output Type Not Applicable Bottom Story Base

Proceedings of 36th National Convention of Civil Engineers & National Conference
on ‗Innovation, Mechanization and Modern Techniques in Civil Engineering‘
organized by Jharkhand State Centre, 23-24 October, 2021
66
Table 2 Max Lateral Displacement SW at Corner
Story Elevation (m) Location X-Dir (mm) Y-Dir (mm)
Story 22 80.4 Top 65.924 2.352
Story 21 76.8 Top 66.179 2.79
Story 20 73.2 Top 67.588 4.643
Story19 69.6 Top 64.329 4.182
Story18 66 Top 60.812 3.936
Story 17 62.4 Top 57.235 3.886
Story 16 58.8 Top 53.569 3.793
Story15 55.2 Top 49.818 3.67
Story14 51.6 Top 45.992 3.52
Story13 48 Top 42.099 3.339
Story12 44.4 Top 38.14 3.107
Story11 40.8 Top 34.21 2.901
Story10 37.2 Top 30.29 4.229
Story9 33.6 Top 26.398 3.626
Story8 30 Top 22.565 3.038
Story7 26.4 Top 18.83 2.469
Story6 22.8 Top 15.239 1.935
Story5 19.2 Top 11.847 1.444
Story4 15.6 Top 8.717 1.09
Story3 12 Top 5.922 0.828
Story2 8 Top 3.295 0.551
Story1 4 Top 1.288 0.315
Base 0 Top 0 0

Proceedings of 36th National Convention of Civil Engineers & National Conference
on ‗Innovation, Mechanization and Modern Techniques in Civil Engineering‘
organized by Jharkhand State Centre, 23-24 October, 2021
67
Shear Wall Located at Middle
Display Type Max Story Displ Story Range All Stories
Load Combo DWal7 Top Story Story 22
Table 3 Max Lateral Displacement – SW at Middle
Story Elevation (m) Location X-Dir (mm) Y-Dir (mm)
Story 22 80.4 Top 72.627 4.447
Story 21 76.8 Top 74.793 4.46
Story 20 73.2 Top 80.102 11.981
Story19 69.6 Top 76.35 11.524
Story18 66 Top 72.44 11.007
Story 17 62.4 Top 68.423 10.473
Story 16 58.8 Top 64.27 9.914
Story15 55.2 Top 59.989 9.334
Story14 51.6 Top 55.587 8.732
Story13 48 Top 51.077 8.1
Story12 44.4 Top 46.447 7.427
Story11 40.8 Top 41.9 6.798
Story10 37.2 Top 37.288 6.674
Story9 33.6 Top 32.659 5.92
Story8 30 Top 28.061 5.098
Story7 26.4 Top 23.538 4.269
Story6 22.8 Top 19.148 3.456
Story5 19.2 Top 14.96 2.707
Story4 15.6 Top 11.059 2.078
Story3 12 Top 7.545 1.512
Story2 8 Top 4.187 0.959
Story1 4 Top 1.559 0.493
Base 0 Top 0 0

Proceedings of 36th National Convention of Civil Engineers & National Conference
on ‗Innovation, Mechanization and Modern Techniques in Civil Engineering‘
organized by Jharkhand State Centre, 23-24 October, 2021
68
MAX DRIFT
Drift – Shear Wall at Corner
Table 4 Story Max/Avg Drifts SW at Corner
Story Load Case/Combo Direction Max Drift in mm Avg Drift in mm Ratio
Story3 Wall X 0.006 0.003 1.943
Story2 Floor Finish Y 0.007 0.004 1.791
Story2 Wall X 0.007 0.003 2.472
Story 21 DSlbU212 X 4.58 3.339 1.372
Story 21 DSlbU261 X 4.58 3.339 1.372
Story 21 DWal3 X 4.58 3.339 1.372
Story 21 DCon3 X 4.58 3.339 1.372
Story 21 DWal11 X 5.112 3.793 1.348
Story 21 DCon11 X 5.112 3.793 1.348
Story 21 DSlbU216 X 5.177 3.845 1.346
Story 21 DSlbU265 X 5.177 3.845 1.346
Story 21 DSlbU220 X 5.242 3.856 1.359
Story 21 DSlbU269 X 5.242 3.856 1.359
Story 21 DWal7 X 5.309 3.925 1.353
Story 21 DCon7 X 5.309 3.925 1.353
Drift – Shear Wall at Middle
Table 5 Story Max/Avg Drifts SW at Middle
Story Load Case/Combo Direction Max Drift in mm Avg Drift in mm Ratio
Story2 Floor Finish Y 0.00 0.00 4.28
Story13 Wall Y 0.01 0.00 3.42
Story12 Wall Y 0.01 0.00 2.57
Story13 DWal7 X 4.69 3.52 1.33
Story 21 DSlbU208 X 5.37 3.57 1.51
Story 21 DSlbU257 X 5.37 3.57 1.51
Story 21 DSlbU220 X 5.51 3.95 1.40
Story 21 DSlbU269 X 5.51 3.95 1.40
Story 21 DSlbU212 X 5.53 3.77 1.47
Story 21 DSlbU261 X 5.53 3.77 1.47
Story 21 DWal3 X 5.53 3.77 1.47
Story 21 DWal11 X 5.58 3.98 1.40
Story 21 DSlbU216 X 5.97 4.19 1.43
Story 21 DSlbU265 X 5.97 4.19 1.43
Story 21 DWal7 X 6.20 4.32 1.44

Proceedings of 36th National Convention of Civil Engineers & National Conference
on ‗Innovation, Mechanization and Modern Techniques in Civil Engineering‘
organized by Jharkhand State Centre, 23-24 October, 2021
69
BASE SHEAR
Base Shear Shear Wall at Corner
Table 6 Base Shear – SW at Corner
Story Elevation (m) Location X-Dir (kN) Y-Dir (kN)
Story 22 80.4 Top 0 -73.7495
Story 21 76.8 Top 0 -198.0541
Story 20 73.2 Top 0 -1160.05
Story19 69.6 Top 0 -2065.9634
Story18 66 Top 0 -2880.5853
Story 17 62.4 Top 0 -3608.7631
Story 16 58.8 Top 0 -4255.344
Story15 55.2 Top 0 -4825.1754
Story14 51.6 Top 0 -5323.1046
Story13 48 Top 0 -5753.979
Story12 44.4 Top 0 -6127.1593
Story11 40.8 Top 0 -6447.353
Story10 37.2 Top 0 -6760.4463
Story9 33.6 Top 0 -7011.2198
Story8 30 Top 0 -7211.135
Story7 26.4 Top 0 -7365.9492
Story6 22.8 Top 0 -7481.4202
Story5 19.2 Top 0 -7563.3054
Story4 15.6 Top 0 -7617.3625
Story3 12 Top 0 -7649.6699
Story2 8 Top 0 -7664.3636
Story1 4 Top 0 -7668.0832
Base 0 Top 0 0

Proceedings of 36th National Convention of Civil Engineers & National Conference
on ‗Innovation, Mechanization and Modern Techniques in Civil Engineering‘
organized by Jharkhand State Centre, 23-24 October, 2021
70
Base Shear – Shear Wall at Middle
Table 7 Base Shear – SW at Middle
Story Elevation in m Location X-Dir in kN Y-Dir in kN
Story 22 80.4 Top 0 -87.9956
Story 21 76.8 Top 0 -236.3119
Story 20 73.2 Top 0 -1384.1347
Story19 69.6 Top 0 -2465.0418
Story18 66 Top 0 -3437.0228
Story 17 62.4 Top 0 -4305.8613
Story 16 58.8 Top 0 -5077.3411
Story15 55.2 Top 0 -5757.2458
Story14 51.6 Top 0 -6351.3591
Story13 48 Top 0 -6865.4648
Story12 44.4 Top 0 -7310.7316
Story11 40.8 Top 0 -7692.7766
Story10 37.2 Top 0 -8066.3496
Story9 33.6 Top 0 -8365.5645
Story8 30 Top 0 -8604.0969
Story7 26.4 Top 0 -8788.8164
Story6 22.8 Top 0 -8926.5927
Story5 19.2 Top 0 -9024.2955
Story4 15.6 Top 0 -9088.7947
Story3 12 Top 0 -9127.3428
Story2 8 Top 0 -9144.8749
Story1 4 Top 0 -9149.313
Base 0 Top 0 0

Proceedings of 36th National Convention of Civil Engineers & National Conference
on ‗Innovation, Mechanization and Modern Techniques in Civil Engineering‘
organized by Jharkhand State Centre, 23-24 October, 2021
71
STIFFNESS
Stiffness - Shear Wall at Corner
Table 8 Stiffness – SW at Corner
Story Elevation(m) Location X-Dir (kN/m) Y-Dir (kN/m)
Story 22 80.4 Top 348599.079 378904.112
Story 21 76.8 Top 211154.106 199941.913
Story 20 73.2 Top 1299962.911 1019952.044
Story19 69.6 Top 2077892.439 1687705.503
Story18 66 Top 2655961.236 2179231.885
Story 17 62.4 Top 3040244.001 2542765.143
Story 16 58.8 Top 3300164.703 2811076.308
Story15 55.2 Top 3487833.546 3008082.504
Story14 51.6 Top 3640393.241 3167352.656
Story13 48 Top 3743754.258 3268584.151
Story12 44.4 Top 4058471.844 3622927.883
Story11 40.8 Top 4225806.588 3829277.767
Story10 37.2 Top 4789227.731 4180043.156
Story9 33.6 Top 5002193.734 4235245.703
Story8 30 Top 5482032.252 4573527.307
Story7 26.4 Top 6095893.643 5053619.81
Story6 22.8 Top 6861187.714 5658190.637
Story5 19.2 Top 7844607.41 6434320.328
Story4 15.6 Top 9143628.784 7401824.539
Story3 12 Top 10268606.956 8034740.71
Story2 8 Top 14355639.442 10685615.088
Story1 4 Top 24038418.377 17147139.582
Base 0 Top 0 0

Proceedings of 36th National Convention of Civil Engineers & National Conference
on ‗Innovation, Mechanization and Modern Techniques in Civil Engineering‘
organized by Jharkhand State Centre, 23-24 October, 2021
72
Stiffness – Shear Wall at Middle
Table 9 Stiffness – SW at middle
Story Elevation (m) Location X-Dir (kN/m) Y-Dir (kN/m)
Story 22 80.4 Top 239411.135 0
Story 21 76.8 Top 155185.937 0
Story 20 73.2 Top 957771.759 0
Story19 69.6 Top 1582206.61 0
Story18 66 Top 2132727.737 0
Story 17 62.4 Top 2586286.791 0
Story 16 58.8 Top 2962656.707 0
Story15 55.2 Top 3283558.936 0
Story14 51.6 Top 3572751.283 0
Story13 48 Top 3771337.919 0
Story12 44.4 Top 4220963.131 0
Story11 40.8 Top 4418524.666 0
Story10 37.2 Top 4962607.502 0
Story9 33.6 Top 5068113.531 0
Story8 30 Top 5401129.958 0
Story7 26.4 Top 5798697.423 0
Story6 22.8 Top 6301644.697 0
Story5 19.2 Top 6982174.684 0
Story4 15.6 Top 8003116.452 0
Story3 12 Top 8580768.039 0
Story2 8 Top 11659016.714 0
Story1 4 Top 21727640.381 0
Base 0 Top 0 0

Proceedings of 36th National Convention of Civil Engineers & National Conference
on ‗Innovation, Mechanization and Modern Techniques in Civil Engineering‘
organized by Jharkhand State Centre, 23-24 October, 2021
73
COMPARATIVE GRAPH
COMPARATIVE RESULT
Table 10
Lateral Displacement
(mm)
Max Drift
(mm)
Base Shear
(kN)
Stiffness
(kN/M)
Shear wall at corner in all side 67.588 5.309 7668.08 24038418
Shear wall at middle in all side 80.102 6.204 9149.31 21727640
SCOPE
This paper will give an idea about location of shear wall, which area where we can provide to get the optimum result of
the tall building, the optimum position of shear wall may vary which is expected to be the area for extended research.
CONCLUSION
In the Present Study
a. Lateral Displacement: it was found that the Lateral Displacement was lesser in shear wall located at corner portion as
per analysis result was 67.588 mm, whereas shear wall located at middle portion was 80.102 mm – as per code
maximum allowable lateral displacement lime as per IS 1893 part 4 -2005 is 0.003h = 0.003x 80400 = 241.2 mm.
Hence it is within limit.
b. Maximum Story Drift: it was found that the maximum story Drift was lesser in shear wall located at corner portion as
per analysis result was 5.309 mm, whereas shear wall located at middle portion was 6.204 mm – as per code
maximum allowable story drift as per IS 1893 part 1 -2016 clause 7.11.1 is 0.004 times of story height = 0.004 3600
= 14.4 mm. Hence it is within limit.
c. Base Shear: It was found that Base shear in Shear wall located at corner was lesser than located at corner.
Base shear : Shear wall at corner = 7688 kN
Base shear :Shear wall at middle = 9149 kN

Proceedings of 36th National Convention of Civil Engineers & National Conference
on ‗Innovation, Mechanization and Modern Techniques in Civil Engineering‘
organized by Jharkhand State Centre, 23-24 October, 2021
74
d. Stiffness: It was found that Stiffness is more in shear wall located at corner.
Shear wall at corner = 24.04 x 10⁶ kN/M
Shear wall at middle =21.72 x 10⁶ kN/M
My conclusion {firstcase}Shear wall located at Corner is giving Good Result in term of Lateral displacement, Drift, Base
Shear and Stiffness for this type of structural model.
REFERENCES
1. IS 1893 (Part 1): Criteria for earthquake resistant design of structures, part 1, general provisions and buildings.
2. IS 456 – 2000 : Plain and Reinforced Concrete – Code of Practice – Bureau of Indian Standards, New Delhi.
3. IS 875 (Part 1) – 1987. Code of practice for Design Loads (other than earthquake) for buildings and structures, dead
loads Bureau of Indian Standards, New Delhi.
4. IS 875 (Part 3) – 2015, Design loads (other than earthquake) for buildings and structures – Code Practice.
5. IS 1893 (Part 4) 2015 Indian standards Criteria for Earthquake Resistant design of structures.
6. SP 16

Proceedings of 36th National Convention of Civil Engineers & National Conference
on ‗Innovation, Mechanization and Modern Techniques in Civil Engineering‘
organized by Jharkhand State Centre, 23-24 October, 2021
75
DOI: https://10.36375/prepare_u.iei.a105 ISBN 978-81-952159-1-1
Promoting the Reuse of C&D Wastes with Better Properties via
Construction Made from Recycled Concrete Aggregates
Pradyut Anand and Swagata Chakraborty
Department of Civil & Environmental Engineering, Birla Institute of Technology Mesra, Jharkhand
Abstract: The demand of infrastructure has increased strikingly due to increasing populace and improved standard of
living. Construction sector has witnessed record development due to change in its policies and India being a developing
country is seeing ascent in the construction activities. The change is an unavoidable part for rapid urbanization and
demolition and reconstruction are the basic necessities for redevelopment. Construction and Demolition (C&D)
squanders become a crucial ecological difficulty because C&D squanders are non-biodegradable. In this paper an
analytical study is engulfed which incorporates Recycled Concrete Aggregate (RCA) obtained from C&D squanders as a
halfway replacement of fine aggregate in Self-Compacting Concrete (SCC) utilizing Two Stage Mixing Approach Method
(TSMA) to acquire a concrete with durability properties better than Normal Mixing Approach (NMA).
Keywords: Construction and Demolition, Recycled Concrete Aggregate, Self-Compacting Concrete, Two Stage Mixing
Approach Method, Normal Mixing Approach
INTRODUCTION
Natural resources are rapidly dwindling. One such resource is aggregate, which is rapidly depleting due to massive
construction extraction. This industry uses a lot of natural resources every year. The overuse of natural resources is
causing faster depletion of their sources, causing concern in the construction industry[5]. Extensive mining of gravel and
sand threatens rivers, streams, and other natural resources. Reduce the amount of virgin aggregate mining to protect the
natural ecosystem and resources.
Due to a sharp rise in construction activity around the world, a massive amount of Construction and Demolition
(C&D)[6] waste was produced. A long series of environmental and social problems came into play due to C&D waste
that was handled inadequately. A major way these C&D wastes are disposed of is through dumping[7–9]. Recycled
Concrete Aggregate (RCA) can be made from recycled C&D waste, which helps to cut down on waste generation in that
category. Reused aggregates are used to make recycled concrete aggregate (RCA). Even this makes a difference. Because
of this, there is an increased likelihood of an environment-friendly concrete being developed. Work is currently being
done on RCA worldwide, as the end product, concrete aggregate, has nearly identical properties to Virgin Concrete
Aggregates (VCA)[10]. Recycled concrete appears to have structural value. Of the experimental results that have been
evaluated, about half of them have proven to achieve the desired two strengths of RCA by using authentic mixing
approaches alongside the inclusion of admixtures showing that SCC can also be produced using RCA.
CONSTRUCTION AND DEMOLITION (C&D) WASTES
United States (US), Environmental Protection Agency (EPA) defined C&D waste. As per EPA, waste materials
comprising of the debris generated during the construction, renovation, and demolition of buildings, roads, and bridges is
called as C&D waste[11].
Building components such as concrete and mortar are commonly recovered from C&D waste. As we move towards a
more sustainable development model, the generation and handling of C&D waste is unavoidable. Handling C&D waste
should prioritise the 3R philosophy of Reduce, Reuse, and Recycle[12]. After World War II, Germany adopted the
recycling concept. Concrete from demolished buildings was reused for construction. But many countries are unaware of
the 3Rs, potential. So, they still find land filling to be the easiest option. Creating C&D waste is harmful to the
environment, but it is unavoidable due to rapid urbanization. Redevelopment necessitates demolition and
reconstruction.[8,9]

Proceedings of 36th National Convention of Civil Engineers & National Conference
on ‗Innovation, Mechanization and Modern Techniques in Civil Engineering‘
organized by Jharkhand State Centre, 23-24 October, 2021
76
Concrete makes up 30-40% of the world's construction waste. Generation C&D waste is a concern for developing and
underdeveloped countries[12].
NOTABLE ADVANTAGES OF RCA
1) Concrete wastes are not dumped in landfills, which helps to reduce the amount of landfill space used.
2) It will reduce the need for gravel mining if recycled material is used in place of coarse aggregate and fine aggregate
in the construction industry.
3) The recycling of cement can save approximately 1 ton of water and approximately 900 kg of CO2 [13].
4) If recycled concrete is used as the base material for roadways instead of virgin concrete, the amount of pollution is
reduced.
Obtaining the RCA from C&D Wastes
The C&D wastes are mechanically crushed to make aggregates. Those small C&D waste particles are again crushed into
smaller pieces using a jaw crusher. After crushing, RCA is filtered by sieve analysis.
Figure 1 Process of Obtaining RCA: (a) C&D Wastes, (b) Jaw Crusher, (c) Sieving[13]
RCA is typically mortared and permeable. Property of RCA depends on amount of adhering mortar on surface. RCA can
be used as aggregate in concrete after attaining the attributes of grain size, bulk density, specific gravity, water
absorption, crushing value, and impact value[14].
Improving the Attributes of RCA
The mortar on the surface of the RCA is porous, resulting in more water absorption capacity and lower density. Different
two stage mixing procedures are used to improve the mechanical and durability attributes of RCA concrete[15].
Self-compacting Recycled Aggregate Concrete (SCRCA) can be made without affecting the mechanical or durability
attributes of standard concrete. SCRCA can make RCA more sustainable. SCC made with RCA has no set mix design
procedure. The same mix design process used for SCC utilizing VCA, dubbed self-compacting virgin aggregate concrete
(SCVAC), can be used for SCRCA[16].
The traditional ITZ of RCA is improved by using different admixtures and modern mixing techniques the SCC mix
uses two mixing procedures, Normal Mixing Approach (NMA) and Two Stage Mixing Approach (TSMA), to achieve
distinct RCA ratios[1].
Mixing Approach
Normal Mixing Approach (NMA)
First, the fine and coarse aggregates (FA & CA) were combined for 30 seconds. Flame retardant additives (fly ash and
cement) were applied. they were blended for thirty seconds again Finally, a super plasticizer (SP) and water mixture was
added before mixing for the following 120 seconds[1, 17].

Proceedings of 36th National Convention of Civil Engineers & National Conference
on ‗Innovation, Mechanization and Modern Techniques in Civil Engineering‘
organized by Jharkhand State Centre, 23-24 October, 2021
77
Figure 2 Normal Mixing Approach (NMA)
Two Stage Mixing Approach (TSMA)
First, coarse and fine aggregates (CA & FA) were mixed for 60 seconds. Then 50/50 water and SP were added and stirred
for 60 sec. Then came fly ash and cement. 30 seconds of mixing followed. Finally, for the remaining 120 sec of mixing,
50% water and 50% SP were added.[1, 17]
Figure 3 Two Stage Mixing Approach (TSMA)
PREPARING THE SPECIMEN USING RCA
Materials Used and Its Properties
In SCC mixes, the cementitious materials used were 43-grade Portland cement, Silica Fume, and Class F Fly Ash.
Cement with a specific gravity of 3.15 was utilized, in accordance with IS 8112 (1989). Tables 1 to 3 [1] detail the
characteristics of cement, class F fly ash, and silica fume, respectively.
The fine aggregate was sand, and the coarse aggregate was crushed stone (4.75 mm to 20 mm). The fine aggregate
fineness modulus was 2.45 (IS 383 compliant) (1970). RCA from a 30-year-old building in Dhanbad, Jharkhand.
Concrete was crushed to 5-20 mm and then manually screened to make RCA.
Table 4 shows the physical and mechanical parameters of VCA, RCA and fine aggregates [1].
All concrete mixtures used potable water. To improve SCC flowability, Super Plasticizer (SP) was commonly mixed
with dry concrete. The study employed GLENIUM B233, a modified poly carboxylic ether admixture[1].
Table 1
Physical Properties of Cement
Characteristics IS: 8112-1989 Specifications Obtained Value Author Reference
Normal consistency (%) - 29
P. Rajhans et al., 2017[1]
Initial setting time (min) 30 (minimum) 75
Final setting time (min) 600 (maximum) 217
Fineness (%) 10 7
Specific gravity - 3.15
Soundness (mm) 10 (maximum) 2.55
Compressive strength (N/mm2) 3
days
7 days
28 days
23
33
43
25
35.59
45.48

Proceedings of 36th National Convention of Civil Engineers & National Conference
on ‗Innovation, Mechanization and Modern Techniques in Civil Engineering‘
organized by Jharkhand State Centre, 23-24 October, 2021
78
Table 2
Physical Properties of Fly Ash
Test Property Obtained Value Author Reference
Specific gravity 2.15
P. Rajhans et al., 2017[1] Fines passing 150 µ sieve (%) 99.3
Fines passing 90µ sieve (%) 96
Blaine‘s fineness (cm2/gm) 3894
Table 3
Physical Properties of Silica Fumes
Test Property Obtained Value Author Reference
Specific gravity 2.20
P. Rajhans et al., 2017[1] Specific surface area 20,000 m
2/kg
Particle size 0.1 mm
Bulk loose density 232–300 kg/m3
Table 4
Physical Properties of Aggregate
Test Property VCA RCA Fine Aggregates Author Reference
Specific gravity 2.66 2.60 2.68
P. Rajhans et al., 2017[1]
Water absorption (%) 0.5 4.78 0.82
Bulk density (kg/m3) 1450 1250 1500
Crushing value (%) 28 33 -
Impact value (%) 23 28 -
Mix Proportion and Casting of Specimens
The Nan Su approach was used to prepare the SCC mix design for M30 concrete. This study used one reference mix,
SCVAC, which includes 100% VCA. The other four mixes were labelled SCRAC20, SCRAC40, SCRAC60, and
SCRAC100, with RCA replacing natural aggregate at 20, 40, 60, and 100%. Tables 5 and 6 list the mix proportions and
standard test results of the mix.[18]
The specimens were casted using mixed proportioned concrete and examined for standard durability tests, as stated in
Table 7.
Table 5 Mix design for fck= 30MPa concrete by Nan Su method.
Coarse
Aggregates
%
RCA
Mix
Designation
Cement
(kg/m3)
FA
(kg/m3)
VA
(kg/m3)
RCA
(kg/m3)
Fly ash
(kg/m3)
Water
(kg/m3)
SP
(kg/m3)
Author
Reference
0 SCVAC 300 826 815 - 160 194 4.6
P. Rajhans et
al. 2017[1]
20 SCRAC-20 300 826 640 147 160 194 4.6
40 SCRAC-40 300 826 480 294 160 194 4.6
60 SCRAC-60 300 826 320 442 160 194 4.6
100 SCRAC-100 300 826 - 337 160 200 4.6

Proceedings of 36th National Convention of Civil Engineers & National Conference
on ‗Innovation, Mechanization and Modern Techniques in Civil Engineering‘
organized by Jharkhand State Centre, 23-24 October, 2021
79
Table 6 Fresh Properties of SCC having fck = 30MPa
Mixing
Methods
% of
Replacements
Mix
Designation
T50,
(sec)
Slump Flow
(mm)
J-ring
(mm)
V- funnel
Time (s)
Author
Reference
NMA 0 SCVAC 3 755 7.5 7.6
P. Rajhans et
al., 2017[1]
20 SCRAC-20 3 730 8.4 7.9
40 SCRAC-40 4 725 8.6 8.4
60 SCRAC-60 5 700 9.1 8.5
100 SCRAC-100 5 680 9.3 10.6
TSMA 0 SCVAC 3 760 7.5 7.3
20 SCRAC-20 4 740 8 7.5
40 SCRAC-40 4 729 8.4 8.2
60 SCRAC-60 5 709 8.8 8.4
100 SCRAC-100 5 685 9.2 9.6
Table 7 Properties of casted specimen with SCC for fck =30 MPa
Mixing
Methods
%
RCA
Mix
Designation
Compressive
Strength (N/mm2)
Flexural Strength
(N/mm2)
Splitting Tensile
Strength (N/mm2)
Author
Reference
Days
Curing
7 14 28 7 14 28 7 14 28
NMA 0 VASCC 23.5 25.9 36.4 3.25 4.23 4.6 2.55 2.78 3
P. Rajhans
et al.,
2017[1]
20 SCRAC-20 22.9 24.1 35.2 3 4 4.5 2.38 2.59 2.74
40 SCRAC-40 21 23.9 34.7 2.63 3.45 4.08 2.08 2.29 2.4
60 SCRAC-60 20 22.9 32.6 2 3.34 3.43 1.68 1.86 2.05
100 SCRAC-100 19.5 21 30.1 1.87 3 3 1.42 1.67 2
TSMA 0 VASCC 24.1 26 38.3 3.67 4.53 4.71 2.7 3 3.09
20 SCRAC-20 23 25 37.1 3.18 4.24 4.53 2.46 2.69 3.04
40 SCRAC-40 22 24.8 36 2.78 4 4.33 2.14 2.44 2.64
60 SCRAC-60 21.5 23.8 35.2 2.42 3.48 4 2 2.18 2.35
100 SCRAC-100 20 22.1 34 2 3.23 3.48 1.57 2.02 2.3
FINITE ELEMENT METHOD ANALYSIS ON THE CASTED SPECIMENS
ANSYS Workbench is a popular engineering simulation tool. It uses finite element analysis (FEM). ANSYS workbench
can tackle problems ranging from linear analysis to nonlinear simulations, among others. It works from geometry
preparation through optimization and all intermediate processes. Geometry, Modelling, Meshing, Load Application,
Analysis and Post-Processing can all be done on a single platform.[19]
In this study, maximum mid span deflection of RCA Beams casted is estimated analytically using ANSYS
WORKBENCH.
Table 8
ANSYS Parameters
Parameters Description
Beam Size (500*100*100) mm
Supports Simply Supported
Concentrated Center Loading Applied on each Beam Calculated using Flexure Formula ( F =PL3
bd2)
Meshing Size 10 mm
Static Modulus of Elasticity (EI) 31000 N/mm2

Proceedings of 36th National Convention of Civil Engineers & National Conference
on ‗Innovation, Mechanization and Modern Techniques in Civil Engineering‘
organized by Jharkhand State Centre, 23-24 October, 2021
80
Table 9 Loading and mid span deflection comparison of specimens
Mixing
Methods
%
RCA
Mix
Designation
Center Point Load
(N)
Actual Mid Span
Deflection (mm)
Theoretical Mid Span
Deflection (mm)
Days
Curing
7 14 28 7 14 28 7 14 28
NMA 0 VASCC 8125 10575 11500 0.043 0.055 0.06 0.042 0.054 0.058
20 SCRAC-20 7500 1000 11250 0.04 0.053 0.059 0.039 0.052 0.057
40 SCRAC-40 6575 8625 10200 0.036 0.046 0.054 0.034 0.045 0.053
60 SCRAC-60 5000 8350 8575 0.027 0.045 0.046 0.026 0.044 0.044
100 SCRAC-100 4675 7500 7500 0.026 0.041 0.041 0.025 0.04 0.039
TSMA 0 VASCC 9175 11325 11775 0.049 0.059 0.059 0.048 0.057 0.057
20 SCRAC-20 7950 10600 11325 0.043 0.055 0.059 0.041 0.054 0.057
40 SCRAC-40 6950 10000 10825 0.037 0.053 0.057 0.036 0.051 0.055
60 SCRAC-60 6050 8700 10000 0.033 0.047 0.054 0.032 0.045 0.052
100 SCRAC-100 5000 8075 8700 0.027 0.044 0.047 0.026 0.042 0.045
CONCLUSION
The RCA made from TSMA outperforms the NMA. After 28 days, TSMA had 12.96% higher compressive,16% split
tensile, and 15.96% flexural strength than NMA with 100% RCA. Beams cast using TSMA have stronger flexural
strength than NMA beams, and consequently higher load carrying capacity. That is, TSMA deflection exceeds NMA.
Beams cast using TSMA have stronger flexural strength than NMA beams, and consequently higher load carrying
capacity.
According to the plot of load vs deflection, NMA concrete with 100% RCA has lower maximum deflection than 0%
RCA concrete. TSMA's load carrying capacity exceeds NMA's. Increasing the percentage of RCA causes the maximum
deflection to decrease. Increasing the percentage of RCA will decrease the maximum shear stress. Deflection is around
3.38% greater than what is theoretically possible.
REFERENCES
1. P. Rajhans, S.K. Panda, and S. Nayak, Sustainable self compacting concrete from C&D waste by improving the
microstructures of concrete ITZ, Constr. Build. Mater., vol. 163, February 2018, pp. 557–570, doi:
10.1016/j.conbuildmat.2017.12.132.
2. P. Rajhans, S.K. Panda and S. Nayak, Properties of self compacted recycled aggregate concrete (SCRAC) with
different two stage mixing approaches, p. 8.
3. V. Revilla-Cuesta et al., Self-compacting concrete manufactured with recycled concrete aggregate: an overview, J.
Clean. Prod., vol. 262, 2020, doi: 10.1016/j.jclepro.2020.121362.
4. V.S. Babu, A.K. Mullick, K.K. Jain and P.K. Singh, Strength and durability characteristics of high-strength concrete
with recycled aggregate – influence of mixing techniques, J. Sustain. Cem.-Based Mater., vol. 3, no. 2, April 2014,
pp. 88–110, doi: 10.1080/21650373.2013.874302.
5. S. Shahidan, M.A.M. Azmi, K. Kupusamy, S.S.M. Zuki and N. Ali, Utilizing construction and demolition (C&D)
waste as recycled aggregates (RA) in concrete, Procedia Eng., vol. 174, 2017, pp. 1028–1035, doi:
10.1016/j.proeng.2017.01.255.
6. Q. Tang, Z. Ma, H. Wu and W. Wang, The utilization of eco-friendly recycled powder from concrete and brick
waste in new concrete: A critical review, Cem. Concr. Compos., vol. 114, November 2020, doi:
10.1016/j.cemconcomp.2020.103807.
7. D. Yang, M. Liu and Z. Ma, Properties of the foam concrete containing waste brick powder derived from
construction and demolition waste, J. Build. Eng., vol. 32, November 2020, doi: 10.1016/j.jobe.2020.101509.
8. A. K. Kasthurba and K. R. Reddy, Managing building waste for sustainable urban development: challenges,
opportunities and future outlook.
9. A. R. Chini and S. Bruening, Deconstruction and materials reuse in the United States, Future Sustain. Constr., vol.
14, 2003.
10. D. Yang, M. Liu and Z. Ma, Properties of the foam concrete containing waste brick powder derived from
construction and demolition waste, J. Build. Eng., vol. 32, November 2020, doi: 10.1016/j.jobe.2020.101509.

Proceedings of 36th National Convention of Civil Engineers & National Conference
on ‗Innovation, Mechanization and Modern Techniques in Civil Engineering‘
organized by Jharkhand State Centre, 23-24 October, 2021
81
11. M.R. Esa, A. Halog and L. Rigamonti, Developing strategies for managing construction and demolition wastes in
Malaysia based on the concept of circular economy, J. Mater. Cycles Waste Manag., vol. 19, no. 3, July 2017, pp.
1144–1154, doi: 10.1007/s10163-016-0516-x.
12. S. Shrivastava and A. Chini, Construction materials and C&D waste in India, Lifecycle Des. Build. Syst. Mater.,
vol. 72, 2009.
13. S. Uniyal and V. Aggrawal, Two-stage mixing approach (TSMA) versus normal mixing approach (NMA) for
concrete in terms of compressive strength and carbonation depth, Int J Sci Res Dev, vol. 2, 2014, pp. 721–725.
14. T. Manikandan, M. Mohan and Y.M. Siddaharamaiah, Strength study on replacement of coarse aggregate by reused
aggregate on concrete, vol. 2, no. 4, p. 4.
15. S. Ismail and M. Ramli, Mechanical strength and drying shrinkage properties of concrete containing treated coarse
recycled concrete aggregates, Constr. Build. Mater., vol. 68, October 2014, pp. 726–739, doi:
10.1016/j.conbuildmat.2014.06.058.
16. B.A. Harish, N.V. Ramana and K. Gnaneswar, Experimental and analytical studies on recycled coarse aggregate
concrete, Mater. Today Proc., vol. 46, 2021, pp. 294–300.
17. A. Sičáková, K. Urbán and M. Kováč, Slump loss of concrete based on RCA and prepared by specific mixing
approach, Period. Polytech. Civ. Eng., vol. 62, no. 4, Art. no. 4, September 2018, doi: 10.3311/PPci.11733.
18. N. Su, K-C. Hsu and H-W. Chai, A simple mix design method for self-compacting concrete, Cem. Concr. Res.,
2001, p. 9.
19. A. Barbosa et al., Analysis of reinforced concrete structures using ansys nonlinear concrete model.

Proceedings of 36th National Convention of Civil Engineers & National Conference
on ‗Innovation, Mechanization and Modern Techniques in Civil Engineering‘
organized by Jharkhand State Centre, 23-24 October, 2021
82
DOI: https://10.36375/prepare_u.iei.a124 ISBN 978-81-952159-1-1
Risk Assessment of Earthquake on Historical Structures and
Monuments
P K Tiwari1, G Pandey
2 and V Kumar
3
1Assistant Superintending Engineer, Archaeological Survey of India, Sarnath Circle, Varanasi
2Prof & Dean, Infrastructure & Planning, Madan Mohan Malaviya University of Technology, Gorakhpur
3Assistant Professor, Civil Engineering Department, Central University of Haryana
Abstract: This paper discusses the risk assessment of earthquake on historical structures and monuments as per their
height and shape with reference to the earthquake that occurred on 25 April 2015 and on 12 May 2015. Heritage Site,
Dharahara tower, which was very high-rise in height, totally collapsed. Owing to such height the upper portions of 9-
storied Basantapur Durbar, the Dasa Avtar temple were demolished by the quake.
In an earlier earthquake in India near Aravali hill range in 1505, damaged Qutub Minar, Delhi built in 12th
century,
was fallen off its top two story, after like some quake due to sky/cloud bursting electric happening, but no such damage
to ground, first and second story structures was noticed. Generally many old forts in India, were safe during earthquakes
due to large in plan area and low in height , but further the high-rise old buildings suffered during earthquake at some
specific intensity of earthquake at several times in past .
It is important to point out the height and shape of historical structures and monuments for further safety measures and
precautions as for as possible for load bearing structures, in Zone V with less than 400 sqm (appox.) in plan area of
foundation with plinth may be risk affected during/after earthquake.
Keywords: Height and Shape, Earthquake, Monuments, Plinth Area, Load Bearing Structure, Seismic Zone
INTRODUCTION
The historical buildings are the landmark of the any culture and nation and conservation of such structure must be on
priority to protect the culture of the nation. A very less literature is available on the prediction of damage and losses in
historical building as compared to other residential building. The main aim of the paper is to study the seismic risks
associated with the earthquake on the historical structures and monuments situated in India and Nepal. Further, the study
delineates measures to be adopted proactively for mitigating the severe damaging affects of earthquake on cultural and
historical/heritage buildings.
Many of the structures which exist, their natural frequencies of vibration lie in the band of frequencies where the energy
due to earthquake ground motions is highest. In those cases, structure because of the frequencies lying in that band
amplifies the seismic ground vibrations and hence produces accelerations within the structure. These accelerations get
increased from the bottom of the structure to the top. For achieving the goal of seismic isolation, the structure has to be
designed such that the fundamental frequency of the structure is shifted away from the most powerful and dominant
frequencies of the earthquake ground motion. Base isolation is one of the techniques to shifts the dominant frequency of
earthquake from the natural frequency of the structure. Also the fundamental frequency of structure which has fixed-base
superstructure can be fixed as per the foundation area and height of structures as per the geographical location of
structures and the respective seismic zone location, as depicted in Figures 1 and 2.
Seismic Hazard
Prevention from seismic hazard depend on the response of the structure to the past earthquakes. In case of an affected
structure from an earthquake, the soil stratification and the foundation and, topographic amplification effects may be the
reasons for same [2]. For important monuments, the seismic action may be modified by taking into account local soil
dynamic conditions, geomorphology, an estimation of the duration of the earthquake and especially the effects of
neighbouring active faults in respective seismic zones.

Proceedings of 36th National Convention of Civil Engineers & National Conference
on ‗Innovation, Mechanization and Modern Techniques in Civil Engineering‘
organized by Jharkhand State Centre, 23-24 October, 2021
83
Figure 1 Affected area of Nepal earthquake (2015)
Figure 2 Seismic Map of India (ss per Vulnerability Atlas of India by BMTPC)

Proceedings of 36th National Convention of Civil Engineers & National Conference
on ‗Innovation, Mechanization and Modern Techniques in Civil Engineering‘
organized by Jharkhand State Centre, 23-24 October, 2021
84
Figure 3 As per Vulnerability Atlas of India by BMTPC
Figure 4 Epicenter of April 25, 2015 M 7.8 event (Source: USGS)
Nepal lying in the mountainous region geographically becomes one of the most seismically active and hazardous regions
in the world. It resides on the boundary of the Indian and Eurasian plates. As numerous active faults have been identified
in the Himalayan region, Nepal therefore is the region with high seismic activity. Numerous significant earthquakes

Proceedings of 36th National Convention of Civil Engineers & National Conference
on ‗Innovation, Mechanization and Modern Techniques in Civil Engineering‘
organized by Jharkhand State Centre, 23-24 October, 2021
85
(MW > 7.5) have occurred in the past 500 years, including the MW 7.8 Kangara earthquake in 1905 and the MW 8.1
Nepal-Bihar earthquake in 1934 [1].
In Nepal, most of the buildings are adobe structures and can be divided under four categories first are those which are
made up of brick or stone masonry with mud mortar second; brick or stone masonry with cement mortar, third; wooden
structures, and last are reinforced concrete buildings. With reference to, either the plan type or geometry, Nepalese
temples can be classified as either square or rectangular. The main structural element used mostly in roofs of Nepalese
temple is timber element. The components made from timber elements are wall plates, cross-beams and rafters [1].
Salwood is the main variety of timber used in all Nepalese temples. Hence on the basis of roofs, the temples can be
distinguished as one roof temple, two roof temple, three roof temple and five roof temple.
Figure 5(a) & 5(b) Maju Dega Temple, before quake and after quake (source: ICIMOD)
Figure 6(a) & 6(b) Fasidega Temple before earthquake and after earthquake

Proceedings of 36th National Convention of Civil Engineers & National Conference
on ‗Innovation, Mechanization and Modern Techniques in Civil Engineering‘
organized by Jharkhand State Centre, 23-24 October, 2021
86
Figure 7(a) & (b) Dharahara Tower before and after quake
Studies on Effect of Seismic Zone, Height and Shape of the Historical Structure
By the above discussion, the following table prepared for the risk assessment parameters for Heritage Structures,
considering the details given in Figures 3 to 7.
Table 1 Assessment parameters for collapsed / damaged Heritage Structures (all dimensions are in SI system and based
on approximate, from different sources such as Archaeological Survey of India, field visit of authors and internet)
Country Structure Name &
E.Q Year
Structure
Description
Floor Height Shape in
Plan
Material Collapsed
Height
Ground
Area
Seismic
Zone
Nepal Maju Dega Temple,
Kathamandu
2015
Platform 9 14 m Rectangular Brick Safe 500 sqm V
Super
Structure
3 9 m Square Brick &
wooden
9 m - ―
Fasidega Temple,
Bhaktapur Darbar
2015
Platform 6 11 m Rectangular Stone &
Brick
Safe 600 sqm V
Super
Structure
2 7 m Square Brick 7 mtr - ―
Dharahara Tower,
Kathamandu
2015
Platform 9 8 m Square Stone Safe 380 sqm V
Super
Structure
9 62 m Circular Brick 52 mtr - ―
India Qutb Minar, Delhi
1505
Foundation 1 0.5 m Circular Stone safe 161 sqm IV
Super
Structure
6 72 m Circular Stone 2 upper
story
- ―
Mahaparinirvan
Stupa , Kushinagar
(U.P.)
2015
Platform 1 2.75 m Rectangular Brick Safe 1050
sqm
IV
Super
Structure
2 22.7 m Circular Brick minor hair
cracks
223 sqm ―

Proceedings of 36th National Convention of Civil Engineers & National Conference
on ‗Innovation, Mechanization and Modern Techniques in Civil Engineering‘
organized by Jharkhand State Centre, 23-24 October, 2021
87
In Table 1, we comparatively assessed the height and shape parameters with respective seismic zones, for
collapsed/damaged Heritage Structures.
In Maju Dega Temple, Kathamandu, situated in Zone V, the 14 mtr high stepped Foundation / Platform Rectangular
in plan area 500 sqm, safe during and after earthquake, but 9 mtr high Square shaped in plan Super Structure
complete collapsed during and after earthquake.
In Fasidega Temple, Bhaktapur Darbar, situated in Zone V, the 11 mtr high stepped Foundation/Platform
Rectangular in plan area 600 sqm, safe during and after earthquake, but 7 mtr high Square shaped in plan Super
Structure complete collapsed during and after earthquake.
In Dharahara Tower, Kathamandu, situated in Zone V, the 8 mtr high stepped Foundation/Platform square in plan
area 380 sqm, safe during and after earthquake, but 62 mtr high circular shaped in plan Super Structure tower,
above plinth/platform collapsed 84 % in height, during and after earthquake.
On other side in India near Gorakhpur, the Mahaparinirvan Stupa, Kushinagar, India, situated in Zone IV, the 2.27
mtr high Foundation/Platform, Rectangular in plan area 1050 sqm, safe during and after earthquake, and also 22.7
mtr high circular shaped in plan Super Structure safe/only few minor hair cracks on wall surface, during and after
earthquake.
By above observation/studies, we assessed here that high rise super structure in Zone V with less than 400 sqm
(appox.) in plan area of foundation may be risk affected during/after earthquake.
CONCLUSIONS
The height and shape of historical structures and monuments with foundation covering area and seismic zone of that
particular location of historical building may be useful, for further safety measures and precautions as for as possible for
load bearing structures and the effect of earthquake is more prominent in the case of Zone V on the historical structures.
REFERENCES
1. Durgesh C. Rai, Vaibhav Singhal, S Lalit Sagar and Bhushan Raj S, Effects on built environment & a perspective
on growing seismic risk in Bihar-Nepal region, Earthquake, National Information Center on Earthquake
Engineering, 12 May 2015, www.nicee.org.
2. A. Furukawa, J. Kiyono and M. Tatsumi, K. Toki, H. Taniguchi and H. Parajuli, Earthquake risk evaluation of
historic masonry buildings in Kathmandu Valley, Nepal, 15 WCEE LISBOA 2012
3. Catalogue of Earthquakes in India and Neighborhood from Historical period upto 1979, ISET 1983

Proceedings of 36th National Convention of Civil Engineers & National Conference
on ‗Innovation, Mechanization and Modern Techniques in Civil Engineering‘
organized by Jharkhand State Centre, 23-24 October, 2021
88
DOI: https://10.36375/prepare_u.iei.a114 ISBN 978-81-952159-1-1
Seismic Performance of Precast Steel Reinforced Concrete
Building
Mohammad Arastu1
and Khalid Moin2
1Research Scholar, Department of Civil Engineering, Jamia Millia Islamia, New Delhi
2Professor, Department of Civil Engineering, Jamia Millia Islamia, New Delhi
[email protected], [email protected]
Abstract: Precast Steel Reinforced Concrete (PSRC) structural frame systems for moment-resisting, comprised of
PrefabricatedSteel (S) girders and Precast Reinforced Cement Concrete (RCC) columns. This structural system has the
advantage of inherent stiffness and damping during a seismic event. PSRC moment-resisting frame system is also known
for its construction efficiency, lightweight and low-cost. Earlierinvestigations have shown PSRC systems useful in
designing and constructing the buildings while maintainingample strength and high ductility during seismic incidents.
Despite much previousresearch on it, the use of the PSRCstructural system in Indiais still limited. Previous studies have
accepted a vital need to reviewthorough structural systems usingexperiment and analytical studies to validate the
understanding collectedtill date and act as evidence of concept for the PSRC moment-resisting frame system. This paper
aims to facilitate morerecognition and use of the PSRC structural system as a feasible choice to traditional RCC lateral
resisting systems.
Two structures are studied to evaluate low-rise PSRC and RCC structures' performance during maximum considered
earthquake events. These consist of typical steel beams and Precast RC columns frame buildings. Four-storey PSRC
buildings are designed according to Indian Codes of practice. Design columns under provisions of Indian reinforced
concrete structures code, and beams are designed according to Indian steel construction code. The comparative studies
for the two buildings are presented.
Keyword: Seismic Analysis, Pushover, PSRC System, RCC System, Moment Resisting Frame
INTRODUCTION
The modernization of steel and concrete structures provides attractive alternatives to reinforced concrete systems. PSRC
structural systems for moment-resisting, comprises of Prefabricated Steel (S) girders and Precast Reinforced Cement
Concrete (RCC) columns, have the advantage of the inherent stiffness and damping during a seismic event. PSR
Cmoment-resisting frame system is also known for its construction efficiency, light weight and low-cost (Liang et al.
2004).
PSRC frame systems have been shown to retain numerous advantages from economic and construction view points
(Griffis 1986) compared to either RCC or steel frame systems. RCC columns are nearly ten times more efficient than
steel columns in axial strength and axial stiffness (Sheikh et al. 1987). On the other hand, the deck slabs supported on
steel girders are significantly lighter than the RCC beam-slab system, leading to significant reductions in the total
building‘s load, costs of the foundation, and earthquake forces. In the previous years, the PSRC structural systems for
moment-resisting have mostly been used for buildings located in low seismicity areas in developed countries. In most
recent years, the researcher attempts to develop seismic design guidelines for PSRC systems located in high seismic risk
regions (Liang et al. 2004).
Many researchers have developed testing models of PSRC frames based on a typical theme building devised for the US-
Japan program (Mehanny 2000, Bugeja 1999, Noguchi 1998). These studies apply the suggested seismic design
specifications for PSRC systems and then assess the seismic performance of resulting designs using nonlinear analyses
and advanced performance assessment techniques. Traditional steel frames were also investigated in these studies to
benchmark conventional structures‘ performance compared to the Precast SRC frames. Using a standard floor plan, the
building heights varied and the implementation of perimeter versus space frame systems. These design studies have
shown that the steel beam sizes tend to be similar for the PSRC and steel system and that the main disagreements lie in
the RCC column and steel girders connection. Given the additional stiffness provided by the RCC columns, the SRC

Proceedings of 36th National Convention of Civil Engineers & National Conference
on ‗Innovation, Mechanization and Modern Techniques in Civil Engineering‘
organized by Jharkhand State Centre, 23-24 October, 2021
89
frames tended to be controlled more by the bare minimum strength requirements, whereas lateral drift limitations
restricted the steel frames. In general, these studies have shown that the inelastic dynamic response of the PSRC frames is
similar to comparably designed steel momentframes.
Cordova et al. 2005 design and test a full-scale 3-storey SRC moment frame. Using the pseudo-dynamic loading
technique, this specimen is subjected to a sequence of earthquake motions ranging in hazards from frequent to sporadic
events. Using the results of the test specimens and recommendation, trial designs of three case study buildings (3, 6, and
20-stories) are generated, analytically modeled, and subjected to a collection of earthquake ground motions at a range of
hazard levels. They investigate differences between the response of beam-column subassembly and full-scale system
testing and evaluate how this affects the interpretations from these tests.
One of the efficient tools of addressing the behavior of building under earthquake loading is pushover analysis. Due to its
lack of sophistication, nonlinear static procedure or pushover analysis are used by the many structural engineers. When
pushover analysis is used carefully, it is widely accepted that it provides valuable data that cannot be achieved by linear
static or dynamic analysis procedure (Mehmetinel et al. 2006). This paper intends to study the seismic performance of the
PSRC system for buildings compared to ordinary RCC buildings.
PUSHOVERANALYSIS
The structures deform inelastically during the maximum considered earthquake (MCE). Hence structural performance
must be checked duringthe post-elastic behavior of the structure. Static nonlinear analysis (also called Pushover
Analysis) should be used to evaluate seismic performance because the elastic analysis can not determine the structure‘s
post-elastic behavior during such events. Moreover, to estimate the seismically induced needsthat exhibit inelastic
behavior, the structures‘ maximum inelastic displacement requirement should be determined effectively.
In the static nonlinear analysis method, the monotonically increasing horizontal loads are applied to the structure with
invariant distribution over the height until the top storey displacement reaches the target displacement value. In this
analysis method, the superposition principle is used to get an approximate force-displacement curve of the structure by
adding the response of a successive series of elastic analyses. The nonlinear static gravity loads are applied initially, and
all horizontal force-resisting elements are formed as 2-D or 3-D structures with bilinear load-deformation graphs.
A predefined horizontal load distributed along the building height is applied. The horizontalloads are increased until
some elements yield. The structural model is revised to account for the reduced stiffness of yielded elements due to
formation of hinges, and horizontal loads are again increased until additional elements yield. The procedure is continued
until aobserved displacement at the top of the building gets a required deformation level, or the structure turn out to be
unstable. The top roof horizontal displacement is mapped with base shear to get the capacity graph (Figure 1).
Figure 1 Expected capacity curve of the frame element
Nonlinear static analysis efficient for capturing strength and stiffness degradation in structural elements due to large
deformations caused by horizontal loads. A substantial computational challenge is to precisely arrest the negative post-
peak response. Such response leads to the need for robust iterative numerical solution approaches to minimize errors.
SAP2000 software can overcome this issue negative post-peak by investigate the sensitivity of the solution [FEMA
P695].

Proceedings of 36th National Convention of Civil Engineers & National Conference
on ‗Innovation, Mechanization and Modern Techniques in Civil Engineering‘
organized by Jharkhand State Centre, 23-24 October, 2021
90
SEISMIC PERFORMANCE OF BUILDINGS
The state of damage measures buildings‘ seismic performance under a specific seismic hazard level. The form of damage
is measured by the roof‘s displacement and the structural elements‘ displacement. Primarily, gravity nonlinear analysis is
carried out using the force control method. It is followed by a lateral load with displacement control using SAP2000.
To perform displacement-based nonlinear static analysis, target displacement needs to be defined. This gives an
understanding into the highest base shear that the structure can withstand. The building performance depends on the
structure elements performance levels and the nonstructural elements. A performance level depicts a limiting damage
requirement, which may be deemed acceptable for a given building with specific ground motion. The performance of the
structure is determined by hinges formation in structural elements. Different types of plastic hinges like
uncoupled/coupled moment, torsion, axial force, and shear hinges are available in standard analysis program. After
yielding of the structural elements, plastic hinges will form at predefined locations, indicating the risk level (Figure 2
and Figure 3). The performance point is calculated from the guideline defined in FEMA-356 and ATC-40. The
horizontalload is applied at the deformed state of the general loading from point A (Figure 2). No hinges will be formed
before point B, where the structure will show linear behavior, and after that, one or more hinges will start to form. The
software will showhinges with the following remarkableindication:
Figure 2 Generalized component force-deformation
relations for depicting
Figure 3 FEMA 273/356 performance levels (taken from
Fajfar et al. 2004)
Immediate Occupancy I.O.
Iindicates the state of damage in which limited nonstructural damage has occurred. The structural elements of the
building maintain their original strength and stiffness. The probability of life-threatening injury is very low because of
nonstructural damages, and minor repairs of these nonstructural elements can be repaired before reaccompancy [FEMA-
356].
Life Safety Level L.S.
Indicates state of damage in which substantial damage to the structural elements has occurred, but some scope against
either partial or total structural collapse persists. Many structural elements are severely damaged, but this has not resulted
in large falling debris hazards. Injuries may arise during the at this stage; however, the overall probability of life-
threatening injury is low because of low structural damage is expected and it is feasible to repair the structure [FEMA-
356].
Collapse Prevention CP
Indicates the state of damage in which the building is on the limit of partial or total collapse. Significant damage to the
structure has occurred, possibly including significant degradation in the stiffness and strength of structural elements,
permanent lateral deformation of the structure, and degradation in axial stiffness and strength. Substantial threat of injury
may happen due to collapsing of structural debris. The structure may not be practical to repair and is not safe for
reoccupancy [FEMA-356].

Proceedings of 36th National Convention of Civil Engineers & National Conference
on ‗Innovation, Mechanization and Modern Techniques in Civil Engineering‘
organized by Jharkhand State Centre, 23-24 October, 2021
91
MODELING AND ACCEPTANCE CRITERIA [FEMA-356]
Description of Studied Structures
Two structures are considered to represent low-and medium-rise PSRC and RCC structures to study. These consist of a
typical steel beam and Precast R.C. columns frame building. Four-storey PSRC buildings are designed according to
Indian Codes of Practice. Design columns under provisions of Indian reinforced concrete structures code, and beams are
designed according to Indian steel constructioncode.
The longitudinal and transverse bars‘ yield strength for RCC beams and columns used as 500 N/mm2. The compressive
strength of concrete used was 25 MPa at 28 days. The structural steel had a yield strength of 250 N/mm2
used in the
analysis.
The column center to center dimensions was 5000 mm in both directions. The model is assumed to be pinned at the base.
The column and beam details have been done as per the Indian Code of Practice. The 300 mm wide and 400 mm deep
beam with 3 bars of 16 mm diameter at top and bottom were used at all levels and in both directions, plus an extra 2T16
at the support. The 400 mm 400 mm columns with 8 bars of 20 mm diameter and 8 mm diameter wire were used as
stirrup at 100 mm c/c near the beam-column junction and 150 mm c/c near the mid-height of the column. The storey
height was kept as 3000 mm c/c of the beam on all floors. For PSRC structural system, steel girders of ISM300 are
considered.
Building Performance
The lateral load pattern for zone IV corresponding to the Indian Earthquake Loading Code (IS1893-2016) is implemented
and applied in SAP 2000 as auto lateral load pattern. The lateral load pattern is computed considering full dead load and
25% of live load for calculation of lateral loads. The direction of checking the building‘s behavior is the same as the
lateral load direction. PM2M3 type hinges are assigned to columns and M3 type hinges are assigned to beams.
RCC and PSRC buildings were analyzed using the SAP2000 program. Base columns are assumed hinged at the
foundation level. The beams and columns are modeled as nonlinear frame elements with lumped plasticity; hinges are
defined according to the section properties at both ends at the columns and beams.
The pushover curve for the PSRC building is shown in Figure 4 and for the RCC buildingin Figure 5. The pushover
curves with each associated response spectrum curve for different levels of shaking levels are shown in Figure 6 for
PSRC structures and in Figure 7 for RCC structure. The hinge patterns are shown in Figure 8 for the RCCstructure and
in Figure 9 for the PSRCstructure.
Figure 4 Displacement vs. base shear for PSRC structure Figure 5 Displacement vs. base shear for RCC structure

Proceedings of 36th National Convention of Civil Engineers & National Conference
on ‗Innovation, Mechanization and Modern Techniques in Civil Engineering‘
organized by Jharkhand State Centre, 23-24 October, 2021
92
Figure 6 Pushover and demand spectrum for PSRC
building
Figure 7 Pushover and demand spectrum for RCC building
8(a) Plastic hinges in the RCC building start at beams of
the lower floor 8(b) Plastic hinges in RCC building propagates to the at
beams upper storey
8(c) Plastic hinges in RCC building propagates to the intermediate & exterior column
Figure 8 Hinge pattern for R.C. building

Proceedings of 36th National Convention of Civil Engineers & National Conference
on ‗Innovation, Mechanization and Modern Techniques in Civil Engineering‘
organized by Jharkhand State Centre, 23-24 October, 2021
93
9(a) Plastic hinges in PSRC building starts at intermediate
columns of the lower storey
9(b) Plastic hinges in the PSRC building propagate to the
lower storey‘s outer columns
9(c) Plastic hinges in PSRC building at failure
Figure 9 Hinge pattern for PSRC building
In the RCC building, plastic hinges formation starts with beam ends then propagates to the beams of the second level.
After that point, intermediate base columns of lower levels then propagate to the intermediate columns of the second
level; the plastic hinges are performed at the lower level‘s outer columns and carry on with yielding of interior columns
in the upper levels until collapse occurs.
In PSRC building, plastic hinges formation starts with intermediate columns of the lower level, then propagates to
interior columns in the upper levels and the intermediate columns of the lower level reaching collapse before the outer
columns, then a failure mechanism occursas the soft storey of the lowerlevel.
CONCLUSIONS AND SUMMARY
A viable nonlinear finite element program (SAP2000) was used to examine the static nonlinear behavior (using pushover
analysis) of (PSRC) structures for horizontal seismic loads. Two buildings are modeled to represent low-risestructures in
seismic zone IV. A comparison with ordinary RCC buildings is presented. The results show that even both structures
have almost the base shear capacity, the PSRC structures behave linearly till the maximum shear base capacity is reached
and the soft storey failure mechanism occurs.

Proceedings of 36th National Convention of Civil Engineers & National Conference
on ‗Innovation, Mechanization and Modern Techniques in Civil Engineering‘
organized by Jharkhand State Centre, 23-24 October, 2021
94
REFERENCES
1. Liang Xuemei, J. Gustavo and K. Wight James, Seismic behavior of RCS beam-column-slab subassemblies
designed following aconnection deformation-based capacity design approach, 13th World Conference on
Earthquake Engineering,Vancouver, B.C., Canada, August 1-6,2004.
2. L.G. Griffis, Some Design Considerations for Composite-Frame Structures, AISC Engineering Journal, Second
Quarter, pp.59-64, 1986.
3. T.M. Sheikh, J.A. Yura and J.O. Jirsa, Moment connections between steel beams and concrete columns, PMFSEL
Report No. 87-4, University of Texas at Austin, Texas, 1987.
4. Mehmet Inel and Hayri Baytan Qzmen, Effect of plastic hinge properties in nonlinear analysis of reinforcedconcrete
building, Engineering Structures Journal, 2006, pp. 1494-1502
5. S.S. Mehanny, P.P. Cordova and G.G. Deierlein, Seismic design of composite moment frame buildings – case
studies and code implications, Composite Construction IV, ASCE, 2000.
6. M. Bugeja, J.M. Bracci and W.P. Moore, Seismic behavior of composite moment resisting frame systems,
Technical Report CBDC-99-01, Dept. of Civil Engrg., Texas A & MUniversity, 1999.
7. H. Noguchi and K. Kim, Shear strength of beam-to-column connections in RCS system, Proceedings of Structural
Engineers World Congress, Paper No. T177-3, Elsevier Science, Ltd, 1998.
8. N. Baba and Y.Nishimura, Seismic behavior of R.C. column to s beam moment frames, Proc.12WCEE, 2000.
9. H. Noguchi and K.Uchida, Finite element method analysis of hybrid structural frames with reinforced concrete
columns and steel beams, Journal of Structural Engineering, vol 130, no 2, 2004, pp 328-335.
10. P.P. Cordova and G.G. Deierlein, Validation of the seismic performance of composite RCS frames: full -
scaletesting, analytical modelling, and seismic design, Report No. 155 the John A. Blume Earthquake Engineering
Center, Stanford University, 2005.
11. M. Mouzzoun, O. Moustachi, A. Taleb and S. Jalal, Seismic performance assessment of reinforced concrete
buildings using pushover analysis, IOSR Journal of Mechanical and Civil Engineering (IOSR-JMCE), ISSN: 2278-
1684, vol. 5, Issue 1, Jan - Feb 2013, pp 44-49
12. FEMA273, Federal emergency management agency, Recommended Provisions for Seismic Regulations for New
Buildings and Other Structures.
13. ATC 40, Applied technology council, seismic evaluation and retrofit of concrete buildings, vol. 1 Report, ,
Redwood City, California,1996.
14. Vision 2000 Committee, Performance based seismic engineering of buildings, Structural Engineers Association of
California (SEAOC), California.
15. P. Fajfar and H. Krawinkler, Performance-based seismic design concepts and implementation, Proceedings of the
International Workshop Bled, Slovenia, College of Engineering, University of California, Berkeley, June 28 - July
1, 2004.

Proceedings of 36th National Convention of Civil Engineers & National Conference
on ‗Innovation, Mechanization and Modern Techniques in Civil Engineering‘
organized by Jharkhand State Centre, 23-24 October, 2021
95
DOI: https://10.36375/prepare_u.iei.a128 ISBN 978-81-952159-1-1
Statistical Modelling for Rainfall Time Series Analysis: Khurdha
District of Odisha, India
Ankita Bohidar1, Anil Kumar Kar
2 and Pradeep Kumar Das
3
1Research Scholar, Civil Engineering Department, VSSUT, Burla, Sambalpur, Odisha
2Associate Professor, Civil Engineering Department, VSSUT, Burla, Sambalpur, Odisha
3Registrar, National Institute of Technology Rourkela, Rourkela, Odisha
Abstract: The rainfall at Odisha state is monsoon driven. The capital city of Odisha state is Bhubaneswar which lies at
Khurdha district. In this study, a statistical modeling is done for the monsoon rainfall of this district including frequency
analysis of the monsoon rainfalls using L-moment techniques. The randomness of the data is determined from Anderson
Correllogram test and then the existence of probable trend is determined using non-parametric test like Mann Kendall.
All the datasets are found to be random but the rainfall during August shows a rising trend at all 1%, 5% and 10%
significance level. Also in month July it rises 5% and 10% significance level. The forecasting of the monthly rainfall is
made through an Auto Regressive Moving Average (ARMA) model. The ARMA (1,1) combination hold good for months
of June, July and September, August and October ARMA (1,2) ARMA (3,3) respectively show better result. Akaike
Information Criteria (AIC) has been used for evaluating the performance of ARMA models. The study shows the
statistical application on climate data and the results are advisory and indispensable for making useful and reliable
decisions in hydrological forecasting and planning.
Keywords: Trend, Mann Kendall, Anderson Correllogram, L-moment, Khurdha
INTRODUCTION
Statistical analyses of hydrological time series play a vital role in water resources studies. The statistical results reflect
the inherent characteristics of a data set. Non parametric tests in detection of trend are a regular practice. Particularly in a
climate change scenario detecting trend in a hydro-meteorological element like rainfall has a different meaning. As
rainfall is the prime factor for all round growth of a locality estimating the variation and frequency of rainfall is important
in context of agriculture, design and construction of storage structures as well as for flood hazards. In this study rainfall
data of a coastal district named Puri of India is first analyzed for its randomness using Anderson Correllogram test then
for existence of trend by using non-parametric Mann Kendall test. The rainfall data is modeled through ARMA model in
order to detect the best possible combination of future forecasting.
Gangyan, et al. (2002) examined the temporal and spatial sediment load characteristics and used statistical tests such
Turning point test, Kendall Rank Correlation test, Anderson correlogram test for identifying the existence of randomness
and trend. The periodicity in the sediment load data was analysed by Harmonic Analysis and stochastic component was
modeled by auto regressive model. Gao, et al. (2002) have applied stochastic hydrology methods to analyze the
characteristics of annual inflow evolution of Miyun reservoir. Jain and Kumar (2012) have detected trends in rainfall,
rainy days and temperature is being analysed through Sen‘s non-parametric estimator of slope and statistical significance
by Mann Kendall test. Sen Test and Mann Kendall test are being applied in many studies as in Vousaghi, et al. (2013),
Kundu, et al. (2014). Chhabra et al. (2014) have applied non-parametric tests to identify trend utilizing 1 1 gridded
rainfall data over North India. In upper Mahanadi, Jaiswal, et al. (2014) have made trend assessment for extreme rainfall
indices with reference to climate change. They have taken six raingauges for analysis and found no significant trend in
any raingauge station while rising trend is seen in very heavy precipitation days in most of the stations. Sethy et al.
(2015) performed a trend analysis for precipitation and inflows time series for Salia river basin of Odisha, India which is
draining to Chilka lake using the Mann–Kendall test. Dawson et al. (2015) have studied about trends in water quality and
quantity for 11 major reservoirs of the Brazos and Colorado river basins in the southern Great Plains. The study of
Manee, et al. (2015) applied the Mann-Kendall (MK) statistical trend test to analyze increasing, decreasing or trendless
characteristics of precipitation, temperature, inflow to dam reservoirs, release from dam reservoirs, and storage volume in
dam reservoir in Thailand from historical operation recorded data. Jaiswal, et al. (2015) have made an assessment of
change detection and trend on monthly, seasonal and annual historical series of different climatic variables of Raipur, the

Proceedings of 36th National Convention of Civil Engineers & National Conference
on ‗Innovation, Mechanization and Modern Techniques in Civil Engineering‘
organized by Jharkhand State Centre, 23-24 October, 2021
96
capital of Chhatisgarh. One of the most useful descriptive tools in time series analysis is to generate the correlogram plot
which is simple a plot of the serial correlations rk versus the lag k for k = 0, 1, . . . , M, where M is usually much less than
the sample size n. If we have a random series of observations that are independent of one another, then the population
serial correlations will all be zero. However, in this case, we would not expect the sample serial correlations to be exactly
zero since they are all defined in terms y etc. However, if we do have a random series, the serial correlations should be
close to zero in value on average. One can show that for a random series,
E[rk] ≈ −1 (n − 1) and Var (rk) ≈ 1/ n
In addition, if the sample size if fairly large (say n ≥ 40), then rk is approximately normally distributed (Kendall et al
1983). The approximate normality of the rk can aid in determining if a sample serial correlation is significantly non-zero,
for instance by examining if rk falls within the confidence limits −1/(n − 1) ± 1.96/ √ n.
To identify trend in climatic variables with reference to climate change, the Mann-Kendall test has been employed by a
number of researches with temperature, precipitation and stream flow data series (Burn, 1994, Douglas et. al 2002, Yue
and Hashimo 2003, Burn et al. 2004, Lindstorm and Bergstrom, 2004). It is a common practice to use a non parametric
test to detect a trend in a time series. This test, being a function of the ranks of the observations rather than their actual
values, is not affected by the actual distribution of the data and is less sensitive to outliers. On the other hand, parametric
trend tests, although more powerful, require the data to be normally distributed and are more sensitive to outliers. The
Mann–Kendall test is therefore more suitable for detecting trends in hydrological time series, which are usually skewed
and may be contaminated with outliers. This test has been extensively used with environmental time series (Hipel and
McLeod, 2005).
The Mann-Kendall trend test is based on the correlation between the ranks of a time series and their time order. For the
statistics S is calculated as Equation (1). This statistic represents the number of positive differences minus the number of
negative differences for all the differences considered as
S = sgn(xj − xi)nj=i+1
n−1i=1 (1)
where n is the number of total data points, xi and xj are the data values in time series i and j (j > 𝑖), respectively, and
sgn(xj − xi) is the sign function as:
sgn xj − xi =
+1, if xj − xi > 0
0, if xj − xi = 0
−1, if xj − xi < 0
(2)
The variance of Mann- Kendall test is calculated by Equation (3) as
Var(S) =n n−1 2n+5 − ti ti−1 (2ti +5)m
i=1
18 (3)
where n is the number of total data points, m is the number of tied groups. The tied group means a simple data having a
same value. The ti indicates the number of ties of extent i. In case of the sample size n > 10, the standard normal test
statistic Zs is estimated by equation (4) as
Zs =
S−1
Var (S), if S > 0
0 if S = 0S+1
Var (S), if S < 0
(4) (4)
The positive values of Zs show increasing trends while negative values represent falling trends. As 5 % significance level
is taken standard for this study, the null hypothesis of no trend is rejected if Zs > 1.96.
ARMA model developed by Box and Jenkins (1970) provides one of the basic tools in time series modeling. The
modeling and forecasting procedures in identifying patterns in time series data involve knowledge about the
mathematical model of the process.

Proceedings of 36th National Convention of Civil Engineers & National Conference
on ‗Innovation, Mechanization and Modern Techniques in Civil Engineering‘
organized by Jharkhand State Centre, 23-24 October, 2021
97
First, for a series tX , we can model that the level of its current observations depends on the level of its lagged
observations The AR (1) (autoregressive of order one) can be written as:
Where
2tt
WN(0, )
Similarly, AR(p) (autoregressive of order p) can be written as:
t t 1 t p t1 pt 2.......
2xx x x
The MA (1) (moving average of order one) and MA (q) (moving average of order q) can be written as
t t t 1x
and
t t t 1 t q1 q.......x
If we combine these two models, we get a general ARMA (p, q) model,
t t 1 t 2 t p t t 1 t q1 q1 2 p...... ......x x x x
The performance of calibration and validation is highly dependent on the structure of the model and the parsimony. The
most prominent, and still widely used, criterion is the Akaike Information Criterion (AIC), proposed by Akaike (1974).
Akaike Information Criteria (AIC) is a widely used measure of a statistical model. It basically quantifies 1) the goodness
of fit, and 2) the simplicity/parsimony, of the model into a single statistic.
AIC mln(RMSE) 2n
Where, m is the number of input-output patterns used for training, n is the number of parameters to be identified and
RMSE is the root-mean-square error between the network output and target. The performance measures generally
improve as more parameters are added to the model, but the AIC statistics penalize the model for having more
parameters and, therefore, tend to result in more parsimonious models.
RESULTS AND DISCUSSION
In this study the monthly rainfall data for monsoon season of Khurda district (Figure 1) is taken into consideration for a
period of 120 years.
The data is initially tested for randomness using Anderson Correlogram test for 1%, 5% and 10% significance level. The
testing criteria Z value is obtained for these significance levels (Table 1). It is found that in most of the case the data is
random other than in the month of August at 10 % significance level.
To know the statistical values of the rainfall series, all the statistical calculations like mean, standard deviation,
coefficient of variation, Coefficient of Skewness, Kurtosis are calculated (Table 2). The month August is showing the
highest average rainfall as 250.15 mm whereas in June it is 166.47 mm. it is also revealed that in every month the highest
rainfall is above 500 mm except June.
The existence of trend is also tested using non-parametric Kendall Rank Test using the significance levels of 1%, 5% and
10% (Table 3). The no trend has been detected in the month of June, September and October whereas rising trend in July
and August Rising trend of July and August is showing increase in frequency of depressions/ cyclones, because Khurdha
is being a coastal district often remains exposed to cyclonic rainfalls The district also remains on the cyclone tract that
enters to the state of Odisha. However the falling trend of rainfall is not seen during any of the monsoon season.
t t 1 tx x

Proceedings of 36th National Convention of Civil Engineers & National Conference
on ‗Innovation, Mechanization and Modern Techniques in Civil Engineering‘
organized by Jharkhand State Centre, 23-24 October, 2021
98
Figure 1 Study area, Khurdha district
Table 1 Randomness check using Anderson Correlogram test
Month R1 Z Significance Level
1% 5% 10%
June -0.037
-0.310 Random Random Random
July -0.07 -0.674 Random Random Random
August -0.161 -1.676 Random Random Not Random
September -0.085 -0.844 Random Random Random
October 0.09 1.078 Random Random Random
Table 2 Statistics of monthly rainfall series
Jun Jul Aug Sep Oct
Avg 166.47 243.50 250.15 218.62 198.20
Max 398.49 614.80 559.20 513.10 663.90
Min 33.17 55.42 96.30 19.86 16.87
Cs 0.85 1.00 0.93 0.52 0.99
Ck 0.62 1.98 3.39 0.65 1.19
Table 3 Trend check using Mann Kendall test
Month P Z Significance Level
1% 5% 10%
June 3514 -0.25404 No Trend No Trend No Trend
July 4524 3.10295 Rising Trend Rising Trend Rising Trend
August 4175 2.74457 Rising Trend Rising Trend Rising Trend
September 3629 0.26765 No Trend No Trend No Trend
October 3765 0.88461 No Trend No Trend No Trend

Proceedings of 36th National Convention of Civil Engineers & National Conference
on ‗Innovation, Mechanization and Modern Techniques in Civil Engineering‘
organized by Jharkhand State Centre, 23-24 October, 2021
99
The ARMA model is tried for modeling of the time series in monthly basis with different Auto Regressive and Moving
Average combinations. In both the cases the trial is done from 0, 1, 2, 3 for p, q values at different combinations. The
outputs are recorded according to AIC values fixed as the performance criteria (Tables 4.1 to 4.12).
Taking the AIC value as performance criteria monthwise best combinations are retrieved from Tables 4.1 to 4.5. The
ARMA coefficients are also derived for the said best combinations. For the future forecasting the same coefficients may
be utilized for finding the respective monthly values.
Table 4.1 AIC values for the month of June
q in MA(q) p in AR(p)
0 1 2 3
0 1457 1441 1427
1 1526 1395 1397 1397
2 1504 1397 1399 1401
3 1489 1397 1401 1403
Table 4.2 AIC values for the month of July
q in MA(q) p in AR(p)
0 1 2 3
0 1503 1482 1467
1 1601 1437 1439 1439
2 1568 1438 1441 1443
3 1545 1439 1443 1442
Table 4.3 AIC values for the month of August
q in MA(q) p in AR(p)
0 1 2 3
0 637.2 622.4 602.7
1 696.4 603.4 602.7 597.5
2 681.6 589.2 606.6 606.7
3 668.9 591.2 593.2 588.9
Table 4.4 AIC values for the month of September
q in MA(q) p in AR(p)
0 1 2 3
0 1478 1458 1449
1 1575 1412 1414 1415
2 1541 1414 1414 1416
3 1517 1415 1418 1417
Table 4.5 AIC values for the month of October
q in MA(q) p in AR(p)
0 1 2 3
0 1555 1540 1524
1 1599 1499 1501 1502
2 1585 1501 1501 1504
3 1574 1502 1503 1495

Proceedings of 36th National Convention of Civil Engineers & National Conference
on ‗Innovation, Mechanization and Modern Techniques in Civil Engineering‘
organized by Jharkhand State Centre, 23-24 October, 2021
100
Table 5 AR, MA coefficients for best combinations in different months
Month Best combinations (p,q) ARMA coefficients AIC values
p q
June 1,1 -1 -0.99956 1395
July 1,1 -0.99974 -0.93586 1437
August 1,2 -0.99977 -1.0832 589.2
0 0.16457
September 1,1 -1 -0.99972 1412
October 3,3 0.74082 0.96641 1495
-0.9839 -0.96369
-0.75692 -0.99712
CONCLUSION
The statistical modeling is applied on the rainfall data of Khurdha district. The statistical parameters are obtained over the
study periods. The rainfall values are found to be random. The non-parametric trends are obtained which shows the
possibility of rising trend during the month of July and August whereas a no trend scenario is visible during rest of the
monsoon period. In none of the cases falling trend is not seen. This indicates the occurrence of number of cyclonic and
depression led rainfall is increasing as the district lies in the coastal part and close to the route of cyclones. Further the
ARMA model is applied in order to find the coefficients for the forecasting of the rainfall series. The monthwise best p, q
combinations are determined and basing on the AIC values the coefficients are obtained for the ARMA model.
REFERENCES
1. H. Akaike, A new look at the statistical model identification. IEEE Transactions on Automatic Control, vol 19, no
6, 1974, pp.716–723.
2. G.E.P. Box and G.M. Jenkins, Time Series Analysis, Forecasting and Control, Holden Day, CA, Sanfrancisco,
1970.
3. D.H. Burn, Hydrologic effects of climatic change in west-central Canada, Journal of Hydrology, vol.160, no. 1,
1994, pp.53–70.
4. D.H. Burn, J.M. Cunderlik and A. Pietroniro, Hydrological trends and variability in the Liard River basin,
Hydrological Sciences Journal, vol. 49, no. 1, 2004, pp.53–67.
5. T. Caloiero, R. Coscarelli and E. Ferrari, Analysis of monthly trend in Calabria (Southern Italy) through the
application of statistical and graphical techniques, Proceedings, vol 2, 2018, p. 629, DOI:
10.3390/Proceedings2110629.
6. D. Dawson, M.M. VanLandegham, W.H. Asquith and R. Patino, Long term trends on reservoir water quality and
quantity in two major river basins of Southern great plains, Journal of Lake and Reservoir Management, vol. 31, no.
3, 2015, pp. 254-279.
7. E.M. Douglas, R.M. Vogel and C.N. Kroll, Impact of stream flow persistence on hydrologic design, Journal of
Hydrologic Engineering, vol.7, no. 3, 2002, pp.220–228.
8. Z. Gangyan, N.K. Goel and V.K. Bhatt, Stochastic modeling of the sediment load of the upper Yangtze river
(China), Hydrological Sciences Journal, vol. 47(S), 2002, pp. S-93-S-105.
9. K.K. Gupta, A.K. Kar, J. Jena and D.R. Jena, Variation in rainfall trend at upstream a threat towards filling
schedule of Hirakud Reservoir, India, International Journal of Water, vol 11, no. 4, 2017, pp.395-407.
10. K. Hipel and A. McLeod, Time Series Modelling of Water Resources and Environmental Systems, 2005
http://www.stats.uwo.ca/faculty/aim/1994Book.
11. R.K. Jaiswal, H.L. Tiwari, and A.K. Lohani, Trend assessment for extreme rainfall indices in the upper Mahanadi
with reference to climate change, International Journal of Scientific Engineering and Technology (IJSET), 18–20
December 2014, pp.93–99.
12. G. Krishnan, S.K. Chandniha and A.K. Lohani, Rainfall trend analysis of Punjab India using statistical non-
parametric test, Current World Environment, vol. 10, no. 3, 2015, pp.792–800.
13. D. Manee, Y. Tachikawa and K. Yorozu, Analysis of Hydrologic Variables Changes related to Large Scale
Reservoir Operation by Using Mann-Kendall Statistical Tests in Thailand, THA 2015 International Conference on
‗Climate Change and Water & Environmental Management in Monsoon Asia‘, 28-30 January 2015, Bangkok,
Thailand.
14. M.M. Portela, L.A. Espinosa and M. Zelenakova, Long term rainfall trends and their variability in mainland
Portugal in the last 106 years, Climate, vol. 8, no. 146, 2020, DOI: 10.3390/ Cli8120146.

Proceedings of 36th National Convention of Civil Engineers & National Conference
on ‗Innovation, Mechanization and Modern Techniques in Civil Engineering‘
organized by Jharkhand State Centre, 23-24 October, 2021
101
15. A.W. Salami, Assessment of the impact of climate change on water resources of Jebba hydropower reservoir using
trend and reduction pattern methods, Paper presented during the 10th
Anniversary Conference of Fulbright held at
Conference Centre, University of Ibadan, Ibadan, 12-15 September 2011.
16. R. Sethy, B.K. Pandey, R. Krishnan, D. Khare, and P.C. Nayak, Performance evaluation and hydrological trend
detection of a reservoir under climate change condition, Journal of Model Earth System Environment, 2015, vol 1,
no. 33, pp. 2-10.
17. S. Yue and M. Hashino, Long term trends of annual and monthly precipitation in Japan, Journal of American Water
Resources Association, vol. 39, no. 3, 2003, pp.587–596.
18. G.P. Zhang, A neural network ensemble method with jittered training data for time series forecasting, Information
Sciences, vol 177, 2007, pp. 5329–5346.
19. G. P. Zhang, Time series forecasting using a hybrid ARIMA and neural network model, Neurocomputing, vol 50,
2003, pp. 159–175.

Proceedings of 36th National Convention of Civil Engineers & National Conference
on ‗Innovation, Mechanization and Modern Techniques in Civil Engineering‘
organized by Jharkhand State Centre, 23-24 October, 2021
102
DOI: https://10.36375/prepare_u.iei.a122 ISBN 978-81-952159-1-1
Thermal/Fire Resistance Studies on Cermabond-569 and Ldam
Coated Concrete Structures at Elevated Temperature
Bishwajeet Chaubey1 and Sekhar Chandra Dutta
2
1Chief Construction Engineer (R&D), DRDO South, Hyderabad, Telangana State
2 Professor, Department of Civil Engineering, Indian Institute of Technology (ISM) Dhanbad, Jharkhand
Abstract: RCC structures under elevated temperatures/ fire conditions, results in the structural damage and sometimes
leads to structural collapse. It is very difficult to predict the behavior of a concrete at elevated temperatures because the
fire spread is random and the heating profile is unpredictable. Excessive heating of concrete over long duration will
degrade in mechanical properties and lead to structural failure. In the present study, thermal protection coatings have
been explored to reduce the conduction of heat/fire into the core of concrete for protection of the concrete linings and
reinforcing steel. Experiments are carried out using Cermabond-569 and Low Density Ablative Material (LDAM)
coatings on M30 and M40 concrete structures with 2 mm and 4 mm thickness as per the specification of Hydro carbon
fire curve. The temperature profile across the front and back surface are measured as a function of time. From Temp-
Time plots, the temperature difference (∆T) between uncoated and coated samples was observed as 200C for
Cermabond and it is 140C for LDAM coated samples. Increase in (∆T), was observed with respect to thickness of
coating. Cermabond-569 coating has good adhesion, low porosity and low thermal conductivity compared to LDAM
coating. It is concluded that for M30 and M40 RCC structures, Cermabond-569 coating is most efficient for high
thermal/fire resistance at elevated temperatures.
Keywords: RCC, Thermal Protection Coatings (TPC), and Low Density Ablative Material (LDAM)
INTRODUCTION
It is very difficult to predict the behavior of the concrete structures/ tunnels, often experiencing the failure due to fires
caused by explosion /accidents of vehicles[1]. Since this kind of accidents is occurring in a confined space, the fires in
this type of explosion are very random and they produce very high temperatures in short duration of time[2,3]. Due to
combustion of fossil fuels and also release huge amounts of smoke and toxic gases which will make the occupants
difficult to evacuate in short time[4]. Many researchers are tried to find the physical, chemical and mechanical changes
occurring in concrete when it is exposed fire but the complete understanding of concrete behavior on exposure to fire is
yet to fulfill the requirements of the designer, resulting lack of confidence in the design of fire-resistant concrete
structures especially for safety of tunnels. The use of thermal protection coatings (TPC) in concrete is limited to off-shore
structures and also provides resistance to corrosion and chemical attack from the sea water too[5]. In the recent
researches the hollow glass microspheres is mixed with the cement to reduce the thermal conductivity of concrete.
Hollow glass microspheres when mixed with cement and water, the glass spheres absorb water and bulges creating a void
space inside the samples. The heat transfer is reduced by the void space in the concrete, but due to formation of voids the
strength of concrete is reduced. Matching the fire growth in the closed profile, different types of fire curves like RABT,
ISO-834, Hydrocarbon and RWS curves are introduced to predict the fire behavior in the tunnels. Normally ISO-834
curves are used for the drive ways and the residential structures which is having the maximum temperature about
1150C[6, 7]. The hydrocarbon curves are also having the same maximum temperature as ISO-834, but the initial
temperature rise is more for the hydrocarbon curves which indicates the fire scenario of tanker accidents, petrol blasts or
explosives blast. The fire occurred in tunnel are different and the growth of fire more rapid in the tunnel and releases the
toxic gases. RABT curves were introduced in Germany in 1994 especially for the tunnel fires which rise to peak
temperature of 1200C in 5 minutes and the peak temperature is applied nearly one hour and then gradually reduces to
120 minutes. The experimental results shown in this paper are conducted up to 1200C by following the time-
temperature profile of Hydrocarbon fire curve.
In the present study, the TPCs used to reduce the fire exposure of concrete are cermabond-569 and LDAM. Cermabond-
569 is an industry made product that can sustain to a maximum temperature of 1650C. LDAM is specially developed by

Proceedings of 36th National Convention of Civil Engineers & National Conference
on ‗Innovation, Mechanization and Modern Techniques in Civil Engineering‘
organized by Jharkhand State Centre, 23-24 October, 2021
103
DRDO, Hyderabad for metallic substrates with hollow glass microspheres as a main constituent that can sustain to
1200C.
SAMPLE PREPARATION AND EXPERIMENTAL TECHNIQUES
Preparation of Samples
All the specimens are casted with normal weight of concrete mix with the target compressive strength of 30 and 40 MPa.
Six samples of M30 and M40 grades are prepared with standard size of 150 150 150 mm3. The properties of
aggregates and mixing ratios are mentioned in Table 1. During casting of concrete blocks, k-type thermocouples were
inserted into the block at different depths across the thickness for measuring the temperature as a function of time as
shown in Figure 1.
Table 1 Properties of aggregates and mix proportion properties
Property M30 M40
Coarse aggregate (kg/m3) 1117 890
Fine aggregate (kg/m3) 797 769
Cement (kg/m3) 289 282
Water (lit/m3) 160 153
w/c ratio 0.46 0.42
Aggregate type Crushed angular aggregates Crushed angular aggregate
28-day compressive strength (MPa) 41 62
Figure 1 Typical Sample for temperature measurement
Types of Coatings
i) Cermabond-569 Coating
The coating of Cermabond-569 is procured from M/s. AREMCO, is a ceramic based coating used for missiles and ships
for protection from lasers beams and gas erosions[11]. It is a water soluble ceramic coating, and after application of
coating, it is cured in ambient for 1 to 4 hours. The properties are mentioned in Table 2.
Table 2 Properties of Cermabond-569
Property Value
Maximum temperature limit 1650 C
Specific gravity 2.15 to 2.3 g/cc
Bonding C-C, C-M
Self-life 6 months

Proceedings of 36th National Convention of Civil Engineers & National Conference
on ‗Innovation, Mechanization and Modern Techniques in Civil Engineering‘
organized by Jharkhand State Centre, 23-24 October, 2021
104
ii) Low Density Ablative Material (LDAM)
LDAM is a special coating, developed by DRDO, Hyderabad with primary constituents are vinyl silicon resign, hollow
glass micro spheres and Hydro carbon-based solvent. The properties are mentioned in Table 3. The coated samples are
shown in Figure 2.
Table 3 Properties of LDAM
Property Value
Density 320 to 340 (kg/m3)
Thermal conductivity 0.171 (W/m-K)
Specific heat 1310 (J/kg-K)
Curing 3 to 4 hours at room temperature.
Figure 2 Coated samples of Cermabond-569 and LDAM
Experimental Techniques
Thermal Properties of Samples – DSC and TGA
Specific heat properties is measured for samples by measuring heat flow using DSC and weight loss as a function of
time is measured using TGA. This can be calculated by the given Equation (1):
Q = m* Cp* (dT/dt) * ∆x (1)
where, Q is the output power (w/cm2); M, the density of concrete block (kg/m
3); Cp, the specific heat (J/g/C); (dT/dt),
the rate of change of temperature with time (/sec) and ∆x is the depth of block (m). Specific heat and heat flow are
measured using differential scanning calorimetry (DSC), thermal conductivity is measured by thermal constants analyzer
(TCA) and weight loss of the concrete is measured using thermos-gravimetric analysis (TGA).
Thermal Properties of Samples – IR Heaters Set up
The error in temperature measurement for thermocouple is measured using M/s. AMTEK calibration instruments and
PID controller as shown in Table 4.
Table 4 Measurement in errors of thermocouple
Calibration (C) Deviation (C)
0 1.5
200 1.5
400 1.6
600 2.4
800 3.2
1000 4
1200 9
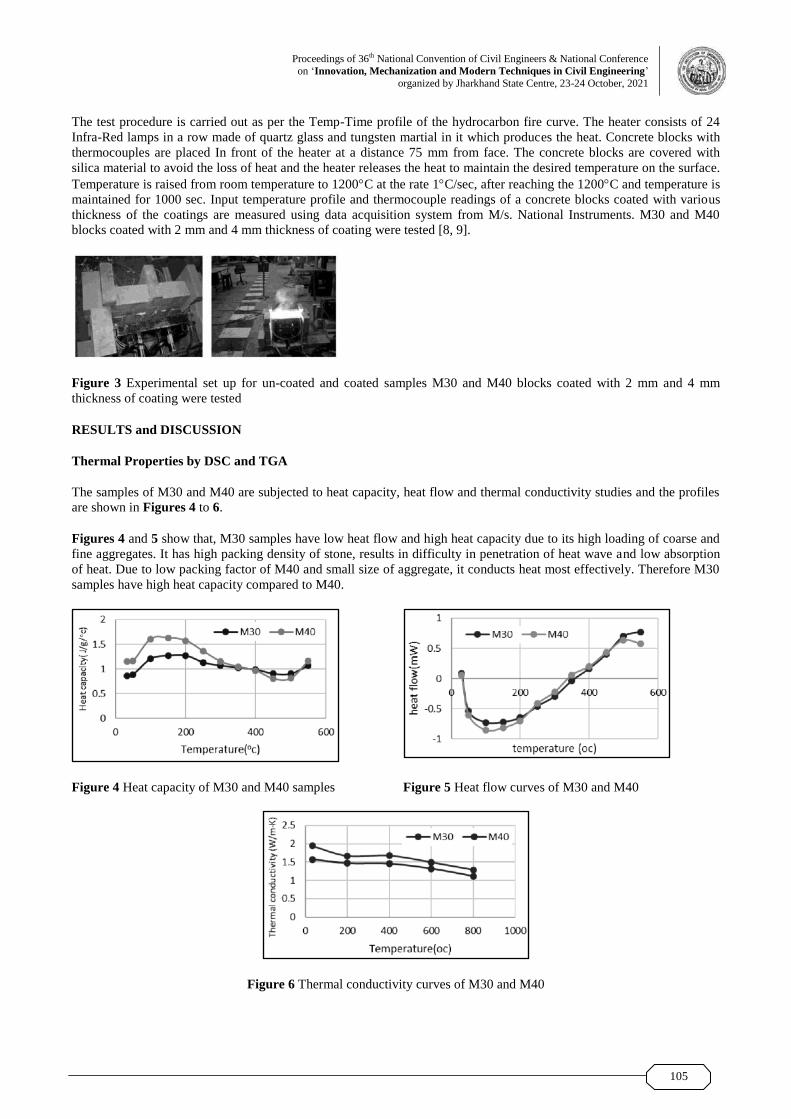
Proceedings of 36th National Convention of Civil Engineers & National Conference
on ‗Innovation, Mechanization and Modern Techniques in Civil Engineering‘
organized by Jharkhand State Centre, 23-24 October, 2021
105
The test procedure is carried out as per the Temp-Time profile of the hydrocarbon fire curve. The heater consists of 24
Infra-Red lamps in a row made of quartz glass and tungsten martial in it which produces the heat. Concrete blocks with
thermocouples are placed In front of the heater at a distance 75 mm from face. The concrete blocks are covered with
silica material to avoid the loss of heat and the heater releases the heat to maintain the desired temperature on the surface.
Temperature is raised from room temperature to 1200C at the rate 1C/sec, after reaching the 1200C and temperature is
maintained for 1000 sec. Input temperature profile and thermocouple readings of a concrete blocks coated with various
thickness of the coatings are measured using data acquisition system from M/s. National Instruments. M30 and M40
blocks coated with 2 mm and 4 mm thickness of coating were tested [8, 9].
Figure 3 Experimental set up for un-coated and coated samples M30 and M40 blocks coated with 2 mm and 4 mm
thickness of coating were tested
RESULTS and DISCUSSION
Thermal Properties by DSC and TGA
The samples of M30 and M40 are subjected to heat capacity, heat flow and thermal conductivity studies and the profiles
are shown in Figures 4 to 6.
Figures 4 and 5 show that, M30 samples have low heat flow and high heat capacity due to its high loading of coarse and
fine aggregates. It has high packing density of stone, results in difficulty in penetration of heat wave and low absorption
of heat. Due to low packing factor of M40 and small size of aggregate, it conducts heat most effectively. Therefore M30
samples have high heat capacity compared to M40.
Figure 4 Heat capacity of M30 and M40 samples Figure 5 Heat flow curves of M30 and M40
Figure 6 Thermal conductivity curves of M30 and M40

Proceedings of 36th National Convention of Civil Engineers & National Conference
on ‗Innovation, Mechanization and Modern Techniques in Civil Engineering‘
organized by Jharkhand State Centre, 23-24 October, 2021
106
The weight loss trend in M30 and M40 samples are shown in Figure 7. The weight loss trend and degradation behavior
depends on cement to water ratio and independent on aggregate percentage. Hence the degradation curves are similar.
The cement is losing its weight around 15% at 750C. This is attributed to evolution of water vapours from the samples
while heating.
Figure 7 Percentage weight loss curves of M30 and M40
Thermal /Fire Testing of the Samples by IR Heaters
The temperature profile of the samples as a function of time is shown for Cermabond 569 coated samples in Figures 8 to
11 and Figures 12 and 15 indicate for LDAM coated samples. The curves indicate the temperature profile of the samples
at a depth of 2 mm from the front surface.
Figure 8 M30-Cermabond569- Front surface Figure 9 M30-Cermabond569- Back surface
Figure 10 M40-Cermabond569- Front surface Figure 11 M40-Cermabond569- Back surface

Proceedings of 36th National Convention of Civil Engineers & National Conference
on ‗Innovation, Mechanization and Modern Techniques in Civil Engineering‘
organized by Jharkhand State Centre, 23-24 October, 2021
107
Figure 12 M30-LDAM- Front surface Figure 13 M30-LDAM- Back surface
Figure 14 M40-LDAM- Front surface Figure 15 M40-LDAM- Back surface
The front surface and back surface temperatures are compared to M30 and M40 grades. The coated and uncoated samples
with Cermabond and LDAM are compared to 2 mm and 4mm thicknesses of coating as shown in Tables 5 and 6.
Table 5 Cermabond-569 coated samples
Sample M30 Sample at 1200C M40 Sample at 1200C
Front Face (C) Back Face (C) Front Face (C) Back Face (C)
Uncoated 1166 346 1150 256
Coated -2 mm- cermabond-569 967 316 856 234
Coated- 4 mm -cermabond-569 676 220 572 173
Table 6 LDAM coated samples
Sample M30 Sample at 1200C M40 Sample at 1200C
Front Face (C) Back Face (C) Front Face (C) Back Face (C)
Uncoated 1166 346 1150 256
Coated-2 mm-LDAM 1026 326 907 256
Coated-4 mm-LDAM 720 256 639 220
From the temperature profile of front and back surfaces of the samples the following observations are made. Cermabond-
569 is a ceramic coating which has low thermal conductivity due to silica mixture whereas LDAM is a combination of
vinyl silicon resin, hollow glass micro spheres and Hydro carbon-based solvent. Hence during coating of Cermabond-
569, the formation of pores is minimum and it has good adhesive strength where as in case LDAM after coating on the
substrate, the resin produces hollow glass micro spheres while curing of coating and produces considerable number of

Proceedings of 36th National Convention of Civil Engineers & National Conference
on ‗Innovation, Mechanization and Modern Techniques in Civil Engineering‘
organized by Jharkhand State Centre, 23-24 October, 2021
108
pores. Due to formation of microspheres the porosity increases in LDAM, results in poor adhesion between coating and
substrate. Therefore the poor adhesive strength and porosity are causing more damage to the surface while heating the
LDAM coated sample. Due to porosity, LDAM is acting as partial heat transfer medium for heat propagation and the
temperature difference (∆T) is reduced to 140C [10, 12].
Cermabond is a water soluble ceramic mixture and has good adhesion to M30 and M40 samples due to ability to form
chemical bonds (i.e. ceramic-ceramic bonds) is high. It produces low porosity compared to LDAM and hence it acts as
barrier to heat wave penetration with minimum heat transfer ability [10, 12]. As the surface temperature increases, the
heat wave cannot propagate easily across the thickness of sample and hence the temperature difference (∆T) is high i.e.,
200C.
CONCLUSIONS
A study on Cermabond-569 and LDAM coatings was carried out on M30 and M40 samples for thermal/fire resistant
properties. The temperature difference (∆T) between uncoated and coated samples was observed as 200C and 1400C,
respectively for Cermabond-569 and LDAM samples. An increase in (∆T), was observed with respect to increase in
thickness of coating. The coating of Cermabond-569 is recommended for M30 and M40 RCC structures due to good
adhesion, low porosity and heat barrier properties against heat/fire protection. The results of the study is implemented as
concrete liners in tunnel for increase its safety.
REFERENCES
1. Jang-Ho Jay Kim, Yun Mook Lim, Jong Pil Won and Hae Geun Park, Fire resistant behavior of newly developed
bottom-ash-based cementitious coating applied concrete tunnel lining under RABT fire loading, Construction and
Building Materials, 4 May 2010, p. 11.
2. K. H. Tan and Y. Yao, Fire resistance of reinforced concrete columns subjected to 1-, 2-, and 3-face heating,
Journal of Structural Engineering, ASCE, p.9, 10.1061/(ASCE)0733-9445(2004)130:11(1820).
3. H.Ingason, Design fire curves for tunnels, Journal home page: www.elsevier.com/locate/firesafety, 27 August 2008,
p. 7.
4. A.A. Shilin, A.I. Zvezdov and V.R. Falikman, Fire protection coating of reinforced concrete lining in lefortovsky
tunnel, Concrete for Transportation Infrastructure, p. 6.
5. Yan Hao Ng, Anil Suri, Aravind Dasari and Kang Hai Tan, Thermal decomposition and fire response of non-
halogenated polymer-based thermal coatings for concrete structures, Surface & Coatings Technology, 4 December
2016, p. 8.
6. K. Sakkas, D. Panias, P.P. Nomikos and A.I. Sofianos, Potassium based geopolymer for passive fire protection of
concrete tunnels linings, Tunnelling and Underground Space Technology, 12 May 2014, p. 9.
7. M. Gravit, Quality control of fireproof coatings for reinforced concrete structures, Earth and Environmental
Science, 13-April-2017, p. 5.
8. Jung J. Kim, Kwang-Soo Youm and Mahmoud M. Reda Taha, Extracting concrete thermal characteristics from
temperature time history of RC column exposed to standard fire, Hindawi Publishing Corporation, The Scientific
World Journal, Article ID 242806, 11 August 2014, 10 pages.
9. Andrii Kovalo, Yurii Otrosh, Olha Ostroverkh, Oleksandr Hrushovinchuk and Oleksandr Savchenko, Fire resistance
evaluation of reinforced concrete floors with fire-retardant coating by calculation and experimental method, EDP
Sciences, p.9,
10. J. Selih and A.C.M. Sousa, Heat transfer and thermal stress calculation in fire-exposed concrete walls, Transactions
on Engineering Sciences, vol 12, © 1996 WIT Press, www.witpress.com, ISSN 1743-3533, p. 10.
11. AREMCO, Properties of cermabond-569, High Temperature Ceramic & Graphite Adhesives.
12. V.K.R. Kodur and M.A. Sultan, Effect of temperature on thermal properties of high-strength concrete, Journal of
Materials In Civil Engineering, ASCE, vol. 15, no. 2, March 2003, p. 7.


The Institution of Engineers (India)Jharkhand State Centre
Engineer Bhawan, Nepal Kothi Campus,
P.O. Doranda, Ranchi 834002, Ph : (0651) 2491344
E-mail: [email protected],
Web: www.ieijsc.org
Administrator
Typewritten Text
ISBN 978-81-952159-1-1