
Oscillation of nonlinear neutral delay differential Equations
Upload
independentCategory
view
3download
0
Quality & Quantity 38: 17–33, 2004.© 2004 Kluwer Academic Publishers. Printed in the Netherlands.
17
Response Effects in Surveys on Children andAdolescents: The Effect of Number of ResponseOptions, Negative Wording, and Neutral Mid-Point
NATACHA BORGERS� and JOOP HOXUtrecht University
DIRK SIKKELCatholic University Brabant
Abstract. Social researchers increasingly survey children and young adolescents. They are con-vinced that information about perspectives, attitudes, and behaviors of children should be collectedfrom the children themselves. Methodological expertise on surveying children is still scarce, andresearchers rely on ad-hoc knowledge from fields such as child psychiatry and educational testing, oron methodological knowledge on surveying adults. Regarding adults, empirical evidence shows thatrespondent characteristics (cognitive abilities) as well as question characteristics (question difficulty)affect response quality.
This study reports on a methodological survey experiment on the effect of negatively formu-lated questions, the number of response options and offering a neutral midpoint as response optionquestion characteristics on the reliability of the responses, using children and young adolescents asrespondents.
The study shows no effects of negatively formulated questions on the reliability measures,although children respond consistently differently on negatively formulated questions than on pos-itively formulated questions. Taking all results on the effects of number of response options andoffering a neutral midpoints on the different reliability measures into consideration; it would appearthat offering about four response options is optimal with children as respondents.
Key words: question characteristics, stability over time, internal consistency, response quality,reliability
1. Introduction
Surveying the general population involves a set of complex activities, althoughprocedures to increase general response quality are well documented (Biemer etal., 1991; Groves, 1989; Lyberg et al., 1997). There is an increasing body of empir-ical evidence that both respondent and question characteristics affect the reliabilityof responses in surveys (Alwin & Krosnick, 1991; Krosnick, 1991; Krosnick &Alwin, 1987; Krosnick & Fabrigar, 1997; Narayan & Krosnick, 1996; Schwarz &
� Author for correspondence: University of Utrecht, Methodology & Statistics Department, P.O.Box 80.140, NL-3580 TC Utrecht, the Netherlands. E-mail: [email protected]

18 NATACHA BORGERS ET AL.
Hippler, 1995; Schwarz & Knäuper, 1999; Schwarz et al., 1998; Schwarz et al.,1998). These studies show that cognitive abilities (often indicated by respondenteducation) and variations in question wording may affect responses. Althoughsocial researchers increasingly survey children and young adolescents, survey-ing such special populations is still at the frontier of survey methodology (Scott,1997). Much methodological advice on how to best survey children is derived frommethodological studies on adults and theories based on adults as respondents.
This study reports on a methodological survey experiment on the effect of sev-eral question characteristics on the reliability of the responses, using children andyoung adolescents as respondents. The theoretical background of our study is Kros-nick’s (1991) satisficing theory, which explains why the reliability of responsesdiffers between respondents, and why it can be affected by question wording.The satisficing theory elaborates a standard question answering process-modeldeveloped by Tourangeau (1988; cf. Cannel et al., 1990; Krosnick et al., 1996;Schwarz & Knäuper, 1999; Schwarz et al., 1998; Sudman et al., 1996). In thisstandard question-answering model a sequence of four steps characterizes an op-timal question answering process: (1) understanding and interpreting the questionbeing asked; (2) retrieving the relevant information from memory; (3) integrat-ing this information into a summarized judgment; (4) reporting this judgment bytranslating it to the format of the presented response scale.
Krosnick’s satisficing theory identifies two processes that explain differencesin reliability of responses, namely optimizing and satisficing. Optimizing meansthat the respondent goes through all four cognitive steps needed to answer a sur-vey question. In contrast to optimizing, satisficing means that a respondent givesmore or less superficial responses that appear reasonable or acceptable, withoutgoing through all the steps involved in the question-answering process. Satisficingis related to three dimensions of the question-answering process: the motivationof the respondent, the difficulties of the task, and the cognitive abilities of therespondent. Low motivation, difficult questions, and low cognitive abilities maylead respondents to provide a satisfactory response instead of an optimal one.Using a satisficing strategy generally produces less reliable responses than usingan optimizing strategy. Implicitly, the satisficing theory assumes an interactioneffect between respondent characteristics and question characteristics, which canbe described as follows: the less cognitively sophisticated the respondents are, themore sensitive they are to difficult or cognitively demanding questions, and the lessreliable their responses tend to be.
Applying the satisficing theory to special populations, such as elderly or chil-dren, is of special interest, because both growing up and aging involve changes incognitive functioning, and cognitive ability is a central respondent characteristicthat affects the reliability of responses. Recently, several studies have shown thatreduction in cognitive functioning due to the aging process is associated with adecline in the reliability of survey responses (Alwin & Krosnick, 1991; Knäuperet al., 1997; Krosnick, 1991; Schwarz et al., 1998). Like aging, growing up in-
RESPONSE EFFECTS IN SURVEYS ON CHILDREN AND ADOLESCENTS 19
volves changes in cognitive functioning. In children and young adolescents, bothcognitive ability and communicative and social skills are still developing. As aconsequence, cognitive ability and social skills vary considerably across children.These differences can lead to the use of different strategies in answering questionsand therefore to differences in the reliability of responses obtained in surveys ofchildren and young adolescents.
Piaget’s (1929) theory of cognitive development provides a useful instrumentto distinguish successive stages in children’s cognitive development. According toPiaget, children’s intellectual development evolves in a fixed sequence of stages.Piaget’s theory has been under criticism from different points of view, but thiscritique focuses mostly on the timing of the successive stages; the transitions fromone stage to another are not as clear as assumed. For our purpose, the directions ofcognitive development are more important than the actual stages. Piaget’s cognitivedevelopmental theory enables us to combine developmental abilities and the cog-nitive demands of survey research. In combination with the question-answeringmodel and the satisficing theory, it explains why younger children have moredifficulties with cognitive demanding survey questions than older children.
Piaget’s developmental theory distinguishes five stages (Flavell, 1985). The firsttwo stages involve developments in early infancy, where verbal surveys are outof the question. In the third stage (intuitive thought), children aged from 4 until7 are developing the basic skills necessary for successful verbal exchange. Theage-group as a whole is still limited in their language development, which implieslimitations in comprehension and in verbal memory. In the fourth stage (concreteoperations), children aged 7 until 11 develop language and reading skills. Childrenof this age start to understand the concept of different points of views (such as selfvs. others), they begin to learn classification and temporal relations, but they stillhave problems with logic forms, for instance negations. In addition, they tend to bevery literal in the interpretation of words. In the fifth stage (formal thought), withchildren aged 11 until 15, cognitive functioning (e.g., formal thinking, negations,logic) is well developed. However, children in this age group are still very contextsensitive and they may have their own norms. Children or rather adolescents aged16 and up are treated as adults in survey research (Borgers et al., 1999), there is noreason to treat them as a special group.
In general, Piaget (1955) stated that language and other cognitive developmenthave comparable developmental and transitional periods. Language and cognitivedevelopment are both involved in perception, storage and retrieval of information(Holaday & Turner-Henson, 1989). All characteristics of the three stages, intuitivethought, concrete operations, and formal thought appear to be important for thequestion answering process and may therefore affect this process.
The small number of studies that researched the effects of cognitive abilities ofchildren in survey research support the hypothesis that growing up is related to anincrease of the reliability of responses (e.g., Amato & Ochiltree, 1987; Borgers,1997, 1998; Borgers & Hox, 1999, 2000; Borgers et al., 1999; De Leeuw & Otter,
20 NATACHA BORGERS ET AL.
1995; Otter et al., 1995; Otter, 1993; Vaillancourt, 1973). In general, even slighterrors (such as negatively formulated questions) in the questionnaire are more dif-ficult to compensate for children and have larger effects on the responses (Borgers& Hox, 2000; Marsh, 1986).
From Piaget’s theory of cognitive development, one can derive directly that neg-atively formulated questions should pose serious problems in survey research withchildren. Especially the younger children (11 and younger) have not yet developedthe formal thinking that is necessary to understand logical negations. In an earlierstudy, Borgers and Hox (2000) confirmed the expected negative effect of negat-ively formulated questions on response reliability. However, they did not find theexpected interaction effect between age of the children and negatively formulatedquestions. A weak point in their study is that it is based on secondary analysis. Thedata were not collected for this research question, and researchers probably adaptthe text of the questions to the cognitive abilities of the researched population.
In addition to the problem of negations, limitations of comprehension and verbalmemory are expected to be one of the most important causes of children’s diffi-culties in adequately responding to survey questions. Verbal comprehension andverbal memory are very important in the first two steps of the question-answeringprocess: understanding the question and retrieval of relevant information frommemory. For instance, longer questions can help respondents by providing memorycues or as ‘anchor points’ and by acting as a form of aided recall (Holaday &Turner-Henson, 1989). However, research on the effect of long questions indic-ates that response reliability in general declines as the length of the questionincreases (Borgers & Hox, 2000; Holaday & Turner-Henson, 1989; Knäuper et al.,1997), which can be explained by the increased demand that remembering longerquestions makes on verbal memory. This leads to the general advice that surveyquestions should be short and clearly formulated (Borgers et al., 2000). The samecontradiction might apply for the number of response options offered. In researchwith adults there is increasing evidence, and even consensus, that data quality im-proves as the number of response categories increases (Andrews, 1984; Krosnick& Fabrigar, 1997; Rodgers et al., 1989; Rodgers et al., 1988). However, the moreoptions offered, the more burden is placed on verbal memory. In secondary researchwith children, the results indicate that offering more response options decreases thereliability of responses of children (Borgers & Hox, 2000).
Offering a neutral midpoint in the response scale can serve as an anchor point,but it seems more often found that offering a neutral midpoints tempts respondentsto choose this category (Ayidiya & McClendon, 1990; Narayan & Krosnick, 1996;Raaijmakers et al., 2000). This neutral mid-point is apparently often used in thesense of undecided (Raaijmakers et al., 2000). Given the limitations of children’scognitive ability and communicative and social skills, we expect that they are sens-itive to the temptation to satisfice by choosing a neutral mid-point when this is notthe optimal answer.
RESPONSE EFFECTS IN SURVEYS ON CHILDREN AND ADOLESCENTS 21
An experimental design is needed to systematically research the effects of thesequestion characteristics in survey research with children. In this study, we describesuch an experiment with children aged between 8 and 16 years. The researchquestions can be summarized as follows: (1) What are the effects of negativelyformulated questions, the number of response options and offering a neutral mid-point as response option on the reliability of children’s responses, after controllingfor age? (2) Is there evidence for an interaction between age and the effect of thequestion characteristics manipulated in the experiment?
2. Method
2.1. DATA COLLECTION AND PARTICIPANTS
The data have been collected by CentERdata, a University-based research cen-ter, which operates a telepanel. The telepanel consists of a random sample ofapproximately 2000 households who have an Internet connection at home. Thepanel members receive questionnaires via Internet on a weekly basis. New andreplacement households are selected by telephone interviews (CATI). The samplefor these interviews is based on random selection of telephone number of Dutchprivate households (Felix & Sikkel, 1999). Panel members who do not have acomputer or an Internet connection borrow a settop box from CentERdata, whichenables them to use e-mail and the Internet and to fill out electronic questionnaires.
For this experiment, children in the telepanel households between 8 and 16years old were asked to answer the questionnaire. The questionnaire was admin-istered twice (repeated measures). The first administration took place between theend of June and the end of September 2001. In the first administration 222 childrenparticipated, of whom 117 are boys and 105 are girls. In the second administration91 children responded. The period between the first and second measurement variesbetween a minimum of 3 weeks and a maximum of 8 weeks.
2.2. DESIGN
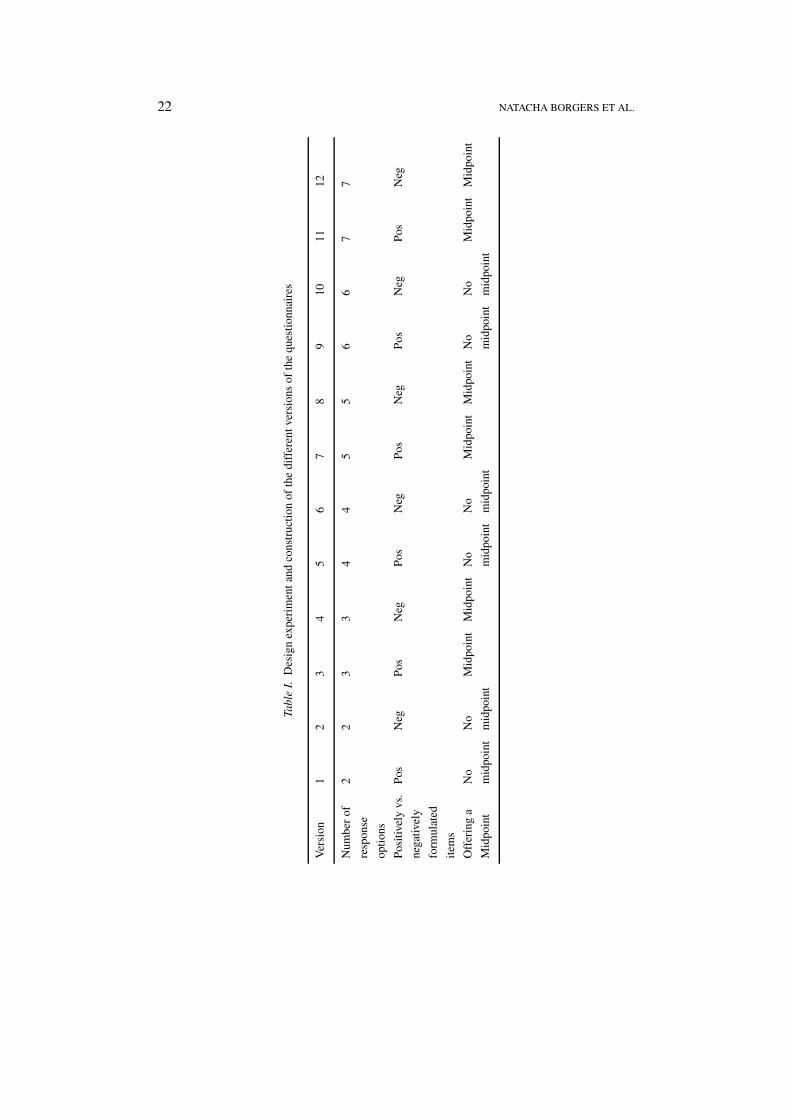
A six by two factorial design was used. Six different number of response optionsby negatively and positively formulated items were used. Besides the questioncharacteristic offering a midpoint was included. This was not an extra factor inthe design because all odd number of response options include a midpoint while itis impossible to include a midpoint when offering an even number of response op-tions. Table I shows in summary the design of the experiment and the constructionof the 12 different versions of the questionnaires.
Two instruments were used for this study. The first instrument is the Dutchten-item version of the Rosenberg Self-Esteem scale (Rosenberg, 1965, 1979),translated by Linden et al. (1983). For use with children the items were reformu-lated into shorter and more concrete items. One item was judged too complicated
22 NATACHA BORGERS ET AL.
Tabl
eI.
Des
ign
expe
rim
enta
ndco
nstr
ucti
onof
the
diff
eren
tver
sion
sof
the
ques
tion
nair
es
Ver
sion
12
34
56
78
910
1112
Num
ber
of2
23
34
45
56
67
7
resp
onse
opti
ons
Pos
itiv
ely
vs.
Pos
Neg
Pos
Neg
Pos
Neg
Pos
Neg
Pos
Neg
Pos
Neg
nega
tivel
y
form
ulat
ed
item
s
Off
erin
ga
No
No
Mid
poin
tM
idpo
int
No
No
Mid
poin
tM
idpo
int
No
No
Mid
poin
tM
idpo
int
Mid
poin
tm
idpo
int
mid
poin
tm
idpo
int
mid
poin
tm
idpo
int
mid
poin
t
RESPONSE EFFECTS IN SURVEYS ON CHILDREN AND ADOLESCENTS 23
for the youngest children and is left out of the questionnaire. The original in-strument offered four response options (strongly agree; agree; disagree; stronglydisagree). The second instrument is derived from Bradburns well-being scale(Bradburn, 1969; Bradburn & Caplovitz, 1965) and translated into Dutch by Hox(1986). Bradburn’s well-being scale originally contains 18 items, nine items ask forpositive affect and nine for negative affect. Because we need to include positivelyversus negatively formulated items in the experiment, we just used the ten itemsthat differ concerning the content of the items (the other Bradburn items are negat-ively formulated questions of available items). The Dutch version originally offeredfive response options (never; rarely; sometimes; often; very often). Again the itemswere reformulated into items that were more concrete and clear for children. Thenumber of response options was adapted to the number of response options thatthe design allowed, and always included as many positive as negative options. Thequestion order (in blocks of all questions in a scale) was randomly assigned to eachof the children.
2.3. DEPENDENT VARIABLES AND ANALYSIS
Two measures of reliability are used as dependent variables (Borgers, 1997; Bor-gers & Hox, 2000; De Leeuw & Otter, 1995). The first is the item-rest correlation,a measure for internal consistency that is defined at the item level. The item-restcorrelation is calculated on the responses of the first measurement occasion only.Item-rest correlations cannot be calculated for individual children, they can onlybe calculated on groups of children. Therefore, different groups of children aredefined, and for each group of children within a questionnaire version, the item-rest correlations are computed for every item in the scale. Since correlations do nothave a normal distribution and have a limited range (−1 ≤ rir ≤ 1) a normaliz-ing transformation, the Fisher-Z transformation (Hayes, 1974)1 is applied to theitem-rest correlations.
The second reliability indicator is defined per child per question, being the ab-solute difference between the first and second measurement, which is a measure ofconsistency over time. The distribution of this absolute difference between the firstand second measurement is a strongly skewed distribution, which means that mostchildren are very consistent in their responses over time. In addition, the number ofresponse options differs between the different versions, varying between two andseven response options. This means that the absolute differences between the firstand second measure are not wholly comparable between the different versions. Forthis reason we use in addition to the absolute difference between both measuresalso the relative difference between the first and second measure, which is theabsolute difference divided by the number of response options, which results ina value between 0 and 1 for the relative difference.
The analysis model used for all three dependent variables is a multilevel regres-sion model. For an introduction to multilevel modeling, see Bryk and Raudenbush
24 NATACHA BORGERS ET AL.
(1992) and Hox (2002). The data in this study are a hierarchically structuredwith two levels: items that are nested within children. For the different types ofdependent variables, different types of multilevel analysis have been performed.
First, a random-effects meta-analysis has been used for the transformed Fisher’sZ as dependent variable. The use of a random-effect meta-analysis has the advant-age that the coefficients are analyzed as outcomes, using the information availableon their standard error. Bryk and Raudenbush (1992) and Raudenbush (1994) de-scribe a two-level model for meta-analysis, which was used by De Leeuw (1995)and Otter (1995) and by Borgers and Hox (2000).
Secondly, a multilevel logistic regression model was used for the relative dif-ference between the first and second measure. Because this variable is definedas a value between 0–1, it should treated as a proportion. Such data violate sev-eral assumptions of the normal regression method, and the appropriate analysismodel is logistic regression. The multilevel logistic model is described in Goldstein(1995). The disadvantage of using logistic regression on the relative difference isthe shrinkage of the differences between both measures.
Therefore we did a third type of multilevel analysis on the absolute differencebetween the first and second measure. Since we have to deal with a non-normal de-pendent variable, and a relatively small highest-level sample size, a nonparametricbootstrap method is used to estimate the parameters and standard errors in the finalmodel. In the nonparametric bootstrap the multilevel regression estimate is carriedout once on the total data set. The regression coefficient from this estimation is usedto produce predicted values, and the residuals from this analysis are resampled ineach bootstrap iteration (Hox, 2002).
The analysis strategy is the same for all three dependent variables. Three modelsare analyzed. The first model is the null-model. This model decomposes the vari-ance in the dependent variables into the different levels. Secondly, we include theexplanatory variables measured at the child level (age, gender, number of weeksbetween the first and second administration). In the final model the question char-acteristics (negatively formulated questions, offering a neutral midpoint and thenumber of response options) are included. We do not assume that the number ofresponse options has a linear effect on the dependent variable. Including all pos-sible dummy variables for the number of response options in the analysis togetherwith the question characteristic ‘offering a neutral midpoint’ causes a collinearityproblem. For that reason the number of response options is included in the analysisas the number of response options, centered around the overall (theoretical) mean,the squared values and the cubed values of the centered number of responses.
The last analysis step is to model these regression coefficients as varyingacross groups of children. This models different effects of the question char-acteristics across children, with varying slopes for the question characteristiceffects indicating possible interaction effects for these variables with some childcharacteristics.
RESPONSE EFFECTS IN SURVEYS ON CHILDREN AND ADOLESCENTS 25
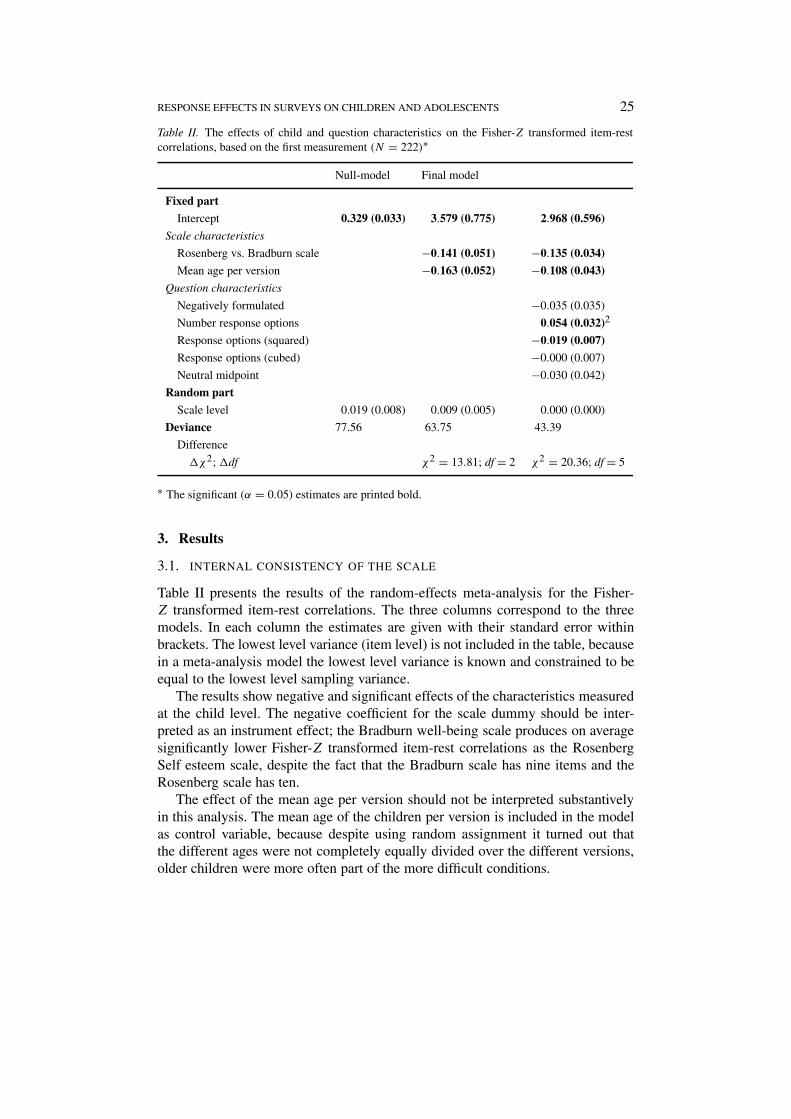
Table II. The effects of child and question characteristics on the Fisher-Z transformed item-restcorrelations, based on the first measurement (N = 222)∗
Null-model Final model
Fixed part
Intercept 0.329 (0.033) 3.579 (0.775) 2.968 (0.596)
Scale characteristics
Rosenberg vs. Bradburn scale −0.141 (0.051) −0.135 (0.034)
Mean age per version −0.163 (0.052) −0.108 (0.043)
Question characteristics
Negatively formulated −0.035 (0.035)
Number response options 0.054 (0.032)2
Response options (squared) −0.019 (0.007)
Response options (cubed) −0.000 (0.007)
Neutral midpoint −0.030 (0.042)
Random part
Scale level 0.019 (0.008) 0.009 (0.005) 0.000 (0.000)
Deviance 77.56 63.75 43.39
Difference
�χ2; �df χ2 = 13.81; df = 2 χ2 = 20.36; df = 5
∗ The significant (α = 0.05) estimates are printed bold.
3. Results
3.1. INTERNAL CONSISTENCY OF THE SCALE
Table II presents the results of the random-effects meta-analysis for the Fisher-Z transformed item-rest correlations. The three columns correspond to the threemodels. In each column the estimates are given with their standard error withinbrackets. The lowest level variance (item level) is not included in the table, becausein a meta-analysis model the lowest level variance is known and constrained to beequal to the lowest level sampling variance.
The results show negative and significant effects of the characteristics measuredat the child level. The negative coefficient for the scale dummy should be inter-preted as an instrument effect; the Bradburn well-being scale produces on averagesignificantly lower Fisher-Z transformed item-rest correlations as the RosenbergSelf esteem scale, despite the fact that the Bradburn scale has nine items and theRosenberg scale has ten.
The effect of the mean age per version should not be interpreted substantivelyin this analysis. The mean age of the children per version is included in the modelas control variable, because despite using random assignment it turned out thatthe different ages were not completely equally divided over the different versions,older children were more often part of the more difficult conditions.
26 NATACHA BORGERS ET AL.
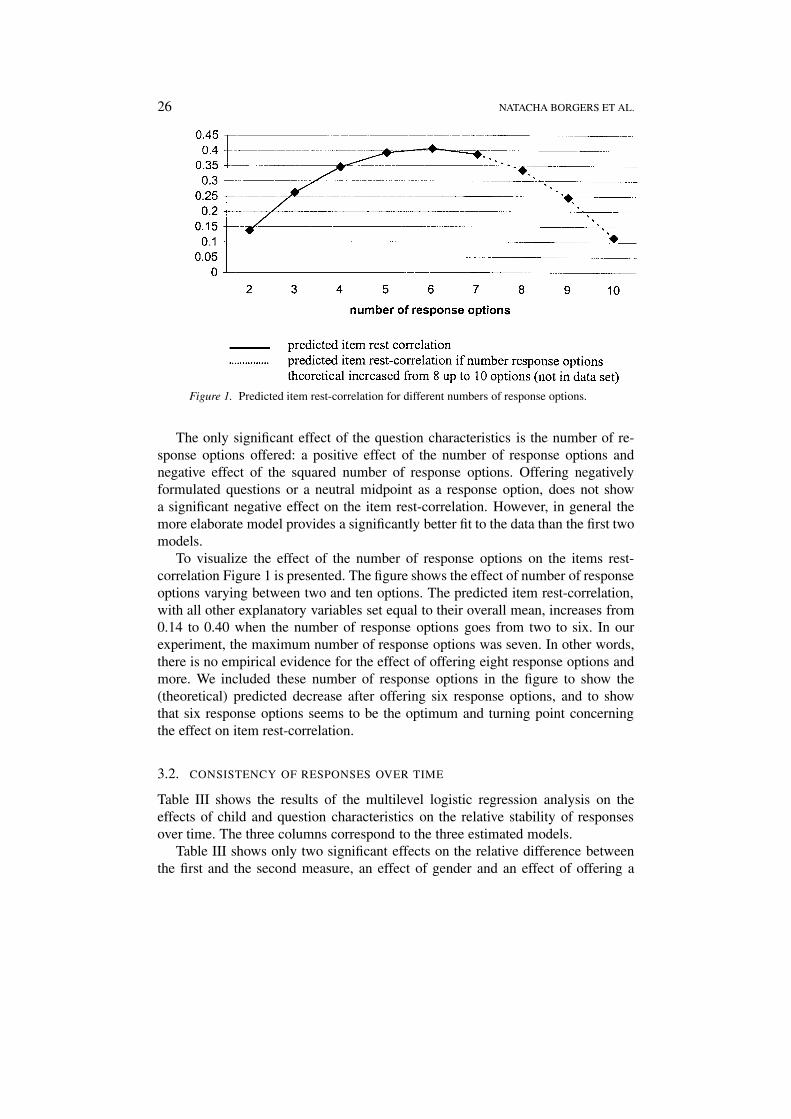
Figure 1. Predicted item rest-correlation for different numbers of response options.
The only significant effect of the question characteristics is the number of re-sponse options offered: a positive effect of the number of response options andnegative effect of the squared number of response options. Offering negativelyformulated questions or a neutral midpoint as a response option, does not showa significant negative effect on the item rest-correlation. However, in general themore elaborate model provides a significantly better fit to the data than the first twomodels.
To visualize the effect of the number of response options on the items rest-correlation Figure 1 is presented. The figure shows the effect of number of responseoptions varying between two and ten options. The predicted item rest-correlation,with all other explanatory variables set equal to their overall mean, increases from0.14 to 0.40 when the number of response options goes from two to six. In ourexperiment, the maximum number of response options was seven. In other words,there is no empirical evidence for the effect of offering eight response options andmore. We included these number of response options in the figure to show the(theoretical) predicted decrease after offering six response options, and to showthat six response options seems to be the optimum and turning point concerningthe effect on item rest-correlation.
3.2. CONSISTENCY OF RESPONSES OVER TIME
Table III shows the results of the multilevel logistic regression analysis on theeffects of child and question characteristics on the relative stability of responsesover time. The three columns correspond to the three estimated models.
Table III shows only two significant effects on the relative difference betweenthe first and the second measure, an effect of gender and an effect of offering a

RESPONSE EFFECTS IN SURVEYS ON CHILDREN AND ADOLESCENTS 27
Table III. Results of multilevel logistic regression analyses on the effects of child andquestion characteristics on the relative differences between the first and second measuredivided by the range of response options offered (N = 91)∗
Null-model Final model (s.e.)
parameter (s.e.)
Fixed part
Intercept 1.59 (0.06) −1.53 (0.34) −1.744 (0.030)
Child characteristics
Age −0.03 (0.03) −0.03 (0.02)
Gender 0.14 (0.11) 0.21 (0.11)
Weeks 0.02 (0.03) 0.01 (0.03)
Question characteristics
Negatively formulated 0.12 (0.11)
Number response options −0.02 (0.09)
Response options (squared) −0.02 (0.03)
Response options (cubed) −0.01 (0.02)
Neutral midpoint 0.224 (0.121)
Random part
Child level 0.161 (0.040) 0.152 (0.039) 0.124 (0.034)
Question level 1.00 (0.000) 1.00 (0.000) 1.00 (0.000)
∗ The significant (α = 0.05) estimates are printed bold.
neutral midpoint. Girls produce a larger relative difference between the first andthe second measure and offering a midpoint in the response scale also producesa bigger difference. Consistent with the results in Table II, negatively formulatedquestions do not affect the stability over time. Increasing the number of responseoptions, however, also does not show an effect on the relative difference betweenthe first and second measure. This result is likely the effect of the small size ofthe relative instability over time, which almost disappears after the logistic trans-formation. For that reason we also performed analyses on the absolute difference,which include bootstrapped estimates. Because of the small sample size and non-normality of the dependent variable, we have more confidence in the bootstrappedresults than the asymptotic estimates. The results of these analyses are shown inTable IV.
Table IV shows that most of the variance in the absolute difference betweenthe first and second measure is at the question level. Besides, the variance at thequestion level is not at all explained by the explanatory variables. 45% percent ofthe variance at child level is explained by our explanatory variables, just 8.3% ofthe total variance is explained by our final model.
The asymptotic results show a significant result of age and gender, partly con-sistent with the results in Table III, and a significant effect of the number of

28 NATACHA BORGERS ET AL.
Tabl
eIV
.R
esul
tsof
the
mul
tile
vel
regr
essi
onan
alys
isof
the
effe
ctof
chil
dan
dqu
esti
onch
arac
teri
stic
son
the
abso
lute
diff
eren
cebe
twee
nbo
thm
easu
res
Nul
l-m
odel
Fin
alB
oots
trap
95%
-con
fide
nce
para
met
er(s
.e.)
mod
eles
tim
ates
inte
rval
Fix
edpa
rt
Inte
rcep
t0.
621
(0.0
41)
0.85
(0.2
6)0.
51(0
.18)
0.90
50.
468/
1.33
9
Chi
ldch
arac
teri
stic
s
Age
−0.0
3(0
.02)
−0.0
2(0
.01)
−0.0
17−0
.043
/0.0
12
Gen
der
0.01
(0.0
8)0.
12(0
.06)
−0.0
79−0
.206
/0.0
60
Wee
ks0.
03(0
.02)
0.00
(0.0
2)−0
.011
−0.0
41/0
.021
Que
stio
nch
arac
teri
stic
s
Neg
ativ
ely
form
ulat
ed0.
08(0
.06)
0.05
6−0
.069
/0.1
86
Num
ber
resp
onse
opti
ons
0.17
(0.0
5)0.
192
0.07
5/0.
308
Res
pons
eop
tion
s(s
quar
ed)
−0.0
0(0
.01)
−0.0
03−0
.039
/0.0
33
Res
pons
eop
tion
s(c
ubed
)−0
.00
(0.0
1)−0
.006
−0.0
26/0
.015
Neu
tral
mid
poin
t0.
11(0
.06)
0.09
1−0
.070
/0.2
55
Ran
dom
part
Chi
ldle
vel
0.13
3(0
.022
)0.
105
(0.0
21)
0.02
6(0
.010
)0.
060
0.02
9/0.
089
Que
stio
nle
vel
0.72
0(0
.025
)0.
720
(0.0
25)
0.72
0(0
.025
)0.
722
0.67
1/0.
770
RESPONSE EFFECTS IN SURVEYS ON CHILDREN AND ADOLESCENTS 29
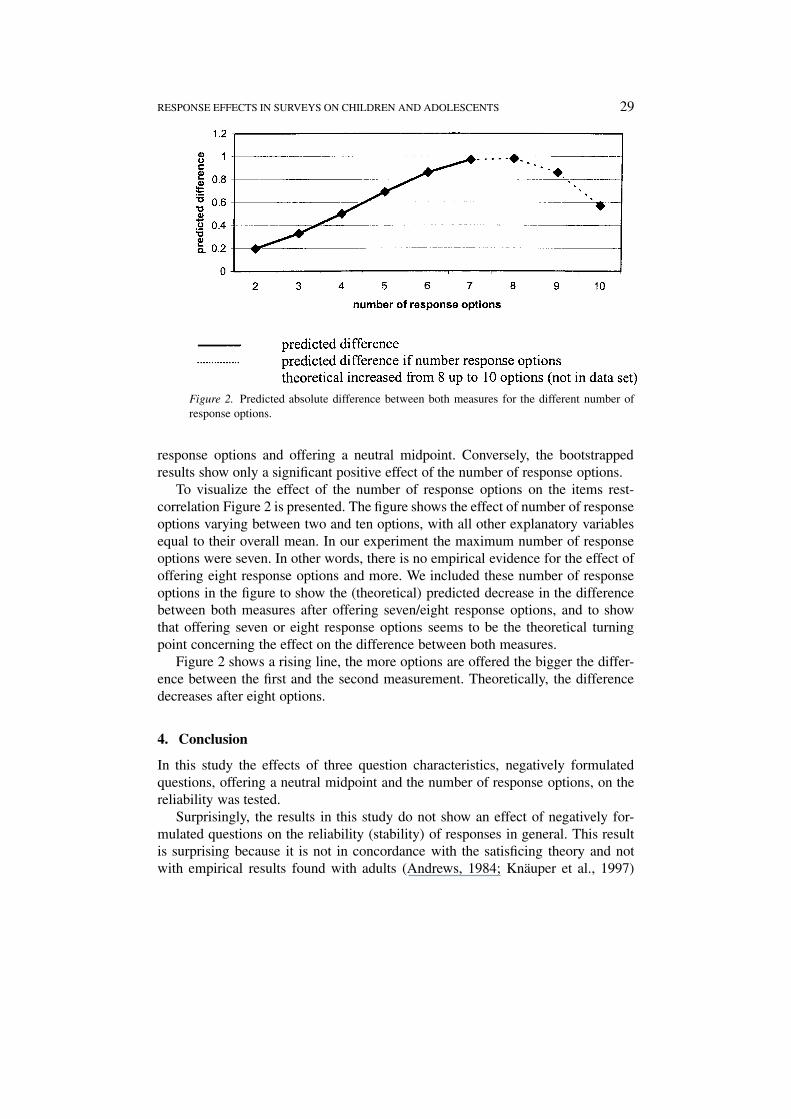
Figure 2. Predicted absolute difference between both measures for the different number ofresponse options.
response options and offering a neutral midpoint. Conversely, the bootstrappedresults show only a significant positive effect of the number of response options.
To visualize the effect of the number of response options on the items rest-correlation Figure 2 is presented. The figure shows the effect of number of responseoptions varying between two and ten options, with all other explanatory variablesequal to their overall mean. In our experiment the maximum number of responseoptions were seven. In other words, there is no empirical evidence for the effect ofoffering eight response options and more. We included these number of responseoptions in the figure to show the (theoretical) predicted decrease in the differencebetween both measures after offering seven/eight response options, and to showthat offering seven or eight response options seems to be the theoretical turningpoint concerning the effect on the difference between both measures.
Figure 2 shows a rising line, the more options are offered the bigger the differ-ence between the first and the second measurement. Theoretically, the differencedecreases after eight options.
4. Conclusion
In this study the effects of three question characteristics, negatively formulatedquestions, offering a neutral midpoint and the number of response options, on thereliability was tested.
Surprisingly, the results in this study do not show an effect of negatively for-mulated questions on the reliability (stability) of responses in general. This resultis surprising because it is not in concordance with the satisficing theory and notwith empirical results found with adults (Andrews, 1984; Knäuper et al., 1997)
30 NATACHA BORGERS ET AL.
and children (Benson & Hocevar, 1985; Borgers & Hox, 2000; Marsh, 1986). Thatthis result does not appear in our study can be the result of the definition of ourdependent variable as stability over time. Apparently, children can respond stablyover time and within a scale, while responding consistently different on negativelyformulated questions. So, the interpretation of negative questions is stable over allquestions, but different from the positively formulated questions. On more thanhalf of the questions significant differences in responses between the negativelyformulated and positively formulated questions were found. Marsh (1986) alsofound that the interpretation of negatively formulated question is very differentfrom positively formulated questions.
The most stable result in this study is the effect of the number of responseoptions on the reliability of responses. However, it is not a linear effect. Thestability of responses within the scale increased with the number of responsesoptions offered, up to six options. Offering seven or more options appears to causea decrease in scale reliability. The effect of increasing the number of responseoptions on the stability over time shows the opposite effect. Increasing the num-ber of response options cause an increase of the absolute difference between thefirst and the second measurement up to offering seven response options. This islogical, since offering more response options provides room for larger absolutedifferences. After about eight response options, the predicted difference declined.For the relative difference no effects were found.
Earlier studies showed that more response options offered, the less reliable(stability within the scale) the responses were and more item non-response wasproduced. For developing questionnaires for children this means that the researchershould weigh one effect against the other. The results are not as clear with childrenas they are for adults, where increasing the number of response options definitelyresults in an increase of reliability of responses with an optimum around sevenresponse options. Besides, the results on the relative difference between both meas-ures show a positive effect of offering a midpoint. Questions with a response scalethat offers a neutral midpoint produce a bigger relative difference between bothmeasures. Take all above-mentioned results into consideration; it would appearthat offering about four response options is optimal with children as respondents.
The variance of the outcome over children is significant, indicating that differentchildren do not react the same to the questions. This indicates possible interactionsbetween child and question characteristics. However, given the limitations of oursample, it was not possible to model these interactions with the data at our disposal.A second limitation of this study is that the data are collected using computer-assisted self-interviewing (CASI) with a standing panel of respondents. In general,using computer assisted questionnaires produces a better quality of responses (deLeeuw et al., 1998). In addition, panel respondents are trained respondents com-pared to respondents in general. Both aspects can affect the responses and theresults in this study, resulting in smaller effects that would be found otherwise.

RESPONSE EFFECTS IN SURVEYS ON CHILDREN AND ADOLESCENTS 31
Notes
1. Z = (ln(1+rir )− ln(1−rir )); and the inverse transformation is rir = (exp(2∗Z)−1)/(exp(2∗Z) + 1).
2. The Wald test is used to test the hypothesis that both coefficients (the number of responseoptions and the squared number of response options) are zero (Goldstein, 1995; Hox, 2002).This resulted in χ2 = 8.45 df = 2; p = 0.015, which shows that both coefficients do not equalzero.
References
Alwin, D. F. & Krosnick, J. A. (1991). The reliability of survey attitude measurement. The influenceof question and respondent attributes. Sociological Methods and Research 20(1): 139–181.
Amato, P. R. & Ochiltree, G. (1987). Interviewing children about their families: A note on dataquality. Journal of Marriage and the Family 49: 669–675.
Andrews, F. M. (1984). Construct validity and error components of survey measures: A structuralmodeling approach. Public Opinion Quarterly 48: 409–442.
Ayidiya, S. A. & McClendon, M. J. (1990). Response effects in mail surveys. Public OpinionQuarterly 54: 229–247.
Benson, J. & Hocevar, D. (1985). The impact of item phrasing on the validity of attitude scales forelementary school children. Journal of Educational Measurement 22(3): 231–240.
Biemer, P. P., Groves, R. M., Lyberg, L. E., Mathiowetz, N. A. & Sudman, S. (eds.) (1991).Measurement Errors in Surveys. New York: Wiley.
Borgers, N. (1997). De invloed van taalvaardigheid op datakwaliteit bij vragenlijstonderzoek on-der kinderen [in Dutch] (The Influence of Language and Reading Ability on Data Quality inQuestionnaire Research with Children) (unpublished). Amsterdam: University of Amsterdam,Department of Education (POW).
Borgers, N. (1998). The Influence of Child and Question Characteristics on Item Non-Response andthe Reliability in Self-Administered Questionnaires: Coding Scheme and Preliminary Results.Paper presented at the SMABS Conference, Leuven.
Borgers, N. & Hox, J. J. (1999). Item Non-Response in Questionnaire Research with Children. Paperpresented at the International Conference on Survey Non-Response, Portland.
Borgers, N. & Hox, J. J. (2000, 3–6 October). Reliability of Responses in Questionnaire Researchwith Children. Paper presented at the Fifth International Conference on Logic and Methodology,Cologne, Germany.
Borgers, N., Leeuw, E. D. & Hox, J. J. (1999). Surveying children: Cognitive development and re-sponse quality in questionnaire research. In: A. Christianson, J. R. Gustafson, A. Klevmarken, B.Rosén, K.-G. Hansson & L. Granquist (eds.), Official Statistics in a Changing World. Stockholm:SCB, pp. 133–140.
Borgers, N., Leeuw, E. D. & Hox, J. J. (2000). Children as respondents in survey research: Cognitivedevelopment and response quality. Bulletin de méthodologie sociologique (BMS) 66: 60–75.
Bradburn, N. M. (1969). The Structure of Well-Being. Chicago: Aldine.Bradburn, N. M. & Caplovitz, D. (1965). Reports of Happiness. Chicago: Aldine.Bryk, A. S. & Raudenbush, S. W. (1992). Hierarchical Linear Model: Applications and Data
Analysis Methods. Newbury Park: Sage.Cannel, Miller & Oksenberg. (1990). Research on Interviewing Techniques. Field Experiment in
Health Research 1971–1977.De Leeuw, E. D. & Otter, M. E. (1995). The reliability of children’s responses to questionnaire items;
Question effects in children’s questionnaire data. In: J. J. Hox, B. F. V. D. Meulen, J. M. A. M.Janssens, J. J. F. T. Laak & L. W. C. Tavecchio (eds.), Advances in Family Research. Amsterdam:Thesis Publishers.

32 NATACHA BORGERS ET AL.
Felix, J. & Sikkel, D. (1999). Attrition bias in telepanel research. Kwantitatieve Methoden 20(61):101–110.
Flavell, J. H. (1985). Cognitive Development, 2nd edn. Englewood Cliffs, New Jersey: Prentice-HallInternational, Inc.
Goldstein, H. (1995). Multilevel Statistical Models, 2nd edn. London: Edward Arnold.Groves, R. (1989). Survey Error and Survey Costs. New York: Wiley.Hayes, W. L. (1974). Statistics for Social Sciences, 2nd edn. London: Holt, Rinehart and Winston.Holaday, B. & Turner-Henson, A. (1989). Response effects in surveys with school-age children.
Nursing Research 38(4): 248–250.Hox, J. J. (1986). Het gebruik van hulptheorieen bij operationalisering. Een studie rond het begrip
subjectief welbevinden. Unpublished PhD, University of Amsterdam, Amsterdam.Hox, J. J. (2002, forthcoming). Multilevel Analysis of Regression and Structural Equation Models.
Mahwah, NJ: Erlbaum.Knäper, B., Belli, R. F., Hill, D. H. & Herzog, A. R. (1997). Question difficulty and respondents’
cognitive ability: The effect of data quality. Journal of Official Statistics: An International Review13(2).
Krosnick, J. A. (1991). Response strategies for coping with the cognitive demands of attitudemeasures in surveys. Applied Cognitive Psychology 5: 213–236.
Krosnick, J. A. & Alwin, D. F. (1987). An evaluation of cognitive theory of response-order effects insurvey measurement. Public Opinion Quarterly 51(2): 201–219.
Krosnick, J. A. & Fabrigar, L. R. (1997). Designing Rating Scaling for Effective Measurement inSurveys. Survey Measurement and Process Quality. New York: Wiley.
Krosnick, J. A., Narayan, S. & Smith, W. R. (1996). Satisficing in surveys: Initial evidence. NewDirections for Evaluation 70: 29–43.
Leeuw, E. D. de, Hox, J. J. & Snijkers, G. (1998). The effect of computer-assisted interviewingon data quality. A review. In: B. Blyth (ed.), Market Research and Information Technology.ESOMAR Monograph. Amsterdam: Esomar, pp. 173–198.
Linden, F. J. V. D., Dijkman, T. & Roeders, P. J. B. (1983). Metingen van kenmerken van hetpersoonssysteem en sociale systeem. Nijmegen: Hoogveld Instituut.
Lyberg, L., Biemer, P., Collins, M., Leeuw, E. D., Dippo, C., Schwarz, N. & Trewin, D. (eds.) (1997).Survey Measurement and Process Quality, Vol. 1. New York: Wiley.
Marsh, H. W. (1986). Negative item bias in rating scales for preadolescent children: A cognitive-developmental phenomenon. Developmental Psychology 22(1): 37–49.
Narayan, S. & Krosnick, J. A. (1996). Education moderates some response effects in attitudemeasurement. Public Opinion Quarterly 60: 58–88.
Otter, M., Mellenberg, D. & Glopper, K. D. (1995). The relation between information-processingvariables and test-retest stability for questionnaire items. Journal of Educational Measurement32(2): 199–216.
Otter, M. E. (1993). Leesvaardigheid, leesonderwijs en buitenschools lezen. Instrumentatie eneffecten. Unpublished Ph.D., University of Amsterdam, Amsterdam.
Piaget, J. (1929). Introduction to the Child’s Conception of the World. New York: Harcourt.Piaget, J. (1955). The Language and Thought of the Child. New York: Meridian Books.Raaijmakers, Q. A. W., Van Hoof, A., ’t Hart, H., Verbogt, T. F. M. A. & Vollebergh, W. A. M.
(2000). Adolescents’ midpoint responses on Liker-type scale items: Neutral or missing values?International Journal of Public Opinion Research 12(2).
Raudenbush, S. W. (1994). Random effects models. In: C. H. & L. V. Hedges (eds.), The Handbookof Research Synthesis. New York: Russell Sage Foundation.
Rodgers, W. L., Andrews, F. M. & Herzog, A. R. (1989). Quality of Survey Measures: A StructuralModeling Approach.
Rodgers, W. L., Herzog, A. R. & Andrews, F. M. (1988). Interviewing older adults: Validity ofself-reports of satisfaction. Psychology and Aging 3(1): 264–272.

RESPONSE EFFECTS IN SURVEYS ON CHILDREN AND ADOLESCENTS 33
Rosenberg, M. (1965). Society and the Adolescents Self Image. Princeton, NJ: Princeton UniversityPress.
Rosenberg, M. (1979). Conceiving the Self. New York: Basic.Schwarz, N. & Hippler, H. J. (1995). Subsequent questions may influence answers to preceding
questions in mail surveys. Public Opinion Quarterly 59: 93–97.Schwarz, N. & Knäuper, B. (1999). Cognitive aging and accuracy of self-report. In: D. Park & N.
Schwarz (eds.), Cognitive Aging: A Primer. Philadelphia, PA: Psychology Press, pp. 233–252.Schwarz, N., Knäuper, B. & Park, D. (1998). Aging, Cognition, and Context Effects: How Differential
Context Effects Invite Misleading Conclusions about Cohort Differences. Paper presented at theConference on Methodological Issues in Official Statistics, Stockholm.
Schwarz, N., Park, D., Knäuper, B. & Sudman, S. (1998). Cognition, Aging, and Self-Reports.Philadelphia, PA: Psychology Press.
Scott, J. (1997). Children as respondents: Methods for improving data quality. In: L. Lyberg (ed.),Survey Measurements and Process Quality. New York: Wiley.
Sudman, S., Bradburn, N. M. & Schwarz, N. (1996). Thinking about Answers. The Application ofCognitive Processes to Survey Methodology. San Fransisco: Josey-Bass.
Tourangeau, R. & Rasinski, K. A. (1988). Cognitive processes underlying context effects in attitudemeasurement. Psychological Bulletin 103: 299–314.
Vaillancourt, P. M. (1973). Stability of children’s survey responses. Public Opinion Quarterly 373–387.

Copyright © 2022 FDOKUMEN