Neutral gas heating by X-rays in primitive galaxies
39
HAL Id: hal-01554830 https://hal.archives-ouvertes.fr/hal-01554830 Submitted on 22 Jan 2021 HAL is a multi-disciplinary open access archive for the deposit and dissemination of sci- entific research documents, whether they are pub- lished or not. The documents may come from teaching and research institutions in France or abroad, or from public or private research centers. L’archive ouverte pluridisciplinaire HAL, est destinée au dépôt et à la diffusion de documents scientifiques de niveau recherche, publiés ou non, émanant des établissements d’enseignement et de recherche français ou étrangers, des laboratoires publics ou privés. Neutral gas heating by X-rays in primitive galaxies: Infrared observations of the blue compact dwarf I Zw 18 with Herschel V. Lebouteiller, D. Pequignot, D. Cormier, S. Madden, M.W. Pakull, D. Kunth, F. Galliano, M. Chevance, S.R. Heap, M. -y. Lee, et al. To cite this version: V. Lebouteiller, D. Pequignot, D. Cormier, S. Madden, M.W. Pakull, et al.. Neutral gas heating by X-rays in primitive galaxies: Infrared observations of the blue compact dwarf I Zw 18 with Herschel. Astron.Astrophys., 2017, 602, pp.A45. 10.1051/0004-6361/201629675. hal-01554830
-
Upload
khangminh22 -
Category
Documents
-
view
0 -
download
0
Transcript of Neutral gas heating by X-rays in primitive galaxies

HAL Id: hal-01554830https://hal.archives-ouvertes.fr/hal-01554830
Submitted on 22 Jan 2021
HAL is a multi-disciplinary open accessarchive for the deposit and dissemination of sci-entific research documents, whether they are pub-lished or not. The documents may come fromteaching and research institutions in France orabroad, or from public or private research centers.
L’archive ouverte pluridisciplinaire HAL, estdestinée au dépôt et à la diffusion de documentsscientifiques de niveau recherche, publiés ou non,émanant des établissements d’enseignement et derecherche français ou étrangers, des laboratoirespublics ou privés.
Neutral gas heating by X-rays in primitive galaxies:Infrared observations of the blue compact dwarf I Zw 18
with HerschelV. Lebouteiller, D. Pequignot, D. Cormier, S. Madden, M.W. Pakull, D.
Kunth, F. Galliano, M. Chevance, S.R. Heap, M. -y. Lee, et al.
To cite this version:V. Lebouteiller, D. Pequignot, D. Cormier, S. Madden, M.W. Pakull, et al.. Neutral gas heating byX-rays in primitive galaxies: Infrared observations of the blue compact dwarf I Zw 18 with Herschel.Astron.Astrophys., 2017, 602, pp.A45. �10.1051/0004-6361/201629675�. �hal-01554830�

A&A 602, A45 (2017)DOI: 10.1051/0004-6361/201629675c© ESO 2017
Astronomy&Astrophysics
Neutral gas heating by X-rays in primitive galaxies: Infraredobservations of the blue compact dwarf I Zw 18 with Herschel?
V. Lebouteiller1, D. Péquignot2, D. Cormier1, 3, S. Madden1, M. W. Pakull4, D. Kunth5, F. Galliano1, M. Chevance1, 6,S. R. Heap7, M.-Y. Lee1, and F. L. Polles1
1 Laboratoire AIM Paris-Saclay, CEA/IRFU – CNRS/INSU – Université Paris Diderot, Service d’Astrophysique, Bât. 709,CEA-Saclay, 91191 Gif-sur-Yvette Cedex, Francee-mail: [email protected]
2 LUTH, Observatoire de Paris, CNRS, Université Paris Diderot, 5 place Jules Janssen, 92190 Meudon, France3 Zentrum für Astronomie der Universität Heidelberg, Institut für Theoretische Astrophysik, Albert-Ueberle-Str. 2,
69120 Heidelberg, Germany4 Observatoire astronomique de Strasbourg, Université de Strasbourg, CNRS, UMR 7550, 11 rue de l’Université, 67000 Strasbourg,
France5 Institut d’Astrophysique de Paris, 98 bis Boulevard Arago, 75014 Paris, France6 Astronomisches Rechen-Institut, Zentrum für Astronomie der Universität Heidelberg, Mönchhofstraße 12-14, 69120 Heidelberg,
Germany7 NASA Goddard Space Flight Center, Greenbelt, MD 20771, USA
Received 9 September 2016 / Accepted 23 February 2017
ABSTRACT
Context. The neutral interstellar medium of galaxies acts as a reservoir to fuel star formation. The dominant heating and cooling mech-anisms in this phase are uncertain in extremely metal-poor star-forming galaxies. The low dust-to-gas mass ratio and low polycyclicaromatic hydrocarbon abundance in such objects suggest that the traditional photoelectric effect heating may not be effective.Aims. Our objective is to identify the dominant thermal mechanisms in one such galaxy, I Zw 18 (1/30 Z�), assess the diagnostic valueof fine-structure cooling lines, and estimate the molecular gas content. Even though molecular gas is an important catalyst and tracerof star formation, constraints on the molecular gas mass remain elusive in the most metal-poor galaxies.Methods. Building on a previous photoionization model describing the giant H ii region of I Zw 18-NW within a multi-sector topology,we provide additional constraints using, in particular, the [C ii] 157 µm and [O i] 63 µm lines and the dust mass recently measuredwith the Herschel Space Telescope.Results. The heating of the H i region appears to be mainly due to photoionization by radiation from a bright X-ray binary source,while the photoelectric effect is negligible. Significant cosmic ray heating is not excluded. Inasmuch as X-ray heating dominates inthe H i gas, the infrared fine-structure lines provide an average X-ray luminosity of order 4 × 1040 erg s−1 over the last few 104 yr inthe galaxy. The upper limits to the [Ne v] lines provide strong constraints on the soft X-ray flux arising from the binary. A negligiblemass of H2 is predicted. Nonetheless, up to ∼107 M� of H2 may be hidden in a few sufficiently dense clouds of order .5 pc (.0.05′′)in size. Regardless of the presence of significant amounts of H2 gas, [C ii] and [O i] do not trace the so-called “CO-dark gas”, butthey trace the almost purely atomic medium. Although the [C ii]+[O i] to total infrared ratio in I Zw 18 is similar to values in moremetal-rich sources (∼1%), it cannot be safely used as a photoelectric heating efficiency proxy. This ratio seems to be kept stable owingto a correlation between the X-ray luminosity and the star formation rate.Conclusions. X-ray heating could be an important process in extremely metal-poor sources. The lack of photoelectric heating due tothe low dust-to-gas ratio tends to be compensated for by the larger occurrence and power of X-ray binaries in low-metallicity galaxies.We speculate that X-ray heating may quench star formation.
Key words. X-rays: binaries – infrared: ISM – photon-dominated region (PDR) – galaxies: ISM – galaxies: individual: I Zw 18 –galaxies: star formation
1. Introduction
Star formation in primordial (or quasi-primordial) gas is a fun-damental process taking place in the first galaxies that are notyet enriched with elements produced by stellar nucleosynthe-sis. Star formation proceeds when a cloud is gravitationallybound, dense, and cold enough to be subject to the Jeans in-stability (e.g., Krumholz 2012). Thermal pressure is removed
? Herschel is an ESA space observatory with science instruments pro-vided by European-led Principal Investigator consortia and with impor-tant participation from NASA.
by lowering the heating from UV photons through H2 self-shielding or absorption by dust particles (and conversion to in-frared radiation; IR). Furthermore, the presence of metals, evenin small amounts, significantly cools down the gas through ra-diative transitions such as [C ii] 157 µm, [O i] 63 µm, and [Si ii]34 µm in the neutral atomic medium, or CO in the molecularmedium. In the diffuse interstellar medium (ISM), metal cool-ing is expected to become dominant over H2 cooling when themetallicity is &1/10 Z� (Glover & Clark 2014). The cooling ratefrom metals in the neutral phase and the abundance of H2 aretherefore two critical parameters to understand the prerequisites
Article published by EDP Sciences A45, page 1 of 38

A&A 602, A45 (2017)
for star formation in low-metallicity environments. At the sametime, it is essential to identify the main heating mechanisms atwork, especially in the neutral ISM, in order to establish the re-lationship between the thermal tracers and the star formationprocess. Infrared cooling lines are, for instance, widely usedtracers to probe star formation at potentially all redshifts (e.g.,De Looze et al. 2014), despite the lack of precise knowledgeconcerning the heating mechanisms.
The class of blue compact dwarf (BCD) galaxies containssome of the most metal-poor star-forming galaxies known. Apartfrom a subcomponent of SBS 0335-052 and a low star for-mation rate (SFR) BCD recently discovered through a blindH i survey (AGC 198691; Hirschauer et al. 2016), I Zw 18 is thenearby star-forming galaxy with the lowest metallicity known,i.e., 12 + log(O/H) = 7.22 or 1/30 Z�1, as measured by opti-cal emission lines in the H ii regions (Searle & Sargent 1972;Skillman & Kennicutt 1993; Kunth et al. 1994; Garnett et al.1997; Izotov & Thuan 1998). Observations of the neutral atomicmedium probed by far-ultraviolet (FUV) absorption lines to-ward the massive stars suggest that the H i region might beeven more metal poor (Kunth et al. 1994; Aloisi et al. 2003;Lecavelier des Etangs et al. 2004; Lebouteiller et al. 2013). Ac-cording to Lebouteiller et al. (2013), it is possible that as muchas 50% of the H0 mass in I Zw 18 is pristine. Blue compactdwarfs and in particular the well-studied galaxy I Zw 18, thusrepresent important probes of the thermal balance of the ISM inprimitive environments.
The main heating mechanism in the ionized gas of H ii re-gions of star-forming galaxies is photoionization2 of H, He, andsometimes He+. In I Zw 18, Stasinska & Schaerer (1999) pro-posed that the H ii regions may be heated by other energysources as well (shocks, conductive heating at the interface of anX-ray plasma), mainly owing to the supposedly too large elec-tron temperature observed (see also Kehrig et al. 2016). How-ever, Péquignot (2008, hereafter P08) later performed a de-tailed modeling of the I Zw 18-NW region using the code Nebu(Péquignot et al. 2001); these authors concluded that photoion-ization by hot stars could satisfactorily explain the entire opticalline spectrum, provided that the H ii region topology is equiva-lent to an incomplete radiation-bounded shell embedded in a dif-fuse low-density matter-bounded medium of filling factor unity.In essence, the lower density of the diffuse ionized gas leads toa smaller fraction of H0, which is a dominant cooling agent inlow-metallicity H ii regions, and therefore to a higher electrontemperature.
The heating of H i regions is comparatively much lessunderstood. While the main heating mechanism in the neu-tral ISM of our Galaxy is due to the photoelectric effect onpolycyclic aromatic hydrocarbons (PAHs) and dust grains (e.g.,Weingartner & Draine 2001b), both the low dust-to-gas mass ra-tio (D/G) and the low PAH abundance observed in BCDs (e.g.,Wu et al. 2006; Rémy-Ruyer et al. 2014) may lead to importantdifferences as compared to more metal-rich objects. P08 intro-duced in his model of I Zw 18-NW the heating of the H i regionby the soft X-ray source observed in this galaxy and was ableto account to order of magnitude for the low-ionization fine-structure lines then recently detected by Spitzer (in particular[Si ii] 34.8 µm and [Fe ii] 26.0 µm). P08 also made tentative1 We use the oxygen abundance obtained by Péquignot (2008) dividedby the solar value from Asplund et al. (2009).2 Outside the H ii regions, in the so-called warm diffuse ionizedmedium of disk galaxies, some extra heating exists in extremely low-density regions (e.g., Reynolds et al. 1999) and may be due, e.g., tophotoelectric effect on dust or dissipation of interstellar turbulence.
predictions for the far-infrared (FIR) lines [C ii] 157 µm and[O i] 63 µm, which are the most important coolants in the neutralatomic medium. According to the models, these lines are mainlyproduced in an H i region of moderate ionization and temper-ature, that is, in an X-ray dominated region (XDR), using theterminology introduced in the framework of the physics of ac-tive galactic nuclei (e.g., Tine et al. 1997). The study of P08implied that an X-ray source could provide an effective heatingmechanism in the neutral ISM of low-metallicity BCD galaxies,and therefore a possible alternative to the traditional photoelec-tric effect heating. Thanks to the Herschel Space Observatory(Pilbratt et al. 2010) and, in particular, the Photodetector ArrayCamera and Spectrometer (PACS; Poglitsch et al. 2010), it isnow possible to compare observations and models for [C ii] and[O i].
More recently, using Hubble/COS, Lebouteiller et al. (2013)observed I Zw 18-NW in the FUV absorption-lines C ii λ1334.5and C ii* λ1335.7, arising from the ground level and fine-structure level of C+, respectively, and observed against theFUV continuum provided by the UV-bright stars in the stel-lar cluster. The authors roughly estimated an electron fractionne/nH ∼ 0.1% and attempted to substantiate the assumption ofphotoelectric effect on dust and PAHs, but with mitigate success,which may be viewed retroactively as evidence in favor of X-rayheating in the H i region, as proposed by P08.
Here, building on the model of P08, the heating by pho-toelectric effect, X-rays, and by other processes is examined.Consequences may pertain to other metal-poor star-forminggalaxies, as there is growing evidence that ultraluminous X-raysources (ULXs; LX & 1039 erg s−1) are more numerous and moreluminous in low-metallicity galaxies (e.g., Kaaret et al. 2011;Kaaret & Feng 2013; Brorby et al. 2014, 2015; Basu-Zych et al.2016, and references therein). These ULXs are thought to beassociated with high-mass X-ray binaries (HMXBs), involv-ing either a stellar-mass or intermediate-mass black hole or,rather unexpectedly pulsating neutron stars (Bachetti et al. 2014;Fürst et al. 2016; Israel et al. 2016, 2017). The effects of X-raysare numerous, since they can photoevaporate small moleculesand PAHs (while heating larger grains), and at the same timepenetrate deep inside the H i region where they can ionizeatomic and molecular hydrogen. The most obvious hallmark ofX-ray photoionization of the ISM by luminous X-ray sourcesis the presence of highly ionized species such as He ii λ4686recombination radiation. This effect has first been observed byPakull & Angebault (1986) for the luminous black hole candi-date LMC X-1. In the case of the ULX Holmberg II X-1 thedetection of a X-ray ionized nebula has furthermore allowedan independent estimate of the total luminosity of the X-raysource from the He ii λ4686 emission (Pakull & Mirioni 2002).By modeling the observed ionization structure with Cloudy(Ferland et al. 1998) these observations imply a largely isotropicX-ray emission and largely exclude any significant beaming ofthe ULX into our line of sight.
Understanding the origin of [C ii] or [O i] in metal-poorgalaxies and the impact of X-rays is an important challenge notonly to constrain the neutral gas heating mechanism but alsoto evaluate the possible reservoir of molecular gas. The appar-ent lack of molecular gas in I Zw 18 (Vidal-Madjar et al. 2000;Wu et al. 2006; Leroy et al. 2007) is at variance with the presentvigorous starburst episode. While it is possible that the earlieststages of star formation occur in the cold atomic gas, with molec-ular gas forming only at the onset of the star-forming cloud col-lapse (e.g., Glover & Clark 2012; Krumholz 2012), a significantreservoir of molecular gas that is not traced by CO may still exist,
A45, page 2 of 38

V. Lebouteiller et al.: Neutral gas heating by X-rays in primitive galaxies: Infrared observations of I Zw 18 with Herschel
Table 1. Main I Zw 18 properties used in this study.
Parameter Value ReferenceCoordinates (J2000) 09h34m02.2s, +55d14m28.0sDistance 18.2 Mpc (1)M(H0) (main body) 108 M� (2,3)M(H0) (NW) ≈2 × 10⁷ M� (this study)M(H+) (NW) 3.4 × 10⁶ M� (4)M∗ 1−20 × 106 M� (5, 6)M∗ (NW) ∼3 × 10⁵ M� (7)Mdust
a 562+586−287 M�, 724+535
−308 M� (6)D/Gb 5+9.3
−1.7 × 10⁻⁴ (6)LFIR 2.88 ± 0.13 × 10⁷ L� (6)LUV 1.06 × 10⁸ L� (8)SFR ≈0.1 M� yr−1 (9)Abundances 12 + log(C/H) = 6.59 (4)
12 + log(N/H) = 5.57 (4)12 + log(O/H) = 7.22 (4)12 + log(Ne/H) = 6.41 (4)12 + log(Si/H) = 6.00 (4)12 + log(S/H) = 5.63 (4)12 + log(Fe/H) = 5.79 (4)12 + log(Ar/H) = 5.79 (4)
Notes. (a) The dust mass is given for two dust compositions(Galliano et al. 2011, “standard” and “AC”) with different emissivities(Rémy-Ruyer et al. 2015). (b) Dust-to-gas mass ratio.References. (1) Aloisi et al. (2006); see also Sect. 2.1; (2) Lelli et al.(2012); (3) van Zee et al. (1998); (4) Péquignot (2008); seealso Sect. 2.4; (5) Schneider et al. (2016); (6) Rémy-Ruyer et al.(2015); (7) Stasinska & Schaerer (1999); (8) Heckman et al. (1998);(9) Cannon et al. (2005); see also Sect. 2.3.
i.e., the so-called CO-dark gas (e.g., Tielens & Hollenbach 1985;Maloney & Black 1988; van Dishoeck & Black 1988; Grenier2005; Wolfire et al. 2010). The low dust abundance in metal-poor galaxies results in a smaller photodissociated CO corewhile H2 is self-shielded, resulting in a CO-free molecular gaslayer with abundant C+ and leading to an enhanced [C ii]/COratio for the global cloud emission (e.g., Poglitsch et al. 1996;Madden et al. 1997). I Zw 18 provides an opportunity to examinethe origin of [C ii] and its hypothetical association with molecu-lar gas.
A summary of relevant properties of I Zw 18 is provided inSect. 2. Observations are described in Sect. 3. A topologicallysignificant model of the NW region is then obtained using thephotoionization and photodissociation code Cloudy (Sects. 4, 5).Various models, which are shown to be relevant to the full ob-served IR emitting region, are explored in Sect. 6. The presenceof molecular gas and physical conditions in the diffuse gas areinvestigated in Sect. 7. Implications of X-ray heating of the H igas are examined in Sect. 8. Conclusions are found in Sect. 9.Details about Herschel, Spitzer, and X-ray data treatments areprovided in Appendices A, B, and C respectively.
2. Characteristics of I Zw 18
Some of the main characteristics of I Zw 18 are listed in Table 1.The most important properties are described in the following.Gas and dust masses are discussed separately in Sect. 5.
2.1. Distance
The distance to I Zw 18 has been the subject of much de-bate. Early determinations fell in the range 10−13 Mpc (Östlin2000; Izotov & Thuan 2004). The distance was then revisedto 18.2 Mpc when using the red giant branch tip (Aloisi et al.2006) and 19.0 Mpc using Cepheids (Fiorentino et al. 2010;Marconi et al. 2010). The distance used by P08 for modelingthe NW region was 13 Mpc although he briefly considered onemodel at 18.3 Mpc. A distance of 18.2 Mpc is adopted in ourmodels. An update to the P08 model using this distance is pre-sented in Sect. 4.2 for consistency and for comparison with thepresent study.
2.2. Constituents
Although I Zw 18 has been often considered to be a younggalaxy, possibly showing its first episode of star formation, sev-eral studies have identified an old (>1 Gyr) stellar population(e.g., Aloisi et al. 2006; Annibali et al. 2013). The current on-set of star formation could be due to the merging of dwarfs orsub-damped Lyman α systems, as suggested by the somewhatdisrupted H i morphology observed, for instance, by Lelli et al.(2012).
I Zw 18 contains a main body and a secondary body. Themain body contains two massive stellar clusters, NW and SE(Fig. 1), associated with giant H ii regions and surrounded byan irregular and filamentary halo of diffuse ionized gas (e.g.,Izotov et al. 2001). Although the secondary body is gravitation-ally bound to the galaxy (Petrosian et al. 1997; van Zee et al.1998), it is disconnected from the main body and contains starsthat are older on average (Contreras Ramos et al. 2011). BothNW and SE contain a young stellar population but NW has beenthe more active recently (Contreras Ramos et al. 2011).
For comparison, the diameter of I Zw 18, as observedat 21 cm (e.g., Lelli et al. 2012), is close to that of theLarge Magellanic Cloud, i.e., ≈7 kpc (e.g., Kim et al. 1998;Staveley-Smith et al. 2003), and the diameter of the NW H iiregion, (≈400 pc), is about twice that of the LMC-30 Dor region.
2.3. Star formation rate
Legrand et al. (2000) found that a low SFR (∼10−4 M� yr−1) overthe Hubble time could explain the metal enrichment of I Zw 18.The instantaneous SFR derived from Hα is 0.1−0.2 M� yr−1
(e.g., Dufour & Hester 1990; Petrosian et al. 1997; Cannon et al.2002, 2005). De Looze et al. (2014) calculated a similar SFR us-ing the combination of FUV and 24 µm, providing 0.06 M� yr−1.De Looze et al. (2014) also investigated the applicability of sev-eral FIR lines for tracing SFR and obtained ≈0.02 M� yr−1 usingpreliminary measurements of [C ii], [O i], and [O iii] with Her-schel/PACS. The radio continuum emission, which consists ofthe combination of thermal free-free emission and synchrotronradiation, provides yet another independent SFR estimate. InI Zw 18, the 1.4 GHz emission is dominated by synchrotron ra-diation (Cannon et al. 2005). Using L1.4 GHz = 8 × 10¹⁹ W Hz−1
(Hunt et al. 2005) and the SFR calibration from Bell (2003), weobtain 0.13 M� yr−1.
Annibali et al. (2013) examined color-magnitude diagrams(CMD) from deep Hubble/ACS images and found a larger valueof ≈1 M� yr−1 over the last 10 Myr in the most crowded re-gions (including NW). Part of the discrepancy could be ex-plained by somewhat different timescales probed by each tracer(∼100 Myr for the FUV vs. ∼10 Myr for Hα or CMD). Some
A45, page 3 of 38

A&A 602, A45 (2017)
03.0 02.0 01.0 9:34:00.0
40.0
35.0
55:1
4:30
.025
.020
.015
.0
Right ascension (J2000)
Dec
linat
ion
(J20
00)
"C"
SE
NW
1kpc
Fig. 1. H i column density contours from Lelli et al. (2012), with 2′′resolution (beam size in the bottom left). Contours are drawn for 3(dashed), 6, 9, 12, and 15 × 1021 cm−2. The largest red circle showsthe PACS beam at 157 µm ([C ii]) and the smallest red circle shows thebeam at 63 µm ([O i]). Both beams are centered at the emission centroidderived by the PACS optimal extraction method (Sect. 3.1.1). The greencross shows the location of the X-ray point source (Sect. 3.3). The back-ground image is HST/ACS F555W. The NW region coincides with anH i hole. The H i column density peak lies between NW and SE.
SFR determinations are sensitive to the escape of ionizing pho-tons from the galaxy, but, considering the large amount ofsurrounding neutral gas, it is unlikely that this could explainthe scatter of the different determinations. Various SFR valuesare considered to scale the cosmic ray (CR) ionization rate inSect. 6.4.
2.4. Chemical abundances
The H ii region abundances are adopted (Table 1). A disconti-nuity seems to exist between these values measured from opti-cal emission lines in the H ii regions and those determined fromFUV absorption lines in the diffuse H i region (Aloisi et al. 2003;Lecavelier des Etangs et al. 2004; Lebouteiller et al. 2013). Ac-cording to Lebouteiller et al. (2013), the oxygen abundancemay be slightly lower by 0.18 ± 0.16 dex (2σ error bar) inthe H i region. A greater discontinuity might exist for Cand Si, but absorption-line saturation prohibits a reliable esti-mate. The origin of this discontinuity, which is in fact muchlarger in BCDs that are more metal rich than I Zw 18 (seesummary in Lebouteiller et al. 2009), is subject to debate. Lo-cal self-enrichment of the H ii regions was initially proposedby Kunth & Sargent (1986), but contamination by metal-poorgas along the lines of sight was the favored explanation inLebouteiller et al. (2013). We use hereafter the H ii region abun-dances while keeping in mind that all abundances in the H i re-gion may be slightly lower.
The choice of using individual observed elemental abun-dances (as opposed to the solar abundance pattern scaled to themetallicity of I Zw 18) has some impact on the IR line ratio in-terpretation. The C/O abundance ratio in I Zw 18 is ≈2.5 timeslower than the solar ratio. In general, C/O tends to decrease with
decreasing metallicity in BCDs (e.g., Garnett et al. 1995), whichis consistent with enrichment by massive stars at low metallic-ity. It can also be noted that the Si/O abundance ratio in I Zw 18is about solar (in both the ionized gas and neutral gas, as dis-cussed in Lebouteiller et al. 2013), indicating that both elementsare produced in the same massive stars, that silicon is not sig-nificantly depleted on dust grains, and that [Si ii] may thereforebe an important gas coolant (see Sect. 5). Iron is not depleted ei-ther (P08). Thus, there is no sign of depletion on dust grains inI Zw 18, which is consistent with the low dust-to-metal ratio inthis galaxy (Rémy-Ruyer et al. 2015).
3. Observations
We present here observational data that were either not used orunavailable in P08, namely the dust mass and spectral energydistribution (SED), the [C ii] 157 µm, [O i] 63 µm, and [O iii]88 µm line fluxes from Herschel, the suite of Spitzer lines remea-sured, recent X-ray observations, and the H0 mass. A summaryof the observational constraints used in the models is providedin Sect. 5.
3.1. Herschel/PACS
3.1.1. Datasets
I Zw 18 was observed by Herschel as part of the Dwarf GalaxySurvey Key Program (DGS; Madden et al. 2013). Observationsare described in detail in Cormier et al. (2015), we describe inthe following specific information relevant to the observation ofI Zw 18. The PACS spectroscopy observations were performedin two steps. The [C ii] 157 µm line was observed first in May2011 (OBSID 1342220973) as part of the SHINING program (PIE. Sturm, KPGT_esturm_1) for 3.7 ks. The [O i] 63 µm (OBSID1342253757) and [O iii] 88 µm (OBSID 1342253758) lines werethen observed in October 2012 as part of the DGS (PI S. Madden,OT2_smadde01) for 13.8 ks and for 4.3 ks respectively. The in-put coordinates for the [C ii] observation were slightly differentthan the [O i] and [O iii] observations.
As explained in Cormier et al. (2015), the projection of thePACS array on the sky is a footprint of 5×5 spatial pixels (“spax-els”), corresponding to a ≈47′′ × 47′′ field of view. Each spaxelis ≈9.4′′ in size. A single footprint observation was performedsince I Zw 18 appears smaller than the footprint size. Accord-ing to the PACS Observer’s Manual3, the point spread function(PSF) full width at half maximum (FWHM) ranges from ≈9.5′′(≈0.8 kpc at the adopted distance of 18.2 Mpc) between 55 µmand 100 µm to about ≈14′′ at 200 µm (≈1.2 kpc). The spectralresolution is about 90, 125, and 240 km s−1 for [O i], [O iii], and[C ii] respectively.
The data reduction was performed in HIPE 12.0 (Ott et al.2010) using the default chop/nod pipeline script. The level 1product (calibrated in flux and in wavelength, with bad pix-els masks according to the HIPE reduction criteria) wasthen exported and processed by our in-house PACSman tool(Lebouteiller et al. 2012) for empirical error estimates and lineflux extraction.
Figure 2 shows the footprint and line detections. Each lineis well detected (>5σ) in at least one spaxel, and it is alwaysunresolved in velocity. The observed spectra and the line fits areshown in Appendix A.1. Another, independent, observation of
3 http://herschel.esac.esa.int/Docs/PACS/html/pacs_om.html
A45, page 4 of 38

V. Lebouteiller et al.: Neutral gas heating by X-rays in primitive galaxies: Infrared observations of I Zw 18 with Herschel
143.515 143.510 143.505 143.500 143.495RA J2000 (deg)
55.236
55.238
55.240
55.242
55.244
55.246
55.248
55.250D
EC
J20
00 (d
eg)
10.0
5.9
2.3
2.22
143.520 143.515 143.510 143.505 143.500 143.49RA J2000 (deg)
55.235
55.240
55.245
DE
C J
2000
(deg
)
2.6
5.9
2.3
143.520 143.515 143.510 143.505 143.500 143.49RA J2000 (deg)
55.235
55.240
55.245
DE
C J
2000
(deg
)
3.6
15.0
2.1
2.2
Fig. 2. Herschel/PACS map of [C ii] (top), [O i] (middle), and [O iii](bottom) emission in I Zw 18. The 25 spaxels of the PACS footprintare overplotted on the F555W HST/ACS image. The contours show theH i column density at 5′′ resolution (Lelli et al. 2012). For display pur-poses, only the fits are shown for each spaxel with detection level >2σ,and the number indicates the detection level in σ. The red circle showsthe beam size and the red cross shows the emission centroid as calcu-lated by the optimal extraction (Sect. 3.1.2). Individual spaxel spectraare presented in Appendix A.1.
the [O iii] line was performed as a small map, but with a lowerintegration time (see Appendix A.2), so we decided to use onlythe pointed observation described here.
3.1.2. Line fluxes and spatial distribution
The line profile in each spaxel is adjusted with a Gaussian com-ponent and a flat baseline (Appendix A.1). The line width isfixed, constrained by the spectral resolution of the instrument,in particular for the spaxels for which the line is not detected.
Although each line is well detected in at least one spaxel,the low signal-to-noise ratio (S/N) in spaxels corresponding tothe wings of the PSF together with the low spatial sampling ofthe PSF usually prevent an accurate determination of the emis-sion spatial centroid. More specifically, for all lines, most of thespaxels around the brightest spaxel have a detection level .3σ(Fig. 2), so it is difficult to pinpoint the peak position or thesource spatial shape with an accuracy smaller than the spaxelsize (≈9.4′′). The optimal extraction algorithm of PACSman wasused to obtain a more accurate estimate of the source centroid.The optimal extraction compares the spatial profile of the sourcewith that of the instrument PSF, accounting for the uncertaintiesin the line flux measurements in all spaxels (see Appendix A.1).We find that the emission is point-like for [C ii], [O i], and [O iii]with an intrinsic extent .6′′ (530 pc at the adopted distance of18.2 Mpc). We also find a remarkable agreement between thecentroids, despite the different map position angle and pointingcoordinates (Fig. 2). The centroid location and the compact ap-pearance both indicate that the line emission originates withinthe main body of I Zw 18. The [O i] and [O iii] observations, witha slightly higher spatial resolution than for [C ii], suggest that thecentroid is closer to NW than SE (Fig. 2). Overall, the low spa-tial resolution of PACS observations unfortunately prevents usfrom disentangling the emission of the NW and SE regions. Thefluxes we can derive therefore correspond to the global emission(implications for models are discussed in Sect. 5.6).
Cormier et al. (2015) provide flux determinations for allDGS objects, including I Zw 18, using various methods. We re-view these methods in the following and examine their applica-bility to the I Zw 18 observation in detail.
Method F1 scales the flux in the brightest spaxel by ap-plying a point-source correction (from 25% to 67% between50−220 µm). This method is valid for a point-like source exactlycentered in a spaxel. Any deviation from this hypothesis resultsin underestimating the flux determination. Method F1 providesthe best S/N since it uses only the brightest spaxel, but an ad-ditional systematic uncertainty exists because of the pointing is-sues and possible deviation from a point source.
The second method uses the footprint subarray of 3×3 spax-els centered on the brightest spaxel and adds the line fluxes eitherfrom all spaxels (F3×3) or only from spaxels with >3σ detec-tions (F′3×3). A point-source correction factor is also required,although it is much smaller (from 4% to 17% for the range50−220 µm) than for F1. The 3 × 3 methods are more reliablethan F1 when the source is not well centered in any spaxel, but itmay increase the error bar on the flux determination by includ-ing spaxels with a low S/N. The F′3×3 method uses an incompletesampling of the PSF and therefore results in a lower limit on theflux determination4.
Finally, method Fopt performs an optimal extraction by scal-ing the normalized instrument point-spread function. This is inprinciple the best method since it reaches a compromise between
4 Alternative methods consist of combining the spaxel spectra (either3 × 3 or 5 × 5) before performing the line fitting. However, possiblevariations of the baseline between spaxels and co-addition of spuriousfeatures may introduce systematic errors. In any case, the fluxes mea-sured this way, despite large systematic errors, are compatible with ourfinal values.
A45, page 5 of 38

A&A 602, A45 (2017)
Table 2. Herschel/PACS line flux determinations.
Method [C ii] 157 µm [O i] 63 µm [O iii] 88 µmFopt 97 ± 23 76 ± 20 248 ± 31F1 (>) 71 ± 7 (>) 69 ± 12 (>) 207 ± 14F3×3 108 ± 45 143 ± 82 267 ± 102F′3×3 (>) 81 ± 16 (>) 80 ± 21 (>) 217 ± 38Cormier et al. (2015)a 106 ± 8 115 ± 21 284 ± 34Final 97 ± 25 76 ± 25 248 ± 35
Notes. Fluxes are given in 10−19 W m−2. (a) Cormier et al. (2015) usedthe F3×3 method for all lines in I Zw 18.
S/N and the ability to recover the total flux from a source that isnot well centered in a spaxel. The flux calibration remains ac-curate as long as the source is point-like. Details on optimal ex-traction are given in Appendix A.1, where it can be seen that theemission in I Zw 18 appears point-like.
Table 2 lists the various flux determinations. We considerF1 to be a lower limit because the emission can never be per-fectly centered in any spaxel and we use Fopt for our final fluxes.Cormier et al. (2015) used the F3×3 method for I Zw 18 as partof the global and systematic DGS analysis and our revised mea-surements agree within errors (Table 2). For all lines, we verifiedthat the relatively large error bars of F3×3 encompass the Fopt de-termination. We discuss, in Sect. 5.1, how PACS fluxes are nor-malized for comparison with the other tracers used in this study.
3.2. Spitzer/IRS
We used archival data from the Infrared Spectrograph (IRS;Houck et al. 2004) on board the Spitzer Space Telescope(Werner et al. 2004) data to measure in a consistent way thesuite of lines originating mostly in the ionized gas (e.g.,[Ne ii] 12.8 µm and [Ne iii] 15.5 µm), but also [Si ii] 34.8 µm and[Fe ii], which partly originate from the neutral gas. For the low-resolution spectrum (SL and LL modules; R = λ/∆λ ∼ 57−126over ≈5−14 µm and ≈14−36.5 µm, respectively), the deepest ob-servation available was used (AORkey 16205568). For the high-resolution spectrum (SH and LH; R ∼ 600 over ≈10−19.5 µmand ≈20−36.5 µm respectively), AORkey 16205568 was usedtogether with 9008640 and 12622848, which are shallower butless affected by bad pixels in some spectral regions. These obser-vations were all performed in staring mode, in which the sourceis observed in two nod positions. The PSF FWHM ranges be-tween ≈2′′ at 5 µm to ≈11′′ at 38 µm.
The investigation of the spatial profiles of AORkey16205568 in the cross-dispersion direction (Figs. 3 and 4)shows that the source appears somewhat extended in SLand SH (about 6′′ FWHM). One can distinguish two com-ponents in the SL profile. One component is located at09h34m02.29s/+55◦14′27.52′′, coinciding with NW, with aprominent [S iv] line and relatively shallow continuum, whilethe other component is located at 09h34m02.31s/55◦14′22.67′′,coinciding with SE, with a much weaker [S iv] line and a rela-tively steeper continuum. The NW component is responsible for≈75% of the total [S iv] and ≈68% of the total H i recombinationline Huα 12.37 µm (see fluxes in Appendix B). These values arein good agreement with the Hβ fraction originating from NW,≈78% (Skillman & Kennicutt 1993). The NW component ap-pears extended in the SL module while the SE component ap-pears quasi-point-like (intrinsic broadening of ≈5′′ and ≈1′′, re-spectively). The NW and SE components are not distinguishable
Integrated emission over 8-14umNWSE
[SIV] emissionNWSE
Fig. 3. Cross-dispersion profiles along the SL slit of the Spitzer/IRSobservation 16205568. The histogram shows the emission as a func-tion of the spatial position along the slit, in pixel units (1 px = 1.8′′).The spatial profile is modeled by two slightly extended sources, one ofwhich corresponds to NW (blue, left) and the other to SE (red, right).The profile is shown for the entire integrated spectral order of moduleSL1 (∼8−14 µm; top) and for the [S iv] 10.5 µm line only (bottom). Leftcorresponds to north in Fig. 4.
in the LL and LH modules because of the relatively lower spatialresolution.
Line measurements are described in Appendix B, where acomparison is performed with Wu et al. (2007, hereafter W07).P08 already compared photoionization models to the W07 fluxesand found an overall good agreement. However, P08 noted thatthe [S iii] 33.5 µm flux measured by W07 is more than a fac-tor of 2 larger than predictions; based on a similar discrepancyfor the [Si ii] 34.8 µm line arising in the same IRS module as[S iii] 33.5 µm, P08 proposed that the fluxes of these two lineswere overestimated. We find new [S iii] 33.5 µm and [Si ii]fluxes that are lower by factors of 2.3 and 2.1, respectively, ascompared to W07, thereby confirming the hypothesis of P08.Our revised measurement of both [S iii] lines at 18.7 µm and33.5 µm confirms that the gas density in the ionized gas is wellbelow 1000 cm−3. Furthermore, the [S iv] flux predicted by P08is significantly larger than in W07. Our measured value confirmsthe low value of W07, hinting that the problem may be due to adoubtful S2+ di-electronic recombination coefficient (see P08 formore details).
The upper limit on the PAH emission was calculated usingthe deep low-resolution observation 16205568. We fitted the lat-ter spectrum with the model of Galliano et al. (2011). The PAHoptical properties are from Draine & Li (2007). Rather than fit-ting individual PAH emission bands, we have adjusted a tem-plate with two PAH components (neutral and ionized) with fixed
A45, page 6 of 38

V. Lebouteiller et al.: Neutral gas heating by X-rays in primitive galaxies: Infrared observations of I Zw 18 with Herschel
Fig. 4. Spatial positions of the two components seen in the IRS SL slit.The slit is shown with the white rectangle and the circles indicate thelocations of the sources shown in Fig. 3. The size of the circles cor-responds to the total FWHM of each source (i.e., including both theinstrument PSF and the intrinsic broadening). The background image isthe B band from the DSS2 survey.
properties. The upper limit on the PAH emission in the range6−15 µm is ≤1.9 × 10⁻¹⁷ W m−2 with little influence from theneutral/ionized PAH mixture. We review in Sect. 5.1 the ex-tracted line fluxes from Spitzer and Herschel and how they areused as constraints for the models.
3.3. X-ray observations
Following P08, X-rays are to be considered a promising heatingmechanism in the H i region of I Zw 18. We describe here thevarious X-ray measurements, and in particular the most recentobservation by XMM-Newton.
I Zw 18 was observed with ROSAT with two instruments,first with PSPC (Position Sensitive Proportional Counters) in1992 and then with the High Resolution Imager (HRI) in 1997.Fourniol et al. (1996) reported the PSPC detection of an un-resolved source and calculated an unabsorbed X-ray luminos-ity of LX = 6.2+2.3
−4.9 × 1039 erg s−1 between 0.1−2.4 keV. Martin(1996) independently examined the same observation, calculat-ing a lower limit of LX & 1 × 1039 erg s−1 with only Galacticabsorption considered. The higher spatial resolution enabled bythe subsequent HRI observations led Bomans & Weis (2002) toconclude to the existence of both a point source located in NWand a diffuse component.
I Zw 18 was later observed with Chandra in 2000 and X-rayMulti-Mirror Mission (XMM-Newton) in 2002. The Chandra ob-servation, first reported in Bomans & Weis (2002), was analyzedin detail by Thuan et al. (2004). As noted by Thuan et al. (2004),the X-ray emission from I Zw 18 is dominated by a single pointsource associated with the NW region5 (see position in Fig. 1).
5 Ott et al. (2005) reported a different position, located at the edge ofthe Hα nebula, somewhat offset from the NW stellar cluster. While thecoordinates of the X-ray source reported in their Table 6 does in factcoincide with the NW cluster, their interpretation seems to rely on in-correct astrometry of HST images.
The point-source luminosity is 3×1039 erg s−1 in the 0.5−10 keVrange (value renormalized to a distance of 18.2 Mpc). Faint dif-fuse emission was also detected but contributed to at most 4% ofthe point-source flux.
Kaaret & Feng (2013) analyzed the XMM-Newton obser-vation and found a larger flux, 1.4 × 1040 erg s−1, as com-pared to the Chandra observation. Based on this increased flux,Kaaret & Feng (2013) suggested that the X-ray point sourceemission is likely dominated by a single X-ray binary, as alreadyproposed by Thuan et al. (2004). The X-ray source in I Zw 18 islocated precisely within the NW cluster, according to the relativeposition with several quasars in the XMM-Newton images, whosepositions are known with high accuracy (Pakull et al., in prep.;Fig. 1).
Diffuse X-ray emission might be present, possibly associ-ated with a supernova (SN) cavity between the NW and SE re-gions (Thuan et al. 2004). The luminosity of the extended X-raycomponent measured by Thuan et al. (2004) is about 1038 erg s−1
(value renormalized to a distance of 18.2 Mpc). Although theirstudies are based on the same Chandra data, Ott et al. (2005)and Kaaret et al. (2011) both argue against the presence of de-tectable diffuse X-ray emission. In the following, only the X-raypoint source is considered. The use of the X-ray observation asa constraint to our models is discussed in Sect. 5.3.
3.4. Photometry
Photometry data is used in our study to examine the pre-dicted SED from the models, in particular in the IR range.We use the photometry data measurements from radio to IR(with 2MASS, Spitzer/IRAC, WISE, Herschel/PACS, and Her-schel/SPIRE) compiled in Rémy-Ruyer et al. (2015). Figure 5shows the Spitzer and Herschel dust emission maps. The mea-sured photometry corresponds to the main body emission, andthe NW and SE regions cannot be disentangled. Optical to FUVmeasurements (within a 20′′ aperture), taken from the NEDarchival data, are only used for illustrative purposes.
3.5. H I observations
While P08 explored the H i region heating in I Zw 18, theH0 mass was not explicitly considered. The H0 mass, no-tably responsible for the [C ii] emission, provides an impor-tant constraint to our models (Sect. 5.5). Here the interferometricH i 21 cm observations of Lelli et al. (2012) are adopted.
4. Model description
Our objective is to build a photoionization model for the incom-plete H ii+H i region shell of I Zw 18-NW that takes into accountnew observational constraints presented in Sect. 3. In the follow-ing we describe the model components (Sect. 4.1) and presentthe Nebu and Cloudy models (Sect. 4.2).
4.1. Model topology
In the description of I Zw 18-NW by P08, the primary radiationsources are (1) the central young star cluster (responsible for theH ii region shell) and (2) the point-like X-ray source (responsi-ble for a partially ionized warm H i region beyond the ionizationfront of the H ii region), resulting in a relatively simple geometrywith a central UV+X source. The geometry is open, with ≈65%of the ionizing photons actually escaping the NW region through
A45, page 7 of 38
A&A 602, A45 (2017)
Herschel/PACS160um
Herschel/PACS70umSpitzer/MIPS24um
Herschel/PACS100um
Spitzer/IRAC8um
01.001.59:34:02.002.503.0
18.0
22.0
26.0
55:1
4:3
0.0
34.0HST/ACS/F555W
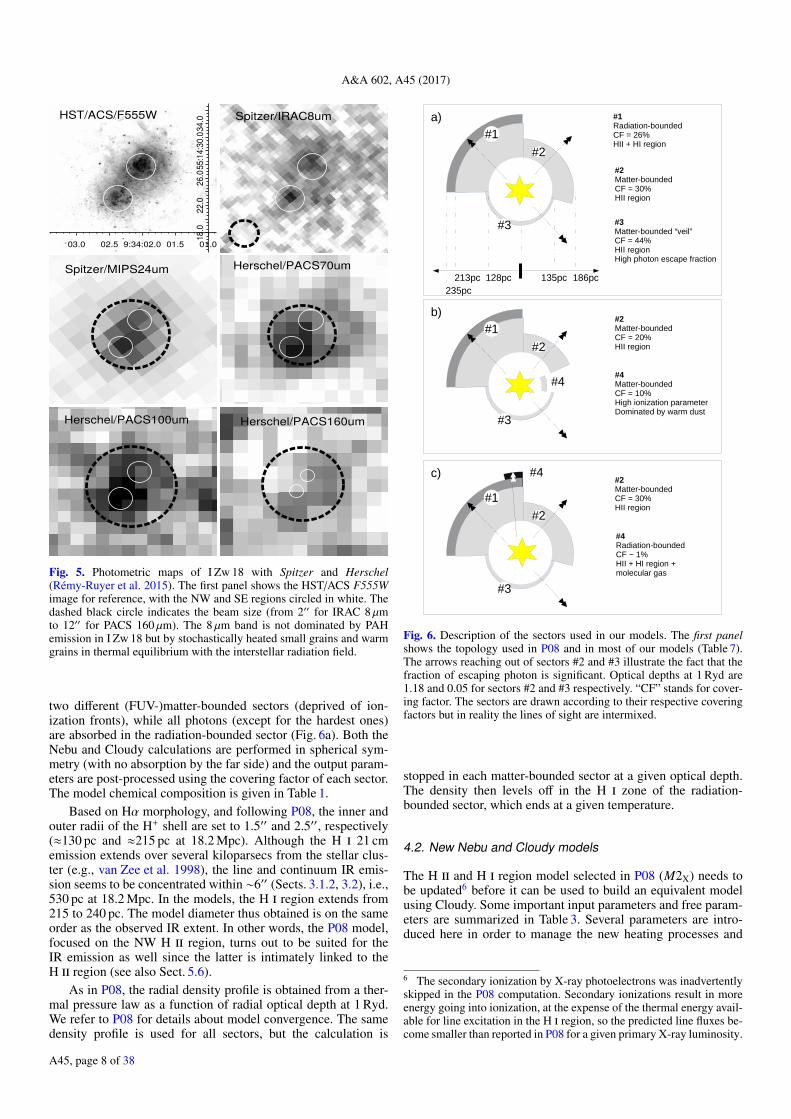
Fig. 5. Photometric maps of I Zw 18 with Spitzer and Herschel(Rémy-Ruyer et al. 2015). The first panel shows the HST/ACS F555Wimage for reference, with the NW and SE regions circled in white. Thedashed black circle indicates the beam size (from 2′′ for IRAC 8 µmto 12′′ for PACS 160 µm). The 8 µm band is not dominated by PAHemission in I Zw 18 but by stochastically heated small grains and warmgrains in thermal equilibrium with the interstellar radiation field.
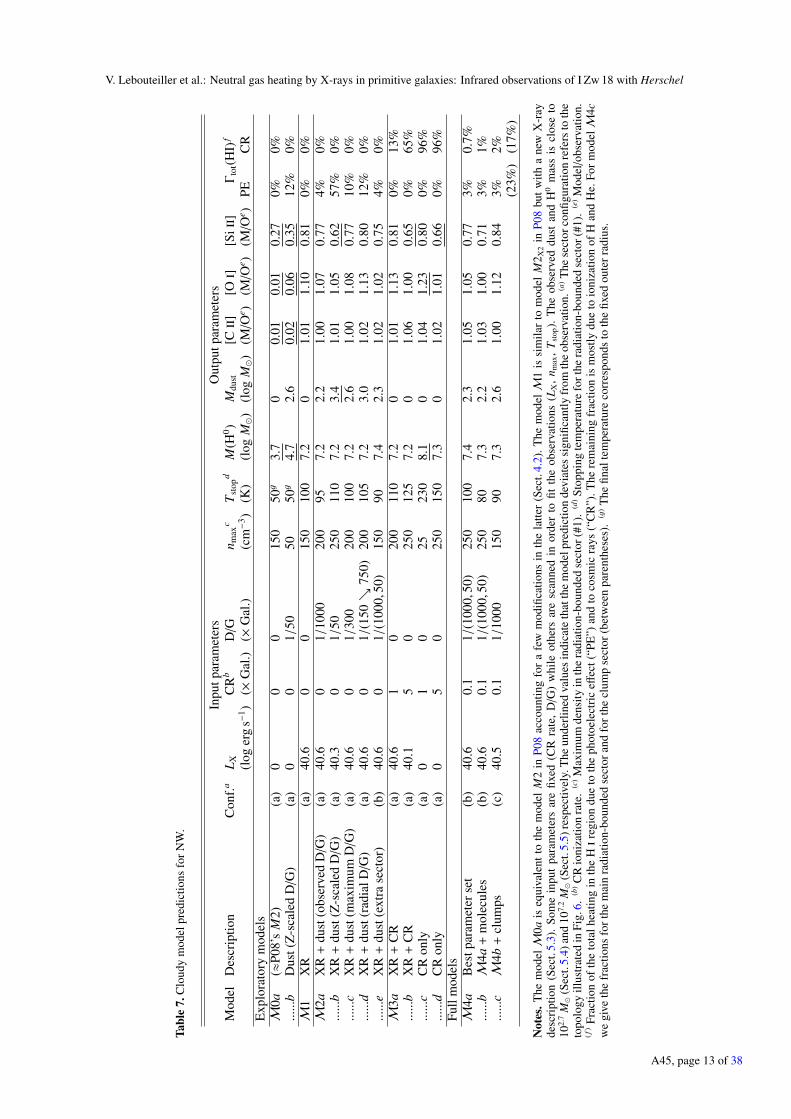
two different (FUV-)matter-bounded sectors (deprived of ion-ization fronts), while all photons (except for the hardest ones)are absorbed in the radiation-bounded sector (Fig. 6a). Both theNebu and Cloudy calculations are performed in spherical sym-metry (with no absorption by the far side) and the output param-eters are post-processed using the covering factor of each sector.The model chemical composition is given in Table 1.
Based on Hα morphology, and following P08, the inner andouter radii of the H+ shell are set to 1.5′′ and 2.5′′, respectively(≈130 pc and ≈215 pc at 18.2 Mpc). Although the H i 21 cmemission extends over several kiloparsecs from the stellar clus-ter (e.g., van Zee et al. 1998), the line and continuum IR emis-sion seems to be concentrated within ∼6′′ (Sects. 3.1.2, 3.2), i.e.,530 pc at 18.2 Mpc. In the models, the H i region extends from215 to 240 pc. The model diameter thus obtained is on the sameorder as the observed IR extent. In other words, the P08 model,focused on the NW H ii region, turns out to be suited for theIR emission as well since the latter is intimately linked to theH ii region (see also Sect. 5.6).
As in P08, the radial density profile is obtained from a ther-mal pressure law as a function of radial optical depth at 1 Ryd.We refer to P08 for details about model convergence. The samedensity profile is used for all sectors, but the calculation is
#1Radiation-boundedCF = 26%HII + HI region
#2Matter-boundedCF = 30%HII region
#3Matter-bounded “veil”CF = 44%HII regionHigh photon escape fraction
128pc213pc 186pc
#1
#2
#3
a)
135pc235pc
#2Matter-boundedCF = 20%HII region
#1
#2
#3
b)
#4Matter-boundedCF = 10%High ionization parameterDominated by warm dust
#4
#1
#2
#3
c)
#4Radiation-boundedCF ~ 1%HII + HI region + molecular gas
#4#2Matter-boundedCF = 30%HII region
Fig. 6. Description of the sectors used in our models. The first panelshows the topology used in P08 and in most of our models (Table 7).The arrows reaching out of sectors #2 and #3 illustrate the fact that thefraction of escaping photon is significant. Optical depths at 1 Ryd are1.18 and 0.05 for sectors #2 and #3 respectively. “CF” stands for cover-ing factor. The sectors are drawn according to their respective coveringfactors but in reality the lines of sight are intermixed.
stopped in each matter-bounded sector at a given optical depth.The density then levels off in the H i zone of the radiation-bounded sector, which ends at a given temperature.
4.2. New Nebu and Cloudy models
The H ii and H i region model selected in P08 (M2X) needs tobe updated6 before it can be used to build an equivalent modelusing Cloudy. Some important input parameters and free param-eters are summarized in Table 3. Several parameters are intro-duced here in order to manage the new heating processes and
6 The secondary ionization by X-ray photoelectrons was inadvertentlyskipped in the P08 computation. Secondary ionizations result in moreenergy going into ionization, at the expense of the thermal energy avail-able for line excitation in the H i region, so the predicted line fluxes be-come smaller than reported in P08 for a given primary X-ray luminosity.
A45, page 8 of 38

V. Lebouteiller et al.: Neutral gas heating by X-rays in primitive galaxies: Infrared observations of I Zw 18 with Herschel
Table 3. Model summary and updates from P08.
Parameter Value/commentTopologyNumber of sectors Fixed (3 to 5)Covering factors Fixed, except for dense clump sectorInner radius Fixed (130 pc)Ionization front Fixed (220 pc)Physical conditionsDensity Pressure law, maximum value freeStopping temperature Minimum value free(outer radius of H i region) (maximum value free)Radiation fieldBlackbody Fixed (log L = 41.58, T = 4 × 10⁴ K)Blackbodya Fixed (log L = 41.58, T = 8 × 10⁴ K)X-rays diskbb spectrum, luminosity freeOptical-UV Added in present study (Fig. 7)CR Several ionization rate values testedChemical compositionMetal abundances Fixed (see Table 1)
He/H = 0.085 (updated from P08)D/G Several values tested
Notes. (a) Scaled down for energies ≥4 Ryd to mimic the discontinuityobserved in model stars (see P08 for details).
diagnostics, which are studied by means of Cloudy (Sects. 6, 7).We use Cloudy version c13.037 (Ferland et al. 2013).
The distance is now 18.2 Mpc instead of 13 Mpc with theprimary luminosity and initial/final H ii region radii increasedaccordingly. The helium abundance by number is now He/H =0.085 (instead of 0.080), as in one trial calculation of P08.
Owing to the larger distance, the radial density profile, nH(r),must be updated. After convergence, the new parameters in ex-pression (1) of P08 are as follows: Pin = 2.8, Pout = 24 (in/k/105 CGS), and τc = 4.2. The nH(r) obtained from Nebu isnumerically introduced step by step in the Cloudy computation.
As in P08, the FUV radiation field is described as the sum oftwo blackbodies of similar power, with temperatures 4 × 10⁴ Kand 8× 10⁴ K, respectively. Unlike in P08, a realistic stellar con-tinuum is implemented below 1 Ryd. Optical and UV photonscontribute to the photoelectric heating on dust grains and to thephotoionization of several neutral species (C0, Si0...), thereby in-fluencing chemistry processes. The optical+UV continuum pre-scription used by Lebouteiller et al. (2013) is adopted. The radi-ation fields used in P08 and in the present study are compared inFig. 7.
Although the usual signatures of Wolf-Rayet (WR) starsare relatively discrete in I Zw 18-NW (e.g., Brown et al. 2002;Kehrig et al. 2015), P08 considered that the observed nebularHe ii recombination emission was essentially due to hot stars. Itis now admitted that many low-metallicity massive stars couldevolve into either very hot WR stars with weak winds (e.g.,Crowther & Hadfield 2006) or else into chemically homoge-neous transparent wind ultraviolet intense stars (“TWUIN stars”;Szécsi et al. 2015); these are both almost undetectable in the op-tical, but emit a plethora of radiation above 4 Ryd. Nonetheless,no star cluster synthetic model could pretend to predict the FUVcontinuum of I Zw 18-NW around 4 Ryd with any certainty, inparticular the amplitude of the discontinuity expected at 4 Ryd.
7 The default atomic data of Cloudy version c13.03 are used exceptin that Abrahamsson et al. (2007), also used in P08, is preferred toLaunay & Roueff (1977) for the critical collisional excitation O0(3P) +H0(2S ). The more recent rate is many times larger than the old rate.
0.01 0.10 1.00 10.00 100.00 1000.00Energy [eV]
10-6
10-5
10-4
10-3
10-2
10-1
100
Continuum
[x10
41 e
rg s
-1 e
V-1]
Fig. 7. Blue curves show the input radiation field used in P08, comprisedof three blackbodies with temperature 4 × 10⁴, 8 × 10⁴, and 2 × 10⁶ K.The dashed curve is for LX = 4 × 1039 erg s−1 (P08 model M2X) andthe solid curve is for LX = 8 × 1039 erg s−1 (P08 model M2X2). Thered curves show the radiation field used in this study, with additionalUV-optical contribution (from Lebouteiller et al. 2013) and with an im-proved X-ray spectrum prescription as compared to P08. The dashedcurve is for LX = 1.4 × 1040 erg s−1 (luminosity inferred from observa-tions) and the solid curve is for LX = 4 × 1040 erg s−1 (adopted stan-dard). The black diamonds show the unfolded XMM-Newton spectrum(see Sect. 5.3 for more details).
In the P08 and present photoionization models, the low-energytail of the assumed X-ray source spectrum (Appendix C) con-tributes somewhat to He ii, and the discontinuity at 4 Ryd is em-pirically adjusted so that He ii is exactly fitted8. P08 providesan acceptable H ii region model that is useful to our H i regionmodels, but the adopted FUV continuum may not be unique. Theimportant point to emphasize here is that the assumed 1−6 RydFUV continuum has strictly no impact on the properties of thepresent H i region modeling.
Instead of the coarse representation of the intrinsic X-rayemission as a single blackbody at 2×10⁶ K (P08), we take advan-tage of satisfactory fits to the observed XMM-Newton data, ob-tained by Kaaret & Feng (2013), who assumed either Kerr blackhole, cutoff power-law, or diskbb (distribution of blackbod-ies from an accretion disk) models. Here we adopt the diskbbmodel spectrum (see Fig. 7 and Sect. 5.3).
In order to check the computations, we have compared theNebu and Cloudy results in similar conditions, that is onlywith heating by UV and X-ray photoionization (no dust andno CR). Overall most significant line fluxes agree to better ormuch better than 15% (Table 4). This agreement between theCloudy and Nebu model results is impressive, especially as theCloudy computation was not performed in fully self-consistentconditions. Comparison between photoionization codes in stan-dard conditions most often reveals larger discrepancies (e.g.,Péquignot et al. 2001). This success may be partly explained bythe fact that, due to the very low metallicity and high ionizationin the I Zw 18 NW H ii region shell, the energy balance, domi-nated by H and He, is much simplified and the physical condi-tions approach the theoretical limit allowed for H ii regions.
8 Fitting He ii and a number of other nebular lines is a prerequisite toany model of the H ii region (see P08).
A45, page 9 of 38

A&A 602, A45 (2017)
Table 4. Comparison between observed extinction-corrected opticaland UV line fluxes and models.
Line Obs. Nebua M0a M4aH i 4861 Å 1000 1000 1000 1000H i 6563 Å 2860 2841 2858 2854He i 4471 Å 21.4 36.6 36.9 35.2He i 6678 Å 25.3 27.0 28.1 26.7He i 7065 Å 24.4 23.9 22.4 21.8He ii 4686 Å 36.8 36.8 38.8 35.6[N ii] 6548+84 Å 9.2 9.2 7.8 7.3[O i] 6300+63 Å 8.5 8.6 9.9 9.0[O ii] 3726+9 Å 238 236.8 207 203[O ii] 7320+30 Å 6.3: 6.6 5.7 5.4[O iii] 4363 Å 65.9 66.0 65.6 66.3[O iii] 5007+4959 Å 2683 2679.4 2691 2653[Ne iii] 3869 Å+968 Å 191 191.2 224 219.9[S ii] 6716 Å 22.5 18.9 20.7 19.0[S ii] 6731 Å 16.9 14.0 15.5 14.4[S ii] 6716/6731 1.33 1.35 1.33 1.32[S iii] 6312 Å 6.7 6.4 7.6 7.2[S iii] 9069+532 Å 114 113 129.4 122[Ar iii] 7136+751 Å 23.5 23.4 20 18.6[Ar iv] 4740 Å 4.5 7.2 9.5 9.5[Fe iii] 4658 Å 4.5 4.5 4.8 4.5[Fe iii] 4986 Å 7.4 6.7 ... ...
C iii] 1909+07 Å 467 465 430 411Si iii] 1882 Å 164: 207 225 209C iv 1549 Å 512: 393. 413 ...log L(Hβ) (erg s−1) 39.43 39.43 39.36 39.43
Notes. Fluxes are scaled with Hβ = 1000. Observed values for theoptical lines are from Izotov & Thuan (1999), Skillman & Kennicutt(1993), and P08. Kehrig et al. (2015) provide a new integrated He iiflux, but the observed He ii intensity to be modeled, based on an aver-age of the relatively stable He ii/Hβ intensity ratio measured in differentslit spectra of I Zw 18-NW, is not changed. (a) See Sect. 4.2.
5. Summary of the observational constraints
The main observational constraints considered in this study arethe optical and IR emission lines arising in the ionized gas, theIR lines [C ii], [O i], and [Si ii] arising in the H i region, andthe H0 mass. The dust mass, dust SED, and X-ray luminosity arealso used, but they are as well input parameters of the modelsand are left some freedom for different reasons explained in thissection. The suitability of these constraints to the NW model isalso discussed.
5.1. Homogenization of infrared and optical line fluxes
Optical and IR line fluxes are used to constrain the physical con-ditions of both the H ii and H i region in a consistent manner. TheHerschel and Spitzer line fluxes (Sects. 3.1.2, 3.2) first need to benormalized9 to be compared to the optical tracers. All fluxes arescaled to Hβ = 1000.
9 We do not refer to the normalization of fluxes due to a possible con-tamination by regions outside NW (Sect. 5.6) but to the normalizationbetween observations with different apertures.
Table 5. Factors to normalize fluxes in W m−2 to Hβ = 1000.
Observation Reference tracer(s) Factor
Herschel [O iii] 88 µm, aperture corrected Hβ ≈1.25 × 10⁻¹⁹
Spitzer...SL Huα 12.37 µm, [Ne ii] 12.8 µm ∼1 × 10⁻¹⁹
...SH [Ne iii] 15.6 µm ≈1.3 × 10⁻¹⁹
...LL [Ne iii] 15.6 µm, [S iii] 18.7 µm ≈1.5 × 10⁻¹⁹
...LH [S iii] 18.7 µm ≈1.2 × 10⁻¹⁹
For the normalization of Herschel/PACS measurements, wecalculate the total deredenned Hβ flux in the PACS footprintfrom the Hα map (de Paz et al. 2003), assuming Hα/Hβ = 2.8and E(B−V) = 0.09 (Schlegel et al. 1998; Schlafly & Finkbeiner2011). We find F(Hβ) ≈ 11.5× 10⁻¹⁷ W m−2, implying a scalingfactor of ≈1.15 × 10⁻¹⁹, which is the factor by which the PACSfluxes should be divided by to normalize to Hβ = 1000.
Since we consider the P08 predictions for the H ii regionlines as robust, another, independent and informative, estimateof the PACS scaling factor is provided by the ratio between theobserved and predicted ionized gas tracer [O iii] 88 µm. We find≈1.2× 10⁻¹⁹, i.e., in good agreement with the geometrical factorderived directly from the Hα observation. The same normaliza-tion is used in our study for all PACS tracers [O iii], [C ii], and[O i], with a factor 1.2 × 10⁻¹⁹ (Table 5).
The Spitzer/IRS fluxes measured in each module do notstrictly correspond to the emission within the correspondingapertures, as a fraction of the source emission is lost outsidethe aperture owing to the PSF size. For this reason, we cannotsimply use the Hα fraction falling inside the IRS apertures. Forpoint sources, the aperture correction is accounted for by the reg-ular IRS flux calibration. In the case of I Zw 18, the emission issomewhat extended, requiring a specific extraction method to re-cover the total flux (Sect. 3.2). With this method, we expect thatour Spitzer/IRS fluxes correspond to the total emission from themain body.
Similar to the scaling for PACS data, we can also test refer-ence ionized gas tracers in the IRS range to estimate the requirednormalization by comparing the observed flux to the H ii regionmodel predictions from P08. Results are shown in Table 5 whereit can be seen that the scaling factors for all modules agree wellwith each other, implying that the total flux was recovered in thesmall apertures of the IRS10. The IRS scaling factors also agreewell with those derived for PACS, implying that, as expected, theIRS line fluxes are well recovered by our extraction method.
The final normalized fluxes are provided in Table 6. Thepresent study focuses on the H i region and does not aim toimprove the H ii region model. Our adopted fluxes for the IRionized gas tracers are close to those used in P08 and we use thesame optical line fluxes as in P08. While our models are adaptedto the NW region, we bear in mind that some of the tracers maybe contaminated by the SE region (see discussion in Sect. 5.6).
10 The present absolute flux values are globally larger than those inW07, and the scaling factor reduces the fluxes to levels correspondingapproximately to the P08 normalization. P08 did not want to consider allof the Hβ emission, but that arising from the main NW shell. However,P08 calibrated the different instruments, using Hα fluxes from compara-ble regions (not necessarily the region he wanted to model). In the sameway, P08 derived 65% of ionizing photons escaping from the NW shell.
A45, page 10 of 38

V. Lebouteiller et al.: Neutral gas heating by X-rays in primitive galaxies: Infrared observations of I Zw 18 with Herschel
Table 6. Infrared line fluxes scaled to Hβ = 1000.
Normalized AdoptedHerschel[C ii] 157 µm 76 ± 20 76 ± 20[O i] 63 µm 60 ± 20 60 ± 20[O iii] 88 µm 198 ± 30 200 ± 30Spitzer SL/LL SH/LHH i Huα 12.37 µm 8.5 ± 3 <7.5 8.5 ± 3[O iv] 25.9 µm 40 ± 10 37.5 ± 8 38 ± 8
(+[Fe ii] 26.0 µm)[Ne ii] 12.8 µm 6 ± 3 ∼6 6 ± 3[Ne iii] 15.5 µm 48 ± 10 46 ± 7.5 47 ± 10[Ne iii] 36.0 µm <7 <21 <7[Ne v] 14.3 µm <7 <2.3 <2.3[Ne v] 24.3 µm <7 <4 <4[Si ii] 34.8 µm 63 ± 13 67 ± 25 65 ± 12[S iii] 18.7 µm 27 ± 7 29 ± 8 28 ± 7[S iii] 33.5 µm 37 ± 7 42 ± 8 40 ± 7[S iv] 10.5 µm 43 ± 5 53.8 ± 15.4 50 ± 10[Ar ii] 7.0 µm <5 ... <5[Ar iii] 9.0 µm <10 ... <10[Ar iii] 21.8 µm <10 <8 <8[Fe ii] 17.9 µm <7 <3 <3[Fe ii] 26.0 µm 40 ± 10 12.5 ± 8: 13 ± 8:
(+[O iv] 25.9 µm)[Fe iii] 23.0 µm <10 <6 <6H2 S(0) 28.2 µm <7 <8 <7H2 S(1) 17.0 µm <7 <7.5 <7H2 S(2) 12.29 µm ... <7.5 <7.5
Notes. [O iv] 25.9 µm and [Fe ii] 26.0 µm are blended in the Spitzerlow-resolution modules.
5.2. H I region cooling lines
The maximum density in the H i region, the outer radius (orelse the minimum temperature) at which the model calculationis stopped, and the X-ray source parameters can be constrainedto some extent by the [C ii], [O i], [Si ii], and [Fe ii] fluxesmeasured in this study (Sect. 6.1). We expect these lines to beoptically thin in I Zw 18 based on the low [O i] 145 µm/63 µmratio found in other DGS sources (Cormier et al. 2015).
The [C ii] 157 µm and [O i] 63 µm lines are the dominantcoolants in the neutral ISM as long as the metallicity is abovesome critical value (&10−3.5 Z�; e.g., Santoro & Shull 2006). The[Si ii] 34.8 µm line has attracted relatively less attention, partlybecause its wavelength falls at the edge of the Spitzer/IRS cover-age and also because most of the silicon is usually depleted ontodust grains. In low-metallicity environments, however, depletionis weaker and [Si ii] (and to a lesser extent [Fe ii]) is an impor-tant coolant. Given the lack of depletion in I Zw 18 (Sect. 2.4),we expect [Si ii] to be an important constraint to the models;[Fe ii] is observationally and theoretically less reliable.
5.3. X-ray intrinsic spectrum
X-rays are a fundamental ingredient in the models, but the X-rayluminosity and spectrum shape as derived from observationsmay not correspond directly to the radiation absorbed in theH i region. The fact that the Spitzer observations (December2005) and Herschel observations (May 2011 and October 2012)do not coincide in time with the X-ray observations (Sect. 3.3)
is of little consequence since the light travel timescale across theshell is of order 103 yr. More importantly, however, the modelsindicate that typical cooling timescales in the temperature range100−300 K are ∼104 yr and ∼105 yr for densities 500 cm−3 and100 cm−3, respectively. Then, the X-ray spectrum we are consid-ering in the models is nothing but an average over at least several104 yr, which may readily differ from the present observations.
Moreover, the observed X-ray spectrum is itself subject tocaution. There is observational evidence that the X-ray fluxmay vary considerably over a few years in I Zw 18 (Sect. 3.3;Kaaret & Feng 2013), which is compatible with state transitionsin HMXBs between a low-luminosity hard spectrum state and ahigher luminosity state with varying hardness. Such state tran-sitions seem to have been observed in I Zw 18 (Kaaret & Feng2013) and another BCD (VII Zw 403; Brorby et al. 2015).
The X-ray spectrum shape seen by the gas also bearssome uncertainty, in particular for the soft X-rays that are ab-sorbed in the H i region. Because of the degeneracy inducedby this absorption, whose value is not accurately known alongthe X-ray source line of sight, the observed soft X-ray spec-trum is poorly constrained (see Appendix C). Nonetheless, high-ionization lines such as [Ne v], with the help of detailed pho-toionization models, can considerably reduce the uncertainty onthe intrinsic soft X-ray flux (Appendix C).
Despite these uncertainties, and ignoring possiblestrongly anisotropic X-ray emission (Pakull & Mirioni 2002;Kaaret et al. 2004; see however Bachetti 2016; King et al. 2001;Körding et al. 2002), it is relatively safe to assume that, withina factor of a few, the presently observed X-ray luminosity,1.4 × 1040 erg s−1, should represent the (average) luminosityseen by the H i region in I Zw 18. In order to appraise thegenerality of the conclusions, combinations of blackbodiesthat are compatible with the X-ray observations are consideredtogether with the diskbb spectrum (see Appendix C).
5.4. Dust mass
There is evidence that, globally, the D/G in I Zw 18 ismuch lower than the value assuming a simple scaling withmetallicity (Galliano et al. 2008; Herrera-Camus et al. 2012;Rémy-Ruyer et al. 2014; Fisher et al. 2014; Rémy-Ruyer et al.2015). The dust mass derived by Rémy-Ruyer et al. (2015) forthe entire galaxy is robust and used here for reference. The au-thors derived two values assuming the carbon-rich dust com-ponent is described either by graphite or amorphous carbon.To remain consistent with the dust prescription in Cloudy, weuse the dust mass derived with the “standard” dust composi-tion of Galliano et al. (2011), where the carbon component ismade of graphite, i.e., 724+535
−308 M�. To put this value in perspec-tive, the giant H ii region LMC-N 11, despite a smaller physicalsize (≈150−200 pc) as compared to the I Zw 18 NW region, har-bors ∼3 × 10⁴ M� of dust (Gordon et al. 2014). The total gasmass in the main body is 108 M� (Lelli et al. 2012), leading toD/G ≈ 1/1000 D/GMW, where D/GMW is the Milky Way value11.
The global D/G value must be regarded with caution. On theone hand, the dust emission may be associated with only a frac-tion of the main body gas mass. On the other hand, there is evi-dence that the extended H i in I Zw 18 may contain as much massas the main body (Lelli et al. 2012), in which case the global D/Gmay be driven to even lower values if the extended H i is dust-free. Based on the non-detections of CO (e.g., Leroy et al. 2007),
11 D/GMW is 1/148, close to the values in Zubko et al. (2004), 1/158,and Jones et al. (2013), 1/156.
A45, page 11 of 38

A&A 602, A45 (2017)
the mass of H2 is ignored, and we keep in mind that D/G couldbe even lower if a significant fraction of gas exists as a CO-darkmolecular gas. In our models we test several values for D/G.Apart from the dust mass, the dust SED shape is a qualitativeconstraint to our models.
5.5. H0 mass
The H0 mass in the main body of I Zw 18 is ≈108 M�, whichincludes the H i located in NW and in the high H i column den-sity cloud between NW and SE (Lelli et al. 2012). Our observa-tions show that the [C ii] and [O i] emission is compatible witha compact source within the main body (Sect. 3.1.2), so that thecorresponding H0 mass should be less than 108 M�.
We use the 2′′ resolution H i map from Lelli et al. (2012) toestimate the H0 mass associated with either the NW region it-self (defined as a ≈430 pc diameter region centered on the NWstellar cluster) or with the slightly different region observed withIR tracers (Sects. 3 and 5.6). For the NW region, the H i columndensity lies between 3−6 × 1021 cm−2, which translates into amass 5 × 10⁶ M�. If we now consider instead the H0 mass as-sociated with the H i column density peak between NW and SE(Lelli et al. 2012), we find a larger mass, ≈2 × 10⁷ M�. In thefollowing we consider that H0 masses around ≈0.5−2 × 10⁷ M�are acceptable.
5.6. Applicability of the tracers to the NW region
The models are built for the NW H ii region of I Zw 18 and itssurroundings. Owing to limited spatial resolution of IR observa-tions, some degree of contamination by SE (gas and dust emis-sion) and more diffuse regions is unavoidable. Nevertheless, ourapproach can be justified on both observational and theoreticalgrounds:
– The emission in all IR gas tracers is compact with a sizesimilar to the NW region (.6′′; Sect. 3.1.2). The centroid for[O i] and [O iii] seems to be located closer to NW, possiblycoinciding with a dust-rich ionized gas shell located betweenNW and SE (labeled NW-D3 in Cannon et al. 2002), near theH i peak column density.
– The convergence to a solution produces a kind of an averagemodel because the (normalized) IR observations are ratherglobal. Nonetheless, since the NW nebular emission is threetimes stronger than the corresponding SE emission at mostwavelengths (e.g., Hβ, Huα, and [S iv]; Sect. 3.2) and giventhe location of the X-ray source within NW, it can be safelysurmised that the model more closely reflects (average) prop-erties of the NW region.
– The ionization structure and metallicity do not varymuch between NW and SE (Legrand et al. 2000;Skillman & Kennicutt 1993; Kehrig et al. 2016). Sinceour line measurements are normalized to Hβ, this means thatline constraints should not be significantly affected by SE.
– All H i regions will be subject to the X-ray radiation, whetherthey are associated with the NW or SE giant H ii regions.Since the ionization state is stable in the H i gas, the fine-structure line emissivity depends essentially on local tem-perature, which is controlled by the local flux of X-rays.Geometrical details have little consequence.
– The H i gas can only exist where the ionizing photons fromthe star cluster are exhausted, that is beyond an H ii region.Diffuse Hβ emission exists out of the main H ii regions of
I Zw 18 and may be associated with diffuse [C ii] and [O i]emission. Trial calculations show that the ratio of strong linesfrom the H ii region, such as Hβ and [O iii] 5007 Å, to [C ii]and [O i] lines is a slow function of assumed parameters(density and distance to the source) over a large range ofconditions. This further suggests that the NW shell model isrepresentative of the more global emission (see also end ofSect. 7.2).
We conclude that, in practice, IR gas tracers can be safely as-sumed to arise in NW. A possible contamination by regionsoutside of NW (SE or diffuse) would not significantly alter ourresults. The H0 mass, on the other hand was calculated specifi-cally for NW, or more precisely for the IR-emitting region thatappears to coincide with NW (Sect. 5.5). Finally, the dust massinferred from observations is the total dust mass of the galaxy(Sect. 5.4), so we keep in mind that the dust mass computed inthe NW model can be smaller than the observed value. SeveralD/G values are explored in the models.
In summary, we consider that the observational constraintspresented here can be applied to the NW model. The specificcontamination of SE on the dust SED and dust mass is discussedfurther in Sect. 6.3.2.
6. H II + H I region modeling
6.1. Modeling strategy
Armed with a satisfactory Cloudy model equivalent to the Nebumodels (Sect. 4) and with new or updated observational con-straints (Sect. 5), our strategy consists in exploring several pa-rameters to evaluate their importance in the H i gas heat-ing. Free parameters for the gas are the maximum density andthe minimum temperature assumed in the radiation-boundedsector (Table 3). The other free parameters examined are theX-ray luminosity (Sect. 6.2), the photoelectric effect throughD/G (Sect. 6.3), and the CR ionization rate (Sect. 6.4). Other pro-cesses such as mechanical heating are not considered.
For each set of free parameters, we monitor the predic-tions for the main observational constraints, namely the [C ii],[O i], and [Si ii] line fluxes but also the dust mass and H0
mass (Sect. 5.5). In most cases, the minimum temperature inthe radiation-bounded sector is constrained by the observed[C ii] flux, while the maximum density is constrained by the[O i]/[C ii] ratio. In short, given the X-ray source, a larger maxi-mum density implies a smaller H0 mass and smaller line fluxes,where [C ii] and [O i] are more sensitive to change than [Si ii]and [Fe ii]. A smaller minimum temperature implies a larger H0
mass and stronger [C ii] and moderately stronger [O i] lines.Increasing the X-ray luminosity and thus the H i zone temper-ature, all IR line intensities are increased; [Si ii] and [Fe ii] areselectively enhanced, while smaller H0 masses (larger minimumtemperature) are required.
Relevant properties of our models are shown in Table 7.Since the combination of maximum density and depth (hencetemperature) is constrained by the observed [C ii] and [O i]fluxes, the models are expected, by design, to reproduce bothlines. This is not the case, however, for models with no X-rays(M0a and M0b, without and with dust, respectively), whichseverely underestimate the line fluxes and the H0 mass. The[Si ii] flux is comparatively better reproduced in these modelssince the line is partly emitted in the H ii region. The reasonswhy the H i region line fluxes are underestimated are twofold,(1) the UV luminosity provided by the central cluster is not able
A45, page 12 of 38
V. Lebouteiller et al.: Neutral gas heating by X-rays in primitive galaxies: Infrared observations of I Zw 18 with Herschel
Tabl
e7.
Clo
udy
mod
elpr
edic
tions
forN
W.
Inpu
tpar
amet
ers
Out
putp
aram
eter
sM
odel
Des
crip
tion
Con
f.aL X
CR
bD
/Gn m
axc
T sto
pdM
(H0 )
Mdu
st[Cii
][Oi]
[Siii]
Γto
t(HI)
f
(log
erg
s−1 )
(×G
al.)
(×G
al.)
(cm−
3 )(K
)(l
ogM�)
(log
M�)
(M/O
e )(M
/Oe )
(M/O
e )PE
CR
Exp
lora
tory
mod
els
M0a
(≈P0
8’s
M2)
(a)
00
015
050
g3.
70
0.01
0.01
0.27
0%0%
......
bD
ust(
Z-s
cale
dD
/G)
(a)
00
1/50
5050
g4.
72.
60.
020.
060.
3512
%0%
M1
XR
(a)
40.6
00
150
100
7.2
01.
011.
100.
810%
0%M
2aX
R+
dust
(obs
erve
dD
/G)
(a)
40.6
01/
1000
200
957.
22.
21.
001.
070.
774%
0%......
bX
R+
dust
(Z-s
cale
dD
/G)
(a)
40.3
01/
5025
011
07.
23.
41.
011.
050.
6257
%0%
......
cX
R+
dust
(max
imum
D/G
)(a
)40.6
01/
300
200
100
7.2
2.6
1.00
1.08
0.77
10%
0%......
dX
R+
dust
(rad
ialD
/G)
(a)
40.6
01/
(150↘
750)
200
105
7.2
3.0
1.02
1.13
0.80
12%
0%......
eX
R+
dust
(ext
rase
ctor
)(b
)40.6
01/
(100
0,50
)15
090
7.4
2.3
1.02
1.02
0.75
4%0%
M3a
XR
+C
R(a
)40.6
10
200
110
7.2
01.
011.
130.
810%
13%
......
bX
R+
CR
(a)
40.1
50
250
125
7.2
01.
061.
000.
650%
65%
......
cC
Ron
ly(a
)0
10
2523
08.
10
1.04
1.23
0.80
0%96
%......
dC
Ron
ly(a
)0
50
250
150
7.3
01.
021.
010.
660%
96%
Full
mod
els
M4a
Bes
tpar
amet
erse
t(b
)40.6
0.1
1/(1
000,
50)
250
100
7.4
2.3
1.05
1.05
0.77
3%0.
7%......
bM
4a+
mol
ecul
es(b
)40.6
0.1
1/(1
000,
50)
250
807.
32.
21.
031.
000.
713%
1%......
cM
4b+
clum
ps(c
)40.5
0.1
1/10
0015
090
7.3
2.6
1.00
1.12
0.84
3%2%
(23%
)(1
7%)
Not
es.T
hem
odelM
0ais
equi
vale
ntto
the
mod
elM
2in
P08
acco
untin
gfo
ra
few
mod
ifica
tions
inth
ela
tter
(Sec
t.4.
2).T
hem
odelM
1is
sim
ilar
tom
odel
M2 X
2in
P08
butw
itha
new
X-r
ayde
scri
ptio
n(S
ect.
5.3)
.So
me
inpu
tpa
ram
eter
sar
efix
ed(C
Rra
te,
D/G
)w
hile
othe
rsar
esc
anne
din
orde
rto
fitth
eob
serv
atio
ns(L
X,
n max
,T
stop
).T
heob
serv
eddu
stan
dH
0m
ass
iscl
ose
to10
2.7
M�
(Sec
t.5.
4)an
d10
7.2
M�
(Sec
t.5.
5)re
spec
tivel
y.T
heun
derl
ined
valu
esin
dica
teth
atth
em
odel
pred
ictio
nde
viat
essi
gnifi
cant
lyfr
omth
eob
serv
atio
n.(a
)T
hese
ctor
confi
gura
tion
refe
rsto
the
topo
logy
illus
trat
edin
Fig.
6.(b
)C
Rio
niza
tion
rate
.(c
)M
axim
umde
nsity
inth
era
diat
ion-
boun
ded
sect
or(#
1).
(d)St
oppi
ngte
mpe
ratu
refo
rthe
radi
atio
n-bo
unde
dse
ctor
(#1)
.(e
)M
odel
/obs
erva
tion.
(f)
Frac
tion
ofth
eto
talh
eatin
gin
the
Hi
regi
ondu
eto
the
phot
oele
ctri
ceff
ect(
“PE
”)an
dto
cosm
icra
ys(“
CR
”).T
here
mai
ning
frac
tion
ism
ostly
due
toio
niza
tion
ofH
and
He.
Form
odelM
4cw
egi
veth
efr
actio
nsfo
rthe
mai
nra
diat
ion-
boun
ded
sect
oran
dfo
rthe
clum
pse
ctor
(bet
wee
npa
rent
hese
s).
(g)
The
final
tem
pera
ture
corr
espo
nds
toth
efix
edou
terr
adiu
s.
A45, page 13 of 38

A&A 602, A45 (2017)
to heat a large enough H0 mass, even with a large D/G; and (2)we have only considered the OB stellar cluster as the heatingsource.
All other models include the X-ray source. In order to isolatethe effect of each process, we explore models with no dust andno CR (M1), with dust but no CR (M2), and with CR but no dust(M3). The objective is not to find the best combination but to testthe impact of each parameter. The full model (M4) is the onlyone that combines all physical processes. For each model wetest different values of D/G and the CR rate, and for each set ofvalues we allow the X-ray luminosity to vary. We then examinethe output quantities to compare to observations, namely [C ii],[O i], [Si ii], the dust mass and SED shape, and the H0 mass. Wemonitor the relative importance of the different heating processesfor each satisfactory model.
6.2. Exploratory modelM1: X-ray heating
As originally proposed by P08, the heating provided by XR pho-toionization is a natural explanation to the H i region line emis-sion. The intrinsic X-ray spectrum used in our models is de-scribed in Sect. 4.1 (see also Appendix C).
Figure 8 shows the suite of models with only the X-ray heat-ing considered. The predicted [O i]/[C ii] line ratio increaseswith increasing X-ray luminosity and with increasing tempera-ture. Both effects are due to the fact that [O i] dominates thecooling at the inner edge of the H i region while [C ii] domi-nates inside. The predicted [Si ii] emission tends to be somewhatweaker than the observed one. Improving [Si ii] using a larger LXis at the expense of [O i], which becomes too large. In addition toobservational uncertainties, this moderate discrepancy may sug-gest that either the adopted Si abundance was underestimated or[O i] is affected by self absorption.
The model that reproduces the observations (line emissionand H0 mass) best is labeledM1. As expected, the [C ii], [O i]63 µm, and [Si ii] transitions are the strongest coolants, followedby [O i] 145 µm and [Fe ii], in the H i region. The required X-rayluminosity is 4×1040 erg s−1, which is three times larger than theobserved luminosity. According to the analysis of Sect. 5.3, sucha difference is acceptable.
In summary, model M1 shows that X-ray heating alone isalready sufficient to explain the FIR line emission, through a rea-sonable alteration of the observed X-ray spectrum. Inasmuch asX-ray heating dominates in the H i gas, the H i region coolinglines provide a reliable average of the average soft X-ray lumi-nosity over the last few 104 yr in I Zw 18. We now explore mod-els involving alternative heating mechanisms.
6.3. Exploratory modelsM2: photoelectric effect heating
In this section we examine the photoelectric effect on dust grainsand PAH molecules in addition to the X-ray heating. The objec-tives are to reproduce qualitatively the observed dust SED shape,obtain a reasonable dust mass, and quantify the photoelectricheating rate. Since the observed dust properties correspond tothe entire galaxy (Sect. 5.4), models that overestimate the dustmass or the dust SED are not deemed acceptable.
For lack of an accurate description of the dust propertiesin I Zw 18 (or in any other extremely metal-poor environment),we use the Small Magellanic Cloud opacity files in Cloudy thatare based on the size distribution given in Weingartner & Draine(2001a). Our results concerning the gas line emission are barelychanged if we use grain properties reflecting the size distribution
40.0 40.2 40.4 40.6 40.8
0.0
0.5
1.0
1.5
2.0
40.0 40.2 40.4 40.6 40.8
0.0
0.5
1.0
1.5
2.0
LX
1.0 1.5 2.0 2.5 3.0
0.0
0.5
1.0
1.5
2.0
1.0 1.5 2.0 2.5 3.0
0.0
0.5
1.0
1.5
2.0
nmax
40 60 80 100 120 140 160
0.0
0.5
1.0
1.5
2.0
40 60 80 100 120 140 160
0.0
0.5
1.0
1.5
2.0
Tmin
6.5 7.0 7.5 8.0
0.0
0.5
1.0
1.5
2.0
6.5 7.0 7.5 8.0
0.0
0.5
1.0
1.5
2.0
M(HI)
X-ray heating only
1.5 2.0 2.5 3.0 3.5 4.0
0.0
0.5
1.0
1.5
2.0
1.5 2.0 2.5 3.0 3.5 4.0
0.0
0.5
1.0
1.5
2.0
M(dust)
[CII] [OI] [SiII]
Fig. 8. Exploration of models with X-ray heating only (no dust and noCR). The predicted line fluxes (model/observation) are plotted againsteach model parameter with from top to bottom, the dust mass andH0 mass (log M�), minimum temperature (K) and maximum density(log cm−3) in the radiation-bounded sector, and the X-ray luminosity(log L�). Each point represents a model, and the symbol size is inverselyproportional to the residuals between model predictions and observa-tions for [C ii], [O i], and [Si ii]. The light gray zone corresponds tothe observed values and their associated error bar. The dark gray zonecorresponds to the best models.
in the diffuse ISM of the Milky Way. Considering the lack of evi-dence for elemental depletion on dust grains and the low dust-to-metal ratio in I Zw 18 (Sect. 2.4), the gas-phase abundances arethe same for all models. We test several choices for D/G and wecalculate a grid with varying X-ray luminosity for each choice.
6.3.1. Uniform D/G (M2a,M2b,M2c)
First, a uniform D/G value is assumed across the galaxy. ModelM2a uses a global D/G of 1/1000 D/GMW, corresponding to theobserved value as constrained by Herschel (Sect. 5.4). ModelM2b uses 1/50 D/GMW, corresponding to the metallicity scal-ing. Figure 9 shows the results for both models.
As shown in Table 7, the solution for modelM2a is almostthe same as that of model with only X-ray heating (M1), which
A45, page 14 of 38

V. Lebouteiller et al.: Neutral gas heating by X-rays in primitive galaxies: Infrared observations of I Zw 18 with Herschel
40.0 40.2 40.4 40.6 40.8
0.0
0.5
1.0
1.5
2.0
40.0 40.2 40.4 40.6 40.8
0.0
0.5
1.0
1.5
2.0
LX
1.0 1.5 2.0 2.5 3.0
0.0
0.5
1.0
1.5
2.0
1.0 1.5 2.0 2.5 3.0
0.0
0.5
1.0
1.5
2.0
nmax
40 60 80 100 120 140 160
0.0
0.5
1.0
1.5
2.0
40 60 80 100 120 140 160
0.0
0.5
1.0
1.5
2.0
Tmin
6.5 7.0 7.5 8.0
0.0
0.5
1.0
1.5
2.0
6.5 7.0 7.5 8.0
0.0
0.5
1.0
1.5
2.0
M(HI)
X-rays + observed D/G
1.5 2.0 2.5 3.0 3.5 4.0
0.0
0.5
1.0
1.5
2.0
1.5 2.0 2.5 3.0 3.5 4.0
0.0
0.5
1.0
1.5
2.0
M(dust)
[CII] [OI] [SiII]
40.0 40.2 40.4 40.6 40.8
0.0
0.5
1.0
1.5
2.0
40.0 40.2 40.4 40.6 40.8
0.0
0.5
1.0
1.5
2.0
LX
1.0 1.5 2.0 2.5 3.0
0.0
0.5
1.0
1.5
2.0
1.0 1.5 2.0 2.5 3.0
0.0
0.5
1.0
1.5
2.0
nmax
40 60 80 100 120 140 160
0.0
0.5
1.0
1.5
2.0
40 60 80 100 120 140 160
0.0
0.5
1.0
1.5
2.0
Tmin
6.5 7.0 7.5 8.0
0.0
0.5
1.0
1.5
2.0
6.5 7.0 7.5 8.0
0.0
0.5
1.0
1.5
2.0
M(HI)
X-rays + Z-scaled D/G
1.5 2.0 2.5 3.0 3.5 4.0
0.0
0.5
1.0
1.5
2.0
1.5 2.0 2.5 3.0 3.5 4.0
0.0
0.5
1.0
1.5
2.0
M(dust)
[CII] [OI] [SiII]
Fig. 9. Models with X-ray and photoelectric effect heating for D/G observed (left) or scaled with metallicity (right). See Fig. 8 for the plotdescription.
is due to the fact that the photoelectric heating rate is muchsmaller than the soft X-ray ionization heating rate (Fig. 10). Thephotoelectric effect represent only ≈4% of the total heating inthe H i region in model M2a (Table 7), as compared to 58%and 30% for ionization by soft X-rays of He0 and H0, respec-tively. The dust SED is, however, very underestimated (Fig. 10)and the dust mass somewhat underestimated too. This can be atleast partly ascribed to the fact that we model the NW regionwhile the observed dust SED and dust mass correspond to theentire galaxy (Sect. 5.4).
On the other hand, modelM2b provides relatively more pho-toelectric effect heating (57% of the total heating across the H iregion; Table 7), which results in a lower required X-ray lumi-nosity as compared to modelM2a. Nevertheless, the dust massand dust SED are now significantly overestimated (Fig. 10) and[Si ii] is not as well reproduced as in modelM2a.
The photometry data at 100 µm and the upper limit at 160 µmprovide an upper limit on the uniform D/G. We find that,with the current topology, a radiation-bounded cloud necessar-ily produces too much dust emission if the D/G is larger than1/300 D/GMW (model M2c; Table 7). The corresponding dustmass is in relatively good agreement with what observations sug-gest, but the SED is not well reproduced shortward of 100 µm(Fig. 11), which could be due to a missing dust component (notcontributing significantly to the dust mass). ModelM2c has sim-ilar physical conditions in the H i region (density, temperature)
as model M2a and the heating fraction contributed for by thephotoelectric effect is only 10%.
In summary, the H i region cooling lines can be reproduced inmodels with X-rays together with a wide range of uniform D/Gvalue, but the photoelectric effect is never a significant heatingmechanism in the H i region. Heating by soft X-rays dominateand the required X-ray luminosity is only twice as low whenD/G increases from 1/1000 D/GMW to 1/50 D/GMW. Still, whilea large D/G ratio does increase the photoelectric heating to sig-nificant amounts, the dust SED becomes overestimated if theD/G is larger than 1/300 D/GMW. In any case, there is no so-lution that reproduces well the entire dust SED under a uniformD/G assumption. This leaves us with three possibilities: mod-ify the grain size distribution, modify the topology of the model(e.g., inclusions of dust-rich ionized gas with a relatively largeionization parameter), or keep the topology unchanged but mod-ify the D/G spatial distribution. We investigate in Sect. 6.3.2 onlythe latter two possibilities because of the lack of constraints onthe grain size distribution in such an extreme environment asI Zw 18.
6.3.2. Non-uniform D/G (M2d,M2e)
In Sect. 6.3.1 we assumed that the D/G was uniform acrossthe galaxy. The measurement of Rémy-Ruyer et al. (2014) onlyprovides an average D/G. One way to reproduce the observed
A45, page 15 of 38

A&A 602, A45 (2017)
0.0
0.2
0.4
0.6
0.8
1.0
Λ (
con
trib
utio
ns)
[FeII][SiII] 35um[CII][OI] 63um
10-24
10-23
Γ,
nΛ
[e
rg s
-1 c
m-3]
M2a
0.0
0.2
0.4
0.6
0.8
1.0
Γ (
con
trib
utio
ns)
Phot. eff.Charge trans.Ion(H0)Ion(He0)
200 210 220 230 240 250Radius [pc]
37.0
37.5
38.0
38.5
39.0
39.5
Cu
mu
lativ
e in
ten
sitie
s [e
rg s
-1]
[SiII][OI] 63um[CII]
0.0
0.2
0.4
0.6
0.8
1.0
Λ (
con
trib
utio
ns)
[FeII][SiII] 35um[CII][OI] 63um
10-24
10-23
Γ,
nΛ
[e
rg s
-1 c
m-3]
M2b
0.0
0.2
0.4
0.6
0.8
1.0
Γ (
con
trib
utio
ns)
Charge trans.Ion(H0)Ion(He0)Phot. eff.
200 210 220 230 240 250Radius [pc]
37.0
37.5
38.0
38.5
39.0
39.5C
um
ula
tive
inte
nsi
ties
[erg
s-1]
[SiII][OI] 63um[CII]
10-4 10-2 100 102 104
Wavelength [um]
102
103
104
105
106
107
108
109
ν L
ν [L
sol]
10-4 10-2 100 102 104
102
103
104
105
106
107
108
109
M2a
10-4 10-2 100 102 104
Wavelength [um]
102
103
104
105
106
107
108
109
ν L
ν [L
sol]
10-4 10-2 100 102 104
102
103
104
105
106
107
108
109
M2b
Fig. 10. Model results forM2a (D/G observed, left) andM2b (D/G scaled with metallicity, right). The plots on top show, from top to bottom, thetotal heating and cooling rate, the contributions to the heating rate, the contributions to the cooling rate, and the cumulative intensities of coolinglines for the radiation-bounded sector as a function of the depth within the cloud (the H ii-H i transition lies at ≈213 pc). For clarity, the heatingand cooling mechanisms in the H ii region are not shown. The predicted dust SED is shown in the bottom panels for both models. The 20 cmmeasurement is thought to be dominated by synchrotron emission (see text). The vertical lines indicate the range used to calculate the total infraredluminosity (3−1100 µm) and the green shaded area shows the modeled emission in this range. The blue shaded area shows the input radiation field.The modelM2b shows weak silicate emission bands at 10 µm and 20 µm that are not seen in the IRS spectrum.
dust SED could be to keep the topology unchanged whilst mod-ifying the D/G along some lines of sight. For instance, the dustSED assuming a radially decreasing D/G (M2d) agrees betterwith the observations than models with uniform D/G (Fig. 11).The photoelectric effect in modelM2d represents only ≈12% ofthe H i heating (Table 7). Even then, modelM2d still somewhatoverestimates the cold dust emission and therefore the total dustmass.
Another way to reproduce the observed SED is to alter themodel topology. While in principle one could simply change thetopology assuming a uniform D/G, in practice no satisfactory
solution is found. We modify model M2a (1/1000 D/GMW)to include an extra sector with 1/50 D/GMW and with a rela-tively small covering factor (M2e). The extra sector can rep-resent hypothetical dust-rich inclusions within the H ii region.Cannon et al. (2002) found that several dust-rich regions werelocated between the SE and NW regions and also close toionizing sources in the SE region (finding based on variations ofthe observed Hα/Hβ ratio, even though part of these variationsmay be ascribed to collisional excitation of H0 in the H ii re-gion; see P08 for more details). A close look at the Spitzer andHerschel photometry maps reveals that dust emission peaks in
A45, page 16 of 38
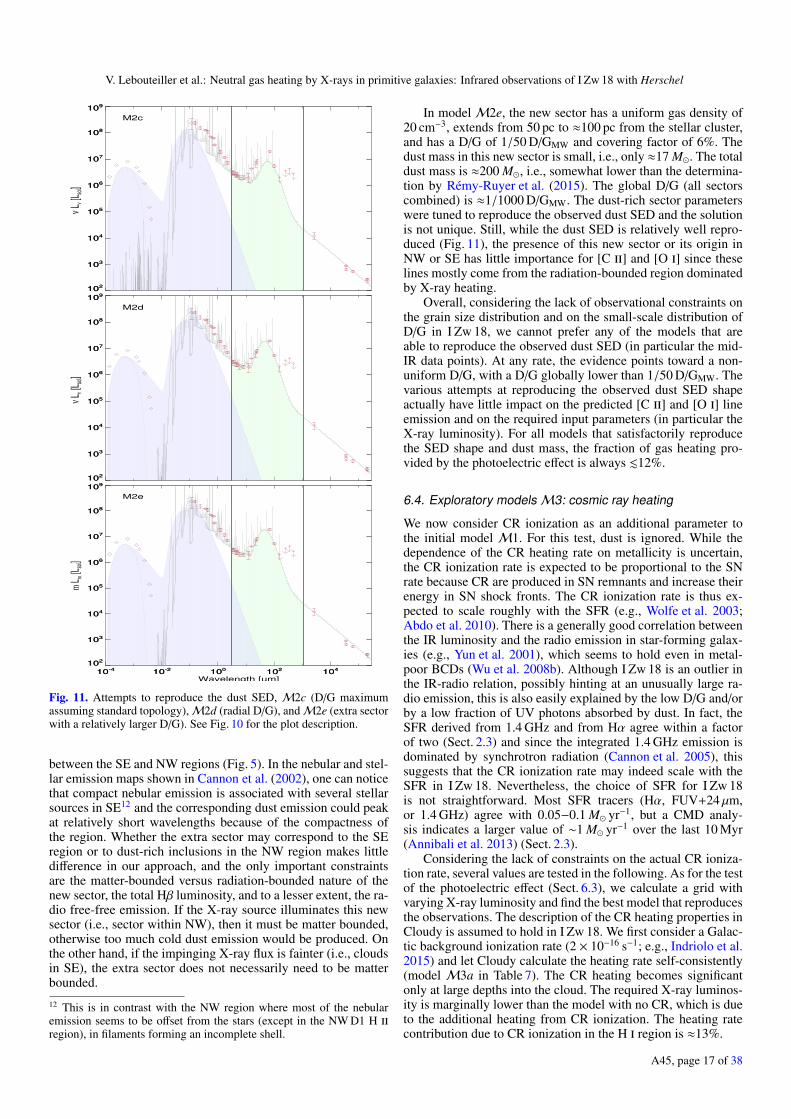
V. Lebouteiller et al.: Neutral gas heating by X-rays in primitive galaxies: Infrared observations of I Zw 18 with Herschel
10-4 10-2 100 102 104
Wavelength [um]
102
103
104
105
106
107
108
109
ν L
ν [L
sol]
10-4 10-2 100 102 104
102
103
104
105
106
107
108
109
M2c
10-4 10-2 100 102 104
Wavelength [um]
102
103
104
105
106
107
108
109
ν L
ν [L
sol]
10-4 10-2 100 102 104
102
103
104
105
106
107
108
109
M2d
10-4 10-2 100 102 104
Wavelength [um]
102
103
104
105
106
107
108
109
m L
m [L
sol]
10-4 10-2 100 102 104
102
103
104
105
106
107
108
109
M2e
Fig. 11. Attempts to reproduce the dust SED, M2c (D/G maximumassuming standard topology),M2d (radial D/G), andM2e (extra sectorwith a relatively larger D/G). See Fig. 10 for the plot description.
between the SE and NW regions (Fig. 5). In the nebular and stel-lar emission maps shown in Cannon et al. (2002), one can noticethat compact nebular emission is associated with several stellarsources in SE12 and the corresponding dust emission could peakat relatively short wavelengths because of the compactness ofthe region. Whether the extra sector may correspond to the SEregion or to dust-rich inclusions in the NW region makes littledifference in our approach, and the only important constraintsare the matter-bounded versus radiation-bounded nature of thenew sector, the total Hβ luminosity, and to a lesser extent, the ra-dio free-free emission. If the X-ray source illuminates this newsector (i.e., sector within NW), then it must be matter bounded,otherwise too much cold dust emission would be produced. Onthe other hand, if the impinging X-ray flux is fainter (i.e., cloudsin SE), the extra sector does not necessarily need to be matterbounded.
12 This is in contrast with the NW region where most of the nebularemission seems to be offset from the stars (except in the NW D1 H iiregion), in filaments forming an incomplete shell.
In modelM2e, the new sector has a uniform gas density of20 cm−3, extends from 50 pc to ≈100 pc from the stellar cluster,and has a D/G of 1/50 D/GMW and covering factor of 6%. Thedust mass in this new sector is small, i.e., only ≈17 M�. The totaldust mass is ≈200 M�, i.e., somewhat lower than the determina-tion by Rémy-Ruyer et al. (2015). The global D/G (all sectorscombined) is ≈1/1000 D/GMW. The dust-rich sector parameterswere tuned to reproduce the observed dust SED and the solutionis not unique. Still, while the dust SED is relatively well repro-duced (Fig. 11), the presence of this new sector or its origin inNW or SE has little importance for [C ii] and [O i] since theselines mostly come from the radiation-bounded region dominatedby X-ray heating.
Overall, considering the lack of observational constraints onthe grain size distribution and on the small-scale distribution ofD/G in I Zw 18, we cannot prefer any of the models that areable to reproduce the observed dust SED (in particular the mid-IR data points). At any rate, the evidence points toward a non-uniform D/G, with a D/G globally lower than 1/50 D/GMW. Thevarious attempts at reproducing the observed dust SED shapeactually have little impact on the predicted [C ii] and [O i] lineemission and on the required input parameters (in particular theX-ray luminosity). For all models that satisfactorily reproducethe SED shape and dust mass, the fraction of gas heating pro-vided by the photoelectric effect is always .12%.
6.4. Exploratory modelsM3: cosmic ray heating
We now consider CR ionization as an additional parameter tothe initial model M1. For this test, dust is ignored. While thedependence of the CR heating rate on metallicity is uncertain,the CR ionization rate is expected to be proportional to the SNrate because CR are produced in SN remnants and increase theirenergy in SN shock fronts. The CR ionization rate is thus ex-pected to scale roughly with the SFR (e.g., Wolfe et al. 2003;Abdo et al. 2010). There is a generally good correlation betweenthe IR luminosity and the radio emission in star-forming galax-ies (e.g., Yun et al. 2001), which seems to hold even in metal-poor BCDs (Wu et al. 2008b). Although I Zw 18 is an outlier inthe IR-radio relation, possibly hinting at an unusually large ra-dio emission, this is also easily explained by the low D/G and/orby a low fraction of UV photons absorbed by dust. In fact, theSFR derived from 1.4 GHz and from Hα agree within a factorof two (Sect. 2.3) and since the integrated 1.4 GHz emission isdominated by synchrotron radiation (Cannon et al. 2005), thissuggests that the CR ionization rate may indeed scale with theSFR in I Zw 18. Nevertheless, the choice of SFR for I Zw 18is not straightforward. Most SFR tracers (Hα, FUV+24 µm,or 1.4 GHz) agree with 0.05−0.1 M� yr−1, but a CMD analy-sis indicates a larger value of ∼1 M� yr−1 over the last 10 Myr(Annibali et al. 2013) (Sect. 2.3).
Considering the lack of constraints on the actual CR ioniza-tion rate, several values are tested in the following. As for the testof the photoelectric effect (Sect. 6.3), we calculate a grid withvarying X-ray luminosity and find the best model that reproducesthe observations. The description of the CR heating properties inCloudy is assumed to hold in I Zw 18. We first consider a Galac-tic background ionization rate (2 × 10⁻¹⁶ s−1; e.g., Indriolo et al.2015) and let Cloudy calculate the heating rate self-consistently(model M3a in Table 7). The CR heating becomes significantonly at large depths into the cloud. The required X-ray luminos-ity is marginally lower than the model with no CR, which is dueto the additional heating from CR ionization. The heating ratecontribution due to CR ionization in the H i region is ≈13%.
A45, page 17 of 38

A&A 602, A45 (2017)
In modelM3b we test a CR rate that is five times the Galac-tic background rate. The heating rate in the H i region due toCR ionization becomes ≈65% and the required X-ray luminos-ity decreases to ≈1.25 × 1040 erg s−1. Although the H0 mass isfairly well reproduced, we notice that as the CR ionization rateincreases it becomes more and more difficult to find a satisfac-tory solution for [C ii], [O i], and [Si ii], with either [O i]/[C ii]or [Si ii]/[C ii] increasing with the CR ionization rate.
In order to isolate and test the heating efficiency of CR ion-ization alone, we briefly considered a model with no X-ray butwith a CR ionization rate scaled to reproduce the observed [C ii]flux. For a Galactic background rate (M3c), the H0 mass re-quired to reproduce [C ii] and the other H i region lines is sig-nificantly larger than observations (Table 7). For a rate five timeslarger (M3d), observations are relatively well reproduced, al-though the prediction for [Si ii] is somewhat low. This showsthat the heating provided by the X-ray source in I Zw 18 is in ef-fect similar to what CR ionization could provide with a flat rateof ≈10−15 s−1 across the H i region. Since the characteristics ofthe X-ray source in I Zw 18 are well established, we argue thatthe large ionization fraction observed in the H i region is theconsequence of the X-ray source.
6.5. Full modelM4a
The full model M4a combines all heating mechanisms (pho-toelectric effect, soft X-ray and CR ionization). We tentativelyscale down the CR ionization rate by a factor of 10 as comparedto the Galactic background (i.e., assuming a scaling with SFR)and keep in mind that the global heating in the H i region due toCR ionization remains under 13% even if a Galactic backgroundrate is chosen (Sect. 6.4). We include an additional dust-rich sec-tor to reproduce the dust SED (Sect. 6.3.2). This model thereforereproduces well the observed [C ii], [O i], and [Si ii] fluxes, thesuite of Spitzer and optical H ii region lines, and the H0 mass.The dust mass is somewhat underestimated and the dust SED isqualitatively reproduced.
The optical and infrared ionized gas line intensities pre-dicted by modelM4a are in good agreement with observations(Tables 4, 8) and with Nebu (Sect. 4.2). The presence of dust haslittle impact on the predicted optical line intensities. The ob-served He i intensities are affected by stellar line contamination(see P08 for more details). The [S iv] and [Ar iv] lines are alsocomparatively not well reproduced. The ionization balances ofboth S and Ar are thought to be affected by uncertain dielectronicrecombination rates and we refrain at this stage from elaboratingon these discrepancies.
Interestingly, the flux of [Ne v] 14.3 µm predicted by modelM4a is only a factor of ≈5 below the current observed upperlimit. Since the [Ne v] emission traces the soft X-ray radia-tion, deeper observations with the James Webb Space Telescope(JWST) may be useful to constrain the X-ray source emis-sion properties in a hardly accessible spectral range (see alsoAppendix C). The JWST will also be able to test model predic-tions for other faint neutral gas tracers, such as [Ar ii] and [Fe ii].Nonetheless present collisional rates with H0 are inaccurate forthese lines.
Figure 12 shows the density and temperature profiles for theradiation-bounded sector of model M4a. The electron fractionranges from ∼0.5% down to ∼0.05% and the electron temper-ature remains above 50 K throughout the H i region. Figure 13shows the cooling and heating contributions. One can see that,as expected, [C ii], [O i], and [Si ii] are the main coolants in theH i region, with [O i] and [Si ii] dominating at the surface of
IZw18: M2X2_newX_finalSMC_Sector1(0.26)
140 160 180 200 220 240Radius [pc]
0.1
1.0
10.0
100.0
Dens
ity [c
m-3]
n(H)n(e)
IZw18: M2X2_newX_finalSMC_Sector1(0.26)
140 160 180 200 220 240Radius [pc]
10
100
1000
10000
Tem
pera
ture
[K]
Fig. 12. Radial density and temperature in the radiation-bounded sectorof the full modelM4a. The plots are shown for the radiation-boundedsector.
the cloud and [C ii] dominating deeper. The optical depth valuesof [C ii], [O i], [Si ii], and [Fe ii] 26.0 µm are 0.5, 2.3, 0.3, and0.3, respectively; in a static model, i.e., no internal motions andassuming only thermal broadening for the lines.
The observed low D/G (Sect. 5.4) and low PAH abundance inI Zw 18 (e.g., Wu et al. 2006; Rémy-Ruyer et al. 2014) alreadysuggest that dust grains and PAHs do not contribute significantlyto the gas heating. This is confirmed by our model in which themain heating source in the H i region is the photoionization ofHe0 and H0 by the X-ray source. The photoelectric effect heatingincreases deeper into the cloud but never contributes to morethan ∼10% of the local heating rate.
Our model is helpful to understand the origin of the totalinfrared (TIR) emission. About 85% of the TIR in the modelcomes from the ionized phase in the H ii region (i.e., the twomatter-bounded sectors, the additional dust-rich sector, and theradiation-bounded sector before the ionization front). With re-gard to the physical processes accounting for TIR, about 60% ofthe TIR in the model arises from free-free emission in the ion-ized phase, with the remaining 40% arising from dust (mostly inthe ionized phase). The important contribution from the ionizedphase in TIR implies that the ratio ε′TIR = ([C ii]+[O i])/TIR can-not be used to probe the photoelectric effect heating efficiency inthe H i region (see also discussion in Sect. 8.2).
7. Model discussion
7.1. Molecular gas content
Our models, describing the H i region physical properties ofI Zw 18, provide useful constraints to the molecular gas con-tent. We consider two cases: molecular gas in the uniformly
A45, page 18 of 38
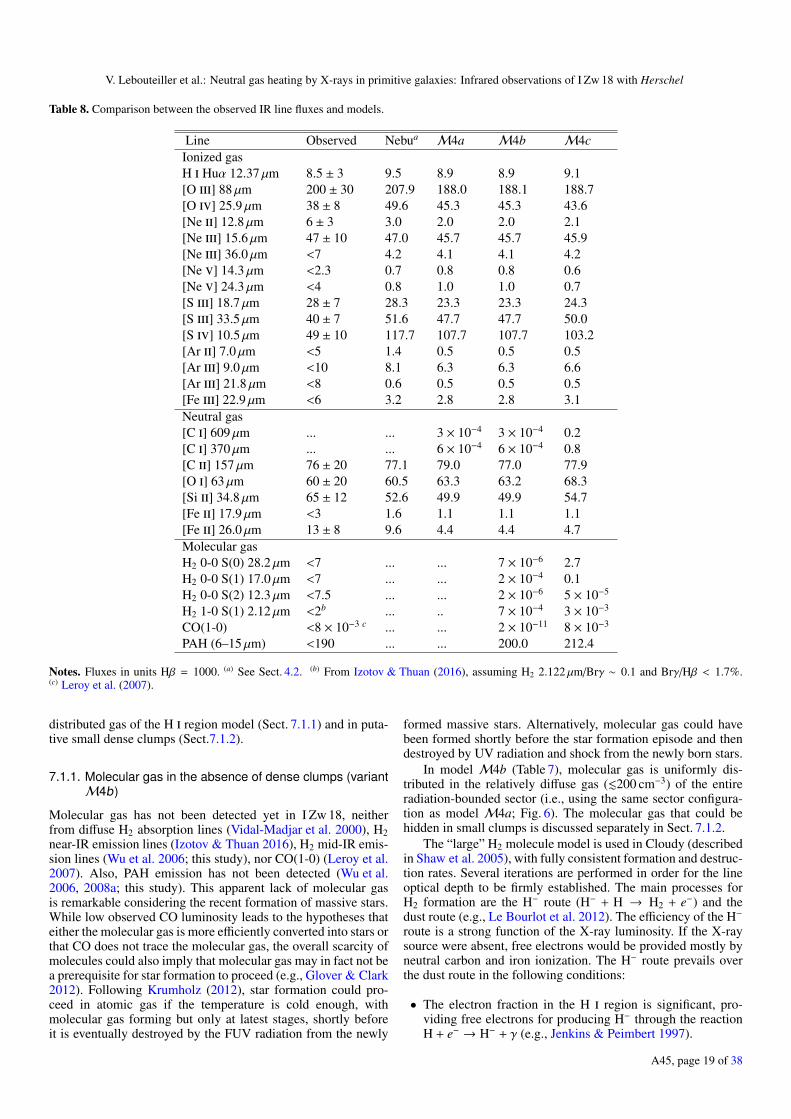
V. Lebouteiller et al.: Neutral gas heating by X-rays in primitive galaxies: Infrared observations of I Zw 18 with Herschel
Table 8. Comparison between the observed IR line fluxes and models.
Line Observed Nebua M4a M4b M4cIonized gasH i Huα 12.37 µm 8.5 ± 3 9.5 8.9 8.9 9.1[O iii] 88 µm 200 ± 30 207.9 188.0 188.1 188.7[O iv] 25.9 µm 38 ± 8 49.6 45.3 45.3 43.6[Ne ii] 12.8 µm 6 ± 3 3.0 2.0 2.0 2.1[Ne iii] 15.6 µm 47 ± 10 47.0 45.7 45.7 45.9[Ne iii] 36.0 µm <7 4.2 4.1 4.1 4.2[Ne v] 14.3 µm <2.3 0.7 0.8 0.8 0.6[Ne v] 24.3 µm <4 0.8 1.0 1.0 0.7[S iii] 18.7 µm 28 ± 7 28.3 23.3 23.3 24.3[S iii] 33.5 µm 40 ± 7 51.6 47.7 47.7 50.0[S iv] 10.5 µm 49 ± 10 117.7 107.7 107.7 103.2[Ar ii] 7.0 µm <5 1.4 0.5 0.5 0.5[Ar iii] 9.0 µm <10 8.1 6.3 6.3 6.6[Ar iii] 21.8 µm <8 0.6 0.5 0.5 0.5[Fe iii] 22.9 µm <6 3.2 2.8 2.8 3.1Neutral gas[C i] 609 µm ... ... 3 × 10⁻⁴ 3 × 10⁻⁴ 0.2[C i] 370 µm ... ... 6 × 10⁻⁴ 6 × 10⁻⁴ 0.8[C ii] 157 µm 76 ± 20 77.1 79.0 77.0 77.9[O i] 63 µm 60 ± 20 60.5 63.3 63.2 68.3[Si ii] 34.8 µm 65 ± 12 52.6 49.9 49.9 54.7[Fe ii] 17.9 µm <3 1.6 1.1 1.1 1.1[Fe ii] 26.0 µm 13 ± 8 9.6 4.4 4.4 4.7Molecular gasH2 0-0 S(0) 28.2 µm <7 ... ... 7 × 10⁻⁶ 2.7H2 0-0 S(1) 17.0 µm <7 ... ... 2 × 10⁻⁴ 0.1H2 0-0 S(2) 12.3 µm <7.5 ... ... 2 × 10⁻⁶ 5 × 10⁻⁵
H2 1-0 S(1) 2.12 µm <2b ... .. 7 × 10⁻⁴ 3 × 10⁻³
CO(1-0) <8 × 10⁻³ c ... ... 2 × 10⁻¹¹ 8 × 10⁻³
PAH (6–15 µm) <190 ... ... 200.0 212.4
Notes. Fluxes in units Hβ = 1000. (a) See Sect. 4.2. (b) From Izotov & Thuan (2016), assuming H2 2.122 µm/Brγ ∼ 0.1 and Brγ/Hβ < 1.7%.(c) Leroy et al. (2007).
distributed gas of the H i region model (Sect. 7.1.1) and in puta-tive small dense clumps (Sect.7.1.2).
7.1.1. Molecular gas in the absence of dense clumps (variantM4b)
Molecular gas has not been detected yet in I Zw 18, neitherfrom diffuse H2 absorption lines (Vidal-Madjar et al. 2000), H2near-IR emission lines (Izotov & Thuan 2016), H2 mid-IR emis-sion lines (Wu et al. 2006; this study), nor CO(1-0) (Leroy et al.2007). Also, PAH emission has not been detected (Wu et al.2006, 2008a; this study). This apparent lack of molecular gasis remarkable considering the recent formation of massive stars.While low observed CO luminosity leads to the hypotheses thateither the molecular gas is more efficiently converted into stars orthat CO does not trace the molecular gas, the overall scarcity ofmolecules could also imply that molecular gas may in fact not bea prerequisite for star formation to proceed (e.g., Glover & Clark2012). Following Krumholz (2012), star formation could pro-ceed in atomic gas if the temperature is cold enough, withmolecular gas forming but only at latest stages, shortly beforeit is eventually destroyed by the FUV radiation from the newly
formed massive stars. Alternatively, molecular gas could havebeen formed shortly before the star formation episode and thendestroyed by UV radiation and shock from the newly born stars.
In model M4b (Table 7), molecular gas is uniformly dis-tributed in the relatively diffuse gas (.200 cm−3) of the entireradiation-bounded sector (i.e., using the same sector configura-tion as model M4a; Fig. 6). The molecular gas that could behidden in small clumps is discussed separately in Sect. 7.1.2.
The “large” H2 molecule model is used in Cloudy (describedin Shaw et al. 2005), with fully consistent formation and destruc-tion rates. Several iterations are performed in order for the lineoptical depth to be firmly established. The main processes forH2 formation are the H− route (H− + H → H2 + e−) and thedust route (e.g., Le Bourlot et al. 2012). The efficiency of the H−route is a strong function of the X-ray luminosity. If the X-raysource were absent, free electrons would be provided mostly byneutral carbon and iron ionization. The H− route prevails overthe dust route in the following conditions:
• The electron fraction in the H i region is significant, pro-viding free electrons for producing H− through the reactionH + e− → H− + γ (e.g., Jenkins & Peimbert 1997).
A45, page 19 of 38

A&A 602, A45 (2017)
0.0
0.2
0.4
0.6
0.8
1.0
Λ (
con
trib
utio
ns)
[FeII][SiII] 35um[CII][OI] 63um
10-24
10-23
Γ,
nΛ
[e
rg s
-1 c
m-3]
M4a
0.0
0.2
0.4
0.6
0.8
1.0
Γ (
con
trib
utio
ns)
Charge trans.Phot. eff.Ion(H0)Ion(He0)
200 210 220 230 240 250Radius [pc]
37.0
37.5
38.0
38.5
39.0
39.5
Cu
mu
lativ
e in
ten
sitie
s [e
rg s
-1]
[SiII][OI] 63um[CII]
Fig. 13. Heating and cooling rates for the full model (M4a). The plotsare shown for the radiation-bounded sector. See Fig. 10 for the plotdescription.
• The medium density is &100 cm−3, below which the H−photodetachment (H− + γ → H + e−) starts to dominate(e.g. Kamaya & Hirashita 2001; Chuzhoy et al. 2007). Fur-thermore, regulation by electron recombination prevents alarge molecular gas fraction through the H− route unless thedensity becomes much larger than ∼104 cm−3 (for a metal-licity adapted to I Zw 18; Omukai et al. 2005).
• The D/G falls below some critical value (see Glover 2003),
The formation of H2 in dense clouds can therefore beX-ray-induced (e.g., Haiman et al. 1996), with a significantnumber of free electrons provided by primary and secondaryionization13. The competing photodissociation of H2 by Lyman-Werner photons may, however, still partly control the moleculargas fraction if the X-ray and UV sources are correlated throughsimilar origin and timescale (e.g., Machacek et al. 2003). Thepositive feedback of X-rays could manifest itself mostly if theUV field is weak but X-rays are still able to ionize interiors ofdense clouds. The timescales are critical, and if the X-ray sourcesurvives long enough after the UV field weakens, H2 formationin dense clouds may be enhanced, thereby providing an impor-tant cooling.
ModelM4b predicts an H2 column density of 4 × 1013 cm−2
that is lower than the observed upper limit .1015 cm−2 mea-sured by Vidal-Madjar et al. (2000) with FUV absorption lines.The authors also calculated a theoretical column density of
13 Number of secondary ionizations is 25 (Eγ/1 keV) (Shull &van Steenberg 1985).
2 × 1012 cm−2 but underestimated the importance of the H2 for-mation process via the H− route by assuming that free electronswere only provided by ionization of carbon. In modelM4b, theH− formation route contributes to ∼60% of the H2 mass. H2 ismostly formed through the H− route at the inner edge of the H ishell, while the dust route eventually dominates deeper in theneutral cloud.
We therefore propose that the diffuse (as opposed to theclumps discussed in Sect. 7.1.2) H2 column density may be closeto a few 1013 cm−2 based on our models, bearing in mind thatthe latter may not account for an accurate description of the pho-todissociation in a clumpy medium. Even gas with extremelylow molecular gas fraction can produce a significant amount ofself-shielding with a large enough total column density. Figure 1of Draine & Bertoldi (1996) shows the self-shielding functionwithout any dust. One can see that the self-shielding factor be-comes important (0.5; i.e., half of the flux in the Lyman andWerner bands is absorbed) for N(H2) ≈ 2.5 × 1014 cm−2. InI Zw 18, the column density is thus barely sufficient, if at all, toenable H2 self-shielding unless it is distributed into dense clumps(Sect. 7.1.2).
The H2 mass distributed within the radiation-bounded sectorof model M4b is only ∼0.1 M� (corresponding to a moleculargas mass fraction of ∼5 × 10⁻⁹). In the sector configuration ofM4b, the [C ii] and [O i] emission lines thus trace an almostpurely atomic medium.
The CO(1-0) intensity predicted by model M4b is 2 ×10⁻³⁰ W m−2, to be compared to the upper limit by Leroy et al.(2007) of 8 × 10⁻²² W m−2 (with a beam of ≈380 pc). Both thesensitivity and the beam filling factor could explain in part whythe current observed upper limit is so large as compared to themodel.
7.1.2. Dense molecular clumps (variantM4c)
As mentioned in Sect. 7.1.1, absorption-line studies did not suc-ceed in detecting H2 in the diffuse ISM along the lines of sighttoward the massive stars. This is in agreement with modelM4b.Nonetheless, H2 may still exist in significant amounts out of theavailable lines of sight toward the massive stars in NW, whichare located within an H i hole (Fig. 1), far from the dust-rich re-gions (Sect. 6.3.2). For example, H2 may belong to undetected,relatively small, and dense clumps (Vidal-Madjar et al. 2000).Thuan et al. (2005) proposed the existence of such clumps inthe BCD SBS 0335−052 based on the lack of diffuse H2 to-gether with the detection of warm H2 emission in the near IR.Rubio et al. (2015) observed small CO clumps with ALMA inthe low-metallicity galaxy WLM (12 + log(O/H) = 7.8) of 1.5to 6 pc in size, which begs the question of whether such clumpscan exist in I Zw 18.
Similar to Cormier et al. (2012), who modeled photodissoci-ation regions (PDRs) in the dwarf galaxy Haro 11, we considerdense clumps in I Zw 18 with a small covering factor as com-pared to the H i shell (Fig. 6). In other words, only a small frac-tion of the radiation-bounded sector reaches the molecular phase.Since there are no constraints on the mere presence of clumps,we bear in mind that the following models are only exploratory.Apart from the upper limits on CO, H2, and PAH emission, an-other observational constraint is the dust SED and in particularthe long wavelength emission corresponding to cold dust.
We assume D/G = 1/1000 D/GMW across the molecular sec-tor. The dust-rich sector (added to reproduce the observed SEDshortward of 100 µm; Sect. 6.3.2) is ignored for this test sincewe wish to study the specific contribution of the clump sector.
A45, page 20 of 38

V. Lebouteiller et al.: Neutral gas heating by X-rays in primitive galaxies: Infrared observations of I Zw 18 with Herschel
10-4 10-2 100 102 104
Wavelength [um]
102
103
104
105
106
107
108
109
ν L
ν [L
sol]
10-4 10-2 100 102 104
102
103
104
105
106
107
108
109
M4c
Fig. 14. Spectral energy distribution for modelM4c (model with molec-ular clump). See Fig. 10 for the plot description. The dust-rich sector isignored for this model.
The density profile across the clump sector is calculated self-consistently by constraining a constant pressure (P/k = 8 × 10⁶
CGS units). The density profile is thus similar to the radiation-bounded sector (#1) used in our previous modeling up to thephotoionization front, but the density then eventually reaches∼106 cm−3, for which the medium becomes fully molecular(even with no dust grains).
Various combinations of covering factor and stopping col-umn density can lead to significant H2 mass in the clump sectorwith more mass produced in variants with low covering factorand large stopping column density. As a test, we consider a sec-tor reaching a total column density of 1025 cm−2 (AV ∼ 3) withthe covering factor scaled to accommodate the observed con-straints (the CO upper limit, the observed dust SED, and the cor-responding dust mass).
In practice, the CO upper limit is the most stringent obser-vational constraint. It is reached for a clump covering factor of≈0.1% (Table 8). For such a covering factor, the dust SED re-mains compatible with observations (Fig. 14) and the dust massis also well reproduced (Table 7). The resulting upper limit onthe molecular volume is about 143 pc3 (∼25 × 25 pc2 surfacearea and ∼5 pc deep). Considering the depth scale and assum-ing spherical clumps, this should correspond to a couple dozenclumps at most.
The main heating mechanisms in the clump sector are thephotoionization of H and He at small depths, and the collisionswith H2, photoelectric effect, and CR ionization at larger depths.The clump sector is almost fully (98%) molecular in mass. Asshown in Fig. 15, most of the [C ii] emission in the clump sectoroccurs at depths for which the gas is molecular (≈75% of [C ii] isassociated with a molecular gas fraction >50%). However, [C ii]does not trace well the H2 mass, since most (80%) of the H2 massis produced at depths where C is into C0 or CO. Comparatively,[C i], CO(1-0), or H2 2.12 emissions follow the H2 mass profilemore closely, although they emit mostly at depths where the H2mass is still small.
While [C ii] emission is associated with H2 in the clump sec-tor, the fraction of [C ii] arising from this sector is only about15% of the total [C ii] in the model (the same fraction is foundfor [O i]). Most of the emission arises from the relatively morediffuse H i region in sector #1 where [C ii] traces H0.
The H2 mass in model M4c is ∼4 × 10⁷ M�, i.e., onthe same order as the H0 mass. From CO observations andusing a point-source luminosity, Leroy et al. (2007) found
Fig. 15. Top: abundance fraction of C0, C+, CO, and H2 plotted againstthe optical depth at 1 Ryd for the clump sector of modelM4c. Bottom:cumulative fraction of [C i] 609 µm, [C ii], CO(1-0), H2 2.12 µm, andH2 mass normalized to the maximum value.
M(H2)< 7.4× 10⁵ M�14. Assuming the star formation efficiencyis the same as in the Milky Way, we can argue that XCO is signif-icantly larger. If XCO is 100 times larger than the Galactic valueas proposed by Leroy et al. (2007) − similar to the factor extrap-olated from the trend by Schruba et al. (2012) − we obtain anupper limit on the H2 mass on the same order as our estimatein M4c. A large XCO might be partly related to low cloud ex-tinction due to low metallicity (i.e., enhanced photodissociation)rather than to a direct abundance effect (Glover & Low 2011).
The molecular volume and clump size we estimate are upperlimits. First, these values are calculated based on the CO(1-0)observed upper limit. Second, our model does not account forinternal motions. The CO emission could be different if we con-sidered turbulence or a velocity gradient, in which case both themolecular volume and clump size could in fact be much smaller.
We conclude that it is possible that significant amounts ofmolecular gas exist in I Zw 18 if it is distributed within a fewsmall dense clumps of size .5 pc (.0.05′′ at 18.2 Mpc). Parsec-size clouds are difficult to observe in absorption because it re-quires a line of sight intersecting the clump toward a FUV back-ground source. Furthermore, absorption-line measurements ofa group of FUV background sources privilege low-extinctionlines of sight. While such clumps could be directly detectedwith high spatial resolution CO observations, it is also possi-ble to observe relatively strong signatures from [C i] and fromthe warm molecular layer in the mid-IR H2 lines − in particularS(0) (Table 8) − as long as the molecular clouds remain excitedby the X-ray source and by the stellar clusters (hence provid-ing a significant gas temperature). The near-IR H2 line 1-0 S(1)at 2.12 µm is a few orders of magnitude below the current ob-served upper limit (Izotov & Thuan 2016), suggesting that 8 mclass telescopes could possibly reach such levels predicted byour models (e.g., Vanzi et al. 2011). Clumps may also exist atsignificant distances from the clusters, where they can be near
14 Value rescaled at 18.2 Mpc. with a Galactic CO/H2 conversion factor.
A45, page 21 of 38

A&A 602, A45 (2017)
isothermal equilibrium with the CMB and CR, in which caseonly cold molecular gas can be detected. Another possible ob-servational constraint to such dense clumps is provided by thedust emission longward of 500 µm (Fig. 14).
The existence of molecular clumps in general in I Zw 18would shed a new light on the importance of the molecular gasinto the baryonic budget of low-metallicity dwarf galaxies; suchgalaxies have been generally thought to be dark-matter domi-nated although this is a disputed issue (e.g., Swaters et al. 2011;Ferrero et al. 2012; Kuhlen et al. 2013; Sawala et al. 2015). Suchclumps are reminiscent of recurring and self-gravitating coldH2 clumps that may exist in a hierarchical structure of vari-ous sizes (Pfenniger & Combes 1994a,b; Combes & Pfenniger1997; Combes 2005).
7.2. C+ cooling rate in the dense versus diffuse medium
While our models focus on the relatively dense gas associatedwith the star-forming region of I Zw 18, a significant fraction ofthe H0 mass of the galaxy is distributed within the large H i en-velope (Lelli et al. 2012). In this section we compare the coolingrates observed in both phases.
The C+ cooling rate can be measured either using the [C ii]157 µm emission line or the C ii* λ1335.7 FUV absorptionline doublet (Fig. 16). In the Milky Way, the 2P3/2 fine-structureline population was first observed in absorption toward Galac-tic stars (Pottasch et al. 1979). The 157 µm emission line wasfirst observed shortly after in NGC 2024 and the Orion nebula(Russell et al. 1980). A comparison between the cooling rate in-ferred from the absorption and the emission was first performedfor our Galaxy by Stacey et al. (1985), indicating a rough agree-ment. The same comparison in extragalactic targets is challeng-ing as in most sources the material observed in emission can-not always be easily associated with that observed in absorption(e.g., quasar lines of sight). Furthermore, most IR-bright galax-ies are difficult to observe in the FUV because of absorption bydust. Inversely, most FUV-bright galaxies are difficult to observein the IR because of the lack of dust. The advent of Herschelmade it possible to detect relatively dust-poor galaxies at FIRwavelengths.
In that vein, the comparison between our results concerning[C ii] and those of Lebouteiller et al. (2013) concerning C ii*is informative and is, to our knowledge, the first comparisonmade in an extragalactic target. Lebouteiller et al. (2013) ex-amined with the FUV absorption lines C ii λ1334.5 and C ii*λ1335.7, arising from the ground level and fine-structure level ofC+, respectively. The observations of C ii*, performed with Hub-ble/COS, probe lines of sight toward bright young stars with-ing the 2.5′′ aperture. The authors inferred an electron frac-tion upper limit of 2% in the H i region with a best guess of∼0.1%, which is within the range we have determined with Her-schel/PACS and Spitzer/IRS line ratios (Sect. 6.5) and with ourmodels (Sect. 6.5). Furthermore, the cooling rate as determinedby the C ii* column density was found to be incompatible withthe photoelectric effect on dust, which is again consistent withthe results in the present study.
We do not expect a priori an agreement between the C+
cooling rate calculated in the present study and the results ofLebouteiller et al. (2013). Firstly, only the most diffuse mediumshould be seen in absorption because the most dust-rich linesof sight suffer from UV absorption. However, we bear in mindthat such a bias is likely negligible for I Zw 18 because of itslow dust content. Secondly, and most importantly, the H i regionseen in emission corresponds to the entire main body while the
0 K
91.3 K
61 924.8 K
61 956.4 K
61 997.2 K
107 889.3 K
107 903.0 K
138 951.0 K
2P1/2
2P3/2
4P1/2
4P3/2
4P5/2
2D5/2
2D3/2
2S1/2
CII 1
036.3
4A
CII 1
334.5
3A
CII*
1037.0
2A
CII*
1335.6
6A
157um
(2s22p) (2s2p2)C
II*
1335.7
1A
Fig. 16. Main levels of the C+ ion. The dot-dashed lines correspond toweak transitions.
H i region seen in absorption by COS probes a region of ≈2.5′′across centered on NW and coinciding in fact with an H i hole(Fig. 1).
To quantify further the comparison between the cooling rateinferred in emission and absorption, we calculate the total cool-ing rate in erg s−1. From the observed [C ii] 157 µm line inten-sity, 10−17 W m−2, we find a total rate of 3.9 × 1031 W. For themeasure in absorption, we first use the cooling rate per H atomobtained by Lebouteiller et al. (2013), 8.3 × 10⁻²⁸ erg s−1 (H−1),which we then multiply by the total mass of H0 in the main body,≈108 M�, assuming that the cooling rate per H atom is uniformacross the H i body. We find a rate of 1038 erg s−1 = 1031 W,i.e., a factor of ≈4 difference with the rate measured in emis-sion. Another way to show this discrepancy is to compare theCOS measurement 8.3 × 10⁻²⁸ erg s−1 (H−1) to the cooling ratepredicted by the model (10−24−10−23 erg s−1; Fig. 13). Consider-ing the volume density in the C+-emitting region in the model,the cooling rate becomes ≈10−26−10−25 erg s−1 (H−1), implyinga factor of &10 larger than the COS rate.
The discrepancy we observe cannot be solely attributed to therelatively uncertain H0 mass of the main body used for the calcu-lation and we argue that the cooling rate is genuinely lower in theH i region probed toward the NW cluster. Taking at face valuethe cooling rates measured in absorption and in emission and theH0 mass of the main body, it seems that most of the C+ cool-ing in I Zw 18 occurs in the star-forming region with a relatively
A45, page 22 of 38
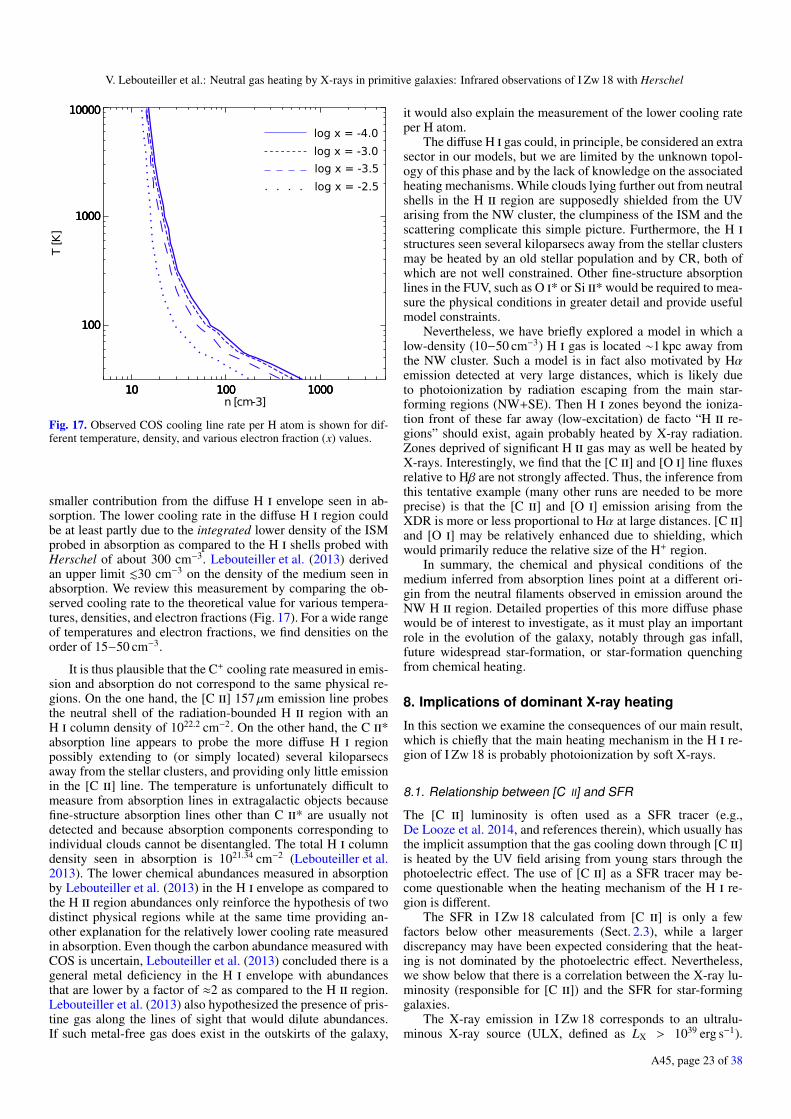
V. Lebouteiller et al.: Neutral gas heating by X-rays in primitive galaxies: Infrared observations of I Zw 18 with Herschel
Fig. 17. Observed COS cooling line rate per H atom is shown for dif-ferent temperature, density, and various electron fraction (x) values.
smaller contribution from the diffuse H i envelope seen in ab-sorption. The lower cooling rate in the diffuse H i region couldbe at least partly due to the integrated lower density of the ISMprobed in absorption as compared to the H i shells probed withHerschel of about 300 cm−3. Lebouteiller et al. (2013) derivedan upper limit .30 cm−3 on the density of the medium seen inabsorption. We review this measurement by comparing the ob-served cooling rate to the theoretical value for various tempera-tures, densities, and electron fractions (Fig. 17). For a wide rangeof temperatures and electron fractions, we find densities on theorder of 15−50 cm−3.
It is thus plausible that the C+ cooling rate measured in emis-sion and absorption do not correspond to the same physical re-gions. On the one hand, the [C ii] 157 µm emission line probesthe neutral shell of the radiation-bounded H ii region with anH i column density of 1022.2 cm−2. On the other hand, the C ii*absorption line appears to probe the more diffuse H i regionpossibly extending to (or simply located) several kiloparsecsaway from the stellar clusters, and providing only little emissionin the [C ii] line. The temperature is unfortunately difficult tomeasure from absorption lines in extragalactic objects becausefine-structure absorption lines other than C ii* are usually notdetected and because absorption components corresponding toindividual clouds cannot be disentangled. The total H i columndensity seen in absorption is 1021.34 cm−2 (Lebouteiller et al.2013). The lower chemical abundances measured in absorptionby Lebouteiller et al. (2013) in the H i envelope as compared tothe H ii region abundances only reinforce the hypothesis of twodistinct physical regions while at the same time providing an-other explanation for the relatively lower cooling rate measuredin absorption. Even though the carbon abundance measured withCOS is uncertain, Lebouteiller et al. (2013) concluded there is ageneral metal deficiency in the H i envelope with abundancesthat are lower by a factor of ≈2 as compared to the H ii region.Lebouteiller et al. (2013) also hypothesized the presence of pris-tine gas along the lines of sight that would dilute abundances.If such metal-free gas does exist in the outskirts of the galaxy,
it would also explain the measurement of the lower cooling rateper H atom.
The diffuse H i gas could, in principle, be considered an extrasector in our models, but we are limited by the unknown topol-ogy of this phase and by the lack of knowledge on the associatedheating mechanisms. While clouds lying further out from neutralshells in the H ii region are supposedly shielded from the UVarising from the NW cluster, the clumpiness of the ISM and thescattering complicate this simple picture. Furthermore, the H istructures seen several kiloparsecs away from the stellar clustersmay be heated by an old stellar population and by CR, both ofwhich are not well constrained. Other fine-structure absorptionlines in the FUV, such as O i* or Si ii* would be required to mea-sure the physical conditions in greater detail and provide usefulmodel constraints.
Nevertheless, we have briefly explored a model in which alow-density (10−50 cm−3) H i gas is located ∼1 kpc away fromthe NW cluster. Such a model is in fact also motivated by Hαemission detected at very large distances, which is likely dueto photoionization by radiation escaping from the main star-forming regions (NW+SE). Then H i zones beyond the ioniza-tion front of these far away (low-excitation) de facto “H ii re-gions” should exist, again probably heated by X-ray radiation.Zones deprived of significant H ii gas may as well be heated byX-rays. Interestingly, we find that the [C ii] and [O i] line fluxesrelative to Hβ are not strongly affected. Thus, the inference fromthis tentative example (many other runs are needed to be moreprecise) is that the [C ii] and [O i] emission arising from theXDR is more or less proportional to Hα at large distances. [C ii]and [O i] may be relatively enhanced due to shielding, whichwould primarily reduce the relative size of the H+ region.
In summary, the chemical and physical conditions of themedium inferred from absorption lines point at a different ori-gin from the neutral filaments observed in emission around theNW H ii region. Detailed properties of this more diffuse phasewould be of interest to investigate, as it must play an importantrole in the evolution of the galaxy, notably through gas infall,future widespread star-formation, or star-formation quenchingfrom chemical heating.
8. Implications of dominant X-ray heating
In this section we examine the consequences of our main result,which is chiefly that the main heating mechanism in the H i re-gion of I Zw 18 is probably photoionization by soft X-rays.
8.1. Relationship between [C II] and SFR
The [C ii] luminosity is often used as a SFR tracer (e.g.,De Looze et al. 2014, and references therein), which usually hasthe implicit assumption that the gas cooling down through [C ii]is heated by the UV field arising from young stars through thephotoelectric effect. The use of [C ii] as a SFR tracer may be-come questionable when the heating mechanism of the H i re-gion is different.
The SFR in I Zw 18 calculated from [C ii] is only a fewfactors below other measurements (Sect. 2.3), while a largerdiscrepancy may have been expected considering that the heat-ing is not dominated by the photoelectric effect. Nevertheless,we show below that there is a correlation between the X-ray lu-minosity (responsible for [C ii]) and the SFR for star-forminggalaxies.
The X-ray emission in I Zw 18 corresponds to an ultralu-minous X-ray source (ULX, defined as LX > 1039 erg s−1).
A45, page 23 of 38

A&A 602, A45 (2017)
Ultraluminous X-ray sources are not associated with the nu-clei of galaxies and are thought to be intermediate-mass blackholes or to involve a HMXB system with either a neutronstar and/or a stellar mass black hole (see, e.g., Gilfanov et al.2004a; Berghea et al. 2013; King & Lasota 2016). As they arelate stages of dying massive stars, the HMXBs are expected to berelated to star formation, with progenitors &8 M�, and with evo-lution timescales on the order of 106−7 yr. A correlation betweenSFR and LX has been shown observationally by Grimm et al.(2003) based on what seems to be a universal HMXB luminosityfunction in nearby star-forming galaxies (see also Gilfanov et al.2004b). The SFR-LX relation is linear for high-SFR regime(>4.5 M� yr−1) and non-linear below. Contaminations includeactive galactic nuclei and low-mass X-ray binaries (LMXBs), thelatter being a more important contaminant for galaxies with lowSFR. The non-linear behavior is thought to be a metallicity ef-fect, as proposed by Douna et al. (2015), reflecting the enhance-ment of the HMXB population at low-metallicity. This enhance-ment has been expected from theory (e.g., Linden et al. 2010;Fragos et al. 2013; Prestwich et al. 2013; Mapelli et al. 2010;Mapelli 2013) and is supported observationally by the rising ev-idence of ULXs in nearby metal-poor BCDs (e.g., Kaaret et al.2011; Kaaret & Feng 2013; Brorby et al. 2014, 2015 and ref-erences therein). The measured values of SFR and LX inI Zw 18 are consistent with such a metallicity dependence15.Besides, the dependence with metallicity is inferred indirectlyfrom the deficit of ULX in metal-rich luminous IR galaxies(Luangtip et al. 2014)
In summary, the SFR-LX relationship explains why [C ii]traces relatively well the SFR in I Zw 18. It also explains whythe value of the often-used diagnostic ratio ([C ii]+[O i])/TIR isnot unusual (Sect. 8.2).
8.2. Relationship between [C II] and TIR
The ([C ii]+[O i])/TIR (εTIR; with TIR calculated between3−1100 µm) ratio is often used to estimate the photoelectric ef-fect heating efficiency16, in which case it may also be used to cal-culate the physical scale of star formation (Stacey et al. 2010).It is also used to probe the so-called “[C ii] deficit” in ultra-luminous IR galaxies (e.g., Díaz-Santos et al. 2013, and refer-ences therein). Inversely, metal-poor galaxies show an elevatedεTIR (Cormier et al. 2015). A larger εTIR ratio is traditionally at-tributed to a larger photoelectric effect heating efficiency, whichmay be considered a consequence of a lower grain charging dueto the relatively lower absorption of UV photons in a dust-poorenvironment (Israel et al. 1996; Israel & Maloney 2011) or to asmaller dust grain size distribution (Galliano et al. 2005). Our re-sult that the photoelectric effect heating is negligible in I Zw 18allows us to test diagnostics held by εTIR.
For I Zw 18 we find εTIR = 0.6%. If we tentatively as-sume that half of the TIR emission arises in the H ii re-gion (approximate fraction derived from the SED fitting;
15 I Zw 18 would fall closer to the linear relationship with SFR of∼1 M� yr−1 as suggested by the CMD analysis from Annibali et al.(2013) (Sect. 2.3). Photon escape probability and the use of indirecttracers to infer SFR may therefore play some role and explain in partthe different behavior of SFR-LX observed at low-metallicity (as themetallicity decreases, photon escape is presumably enhanced due to alower D/G and to a more porous ISM).16 εTIR represents the gas cooling over the power absorbed by dust. Con-sidering the low efficiency values (typically less than 1%), the dust IRemission is assumed to approximate the UV photon energy absorbed bydust.
Galliano et al. 2008), we derive the following values for thePDR/H i region component alone εTIR = 1.2%. For comparison,Lebouteiller et al. (2012, 2013) found εTIR = 0.4−0.7% inthe PDR-dominated regions of the LMC-N11B nebula. InHaro 11, Cormier et al. (2012) found 0.18% for the entire galaxyand 1.1% for the PDR component alone. In Galactic PDRs,Okada et al. (2013) found 0.1−0.9%. We can also compare toother measurements of integrated galaxies (not corrected forthe H ii region contribution from TIR). Cormier et al. (2015)find 0.2−1.0% in dwarf galaxies of the DGS while Croxall et al.(2012) find 0.2−0.7% in two super-solar metallicity galaxies.
In summary, εTIR in I Zw 18 is similar to the values in othergalaxies, although somewhat larger. As shown in Sect. 6.3, thiscannot be explained in terms of photoelectric efficiency for thisgalaxy as photoionization of the H i region by X-rays can solelyexplain the emission of [C ii] and [O i]. In order to understandwhy εTIR is not extreme in I Zw 18, we must take a closer look atthe tracers involved in the quantity εTIR.
First, the free-free contribution in the TIR range, TIRff ,could become important when D/G decreases to extremely lowvalues. In I Zw 18, using the number of ionizing photons inP08 (scaled at 18.2 Mpc), we find TIRff ≈ 6.9 × 10⁶ L�, i.e.,only about four times lower than the observed TIR luminosity2.9×107 L� (Rémy-Ruyer et al. 2015). The observed luminosityof [C ii]+[O i] calculated at the same distance is 1.8 × 10⁵ L�,which results in εTIR,ff ∼ 2.6%. Hence even if I Zw 18 were vir-tually dust free, εTIR would remain on the order of a few percent,i.e., on the same order as the observed ratio in more metal-richobjects.
Apart from the free-free emission, the observed TIR also in-cludes an important contribution from the dust in the ionizedphase. Such dust population does not participate significantly tothe heating of the H ii region, and evidently does not contributeto the H i region heating where [C ii] and [O i] originate. In ourmodels, the fraction of the observed TIR that arises by dust in theH i region alone is only 15%. This shows that to calculate the ac-tual photoelectric effect heating efficiency in the H i region, wewould need to apply a significant correction to TIR.
The fact that εTIR does not reach extreme values in a dust-freeenvironment can be surprising at first, as it suggests a physicalconnection between cooling lines and TIR, even though the heat-ing mechanisms are different as compared to more metal-richsources. While TIR scales with the UV field intensity (throughdust and free-free emission), [C ii] and [O i] scale with the X-rayemission through photoionization heating. It turns out that bothenergy sources (UV and X-rays) are correlated (Sect. 8.1), im-plying that the cooling line emission and TIR scale together onfirst approximation.
Nevertheless, in a completely metal-free environment thefree-free emission would dominate TIR, and [C ii]+[O i] wouldbe null, leading in effect to εTIR = 0. Therefore, the fact that εTIRdoes not reach extreme values remains valid as long as the mainH i region coolants are metallic species.
8.3. Star-formation quenching from X-ray vs. photoelectriceffect heating
Forbes et al. (2016) proposed that the gas depletion timescalein dwarf galaxies may be dominated by the photoelectric ef-fect heating and not by SN feedback. The photoelectric heatingcould then be an important quenching mechanism for star for-mation for isolated systems, implying a significant metallicity-dependence for the star formation history. Hu et al. (2017) find
A45, page 24 of 38

V. Lebouteiller et al.: Neutral gas heating by X-rays in primitive galaxies: Infrared observations of I Zw 18 with Herschel
conflicting results, with SNe dominating the feedback, but thephotoelectric effect still has some impact on the SFR.
The H i region heating in I Zw 18 is in fact dominated byX-ray ionization. Our result, together with the enhanced abun-dance of HMXBs in low-metallicity galaxies (Sect. 8.1), sug-gests that star formation may have been mostly suppressed, or atleast influenced, by X-ray heating. Our hypothesis stands for aclosed-box model of star formation, but interestingly, X-ray andEUV ionization generated by star formation have also been pro-posed to regulate star formation in galaxies through the reducedcooling rate of the halo gas to be accreted (Cantalupo 2010).
Overall, there seems to exist a compensation between theheating provided by HXMBs and the photoelectric heating fromdust, where both heating mechanisms vary with metallicity (orD/G) in opposite ways. Although it is plausible that the pho-toelectric effect dominates the gas heating in most sources inthe DGS sample the enhancement of the HMXB population atlow metallicity may play a role in extreme environments such asI Zw 18. The key parameter is not metallicity but, to first order,the competition between D/G and LX (modulated by the topol-ogy and the photon absorption). For instance, our models forI Zw 18 predict that the photoelectric effect would be a signifi-cant heating mechanism (accounting for ∼31% of the total heat-ing in the H i region) if D/G were to be scaled with the metallicity(Sect. 6.3.1).
9. Conclusions
In this study the extremely metal-poor (1/30 Z�) galaxy I Zw 18is examined to identify and quantify the main gas heating mech-anisms in the H i region.
To this end, a detailed modeling of the H ii+H i region withthe photoionization code Cloudy is undertaken, building on aprevious model by P08. Our new Herschel/PACS observations([C ii] 157 µm, [O i] 63 µm, and [O iii] 88 µm) and updatedSpitzer/IRS measurements (particularly [Si ii] 34.8 µm) are usedas constraints. Other new constraints include observations of thedust SED, dust mass, H0 mass, and X-ray spectrum.
The photoelectric effect, CR, and X-ray heating are all con-sidered in different consistent models. The selected models re-produce well the optical to FIR emission lines, dust SED, andother data. The main conclusions are as follows:
• The photoelectric effect is not a significant heating mecha-nism in the H i region, whether we use the D/G constrainedby Herschel or a larger D/G scaled with metallicity.
• To order of magnitude, the weak photoionization of H0 andHe0 by X-rays can provide enough heating to explain theobserved low-ionization fine-structure line intensities. Thedominant coolants are [O i] and [Si ii] at the inner edge ofthe H i region and [C ii] deeper inside.
• More precisely, the H i zone fluxes imply a luminosity LX ≈
4× 1040 erg s−1 that is about three times larger than the valueinferred from a diskbb model fitting of the XMM-Newtonobservations. This difference is not critical, given that (1) thesource may not emit isotropically; (2) the X-ray source isvariable; and (3) the model X-ray flux corresponds to a timeaverage over the H i gas cooling timescale of several 104 yr.This large average X-ray luminosity could imply the exis-tence of a massive accreting black hole in I Zw 18-NW.
• The lack of constraints in an environment such as I Zw 18prevents from any definite conclusion concerning CR heat-ing. Nonetheless, CR heating is negligible if the “standard”description in Cloudy is adopted.
• The models predict only about 0.1 M� of H2 in the regiontraced by [C ii] and [O i] if the radiation-bounded sectorhas uniform properties (no clumps). Under such conditions,[C ii] and [O i] are therefore not (CO-dark) molecular gastracers.
• We also explore the possible existence of undetected molec-ular clumps. These H2 clouds should reach a density of106 cm−3 and have a small covering factor (.0.1%). Themain constraints come from the CO emission and the dustSED. This dense sector can shelter .4 × 107 M� of H2, inwhich case H2 must belong to a few clouds of a few parsecsin size (<∼0.05′′). Most of the [C ii] and [O i] emission in theclump sector is associated with a large molecular gas frac-tion, but theses lines do not trace well the H2 mass. Even inthe presence of clumps, most (&85%) of the [C ii] and [O i]emission in the model is associated with atomic gas in themore diffuse sector.
• The cooling rate derived from C ii* in absorption againstUV-bright stars is somewhat less than the rate measured from[C ii] in the H i shell adjoined to the H ii region. In absorp-tion, the lines of sight may intersect a rather diffuse neutral(∼10 cm−3) up to several kiloparsecs away from the stellarcluster.
• The dust SED is not well reproduced with uniform D/G val-ues. A warm dusty component is required to fit the mid-IRpart of the SED. Adding this component has no impact onthe FIR line emission and on any other result.
• More than half of the observed TIR flux is free-free emissionfrom the ionized phase. The rest is dust emission (mostly inthe ionized phase). Only 15% of the TIR comes from dust inthe H i region. Diagnostics involving TIR, such as the photo-electric heating efficiency proxy [C ii]+[O i]/TIR, should beused with caution.
That the H i region heating is dominated by X-ray ionizationhas important implications for extremely metal-poor galaxies ingeneral. There seems to be a competition between the photo-electric effect (scaling with metallicity) and the X-ray ionization,the latter becoming more and more important in low-metallicitystar-forming galaxies through the larger occurrence and lumi-nosity of HMXBs (expected theoretically and checked observa-tionally). Some uncertainty pertains to the difficulty in recover-ing the X-ray energy distribution actually seen by the gas. Weshow that some of this uncertainty can be lifted through the useof high-ionization lines such as [Ne v] (Appendix C).
In environments with both an extremely low D/G and brightX-ray binaries, the physical conditions can no longer be eas-ily derived from FIR diagnostics. In I Zw 18, we notice that the[C ii]+[O i]/TIR ratio is surprisingly normal, with a value simi-lar to what is observed in more metal-rich sources. We argue thatthis ratio is kept stable because of a correlation between X-rayluminosity, which is responsible for the heating of the gas inwhich [C ii] and [O i] originate, and UV radiation field throughthe SFR, which is responsible for most of the TIR emission. Thisimplies that the value of [C ii]+[O i]/TIR cannot be interpretedas a photoelectric effect heating efficiency proxy (or as an indi-rect metallicity tracer) in I Zw 18. For the same reason (i.e., therelationship between SFR and X-ray luminosity in star-forminggalaxies), H i region cooling lines, and in particular [C ii], scalewith the SFR even though the gas heating mechanism may bedifferent.
Finally, we propose that X-ray heating may be an importantquenching mechanism for star formation. This quenching couldbe efficient at large scales, as shown by the comparison of the C+
A45, page 25 of 38

A&A 602, A45 (2017)
cooling rate measured in emission to that measured in absorp-tion. Our models suggest that X-rays can heat the gas at largedistances.
The study of I Zw 18 is interesting to put in perspective withthe expected occurrence of binary systems made of compact ob-jects in the first galaxies. The latter are star-forming H i richobjects that share similarities with nearby BCDs, and the heat-ing of the H i region may be dominated by the same mecha-nisms. The number and luminosity of HMXBs is expected to beenhanced in low-metallicity galaxies, and it is therefore likelythat such HMXBs contributed significantly to heating the earlyUniverse (e.g., Mirabel et al. 2011). I Zw 18 provides an inter-esting testbed, but the fraction of escaping X-ray photons needsto be estimated. The ISM is expected to be more porous in dust-and metal-poor environments (e.g., Cormier et al. 2015), whichwould favor both the escape of FUV and X-ray photons.
Acknowledgements. We thank the anonymous referee for constructive feedback.V.L. was supported by a CEA/Marie Curie Eurotalents fellowship when thisstudy was initiated. We acknowledge financial support from “Programme Na-tional de Cosmologie et Galaxies” (PNCG) funded by CNRS/INSU-IN2P3-INP, CEA and CNES, France. M.C. gratefully acknowledges funding from theDeutsche Forschungsgemeinschaft (DFG) through an Emmy Noether ResearchGroup, grant number KR4801/1-1. This research was partly supported by theAgence Nationale pour la Recherche (ANR) through the program SYMPA-TICO (Programme Blanc Projet ANR-11-BS56-0023). We wish to thank JérômeRodriguez and Giulia Migliori for their help with the XMM-Newton spectra.PACS has been developed by a consortium of institutes led by MPE (Ger-many) and including UVIE (Austria); KU Leuven, CSL, IMEC (Belgium); CEA,LAM (France); MPIA (Germany); INAF-IFSI/OAA/OAP/OAT, LENS, SISSA(Italy); IAC (Spain). This development has been supported by the funding agen-cies BMVIT (Austria), ESA-PRODEX (Belgium), CEA/CNES (France), DLR(Germany), ASI/INAF (Italy), and CICYT/MCYT (Spain). HIPE is a joint de-velopment by the Herschel Science Ground Segment Consortium, consisting ofESA, the NASA Herschel Science Center, and the HIFI, PACS and SPIRE con-sortia. This research has made use of the NASA/IPAC Extragalactic Database(NED) which is operated by the Jet Propulsion Laboratory, California Insti-tute of Technology, under contract with the National Aeronautics and SpaceAdministration.
ReferencesAbdo, A. A., Ackermann, M., Ajello, M., et al. 2010, ApJ, 709, L152Abrahamsson, E., Krems, R. V., & Dalgarno, A. 2007, ApJ, 654, 1171Aloisi, A., Savaglio, S., Heckman, T. M., et al. 2003, ApJ, 595, 760Aloisi, A., Annibali, F., Mack, J., et al. 2006, Proc. IAU, 2, 310Annibali, F., Cignoni, M., Tosi, M., et al. 2013, AJ, 146, 144Arnaud, K. A. 1996, in ADASS, ASP Conf. Ser., 101, 17Asplund, M., Grevesse, N., Sauval, A. J., & Scott, P. 2009, ARA&A, 47, 481Bachetti, M. 2016, Astron. Nachr., 337, 349Bachetti, M., Harrison, F. A., Walton, D. J., et al. 2014, Nature, 514, 202Basu-Zych, A. R., Lehmer, B., Fragos, T., et al. 2016, ApJ, 818, 140Bell, E. F. 2003, ApJ, 586, 794Berghea, C. T., Dudik, R. P., Tincher, J., & Winter, L. M. 2013, ApJ, 776, 100Bomans, D. J., & Weis, K. 2002, The High Energy Universe at Sharp Focus:
Chandra Science, held in conjunction with the 113th Annual Meeting of theASP, eds. E. M. Schlegel, & S. Dil Vrtilek (San Francisco: Astronomi), ASPConf. Proc., 262
Brorby, M., Kaaret, P., & Prestwich, A. 2014, MNRAS, 441, 2346Brorby, M., Kaaret, P., & Feng, H. 2015, MNRAS, 448, 3374Brown, T. M., Heap, S. R., Hubeny, I., Lanz, T., & Lindler, D. 2002, ApJ, 579,
L75Cannon, J. M., Skillman, E. D., Garnett, D. R., & Dufour, R. J. 2002, ApJ, 565,
931Cannon, J. M., Walter, F., Skillman, E. D., & van Zee, L. 2005, ApJ, 621, L21Cantalupo, S. 2010, MNRAS, 403, L16Chuzhoy, L., Kuhlen, M., & Shapiro, P. R. 2007, ApJ, 665, L85Combes, F. 2005, in Hunt for Molecules, meeting held in honor of Pierre
Encrenaz [arXiv:astro-ph/0601680]Combes, F., & Pfenniger, D. 1997, A&A, 327, 15Contreras Ramos, R., Annibali, F., Fiorentino, G., et al. 2011, ApJ, 739, 74Cormier, D., Lebouteiller, V., Madden, S. C., et al. 2012, A&A, 548, A20Cormier, D., Madden, S. C., Lebouteiller, V., et al. 2015, A&A, 578, A53
Crowther, P. A., & Hadfield, L. J. 2006, A&A, 449, 711Croxall, K. V., Smith, J. D., Wolfire, M. G., et al. 2012, ApJ, 747, 81De Looze, I., Cormier, D., Lebouteiller, V., et al. 2014, A&A, 568, A62de Paz, A. G., Madore, B. F., & Pevunova, O. 2003, ApJS, 147, 29Díaz-Santos, T., Armus, L., Charmandaris, V., et al. 2013, ApJ, 774, 68Douna, V. M., Pellizza, L. J., Mirabel, I. F., & Pedrosa, S. E. 2015, A&A, 579,
A44Draine, B. T., & Bertoldi, F. 1996, ApJ, 468, 269Draine, B. T., & Li, A. 2007, ApJ, 657, 810Dufour, R. J., & Hester, J. J. 1990, ApJ, 350, 149Farrah, D., Lebouteiller, V., Spoon, H. W. W., et al. 2013, ApJ, 776, 38Ferland, G. J., Korista, K. T., Verner, D. A., et al. 1998, PASP, 110, 761Ferland, G. J., Porter, R. L., van Hoof, P. A. M., et al. 2013, Rev. Mex. Astron.
Astrofis., 49, 137Ferrero, I., Abadi, M. G., Navarro, J. F., Sales, L. V., & Gurovich, S. 2012,
MNRAS, 425, 2817Fiorentino, G., Ramos, R. C., Clementini, G., et al. 2010, ApJ, 711, 808Fisher, D. B., Bolatto, A. D., Herrera-Camus, R., et al. 2014, Nature, 505, 186Forbes, J. C., Krumholz, M. R., Goldbaum, N. J., & Dekel, A. 2016, Nature, 535,
523Fourniol, N., Pakull, M. W., & Motch, C. 1996, Int. Conf. on X-ray Astronomy
and Astrophysics: Röntgenstrahlung from the Universe, 375Fragos, T., Lehmer, B., Tremmel, M., et al. 2013, ApJ, 764, 41Fürst, F., Walton, D. J., Harrison, F. A., et al. 2016, ApJ, 831, L14Galliano, F., Madden, S. C., Jones, A. P., Wilson, C. D., & Bernard, J.-P. 2005,
A&A, 434, 867Galliano, F., Dwek, E., & Chanial, P. 2008, ApJ, 672, 214Galliano, F., Hony, S., Bernard, J.-P., et al. 2011, A&A, 536, A88Garnett, D. R., Skillman, E. D., Dufour, R. J., et al. 1995, ApJ, 443, 64Garnett, D. R., Skillman, E. D., Dufour, R. J., & Shields, G. A. 1997, ApJ, 481,
174Gilfanov, M., Grimm, H.-J., & Sunyaev, R. 2004a, Nucl. Phys. Proc. Suppl., 132,
369Gilfanov, M., Grimm, H. J., & Sunyaev, R. 2004b, MNRAS, 347, L57Glover, S. C. O. 2003, ApJ, 584, 331Glover, S. C. O., & Clark, P. C. 2012, MNRAS, 421, 9Glover, S. C. O., & Clark, P. C. 2014, MNRAS, 437, 9Glover, S. C. O., & Low, M.-M. M. 2011, MNRAS, 412, 337Gordon, K. D., Roman-Duval, J., Bot, C., et al. 2014, ApJ, 797, 85Grenier, I. A. 2005, Science, 307, 1292Grimm, H. J., Gilfanov, M., & Sunyaev, R. 2003, MNRAS, 339, 793Guver, T., & Ozel, F. 2009, MNRAS, 400, 2050Haiman, Z., Rees, M. J., & Loeb, A. 1996, ApJ, 467, 522Heckman, T. M., Robert, C., Leitherer, C., Garnett, D. R., & van der Rydt, F.
1998, ApJ, 503, 646Herrera-Camus, R., Fisher, D. B., Bolatto, A. D., et al. 2012, ApJ, 752, 112Hirschauer, A. S., Salzer, J. J., Skillman, E. D., et al. 2016, ApJ, 822, 108Houck, J. R., Roellig, T. L., van Cleve, J., et al. 2004, ApJS, 154, 18Hu, C.-Y., Naab, T., Glover, S. C. O., Walch, S., & Clark, P. C. 2017, MNRAS,
submitted [arXiv:1701.08779]Hunt, L. K., Dyer, K. K., & Thuan, T. X. 2005, A&A, 436, 837Indriolo, N., Neufeld, D. A., Gerin, M., et al. 2015, ApJ, 800, 40Israel, F. P., & Maloney, P. R. 2011, A&A, 531, A19Israel, F. P., Maloney, P. R., Geis, N., et al. 1996, ApJ, 465, 738Israel, G. L., Esposito, P., Rea, N., et al. 2016, MNRAS, 457, 3448Israel, G. L., Papitto, A., Esposito, P., et al. 2017, MNRAS, 466, L48Izotov, Y. I., & Thuan, T. X. 1998, ApJ, 497, 227Izotov, Y. I., & Thuan, T. X. 1999, ApJ, 511, 639Izotov, Y. I., & Thuan, T. X. 2004, ApJ, 602, 200Izotov, Y. I., & Thuan, T. X. 2016, MNRAS, 457, 64Izotov, Y. I., Chaffee, F. H., Foltz, C. B., et al. 2001, ApJ, 560, 222Jenkins, E. B., & Peimbert, A. 1997, ApJ, 477, 265Jones, A. P., Fanciullo, L., Köhler, M., et al. 2013, A&A, 558, A62Kaaret, P., & Feng, H. 2013, ApJ, 770, 20Kaaret, P., Ward, M. J., & Zezas, A. 2004, MNRAS, 351, L83Kaaret, P., Schmitt, J., & Gorski, M. 2011, ApJ, 741, 10Kalberla, P. M. W., Burton, W. B., Hartmann, D., et al. 2005, A&A, 440, 775Kamaya, H., & Hirashita, H. 2001, PASJ, 53, 483Kehrig, C., Vílchez, J. M., Pérez-Montero, E., et al. 2015, ApJ, 801, L28Kehrig, C., Vílchez, J. M., Pérez-Montero, E., et al. 2016, MNRAS, 459, 2992Kim, S., Staveley-Smith, L., Dopita, M. A., et al. 1998, ApJ, 503, 674King, A., & Lasota, J. 2016, MNRAS, 458, L10King, A. R., Davies, M. B., Ward, M. J., Fabbiano, G., & Elvis, M. 2001, ApJ,
552, L109Körding, E., Falcke, H., & Markoff, S. 2002, A&A, 382, L13Krumholz, M. R. 2012, ApJ, 759, 9Kuhlen, M., Madau, P., & Krumholz, M. R. 2013, ApJ, 776, 34Kunth, D., & Sargent, W. L. W. 1986, ApJ, 300, 496
A45, page 26 of 38

V. Lebouteiller et al.: Neutral gas heating by X-rays in primitive galaxies: Infrared observations of I Zw 18 with Herschel
Kunth, D., Lequeux, J., Sargent, W. L. W., & Viallefond, F. 1994, A&A, 282,709
Launay, J. M., & Roueff, E. 1977, A&A, 56, 289Le Bourlot, J., Le Petit, F., Pinto, C., Roueff, E., & Roy, F. 2012, A&A, 541, A76Lebouteiller, V., Kunth, D., Thuan, T. X., & Désert, J. M. 2009, A&A, 494, 915Lebouteiller, V., Bernard-Salas, J., Sloan, G. C., & Barry, D. J. 2010, PASP, 122,
231Lebouteiller, V., Barry, D. J., Spoon, H. W. W., et al. 2011, ApJS, 196, 8Lebouteiller, V., Cormier, D., Madden, S. C., et al. 2012, A&A, 548, A91Lebouteiller, V., Heap, S., Hubeny, I., & Kunth, D. 2013, A&A, 553, A16Lebouteiller, V., Barry, D. J., Goes, C., et al. 2015, ApJS, 218, 21Lecavelier des Etangs, A., Désert, J.-M., Kunth, D., et al. 2004, A&A, 413, 131Legrand, F., Kunth, D., Roy, J.-R., Mas-Hesse, J. M., & Walsh, J. R. 2000, A&A,
355, 891Lelli, F., Verheijen, M., Fraternali, F., & Sancisi, R. 2012, A&A, 537, A72Leroy, A., Cannon, J., Walter, F., Bolatto, A., & Weiss, A. 2007, ApJ, 663, 990Linden, T., Kalogera, V., Sepinsky, J. F., et al. 2010, ApJ, 725, 1984Luangtip, W., Roberts, T. P., Mineo, S., et al. 2014, MNRAS, 446, 470Machacek, M. E., Bryan, G. L., & Abel, T. 2003, MNRAS, 338, 273Madden, S. C., Poglitsch, A., Geis, N., Stacey, G. J., & Townes, C. H. 1997, ApJ,
483, 200Madden, S. C., Rémy-Ruyer, A., Galametz, M., et al. 2013, PASP, 125, 600Maloney, P., & Black, J. H. 1988, ApJ, 325, 389Mapelli, M. 2013, ArXiv e-prints [arXiv:1302.2238]Mapelli, M., Ripamonti, E., Zampieri, L., Colpi, M., & Bressan, A. 2010,
MNRAS, 408, 234Marconi, M., Musella, I., Fiorentino, G., et al. 2010, ApJ, 713, 615Martin, C. L. 1996, ApJ, 465, 680Mirabel, I. F., Dijkstra, M., Laurent, P., Loeb, A., & Pritchard, J. R. 2011, A&A,
528, A149Okada, Y., Pilleri, P., Berné, O., et al. 2013, A&A, 553, A2Omukai, K., Tsuribe, T., Schneider, R., & Ferrara, A. 2005, ApJ, 626, 627Östlin, G. 2000, ApJ, 535, L99Ott, J., Walter, F., & Brinks, E. 2005, MNRAS, 358, 1453Ott, S., Centre, H. S., & Agency, E. S. 2010, ASP Conf. Ser., 434, 139Pakull, M. W., & Angebault, L. P. 1986, Nature, 322, 511Pakull, M. W., & Mirioni, L. 2002, ArXiv e-prints [arXiv:astro-ph/0202488]Péquignot, D. 2008, A&A, 478, 371Péquignot, D., Ferland, G. J., Netzer, H., et al. 2001, ASP Conf. Ser., 247, 533Petrosian, A. R., Boulesteix, J., Comte, G., Kunth, D., & Lecoarer, E. 1997,
A&A, 318, 390Pfenniger, D., & Combes, F. 1994a, A&A, 285, 79Pfenniger, D., & Combes, F. 1994b, A&A, 285, 94Pilbratt, G. L., Riedinger, J. R., Passvogel, T., et al. 2010, A&A, 518, L1Poglitsch, A., Herrmann, F., Genzel, R., et al. 1996, ApJ, 462, L43Poglitsch, A., Waelkens, C., Geis, N., et al. 2010, A&A, 518, L2Pottasch, S. R., Wesselius, P. R., & van Duinen, R. J. 1979, A&A, 74, L15Prestwich, A. H., Tsantaki, M., Zezas, A., et al. 2013, ApJ, 769, 92
Rémy-Ruyer, A., Madden, S. C., Galliano, F., et al. 2014, A&A, 563, A31Rémy-Ruyer, A., Madden, S. C., Galliano, F., et al. 2015, A&A, 582, A121Reynolds, R. J., Haffner, L. M., & Tufte, S. L. 1999, ApJ, 525, L21Rubio, M., Elmegreen, B. G., Hunter, D. A., et al. 2015, Nature, 525, 218Russell, R. W., Melnick, G., Gull, G. E., & Harwit, M. 1980, ApJ, 240, L99Santoro, F., & Shull, J. M. 2006, ApJ, 643, 26Sawala, T., Frenk, C. S., Fattahi, A., et al. 2015, MNRAS, 448, 2941Schlafly, E. F., & Finkbeiner, D. P. 2011, ApJ, 737, 103Schlegel, D. J., Finkbeiner, D. P., & Davis, M. 1998, ApJ, 500, 525Schneider, R., Hunt, L., & Valiante, R. 2016, MNRAS, 457, 1842Schruba, A., Leroy, A. K., Walter, F., et al. 2012, AJ, 143, 138Searle, L., & Sargent, W. L. W. 1972, ApJ, 173, 25Shaw, G., Ferland, G. J., Abel, N. P., Stancil, P. C., & van Hoof, P. A. M. 2005,
ApJ, 624, 794Shull, J. M., & van Steenberg, M. E. 1985, ApJ, 298, 268Skillman, E. D., & Kennicutt, R. C. J. 1993, ApJ, 411, 655Stacey, G. J., Viscuso, P. J., Fuller, C. E., & Kurtz, N. T. 1985, ApJ, 289, 803Stacey, G. J., Hailey-Dunsheath, S., Ferkinhoff, C., et al. 2010, ApJ, 724, 957Stark, A. A., Gammie, C. F., Wilson, R. W., et al. 1992, ApJS, 79, 77Stasinska, G., & Schaerer, D. 1999, A&A, 351, 72Staveley-Smith, L., Kim, S., Calabretta, M. R., Haynes, R. F., & Kesteven, M. J.
2003, MNRAS, 339, 87Swaters, R. A., Sancisi, R., van Albada, T. S., & van der Hulst, J. M. 2011, ApJ,
729, 118Szécsi, D., Langer, N., Yoon, S.-C., et al. 2015, A&A, 581, A15Thuan, T. X., Bauer, F. E., Papaderos, P., & Izotov, Y. I. 2004, ApJ, 606, 213Thuan, T. X., Lecavelier des Etangs, A., & Izotov, Y. I. 2005, ApJ, 621, 269Tielens, A. G. G. M., & Hollenbach, D. 1985, ApJ, 291, 722Tine, S., Lepp, S., Gredel, R., & Dalgarno, A. 1997, ApJ, 481, 282van Dishoeck, E. F., & Black, J. H. 1988, ApJ, 334, 771van Zee, L., Westpfahl, D., & Haynes, M. P. 1998, AJ, 115, 1000Vanzi, L., Cresci, G., Sauvage, M., & Thompson, R. 2011, A&A, 534, A70Vidal-Madjar, A., Kunth, D., Lecavelier des Etangs, A., et al. 2000, ApJ, 538,
L77Weingartner, J. C., & Draine, B. T. 2001a, ApJ, 548, 296Weingartner, J. C., & Draine, B. T. 2001b, ApJS, 134, 263Werner, M. W., Roellig, T. L., Low, F. J., et al. 2004, ApJS, 154, 1Willingale, R., Starling, R. L. C., Beardmore, A. P., Tanvir, N. R., & O’Brien,
P. T. 2013, MNRAS, 431, 394Wolfe, A. M., Prochaska, J. X., & Gawiser, E. 2003, ApJ, 593, 215Wolfire, M. G., Hollenbach, D., & McKee, C. F. 2010, ApJ, 716,
1191Wu, Y., Charmandaris, V., Hao, L., et al. 2006, ApJ, 639, 157Wu, Y., Charmandaris, V., Hunt, L. K., et al. 2007, ApJ, 662, 952Wu, Y., Bernard-Salas, J., Charmandaris, V., et al. 2008a, ApJ, 673, 193Wu, Y., Charmandaris, V., Houck, J. R., et al. 2008b, ApJ, 676, 970Yun, M. S., Reddy, N. A., & Condon, J. J. 2001, ApJ, 554, 803Zubko, V., Dwek, E., & Arendt, R. G. 2004, ApJS, 152, 211
A45, page 27 of 38

A&A 602, A45 (2017)
Appendix A: Herschel/PACS spectral extraction
A.1. PACS optimal extraction of pointed observations
The Herschel/PACS spectra are shown in Figs. A.1 and A.2. Wederive the following radial velocities, 795±100 km s−1 for [C ii],760 ± 40 km s−1 for [O i], and 795 ± 75 km s−1 for [O iii]. Whilethe spectral resolution of Spitzer is too low to provide a usefulcomparison (>500 km s−1; Sect. 3.2), Lelli et al. (2012) modeledthe H i 21 cm velocity distribution of I Zw 18 main body as adisk with a centroid close to the SE component and a central ve-locity of ≈765 km s−1. The velocity ranges from ≈735 km s−1 to≈790 km s−1 from north to south. Interferometric Hα measure-ments are in agreement with these values (Petrosian et al. 1997).
The optimal extraction uses the “as-built” telescopemonochromatic PSF17 projected on the PACS footprint. The fluxis calibrated by ensuring that the encircled energy fraction issimilar to that in the PACS photometer documentation. The al-gorithm does not take into account optical effects within thespectrometer. Nevertheless, the spectrometer PSF is to first or-der similar to the telescope PSF and it is considered to be a sat-isfactory model when used with a proper flux calibration. Theflux is determined by scaling the normalized PSF to the data.The scaling is performed by using a multi-linear regression al-gorithm, following the method used for the Spitzer/IRS spectrain Lebouteiller et al. (2010). The spaxels located far from thesource centroid do not significantly affect the optimal extractionsince the latter follows the PSF profile. We have validated the al-gorithm on point sources from the HERUS sample (Farrah et al.2013).
The optimal extraction for [C ii], [O i], and [O iii] in I Zw 18is shown in Fig. A.3. From the spatial profiles, we can estimatewhether a source is point-like or not. Practically, only two orthree detected spaxels are sufficient to show evidence of signif-icantly broadened sources (for a single source in the footprint).The emission appears point-like for the three PACS lines. Theintrinsic source extent is estimated to be .6′′.
We can also quantify the contribution from a large-scale lowsurface brightness component by adding a flat emission compo-nent in the optimal extraction algorithm. The large-scale compo-nent is fitted simultaneously with the point source. The flux ofthis large-scale component represents ≈10%, ≈18%, and ≈7%of the total line flux for [C ii], [O i], and [O iii], respectively.We conclude that our measurements of the point source are notsignificantly affected by a potential low surface brightness com-ponent. This finding is also consistent the point-like appearanceof I Zw 18 in the PACS photometry 70 µm and 100 µm bands(with a similar PSF size as the PACS spectroscopy observations)(Rémy-Ruyer et al. 2015).
A.2. Unchopped [O III] 88µm raster map
I Zw 18 was observed independently with Herschel/PACSon April 6th, 2013 as part of program OT2_kcroxall_1 (PI
17 http://pacs.ster.kuleuven.ac.be/pubtool/PSF/
Table A.1. [O iii] 88 µm line flux determinations from the spectral map.
Obs. & Method F1 F3×3 F′3×3Raster 1 (>) 144 ± 33 133 ± 104 (>) 367 ± 104Raster 2 (>) 150 ± 23 335 ± 192 (>) 411 ± 133Raster 3 (>) 236 ± 32 239 ± 173 (>) 505 ± 108Raster 4 (>) 191 ± 22 270 ± 203 (>) 251 ± 59Map Aperture extraction: 205 ± 25
Notes. Fluxes are given in 10−19 W m−2. The values obtained for meth-ods F1 and F′3×3 underestimate the actual flux by an uncertain factor,hence we only quote the values as lower limits.
K. Croxall), for 2.7 ks. The observation (OBSID 1342269442) isa spectral map of the [O iii] 88 µm line. Contrary to our DGSobservations in which observations were performed using thechop/nod mode (with a fast removal of the telescope baseline,Sect. 3.1.1), OBSID 1342269442 uses the unchopped gratingscan mode in which an offset position was observed before andafter the on-source exposure. The map consists of four raster po-sitions shifted by half a spaxel, allowing a better spatial samplingof the line peak emission.
We reduced the data and analyzed it with PACSman.The PACS spectral map projection algorithm is explained inLebouteiller et al. (2012). The final map is shown in Fig. A.4.The emission corresponds to a compact source located at09h34m02.12s/55◦14′27.4′′, i.e., coinciding with the NW clus-ter (Fig. A.4). The source appears mostly point-like, with a slightelongation along the NW-SE axis. This result is consistent withthe Spitzer/IRS results showing that most of the IR ionized gasline emission arises in the NW region and that a relatively lowerfraction arises in the SE region (Sect. 3.2).
The integrated source flux in the reconstructed map is 2.05±0.25 × 10⁻¹⁷ W m−2, close to the value derived from our obser-vation (OBSID 1342253758; Table 2). For testing purposes wehave also extracted the flux in each individual raster position ofthe map using the methods described in Sect. 3.1.2. Only Fopt(optimal extraction) could not be used because only one spaxelis significantly detected in each raster position. Despite the lowerS/N as compared to OBSID 1342253758, we find that the var-ious determinations are overall in good agreement (Table A.1).The error bars on the [O iii] flux from the spectral map obser-vation may be underestimated because of the presence of sys-tematic uncertainties in the baseline used for the fit. Such un-certainties are better canceled in chop/nod observations than inunchopped scan observations because of the fast removal of thetelescope background (see PACS Observer’s manual18). In ouranalysis we only use the chop/nod [O iii] observations describedin Sect. 3.1.1.
18 http://herschel.esac.esa.int/Docs/PACS/html/pacs_om.html
A45, page 28 of 38

V. Lebouteiller et al.: Neutral gas heating by X-rays in primitive galaxies: Infrared observations of I Zw 18 with Herschel
Fig. A.1. Individual Herschel/PACS spaxel background-subtracted spectra for [C ii] 157 µm (top) and [O i] 63 µm (bottom). The observed spectrumis shown in black while the line fit is shown in orange. The number between parentheses indicates the spaxel coordinate within the footprint. Thesecond column is shifted to reflect the PACS footprint projection on the sky.
A45, page 29 of 38

A&A 602, A45 (2017)
Fig. A.2. Individual Herschel/PACS spaxel background-subtracted spectra for [O iii] 88 µm. See Fig. A.1 for the description.
A45, page 30 of 38

V. Lebouteiller et al.: Neutral gas heating by X-rays in primitive galaxies: Infrared observations of I Zw 18 with Herschel
Observed Footprint
0 1 2 3 4 5
0
1
2
3
4
5
Template Footprint
0 1 2 3 4 5
0
1
2
3
4
5
0 5 10 15 20 25Array index
10-20
10-19
10-18
Flu
x s
calin
g facto
r
10-11
10-10
10-9
[W m
-2 s
r-1]
0 5 10 15 20 25Array index
10-20
10-19
10-18
Flu
x s
calin
g facto
r
10-11
10-10
10-9
[W m
-2 s
r-1]
0 5 10 15 20 25Array index
10-20
10-19
10-18
Flu
x s
calin
g facto
r
F = 1.0484977e-17 +/- 1.9962266e-18R_Chi2 = 4.353
Source centroid: 143.50877, 55.240326Offset = -8.000, -9.000
Observed Footprint
0 1 2 3 4 5
0
1
2
3
4
5
Template Footprint
0 1 2 3 4 5
0
1
2
3
4
5
0 5 10 15 20 25Array index
10-20
10-19
10-18
Flu
x s
calin
g facto
r
10-11
10-10
10-9
[W m
-2 s
r-1]
0 5 10 15 20 25Array index
10-20
10-19
10-18
Flu
x s
calin
g facto
r
10-11
10-10
10-9
[W m
-2 s
r-1]
0 5 10 15 20 25Array index
10-20
10-19
10-18
Flu
x s
calin
g facto
r
F = 7.9725827e-18 +/- 1.8452908e-18R_Chi2 = 5.152
Source centroid: 143.50871, 55.240496Offset = 2.000, 2.000
Observed Footprint
0 1 2 3 4 5
0
1
2
3
4
5
Template Footprint
0 1 2 3 4 5
0
1
2
3
4
5
0 5 10 15 20 25Array index
10-19
10-18
10-17
Flu
x s
calin
g facto
r
10-10
10-9
[W m
-2 s
r-1]
0 5 10 15 20 25Array index
10-19
10-18
10-17
Flu
x s
calin
g facto
r
10-10
10-9
[W m
-2 s
r-1]
0 5 10 15 20 25Array index
10-19
10-18
10-17
Flu
x s
calin
g facto
r
F = 2.5289857e-17 +/- 2.7499433e-18R_Chi2 = 4.601
Source centroid: 143.50870, 55.240496Offset = 2.000, 2.000
Fig. A.3. Optimal extraction of [C ii] (top), [O i] (middle), and [O iii] (bottom). For each line the top panel shows the observed footprint (withcrossed spaxels indicating non-detection) and the template footprint (chosen from a library of precomputed projected PSFs). The footprint isshown as a regular grid for display purposes only; in reality, the spaxels are not uniform in size and one row is shifted with respect to the others.The bottom panel shows the spaxel fluxes ordered by flux. Observed values are indicated in orange. The theoretical distribution from the templatefootprint is shown with the black curve. The 3 brightest spaxels suffice to locate the peak.
A45, page 31 of 38

A&A 602, A45 (2017)
06.0 05.0 04.0 03.0 02.0 01.09:34:00.059.0 33:58.0
15:0
0.0
50.0
40.0
30.0
20.0
10.0
55:1
4:0
0.0
RA (J2000)
DE
C (
J2000)
Fig. A.4. The [O iii] map from the program OT2_kcroxall_1 (contours)obtained with Herschel/PACS. The background is the Hubble/ACSF555W image. The beam is shown in the bottom-left.
A45, page 32 of 38
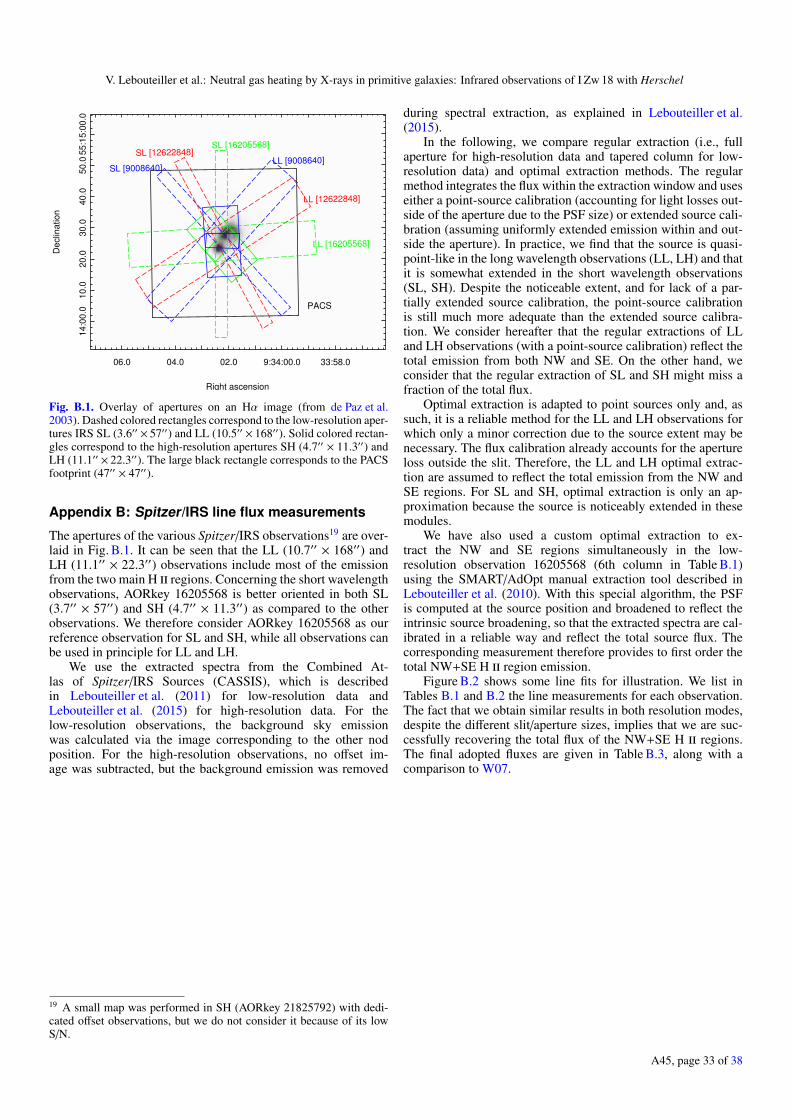
V. Lebouteiller et al.: Neutral gas heating by X-rays in primitive galaxies: Infrared observations of I Zw 18 with Herschel
06.0 04.0 02.0 9:34:00.0 33:58.0
55
:15
:00
.05
0.0
40
.03
0.0
20
.01
0.0
14
:00
.0
Right ascension
De
clin
atio
n
PACS
LL [12622848]
SL [12622848]
LL [16205568]
SL [16205568]
LL [9008640]SL [9008640]
Fig. B.1. Overlay of apertures on an Hα image (from de Paz et al.2003). Dashed colored rectangles correspond to the low-resolution aper-tures IRS SL (3.6′′ × 57′′) and LL (10.5′′ × 168′′). Solid colored rectan-gles correspond to the high-resolution apertures SH (4.7′′ × 11.3′′) andLH (11.1′′ × 22.3′′). The large black rectangle corresponds to the PACSfootprint (47′′ × 47′′).
Appendix B: Spitzer/IRS line flux measurements
The apertures of the various Spitzer/IRS observations19 are over-laid in Fig. B.1. It can be seen that the LL (10.7′′ × 168′′) andLH (11.1′′ × 22.3′′) observations include most of the emissionfrom the two main H ii regions. Concerning the short wavelengthobservations, AORkey 16205568 is better oriented in both SL(3.7′′ × 57′′) and SH (4.7′′ × 11.3′′) as compared to the otherobservations. We therefore consider AORkey 16205568 as ourreference observation for SL and SH, while all observations canbe used in principle for LL and LH.
We use the extracted spectra from the Combined At-las of Spitzer/IRS Sources (CASSIS), which is describedin Lebouteiller et al. (2011) for low-resolution data andLebouteiller et al. (2015) for high-resolution data. For thelow-resolution observations, the background sky emissionwas calculated via the image corresponding to the other nodposition. For the high-resolution observations, no offset im-age was subtracted, but the background emission was removed
19 A small map was performed in SH (AORkey 21825792) with dedi-cated offset observations, but we do not consider it because of its lowS/N.
during spectral extraction, as explained in Lebouteiller et al.(2015).
In the following, we compare regular extraction (i.e., fullaperture for high-resolution data and tapered column for low-resolution data) and optimal extraction methods. The regularmethod integrates the flux within the extraction window and useseither a point-source calibration (accounting for light losses out-side of the aperture due to the PSF size) or extended source cali-bration (assuming uniformly extended emission within and out-side the aperture). In practice, we find that the source is quasi-point-like in the long wavelength observations (LL, LH) and thatit is somewhat extended in the short wavelength observations(SL, SH). Despite the noticeable extent, and for lack of a par-tially extended source calibration, the point-source calibrationis still much more adequate than the extended source calibra-tion. We consider hereafter that the regular extractions of LLand LH observations (with a point-source calibration) reflect thetotal emission from both NW and SE. On the other hand, weconsider that the regular extraction of SL and SH might miss afraction of the total flux.
Optimal extraction is adapted to point sources only and, assuch, it is a reliable method for the LL and LH observations forwhich only a minor correction due to the source extent may benecessary. The flux calibration already accounts for the apertureloss outside the slit. Therefore, the LL and LH optimal extrac-tion are assumed to reflect the total emission from the NW andSE regions. For SL and SH, optimal extraction is only an ap-proximation because the source is noticeably extended in thesemodules.
We have also used a custom optimal extraction to ex-tract the NW and SE regions simultaneously in the low-resolution observation 16205568 (6th column in Table B.1)using the SMART/AdOpt manual extraction tool described inLebouteiller et al. (2010). With this special algorithm, the PSFis computed at the source position and broadened to reflect theintrinsic source broadening, so that the extracted spectra are cal-ibrated in a reliable way and reflect the total source flux. Thecorresponding measurement therefore provides to first order thetotal NW+SE H ii region emission.
Figure B.2 shows some line fits for illustration. We list inTables B.1 and B.2 the line measurements for each observation.The fact that we obtain similar results in both resolution modes,despite the different slit/aperture sizes, implies that we are suc-cessfully recovering the total flux of the NW+SE H ii regions.The final adopted fluxes are given in Table B.3, along with acomparison to W07.
A45, page 33 of 38

A&A 602, A45 (2017)
Table B.1. Spitzer/IRS low-resolution measurements.
Method Regular Optimal Regular Optimal Optimal customa Regular OptimalSL 9008640 9008640 16205568 16205568 16205568 12622848 12622848
(Ap.) (Ap., meth.) (Pref.) (Meth.) (Pref.) (Ap.) (Ap., meth.)H i Huα 12.37 µm <7 <5 8.2 ± 2.5 4.1 ± 1.5 2.6 ± 2.0, 5.5 ± 1.8 7.0 ± 3.5 6.5 ± 3.3[Ne ii] 12.8 µm <9 <6 <2 4.1 ± 1.7 3.0 ± 1.6, 5.2 ± 2.6 8.5 ± 3.5 6.0 ± 3.1[S iv] 10.5 µm <10 <6 40 ± 3 19 ± 2 14 ± 2, 34 ± 2 39 ± 4 29 ± 3[Ar ii] 7.0 µm ... ... <5 <3 ... <5 <3[Ar iii] 9.0 µm <5 <7 <8 <3 <10 <15 <3LL 9008640 9008640 16205568 16205568 16205568 12622848 12622848
(Pref.) (Pref., meth.) (Pref.) (Pref., meth.) (Pref.) (Pref.) (Pref., meth.)[O iv]+[Fe ii] 66 ± 19 52 ± 12 53 ± 22 43 ± 11 53 ± 11 79 ± 20 60 ± 15[Ne iii] 15.5 µm 71 ± 13 66 ± 17 83 ± 8 65 ± 8 76 ± 10 104 ± 41∗ 59 ± 13[Ne iii] 36.0 µm ... <14 <11 <51 46 ± 24∗ 135 ± 70∗ 60 ± 24∗[Ne v] 14.3 µm <14 <21 <7 <8 <8 <21 <19[Ne v] 24.3 µm <23 <14 <10 <8 <9 <18 <13[S iii] 18.7 µm 39 ± 17 46 ± 15 43 ± 6 40 ± 6 47 ± 8 42 ± 17 56 ± 16[S iii] 33.5 µm < 45 65 ± 16 60 ± 10 45 ± 13 48 ± 12 91 ± 30 57 ± 11[Ar iii] 21.8 µm < 29 < 21 <13 <10 <13 <23 <17[Fe iii] 23.0 µm < 28 < 19 <12 <10 <12 <21 <15[Si ii] 34.8 µm <75 96 ± 30 96 ± 14 50 ± 11 65 ± 12 130 ± 63 115 ± 24[Fe ii] 17.9 µm <27 <24 <11 <9 <11 <20 <15H2 S(0) 28.2 µm <17 <14 <10 <7 <7 <14 <11H2 S(1) 17.0 µm <17 < 24 <10 <9 <9 <21 <17
Notes. Fluxes are in units of 10−19 W m−2. Upper limits are 1σ. The line below the AORkey indicates whether the total emission from NW+SE isunderestimated due to aperture mispointing (“Ap.”) or underestimated because the optimal extraction method is adapted to point sources (“Meth.”).The preferred determination is indicated with “Pref.”. Line fluxes followed by asterisks are deemed unreliable due to the presence of spurious fea-tures. Ellipses indicate that the line flux cannot be determined (because of numerous spurious features). (a) NW and SE are extracted simultaneouslyin SL, with their spatial extent accounted for. In LL, a single slightly extended source is used.
Table B.2. Spitzer/IRS high-resolution measurements.
Method Regular (full) Optimal Regular (full) OptimalSH 9008640 9008640 16205568 16205568
(Ap.) (Ap., meth.) (Pref.) (Meth.)H i Huα 12.37 µm 12 ± 6, 18 ± 10 <2, <2 <9, <10 <1, <2[Ne ii] 12.8 µm 17 ± 3∗, 13 ± 3∗ 6 ± 1, <1 ..., ... <2, <1[S iv] 10.5 µm 56 ± 5, 37 ± 4 14 ± 3, 22 ± 4 66 ± 22, 83 ± 25 23 ± 2, 26 ± 1[Ne v] 14.3 µm <3, <3 <1, <1 <3, <3 <1, <1[Ne iii] 15.5 µm 47 ± 4, 44 ± 4 28 ± 1, 28 ± 1 51 ± 7, 78 ± 7 21 ± 3, 28 ± 7[S iii] 18.7 µm 25 ± 3, 32 ± 4 13 ± 2∗, 13 ± 2∗ 37 ± 4, 31 ± 4 21 ± 3, 25 ± 2[Fe ii] 17.9 µm <4, <4 <2, <2 ..., <42 <23, 4 ± 1H2 S(1) 17.0 µm <3, <3 <1, <1 ..., ... ..., ...H2 S(2) 12.3 µm 15 ± 7∗, <7 <2, ... <6, <6 <4, <3LH 9008640 9008640 16205568 16205568
(Pref.) (Pref., meth.) (Pref.) (Pref., meth.)[O iv] 25.89 µm 35 ± 8, 49 ± 11∗ 29 ± 6, 25 ± 4 <91, <86 <53∗, <31∗[Ne iii] 36.0 µm <32, <23 ..., ... <28, <32 <10, < 50[Ne v] 24.3 µm <10, <10 <5, 8 ± 4 <6, <5 <3, <2[S iii] 33.5 µm 59 ± 23, 46 ± 22 37 ± 21, <9 38 ± 11, 52 ± 16 58 ± 8, 43 ± 8[Ar iii] 21.8 µm <8, <9 <5, <4 <7, 16 ± 7 <3, <2[Fe iii] 23.0 µm <6, <11 <5, <4 <7, <4 <3, <2[Si ii] 34.8 µm 64 ± 14, 88 ± 16 65 ± 6, 52 ± 10 111 ± 50, 117 ± 32 95 ± 2∗, 61 ± 10∗[Fe ii] 26.0 µm 34 ± 10, 33 ± 11 <5, <6 16 ± 7, 13 ± 5 <2, <2H2 S(0) 28.2 µm ..., ... <4, <4 <12, <10 <4, <3
Notes. Fluxes are in units of 10−19 W m−2. Upper limits are 1σ. See Table B.1 for the description. For the regular extraction, fluxes are given forthe two nod positions and a point source calibration is used. For optimal extraction, we provide two determinations, one using the simultaneousnod extraction and one using the combined nod spectrum (see Lebouteiller et al. 2015 for more details on the high-resolution optimal extractionalgorithm). The preferred sets of observations and methods are marked in bold.
A45, page 34 of 38

V. Lebouteiller et al.: Neutral gas heating by X-rays in primitive galaxies: Infrared observations of I Zw 18 with Herschel
Fig. B.2. Spectral fits for the most important lines used in this study. Several spectra are available for each Spitzer/IRS line in both low- and high-resolution modes with line widths of ∼3000 km s−1 and ∼400 km s−1 respectively. We selected one spectrum per line for illustrative purposes. Thediamonds show the data and the connected diamonds represent the range used for fitting the line. The many light gray curves show Monte-Carloiterations for determining the line flux uncertainty. The red curve shows the final fit.
A45, page 35 of 38

A&A 602, A45 (2017)
Table B.3. Spitzer/IRS line fluxes.
W07 Low-resolution High-resolutionH i Huα 12.37 µm ... 8.5 ± 3a SL <10 SH[O iv] 25.89 µm 49 ± 3 60 ± 15 LL 45 ± 10 LH
(+[Fe ii])[Ne ii] 12.8 µm 9 ± 1 6 ± 3 SL ∼8b SH[Ne iii] 15.5 µm 46 ± 2 70 ± 15 LL 60 ± 10 SH[Ne iii] 36.0 µm ... <10 LL <25 LH[Ne v] 14.3 µm ... <10 LL <3 SH[Ne v] 24.3 µm ... <10 LL <5 LH[Si ii] 34.8 µm 158 ± 8 95 ± 20 LL 80 ± 30 LH[S iii] 18.7 µm 23 ± 2 40 ± 10 LL 35 ± 10 LH[S iii] 33.5 µm 120 ± 12 55 ± 10 LL 50 ± 10 LH[S iv] 10.5 µm 48 ± 3 43 ± 5 SL 70 ± 20 SH[Ar ii] 7.0 µm ... <5 SL ... ...[Ar iii] 9.0 µm ... <10 SL ... ...[Ar iii] 21.8 µm ... <15 LL < 10 LH[Fe ii] 17.9 µm ... <10 LL <4 SH[Fe ii] 26.0 µm 34 ± 3 60 ± 15 LL 15 ± 5 LH
(+[O iv])[Fe iii] 23.0 µm ... <15 LL <7 LHH2 S(0) 28.2 µm ... <10 LL <10 LHH2 S(1) 17.0 µm ... <10 LL <10 SHH2 S(2) 12.29 µm ... ... SL <10 SH
Notes. Fluxes are in units of 10−19 W m−2. Upper limits are 1σ. Mea-surements by W07 were done with the high-resolution modules. Foreach measurement, we indicate the module used (SL, LL, SH, LH).(a) Assuming that the molecular hydrogen line flux is negligible. (b) Es-timated using optimal extraction of AORkey 9008640 together with acorrection factor based on [Ne iii] 15.5 µm.
A45, page 36 of 38

V. Lebouteiller et al.: Neutral gas heating by X-rays in primitive galaxies: Infrared observations of I Zw 18 with Herschel
Appendix C: X-ray source intrinsic spectrum
In this section, we explore the possible intrinsic X-ray spectrathat are compatible with the XMM-Newton observation, the ob-served optical and IR line fluxes (e.g., [Ne v], [C ii], [O i]),and the H0 column density. All tests are performed with xspec(Arnaud 1996). We are mostly interested in photons with en-ergies between ∼0.1−2 keV because they are absorbed in theH i region. Lower energy photons are absorbed in the H ii regionand higher energy photons freely cross the H ii + H i regions.For this reason, one must bear in mind that the fits to the XMM-Newton observation are actually mostly constrained by the welldetected hard X-ray component that is not absorbed. Recoveringthe soft-X-ray component heavily depends on the model cho-sen that ties the hard- and soft-X-ray components in a physicallymotivated way.
We first consider a diskbb model. For the attenuation inthe Milky Way, we used the foreground Galactic extinction0.091 (Schlegel et al. 1998; Schlafly & Finkbeiner 2011) and theAV -to-column density conversion of Guver & Ozel (2009). Wefind NH ≈ 2× 1020 cm−2, in good agreement with the value mea-sured at 21 cm (e.g., Stark et al. 1992; Kalberla et al. 2005). Thetotal absorbing hydrogen column density in the Milky Way (in-cluding molecular hydrogen) is 2.7×1020 cm−2 (Willingale et al.2013). Figure C.1 shows the diskbb model and the absorbedspectrum. Most of the absorption occurs in I Zw 18, with a col-umn density of 1021 cm−2. The luminosity between 0.3−1 keV is≈1040 erg s−1 and the temperature at the inner edge of the accre-tion disk is 1.04 keV. These results are similar to those found byKaaret & Feng (2013). These values are unchanged when usingthe abundances measured in absorption by HST/COS rather thanabundances measured in emission in the H ii regions (Sect. 2.4).The column density for the diskbb model is somewhat lowerthan expected based on H i absorption measurements. TheX-ray source is located within the stellar cluster (Sect. 3.3), to-ward which the H i column density has been calculated to be2.2 × 1021 cm−2 (Aloisi et al. 2003; Lecavelier des Etangs et al.2004; Lebouteiller et al. 2013). The column density measuredin absorption, however, represents an average value (toward themost FUV-bright stars within the 2′′ COS aperture), which maydiffer from that derived along the line of sight of the X-ray pointsource.
While the diskbb model was preferred in the present study,combinations of blackbodies were also considered. Such combi-nations allow us to fully explore the range of acceptable spectrawithout strong assumptions about the nature of the source. Onthe other hand, using blackbodies ensures that physically unreal-istic sharp features and/or discontinuities are discarded from theanalysis. The single 2 × 10⁶ K blackbody used in P08 neglectedthe hard X-ray tail (&2 keV) which barely impacts on the H i re-gion properties, yet it was a coarse first approximation, given theX-ray data now available.
Using a sum of four blackbodies with temperatures between0.05−1.20 keV, and column densities between 0−1 × 1022 cm−2
proved to provide sufficient flexibility (nine free parameters).Figure C.2a shows a broad selection of combinations providingthe best χ2. Unlike for the diskbb model, owing to the lackof physical ties between the hard and soft X-ray components,the soft X-rays are little constrained and a degeneracy devel-ops between the coldest blackbody fluxes and the (here poorlydefined) column density. We constrain further the column den-sity in the X-ray model assuming that the X-ray source lieswithin the NW stellar cluster, hence assuming a column den-sity of 1−2.5 × 1021 cm−2 (Fig. C.2b). Two different spectral
10 100 1000Energy [eV]
10-6
10-5
10-4
Con
tinuu
m [x
1041
erg
s-1eV
-1]
IntrinsicAbsorbed (IZw18)
Absorbed (MW)Absorbed (total)
Fig. C.1. X-ray spectrum of I Zw 18. The X-ray emission is calculatedwith a diskbb model (distribution of blackbodies from an accretiondisk). The diamonds show the unfolded XMM-Newton spectrum. Thedashed red line shows the spectrum absorbed by I Zw 18 alone while thedotted red line shows the spectrum absorbed by the Milky Way alone.The top red solid line shows the intrinsic (unabsorbed) X-ray spectrum.The thick black curve shows the sum of the radiation field components(two blackbodies in the optical and the X-ray source).
shapes emerge, one with a soft X-ray excess and one with-out. In Fig. C.2b, the X-ray luminosity range of the models is1.1−2.5 × 1040 erg s−1. Below ∼0.3 keV, the freedom left by thexspec approach with a blackbody combination is considerable.
Some of the degeneracy can be lifted using signatures ofthe X-ray emission on the surrounding ISM. Our standard pho-toionization model, in which the diskbb X-ray spectrum isadopted, predicts fluxes 3−5 times weaker than the observationalupper limits for the high-ionization lines [Ne v] 14.3 µm and[Ne v] 24.3 µm (Table 8). Also, no detection has been reportedfor [Ne v] 3426 Å in I Zw 18. Producing [Ne v] in the H ii regionrequires photon energies &100 eV. In Fig. C.2b, the soft X-rayexcess allowed by xspec around 100 eV can exceed the relativelyflat diskbb model spectrum by more than one order of magni-tude. Obviously, at least some of these blackbody combinationsproduce much stronger [Ne v] lines than diskbb. Figure C.2cshows the combination spectra allowed when the additional con-straint brought by the upper limit on [Ne v] is applied to pho-toionization model results20.
This illustrates how detailed photoionization modeling of theISM around X-ray sources may provide powerful constraints onthe low-energy tail of X-ray source spectra and therefore on thenature and properties of such sources. A preliminary inferencefrom the present analysis is that the soft X-ray spectrum of theI Zw 18-NW source cannot much exceed that corresponding tothe diskbbmodel. Not only is the solution above ∼0.4 keV welldefined, but it turns out that, within a factor of ∼2.5, the set ofblackbody combinations follows the diskbb spectrum down toless than 0.1 keV. The fall of the blackbody combinations towardlow energies, essentially an artefact of the fitting assumptions, isof no consequence since the stellar continuum then dominates.
20 Since the additional constraint provided by [Ne v] is related to theionized gas irradiated by the X-ray source, we need to consider the X-ray luminosity around 4 × 1040 erg s−1 used in our modeling (Sect. 5.3).
A45, page 37 of 38

A&A 602, A45 (2017)
Fig. C.2. Test of the 4-blackbody combinations with xspec. The open diamonds show the diskbb model while the filled diamonds show theXMM-Newton unfolded spectrum. The set of best blackbody combinations with column density <1022 cm−2 are shown in panel a). A subset withcolumn densities between 1−2.5 × 1021 cm−2 is shown in panel b). Only in the combinations left in panel c) are the associated photoionizationmodels fulfilling the observed upper limit on the [Ne v] flux. For simplicity, we plot the X-ray spectra of panel c) with the same luminosity as forthe other panels, but in reality an increased luminosity is used, according to Sect. 5.3. In each panel, the colors indicate the relative variation of theχ2 among the plotted combinations (lower χ2 in red, larger χ2 in blue).
A45, page 38 of 38