Response Delays and the Structure of Transcription Networks
10
Response Delays and the Structure of Transcription Networks Nitzan Rosenfeld and Uri Alon* Department of Molecular Cell Biology and Department of Physics of Complex Systems Weizmann Institute of Science Rehovot 76100, Israel Sensory transcription networks generally control rapid and reversible gene expression responses to external stimuli. Developmental transcrip- tion networks carry out slow and irreversible temporal programs of gene expression during development. It is important to understand the design principles that underlie the structure of sensory and developmental tran- scription networks. Cascades, which are chains of regulatory reactions, are a basic structural element of transcription networks. When comparing databases of sensory and developmental transcription networks, a strik- ing difference is found in the distribution of cascade lengths. Here, we suggest that delay times in the responses of the network present a design constraint that influences the network architecture. We experimentally studied the response times in simple cascades constructed of well-charac- terized repressors in Escherichia coli. Accurate kinetics at high temporal resolution was measured using green fluorescent protein (GFP) reporters. We find that transcription cascades can show long delays of about one cell-cycle time per cascade step. Mathematical analysis suggests that such a delay is characteristic of cascades that are designed to minimize the response times for both turning-on and turning-off gene expression. The need to achieve rapid reversible responses in sensory transcription net- works may help explain the finding that long cascades are very rare in databases of E. coli and Saccharomyces cerevisiae sensory transcription net- works. In contrast, long cascades are common in developmental transcrip- tion networks from sea urchin and from Drosophila melanogaster . Response delay constraints are likely to be less important for developmental net- works, since they control irreversible processes on the timescale of cell- cycles. This study highlights a fundamental difference between the archi- tecture of sensory and developmental transcription networks. q 2003 Elsevier Science Ltd. All rights reserved Keywords: design principles; systems-biology; network motifs; computational biology *Corresponding author Introduction Gene expression is governed by networks of transcription interactions between transcription factors and the genes they regulate. These net- works are complex, and unifying design principles are needed to help make sense of their structure. 1–14 One way to approach this is to attempt to under- stand the structure of transcription networks based on databases of experimentally verified interactions. For Escherichia coli, this was pioneered by the work of Collado-Vides and associates, 6 based on an extensive transcription database. Recently, an approach for identifying the basic building blocks of networks, termed network motifs, has been presented, 15,16 and applied to tran- scription networks. Network motifs were defined as patterns that occur more often in the real net- work than in randomized networks. 17 – 20 Three types of recurring network motif circuits were found to describe most of the E. coli and Saccharomyces cerevisiae transcription networks. 15,16,21 Each of these network motifs was suggested to have a specific function in information processing. One important feature of the network archi- tecture is the distribution of transcription cascade lengths. Transcription cascades are defined by a set of transcription factors that regulate each other 0022-2836/03/$ - see front matter q 2003 Elsevier Science Ltd. All rights reserved E-mail address of the corresponding author: [email protected] Abbreviations used: IPTG, isopropyl-b-D- thiogalactopyranoside; GFP, green fluorescent protein. doi:10.1016/S0022-2836(03)00506-0 J. Mol. Biol. (2003) 329, 645–654
-
Upload
khangminh22 -
Category
Documents
-
view
3 -
download
0
Transcript of Response Delays and the Structure of Transcription Networks
Response Delays and the Structure ofTranscription Networks
Nitzan Rosenfeld and Uri Alon*
Department of Molecular CellBiology and Department ofPhysics of Complex SystemsWeizmann Institute of ScienceRehovot 76100, Israel
Sensory transcription networks generally control rapid and reversiblegene expression responses to external stimuli. Developmental transcrip-tion networks carry out slow and irreversible temporal programs of geneexpression during development. It is important to understand the designprinciples that underlie the structure of sensory and developmental tran-scription networks. Cascades, which are chains of regulatory reactions,are a basic structural element of transcription networks. When comparingdatabases of sensory and developmental transcription networks, a strik-ing difference is found in the distribution of cascade lengths. Here, wesuggest that delay times in the responses of the network present a designconstraint that influences the network architecture. We experimentallystudied the response times in simple cascades constructed of well-charac-terized repressors in Escherichia coli. Accurate kinetics at high temporalresolution was measured using green fluorescent protein (GFP) reporters.We find that transcription cascades can show long delays of about onecell-cycle time per cascade step. Mathematical analysis suggests that sucha delay is characteristic of cascades that are designed to minimize theresponse times for both turning-on and turning-off gene expression. Theneed to achieve rapid reversible responses in sensory transcription net-works may help explain the finding that long cascades are very rare indatabases of E. coli and Saccharomyces cerevisiae sensory transcription net-works. In contrast, long cascades are common in developmental transcrip-tion networks from sea urchin and from Drosophila melanogaster. Responsedelay constraints are likely to be less important for developmental net-works, since they control irreversible processes on the timescale of cell-cycles. This study highlights a fundamental difference between the archi-tecture of sensory and developmental transcription networks.
q 2003 Elsevier Science Ltd. All rights reserved
Keywords: design principles; systems-biology; network motifs;computational biology*Corresponding author
Introduction
Gene expression is governed by networks oftranscription interactions between transcriptionfactors and the genes they regulate. These net-works are complex, and unifying design principlesare needed to help make sense of their structure.1–14
One way to approach this is to attempt to under-stand the structure of transcription networksbased on databases of experimentally verifiedinteractions. For Escherichia coli, this was pioneeredby the work of Collado-Vides and associates,6
based on an extensive transcription database.Recently, an approach for identifying the basicbuilding blocks of networks, termed networkmotifs, has been presented,15,16 and applied to tran-scription networks. Network motifs were definedas patterns that occur more often in the real net-work than in randomized networks.17 – 20 Threetypes of recurring network motif circuitswere found to describe most of the E. coli andSaccharomyces cerevisiae transcriptionnetworks.15,16,21 Each of these network motifs wassuggested to have a specific function ininformation processing.
One important feature of the network archi-tecture is the distribution of transcription cascadelengths. Transcription cascades are defined by aset of transcription factors that regulate each other
0022-2836/03/$ - see front matter q 2003 Elsevier Science Ltd. All rights reserved
E-mail address of the corresponding author:[email protected]
Abbreviations used: IPTG, isopropyl-b-D-thiogalactopyranoside; GFP, green fluorescent protein.
doi:10.1016/S0022-2836(03)00506-0 J. Mol. Biol. (2003) 329, 645–654
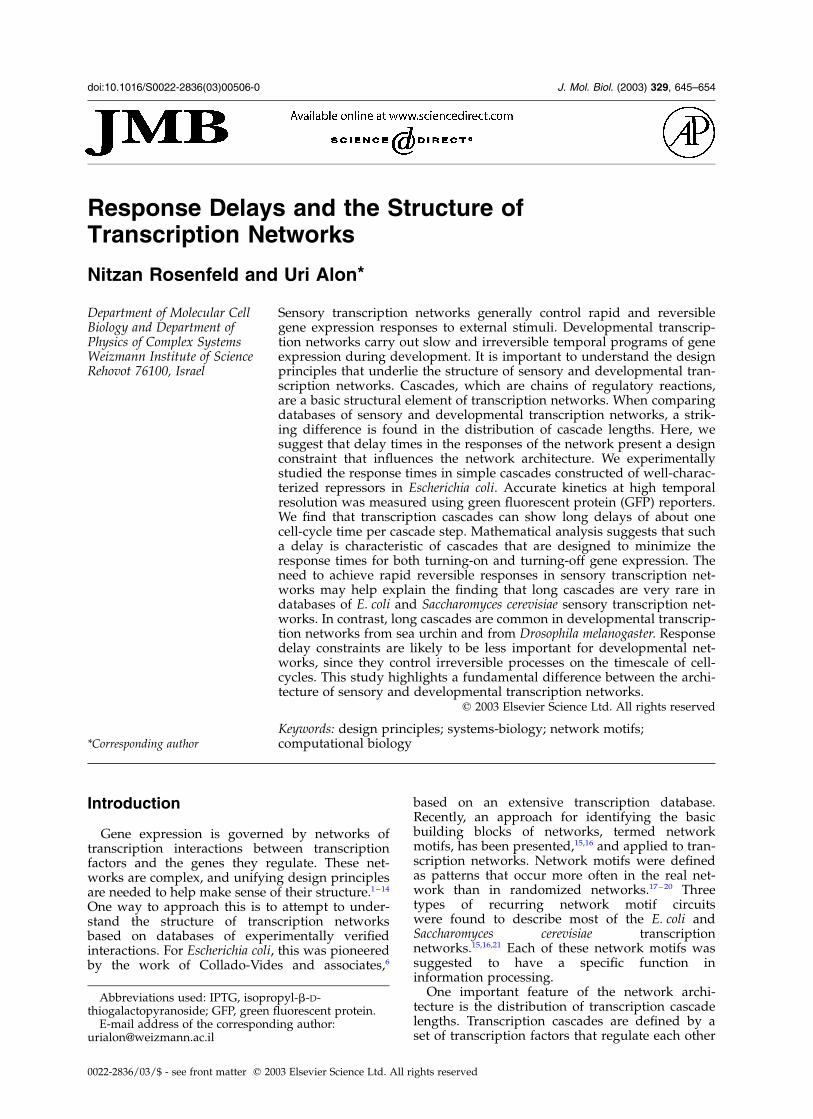
sequentially.21,22 The first-step transcription factoractivates or represses the second-step transcriptionfactor, which in turn activates or represses thethird-step transcription factor, and so on. In astudy of the architecture of the transcriptionnetwork of E. coli, it was observed that it has astrikingly shallow architecture, with most genesregulated by overlapping cascades of length oneto two.15 Here, we find that two different databasesof transcription interactions in yeast (YPD,23 and agenome-wide location analysis experiment21) alsohave a shallow architecture where long cascadesare much less common than short cascades. Whatis the reason for a design that favors shortcascades?
To address this, we experimentally study theresponse times of simple transcription cascades.To study the properties of transcription cascadesin a setting that minimizes unknown coupling tothe rest of the cell, we constructed a two-stepcascade made of well-characterized bacterialrepressors.22 A similar approach has been used forstudying oscillators,24 toggle switches,25 negativeautoregulation circuits26,27 and logic-gates28 inbacteria. We find that cascades can show longdelays. We suggest that response delays in tran-scription cascades constitute one of the design con-straints that underlie the observed transcriptionnetwork architecture. We show that developmentaltranscription networks, in which response delaysmay not be an important constraint, have adifferent architecture, with many long cascades.
Results
Long cascades are rare in databases of E. coliand S. cerevisiae transcription interactions
We analyzed a database of experimentallyverified direct transcription interactions in E. coli,15
which includes 578 interactions and 423 operons.The database consists of operons regulated by atleast one transcription factor. For each operon, wetraced the maximal number of transcription stepsback to a transcription factor that is not regulatedby any other transcription factor. We find that themost common cascades in E. coli are one-stepcascades. Two-step cascades are less common, andlonger cascades are rare (Figure 1(a)).
A similar cascade distribution was found in adatabase of transcription interactions for the yeastS. cerevisiae, based on transcription interactionsfrom the YPD literature-based database,23 whichincludes 1052 interactions and 678 genes. Again,one-step cascades are the most common, and theoccurrence of longer cascades decreases sharplywith length (Figure 1(b)). We analyzed the networkof interactions found by a genome-wide locationanalysis experiment in yeast,21 which includes3969 interactions and 2341 genes. This datasetdoes not have the methodological biases that mayoccur in databases of interactions collected from
the literature, such as the possibility of unsaturatedgenetics. In this database, there are more longcascades than in the literature database, whichmay reflect multi-step processes in yeast.29 On thewhole, short cascades are much more frequentthan long ones (Figure 1(c)).21
Long cascades are common in transcriptionnetworks for sea urchin and Drosophilaearly development
Developmental networks in metazoans are wellknown to contain elaborate transcription cascades.4
In order to compare such networks to the sensorynetworks of micro-organisms on an equal footing,we enumerated the cascades in the rather limiteddevelopmental databases that are currently avail-able. We analyzed the transcription network gov-erning endomesoderm specification during seaurchin development.30 This network contains 44genes and 82 interactions. We find that long cas-cades are about as common as short cascades(Figure 1(d)). We analyzed the network of theestablished direct transcription interactionsinvolved in early development in Drosophila mela-nogaster, based on the direct interactions listed inthe GeNet database. This network is comprised of45 direct interactions and 25 genes, including gapgenes (hunchback, kruppel, knirps, giant, torso, tailless,and caudal), pair-rule genes (hairy, odd-paired, odd-skipped, fushi tarazu, even-skipped, paired, runt, andsloppy-paired), homeotic genes (Ultrabithorax,empty-spiracles, Abdominal-A, and Antennapedia),and segment polarity genes (decapentaplegic,engrailed, wingless, and gooseberry-neuro), as well asbicoid and achete. In this network, long cascadesare at least as common as short ones (Figure 1(e)).
Experiment on a two-step cascade shows adelay of about one cell-cycle per step
To study the response kinetics of a cascade, weused a synthetic repressor cascade in E. coli (Figure2). In this cascade, the LacI repressor, madechromosomally by the cell, represses a geneencoding the Tet repressor. The Tet repressor, inturn, represses the tet promoter that controls areporter gene (gfp) encoding the green fluorescentprotein (GFP) (Figure 2(a) and (c)).31 The promoteractivity of the first step in the cascade is monitoredin a separate reporter strain carrying the lacpromoter controlling gfp and a blank tet promoterplasmid (Figure 2(b)). The system is induced byadding external saturating isopropyl-b-D-thio-galactopyranoside (IPTG) to inactivate the LacIrepressor. Fluorescence and cell density duringexponential growth were measured automaticallyfrom both reporter strains in a multi-well fluori-meter at about a five minute resolution.32,33 Afterinduction, the fluorescence from the first stepreporter rises, and fluorescence from the secondstep is repressed after a delay (Figure 3).
We repeated this experiment at two different
646 Sensory Transcription Networks
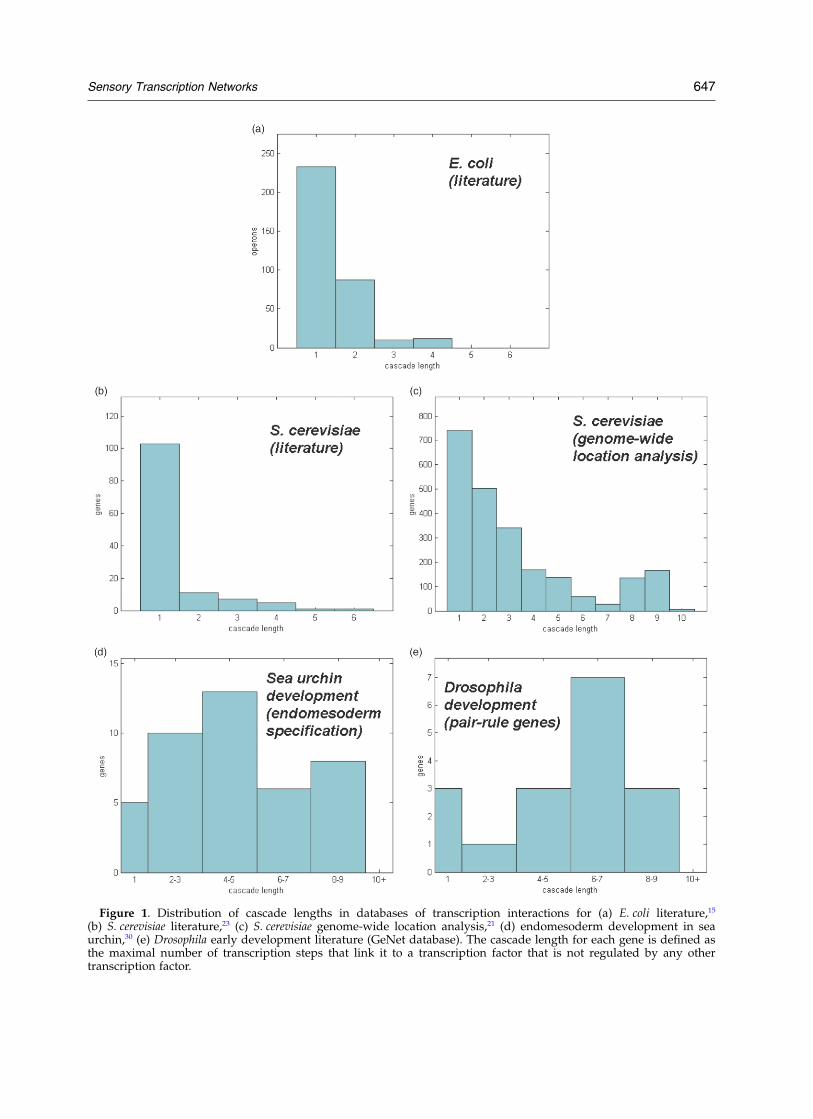
Figure 1. Distribution of cascade lengths in databases of transcription interactions for (a) E. coli literature,15
(b) S. cerevisiae literature,23 (c) S. cerevisiae genome-wide location analysis,21 (d) endomesoderm development in seaurchin,30 (e) Drosophila early development literature (GeNet database). The cascade length for each gene is defined asthe maximal number of transcription steps that link it to a transcription factor that is not regulated by any othertranscription factor.
Sensory Transcription Networks 647
Figure 2. (a) Plasmid system usedto implement the two-step tran-scription cascade. A chromosomallyencoded LacI repressor repressesthe tetR gene. The TetR repressorrepresses the second step promoter,which controls a gfp reporter gene.The inducer IPTG binds and inacti-vates lacI, causing the expressionof tetR and the repression of thereporter gene. (b) The first-stepreporter strain bears a gfp geneunder control of the lac promoter(step 1). As a control, this strainbears a compatible plasmid withthe tet promoter upstream of amulticloning site (MCS). (c) Thesecond-step reporter strain carriestetR under the lac promoter, andthe second plasmid with tet pro-moter controlling gfp. The twostrains allow the monitoring of thepromoter activity of both cascadesteps in parallel.
Figure 3. Normalized GFP fluor-escence from the two cascade stepsas a function of time. At time ¼ 0the inducer IPTG was added. Thefirst step shows an increase in fluor-escence, and the second step showsa delayed decrease in fluorescence.Continuous lines, 36 8C; brokenlines, 27 8C.
648 Sensory Transcription Networks
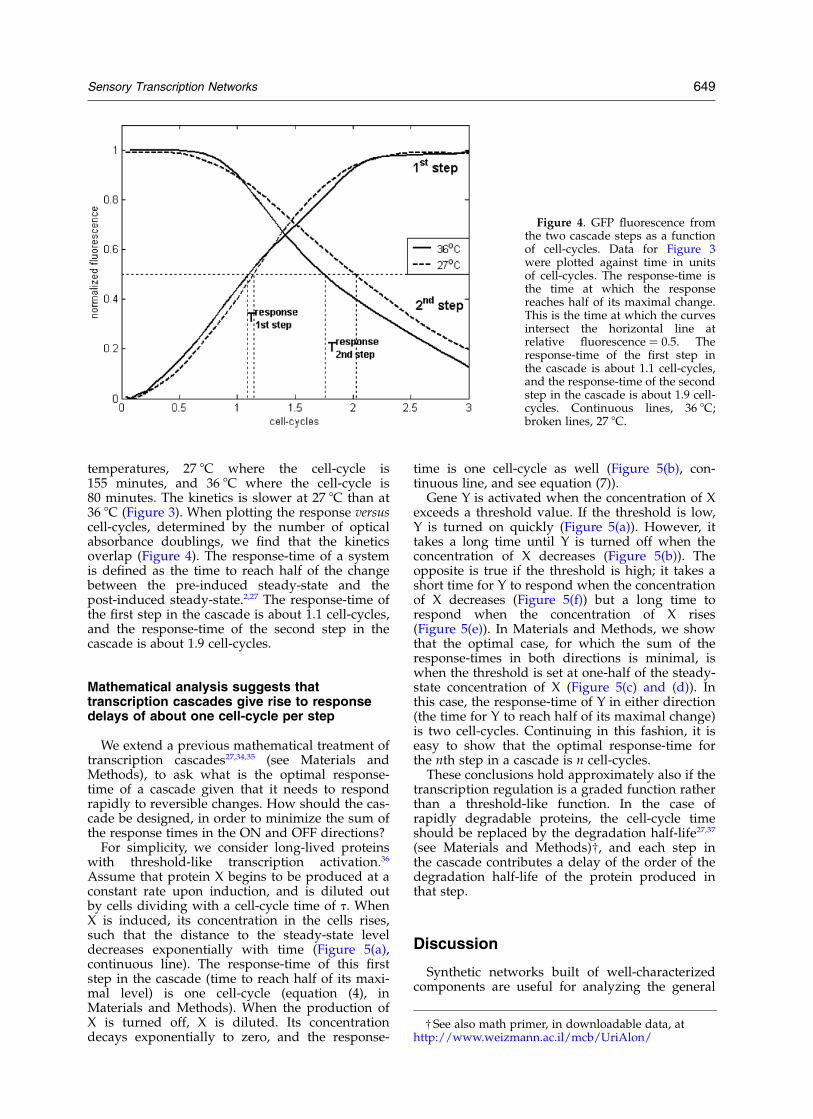
temperatures, 27 8C where the cell-cycle is155 minutes, and 36 8C where the cell-cycle is80 minutes. The kinetics is slower at 27 8C than at36 8C (Figure 3). When plotting the response versuscell-cycles, determined by the number of opticalabsorbance doublings, we find that the kineticsoverlap (Figure 4). The response-time of a systemis defined as the time to reach half of the changebetween the pre-induced steady-state and thepost-induced steady-state.2,27 The response-time ofthe first step in the cascade is about 1.1 cell-cycles,and the response-time of the second step in thecascade is about 1.9 cell-cycles.
Mathematical analysis suggests thattranscription cascades give rise to responsedelays of about one cell-cycle per step
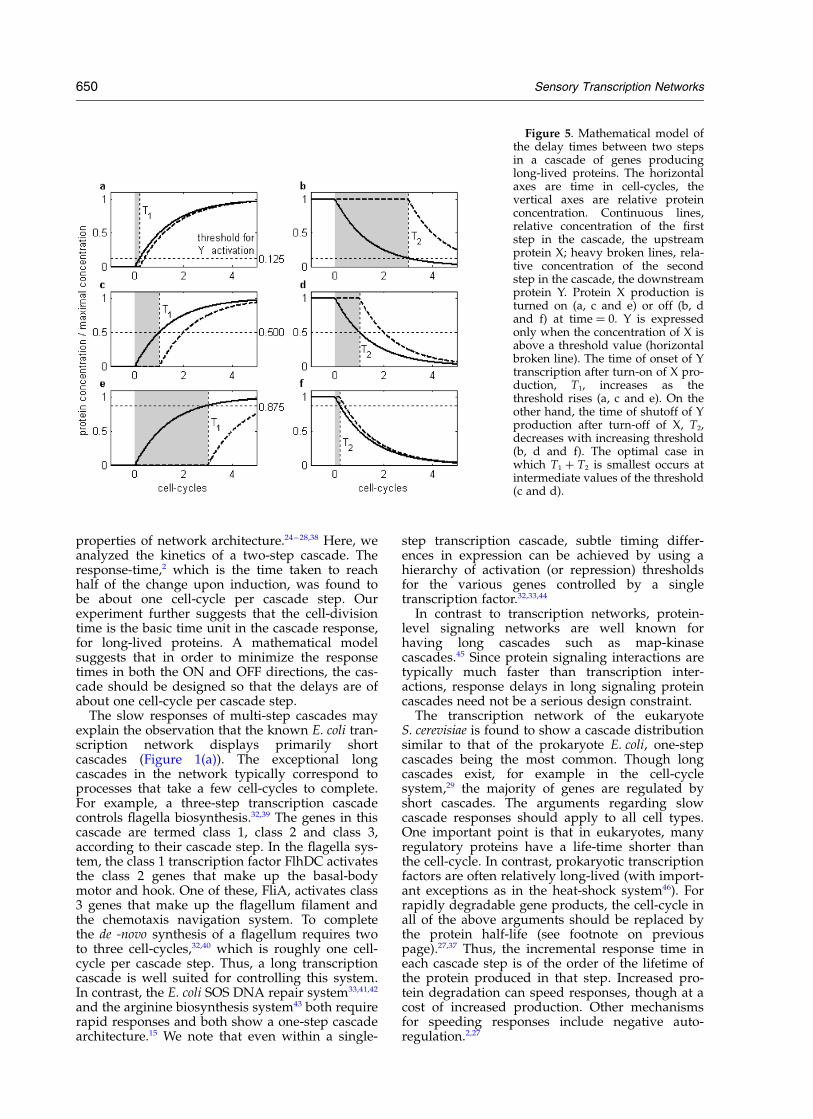
We extend a previous mathematical treatment oftranscription cascades27,34,35 (see Materials andMethods), to ask what is the optimal response-time of a cascade given that it needs to respondrapidly to reversible changes. How should the cas-cade be designed, in order to minimize the sum ofthe response times in the ON and OFF directions?
For simplicity, we consider long-lived proteinswith threshold-like transcription activation.36
Assume that protein X begins to be produced at aconstant rate upon induction, and is diluted outby cells dividing with a cell-cycle time of t. WhenX is induced, its concentration in the cells rises,such that the distance to the steady-state leveldecreases exponentially with time (Figure 5(a),continuous line). The response-time of this firststep in the cascade (time to reach half of its maxi-mal level) is one cell-cycle (equation (4), inMaterials and Methods). When the production ofX is turned off, X is diluted. Its concentrationdecays exponentially to zero, and the response-
time is one cell-cycle as well (Figure 5(b), con-tinuous line, and see equation (7)).
Gene Y is activated when the concentration of Xexceeds a threshold value. If the threshold is low,Y is turned on quickly (Figure 5(a)). However, ittakes a long time until Y is turned off when theconcentration of X decreases (Figure 5(b)). Theopposite is true if the threshold is high; it takes ashort time for Y to respond when the concentrationof X decreases (Figure 5(f)) but a long time torespond when the concentration of X rises(Figure 5(e)). In Materials and Methods, we showthat the optimal case, for which the sum of theresponse-times in both directions is minimal, iswhen the threshold is set at one-half of the steady-state concentration of X (Figure 5(c) and (d)). Inthis case, the response-time of Y in either direction(the time for Y to reach half of its maximal change)is two cell-cycles. Continuing in this fashion, it iseasy to show that the optimal response-time forthe nth step in a cascade is n cell-cycles.
These conclusions hold approximately also if thetranscription regulation is a graded function ratherthan a threshold-like function. In the case ofrapidly degradable proteins, the cell-cycle timeshould be replaced by the degradation half-life27,37
(see Materials and Methods)†, and each step inthe cascade contributes a delay of the order of thedegradation half-life of the protein produced inthat step.
Discussion
Synthetic networks built of well-characterizedcomponents are useful for analyzing the general
Figure 4. GFP fluorescence fromthe two cascade steps as a functionof cell-cycles. Data for Figure 3were plotted against time in unitsof cell-cycles. The response-time isthe time at which the responsereaches half of its maximal change.This is the time at which the curvesintersect the horizontal line atrelative fluorescence ¼ 0.5. Theresponse-time of the first step inthe cascade is about 1.1 cell-cycles,and the response-time of the secondstep in the cascade is about 1.9 cell-cycles. Continuous lines, 36 8C;broken lines, 27 8C.
† See also math primer, in downloadable data, athttp://www.weizmann.ac.il/mcb/UriAlon/
Sensory Transcription Networks 649
properties of network architecture.24 – 28,38 Here, weanalyzed the kinetics of a two-step cascade. Theresponse-time,2 which is the time taken to reachhalf of the change upon induction, was found tobe about one cell-cycle per cascade step. Ourexperiment further suggests that the cell-divisiontime is the basic time unit in the cascade response,for long-lived proteins. A mathematical modelsuggests that in order to minimize the responsetimes in both the ON and OFF directions, the cas-cade should be designed so that the delays are ofabout one cell-cycle per cascade step.
The slow responses of multi-step cascades mayexplain the observation that the known E. coli tran-scription network displays primarily shortcascades (Figure 1(a)). The exceptional longcascades in the network typically correspond toprocesses that take a few cell-cycles to complete.For example, a three-step transcription cascadecontrols flagella biosynthesis.32,39 The genes in thiscascade are termed class 1, class 2 and class 3,according to their cascade step. In the flagella sys-tem, the class 1 transcription factor FlhDC activatesthe class 2 genes that make up the basal-bodymotor and hook. One of these, FliA, activates class3 genes that make up the flagellum filament andthe chemotaxis navigation system. To completethe de -novo synthesis of a flagellum requires twoto three cell-cycles,32,40 which is roughly one cell-cycle per cascade step. Thus, a long transcriptioncascade is well suited for controlling this system.In contrast, the E. coli SOS DNA repair system33,41,42
and the arginine biosynthesis system43 both requirerapid responses and both show a one-step cascadearchitecture.15 We note that even within a single-
step transcription cascade, subtle timing differ-ences in expression can be achieved by using ahierarchy of activation (or repression) thresholdsfor the various genes controlled by a singletranscription factor.32,33,44
In contrast to transcription networks, protein-level signaling networks are well known forhaving long cascades such as map-kinasecascades.45 Since protein signaling interactions aretypically much faster than transcription inter-actions, response delays in long signaling proteincascades need not be a serious design constraint.
The transcription network of the eukaryoteS. cerevisiae is found to show a cascade distributionsimilar to that of the prokaryote E. coli, one-stepcascades being the most common. Though longcascades exist, for example in the cell-cyclesystem,29 the majority of genes are regulated byshort cascades. The arguments regarding slowcascade responses should apply to all cell types.One important point is that in eukaryotes, manyregulatory proteins have a life-time shorter thanthe cell-cycle. In contrast, prokaryotic transcriptionfactors are often relatively long-lived (with import-ant exceptions as in the heat-shock system46). Forrapidly degradable gene products, the cell-cycle inall of the above arguments should be replaced bythe protein half-life (see footnote on previouspage).27,37 Thus, the incremental response time ineach cascade step is of the order of the lifetime ofthe protein produced in that step. Increased pro-tein degradation can speed responses, though at acost of increased production. Other mechanismsfor speeding responses include negative auto-regulation.2,27
Figure 5. Mathematical model ofthe delay times between two stepsin a cascade of genes producinglong-lived proteins. The horizontalaxes are time in cell-cycles, thevertical axes are relative proteinconcentration. Continuous lines,relative concentration of the firststep in the cascade, the upstreamprotein X; heavy broken lines, rela-tive concentration of the secondstep in the cascade, the downstreamprotein Y. Protein X production isturned on (a, c and e) or off (b, dand f) at time ¼ 0. Y is expressedonly when the concentration of X isabove a threshold value (horizontalbroken line). The time of onset of Ytranscription after turn-on of X pro-duction, T1, increases as thethreshold rises (a, c and e). On theother hand, the time of shutoff of Yproduction after turn-off of X, T2,decreases with increasing threshold(b, d and f). The optimal case inwhich T1 þ T2 is smallest occurs atintermediate values of the threshold(c and d).
650 Sensory Transcription Networks
In the single-celled organisms considered above,transcription cascades mainly orchestrateresponses to fluctuating external conditions (weterm these sensory networks). The decisions madeby sensory networks are mostly reversible. Incontrast, multi-cellular organisms have extensivetranscription networks that are responsible forthe cell-fate decisions made duringdevelopment.30,47 – 51 Since developmental networksoften control processes on the order of many cell-cycle times, response-time considerations may beless important than in sensory networks. Suchdelays may even prove useful during developmentby providing the cells with a measure of the num-ber of cell-cycles that have elapsed.† Furthermore,since developmental networks often control pro-cesses of deciding cell-fates, which are seldomreversed, they need not optimize both turn-on andturn-off times and can achieve fast timing in onedirection by having appropriate activationthresholds (Figure 5). Therefore, developmentaltranscription networks need not be biased againstlong cascades. We find that developmental net-works from sea urchin and from Drosophila indeedhave a cascade structure that is very differentfrom that of sensory networks. Developmental net-works display many long cascades. Long cascadesare also found in developmental-like processes insingle-celled organisms, as in the sigma-factor cas-cade regulating sporulation in the bacterium Bacil-lus subtillis.52 The difference in the cascadedistributions suggests a fundamental differencebetween the architecture of sensory and develop-mental transcription factor networks. It would befascinating to discover additional constraints andthe design principles they induce in biologicalnetworks.
Materials and Methods
Measuring cascade lengths in network databases
For each gene in the network, we traced back alongthe network by an exhaustive search of all the possibledirect transcription cascades that affect this gene, andfound the longest cascade that affects each gene. Whena closed transcription loop was encountered, the cascadewas terminated. The E. coli network15 contains no closedloops, though in rare cases two transcription factors areencoded on the same operon, such as marA and marR,and regulate their own promoter, thus effectively regu-lating each other. The two yeast networks contain severalloops (the YPD23 network contains one two-gene and onethree-gene loop, and the genome-wide locationnetwork21 contains two two-gene loops and one three-gene loop). The much smaller developmental networkscontain several closed loops (which may function as irre-versible switches25,30,36): the sea urchin network30 has twoclosed two-gene loops and the even smaller drosophila
network contains four two-gene loops and one three-gene loop. The drosophila network is from the GeNetdatabase (www.csa.ru/Inst/gorb_dep/inbios/genet/s8prrl.htm).
Bacterial strains and plasmids
E. coli strain Dh5a which expresses lacI was used in allexperiments. Plasmid pairs pZS12-gfp þ pZE21-MCS,pZS12-TetR þ pZE21-gfp were used for the cascade inFigure 2(b) and (c).24 All plasmids were based on themodular system described by Lutz & Bujard.53 For theGFP variant used in this study, the biosynthetic delaybetween transcription onset and production of the firstfluorescent GFP molecules is estimated at severalminutes.32,54 For pZS12-TetR and pZS12-gfp, the gene ofinterest (tetR or gfp31) was cloned into a vector containingthe low-copy SC101 origin of replication, ampicillin-resistance gene, and PLlacO1 promoter.53 pZE21-MCSIcontained a ColE1 origin, kanamycin-resistance gene, PL-
tetO1 promoter, and a multiple-cloning site, which wasreplaced by gfp to create pZE21-gfp. This plasmid con-figuration was chosen because it allows functionalmodulation of step 2 by IPTG. Other plasmid choices,such as placing tetR on a high-copy number plasmid,were non-functional, in the sense that they failed tocover much of the range of tet-promoter activity undervarious levels of IPTG (data not shown).22
Growth conditions and measurements
Cultures (2 ml) inoculated from single colonies weregrown overnight in defined medium (M9 salts, 0.05%(w/v) Casamino acids, 0.5% (v/v) glycerol, 2 mMMgSO4, 0.1 mM CaCl2, 1.5 mM thiamine and antibiotics:50 mg/ml of kanamycin, 100 mg/ml of ampicillin) at37 8C with shaking at 300 rpm. The cultures were diluted1:100 (v/v) into fresh medium in a flat-bottom 96-wellplate, at a final volume of 200 ml per well, and weregrown at 36 8C or 27 8C with shaking. The bacteria wereallowed to reach 1/10 stationary absorbance, and thendiluted 1:10 (v/v) into fresh medium at the same tem-perature, with and without 1 mM IPTG to induce thelac promoter. Cultures were grown in a Wallac Victor2multiwell fluorimeter set at 36 8C or 27 8C, and assayedwith an automatically repeating protocol of shaking(2 mm double-orbital, normal speed, 20 seconds) absorb-ance (A) measurements (600 nm filter, 0.1 second,absorbance through approximately 0.5 cm of fluid),fluorescence readings (485 nm and 535 nm filters, 0.5second, CW lamp energy 10,000 units), and a delay (100seconds).32,33 The time between repeated measurementswas 5.75 minutes. Triplicates were averaged, and thefluorescence of the induced cultures was divided by thefluorescence of the uninduced culture. The relative fluor-escence was normalized for each strain to a maximumlevel of one and a minimum of zero. The day-to-dayreproducibility error of the normalized fluorescence isabout 0.1.
Optimal response times for rapid turn-on andturn-off
Assume that protein X is produced at a rate of Sx, isdegraded with a half-life of tdeg,x, and is diluted out bycells dividing with a cell-cycle time of t. The basicequation describing X, the concentration of protein X,
† Drosophila early development occurs in the absenceof cell divisions, and the time-scale may therefore be setby the degradation times of the regulatory proteins.
Sensory Transcription Networks 651
is†:27,35
dX=dt ¼ Sx 2 axx ð1Þ
in which the first term describes production and thesecond degradation plus dilution, with an effectivedilution rate of ax ¼ log(2)/tx, where the effective life-time is tx ¼ (1/t þ 1/tdeg,x)
21. For rapidly degradableproteins with half-life tdeg,x much smaller than t, theeffective life-time is approximately equal to the degra-dation half-life tx < tdeg,x. For long-lived proteins withtdeg,x q t, the effective life-time is tx < t. The bio-synthetic delays between transcription onset and pro-duction of the first active product can usually beneglected because it is much shorter than typical proteinlife-times.
The solution, assuming that X(t ¼ 0) ¼ 0, is(Figure 5(a), continuous line):
XðtÞ ¼ Xmax½1 2 expð2axtÞ� ð2Þ
where the steady-state level is Xmax ¼ Sx/ax. Theresponse-time of this first step in the cascade, which isthe time needed to reach Xmax/2:
XðTON;1Þ ¼ Xmax½1 2 expð2axTON;1Þ� ¼ Xmax=2 ð3Þ
is one effective life-time unit (one cell-cycle for long-lived proteins):
TON;1 ¼ tx ðfirst stepÞ ð4Þ
When the production of X is turned off, its concentrationdecays exponentially (Figure 5(b), continuous line):
XðtÞ ¼ Xmaxexpð2axtÞ ð5Þ
and the response-time:
XðTOFF;1Þ ¼ Xmax expð2axTOFF;1Þ ¼ Xmax=2 ð6Þ
is one effective life-time unit as well (one cell-cycle forlong-lived proteins):
TOFF;1 ¼ tx ðfirst stepÞ ð7Þ
Suppose now that X activates the transcription of adownstream gene Y, with a degradation half-life of tdeg,y,an effective life-time of:
ty ¼ ð1=tþ 1=tdeg;yÞ21
and an effective dilution rate of ay ¼ log(2)/ty. Assume,for simplicity, that X activates the transcription of Ythrough a step-like activation function,34,36 so that Y isproduced at a rate Sy when X is at a greater than athreshold concentration Xthreshold, and at rate zero other-wise. More elaborate models, using Hill functions, pro-duce the same qualitative results. The concentration ofprotein Y (Y) changes according to:
dY=dt ¼ FðXÞ2 ayY; where FðX , XthresholdÞ
¼ 0 and FðX . XthresholdÞ ¼ Sy ð8Þ
The time when Y begins to be expressed is the time T1
when X crosses the threshold (Figure 5(a), (c) and (e)).This occurs when:
XðT1Þ ¼ Xmax½1 2 expð2axT1Þ� ¼ Xthreshold ð9Þ
The solution for T1 is:
T1 ¼ 2ð1=axÞlogð1 2 Xthreshold=XmaxÞ ð10Þ
After time T1, Y rises with a constant production rate Sy,and has simple exponential kinetics (as in equation (2)):
YðtÞ ¼ Ymax½1 2 expð2ayðt 2 T1ÞÞ� ð11Þ
with Ymax ¼ Sy/ay. The time to reach half-way to themaximal level, Ymax, is shifted by T1 with respect to theresponse-time of X (equation (2)), and is equal to T1 plusone effective protein life-time unit (T1 þ t for long-livedprotein Y):
TON;2 ¼ ty þ T1 ðsecond stepÞ ð12Þ
Conversely, Y is turned off when X crosses the thresholdfrom above. Assume that at t ¼ 0, protein X is at itssteady-state level X ¼ Xmax, and then the production ofX is turned off. The concentration of X decays asequation (4). It crosses the threshold Xthreshold at a timeT2 given by (Figure 5(b), (d) and (f)):
T2 ¼ 2ð1=axÞlogðXthreshold=XmaxÞ ð13Þ
At time T2, the production of Y ceases and it decays bydilution. Since the kinetics of Y is like that of X (equation(5)), only shifted by a time T2, the corresponding OFFtime is given by:
TOFF;2 ¼ ty þ T2 ðsecond stepÞ ð14Þ
The sum of the ON and OFF response-times is:
Tsum ¼ TON;2 þ TOFF;2 ¼ 2ty þ T1 þ T2 ð15Þ
The bigger Xthreshold is, the bigger is TON and the smaller isTOFF (Figure 5). The activation threshold where Tsum isminimal can be found by differentiating Tsum by Xthreshold,and seeking d(Tsum)/d(Xthreshold) ¼ 0. The optimalthreshold that gives minimal Tsum is:
Xoptimalthreshold ¼ Xmax=2 ð16Þ
At this optimal solution the response-times in the ONand OFF directions are equal to each other, and bothequal to the sum of the effective life-times of the twoproteins:
TON;2;optimal ¼ TOFF;2;optimal ¼ tx þ ty ð17Þ
For long-lived proteins, tx ¼ ty ¼ t, and we obtain:
TON;2;optimal ¼ TOFF;2;optimal ¼ tx þ ty ¼ 2t ð18Þ
Continuing in this fashion, it is easy to show that theresponse-time for the nth step in the cascade of long-lived proteins is n cell-cycles:
TON;n;optimal ¼ TOFF;n;optimal ¼ nt ð19Þ
Acknowledgements
We thank M. Elowitz and S. Leibler for plasmidsand discussions. We thank S. Shen-Orr andP. Bashkin for their contributions. We thankO. Hobart, M. Surette and all members of ourlaboratory for discussions. This work was sup-ported by the Minerva fellowship, the IsraelScience Foundation and the Human FrontiersScience Project. We dedicate this work to thememory of Yasha (Yaakov) Rosenfeld.
References
1. Savageau, M.A. (1971). Parameter sensitivity as a
652 Sensory Transcription Networks
criterion for evaluating and comparing the perform-ance of biochemical systems. Nature, 229, 542–544.
2. Savageau, M. A. (1974). Comparison of classical andautogenous systems of regulation in inducibleoperons. Nature, 252, 546–549.
3. Savageau, M. A. (1977). Design of molecular controlmechanisms and the demand for gene expression.Proc. Natl Acad. Sci. USA, 74, 5647–5651.
4. Arnone, M. I. & Davidson, E. H. (1997). The hard-wiring of development: organization and functionof genomic regulatory systems. Development, 124,1851–1864.
5. Savageau, M. (2001). Design principles for elemen-tary gene circuits: elements, methods, and examples.Chaos, 11, 142–159.
6. Thieffry, D., Huerta, A. M., Perez-Rueda, E. &Collado-Vides, J. (1998). From specific gene regu-lation to genomic networks: a global analysis oftranscriptional regulation in Escherichia coli. Bioessays,20, 433–440.
7. Hartwell, L. H., Hopfield, J. J., Leibler, S. & Murray,A. W. (1999). From molecular to modular cell biology.Nature, 402, C47–C52.
8. McAdams, H. H. & Arkin, A. (2000). Towards acircuit engineering discipline. Curr. Biol. 10,R318–R320.
9. Barkai, N. & Leibler, S. (1997). Robustness in simplebiochemical networks. Nature, 387, 913–917.
10. Alon, U., Surette, M. G., Barkai, N. & Leibler, S.(1999). Robustness in bacterial chemotaxis. Nature,397, 168–171.
11. Yi, T. M., Huang, Y., Simon, M. I. & Doyle, J. (2000).Robust perfect adaptation in bacterial chemotaxisthrough integral feedback control. Proc. Natl Acad.Sci. USA, 97, 4649–4653.
12. Barkai, N. & Leibler, S. (2000). Circadian clockslimited by noise. Nature, 403, 267–268.
13. Vilar, J. M., Kueh, H. Y., Barkai, N. & Leibler, S.(2002). Mechanisms of noise-resistance in geneticoscillators. Proc. Natl Acad. Sci. USA, 99, 5988–5992.
14. Wyrick, J. J. & Young, R. A. (2002). Deciphering geneexpression regulatory networks. Curr. Opin. Genet.Dev. 12, 130–136.
15. Shen-Orr, S. S., Milo, R., Mangan, S. & Alon, U.(2002). Network motifs in the transcriptional regu-lation network of Escherichia coli. Nature Genet. 31,64–68.
16. Milo, R., Shen-Orr, S., Itzkovitz, S., Kashtan, N.,Chklovskii, D. & Alon, U. (2002). Network motifs:simple building blocks of complex networks. Science,298, 824–827.
17. Wagner, A. & Fell, D. A. (2001). The small worldinside large metabolic networks. Proc. R. Soc. ser. B,268, 1803–1810.
18. Guelzim, N., Bottani, S., Bourgine, P. & Kepes, F.(2002). Topological and causal structure of the yeasttranscriptional regulatory network. Nature Genet. 31,60–63.
19. Newman, M. E., Strogatz, S. H. & Watts, D. J. (2001).Random graphs with arbitrary degree distributionsand their applications. Phys. Rev. ser. E, 64, 026118.
20. Maslov, S. & Sneppen, K. (2002). Specificity andstability in topology of protein networks. Science,296, 910–913.
21. Lee, T. I., Rinaldi, N. J., Robert, F., Odom, D. T., Bar-Joseph, Z., Gerber, G. K. et al. (2002). Transcriptionalregulatory networks in Saccharomyces cerevisiae.Science, 298, 799–804.
22. Yokobayashi, Y., Weiss, R. & Arnold, F. H. (2002).
Directed evolution of a genetic circuit. Proc. NatlAcad. Sci. USA, 99, 16587–16591.
23. Costanzo, M. C., Crawford, M. E., Hirschman, J. E.,Kranz, J. E., Olsen, P., Robertson, L. S. et al. (2001).YPD, PombePD and WormPD: model organismvolumes of the BioKnowledge library, an integratedresource for protein information. Nucl. Acids Res. 29,75–79.
24. Elowitz, M. B. & Leibler, S. (2000). A synthetic oscil-latory network of transcriptional regulators. Nature,403, 335–338.
25. Gardner, T. S., Cantor, C. R. & Collins, J. J. (2000).Construction of a genetic toggle switch in Escherichiacoli. Nature, 403, 339–342.
26. Becskei, A. & Serrano, L. (2000). Engineering stabilityin gene networks by autoregulation. Nature, 405,590–593.
27. Rosenfeld, N., Elowitz, M. B. & Alon, U. (2002).Negative autoregulation speeds the response timesof transcription networks. J. Mol. Biol. 323, 785–793.
28. Guet, C. C., Elowitz, M. B., Hsing, W. & Leibler, S.(2002). Combinatorial synthesis of genetic networks.Science, 296, 1466–1470.
29. Simon, I., Barnett, J., Hannett, N., Harbison, C. T.,Rinaldi, N. J., Volkert, T. L. et al. (2001). Serial regu-lation of transcriptional regulators in the yeast cellcycle. Cell, 106, 697–708.
30. Davidson, E. H., Rast, J. P., Oliveri, P., Ransick, A.,Calestani, C., Yuh, C. H. et al. (2002). A genomicregulatory network for development. Science, 295,1669–1678.
31. Cormack, B. P., Valdivia, R. H. & Falkow, S. (1996).FACS-optimized mutants of the green fluorescentprotein (GFP). Gene, 173, 33–38.
32. Kalir, S., McClure, J., Pabbaraju, K., Southward, C.,Ronen, M., Leibler, S. et al. (2001). Ordering genes ina flagella pathway by analysis of expression kineticsfrom living bacteria. Science, 292, 2080–2083.
33. Ronen, M., Rosenberg, R., Shraiman, B. I. & Alon, U.(2002). Assigning numbers to the arrows: parameter-izing a gene regulation network by using accurateexpression kinetics. Proc. Natl Acad. Sci. USA, 99,10555–10560.
34. McAdams, H. H. & Arkin, A. (1998). Simulation ofprokaryotic genetic circuits. Annu. Rev. Biophys.Biomol. Struct. 27, 199–224.
35. Monod, J., Pappenheimer, A. & Cohen-Bazire, G.(1953). La cinetique de la biosynthese de lab-Galactosidase chez E. coli consideree comme fonc-tion de la croissance. Biochim. Biophys. Acta, 9.
36. Thomas, R. (1973). Boolean formalization of geneticcontrol circuits. J. Theor. Biol. 42, 563–585.
37. Schimke, R. (1969). On the roles of synthesis anddegradation in regulation of enzyme levels inmammalian tissues. Curr. Top. Cell. Regul. 1, 77–124.
38. Judd, E. M., Laub, M. T. & McAdams, H. H. (2000).Toggles and oscillators: new genetic circuit designs.Bioessays, 22, 507–509.
39. Aldridge, P. & Hughes, K. T. (2002). Regulation offlagellar assembly. Curr. Opin. Microbiol. 5, 160–165.
40. Aizawa, S. I. & Kubori, T. (1998). Bacterial flagella-tion and cell division. Genes Cells, 3, 625–634.
41. Little, J. W. & Mount, D. W. (1982). The SOS regulat-ory system of Escherichia coli. Cell, 29, 11–22.
42. Courcelle, J., Khodursky, A., Peter, B., Brown, P. O. &Hanawalt, P. C. (2001). Comparative gene expressionprofiles following UV exposure in wild-type andSOS-deficient Escherichia coli. Genetics, 158, 41–64.
43. Makarova, K. S., Mironov, A. A. & Gelfand, M. S.
Sensory Transcription Networks 653

(2001). Conservation of the binding site for thearginine repressor in all bacterial lineages. GenomeBiol. 2, 13.
44. Laub, M. T., McAdams, H. H., Feldblyum, T., Fraser,C. M. & Shapiro, L. (2000). Global analysis of thegenetic network controlling a bacterial cell cycle.Science, 290, 2144–2148.
45. Ferrell, J. E., Jr & Machleder, E. M. (1998). The bio-chemical basis of an all-or-none cell fate switch inXenopus oocytes. Science, 280, 895–898.
46. Bourke Arnvig, K., Pedersen, S. & Sneppen, K.(2000). Thermodynamics of heat-shock response.Phys. Rev. Letters, 84, 3005–3008.
47. Lawrence, P. (1992). The Making of a Fly, BlackwellScience Inc, Oxford.
48. Maduro, M. F. & Rothman, J. H. (2002). Makingworm guts: the gene regulatory network of theCaenorhabditis elegans endoderm. Dev. Biol. 246,68–85.
49. Kim, S. K., Lund, J., Kiraly, M., Duke, K., Jiang, M.,
Stuart, J. M. et al. (2001). A gene expression map forCaenorhabditis elegans. Science, 293, 2087–2092.
50. Rothenberg, E. V. & Anderson, M. K. (2002).Elements of transcription factor network design forT-lineage specification. Dev. Biol. 246, 29–44.
51. Tomancak, P., Beaton, A., Weiszmann, R., Kwan, E.,Shu, S., Lewis, S. E. et al. (2002). Systematicdetermination of patterns of gene expressionduring Drosophila embryogenesis. Genome Biol, 3,research0088.1–research0088.14.
52. Stragier, P. & Losick, R. (1990). Cascades of sigmafactors revisited. Mol. Microbiol. 4, 1801–1806.
53. Lutz, R. & Bujard, H. (1997). Independent and tightregulation of transcriptional units in Escherichia colivia the LacR/O, the TetR/O and AraC/I1-I2 regulat-ory elements. Nucl. Acids Res. 25, 1203–1210.
54. Cluzel, P., Surette, M. & Leibler, S. (2000). An ultra-sensitive bacterial motor revealed by monitoringsignaling proteins in single cells. Science, 287,1652–1655.
Edited by M. Yaniv
(Received 30 January 2003; received in revised form 1 April 2003; accepted 9 April 2003)
654 Sensory Transcription Networks