Hsp70 overexpression sequesters AIF and reduces neonatal hypoxic/ischemic brain injury
Upload
independentCategory
view
3download
0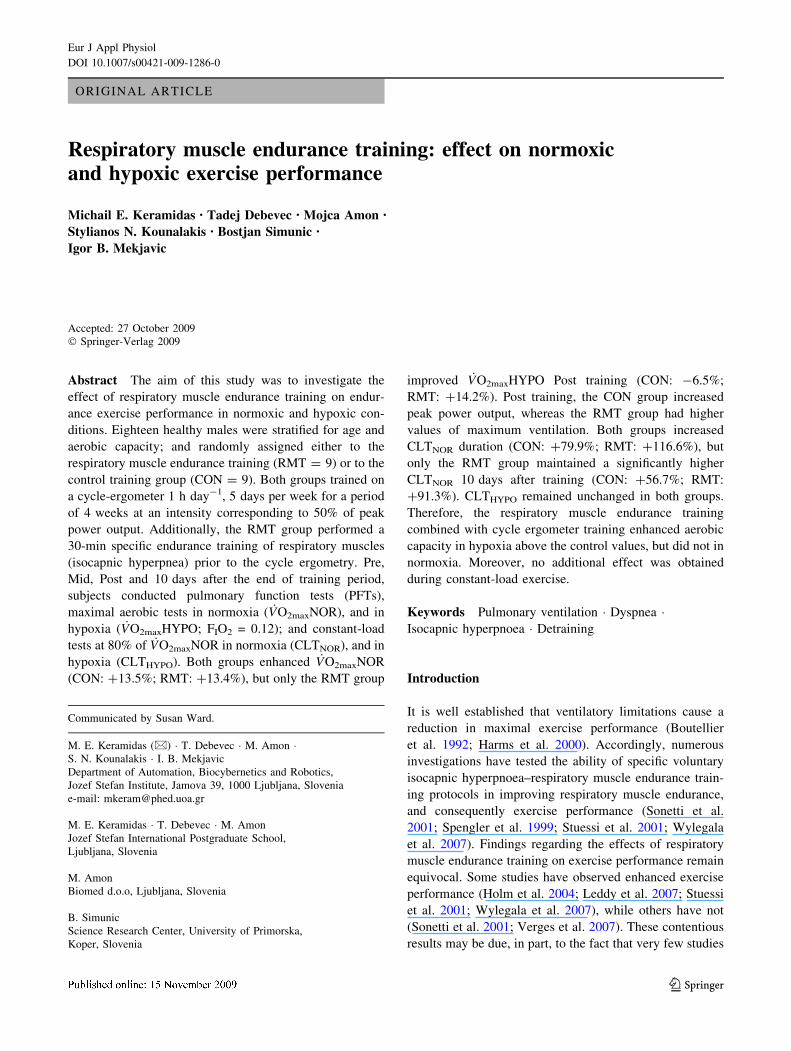
ORIGINAL ARTICLE
Respiratory muscle endurance training: effect on normoxicand hypoxic exercise performance
Michail E. Keramidas • Tadej Debevec • Mojca Amon •
Stylianos N. Kounalakis • Bostjan Simunic •
Igor B. Mekjavic
Accepted: 27 October 2009
� Springer-Verlag 2009
Abstract The aim of this study was to investigate the
effect of respiratory muscle endurance training on endur-
ance exercise performance in normoxic and hypoxic con-
ditions. Eighteen healthy males were stratified for age and
aerobic capacity; and randomly assigned either to the
respiratory muscle endurance training (RMT = 9) or to the
control training group (CON = 9). Both groups trained on
a cycle-ergometer 1 h day-1, 5 days per week for a period
of 4 weeks at an intensity corresponding to 50% of peak
power output. Additionally, the RMT group performed a
30-min specific endurance training of respiratory muscles
(isocapnic hyperpnea) prior to the cycle ergometry. Pre,
Mid, Post and 10 days after the end of training period,
subjects conducted pulmonary function tests (PFTs),
maximal aerobic tests in normoxia ( _VO2maxNOR), and in
hypoxia ( _VO2maxHYPO; FIO2 = 0.12); and constant-load
tests at 80% of _VO2maxNOR in normoxia (CLTNOR), and in
hypoxia (CLTHYPO). Both groups enhanced _VO2maxNOR
(CON: ?13.5%; RMT: ?13.4%), but only the RMT group
improved _VO2maxHYPO Post training (CON: -6.5%;
RMT: ?14.2%). Post training, the CON group increased
peak power output, whereas the RMT group had higher
values of maximum ventilation. Both groups increased
CLTNOR duration (CON: ?79.9%; RMT: ?116.6%), but
only the RMT group maintained a significantly higher
CLTNOR 10 days after training (CON: ?56.7%; RMT:
?91.3%). CLTHYPO remained unchanged in both groups.
Therefore, the respiratory muscle endurance training
combined with cycle ergometer training enhanced aerobic
capacity in hypoxia above the control values, but did not in
normoxia. Moreover, no additional effect was obtained
during constant-load exercise.
Keywords Pulmonary ventilation � Dyspnea �Isocapnic hyperpnoea � Detraining
Introduction
It is well established that ventilatory limitations cause a
reduction in maximal exercise performance (Boutellier
et al. 1992; Harms et al. 2000). Accordingly, numerous
investigations have tested the ability of specific voluntary
isocapnic hyperpnoea–respiratory muscle endurance train-
ing protocols in improving respiratory muscle endurance,
and consequently exercise performance (Sonetti et al.
2001; Spengler et al. 1999; Stuessi et al. 2001; Wylegala
et al. 2007). Findings regarding the effects of respiratory
muscle endurance training on exercise performance remain
equivocal. Some studies have observed enhanced exercise
performance (Holm et al. 2004; Leddy et al. 2007; Stuessi
et al. 2001; Wylegala et al. 2007), while others have not
(Sonetti et al. 2001; Verges et al. 2007). These contentious
results may be due, in part, to the fact that very few studies
Communicated by Susan Ward.
M. E. Keramidas (&) � T. Debevec � M. Amon �S. N. Kounalakis � I. B. Mekjavic
Department of Automation, Biocybernetics and Robotics,
Jozef Stefan Institute, Jamova 39, 1000 Ljubljana, Slovenia
e-mail: [email protected]
M. E. Keramidas � T. Debevec � M. Amon
Jozef Stefan International Postgraduate School,
Ljubljana, Slovenia
M. Amon
Biomed d.o.o, Ljubljana, Slovenia
B. Simunic
Science Research Center, University of Primorska,
Koper, Slovenia
123
Eur J Appl Physiol
DOI 10.1007/s00421-009-1286-0
have used an appropriate control or placebo group (Sheel
2002). In particular, they have either omitted a control
group (Boutellier et al. 1992; Boutellier and Piwko 1992;
Spengler et al. 1999), used a control group that conducted
sham training (Holm et al. 2004; Leddy et al. 2007; Sonetti
et al. 2001; Verges et al. 2007; Wylegala et al. 2007), or a
control group that performed no intervention (Holm et al.
2004; Stuessi et al. 2001).
Although the physiological mechanisms underlying the
purported improvements in exercise performance after
respiratory muscle endurance training remain unresolved
(Sheel 2002), factors that have been implicated include
improved ratings of breathing perception (Holm et al.
2004), improved ventilatory efficiency (Boutellier et al.
1992; Boutellier and Piwko 1992; Wylegala et al. 2007),
delay of respiratory muscle fatigue (Verges et al. 2008,
2007) and a change in the distribution of the blood flow to
respiratory and locomotor muscles (Dempsey et al. 2006;
St Croix et al. 2000).
Since hypoxic exercise enhances the ventilatory
response (Babcock et al. 1995; Cibella et al. 1996; Vogi-
atzis et al. 2007) and the associated metabolic demand of
the respiratory muscles (Roussos 1985), we reasoned that
respiratory muscle training might contribute to the
enhancement of exercise performance at altitude. This is
supported, to a degree, by the findings of Downey et al.
(2007), who reported that inspiratory muscle training
improves structural (increased maximal inspiratory mouth
pressure and diaphragm thickness) and functional (reduced
oxygen uptake, cardiac output, ventilation; and increased
arterial oxygen saturation) characteristics of pulmonary
function, but does not affect the time to exhaustion during
hypoxic exercise. However, the effect of voluntary iso-
capnic hyperpnoea mode of respiratory muscle training on
altitude exercise remains unresolved, although extrapola-
tion of the above findings would suggest that it might
enhance aerobic hypoxic performance via the mechanism
of increased breathing endurance.
Therefore, the purpose of this study was to evaluate
whether respiratory muscle endurance training combined
with a submaximal-exercise training regimen could improve
normoxic and hypoxic endurance performance. The meth-
odological novelty of the present study is the combined
respiratory and exercise training in one training session. It
was designed to simulate the manner in which athletes would
incorporate respiratory training within their overall training
programme. In addition, the respiratory training preceded the
exercise training, as this would logistically be the optimal
manner in which it could be supervised in the field.
Methods
Subjects
Eighteen healthy males participated in this study. All
subjects were free of heart and lung disease and had normal
resting pulmonary function, as assessed by standard pul-
monary function tests (PFTs). The subjects were informed
about the nature and risks involved and gave their written
consent. All were recreationally active (no more than 3–5 h
of exercise per week) and were instructed to adhere to their
usual diet and physical activity; and not to engage in any
strenuous activity and not to drink coffee or other caffei-
nated beverages on testing days. The experimental protocol
was approved by the National Committee for Medical
Ethics at the Ministry of Health of Republic of Slovenia
and conformed to the Declaration of Helsinki.
Experimental design
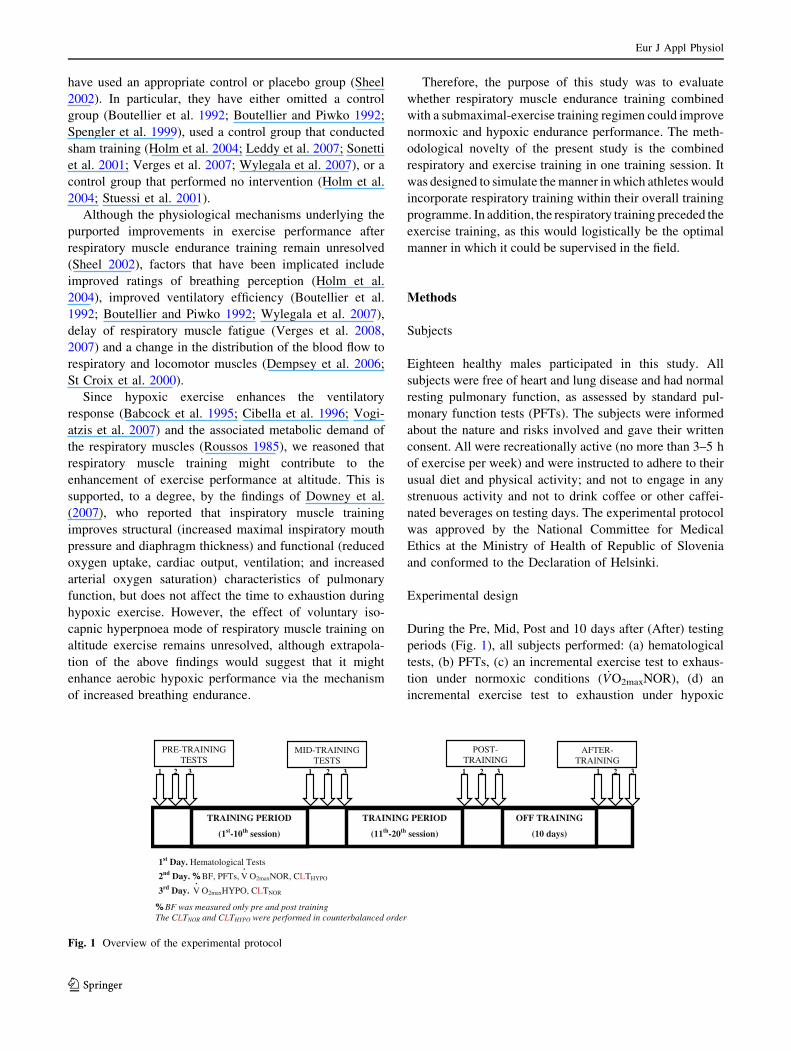
During the Pre, Mid, Post and 10 days after (After) testing
periods (Fig. 1), all subjects performed: (a) hematological
tests, (b) PFTs, (c) an incremental exercise test to exhaus-
tion under normoxic conditions ( _VO2maxNOR), (d) an
incremental exercise test to exhaustion under hypoxic
TRAINING PERIOD
(11th-20th session)
AFTER-TRAINING
POST-TRAINING
TRAINING PERIOD
(1st-10th session)
OFF TRAINING
(10 days)
PRE-TRAININGTESTS
MID-TRAININGTESTS
1st Day. Hematological Tests
2nd Day. % BF, PFTs, •
V O2maxNOR, CLTHYPO
3rd Day.•
V O2maxHYPO, CLTNOR
% BF was measured only pre and post training The CLTNOR and CLTHYPO were performed in counterbalanced order
2 31 2 31 2 3 321 1
Fig. 1 Overview of the experimental protocol
Eur J Appl Physiol
123

conditions ( _VO2maxHYPO), (e) a constant-load test in nor-
moxia (CLTNOR), and (f) a constant-load test in hypoxia
(CLTHYPO). The performance tests outlined above (c–f)
were conducted on 2 days, separated by a rest day. On each
test day, subjects performed a maximal aerobic capacity test
( _VO2max) in the morning and an endurance test (CLT) in the
afternoon. All the tests were conducted at the same time of
the day for each subject to avoid diurnal variations. More-
over, during the exercise cessation period, subjects
refrained from any physical training, but otherwise fol-
lowed their normal daily routines (individual physical
activity diary was recorded).
Blood sampling and analysis
Overnight-fasted subjects reported to the hematological lab-
oratory (Adria Laboratories, Ljubljana, Slovenia) on the first
day of each testing period. Blood samples were drawn from the
antecubital vein and analyzed for red blood cell count (RBCs),
hemoglobin (Hb), and hematocrit (Ht) with a cytochemical
impedance method (ABX Pentra 120, Horiba, Japan) (coef-
ficient of variation: \2, \1, and \2%, respectively). The
apparatus was calibrated before each measurement.
Pulmonary function
PFTs were conducted on the rest day in each of the per-
formance test periods (Pre, Mid, Post, After). PFTs were
conducted using a Cardiovit AT-2plus (Schiller, Baar,
Switzerland) spirometer, according to the criteria published
by Miller et al. (2005). The spirometer was calibrated
before every test with a 3-L syringe. Each subject per-
formed each test three times and the highest of the three
acceptable recorded values was used for subsequent anal-
ysis. The PFTs were used to obtain measures of forced vital
capacity (FVC), forced expiratory volume in 1 s (FEV1),
peak expiratory flow (PEF), slow vital capacity (SVC) and
maximum voluntary ventilation (MVV).
_VO2max Testing
Subjects performed two incremental exercise tests to
exhaustion on an electrically braked cycle-ergometer (ERG
900S, Schiller, Baar, Switzerland): on one occasion
inspiring normal room air (FIO2 = 0.21; _VO2maxNOR) and
on the other, a hypoxic gas mixture (FIO2 = 0.12;_VO2maxHYPO). Each test consisted of a 10-min rest period,
followed by a 2-min warm-up on a cycle-ergometer at
work rate of 60 W. In the hypoxic test, the 10-min rest
period comprised a 5-min normoxic period, followed by a
5-min hypoxic rest period. Upon completion of the warm-
up, the load was increased each minute by 30 W until the
subject was unable to maintain the pedaling frequency of
60 rpm. Attainment of _VO2max, defined as the highest _VO2
averaged over 60 s, was confirmed according to the fol-
lowing classical criteria: (a) a respiratory exchange ratio
(RER) [ 1.10, (b) cycling cadence decreased below the
60 rpm, and/or (c) a plateau in oxygen uptake.
During the exercise tests, oxygen uptake ( _VO2), venti-
lation ( _VE) and carbon dioxide production ( _VCO2) were
measured on-line with a metabolic cart (CS-200, Schiller,
Baar, Switzerland), while subjects breathed through a low
resistance two way-respiratory valve (Model 2, 700 T-
Shape, Hans Rudolph, Inc., Shawnee, USA). During the
hypoxic exercise tests, the inspiratory side of the respira-
tory valve was connected via respiratory corrugated tubing
to a 200-L Douglas bag filled with the pre-mixed humidi-
fied hypoxic test breathing mixture (12% O2, 88% N2). The
gas analyzers and pneumotachograph were calibrated
before each test with two different gas mixtures and a 3-L
syringe, respectively. Data were averaged each minute.
Peak power output (PPO) was calculated by the equation:
PPO = POFINAL ? (t/60 9 30 W), where POFINAL refers
to the last workload completed, and t is the number of
seconds.
During the test, subjects were requested to provide rat-
ings of perceived exertion (RPE; scale 0–10) dyspnea–
respiratory discomfort (D-RPE; Wilson and Jones 1991),
and leg effort (L-RPE) at min intervals. Heart rate (HR)
was measured using a HR monitor (Vantage NVTM, Polar
Electro, Kempele, Finland). The arterial oxygen saturation
(SpO2) was monitored with a finger pulse oxymeter
(Nellcor, BCI 3301, Boulder, USA), with an accuracy of
±2 units across the range of 70–100% and an acceptable
resilience to motion artifact (Langton and Hanning 1990).
Constant-load performance test
Results from the Pre _VO2maxNOR test were used to cal-
culate the workload corresponding to 80% of _VO2maxNOR
for each subject. Two constant-load tests were then per-
formed in a random and counterbalanced order either under
normoxic (FIO2 = 0.21; CLTNOR) or hypoxic conditions
(FIO2 = 0.12; CLTHYPO). Subjects completed a 2-min
warm-up on a cycle ergometer at a work rate of 60 W.
Thereafter, they cycled at 80% _VO2maxNOR until exhaus-
tion. Time to fatigue was recorded as the number of sec-
onds each subject maintained a cadence C60 rpm. During
the tests, _VO2, _VE, _VCO2, D-RPE, L-RPE and SpO2 values
were recorded, as they were described previously.
Training
After completing all baseline testing, participants were strat-
ified for age and aerobic capacity, and randomly assigned to
either the respiratory muscle endurance training (RMT = 9;
Eur J Appl Physiol
123

age: 22.1 ± 4.0 years; stature: 179.6 ± 5.2 cm; body mass:
72.8 ± 9.9 kg; BMI: 22.7 ± 2.2 kg cm2; _VO2max: 47.0 ±
5.0 mL kg-1 min-1) or the control training (CON = 9;
age: 22.7 ± 4.1 years; stature: 178.7 ± 4.6; body mass:
72.9 ± 9.7 kg; BMI: 22.5 ± 2.4 kg cm2; _VO2max: 45.8 ±
6.2 mL kg-1 min-1) group (P [ 0.05).
Both groups trained 5 days per week for 4 weeks and
were supervised by the same investigators during the entire
training period. Subjects exercised 1-h on a cycle ergom-
eter, but the RMT group performed an additional endur-
ance training of the respiratory muscles (described below)
prior to the cycle ergometry. The environmental conditions
were normoxic and kept constant and thermoneutral during
the entire training procedure.
Respiratory muscle training
The RMT group used a specific training device (Spiroti-
ger�, Idiag, Fehraltorf, Switzerland), which consisted of a
hand-held unit with a pouch and a base station. A two-way
piston valve connected to a rebreathing bag permitted the
inhalation of fresh inspired air into the rebreathing bag in
order to maintain a constant isocapnic end-tidal CO2
fraction (Sartori et al. 2008). Personal target values were
entered into the base unit and were used to monitor the
breathing frequency (fR), and tidal volume during the
training. The base station in the hand-held computer
monitored the fR, set threshold limits for breathing patterns,
and displayed visual and acoustic feedback to allow the
subject to breathe within the threshold values for isocapnia.
The respiratory muscle training protocol was based on
Wylegala et al. (2007). The duration of the respiratory muscle
training was 30 min. The volume of the bag (VBAG) was
initially set at a value representing approximately 55% of the
subject’s SVC. The fR was then determined by dividing 50%
of MVV by the bag volume such that fR = MVV (0.50)/
VBAG. In each session, the subjects were instructed to increase
the fR by 1–2 breaths per min after 20 min of training, if they
felt it would not exhaust them by 30 min. They then contin-
ued at this higher frequency for the last 10 min of the training.
The next training session began at the highest frequency
achieved in the previous session, and this was then main-
tained for 20 min followed by a further increase of 1–2
breaths min-1 for the remaining 10 min. In the event that
subjects perceived the training to be extremely difficult, the
setting of VBAG and fR, were adjusted accordingly.
Exercise training
Both CON and RMT groups conducted identical 1-h training
sessions on a cycle ergometer at a work rate equivalent to
50% of their normoxic PPO. For each subject, the control of
exercise training was carried out through HR (Hosand
TMpro�, Verbania, Italy), and rating of perceived exertion
(Borg’s scale; scale 0–10). Training progression was imple-
mented regularly by increasing a subject’s workload, such
that the exercise HR was maintained at a level corresponding
to that observed at 50% of normoxic PPO. All subjects were
instructed to pedal at a cadence of 70 rpm. Each training
session commenced with a standardized 5-min warm-up
period at a work rate equivalent to 20% of normoxic PPO.
Statistical analysis
Statistical analyses were performed using Statistica 5.0
(StatSoft, Tulsa, USA). All data are reported as mean (SD)
unless otherwise indicated. Due to a technical problem, the
Post CPTNOR performance time of one subject in the CON
group was excluded from the analysis (CON = 8 for Post
CPTNOR). Statistical significance of maximum values was
assessed with a three-way analysis of variance (ANOVA) for
repeated measures (group 9 condition 9 testing session). A
four-way ANOVA for repeated measures was used for relative
submaximal values of both incremental exercise and constant-
power tests (group 9 condition 9 testing session 9 relative
intensity). A t-test analysis was used for the training variables.
The Tukey post hoc test was employed to identify specific
differences between means when main effects were observed.
The alpha level of significance was set a priori at 0.05.
Results
Despite an identical exercise training protocol, as reflected
in the mean values of HR, PO and the mean increment in
PO for each training week (Table 1), the RMT group
perceived the submaximal exercise training harder than the
CON group as indicated by the significantly (P B 0.05)
higher values of D-RPE and L-RPE (Table 1).
Moreover, the participants did not alter their body mass
during the testing periods (CON: Pre = 72.8 ± 9.5 kg,
Mid = 74.6 ± 9.9 kg, Post = 73.6 ± 8.9 kg, After =
74.3 ± 9.8 kg; RMT: Pre = 72.8 ± 9.9 kg, Mid = 73.4 ±
9.9 kg, Post = 72.8 ± 9.1 kg, After = 72.2 ± 9.3 kg). In
addition, the body fat did not change Post training in both
groups (CON: Pre = 10.4 ± 3.0%, Post = 10.5 ± 3.8%;
RMT: Pre = 10.2 ± 3.0, Post = 9.3 ± 2.7%).
Pulmonary function
With the exception of the significant increase (P B 0.05) in
PEF Mid and After training in the CON group, no other
significant changes were noted in any of the pulmonary
function variables measured in either group (Table 2). PEF
in the CON group was also significantly lower (P B 0.05)
Pre training compared to the RMT group (Table 2).
Eur J Appl Physiol
123
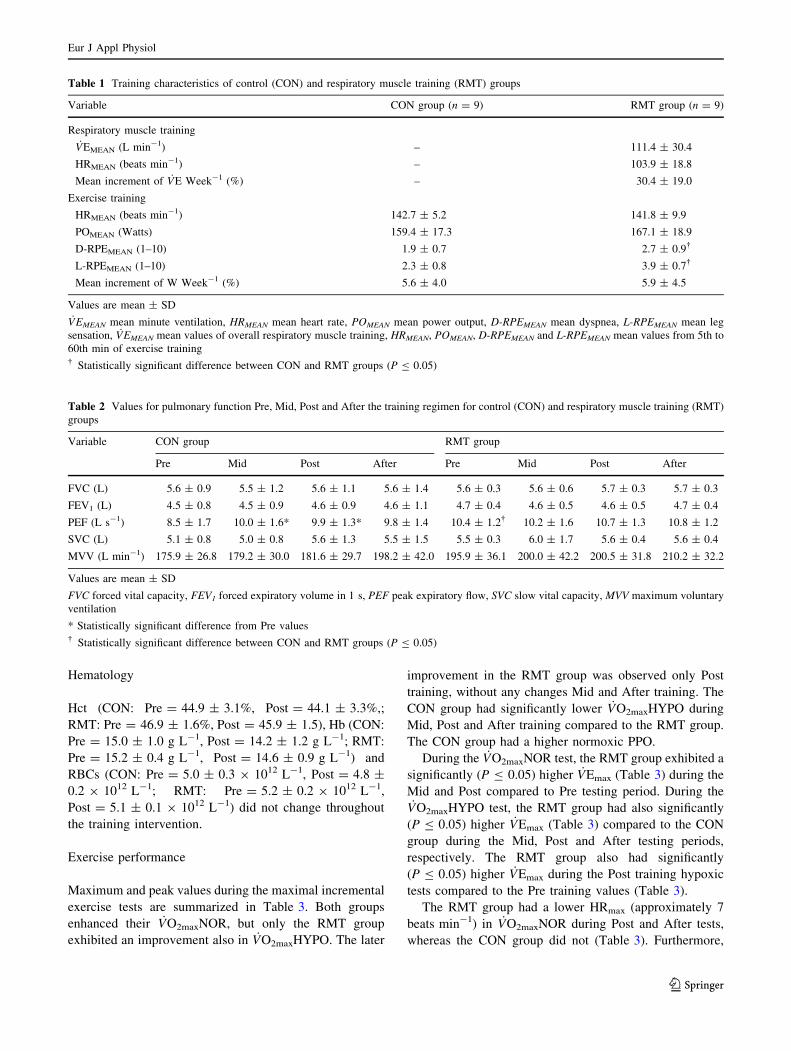
Hematology
Hct (CON: Pre = 44.9 ± 3.1%, Post = 44.1 ± 3.3%,;
RMT: Pre = 46.9 ± 1.6%, Post = 45.9 ± 1.5), Hb (CON:
Pre = 15.0 ± 1.0 g L-1, Post = 14.2 ± 1.2 g L-1; RMT:
Pre = 15.2 ± 0.4 g L-1, Post = 14.6 ± 0.9 g L-1) and
RBCs (CON: Pre = 5.0 ± 0.3 9 1012 L-1, Post = 4.8 ±
0.2 9 1012 L-1; RMT: Pre = 5.2 ± 0.2 9 1012 L-1,
Post = 5.1 ± 0.1 9 1012 L-1) did not change throughout
the training intervention.
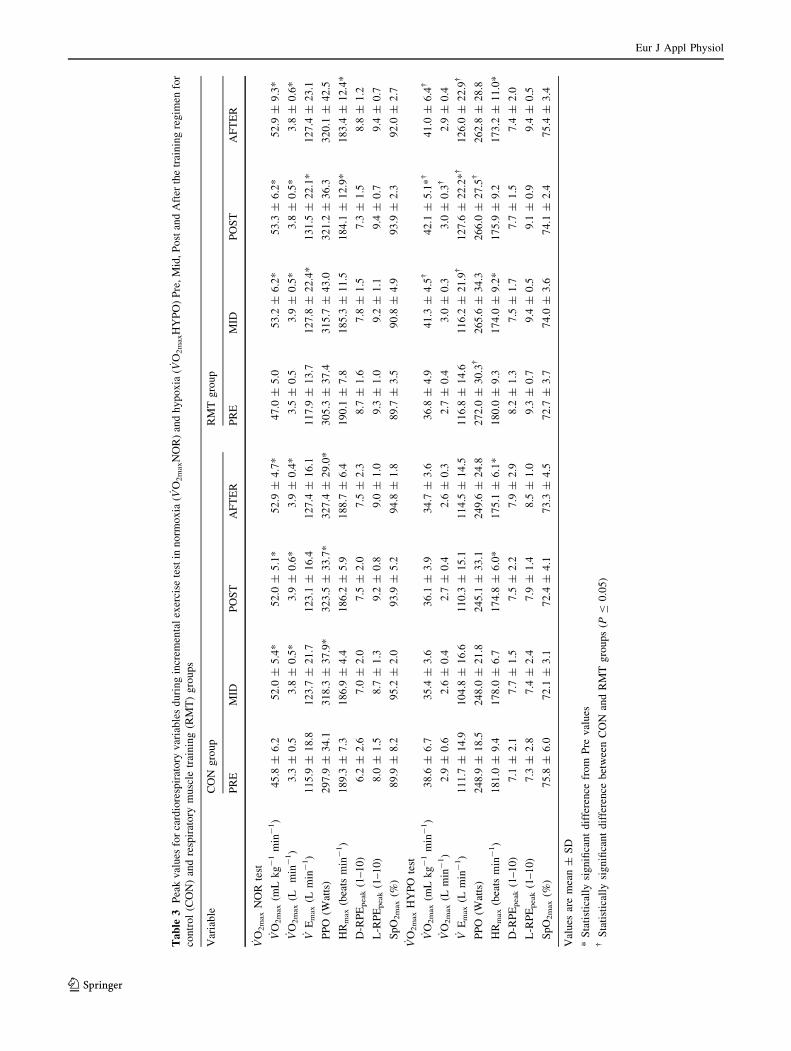
Exercise performance
Maximum and peak values during the maximal incremental
exercise tests are summarized in Table 3. Both groups
enhanced their _VO2maxNOR, but only the RMT group
exhibited an improvement also in _VO2maxHYPO. The later
improvement in the RMT group was observed only Post
training, without any changes Mid and After training. The
CON group had significantly lower _VO2maxHYPO during
Mid, Post and After training compared to the RMT group.
The CON group had a higher normoxic PPO.
During the _VO2maxNOR test, the RMT group exhibited a
significantly (P B 0.05) higher _VEmax (Table 3) during the
Mid and Post compared to Pre testing period. During the_VO2maxHYPO test, the RMT group had also significantly
(P B 0.05) higher _VEmax (Table 3) compared to the CON
group during the Mid, Post and After testing periods,
respectively. The RMT group also had significantly
(P B 0.05) higher _VEmax during the Post training hypoxic
tests compared to the Pre training values (Table 3).
The RMT group had a lower HRmax (approximately 7
beats min-1) in _VO2maxNOR during Post and After tests,
whereas the CON group did not (Table 3). Furthermore,
Table 1 Training characteristics of control (CON) and respiratory muscle training (RMT) groups
Variable CON group (n = 9) RMT group (n = 9)
Respiratory muscle training
_VEMEAN (L min-1) – 111.4 ± 30.4
HRMEAN (beats min-1) – 103.9 ± 18.8
Mean increment of _VE Week-1 (%) – 30.4 ± 19.0
Exercise training
HRMEAN (beats min-1) 142.7 ± 5.2 141.8 ± 9.9
POMEAN (Watts) 159.4 ± 17.3 167.1 ± 18.9
D-RPEMEAN (1–10) 1.9 ± 0.7 2.7 ± 0.9�
L-RPEMEAN (1–10) 2.3 ± 0.8 3.9 ± 0.7�
Mean increment of W Week-1 (%) 5.6 ± 4.0 5.9 ± 4.5
Values are mean ± SD
_VEMEAN mean minute ventilation, HRMEAN mean heart rate, POMEAN mean power output, D-RPEMEAN mean dyspnea, L-RPEMEAN mean leg
sensation, _VEMEAN mean values of overall respiratory muscle training, HRMEAN, POMEAN, D-RPEMEAN and L-RPEMEAN mean values from 5th to
60th min of exercise training� Statistically significant difference between CON and RMT groups (P B 0.05)
Table 2 Values for pulmonary function Pre, Mid, Post and After the training regimen for control (CON) and respiratory muscle training (RMT)
groups
Variable CON group RMT group
Pre Mid Post After Pre Mid Post After
FVC (L) 5.6 ± 0.9 5.5 ± 1.2 5.6 ± 1.1 5.6 ± 1.4 5.6 ± 0.3 5.6 ± 0.6 5.7 ± 0.3 5.7 ± 0.3
FEV1 (L) 4.5 ± 0.8 4.5 ± 0.9 4.6 ± 0.9 4.6 ± 1.1 4.7 ± 0.4 4.6 ± 0.5 4.6 ± 0.5 4.7 ± 0.4
PEF (L s-1) 8.5 ± 1.7 10.0 ± 1.6* 9.9 ± 1.3* 9.8 ± 1.4 10.4 ± 1.2� 10.2 ± 1.6 10.7 ± 1.3 10.8 ± 1.2
SVC (L) 5.1 ± 0.8 5.0 ± 0.8 5.6 ± 1.3 5.5 ± 1.5 5.5 ± 0.3 6.0 ± 1.7 5.6 ± 0.4 5.6 ± 0.4
MVV (L min-1) 175.9 ± 26.8 179.2 ± 30.0 181.6 ± 29.7 198.2 ± 42.0 195.9 ± 36.1 200.0 ± 42.2 200.5 ± 31.8 210.2 ± 32.2
Values are mean ± SD
FVC forced vital capacity, FEV1 forced expiratory volume in 1 s, PEF peak expiratory flow, SVC slow vital capacity, MVV maximum voluntary
ventilation
* Statistically significant difference from Pre values� Statistically significant difference between CON and RMT groups (P B 0.05)
Eur J Appl Physiol
123
Ta
ble
3P
eak
val
ues
for
card
iore
spir
ato
ryv
aria
ble
sd
uri
ng
incr
emen
tal
exer
cise
test
inn
orm
ox
ia(
_ VO
2m
axN
OR
)an
dh
yp
ox
ia(
_ VO
2m
axH
YP
O)
Pre
,M
id,
Po
stan
dA
fter
the
trai
nin
gre
gim
enfo
r
con
tro
l(C
ON
)an
dre
spir
ato
rym
usc
letr
ain
ing
(RM
T)
gro
up
s
Var
iab
leC
ON
gro
up
RM
Tg
rou
p
PR
EM
IDP
OS
TA
FT
ER
PR
EM
IDP
OS
TA
FT
ER
_ VO
2m
ax
NO
Rte
st
_ VO
2m
ax
(mL
kg
-1
min
-1)
45
.8±
6.2
52
.0±
5.4
*5
2.0
±5
.1*
52
.9±
4.7
*4
7.0
±5
.05
3.2
±6
.2*
53
.3±
6.2
*5
2.9
±9
.3*
_ VO
2m
ax
(Lm
in-
1)
3.3
±0
.53
.8±
0.5
*3
.9±
0.6
*3
.9±
0.4
*3
.5±
0.5
3.9
±0
.5*
3.8
±0
.5*
3.8
±0
.6*
_ VE
max
(Lm
in-
1)
11
5.9
±1
8.8
12
3.7
±2
1.7
12
3.1
±1
6.4
12
7.4
±1
6.1
11
7.9
±1
3.7
12
7.8
±2
2.4
*1
31
.5±
22
.1*
12
7.4
±2
3.1
PP
O(W
atts
)2
97
.9±
34
.13
18
.3±
37
.9*
32
3.5
±3
3.7
*3
27
.4±
29
.0*
30
5.3
±3
7.4
31
5.7
±4
3.0
32
1.2
±3
6.3
32
0.1
±4
2.5
HR
max
(bea
tsm
in-
1)
18
9.3
±7
.31
86
.9±
4.4
18
6.2
±5
.91
88
.7±
6.4
19
0.1
±7
.81
85
.3±
11
.51
84
.1±
12
.9*
18
3.4
±1
2.4
*
D-R
PE
peak
(1–
10
)6
.2±
2.6
7.0
±2
.07
.5±
2.0
7.5
±2
.38
.7±
1.6
7.8
±1
.57
.3±
1.5
8.8
±1
.2
L-R
PE
peak
(1–
10
)8
.0±
1.5
8.7
±1
.39
.2±
0.8
9.0
±1
.09
.3±
1.0
9.2
±1
.19
.4±
0.7
9.4
±0
.7
Sp
O2m
ax
(%)
89
.9±
8.2
95
.2±
2.0
93
.9±
5.2
94
.8±
1.8
89
.7±
3.5
90
.8±
4.9
93
.9±
2.3
92
.0±
2.7
_ VO
2m
ax
HY
PO
test
_ VO
2m
ax
(mL
kg
-1
min
-1)
38
.6±
6.7
35
.4±
3.6
36
.1±
3.9
34
.7±
3.6
36
.8±
4.9
41
.3±
4.5
�4
2.1
±5
.1*
�4
1.0
±6
.4�
_ VO
2m
ax
(Lm
in-
1)
2.9
±0
.62
.6±
0.4
2.7
±0
.42
.6±
0.3
2.7
±0
.43
.0±
0.3
3.0
±0
.3�
2.9
±0
.4
_ VE
max
(Lm
in-
1)
11
1.7
±1
4.9
10
4.8
±1
6.6
11
0.3
±1
5.1
11
4.5
±1
4.5
11
6.8
±1
4.6
11
6.2
±2
1.9
�1
27
.6±
22
.2*�
12
6.0
±2
2.9
�
PP
O(W
atts
)2
48
.9±
18
.52
48
.0±
21
.82
45
.1±
33
.12
49
.6±
24
.82
72
.0±
30
.3�
26
5.6
±3
4.3
26
6.0
±2
7.5
�2
62
.8±
28
.8
HR
max
(bea
tsm
in-
1)
18
1.0
±9
.41
78
.0±
6.7
17
4.8
±6
.0*
17
5.1
±6
.1*
18
0.0
±9
.31
74
.0±
9.2
*1
75
.9±
9.2
17
3.2
±1
1.0
*
D-R
PE
peak
(1–
10
)7
.1±
2.1
7.7
±1
.57
.5±
2.2
7.9
±2
.98
.2±
1.3
7.5
±1
.77
.7±
1.5
7.4
±2
.0
L-R
PE
peak
(1–
10
)7
.3±
2.8
7.4
±2
.47
.9±
1.4
8.5
±1
.09
.3±
0.7
9.4
±0
.59
.1±
0.9
9.4
±0
.5
Sp
O2m
ax
(%)
75
.8±
6.0
72
.1±
3.1
72
.4±
4.1
73
.3±
4.5
72
.7±
3.7
74
.0±
3.6
74
.1±
2.4
75
.4±
3.4
Val
ues
are
mea
n±
SD
*S
tati
stic
ally
sig
nifi
can
td
iffe
ren
cefr
om
Pre
val
ues
�S
tati
stic
ally
sig
nifi
can
td
iffe
ren
ceb
etw
een
CO
Nan
dR
MT
gro
up
s(P
B0
.05
)
Eur J Appl Physiol
123
both groups decreased HRmax in _VO2maxHYPO, but the
decrement was observed in different testing periods: the
CON group had a lower HRmax Post and After training,
whereas the RMT group had a significantly lower HRmax
Mid and After training. There was a main effect of group
on L-RPEpeak, since the CON had lower values than the
RMT group, but there were no post hoc differences
between them over the testing periods. There were no
differences in D-RPEpeak and SpO2max in both groups
(Table 3).
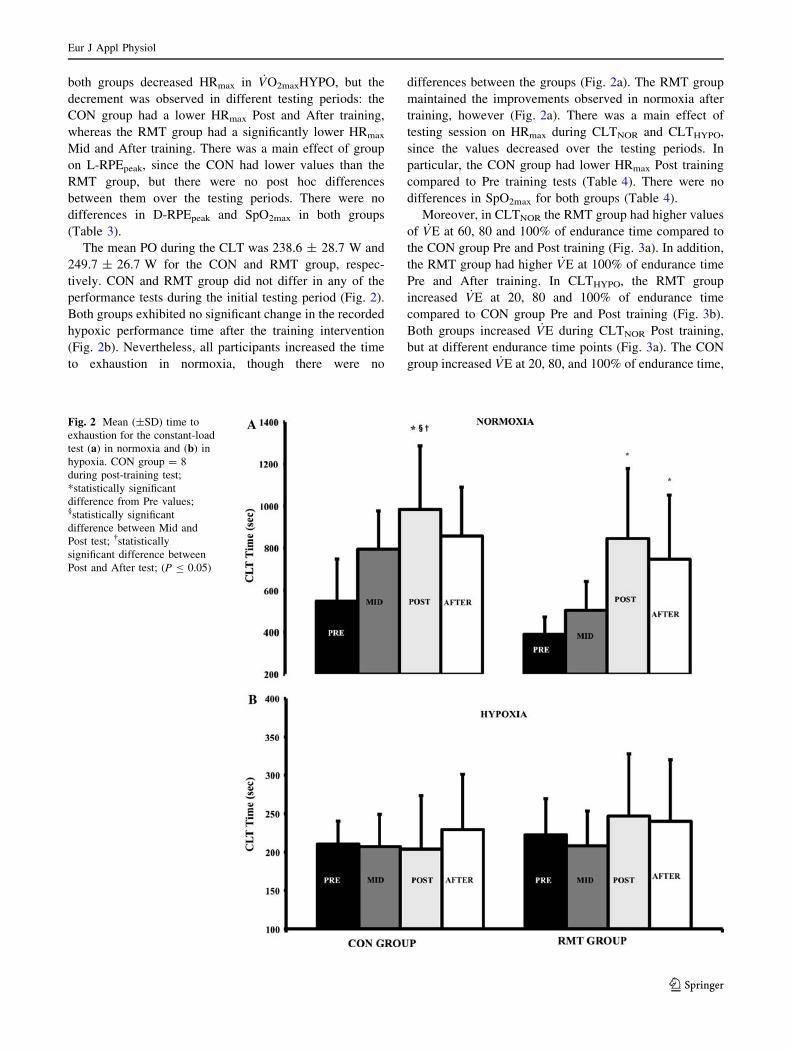
The mean PO during the CLT was 238.6 ± 28.7 W and
249.7 ± 26.7 W for the CON and RMT group, respec-
tively. CON and RMT group did not differ in any of the
performance tests during the initial testing period (Fig. 2).
Both groups exhibited no significant change in the recorded
hypoxic performance time after the training intervention
(Fig. 2b). Nevertheless, all participants increased the time
to exhaustion in normoxia, though there were no
differences between the groups (Fig. 2a). The RMT group
maintained the improvements observed in normoxia after
training, however (Fig. 2a). There was a main effect of
testing session on HRmax during CLTNOR and CLTHYPO,
since the values decreased over the testing periods. In
particular, the CON group had lower HRmax Post training
compared to Pre training tests (Table 4). There were no
differences in SpO2max for both groups (Table 4).
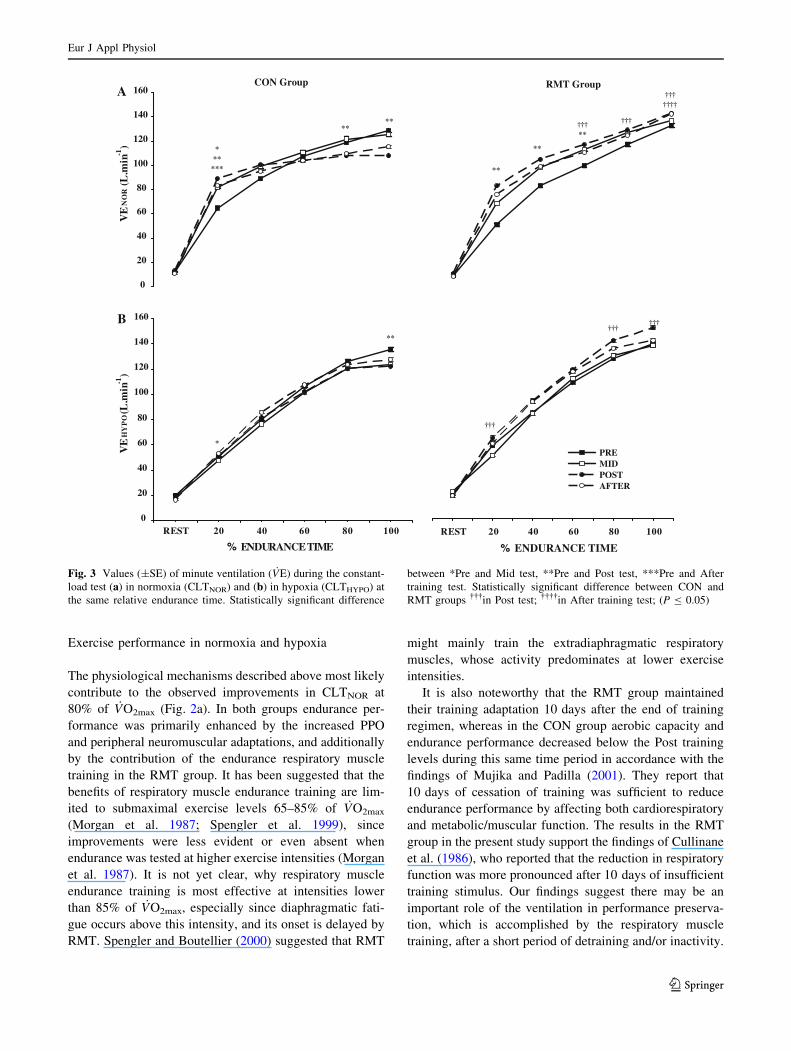
Moreover, in CLTNOR the RMT group had higher values
of _VE at 60, 80 and 100% of endurance time compared to
the CON group Pre and Post training (Fig. 3a). In addition,
the RMT group had higher _VE at 100% of endurance time
Pre and After training. In CLTHYPO, the RMT group
increased _VE at 20, 80 and 100% of endurance time
compared to CON group Pre and Post training (Fig. 3b).
Both groups increased _VE during CLTNOR Post training,
but at different endurance time points (Fig. 3a). The CON
group increased _VE at 20, 80, and 100% of endurance time,
Fig. 2 Mean (±SD) time to
exhaustion for the constant-load
test (a) in normoxia and (b) in
hypoxia. CON group = 8
during post-training test;
*statistically significant
difference from Pre values;§statistically significant
difference between Mid and
Post test; �statistically
significant difference between
Post and After test; (P B 0.05)
Eur J Appl Physiol
123

while the RMT group increased it at 20, 40, and 60%
(Fig. 3a). During CLTHYPO only the CON group increased_VE at 20 and 100% of endurance time (Fig. 3b).
Discussion
The principal finding of the present study is that respira-
tory muscle endurance training improves _VO2maxHYPO
without a concomitant enhancement of constant-load
exercise performance either in hypoxia or normoxia. An
interesting observation was also that subjects perceived the
exertion of exercise training conducted immediately after
respiratory muscle training more strenuous, than did the
control group.
Aerobic capacity in normoxia and hypoxia
Both the RMT and CON group equally improved_VO2maxNOR Mid, Post and After training, reflecting a
similar training-induced improvement. Previous studies
have examined the influence of respiratory muscle endur-
ance training on _VO2max and found no significant
improvement (Fairbarn et al. 1991; Holm et al. 2004;
Morgan et al. 1987) supporting the notion that _VO2max is
not limited by ventilation (Reybrouck et al. 1975). How-
ever, some researchers have suggested that the pulmonary
system may indeed limit _VO2max under certain circum-
stances (e.g. hypoxia, asthma, COPD), when a reduction in
arterial PO2 prevails (Bauerle and Younes 1995; Calbet
et al. 2003; Kinnula and Sovijarvi 1996). Exercise-induced
arterial hypoxemia enhances peripheral-locomotor muscle
fatigue (Romer et al. 2006), and may also contribute to the
fatigue of respiratory muscles, and therefore cause a ven-
tilation-induced limitation of _VO2max. In the present study,
a moderate degree of exercise-induced arterial hypoxemia
(Dempsey and Wagner 1999) was observed during_VO2maxNOR (Table 3), which was unaffected by the
improved exercise ventilation in the Post and After training
tests.
The enhanced _VO2maxHYPO in the RMT group was
accompanied by increased _VEmax at identical power output,
most likely resulting in an increased metabolic demand of
the respiratory muscles (Babcock et al. 1995; Roussos
1985; Vogiatzis et al. 2007). Downey et al. (2007) main-
tained that inspiratory muscle training significantly
decreased submaximal _VE and conjectured, that it is
probably the result of increased SpO2, indicating a reduced
input to the peripheral chemoreceptors. However, in the
present study, _VEmax is higher after training, and despite its
higher values the SpO2max was unchanged during the
incremental exercise to exhaustion in hypoxia.
It has been suggested that respiratory muscle training
reduces the perception of adverse respiratory sensations
despite the increased exercise ventilation (Holm et al.
2004; Verges et al. 2008). In the present study, the higher
values of _VE and the improved _VO2max were not related
with lower values of D-RPEpeak in both conditions. Thus,
the hypothesis that changes in perception of breathing, such
as decreased sense of respiratory exertion or breathless-
ness, might contribute, as secondary factor, to increased
performance cannot be confirmed by the present results.
Table 4 Peak values for _VO2, HR and SaO2 during constant load test in normoxia (CLTNOR) and hypoxia (CLTHYPO) Pre, Mid, Post and After
the training regimen for control (CON) and respiratory muscle training (RMT) groups
Variable CON group RMT Group
Pre Mid Post After Pre Mid Post After P
CLTNOR
_VO2peak
(mL kg-1 min-1)
45.3 ± 6.3 48.4 ± 5.6 43.8 ± 8.7 46.1 ± 5.7 45.1 ± 4.3 52.9 ± 5.2 50.6 ± 5.2 49.6 ± 4.6 n.s.
HRpeak
(beats min-1)
190.6 ± 6.1 187.6 ± 8.4 182.4 ± 5.3* 185.8 ± 7.0 181.6 ± 8.3 178.0 ± 5.5 175.2 ± 8.1 176.7 ± 7.0 0.00�
SpO2peak (%) 92.7 ± 2.4 93.9 ± 1.5 94.3 ± 0.7 93.9 ± 0.9 92.9 ± 2.8 92.7 ± 3.6 92.8 ± 2.4 92.8 ± 1.7 n.s.
CLTHYPO
_VO2peak
(mL kg-1 min-1)
44.2 ± 10.8 39.1 ± 3.6 36.5 ± 6.2 36.8 ± 4.7 42.2 ± 5.9 43.8 ± 6.0 45.4 ± 6.1 43.1 ± 6.4 n.s.
HRpeak
(beats min-1)
186.6 ± 10.7 185.4 ± 11.6 184.8 ± 8.1 182.7 ± 7.2 179.6 ± 11.7 174.6 ± 11.9 174.8 ± 12.5 174.8 ± 11.1 0.00�
SpO2peak (%) 72.1 ± 5.7 72.4 ± 3.5 73.3 ± 5.8 72.4 ± 4.1 76.3 ± 6.7 74.1 ± 4.0 74.8 ± 5.2 75.2 ± 4.1 n.s.
Values are mean ± SD
* Statistically significant difference from Pre values� Statistically significant main effect of testing session (P B 0.05)
Eur J Appl Physiol
123
Exercise performance in normoxia and hypoxia
The physiological mechanisms described above most likely
contribute to the observed improvements in CLTNOR at
80% of _VO2max (Fig. 2a). In both groups endurance per-
formance was primarily enhanced by the increased PPO
and peripheral neuromuscular adaptations, and additionally
by the contribution of the endurance respiratory muscle
training in the RMT group. It has been suggested that the
benefits of respiratory muscle endurance training are lim-
ited to submaximal exercise levels 65–85% of _VO2max
(Morgan et al. 1987; Spengler et al. 1999), since
improvements were less evident or even absent when
endurance was tested at higher exercise intensities (Morgan
et al. 1987). It is not yet clear, why respiratory muscle
endurance training is most effective at intensities lower
than 85% of _VO2max, especially since diaphragmatic fati-
gue occurs above this intensity, and its onset is delayed by
RMT. Spengler and Boutellier (2000) suggested that RMT
might mainly train the extradiaphragmatic respiratory
muscles, whose activity predominates at lower exercise
intensities.
It is also noteworthy that the RMT group maintained
their training adaptation 10 days after the end of training
regimen, whereas in the CON group aerobic capacity and
endurance performance decreased below the Post training
levels during this same time period in accordance with the
findings of Mujika and Padilla (2001). They report that
10 days of cessation of training was sufficient to reduce
endurance performance by affecting both cardiorespiratory
and metabolic/muscular function. The results in the RMT
group in the present study support the findings of Cullinane
et al. (1986), who reported that the reduction in respiratory
function was more pronounced after 10 days of insufficient
training stimulus. Our findings suggest there may be an
important role of the ventilation in performance preserva-
tion, which is accomplished by the respiratory muscle
training, after a short period of detraining and/or inactivity.
0
20
40
60
80
100
120
140
160
VE
NO
R (L
.min
-1)
CON Group
***
***
****
ARMT Group
**
**
†††**
†††
†††††††
0
20
40
60
80
100
120
140
160
REST 20 40 60 80 100
% ENDURANCE TIME
VE
HY
PO
(L.m
in-1
)
*
**
B
REST 20 40 60 80 100
% ENDURANCE TIME
PREMIDPOSTAFTER
†††
††††††
Fig. 3 Values (±SE) of minute ventilation ( _VE) during the constant-
load test (a) in normoxia (CLTNOR) and (b) in hypoxia (CLTHYPO) at
the same relative endurance time. Statistically significant difference
between *Pre and Mid test, **Pre and Post test, ***Pre and After
training test. Statistically significant difference between CON and
RMT groups ���in Post test; ����in After training test; (P B 0.05)
Eur J Appl Physiol
123
Despite the significantly increased _VO2maxHYPO, the
RMT group did not improve their hypoxic endurance
performance. This is most likely due to greater exercise
intensity performed in the hypoxic CLT test (CLTHYPO).
Although both CLT tests were performed at the same
absolute workload equivalent to 80% of normoxic Pre
training _VO2max, the relative intensity of the workload was
much higher in the CLTHYPO test (CON: 95.72 ± 7.34%;
RMT: 91.99 ± 5.86% of Pre training _VO2maxHYPO,
respectively). As noted previously, diaphragmatic fatigue
occurs at exercise intensities [ 85% of _VO2max and the
respiratory muscle endurance training is probably unable to
enhance performance in this exercise intensity range.
Training procedure
Both groups performed the same exercise training, as
confirmed by the values of HRMEAN and the weekly
increment of workload. However, the perceived dyspnea
and leg exertion differed significantly between groups
during the submaximal exercise training sessions. The
RMT group, which conducted a 30-min respiratory muscle
endurance training prior to the cycle ergometry, provided
significantly higher ratings of D-RPEMEAN and L-RPE-
MEAN. The higher perception of dyspnea probably reveals
slight training-induced fatigue of the respiratory muscles. It
is noteworthy that the respiratory muscle training induced a
greater perception of fatigue in the legs, which may be
attributed, in part, to the previously reported effect of
respiratory muscle fatigue on exercise performance (Mador
and Acevedo 1991; Martin et al. 1982). According to this
theory, the increased metabolic demand of the respiratory
muscles due to RMT (increased neural activity in type IV
afferents nerve fibers) may have enhanced sympathetic
outflow to the limb, thus affecting blood flow redistribution
(Sheel et al. 2001; St Croix et al. 2000). The ensuing
competition by the respiratory and locomotor muscles for
blood flow may have resulted in lower perfusion of the
locomotor muscles during the cycle ergometry following
RMT, than would have been experience by the CON group,
which did not conduct any prior respiratory muscle
training.
In conclusion, the present study shows that respiratory
muscle endurance training combined with cycle ergometer
training improved aerobic capacity in hypoxia above the
control training but did not in normoxia. Moreover, no
additional effect was obtained during constant-load exer-
cise. However, respiratory muscle training seems to delay
the negative effects of inactivity or reduced training load,
resulting in preservation of enhanced performance. More-
over, performing a RMT session immediately before
exercise training significantly increases the rate of per-
ceived exertion during the training session. Doing so may
limit the quality of the training session performed by an
athlete.
Acknowledgments The current project was funded, in part, by the
Olympic Committee of Slovenia, and by a ‘‘Knowledge for Security
and Peace’’ grant from the Ministry of Defense (Republic of Slove-
nia). Moreover, we would like to thank all the subjects for their time
and effort. Finally yet importantly, we would like to thank all the
personnel of Adria Lab for their technical support.
Conflict of interest statement The authors state that there is no
personal of financial conflict of interest in the present study.
References
Babcock MA, Johnson BD, Pegelow DF, Suman OE, Griffin D,
Dempsey JA (1995) Hypoxic effects on exercise-induced
diaphragmatic fatigue in normal healthy humans. J Appl Physiol
78:82–92
Bauerle O, Younes M (1995) Role of ventilatory response to exercise
in determining exercise capacity in COPD. J Appl Physiol
79:1870–1877
Boutellier U, Piwko P (1992) The respiratory system as an exercise
limiting factor in normal sedentary subjects. Eur J Appl Physiol
Occup Physiol 64:145–152
Boutellier U, Buchel R, Kundert A, Spengler C (1992) The
respiratory system as an exercise limiting factor in normal
trained subjects. Eur J Appl Physiol Occup Physiol 65:347–353
Calbet JA, Boushel R, Radegran G, Sondergaard H, Wagner PD,
Saltin B (2003) Determinants of maximal oxygen uptake in
severe acute hypoxia. Am J Physiol Regul Integr Comp Physiol
284:R291–R303
Cibella F, Cuttitta G, Kayser B, Narici M, Romano S, Saibene F
(1996) Respiratory mechanics during exhaustive submaximal
exercise at high altitude in healthy humans. J Physiol 494(Pt
3):881–890
Cullinane EM, Sady SP, Vadeboncoeur L, Burke M, Thompson PD
(1986) Cardiac size and VO2max do not decrease after short-
term exercise cessation. Med Sci Sports Exerc 18:420–424
Dempsey JA, Wagner PD (1999) Exercise-induced arterial hypox-
emia. J Appl Physiol 87:1997–2006
Dempsey JA, Romer L, Rodman J, Miller J, Smith C (2006)
Consequences of exercise-induced respiratory muscle work.
Respir Physiol Neurobiol 151:242–250
Downey AE, Chenoweth LM, Townsend DK, Ranum JD, Ferguson
CS, Harms CA (2007) Effects of inspiratory muscle training on
exercise responses in normoxia and hypoxia. Respir Physiol
Neurobiol 156:137–146
Fairbarn MS, Coutts KC, Pardy RL, McKenzie DC (1991) Improved
respiratory muscle endurance of highly trained cyclists and the
effects on maximal exercise performance. Int J Sports Med
12:66–70
Harms CA, Wetter TJ, St Croix CM, Pegelow DF, Dempsey JA
(2000) Effects of respiratory muscle work on exercise perfor-
mance. J Appl Physiol 89:131–138
Holm P, Sattler A, Fregosi RF (2004) Endurance training of
respiratory muscles improves cycling performance in fit young
cyclists. BMC Physiol 4:9
Kinnula VL, Sovijarvi AR (1996) Hyperventilation during exercise:
independence on exercise-induced bronchoconstriction in mild
asthma. Respir Med 90:145–151
Eur J Appl Physiol
123
Langton JA, Hanning CD (1990) Effect of motion artefact on pulse
oximeters: evaluation of four instruments and finger probes. Br J
Anaesth 65:564–570
Leddy JJ, Limprasertkul A, Patel S, Modlich F, Buyea C, Pendergast
DR, Lundgren CE (2007) Isocapnic hyperpnea training improves
performance in competitive male runners. Eur J Appl Physiol
99:665–676
Mador MJ, Acevedo FA (1991) Effect of respiratory muscle fatigue
on subsequent exercise performance. J Appl Physiol 70:2059–
2065
Martin B, Heintzelman M, Chen HI (1982) Exercise performance
after ventilatory work. J Appl Physiol 52:1581–1585
Miller MR, Hankinson J, Brusasco V, Burgos F, Casaburi R, Coates
A, Crapo R, Enright P, van der Grinten CP, Gustafsson P, Jensen
R, Johnson DC, MacIntyre N, McKay R, Navajas D, Pedersen
OF, Pellegrino R, Viegi G, Wanger J (2005) Standardisation of
spirometry. Eur Respir J 26:319–338
Morgan DW, Kohrt WM, Bates BJ, Skinner JS (1987) Effects of
respiratory muscle endurance training on ventilatory and endur-
ance performance of moderately trained cyclists. Int J Sports
Med 8:88–93
Mujika I, Padilla S (2001) Cardiorespiratory and metabolic charac-
teristics of detraining in humans. Med Sci Sports Exerc 33:413–
421
Reybrouck T, Heigenhauser GF, Faulkner JA (1975) Limitations to
maximum oxygen uptake in arms, leg, and combined arm-leg
ergometry. J Appl Physiol 38:774–779
Romer LM, Dempsey JA, Lovering A, Eldridge M (2006) Exercise-
induced arterial hypoxemia: consequences for locomotor muscle
fatigue. Adv Exp Med Biol 588:47–55
Roussos C (1985) Function and fatigue of respiratory muscles. Chest
88:124S–132S
Sartori R, Barbi E, Poli F, Ronfani L, Marchetti F, Amaddeo A,
Ventura A (2008) Respiratory training with a specific device in
cystic fibrosis: a prospective study. J Cyst Fibros 7:313–319
Sheel AW (2002) Respiratory muscle training in healthy individuals:
physiological rationale and implications for exercise perfor-
mance. Sports Med 32:567–581
Sheel AW, Derchak PA, Morgan BJ, Pegelow DF, Jacques AJ,
Dempsey JA (2001) Fatiguing inspiratory muscle work causes
reflex reduction in resting leg blood flow in humans. J Physiol
537:277–289
Sonetti DA, Wetter TJ, Pegelow DF, Dempsey JA (2001) Effects of
respiratory muscle training versus placebo on endurance exercise
performance. Respir Physiol 127:185–199
Spengler CM, Boutellier U (2000) Breathless legs? Consider training
your respiration. News Physiol Sci 15:101–105
Spengler CM, Roos M, Laube SM, Boutellier U (1999) Decreased
exercise blood lactate concentrations after respiratory endurance
training in humans. Eur J Appl Physiol Occup Physiol 79:299–
305
St Croix CM, Morgan BJ, Wetter TJ, Dempsey JA (2000) Fatiguing
inspiratory muscle work causes reflex sympathetic activation in
humans. J Physiol 529(Pt 2):493–504
Stuessi C, Spengler CM, Knopfli-Lenzin C, Markov G, Boutellier U
(2001) Respiratory muscle endurance training in humans
increases cycling endurance without affecting blood gas con-
centrations. Eur J Appl Physiol 84:582–586
Verges S, Lenherr O, Haner AC, Schulz C, Spengler CM (2007)
Increased fatigue resistance of respiratory muscles during
exercise after respiratory muscle endurance training. Am J
Physiol Regul Integr Comp Physiol 292:R1246–R1253
Verges S, Boutellier U, Spengler CM (2008) Effect of respiratory
muscle endurance training on respiratory sensations, respiratory
control and exercise performance: a 15-year experience. Respir
Physiol Neurobiol 161:16–22
Vogiatzis I, Georgiadou O, Koskolou M, Athanasopoulos D, Kostikas
K, Golemati S, Wagner H, Roussos C, Wagner PD, Zakynthinos
S (2007) Effects of hypoxia on diaphragmatic fatigue in highly
trained athletes. J Physiol 581:299–308
Wilson RC, Jones PW (1991) Long-term reproducibility of Borg scale
estimates of breathlessness during exercise. Clin Sci (Lond)
80:309–312
Wylegala JA, Pendergast DR, Gosselin LE, Warkander DE, Lundgren
CE (2007) Respiratory muscle training improves swimming
endurance in divers. Eur J Appl Physiol 99:393–404
Eur J Appl Physiol
123
Copyright © 2022 FDOKUMEN