A convenient apparatus and tracking dye for anaerobic analytical polyacrylamide-gel electrophoresis
X-ray CT dose in normoxic polyacrylamide gel dosimetry
10
X-ray CT dose in normoxic polyacrylamide gel dosimetry P. Baxter and A. Jirasek a Department of Physics and Astronomy, University of Victoria, Victoria BC V8W 3P6, Canada M. Hilts Medical Physics, BC Cancer Agency-Vancouver Island Centre, Victoria BC V8R 6V5, Canada Received 21 December 2006; revised 16 February 2007; accepted for publication 27 March 2007; published 9 May 2007 This study reports on the effects of x-ray CT dose in CT imaged normoxic polyacrylamide nPAG gel dosimeters. The investigation is partitioned into three sections. First, the CT dose absorbed in nPAG is quantified under a range of typical gel CT imaging protocols. It is found that the maximum absorbed CT dose occurs for volumetric imaging and is in the range of 4.6± 0.2 cGy/image. This does scales linearly with image averaging. Second, using Raman spectroscopy, the response of nPAG to CT imaging photon energies i.e., 120–140 kVp is established and compared to the well known dose response of nPAG exposed to 6 MV photons. It is found that nPAG exhibits a weaker response per unit dose to 140-kVp incident photons as compared to 6 MV incident photons slopes m 6 MV = −0.0374 ± 0.0006 Gy −1 and m 140 kVp = −0.016±0.001 Gy −1 . Finally, using the above data, an induced change in CT number N CT is calculated for nPAG imaged using a range of gel imaging protocols. It is found that under typical imaging protocols 120–140 kVp, 200 mAs, 16–32 image averages a N CT 0.2 H is induced in active nPAG dosimeters. This N CT is below the current limit of detectability of CT nPAG polymer gel dosimetry. Under expanded imaging protocols e.g., very high number of image averages an induced N CT of 0.5 H is possible. In these situations the additional polymerization occurring in nPAG due to the imaging process may need to be accounted for. © 2007 American Association of Physicists in Medicine. DOI: 10.1118/1.2732032 Key words: polymer gel dosimetry, x-ray imaging, x-ray CT dose, polyacrylamide I. INTRODUCTION Polymer gel dosimeters are tissue equivalent, high spatial resolution, three-dimensional 3D radiation dosimeters that are among the most promising materials developed to date for full 3D dose verification of complex radiation therapy treatments. Recent advances have enabled straightforward bench-top manufacture of “normoxic” polymer gel dosimeters, 1 thus increasing the clinical practicality of this class of dosimeter. Since the introduction of normoxic poly- mer gel dosimeters, reports on an array of new polymer gel formulations have appeared in the literature. 2–9 One of the most promising is a normoxic variant of the original poly- acrylamide based polymer gel PAG gel, termed nPAG. For further reviews of normoxic polymer gel dosimetry, the in- terested reader is referred to recent proceedings of the 4th International Conference on Radiotherapy Gel Dosimetry. 10 Traditionally, dose information extraction from polymer gel dosimeters has been performed utilizing magnetic reso- nance imaging MRI. 11–15 While MRI offers much potential for imaging in polymer gel dosimetry, not all research groups and/or radiation therapy clinics have ready access to MRI. Furthermore, performing highly accurate, quantitative MRI polymer gel dosimetry is technically challenging, to the point that MRI specialists are typically required if one is interested in obtaining the best possible results. 11,16 Hence, alternate imaging modalities have been investigated as potential com- pliments to MRI imaging, including x-ray computed tomog- raphy CT and optical-CT. Optical-CT is a gel imaging tech- nique that is currently under development. While largely in the prototypical stage, commercial optical-CT scanners are now available and show promise for imaging polymer gel dosimeters. 17–19 X-ray CT imaging of polymer gels was first introduced as a viable alternative to MRI by Hilts et al. 20 The technique relies on CT contrast due to radiation dose-dependent density changes occurring in irradiated polymer gel. 21 While the technique has met with some success e.g., Ref. 22, x-ray CT polymer gel dosimetry has currently not gained wide- spread due to two primary limitations. First, the density changes occurring in irradiated polymer gel are minute 1% and therefore image contrast and hence dose reso- lution in x-ray CT polymer gel dosimetry remains low. The development of higher contrast polymer gel formulations, as well as post-image acquisition data processing e.g., image filtering 23,24 are research avenues that stand to improve upon this limitation. A second limitation involves the fact that x-ray CT imag- ing of polymer gel dosimeters utilizes ionizing radiation dur- ing the imaging process. Hence, CT imaging deposits radia- tion dose into the polymer gel materials, which can in turn induce gel polymerization and potentially alter the recorded dose. The extent of the effects of CT dose on x-ray CT poly- mer gel dosimetry have not been fully explored. It is the aim of this investigation to assess the effect of CT dose on the read-out of normoxic polymer gels by x-ray CT 1934 1934 Med. Phys. 34 „6…, June 2007 0094-2405/2007/34„6…/1934/10/$23.00 © 2007 Am. Assoc. Phys. Med.
Transcript of X-ray CT dose in normoxic polyacrylamide gel dosimetry

X-ray CT dose in normoxic polyacrylamide gel dosimetryP. Baxter and A. Jiraseka!
Department of Physics and Astronomy, University of Victoria, Victoria BC V8W 3P6, Canada
M. HiltsMedical Physics, BC Cancer Agency-Vancouver Island Centre, Victoria BC V8R 6V5, Canada
!Received 21 December 2006; revised 16 February 2007; accepted for publication 27 March 2007;published 9 May 2007"
This study reports on the effects of x-ray CT dose in CT imaged normoxic polyacrylamide !nPAG"gel dosimeters. The investigation is partitioned into three sections. First, the CT dose absorbed innPAG is quantified under a range of typical gel CT imaging protocols. It is found that the maximumabsorbed CT dose occurs for volumetric imaging and is in the range of 4.6±0.2 cGy/image. Thisdoes scales linearly with image averaging. Second, using Raman spectroscopy, the response ofnPAG to CT imaging photon energies !i.e., 120–140 kVp" is established and compared to the wellknown dose response of nPAG exposed to 6 MV photons. It is found that nPAG exhibits a weakerresponse !per unit dose" to 140-kVp incident photons as compared to 6 MV incident photons!slopes m6 MV=−0.0374±0.0006 Gy−1 and m140 kVp=−0.016±0.001 Gy−1". Finally, using the abovedata, an induced change in CT number !!NCT" is calculated for nPAG imaged using a range of gelimaging protocols. It is found that under typical imaging protocols !120–140 kVp, 200 mAs,#16–32 image averages" a !NCT"0.2 H is induced in active nPAG dosimeters. This !NCT isbelow the current limit of detectability of CT nPAG polymer gel dosimetry. Under expandedimaging protocols !e.g., very high number of image averages" an induced !NCT of #0.5 H ispossible. In these situations the additional polymerization occurring in nPAG due to the imagingprocess may need to be accounted for. © 2007 American Association of Physicists in Medicine.$DOI: 10.1118/1.2732032%
Key words: polymer gel dosimetry, x-ray imaging, x-ray CT dose, polyacrylamide
I. INTRODUCTION
Polymer gel dosimeters are tissue equivalent, high spatialresolution, three-dimensional !3D" radiation dosimeters thatare among the most promising materials developed to datefor full 3D dose verification of complex radiation therapytreatments. Recent advances have enabled straightforwardbench-top manufacture of “normoxic” polymer geldosimeters,1 thus increasing the clinical practicality of thisclass of dosimeter. Since the introduction of normoxic poly-mer gel dosimeters, reports on an array of new polymer gelformulations have appeared in the literature.2–9 One of themost promising is a normoxic variant of the original poly-acrylamide based polymer gel !PAG gel", termed nPAG. Forfurther reviews of normoxic polymer gel dosimetry, the in-terested reader is referred to recent proceedings of the 4thInternational Conference on Radiotherapy Gel Dosimetry.10
Traditionally, dose information extraction from polymergel dosimeters has been performed utilizing magnetic reso-nance imaging !MRI".11–15 While MRI offers much potentialfor imaging in polymer gel dosimetry, not all research groupsand/or radiation therapy clinics have ready access to MRI.Furthermore, performing highly accurate, quantitative MRIpolymer gel dosimetry is technically challenging, to the pointthat MRI specialists are typically required if one is interestedin obtaining the best possible results.11,16 Hence, alternateimaging modalities have been investigated as potential com-pliments to MRI imaging, including x-ray computed tomog-
raphy !CT" and optical-CT. Optical-CT is a gel imaging tech-nique that is currently under development. While largely inthe prototypical stage, commercial optical-CT scanners arenow available and show promise for imaging polymer geldosimeters.17–19
X-ray CT imaging of polymer gels was first introduced asa viable alternative to MRI by Hilts et al.20 The techniquerelies on CT contrast due to radiation dose-dependent densitychanges occurring in irradiated polymer gel.21 While thetechnique has met with some success !e.g., Ref. 22", x-rayCT polymer gel dosimetry has currently not gained wide-spread due to two primary limitations. First, the densitychanges occurring in irradiated polymer gel are minute!#1% " and therefore image contrast !and hence dose reso-lution" in x-ray CT polymer gel dosimetry remains low. Thedevelopment of higher contrast polymer gel formulations, aswell as post-image acquisition data processing !e.g., imagefiltering23,24" are research avenues that stand to improve uponthis limitation.
A second limitation involves the fact that x-ray CT imag-ing of polymer gel dosimeters utilizes ionizing radiation dur-ing the imaging process. Hence, CT imaging deposits radia-tion dose into the polymer gel materials, which can in turninduce gel polymerization and potentially alter the recordeddose. The extent of the effects of CT dose on x-ray CT poly-mer gel dosimetry have not been fully explored.
It is the aim of this investigation to assess the effect of CTdose on the read-out of normoxic polymer gels by x-ray CT
1934 1934Med. Phys. 34 „6…, June 2007 0094-2405/2007/34„6…/1934/10/$23.00 © 2007 Am. Assoc. Phys. Med.

imaging. This study consists of three sections. The first sec-tion quantifies doses delivered to polymer gel dosimetersduring CT imaging. Ion chamber measurements, film mea-surements, and the concept of computed tomography doseindex !CTDI" are used to assess CT dose for a range oftypical gel dosimetry imaging protocols !see below". In ad-dition, the uniformity of deposited CT dose is examined for avariety of polymer gel dosimeter phantoms. Second, the re-sponse of nPAG to kV photon energies used in CT imaging isestablished and compared with the response of nPAG ex-posed to 6 MV photons. This relative response is measuredusing Raman spectroscopy, as this technique offers a directmeasurement of the changes in monomer !and polymer" con-centration as a function of absorbed dose in nPAG.25–27 Fi-nally, knowledge of the doses deposited in nPAG during CTimaging !section 1" and the relative dose response of nPAGirradiated with kVp !i.e., CT" and MV !i.e., linac" photonenergies !section 2" are used to infer any changes in nPAGCT number !!NCT" that may result from the CT imagingprocess itself.
II. THEORY
The computed tomography dose index !CTDI, units ofGy" is a tool used in diagnostic imaging to estimate the av-erage dose given to a patient during diagnostic examinations.CTDI sums the primary and secondary radiation received ata point from a single slice CT scan, as shown in Fig. 1. CTDIwas originally defined as28
CTDI =1T&
−#
+#
D1!z"dz , !1"
where D1!z" !units of Gy" is the dose at position z and T isthe nominal slice thickness as specified by the CT scanner.Note that changing the slice thickness also changes the num-ber of slices acquired in a given volume, since in the conceptof CTDI slices are assumed to be directly adjacent to oneanother. In addition, in accordance with x-ray CT conven-tions, D1!z" is a function of z only, and not x or y !i.e., doseuniformity is assumed in the x-y plane even though it isknown that some dose nonuniformity exists in the x-y plane".This dose nonuniformity is not addressed in CTDI, as allmeasurements are made on the z axis. To measure CTDI, anextended !100 mm" pencil ion chamber is used. The total ionchamber reading is the sum of the primary and scatteredradiation due to the single CT slice, since primary and sec-ondary radiation are indistiguishable by the chamber andmeasured simultaneously. The scattered radiation measuredby the chamber is used as a representation of the scatteredradiation from adjacent slices in a typical volumetric acqui-sition.
In practice, CT dose is typically quantified usingCTDI!100" !100 mm chamber length":
CTDI!100" =1T
Mcorr100 $mm% , !2"
where Mcorr is the corrected dose as measured within the ionchamber, e.g.,
Mcorr = MrawCfNkCTPfmed. !3"
Here, Mraw is the raw ion chamber reading, Cf is a chamberfactor relating the raw chamber reading !in nC" to a readingin mR !i.e., a cross-calibration factor to a calibrated cham-ber", Nk is an absolute calibration factor for the calibrated ionchamber, CTP is the standard temperature/pressure correctionfactor, and fmed is a conversion factor for dose to a mediumother than air.
When imaging polymer gels using x-ray CT, CTDI!100"is useful in whole volume scanning for estimating the accu-mulated dose at any point within the gel. However, whendetermining the accumulated dose due to a single slice, aswould be of interest when performing region of interest!ROI" or calibration gel imaging, CTDI!100" overestimatesthe delivered dose. The scattered radiation is not contributingto the dose delivered when obtaining a single slice image,but is read by the ion chamber when performing theCTDI!100" measurement. Thus, the dose calculated as CTDIis greater than the primary dose given in a single slice. Anormalized dose profile !e.g., Fig. 1" can be used in conjunc-tion with CTDI calculations to determine the dose resultingfrom single slice imaging. This process is described in Sec.III A 2.
FIG. 1. !a" Dose profile of a single slice CT scan !1 cm nominal slice thick-ness". !b" Accumulated dose profile of multiple single slices within a typicalCT scan. CTDI is equivalent to the summation of the point doses at thecentral position.
1935 Baxter, Jirasek, and Hilts: X-ray CT dose in normoxic polyacrylamide gel dosimetry 1935
Medical Physics, Vol. 34, No. 6, June 2007

III. MATERIALS AND METHODS
To determine the effects of x-ray CT imaging on nPAGdosimetry, three seperate experiments were performed: !A"the quantification of CT dose for several representative poly-mer gel dosimetry imaging protocols; !B" the assessment ofpolymer gel dose response to diagnostic energy photons; and!C" a quantification of the change in CT number !induced!NCT" expected in nPAG as a result of CT imaging.
A. Measurement of CT dose for gel imaging protocols
All CT dose measurements were made on a GE HiSpeedX/i CT Scanner !GE Medical Systems, Milwaukee, WI" us-ing a RadCal 10$5–3 CT ion chamber !RadCal Corp. Mon-rovia, CA" in a range of phantoms selected to simulate typi-cal polymer gel phantoms !Fig. 2". Investigations wereundertaken for the CT dose delivered by three different poly-mer gel imaging protocols: !1" volumetric imaging, !2" re-gion of interest single slice imaging and !3" calibration vialimaging. Table I summarizes the CT imaging protocols usedin this study. These protocols are based on recent work onoptimizing CT imaging for gel dosimetry.29
1. Volumetric imaging
A CTDI ion chamber was placed in a 16 cm diameterCTDI phantom $Fig. 2!a", Nuclear Associates, Carle Place,NY% in order to mimic a typical polymer gel volumetricphantom. Measurements were made at positions A–E $Fig.2!a"% within the phantom in order to assess dose uniformity.CT imaging parameters were as given in Table I. Chamberreadings were converted to absorbed dose using Eqs. !2" and!3". The chamber factor !Cf" was obtained through cross-calibration to a calibrated ion chamber !Vancouver GeneralHospital, RadCal 10$5–3 CT ionization chamber". Nk forthis chamber was supplied by the National Research Councilof Canada !NRC".
2. Single slice, ROI imaging
CT dose measurements for single slice !ROI" imagingwere determined from the CTDI measurements obtained forvolumetric imaging as described above. The single slice,ROI CT imaging protocols used are as listed in Table I.CTDI doses were converted to single slice peak doses usingdose profiles measured with X-OMAT V film !EastmanKodak Company, Rochester, NY". Films were placed withinslabs of solid water !Gammex RMI, Middleton, WI" placedparallel to the scanner couch. Solid water slabs were 8 cm indepth to provide comparable scatter conditions to the CTDI
measurements. Dose profiles were extracted along the z axis!of the scanner" from the irradiated films utilizing in-housesoftware. The scatter component from the CTDI measure-ments was removed according to
FIG. 2. Phantoms used in CT dose measurements, irradiations, and imagingstudies. !a" 16 cm diameter CTDI phantom. !b" Styrofoam gel “calibration”phantom. !c" Styrofoam phantom used for 140 kVp gel irradiations and inthe assessment of CT dose uniformity. Letters A–E indicate points ofmeasurement.
1936 Baxter, Jirasek, and Hilts: X-ray CT dose in normoxic polyacrylamide gel dosimetry 1936
Medical Physics, Vol. 34, No. 6, June 2007

PD = CTDI!100"PATA
, !4"
where PD is the single slice peak dose, PA is the peak area!i.e., the integral area under the dose profile curve taken atthe nominal slice width" and TA is the total area of the doseprofile.
3. Calibration vial imaging
CT doses for imaging gel calibration vials were deter-mined in a similar manner to the gel volume ROI dosesdescribed above. The CTDI ion chamber was housed withina purpose-built 1.5 cm diameter acrylic insert designed tomimic gel calibration vials used for CT gel dosimetry24 andirradiated within a styrofoam calibration phantom, shown inFig. 2!b". CTDI!100" measurements were obtained at posi-tions A–D $see Fig. 2!b"% to establish uniformity within thephantom. Dose profiles were measured using a 3 cm hori-zontal stack of solid water with film at 1.5 cm depth to pro-vide similar scatter conditions to the CTDI measurements.Peak single slice doses were calculated using Eq. !4" as de-scribed above.
B. Gel dose response measurements
1. Gel Preparation
Details of gel preparation are given elsewhere.2 Briefly,all gels were made under a fume hood and were composed of3% !by weight" acrylamide, 3% methelyne bi-acrylamide!both of electrophoresis grade, Sigma Aldrich, St. Louis,MO", 5% 300 bloom porcine skin gelatin !Sigma Aldrich",89% deionized water, and 4.65 mM tetrakis hydroxymethylphosphonium chloride !THPC" !Sigma Aldrich". This nPAGcomposition was shown previously to provide an optimizedpolymer gel CT dose response.2 Gels were manufactured inbulk and transfered to 10 ml, 10 mm outer diameter, preci-sion made Pyrex™ NMR sample tubes !Wilmad Glass,Buena, NJ". The glass vials were stopped with rubber stop-pers and allowed to solidify at 4 °C. Note that since smallcalibration vials have been used in all experiments, effects ofgel container size have been minimized.30
2. MV irradiation of nPAG
Gel vials were irradiated, as described previously,25 be-tween 2 and 4 h post manufacture and using 6 MV photonsfrom a Varian CL6 linear accelerator !Varian Medical Sys-tems, Palo Alto CA". Each gel was placed at a depth of1.5 cm in a purpose-built acrylic phantom and irradiated to
uniform doses !2–50 Gy". The gels were analyzed 7 dayspost irradiation using Raman spectroscopy as described inSec. III B 4, below.
3. kV irradiation of nPAG
Kilovolt irradiation was performed using a GE HiSpeedX/i CT scanner !GE Medical Systems, Milwaukee WI" oper-ating at 140 kVp. Gel vials were irradiated between 2 and4 h post manufacture in a specially manufactured styrofoamphantom $Fig. 2!c"%. Gels were placed along the central axisof the CT scanner and were irradiated to a range of doses!1.95–9.5 Gy" by accumulating multiple images at the samelocation. A 200 mAs tube current and a 10 mm slice thick-ness were used for all irradiations. Doses were determinedfrom measurements of CTDI and dose profiles using thesame method as described above !Sec. III A". CTDI mea-surements were made within the styrofoam irradiation phan-tom. Dose profiles were measured using film housed at adepth of 0.5 cm in a horizontal stack of solid water.CTDI!100" measurements were also made at positions A–Eof Fig. 2!c" in order to assess the dose uniformity within thephantom.
4. Raman spectroscopy
Gels were analyzed 7 days post-irradiation using Ramanspectroscopy.2,31 Raman spectra were acquired using acustom-built spectrometer with 785 nm laser excitation!Renishaw Inc, Gloucestershire, UK". Backscattered Ramanlight was incident on a 0.75 m Spectra Pro monochromater!Acton Research Corp., Trenton, NJ" equipped with a600 mm−1 grating and collected using a 1340$400 pixelCCD operating at −75 °C. !Princton Instruments, Trenton,NJ". The wavenumber axis was calibrated using Tylenol as afrequency standard.40
Four Raman spectra !4 min acquisition time/spectrum"were acquired on each polymer gel sample and averaged fornoise reduction purposes. Linear baselines were subtractedfrom each averaged spectrum and resulting spectra were nor-malized to the 0 Gy dataset. As acrylamide consumption inirradiated polymer gels has been shown to be directly relatedto polymer formation,25 the resultant gel dose response curve!i.e., acrylamide consumption vs absorbed dose" was used asa direct measure of the amount of polymer formed withinirradiated gel samples.
C. !NCT of MV and kV irradiated nPAG
The !NCT induced in nPAG gel through CT imaging wasdetermined from !1" measured CT doses for gel imaging pro-
TABLE I. Typical x-ray CT imaging protocols used in polymer gel dosimetry. Phantoms are shown in Fig. 2.
Imaging protocol Phantom kVp mA s # averages Slice thickness !mm"
Volumetric 16 cm diam. CTDI 120–140 200 16 2–10Single slice !ROI" 16 cm diam. CTDI 120–140 200 32 2–10
Calibration Gel calibration 140 200 16 10
1937 Baxter, Jirasek, and Hilts: X-ray CT dose in normoxic polyacrylamide gel dosimetry 1937
Medical Physics, Vol. 34, No. 6, June 2007
tocols !as described in Sec. III A", !2" the relative dose re-sponse of nPAG irradiated with 140 kVp and 6 MV photonbeams !as described in Sec. III B" and !3" the measured!NCT dose response for MV irradiated nPAG gel. The !NCTdose response for nPAG irradiated with 6 MV photons iswell established and methods of measurement have been de-scribed in detail elsewhere.2,6 The details of this calculationare given in the Appendix.
IV. RESULTS
A. CT Dose absorbed in nPAG
1. Doses delivered by gel CT imaging protocols
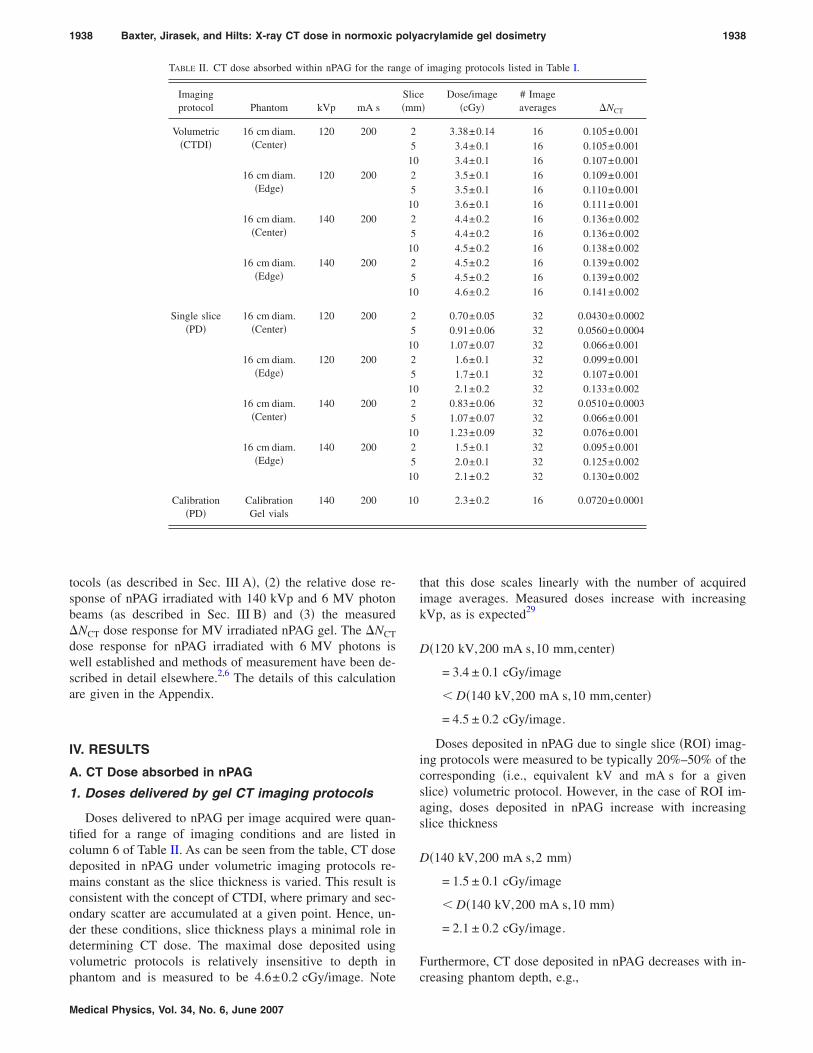
Doses delivered to nPAG per image acquired were quan-tified for a range of imaging conditions and are listed incolumn 6 of Table II. As can be seen from the table, CT dosedeposited in nPAG under volumetric imaging protocols re-mains constant as the slice thickness is varied. This result isconsistent with the concept of CTDI, where primary and sec-ondary scatter are accumulated at a given point. Hence, un-der these conditions, slice thickness plays a minimal role indetermining CT dose. The maximal dose deposited usingvolumetric protocols is relatively insensitive to depth inphantom and is measured to be 4.6±0.2 cGy/image. Note
that this dose scales linearly with the number of acquiredimage averages. Measured doses increase with increasingkVp, as is expected29
D!120 kV,200 mA s,10 mm,center"
= 3.4 ± 0.1 cGy/image
" D!140 kV,200 mA s,10 mm,center"
= 4.5 ± 0.2 cGy/image.
Doses deposited in nPAG due to single slice !ROI" imag-ing protocols were measured to be typically 20%–50% of thecorresponding !i.e., equivalent kV and mA s for a givenslice" volumetric protocol. However, in the case of ROI im-aging, doses deposited in nPAG increase with increasingslice thickness
D!140 kV,200 mA s,2 mm"
= 1.5 ± 0.1 cGy/image
" D!140 kV,200 mA s,10 mm"
= 2.1 ± 0.2 cGy/image.
Furthermore, CT dose deposited in nPAG decreases with in-creasing phantom depth, e.g.,
TABLE II. CT dose absorbed within nPAG for the range of imaging protocols listed in Table I.
Imagingprotocol Phantom kVp mA s
Slice!mm"
Dose/image!cGy"
# Imageaverages !NCT
Volumetric!CTDI"
16 cm diam.!Center"
120 200 2 3.38±0.14 16 0.105±0.0015 3.4±0.1 16 0.105±0.001
10 3.4±0.1 16 0.107±0.00116 cm diam.
!Edge"120 200 2 3.5±0.1 16 0.109±0.001
5 3.5±0.1 16 0.110±0.00110 3.6±0.1 16 0.111±0.001
16 cm diam.!Center"
140 200 2 4.4±0.2 16 0.136±0.0025 4.4±0.2 16 0.136±0.002
10 4.5±0.2 16 0.138±0.00216 cm diam.
!Edge"140 200 2 4.5±0.2 16 0.139±0.002
5 4.5±0.2 16 0.139±0.00210 4.6±0.2 16 0.141±0.002
Single slice!PD"
16 cm diam.!Center"
120 200 2 0.70±0.05 32 0.0430±0.00025 0.91±0.06 32 0.0560±0.0004
10 1.07±0.07 32 0.066±0.00116 cm diam.
!Edge"120 200 2 1.6±0.1 32 0.099±0.001
5 1.7±0.1 32 0.107±0.00110 2.1±0.2 32 0.133±0.002
16 cm diam.!Center"
140 200 2 0.83±0.06 32 0.0510±0.00035 1.07±0.07 32 0.066±0.001
10 1.23±0.09 32 0.076±0.00116 cm diam.
!Edge"140 200 2 1.5±0.1 32 0.095±0.001
5 2.0±0.1 32 0.125±0.00210 2.1±0.2 32 0.130±0.002
Calibration!PD"
CalibrationGel vials
140 200 10 2.3±0.2 16 0.0720±0.0001
1938 Baxter, Jirasek, and Hilts: X-ray CT dose in normoxic polyacrylamide gel dosimetry 1938
Medical Physics, Vol. 34, No. 6, June 2007

D!140 kV,200 mA s,10 mm,center"
= 1.2 ± 0.1 cGy/image
" D!140 kV,200 mA s,10 mm,edge"
= 2.1 ± 0.2 cGy/image.
Doses deposited in nPAG calibration vials were recordedto be 2.3±0.2 cGy/image, similar to ROI imaging protocolsin the “edge” region of the phantom.
Figure 3 illustrates the absorbed dose in nPAG as a func-tion of the number of image averages for the range of imag-ing protocols listed in Table II. As can be seen from Fig. 3,volumetric imaging delivers the highest doses, up to#100 cGy for typical imaging protocols !i.e., "20 imageaverages". ROI and calibration gel imaging deliver lowerdoses, on the order of #75 cGy for typical imaging proto-cols !i.e., "30 image averages".
2. Dose uniformity
Dose uniformity, expressed as a percent relative to a cen-tral marker, is listed in Table III for the three phantoms!marked locations given in Fig. 2" and for single slice imag-ing techniques. As can be seen from the table, dose varia-tions of up to 11% occur within the 16 cm diameter phan-tom. The anterior !B" and posterior !D" positions show thegreatest dose variation !+8% and −11%, respectively" as
compared to the central region of the phantom. These varia-tions are due to photon attenuation from the CT patientcouch which supports the phantom. Similar results are ob-served for the calibration vial phantom $Fig. 2!b"%, withmaximum dose variation occurring in position D !−7% ".The gel phantom of Fig. 2!c" exhibited the greatest variationin absorbed dose, with positions A and E varying up to −26%as compared to position C. The lower doses deposited in theouter positions are likely due to the highly nonuniform phan-tom thickness at these positions !as “seen” by the incidentphotons", thus causing increased primary x-ray beam attenu-ation at these positions. Hence, only the center three posi-tions !B, C, D" were used for the nPAG irradiations per-formed in Sec. IV B.
B. NPAG dose response to 6 MV and 140 kVirradiation energies
The responses of nPAG to both kV !i.e., CT" and MVenergy photons were measured using Raman spectroscopy,as a step in the assessment of the impact of the doses re-corded in Table II on !NCT in nPAG. The Raman spectra ofirradiated nPAG are shown in Fig. 4 for both 140 kVp $Fig.4!a"% and 6 MV $Fig. 4!b"% irradiated gels. Figure 4 illus-trates the consumption of acrylamide !peak centered at1285 cm−1" and bis-acrylamide !peak centered at 1256 cm−1"as a function of absorbed radiation dose. As can be seen from
FIG. 3. CT dose absorbed in polymer gel as a function of the number ofimage averages and imaged with the protocols of Table I. Vol=volumetricimaging, SP=single position imaging, calib ptm=calibration gel vial phan-tom, C=central position in phantom, and E=edge position in phantom.Nominal slice thickness indicated in mm.
TABLE III. Uniformity of CTDI doses for phantoms shown in Fig. 2. EachCTDI measurement has an uncertainty of 4%.
Phantom
Dose uniformity
A B C D E
16 cm diameter phantom 100% 108% 102% 89% 101%Calibration phantom 100% 103% 99% 93%
Gel irradiation phantom 75% 94% 100% 93% 74%
FIG. 4. Raman spectra acquired on nPAG samples irradiated between0–10 Gy with !a" 6 MV !linac". !b" 140 kVp !CT scanner" inident photonbeams.
1939 Baxter, Jirasek, and Hilts: X-ray CT dose in normoxic polyacrylamide gel dosimetry 1939
Medical Physics, Vol. 34, No. 6, June 2007

the figure, less acrylamide/bis-acrylamide conversion topolymer occurs !per unit absorbed dose" for gels irradiatedwith 140 kVp photons as compared to gels irradiated with6 MV photons.
The differential rates of consumption of acryl-amide observed in Fig. 4 are quantified in Fig. 5. Theacrylamide consumption curves of Fig. 5 can be consideredquasi-linear in the 0–10 Gy range, with slopes m6 MV=−0.0374±0.0006 Gy−1 and m140 kVp=−0.016±0.001 Gy−1
!note: y axis unit in Fig. 5 is in arbitrary Raman intensityunits". The rate of acrylamide consumption has been directlyrelated to the rate of polymer formation for polyacrylamide-based gels.25,32 Hence, the differential rates of acrylamideconsumption illustrated in Fig. 5 are a direct measure of adifferential rate of polymer formation for polymer gels irra-diated with kV or MV photon beams. The lower rate of poly-mer formation in gels irradiated with 140 kVp photons trans-lates to a lower CT response !per unit dose" for gelsirradiated with equivalent doses of 140 kVp x rays as com-pared to 6 MV photons, as discussed further in Sec. V.
C. CT imaging induced !NCT in nPAG
It can be deduced from Fig. 5 that some polymerizationwill be induced in active polymer gels imaged with CT whenusing typical imaging protocols !e.g., Table I". This addi-tional polymerization will in turn translate to a !NCT inducedthrough the imaging process. However, the induced !NCTwill be lower than anticipated through inspection of Table IIand application of the well known 6 MV nPAG doseresponse,2,6 due to the differential dose response between kVand MV radiation as illustrated in Fig. 5. !NCT induced bythe imaging process was calculated using the relative re-sponse shown in Fig. 5 and previously published 6 MVnPAG CT dose response data2 reproduced here for referencein Fig. 6 !dark trace". The slope of this 6 MV !NCT doseresponse curve is 0.47±0.01 H Gy−1.2 Results for the calcu-lated 140 kVp response are also shown in Fig. 6 !light trace".As can be seen from the figure, the nPAG 140 kVp !NCT
dose response is weaker than the corresponding 6 MV doseresponse curve. The slope of the constructed 140 kVp re-sponse curve is 0.19±0.02 H Gy−1, less than one-half theslope of the polymer gel dose response to 6 MV radiation.
The !NCT dose response established for nPAG irradiatedwith a kV photon beam !Fig. 6" was used to calculate theanticipated !NCT resulting from the different imaging proto-cols listed in Table I. Results are tabulated as the last columnof Table II for the number of image averages !NAX" listed incolumn 7 of Table II. Calculated !NCT versus NAX is shownin Fig. 7. As can be seen from Fig. 7, volumetric imaginginduces the largest !NCT of the tested protocols. In addition,!NCT is largely independent of slice thickness. For typicalimaging protocols, an induced !NCT"0.25 H can be antici-pated for volumetric imaging. Single slice !ROI" imaging!i.e., for protocols with #"30 image averages" typicallyinduces a "0.1 H !NCT in nPAG gel dosimeters. The imag-ing of calibration gel vials induces a !NCT of "0.2 H for a
FIG. 5. Relative change of acrylamide peak intensity as a function of ab-sorbed radiation dose for polymer gels irradiated with 6 MV !linac" and140 kVp !CT scanner" incident photon beams.
FIG. 6. !NCT as a function of absorbed radiation dose for polymer gel irra-diated with 6 MV !linac" and 140 kVp !CT scanner" incident photonsenergies.
FIG. 7. Induced !NCT in polymer gel as a function of the number of imageaverages and imaged with the protocols of Table I. Vol=volumetric imag-ing, SP=single position imaging, calib ptm=calibration gel vial phantom,C=central position in phantom, and E=edge position in phantom. Nominalslice thickness indicated in mm.
1940 Baxter, Jirasek, and Hilts: X-ray CT dose in normoxic polyacrylamide gel dosimetry 1940
Medical Physics, Vol. 34, No. 6, June 2007
16 slice acquisition using 140 kVp, 200 mA s, and a 10 mmslice thickness, which is a typical gel calibration imagingprotocol. These induced !NCT values are below the limit ofdetectability in current CT nPAG dosimetry.
V. DISCUSSION
A. NPAG dose response to kV irradiation energies
As is observed in Fig. 5, the dose response of nPAG to140 kVp photon energies !i.e., as emitted from a CT scanner"is weaker than the dose response of nPAG irradiated with6 MV photons !i.e., as emitted from a radiation therapy lin-ear accelerator". Several possibilities exist for this discrep-ancy.
A dose rate-dependent polymer gel dose response hasbeen reported previously.3,33 However, at most, a 5% differ-ence in the slope of the polymer gel dose response curve wasreported for gels irradiated with dose rates between10–400 cG/min. Thus, the magnitude of the difference indose rates between the 140 kVp !200–300 cGy/min" and6 MV !400 cGy/min" irradiations performed in these experi-ments cannot explain the observed differences in nPAG doseresponse. However, the method of delivery of radiation isdifferent between the 140 kVp and 6 MV beams: the140 kVp beam produced by the CT scanner is of constantdose rate !i.e., not pulsed", whereas the 6 MV linac beam ispulsed. Hence, instantaneous dose rates between the two de-livery systems can be significantly different. The differencein polymer gel dose response irradiated with pulsed versusconstant beam irradiation has not been fully investigated andremains as future work.
Below #60 keV incident photon energies, the radiologi-cal tissue equivalence of polymer gels becomescompromised.34 The photon beam emitted from the CT scan-ner is a polyenergetic beam with a fraction of the emittedphotons below #60 keV. Hence, a possibility exists of nontissue equivalence perturbing the polymer gel dose response.However, correction factors for this effect are on the order of1–2%.34 Furthermore, the direction of the correction factor isopposite to that of the discrepancy observed in the currentstudy. Hence, this correction cannot account for the observeddiscrepancy in polymer gel dose response.
A difference exists between the mean linear energy trans-fer !LET" of the two incident photon beams. LET depen-dence of polymer gel dosimeters has been studied by a num-ber of researchers.35,36 In each of the cases studied, apolymer gel under-response was observed for high LET in-cident particle irradiation, as compared to low LET !i.e.,6 MV photon" irradiation. The magnitude of the under-response was found to be proportional to the incident particleLET and due to dose saturation effects close to the tracks ofincident particles.36 In the current study, due to differences instopping power, the mean LET for 140 kVp incident photonsis #60 MeV/cm, as compared to a mean LET of#5 MeV/cm for an incident beam of 6 MV photons.37,38
This discrepancy in LET is similar to that studied earlier36
for incident proton beam irradiation of polymer gel. The dis-crepancy in dose response curves !Fig. 5" observed in the
current study is also of similar magnitude to that observedearlier.36 Hence, it is possible to at least partially attribute theobserved discrepancy in nPAG dose response curves !Fig. 5"to a LET effect.
B. !NCT induced in nPAG through CT imaging
In Sec. IV C, the induced !NCT due to CT imaging ofpolymer gel was quantified. In general, it can be seen !e.g.,Table II and Fig. 7" that under typical CT imaging protocolsa !NCT"0.2 H is induced in nPAG polymer gel due to CTimaging. This induced !NCT is currently below the limit ofdetectability in CT dosimetry using nPAG. Further, it isnoted that the induced !NCT are for active nPAG, i.e., gelsthat have not been made inactive by the presence of oxygen.It is common practice in CT polymer gel dosimetry to inac-tivate polymer gel !post-irradiation" through exposure to at-mospheric oxygen. Hence, in doing so a reduction in induced!NCT would be observed. However, for larger gel phantoms,waiting for oxygen to permeate throughout the volume of thepolymer gel may become impractical due to the long waittimes required to fully inactivate the polymer gel.39 Further-more, our initial investigations of nPAG have revealed thatthe diffusion of atmospheric oxygen through nPAG may beslower than for traditional PAG !i.e., polyacrylamide gel withno oxygen scavenger". Oxygen diffusion through nPAG re-quires further investigation.
For CT polymer gel dosimetry applications requiringvolumetric imaging using a large number of averages !e.g.,60", the induced !NCT can become large enough !#0.5 H"so as to be above the limit of detectability of the currenttechnique. This 0.5 H can induce a relative dose error of 6%for a gel irradiated in a linac to 20 Gy !i.e., !NCT=8".Hence, in such rare cases it may become necessary to ensurethat this induced !NCT is appropriately accounted for, eitherby inducing similar !NCT in the dose calibration vials, orthrough polymer gel inactivation prior to imaging. In theformer case, the uniformity of dose deposition due to CTscanning !Table III" would need to be considered. These av-enues remain to be fully explored.
VI. CONCLUSIONS
The effects of CT dose due to typical polymer gel dosim-etry CT imaging protocols have been examined. It has beenobserved that under typical imaging protocols, as defined byvolumetric, ROI, and calibration vial imaging, a !NCT"0.2 H is induced into nPAG polymer gels. Under expandedprotocols !e.g., large number of image averages" a !NCT#0.5 H can be induced through the CT imaging process. Inthese rare cases, appropriate correction/or minimization mea-sures will need to be considered.
ACKNOWLEDGMENTS
We would like to acknowledge the financial support of theNatural Science and Engineering Research Council!NSERC", the Canadian Foundation for Innovation !CFI",
1941 Baxter, Jirasek, and Hilts: X-ray CT dose in normoxic polyacrylamide gel dosimetry 1941
Medical Physics, Vol. 34, No. 6, June 2007

the British Columbia Knowledge Development Fund!BCKDF", and the British Columbia Cancer Foundation.
APPENDIX: CALCULATION OF INDUCED!NCT
The calculation of the induced !NCT proceeds in twosteps. The first step is to determine the dose required to bedelivered with 6 MV photons which generates an equivalent!NCT !i.e., dose response" as in nPAG that has been irradi-ated with 140 kVp photons. This is obtained from Fig. 5 and
eqDMV =AAkV − 1
m6 MV, !A1"
where eqDMV is the dose delivered by a 6 MV photon beamand required to generate an equivalent !NCT to that gener-ated through 140 kVp photon irradiation, AAkV is the frac-tion of acrylamide remaining after a given kVp dose !takenfrom Fig. 5", and m6 MV is the slope of the 6 MV curveshown in Fig. 5. Note that eqDMV will be lower, for a givenresponse, than the dose delivered by the 140 kVp beam. Thesecond step is to calculate the !NCT induced through CTimaging using
in!NCT = m6 MV,CTeqDMV !A2"
where in!NCT is the induced !NCT and m6 MV,CT=0.47±0.01 H Gy−1 is the slope of the 6 MV !NCT doseresponse curve.
a"Electronic mail: [email protected]. M. Fong, D. C. Keil, M. D. Does, and J. C. Gore, “Polymer gels formagnetic resonance imaging of radiation dose distributions at normalroom atmosphere,” Phys. Med. Biol. 46, 3105–3113 !2001".
2A. Jirasek, M. Hilts, C. Shaw, and P. Baxter, “Investigation of tetrakishydroxymethyl phosphonium chloride as an antioxidant for use in x-raycomputed tomography polyacrylamide gel dosimetry,” Phys. Med. Biol.51, 1891–1906 !2006".
3Y. De Deene, K. Vergote, C. Claeys, and C. De Wagter, “The fundamentalradiation properties of normoxic polymer gel dosimeters: A comparisonbetween a methacrylic acid based gel and acrylamide based gels,” Phys.Med. Biol. 51, 653–673 !2006".
4A. J. Venning, B. Hill, S. Brindha, B. J. Healy, and C. Baldock, “Inves-tigation of the PAGAT polymer gel dosimeter using magnetic resonanceimaging,” Phys. Med. Biol. 50, 3875–3888 !2005".
5B. Hill, A. Venning, and C. Baldock, “The dose response of normoxicpolymer gel dosimeters measured using X-ray CT,” Br. J. Radiol. 78,623–630 !2005".
6S. Brindha, A. Venning, B. Hill, and C. Baldock, “Experimental study ofattenuation properties of normoxic polymer gel dosimeters,” Phys. Med.Biol. 49, N353–N361 !2004".
7E. Vanden Bussche, Y. De Deene, K. Vergote, and C. De Wagter, “Alter-native gelling agents for normoxic gels: A stability study,” J. Phys.: Conf.Ser. 3, 158–161 !2004".
8B. Hill, A. Venning, and C. Baldock, “Use of normoxic polymer geldosimeters for measuring diagnostic doses on CT scanners,” J. Phys.:Conf. Ser. 3, 214–217 !2004".
9H. Gustavsson, A. Karlsson, S. A. J. Back, L. E. Olsson, P. Haraldsson, P.Engstrom, and H. Nystrom, “MAGIC-type polymer gel for three-dimensional dosimetry: Intensity-modulated radiation therapy verifica-tion,” Med. Phys. 30, 1264–1271 !2003".
10Fourth International Conference on Radiotherapy Gel Dosimetry, editedby M. Lepage, A. Jirasek, and L. J. Schreiner, J. Phys. Conf. Series, 56,2006.
11Y. De Deene and C. De Wagter, “Artefacts in multi-echo T2 imaging forhigh-precision gel dosimetry: III. Effects of temperature drift during scan-ning,” Phys. Med. Biol. 46, 2697–2711 !2001".
12M. Lepage, P. M. Jayasakera, S. A. J. Back, and C. Baldock, “Doseresolution optimization of polymer gel dosimeters using different mono-mers,” Phys. Med. Biol. 46, 2665–2680 !2001".
13Y. De Deene, C. De Wagter, W. De Neve, and E. Achten, “Artefacts inmulti-echo T2 imaging for high-precision gel dosimetry: II. Analysis ofB1-field inhomogeneity,” Phys. Med. Biol. 45, 1825–1839 !2000".
14Y. De Deene, C. De Wagter, B. Van Duyse, S. Derycke, B. Mersseman,W. De Gersem, T. Voet, E. Achten, and W. De Neve, “Validation ofMR-based polymer gel dosimetry as a preclinical three-dimensional veri-fication tool in conformal radiotherapy,” Magn. Reson. Med. 43, 116–125 !2000".
15I. C. Baustert, M. Oldham, T. A. D. Smith, S. Webb, and M. O. Leach,“Optimized MR imaging for polyacrylamide gel dosimetry,” Phys. Med.Biol. 45, 847–858 !2000".
16M. Lepage, P. S. Tofts, S. A. Back, P. M. Jayasekera, and C. Baldock,“Simple methods for the correction of T2 maps of phantoms,” Magn.Reson. Med. 46, 1123–1129 !2001".
17P. Guo, J. Adamovics, and M. Oldham, “A practical three-dimensionaldosimetry system for radiation dosimetry,” Med. Phys. 33, 3962–3972!2006".
18S. J. Doran, N. Krstajic, J. Adamovics, and P. M. Jenneson, “Optical CTscanning of presage™ polyurethane samples with a CCD-based readoutsystem,” 3rd International Conference on Radiotherapy Gel Dosimetry,edited by Y. De Deene and C. Baldock, J. Phys. Conf. Series, 3, 2004.
19M. Oldham, G. Gluckman, and L. Kim, “3D verification of a prostateIMRT treatment by polymer gel-dosimetry and optical-CT scanning,” in3rd International Conference on Radiotherapy Gel Dosimetry, edited byY. De Deene and C. Baldock, J. Phys. Conf. Series, 3, 2004.
20M. Hilts, C. Audet, C. Duzenli, and A. Jirasek, “Polymer gel dosimetryusing x-ray computed tomography: A feasibility study,” Phys. Med. Biol.45!9", 2559–2571 !2000".
21J. V. Trapp, G. Michael, Y. De Deene, and C. Baldock, “Attenuation ofdiagnostic energy photons by polymer gel dosimeters,” Phys. Med. Biol.47, 4247–4258 !2002".
22C. Audet, M. Hilts, A. Jirasek, and C. Duzenli, “CT gel dosimetry tech-nique: Comparison of a planned and measured 3D stereotactic dose vol-ume,” J. Appl. Clin. Med. Phys. 3, 110–118 !2002".
23A. Jirasek, Q. Matthews, M. Hilts, G. Schulze, M. W. Blades, and R. F. B.Turner, “Investigation of a 2D two-point maximum entropy regularizationmethod for signal-to-noise ratio enhancement: Application to CT polymergel dosimetry,” Phys. Med. Biol. 51, 2599–2617 !2006".
24M. Hilts and C. Duzenli, “Image filtering for improved dose resolution inCT polymer gel dosimetry,” Med. Phys. 31, 39–49 !2004".
25A. Jirasek, C. Duzenli, C. Audet, and J. Eldridge, “Characterization ofmonomer/crosslinker consumption and polymer formation observed inFT-Raman spectra of irradiated polyacrylamide gels,” Phys. Med. Biol.46, 151–165 !2001".
26A. Jirasek and C. Duzenli, “Effects of crosslinker fraction in polymer geldosimeters using FT Raman spectroscopy,” Phys. Med. Biol. 46, 1949–1961 !2001".
27C. Baldock, L. Rintoul, S. F. Keevil, J. M. Pope, and G. A. George,“Fourier transform Raman spectroscopy of polyacrylamide gels !PAGs"for radiation dosimetry,” Phys. Med. Biol. 43, 3617–3627 !1998".
28T. B. Shope, R. M. Geagne, and G. C. Johnson, “A method for determin-ing the dose delivered by transmission x-ray computed tomography,”Med. Phys. 8, 488–495 !1981".
29M. Hilts, A. Jirasek, and C. Duzenli, “Technical considerations for imple-mentation of x-ray CT polymer gel dosimetry,” Phys. Med. Biol. 50,1727–1745 !2005".
30G. J. Salomons, Y. S. Park, K. B. McAuley, and L. J. Schreiner, “Tem-perature increases associated with polymerization of irradiated PAG do-simeters,” Phys. Med. Biol. 47, 1435–1448 !2002".
31C. Baldock, M. Lepage, L. Rintoul, P. Murray, and A. K. Whittaker,Investigation of polymerization of radiation dosimetry polymer gels, Pro-ceedings of the 1st International Workshop on Radiation Therapy GelDosimetry, edited by L. J. Schriener and C. Audet, Canadian College ofPhysicists in Medicine and Canadian Organization of Medical Physicists,Lexington KY, 1999, pp. 99–105.
32M. Hilts, A. Jirasek, and C. Duzenli, “Effects of gel composition on theradiation induced density change in PAG polymer gel dosimeters: Amodel and experimental investigations,” Phys. Med. Biol. 49, 2477–2490!2004".
33J. Novotny, Jr., V. Spevacek, P. Dvorak, J. Novotny, and T. Cechak,
1942 Baxter, Jirasek, and Hilts: X-ray CT dose in normoxic polyacrylamide gel dosimetry 1942
Medical Physics, Vol. 34, No. 6, June 2007

“Energy and dose rate dependence of BANG-2 polymer-gel dosimeter,”Med. Phys. 28, 2379–2386 !2001".
34E. Pantelis, A. K. Karlis, M. Kozicki, P. Papagiannis, L. Sakelliou, and J.M. Rosiak, “Polymer gel water equivalence and relative energy responsewith emphasis on low photon energy dosimetry in brachytherapy,” Phys.Med. Biol. 49, 3495–3514 !2004".
35H. Gustavsson, S. Back, J. Medin, E. Grusell, and L. E. Olsson, “Linearenergy transfer dependence of a normoxic polymer gel dosimeter inves-tigated using proton beam absorbed dose measurements,” Phys. Med.Biol. 49, 3847 !2004".
36A. Jirasek and C. Duzenli, “Relative effectiveness of polyacrylamide geldosimeters applied to proton beams: Fourier transform Raman observa-tions and track structure calculations,” Med. Phys. 29, 569–577 !2002".
37G. Makrigiorgos and L. M. Chin, “Measurement of the restricted let oforthovoltage and low-energy x-rays in tissue-equivalent plastic,” Phys.Med. Biol. 36, 835–841 !1991".
38“International commission on radiation units and measurements report 16:Linear energy transfer,” Technical report, Washington DC, 1970.
39S. Hepworth, M. O. Leach, and S. J. Doran, “Dynamics of polymerizationin polyacrylamide gel !PAG" dosimeters: !II" modeling oxygen diffu-sion,” Phys. Med. Biol. 44, 1875–1884 !1999".
40R. L. McCreery, Raman Spectroscopy for Chemical Analysis, Vol. 177 inChemical Analysis, A Series of Monographs on Analytical Chemistry andIts Applications, edited by J. D. Winefordner, John Wiley and Sons, NewYork, 2000.
1943 Baxter, Jirasek, and Hilts: X-ray CT dose in normoxic polyacrylamide gel dosimetry 1943
Medical Physics, Vol. 34, No. 6, June 2007