The acute hypoxic ventilatory response: Testing the adaptive significance in human populations
14
The acute hypoxic ventilatory response: Testing the adaptive significance in human populations John S. Terblanche a, T , Krystal A. Tolley b , Andreas Fahlman a , Kathryn H. Myburgh a , Sue Jackson a a Department of Physiological Sciences, University of Stellenbosch, Private Bag X1, Matieland 7602, South Africa b Centre for Invasion Biology, University of Stellenbosch, Stellenbosch, South Africa Received 8 July 2004; received in revised form 23 January 2005; accepted 24 January 2005 Abstract The acute Hypoxic Ventilatory Response (HVR) is an important component of human hypoxia tolerance, hence presumably physiological adaptation to high altitude. We measured the isocapnic HVR (L min 1 % 1 ) in two genetically divergent low altitude southern African populations. The HVR does not differ between African Xhosas (X) and Caucasians (C) (X:0.34F0.36; C:0.42F0.33; PN0.34), but breathing patterns do. Among all Xhosa subjects, size-independent tidal volume was smaller (X: 0.75F0.20; C: 1.11F0.32 L; Pb0.01), breathing frequency higher (X: 22.2F5.7; C: 14.3F4.2 breaths min 1 ; Pb0.01) and hypoxic oxygen saturation lower than among Caucasians (X: 78.4F4.7%; C: 81.7F4.7%; Pb0.05). The results remained significant if subjects from Xhosa and Caucasian groups were matched for gender, body mass index and menstrual cycle phase in the case of females. The latter also employed distinct breathing patterns between populations in normoxia. High repeatability (intra-class correlation coefficient) of the HVR in both populations (0.77–0.87) demonstrates that one of the prerequisites for natural selection, consistent between-individual variation, is met. Finally, we explore possible relationships between inter-population genetic distances and HVR differences among Xhosa, European, Aymara Amerindians, Tibetan and Chinese populations. Inter-population differences in the HVR are not attributable to genetic distance (Mantel Z-test, P=0.59). The results of this study add novel support for the hypothesis that differences in the HVR, should they be found between other human populations, may reflect adaptation to hypoxia rather than genetic divergence through time. D 2005 Elsevier Inc. All rights reserved. Keywords: Evolution; Hypoxia tolerance; Low-altitude population; Repeatability; Variation; Ventilatory adaptation 1. Introduction Inter-population comparisons of human ventilatory responses to hypoxia help elucidate the history of our species’ adaptation to high altitude (HA). For example, many studies indicate that Tibetans ventilate more (volume per unit time) than Andean high-altitude natives residing at similar altitudes (see reviews by Beall, 2000; Moore, 2000; Hochachka and Monge, 2000; Hochachka and Somero, 2002), and the ventilation response to acute hypoxia (HVR) may be significantly greater among Himalayan than among Andean residents at ~4200 m (Beall et al., 1997a; Moore, 2000). Comparisons between low and high altitude pop- ulations (e.g. Lahiri et al., 1970; Zhuang et al., 1993; Curran et al., 1997) have added support to the possibility that between-population variation in the HVR reflects adaptation to local environmental (hypoxic) conditions (but see Vargas et al., 1998). However, the generality of such differences may not apply when all available studies are collectively analysed. For example, Moore (2000) regards the HVR differences between Tibetan than Andean high-altitude natives as unresolved. Demonstrations that phenotypic differences in ventilatory sensitivity among populations arise from natural selection, reflecting genotypic adaptations to hypoxia, are generally a 1095-6433/$ - see front matter D 2005 Elsevier Inc. All rights reserved. doi:10.1016/j.cbpb.2005.01.016 T Corresponding author. S.P.A.C.E. Group, Department of Botany and Zoology, University of Stellenbosch, Private Bag X1, Matieland 7602, South Africa. Tel.: +27 21 808 2605; fax: +27 21 808 2405. E-mail address: [email protected] (J.S. Terblanche). Comparative Biochemistry and Physiology, Part A 140 (2005) 349– 362 www.elsevier.com/locate/cbpa
Transcript of The acute hypoxic ventilatory response: Testing the adaptive significance in human populations

www.elsevier.com/locate/cbpa
Comparative Biochemistry and Physiol
The acute hypoxic ventilatory response: Testing the adaptive
significance in human populations
John S. Terblanchea,T, Krystal A. Tolleyb, Andreas Fahlmana,
Kathryn H. Myburgha, Sue Jacksona
aDepartment of Physiological Sciences, University of Stellenbosch, Private Bag X1, Matieland 7602, South AfricabCentre for Invasion Biology, University of Stellenbosch, Stellenbosch, South Africa
Received 8 July 2004; received in revised form 23 January 2005; accepted 24 January 2005
Abstract
The acute Hypoxic Ventilatory Response (HVR) is an important component of human hypoxia tolerance, hence presumably physiological
adaptation to high altitude. We measured the isocapnic HVR (L min�1 %�1) in two genetically divergent low altitude southern African
populations. The HVR does not differ between African Xhosas (X) and Caucasians (C) (X:�0.34F0.36; C:�0.42F0.33; PN0.34), but
breathing patterns do. Among all Xhosa subjects, size-independent tidal volume was smaller (X: 0.75F0.20; C: 1.11F0.32 L; Pb0.01),
breathing frequency higher (X: 22.2F5.7; C: 14.3F4.2 breaths min�1; Pb0.01) and hypoxic oxygen saturation lower than among Caucasians
(X: 78.4F4.7%; C: 81.7F4.7%; Pb0.05). The results remained significant if subjects from Xhosa and Caucasian groups were matched for
gender, body mass index and menstrual cycle phase in the case of females. The latter also employed distinct breathing patterns between
populations in normoxia. High repeatability (intra-class correlation coefficient) of the HVR in both populations (0.77–0.87) demonstrates that
one of the prerequisites for natural selection, consistent between-individual variation, is met. Finally, we explore possible relationships
between inter-population genetic distances and HVR differences among Xhosa, European, Aymara Amerindians, Tibetan and Chinese
populations. Inter-population differences in the HVR are not attributable to genetic distance (Mantel Z-test, P=0.59). The results of this study
add novel support for the hypothesis that differences in the HVR, should they be found between other human populations, may reflect
adaptation to hypoxia rather than genetic divergence through time.
D 2005 Elsevier Inc. All rights reserved.
Keywords: Evolution; Hypoxia tolerance; Low-altitude population; Repeatability; Variation; Ventilatory adaptation
1. Introduction
Inter-population comparisons of human ventilatory
responses to hypoxia help elucidate the history of our
species’ adaptation to high altitude (HA). For example,
many studies indicate that Tibetans ventilate more (volume
per unit time) than Andean high-altitude natives residing at
similar altitudes (see reviews by Beall, 2000; Moore, 2000;
Hochachka and Monge, 2000; Hochachka and Somero,
2002), and the ventilation response to acute hypoxia (HVR)
1095-6433/$ - see front matter D 2005 Elsevier Inc. All rights reserved.
doi:10.1016/j.cbpb.2005.01.016
T Corresponding author. S.P.A.C.E. Group, Department of Botany and
Zoology, University of Stellenbosch, Private Bag X1, Matieland 7602,
South Africa. Tel.: +27 21 808 2605; fax: +27 21 808 2405.
E-mail address: [email protected] (J.S. Terblanche).
may be significantly greater among Himalayan than among
Andean residents at ~4200 m (Beall et al., 1997a; Moore,
2000). Comparisons between low and high altitude pop-
ulations (e.g. Lahiri et al., 1970; Zhuang et al., 1993; Curran
et al., 1997) have added support to the possibility that
between-population variation in the HVR reflects adaptation
to local environmental (hypoxic) conditions (but see Vargas
et al., 1998). However, the generality of such differences
may not apply when all available studies are collectively
analysed. For example, Moore (2000) regards the HVR
differences between Tibetan than Andean high-altitude
natives as unresolved.
Demonstrations that phenotypic differences in ventilatory
sensitivity among populations arise from natural selection,
reflecting genotypic adaptations to hypoxia, are generally a
ogy, Part A 140 (2005) 349–362
J.S. Terblanche et al. / Comparative Biochemistry and Physiology, Part A 140 (2005) 349–362350
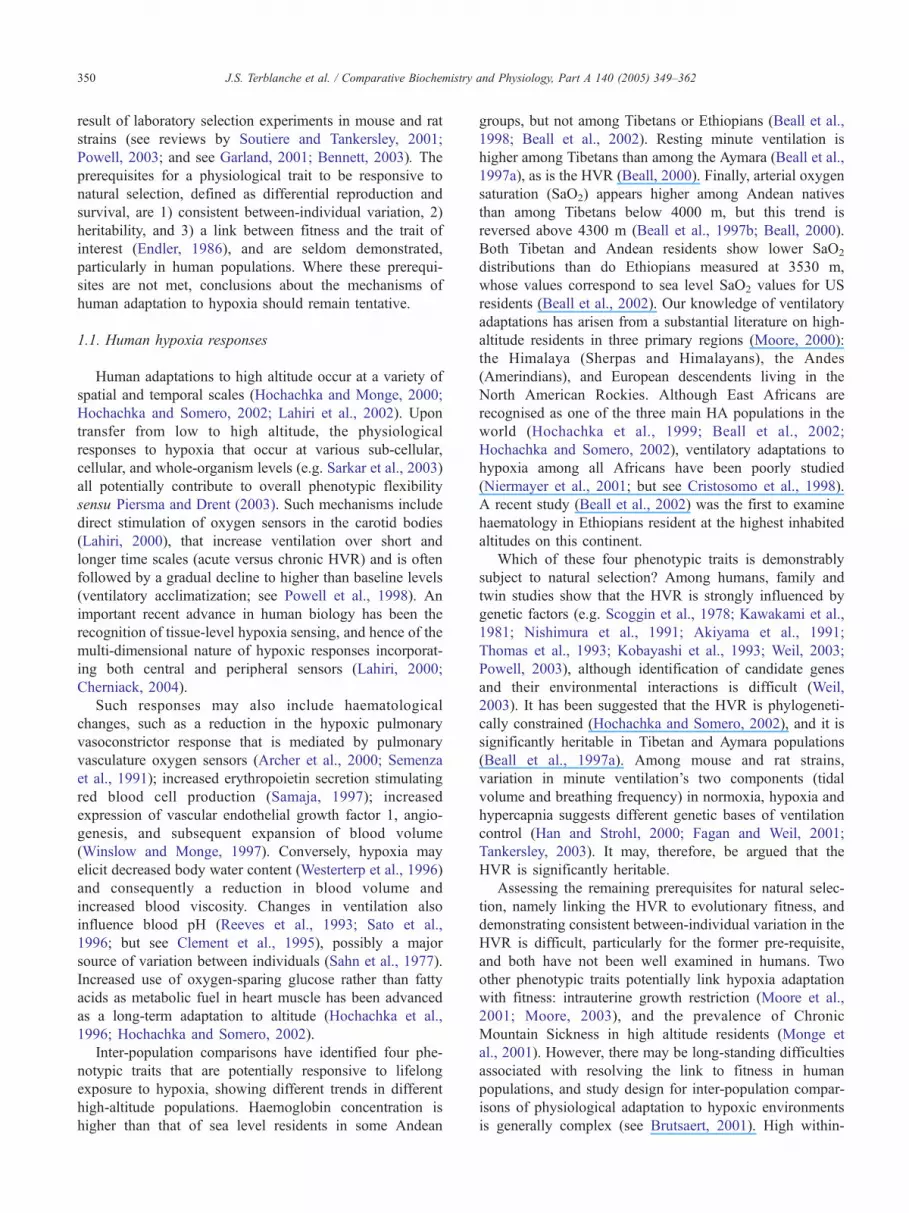
result of laboratory selection experiments in mouse and rat
strains (see reviews by Soutiere and Tankersley, 2001;
Powell, 2003; and see Garland, 2001; Bennett, 2003). The
prerequisites for a physiological trait to be responsive to
natural selection, defined as differential reproduction and
survival, are 1) consistent between-individual variation, 2)
heritability, and 3) a link between fitness and the trait of
interest (Endler, 1986), and are seldom demonstrated,
particularly in human populations. Where these prerequi-
sites are not met, conclusions about the mechanisms of
human adaptation to hypoxia should remain tentative.
1.1. Human hypoxia responses
Human adaptations to high altitude occur at a variety of
spatial and temporal scales (Hochachka and Monge, 2000;
Hochachka and Somero, 2002; Lahiri et al., 2002). Upon
transfer from low to high altitude, the physiological
responses to hypoxia that occur at various sub-cellular,
cellular, and whole-organism levels (e.g. Sarkar et al., 2003)
all potentially contribute to overall phenotypic flexibility
sensu Piersma and Drent (2003). Such mechanisms include
direct stimulation of oxygen sensors in the carotid bodies
(Lahiri, 2000), that increase ventilation over short and
longer time scales (acute versus chronic HVR) and is often
followed by a gradual decline to higher than baseline levels
(ventilatory acclimatization; see Powell et al., 1998). An
important recent advance in human biology has been the
recognition of tissue-level hypoxia sensing, and hence of the
multi-dimensional nature of hypoxic responses incorporat-
ing both central and peripheral sensors (Lahiri, 2000;
Cherniack, 2004).
Such responses may also include haematological
changes, such as a reduction in the hypoxic pulmonary
vasoconstrictor response that is mediated by pulmonary
vasculature oxygen sensors (Archer et al., 2000; Semenza
et al., 1991); increased erythropoietin secretion stimulating
red blood cell production (Samaja, 1997); increased
expression of vascular endothelial growth factor 1, angio-
genesis, and subsequent expansion of blood volume
(Winslow and Monge, 1997). Conversely, hypoxia may
elicit decreased body water content (Westerterp et al., 1996)
and consequently a reduction in blood volume and
increased blood viscosity. Changes in ventilation also
influence blood pH (Reeves et al., 1993; Sato et al.,
1996; but see Clement et al., 1995), possibly a major
source of variation between individuals (Sahn et al., 1977).
Increased use of oxygen-sparing glucose rather than fatty
acids as metabolic fuel in heart muscle has been advanced
as a long-term adaptation to altitude (Hochachka et al.,
1996; Hochachka and Somero, 2002).
Inter-population comparisons have identified four phe-
notypic traits that are potentially responsive to lifelong
exposure to hypoxia, showing different trends in different
high-altitude populations. Haemoglobin concentration is
higher than that of sea level residents in some Andean
groups, but not among Tibetans or Ethiopians (Beall et al.,
1998; Beall et al., 2002). Resting minute ventilation is
higher among Tibetans than among the Aymara (Beall et al.,
1997a), as is the HVR (Beall, 2000). Finally, arterial oxygen
saturation (SaO2) appears higher among Andean natives
than among Tibetans below 4000 m, but this trend is
reversed above 4300 m (Beall et al., 1997b; Beall, 2000).
Both Tibetan and Andean residents show lower SaO2
distributions than do Ethiopians measured at 3530 m,
whose values correspond to sea level SaO2 values for US
residents (Beall et al., 2002). Our knowledge of ventilatory
adaptations has arisen from a substantial literature on high-
altitude residents in three primary regions (Moore, 2000):
the Himalaya (Sherpas and Himalayans), the Andes
(Amerindians), and European descendents living in the
North American Rockies. Although East Africans are
recognised as one of the three main HA populations in the
world (Hochachka et al., 1999; Beall et al., 2002;
Hochachka and Somero, 2002), ventilatory adaptations to
hypoxia among all Africans have been poorly studied
(Niermayer et al., 2001; but see Cristosomo et al., 1998).
A recent study (Beall et al., 2002) was the first to examine
haematology in Ethiopians resident at the highest inhabited
altitudes on this continent.
Which of these four phenotypic traits is demonstrably
subject to natural selection? Among humans, family and
twin studies show that the HVR is strongly influenced by
genetic factors (e.g. Scoggin et al., 1978; Kawakami et al.,
1981; Nishimura et al., 1991; Akiyama et al., 1991;
Thomas et al., 1993; Kobayashi et al., 1993; Weil, 2003;
Powell, 2003), although identification of candidate genes
and their environmental interactions is difficult (Weil,
2003). It has been suggested that the HVR is phylogeneti-
cally constrained (Hochachka and Somero, 2002), and it is
significantly heritable in Tibetan and Aymara populations
(Beall et al., 1997a). Among mouse and rat strains,
variation in minute ventilation’s two components (tidal
volume and breathing frequency) in normoxia, hypoxia and
hypercapnia suggests different genetic bases of ventilation
control (Han and Strohl, 2000; Fagan and Weil, 2001;
Tankersley, 2003). It may, therefore, be argued that the
HVR is significantly heritable.
Assessing the remaining prerequisites for natural selec-
tion, namely linking the HVR to evolutionary fitness, and
demonstrating consistent between-individual variation in the
HVR is difficult, particularly for the former pre-requisite,
and both have not been well examined in humans. Two
other phenotypic traits potentially link hypoxia adaptation
with fitness: intrauterine growth restriction (Moore et al.,
2001; Moore, 2003), and the prevalence of Chronic
Mountain Sickness in high altitude residents (Monge et
al., 2001). However, there may be long-standing difficulties
associated with resolving the link to fitness in human
populations, and study design for inter-population compar-
isons of physiological adaptation to hypoxic environments
is generally complex (see Brutsaert, 2001). High within-

J.S. Terblanche et al. / Comparative Biochemistry and Physiology, Part A 140 (2005) 349–362 351
individual variability in the HVR (Sahn et al., 1977; Sato et
al., 1996; Zhang and Robbins, 2000; Terblanche et al.,
2004) may outweigh consistent between-individual varia-
tion, thereby excluding the possibility that natural selection
is responsible for the origin and maintenance of inter-
population variation in the HVR. Therefore, determining
repeatability of the HVR is a worthwhile goal since it is
relatively simple and may provide valuable insight into the
adaptive potential of this trait.
1.2. Aims
By measuring the acute isocapnic hypoxic ventilatory
(HVR) and cardiovascular responses, we aimed to deter-
mine non-invasively whether two sedentary South African
populations, both residing at similar low altitudes and living
under similar environmental conditions, differ in their
ventilatory and cardiovascular hypoxic sensitivity. These
two low-altitude populations will allow us to establish
baseline values for subsequent comparisons with high-
altitude groups in East Africa. Second, we aimed to estimate
repeatability of the HVR in these two populations, thereby
testing the prerequisite of consistent between-individual
variation in a trait, for adaptations resulting from natural
selection. Third, we provide an assessment of the phyloge-
netic dependence of the HVR, investigating whether inter-
population differences in this trait are purely correlated with
genetic distance. For this component of our study, we
extracted data on genetic distances and HVR from the
literature for three populations: Han Chinese (Zhuang et al.,
1993), Tibetans (Zhuang et al., 1993; Beall et al., 1997a),
and Andeans (Beall et al., 1997a) and compared these with
literature values on genetic distance with the HVR measured
for Europeans and Xhosa Africans.
2. Methods
2.1. Subjects
As part of a larger family study, 63 individuals from 20
South African families (10 Caucasian, and 10 Xhosa)
participated voluntarily in the study. All test procedures
were fully explained to each person, verbally and in written
form, before he or she signed a consent form. Under-age
subjects signed a consent form in the presence of their
parent. Ethical approval for all procedures was granted by
the Sub-Committee C of the Research Committee of the
University of Stellenbosch, which conforms to the interna-
tionally accepted ethical guidelines detailed in the Declara-
tion of Helsinki.
2.2. Family Criteria
Families invited to participate in the study had a
minimum of two children and one parent. The oldest parent
was younger than 70 years and the youngest of the children
was 15 years old. All individuals had low activity lifestyles,
had never participated in national or international sports,
and lived at sea level in the same town (~50 m asl). For
Xhosa-speaking families, the family for at least two
previous generations was of only Xhosa origin. No families
were included if they were not both Xhosa-speaking and
self-declared to be of Xhosa origin. Both autosomal and Y-
chromosome DNA studies reveal that in general, but
especially in the Xhosa-speaking people, South African
Bantu-speaking groups cluster according to their linguistic
groupings (Lane et al., 2002), thereby supporting our use of
language as an indicator of genetic distinctness between
populations. Matching of subjects’ height and mass was not
possible between populations due to differences in popula-
tion anthropometry and morphology (see e.g. van de Wal et
al., 1970; Johnston et al., 1987) particularly in the case of
females, and instead, statistical approaches which account
for such differences were incorporated specifically to handle
this aspect of the study (see statistical analyses below).
2.3. Questionnaires
Each subject completed a questionnaire (assisted by a
translator when necessary). No subjects were classified as
having an altitude history (having been born at an altitude of
greater than 3000 m), although some Caucasian subjects
(n=3) had prior exposure to acute hypoxia (as may be seen
in mountaineers or pilots). All subjects were born at
altitudes less than 1500 m and had lived at sea level in
Stellenbosch for more than 11 years. The previous
occurrence of respiratory (e.g. asthma) or haematological/
cardiovascular (such as anaemia) disorders was noted, and
whether these were treated or untreated. Smokers and non-
smokers were recorded. The phase of the menstrual cycle
(follicular or luteal) was noted for female subjects, as was
the absence of menstruation in subjects who were post-
menopausal, breastfeeding or using injectable contracep-
tives (e.g. Depo-proveraR Pharmacia and Upjohn, Kalama-
zoo, MI, USA).
2.4. Protocol
During exposure to hypoxia, isocapnic eucapnia was
maintained during hyperventilation using the non-rebreath-
ing method described in Fahlman et al. (2002) and
Terblanche et al. (2004). All experimental recordings were
performed by a single investigator in order to reduce
variation as a result of observational differences between
investigators.
Before the study, the subjects each completed one or two
preliminary experiments involving normoxic and hypoxic
exposures identical to those in the actual experiments, for
familiarisation with the breathing circuit and the study
protocol. Data from preliminary experiments were used
only to calculate coefficients of variation, not in any other

J.S. Terblanche et al. / Comparative Biochemistry and Physiology, Part A 140 (2005) 349–362352
analyses. Experiments were conducted on each subject three
to five times, including familiarisation tests, and were
separated by at least 60 min. Subjects were asked to refrain
from drinking alcohol and caffeine-containing beverages
from the evening before the experiments, as these factors are
known to affect ventilatory chemosensitivity (D’Urzo et al.,
1990). During each test the HVR (L min�1 %�1) was
measured using a previously-described protocol (Fahlman et
al., 2002), but with a single hypoxic exposure per test (see
Terblanche et al., 2004).
Expired volume (VE, L min�1, STPD), tidal volume, (VT,
L, STPD), and fR (breaths min�1) was sampled by a
metabolic system (MetaMaxk, Cortex Biophysik, Leipzig,
Germany) and average values recorded every 10 s. The end-
tidal CO2 partial pressure (PETCO2 at body temperature,
pressure and saturation, BTPS) was sampled by a capno-
graph (Microstreamk, Microcap, Oridion Medical, Jerusa-
lem, Israel) and average values recorded every 5 s. All
values were converted to BTPS prior to analyses and are
presented as such.
For the first 5 min subjects breathed air (21% O2, balance
N2). The resting VE and PETCO2 were averaged during the
last 2 min of this period. If these two variables were not
stable, the initial period was extended until values stabilized.
Inspired gas was then switched instantaneously to 8.2% O2
(F0.3%, n=3 bottles) for 120 s, then back to air (21F0.2%
O2, n=7 bottles) for another 120 s while the subject was
monitored to ensure full recovery of all ventilatory and
cardiovascular parameters to resting levels. The use of only
one hypoxic exposure per test eliminated the possibility of
acute HVD (Powell et al., 1998). Total experimental time
was at least 9 min, with each test comprising an initial
resting phase (N1) of 5 min or more (of which only the last 2
min were used for analyses), 2 min of hypoxia (H), and 2
min of normoxia (N2). Tests were at least 60 min apart. Each
subject’s PETCO2 was maintained at normocapnic levels
(F1 mmHg), established during the last 2 min of N1.
2.5. Arterial O2 saturation (SaO2) and heart rate ( fH)
SaO2 (%) and fH (beats min�1) were measured using a
pulse oximeter (Nellcor N-395 Pulse Oximeter, Mallinkrodt,
St Louis, MO, USA) with a forehead sensor (Nellcor RS10,
Mallinkrodt, St Louis, MO, USA). The area of application
of the sensor was massaged with a mild capsaicin ointment
(0.25/100 g, Sloan Heat Rub, Warner-Lambert, South
Africa), approximately 2 min before attachment, to promote
surface blood flow. Analogue signals from the oximeter
were relayed to the metabolic system, which recorded SaO2
and fH every 10 s.
2.6. Data processing
Resting values of VE, SaO2, VT, fR and fH for each
subject were calculated as means for the final 120 s of N1
(data points, n=22F1), except in the case of PETCO2 where
the last 60 s were used (data points, n=20F1). For all
variables during the hypoxic exposure, a 30 s period was
used (H; data points, n=7F2).
2.7. Calculations
All variables representative of normoxia and hypoxia
were averaged during the last 120 s of N1 and 30 s of H,
respectively. Averages of two test values (excluding the
familiarisation tests) were used, unless the coefficient of
variation (CV) of the calculated HVR values between the
two experiments was greater than 26% (see Sahn et al.,
1977; Zhang and Robbins, 2000), in which case a third
experiment was performed and the median of the three
test values used to calculate population means for all
variables. All estimates of HVR were performed by a
single investigator in order to reduce observer-induced
variation which may affect the calculation of repeatability
(Krebs, 1999).
HVR and HHR were estimated as the change in VE or fH,
respectively, per 1% change in SaO2 from normoxia to
hypoxia (HVR: DVE DSaO2�1, L min�1 %�1; HHR: D fH
DSaO2�1, heart beats min�1 %�1).
The repeatability (R) that we estimate is not the
coefficient of repeatability defined by Bland and Altman
(1986), but rather a measure used in quantitative genetics,
calculated as R=(s2 between individuals)/(s2 between
individuals+s2 within individuals) where s2=variance (Fal-
coner and Mackay, 1996; Krebs, 1999). R ranges between 1
and 0, and when close to 1 suggests that experimental
measurements are precise and that most variation is
partitioned between individuals. Because R represents
inter-individual variation, traits with a high R are those
most likely to respond to natural selection (Dohm, 2002),
and their identification is therefore useful to evolutionary
physiologists interested in adaptation to environmental
conditions. Providing that repeated measures of a trait have
equal variances, and that the repeated measures of a
parameter assess exactly the same underlying genetic trait
itself, R provides an estimate of the maximum possible
heritability of a trait (Dohm, 2002). Dohm (2002) provides
an excellent summary of the assumptions between herit-
ability and repeatability, and discusses various cases in
which repeatability may not set the upper limit to
heritability. In brief, these are when a) measured traits are
not genetically identical, b) common environmental effects
work in opposition to direct genetic effects, c) the temporary
environments for each trait are negatively correlated, d)
significant genotype-environment interaction is present, or
e) the traits are influenced by maternal effects. Thus, R
offers comparative and evolutionary physiologists a con-
ceptually simple way to identify traits that are likely to have
a strong genetic basis. A low R suggests either experimental
error, or a strong influence of environment on the trait in
question, and/or low heritability for that trait (Falconer and
Mackay, 1996; Krebs, 1999). Confidence limits (Krebs,

J.S. Terblanche et al. / Comparative Biochemistry and Physiology, Part A 140 (2005) 349–362 353
1999) of mean repeatability estimates were calculated for all
parameters.
2.8. Statistical analysis
All data are reported as meansF1 standard deviation
(SD), unless otherwise specified. Categorical data from
questionnaires were compared between the two populations
using chi-square and two-tailed Student’s t-tests, or Mann–
Whitney U-tests if data proved to be non-normal (Zar,
1996). Likewise, initial paired comparisons between N1 and
H using two-tailed Student’s t-tests or Mann–Whitney U-
tests explored the effects of isocapnic hypoxia on respiratory
variables in all subjects. For each subject, averages (n=2) or
medians of data (n=3) were used to assess differences
between and within the groups (Winer et al., 1991). Each
subject is therefore represented by one value (n=30 for X,
and n=33 for C). Misrepresentation of a subject’s HVR
caused by one extreme value is thus minimized. For
calculation of R, data from all tests were used.
Stepwise multiple regressions isolated suitable covariates
for analyses of covariance (ANCOVA), and general linear
model (GLM) analyses and ANCOVA were then used to
take into account the effects of body size or gender on
ventilatory and other variables. We used NCSS 2000
(Kaysville, UT) for all analyses, with significance set at
Pb0.05 unless otherwise stated.
2.9. Inter-population comparison: global HVR analysis
Inter-population comparisons of physiological factors
may be confounded by phylogenetic relationships (Harvey
and Pagel, 1993). As a pre-requisite to such analyses, it is
instructive to examine whether HVR variation is signifi-
cantly related to genetic distance among populations. We
did so using a distance matrix correlation between genetic
distance and HVR bdistanceQ. The test we used has been
used to assess the correspondence between metric distances
in medicine, ecology, anthropology, and population genet-
ics (e.g. Jackson and Somers, 1989; Manly, 1986; Waddle,
1994). Here, we use it to test whether or not there is a
significant association between published HVR values and
Nei’s genetic distance, among five regional populations
(Xhosa, European, Tibetan, Aymara, and Han Chinese).
Pairwise genetic distances for these five populations were
taken from estimates of a study of world-wide genetic
relationships of 42 human populations using classical
genetic markers and averaged over 128 allozyme loci
(Cavalli-Sforza et al., 1994, Table 2.3.1B). This source
treats Amerindians as a single, monophyletic group.
Indeed, genetic differences between populations within
this group, such as the Quechua and Aymara, are minor
(Gene et al., 2000) relative to global differences among
continental (Asians, Africans, Europeans) population
groups (Zhivotovsky et al., 2003). HVR values for
Andeans were measured in the Aymara (Beall et al.,
1997a). Pairwise HVR bdistancesQ were estimated by
taking the differences in HVR between each pair of
populations. Where multiple HVR values were available,
this pairwise difference was calculated from a single
median value for each population (e.g. in the case of
Tibetan HVR data provided by both Beall et al., 1997a,b
and Zhuang et al., 1993). We did not use studies that did
not supply the information required to convert the dAparameterT units into HVR values comparable with our
own (L min�1 %�1). A permutation procedure (10,000
randomisations—for rationale see Jackson and Somers,
1989) was conducted for the two distance matrices (Mantel
for Windows, M.J. Cavalcanti, 2000, http://life.bio.sunysb.
edu/morph/). Departure from the null model would
demonstrate a correspondence between genetic and HVR
distances. A non-significant relationship would suggest that
there is not necessarily an association between HVR
distance and genetic distance for these regional popula-
tions. In the latter case, HVR should be independent of
phylogeny. Although differences in HVR protocol may
influence comparisons between studies, there are at present
insufficient population studies at global scales from which
to select those which only use similar methods to obtain
HVR estimates. For this preliminary analysis which we
hope will soon be augmented by addition of more
populations, we have therefore chosen to disregard
methodological differences between studies in favour of
using representative samples for each population.
3. Results
3.1. Subject characteristics, anthropometry and gender
There were significantly more smokers among Cauca-
sians than among Xhosas (61% and 13%, respectively, v2
test, Pb0.05). Across the entire data set, both populations
had similar levels of respiratory disorders (9% and 13% in
Caucasians and Xhosas, respectively). For analyses of the
two subsets of females and males (see next paragraph), we
excluded individuals with respiratory disorders, and females
on contraceptives. Anthropomorphic variables differed
among populations, not unexpectedly (van de Wal et al.,
1970; Johnston et al., 1987). Males were taller than females,
and for both genders, Caucasians were taller than Xhosas
(Table 1). Among male subjects, Caucasians were signifi-
cantly heavier than Xhosas, but among females, Caucasians’
BMIs were significantly lower than those of Xhosas
(Table 1).
Since height differed between the two groups, and
height, mass and BMI differed between genders within the
two groups, these factors were tested for their influence
(covariance) on all variables using correlations and compar-
isons of statistical significance. Across the entire data set,
there were no significant interactions (GLM/ANCOVA)
between gender, height, mass, BMI, or population, and

Table 1
Characteristics of Xhosa (X) and Caucasian (C) subjects
Group Age (years) Height (m) Mass (kg) BMI (kg m�2)
C (all) (n=33) 32.9F15.4 1.79F0.09 73.5F10.9 23.0F2.44
X (all) (n=30) 27.4F12.3 1.59F0.07** 71.5F16.8 28.6F8.30yC (h) (n=23) 30.5F15.2 1.83F0.06 64.8F4.90 22.7F1.83
X (h) (n=5) 22.0F5.66 1.69F0.03** 60.5F8.51 21.3F3.51
C (U) (n=10) 38.5F15.4 1.69F0.02 77.3F10.6 23.1F2.70
X (U) (n=25) 28.4F13.1 1.57F0.01** 73.7F17.3 30.1F8.23ySignificant differences for each variable between Xhosa and Caucasian between subjects: **unpaired, two-tailed Student’s t-test ( Pb0.01); or yMann–Whitney
U-test ( Pb0.05).
J.S. Terblanche et al. / Comparative Biochemistry and Physiology, Part A 140 (2005) 349–362354
mean HVR. For analyses of the entire data set, we used
mass- and/or height-independent analyses which specifi-
cally account for anthropometric differences within and
among populations.
There were no significant correlations (both least squares
and robust regression) between HVR values for parents, and
mean HVR from the two sibling offspring of each parent.
Environmental influences thus contributed substantially
more to the variance in the HVR than did genetic factors.
In all analyses reported below, family members were treated
as separate individuals.
3.2. Inter-population variation of the hypoxic ventilatory
response
Across all subjects, VT, fR, VE, and SaO2 differed
significantly between normoxic (N1, N2) and hypoxic (H)
intervals, but PETCO2 did not (meansFS.E.: 34.1F0.51,
33.9F0.40 and 34.5F0.44 mmHg, respectively; F2;413=
0.43; PN0.65). An acute isocapnic hypoxic ventilatory
response was thus achieved for all subjects. Minute
ventilation (VE) in both normoxia (N1) and hypoxia (H)
was normally distributed within both populations, and its
variance did not differ between populations (Kolmogorov–
Smirnov and F-tests, respectively, PN0.1). The same is true
for normoxic PETCO2 and VO2 (Table 2, PN0.3). There-
fore, we considered both populations to be in a similar state
of anxiety.
In order to balance comparisons between our two study
populations as stringently as possible in terms of subject
anthropometry, gender, and menstrual cycle phase, we
performed separate comparisons of the HVR and its
ventilatory components on a subset of data comprising five
Caucasian and six Xhosa female subjects from each family,
one individual per family, matched as closely as possible for
Table 2
Absolute means (F1 S.D.) for hypoxic ventilatory (HVR) and heart rate (HHR)
PCO2 (PETCO2) in all Xhosa (X) and Caucasian (C) subjects
Group HVRa (L min�1 %�1) HHRa (beats min
C (n=33) 0.42F0.33 0.627F0.380
X (n=30) 0.34F0.36 0.918F0.462
P N0.35 b0.01
a One-way ANOVA (HVR: F1; 61=0.872; HHR: F1; 61=7.57).b Unpaired two-tailed Student’s t-test.
body size and all in the follicular phase of the menstrual
cycle (Table 3). We hereby hoped to remove the confound-
ing effects of age, menstrual cycle phase, and lack of
independence between individuals from the same family.
We performed a similar analysis on a subset of five males
from each population group, whom we were able to match
better for BMI and for age (Table 4).
These analyses show that among both males and
females (Tables 3 and 4), there is a significant positive
relationship (least-squares regression) between VT and VE,
and height and mass. However, in most cases more
variance in each of these dependent variables is explained
by body mass index (BMI) than by height or mass
separately. For example, BMI explains a significant
majority of the variance in normoxic VT and VE in both
male and female groups, and among females, BMI is the
largest and significant determinant of variation in the HVR.
Therefore, we considered analyses of covariance with BMI
as covariate appropriate to remove the effect of subject
body-size differences on the HVR and ventilatory varia-
bles. Breathing frequency ( fR) was independent of (and not
linearly related to) both BMI and gender. In both hypoxia
and normoxia, VE and the HVR were similar among Xhosa
and Caucasian females, but the components of the HVR
differed: fR was higher and VT lower among Xhosa females
than among Caucasians in both normoxia and hypoxia
(Table 3). We were able to match Caucasian and Xhosa
male subjects for both age and BMI (Table 4). Although
there were not always differences during normoxia, Xhosa
males showed higher fR and lower VT values during
hypoxia than did Caucasians.
Similar trends were observed for our whole data set of 63
subjects (see Table 1 for subject characteristics), which
trades a larger sample size for control of age, menstrual
cycle phase and body mass index effects on ventilation and
responses, normoxic oxygen consumption (VO2), and normoxic end-tidal
�1 %�1) VO2b(L min�1) PETCO2
b (mmHg)
0.37F0.007 32.0F3.6
0.36F0.007 31.5F4.2
N0.5 N0.5

Table 3
Subject characteristics, HVR (hypoxic ventilatory response) and its ventilatory components (VE=minute ventilation; fR=breathing frequency; VT=tidal volume)
compared between a subset of young Caucasian and Xhosa females, one per family, all in the follicular phase of the menstrual cycle and matched as closely as
was possible within our data set for body mass index (BMI)
Caucasian Xhosa SS DF MS F P
HVR (L min�1 %�1)a �0.472F0.094 �0.350F0.086 0.040 1 0.0401 0.904 N0.37
Error 0.399 8 0.0443
Age (years)b 26.0F3.5 20.1F3.3 133.05 1 133.05 2.025 N0.19
BMI (kg m�2)b 21.9F1.5 26.1F1.3 48.313 9 48.313 4.520 0.062
Hypoxia
VE (L min�1)a 14.0F1.3 15.1F1.3 2.842 1 2.8424 0.301 N0.60
VT (L)a 0.99F0.09 0.60F0.08 0.242 1 0.2416 5.987 b0.05
Error 0.363 8 0.0404
fR (breaths min�1)b 12.0F1.8 21.0F1.7 303.90 1 303.90 24.27 b0.005
Normoxia
VE (L min�1)a 6.4F0.6 8.0F0.5 1.695 1 1.6947 0.975 N0.32
VT (L)a 0.57F0.05 0.39F0.04 0.056 1 0.0562 12.55 b0.01
Error 0.089 8 0.0111
fR (breaths min�1)b 12.0F1.3 20.4F1.2 195.40 1 195.40 22.78 b0.01
N 5 6
For each variable, comparisons between the two population groups are based on general linear models (or analyses of covariance, ANCOVA) with BMI as the
covariate. All data are presented as meansFS.E.M.a ANCOVA with BMI as covariate.b ANOVA.
J.S. Terblanche et al. / Comparative Biochemistry and Physiology, Part A 140 (2005) 349–362 355
ventilatory sensitivity. For this comparison, mean HVR did
not differ between Xhosas and Caucasians (F1; 61=0.872;
PN0.35; Table 2). An a posteriori power analysis was
performed to estimate the sample sizes that would be
required to determine a significant difference in HVR
between populations with a low probability of committing
a Type II error. Using the population HVR means and
associated variances that we obtained (Table 2) to calculate
the effect size (0.42 vs. 0.34 L min�1 %�1, effect size
d=0.2285 a=0.05, and b=0.7) we found that a sample size
Table 4
Subject characteristics, HVR (hypoxic ventilatory response) and its ventilatory com
compared between a subset of young Caucasian and Xhosa males, one per famil
Caucasian Xhosa
HVR (L min�1 %�1)a �0.423F0.124 �0.143F0.124
Error
Age (years)b 21.4F2.1 22.0F2.2
BMI (kg m�2)b 22.1F1.8 23.8F1.8
Hypoxia
VE (L min�1)a 14.4F1.7 12.3F1.7
VT (L)a 1.21F0.07 0.64F0.07
Error
fR (breaths min�1)b 11.9F2.5 20.2F2.5
Normoxia
VE (L min�1)a 9.38F0.92 9.83F0.92
VT (L)a 0.67F0.07 0.52F0.07
Error
fR (breaths min�1)b 14.0F2.8 18.9F2.8
N 5 5
Subjects were closely matched for body mass index (BMI) between Caucasian ana ANCOVA with BMI as covariate.b ANOVA.
of greater than 460 subjects would be necessary to detect
any significant difference in HVR between Xhosas and
Caucasians.
For the larger data set, regression analysis indicated that
the BMI accounted for more variability in the HVR than did
age, body mass or height successively (unpublished data,
and see above). Subsequent general linear model analyses
using BMI and gender as covariates also found no differ-
ence between the two populations (F1;59=1.04, PN0.34).
The HVR did not differ between Xhosa and Caucasian
ponents (VE=minute ventilation; fR=breathing frequency; VT=tidal volume)
y
SS DF MS F P
0.192 1 0.192 2.514 N0.16
0.533 7 0.076
0.900 1 0.900 0.040 N0.85
6.860 1 6.860 0.435 N0.53
11.25 1 11.25 0.802 N0.40
0.794 1 0.794 30.465 b0.001
0.182 7 0.026
172.09 1 172.09 5.554 b0.05
0.017 1 0.0173 0.003 N0.95
0.052 1 0.0515 1.967 N0.20
0.183 7 0.026
58.544 1 58.544 1.495 N0.26
d Xhosa groups. All data are presented as meansFS.E.M.

Table 5
Analysis of variance for the HVR in Caucasian and Xhosa subjects
Source of variation DF Sums of
squares
Mean
squares
F-ratio P
Among populations 1 0.407 0.407 3.23 N0.05
Within populations
Xhosa 29 7.7414 0.2670 4.5233 b0.05
Caucasian 32 6.9820 0.2182 15.0711 b0.05
F-ratio=mean square among individuals/mean square within individuals;
DF=degrees of freedom.
J.S. Terblanche et al. / Comparative Biochemistry and Physiology, Part A 140 (2005) 349–362356
males and females, nor did it differ among females tested in
different phases of their menstrual cycle.
Repeatability of HVR and HHR (the intra-class correla-
tions coefficient [or s], Falconer and Mackay, 1996) did not
differ significantly between populations (Fig. 1). For all
individuals from both populations, the HVR and its primary
components (SaO2 and VE) are significantly repeatable
(R=0.862, 0.633 and 0.731, respectively, Pb0.05 in all
cases; see Table 5). Separate calculation of R within each
population and gender showed the same to be true of HVR
for male Caucasians and for females in both populations
(Table 6). For Xhosa males, repeatability was not signifi-
cant, i.e. inter-individual variation was not significantly
greater than intra-individual variation.
The Mantel test revealed no significant difference from
the null model, suggesting a lack of correspondence
between genetic distance and HVR distance for the five
populations investigated (r=�0.143; P=0.59, Table 7). This
indicates that among the human populations for which HVR
values are available, there is no consistent relationship
between genetic distance and the median population HVR
(Fig. 2).
Baseline normoxic (N1) SaO2 did not differ between
populations, but hypoxic SaO2 was significantly lower
among Xhosas (X: 78.4F4.7%; C: 81.7F4.7%; Pb0.05).
During N2, the SaO2 of both populations returned to levels
similar to baseline N1 (X: 99F2%; C: 98F4%, PN0.21).
3.3. Hypoxic heart rate response is higher among Xhosas
than among Caucasians
For a comparison using our entire data set, heart rate ( fH,
beats min�1) was significantly higher among Xhosas during
both N1 (C: 73.1F10.2 beats min�1; X: 78.2F11.1 beats
min�1; one-way ANOVA, F1; 61=5.838; Pb0.05) and H (C:
83.6F11.5 beats min�1; X: 94.0F11.3 beats min�1; one-
way ANOVA, F1; 61=25.328; Pb0.01). No anthropometric
C X
Rep
eata
bilit
y
0.0
0.2
0.4
0.6
0.8
1.0HHRHVR
Fig. 1. Repeatability (FSE) of the HVR and HHR for Caucasian (C) and
Xhosa (X) populations. Standard error of repeatability calculated according
to Becker (1984).
variables proved to be significant covariates for this
parameter. Hypoxic heart rate response (HHR, beats
min�1 %�1) did not differ between genders (meansFSEM,
females: �0.802F0.075, males: �0.720F0.084, one-way
ANOVA, F1; 61=0.53, PN0.47), but was significantly lower
among Xhosas (Table 2, Pb0.01).
4. Discussion
4.1. Inter-population comparison of the HVR in low-altitude
southern Africans
The similarity in baseline normoxic VO2 in our two
study populations indicates similarity in resting metabolic
rate. Normality of data distribution, equal variances and
similar normoxic VE and PETCO2 were confirmed in
subjects from both populations. Therefore, these popula-
tions probably have similar stimuli for ventilatory drive
under sea level conditions. The HVR is influenced by higher
brain inputs such as psychological factors (Shea, 1996).
Conversations and behaviour before, during and after the
tests indicated that subjects in both populations appeared
comfortable with the test environment. Subjects were
sampled randomly from within their communities and
neither group contained any individuals who had partici-
pated previously in tests of hypercapnic or hypoxic
ventilatory sensitivity. For the purposes of this study, we
conclude that these two samples represented their respective
populations adequately.
The two populations in this study presented similar levels
of hypoxic sensitivity (HVR) even when specific body size-
independent comparisons were performed, whether genders
were separated or pooled. Our data provide us with a useful
baseline for assessing hypoxic sensitivity in other African
populations. Studies suggesting that high altitude (HA)
natives exhibit blunted hypoxic sensitivity (e.g. Hackett et
al., 1980; see also review by Weil, 2003) have not been
consistently supported by more recent work (Vargas et al.,
1998; Moore, 2000). Beall et al. (1997a) detected an
absolute difference in HVR of ~0.41 L min�1 %�1, between
two HA populations, one Himalayan and one Andean. Our
populations, with ~0.08 L min�1 %�1 absolute difference in
HVR, do not differ. Indeed, our HVR values appear similar

Table 6
Repeatability of the HVR calculated separately for male and female Caucasians and Xhosas
Population Gender Source DF SS MS F-ratio Repeatability
Caucasian Females Among 9 1.2610 0.1401 40.32 0.985T
Within 19 0.0382 0.0035
Males Among 22 5.3417 0.2428 12.57 0.890T
Within 49 0.4830 0.0193
Xhosa Females Among 24 7.2356 0.3015 4.34 0.624T
Within 60 2.4998 0.0694
Males Among 4 0.0477 0.0119 0.69 0.000a
Within 14 0.1559 0.0173
a Negative value rounded to zero.
T Pb0.05.
J.S. Terblanche et al. / Comparative Biochemistry and Physiology, Part A 140 (2005) 349–362 357
to other studies, such as in a low-altitude Han Chinese
population (Zhuang et al., 1993; see also Moore, 2000).
The absence of previously published information on the
HVR in any African population suggests that more work on
this continent is required to test the generality of the
hypothesis that long-term HA residents develop blunted
HVR (Hochachka and Monge, 2000). The only published
data on ventilatory sensitivity in Africans, of which we are
aware, show an age-related decline in hypercapnic sensi-
tivity among Nigerians (Elegbeleye and Femi-Pearse, 1980).
Age was not significantly related to HVR in our analyses.
Nevertheless, addition of HVR data from currently untested
populations (e.g. residents of Pakistan, India or Australian
Aborigines) to the global database (e.g. Moore, 2000),
whether such populations are of high or low altitude origin,
could provide valuable insight into baseline HVR and the
nature of adaptive change therein.
4.2. Phylogenetic independence of the HVR confirms
possibility of its adaptive potential
Estimation of inter-population variation in the HVR is
complicated by a number of factors. For example, devel-
opmental effects and environmental interactions with
hypoxic sensitivity may induce subtle differences in HVR
in humans (Sbrensen and Severinghaus, 1968) and other
mammals (reviewed in Mitchell et al., 2001, and see Bavis
et al., 2004). Intermittent hypoxia may be a more potent
stimulus for adaptation than is continuous hypoxia (Prabha-
Table 7
Matrices representing Nei’s genetic distance (upper right-hand half of matrix), (Tab
half of matrix) among five populations investigated to date
Population Xhosa (Bantu) European
Xhosaa 0.0462
Europeana �0.08
Tibetanb �0.36 �0.28
Aymara/Quechuab �0.07 0.02
Han Chinesec �0.06 0.02
Where multiple data for a single population were available, a median value wasa Our study.b Beall et al., 1997a.c Zhuang et al., 1993.
kar, 2001). In population comparisons seeking to explore
the adaptive significance of hypoxic sensitivity that use
subjects in their natural environment, accounting fully for
such factors remains a significant challenge (Brutsaert,
2001; Hochachka and Somero, 2002; Powell, 2003).
The Mantel correlation matrix showed that HVR differ-
ences between Aymara, Tibetans, Han Chinese, Europeans
and Xhosas cannot be attributed to genetic distance. This
result, in conjunction with repeatability, heritability and a
potential link to fitness (see Introduction), suggests that
inter-population variation in the HVR may well be the result
of local environmental adaptation, and is likely not merely a
consequence of phylogenetic association. Reassuringly, our
analysis indicates that statistical assumptions of previously
published studies that regard population means as inde-
pendent data points are vindicated (e.g. Beall et al., 1997a;
Moore, 2000; Beall, 2000; Powell, 2003). We caution that
our analyses do not replace phylogenetically independent
contrasts such as those using the PDAP and PDTREE
analytical packages (Garland et al., 1993). The addition of
more populations to the comparative HVR database may
alter our perspective of the relationship between phylogeny
and HVR. A re-examination of the phylogenetic independ-
ence of HVR upon the addition of new data should shed
additional light on this relationship. The inclusion of
additional populations and new genetic markers (other than
classical allozyme loci—see Cavalli-Sforza et al., 1994) will
increase our confidence in the independence of these
variables. Regardless, it is unlikely that this relationship
le 2.3.1B, Cavalli-Sforza et al., 1994) and HVR difference (bottom left-hand
Tibetan Aymara/Quechua Han Chinese
0.0324 0.0573 0.0433
0.0142 0.0266 0.0196
0.0148 0.0093
�0.29 0.0193
0.3 0.01
calculated from all usable data (e.g. Tibetans).

X-E
X-T
X-S
X-C
E-T
E-S
E-C
T-S
T-C
S-C
-0.4 -0.3 -0.2 -0.1 0.0 0.1 0.2 0.3 0.4
HVR difference
0.00
0.01
0.02
0.03
0.04
0.05
0.06
Gen
etic
dis
tanc
e
Fig. 2. Pair-wise plot demonstrating that genetic distance (raw data from
Cavalli-Sforza et al., 1994) is not directly related to the magnitude of HVR
difference between five main populations. X: Xhosa (Bantu, our study); C:
Chinese (Zhuang et al., 1993); S: South Amerindians (Aymara; Beall et al.,
1997a); T: Tibetans (Zhuang et al., 1993; Beall et al., 1997a); E: Europeans
(Caucasians, our study). Closed circle: this study.
J.S. Terblanche et al. / Comparative Biochemistry and Physiology, Part A 140 (2005) 349–362358
will be altered greatly since the Mantel test is robust to small
sample sizes providing sufficient permutations (N1000) have
been utilised (Jackson and Somers, 1989). Finally, use of
HVR measures obtained by standardized methods may
clarify the nature of this relationship further, but further
interpretations may be premature since different data sets
have been obtained using different methods in the past.
4.3. Phenotypic adaptation, variability and repeatability
Because inter-individual variability underlies differential
survival and reproductive success, it can be considered as
the raw material upon which natural selection acts.
Repeatable differences between individuals are of great
interest to evolutionary biologists, because traits showing
high repeatability (inter-individual variance expressed as a
fraction of summed intra- and inter-individual variance,
(Falconer and Mackay, 1996; Krebs, 1999)) are likely to
show high heritability (Falconer and Mackay, 1996; Dohm,
2002). Quantification of both intra- and inter-individual
variation is thus critical to our understanding of physio-
logical diversity and evolutionary adaptation (Bennett,
1987; Falconer and Mackay, 1996; Spicer and Gaston,
1999; McNab, 2003).
Physiological variability can be assessed using repeat-
ability calculations and variance partitioning (Falconer and
Mackay, 1996; Krebs, 1999). Repeatability differs consid-
erably, depending on the nature of the character in question,
the genetic properties of the population, and the extent of
the influence of the local environmental conditions experi-
enced by that population’s individuals. Estimation of the
variability of the HVR can provide important information
for understanding the extent to which the experimental
technique provides precise estimates of this parameter (see,
e.g. Rebuck and Campbell, 1974; Beall et al., 1997a).
High intra-individual variability does not preclude the
application of the HVR as a research tool, but without
understanding the degree of variation at the respective
hierarchical levels, deductions that can be made from the
acquired data are severely limited, and perhaps even false.
High variability in HVR within populations (Beall et al.,
1997a; Hochachka et al., 1998; Hochachka and Monge,
2000; Hochachka et al., 1999) does not prevent comparison
of HVR between populations, but rather necessitates care
about the number of repeated measures used (see also Vizek
et al., 1987; Khoo, 2001; Spengler and Shea, 2001;
Terblanche et al., 2004). Such numbers should be based
on good understanding of the relationship of the intra- and
inter-individual variation of the HVR at both the individual
and population levels.
Although repeatability (sensu Falconer and Mackay,
1996) has been assessed for physiological traits such as
metabolic rate in mammals (e.g. McNab, 2003) and insects
(e.g. Marais and Chown, 2003), and life history, behavioural
and morphological traits in birds and insects (e.g. Mbller,2001; Van Dongen, 1998), this tool has not yet been used to
explore the nature of the variation in hypoxic ventilatory
chemosensitivity within and between human populations.
Inter-individual variation in the HVR is known to be high
(Sahn et al., 1977; Zhang and Robbins, 2000), and although
this parameter can be considered a genotypic adaptation to
the selective pressures of hypoxic environments (e.g. Beall
et al., 1997a; Hochachka et al., 1999), its heritability should
also be demonstrated (e.g. Strohl et al., 1997; Weil et al.,
1998; Weil, 2003). Our finding that the HVR, HHR and
their respective components are repeatable supports the
utility of these traits as measures of human adaptation to
high altitude and adds a strong evolutionary framework
within which to study inter-population hypoxic ventilatory
adaptation. In cases where repeated measures of the trait
have equal variances, and the repeated measures assess the
exact same underlying genetic trait itself, repeatability can
provide an estimate of the maximum possible heritability of
the trait itself providing that certain critical assumptions
have not been violated (see discussion in Dohm, 2002 for
further details; and see Methods).
4.4. HVR components and breathing patterns
The HVR shows significant heritability in humans and
can differ between high-altitude populations (34% vs. 22%
in Tibetans vs. Andeans (Beall et al., 1997a)). Family and
twin studies have shown a strong genetic influence on
hypoxic sensitivity (reviewed in Weil, 2003; and see
Introduction). Our study contributes two potentially impor-
tant findings with regard to differences in breathing patterns
obtained between the Xhosa and Caucasian populations.
First, hypoxic compensatory mechanisms of ventilation are
indeed plastic in humans, both within (see e.g. Gozal et al.,
1995) and between populations. Second, there is surprising
dichotomy for variation in breathing patterns between our

J.S. Terblanche et al. / Comparative Biochemistry and Physiology, Part A 140 (2005) 349–362 359
study’s two human populations, similar to that of inbred
mouse and rat strains (Strohl et al., 1997; Tankersley et al.,
1997; Tankersley, 2000; 2003; see also Powell, 2003; Weil,
2003). Phenotypic variation in hypoxic fR is probably
controlled by two major genes in mice (Tankersley, 2000),
but the complexity of genetic control of the HVR among
bwild-typeQ mouse (and human) phenotypes is likely far
greater than that among inbred laboratory mouse strains, and
the human genome is more heterogeneous than that of this
experimental model (Tankersley, 2003). Nevertheless,
investigation of the underlying genetic differences between
the Xhosa and Caucasian populations may be of interest in
clarifying the nature of the correspondence in breathing
patterns observed between rodent models and the human
populations in our study.
The two populations in our study display different
hypoxic SaO2, a parameter that is significantly influenced
by genotype (Beall et al., 1997b; Brutsaert et al., 2000). The
significantly lower SaO2 values that we report for Xhosa
subjects, in conjunction with their smaller hypoxic VT,
suggest that the two patterns of respiration we describe here
differ in effective oxygenation of the blood during hypoxia.
It is unlikely that the measured SaO2 differences reflected
interference of skin pigmentation with the pulse oximeter
(Bothma et al., 1996). The increased HHR that we report
among Xhosas suggests that reduction in hypoxic SaO2,
hence total carrying capacity of the blood for oxygen, may
be compensated for by increased cardiac output. Further-
more, in an analysis which removed the effect of ventilatory
dead-space volume, we found that there is no difference
between Xhosa and Caucasian alveolar ventilation in either
normoxia or hypoxia (J.S. Terblanche and S. Jackson,
unpublished data). Despite differences in body-size, there-
fore, effective minute ventilation in these two populations
appears similar.
4.5. Potential complicating factors
Our analyses permitted us to compare two populations
independently of gender ratios and body size (Aitken et al.,
1986). The effect of ovarian hormones on the HVR within
women is difficult to demonstrate, with some studies
showing no difference within individuals between the
follicular and luteal phases of the cycle (reviewed by Muza
et al., 2001, see also Tarbichi et al., 2003), and equal
numbers showing increased HVR in the midluteal phase,
probably because elevated plasma concentrations of
ovarian hormones during this phase increase sensitivity
of both central and peripheral chemoreceptors (Muza et al.,
2001). Our separate analyses of sub-sets of age-matched
female subjects all in the follicular phase, and male
subjects from each population confirmed the results of
the larger comparison, showing that although the HVR is
similar between the two populations we studied, Xhosas
breathe more frequently but have lower VT in both
normoxia and hypoxia.
Endurance athletes have diminished HVR relative to that
of mountaineers or sedentary controls (Schoene, 1982;
Masuyama et al., 1986). Whilst all our subjects had non-
athletic lifestyles, inter-population differences in habitual
exercise levels resulting from socio-economic differences
between the two populations may have affected our results.
Although Caucasian subjects participated in recreational
exercise more frequently than did Xhosas, the latter
performed more lifestyle-related physical exertion (e.g.
walking to work) than did Caucasians, thus compensating
partially for this difference.
Body size influences lung size, hence ventilation and
presumably anatomical dead-space. The absence of a
negative correlation between height and SaO2 in our data
suggests that larger subjects were not experiencing a greater
hypoxic dose as a result of potentially greater tidal volumes,
hence more effective alveolar ventilation. However, VT and
SaO2 were inversely related in our subjects. Our finding that
VT was smaller among Xhosas than among Caucasians is
supported by studies showing smaller forced expiratory
volume in one second (FEV1) and forced vital capacity
(FVC) in African or African-American children relative to
age-matched European-American or European children
(Johnston et al., 1987; Joseph et al., 2000). Similarly, adult
South African Africans showed lower FEV1 than did their
compatriot Caucasians (van de Wal et al., 1970). Among
Ethiopians, FEV1 and FVC are significantly lower among
people living at 1500 m than among those living at 3000 m
and higher (Harrison et al., 1969; and see Wood et al.,
2003). Moreover, Wood et al. (2003) found relatively greater
pulmonary function (FEV1/FVC) in high altitude Indian and
Tibetan groups compared with sojourner controls.
Understanding hypoxic sensitivity in Africans is impor-
tant to our understanding of the hypoxia response systems
that shaped the physiology of humans, and to understanding
different strategies of adaptation to hypoxia among high-
altitude populations (Beall et al., 2002; Hochachka and
Somero, 2002). A comparison of the HVR between East
Africans from the same high-altitude population living at
high and low altitude would enhance our understanding of
the effects of genes and environment on the HVR (Brutsaert,
2001). Investigation of possible mechanisms compensating
for lower VT and hypoxic SaO2 among Xhosas, such as
nitric oxide-linked differences in oxygen extraction effi-
ciency (Beall et al., 2001), would provide a basis for
comparison with closely related high altitude populations in
East Africa.
5. Conclusion
This is the first study of hypoxic chemosensitivity in
African populations and we demonstrate that the HVR does
not differ between Xhosas and Caucasians. However, its
components (tidal volume, breathing frequency and hypoxic
SaO2) differed, even after body size effects have been

J.S. Terblanche et al. / Comparative Biochemistry and Physiology, Part A 140 (2005) 349–362360
controlled for. This suggests two distinct breathing patterns:
a) shallower, more rapid breathing among Xhosas, and b)
deeper, slower breathing among Caucasians. These differ-
ences were apparent in normoxia and likely resulted in the
lower arterial oxygen saturation during hypoxia among the
Xhosa subjects. Their less effective oxygenation of the
blood was possibly compensated for by the higher HHR
demonstrated among these subjects. The high and signifi-
cant repeatability for the HVR and HHR in both populations
demonstrates that one of the prerequisites for natural
selection, and hence adaptation, is met. Indeed, the
phylogenetic independence of HVR values suggested by
our inter-population analyses, in conjunction with consistent
between-individual variation (repeatability), heritability and
potential links to fitness, add strong statistical support to the
theory that the magnitude of the HVR likely reflects an
adaptation to local hypoxic environmental conditions, and is
not merely the result of genetic divergence between differ-
ent high altitude populations.
Acknowledgements
We are sincerely grateful to our subjects for their
participation in this study. We thank Bill Louw for his
patience during discussions of quantitative genetics. Steven
Chown, Jaco Klok, Brent Sinclair and Elrike Marais
provided valuable discussion and comments. Saskia Gold-
berg and various anonymous reviewers provided useful
comments on an earlier version of this manuscript. The staff
of National Hyperbarics assisted with gas mixing and
provided air cylinders. This research was supported by the
National Research Foundation of South Africa (Project No:
NRF 1031).
References
Aitken, M.L., Franklin, J.L., Pierson, D.J., Schoene, R.B., 1986. Influence
of body size and gender on control of ventilation. J. Appl. Physiol. 60,
1894–1899.
Archer, S.L., Weir, E.K., Reeve, H.L., Michelakis, E., 2000. Molecular
identification of O2 sensors and O2-sensitive potassium channels in the
pulmonary circulation. Adv. Exp. Med. Biol. 475, 219–240.
Akiyama, Y., Nishimura, M., Suzuki, A., Yamamoto, M., Kawakami, Y.,
1991. Peripheral chemosensitivity assessed by the modified transient O2
test in female twins. Chest 100, 102–105.
Bavis, R.W., Olson Jr., E.B., Vidruk, E.H., Fuller, D.D., Mitchell, G.S.,
2004. Developmental plasticity of the hypoxic ventilatory response in
rats induced by neonatal hypoxia. J. Physiol. 557, 645–660.
Beall, C.M., 2000. Tibetan and Andean patterns of adaptation to high-
altitude hypoxia. Hum. Biol. 72, 201–228.
Beall, C.M., Strohl, K.P., Blangero, J., Williams-Blangero, S., Almasy,
L.A., Decker, M.J., Worthman, C.M., Goldstein, M.C., Vargas, E.,
Villena, M., Soria, R., Alarcon, A.M., Gonzales, C., 1997a. Ventilation
and hypoxic ventilatory response of Tibetan and Aymara high altitude
natives. Am. J. Phys. Anthropol. 104, 427–447.
Beall, C.M., Strohl, K.P., Blangero, J., Williams-Blangero, S., Decker, M.J.,
Brittenham, G.M., Goldstein, M.C., 1997b. Quantitative genetic
analysis of arterial oxygen saturation in Tibetan highlanders. Hum.
Biol. 69, 597–604.
Beall, C.M., Brittenham, G.M., Strohl, K.P., Blangero, J., Williams-
Blangero, S., Goldstein, M.C., Decker, M.J., Vargas, E., Villena, M.,
Soria, R., Alarcon, A.M., Gonzales, C., 1998. Hemoglobin concen-
tration of high-altitude Tibetans and Bolivian Aymara. Am. J. Phys.
Anthropol. 106, 385–400.
Beall, C.M., Laskowski, D., Strohl, K.P., Soria, R., Villena, M., Vargas, E.,
Alarcon, A.M., Gonzales, C., Erzurum, S.C., 2001. Pulmonary nitric
oxide in mountain dwellers. Nature 414, 411–412.
Beall, C.M., Decker, M.J., Brittenham, G.M., Kushner, I., Gebremedhin, A.,
Strohl, K.P., 2002. An Ethiopian pattern of human adaptation to high-
altitude hypoxia. Proc. Natl. Acad. Sci. U. S. A. 99, 17215–17218.
Becker, W.A., 1984. Manual of Quantitative Genetics, 4th edn. Academic
Enterprises, Washington.
Bennett, A.F., 1987. Interindividual variability: an underutilized resource.
In: Feder, M.E., Bennett, A.F., Burggren, W., Huey, R.B. (Eds.), New
Directions in Ecological Physiology. Cambridge University Press,
Cambridge, pp. 147–169.
Bennett, A.F., 2003. Experimental evolution and the Krogh principle:
generating biological novelty for functional and genetic analyses.
Physiol. Biochem. Zool. 76, 1–11.
Bland, J.M., Altman, D.G., 1986. Statistical methods of agreement between
two methods of clinical measurement. The Lancet 1, 307–310.
Bothma, P.A., Joynt, G.M., Lipman, J., Hon, H., Mathala, B., Scribante, J.,
Kromberg, J., 1996. Accuracy of pulse oximetry in pigmented patients.
S. Afr. Med. J. 86, 594–596.
Brutsaert, T.D., 2001. Genetic and environmental adaptation in high altitude
natives. Conceptual, methodological, and statistical concerns. Adv. Exp.
Med. Biol. 502, 133–151.
Brutsaert, T.D., Araoz, M., Soria, R., Spielvogel, H., Haas, J.D.,
2000. Higher arterial oxygen saturation during submaximal exercise
in Bolivian Aymara compared to European sojourners and Euro-
peans born and raised at high altitude. Am. J. Phys. Anthropol. 113,
169–181.
Cavalli-Sforza, L.L., Menozzi, P., Piazza, A., 1994. The History and
Geography of Human Genes (full version). Princeton University Press,
New Jersey.
Clement, I.D., Pandit, J.J., Bascom, D.A., Dorrington, K.L., O’Connor,
D.F., Robbins, P.A., 1995. An assessment of central-peripheral
ventilatory chemoreflex interaction using acid and bicarbonate infusions
in humans. J. Physiol. 485, 561–570.
Cherniack, N.S., 2004. Oxygen sensing: applications in humans. J. Appl.
Physiol. 96, 352–358.
Cristosomo, I., Zayyad, A., Carley, D.W., Abubaker, J., Onal, E., Stepanski,
E.J., Lopata, M., Basner, R.C., 1998. Chemo- and baroresponses differ
in African-Americans and Caucasians in sleep. J. Appl. Physiol. 85,
1413–1420.
Curran, L.S., Zhuang, J., Sun, S.F., Moore, L.G., 1997. Ventilation and
hypoxic ventilatory responsiveness in Chinese-Tibetan residents at
3,658 m. J. Appl. Physiol. 83, 2098–2104.
Dohm, M.R., 2002. Repeatability estimates do not always set an upper limit
to heritability. Funct. Ecol. 16, 273–280.
D’Urzo, A.D., Jhirad, R., Jenne, H., Avendano, M.A., Rubenstein, I.,
D’Costa, M., Goldstein, M.A., 1990. Effect of caffeine on ventilatory
responses to hypercapnia, hypoxia, and exercise in humans. J. Appl.
Physiol. 68, 322–328.
Elegbeleye, O.O., Femi-Pearse, D., 1980. Relation between age and
respiratory response to inhaled carbon dioxide in healthy Nigerians.
Isr. J. Med. Sci. 16, 389–391.
Endler, J.A., 1986. Natural Selection in the Wild. Princeton University
Press, New Jersey.
Fagan, K.A., Weil, J.V., 2001. Potential genetic contributions to control of
the pulmonary circulation and ventilation at high altitude. High Alt.
Med. Biol. 2, 165–171.
Fahlman, A., Fisher, J.A., Vesely, A., Sasano, H., Terblanche, J., Jackson,
S., Myburg, K., 2002. A simple breathing circuit to maintain isocapnia

J.S. Terblanche et al. / Comparative Biochemistry and Physiology, Part A 140 (2005) 349–362 361
during measurements of the hypoxic ventilatory response. Respir.
Physiol. Neurobiol. 133, 259–270.
Falconer, D.S., Mackay, T.F., 1996. Introduction to Quantitative Genetics,
4th edn. Longman Harlow, London.
Garland Jr., T., 2001. Phylogenetic comparison and artificial selection. Adv.
Exp. Med. Biol. 502, 107–132.
Garland, T.J., Dickerman, A.W., Janis, C.M., Jones, J.A., 1993. Phyloge-
netic analysis of covariance by computer simulation. Syst. Biol. 42,
265–292.
Gene, M., Moreno, P., Borrego, N., Pique, E., Xifro, A., Fuentes, M., Bert,
F., Corella, A., Perez-Perez, A., Turbon, D., Corbella, J., Huguet, E.,
2000. Population study of Aymara Amerindians for the PCR-DNA
polymorphisms HUMTH01, HUMVWA31A, D3S1358, D8S1179,
D18S51, D19S253, YNZ22 and HLA-DQ alpha. Int. J. Leg. Med.
113, 126–128.
Gozal, D., Ben-Ari, J.H., Harper, R.M., Keens, T.G., 1995. Ventilatory
responses to repeated short hypercapnic challenges. J. Appl. Physiol.
78, 1374–1381.
Hackett, P.H., Reeves, J.T., Reeves, C.D., Grover, R.F., Rennie, D., 1980.
Control of breathing in Sherpas at low and high altitude. J. Appl.
Physiol. 49, 374–379.
Han, F., Strohl, K.P., 2000. Inheritance of ventilatory behaviour in rodent
models. Respir. Physiol. 121, 247–256.
Harrison, G.A., Kucheman, C.F., Moore, M.A.S., Boyce, A.J., 1969. The
effects of altitudinal variation in Ethiopian populations. Philos. Trans.
R. Soc. Lond. 256, 147–182.
Harvey, P.H., Pagel, M.D., 1993. The Comparative Method in Evolutionary
Biology. Oxford University Press, Oxford.
Hochachka, P.W., Monge, C., 2000. Evolution of human hypoxia tolerance
physiology. Adv. Exp. Med. Biol. 475, 25–43.
Hochachka, P.W., Somero, G., 2002. Biochemical Adaptations: Mechanism
and Process in Physiological Evolution. Oxford University Press,
Oxford.
Hochachka, P.W., Clark, C.M., Holden, J.E., Stanley, C., Ugurbil, K.,
Menon, R.S., 1996. P-31 magnetic resonance spectroscopy of the
Sherpa heart: a phosphocreatine adenosine triphosphate signature of
metabolic defense against hypobaric hypoxia. Proc. Natl. Acad. Sci.
U. S. A. 93, 1215–1220.
Hochachka, P.W., Gunga, H.C., Kirsch, K., 1998. Our ancestral
physiological phenotype: an adaptation for hypoxia tolerance and
for endurance performance? Proc. Natl. Acad. Sci. U. S. A. 95,
1915–1920.
Hochachka, P.W., Rupert, J.L., Monge, C., 1999. Adaptation and
conservation of physiological systems in the evolution of human
hypoxia tolerance. Comp. Biochem. Physiol., A 124, 1–17.
Jackson, D.A., Somers, K.M., 1989. Are probabilities estimates from the
permutation model of Mantel’s test stable? Can. J. Zool. 67, 766–769.
Johnston, I.D., Bland, J.M., Anderson, H.R., 1987. Ethnic variation in
respiratory morbidity and lung function in childhood. Thorax. 42,
542–548.
Joseph, C.L.M., Ownby, D.R., Peterson, E.L., Johnson, C.C., 2000. Racial
differences in physiological parameters related to asthma among
middle-class children. Chest 117, 1336–1344.
Kawakami, Y., Irie, T., Kishi, F., Asanuma, Y., Shida, A., Yoshikawa,
T., Kamishima, K., Hasegawa, H., Murao, M., 1981. Familial
aggregation of abnormal ventilatory control and pulmonary
function in chronic obstructive pulmonary disease. Eur. J. Respir.
Dis. 62, 56–64.
Khoo, M.C.K., 2001. Respiratory instability and variability: why is
respiration such a mess? In: Poon, C.S., Kazemi, H. (Eds.), Frontiers
in Modeling and Control of Breathing. Kluwer/Plenum, New-York.
Adv. Exp. Med. Biol. 499, 495–500.
Kobayashi, S., Nishimura, M., Yamamoto, M., Akiyama, Y., Kishi, F.,
Kawakami, Y., 1993. Dyspnea sensation and chemical control of
breathing in adult twins. Am. Rev. Respir. Dis. 147, 1192–1198.
Krebs, C.J., 1999. Ecological Methodology, 2nd ed. Benjamin/Cummings,
Menlo Park.
Lahiri, S., 2000. Historical perspectives of cellular oxygen sensing and
responses to hypoxia. J. Appl. Physiol. 88, 1467–1473.
Lahiri, S., Kao, F.F., Velasquez, T., Martinez, C., Pezzia, W., 1970.
Respiration of man during exercise at high altitude: highlander vs.
lowlander. Respir. Physiol. 8, 361–375.
Lahiri, S., Di Giulo, C., Roy, A., 2002. Lessons from chronic intermittent
and sustained hypoxia at high altitudes. Respir. Physiol. Neurobiol. 130,
223–233.
Lane, A.B., Soodyall, H., Arndt, S., Ratshikhopha, M.E., Jonker, E.,
Freeman, C., Young, L., Morar, B., Toffie, L., 2002. Genetic
substructure in South African Bantu-Speakers: evidence from autoso-
mal DNA and Y-chromosome studies. Am. J. Phys. Anthropol. 119,
175–185.
Manly, B.F.J., 1986. Randomization and regression methods for testing for
associations with geographical, environmental and biological distances
between populations. Res. Popul. Ecol. 28, 201–281.
Marais, E., Chown, S.L., 2003. Repeatability of standard metabolic rate and
gas exchange characteristics in a highly variable cockroach Perisphae-
ria sp. J. Exp. Biol. 206, 4565–4574.
Masuyama, S., Kimura, H., Sugita, T., Kuriyama, T., Tatsumi, K.,
Kunitomo, F., Okita, S., Tojima, H., Yuguchi, Y., Watanabe, S., Honda,
Y., 1986. Control of ventilation in extreme altitude climbers. J. Appl.
Physiol. 61, 500–506.
McNab, B.K., 2003. Sample sizes and the estimation of physiological
parameters in the field. Funct. Ecol. 17, 82–86.
Mitchell, G.S., Baker, T.L., Nanda, S.A., Fuller, D.D., Zabka, A.G.,
Hodgeman, B.A., Bavis, R.W., Mack, K.J., Olson Jr., E.B., 2001.
Intermittent hypoxia and respiratory plasticity. J. Appl. Physiol. 90,
2466–2475.
Mbller, A.P., 2001. Heritability of arrival date in a migratory bird. Proc. R.
Soc. Lond., B 268, 203–206.
Monge, C.M., Leon-Velarde, F., Arregui, A., 2001. Chronic mountain
sickness in Andeans. In: Schoene, T.H.R. (Ed.), High Altitude: An
Exploration of Human Adaptation. Marcel Dekker Inc., New York,
pp. 815–838.
Moore, L.G., 2000. Comparative human ventilatory adaptation to high
altitude. Respir. Physiol. 121, 257–276.
Moore, L.G., 2003. Fetal growth restriction and maternal oxygen transport
during high altitude pregnancy. High Alt. Med. Biol. 4, 141–156.
Moore, L.G., Zamudio, S., Zhuang, J., Sun, S., Droma, T., 2001. Oxygen
transport in Tibetan women during pregnancy at 3,658 M. Am. J. Phys.
Anthropol. 114, 42–53.
Muza, S.R., Rock, P.B., Fulco, C.S., Zamudio, S., Braun, B., Cymerman,
A., Butterfield, G.E., Moore, L.G., 2001. Women at altitude: ventilatory
acclimatization at 4,300 m. J. Appl. Physiol. 91, 1791–1799.
Niermayer, S., Zamudio, S., Moore, L.G., 2001. The people. In: Schoene,
T.H.R. (Ed.), High Altitude: An Exploration of Human Adaptation.
Marcel Dekker Inc., New York, pp. 43–100.
Nishimura, M., Yamamoto, M., Yoshioka, A., Akiyama, Y., Kishi, F.,
Kawakami, Y., 1991. Longitudinal analyses of respiratory chemo-
sensitivity in normal subjects. Am. Rev. Respir. Dis. 143, 1278–1281.
Piersma, T., Drent, J., 2003. Phenotypic flexibility and the evolution of
organismal design. Trends Ecol. Evol. 18, 228–233.
Powell, F.L., 2003. Functional genomics and the comparative physiology of
hypoxia. Ann. Rev. Physiol. 65, 203–230.
Powell, F.L., Milsom, W.K., Mitchell, G.S., 1998. Time domains of the
hypoxic ventilatory response. Respir. Physiol. 112, 123–134.
Prabhakar, N.R., 2001. Oxygen sensing during intermittent hypoxia:
cellular and molecular mechanisms. J. Appl. Physiol. 90, 1986–1994.
Rebuck, A.S., Campbell, E.J.M., 1974. A clinical method for assessing the
ventilatory response to hypoxia. Am. Rev. Respir. Dis. 109, 345–350.
Reeves, J.T., McCullough, R.E., Moore, L.G., Cymerman, A., Weil, J.V.,
1993. Sea-level PCO2 relates to ventilatory acclimitization. J. Appl.
Physiol. 75, 1117–1122.
Sahn, S.A., Zwillich, C.W., Dick, N., McCullough, R.E., Lakshminarayan,
S., Weil, J.V., 1977. Variability of ventilatory responses to hypoxia and
hypercapnia. J. Appl. Physiol. 43, 1019–1025.

J.S. Terblanche et al. / Comparative Biochemistry and Physiology, Part A 140 (2005) 349–362362
Samaja, M., 1997. Blood gas transport at high altitude. Respiration 64,
422–428.
Sarkar, S., Banerjee, P.K., Selvamurthy, W., 2003. High altitude hypoxia: an
intricate interplay of oxygen responsive macroevents and micro-
molecules. Mol. Cell. Biochem. 253, 287–305.
Sato, F., Nishimura, M., Igarashi, T., Yamamoto, M., Miyamoto, K.,
Kawakami, Y., 1996. Effects of exercise and CO2 inhalation on
intersubject variability in ventilatory and heart rate responses to
progressive hypoxia. Eur. Respir. J. 9, 960–967.
Scoggin, C.H., Doekel, R.D., Kryger, M.H., Zwillich, C.W., Weil, J.H.,
1978. Familial aspects of decreased hypoxic drive in endurance athletes.
J. Appl. Physiol. 44, 464–468.
Schoene, R.B., 1982. Control of ventilation in climbers to extreme altitude.
J. Appl. Physiol. 53, 886–890.
Semenza, G.L., Koury, S.T., Nejfelt, M.K., Gearhart, J.D., 1991. Cell-type-
specific and hypoxia-inducible expression of the human erythropoietin
gene in transgenic mice. Proc. Natl. Acad. Sci. U. S. A. 88, 8725–8729.
Shea, S.A., 1996. Behavioural and arousal-related influences on breathing
in humans. Exp. Physiol. 81, 1–26.
Sbrensen, S.C., Severinghaus, J.W., 1968. Irreversible respiratory insensi-
tivity to acute hypoxia in man born at high altitude. J. Appl. Physiol. 25,
217–220.
Soutiere, S.E., Tankersley, C.G., 2001. Challenges implicit to gene
discovery during research in the control of ventilation during hypoxia.
High Alt. Med. Biol. 2, 191–200.
Spengler, C.M., Shea, S.A., 2001. Explained and unexplained variability of
CO2-sensitivity in humans. In: Poon, C.S., Kazemi, H., (Eds.), Frontiers
in Modeling and Control of Breathing. Kluwer/Plenum, New-York.
Adv. Exp. Med. Biol. 499, 483–488.
Spicer, J.I., Gaston, K.J., 1999. Physiological Diversity and its Ecological
Implications. Blackwell, Oxford.
Strohl, K.P., Thomas, A.J., St Jean, P., Schlenker, E.H., Koletsky, R.J.,
Schork, N.J., 1997. Ventilation and metabolism among rat strains.
J. Appl. Physiol. 82, 317–323.
Tankersley, C.G., 2000. A genomic model for differential hypoxic
ventilatory responses. Adv. Exp. Med. Biol. 475, 75–85.
Tankersley, C.G., 2003. Genetic aspects of breathing: on interactions
between hypercapnia and hypoxia. Respir. Physiol. Neurobiol. 135,
167–178.
Tankersley, C.G., Fitzgerald, R.S., Levitt, R.C., Mitzner, W.A., Ewart, S.L.,
Kleeberger, S.R., 1997. Genetic control of differential baseline breath-
ing pattern. J. Appl. Physiol. 82, 874–881.
Tarbichi, A.G.S., Rowley, J.A., Shkoukani, M.A., Mahadevan, K., Badr,
M.S., 2003. Lack of gender difference in ventilatory chemoresponsive-
ness and post-hypoxic ventilatory decline. Respir. Physiol. Neurobiol.
137, 41–50.
Terblanche, J.S., Fahlman, A., Myburgh, K.H., Jackson, S., 2004. Measure-
ment reliability of highly variable physiological responses to exper-
imentally-manipulated gas fractions. Physiol. Meas. 25, 1189–1197.
Thomas, D.A., Swaminathan, S., Beardsmore, C.S., McArdle, E.K.,
MacFadyen, U.M., Goodenough, P.C., Carpenter, R., Simpson, H.,
1993. Comparison of peripheral chemoreceptor responses in
monozygotic and dizygotic twin infants. Am. Rev. Respir. Dis. 148,
1605–1609.
van de Wal, B.W., Erasmus, L.D., Hechter, R., 1970. Stem and standing
heights in Bantu and White South Africans: their significance in relation
to pulmonary function values. S. Afr. Med. J. 45, 568–570.
Van Dongen, S., 1998. How repeatable is the estimation of devel-
opmental stability by fluctuating asymmetry? Proc. R. Soc. Lond., B
265, 1423–1427.
Vargas, M., Leon-Velarde, F., Monge-C, C., Palacios, J.A., Robbins, P.A.,
1998. Similar hypoxic ventilatory responses in sea-level natives and
high-altitude Andean natives living at sea level. J. Appl. Physiol. 84,
1024–1029.
Vizek, M., Pickett, C.K., Weil, J.V., 1987. Interindividual variation in
hypoxic ventilatory response: potential role of carotid body. J. Appl.
Physiol. 63, 1884–1889.
Waddle, D.M., 1994. Matrix correlation tests support a single origin for
modern humans. Nature 368, 452–454.
Weil, J.V., 2003. Variation in human ventilatory control—genetic influence
of the hypoxic ventilatory response. Respir. Physiol. Neurobiol. 135,
239–246.
Weil, J.V., Stevens, T., Pickett, C.K., Tatsumi, K., Dickinson, M.G., Jacoby,
C.R., Rodman, D.M., 1998. Strain-associated differences in hypoxic
chemosensitivity of the carotid body in rats. Am. J. Physiol. 274,
L767–L774.
Westerterp, K.R., Robach, P., Wouters, L., Richalet, J.P., 1996. Water
balance and acute mountain sickness before and after arrival at high
altitude of 4,350 m. J. Appl. Physiol. 80, 1968–1972.
Winer, B.J., Brown, D.R., Michels, K.M., 1991. Statistical Principles in
Experimental Design. McGraw-Hill, New York, pp. 497–582.
Winslow, R.M., Monge, C.M., 1997. Hypoxia, Polycythemia, and Chronic
Mountain Sickness. Johns Hopkins University Press, Baltimore.
Wood, S., Norboo, T., Lilly, M., Yoneda, K., Eldridge, M., 2003.
Cardiopulmonary function in high altitude residents of Ladakh. High
Alt. Med. Biol. 4, 445–454.
Zar, J.H., 1996. Biostatistical Analysis. Prentice Hall, New Jersey.
Zhivotovsky, L.A., Rosenberg, N.A., Feldman, M.W., 2003. Features of
evolution and expansion of modern humans, inferred from genomewide
microsatellite markers. Am. J. Hum. Genet. 72, 1171–1186.
Zhang, S., Robbins, P.A., 2000. Methodological and physiological
variability within the ventilatory response to hypoxia in humans.
J. Appl. Physiol. 88, 1924–1932.
Zhuang, J., Droma, T., Sun, S., Janes, C., McCullough, R.E., McCullough,
R.G., Cymerman, A., Huang, S.Y., Reeves, J.T., Moore, L.G., 1993.
Hypoxic ventilatory responsiveness in Tibetan compared with Han
residents of 3658 m. J. Appl. Physiol. 74, 303–311.