Phase-controlled series-parallel resonant converter - CiteSeerX
Physica B 183 (1993) 1-24
North-Holland PHYSICA ii’
Resonant ultrasound spectroscopic techniques for measurement of the elastic moduli of solids
A. Migliori, J.L. Sarrao, William M. Visscher, T.M. Bell, Ming Lei, Z. Fisk’ and R.G. Leisure’ Los Alumos Nutionul Laboratory. Los Alumos, NM. USA
Received 20 0ctober 1992
The mechanical resonant response of a solid depends on its shape. density. elastic moduli and dissipation. We describe
here instrumentation and computational methods for acquiring and analyzing the resonant ultrasound spectrum of very
small (0.001 cm’) samples as a function of temperature, and provide examples to demonstrate the power of the technique.
The information acquired is in some cases comparable to that obtained from other more conventional ultrasonic
measurement techniques, but one unique feature of resonant ultrasound spectroscopy (RUS) is that all moduli are
determined simultaneously to very high accuracy. Thus in circumstances where high relative or absolute accuracy is
required for very small crystalline or other anisotropic samples RUS can provide unique information. RUS is also sensitive
to the fundamental symmetry of the object under test so that certain symmetry breaking effects are uniquely observable.
and because transducers require neither couplant nor a flat surface, broken fragments of a material can be quickly screened
for phase transitions and other temperature-dependent responses.
1. Introduction
Large single crystals are always highly prized, in part because of their appearance, but also because usually they are the result of consider- able effort on the part of the grower. Such effort is justified because the usual implementation of many measurement techniques, for various com- plex and often mundane reasons, requires sam- ples with dimensions in the centimeter range. Ultrasound measurements, traditionally of great
importance because of their connection to thermodynamics, transport properties and mi- crostructural effects, are typically subject to this size constraint. When only small samples are available, it is possible to perform pulse-echo
Correspondence to: A. Migliori, Los Alamos National Lab-
oratory, MSK 764 L,os Alamos, NM 87545, USA.
’ Also at Department of Physics and Institute for Pure and Applied Physical Sciences, University of California, San
Diego, La Jolla, CA 92093, USA.
’ Permanent address: Department of Physics, Colorado State
University, Fort Collins, CO 80.523. USA.
ultrasound measurements at GHz frequencies [l] or to use the vibrating reed and related methods [2], but the cost to the scientist is either instru- ment complexity or loss of information. There are, of course, other nonacoustic techniques for obtaining sound velocity and attenuation data such as Brillouin scattering [3], inelastic neutron scattering [4], X-ray based methods [5] and others. Each of these nonacoustic techniques has advantages and disadvantages. Among the dis- advantages common to all of them is the lack of high precision. Only the acoustic techniques can achieve lo-’ or better reproducibility. Because the speed of sound may vary only a percent or less at a phase transition [6] or a few percent from 300 K to 4 K, this lack of precision can be a serious failing. On the other hand, neutron scat- tering can provide the entire dispersion curve from Brillouin-zone center to edge, but with worse than percent accuracy, Brillouin scattering can obtain data at frequencies in the tens of GHz range with 1% accuracy on very small samples but suffers at cryogenic temperatures or with
0921.4526/93/$06.00 0 1993 - Elsevier Science Publishers B.V. All rights reserved
(It the acoustic tcchnique4. \uch mcth~cl~ 24
I hc \,ilJrating rccti and torsion pctidulunt 1‘211
tttca4urc onl\ sonic ot the elastic moduli. \\ hilt
pul\c-echo ultrasound and nio4t of the tiotixo~~~-
tic technique\ can mca~ut-c all of them. l’hi\ i\
not ;I p;trticLtlarl\~ inipc)rtatit constraint tot- t\o-
tropic materials such ;I\ gl;issc\. polycr)~stallinc
mctal4 atid cet-atiiic\. tiowelet-. for 4inglc c’tW\
tals. textured allo\ and the like. the \;iJuc 01
ultrasound nicasurctiietit4 is often criticall> clc-
pcnclent on tiicasurcnit2nt of all tiioduli with both
precision 2nd accuraq.
This rcquiremcnt fot- accuracy and prcci4ion I\ cucniplificd bv ultrasonic studies of the phv4ic\
sLtrrounding second-order phase transitiotix. :\t
4Ltch transitions. there arc’ no microscopic ciiscon-
tinLtitic4 in the tnatcrial. No atoms ~uclcienl~
change position. magncti\m and ferroelectricit>
do not ~Llcldctll~ al’lx”t-. and electrical co~idt~c-
ti\,it\ in ;I supercotidLtctor hecomcs itifinitc on1\
t’or intinitesimal currcnta carried at Lcro nid~netic
ticld. However. scvctxl thermodynamic second
dct-ivativcs do exhibit ciiscontinuities. For ;I liq-
uid. with only one elastic tnodulus. it is simple to
write down the important relations. using pt-c\-
4ut-c (I’). volume (C’) and tctnpcraturc (7 1 ltl- stead of stress CT,,. strain F,, and I’. ‘The\, i11.c
0 -1(;;i/I“ = h _!5 C’; iI I’ ~ I :I II (1)
ir‘A(;:i,T 7~ -~i,_l,s/;,I’-- C‘,,. I _ (‘1
i ii~;li,l’i,7‘- i,1Wit’l‘- CY . ( -3 )
\vhct-c A(; is the Gihh‘s free cncrgy difference
per unit volume acres\; the phase boundary and
is continuous. AV is the fractional volume ciis- continuity across the phase boundary. equal to zero. AS the entropy discontinuity. also zero. C‘,, ix the spccitic hcnt. CY is the volume thermal expansion coefticient and H the hulk modulus. Each of the quantities C‘,,, a and B can exhibit discontinuities at I‘,, the second-order phase
I)iscontinuitte\ arc 01 great importattcc to 111L. cxpcrimentnlist IWC;ILIW the\ arc cjftett the moot
LtnatiihigLtc~us of nic;isLtrcd quantities. \lot-cc~\cl in general C,, i\ ;I w~I;II. !i ;I \cctc,r iiitd. if \\I’
wcrc to write cq. ( I ) toi- \trcss and xtratri r;ithcr
t hali prcssLirc and \ oliitiic. \+lc‘ woulcl tincl I h:it the right \icic of eq. ( I ) wc~uld he ;I tensot I‘tl;ll
the modulus i\ ;I tcn\or and is tliscontinLtoLt~ AI i/
\ccond-order pha\c transition is ;I kcv ntott\ attrls
factor lor the dcvelopmcnt of K1JS. ‘1’0 \c’c \\ h;
cc)nsiclet- ;I Gtiiplc \oft-mcdc structural ph;l\c
transiticm s~tch ;IS occurs in lda.CuO, ‘Tht\ Iran
\ition. descrihetl in mot-c detail hclou. ;Lri\c\ tram it done-cdgc cioul~le-well [ 71 potential \’ 101
one phonon branch. As the material in it\ tctr:I
gonal phase i\ cooled. the thermal c*xcit;Lttc)ll
level drops through the point where the LloLthlc
well hecomes impvrtant. I‘he free encrg! (; c.x hihit ;I Gngle-well behavior from thermal WI~;II
ing at high tempcraturc ;lIld ;I doLlhlc-UCII t>c.
havior cold. At the tctnperaturc ‘I, \\hcrc the hehaviot- ~LI\I suitc~hes o\c’t-. the phonon’s trc-
quefic~ decreases to LC’I-0 resulting in /I \t;Lltc‘
tlisplaccmcnt. Thib static displacemcnl ittcrcahc\
trr,m KI-0 AS the material is cooled furthct.
doubling the unit cell to an c,rthorhomhic s(rLtc-
turc. What is ot mo\;t interest here i\ that the me-edge Gatic displacenicrtt. coL~plecl hvith
group theoretical considerations iticludin~
phonon and crystal \ytnmctry. C;insburg-L~LltdaLI
theory 1x1 and fluctuation theory [Y]. torcc\ \cI-~ specific predictions ahoLLt which tnoduli exhibit
discontinuities and how his. and the temperature
dependence of the moduli as T, is approached t’wm either direction. Such an analysis can 1~
made for any second-order phase transition. and. if the full response ot the tnodulus tenxot- i\ ;Lvailahle. one can worh backwards to t’stt-irc.1
much of the physics driving the transition. With- out ;I discontinuous tensor to work from. buch ~111
analysis would be more subject to interpretation- al errors.
KUS can determine the tull elastic tcti4or in ;I
\ingle nie;isLtrcmctit with Ltnprcccdentecl ahholLttc
A. Migliori et ul. I On techniques for measurement of‘ the elastic moduli of solids 3
and relative accuracy from cryogenic to very high temperatures. The basic principle behind this simple, inexpensive bench-top measurement
technique is that the mechanical resonances of a solid depend on its shape and moduli in a way
sufficiently complex such that a measurement of the resonant frequencies of a carefully made sample can be used to determine the full elastic
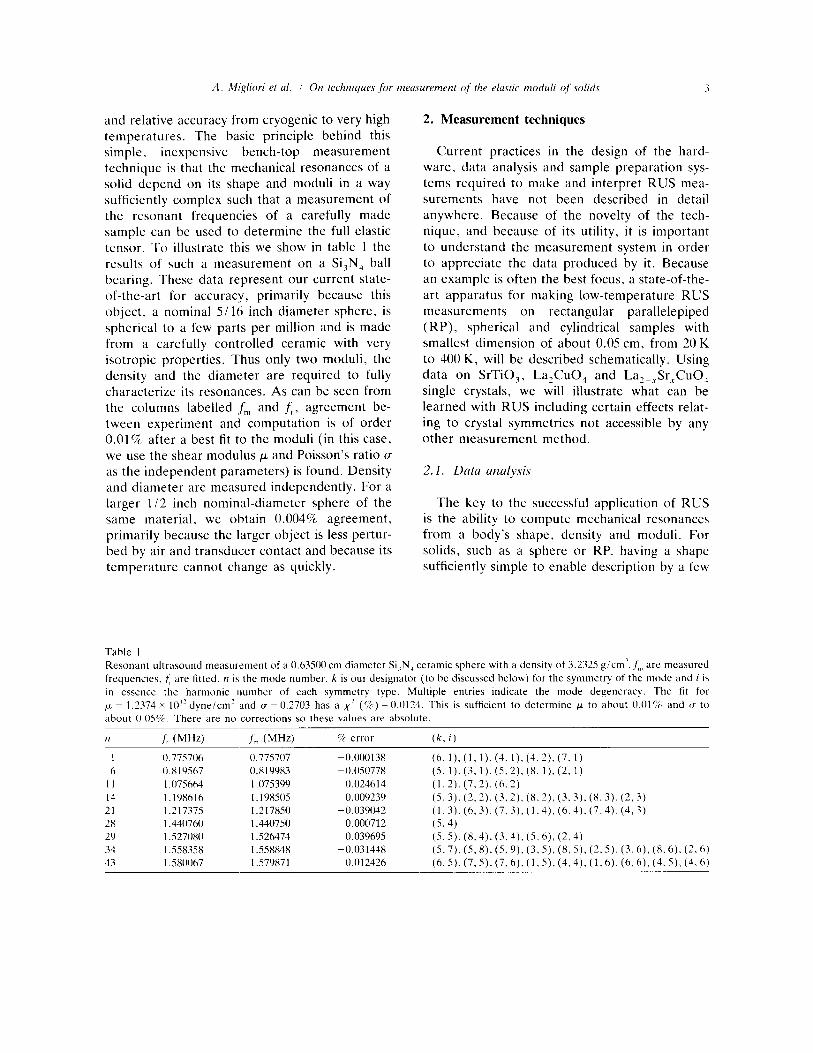
tensor. To illustrate this we show in table 1 the results of such a measurement on a Si,N, ball bearing. These data represent our current state- of-the-art for iaccuracy, primarily because this object. a nominal 5116 inch diameter sphere, is spherical to a few parts per million and is made
from a carefully controlled ceramic with very isotropic properties. Thus only two moduli, the density and the diameter are required to fully characterize its resonances. As can be seen from the columns labelled ,f,, and f,, agreement be- tween experiment and computation is of order 0.01% after a best fit to the moduli (in this case, we use the shear modulus p and Poisson’s ratio v as the independent parameters) is found. Density and diameter arc measured independently. For a larger 112 inch nominal-diameter sphere of the same material, we obtain 0.004% agreement, primarily because the larger object is less pertur- bed by air and transducer contact and because its temperature cannot change as quickly.
2. Measurement techniques
Current practices in the design of the hard- ware, data analysis and sample preparation sys- tems required to make and interpret RUS mea- surements have not been described in detail anywhere. Because of the novelty of the tech- nique, and because of its utility, it is important to understand the measurement system in order
to appreciate the data produced by it. Because an example is often the best focus. a state-of-the-
art apparatus for making low-temperature RUS measurements on rectangular parallelepiped (RP), spherical and cylindrical samples with smallest dimension of about 0.05 cm, from 20 K
to 400 K, will be described schematically. Using data on SrTiO,, La,CuO, and Laz_,Sr,rCuO, single crystals, we will illustrate what can be learned with RUS including certain effects relat- ing to crystal symmetries not accessible by any other measurement method.
2.1. Data analysis
The key to the successful application of RUS is the ability to compute mechanical resonances from a body’s shape, density and moduli. For solids, such as a sphere or RP, having a shape sufficiently simple to enable description by a few
Table I Resonant ultrasound measurement of a 0.63500 cm diameter Si,N, ceramic sphere with a density of 3.2325 g/cm‘. J;,, are measured
frequencies, f, are fitted, II is the mode number. k is our designator (to be discussed below) for the symmetry of the mode and i i\
in essence the harmonic number of each symmetry type. Multiple entries indicate the mode degeneracy. The tit for
p = 1.2374 x IO” dyne/cm’ and D = 0.2703 has a x2 (%) = 0.0124. This is sufficient to determine w to ahout 0.01% and u to
about 0.05%~. There are no corrections so these values are absolute.
12 fc (MHz)
I 0.775706 0.775707 ~0.00013H
6 0.819567 O.XlYYX3 -0.050778
II I .075664 I .075399 0.024614
I4 l.lY8616 I. 198505 0.00023’) 21 I .217375 1.217850 -0.039042
2x 1.440760 I .440750 0.000712
29 1.527080 1.526474 0.039695
34 I .55835X 1.558848 -0.031448
43 1.5X0067 I.579871 0.012426
f;,, (MHz) c/c error (k. i)
(6, l),(l, l).(a. 1),(3.2).(7. 1)
(5. I), (3.1). (5.2). (8. I). (2.1)
(I. 2). (7,2), (6.2)
(5.3). (2,2). (3.2). (8,2). (3.3). (X,3). (2.3)
(1.3). (633). (7.3), (1.4). (6.4). (7.4). (4.3) (5.4)
(5.5). (8.4). (3.4). (5. h), (2.3)
(5.7). (5.X). (5.9). (3,5), (8. S), (2,s). (3,6), (8.6), (2.6)
(6.5). (735). (736). (I. S), (4.4), (1.6). (6,6), (3. S), (4.6)
-7 ct aI. II-1 anti Ohno [Ii] is ud. I‘hi\ lm~~clu~-c
doe> not use finite-element methods hut Instead
wck4 stationary points of the I.agt-angian ic)r (I
v)licl with f‘rcc ~ur~xx5 11-11. and with ;I nond14
Gp;iti\x2 4vmnictric elastic tensor with no far-field
cftcct\ such as those ;r\\ociatccl \\ith tcrrornag-
tic14 or ~erroelectric4. F;ar-field \vstems 1151 ;ind
rhc dieipative problem [ 101 have hecn :tnal~/c~l
~ucces~t’ully. but will not lx diwuwxl hcrc. Oncc~
t hc mechanical resonance\ arc cornputd ( the clircct prohlcni). carct‘ullv constructed fitting pro-
ccclurcs can t3c used to bark txickwards to find
nioduli from resonant frcquencics (the in\crx
problcni).
The lmmxlurc for solving the direct pcd~leni
for a11 arhitrurily shaped elastic solid with LOI-
unit I’. elastic tumor c’!,,\~. densitb p. and with :I
tlcrc 11~ i\ the ith component ot the displaccnlcnt
wctol-. the usual 5umrnation con\.cntion applic\.
indices following ;I comma ¬e differentiation
with respect to that coordinate and the time
dependcncc ot the clisplaccmcnts is assurnecl to
bc c I”” whcrc w ib the angular frcquencv and t i\
time,
I-oIlowing tlaniilton. we allow II! to car-> arhit-
rarily in the coli~mc 1’ and on the surface S
(I[,--+ II; + fur<) dnd calculate the \2riation hf. it1
I.. I‘he result ik
t J
(left side of ccl. ( Y))iS~ri d,Y (7)
A. Mlgliori et al. i On techniques for measurement of the rlastic moduli of solids 5
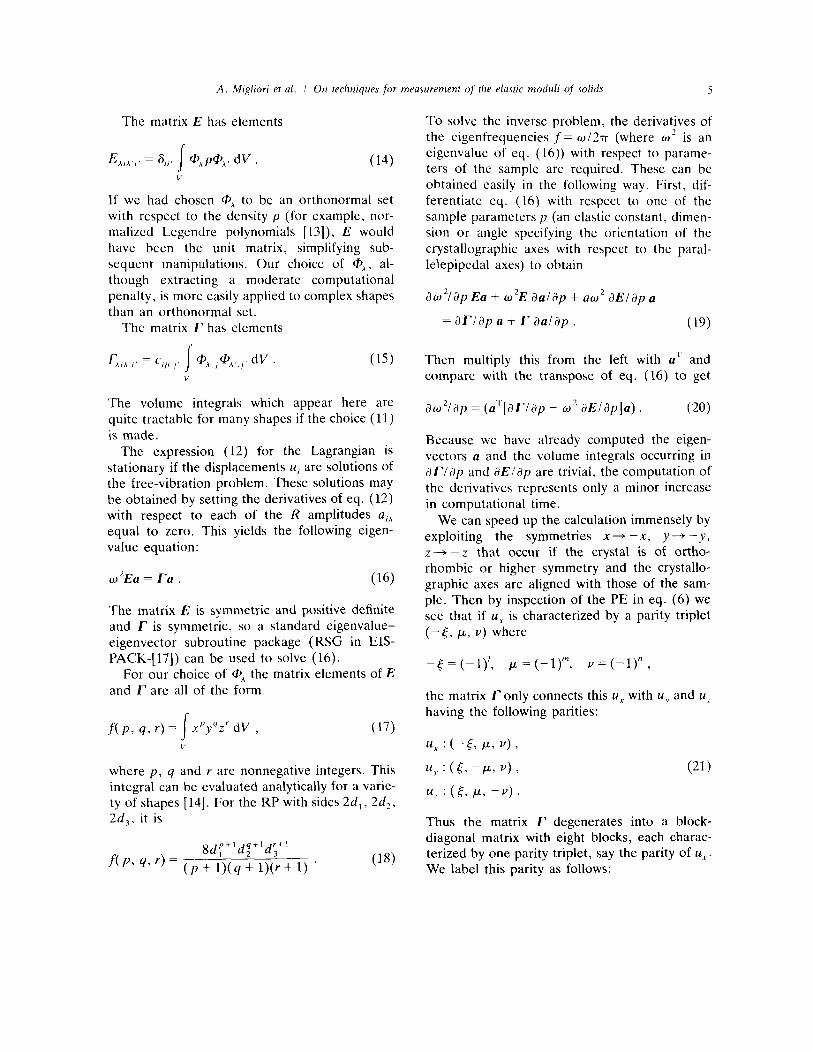
The matrix E has elements
E h,h’,’ = a,, ’ I @,,P@~, dV . (14)
If we had chosen @A to be an orthonormal set with respect to the density p (for example, nor- malized Legendre polynomials [ 13]), E would have been the unit matrix, simplifying sub-
sequent manipulations. Our choice of @*, al- though extracting a moderate computational penalty, is more easily applied to complex shapes than an orthonormal set.
The matrix I‘ has elements
I- h,h’l’ (15)
The volume integrals which appear here are quite tractable for many shapes if the choice (11) is made.
The expression (12) for the Lagrangian is
stationary if the displacements U, are solutions of the free-vibration problem. These solutions may be obtained by setting the derivatives of eq. (12) with respect to each of the R amplitudes uih equal to zero. This yields the following eigen- value equation :
02Ea = ra. (16)
The matrix E is symmetric and positive definite and r is symmetric, so a standard eigenvalue- eigenvector subroutine package (RSG in EIS-
PACK-[17]) can be used to solve (16). For our choice of @A the matrix elements of E
and f are all of the form
f( p, q, I) = 1 xpyqzr dV , (17) C’
where p, q and r are nonnegative integers. This integral can be: evaluated analytically for a varie- ty of shapes [14]. For the RP with sides 2d,, 2d2,
2d,. it is
,,l’+l,;+l,;+’
f(p, q3 4 = rp*] + l)(r + 1) . (18)
To solve the inverse problem, the derivatives of the eigenfrequencies f = wl2n (where w’ is an eigenvalue of eq. (16)) with respect to parame- ters of the sample are required. These can be obtained easily in the following way. First, dif- ferentiate eq. (16) with respect to one of the sample parameters p (an elastic constant, dimen- sion or angle specifying the orientation of the
crystallographic axes with respect to the paral- lelepipedal axes) to obtain
aw21ap Ea + 02E daldp + a~’ dEldp a
= arlap a + r aalap . (19)
Then multiply this from the left with aT and compare with the transpose of eq. (16) to get
&/ap = (a’[ar/ap - W’ aElap]a) (20)
Because we have already computed the eigen- vectors a and the volume integrals occurring in dZ’/dp and aE/ap are trivial, the computation of
the derivatives represents only a minor increase
in computational time. We can speed up the calculation immensely by
exploiting the symmetries x+ -x, y+ -y,
z-+ -z that occur if the crystal is of ortho- rhombic or higher symmetry and the crystallo- graphic axes are aligned with those of the sam- ple. Then by inspection of the PE in eq. (6) we see that if U, is characterized by a parity triplet
(-5, F, v) where
-6 = (-l)‘, p = (-l)“, V = (-1)” ,
the matrix r only connects this U, with uy and uZ having the following parities:
Thus the matrix r degenerates into a block- diagonal matrix with eight blocks, each charac- terized by one parity triplet, say the parity of u,. We label this parity as follows:
c 1
p, _-
-
-
_.. I-
.
7 -
;. ‘-
1 ,
‘2
A. Migliori et al I On techniques for measurement of the elastic moduli of solids 7
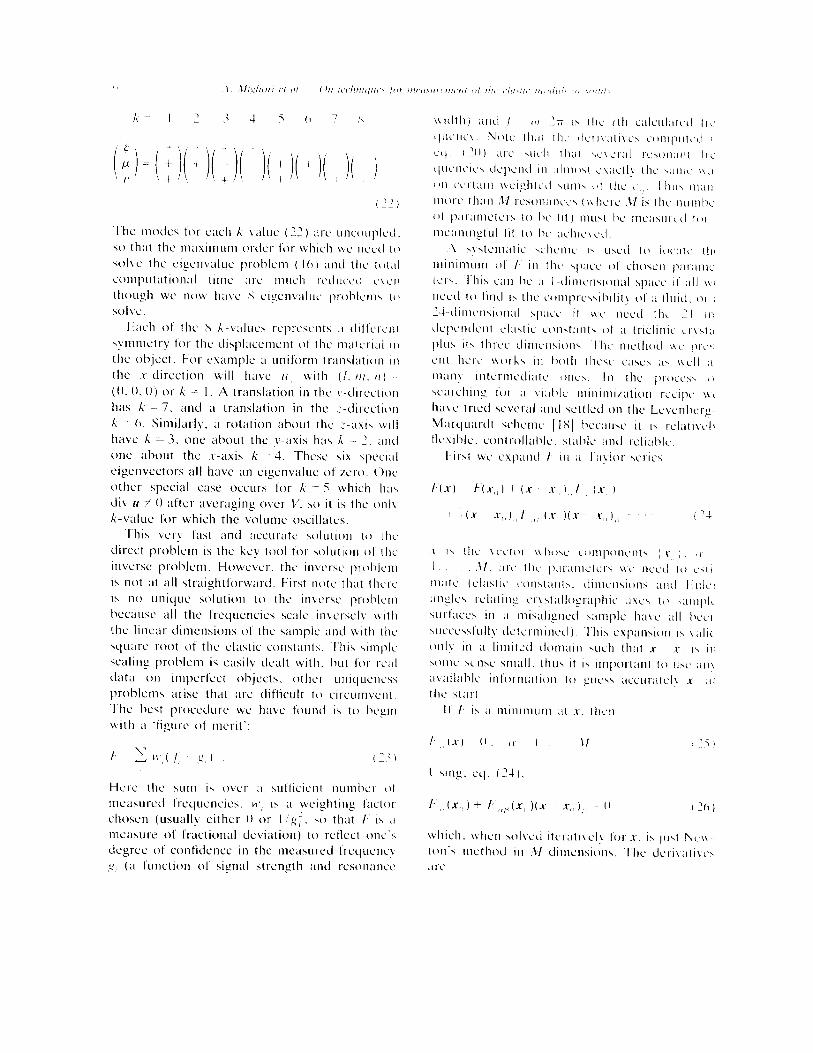
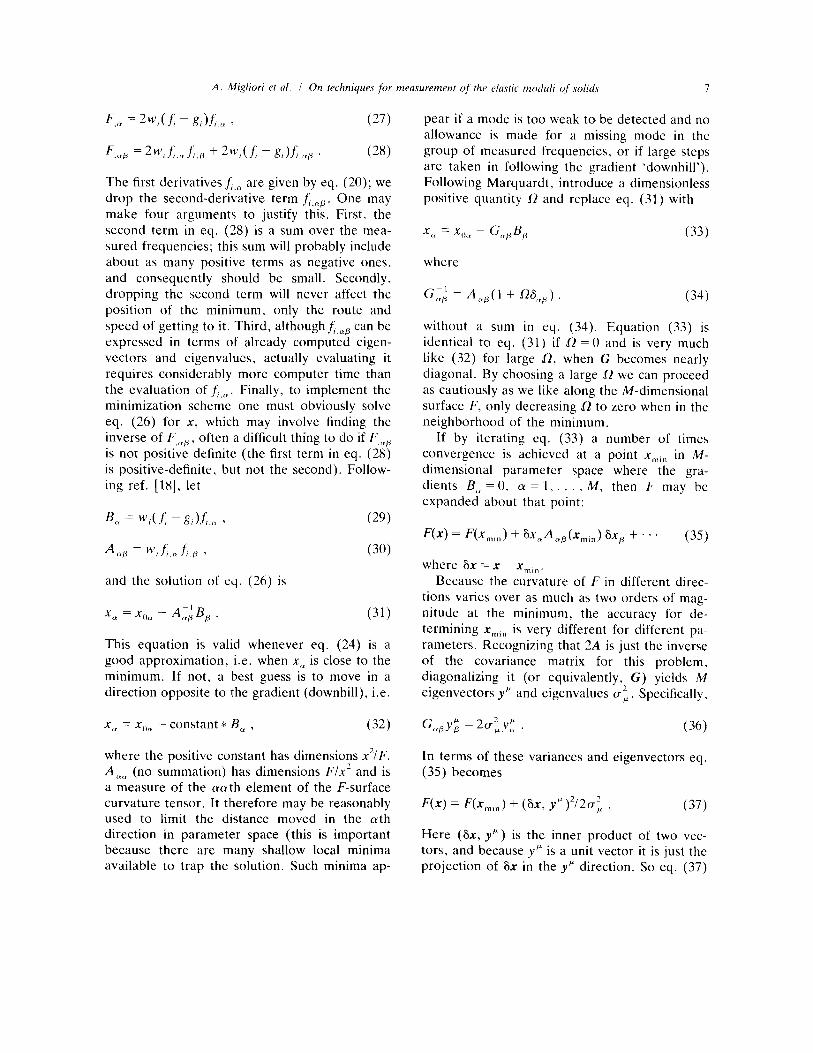
F,,, = 2w,(L - ~J.L 3 (27)
F
The first derivatives f;,, are given by eq. (20); we drop the second-derivative term f,.(+. One may make four arguments to justify this. First, the
second term in eq. (28) is a sum over the mea- sured frequencies; this sum will probably include about as many positive terms as negative ones, and consequently should be small. Secondly, dropping the second term will never affect the position of the minimum, only the route and
speed of getting to it. Third, althoughf,,,c, can be expressed in terms of already computed eigen- vectors and eigenvalues, actually evaluating it requires considerably more computer time than the evaluation off, (.. Finally, to implement the minimization scheme one must obviously solve eq. (26) for X, which may involve finding the inverse of F,(+, often a difficult thing to do if F,,,
is not positive definite (the first term in eq. (28) is positive-definite, but not the second). Follow- ing ref. [18], let
R<? = WI( s, ~ g, ).L 7 (29)
A crfi = YL,f,.~ >
and the solution of eq. (26) is
(30)
x, = xo<t - A,; B, . (31)
This equation is valid whenever eq. (24) is a good approximation, i.e. when x, is close to the minimum. If not, a best guess is to move in a direction opposite to the gradient (downhill), i.e.
XC, = XOC~ - constant * BCr , (32)
where the positive constant has dimensions x2/F.
AU,, (no summation) has dimensions F/x’ and is a measure of the aath element of the F-surface curvature tensor. It therefore may be reasonably used to limit the distance moved in the ath direction in parameter space (this is important because there are many shallow local minima available to trap the solution. Such minima ap-
pear if a mode is too weak to be detected and no allowance is made for a missing mode in the group of measured frequencies, or if large steps are taken in following the gradient ‘downhill’). Following Marquardt, introduce a dimensionless positive quantity f1 and replace eq. (31) with
(33)
without a sum in eq. (34). Equation (33) is identical to eq. (31) if 0 = 0 and is very much like (32) for large R. when G becomes nearly diagonal. By choosing a large 12 we can proceed as cautiously as we like along the M-dimensional surface F, only decreasing R to zero when in the neighborhood of the minimum.
If by iterating eq. (33) a number of times convergence is achieved at a point x,,, in M- dimensional parameter space where the gra- dients BCp =O, LY = 1,. . ,M, then F may be expanded about that point:
F(x) = Q,,,) + ~~,An,&m,,) 6x, + . . .
where 6x = x - x,,,~, .
(35)
Because the curvature of F in different direc- tions varies over as much as two orders of mag- nitude at the minimum. the accuracy for de- termining x,,, is very different for different pa- rameters. Recognizing that 2A is just the inverse of the covariance matrix for this problem, diagonalizing it (or equivalently, G) yields M
eigenvectors y’” and eigenvalues at. Specifically.
GU,Yf; = 2UiYf: (36)
In terms of these variances and eigenvectors eq.
(35) b ecomes
F(x) = W,,,,, ) + (6x, yP))‘/2u2 . (37)
Here (6x, y”) is the inner product of two vec- tors, and because Y@ is a unit vector it is just the projection of 6x in the yP direction. So eq. (37)
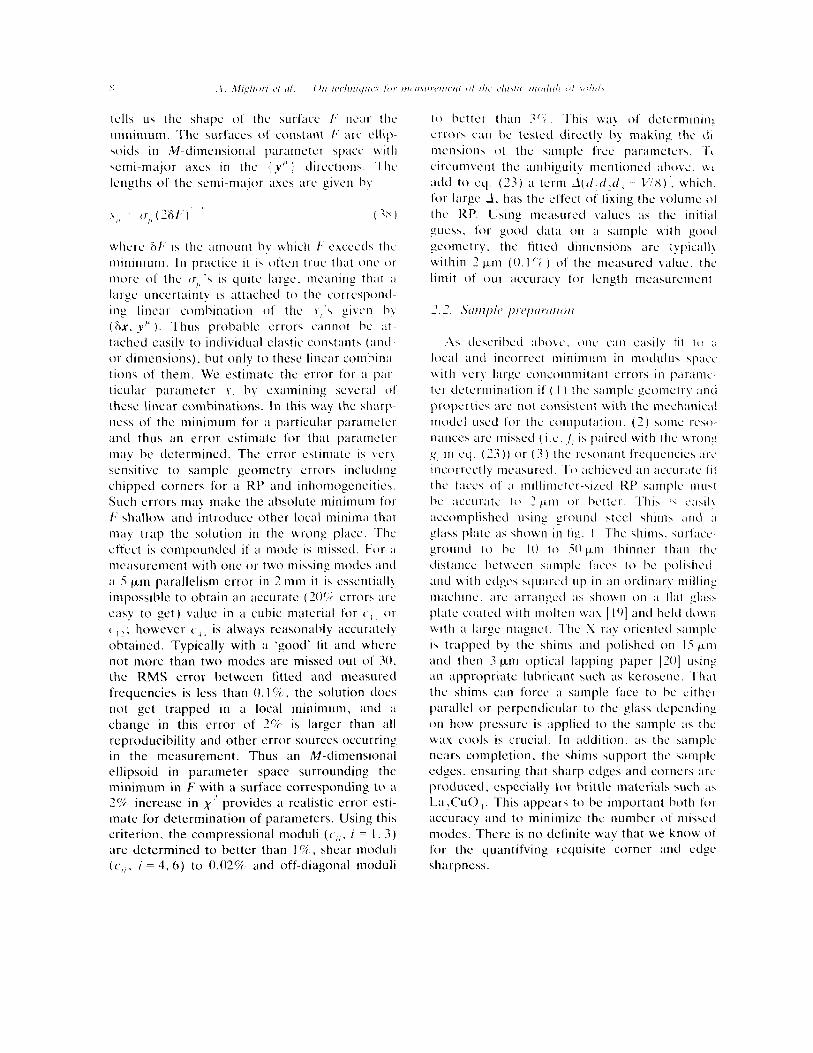
tell5 us the shape of the surface /+’ nt’ar the
minimurn. ‘T‘hc surfaces of c~~nstant E‘ a~-c ellip
soids in :M-dimensional paramelct- spxc ivith
\etni-major axe4 in the (.v”) directions. ‘I he
lengths of the semi-major ;IXCS arc given b!,
\vhet-c &I- is the amount bv which ~‘excectl~ the
minimum. In practice it i\ often true that one ot-
more ol‘ the CT,, ‘\ is quite large. meaning that ;I
large uncertainty ih attuchcd to the correspond-
ing linear conil~ination of the .I;‘\ gi\.cii b\.
(Tsx. y” ). Thus probnblc crrot-s cannot be at-
tachccl easily to individual elastic constants (and
or dimensions), but only to thcsu linear combina
tions of them. We estimate the error t’or ;I ~;IIF
titular parameter .v, 1~~ examining scvcral 01
these linear combinations. In this way the sharp
ncss of the minimum for ;I particular paramctct
and thus an error estimate for that parameter
may be dctcrmincd. The error estimate is \‘cr\
sensitive to sample gcotnetrv error\ including
chipped corners for ;I KP and inhotnogcnciticb.
Such errors may make the absolute minimum t’or
F shallow and introduce other local minima that
may trap the solution in the wrong place. The
cffcct i5 compounded if ii mode i5 missed. For :I
measurcmcnt with one or two missing modes and
;i 5 (*iii parallelism error in 2 mm it is esacntiall~
impossible to obtain an accurate ( 70r? crror4 NC
easy to get) value in ;I cubic material for c., , ot- c,,; however c4, is always reasonably accuratc‘lh
obtained. Typically with a ‘good’ fit and where
not more than two modes are missed out of 30.
the RMS error between fitted and measured
frequencies is less than 0. I%, the solution docs
not get trapped in ;I local minimum. and a change in this error of 2% is larger than all
reproducibility and other error sources occurring
in the measurement. Thus an M-dimensional ellipsoid in parameter space surrounding the minimum in F with a surface corresponding to a 7% increase in x’ provides a realistic error esti-
tnate for determination of parameters. Using this
criterion. the compressional moduli (c,,. i = I. 3) arc determined to better than I%, shear moduli
((,,, . i = 4, 6) to 0.02% and off-diagonal moduli
10 hcttct- that1 3’, l‘his way of dctermintn;
ct-t-ors can be tested dircctlv by making the di
mcnsions of the rumple t’rcc parameter\. I’(
tit-cumvcnt the ambiguitv mentioned above. \\L
add to cq. (73) ;I tcryn _i(tr,C/,tr; \!‘ti)‘. which. for large -I, has the cffcct of fixing the volume 01
the KP. llsing mcasurcd ~alucs as the 1nittal
guesh. for good data on ;I hampIe with goo~l gcomctrv. the tittcd ditnensions arc tvpicall\ within 2 km (0. 1’; ) of the measured value. the
limit c)f our accuracy for length measuretnc‘nt.
,As described abo\ C, 011~’ can casilc. tit (~1 ;I
local atid incorrect minimum in tnodulu’r \p;tc‘~’
Lvith vcr\ Iargc concommit~tnt errors in paranic-
tct- cletcrmination if ( I ) the \atnplc geometr\ and
properties arc not consistent with the mcch:inical
model used for the computation. (7) sottic I-c~)- n;tncc\ arc‘ tnissed (i.e. ,j, i\ ptircd with the wrens
,q, in cq. (3)) or (.3) the trcsonant frequcnctes arc
incorrcctlv measured. 7‘0 achieved an xcitt~alc lit
the face\ of ;L tnillimctct--\i~c~i RP sample nit141
bc accurate to 1 knt ot- bettct-. Thih I\ <*ail\
accomplished using ground stocl 4hinis and ;I glass plate as shown in liz. I l‘hc shims. \uri;ic~~~ c ground to 1~~ IO to 50 ant thinner than the
distance bctwccn 4;iniple ~acc4 I0 bc polished.
and with edgc4 squ;it-cd up in an ordinar\ milling machine. ;trc arranged as \hoM n on ;I flat gl;144
plate coated with moltcti L{;I~ 1 IO] and held do\vri
with :I large niagne(. The ?i-ra> oricnteti \:inipl~
i\ trapped bv the shims and polished on I5 pm and then 3 ini optical lapping paper [N] using
an appropriate lubricant such as kerosene. That
the shims can force ;I sample fact to hc tither
parallel or pcrpcndiculai- to the glass depending on how prcssurc is applied to the satnplc as the
N:IY cools is crucial. In addition. as the sample ncarlr completion. the shims hupport the sample edges. ensuring that sharp edges and corncr4 arc produced, especially for brittle materials such II\ La,c’uO ,_ This appears to be important both t’ot- accuracy and to minitnize the nutnber of missed
modes. There is no definite way that we know of
for the quantifying rcquisitt: corner and cdgc
sharpness.
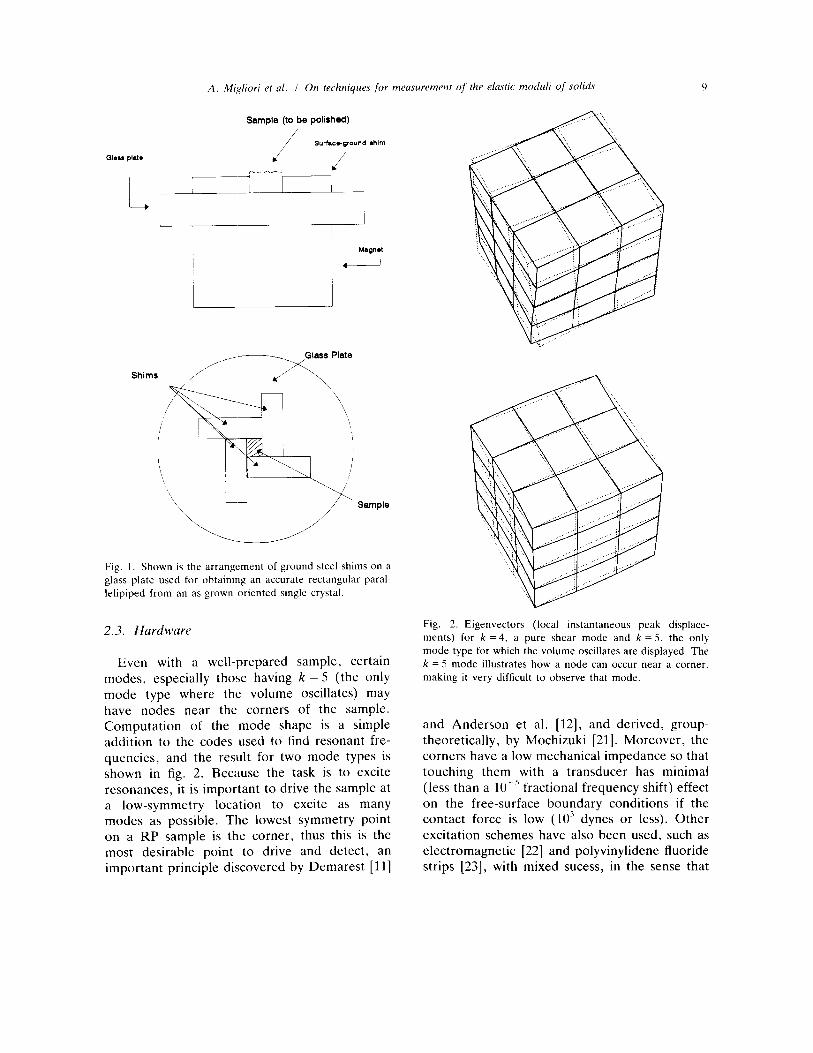
A. Migliori et al. I On techniques for measurement of the elastic. moduli of solids
Sample (to be polished)
/ s”*c.-gro”nd cell
, /
I /
Sample
Fig. I. Shown is the arrangement of ground steel shims on a
glass plate used for obtaining an accurate rectangular paral-
lelipiped from an as-grown oriented single crystal.
2.3. Hardware
Even with a well-prepared sample, certain
modes, especially those having k = 5 (the only mode type where the volume oscillates) may
have nodes near the corners of the sample. Computation of the mode shape is a simple addition to the codes used to find resonant fre- quencies, and the result for two mode types is shown in fig. 2. Because the task is to excite resonances, it is important to drive the sample at a low-symmetry location to excite as many modes as possible. The lowest symmetry point on a RP sample is the corner, thus this is the most desirable point to drive and detect, an important principle discovered by Demarest [ 111
Fig. 2. Eigenvectors (local instantaneous peak displace-
ments) for k = 4, a pure shear mode and k = 5, the only
mode type for which the volume oscillates are displayed. The
k = 5 mode illustrates how a node can occur near a corner.
making it very difficult to observe that mode.
and Anderson et al. [12], and derived, group- theoretically, by Mochizuki [21]. Moreover, the corners have a low mechanical impedance so that touching them with a transducer has minimal (less than a lO_” fractional frequency shift) effect on the free-surface boundary conditions if the contact force is low (lo3 dynes or less). Other
excitation schemes have also been used, such as electromagnetic [22] and polyvinylidene fluoride strips [23], with mixed sucess, in the sense that
Surprisingly. the lowest nicde5. cvcn tot- ;III
RI sample. xc usuall~~ put-c \hcat- mode\. l‘hu\
c\‘ctl it‘ moduli 2nd 4h:tpc conspire to lot-CC. ,i
node to hc near ;I cortict-. thereby making 11 \o
weak that it mu\’ hc missed. the first se\etxl
modes will generally dctcrminc the shear mociuli
to I “C or so. providing ;I good guess for Ihctn iti
the inversion calculation. The inversion ccdc
now ha> somewhat less work to do. making tt
harder to fall into ;I false minimum. Mot-c im-
portant. though. is that anything that hc1ps C~C
WI-C ;I good initial guess for the mociuli should he
used. including publishctl values. hecauxc M ith ;I
good starting point and the LI~C 01 onI\ the tit-\t
live or ten rcsonancc~. the first pa\s of the cotlc
ma\ help identify place4 where ;I mode IS iiit4\-
ing. Then a more careful scan ot- ;I remount 01
the sample may t-weal the mode. l‘hct-c ;~I.c
other ways of finding missing mode4 using simple
modifications to the apparatus describecl I~elo\~
1241. ot- by sitnplq inserting. measuring xitl t-c-
moving the sample several tima. WC cannot
ovcrstress the importance of tinding nearI\ ( 05 ,
or hctter) all modes hefore relying on the analy
his of the data.
.fhc hat-dwar-c atid electronics i14eil to ol3t;1111
accurate I-csoti;~~icc data include ;I ct-vo4t;lt 01
t urnacc. transducers. ;I preamplifier, ~anipliliet-
and mixer/filter or WIW equivalent. The clew-
tronic components and transducers usctl in out-
and Anderson’s systctns 13.51 are now ~o111111et~--
cially available from Quatro Corp. [%I. We will
hcgin the hardware discussion with the transduc-
crs and work our way back to the K-AI‘ con-
patihlc computer used as a controller. Although
other approaches will work. the one described
hcrc has been demonstrated to p~duce sufti-
ciently high relative and absolute accuraq that
overall errors are determined hy temperature
diifts and intrinsic sample preparation problems.
To nicasitrc rcsonancc’; of the sumplc ii I\
important to eliminate the resonant response 01
the apparatus. or cstra modes mav be ohscrvecl.
Krause most satnplcs in the six range of I tntll have t-csonanccs ahow about 0.4 MHz. and 30 ot-
i11ot-c t-c4011;1t1cL’\ l~ClO\4 .: ILlll;/. Lhc tt~;ltl\~illLc’,‘.
llxd tcb c\citc and dctcct tiitl\t IW cithct J;ttitp~~~i
ot nonrc4on;itit in 11114 It-cquctic\ range I )~ltllp
ltlg clck~ not norI\ \\~,ll OL’C~I. \ticIi ;I Iarsc l;itlp 0j
trcclucticic4 01 at 311 K. 111114 the t10t1l~cv~t1;111!
appt-o;lcti I\ hc4t. I I~~v,c~ct ~111 lrandttc~~t nl,i
Icrictl\ ha\c \ouncI \‘c‘loc3ttc5 ix)mp:tt-at31c~ 10 tlti
~ample4 tiicdsurcd ()t1c c;lllllc,t get ;ltc~tltld t111\
I>! tl4ilig clec3ro4t;ltlc~. tiidgll~~tlc 01 optic,at dct~,~
IlOll 4ChClllC’4. I’hC <~[?tlC’;ll rlllC\ LlIC tllllCt1 iO(!
11014\. blagnctic \chcntc%\. ~~cc;ibion;tll\ i~u_xl I’\
c&t-\ [“I. \uffcr lrc)tii two 4criou\ pt-ohlctii\
‘l’hc lir\t is that the ~nplc iiiust tx cithct ICI-
totiiagn~tic or conducting 01. cclatecl with (I ICI
rc~magnetic ot- thick cx)nducttng layer. E\cti I ptit 01 let-romagnctic /;t\cr vi111 bc ;I ()._)(I pcrturb;l
Iicjii OII \niall ~tiiplc5. illit wet-\c still. the 1c.l
t’c~tna~ti~t dot4 not Ii;ivc. 4 \\tiimetric c‘la\ttc tctt-
\ot Second. the cc)11 IIWI to drive 01 Ilct~~~~t
ititct-act\ niechanic2ll\ uith rhc 4;iniplc~ .i ~,i .: tnagtiettc licld. 7‘17~4 the iisitall~ tiumc~-ot~~ ~~011
t~c~4otia1icc4 ztiift arid clegrxlc the ~tiipl~~ tticde~
:I\ well ;I\ pcrhap tntt-ociucing sonic nc~ t )ilC\
I‘hi\ is known ;I> ‘coil cti\easc,’ 111 NMK I~C;IWIC~
mcnts 1771. Llectrost;tttc \\4tcnis haxe \ttiiil;tt
prohlctns. The 4olutton. appl~cal~lc to dit-c,ct COII
tact (and clectro\tattc :rIiti magnetic clr~\~c \I ,-
tcnis iis i4 0In ious attcr :I tiiotiictit‘\ t-eflcctioti) I\
not 10 make b’cr\ small. and thereforc bc‘r\ \ccah
transducers hut to construct the transducer n~ost-
I!, out of Gnglc-crylal diamond. Our \ytctti [ 251
use\ conimcrcial 30 Mt1/ cc~nipressional mode
I .iNhO disc\ I .I tiitii in dianietcr and approxi-
mateI\ 0.1 mm thick [2X]. Such disc4 lii~\c (I
thicknc~~ tnodc of 30 MHz but hcnding tnodc\
near IS0 kHz. llowc\~t-. using our cylinder LXKIC
wc kno\+ that a diamond cvlindcr I..5 mm in
diametct- ;rticl I .O mm long has ;I lowest mode ot
4.47 MH7. ‘Thus it’ wc bond the diamond to the
transducer. the asscnihlv has 2 lowest mode tic21
1 MH-/. The diamond -also acts a\ a11 inerttal
load. 40 that the response ot’ the I.iNh02 ~II
direct contact with the sample is cnhancecl bv the
diamond hchintl it. We al\o use a Ag-coated
polyimidc film 75 pii thick with I pm of cvapr)-
t-ated Ag as the ground plane. and a strip of this
material I .5 tnm wide ;I\ ;I lou inductance. lob
mechanical Q electrical contact bv inserting the
A, Migliori et ul. I On techniques fur nwu.~uretnent of’ the elustic moduli of .solids II
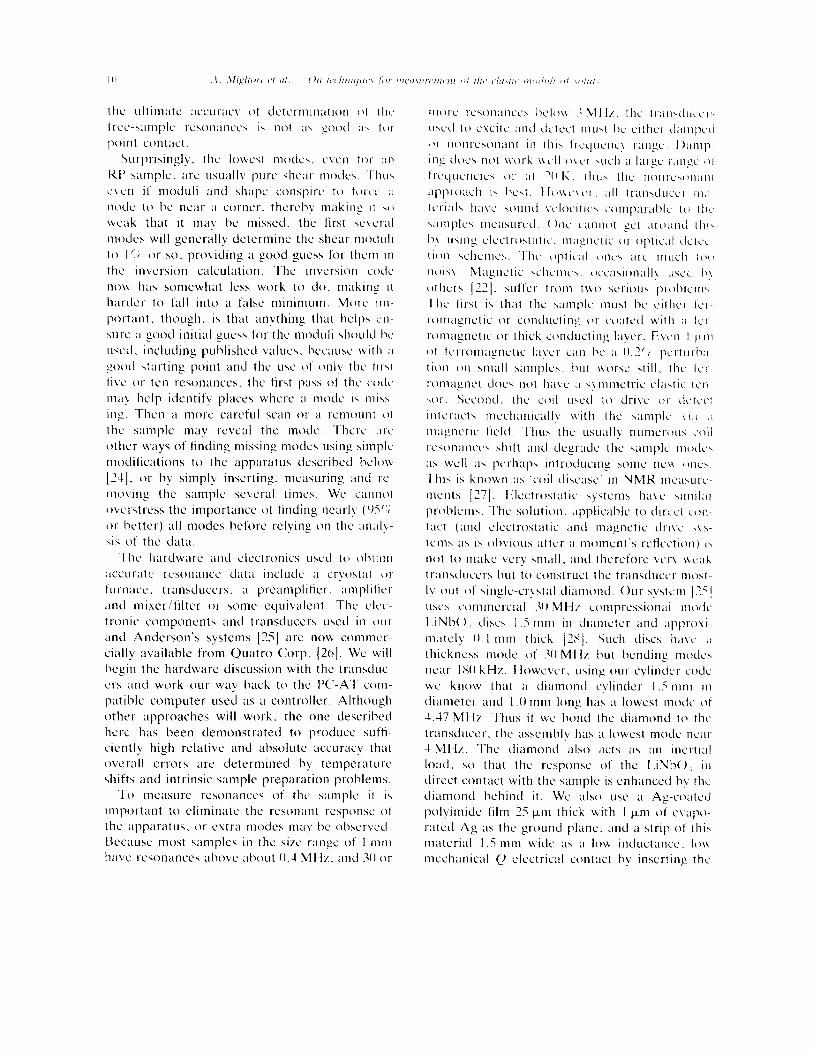
strip between diamond and LiNbO,. This strip also helps damp the 4 MHz and above assembly resonances. All joints are made with a noncon- ducting epoxy [29] because at these frequencies no direct electrical contact with the transducer is required, capacitive coupling is sufficient. The
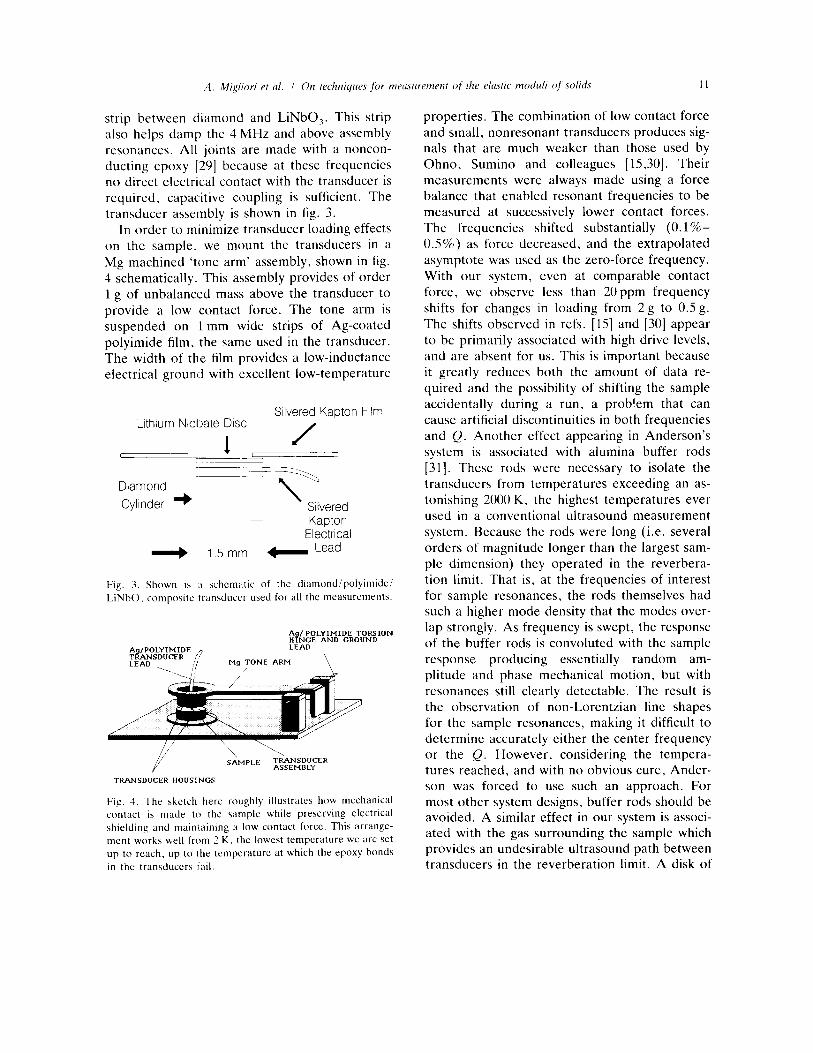
transducer assembly is shown in fig. 3. In order to minimize transducer loading effects
on the sample, we mount the transducers in a
Mg machined ‘tone arm’ assembly, shown in fig. 4 schematically. This assembly provides of order 1 g of unbalanced mass above the transducer to
provide a low contact force. The tone arm is suspended on 1 mm wide strips of Ag-coated polyimide film. the same used in the transducer. The width of the film provides a low-inductance electrical ground with excellent low-temperature
Lithium Niobate Disc Silvered Kapton Film
Diamond
Cylinder -) I Kapton
Electrical
+ ~ 1.5 mm Id- Lead
Fig. 3. Shown is ;i schematic of the diamondipolyimidc!
LiNbO, composite transducer used for all the measurements.
A / POLYIMIDE TORSION H 9 NGE AND GROUND LEAD
Mg TONE ARM
;;I SiMFLE TiiWSDUCER f ASSEMBLY
TRANSDUCER HOUSINGS
Fig. 3. The sketch here roughly illustrates how mechanical
contact is made to the sample while preserving electrical
shielding and maintaining a low contact force. This arrange-
mcnt works well from 2 K. the lowest temperature WC are set
up to reach, up to the temperature at which the epoxy bonds
in the transducers fail.
properties. The combination of low contact force
and small, nonresonant transducers produces sig- nals that are much weaker than those used by Ohno, Sumino and colleagues [15,30]. Their measurements were always made using a force balance that enabled resonant frequencies to be measured at successively lower contact forces. The frequencies shifted substantially (O.l%- 0.5%) as force decreased, and the extrapolated
asymptote was used as the zero-force frequency. With our system, even at comparable contact force, we observe less than 20ppm frequency shifts for changes in loading from 2 g to 0.5 g.
The shifts observed in refs. [15] and [30] appear to be primarily associated with high drive levels, and are absent for us. This is important because it greatly reduces both the amount of data re- quired and the possibility of shifting the sample accidentally during a run, a probrem that can cause artificial discontinuities in both frequencies
and Q. Another effect appearing in Anderson’s system is associated with alumina buffer rods [31]. These rods were necessary to isolate the transducers from temperatures exceeding an as- tonishing 2000 K, the highest temperatures ever used in a conventional ultrasound measurement system. Because the rods were long (i.e. several orders of magnitude longer than the largest sam- ple dimension) they operated in the reverbera- tion limit. That is, at the frequencies of interest for sample resonances, the rods themselves had such a higher mode density that the modes over- lap strongly. As frequency is swept, the response of the buffer rods is convoluted with the sample response producing essentially random am- plitude and phase mechanical motion, but with resonances still clearly detectable. The result is the observation of non-Lorentzian line shapes for the sample resonances, making it difficult to determine accurately either the center frequency or the Q. However, considering the tempera- tures reached, and with no obvious cure, Ander- son was forced to use such an approach. For most other system designs, buffer rods should be avoided. A similar effect in our system is associ- ated with the gas surrounding the sample which provides an undesirable ultrasound path between transducers in the reverberation limit. A disk of
ordinary filter paper with a small hole punched
in the center. and split in half was constructal
and inserted between transducer assemblies and
surrounding the sample. This completely climi-
natcs the gas path for ultrasounci and thuh
minimizes gas resonances.
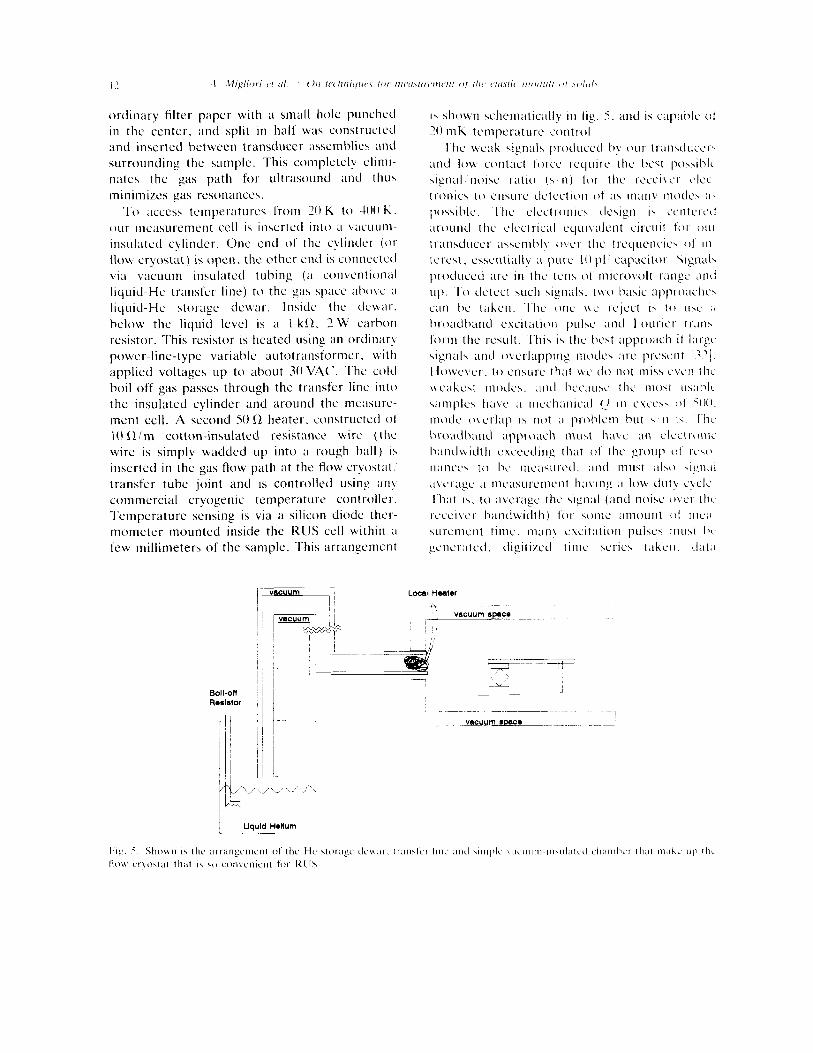
To access temperatures from 70 K to 100 K.
0u1- measurement cell is inserted into ;I v;icuu111-
insulated cylinder. One end of the cylintlcr (01.
How cryostat) is cqxn. the other end is conncctcd
x,ia \xuuIn insulntcd tubing (:I conventional
liquid-He transfer line) to the gas spxc abow :I
liquid-He storage dcwx. Insidc the debar.
below the liquid level is ;I 1 klZ. 2 W carbon
resistor. This resistor is heated using an ordinary
power-line-type variable autotransformer. with
applied voltages up to about 30 VAC‘. The cold
boil-off gas passes through the transfer lint into
the insulated cylinder and around the mcasurc-
ment cell. A second SO fZ heater, constructed 01
IO II/m cotton-insulated resistance wire ( the wire is simply wadded up into ;I rough ball) i>
inserted in the gas flow path at the flow cryostat
transfer tube joint and is controlled using an!
commercial cryogenic temperature controller.
Temperature sensing is via a silicon diode thcr-
mometcr mounted inside the KUS cell within a
few millimeters of the sample. This arrangement
13 shown \chematicallv in tig. 5. and is cap;~blc 01
70 niti temperature c‘ontr-ol
I‘hc beak Ggnal4 protlucc~l t)!, our lran4duccr\
and lob contact I()I-cc require the t>c\t pc>\hil3lc
\ignal;noisc ratio (4 n) tc)r the rccci\cr ctlcc
tronia to cn4urc clctection ot as 11i;uiv ~riodc\ :I\
1x)44ihlc. ThC elcct1-0111cs dc\igIi i4 L,cIiterLsc!
;iI-ound the clccti-ical equi\~dcnt circuit toI 0111
II-;insducer a44cnil~l\ 01~1 the trequencie4 of 111
Ic’rc4t. exxntiallb ;I pure I(\ pF capacitor Sign;ti\ procluccd arc in the tcIl5 ot microvolt r-:inlc dnd
up 7‘0 clctect \uch siynal4. (MO basic appro;ic’hc~\
C;III he taken. .I‘hc one \\c rc.jcct i\ to MC ,i
I7roadtxmcl cscitation pulp and I~oilI-icr trail\
l’orm the IrcaIlt. ‘l‘hi\ i\ the Ilest approach ii Iargi
\ign:il\ and overlappin g niodc4 arc pfc\cnt I.;?/
Howe\:er. to cnsurc that MC do not mi\\ C‘\CII the>
\\c;1l\c41 modcx. AlId tlccau>c the lllO\I IlUl7lL
wlllplc\ hiI\ c’ ;I mechanical Q III c-\c‘c\\ 01 i0I)
iilcdC o\crlap is riot (I prol~leni hut \ 11 I\ I hi, hI-oxit~alld ~lppl-‘~;lcll Illll\t t1;i\c >\I1 cicctl~~ltli
l~;iIidwidth exceeding that 01 the gI-oup ot IIc’4(’
11;111cc~ to Ix_* nic;i\urcd. ;ind must ;ilw~ \ipi:ii
;r\er:rgc ;I mc;isiIrcmcIlt ha\ 1I1g ;I lou cirit\ c‘\clc.
‘l‘hat i\. to avcragc the \~gn:Il (and noi4c ovcI- tllc
rc*cci\cr l~antlwidth) tor \ome amc~utlt of Inc.1
4ui-cnient time. iiii~n\ excitation pulx5 mu\1 I)i
gCncratcd. tlIgItIzecl litiic \erics takeiI. d;11~1
A. Migliori et al. I On techniques for measurement of the elastic mod&i of solids 13
transferred between pulses etc. Thus most of real time is spent with no signal present. Moreover, because measurements are made only in regions of frequency space where the sample exhibits mostly well-separated very sharp modes, any broadband system is acquiring much data that contains no information. Finally, for sharp, Lor- entzian, well-separated modes, phase informa- tion is unnecessary. We have, therefore, chosen to use a swept sine approach based on a heterodyne receiver.
A heterodyne/swept-sine receiver (HSSR) can have an arbitrarily narrow bandwidth, has a duty cycle of unity, need only measure where reso- nances exist, and can signal average for arbitrari-
ly long times a signal from which most of the noise is already eliminated using digital detection of the final, high-amplitude information-contain- ing output of the analog section of the receiver. As with any receiver, the unavoidable noise is
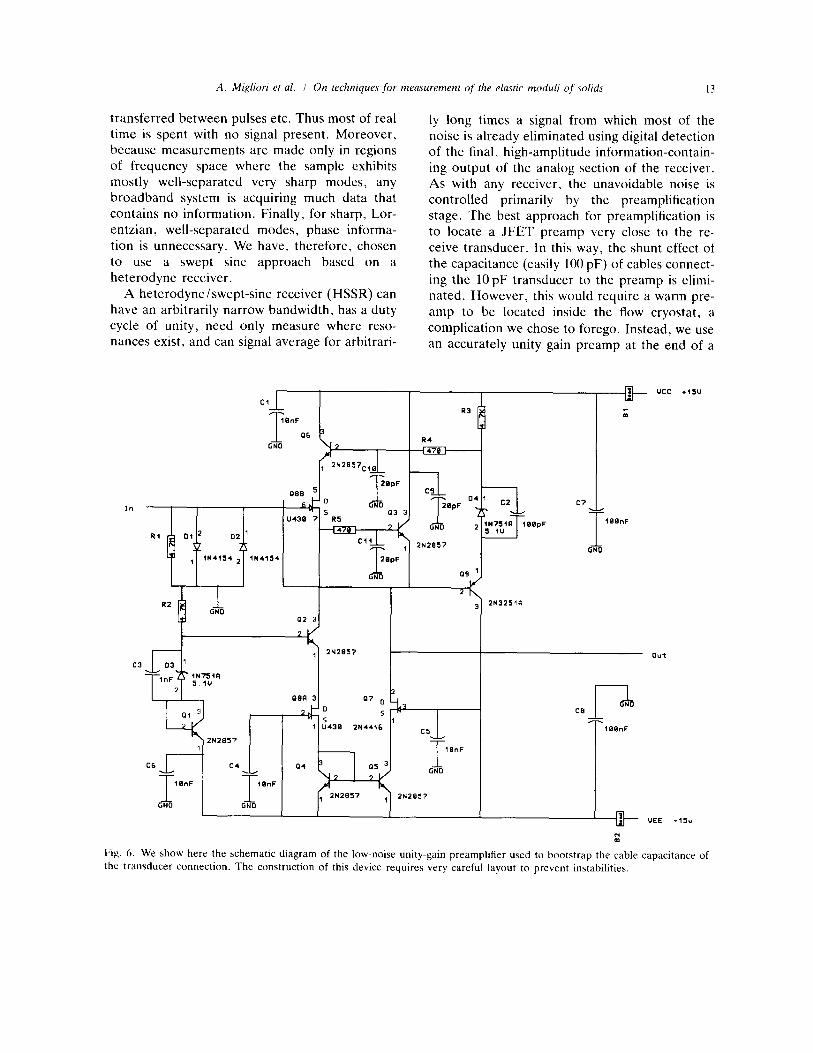
controlled primarily by the preamplification stage. The best approach for preamplification is to locate a JFET preamp very close to the re- ceive transducer. In this way, the shunt effect of the capacitance (easily 100 pF) of cables connect- ing the 10pF transducer to the preamp is elimi-
nated. However, this would require a warm pre- amp to be located inside the flow cryostat, a
complication we chose to forego. Instead, we use an accurately unity gain preamp at the end of a
Ill
100nF
R2 _L GND
3 2N3251R
92 3 1 I
2N2857
C3 03 ’
1°F ‘Ir 1N75iR 5 lU
2 ORR 3
C0
10BfTF
2N2857 1
C6 C4
T IRnF
GNO
out
UEE -15"
Fig. 6. We show here the schematic diagram of the low-noise unity-gain preamplifier used to bootstrap the cable capacitance of
the transducer connection. The construction of this device requires very careful layout to prevent instabilities.
trt~isial cable connecting l”-camp to tt-atisducct
13! cc)ntiectitig the prcanip output lo the ititict
shield of the tria\. WC clitninatc cable c>ll>iicl-
Idttcc effects (this is known iI\ ;I t>oot\tt-~l~~ 01
guard). ‘l-his is onlv important hecausc the pw
amp 14 voltage sctisitive. For ;I current sctisiti\c
prcatiip 01. ati op-arnp type prcanip, cable di~~rtt
capacitance has no effect on overall a/ II. Hut IOI-
ail\ type ot’ prcatiip used with \o iii~icli cabtc
capncttaticc. much care tnusl Ix taken to elimi-
tlatc high-frequency ph;lsc shifts that could C;IIISC
cwillation. This is whc MY have LIXCI low-ittcluct-
:IIICC lexls on tlic transducers and al40 wtiv \IC
liiicl it easier to design ;I good .I2-F1’ front end.
‘l‘he .lFET unity-gain prcaiiip show 11 sctiematic~il-
I! in fig. 0. rnodificd l’rotn one dc\critxd III
I lorowitz and frill (.3.;]. i4 clesip~ccl to ha\<. ,I
lwnci\~~idth of 30 Ml I/.. ensuring no ~~nw~~ntc~tl
ph:~sc \hit’t\ below 4 Mk1/. and ha\ a11 input tloiw
li~ut-c of ;I few nC’/l1/ ‘. cotitrolled primat-il! t)\
the d~ial .IFH‘. lkc~iusc the It-i;ix cffecti\el\
~x~nnccts the output tiirectl! 10 tlic input. the rlcsign ;ind Iavout of tlic circuitn I\ crucial. ‘l‘hc
inhc~rciit re~twtisc of ;I IHSSK is 4uch that it 14 iicll
._
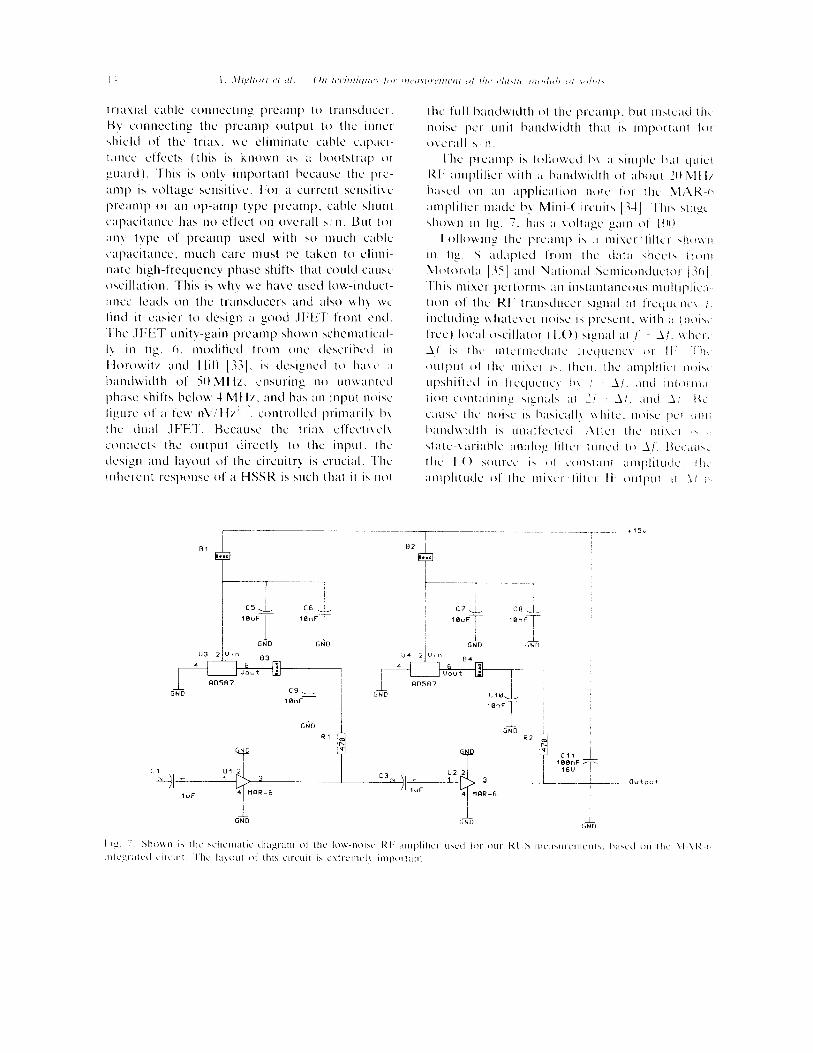
A. Migliori et al. I On techniques for measurement of the elastic moduli of .x/lids
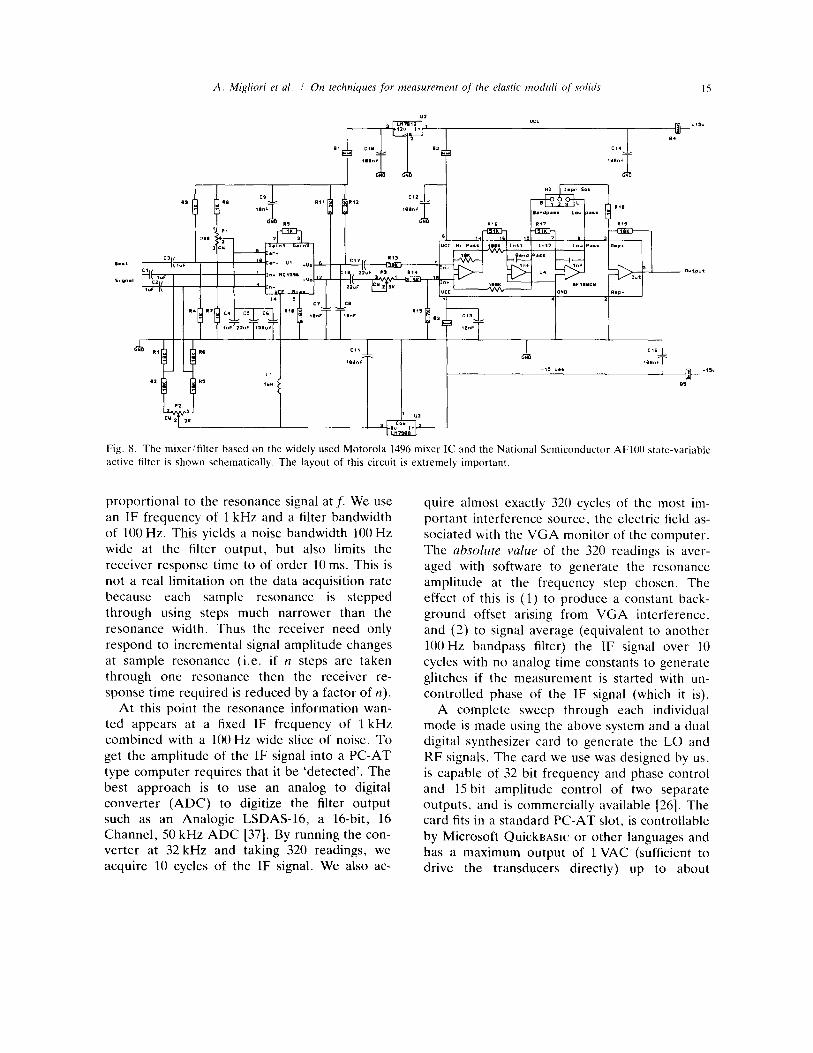
Fig. 8. The mixer/filter based on the widely used Motorola 1496 mixer IC and the National Semiconductor AF100 state-variable
active filter is shown schematically. The layout of this circuit is extremely important.
proportional to the resonance signal at f. We use quire almost exactly 320 cycles of the most im- an IF frequency of 1 kHz and a filter bandwidth portant interference source, the electric field as- of 100 Hz. This yields a noise bandwidth 100 Hz sociated with the VGA monitor of the computer. wide at the filter output, but also limits the The absolute value of the 320 readings is avcr- receiver response time to of order 10 ms. This is aged with software to generate the resonance not a real limitation on the data acquisition rate amplitude at the frequency step chosen. The because each sample resonance is stepped effect of this is (1) to produce a constant back- through using steps much narrower than the ground offset arising from VGA interference, resonance width. Thus the receiver need only and (2) to signal average (equivalent to another respond to incremental signal amplitude changes 100 Hz bandpass filter) the IF signal over 10 at sample resonance (i.e. if II steps are taken cycles with no analog time constants to generate through one resonance then the receiver re- glitches if the measurement is started with un- sponse time required is reduced by a factor of n). controlled phase of the IF signal (which it is).
At this point the resonance information wan- ted appears at a fixed IF frequency of 1 kHz combined with a 100 Hz wide slice of noise. To get the amplitude of the IF signal into a PC-AT type computer requires that it be ‘detected’. The best approach is to use an analog to digital converter (ADC) to digitize the filter output such as an Analogic LSDAS-16, a 16-bit, 16 Channel, 50 kHz ADC [37]. By running the con- verter at 32 kHz and taking 320 readings, we acquire 10 cycles of the IF signal. We also ac-
A complete sweep through each individual mode is made using the above system and a dual digital synthesizer card to generate the LO and RF signals. The card we use was designed by us, is capable of 32 bit frequency and phase control and 15 bit amplitude control of two separate outputs, and is commercially available (261. The card fits in a standard PC-AT slot, is controllable
by Microsoft QuickBAsIc or other languages and has a maximum output of 1 VAC (sufficient to drive the transducers directly) up to about

1370.0 1372.0 1374.0 1776 0
kilohertz
l‘he rcsonancc data xquircd i4 procc~d 10
huhtract background and then. using all the data
acquired. ;I fir41 inomcnt of the usualI\ I.ore~it-
Lian I-CSOI~~IICC‘~ is computed. In this wa> , further
noise reduction occurs so lhal tic can determine
rcliablv the center frequenc\~ ot ;I resonance 10
ahout 3’; or less of the linewidth. A complerc
cwperimentul run WOLIICI consist of ( I ) ii search
for- all modes at rooitt tcmpcraturc. (7) :iccfui\i-
tion of ;I data file produced Iv a iiilrrob s~~cep
through each rcsonancc f’ouncl. (3) ;I croon-
tcntpcratui-e tit to the moduli (and iteration ot
( I ) ant1 (7) if the fit is inadcquatc or predict5
missing modes. and (3) ;I repeat of‘ (2) for each
tcmpcrature desired using sufticiently small Icn-
pci-ature steps so ;IS not to lose track ot mode
identitications.
3. Typical results
klavlitg tlescrihcd the principles. procedures
anti hardware for making RlJS measurcmcnts
and analyzing the data. WC present hcrc \omc
cxamplcs of the application of RLJS to the stud\.
ot 41ructur;iI ptia4c iran4itions (St’.1 ). ‘I‘lic c\;~ili
pies reviewed here arc the 4oft-mode-dri\ cii
SIT5 in the pcrovskite \ytem LA .C’uO ,_ \vhich
includes \c’\,cr;ll high-temperature s~~pc~xx~~lcluc
tars. and in SrI’iO,.
Sr’l‘iO: i\ ;I pcrov\kite that undcrgoc\ ;I SP’I
loom cubic (the tiigli-tcmpct-;ltLlrc or ‘x! nlmct~-IL‘
phase) 10 tetr-agonal (the I(,w-tcniper~lturc 01
‘un\vnimctric‘ phsc) crc.\1;ll \vmmetr! at 105 K
‘I’hi\ material ix par1Icui;lrl!, ihteresting I~CC~LIS~
i14 SPI‘ is ;I canonical cxamplc of ;I \of’t-motlc
1351 phase transitiou ;~ntl has been well \tudieC
hc~th thcorcticdl\ [i9] and csperimentall~ using
conventional ultrasonic techniques [41.-&l ,471.
Furthermore. the pcrovskitc structure ;III~ utl
tier-lying titanium-oxygen cwtahccira in SrT‘iO
:II-c \‘cr! similur to the structure of the higli-
temperature 4upcrconductor\ La .(‘~i( ) dncl
1.2, ~SrU(‘uO, 10 Ix2 discussed helo\v. On 21 more
practical Icwl. large high-qualit\ single c‘rv\tal\
:irc r-cactiI\, available cc~rtirt~~r~iall~~, ;111;l II< 1
macroxq%c fields develop at the SW to compli-
cats data ;inal\;sis. WC ohtaincd ;I large Gnglc
ci-ystiil 143] and prcparcd \cveral KP wniplc~
( I .9 ittnt )i I .5 mm x I .O mm) ii4 was dcscrihccl
~lhove.
The sxnplc geoinctr\ w;i\ imxrate 10 xt3ouI
2 f_mi and the intrinsic qualit> was high ~1 that
A. Migliori et al. I On techniques for mcusurement of‘ the elastic moduli of solids 17
we were able to measure and fit the first 33 resonant frequencies at room temperature with an rms error of 0.075 percent. The values of the elastic moduli determined by the fit, as well as several sets of values from measurements by others, are shown in table 2. The agreement is excellent.
Our real interest in this material is not so much a test of RUS but rather a study of the details of the temperature dependence of the elastic moduli through the SPT. Because of the unique capability of RUS to determine all mod- uli simultaneously, precise comparisons between moduli can be made and compared to Ginsburg- Landau (G-L) type predictions. The SPT in
SrTiO, occurs as a result of the softening of a particular zone edge lattice vibration, the tilting of the titanium-oxygen octahedra around the
(10 0), (0 10) or (0 0 1) axes. As the frequency
of this phonon decreases to zero, these octahed- ra develop a static displacement, reducing the crystal’s symmetry to tetragonal and doubling the size of the unit cell. Because of the three-fold degeneracy of this octahedral tilt (rotation about X, y or z) the material also twins as it goes
through the SPT, making RUS measurements difficult in the low-temperature phase.
Theoretically, this transition is well under- stood. The soft-mode description coupled with a G-L free energy enables accurate quantitative predictions to be made for the elastic response of the material through the transition. Rather than work with the complete expression for the free energy including all possible strains and the full three-component order parameter, discussed in
detail elsewhere [39], we will focus here on a qualitative understanding by considering a
Table 2
Room temperature elastic moduli (all values are in units of
10” dyne/cm*) of SrTiO, determined by RUS as well as by
conventional ultrasonic techniques. The percentages after our
data are the error estimates for the individual moduli, de-
termined as discussed above.
c-11 c1z c41 Source
3.17 1 .O2 1.23 Ref. [40] 3.31 1 .O5 1.26 Ref. [41] 3.15 (0.2%) 1.02 (0.7%) 1.22 (0.01%) This work
single-strain and one-component order parame- ter. This is more than casually justified because if one knows which way the octahedra tilt, then use of a single-component order parameter causes no loss of generality. Because in an unstrained sin- gle crystal the order parameter does develop in a single direction, one certainly knows its direction after the fact. It is only important that one is careful with the group theory. That is, the full
symmetry and number of required components of the order parameter are use to determine what terms must be included in a single-order-
parameter description. Thus an accurate single- component-order-parameter free energy can be written
(39)
where F is the strain, 9 the order parameter and (Y, p, y and c~, temperature-independent con-
stants. The first term in eq. (39) represents the usual elastic energy. the second and third an expansion in the order parameter. and the last term the strain-order parameter coupling. Be- cause the order parameter in this transition is a tilt in a mirror plane, only even powers appear (positive or negative tilts are equivalent energeti- cally). Given such a free energy, the change in elastic moduli can be calculated by minimizing eq. (39) with respect to strain (441. Such a minimization gives
c = c,, 3 T>T,. (40)
c=c,,-y’l2& TCT,. (41)
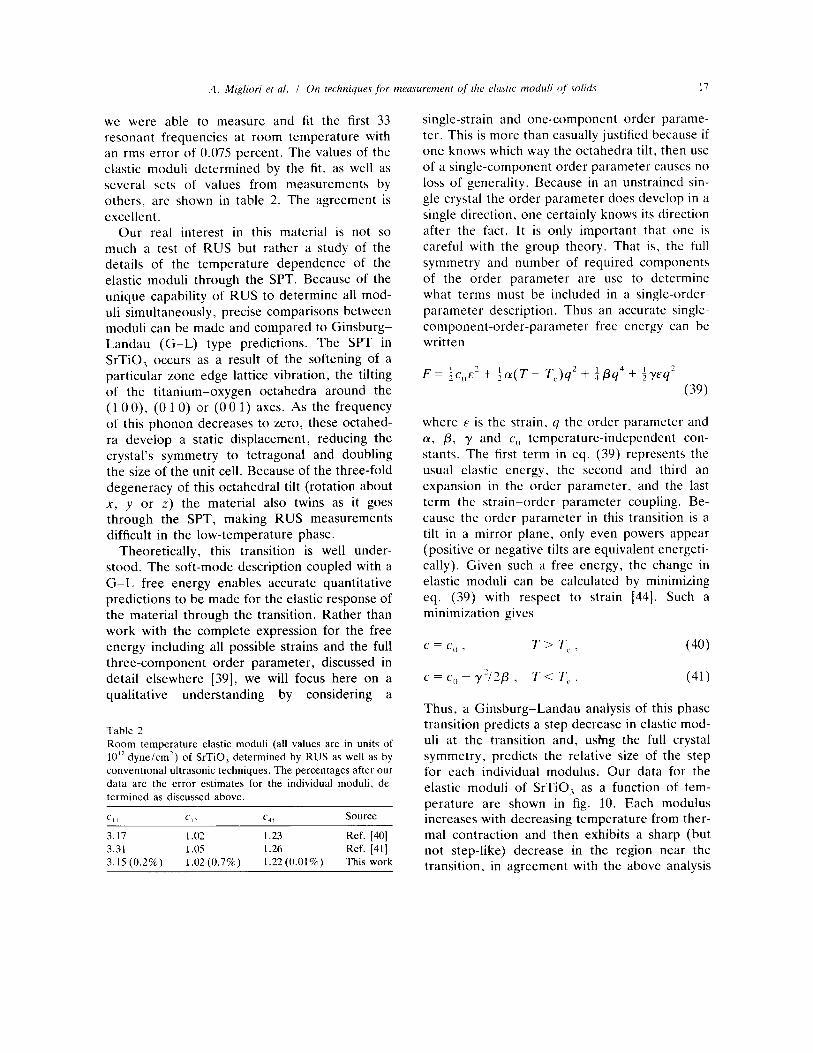
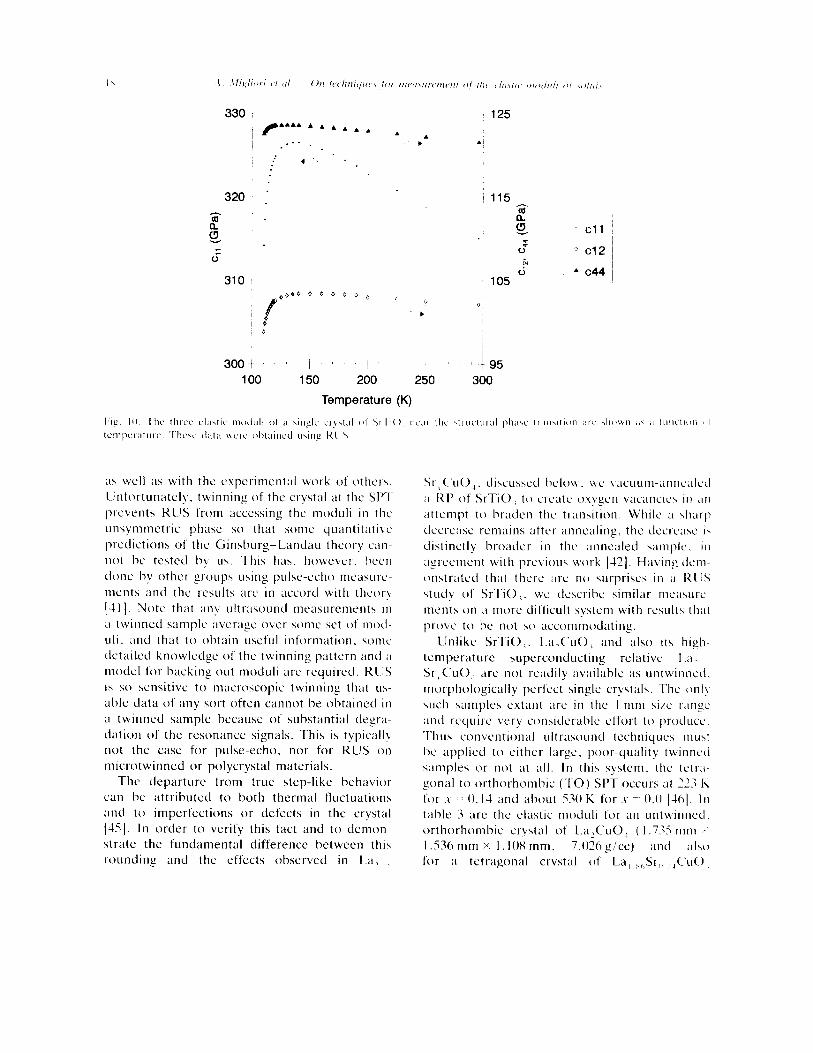
Thus, a Ginsburg-Landau analysis of this phase transition predicts a step decrease in elastic mod- uli at the transition and, us?ng the full crystal symmetry, predicts the relative size of the step for each individual modulus. Our data for the elastic moduli of SrTiO, as a function of tem- perature are shown in fig. 10. Each modulus increases with decreasing temperature from ther- mal contraction and then exhibits a sharp (but not step-like) decrease in the region near the transition, in agreement with the above analysis
is
300$,,,j,“, , 1/t i 95
100 150 200 250 300
Temperature (K)
~1s well ;IS with the experimental work of otherx.
IJnfortunateIy. twinning of the crystal at the SP’I prcvcnta KUS from accessing the moduli in the
unsymmetric phase so that some quantitative
predictions of the Ginsburg-Landau theory can-
not be tested bv u\. Thi\ has. however. been
done bv other groups using pulse-echo mcasurc-
ments and the results arc in accord with theor! 131 1. Note that an\; ultr:tsound messurementx in
;I l\vinned s:lmple average over some set of mod- uli. and that to ohtnin useful information. 4onic detailed knowledge of the twinning pattern and ;I model for hacking out moduli are required. KIIS
is 40 xensitivc to macroscopic twinning that us-
able data of :rny sort often cannot be obtained in
2 twinned sample because of substantial degra-
dation of the resonance signals. This is typically
not the case for pulse-echo. nor for RUS on
microtwinned or polycrystal materials.
The departure from true step-like behavior can he attributed to both thermal Huctuations
and to imperfections or defects in the crystal
[AS]. In order to verify this fact and to demon-
\trate the fundamental difference between this
r-ounding and the effects observed in La, ,
Sr< C‘uO,. discusxxi belo\+ . we viicLlum-11IiIi~~il~~i
2 KP of SrTiO i to crc‘:itc oxygen vxxncIc4 in an attempt to braden the transition. While ;I sharp
clccrcase Ircmaina after annealing, the decrease i\
distinctly broader in the :mneAed s~iniple. III agrecmcnt with previous work [42]. Having den-
onstratcd that there arc no surprises 111 ;I RilS
study of SrTiO I1 M’C clcscribc similar nIc’:isurc-
ments on a mot-c difficult svstc‘m with roults th:it
prove to be not \o ~iccommodatin_.
Unlike SrTiO :. l.a,c’uO, and also its high- temperature superconducting relative IA.
SrIC‘~~O, arc not readilv available as untwinncd.
morphologicallv pcrfcct Gngle crystals. ‘T‘hc onI\
4uch xnmples extant ;trc in the I mm \iye rrangc xicl require verv considerable effort to product.
Thus convcntio&ll ultrasound techniques mu\1 bc applied to either large. poor-quality twinned
\:tmples or not at all. In this system. the tetra-
gonal to orthorhombic (TO) SPT occurs at 171 li
for .I - 0.14 and about 530 I( for .\- = 0.0 [-NJ]. In table 3 arc the elastic moduli for an untwinnecl.
orthorhomhic crvstal of I.a,C’uO, ( I .775 mm I.536 mm X I. lOX mm. 7.076 g/cc) and also for ii tctragonal crystal of La, ,$,,SI-,, , ,C‘uO ,
A. MiC$iori et ul. I On techniques for meusttrement of the elostic morluli of so1iti.c I’)
Table 3
The full elastic moduli of La, ,Sr,, II CuO, and LaZCuO, in units of IO” dyne/cm’ determined using RUS. The first entry for
La, Xh Sr,, ,,CuO, is for the usual tetragonal basis. The second entry is simply the first one rotated by 45” such that a direct
comparison to the orthorhombic stoichiometric compound can be made. The errors are about I .30/c for c,, , i = I. 3. 0.05% for c,, . i = 4. 6. and 3.1% for the off-diagonal moduli for La,CuO,. The corresponding error estimates for La, nhSr,, ,,CuO, are 0.25%.
0.01 o/o and I .O% respectively.
Cl1 (‘21 C37 c21 (‘I, (‘12 (‘41 CT, (‘66
La, &, ,,CuO, 2.666 _ 2.571 _ 0.992 0.649 0.677 0.587 La, xoSrI, ,,CuO, 2.245 _ 2.571 _ 0.992 I.071 0.677 I .oo’) La2Cu0, 1.747 1.730 2.662 0.091 0.928 O.YOO 0.653 0.66Y O.YY2
(2.470 mm X 2.267 mm X 2.192 mm, 6.946 g/cc) determined using RUS. The LazCuO, crystal was grown by Canfield, Fisk and Kodali from a flux [47]. The Sr doped crystal was produced by Tanaka and Kojima using a travelling solvent/ floating zone system [48]. We note that the axes of the La,CuO, sample were not aligned with the crystallographic axes. Thus the fitting proce- dure had to determine not only the moduli and dimensions but also the crystal orientation. This takes far more computer time because the mat- rices to be inverted are no longer block diagonal. Nevertheless, the errors for the determination of moduli and angles are low because over 35 reso- nances were used in the fit.
We review here the microscopic deformations at the SPT in the La,CuO, compounds, the Ginsburg-Landau Hamiltonian, and the expec- ted effects on the sound velocities. Using RUS measurements on LaZ_,Sr,CuO, and a com- parison with SrTiO,, we present direct evidence
for breakdown of tetragonal symmetry at the Brillouin zone center, show how this can explain
the very strong temperature dependence of chh above the TO SPT, and discuss some implica- tions.
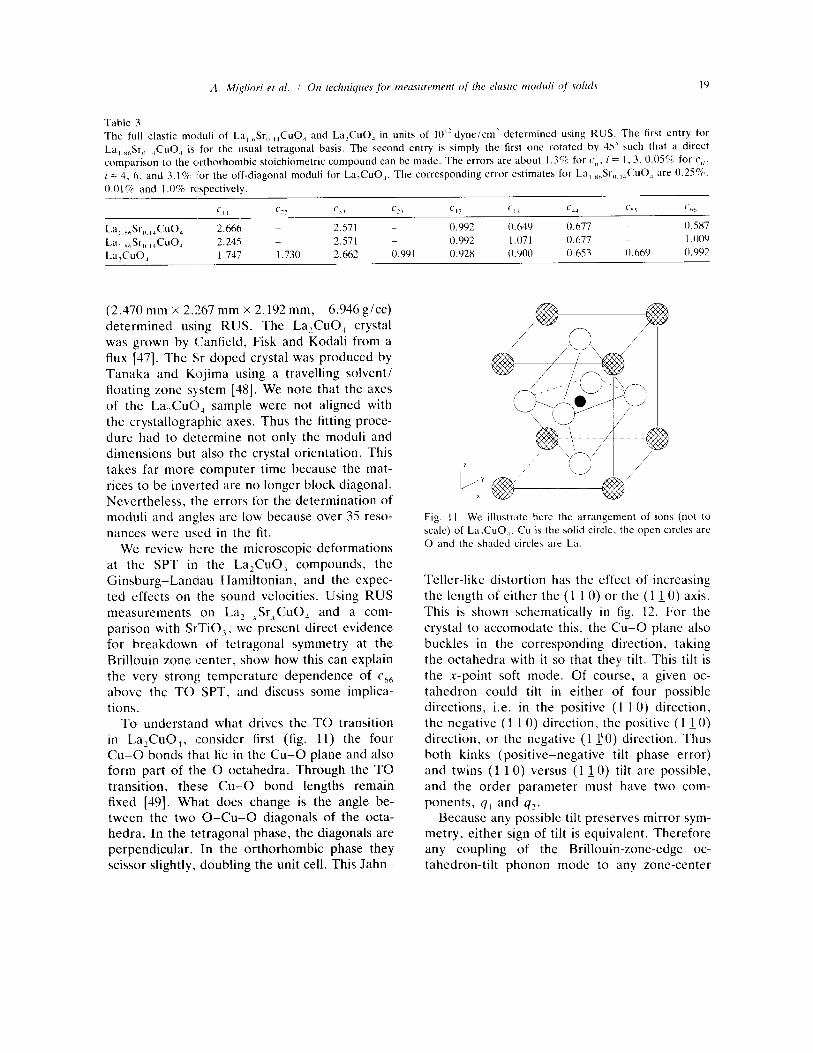
To understand what drives the TO transition in La,CuO,, consider first (fig. 11) the four Cu-0 bonds that lie in the Cu-0 plane and also form part of the 0 octahedra. Through the TO transition, these Cu-0 bond lengths remain fixed [49]. What does change is the angle be- tween the two 0-Cu-0 diagonals of the octa- hedra. In the tetragonal phase, the diagonals are perpendicular. In the orthorhombic phase they scissor slightly, doubling the unit cell. This Jahn-
Fig. I I, We illustrate here the arrangement of ions (not to
scale) of La,CuO,. c‘u is the solid circle. the open circles are
0 and the shaded circles are La.
Teller-like distortion has the effect of increasing the length of either the (1 1 0) or the (1 IO) axis. This is shown schematically in fig. 12. For the crystal to accomodatc this, the Cu-0 plane also buckles in the corresponding direction, taking the octahedra with it so that they tilt. This tilt is the x-point soft mode. Of course, a given oc- tahedron could tilt in either of four possible directions, i.e. in the positive (I 10) direction, the negative (1 1 0) direction. the positive (1 10) direction, or the negative (1 10) direction. Thus both kinks (positive-negative tilt phase error) and twins (1 1 0) versus (1 IO) tilt are possible, and the order parameter must have two com- ponents, q, and q?.
Because any possible tilt preserves mirror sym- metry, either sign of tilt is equivalent. Therefore any coupling of the Brillouin-zone-edge oc- tahedron-tilt phonon mode to any zone-center
*
I,lg. 12 Shown IS a diagram showing the 0 atom\ 1n the
(‘II+O plane (solid circles) and the 0 atoms at the apace\ 01
the 0 octahedra (shadrd circle\) projected onto the (‘~0
plane. I‘he c’u atoms arc directly beneath the undisplaced 0
atom\ and arc not ahown. IJpon tramition to the orthcr-
rhombic slate. the apical C) atoms displace as shown hv the
arrows (a twin would have displacement\ in the (‘u-0 plant
perpendicular to those shown. i.e. turn the figure on it\ xltle).
The tctragonal unit cell is the smaller dashed quay-c. Ihe
orthorhombic one i\ the larger dashed square. although It I\
really a rectangle with the longer G&s parallel to the arrow\
acoustic phonons must hc quadratic in lowest
order. Moreover. most of the effects of the phase transition are seen in c’,,,,. the shear mocl- ulus for deformations of the Cu-0 plane. This is
also easily WCII hccausc when the O&t ‘WC) diagonals scissor. the xqual-e base of the tetrz gonal unit cell becomes a rhombus in the ortho- rhombic phase (fig. II). Deforming the quurc into a rhombus is exactly equivalent to a ( ,,, shear. WC have, as vet. IIO measurements above
the TO transition in. La.C’uO, because our K1JS ccl I cannot handle such temperatures. However. in La, s,Sr,, , , (‘~0, the TO transition occurs at
713 K. ;I very convenient temperature.
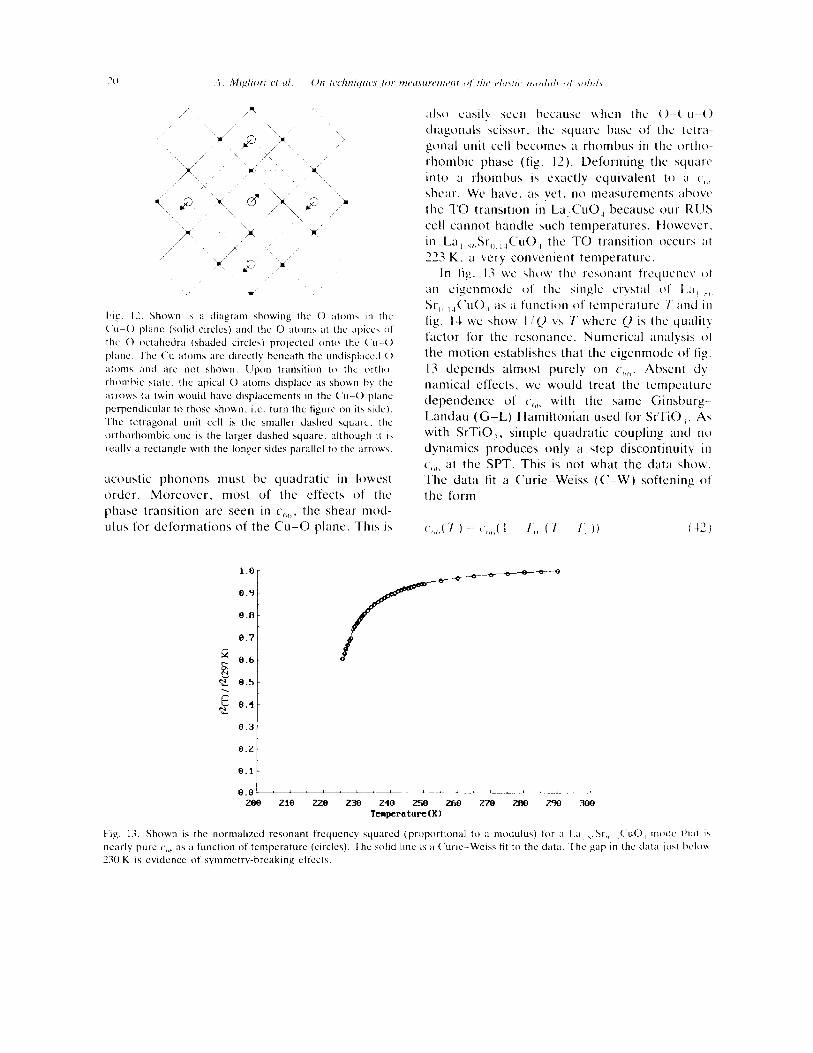
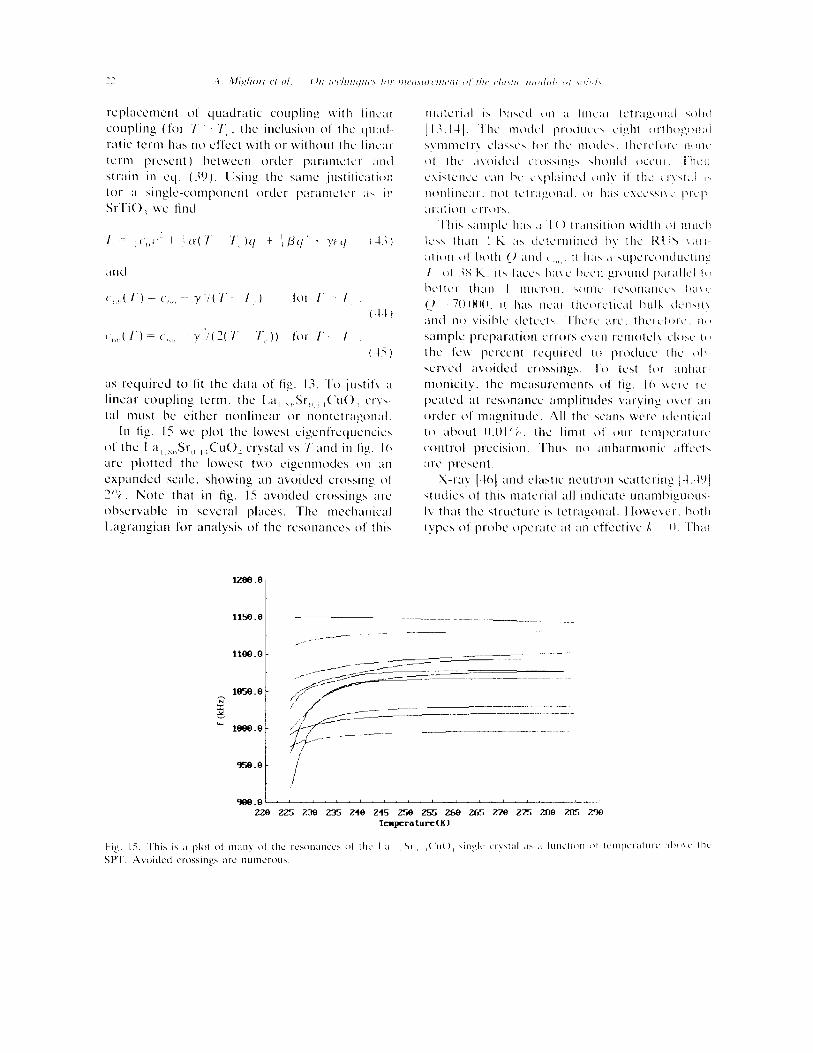
In lig. 13 \h#c how the Irewnant frquenc\ IIt
211 cigenmode 01’ the \ingle crvstal ot La, ,,,
St- ,, ,,C’i10, ;IS ;I function of tcmpe;ature 7‘ and iii
lig. IJ WC shob 1 iv ~4 ‘I‘ where Q is the qualit! factor for the resonance. Numerical analysis ot the motion establishes that the eigenmode of tig. I3 cicpends almost purely on c,,,,. Absent dy- namical effects, WC would treat the tempeature dependence of c’(,,, with the same Ginsburg-
Landau (G-L) Hamiltonian used for SrTiO,. A\ with SrTiO,, simple quadratic coupling arid no
dynamics produces only a step discontinuity in
(1,1<1 at the SPT. This is not what the data show. The data fit a Curie-Weiss (C-W) softening 01 the form
Fig. 13. Shown is the normalized resonant trequency squad (proportional to a modulu\) for :i I .;L, ,,,Sr,, ,,C‘uO, mode that i\
nwrly pure c,>,, as a function of temperature (circles). The \,olid lint IS a <‘uric-W&\ fit to the datx The gap in the data just helo\%
30 K is evidence of hymmetryhreaking effect\.
A. Migliori et al I
e.7-
8.6 -
8.5 -
0 2
e.‘L-
0 2 8.3.
6.2 -
e.1-
On techniques for measurement of the elastic moduli of solids 2
Y
x
x
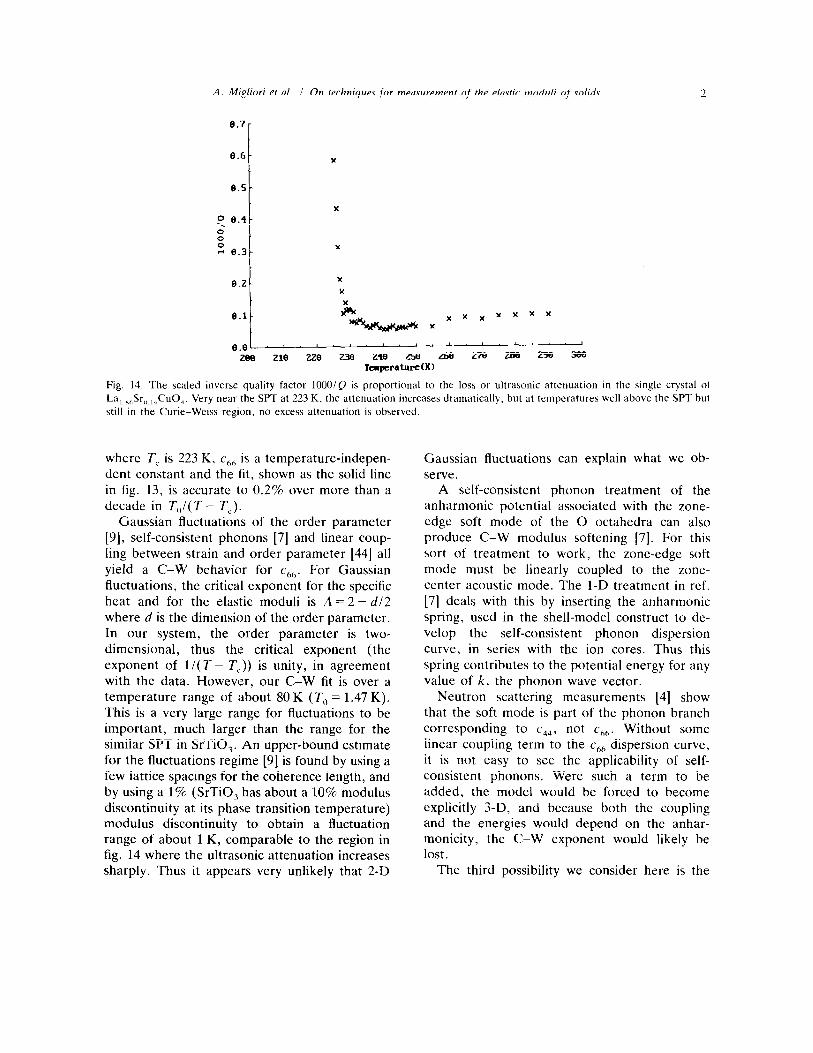
Fig. 14. The scaled inverse quality factor lOOO/ Q is proportional to the loss or ultrasonic attenuation in the single crystal 01
La, Kf,SrO ,JCuO,. Very near the SPT at 223 K. the attenuation increases dramatically. but at temperatures well above the SPT but
still in the Curie-Weiss region, no excess attenuation is observed.
where T, is 223 K, ch6 is a temperature-indepen- dent constant and the fit, shown as the solid line in fig. 13, is accurate to 0.2% over more than a decade in T,,/( T - Tc).
Gaussian fluctuations of the order parameter [9], self-consistent phonons [7] and linear coup- ling between strain and order parameter [44] all
yield a C-W behavior for chh. For Gaussian fluctuations, the critical exponent for the specific heat and for the elastic moduli is A = 2 - d/2 where d is the dimension of the order parameter. In our system, the order parameter is two-
dimensional, thus the critical exponent (the exponent of l/( T - T,)) is unity, in agreement with the data. However, our C-W fit is over a temperature range of about 80 K (To = 1.47 K). This is a very large range for fluctuations to be important, much larger than the range for the similar SPT in SrTiO,. An upper-bound estimate for the fluctuations regime [9] is found by using a few lattice spacings for the coherence length, and by using a 1% (SrTiO, has about a 10% modulus discontinuity at its phase transition temperature) modulus discontinuity to obtain a fluctuation range of about 1 K, comparable to the region in fig. 14 where the ultrasonic attenuation increases sharply. Thus it appears very unlikely that 2-D
Gaussian fluctuations can explain what we ob-
serve. A self-consistent phonon treatment of the
anharmonic potential associated with the zone- edge soft mode of the 0 octahedra can also produce C-W modulus softening [7]. For this sort of treatment to work, the zone-edge soft mode must be linearly coupled to the zone- center acoustic mode. The 1-D treatment in ref. [7] deals with this by inserting the anharmonic
spring, used in the shell-model construct to de- velop the self-consistent phonon dispersion curve, in series with the ion cores. Thus this spring contributes to the potential energy for any value of k, the phonon wave vector.
Neutron scattering measurements [4] show that the soft mode is part of the phonon branch corresponding to cqJ, not chh. Without some linear coupling term to the chh dispersion curve, it is not easy to see the applicability of self- consistent phonons. Were such a term to be added, the model would be forced to become explicitly 3-D, and because both the coupling and the energies would depend on the anhar- monicity, the C-W exponent would likely be lost.
The third possibility we consider here is the
11Qo.e-
23 A. Mtgliori et al. I On techniques for measurement of the elastic moduli of solids
718.8 - *
*
630.0 - * *
t *
* 670.6 - *
* 00 -
658.8 -O 0 0 0 0
0 oOOoOo 0 0
0
3 *
5
*
v 639.9- * LM
*
* 593.6 -*
57e.e j 8 ’ a ’ 8 I ’ 8 ’ a ’ z?s 226 227 228 229 238 231 232 233 234 235
Teapcraturc(K)
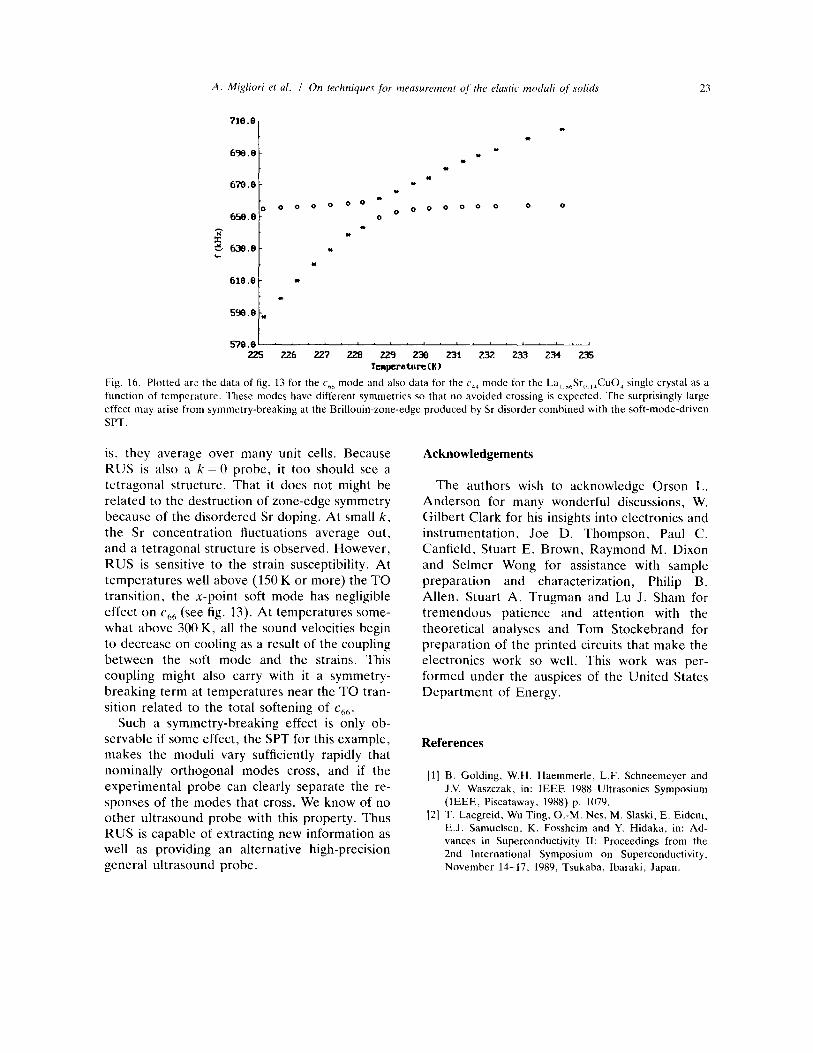
Fig. 16. Plotted are the data of fig. 13 for the chh mode and also data for the c,? mode for the La , xoSr,1 ,,CuO, single crystal as a
function of temperature. These modes have different symmetries so that no avoided crossing is expected. The surprisingly large
effect may arise from symmetry-breaking at the Brillouin-zone-edge produced by Sr disorder combined with the soft-mode-driven
SPT.
is, they average over many unit cells. Because RUS is also a k = 0 probe, it too should see a tetragonal structure. That it does not might be related to the destruction of zone-edge symmetry because of the disordered Sr doping. At small k.
the Sr concentration fluctuations average out, and a tetragonal structure is observed. However, RUS is sensitive to the strain susceptibility. At temperatures well above (150 K or more) the TO transition, the x-point soft mode has negligible effect on cIlh (see fig. 13). At temperatures some-
what above 300 K, all the sound velocities begin to decrease on cooling as a result of the coupling between the soft mode and the strains. This coupling might also carry with it a symmetry- breaking term at temperatures near the TO tran- sition related to the total softening of cbh.
Such a symmetry-breaking effect is only ob- servable if some effect, the SPT for this example, makes the moduli vary sufficiently rapidly that nominally orthogonal modes cross, and if the experimental probe can clearly separate the re- sponses of the modes that cross. We know of no other ultrasound probe with this property. Thus RUS is capable of extracting new information as well as providing an alternative high-precision general ultrasound probe.
Acknowledgements
The authors wish to acknowledge Orson L. Anderson for many wonderful discussions, W. Gilbert Clark for his insights into electronics and instrumentation, Joe D. Thompson, Paul C. Canfield, Stuart E. Brown, Raymond M. Dixon and Selmer Wong for assistance with sample preparation and characterization, Philip B. Allen, Stuart A. Trugman and Lu J. Sham for tremendous patience and attention with the theoretical analyses and Tom Stockebrand for preparation of the printed circuits that make the electronics work so well. This work was per- formed under the auspices of the United States Department of Energy.
References
[l] B. Gelding, W.H. Haemmerle, L.F. Schneemeyer and
J.V. Waszczak, in: IEEE 1988 Ultrasonics Symposium
(IEEE, Piscataway, 1988) p. 1079.
[2] T. Laegreid, Wu Ting, O.-M. Nes. M. Slaski, E. Eidem,
E.J. Samuelsen. K. Fossheim and Y. Hidaka, in: Ad- vances in Superconductivity II: Proceedings from the
2nd International Symposium on Superconductivity,
November 14-17, 1989, Tsukaba, Ibaraki, Japan.
I.31 P. Baumgart. S. Blumcnrodcr. A. Eric, H. Hillchr;indh.
(i. Gunthcrodt and H. Schmidt. Solid State (‘ommurl.
f+J ( I WI) I 13.5, 111 I’. Boni. J.D. Axe. <i. Shiranc. K.J. Birgcncau. l1.H.
(;nhhc. H.P. Jcnsscn. M.A. Knstncr. (‘.J. Pctcrs. I’..1
Piconc and T.K. Thurston. Phyx. Kcv. B 3X ( IW8) ISi
151 I.V. Aleksandrov. A.K. (ioncharov and S.M. Sti\htn.
JETI Lctt. 47 (IYXX) 42X.
lh] K. Kawasaki ant1 A. Ikuhhima. t’h>\. Kc\. B I I 1’171))
311.3.
17) A. Bussmann-Holder. A. Migliori. %. Fisk. J.I.. Surrao.
K.G. Lcisurc and S.-W. Champ. Phcs. Kcv. I.CII. h- (1YYl) 51’.
181 l..D. L,;mdau and E.M. Lifshitz, Statisticnl Physrcs. I’:II~
I (Pcrpamon Press. Oxford. IYXO: 3rd cd.).
1Yl S.K. Mu. Modern Theory of Critical Phcnomcna (H~II-
jamin-Cummings, Kcading. MA. IY7h).
I ltll K. Holland. J. Acoust. Sot. Am. 43 ( 106X) YXX.
II II H.H. Dcmarcst. J. Acoust. SW. Am. 10 (1971) 708.
1121 <).I.. Anderson, E. Schrcihcr and N. Saga. Elastic
Constants and Their Mcasurcmrnts (McGraw-Hill, NW
York. lV73).
1131 I. Ohno. J. Phys. Earth 24 (1976) 355.
II-II William M. Visscher. A. Migliori. T.M. Hell and K.A
Rcincrt. J. Acoust. Sot. Am. YtN) (1991) 2154.
1151 I. Ohno. Phys. Chum. Minerals 17 (IYYO) 371.
I Ihl t1. Oda. 0.1.. Anderson and Isno Suzuki. in: Proceed-
ings of the 2Xth Annual Technical Meeting of the Sonic-
IV of Engineering Sciences. Novcmhcr h-X. IWI.
(iainesville. FL.
1171 B.T. Smith. J.M. Boyle. J.J. Dongarra. B.S. (iarhon.
Y. Ikchc. V.C. Klema ;tnd C.B. Mob. in: Matrix
Eigensystem Routines - EISPACK Ciuidc. Lccturc
Notes in Computer Science No. 6. cdx. G. Goes and J
Hartmanis (Springer. New York. lY7h): B.S. Grhow
J.M. Boyle. J.J. Dongarrd and C.B. Molcr. in: Matrix
Eigensystcm Routines -- EISPACK Guide Extension.
Lecture Notes in Computer Science No. 51. cds. (i. Goes and J. Hartmanis (Springer. New York. IY77).
11x1 W.H. Press. B.P. Lanncry. S.A. Teukolsky and W.I‘.
Vettcrling. Numerical Recipes (Cambridge Ilniversit!
Press. IYXh).
IlYl Crystal Bond; Arcmco Products Inc.. P.O. Box 43.
Ossining. NY IOSh2.
(20] Optical Fiher ‘fcchnologics. Z Lyhcrty Way. Wcstfortl.
MA OIXXh.
121 I ki. Mochizuki. _I. Phys. Earth 35 ( 19X7) I5Y.
1221 W.I.. Johnson. S.J. Norton. F. Bcncdcc and R. PIah. J.
Acoust. Sot. Am. YI (1992) 2637.
1231 J.D. Maynard. J. Acoust. Sot. Am. Yl (lYY2) 175-l.
[%I A. Stekcl, J.L. Sarrao. T.M. Bell. Ming Lci. K.(i
I.&sure. William M. Visscher and A. Migliori. .I
Acoust. Sot. Am. 92 (1992) 66.3.
[.Ul Mini-(‘ircuits. P.O. 1)1)x 35ltlhh. Brooklyn. h‘\l’ 112.35
INU~3.
I.%)( AFltIO liniversal Active Filter. National Scm~c~mtluct~~~
C‘orp.. _ ‘9011 Semiconductor I)r.. f’.O. Box 5XllYtl. S:I~;I
(‘lara. (‘A Y505?,--XtIYO.
I.371 Analogic C‘orp.. 3htl Audohon Kd.. Wakclicld. MA
OIXXO.
l.;Xl W. (‘ochran. Ad\. Phys. ‘I ( IYtil) 3X7: P.W. Andcrsoli.
in: Fizik;l Dielcktrov. cd. (;.I Sknavi (AN SSSK. MI)<
L’ll\%, IYhtl) p. I!YO.
IiY] J.(‘. Slonczcwski and t 1. Thomas. Phyh. Kcv. 1% I I lU711)
35YO.
I4tll K.O. Bell and (i. Kupprccht. Phys. Rev. 13’) 1 lYh3) 00. I-II) B. I.uthi and T.J. Moran. Phys. Rev. B 2 (lY711) 121 I.
1411 D. Baucrlc and W. Kchwald. Solid State C’ommun. ‘7
( lY7X) 1343.
1131 Sample supplied 17~ 1.1). Kaistrick. Los Alamo\ National
l.;lhoratory.
IUl W. Kchwald. Adv. Phys. 22 ( 1’17.1) 771,
I-151 A.P. Lcvanyuk and A.S. Sigov, Dcfccts and Structural
Phase Transitions ((Gordon and Breach. New York.
I ‘JXO ) IJhl K.M. Fleming. B. Hatlogg. K.J. <‘WI and t..;\ KICK-
Illiln. Phys. Rev. B 35 (lYX7) 71Yl.
1471 S.-W. Champ. J.D. Thompson and Z. Fisk. Physica t’ 15x (IYXY) IO’).
l-IX1 I. Tanaka and H. Kojima. Nnturc 3.37 (IYXY) 21.
IJlI K.J. Cava. A. Santoro. D.W. Johnson Jr. and W.W.
Rhodcs. Phys. Kc\. B 3.5 ( IYX7) h71h.
Copyright © 2022 FDOKUMEN