Research Reports 1998 - WUR eDepot
44
Research Reports 1998 Research Institute for Pig Husbandry Adress P.O. Box 83 5240 AB Rosmalen The Netherlands Phone + 31 73 52 86 555 Fax + 31 73 52 18 214 P 5.10 June 1999 ISSN 1385 - 5883
-
Upload
khangminh22 -
Category
Documents
-
view
1 -
download
0
Transcript of Research Reports 1998 - WUR eDepot

Research Reports1998
Research Institute for Pig Husbandry
AdressP.O. Box 835240 AB RosmalenThe NetherlandsPhone + 31 73 52 86 555Fax + 31 73 52 18 214
P 5.10June 1999ISSN 1385 - 5883

PREFACE
At the Research Institute for Pig Husbandry,an organization with 6.5 employees, appliedresearch has been carried out in order tofind practica1 solutions for actual and futureproblems and to stimulate desirable deve-lopments in pig husbandry. In total 1200sows and 3000 growing-finishing pigs atthree experimental farms at Raalte, Rosma-len and Sterksel are available. The experi-ments are often multidisciplinary in naturebut also disciplinary practica1 aspects of pigfarming are investigated. This means thatdifferent aspects of pig production are understudy. The experiments are financed by theMinistry of Agriculture, Nature Managementand Fisheries, Product Boards, farmersorganizations and private companies. Theresults are published in reports and articles.This report gives a review of the data publish-ed in 1998.In 1998 the pig industry had to cape withlow prices and increasing obstruction infarm management by regulations on farmsize, manure disposal and animal welfare.Consumers and retailers increasingly in-fluence the way of production. All thesedevelopments have influenced our researchprogramme. The main topics in 1998 were:1. Economics
Main activities are the annual collection oftechnical and economie data from privatefarms and to compare these results withother European countries. Cost calcula-tion of new farm buildings are published.
0 1999, Research Institute for Pig Husbandry, Rosmalen
NO part of this report
from the publisher.
may be reproduced in any form, by print, photoprint, microfilm or any other means without written permission
These costs are affected by all new rulesconcerning welfare and environment.Health and qualityGood animal health care must be the firstguarantee for safe quality products.More publications are available for goodfarming .EnvironmentMost research aims a lowering ammoniaemission from pig barns. But there is alsoa publication on possibilities of reducingthe volume of slurry by using solar energyfor evaporation.Climate, housing and welfareWelfare of pigs is defined mainly by penand floor design and the inside environ-ment.FeedingProducts from the food processing indus-try are popular as pig feed on the largerfarms. These rest products reduce feed-ing costs. Wheat and barley can have thesame effect.
If you have any question or remark related tothe articles please do not hesitate to contactthe author by phone, fax or e-mail:phone: + 31 73 528 6555fax: + 31 73 521 8214e-mail: [email protected]
Jan A.M. Voermans,directer
PREFACE 2

CONTENTS
ECONOMICSTechnical and economical performance figures of farms with sows in 1996Technical and economical performance figures of farms with fattening pigs in 1996Situation and possible measures on pig farms in Deurne and Ysselsteyn in theareas of health, welfare and environmentInvestment costs of standard pig houses in 1996Testing breeding products of growing-finishing pigs using observational dataA comparison between pig farming in the European Union and North America
HEALTH AND QUALITYHealth management on sow farmsRinsing facilities to clean live stock trucks on pig farmsMethods for fly-control in pig housesCleaning of rooms for pigs after soaking with foam or water; costs and qualityEffects of two types of farrowing pens for “free range” pigs and frequency ofmucking out on performance, labour and ammonia emission
ENVIRONMENTAmmonia emission in farrowing rooms with manure traysHousing large groups of weaned piglets in Iow emission systemsEvaporation of water from slurry using solar-energyAmmonia emission in a room for weaned piglets with a sloped pit wal1
CLIMATE, HOUSING AND WELFAREEnergy usage and lactating sow and piglet performance in farrowing compart-ments with a lowered set point of the room temperatureTechnical functioning of the Air Pathogen Free (APF)-facility: air treatment andhygiene measuresPen type and welfare of A.I.-boars
FEEDINGFeeding liquid feed from Vario-Mix or using a long trough to growing-finishing pigsThe use of liquid by-products. A reviewFermentation of liquid diets and by-products during storageFeeding 50% of wheat and barley to growing and finishing pigs: seperately or incompound feedInfluence of benzoic acid in the diet on performance and urine pH of growing-finishing pigs
PUBLISHED RESEARCH REPORTS IN ENGLISH
445
6111314
1616192023
25
2828303132
33
33
3436
38383940
42
43
44

TECHNICAL AND
OF FARMS WITH
ECONOMICAL PERFORMANCE FIGURES
SOWS IN 1996
ir. C.E.P van Brakel, ing. J. Lubben? ing. PA.M. Bens2
In 1996 the mean gross margin per sowper year reached a record of Dfl. 1,222.-.This is about Dfl. 400.- per sow per yearmore than was expected by the calculatedadvanced six-years mean. The gross mar-gin ranged from Dfl. 1,088.- on smal1 farmsto Dfl. 1,336.- per sow per year on largefarms. In 1995 the mean gross margin wasDfl. 782.- per sow per year. The abovementioned gross margins are based on thefollowing technical and economical perfor-mance figures:- In 1996 the sales prices of piglets weigh-
ing 23 kg were Dfl. 112.-. This is nearlyDfl. 25 higher than in 1995. In 1996farms with an average of less than 100sows achieved a price of Dfl. 109.- perpiglet. Large farms with an average ofmore than 218 sows realised a meancorrected piglet price of Dfl. 115.- perpiglet.
- The number of weaned piglets per sowper year was 21.5 in 1996 with a rangefrom 20.9 to 22.0 piglets per sow peryear for smaller and larger farms respec-tively. In 1995 the mean number ofweaned piglets per sow per year was21.3. This is 0.2 weaned piglet per sowper year less than in 1996.
- Compared to 1995, the sow feed price in1996 was Dfl. 2.85 per 100 kg higher. Inthe same period the piglet feed pricedecreased by Dfl. 1.81 per 100 kg. Smal1farms with a mean of 75 sows per yearpaid 3 cents per 100 kg more for sowfeed and Dfl. 1.42 per 100 kg less forpiglet feed. However, the larger farms
with an average of 302 sows paid 18cents per 100 kg less for sow feed andDfl. 1.41 per 100 kg more for piglet feedper year.In 1996 the costs for health care wereDfl. 82.- per sow per year. Compared to1995 these health care costs had de-creased by Dfl. 8.- per sow per year in1996. On smal1 farms the costs of animalhealth are less than those on large farms,Dfl. 79.- and Dfl. 87.- per sow per yearrespectively.
Differences between regions are stil1 largefor performance figures like feed prices,piglet prices, costs of herd books and arti-ficial insemination. The piglet productionper sow per year does not differ muchcompared to previous years. In 1995 thedifferences in feed intake for sows weresmal1 between regions. However, in 1996these differences became larger.The regional differences in mineral balanceand mineral production are marginal. In1996 the mean phosphate production persow per year increased from 0.2 kg to 14.2kg as a result of the increased feed intakeper sow per year. As in previous years,there are large differences between farmswith regard to the phosphate productionper sow per year. Just as on fatteningfarms, a lower mean phosphate productionper sow per year seems to be accompa-nied by a higher gross margin per sow peryear. n
Report Pl. 197
1 Siva-software B.V., Wageningen2 The Agricultural Extension Service, Boxtel
ECONOMICS 4
TECHNICAL AND ECONOMICAL PERFORMANCE FIGURES
OF FARMS WITH FATTENING PIGS IN 1996
ir: C.E.P van Brakel, ing. J. LubbenT, ing. PA.M. Be&
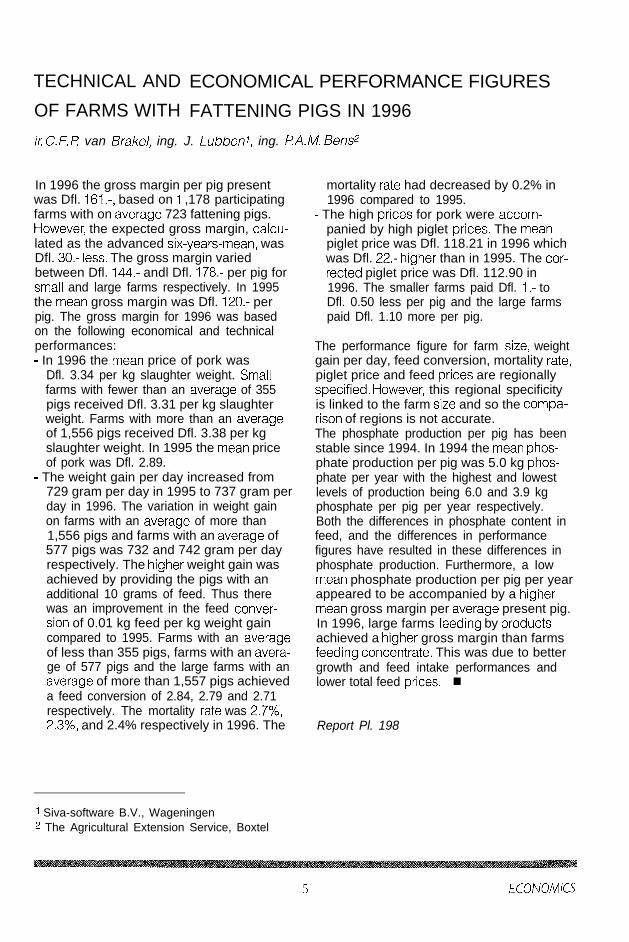
In 1996 the gross margin per pig presentwas Dfl. 161.-, based on 1 ,178 participatingfarms with on average 723 fattening pigs.However, the expected gross margin, calcu-lated as the advanced six-years-mean, wasDfl. 30.- less. The gross margin variedbetween Dfl. 144.- andl Dfl. 178.- per pig forsmal1 and large farms respectively. In 1995the mean gross margin was Dfl. 120.- perpig. The gross margin for 1996 was basedon the following economical and technicalperformances:- In 1996 the mean price of pork was
Dfl. 3.34 per kg slaughter weight. Smal1farms with fewer than an average of 355pigs received Dfl. 3.31 per kg slaughterweight. Farms with more than an averageof 1,556 pigs received Dfl. 3.38 per kgslaughter weight. In 1995 the mean priceof pork was Dfl. 2.89.
- The weight gain per day increased from729 gram per day in 1995 to 737 gram perday in 1996. The variation in weight gainon farms with an average of more than1,556 pigs and farms with an average of577 pigs was 732 and 742 gram per dayrespectively. The higher weight gain wasachieved by providing the pigs with anadditional 10 grams of feed. Thus therewas an improvement in the feed conver-sion of 0.01 kg feed per kg weight gaincompared to 1995. Farms with an averageof less than 355 pigs, farms with an avera-ge of 577 pigs and the large farms with anaverage of more than 1,557 pigs achieveda feed conversion of 2.84, 2.79 and 2.71respectively. The mortality rate was 2.7%,2.3%, and 2.4% respectively in 1996. The
mortality rate had decreased by 0.2% in1996 compared to 1995.
- The high prices for pork were accom-panied by high piglet prices. The meanpiglet price was Dfl. 118.21 in 1996 whichwas Dfl. 22.- higher than in 1995. The cor-rected piglet price was Dfl. 112.90 in1996. The smaller farms paid Dfl. l.- toDfl. 0.50 less per pig and the large farmspaid Dfl. 1.10 more per pig.
The performance figure for farm size, weightgain per day, feed conversion, mortality rate,piglet price and feed prices are regionallyspecified. However, this regional specificityis linked to the farm size and so the compa-rison of regions is not accurate.The phosphate production per pig has beenstable since 1994. In 1994 the mean phos-phate production per pig was 5.0 kg phos-phate per year with the highest and lowestlevels of production being 6.0 and 3.9 kgphosphate per pig per year respectively.Both the differences in phosphate content infeed, and the differences in performancefigures have resulted in these differences inphosphate production. Furthermore, a Iowmean phosphate production per pig per yearappeared to be accompanied by a highermean gross margin per average present pig.In 1996, large farms feeding by productsachieved a higher gross margin than farmsfeeding concentrate. This was due to bettergrowth and feed intake performances andlower total feed prices. n
Report Pl. 198
1 Siva-software B.V., Wageningen2 The Agricultural Extension Service, Boxtel
5 ECONOMICS

SITUATION AND POSSIBLE MEASURES ON PIG FARMS IN
DEURNE AND YSSELSTEYN IN THE AREAS OF HEALTH,
WELFARE AND ENVIRONMENT
ir. M.A. van der Gaag, ing. H.J. M. van der Aa, dr. ir. G. B.C. Backus
Introduction
The epidemical breakout of Classica1 SwineFever and bills on the Restructuring andReconstruction of pig farming have speededup internal and external discussions aboutthe Dutch pig sector with respect to animalhealth, welfare and the environment. Theselaws had not yet been passed as this reportwas written. One of the main aims of theLaw of Restructuring is to introduce so cal-led ‘pig claims’. This means that there will bea limit to the number of pigs a farmer cankeep, instead of a limit to the total amount ofphosphate produced. One pig claim unit isequivalent to one place in a pig pen.The Provinces of Noord-Brabant and Lim-burg and the united interest groups LLTBand NCB commissioned the Research Insti-tute for Pig Husbandry (PV) to investigatethe contact structures (number and kind ofcontacts of a farm with humans, animals andmaterials) in the district of Deurne and thevillage of Ysselsteyn, both areas with a highdensity of pigs and pig farms. Besides thisthe expected development in the number offarms and locations with pigs and the viewsof the pig farmers involved on the (im)possi-bilities of industrial adjustments to animalhealth, welfare and environment were map-ped.
Methods
The study was divided into three parts. 1) Aninventory of the situation on pig farms in1996. This included the farm size, farm suc-cessor, sanitary facilities, direct and indirectcontacts with humans, animals and materialsand the presence of pig pens with reducedammonia emissions and group housing sys-tems for sows. All farms with pigs in Deurne
and Ysselsteyn were asked to participate ina questionnaire. 2) The participants in thesurvey were invited to join meetings invol-ving 10 to 15 people to discuss the (im)pos-sibilities of farm-adjustments on animalhealth, welfare and the environment. 3) Anestimate was made of the development ofthe number of farms and locations with pigs.For this purpose the farms were classifiedinto three groups: smal1 (< 100 sows and< 500 fattening pigs), medium and large(> 200 sows and > 2,500 fattening pigs). Theexpected number of farms in the year 2001was calculated on the basis of two parame-ters: Istly given the experiences of an earlierproject in the southern sandy area, 2ndlyconsidering the generic deduction of 10% in1998 and the 50% cream off by trading pigclaims. It was assumed that 75% of the largefarms, 40% of the medium farms and nosmal1 farms would repurchase the deductedrights. To bring the needed claims on themarket in the concentration area “South”, 5%of the large farms and 25% of the smal1 andremaining medium farms would have to selltheir pig claims. The calculation for the year2006 was made by an autonomie extrapola-tion of five years from 2001.
Development of farms and locations
The historica1 development and an extrapo-lation to the future is shown in figure 1. Thetotal number of farms in the districts Deurneand Venray (including Ysselsteyn) has andwill decrease. The number of smal1 andmedium farms has and will decrease al-though the number of large farms has and’will increase.Under the present polities, most of the loca-tions of smal1 farms will continue to exist.Demolishing the pens is too expensive and
ECONOMICS 6

a lack of possibilities to use them for otherpurposes wil1 cause them to remain unoc-cupied. The modern medium and largelocations are more attractive for a completetake over. The same applies to the remaininglocations as to the smal1 locations.
The number of farms in Deurne and Venrayin 2001 is estimated to be 584 without thegeneric deduction of lO%, instead of 528farms. In 1996 there were almost 21,000 pigfarms in The Netherlands. This number isestimated to be 18,000 in 2001 without thegeneric deduction and 16,000 farms with a10% deduction.
Farm situation in 1996
75% of the farmers responsed to the ques-tionnaire. These included 282 farms with 344locations. 8 of these were smal1 farms withless than 100 sows and 47 farms had lessthan 500 finisher pigs (in total 55 smal1farms). 78 farms fell into the category ‘largefarms’ with more than 200 sows or morethan 2,500 finisher pigs, of which 10 hadfinisher pigs. In The Netherlands more than50% of the farms are smal1 ones, mostly witha smal1 number of finisher pigs as a secon-dary branch.The managers of the large farms are com-
800-I
7001
6001
medium
paratively young; three out of five are lessthan 40 years old compared with one inthree for managers of smal1 farms.
Risk of importing pathogens during animaltransportThree aspects of the supply and delivery ofpigs were analysed; the number of adresses,the distance from the farm to these adressesand the frequency of transportation.More than half of the locations with sowssupplies gilts/sows monthly. 25% suppliesmore frequently and almost 10% breedstheir own gilts. On 30% of the locations thesupply-adress for gilts is more than 25 kmaway. The frequency at which sows are deli-vered is two-weekly on almost half of thelocations. For 25% it is more frequent. Aquarter of the locations breeds their own(chaser)boars, the rest buys boars (two-)yearly. 20% of the locations with sowsexports piglets.In 45% of the locations with finisher pigs, thepiglets are bred on the same location. Whenthe location buys piglets, the supplier islocated within a radius of 25 km in 90% ofthe cases.
10% of the supply of gilts/sows is from twoor more adresses; in 95% of the locationsboars and sperm come from one supplier.
789R-
large total
0 1986 1991 q 1996 n 2001 0 2006
Figure 1: Number and size of farms in 1986, 1991 and 1996 in the districts of Deurne andVenray and an extrapolation to 2001 and 2006
7 ECONOMICS

Less than 50% of the locations with sowsdelivers piglets to more than one adress. Aquarter of the locations with finisher pigsbuys piglets from two or more suppliers.According to the respondents, 97% of thelocations are situated within a radius of1,000 meters from another location withpigs, 89% within a radius of 500 meters and71% within a radius of 250 meters. Four outof ten locations are situated within 100meters of another location.
Risk of impot-ting pathogens by human visitsApproximately 10% of the locations is incontact with other pig farms through theirpermanent or temporary employees. Manyfarmers are member of a team which organi-ses study meetings. In connection withthese meetings 17% of the managers allowcolleagues to enter the pig pens. The avera-ge number of visits of service providers(veterinarian, advisor, A.I., truck driver, main-tainance providers) is 75 a year. There arelarge differences between the locations. InDeurne the average number of visits is 65.In Ysselsteyn it is 105 times a year. This dif-ference is caused mainly by the number ofvisits by the inseminator; Deurne has more
owner-A.l.‘s. In the smal1 locations less servi-ce providers enter the pig pens (36) than inlarge locations (107).
Sanitaty facilitiesThere are several measures possible toavoid the import of pathogens, such as aroom to change into clothing and boots fromthe farm, a complete farm outfit, a barrierbetween the clean and the dirty area, a bootcleaner, a washbowl and a shower. The typeof clean-dirty area was divided into severalcategories: for pigs, for carcasses, for (com-pound) food, for manure and for other do-mestic animals and the presence of a disin-fection trunk was examined. The sequenceof delivering involves the following aspects:the presence of delivery-pens (for sows /boars / piglets / finisher pigs), quarantine-pens, carcass trunks and carcass coolersand how many locations always use a cleanand empty truck for the transport of pigletsand finisher pigs.
In general the smal1 locations take fewersanitary measures than the large locations.The closed herds and the farms specialisedin sows take the most measures.
supply sows
supply boars
supply sperm
delivery sows
delivery piglets
supply piglets
delivery finisher pigs
40 50 60 70 60 90 100percentages
q never 0 1 adress 2 of 3 adresses
> 3 adresses unknown/exporl
Figure 2: Percentages of locations with sows and/or finisher pigs with a certain number ofsupply and deliver-adresses in 1996
ECONOMICS 8

Group-meetings
30% of the invited farmers went to the mee-tings. This group is not representative for allthe pig-farmers in the Peel or The Nether-lands. It was presumed that mainly farmerswanting to continue farming in the (far) futurewere present. During eight meetings with atotal of 68 farmers, the requirements of pigfarming in the future were discussed indetail. Over 80% said that a farm shouldhave just one transport adress (both supplyand delivery adresses) for sows, boars,sperm and finisher pigs. For piglets a maxi-mum of two transport adresses was foundreasonable and all relations with other farmsshould be steady relations. Such conditionsare attainable within three months. Almost80% of the participants said that the trans-port of gilts and sows (supply and delivery)once a month should be possible.According to 40%, the supply of piglets andthe delivery of finisher pigs can be reducedto once every two weeks. But the frequencyof transports is less important than the useof full trucks. Almost everyone agreed withthe obligation of a functional hygiene chan-nel. Three-quarters of the participants saidthat the frequency of service providers visitscould be halved. If farmers were to be allo-wed to vaccinate their animals themselves,95% of the participants believed it possibleto halve the number of visits.Discussion on the marketing area for Dutchpig meat and recent research results led to60% believing that pig husbandry has tomeet the needs of the market and agreeingthat they should switch to group housing forsows within ten years. Thirty percent thoughtthat it could be necessary to give finisher
pigs more space, mostly as a concessiontowards the politica1 compromise on the so-called Dutch Pig order (“Varkensbesluit”). Inspite of these percentages, most farmerswere not convinced of the (positive) effectsof these measures on animal welfare.Every participant considered it attainable tofeed the pigs with food containing fewerminerals. Nowadays the newly built andrenovated pig pens have a reduced ammo-nia emission (Green Label). Nevertheless40% answered ‘no’ to the question whetherall pig pens should be Green Label within 10years. A mentioned reason was: with thecurrent system of regulations it is hard toexpand a farm if all pens are Green Label.
Conclusions
The results of this research must be put inthe proper perspective. The Swine Feverand intended laws have had a great effecton the perspectives of the managers of pigfarms. The research was carried out in anarea with a relatively large number of pigsand large pig farms and so the results arenot representative of all managers of pigfarms in The Netherlands.The following conclusions were made on thebasis of this research:1. The total number of farms with pigs in The
Netherlands is decreasing. This develop-ment is seen in Deurne and Ysselsteyn,although to a lesser extent. This is due tothe relatively large farms with youngmanagers. Fewer farmers are expected tochange their occupation in this group.
2. The participants of the group meetings -mostly stayers - were willing to meet thestrict requirements of the pig husbandry
Table 1: Percentage of the locations with a number of sanitaty facilities
number of hygiene clean-dirty sequence of delivering sequence of deliveringfacilities measurement area principle (locations with sows) (locations with finisher pigs)
0 - 2 25 83 68 823 - 4 61 6 30 175 - 6 14 11 2 1
- __._
9 ECONOMICS

in the future, especially requirements toreduce the risk of impörting pathogens.The transport structure of sows, boars andsperm in Deurne and Ysselsteyn is quitegood. Most locations have less than twosupply and delivery adresses. There aremore locations with piglets and finisherpigs with two or more adresses. Most ofthe deliveries of pigs, except finisher pigsto the slaughterhouse, take place within aradius of 25 km. It is not possible to indi-cate the increase in risk when havingmore supply and delivery adresses.A way to reduce the risk of importingpathogens is to minimalise the visits ofhumans to the pigpens and to have pro-per, functional sanitary facilities. The fre-quency of visits of service providers ishigh, especially on the large farms. Thesanitary facilities are not sufficient onmany smal1 pig locations.
The recommandations based on this researchare as fellows:1. A lot of pig farmers are now aware of the
need to reduce the risk of importing pa-thogens. The leaders of the united interestgroups and of the (local) authorities mustanticipate to increase the leve1 of aware-ness.
Pig farmers are swamped with writteninformation. During the meetings it ap-peared that much of this information isnot recognized as such, although themanagers do admit the importante of(background) information. For example:in order to make a balanced decision onmanagement it is important to knowsomething about the marketing area forDutch pig meat. Further research on themost effective ways of informationexchange to pig farmers is needed.In order to reduce the risk of importingpathogens, it is necessary to know moreabout the risk of each possible activity on apig farm. This includes the different sanitaryfacilities, the contacts with humans (serviceproviders, colleagues, visitors, employees)and contacts with other farms concerningthe supply and delivery of pigs.The leve1 of supply and demand of quotais (indirectly) influenced by the require-ments placed on individual pig farms con-cerning welfare, animal health and theenvironment. A good policy on the de-mands on pig husbandry can control theprices of the quota. n
Report Pl.204
ECONOMICS 10

INVESTMENT COSTS OF STANDARD PIG HOUSES IN 1996
ing. J. H.A. N. Adams, ir. C. E.P van Brakel, dr: ir. G. B.C. Backus, ing. t?A. M. Bensl
From 1975 up til1 now the construction andlayout of pig houses has strongly been influ-enced by changes and modernisation. Pighouses have become larger due to an in-crease in the number of pigs per farms andto observing regulations on animal welfareand health. Mechanisation and automationare also increasingly made use of. Thematerials used have become more durableand different methods of sewerage systemshave been introduced. That is why buildingcosts of pig houses have increased andhousing costs have become a more andmore important component to deal with. Atthe moment widely differing investmentcosts and costs per pig place are men-tioned in practice. There is also uncertaintyabout the economie and technical lifetime(= duration) of new housing systems forsows and growing/finishing pigs. This studyhas tried to determine the investment costsof a new standard housing system for sowsand growingfinishing pigs. It has also beentried to give an impression of the variation ininvestment costs, depending on the invest-ment size and quality. The quality is usuallyexpressed in the depreciation period chosenand costs of maintenance. To make realisticand reliable calculations, several construc-tors and housing designers have beenrequested to make an offer for a previouslydefined standard pig house for sows andgrowing/finishing pigs. The sizes of suchpig houses are 172 sow places and 1,840growing/finishing pig places respectively.These modern pig houses much resemblethe compact pig houses, which have beendescribed by Bens et al. (1994). The sowbarn is made up of one compartment forempty sows, two compartments for pregnantsows, 8 piglet compartments with each 6piglet pens and 6 farrowing compartmentswith each 6 farrowing pens. The pig house
for growingfinishing pigs has 23 compart-ments with 8 pens, each with 10 growinglfinishing pigs. One compartment is used forthe sick, as storage and as an office.Based on the offers, the investment costs ofthe (main) components of the pig househave been calculated. Yearly costs of invest-ment have been determined by calculatingthe costs of depreciation, interest costs (7%of the mean invested capital) and costs ofmaintenance.On the basis of the investment costs calcu-lated, a model called ‘Bouwfl’ has beendeveloped. This model calculates the invest-ment costs of a pig house using design-based input, such as the dimensions of thepig house, compartments and pens and thenumber of walls of the slurry pit. With themodel, calculations can be made of a num-ber of alternative pig houses in a relativelyquick and simple way. By using the standardpig house as a reference, the effects of farmsize, size of the compartment and differen-ces in the design of the slurry pit and areaper pig place on investment costs can beestimated.The investment costs per sow place equalDfl 5,156.- (excluding VAT). In practice,investment costs per sow place range fromDfl 4,045.- to Dfl 5,900.-. Total yearly invest-ment costs equal Dfl 554.- per sow placeper year. The yearly investment costs (10.8%of the total investment) consist of 5.9% de-preciation costs, 3.5% interest costs and1.4% maintenance costs. The average life-time of the pig house for sows is 17 years.For the standard pig house for sows, in-vestment costs per farrowing pen equalDfl 7,664.-. For a pen in a piglet compart-ment with 10 piglet places and a cubicle forempty or pregnant sows, an investment ofDfl 5,839.- and Dfl 2,431.- is needed respec-tively. The yearly costs of these separate
1 The Agricultural Extension Service, Boxtel
I I ECONOMICS

pens are Dfl 885.-, Dfl 646.- and Dfl 247.-respectively.Investment costs per growingfinishing pigplace equal Dfl 885 (excluding VAT).The investment costs per growinglfinishingpig place in the offers made range fromDfl 705 to Dfl 1,095. The average yearlyinvestment costsare Dfl 92.- per growing/finishing pig place per year. These yearlycosts consist of 5.7% depreciation costs,3.5% interest costs and 1.2% maintenancecosts. The average lifetime of the pig housefor growingfinishing pigs is also 17 years.With regard to the effect of the slurry pitstructure, the investment costs of a pighouse with shallow slurry pits are lower thanthe costs of a pig house with deep ones.The investment tost of a pig house with so-called shallow manure channels are lowerthan the investment costs of a comparablepig house with complete shallow slurry pits.As a result, necessary ‘extra’ investment in aslurry storage outside the pig house as com-pensation for the Ioss of slurry storage capa-city under the pig house, total and yearlyinvestment costs of both alternatives withshallow slurry pits or manure channels arehigher than the costs of the standard hous-ing systems with the traditional deep slurry
pits. Individual farmers have to considerwhether a large manure storage facility isrequired on their premises. Also regular andfrequent manure removal is a possibility.Then investment in a large manure storagefacility is not necessary.As farm size increases, investment costs perpig place decrease. This so-called scaleeffect decreases, however, if farm size in-creases further. If the size of the compart-ments increases, this scale effect can alsobe seen. This effect is greater with relativelylarge farms with relatively large compart-ments than with large farms with relativelysmal1 compartments.By increasing the floor area per pig by 40 to45%, the investment costs and yearly costsdo not increase proportionally, but increase byone-third of the increase in floor area in termsof percentage (thus, the investment and year-ly costs increase by 14 to 15% if the floor areaper pig increases by 40 to 50%). A constantslurry storage capacity under the pig house isassumed. This implies that for maintaining thesame slurry storage capacity under the pighouse, the depth of the slurry pits decreasesif the floor area per pig increases. n
Report Pl.214
ECONOMICS 12

TESTING BREEDING PRODUCTS OF GROWING-FINISHING
PIGS USING OBSERVATIONAL DATA
d[ ir: J. WG. M. Swinkels, ir: G. WJ. Giesenl, il J. W van Riel, M.M. J. Toonenl, dr: ir: G.B. C. Backus
In 1995, the research team coined “StudieElektronische Merkentoets” has developed amethod for periodic testing of pig breedingproducts using raw data of managementinformation systems from commercial sowfarms. A breeding product is defined as thecombination of one commercial sow- andone boarline marketed by one breedingcompany. In the method, only farms wereused that contained a sow population con-sisting for 90% or more of the same bree-ding product. The steering committee ofStEM has stated that a periodic test can onlybe performed under the condition that thetest provides information for both commer-cial sow and growing-finishing operations.In this study, the objective was to studywhether the developed method can also beused to test breeding products using rawdata of MIS from growing-finishing farms. Intotal, 101 growing-finishing farms have givenpermission to use a backup of their MIS-
data and were willingly to fill out a surveythat contained questions about farmer andfarm. Of these 101 farms, 65 farms wereused to analyse a number of technical indexfigures. The overall farm average of leanmeat was 55.4%. The maximum (corrected)differente among four breeding productswas 0.7%. The index figures ‘type AA + A’and ‘slaughter weight’ of the pigs were simi-lar among the four breeding products. Othertechnical and economie index figures couldnot be analysed due to the smal1 number offarms per breeding product that were ableto provide reliable MIS-data. It was conclud-ed, that in the short term a periodic test ofpig breeding products can only be perform-ed using MIS-data from commercial sowfarms in combination with experimental dataon the growing-finishing pig performance. n
Report P4.30
1 Wageningen Agricultural University, Department of Farm Management
13 ECONOMICS

A COMPARISON BETWEEN PIG FARMING IN THE EUROPEAN
UNION AND NORTH AMERICA
ir. M.A. H. Vaessen, M.A. C. Bastiaansen, dr. ir: G.B. C. Backus
Aim of this study was to evaluate structuraldevelopments in the sector structure for theEU as wel1 as for the US and to draw a pic-ture of their consequences. The study wascarried out as a joint project of the ResearchInstitute for Pig Husbandry and the ABNAMRO BANK NV The number of pigs inDenmark, France, Ireland and the Nether-lands increased in 1996 compared with1995. In the other EU countries there was adecrease in pigs, the largest of which was inPortugal and Germany. France has surpass-ed the Netherlands as to numbers of pigs.The past few years France and Denmarkparticularly have increased production. Den-mark has the highest self-supporting rateand therefore depends on export the most,after which the Netherlands and Belgium/Luxembourg follow. In recent years Francehas developed itself from a net importertowards a net exporter. Production and totalconsumption are highest in Germany.Denmark, Spain and Germany see the high-est per capita consumption with over 55 kgper capita. Greece and the United Kingdomconsume not even half this amount withalmost 25 kg per capita.Besides slaughtered pigs, the Netherlandsalso exports many live pigs. In 1996 thisexport involved 6.5 m piglets and fatteningpigs. Denmark is the largest exporter in theworld with over 1 .l m tons of export in 1996.Furthermore, Ireland, France and Spain havea self-supporting rate of over 100%.Over 1 million farms had fewer than 10 pigsand over 160,000 farms more than 100 pigsper farm. As these data concern 1993, thelatest EU member states Finland, Austriaand Sweden are excluded.Contrary to the Netherlands and Germany,the Danish slaughter structure is characte-rized by a strong integration and high capa-city utilization. In 1996 the 5 largest slaugh-terhouses accounted for 96% of the totalnumber of slaughterings. The sale of meat
and meat products takes place more andmore through supermarket chains at theexpense of the butcher.The average tost prices in the three mostimportant countries the Netherlands, Den-mark and France do not differ much. Thetost price in Brittany, however, is considera-bly lower. In Germany this is clearly higher.The countries with the lowest output pricesare the Netherlands, France, Denmark andGermany. Output prices are the highest inBelgium. The tost price, however, is alsohigher in Belgium. Cost prices in Italy, Portu-gal and Spain are relatively high.Production in the US and Canada involvedover 9 m tons of pork in 1996 from a pigpopulation of approximately 70 m pigs. Thegreater part is for the internal market. TheUS is, with over 400,000 tons of pork in1996, the second pork exporter in the worldafter the EU. From 1990 to 1996 the pigpopulation in the US increased by 8%. Percapita consumption in the US is relativelylittle compared with Europe. In the US thereis a higher poultry and beef consumption.In the 1960s pigs in the US were mainly keptoutside, on mixed farms. In 1970 there wereover 870,000 pig farms that together produ-eed 87 m slaughter pigs. In 1995 this num-ber had decreased to 149,000. Togetherthey produced almost 96 m slaughter pigsThe 66 largest farms (a yearly production of
A pig farm in the US
ECONOMICS 14

on average 244,000 (!) slaughter pigs perfarm) accounted for 17% of the productionin 1995. There is stil1 a production shift goingon from the traditional Corn Belt states to thesouthern states, among which North Caro-lina, Kansas and Oklahoma. This shift hasparticularly been caused by the fact that inthese “new” states environmental regulationused to be less strict and land and labourrelatively cheap until recently. Particularlyin the states near Iowa the number of pigfarms that goes out of business is large.For 1997 it was estimated that 33% of theslaughtered pigs in the US had been kepton a contract basis. Contract productiontakes particularly place in the “new” pig sta-tes, among which North Carolina, Oklahomaand Kansas. As a counterpart to contractproduction in the “new” pig states, in the tra-ditional “Corn Belt states”, networks havebeen established. Networks play an impor-tant part in the pig sector in Minnesota.The five largest slaughter chains togetherhave a market share of more than 53%.The overall tost price in the US is considera-bly lower than in the EU, despite more unfa-vourable technical results, and is almost $1per kilogram of Iiveweight, which comesdown to approximately $1.25 per kg ofslaughterweight. In a comparison of the USand the EU the dollar exchange rate istherefore important. Besides a low tostprice, the US also has Iow output prices. Theaverage output price in the past 6 years wasapproximately $1.05 per kg of liveweight.
Both the EU and the US show a tendencytowards increase in scale. Moreover, pig far-ming is more and more concentrated insome important production areas, whichresults in environmental problems in theseareas. There is also an increasing concen-tration of slaughterhouses/processing indus-try in both areas. In the US this process hasproceeded further than in the EU.Pig farming in the US is more landbound.The EU is more advanced in environmentallyinvestments. The US has only recently start-ed to solve environmental problems, whichare mainly problems with respect to stench.Contrary to the EU, animal welfare is hardly
an issue in the US.The technical results in the US lag behindcompared with the EU. Because of the avai-lability of cheap materials there is less atten-tion for result improvement. Despite worsetechnical output, tost price in the US isstructurally lower. The US production chainis characterized by a strong vertical integra-tion, while the EU structure is relatively frag-mented. The chain position of the primaryproducer is relatively weak in the US. The“market power” in the chain is with theslaughterhouses. There are also differencesin sales. US sales focus more on bulk pro-ducts with a Iow tost price, whereas the EUproduces relatively more for market seg-ments, such as bacon in the UK and Parmaham in Italy.
The following conclusions can be drawn.- The competitive power of the US on the
world market is currently stronger than thatof the EU.
- Cost price differences between the USand the EU will become less the comingyears.
- Initiated by GATTIWTO agreements andan increasing pork consumption in particu-larly Asia world trade will increase.
- US export will remain to be aimed atcheaper bulk products, which can be pro-duced at a structurally lower price. Forthe EU there are opportunities for the so-called value added. To take advantage ofthese opportunities a far-reaching chainintegration is necessary, in which differentchain stages cooperate closely.
- By increasing world pork consumption anda relatively strong competitive power of pigfarming in the EU as well as in the US, pigfarming in both areas can increase in thefuture.
- The Netherlands should focus more onproducts with a higher value added in achain-oriented organization. All this cannotprevent a decrease in the number of pigsas well as farms in the Netherlands in theyears to come. W
Report P5.6
15 ECONOMICS

HEALTH MANAGEMENT ON SOW FARMS
ir. E. R. ter Elst- Wahle, iK M.A. H. Vaessen, drs. ing. H.J. P M. Vos, ing. G.I? Binnendijk,dr: ir. R.B.M. Huirnel, dr. ir. G.B.C. Backus
In the pig industry more attention is beingpaid to the health care. It is necessary forthe advisory service to pay more attention tohealth care in their educational programs. Inorder to do so it is necessary to have moreconcrete data concerning relations betweenfarm management, the extent of health pro-blems on the farm and technical and econo-mica1 results of the farm. Based on this infor-mation, the advisory service can providemore applicable advice on a more systema-tic approach to health care on the farm. Theaim of the project was to establish relation-ships between farm management, the extentof health problems on the farm and technicaland economical results on the farm.Farm data were collected from 438 sowfarms and their vets by the Agricultural Exten-sion Service (DLV) by means of questionnaire.The questionnaire was made up of 73 ques-tions on the following subjects: general farmdata, farm structure, health care, care forpiglets, housing and climate, climate control,feeding, labour and administration. Anadditional questionnaire was carried out tovalidate the data given by the farms. Thesecond questionnaire was made up of 24questions of the 73 questions in the first
questionnaire. These 24 questions werepresented to 44 of the 438 sow farmers.Another questionnaire was carried outamong the vets of the participating sowfarms to validate the questions concerningthe health care and health problems on theparticipating farms.The research dataset contained technicaland economical farm results, health careand health problem characteristics andmanagement characteristics. All the varia-bles were reduced to a certain number ofvariables or aspects using factor analysis.Through factor analysis a total of 20 aspectswas obtained. The influence of each aspecton the extent of health problems in sowsand/or weaned piglets was analysed. Therelationship between the aspect and healthproblems was determined by means ofregression analysis with the most explana-tory variable (catch variable) within theaspects being the independent variable.A cluster analysis was also carried out todetermine the relationship between thevariables and to determine the relationshipwith health problems and technical and eco-nomical results.417 of the 438 participating farms were sow
Table 1: The extent to which farmers perceived preventative disease measurements as useful(% of farmers)
more than 90% 67 - 90% less than 67%
purchase disease free gilts (99)limit number of contacts (99)all in-all out (98)cleaning (98)hygienic corridor (92)dirty-clean part principle (66)
washing sows (86)isolate sick animals (84)desinfecting boots (83)desinfection (70)no visitors on the farm (68)cooltainers (67)
measurements for animalsleaving/entering the farm(59)preventive medication (40)
1 Wageningen Agricultural University, Department of Farm Management
HEALTH AND QUALITY 16

farms, 21 were rearing farms. On averagethere were 226 sows and 17 rearing sowspresent per farm.
Measurements
8% of the farms reared all the sows. 89% ofthe farms bought gilts. On 71% of the farmsthat purchased the gilts, it was not knownwhether the gilts were free from specific dis-eases.
The percentage of farms applying specificmeasurements to prevent and control sowdiseases were as follows: health controlduring feeding (44%) deworming (98%),scabies (99%), washing sows before enter-ing the farrowing unit (24%) improving sowimmunity (72%).The percentage of farmsapplying specific measurements to preventand control piglet diseases were: precise cli.mate control before piglets enter the pigge-ry, cleaning (both more than 80%); waitingbefore letting the piglets into the piggeryuntil the compartment is dry, desinfection(60 - 80%); medication after weaning (20 -35%).
Health problems
28, 19 and 34 of the farms respectivelydeclared to have no health problems withtheir suckling piglets, weaned piglets and
sows. Results of the questionnaire amongthe vets of the participating sow farms showmarkedly differences concerning the perceiv-ed health problems on the farms. Final ana-lysis was based on the results of the ques-tionnaire among the vets. Further develop-ment and implementation of information sys-tems supporting registration and analysismust have priority. There were problems withoverlaying of the piglets and/or non-viabilitypiglets, arthritis and/or meningitis, swing dis-ease/post weaning diarrhoea/oedema dis-ease, bronchial tube disease and ear- andtail biting on more than 50% of the farms.50% or more of the farms had birth problems,udder infection and fertility problems.
There was a correlation between the extentof bronchial tube problems and udder infec-tion, between worms and scabies andbetween birth problems and udder infectionin sows. There was a correlation betweenthe extent of swing disease and arthritisand/or meningitis, and between bronchialtube problems and ear- and tail biting inweaned piglets.The mutual relationship between differenthealth problems was too Iow for being ableto determine an overall farm health index. Afarm health index can only be determinedwhen it is based on proces based parame-ters that give an indication for the chance atgetting specific health problems. )
Table 2: Health problems with weaned piglets and sows
Health problems Weaned piglets sows
On less than 25% of the farms intestinal problemsother leg problemsnon-viability of the piglets
influenza, PRRS, worms,bladder infectionleg problems
On 25 - 50% of the farms scabiesbronchial tube disease
On more than 50% of the farms swing disease, post weaningdiarrhoea/oedema diseasebronchial tube diseaseear-/tail biting, scabiesarthritis and/or meningitis
birth problemsudder infectionother fertility problems
17 HEALTU AND QUALI7Y

Farm management, economical results andthe extent of health problems
The mutual relationship between farmmanagement, technical and economicalresults and the extent of health problems onthe farms was investigated. Seven aspectswere related to the extent of one or morespecific health problems: labour input persow, rearing own gilts, modernity of the farmbuildings, desinfection, feeding automation,door ventilation, and the frequency of clima-te control. Each of these aspects was moreor less related to other farm characteristics.Although several correlations appeared tobe significant, the correlation between thevariation in the extent of health problemsand farm characteristics was Iow. Otheraspects such as farmer qualifications, weremost probably more important.A relatively Iow as well as a relatively highlabour effort per sow resulted in a lowergross margin per sow. There were relativelymore health problems on farms with a relati-vely low labour effort per sow.
The relationship between labour effort, mar-gin and health problems indicate that onfarms with a relatively Iow labour effort persow possibilities exist to improve both theeconomie result and the health status byincreasing the labour effort per sow.Modern stables, feeding automation as wellas door ventilation in the farrowing stablewere coupled with a higher gross marginper sow. However this was not accompa-nied by fewer health problems. It can beconcluded that there are health problems onmost sow farms to a greater or lesser de-gree. The extent of the health problems onfarms with favourable technical and econo-mica1 results are not necessarily less then onfarms with less favourable technical andeconomical results.Preventive medication was perceived asuseful by 40% of the participating sow far-mers. The results of this observational studyshowed no clear relationship between pre-ventive medication and the extent of healthproblems. Further research is necessary toimprove the knowledge on the possibilitiesto reduce preventive medication.
Risk awareness
The relationship between preventative mea-surements and the extent of health problemson the farm was not clear. The questionnairedemonstrated that not all sow farmers wereconvinced (in 1996) of the effectiveness ofcertain hygiene measurements, such asdesinfection of stables and transport of ani-mals to the farm. These differences in per-ception are partly due to differences in farmcircumstances, but they are also related todifferences in awareness of the individualfarmer regarding the effectiveness of pre-ventive measurements. W
Report Pl.200
HEALTH AND QUALITY 18

RINSING FACILITIES TO CLEAN LIVESTOCK TRUCKS ON
PIG FARMS
ing. P E M. M. Roelofs, ing. J. J. W Nijskensl
In the Netherlands, livestock trucks that areused to transport pigs must be cleaned anddisinfected directly after unloading the truckand before entering public roads. For thisreason transit places, slaughter houses andexport places for pigs have rinsing facilities.After removal of manure and litter, the trucksare placed on a 6% backward slope andcleaned with water at a Iow pressure (about 3atm.) and a high flow rate (about 50 I/minute).This experiment tested whether labour timeand water use to clean livestock trucks afterpig transport can be reduced by platingtrucks on a 6% backward and 4% sideward
Livestock truck on the “sideward & back-ward” rinsing facility
1 The Agricultural Extension Service, Boxtel.
sloped rinsing facility instead of a 6% back-ward sloped rinsing facility. The water useand the labour time required to clean thesetrucks after the transport of between 25 kgand 30 kg piglets to a transit place weremeasured. Only the results of truck driverswho cleaned their truck in both places wereused for the analysis. These were 18 (back-ward) and 22 (sideward & backward) meas-urements.The two different types of rinsing facility didnot influence labour time (p = 0.9) or waterusage (p = 0.8). On average, the truckdrivers used between 10 and 15 minutesand about 0.75 m3 water to clean their trucksafter transport of piglets. Because backwardand sideward sloped rinsing facilities aremore expensive than backward slopedrinsing facilities, it is recommended thattransit places, slaughter houses and exportplaces should build 6% backward slopedrinsing facilities.Most farms only need to clear several timeseach year, although there are big differencesbetween farms. On an average farm, theannual water use is about 12 m3, so it ishard to recover the costs of an expensiverinsing facility by the reduction of water andmanure costs. Because of this, a 1% to 3%backward sloped rinsing facility with a sepa-rated discharge of rinsing water and rainwater is sufficient on most farms. n
Report Pl.205
19 HEALTh AND QUALI7-Y

METHODS FOR FLY-CONTROL IN PIG HOUSES
ing. PEM. M. Roelofs, ing. J. J. W Nijskensl, dr. t? C. Vesseur, ing. J. G. Plagge
Flies found in pig houses and the surroun-ding area are irritating and harmful. Museadomestica (housefly) and Drosophila spp.(fruit fly) are found most frequently. A literatu-re study showed that flies can carry manydiseases, including different kinds of diar-rhoea, Salmonellose, Swine fever andAujeszky’s disease.
In pig houses, a period of about fourteendays usually separates two generations ofstable flies. Temperature and relative humidi-ty affect this interval, and in pig houses theyare almost perfect for flies. Therefore, meas-ures to prevent plagues of flies are needed.
Pig farmers should initially take preventivemeasures (‘ethologie fly control’). Ethologiefly control includes (1) ensuring that sur-faces in the stables are dry and clean and(2) preventing flies from entering. Althoughsome very good results of ethologie fly con-trol have been found in literature, additionalfly control tends to be needed. Additional flycontrol may be chemically based, based onthe use of predators or physically based. Asurvey of the advantages and disadvanta-ges of methods that are described in litera-ture has been made.Chemical fly control can almost always beused and when both larvicides and adultici-des are used properly these methods aresafe to operate. Disadvantages are labourcosts, frequent exposure to pesticides, emis-sion of pesticides to the environment, thesimultaneous killing of predators, the price ofinsecticides and the development of resis-tante in flies.Predators of flies, like mites and beetles, arefound in almost all pig houses. However, theirnumber is not sufficient to prevent plagues offlies. For this purpose more predators must
be introduced. Killer flies (Ophyra aenes-eens) and insectivorous birds are available,and companies are developing fly controlmethods using ichneumon wasps. Fly controlusing killer flies or insectivorous birds aresafe and labour saving methods. Maggots ofOphyra eanescens eat maggots of Museadomestica as a source of proteins.Insectivorous birds eat adult flies and some ofthem also eat maggots if they can reachthem. Disadvantages of the latter method arethat birds leave droppings in the stables, thefarmer must pay attention to the birds whenhe moves sows, pigs or piglets from one roomto another and that the birds may spreaddiseases from one room or batch to another.Examples of physically based systems for flycontrol are electric fly traps combined withUV or sticking fly traps combined with phero-mones. Most physically based systems arelabour-intensive. Only adult flies are caughtand in most cases the results are poer.
In this study, the effective strength and prac-tical value of available methods for fly con-trol are compared. An experiment was car-ried out in 1994 and 1995 on nine Dutchfarms and on the experiment farms in Raalteand Rosmalen. Five methods for fly controlwere studied, namely chemical fly control(CHEM), fly control using insectivorous birds(BIRD), the regular introduction of Ophyraaenescens (ENTOMAX), a single introduc-tion of Ophyra aenescens (ENGRAFT) andthe use of electric traps (TRAP). In REFE-RENCE rooms, only ethological measureswere taken.CHEM involved the periodical application oflarvicides and, only if there were too manystable flies, adulticides. The Larvicides andadulticides belonged to different toxicologi-cal groups. In BIRD-rooms air-inlets and fan
1 National Reference Centre Agriculture
HEALTI-I AND QUALI7-Y 20

shafts were closed using avairy netting and,bearing in mind the size of the room, acouple of Lamprotornis purpureus, Sturnusmalabaricus or Leiothrix lutea was introdu-eed in each BIRD-room. In ENTOMAX-rooms a box with maggots and pupa ofOphyra aenescens was hung in the room inweek 1 (introduction), 5, 9, 17 and 24 andafter this every 13th week. In ENGRAFT-rooms a box with Ophyra aenescens mag-gots and pupa was spread over the driftbedof slurry in the dung pit two times, with a fourweek interval. TRAP consisted of one elec-tric trap (Lurectron 8, type L201-B) in a room,attracting flies by means of UV light andpheromones (Flylures) and killing them byelectrocution.The effectiveness of the systems as a meansof fly control was measured by weekly coun-ting the number of flies, caught by a 14 x 8cm sticking trap.
Fly control systems had no effect on thenumber of fruit flies (Drosophyla spp.).The effect of TRAP on the number of houseflies was so smal1 that the farmers stoppedusing this method prematurely so that not-hing could be concluded statistically.In farrowing rooms only CHEM and BIRD ledto fewer house flies (p < 0.10) than REFE-RENCE. In rooms for weaned piglets CHEMand ENTOMAX resulted in fewer flies thanREFERENCE (p < 0.05) and no effect ofENGRAFT was found (p > 0.2). BIRD wasnot carried out in these rooms. The numberof house flies was lowest in rooms with
CHEM (p < 0.01). According to the farmersboth ENTOMAX and ENGRÄFT were satis-factory in rooms for weaned piglets, andthey all continued to use one of these sys-tems.In rooms for growing-finishing pigs CHEM,ENTOMAX and ENGRAFT resulted in fewer(p < 0.05) flies than REFERENCE. In BIRDthe reduction was not significant (p = 0.1).The farmers judged positively on all fly con-trol systems and most of them continued touse ENTOMAX or ENGRAFT.Statistical analysis of the effectiveness of thefly control systems in rooms for empty andpregnant sows was not possible, but ENTO-MAX and ENGRAFT were certainly not effec-tive there.
Three years after the experiment was startedonly one farmer continued to use TRAP. Heused it in his farrowing rooms and combinedit with CHEM. The other farmers stoppedbecause of poor results. In spite of the goodresults most farmers also stopped usingBIRD. Reasons for stopping with BIRD werethe droppings in the stables and the factthat the farmer must pay attention to thebirds when opening doors. Almost all far-mers used ENTOMAX or ENGRAFT or anintermediate form of the system with Ohyraaenescens in their rooms for weaned pigletsor for growing and finishing pigs. In severalpig houses Ohyra aenescens had alsomigrated to farrowing rooms. Most farmersused CHEM in their rooms for dry and preg-nant sows and one used BIRD.
Table 1: Annual costs (Dutch guilders) of the fly control systems by type of rooms in pig houses
CHEM’ BIRD ENTOMAX ENGRAFT TRAP
6 farrowing rooms 540 180 498 18 1,5908 rooms for weaned piglets 560 240 664 24 2,120160 dry or pregnant- sows 962 38 680 20 36515 rooms for growing/finishing pigs 1,695 450 2,250 75 3,975
total 3,757 908 4,092 137 8,050
1 Costs for CHEM according to the protocol. In the experiment less chemicals were needed and thereal total costs for CHEM were DFL 2,499.-.
21 MALW AND QUALITY

In table 1 the annual costs (V.A.T. incl.) for afarm with 210 sows are presented.
It is concluded that CHEM is most effective.Disadvantages of CHEM are labour andlabour conditions, environmental aspectsand image of pig meat production. In manyrooms for weaned piglets or for growing andfinishing pigs fly control using Ohyra aenes-eens is a very good alternate. However,results of this system were poor in farrowingrooms and rooms for dry and pregnantsows. The reason for these poor results is
not known, but reasons iay be the compo-sition of manure in these rooms or the use ofacaricides. There were more stable flies inthe rooms with insectivorous birds than inrooms with CHEM, but the former systemwas suff iciently adequate. However, mostfarmers stopped using BIRD because of theinconvenience the birds caused. In thisstudy electric fly traps were too expensiveand not effective. n
Report Pl.208
Not only chemical fly control but also fly control by insectivorous birds or by killer flies(Ophyra aenescens) is possible
/#ALW AND QUALIN 22

CLEANING OF ROOMS FOR PIGS AFTER SOAKING WITH
FOAM OR WATER; COSTS AND QUALITY
ing. P EM. M. Roelo fs, ing. J. G. Plagge
Between February 1996 and March 1997 anexperiment was conducted at the Experimen-tal Farm for Pig Husbandry “North- and East-Netherlands” at Raalte. The aim of the expe-riment was to study the effect of the soakingprocedure on working hours and waterconsumption, needed to clean rooms afterall in-all out and on the quality of the cleaningprocess. The study was done in cooperationwith Diversy Lever. The next two soakingprocedures were studied in farrowing roomsand rooms for weaned piglets:WATER: To drench the room with clear water
and to keep it wet for 1.5 hours.FOAM: To soak the room with a foaming
soaking detergent (Stafilax Schuim@;minimum soaking period is 1.5 minu-tes) and to leave it for 50 minutes.
Before soaking, the pens and passageswere swept clean. After soaking, they werecleaned by using a high pressure cleaner(150 - 200 atm. and 16 litres per minute),and by disinfecting them with a detergent@uat@).The rooms were soaked according the WATER
or FOAM procedure. For the first cleaning ineach room, which soaking procedure wouldbe used was randomly chosen. The followingcleanings WATER and FOAM were carried outalternately. During the experiment almost allcleanings were done by the same person.Prior to the cleaning, a visual ‘dirtyness-score’ of the pens was made, on the basisof an assessment record. Working hours andwater consumption for cleaning were measured.After cleaning, ATP-bioluminescence testswere done to determine the amount ofremairjng organic material, and disinfectionwas checked by using Rodac discs.NO literature was available on the use of ATPtests in pig houses. To get insight into theirusefulness, correlations between severaltests were determined.
Determining hygiene
A high correlation between visual dirtyness-scores of the same parts of different pens inone room was found. Although there wasalso a considerable correlation between dif-ferent parts in one pen, it is advised toassess more parts of the pens (e.g. feeders,floors, pen partitions). Also the results ofATP-tests correlated, but the results of theRodac-tests hardly did. NO correlation wasfound between ATP-test and Rodac-test.It can be concluded, therefore, that ATP-testand Rodac test are both useful for hygienecontrol in rooms for pigs. They are comple-mentary tests, measuring different aspectsof hygiene (the amount of organic material(RLU) and the number of colony forming units(cFu), respectively).
Effect on working hours and water consump-tion
FOAM decreased working hours and waterconsumption for cleaning, if compared toWATER. In farrowing rooms, cleaning afterWATER or FOAM lasted 11.6 and 9.5 minutesper pen respectively (p < 0.01). Water con-sumption was 180 litres and 135 litres perpen respectively (p < 0.01). In rooms forweaned piglets, cleaning after WATER or FOAM
lasted 7.2 and 6.4 minutes per pen respecti-vely (ns.), and water consumption was 102and 90 litres per pen respectively (p < 0.1).For Dutch conditions, costs of labour, waterand manure distribution decrease fromDfl 11.86 to Dfl 9.70 per pen and fromDfl 7.03 to Dfl 6.33 per pen in farrowingrooms and rooms for weaned piglets respec-tively, if the rooms are soaked with FOAM
instead of WATER. Including the costs of thedetergent, the costs decrease by Dfl 1.74per pen in farrowing rooms (p < 0.01) andDfl 0.28 per pen in rooms for weaned piglets
23 HEALTH AND QUALITY


EFFECTS OF TWO TYPES OF FARROWING PENS FOR
“FREE RANGE” PIGS AND FREQUENCY OF MUCKING OUT
ON PERFORMANCE, LABOUR AND AMMONIA EMISSION
ing. J.H. Huiskes, ing. J. G. Plagge, ing. PEM. M. Roelofs, iL H.M. Vermee< ir. M. C. Vonking. G. F) Binnendijk, ir. C. E.l? van Brake/
There is an increasing consumer interest forpork produced in an animal and environ-mently friendly way. The production of “freerange” pigs is relevant for this. Extra atten-tion is given to the housing and welfare ofthe pigs. Farms wishing to participate in thismarket have to meet requirements concer-ning available space per animal, use of litterand roughage, an outdoor yard, period ofsuckling, no tail docking etcetera and use ofmedicines. The main bottlenecks in the live-stock phase for a further development arethe economie return, labour conditions andthe ability to comply with husbandry andenvironmental demands/desires.The performance of sows in free range con-ditions were inferior to those of sows kept innon-free range conditions. Bottlenecks in thesuckling period are the mortality of pigletsthrough crushing and a result of diarrhoea,poor hygiene in the farrowing pen, poorlabour circumstances and an expected high-er environment pressure due to ammonia
360
metaltribarslats
straw fence
I , 60 120,200 I
feeding passage
Figure 1: New farrowing pen
emission. These bottlenecks are paradoxicalwith social desires linked to this way of pro-duction and lead, together with the highlabour input and extra housing costs, to anincreased tost price. In this study therefore,the effects of the design of the farrowing penand the frequency of mucking out were exa-mined.
The research was carried out from Septem-ber 1994 to March 1997 at the ExperimentFarm at Raalte with a unit of free range pigs.This unit comprises of 50 sows and 200growing-finishing pigs. The experiment wasset up as a 2 x 2 factorial design. The firstfactor was a New type farrowing pen versusa so-called Danish farrowing pen and thesecond factor was four times versus two b
460
, 60 ,151 60 115116,166
feeding passage
60 solid floor
Figure 2: Danish farrowing pen
waste-pipe withmetal slatsstraw fence
25 HL4LTl-l AND QUALITY

times mucking out per day.The housing met the requirements of theInternational free range meat Control (ISC)(until July 1996) and the Product Board forLivestock and Meat (PVV) (from July 1996onward).One compartment comprised of 5 farrowingpens of the New type (figure 1). Each penhad an area to lie down with a solid strawbedded concrete floor without floor heating.The lying area was seperated from the dung-ing area by means of a plank (straw fence).The floor of the latter area consisted of metaltribar slats. The nett total pen surface was7.2 m? This was larger than the minimumrequirement of 6.5 m* (lSC/PVV). Two com-partments each comprised of 6 so-calledDanish farrowing pens (figure 2). The lyingarea for sows and piglets was a solid strawbedded concrete floor without floor heating.The lying area was separated from the dung-ing area by means of bars and a plank(straw fence). The floor of the dunging areaconsisted of a solid concrete floor with awaste-pipe covered with metal tribar slatsimmediately behind the lying area. The netttotal pen surface was 7.6 m?The pens were daily supplied with chopped
wheat straw in the morning and, if necessa-ry, in the afternoon (during nearly twomonths with hemp straw). Wet spots on thesolid floors were covered with a supply ofsawdust. During the period in the farrowingpen, the sows were fed a lactation feed(9.05 MJ Ner until January Ith 1996, or 9.49MJ Nef from that date onward). During suck-ling at a starting age of about 10 days, thepiglets were fed a weaning feed (9.84 MJNef). Drinking water was available ad lib forthe sows and the piglets.
The piglets in the New pen grew better (242versus 217 gram). As a result of this theyhad a higher weaning weight than those inthe Danish pen (11.4 versus 10.4 kg). In theNew pen, mortality of piglets due to diar-rhoea was lower (0.3 versus 1.7%) andfewer piglets were treated for intestinal disor-ders (6.1 versus 12.4%). Mucking out fourtimes daily results in healthier piglets withless diarrhoea (6.1 versus 15%) and a ten-dency to a higher feed intake. However, itdoes not lead to increased growth. The legsof the sows improved while they were in thefarrowing house. This improvement washigher in the Danish pen, allthough the sta-
The new farrowing pen
HL4LTl-l AND QUAlI7-Y 26

tus at the start was also better.Mucking out four times a day results in acleaner lying area, especially in the Danishpen, and the use of more litter.The amount oflabour required to muck out is lowest (8 mi-nutes per compartment per day, calculatedat six pens) in the New pens cleaned twicea day. The New pen requires less labour tomuck out than the Danish pen at both fourtimes and two times a day. Mucking outtakes up more time when done four timesinstead of two times in both types of pens.Cleaning and desinfecting a compartment(calculated at six pens) after each batchtakes less time for the New pens than for theDanish pens (3 and 4 hours respectively)and needs less water (2.25 m3 versus 2.6m3). The frequency of daily mucking out wasnot related to the amount of time and waterrequired to clean and desinfect the compart-ments.The 24-hours average concentration of dustis higher in the compartment with New pens(2.11 mg/mJ) than in the compartments withDanish pens (1.69 mg/mJ). Mucking out fourtimes a day results in a higher dust concen-tration (2.19 mg/ms) than two times a day(1.61 mg/ms). The use of chopped hempstraw results in a higher dust concentration(2.37 mg/ms) than chopped wheat straw(1.43 mg/mJ). The highest concentrationswere close to a proposed upper value of 2.4mg/m? The concentration of fine dust (respi-
rable) in the sheds air was so high that thereis a realistic chance of respiratory tract com-plaints from pig farmers and stockmen regu-larly working in these kind of compartmentswithout the use of personal protective equip-ment.The ammonia emission per sow place ten-ded to be lower in the compartment withNew pens (4.96 kg ammonia per sow placeper year) than in the compartments withDanish pens (6.25 and 7.53 kg). The relati-vely Iow ammonia emission from all threecompartments is notable, compared with thereference leve1 of the Green Label Founda-tion. Taking into account these emissionlevels, the development of a Green Labelcertifiable farrowing pen for free range pigsmust be seen as a realistic option.The average balance is Dfl 51,- per litterhigher for the New pen, but this differentewith the Danish pen is not significant. Whentaking into account the costs of labour andhousing the New pen is preferable to theDanish pen. The extra effort required tomuck out four times a day instead of twice aday did not lead to an improved economieresult.In conclusion, the New pen is preferableand opens the opportunity to develop aGreen Label certifiable farrowing pen for freerange pigs. n
Report Pl. 199
The Danish farrowing pen
27 HEALTU AND QUALI7-Y

AMMONIA EMISSION IN FARROWING ROOMS WITH
MANURE TRAYS
ing. A. J.A. M. van Zeeland, ir. N. Verdoes
One of the ways of reducing the ammoniaemission in pig husbandry is by adaptingthe housing systems. At present, a low tostsystem with Iow ammonia emission is availa-ble for each category of pigs (Den Brok etal., 1997). For lactating sows these includethe separate water and manure Channel infarrowing pens with fully slatted floors andthe farrowing pen with a sloped plate in themanure pit.
The concept of the water and manure chan-nel and the concept of the sloped pit wallcan be optimized by manure trays. A manu-re tray is an undeep plastic tray mountedbelow the slats. Pre-fab manure trays can beintegrated into each existing type of build-ing. Another advantage of the manure trayis that more hygienic conditions are created,which is very important especially for farrow-ing pens. Futhermore, the incoming ventila-tion air passes through a passage under thetrays. In this way heat exchange can occurbefore the air reaches the animals (figure 1).
These advantages have stimulated twoequipment suppliers to produce an optimi-zed shape for manure trays. One type isbased on the concept of the water and
/air
/air
Figure 1: Cross section of farrowing roomwith manure trays and air inletChannel
manure Channel (figure 2). The other onehas a sloped form (figure 3). Combined withfrequent manure removal the emitting sur-face is decreased in such a way that theleve1 of ammonia emission remains low.Before introducing these manure trays ontothe market, the ammonia emission must beknown. The aim of this research thereforewas to measure the ammonia emission inaccordance with a strictly formulated proto-col when using manure trays in farrowingrooms.
The measurements took place between 24thJuly 1997 and 7th October 1997. During thefirst and second farrowing period from therooms using the manure tray and the waterand manure Channel 3.30 and 3.23 kg NH,per sow place per year were emitted, res-pectively, the average being 3.27 kg. Duringthe first and second farrowing period fromthe rooms using the manure tray and the slo-ped form 2.92 and 2.61 kg NH, per sowplace per year were emitted, respectively,the average being 2.77 kg. These values ofammonia emission were not corrected forthe ammonia concentration from the inco-ming air.
Figure 2:
Floor-plan
1.80 m
sewage system
30.70 m0.25 m
Floor-plan manure tray with sepa-rated water and manure Channel
ENVIRONMENT 28

After manure removal the ammonia emissiondecreased, especially for the manure traywith the water and manure Channel. Thiscorrelation was not very clear for the manuretray with the sloped form, probably due tothe very frequent manure removal every 2 to4 days. With increasing pen dirtiness, theinfluence of the manure removal on theammonia emission decreased.
In an economie evaluation the application ofmanure trays in new building situations wascompared with traditional situations withoutmanure trays for 12 farrowing sows per com-
Floor-plan
1.70 m
2.50 m
mt cr=0 sewage system
Figure 3: Floor-plan and profile manure traywith sloped form
partment. Three situations were comparedwith the traditional farrowing compartment:- a traditional compartment with manure trays,- a compartment with an air Channel of
15 cm at the front of the farrowing pens and- a compartment with an air Channel inte-
grated in the manure tray.Compared with the traditional farrowingroom without manure trays the extra annualcosts of these three situations with manuretrays are 110.66, 126.54 and 79.91 DutchGuilders per farrowing pen per year.The manure tray with the water and manureChannel realized a reduction in ammoniaemission (compared with traditional rooms)of 5.03 kg per sow place per year. The extraannual costs per kg ammonia reduction forthese three situations with manure trays are20.01, 25.15 and 15.88 Dutch Guilders,respectively.The manure tray with the sloped form reali-zed a reduction in ammonia emission (com-pared with traditional rooms) of 5.53 kg persow place per year. The extra annual costsper kg ammonia reduction for these threesituations with manure trays are 22.00, 22.88and 14.45 Dutch Guilders, respectively. n
Report Pl.201
29 ENVIRONMENT

HOUSING LARGE GROUPS OF WEANED PIGLETS IN LOW
EMISSION SYSTEMS
ing. A. J.A. M. van Zeeland, iK N. Verdoes
In the Netherlands many farmers are interes-ted in housing weaned piglets in big groupsbecause of lower housing- and cleaningcosts, better performance in the growinglfinishing phase (Vermeer and Hoofs, 1994)and the future obligation to use stablegroups (mixing is forbidden). Besides theseadvantages the piglets have more freedomof movement, which probably increases theirwelfare. Research shows a lower performan-ce in big groups in comparison with smal1groups, but the performance may increaseby the application of better feeding techni-ques in large groups. For these reasons pig-Iets will be housed in large groups more fre-quently. The need for a low tost system withIow ammonia emission for large groups isgrowing.On the Experiment Pig Farm in Sterksel astudy was carried out using two systems withlarge groups piglets. In the first compartmenta water and manure Channel was appliedunder fully slatted floors. The slats above themanure Channel were tribar, those above thewater Channel were plastic. The secondcompartment was equiped with a partly slat-ted floor and sloped walls in the manure pit.The pit wall was placed at an angle of 45”and the manure was removed one to twotimes per nursery period. The expectationwas - based on experiences from recentresearch using the water and manure chan-nel for farrowing sows (Den Brok et al., 1997)and sloped walls for fattening pigs (VanZeeland, 1997) - that the ammonia emissionof both systems would remain below thethreshold for Green Label Awards (0.30 kgNH3 per pig place and year).The aim of the research was to measure theammonia emission in accordance with theprotocol for measuring animal house with lowemission, formulated by Van der Hoek et al.,1996. In the protocol, data on performance,climatization and feeding must also be meas-ured.
The parameters were measured in the periodfrom March to October 1997. The ammoniavolatilization during the first, second and thirdperiod in the water and manure Channel andfully slatted floor was 0.38, 0.33 and 0.30 kgNH, per pig place and year respectively (witha mean of 0.34 kg NH,). The ammonia emis-sion in the room with partly slatted floor andsloped pit walls was 0.30, 0.19 and 0.35 kgNH, per pig place and year (with a mean of0.28 kg NH,) respectively.The research showed that weaned piglets inlarge groups defaecate and urinate on alimited number of places in the room. In theroom with the water and manure Channeland fully slatted floor, too much manure wasdropped in the water and manure Channel inspite of adaptions in the third period. In theroom with partly slatted floor and sloped pitwalls, the pens remained very clean and theammonia emission remained below thethreshold for Green Label. The average leve1of the manure in the pits was 8.4 cm and themaximal leve1 was 16.5 cm. This correspondswith an emitting surface of 0.12 m* and 0.13m* per piglet place respectively.The costs of these rooms were comparedwith rooms in a traditional pig house withnew building situations. The surface of aroom for 60 piglets in a traditional pig houseis equal to the surface for 80 piglets in alarge group system, since no control path isnecessary. In comparison with the traditionalpig house the extra annual costs in a roomwith a water and manure Channel and fullyslatted floors are Dfl 10.38 lower. The costsof a room with partly slatted floors and slo-ped pit walls are Dfl 12.13 lower. The extraannual costs per kg ammonia reduction areDfl 34.60 and Dfl 43.32 respectively. At pre-sent these systems are the cheapest way ofhousing large groups of weaned piglets witha low ammonia emission. n
Report P 1.207
ENVIRONMENT 30

EVAPORATION OF WATER FROM SLURRY USING SOLAR-
ENERGY
ing. J. J. H. Huijben, ir. A. K van Wagenberg
The Dutch legislation concerning theapplication of animal slurry on land hasbeen tightened during the last few years.As a result of the fact that slurry-applica-tion is not allowed in the winter period,large number of slurry stores have beenbuilt. It is compulsory that slurry storesbuilt after 1987 are covered to reduceammonia emission.By using slurry stores with a transparentcover, it is possible to evaporate waterfrom the stored slurry. Solar-energy entersthe store and stimulates evaporation ofwater from the slurry. Condensationappears on the inside of the relatively coldcover. This clear condensation-water iscollected outside the storage. Computersimulation indicated that evaporating waterfrom slurry within a slurry store could be aviable technique. As a result of the modelcalculations, a study was designed.The store had two compartments and aclosed cover. The slurry surface of one ofthe compartments was covered with anisolation-layer. A relatively thin layer ofslurry was pumped on this isolation-layer.
Slurty storage with a transparent foil coverconstructed upon a trench silo
The slurry cover was made of foil.The reduction in the slurry leve1 was regi-strated per day and per compartment (withand without isolation-layer). The tempera-ture in different places in both compart-ments was also measured. The evapora-tion in the compartment without an iso-lation-layer was 261 litres water per squaremetre slurry surface between the first ofApril 1997 and April 1998. In the compart-ment with an isolation-layer it was 304 litreswater per square metre. The measuredresults were compared with the results ofthe simulation model. Thereafter thesimulation model was renewed and themeasured climate data for the researchperiod was used as input. The measuredand estimated temperatures in the slurrystore were nearly the same (r2 = 0.97). Theestimated evaporation proved to be a littlemore than the measured evaporation (324and 278 I/m2 instead of 304 and 261 I/m2).To build a slurry store with a big evapora-ting surface, extra space is needed on thefarm. This extra space is not always pre-sent, so it is not always possible to use thismethod of evaporation of water from slurry.The total financial savings for slurry trans-port and application including the extrainvestment costs (Dfl lO.- per sow or Dfl l.-per fattening pig) is enough to make theinvestments profitable, when investment ina slurry store is necessary. If the costs forslurry transport and application rises, theprofit may be higher.On farms with insufficient capacity forstorage of slurry, investments in a storagesystem with a transparent cover is a realalternative to improve the quality of themanure on the own farm in an energyfriendly way. W
Report Pl.213
31 ENVIRONMENT

AMMONIA EMISSION IN A ROOM FOR WEANED PIGLETS
WITH A SLOPED PIT WALL
ing. A. J.A. M. van Zeeland, ing. G.M. den Brok
In 1995 a Iow tost system with a Iow ammo-nia emission was developed for weaned pig-Iets: the so-called DeLVris system (Voermansand Hendriks, 1996). The concept of thishousing system was based on narrow anddeep pens with a narrow water Channel atthe front of the pen and a broad manureChannel at the back. This system received aGreen Label Award (BB.96.03.033) and wasofficially registered with an average ammo-nia emission of 0.26 kg NH, per piglet placeper year. Research on the ammonia emis-sion in fattening pigs had demonstrated thatthe ammonia emission could be decreasedfurther by mounting sloping plates in thebroad manure Channel. Therefore researchwas carried out on the Experiment Farm forPig Husbandry ‘South- and West-Nether-lands” in Sterksel to measure the ammoniaemission and leve1 at which the pens were
I\ /I 1,5 m I I
< *< * 0,4 m
1,l m
Figuur 1: Cross section DeLVris system withsloping pit walls for weaned piglets
fouled in the DeLVris housing type optimizedwith sloping pit walls.The amount of ventilated air and the ammo-nia concentration were measured during twonursery periods between July 17th and Octo-ber 2nd 1997. The ammonia emission wasnot corrected for the ammonia concentrationin the incoming air. The results of the meas-urements were that the ammonia emissionwas 0.19 and 0.15 kg NH3 per piglet placeper year for the first and second periodrespectively and averaged 0.17 kg NH,.The highest manure leve1 in the Channel was14 cm. This was equivalent to a maximalemitting manure surface of 0.073 m* per pig-let place. Compared to the DeLVris systemthe reduction of the emitting surface wasminimised to 33%. Annoyance from flies,caused by dirty sloping pit walls, was notrecorded in this research.In an economie evaluation this system wascompared with a traditional house forweaned piglets in a new building situation.The extra investment costs for the DeLVrissystem and for the DeLVris system with slop-ing pit walls were Dfl 13.30 and Dfl 16.39per piglet place per year. The extra annualcosts were very low: Dfl 0.90 and Dfl 1.40respectively. The extra annual costs per kgammonia reduction for the system wereDfl 3.25. n
Report P4.3 1
ENVIRONMENT 32

ENERGY USAGE AND LACTATING SOW AND PIGLET PER-
FORMANCE IN FARROWING COMPARTMENTS WITH A
LOWERED SET POINT OF THE ROOM TEMPERATURE
ir. t? J. W M. Geurts, ing. GA? Binnendijk ing. J. J. H. Huijben, dr. ir. J. ING. M. Swinkels
Heating costs form the main part of the totalenergy tost of commercial sow operations.Within a commercial sow farm, most of theenergy usage occurs in the farrowing com-partment, because the temperature require-ment is high for the suckling piglets. In thisstudy it was examined whether a reductionin temperature setting of 2°C in combinationwith an adequate micro-climate for sucklingpiglets can contribute both to energy sa-vings and improvement of lactating sow per-formance.In total 96 sows were used in this study. Thestudy was conducted in four naturally venti-lated farrowing compartments (six sows percompartment) with a combination of indirectand direct air-inlet during November 1996and May 1997. In the compartment with thestandard temperature setting (control), the“set point for heating” and “set point for ven-tilation” were set at 21°C and 23X, respecti-vely, when all sows in the compartment hadproduced their litter. In the experimentalcompartment, both set points were reducedwith 2°C. A hoover with local heating wasinstalled in each pen of the experimentalcompartments to provided the suckling pig-Iets with an appropriate micro-climate. Intotal eight batches of sows were followed inthe winter period. After each batch, the con-trol and experimental treatments wereswitched between compartments.In each of the eight batches, a differente inroom temperature was realised between thecompartment with the standard and reduced
temperature settings. The room temperaturewas on average 1.1 “C lower in the compart-ment with the reduced temperature setting.The reduction in room temperature had noeffect on lactating sow and piglet perfor-mance. In conclusion it is possible to reducethe room temperature in naturally ventilatedfarrowing barns, where the air-inlet is directand the optimum micro-climate of the suck-ling piglets can be guaranteed using ahoover. Energy savings in the compartmentswith reduced temperature settings mountedto DFI 3.- per sow and year, without negativeeffects on lactating sow and piglet perfor-mance. The increased tost for electricity(DFI 3.50 per sow and year) can be avoidedwhen using floor heating and letting the calllight in the hoover burn for only a few daysafter farrowing. H
Report P 1.202
Farrowing pen with a hoover for local heating
33 CLIMATE, HOUSING AND WELFARE

TECHNICAL FUNCTIONING OF THE AIR PATHOGEN FREE
(APF)-FACILITY: AIR TREATMENT AND HYGIENE MEASURES
ing. J. J. H. Huijben, ing. D. J.i?H. van de Loo, ir: A. V van Wagenberg, dr: ir: J. WG. M. Swinkels,dr. l?C. Vesseur
When fewer pathogens can enter a pig faci-lity, there is less risk of these pathogenscausing disease amongst pigs free fromthem. The pig health status can more easilybe kept on a pig farm. Depending on thekind of pathogen, the advantages can eitherbe better economie results or better salespotential. For example, the export of pigletsto a growing number of German provinces isreserved for only farms with an Aujeszky-freecertificate. Many pathogens are spreadthrough the air. Air filtering can prevent thesepathogens from entering a pig facility via theair.The Air Pathogen Free (APF)-facility hasbeen built for the Research Institute for PigHusbandry. The APF facility contains twonursery rooms and four growing-finishingrooms.In the APF facility, the introduction of air-borne pathogens is prevented by an airtreatment installation. The air treatmentinstallation consists of a central pre-treat-ment unit, an air distribution Channel and, foreach room, a treatment unit, an air distribu-tion Channel and an air outlet. The introduc-tion of pathogens in other ways is preventedby measurements described in a stricthygiene protocol (Van de Loo et al., 1996).The functioning of the air treatment installa-tion and the effectiveness of some of thehygienic measures were tested betweenJune 1996 and July 1997. Two batches ofgrowing-finshing pigs and five batches ofpiglets were housed in the APF facility.
To judge the functioning of the air treatmentinstallation during the test period the airpressure was collected and observed inseveral places in the system and measure-ments of the indoor climate within the roomswere carried out.Blockages and leakages in the system could
succesfully be detected using the air pres-sure data. It was possible to control theamount of ventilation air in the rooms afterseveral technical improvements. There wereno problems with the air distribution withinthe rooms since three pieces of wood wereplaced in the air Channel beneath the alley.The pieces of wood were placed in the airstream in the air Channel to force part of theair stream up.The room and floor temperature gave noproblems.The measured values of CO2 and NH, werealways lower than the maximum acceptableconcentrations. The same was found to bethe case for the dust concentration. Themean relative humidity in the nursery roomwas 46%; 60% is seen as an acceptablelower limit (Wergroep Klimaatsnormen,1989). In a growing-finishing room the relati-ve humidity was lower than the lower limit of50% in 66% of the time. During the testperiod no problems occured that could becaused by dry air.
The energy use of the air treatment installa-tion was also measured. The calculatedenergy costs were Dfl 19.- per piglet placeper year and Dfl 30.- per growing-finishingpig place per year.
The measures taken to maintain a good leve1of hygiene are described in a hygiene proto-col. The effectiveness of several hygienemeasures was tested. Cleaning the roomswas effective as was the treatment with for-maldehyde to kill remaining agents in theroom. During the test period no problemsconcerning hygiene occured.
The economie perspective of an APF facilityfor 1,840 growing-finishing pigs was evalu-ated as a part of this study. The extra opera-
CLIMATE, HOUSINGAND WELFARE 34

tional costs had to be offset by an improve-ment in pig performance. The-extra invest-ment costs compared to a regular faciltiywere Dfl 191.- per pig place per year. Theextra operating costs were Dfl 50.- per pigplace per year.To raise the gross margin by Dfl 50.- per pigplace per year, the daily gain had to increaseby 9% (from 737 to 819 gram per day) and
the feed conversion had to improve by 9%(from 2.78 to 2.53 kg food per kg gain)(Geisterfer, 1998). For farms with a regul-ar facility and mean production results(737 gram per day and 2.78 kg food per kggain) an APF facility could be interesting. n
Report Pl.209
Air inlet via the air Channel beneath the feeding alley in the APF facility
35 CLIMATE, HOUSINGAND WELFARE

PEN TYPE AND WELFARE OF A.I.-BOARS
ir: E. M.A.M. Bruininx, ir: H.M. Vermee< i[ KG. Vereijkenl, T WassenaaP, d[ ir: J. WG.M. Swinkels
Introduction
The Dutch Welfare and Health Regulationsfor Pigs of 1994 states that the accommoda-tion of boars should be such that the boarcan turn round and hear, smell and seeother pigs. Additionally the boar should havea clean resting place. This resting placeshould be dry and comfortable. Furthermorethe pen for an adult boar should have a floorsurface of at least 6 m? If the pen is used asa mating area, it should have a surface of atleast 7 m? Finally, the boar pen should, inthe case of a partially slatted floor, have anon-slatted area of at least 66%. Theseregulations are based on advice for boarpens in breeding farms which in generalonly have a few boars at their disposal.However, in Artificially Insemination (A. I J-centres several hundred boars are oftenkept in crates (0,8 x 2,5 m) or in pens with apartially slatted floor or in pens with straw(5 - 7 m*). The effect of housing on produc-tion, health and behaviour (al1 part of wel-fare) was studied since little research hasbeen carried out on boars regarding theeffects of housing on welfare. This project isdivided in three parts:
- the definition of boar categories to clarifythe statement “adult baar”;
- the description of relationships betweenthe housing of A.I.-boars and their produc-tion and health, using raw data from themanagement information systems of sixA. I .-centres;
- the description of relationships betweenthe housing of A.I.-boars and data onbehaviour and health, based on an experi-ment at one A.I.-centre.
1 Centre for Biometry, Wageningen* Agricultural College, Delft
Definition of boar categories
In the case of the housing of boars, the’expression adultness, as it is used in the
Dutch Welfare and Health Regulations forPigs of 1994, can best be interpreted interms of bodysize for the formulation of penspecifications. In literature, the space requi-rements of pigs to perform certain behaviour(e.g. turning) are related to the body lengthand the body height of the animals.However, little data is available on relationsbetween body size and the age of modernA. I .-boars.At the Research Institute for Pig Husbandrya protocol was developed to measure thebody height and length of A.I.-boars of thebreeds Yorkshire-terminal boar and Krusta.Based on the maximal body size measuredaccording to this protocol it was concludedthat Yorkshire-terminal boars and Krustaboars are able to lie totally recumbent on alying space of 2,5 m?
Relations between housing of A.I.-boars andproduction and health based on a databasestudy
Relations between pen characteristics onthe one hand and production and healthfeatures on the other were studied by meansof statistical analysis of data from manage-ment information systems (MIS) from six A.I.-centres and from a questionnaire. Precedingthis analysis the MIS-data were checkedcarefully for errors.Because of the very unbalanced distributionof the data over the experimental factors theanalysis was performed with the data of onlyone A.I.-centre in which the distribution ofthe data was acceptable.The results of the analysis gave no indicationof the effects of housing type (crates versuspens with partially slatted floors versus penswith straw) on sperm production. However,the results indicated a better quality (bettermorphology of the sperm cells) of the sperm
CLIMATE, HOUSING AND WELFARE 36

produced by boars housed in pens withstraw than by boars housed in’crates orpens with a partially slatted floor. This diffe-rente in sperm quality may be explained bythe isolating properties of straw. In this wayboars are less affected by fluctuations intemperature. Another possible explanationfor this differente is the occurrence of diffe-rences between compartments which haveno relationship with pentype (e.g. climatecontrol)This database study gave no indication ofthe effects of housing type on the health ofA.I.-boars.
Relations between housing and welfare ofA.I.-boars based on experimental research
From experimental research on an A.I.-cen-tre with three kinds of boar pens (crates,pens with a partially slatted floor and penswith straw) it was concluded that A.I.-boarshoused in crates show less oral activity. Incontrast with sows, the occurrence of oralactivity in A.I.-boars was considered to be apoor indication of the occurrence of stereo-type behaviour in A. I.-boars.Furthermore, it was concluded that theoccurrence of skin and leg lesions was high-
er in crates than in pens with straw. Theoccurrence of skin and leg lesions in penswith a partially slatted floor was intermediate.Additionally, the results indicated that becau-se of the limited freedom of movement,boars housed in slatted crates were forcedto lie down in their own manure in as far as itremained on the slatted floor. That is why theboars housed in crates were dirty and theslatted floor stayed clean.
Conclusions
The results of this research project indicatedthat the housing of A.I.-boars should be dif-ferentiated into different areas for lying anddunging. A lying area of 2,5 m2 is sufficientfor totally recumbent lying. Based on a totalfloor space of at least 6 m2 (Dutch Welfareen Health Regulations for Pigs, 1994) thisimplies 40% solid floor. For optimal health(minimal leg and skin lesions and minimaldirtiness) and maybe also for sperm quality,the use of straw on the pen floor is prefera-ble. Labour aspects (quantity and safety)and hygiene concerning the use of strawshould also be considered. n
Report P 1.203
A.I.-boars housed in crates A.I.-boars housed in pens with straw
37 CllMATE, HOUSINGAND WELFARE

FEEDING LIQUID FEED FROM VARIO-MIX OR USING A
LONG TROUGH TO GROWING-FINISHING PIGS
ing. A.I.J. Hoofs, ir: R.H.J. Scholten
Several different liquid feeding systems forgrowing-finishing pigs have been introducedduring the last years. The systems have only1 or 2 feeding places and differ from theconventional long trough, in which the num-ber of feeding places is equal to the numberof pigs per pen. The new systems take upless floor space and allow ad lib liquid fee-ding. Since March 1995 the Vario-MixFeeder, a new feeding system from the com-pany Verbakel B.V., is available for growing-finishing pigs. This is a system with onefeeding place and storage space for liquidfeed. Little is known about the effect of ad libliquid feeding on performance and slaughterquality. Therefore, a study was conducted toexamine the effect of ad lib liquid feedingusing Vario-Mix on the performance, slaugh-ter quality and health of growing-finishingpigs at the Experiment Farm for Pig Husban-dry in Sterksel. Besides that, technical and
Source: Verbakel B.V.Vario-Mix Feeder for growing-finishing pigs
practica1 aspects of working with the Vario-Mix Feeder were registrated. Two experi-mental treatments were tested:1 Ad lib liquid feeding using Vario-Mix Feeder2 Semi-ad lib liquid feeding using a long
troug hThe liquid feed included standard compoundfeed mixed with water in a water : feed ratioof 2.4 : 1 and 2.2 : 1 during the first fourweeks and the remaining weeks respectively.Seven rounds (from 26 kg to 111 kg liveweight) with 464 growing-finishing pigs weretested. Animals were housed in groups of 8pigs per pen.
The group fed using the Vario-Mix Feederrealised a significantly higher feed intake al-though daily weight gain was not improvedsignificantly. The higher feed intake occurredbetween 26 and approximately 47 kg liveweight. NO significant differente in feed toweight gain ratio was observed between thetwo treatments. Moreover the lean meat per-centage and type judgement did not differ.Groups fed a liquid diet using the Vario-MixFeeder tended to require fewer veterinarytreatments due to oedema-disease.During the whole experiment betweenJanuary 1995 and July 1996 Vario-MixFeeder functioned well. However, hygieneaspects of the storage of liquid feed werenot optimal. It is noteworthy that no liquid by-products with a Iow acidity were used inthese experiments. A pilot study showedthat liquid feed containing liquid by-productsresulted in better hygiene than a diet withoutby-products. NO visual differences in feedspoilage are observed between the twoexperimental treatments.The gross margin per delivered pig did notdiffer between the two treatments. n
Report Pl.206
FEEDING 38

THE USE OF LIQUID BY-PRODUCTS. A REVIEW
ir: R. H. J. Scholten, ir: M.M. J.A. Rijnen
There is a rapidly increasing demand forindependant information on liquid by-pro-ducts. However, there are few scientificpapers on studies in which pigs are feddiets with liquid by-products. Several trials atthe Research Institute for Pig Husbandry inRosmalen, the Netherlands, show increasingperformance, increasing health status andlower feeding costs when pigs are fed a dietincluding liquid by-products, such as liquidwheat starch, whey and smashed potatosteam peel. The exact mechanism by whichliquid by-products cause these changes isstil1 unclear.This Iiterature study describes severalaspects regarding the use of liquid by-pro-ducts, such as:- a general description of commonly used
liquid by-products and their productionprocesses
- the use of liquid by-products by pig far-mers
- results of trails with liquid feed, with orwithout liquid by-products
- a short explanation of fermentation proces-ses
- a description of several specific propertiesof carbohydrate rich liquid by-productsand their possible influence on the perfor-mance and health of pigs.
The general description of liquid by-pro-ducts shows the wide range of differentliquid by-products from several industriesthat may be used in pig feed. The succesfuluse of liquid by-products in pig husbandry isdependant of many aspects, such as thecorrect calculation of the feeding value, thehygiene of storage and feeding systems,representative sampling of the by-products,the value of analyses and management bythe pig farmer.Liquid by-products can be divided intogroups on the basis of their nutritional com-ponents: carbohydrate rich, protein rich and
fat rich by-products. About 60% of the Dutchby-product market has been captured bythree carbohydrate rich by-products: liquidwheat streach, whey and smashed potatosteam peel.The number of feeding and digestibility trialscarried out with liquid by-products is low.Only liquid wheat starch and smashed pota-to steam peel are sometimes used in thiskind of trial. These trials show that liquidwheat starch and potato steam peel are verysuitable for use in pig diets.Carbohydrate rich by-products have somespecific properties needed for storage. Theyare delivered warm, stored from severaldays to several weeks and fed regularly.Moreover they have a Iow dry matter con-tent, contain high levels of easily degradablecarbohydrates, have a low pH and containlactic acid bacteria and organic acids.These properties make the storage tanks actlike fermentation tanks, in which carbohy-drates are femented by lactic acid bacteriainto lactic acid, volatile fatty acids and etha-nol. Many studies show a possible positiveeffect of organic acids and probiotics in pigfeed on pig performance. The exact actionpath of these components is stil1 not clearand is dependent on may external factors.Common liquid diets, composed of com-pound feed and water, also ferment sponta-neously if stored long enough. If these fer-mented liquid diets also have positiveeffects on the performance and health ofpigs, then a wider use of these fermentedliquid diets may be possible. The control,mechanism and use of the fermentation pro-cesses stil1 need more research.Researchers in Denmark, United Kingdomand the Netherlands are carrying out studieson many of the specific aspects of liquidfeed and liquid feeding systems. H
Report Pl.210
39 FEEDING

FERMENTATION OF LIQUID DIETS AND BY-PRODUCTS
DURING STORAGE
ir: M.M. J.A. Rynen, k R. H. J. Scholten
In the Dutch pig husbandry increasingamounts of liquid by-products, most com-monly with high contents of carbohydrates,are fed to pigs. These by-products are usu-ally stored in big tanks, in which fermentationcan easily take place. Products most com-monly formed during fermentation are lacticacid, acetic acid and alcohol. Fermentationmay also occur in liquid diets, although it isnot known to what extent fermentation pro-ducts are formed. The fermentation productsmay have a positive effect on the health andperformance of pigs. In this study, therefore,the changes in physical and chemical traitsof liquid diets and liquid by-products arequantified during a storage of 6 days.Two liquid diets and three liquid carbohydra-te-rich by-products were used in this experi-ment. The liquid diets were a grower and afinisher diet mixed with water in a water tofeed ratio of 2.5 : 1. The liquid by-productswere whey, wheat starch and mashed potatosteam peel. Both liquid diets and productswere stored in 50 I pvc-storage tanks for aperiod of 6 days. The experiment consistedof two phases. In both phases, the storageof liquid by-products and diets were repeat-ed three times. In the first phase dry mattercontent, pH and temperature were meas-ured over time to determine the optimumtime points of sampling for the secondphase of the experiment. In the secondphase samples of all products were taken at10 times during storage. Each of the sam-ples were frozen to be later analysed for pH,dry matter, buffering capacity, (in)organicmatter, crude protein, true protein, crude fat,deoxidizing monosaccharides, lactose,(soluble) starch, formic acid, acetic acid,propionic acid, (iso-)butyric acid, (iso-)vale-rit acid, lactic acid and ethanol. Differencesbetween components due to storage timewere statistically analyzed for all compo-nents within products, where only the 0 and144 h time points are considered.
The most important results and conclusionsof this experiment are:
Acidity of all products decrease duringstorage. At the end of the storage periodthe pH of the by-products and liquid dietsis 3.5 and 3.8 respectively. Noticeable isthe turned S-curve pattern of the reductionof the pH in both liquid diets.The dry matter content of the liquid growerdiet, whey and potato steam peel de-crease significantly during storage. On theother hand dry matter content of liquidfinisher diet and liquid wheat starch after144 hours of storage did not differ from thecontent at the beginning of storage.Dry matter content adjusted for volatilecomponents of whey and potato steampeel decrease significantly during storage.The dry matter content of both liquid dietsand liquid wheat starch did not decreasesignificantly during storage.The differente between the dry mattercontent and the adjusted dry matter con-tent may increase to 13.9 g/kg after 144hours storage, absolutely.Except liquid wheat starch, bufferingcapacity of all products decreases signifi-cantly over time. Buffering capacity of thetwo liquid diets is higher than that of thethree liquid by-products.Contents of inorganic matter, crude pro-tein, true protein, crude fat of all productsdid not change during storage. Only theinorganic matter content of finisher liquiddiet and the true protein content of potatosteam peel showed an increase.Starch content of both liquid diets andpotato steam peel decrease significantlyduring storage. The starch content ofliquid wheat starch did not change duringa storage of 6 days.Content of sugar of liquid grower diet andcontent of lactose of whey decreased sig-nificantly. The sugar content of potatosteam peel has a tendency to increase,
FEEDING 40

that of liquid wheat starch and liquid fini-sher diet did not change.
- Content of soluble starch of the liquid dietsand potato steam peel after 144 hours ofstorage do not differ from the content atthe beginning of storage. The solublestarch content in liquid wheat starch has atendency to decrease.
- Formic acid concentrations increased sig-nificantly in liquid grower diet. The contentof acetic acid increased significantly inboth liquid diets. The propionic contentdid not change in all products.
- Lactic acid concentrations increase signifi-cantly in all products, except for liquidwheat starch. Noticeable is the S-curvepattern of the lactic acid leve1 of bothliquid diets during storage.
- Content of ethanol of liquid grower dietand whey increased significantly duringstorage and it has a tendency to increasein liquid finisher diet. The content of etha-
nol of liquid wheat starch did not change.- Variations in chemical composition
between the three repeatments occur.
Based on the results of this experiment, itmay be concluded that remarkable differen-ces in physical and chemical properties ofliquid by-products and liquid diets areobserved at the time of delivery. If storageperiod is prolonged, however, in the liquiddiets fermentation occur also. During stora-ge, fermentation does not only occur inliquid by-products, but also in liquid diets.The main components of the fermentationprocess are the lowered pH due to increas-ed levels of lactic acid and acetic acid.These fermentation components may contri-bute to improved growth performance andpig health. n
Report Pl.21 1
Storage tanks for fermentation at the Research Institute for Pig Husbandty

FEEDING 50% OF WHEATAND BARLEY TO GROWING AND
FINISHING PIGS: SEPERATELY OR IN COMPOUND FEED
ir: M.M. J.A. Rijnen, i[ R. H. J. Scholten, ing. J. G. Plagge
Low prices of cereals make them economi-cally interesting for use in pig diets. Mostresearch on cereals that has been done bythe Research Institute for Pig Husbandryfocused on the replacement of compoundfeed by wheat. This wheat was not proces-sed into the compound feed, but was fedseparately in combination with complemen-tary compound feed. Wheat was treated bya hammer mill, a crusher or a structure mill.These experiments showed that feedingwheat separately increased feed to gainratio than when feeding complete com-pound feed. In the experiment described inthis report also barley was fed separately.The goal of this experiment was to determi-ne the effect of feeding barley and wheatseparately instead of feeding compoundfeed with meat and barley on growth perfor-mance, pig health and slaughter quality ofgrowing-finishing pigs.Two experimental groups were examined:1 Complete compound feed diet with 50% of
barley and wheat (control).2 Diet with 50% of barley and wheat separa-
tely in combination with 50% of comple-mentary compound feed.
The growing pigs received 25% of barleyand 25% of wheat and the finishing pigs15% of barley and 35% of wheat.
The most important results and conclusionsare as follows.
NO significant differences in growth andfeed- and energy intake between the twogroups have been found.There is an increase in feed- and energyconversion when animals were fed 50% ofbarley and wheat separately compared Iwith a complete compound feed diet with50% of barley and wheat.Pigs fed the diet with cereals in the com-pound feed prove to drink more (p < 0.10)water than pigs that were fed barley andwheat separately.Meat quality, number of veterinary-treatedanimals, culled pigs are not differentbetween the two treatments.The occurrence and severity of diarrhoeaduring the first two weeks of the growingperiod is higher in the group of animalsthat received of 50% wheat and barley inthe compound feed compared with thegroup of animals that were fed wheat andbarley separately and complementarycompound feed.Feeding costs are reduced when the cerealsused are fed separately from the compoundfeed and a financial gain of Dfl 3.56 canbe reached for each pig delivered. Thisgain can be used for paying the costs ofseparately feeding. n
Report Pl.215
FEEDING 42

INFLUENCE OF BENZOIC ACID IN THE DIET ON PERFOR-
MANCE AND URINE PH OF GROWING-FINISHING PIGS
ir: C.M. C. van der Peet-Schwering, k N. Verdoes, ing. J. G. Plagge
Ammonia emission from pig houses canconsiderably be reduced by a combinationof housing and feeding measures. Researchat the Experimental Farm for Pig Husbandryat Raalte showed that adding an acidicmixture containing 70% of benzoic acidreduced ammonia emission to a leve1 of 1.22kg ammonia per pig place per year. Up tonow benzoic acid has not been allowed yetin pig feed. As part of the registrationprocedure of benzoic acid, an experimentwas conducted to examine the effect ofbenzoic acid in the diet on the performanceand health of growing-finishing pigs and onthe pH of urine and slurry.Three experimental treatments were com-pared comprising in total 60 individuallyhoused growing-finishing pigs:1 0% of benzoic acid: sows and barrows
were fed a starter diet and a growing-finishing diet with 0% of benzoic acid;
2 1% of benzoic acid: sows and barrowswere fed a starter diet and a growing-finishing diet with 1% of benzoic acid;
3 2% of benzoic acid: sows and barrowswere fed a starter diet and a growing-finishing diet with 2% of benzoic acid.
All pigs were fed twice a day. Water wassupplied four times a day.
The most important results and conclusionsare:- Pigs fed diets containing 1% of benzoic
acid grew faster and had a better feedconversion ratio than pigs fed diets with0% or 2% of benzoic acid. The growth ratewas 40 g/day higher and the feed conver-sion ratio was 0.1 better. Pigs fed dietscontaining 0% and 2% of benzoic acidshowed the same performance.
- Pigs fed diets containing 1% or 2% ofbenzoic acid had less diarrhoea problemsthan pigs fed diets with 0% of benzoic acid.
- Gross margin per pig place per year washighest when pigs were fed diets contain-ing 1% of benzoic acid. The differentebetween pigs fed diets with 0% and 2% ofbenzoic acid was Dfl 1 O.- and Dfl 14.80respectively.
- The pH of the urine and slurry was influenc-ed by the percentage of benzoic acid in thediet: the higher the percentage of benzoicacid in the diet, the lower the pH of theurine (7.52, 6.45 and 5.59 respectively) andslurry (8.18, 7.76 and 7.26 respectively).
- When the pH of the slurry is lower, there ismore nitrogen in the form of ammoniumnitrogen in the slurry. n
Report P5.8
Individually housed growing/finishing pigs atthe Experimental Farm at Raalte
43 FEEDING

PUBLISHED RESEARCH REPORTS IN ENGLISH
P 5.1Comparison of four housing systems fornon-lactating sows. G.B.C. Backus, Vermeer,H.M., Roelofs, P.F.M.M., Vesseur, P.C.,Adams, J.H.A.N., Binnendijk, G.P., Smeets,J.J.J., Peet-Schwering, C.M.C. van der andWilt, F.J. van der, March 1997.
P 5.2Spray-dried blood plasma and spray-driedblood eek in diets of weaned piglets.C.M.C. van der Peet-Schwering andBinnendijk, G.P., March 1997.
P 5.3Research Reports 1996. May 1997.
P 5.4A raised soft farrowing mat during lactation.H.M. Vermeer and Binnendijk, G.P., Novem-ber 1997.
P 5.5Research Reports 1997. March 1998.
P 5.6A comparison between pig farming in theEuropean Union and North America. M.A. H.Vaessen, Bastiaansen, M.A.C. and Backus,G.B.C., March 1998.
P 5.7Urinary pH, ammonia emission and perfor-mance of growing/finishing pigs after theaddition of a mixture of organic acids, mainlybenzoic acid, to the feed. G.M. den Brok,Hendriks, J.G.L., Vrielink, M.G.M. and Peet-Schwering, C.M.C. van der, January 1999.
P 5.8Influence of benzoic acid in the diet on per-formance and urine pH of growing/finishingpigs. C.M.C. van der,Peet-Schwering,Verdoes, N. and Plagge, J.G., January 1999.
P 5.9The influence of induced parturition and themoment of vaccination against Swine erysi-pelas during lactation on the weaning-to-oestrus interval in sows. M.C. Vonk, Binnen-dijk, G.P., Vesseur, P.C., March 1999.
For ordering a P 5-research report we adviseyou to remit the requested amount to ourPostbank account number 51.73.462 in ourname:Research Institute for Pig HusbandtyLunerkampweg 75245 NB RosmalenThe NetherlandsPlease mention the P 5. number of therequested report.
The costs are: Dfl 30.00 per P 5. researchreport (including overseas* postal expenses)plus Dfl 15.00 transfer costs per order:
* The reports are normally send by overseasmail. Air mail will be charged extra.
A subscription for receiving all the researchreports is possible and the costs areDfl 375.00 per year.
PUBLISHED RESEARCH REPORTS 44