Research Article Artificial Neural Network-Statistical Approach ...
10
Hindawi Publishing Corporation Advances in Fuzzy Systems Volume 2012, Article ID 327861, 10 pages doi:10.1155/2012/327861 Research Article Artificial Neural Network-Statistical Approach for PET Volume Analysis and Classification Mhd Saeed Sharif, 1 Maysam Abbod, 1 Abbes Amira, 2 and Habib Zaidi 3, 4, 5 1 Department of Electronic and Computer Engineering, School of Engineering and Design, Brunel University, Uxbridge UB83PH, UK 2 Nanotechnology and Integrated BioEngineering Centre, University of Ulster, Newtownabbey BT37OQB, UK 3 Division of Nuclear Medicine and Molecular Imaging, Geneva University Hospital, CH-1211 Geneva, Switzerland 4 Geneva Neuroscience Center, Geneva University, CH-1205 Geneva, Switzerland 5 Department of Nuclear Medicine and Molecular Imaging, University Medical Center Groningen, University of Groningen, 9700 RB Groningen, The Netherlands Correspondence should be addressed to Mhd Saeed Sharif, [email protected] Received 14 September 2011; Accepted 12 January 2012 Academic Editor: Jiann-Shing Shieh Copyright © 2012 Mhd Saeed Sharif et al. This is an open access article distributed under the Creative Commons Attribution License, which permits unrestricted use, distribution, and reproduction in any medium, provided the original work is properly cited. The increasing number of imaging studies and the prevailing application of positron emission tomography (PET) in clinical oncology have led to a real need for efficient PET volume handling and the development of new volume analysis approaches to aid the clinicians in the clinical diagnosis, planning of treatment, and assessment of response to therapy. A novel automated system for oncological PET volume analysis is proposed in this work. The proposed intelligent system deploys two types of artificial neural networks (ANNs) for classifying PET volumes. The first methodology is a competitive neural network (CNN), whereas the second one is based on learning vector quantisation neural network (LVQNN). Furthermore, Bayesian information criterion (BIC) is used in this system to assess the optimal number of classes for each PET data set and assist the ANN blocks to achieve accurate analysis by providing the best number of classes. The system evaluation was carried out using experimental phantom studies (NEMA IEC image quality body phantom), simulated PET studies using the Zubal phantom, and clinical studies representative of nonsmall cell lung cancer and pharyngolaryngeal squamous cell carcinoma. The proposed analysis methodology of clinical oncological PET data has shown promising results and can successfully classify and quantify malignant lesions. 1. Introduction Positron emission tomography (PET) volume analysis is vital for various clinical applications including artefact reduction and removal, tumour quantification in staging, a process which analyses the development of tumours over time, and to aid in radiotherapy treatment planning [1, 2]. PET has been progressively incorporated into the management of patients. Results of clinical studies using fluorodeoxyglucose (FDG)-PET have demonstrated its added value in the diagnosis, staging, and evaluation of response to therapy [3– 5]. The utilisation of advanced high performance analysis approaches will be useful in aiding clinicians in diagnosis and radiotherapy planning. Although the task of medical volume analysis appears simple, the reality is that an indepth knowledge of the anatomy and physiology is required to perform such task on clinical medical images. Essentially, the expert observes a particular slice, determines borders between regions, and classifies each region. This is commonly completed slice by slice for a 3D volume and requires a reslicing of data into the transaxial, sagittal, and coronal planes. In addition to this, identifying smaller slice features and contrast modifications are often required. Although, for a typical 3D data set, the entire expert manual analysis can take several hours to complete, this approach is perhaps the most reliable and accurate method of medical volume analysis. This is due to the immense complexity of the human visual system, a system well suited to this task [6–9].
-
Upload
khangminh22 -
Category
Documents
-
view
0 -
download
0
Transcript of Research Article Artificial Neural Network-Statistical Approach ...

Hindawi Publishing CorporationAdvances in Fuzzy SystemsVolume 2012, Article ID 327861, 10 pagesdoi:10.1155/2012/327861
Research Article
Artificial Neural Network-Statistical Approach forPET Volume Analysis and Classification
Mhd Saeed Sharif,1 Maysam Abbod,1 Abbes Amira,2 and Habib Zaidi3, 4, 5
1 Department of Electronic and Computer Engineering, School of Engineering and Design, Brunel University,Uxbridge UB83PH, UK
2 Nanotechnology and Integrated BioEngineering Centre, University of Ulster, Newtownabbey BT37OQB, UK3 Division of Nuclear Medicine and Molecular Imaging, Geneva University Hospital, CH-1211 Geneva, Switzerland4 Geneva Neuroscience Center, Geneva University, CH-1205 Geneva, Switzerland5 Department of Nuclear Medicine and Molecular Imaging, University Medical Center Groningen, University of Groningen,9700 RB Groningen, The Netherlands
Correspondence should be addressed to Mhd Saeed Sharif, [email protected]
Received 14 September 2011; Accepted 12 January 2012
Academic Editor: Jiann-Shing Shieh
Copyright © 2012 Mhd Saeed Sharif et al. This is an open access article distributed under the Creative Commons AttributionLicense, which permits unrestricted use, distribution, and reproduction in any medium, provided the original work is properlycited.
The increasing number of imaging studies and the prevailing application of positron emission tomography (PET) in clinicaloncology have led to a real need for efficient PET volume handling and the development of new volume analysis approaches to aidthe clinicians in the clinical diagnosis, planning of treatment, and assessment of response to therapy. A novel automated system foroncological PET volume analysis is proposed in this work. The proposed intelligent system deploys two types of artificial neuralnetworks (ANNs) for classifying PET volumes. The first methodology is a competitive neural network (CNN), whereas the secondone is based on learning vector quantisation neural network (LVQNN). Furthermore, Bayesian information criterion (BIC) is usedin this system to assess the optimal number of classes for each PET data set and assist the ANN blocks to achieve accurate analysisby providing the best number of classes. The system evaluation was carried out using experimental phantom studies (NEMA IECimage quality body phantom), simulated PET studies using the Zubal phantom, and clinical studies representative of nonsmallcell lung cancer and pharyngolaryngeal squamous cell carcinoma. The proposed analysis methodology of clinical oncological PETdata has shown promising results and can successfully classify and quantify malignant lesions.
1. Introduction
Positron emission tomography (PET) volume analysis is vitalfor various clinical applications including artefact reductionand removal, tumour quantification in staging, a processwhich analyses the development of tumours over time, andto aid in radiotherapy treatment planning [1, 2]. PET hasbeen progressively incorporated into the management ofpatients. Results of clinical studies using fluorodeoxyglucose(FDG)-PET have demonstrated its added value in thediagnosis, staging, and evaluation of response to therapy [3–5]. The utilisation of advanced high performance analysisapproaches will be useful in aiding clinicians in diagnosisand radiotherapy planning. Although the task of medical
volume analysis appears simple, the reality is that an indepthknowledge of the anatomy and physiology is required toperform such task on clinical medical images. Essentially,the expert observes a particular slice, determines bordersbetween regions, and classifies each region. This is commonlycompleted slice by slice for a 3D volume and requires areslicing of data into the transaxial, sagittal, and coronalplanes. In addition to this, identifying smaller slice featuresand contrast modifications are often required. Although, fora typical 3D data set, the entire expert manual analysis cantake several hours to complete, this approach is perhapsthe most reliable and accurate method of medical volumeanalysis. This is due to the immense complexity of the humanvisual system, a system well suited to this task [6–9].

2 Advances in Fuzzy Systems
The main challenges associated with PET are the statisti-cal noise and the low resolution which results in a significantpartial volume effect. This effect should be reduced to theminimum level so that the required information can beprecisely extracted from the analysed volume. Analysingand extracting the proper information from PET volumescan be performed by utilising analysis and classificationapproaches which provide rich information compared towhat can be extracted from visual interpretation of thePET volumes alone. The need for accurate and fast analysisapproaches of imaging data motivated the exploitationof artificial intelligence (AI) technologies. Artificial neuralnetwork (ANN) is one of the powerful AI techniques that hasthe capability to learn from a set of data and construct weightmatrices to represent the learning patterns. The ANN is amathematical model which emulates the activity of biologicalneural networks in the human brain.
ANNs had great success in many applications includingpattern classification, decision making, forecasting, andadaptive control [10]. Competitive neural networks withwavelet invariant moments have been used in [11] to detectthe arbitrary pose of the face and verify the candidate faceregions. In this work, the user selects some wavelet invariantmoments and feed them into the neural network. There isjust one active output out of three outputs of the networkwhich correspond to frontal face, nonface, and profile face.Therefore there is no full classification for the whole imagesince it is just restricted to some selected features. Supervisedcompetitive learning algorithm has been used to train com-petitive learning neural network with the extracted featuresset for handwritten Chinese character recognition [12]. Anumber of research studies has been carried out in themedical field utilising ANN for image segmentation andclassification using various medical imaging modalities.Multilayer perceptron (MLP) neural network have beenused in [13] to identify breast nodule malignancy usingsonographic images. A multiple classifier system using fivetypes of ANNs and five sets of texture features extraction forthe characterisation of hepatic tissue from CT images waspresented in [14]. Kohonen self-organising neural networkfor segmentation and a multilayer backpropagation neuralnetwork for classifying multispectral MR images have beenused in [15]. Kohonen ANN was also used for image segmen-tation in [16]. Computer-aided diagnostic (CAD) scheme todetect nodules in lung using multiresolution massive trainingartificial neural network (MTANN) is presented in [17].
Many other approaches were used for medical imagesegmentation. A fuzzy locally adaptive Bayesian (FLAB)segmentation for automatic lesion volume delineation hasbeen proposed in [18]. The FLAB approach was comparedwith a threshold approach as well as fuzzy hidden Markovchains (FHMCs) and the fuzzy C-Means (FCM) algorithms.In this comparison, phantom data sets were used to validatethe performance of the proposed algorithm. A new fuzzysegmentation technique adapted to typical PET data wasalso recently proposed [19]. First, PET images smoothedusing a nonlinear anisotropic diffusion filter are added as asecond input to the FCM algorithm to incorporate spatialinformation. Thereafter, a methodology was developed to
integrate the a trous wavelet transform in the standardFCM algorithm to allow handling of heterogeneous lesions’uptake. An unsupervised MRI segmentation method basedon self-organising feature map has been reported in [20]. Anextra spatial information about a pixel region was obtainedusing a Markov random field (MRF) model. The utilisationof MRF term improves the segmentation results withoutextra data samples in the training set. The cooperation ofMRF into SOFM has shown its great potentials as MRF termmodels the smoothness of the segmented regions. It verifiesthat the neighboring pixels should have similar segmentationassignment unless they are on the boundary of two distinctregions. However, it is not clear how the proposed approachis able to differentiate between two regions.
This paper aims to develop a robust PET volume analysissystem using ANN combined with Bayesian informationcriterion (BIC). The initial investigation of this system waspublished in [21]. Two methodologies have been investigatedusing the competitive neural network (CNN) and thelearning vector quantisation neural network (LVQNN) forclassifying PET volumes. BIC has been used in this system toselect the optimal number of classes for each PET data set andfeed it into the ANN blocks. The CNN and LVQNN outputshave been evaluated using two PET phantom data sets, aclinical PET volume of nonsmall cell lung cancer patient, andPET volumes from seven patients with laryngeal tumours.
This paper is organised as follows. Section 2 presentstheoretical background for the main system componentsincluding BIC, CNN, and LVQNN. The proposed medicalvolume analysis system is described in Section 3. Results andanalysis are illustrated in Section 4, and finally conclusionsare presented in Section 5.
2. Theoretical Background
2.1. Bayesian Information Criterion. Bayesian informationcriterion (BIC) is employed to approximate the Bayes factorwhich is consequently used to compare a series of rivaltheories. BIC is one hypothesis testing approach whichuses Bayesian inference. BIC has gained notoriety as asignificant approach for model selection and has been usedin contexts varying from image processing and analysis [22],to biological and sociological research [23, 24]. Although theBIC does not allow for spatial correlations between voxelsto be considered, it does provide a useful strategy for thecomparison of contesting models. The model which appliedto the data set is denoted by MK and is defined from theGaussian distribution utilised and its associated parametersθK , where K is a prior number of classes. To comparetwo competing hypotheses MK and MK ′ , the posteriorprobability of each model with voxel labelling Y is computedas follows [23]:
p(MK | Y) = p(Y |MK )p(MK )∑K
l=1 p(Y |Ml)p(Ml), (1)

Advances in Fuzzy Systems 3
p(MK ) is the prior probability of model MK , and in this casethe number of classes considered is taken to be equally likelya priori, therefore,
p(MK ) = 1Kmax
(K = 1, 2, . . . ,Kmax). (2)
The ratio of posteriors, p(Y | MK )/p(YML), is com-monly referred to as the Bayes factor for model MK versusmodel ML. This factor equates to the posterior odds of onehypothesis when the prior probabilities of the two hypothe-ses are likely to be equal. This also provides a measure ofevidential weight provided for the data or against the nullhypothesis. p(Y | MK ) represents the integrated likelihoodof model MK rather than the maximised likelihood and isgiven by:
p(Y |MK ) =∫
p(Y | θK ,MK )p(θK )dθK , (3)
p(Y | θK ,MK ) is the usual likelihood, and p(θK ) is theprior assumed to be equally probable for all MK . Evaluatingthis integral is combinatorially difficult; however, a goodapproximation to the integrated likelihood is given by theBIC:
BIC = 2 log p(Y | θK ,MK
)−DK logN , (4)
where θK is the maximum likelihood estimator of θKobtained from Gaussian mixture fitting:
p(Y | θK ,MK
)=
N∏
i=1
K∑
j=1
P jΦ j
(Yi | θ j
), (5)
where N is the dimensionality of the data vectors, and DK
is the cardinality of the parameter set employed. The Bayesfactor shown in (6) can be approximated by computing thedifference of BIC terms, which are the results of model fittingfor different numbers of classes, K and L [23]:
2 logp(Y |MK )p(Y |ML)
≈ BIC(K)− BIC(L). (6)
Although the absolute value of the BIC is not individuallyinformative due to comparison with the null hypothesis, thedisparity between BIC values for competing models providesevidence specifying the use of one model against another.
Expectation maximisation (EM) algorithm is used to findthe maximum likelihood estimation for each class in theprocessed PET volume. The maximum likelihood estimationof X (MLE) based on the incomplete observed data Y can bedefined as follows:
MLE = argmax{
log p(Y | X)}
, (7)
where log p(Y | X) is the log likelihood of Y given X .The maximum likelihood estimation is calculated first basedon Gaussian distribution, which is a continuous probabilitydistribution that is often used as a first approximation to
describe real-valued random variables that tend to classifyaround a single mean value:
f (x) = 1σ√
2πe−(x−μ)2/2σ2
, (8)
where μ is the mean for each class, and σ is the standarddeviation.
The maximum likelihood estimation for each segmentis finally obtained utilising this probability beside thehistogram of each level in the processed slice. The meanand standard deviation, for each class are also calculatedbased on histogram calculation, and according to thesestatistical details mthe signal-to-noise ratio (SNR) for eachclass is obtained as well to evaluate the level of the signal ineach segment [25]. SNR can be calculated according to thefollowing equation:
SNR = μ
σ. (9)
2.2. Competitive Neural Network. Competitive neural net-works can learn to detect regularities and correlations intheir input and adapt their future responses to that inputaccordingly. The neurons of competitive networks learn torecognise groups of similar input vectors. Self-organisingmaps learn to recognise groups of similar input vectors insuch a way that neurons physically near each other in theneuron layer respond to similar input vectors.
CNN consists of a single layer, the N neurons in thiscompetitive layer distribute themselves to recognise fre-quently presented input vector. The weights are applied tothe input vector using negative Euclidean distance approach.The layer’s net input is calculated by combining its weightedinputs and biases. CNN is trained using two approaches:the first one is sequential order incremental training whichtrains the network with weight and bias learning rules withsequential updates. The other approach is random orderincremental training which trains a network with weightand bias learning rules with incremental updates after eachpresentation of an input. Where in this type of neuralnetwork inputs are presented in random order [26].
2.2.1. Competitive Learning. The learning rule used for CNNis based on Kohonen rule [27, 28], the neuron, whose weightvector was closest to the input vector I , is updated to beeven closer. The result is that the winning neuron is morelikely to win the competition the next time a similar vector ispresented, and less likely to win when a very different inputvector is presented. As more and more inputs are presented,each neuron in the layer closest to a group of input vectorssoon adjusts its weight vector toward those input vectors.Eventually, if there are enough neurons, every class of similarinput vectors will have a neuron that outputs 1 when a vectorin the class is presented, while outputting a 0 at all othertimes. Thus, the competitive network learns to categorise theinput vectors it sees each time. The weight Wi of a neuron iat iteration q is adjusted as follows:
Wi(q) =Wi
(q − 1
)+ α(I(q)−Wi
(q − 1
)), (10)

4 Advances in Fuzzy Systems
Preprocessing toremove external
artefacts
Acquiringstatistical
information fromeach slice
CNN
LVQNN
Original3D PET volume
Segmented3D PET volume
PET scanner
Determine BIC andchoose the bestcluster number
Figure 1: Proposed system for oncological PET volume analysis.
where the learning rate α is set in the proposed PET appli-cation to 0.6. This value has been chosen by experiment, asthe learning rate value near zero results in slow learning,however, values near one result in faster learning, but theweight vector stays unstable. To solve the problem of thenumber of classes in the CNN, BIC has been utilised todetermine the optimal number of classes for each type of theprocessed data set.
2.3. Learning Vector Quantisation Neural Network. Learningvector quantisation neural network is a hybrid network,it uses unsupervised and supervised learning to form theclassification. LVQNN has two layers: the first layer calculatesweighted inputs using negative Euclidean distance approach.The second layer has neurons with pure-line activationfunction and calculates weighted input using dot productweight approach. There are no biases used in LVQNN.LVQ learning in the competitive layer is based on a set ofinput/target pairs. Each target vector has a single 1, and therest of its elements are 0. The 1 tells the right classification ofthe associated input.
LVQNN is more efficient than CNN in case of largenumber of inputs. The optimisation procedure implicitly inthis network yields the class means by estimating optimisedassignment for each class [29].
2.3.1. LVQ Learning Rule. The learning rule in LVQNNcombines competitive learning with supervised learningapproach [30, 31], which requires a set of examples of thesuitable network behavior as follows:
{I1, t1}, {I2, t2}, . . . ,{IQ, tQ
}. (11)
Each of these target vectors should contain all zeros exceptfor a single 1. This 1 indicates the class to which the assignedinput vector belongs. At each iteration, an input vector I is
presented to the LVQNN, and the distance from I to eachprototype vector is calculated. After competition, one neuronwins, and the ith element of the competition outputs vector isset to 1, then this outputs are multiplied by the weight matrixto get the final output, which has one nonzero elementindicating the vector class. Kohonen rule is used as a learningrule; so if the input vector I is classified correctly, then theweight of the winning neuron needs to be moved toward I asfollows:
Wi(q) =Wi
(q − 1
)+ α(I(q)−Wi
(q − 1
)), (12)
however, if I is classified incorrectly then the weight of thewinning neuron needs to be moved away from I as follows:
Wi(q) =Wi
(q − 1
)− α(I(q)−Wi
(q − 1
)). (13)
3. The Proposed System
The proposed medical volume analysis system is illustratedin Figure 1. The 3D PET volume acquired from PET scannergoes through the preprocessing block, where thresholding,histogram equalisation, and median filter are utilised toremove external artefacts and enhance the quality of eachslice features. The EM algorithm is then used to findthe maximum likelihood estimation for each class in theenhanced volume. The normal Gaussian density is thencalculated according to (8) for the values 0–255 of each class.The mean standard deviation and the class probability (CP)for each generated class are also calculated, according to thesestatistical details, the SNR for each class is also obtained. Theclasses probabilities must add up to one. The BIC valuesare calculated and plotted against different values of K todetermine the optimal number of classes for each processedslice. This number is fed to CNN and LVQNN, where theprocessed volume can be then classified. The outputs ofthese approaches are compared in the next step, and the bestclassified outputs are selected and displayed.

Advances in Fuzzy Systems 5
Table 1: Statistical information about the best class number forexperimental phantom data set.
CN μ σ SNR CP
1 1.000986 0.250000 4.003944 0.469466
2 3.528585 1.602465 2.201973 0.240734
3 13.024477 7.048304 1.847888 0.247406
4 57.982584 45.253936 1.281271 0.042394
4. Results and Analysis
4.1. Phantom Studies
4.1.1. Experimental Phantom Studies. The first data set usedin this study is obtained using the NEMA IEC image qualitybody phantom which consists of an elliptical water filledcavity with six spherical inserts suspended by plastic rodsof volumes 0.5, 1.2, 2.6, 5.6, 11.5, and 26.5 mL. The innerdiameters of these spheres are 10, 13, 17, 22, 28, and37 mm. The PET image volume consists of 168 × 168 × 66voxels, each voxel has dimensions of 4.07 mm × 4.07 mm× 5 mm corresponding to voxel volume of 0.0828 mL. Thisphantom was extensively used in the literature for theassessment of image quality and validation of quantitativeprocedures [32–35]. Other variants of the multisphere phan-toms have also been suggested [36]. The PET scanner usedfor acquiring the data is the Biograph 16 PET/CT scanner(Siemens Healthcare, Erlangen, Germany) operating in 3Dmode [37]. Following Fourier rebinning and model-basedscatter correction, PET images were reconstructed usingtwo-dimensional iterative normalised attenuation-weightedordered subsets expectation maximisation (NAW-OSEM).CT-based attenuation correction was used to reconstructthe PET emission data. The default parameters used wereordered OSEM iterative reconstruction with four iterationsand eight subsets followed by a postprocessing Gaussian filter(kernel full-with half-maximal height, 5 mm).
To choose the optimal number of classes for each slicein the processed PET phantom volume, different values of Khave been used. For the proposed application, BIC values arecalculated incrementally increasing from K = 2 to K = 8.K is not further increased, as in this medical application,any additional separation is unnecessary. BIC values tend toincrease indefinitely as the number of components increases.An increase in BIC value indicates improved model fit;however, these values typically stabilise on an approximatecurve plateau, the beginning of which is usually taken toindicate the optimal K value. The plot of BIC values withK for experimental phantom data set shows that the best Kvalue can be obtained at 4, as illustrated in Figure 2.
The mean standard deviation, SNR, and class probability(CP) for each slice have been calculated to analyse all therecommended classes in each slice. Table 1 presents thesevalues for the optimal class number (CN) for experimentalphantom data set.
0 1 2 3 4 5 6 7 8 9
K
−136
−132
−128
−124
−120
−116
−112
−108
−104
−100
BIC
−140
Figure 2: Plot of BIC values for experimental phantom data set,scaled by a factor of 1000.
Table 2: Tumours characteristics for the second data set with 2types of voxels.
TumoursIsotropic voxels Nonisotropic voxels
Position Size Position Size
1 Slice 68 2 voxels Slice 142 2 voxels
2 Slice 57 3 voxels Slice 119 3 voxels
3 Slice 74 2 voxels Slice 155 2 voxels
4.1.2. Simulated Phantom Studies. The second data set con-sists of Monte Carlo simulations of the Zubal anthropomor-phic model where two volumes were generated. The firstvolume contains a matrix with isotropic voxels, the size ofthis volume is 128 × 128 × 180 voxels. The second volumecontains the same matrix of the first one but withoutisotropic voxels, it has a size of 128 × 128 × 375 voxels.The voxel size in both volumes is 5.0625 mm × 5.0625 mm× 2.4250 mm. The second data volume has 3 tumours in thelungs whose characteristics are given in Table 2 [38].
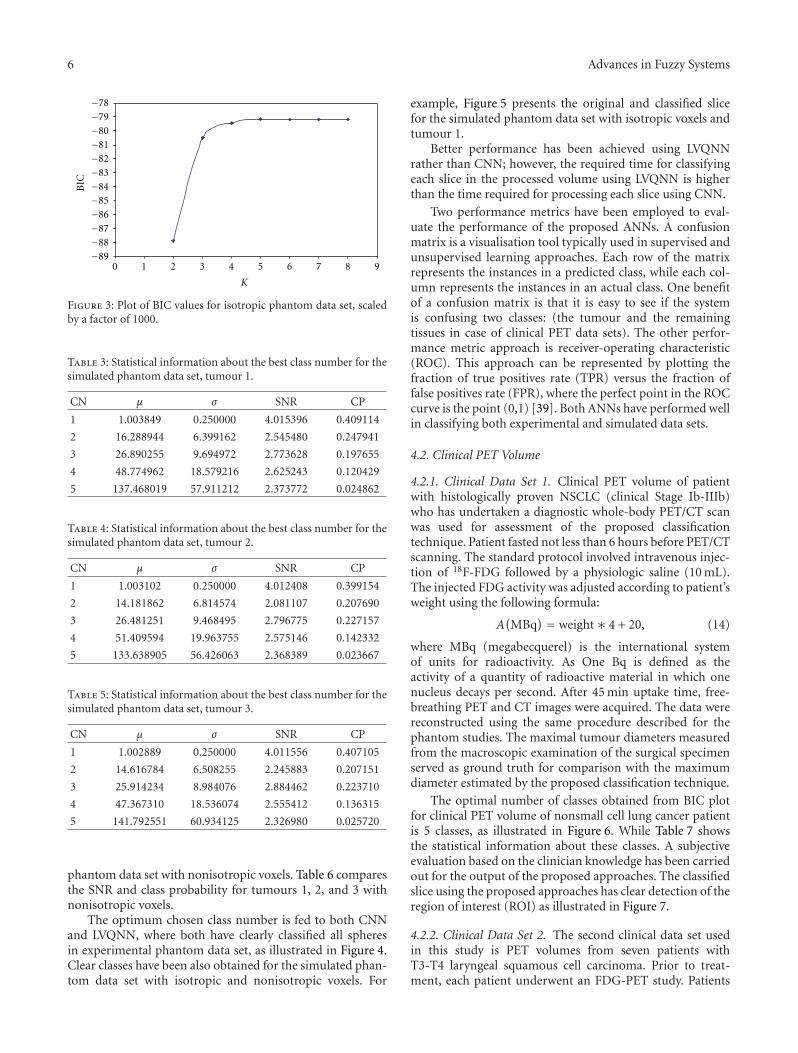
For isotropic voxels in simulated phantom data set, theoptimal class number obtained from BIC plot is 5 classes,as shown in Figure 3. The plot of BIC values flattens to anapproximate plateau at K = 5, and for this reason, thisstatistical model selection test determines 5 to be the mostappropriate number of labels for classifying this data set.The optimal number of classes is the same for tumours 1, 2,and 3. For volume with nonisotropic voxels in the simulatedphantom data set, the optimal number of classes obtainedfrom BIC plot is also 5 classes for all the three tumours.
Table 3 shows the statistical information about the bestnumber of classes for simulated phantom data set, tumour1, with isotropic voxels. While the statistical details abouttumour 2 are presented in Table 4.
Analysing the statistical details about tumour 3 showsthat there is a small difference between the SNR valuescalculated for classes 2, 3, 4, and 5, as presented in Table 5.Similar analysis has been performed for the simulated
6 Advances in Fuzzy Systems
−89−88−87−86−85−84−83−82−81−80−79−78
0 1 2 3 4 5 6 7 8 9
K
BIC
Figure 3: Plot of BIC values for isotropic phantom data set, scaledby a factor of 1000.
Table 3: Statistical information about the best class number for thesimulated phantom data set, tumour 1.
CN μ σ SNR CP
1 1.003849 0.250000 4.015396 0.409114
2 16.288944 6.399162 2.545480 0.247941
3 26.890255 9.694972 2.773628 0.197655
4 48.774962 18.579216 2.625243 0.120429
5 137.468019 57.911212 2.373772 0.024862
Table 4: Statistical information about the best class number for thesimulated phantom data set, tumour 2.
CN μ σ SNR CP
1 1.003102 0.250000 4.012408 0.399154
2 14.181862 6.814574 2.081107 0.207690
3 26.481251 9.468495 2.796775 0.227157
4 51.409594 19.963755 2.575146 0.142332
5 133.638905 56.426063 2.368389 0.023667
Table 5: Statistical information about the best class number for thesimulated phantom data set, tumour 3.
CN μ σ SNR CP
1 1.002889 0.250000 4.011556 0.407105
2 14.616784 6.508255 2.245883 0.207151
3 25.914234 8.984076 2.884462 0.223710
4 47.367310 18.536074 2.555412 0.136315
5 141.792551 60.934125 2.326980 0.025720
phantom data set with nonisotropic voxels. Table 6 comparesthe SNR and class probability for tumours 1, 2, and 3 withnonisotropic voxels.
The optimum chosen class number is fed to both CNNand LVQNN, where both have clearly classified all spheresin experimental phantom data set, as illustrated in Figure 4.Clear classes have been also obtained for the simulated phan-tom data set with isotropic and nonisotropic voxels. For
example, Figure 5 presents the original and classified slicefor the simulated phantom data set with isotropic voxels andtumour 1.
Better performance has been achieved using LVQNNrather than CNN; however, the required time for classifyingeach slice in the processed volume using LVQNN is higherthan the time required for processing each slice using CNN.
Two performance metrics have been employed to eval-uate the performance of the proposed ANNs. A confusionmatrix is a visualisation tool typically used in supervised andunsupervised learning approaches. Each row of the matrixrepresents the instances in a predicted class, while each col-umn represents the instances in an actual class. One benefitof a confusion matrix is that it is easy to see if the systemis confusing two classes: (the tumour and the remainingtissues in case of clinical PET data sets). The other perfor-mance metric approach is receiver-operating characteristic(ROC). This approach can be represented by plotting thefraction of true positives rate (TPR) versus the fraction offalse positives rate (FPR), where the perfect point in the ROCcurve is the point (0,1) [39]. Both ANNs have performed wellin classifying both experimental and simulated data sets.
4.2. Clinical PET Volume
4.2.1. Clinical Data Set 1. Clinical PET volume of patientwith histologically proven NSCLC (clinical Stage Ib-IIIb)who has undertaken a diagnostic whole-body PET/CT scanwas used for assessment of the proposed classificationtechnique. Patient fasted not less than 6 hours before PET/CTscanning. The standard protocol involved intravenous injec-tion of 18F-FDG followed by a physiologic saline (10 mL).The injected FDG activity was adjusted according to patient’sweight using the following formula:
A(MBq
) = weight∗ 4 + 20, (14)
where MBq (megabecquerel) is the international systemof units for radioactivity. As One Bq is defined as theactivity of a quantity of radioactive material in which onenucleus decays per second. After 45 min uptake time, free-breathing PET and CT images were acquired. The data werereconstructed using the same procedure described for thephantom studies. The maximal tumour diameters measuredfrom the macroscopic examination of the surgical specimenserved as ground truth for comparison with the maximumdiameter estimated by the proposed classification technique.
The optimal number of classes obtained from BIC plotfor clinical PET volume of nonsmall cell lung cancer patientis 5 classes, as illustrated in Figure 6. While Table 7 showsthe statistical information about these classes. A subjectiveevaluation based on the clinician knowledge has been carriedout for the output of the proposed approaches. The classifiedslice using the proposed approaches has clear detection of theregion of interest (ROI) as illustrated in Figure 7.
4.2.2. Clinical Data Set 2. The second clinical data set usedin this study is PET volumes from seven patients withT3-T4 laryngeal squamous cell carcinoma. Prior to treat-ment, each patient underwent an FDG-PET study. Patients

Advances in Fuzzy Systems 7
(a) (b)
Figure 4: Experimental phantom data set: (a) original PET image and (b) classified image.
(a) (b)
Figure 5: Simulated phantom data set (tumour 1): (a) original PET and (b) classified image.
−94
−90
−86
−82
−78
−74
−70
−66
0 1 2 3 4 5 6 7 8 9
K
BIC
Figure 6: Plot of BIC values for clinical PET volumes of nonsmallcell lung cancer patient, scaled by a factor of 1000.
were immobilised with a customised thermoplastic mask(Sinmed, Reeuwijk, The Netherlands) fixed to a flat table-top to prevent complex neck movements. First, a 10 mintransmission scan was obtained on the Siemens Exact HRcamera (CTI, Knoxville, USA). Immediately after intra-venous injection of 185–370 MBq (5–10 mCi) of FDG, a 1hdynamic 3D emission scan was performed. It consisted ofeight frames with variable duration ranging from 90 to 600 s.
Table 6: SNR and CP for tumours 1, 2 and 3 in the simulatedphantom data set with nonisotropic voxels.
CNTumour 1 Tumour 2 Tumour 3
SNR CP SNR CP SNR CP
1 4.016184 0.407899 4.013160 0.402693 4.012848 0.396036
2 2.504101 0.239490 2.110565 0.190559 1.962133 0.176196
3 2.814225 0.205216 2.846712 0.222405 2.965170 0.237096
4 2.671825 0.123275 2.557056 0.158497 2.515199 0.161232
5 2.488246 0.024121 2.286361 0.025846 2.224181 0.029441
Table 7: Statistical information about the best class number forclinical PET volume of nonsmall cell lung cancer patient.
CN μ σ SNR CP
1 1.000840 0.250000 4.003360 0.509741
2 2.911473 1.142062 2.549312 0.163043
3 9.035780 4.213254 2.144608 0.146897
4 32.665878 16.455158 1.985145 0.078470
5 167.509276 52.633532 3.182558 0.101848
All images were corrected for dead time, random, scatterattenuation and decay and then reconstructed using a 3DOSEM algorithm, as used in the clinics for patients with

8 Advances in Fuzzy Systems
(a) (b)
Figure 7: Clinical PET data: (a) original PET image and (b) classified image.
−131
−130
−129
−128
−127
−126
−125
−124
0 1 2 3 4 5 6 7 8 9
K
BIC
Figure 8: Plot of BIC values for clinical PET data set 2, scaled by afactor of 1000.
head and neck tumours [40–42]. The size of this data set is128× 128× 47 voxels for each patient.
In the case of clinical data set, the plot of BIC valuesflattens to an approximate plateau at K = 5, and for thisreason, this statistical model selection test determines 5 to bethe most appropriate number of labels for the classificationof this data set. For the data set in question, the K determinedby the BIC plot corresponds precisely to the number of clas-sification levels recommended by clinicians specifically fortumour quantification. The BIC provides a useful objectivemethodology for classification level selection. In particular,the BIC works efficiently for tumour quantification inoncological PET data and can be computed very rapidly.In the case of a volume with dimensionality 128 × 128 ×47 voxels, histogram computation takes approximately 1.9seconds, and thereafter, one BIC value associated with aspecific value of K can be calculated every 1.2 seconds. Thetotal BIC model selection procedure takes approximately 8.4seconds (for K = 2, . . . , 8). The model timings are obtainedusing a single processor, 2.66 GHz, with 3 GB of RAM.
Using the proposed approach the optimum CN foreach patient has been chosen. According to Figure 8 which
0
50
100
150
200
250
300
0 1 2 3 4 5 6
µ
Class number
Patient 1Patient 2Patient 3Patient 4
Patient 5Patient 6Patient 7
Figure 9: Clinical PET data set 2: the μ values for classes one to five.
illustrates the BIC values for different K values (from 2–8),the best CN for this data set is 5 classes. This CN is fed toboth CNN and LVQNN to do the classification for each slicein the processed clinical data set.
All the statistical information about each class in thisdata set has been calculated, Figure 9 illustrates the μ valuesfor each class of clinical data set 2 from patient numberone to patient number seven. The calculated SNR wasimportant to refer to the class which contains the ROI. Asubjective evaluation based on the clinician knowledge hasbeen carried out for the output of the proposed approach.The classified volumes using the proposed approaches havea clear detection of ROI. Laryngeal tumours from sevenpatients were clearly classified, Figure 10 illustrates theoriginal and classified slice for patient 1 data set.

Advances in Fuzzy Systems 9
(a) (b)
Figure 10: Clinical PET data set 2 (patient 1): (a) original PET (128× 128) and (b) classified slice (128× 128).
5. Conclusion
An artificial intelligent statistical approach based on CNNand LVQNN was proposed for 3D oncological PET volumeanalysis. Experimental, simulated, and clinical PET studies ofnonsmall cell lung cancer and pharyngolaryngeal squamouscell carcinoma were used to evaluate the performance of theproposed system. BIC and EM approaches were deployedto obtain the optimal number of classes, which was usedby CNN and LVQNN to classify each slice in the processedPET volume. The mean, standard deviation, signal-to-noiseratio, and class probability were also calculated for eachclass. A detailed objective assessment together with subjectiveevaluation based on clinical knowledge was performed tocharacterise the performance of the proposed approach.Promising results were obtained, and the system appearsto successfully classify and quantify lesions from clinicaloncological PET studies.
Acknowledgments
This paper was supported by the Swiss National ScienceFoundation under Grant SNSF 31003A-125246, GenevaCancer League, and the Indo Swiss Joint Research Pro-gramme ISJRP 138866.
References
[1] H. Zaidi and I. El Naqa, “PET-guided delineation of radiationtherapy treatment volumes: a survey of image segmentationtechniques,” European Journal of Nuclear Medicine and Molec-ular Imaging, vol. 37, no. 11, pp. 2165–2187, 2010.
[2] H. Zaidi, M. Diaz-Gomez, A. Boudraa, and D. O. Slosman,“Fuzzy clustering-based segmented attenuation correction inwhole-body PET imaging,” Physics in Medicine and Biology,vol. 47, no. 7, pp. 1143–1160, 2002.
[3] I. J. Kalet and M. M. Austin-Seymour, “Use of medical imageryin the delivery and planning of radiation therapy,” Journal ofthe American Medical Informatics Association, vol. 4, no. 5, pp.327–339, 1997.
[4] D. W. G. Montgomery and A. Amira, “Automated multiscalesegmentation of oncological cerebral MR image volumes,” inProceedings of the IEEE International Conference on ComputerSystems and Information Technology, 2005.
[5] D. Delbeke and W. H. Martin, “Positron emission tomographyimaging in oncology,” Radiologic Clinics of North America, vol.39, no. 5, pp. 883–917, 2001.
[6] D. A. Mankoff, M. Muzi, and H. Zaidi, “Quantitative analysisin nuclear oncologic imaging,” in Quantitative Analysis of Nu-clear Medicine Images, H. Zaidi, Ed., pp. 494–536, Springer,New York, NY, USA, 2006.
[7] M. Aristophanous, B. C. Penney, and C. A. Pelizzari, “Thedevelopment and testing of a digital PET phantom forthe evaluation of tumor volume segmentation techniques,”Medical Physics, vol. 35, no. 7, pp. 3331–3342, 2008.
[8] H. Vees, S. Senthamizhchelvan, R. Miralbell, D. C. Weber, O.Ratib, and H. Zaidi, “Assessment of various strategies for 18F-FET PET-guided delineation of target volumes in high-gradeglioma patients,” European Journal of Nuclear Medicine andMolecular Imaging, vol. 36, no. 2, pp. 182–193, 2009.
[9] S. Basu, “Selecting the optimal image segmentation strategy inthe era of multitracer multimodality imaging: a critical step forimage-guided radiation therapy,” European Journal of NuclearMedicine and Molecular Imaging, vol. 36, no. 2, pp. 180–181,2009.
[10] G. F. Luger, Artificial Intelligence: Structures and Strategies forComplex Problem Solving, Pearson Education, 2009.
[11] Y. Zhengchun and L. Hongji, “Face detection based on SCNNand wavelet invariant moment in color image,” in Proceedingsof the International Conference on Wavelet Analysis and PatternRecognition (ICWAPR ’07), pp. 783–787, November 2007.
[12] L. Sun and S. Wu, “Handwritten Chinese character recogni-tion based on supervised competitive learning neural networkand block-based relative fuzzy feature extraction,” in Appli-cations of Neural Networks and Machine Learning in ImageProcessing IX, Proceedings of SPIE, pp. 65–70, January 2005.
[13] S. Joo, W. K. Moon, and H. C. Kim, “Computer-aidied diag-nosis of solid breast nodules on ultrasound with digital imageprocessing and artificial neural network,” in Proceedings of the26th Annual International Conference of the IEEE Engineeringin Medicine and Biology Society (EMBC ’04), pp. 1397–1400,September 2004.

10 Advances in Fuzzy Systems
[14] S. G. Mougiakakou, I. Valavanis, K. S. Nikita, A. Nikita, and D.Kelekis, “Characterization of CT liver lesions based on texturefeatures and a multiple neural network classification scheme,”in Proceddings of the 25th Annual International Conferenceof the IEEE Engineering in Medicine and Biology Society, pp.1287–1290, September 2003.
[15] W. E. Reddick, J. O. Glass, E. N. Cook, T. David Elkin, andR. J. Deaton, “Automated segmentation and classification ofmultispectral magnetic resonance images of brain using arti-ficial neural networks,” IEEE Transactions on Medical Imaging,vol. 16, no. 6, pp. 911–918, 1997.
[16] C. C. Reyes-Aldasoro and A. L. Aldeco, “Image segmentationand compression using neural networks,” in Advances in Arti-ficial Perception and Robotics (CIMAT ’00), October 2000.
[17] K. Suzuki, H. Abe, H. MacMahon, and K. Doi, “Image-processing technique for suppressing ribs in chest radio-graphs by means of massive training artificial neural network(MTANN),” IEEE Transactions on Medical Imaging, vol. 25, no.4, pp. 406–416, 2006.
[18] M. Halt, C. C. Le Rest, A. Turzo, C. Roux, and D. Visvikis,“A fuzzy locally adaptive Bayesian segmentation approach forvolume determination in PET,” IEEE Transactions on MedicalImaging, vol. 28, no. 6, pp. 881–893, 2009.
[19] S. Belhassen and H. Zaidi, “A novel fuzzy C-means algorithmfor unsupervised heterogeneous tumor quantification in PET,”Medical Physics, vol. 37, no. 3, pp. 1309–1324, 2010.
[20] Y. Li and Z. Chi, “MR brain image segmentation based on self-organizing map network,” International Journal of InformationTechnology, vol. 11, no. 8, 2005.
[21] M. S. Sharif, A. Amira, and H. Zaidi, “3D oncological PETvolume analysis using CNN and LVQNN,” in Proceedings ofIEEE International Symposium on Circuits and Systems: Nano-Bio Circuit Fabrics and Systems (ISCAS ’10), pp. 1783–1786,June 2010.
[22] C. Collet and F. Murtagh, “Multiband segmentation based ona hierarchical Markov model,” Pattern Recognition, vol. 37, no.12, pp. 2337–2347, 2004.
[23] D. L. Weakliem, “A critique of the Bayesian information cri-terion for model selection,” Sociological Methods and Research,vol. 27, no. 3, pp. 359–397, 1999.
[24] C. T. Volinsky and A. E. Raftery, “Bayesian information cri-terion for censored survival models,” Biometrics, vol. 56, no. 1,pp. 256–262, 2000.
[25] J. T. Bushberg et al., The Essential Physics of Medical Imaging,Lippincott Williams and Wilkins, Philadelphia, Pa, USA, 2006.
[26] G. Dreyfus, Neural Networks Methodology and Applications,Springer, Berlin, Germany, 2005.
[27] B. Curry and P. H. Morgan, “Evaluating Kohonen’s learningrule: an approach through genetic algorithms,” EuropeanJournal of Operational Research, vol. 154, no. 1, pp. 191–205,2004.
[28] S. Clippingdale and R. Wilson, “Self-similar neural networksbased on a Kohonen learning rule,” Neural Networks, vol. 9,no. 5, pp. 747–763, 1996.
[29] M. A. Arbib, The Handbook of Brain Theory and Neural Net-works, Massachusetts Institute of Technology, 2003.
[30] M. Swiercz, J. Kochanowicz, J. Weigele et al., “Learning vectorquantization neural networks improve accuracy of transcra-nial color-coded duplex sonography in detection of middlecerebral artery spasm—preliminary report,” Neuroinformatics,vol. 6, no. 4, pp. 279–290, 2008.
[31] P. Somervuo and T. Kohonen, “Self-organizing maps andlearning vector quantization forfeature sequences,” NeuralProcessing Letters, vol. 10, no. 2, pp. 151–159, 1999.
[32] C. Jonsson, R. Odh, P. O. Schnell, and S. A. Larsson, “A com-parison of the imaging properties of a 3- and 4-ring biographPET scanner using a novel extended NEMA phantom,” inProceedings of IEEE Nuclear Science Symposium and MedicalImaging Conference (NSS-MIC ’07), pp. 2865–2867, November2007.
[33] M. D. R. Thomas, D. L. Bailey, and L. Livieratos, “A dual mo-dality approach to quantitative quality control in emissiontomography,” Physics in Medicine and Biology, vol. 50, no. 15,pp. N187–N194, 2005.
[34] H. Herzog, L. Tellmann, C. Hocke, U. Pietrzyk, M. E. Casey,and T. Kawert, “NEMA NU2-2001 guided performance evalu-ation of four siemens ECAT PET scanners,” IEEE Transactionson Nuclear Science, vol. 51, no. 5, pp. 2662–2669, 2004.
[35] H. Bergmann, G. Dobrozemsky, G. Minear, R. Nicoletti, andM. Samal, “An inter-laboratory comparison study of imagequality of PET scanners using the NEMA NU 2-2001 proce-dure for assessment of image quality,” Physics in Medicine andBiology, vol. 50, no. 10, pp. 2193–2207, 2005.
[36] J. M. Wilson and T. G. Turkington, “Multisphere phantom andanalysis algorithm for PET image quality assessment,” Physicsin Medicine and Biology, vol. 53, no. 12, pp. 3267–3278, 2008.
[37] H. Zaidi, F. Schoenahl, and O. Ratib, “Geneva PET/CT facility:design considerations and performance characteristics of twocommercial (biograph 16/64) scanners,” European Journal ofNuclear Medicine and Molecular Imaging, vol. 34, supplement2, p. S166, 2007.
[38] M. S. Sharif, M. Abbod, A. Amira, and H. Zaidi, “Artificialneural network-based system for PET volume segmentation,”International Journal of Biomedical Imaging, vol. 2010, ArticleID 105610, 11 pages, 2010.
[39] M. Vuk and T. Curk, “ROC curve, lift chart and calibrationplot,” Metodoloski zvezki, vol. 3, no. 1, pp. 89–108, 2006.
[40] J. -F. Daisne, M. Sibomana, A. Bol, G. Cosnard, M. Lonneux,and V. Gregoire, “Evaluation of a multimodality image (CT,MRI and PET) coregistration procedure on phantom andhead and neck cancer patients: accuracy, reproducibility andconsistency,” Radiotherapy and Oncology, vol. 69, no. 3, pp.237–245, 2003.
[41] J. F. Daisne, T. Duprez, B. Weynand et al., “Tumor volume inpharyngolaryngeal squamous cell carcinoma: Comparison atCT, MR imaging, and FDG PET and validation with surgicalspecimen,” Radiology, vol. 233, no. 1, pp. 93–100, 2004.
[42] X. Geets, J. A. Lee, A. Bol, M. Lonneux, and V. Gregoire,“A gradient-based method for segmenting FDG-PET images:methodology and validation,” European Journal of NuclearMedicine and Molecular Imaging, vol. 34, no. 9, pp. 1427–1438,2007.