Representation of Dormant and Active Microbial Dynamics for Ecosystem Modeling
10
Representation of Dormant and Active Microbial Dynamics for Ecosystem Modeling Gangsheng Wang 1,2 *, Melanie A. Mayes 1,2 , Lianhong Gu 1,2 , Christopher W. Schadt 1,3 1 Climate Change Science Institute, Oak Ridge National Laboratory, Oak Ridge, Tennessee, United States of America, 2 Environmental Sciences Division, Oak Ridge National Laboratory, Oak Ridge, Tennessee, United States of America, 3 Biosciences Division, Oak Ridge National Laboratory, Oak Ridge, Tennessee, United States of America Abstract Dormancy is an essential strategy for microorganisms to cope with environmental stress. However, global ecosystem models typically ignore microbial dormancy, resulting in notable model uncertainties. To facilitate the consideration of dormancy in these large-scale models, we propose a new microbial physiology component that works for a wide range of substrate availabilities. This new model is based on microbial physiological states and the major parameters are the maximum specific growth and maintenance rates of active microbes and the ratio of dormant to active maintenance rates. A major improvement of our model over extant models is that it can explain the low active microbial fractions commonly observed in undisturbed soils. Our new model shows that the exponentially-increasing respiration from substrate-induced respiration experiments can only be used to determine the maximum specific growth rate and initial active microbial biomass, while the respiration data representing both exponentially-increasing and non-exponentially-increasing phases can robustly determine a range of key parameters including the initial total live biomass, initial active fraction, the maximum specific growth and maintenance rates, and the half-saturation constant. Our new model can be incorporated into existing ecosystem models to account for dormancy in microbially-driven processes and to provide improved estimates of microbial activities. Citation: Wang G, Mayes MA, Gu L, Schadt CW (2014) Representation of Dormant and Active Microbial Dynamics for Ecosystem Modeling. PLoS ONE 9(2): e89252. doi:10.1371/journal.pone.0089252 Editor: Jonathan H. Badger, J. Craig Venter Institute, United States of America Received October 31, 2013; Accepted January 17, 2014; Published February 18, 2014 This is an open-access article, free of all copyright, and may be freely reproduced, distributed, transmitted, modified, built upon, or otherwise used by anyone for any lawful purpose. The work is made available under the Creative Commons CC0 public domain dedication. Funding: This research was funded by the Laboratory Directed Research and Development (LDRD) Program of the Oak Ridge National Laboratory (ORNL) and by the U.S. Department of Energy Biological and Environmental Research (BER) program. ORNL is managed by UT-Battelle, LLC, for the U.S. Department of Energy under contract DE-AC05-00OR22725. The funders had no role in study design, data collection and analysis, decision to publish, or preparation of the manuscript. Competing Interests: The authors have declared that no competing interests exist. * E-mail: [email protected] Introduction Ecologically-important processes such as soil organic carbon and nutrient cycling largely depend on the active fraction of microbial communities [1]. At any given time in a given environment, microorganisms can be in active, dormant, or dead states [2]. Dormancy is considered an evolutionary strategy designed to maintain the genetic code until conditions improve to allow replication [3]. When environmental conditions are unfavorable for growth, e.g., resource limitation, microbes may enter a reversible state of low to zero metabolic activity to alleviate the loss of biomass and metabolic functions [4,5]. The mainte- nance coefficient (i.e., maintenance cost of C per unit microbial biomass C per unit time) can be two to three orders of magnitude lower in dormant microbes than in metabolically active microbes [6,7]. Many soils have slow organic matter turnover rates with seasonal changes in substrate supply, temperature, and moisture. The complexity of soils in space and time may result in uneven distributions of multiple potentially limiting resources, leading to significant rates of dormancy even when some resources are abundant. When spatial and temporal complexity is combined with differential resource partitioning among species in a community, high rates of dormancy could be a prominent feature in soil systems. Thus it is essential to understand dormancy in order to more accurately predict how active microorganisms contribute to ecosystem processes such as decomposition and nutrient turnover [1]. A complicating factor in studying microbial dormancy is that no single approach can be easily employe to simultaneously measure individual microbial states (active, dormant or dead), and a combination of different techniques is required. Differential staining is often used to segregate physiological states with direct microscopic counting of bacteria and fungi. ‘Life-indicating’ stains that require the presence of ‘standard’ physiological abilities, such as the esterase activity needed for fluorescein diacetate cleavage, may distinguish active from dormant+dead cells [8]. When combined with general-purpose stains, these strains can distinguish dormant cells by difference [9]. Combining membrane-permeant with membrane-impermeant nucleophilic stains (e.g., SYTO-9 and propidium iodide respectively) may distinguish live from dead, but not active from dormant [10,11]. Active microbes may or may not be ‘viable’ with common culture-based techniques, which complicates classification and measurement of dormancy phe- nomena [5]. Methods such as direct plating, serial dilution and most probable number (MPN) techniques will not distinguish between active and dormant organisms [12]. Substrate Induced Respiration (SIR) or Substrate Induced Growth Response (SIGR) method [13,14] can distinguish active and dormant communities if growth respiration curves are modeled (using initial exponentially- increasing respiration); however, the technique often needs to be PLOS ONE | www.plosone.org 1 February 2014 | Volume 9 | Issue 2 | e89252
Transcript of Representation of Dormant and Active Microbial Dynamics for Ecosystem Modeling

Representation of Dormant and Active MicrobialDynamics for Ecosystem ModelingGangsheng Wang1,2*, Melanie A. Mayes1,2, Lianhong Gu1,2, Christopher W. Schadt1,3
1 Climate Change Science Institute, Oak Ridge National Laboratory, Oak Ridge, Tennessee, United States of America, 2 Environmental Sciences Division, Oak Ridge
National Laboratory, Oak Ridge, Tennessee, United States of America, 3 Biosciences Division, Oak Ridge National Laboratory, Oak Ridge, Tennessee, United States of
America
Abstract
Dormancy is an essential strategy for microorganisms to cope with environmental stress. However, global ecosystemmodels typically ignore microbial dormancy, resulting in notable model uncertainties. To facilitate the consideration ofdormancy in these large-scale models, we propose a new microbial physiology component that works for a wide range ofsubstrate availabilities. This new model is based on microbial physiological states and the major parameters are themaximum specific growth and maintenance rates of active microbes and the ratio of dormant to active maintenance rates.A major improvement of our model over extant models is that it can explain the low active microbial fractions commonlyobserved in undisturbed soils. Our new model shows that the exponentially-increasing respiration from substrate-inducedrespiration experiments can only be used to determine the maximum specific growth rate and initial active microbialbiomass, while the respiration data representing both exponentially-increasing and non-exponentially-increasing phasescan robustly determine a range of key parameters including the initial total live biomass, initial active fraction, the maximumspecific growth and maintenance rates, and the half-saturation constant. Our new model can be incorporated into existingecosystem models to account for dormancy in microbially-driven processes and to provide improved estimates of microbialactivities.
Citation: Wang G, Mayes MA, Gu L, Schadt CW (2014) Representation of Dormant and Active Microbial Dynamics for Ecosystem Modeling. PLoS ONE 9(2): e89252.doi:10.1371/journal.pone.0089252
Editor: Jonathan H. Badger, J. Craig Venter Institute, United States of America
Received October 31, 2013; Accepted January 17, 2014; Published February 18, 2014
This is an open-access article, free of all copyright, and may be freely reproduced, distributed, transmitted, modified, built upon, or otherwise used by anyone forany lawful purpose. The work is made available under the Creative Commons CC0 public domain dedication.
Funding: This research was funded by the Laboratory Directed Research and Development (LDRD) Program of the Oak Ridge National Laboratory (ORNL) and bythe U.S. Department of Energy Biological and Environmental Research (BER) program. ORNL is managed by UT-Battelle, LLC, for the U.S. Department of Energyunder contract DE-AC05-00OR22725. The funders had no role in study design, data collection and analysis, decision to publish, or preparation of the manuscript.
Competing Interests: The authors have declared that no competing interests exist.
* E-mail: [email protected]
Introduction
Ecologically-important processes such as soil organic carbon
and nutrient cycling largely depend on the active fraction of
microbial communities [1]. At any given time in a given
environment, microorganisms can be in active, dormant, or dead
states [2]. Dormancy is considered an evolutionary strategy
designed to maintain the genetic code until conditions improve
to allow replication [3]. When environmental conditions are
unfavorable for growth, e.g., resource limitation, microbes may
enter a reversible state of low to zero metabolic activity to alleviate
the loss of biomass and metabolic functions [4,5]. The mainte-
nance coefficient (i.e., maintenance cost of C per unit microbial
biomass C per unit time) can be two to three orders of magnitude
lower in dormant microbes than in metabolically active microbes
[6,7]. Many soils have slow organic matter turnover rates with
seasonal changes in substrate supply, temperature, and moisture.
The complexity of soils in space and time may result in uneven
distributions of multiple potentially limiting resources, leading to
significant rates of dormancy even when some resources are
abundant. When spatial and temporal complexity is combined
with differential resource partitioning among species in a
community, high rates of dormancy could be a prominent feature
in soil systems. Thus it is essential to understand dormancy in
order to more accurately predict how active microorganisms
contribute to ecosystem processes such as decomposition and
nutrient turnover [1].
A complicating factor in studying microbial dormancy is that no
single approach can be easily employe to simultaneously measure
individual microbial states (active, dormant or dead), and a
combination of different techniques is required. Differential
staining is often used to segregate physiological states with direct
microscopic counting of bacteria and fungi. ‘Life-indicating’ stains
that require the presence of ‘standard’ physiological abilities, such
as the esterase activity needed for fluorescein diacetate cleavage,
may distinguish active from dormant+dead cells [8]. When
combined with general-purpose stains, these strains can distinguish
dormant cells by difference [9]. Combining membrane-permeant
with membrane-impermeant nucleophilic stains (e.g., SYTO-9
and propidium iodide respectively) may distinguish live from dead,
but not active from dormant [10,11]. Active microbes may or may
not be ‘viable’ with common culture-based techniques, which
complicates classification and measurement of dormancy phe-
nomena [5]. Methods such as direct plating, serial dilution and
most probable number (MPN) techniques will not distinguish
between active and dormant organisms [12]. Substrate Induced
Respiration (SIR) or Substrate Induced Growth Response (SIGR)
method [13,14] can distinguish active and dormant communities if
growth respiration curves are modeled (using initial exponentially-
increasing respiration); however, the technique often needs to be
PLOS ONE | www.plosone.org 1 February 2014 | Volume 9 | Issue 2 | e89252
combined with microscopy or chloroform fumigation/extraction
in order to obtain total live microbial biomass [15,16].
Despite limitations in distinguishing active, dormant and dead
microbial biomass, abundant evidence indicates that the majority
of environmental microorganisms in a given community may be
dormant under natural conditions [1,17]. Alvarez et al. [18]
reported that only 3.8–9.7% of the total biomass is active in a
Typic Argiudoll soil from the Argentinean Pampa. Khomutova et
al. [19] showed that the fraction of active microbial biomass
ranged from 0.02% to 19.1% in the subkurgan paleosoils of
different age and 9.2–24.2% in modern background soils.
Microbial biomass measured through SIR or SIGR is thought to
reflect only the active portion because the maintenance respiration
of dormancy biomass is negligible in the initial exponentially-
increasing phase [13,16,20]. Through a mathematical analysis of
respiration curves, Van de Werf & Verstraete [21] examined 16
soils and found that 4–49% of the total biomass was in an active
state; and the active component in undisturbed natural ecosystems
(18.868.8%, mean6standard deviation) was about 70% of that in
arable agricultural soils (25.7614.8%). Stenstrom et al. [22]
showed that the fraction of active biomass typically varied from
5% to 20% in soils without recent addition of substrates. Lennon
& Jones [5] found much lower active fractions in soils (18615%)
than in marine (65619%) and fresh (54611%) water environ-
ments. From the above studies it seems conservative to extrapolate
that the active fraction is very likely below 50% of live microbes
under most natural soil conditions.
Microbially-mediated processes have been incorporated into
ecosystem models [23–28] although continued development is still
required to bring microbial processes into global climate models
[29–31]. However, these recent models do not consider physio-
logical state changes and assume that measures of microbial
biomass constitute the active biomass. The exclusion of dormancy
from the microbially-driven ecosystem processes could result in
incorrect estimates of total live microbial biomass, which further
leads to deficiencies in model parameterization and predictions of
soil organic carbon and nutrients.
Generally, there are two strategies to represent physiological
states in microbial-ecology models: one is to explicitly separate the
total live biomass into two pools, i.e., active and dormant [4,32];
the other is to directly regard the active fraction (i.e., ratio of active
biomass to total live biomass) as a state variable [33,34]. Both of
these two approaches predict the total live biomass, active and
dormant biomass, and the flux between the active and dormant
components. Apparently the introduction of the ‘active fraction’ as
a state variable in the latter approach simplifies the model
structure since the adaptive variation of microbial composition
might be represented by one single variable (active fraction)
[34,35]. However, another state variable indicating the microbial
biomass pool size (e.g., total live biomass, active biomass or
dormant biomass) is still essential for ecosystem modeling since the
carbon and nutrient fluxes are pool-size dependent. For example,
if we define active fraction and total microbial biomass as state
variables, the active and dormant biomass could be determined by
them, and the net flux between active and dormant fractions and
other related fluxes could also be computed according to the active
and dormant biomass constrained by mass balance. The above-
mentioned modeling efforts have shown that adequate represen-
tation of dormancy and the transitions between the dormant and
active states is crucial for modeling important microbially-
mediated ecosystem processes.
Here, we review state-of-the-art microbial dormancy modeling
approaches and discuss the rationales of these models with a focus
on transformation processes between active and dormant states.
We propose an improved synthetic microbial physiology model
based on accepted assumptions and examine the model behavior
with theoretical and experimental analyses. In this paper, the ‘total
microbial biomass’ refers to the ‘total live microbial biomass’
unless otherwise stated. Our objective is to clarify the applicability
of existing microbial dormancy models and provide a new
theoretical basis for representing microbial activity and dormancy
in ecosystem models.
Dormancy In Microbial Models
Transformation between active and dormant statesAlthough Buerger et al. [36] argued that dormant microbial cells
could reactivate stochastically and might be independent of
environmental cues, environmental factors such as substrate
availability are often thought to control the transformation
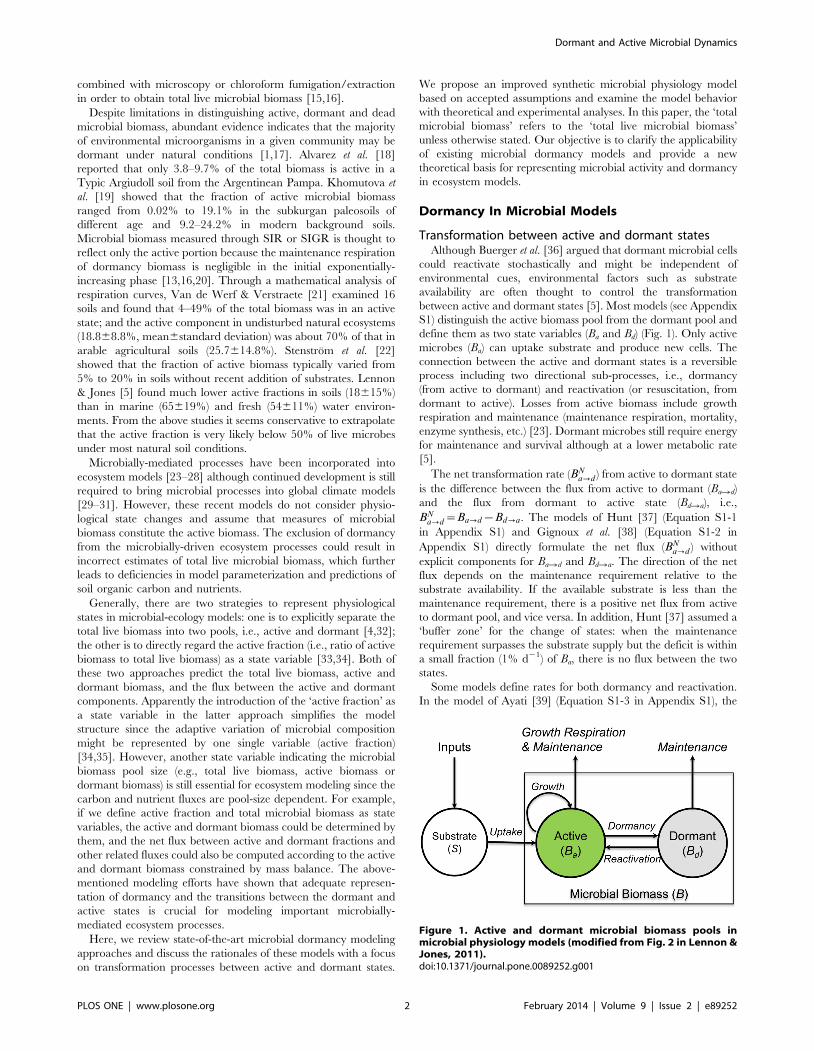
between active and dormant states [5]. Most models (see Appendix
S1) distinguish the active biomass pool from the dormant pool and
define them as two state variables (Ba and Bd) (Fig. 1). Only active
microbes (Ba) can uptake substrate and produce new cells. The
connection between the active and dormant states is a reversible
process including two directional sub-processes, i.e., dormancy
(from active to dormant) and reactivation (or resuscitation, from
dormant to active). Losses from active biomass include growth
respiration and maintenance (maintenance respiration, mortality,
enzyme synthesis, etc.) [23]. Dormant microbes still require energy
for maintenance and survival although at a lower metabolic rate
[5].
The net transformation rate (BNa?d ) from active to dormant state
is the difference between the flux from active to dormant (BaRd)
and the flux from dormant to active state (BdRa), i.e.,
BNa?d~Ba?d{Bd?a. The models of Hunt [37] (Equation S1-1
in Appendix S1) and Gignoux et al. [38] (Equation S1-2 in
Appendix S1) directly formulate the net flux (BNa?d ) without
explicit components for BaRd and BdRa. The direction of the net
flux depends on the maintenance requirement relative to the
substrate availability. If the available substrate is less than the
maintenance requirement, there is a positive net flux from active
to dormant pool, and vice versa. In addition, Hunt [37] assumed a
‘buffer zone’ for the change of states: when the maintenance
requirement surpasses the substrate supply but the deficit is within
a small fraction (1% d21) of Ba, there is no flux between the two
states.
Some models define rates for both dormancy and reactivation.
In the model of Ayati [39] (Equation S1-3 in Appendix S1), the
Figure 1. Active and dormant microbial biomass pools inmicrobial physiology models (modified from Fig. 2 in Lennon &Jones, 2011).doi:10.1371/journal.pone.0089252.g001
Dormant and Active Microbial Dynamics
PLOS ONE | www.plosone.org 2 February 2014 | Volume 9 | Issue 2 | e89252

dormant rate (caRd) increases with declining substrate concentra-
tion, and the reactivation (cdRa) only occurs when substrate
concentration is higher than the half-saturation constant (Ks).
Konopka [32] modified the potential rates for dormancy and
reactivation by the relative growth rate (m/mmax, ratio of true
specific growth rate to maximum specific growth rate), i.e, the two
rates are multiplied by (1-m/mmax) and m/mmax, respectively
(Equation S1-4 in Appendix S1). Similarly, Jones & Lennon [40]
postulated two complementary rates (1-R and R) for dormancy and
resuscitation (Equation S1-5 in Appendix S1).
Two other models also explicitly formulate the two conversion
rates between states but do so using concepts of probability. Bar et
al. [41] used two complementary factors (1-J and J) to represent
the probability for the transition between active and dormant state
in addition to an identical potential rate constant for the two
processes (Equation S1-6 in Appendix S1). The conceptual model
of Locey [42] applies a deterministic dormant rate and a stochastic
resuscitation rate (Equation S1-7 in Appendix S1). The potential
resuscitation rate is modified by (1-p), where p is the probability
that a disturbance in the active pool will result in the immigration
of one individual from the metacommunity. The probability (J) in
Bar et al. [41] is explicitly calculated from the environmental cues
(e.g., soil moisture), while the cause of the probability (p) in Locey
[42] is not elucidated.
Switch function modelIn addition to the dormancy and reactivation processes, a key
concept in the model developed by Stolpovsky et al. [4] is ‘switch
function’ (Equation S1-8 in Appendix S1). The switch function (h)
determines the fraction of active cells taking up dissolved organic
carbon (DOC). This function refers to the growth fraction in active
biomass (Ba) that consumes substrate and thus is not the same as
the active fraction (r) in total biomass (B). Furthermore, the
dormancy and reactivation fluxes are set to be proportional to (1-h)
and h, respectively. h is formulated by the Fermi-Dirac statistics
[4]. Another feature of this model is the consideration of ‘depth’ of
dormancy in reactivation, where the reactivation rate is negatively
dependent on the duration of dormancy. The switch function
model includes at least 15 model parameters and it is difficult to
compute the Gibbs energy change of the oxidation of DOC [4].
The switch function (h) sets it apart from the conventional
Michaelis-Menten (M-M) or Monod kinetics because of its new
perspective of thermodynamics. According to the M-M kinetics
[43], the substrate saturation level represents the fraction of
enzyme-substrate complex (ES) in active enzyme (E0), where the
substrate saturation level is formulated by S/(Ks + S) with S and Ks
being the substrate concentration and the half-saturation constant
[43]. When the M-M kinetics is applied to describe microbial
uptake of substrate, the substrate (or combined with TEA)
saturation level (i.e., m(S, TEA) in Equation S1-8a of Appendix
S1) is a measure of the actively growing fraction in the active
microbial community. The switch function is also determined by
the saturation levels of substrate and terminal electron acceptor
(TEA), i.e., m(S, TEA) (Equation S1-8e in Appendix S1).
Mathematically the inclusion of both the switch function (h) and
the M-M kinetics (i.e., m(S, TEA)) might result in double counting
of the impact of substrate and TEA. We would recommend using
the switch function (h) to modify the microbial uptake rate if the
Gibbs energy change of the oxidation of substrate (DG) is tractable
and the thermodynamic threshold (G0) and the steepness of the
step function (st) are identifiable.
Physiological state index modelsAs an alternative to models with two microbial biomass pools
(i.e., active and dormant), a further state variable indicating the
dormant or active fraction in total biomass has been proposed.
Wirtz [44] developed a simple index (rd = 0.5–1.0) representing the
dormant microbial biomass as a fraction of the steady-state total
biomass (Bstat) under the condition of Bd ,, Ba. In case of a net
loss of total biomass (dB/dt,0), the dormant biomass Bd = Bstat? rd;
otherwise (dB/dt.0), Bd = Bstat?(12rd). This model has a sudden
change of dormant biomass at the transition point (i.e., dB/dt = 0)
since rd.0.5.
Different from the dormant index of Wirtz [44], the concept of
an active index (i.e., index of physiological state) of soil microbial
community has been employed in soil carbon and nutrient cycling
models [33,34]. The index of physiological state (r), referring to the
activity state, is often defined as the ratio of metabolically active
microbial biomass to the total soil microbial biomass [22,33,34].
In the Synthetic Chemostat Model (SCM), the rate of change of
the state variable r is described as follows [33,45]:
dr
dt~
1
B
dB
dt:(w{r)~m:(w{r) ð1Þ
with
w~w(S)~Sn=(KrzSn),orw~S=(KrzS) ð2Þ
where r = Ba/B, representing the fraction (hereinafter referred to as
‘active fraction’) of active biomass in total biomass; m is the specific
growth rate of total biomass; w denotes the saturation level of
substrate (S); the simple power (n = 1) has been widely used [35]
and, in this case (n = 1), Kr is called the half-saturation constant.
Blagodatsky & Richter [34] used the expression
m(S)~mmax:w(S) in their model development. This expression
was not derived in the original definition of the specific growth rate
(see Equation 3) by Panikov [45] and because its validity cannot be
inferred, the concepts will not be addressed here.
According to Panikov’s derivation [45], the specific growth rate
(m) follows the general definition [46,47]:
m~1
B
dB
dtð3Þ
Based on Equations 1 and 3, we can derive (see Equation S2-1
in Appendix S2):
dBa=dt~w:(dB=dt) ð4Þ
dBd=dt~(1{w):(dB=dt) ð5Þ
We find that the model described by Equation 1 is not
applicable under low substrate availability, as described below.
Generally, the rates of change in biomass pools (B, Ba, and Bd) can
be expressed as
dB=dt~g+(S,Ba){f z(S,Bd ) ð6Þ
Dormant and Active Microbial Dynamics
PLOS ONE | www.plosone.org 3 February 2014 | Volume 9 | Issue 2 | e89252

dBa=dt~g+(S,Ba){BNa?d ð7Þ
dBd=dt~{f z(S,Bd )zBNa?d ð8Þ
where BNa?d denotes the net dormancy flux; g (S, Ba) is a function
that represents the difference between the substrate uptake and the
maintenance requirements of Ba, i.e., the net growth of Ba; and
f+(S, Ba) is a function denoting the maintenance and survival
energy costs of Bd. The superscript ‘6’ in g indicates the function
value of g could be positive at high S or non-positive when the
substrate uptake cannot satisfy the maintenance requirements of
Ba at low S. The superscript ‘+’ in f+ implies f$0. Note that the
function f+(S, Ba) is not necessarily dependent on S [4].
From Equations 4, 6 and 7, we can obtain
BNa?d~(1{w):g+(S,Ba){w:f z(S,Bd ) ð9Þ
The two terms in the right side of Equation 9 may be regarded
as the conversion of Ba to Bd (i.e., BaRd) and the transformation of
Bd to Ba (i.e., BdRa), respectively. At high S resulting in g$0,
Equation 9 may be one of the possible expressions for BaRd and
BdRa. However, at low S leading to g,0 and BaRd,0, i.e., no
active cells become dormant under insufficient substrate, which is
inconsistent with the strategy of dormancy for microorganisms
when faced with unfavorable environmental conditions [5].
Based on the above analysis, we conclude that the physiological
state index model (Equation 1) needs to be improved. In other
words, the empirical assumption that the steady state active
fraction (rss) approaches the substrate saturation level (wss) may not
be necessary because this assumption could lead to impractical flux
(Equation 9) between dormant and active states under low
substrate availability.
A Synthetic Microbial Physiology ModelBased on the aforementioned review and analysis, we have
developed a synthetic microbial physiology model component
relating to substrate availability. As indicated by Fig. 1, the growth
and maintenance functions of active microbes (Ba) are character-
ized by the maximum specific growth rate (mG) and maintenance
rate (mR); whereas the dormant microbes (Bd) cost energy to
maintain their basic cellular functions at a much lower specific
maintenance rate (denoted by b?mR, where b,1) [48].
General assumptionsFirst we define the substrate saturation level (w) as
w~S=(KSzS) ð10Þ
where the parameter Ks is the half saturation constant for
substrate uptake as indicated by the M-M kinetics [43].
Based on the above review of existing dormancy models, the
following assumptions are accepted in our new model: (1) the
dormancy rate is proportional to the active biomass and the
reactivation rate is proportional to the dormant biomass, i.e.,
Ba?d!Ba and Bd?a!Bd ; (2) under very high substrate concen-
tration (S..Ks), wR1, BaRdR0 and BdRa$0; (3) under very low
substrate (S,,Ks), wR0, BaRd$0 and BdRaR0; (4) based on the
assumptions (1–3), we derive that Ba?d!(1{w):Ba and
Bd?a!w:Ba; (5) further we assume that the maximum specific
maintenance rate for active microbes (mR with units of h21)
controls both transformation processes since the maintenance
energy cost is the key factor regulating the dormancy strategy
[5,37,38]. As a result we postulate that
Ba?d~(1{w):mR:Ba ð11aÞ
Bd?a~w:mR:Bd ð11bÞ
Model Description
Equations 11a and 11b only describe the transformation
between the active and dormant states. They need to be linked
to a microbial growth and maintenance model for depicting
microbial dynamics. Our recent work to develop the Microbial-
ENzyme-mediated Decomposition (MEND) model [23] suggested
that it might be adapted to serve this purpose due to its focus on
microbial processes for which we have developed a firm theoretical
basis [47,49]. Combining Equations 11a and 11b with the MEND
model [23,47], we express the microbial physiology component
(see Fig. 1) as a group of differential equations
dS=dt~Is{1
YG
: w
amR
:Ba ð12aÞ
dB=dt~d(BazBd )=dt~(w=a{1):mR:Ba{ b:mRð Þ:Bd ð12bÞ
dBa=dt~(w=a{1):mR:Ba{(1{w):mR
:Bazw:mR:Bd ð12cÞ
dBd=dt~{ b:mRð Þ:Bdz(1{w):mR:Ba{w:mR
:Bd ð12dÞ
where t is the time scale; w is defined by Equation 10; Is is the input
to substrate pool; YG is the true growth yield; mR denotes the
specific maintenance rate at active state (h21); a = mR/(mG+mR) is
the ratio of mR to the sum of maximum specific growth rate (mG)
and mR, a [ (0,0:5) since usually mR#mG; and b (0–1) is the ratio of
dormant maintenance rate to active maintenance rate, i.e., (b mR)
denotes the maximum specific maintenance rate at dormant state.
In summary, there are five parameters (a, b, mR or mG, YG, Ks) in
the proposed model (hereinafter referred to as the MEND model).
From Equations 12b and 12c, we can derive the change rate of
active fraction (r) (see Equation S2-2 in Appendix S2)
dr=dt~mR: (w{r)z(w=azb{1):r:(1{r)½ � ð12eÞ
This equation for r is more complicated than Equation 1 but still
practical, given currently available data. Additionally, it implies
that r needs not approach w at steady state in our model, whereas
r;w at steady state is required by the model of Panikov [45].
Steady state analysisAssuming the input (Is) is time-invariant, we can obtain the
steady state solution to the above new MEND model (see
Equations S2-3(a–e) in Appendix S2). Fig. 2 shows the steady
Dormant and Active Microbial Dynamics
PLOS ONE | www.plosone.org 4 February 2014 | Volume 9 | Issue 2 | e89252
+
+

state active fraction (rss) and substrate saturation level (wss) as a
function of the two physiological indices, i.e., a (0–0.5) and b (0–1).
Both rss and wsspositively depend on a and b and rss$wss
for any
combinations of a and b. If we consider two extreme values of
bR0 or bR1, the rss and wss(see Equations S2-4 and S2-5 in
Appendix S2) can be simplified to
rssb?0~wss
b?0~a ð13aÞ
rssb?1~
1zffiffiffiffiffiffiffiffiffi1z8ap
4
wssb?1~
4a{1zffiffiffiffiffiffiffiffiffi1z8ap
3zffiffiffiffiffiffiffiffiffi1z8ap
8<: ð13bÞ
Equation 13 and Fig. 2 indicate that: (1) the steady state active
fraction (rss) is equal to wssand they are identical to a = mR/(mG+mR)
only under the condition of bR0; (2) the upper bound of rss is
approximately 0.8 at aR0.5 and bR1; and (3) with a#0.5, the
maximum rss is ca. 0.5 if the magnitude of b is around 0.001–0.01
[6]. This threshold value (0.5) of rss is a reasonable estimate that
can explain how the measured active fraction of microbes in
undisturbed soils is usually considerably less than the total biomass
[5,21,22].
Model simplification under sufficient substrate conditionAs mentioned in the Introduction, SIR or SIGR method can
distinguish active from dormant composition and the data from
these experiments have been widely used to estimate the active
microbial biomass and the maximum specific growth rate [13,14].
The simplification of the microbial model under excess substrate
has also been employed to estimate maximum specific growth rate
(mG), active microbial biomass (Ba), and/or total microbial biomass
(B) using the SIR or SIGR data [1,13,35]. Here we show the
simplification of our model (Equation 12) for conditions appro-
priate to SIGR or SIR experiments, e.g., the short-term period of
exponentially-increasing respiration of active biomass following
substrate addition. We will test our reduced and full model with
the SIGR data of Colores et al. [13] in the next section.
Under sufficient substrate (i.e., S..Ks in Equation 10 thus
wR1), Equations 12(a–e) can be simplified and integrated for
initial conditions, i.e., S = S0, B = B0 and r = r0 at t = 0 (see
Equations S2-6 and S2-7 in Appendix S2):
S(t)~S0{B(t){B0YG (1{a)
ð14aÞ
B(t)~B0r0:e 1=a{1ð ÞmRtz
B0(1{r0):½a:e 1=a{1ð ÞmRtz(1{a):e{mRt�ð14bÞ
r(t)~½r0za(1{r0)�:e mR=að Þ:t{a(1{r0)
½r0za(1{r0)�:e mR=að Þ:tz(1{a)(1{r0)ð14cÞ
The CO2 production rate, v(t), during the exponential growth
stage is derived as an explicit function of t (see Equation S2-7d in
Appendix S2):
v(t)~dCO2
dt~
B0(1{YG)
YG
(mR=a):r0zmR:(1{r0)½ �:e 1=a{1ð ÞmRt{ mR
:(1{r0)½ �:e{mRtn o ð14dÞ
The respiration rate, v(t), is associated with two exponential
items, i.e., e 1=a{1ð ÞmRt~emGtand e{mRt. Considering an extreme
case that mR,,mG (i.e., aR0), Equations 14(b–d) can be further
simplified to Equations S2-8(b–d) (see Appendix S2). Equations
S2-8b and S2-8c (denoting B(t) and r(t), respectively) are similar to
Equations 11 and 10 in Panikov & Sizova [35], respectively.
However, Equation S2-8d (for v(t)) is different from Equation 13 of
Panikov & Sizova [35], where a constant ‘A’ was added to the
exponential. Equation S2-8d is identical to Equation 7 derived for
SIGR experiments in Colores et al. [13].
Panikov & Sizova [35] used their Equation 13 to fit respiration
rates during the exponentially-increasing (i.e., no substrate
limitation) phase (see Fig. 2 in Panikov & Sizova [35] for data
and curve fittings). However, these data are based on glucose-
induced respiration that includes both basal respiration of native
SOC and respiration due to the addition of glucose [13]. The
basal respiration rate may be regarded as a constant in certain
cases (see Colores et al. [13] and data in Fig. 1 of Blagodatsky et al.
[50]). The constant ‘A’ representing the basal respiration rate was
included in Equation 13 of Panikov & Sizova [35] in order to fit
the combined respiration from the addition of glucose and basal
respiration. However, this constant ‘A’ cannot be derived from
such governing equations as Equations S2-6(a–c) (see Appendix
S2) that assume respiration is the sole result of substrate addition.
In other words, the equations do not include basal respiration.
Certainly, our predicted respiration could include basal respiration
as long as (i) a basal respiration rate is added to Eq. 14d ad hoc or
(ii) Equations S2-6(a–c), or more commonly Equations 12(a–e), are
linked to a soil organic matter (SOM) decomposition model, which
can produce decomposed native soil C in addition to the
respiration of substrate addition. Because Equation 13 of Panikov
& Sizova [35] is not linked to a native C decomposition model,
fitting the model to combined native C and substrate respiration
data is not appropriate.
Model test I: substrate-induced respirationIn this section, we used the respiration data from 14C-labeled
glucose SIGR experiments by Colores et al. [13] to calibrate our
Figure 2. Steady state active fraction (rss) and substratesaturation level ( ss) as a function of a and b; a = mR/(mG+mR),mG and mR (h21) are maximum specific growth rate and specificmaintenance rate for active microbial biomass, respectivly; bdenotes the ratio of dormant specific maintenance rate to mR.doi:10.1371/journal.pone.0089252.g002
ð14dÞ
Dormant and Active Microbial Dynamics
PLOS ONE | www.plosone.org 5 February 2014 | Volume 9 | Issue 2 | e89252
w

MEND model. The respiration data only represented the CO2
production from the added substrate and did not include basal
respiration from the native C.
First we employed Equation 14d to fit the respiration rates
during the exponentially-increasing stage and the result is shown
in Fig. 3a (see original data in Fig. 3 of Colores et al. [13]). The
true growth yield (YG) was set to 0.5 according to Colores et al.
[13]. There are four undetermined parameters (B0, r0, mG, a) in
Equation 14d (with mR = mG ?a/(12a)). We found that only the
maximum specific growth rate (mG) could be determined with high
confidence (coefficient of variation (CV) = 5%) from the exponen-
tially-increasing respiration rates. The CVs of the other three
optimized parameters (B0, r0, a) were as high as 55–77% (Table 1).
However, the initial active microbial biomass (Ba0 = B06r0) had a
lower uncertainty (CV = 20%) compared to B0 and r0. The above
results indicate that the exponentially-increasing respiration rates
can only be used to obtain mG and Ba0.
We then conducted numerical simulations in terms of all data
including both exponentially-increasing and non-exponentially-
increasing respiration rates (Fig. 3b). The non-exponentially-
increasing respiration rates include the lag period before the
exponentially-increasing phase and the respiration at longer times
after the rates cease to increase exponentially [13]. The latter
phase is likely because of the substrate saturation levels (w) become
limiting to respiration. We used Equations 12a, 12b, 12e and the
corresponding expression for CO2 flux rate, to allow the substrate
saturation level (w) to change with time. Additionally, we used the
ranges of mG determined above. We used the SCEUA (Shuffled
Complex Evolution at University of Arizona) algorithm [51,52] to
determine model parameters. The SCEUA is a widely used
stochastic optimization algorithm for calibrating hydrological and
environmental models [51].
When exponentially-increasing and non-exponentially-increas-
ing data are included together, the CVs of all parameters (B0, r0,
mG, a, Ks, b) are within 25% except b with a high CV of 76%
(Table 1). The optimized mG values (0.03060.001 h21) are almost
the same as obtained by Colores et al. [13]. Model estimates of
a = 0.22860.031 indicate that the maximum specific maintenance
rate of active microbes (mR) is about 30% of mG and thus cannot be
ignored. The initial active biomass (Ba0) is 0.14560.004 mg C g21
soil (Table 1), which is lower than the values (0.19460.004 mg C
g21 soil) using the SIGR method [13]. This is likely due to the
inclusion of maintenance respiration (characterized by mR, see
Equation 14d) in our model even for the exponentially-increasing
stage; thus a lower Ba0 could produce similar CO2 flux to the case
with higher Ba0 that does not include the contributions from
maintenance respiration. Our results also show that the initial
active fraction (r0) is 28.566.4% and b is 0.02560.019. The
magnitude of b is comparable to the estimation by Anderson &
Domsch [6,7]. In addition, the half-saturation constant (Ks) was
estimated as 0.27560.038 mg C g21 soil, which is very close to the
values derived from 16 soils by Van de Werf & Verstraete [21].
This Ks value indicates the substrate saturation level (w) is higher
than 0.7 before the transition from exponentially-increasing to
non-exponentially-increasing phase (Fig. 3c). The changes of
substrate (S), total microbial biomass (B) and active fraction (r) with
time are also shown in Fig. 3c. In conclusion, the five parameters
(B0, r0, mG, a, Ks) can be effectively determined using both
exponentially-increasing and non-exponentially-increasing respi-
ration rates, whereas b may also be determined but with a
relatively high uncertainty (CV = 76%) than the other parameters.
Through this experimental analysis, we identified the need for
isotopic data to discriminate between basal and substrate-induced
respiration. We also discovered that the exponentially-increasing
period due to substrate addition can be used to identify only a
select set of model parameters (i.e., mG and Ba0) as also
demonstrated by the method of Colores et al. [13]. These
parameters, however, can be further applied to longer-term
respiration experiments to enable fitting to obtain the remainder of
model parameters by using our MEND model. Thus, we have
found a new and unique solution to identify different parameters
as a function of time, and to effectively use isotopic labeling to
yield a specific set of model parameters.
Model test II: intermittent substrate supplyIn order to further validate this additional physiological
component in the MEND model, we also tested it against a
laboratory experimental dataset with intermittent substrate supply
[4]. In addition to the substrate, another limiting factor (i.e.,
Figure 3. MEND model simulations against the respirationrates due to added 14C-labeled glucose in Colores et al. [13]. (a)Fitting of the respiration rates in the exponentially-increasing phaseusing Equation 14, ‘Obs’ and ‘Sim’ denote observed and simulated data,respectively. (b) Fitting of the respiration rates in both exponentially-increasing and non-exponentially-increasing phases using Equation 12.(c) Simulated substrate (S), total live microbial biomass (B), activefraction (r) and substrate saturation level (q) based on Equation 12.doi:10.1371/journal.pone.0089252.g003
Dormant and Active Microbial Dynamics
PLOS ONE | www.plosone.org 6 February 2014 | Volume 9 | Issue 2 | e89252

oxygen, O2) was included in this study. For this reason, we also
introduced one more parameter (Ko: half saturation constant for
O2) to represent the limitation of O2 on the microbial processes
sketched in Fig. 1. Similar to substrates, the saturation level of O2
is computed as O2/(O2+Ko), where O2 denotes the concentration of
oxygen. The simulated oxygen concentrations by Stolpovsky et al.
[4] were used as an input to our model. We used the SCEUA
algorithm to determine the six model parameters in addition to the
initial value for active fraction (r0).
A summary of the seven parameters (one of them is r0) and their
fitted values is presented in Table 2. The initial active fraction (r0)
has a median of 0.925 with the 95% confidence interval (CI) of
[0.628–1.000]. It means that a high r0 is required for this
experiment, but not necessary to be 1.0 set by Stolpovsky et al. [4].
The model and data are not sensitive to b since its 95% CI covers
a wide range from 0.001 to 1. The reason is that the experiment
only lasts for a very short time (33 h) so the influence of low
metabolic rate at dormant state is insignificant.
Fig. 4 shows that the simulated total biomass (B) and substrate
(S) concentrations agree very well with the observations (the
coefficients of determination are 0.98 and 0.78 for biomass in
Fig. 4a and substrate in Fig. 4b, respectively). Our simulation
results indicate that, under limited O2 between 12h and 24 h of
the experiment, the active biomass decreases and the dormant
biomass increases. As a result, the active fraction (r) declines from
ca. 0.9 to 0.7 (Fig. 4a). For the same period Stolpovsky et al. [4]
predicted a decrease of r from 1.0 to ca. 0, which means that all
active biomass becomes dormant. Although there were not
adequate measurements to confirm either prediction, our predict-
ed changes in the active fraction (r) appear to be more reasonable
during such a short experimental time period. This demonstration
also shows that our model is capable of producing reasonable
change in total, active, and dormant microbial biomass in response
to substrate supply as well as an important forcing function (O2).
Conclusions
We show that the physiological state index model (Equation 1)
of Panikov [33] can be improved by eliminating the assumption
that the steady state active fraction (rss) approaches the substrate
saturation level (wss). In particular, the model of Panikov [33]
indicates that no active cells become dormant under insufficient
substrate, which disregards the general nature of the strategy of
dormancy in microorganisms when faced with unfavorable
environmental conditions [5]. Our analysis also implies that the
estimate of respiration rates under sufficient substrate by the
Table 1. MEND model parameters values used for simulation of respiration rates due to added 14C-labeled glucose in Colores et al.[13].
ParameterExponentially-increasingrespiration* All data{ Description
Mean SD` CV1 Mean SD CV
B0 0.504 0.279 55% 0.525 0.080 15% Initial microbial biomass, (mg C g21 soil)
r0 0.394 0.263 67% 0.285 0.064 23% Initial active fraction
mG 0.027 0.001 5% 0.030 0.001 3% Maximum specific growth rate (h21)
a 0.185 0.142 77% 0.228 0.031 13% mR/(mG+mR), mR is maximum specific maintenance rate for activemicrobes (h21)
Ks — — — 0.275 0.038 14% Half-saturation constant for substrate (mg C g21 soil)
b — — — 0.025 0.019 76% Ratio of dormant maintenance rate to mR
YG 0.5 — — 0.5 — — True growth yield, constant
Ba0 0.135 0.027 20% 0.145 0.004 3% Initial active biomass (mg C g21 soil), calculated by B06r0
*Only the respiration rates during exponentially-increasing phase are used.{All data including both exponentially-increasing and non-exponentially-increasing respiration.`SD: standard deviation.1CV: Coefficient of variation.doi:10.1371/journal.pone.0089252.t001
Table 2. MEND model parameter values used for simulation of the experiment described in Fig. 3 of Stolpovsky et al. (2011).
Parameter Fitted Value* Initial Range Description
mR 0.032, [0.011–0.048] 0.001–0.1 Specific maintenance rate for active biomass (h21)
a 0.099, [0.045–0.181] 0.001–0.50 mR/(mG+mR), mG is specific growth rate (h21)
Ks 3.110, [1.387–5.652] 0.1–9.0 Half-saturation constant for substrate (mg L21)
YG 0.573, [0.463–0.600] 0.2–0.6 Growth yield factor (–)
Ko 0.0008, [0.0007–0.001] 0.005–0.1 Half-saturation constant for dissolved oxygen (mM)
b 0.351, [0.001–1.000] 0.001–1 Ratio of dormant maintenance rate to mR
r0 0.925, [0.628–1.000] 0–1 Initial fraction of active biomass (–)
*Medians and 95% confidence intervals of the fitted values from 100 optimization runs, i.e., 100 different random seeds are used for the stochastic optimizationalgorithm.doi:10.1371/journal.pone.0089252.t002
Dormant and Active Microbial Dynamics
PLOS ONE | www.plosone.org 7 February 2014 | Volume 9 | Issue 2 | e89252

physiological state index model is deficient. Pertaining to the
switch function model, we argue that the switch function (h) is also
determined by the substrate (or combined with other impact
factors) saturation level thus we would recommend using the
switch function to modify the microbial uptake rate if the Gibbs
energy change of the oxidation of substrate (DG) is tractable and
the thermodynamic threshold (G0) and the steepness of the step
function (st) are identifiable. Based on the generally accepted
assumptions summarized from existing dormancy models, we
postulate a synthetic microbial physiology component to account
for dormancy. Both the steady state active fraction (rss) and
substrate saturation level (wss) can be expressed as functions of two
physiological indices: a and b. The index a = mR/(mG+mR) is
composed of mG and mR denoting the maximum specific growth
and maintenance rates, respectively, for active microbes. The
index b represents the ratio of dormant to active maintenance
rates. The value of rss is no less than wss, and is equal only under
the condition of bR0, where they are both identical to a. The
upper bound of rss is ca. 0.8 at aR0.5 and bR1. The maximum rss
is ca. 0.5 if b (#0.01) following the estimation of Anderson &
Domsch [6]. It is evident that rss could be attenuated further by
other limiting factors. The application of the MEND microbial
physiology model to an experimental dataset with intermittent
substrate supply shows satisfactory model performance (the
determination coefficients are 0.98 and 0.78 for microbial biomass
and substrate, respectively). The case study on the SIGR dataset
indicate that the exponentially-increasing respiration rates can
only be used to determine mG and Ba0 (initial active biomass), while
the major parameters (B0, r0, mG, a, Ks) can be effectively
determined using both exponentially-increasing and non-expo-
nentially-increasing respiration rates.
In conclusion, the microbial physiology model presented here
can be incorporated into existing ecosystem models to account for
dormancy in microbially-mediated processes. We have illustrated
Figure 4. MEND model simulations against the experimental dataset used by Stolpovsky et al. (2011). (a) total live biomass, active anddormant biomass, and active fraction; (b) observed and simulated substrate concentration and prescribed O2 concentration. There are threemanipulations on the substrate and oxygen: (1) at time 0, the substrate (3 mg/L) and O2 (0.025 mM) are added to the system; (2) after 12 h, the sameamount of substrate is injected; (3) at 24 h, additional O2 (0.04 mM) is injected to the system. The observed concentrations of substrate and totalbiomass are hourly data interpolated from the original observations in Stolpovsky et al. (2011). We scaled the substrate concentrations (with units ofmM in original data) to match the magnitude of biomass concentration in units of mg/L.doi:10.1371/journal.pone.0089252.g004
Dormant and Active Microbial Dynamics
PLOS ONE | www.plosone.org 8 February 2014 | Volume 9 | Issue 2 | e89252

the impacts of substrate and oxygen availabilities on the
physiological states through this study. Other environmental
factors, such as soil temperature and soil water potential, could
also be introduced into this framework to affect the transformation
processes between the two microbial compositions. The changes in
the physiological states of microbes could further alter the
microbially-driven carbon and nutrient dynamics in ecosystems.
Traditional measures of microbial biomass include the entire
microbial population, even though dormancy is an important
evolutionary strategy for preservation of microbial genetics and
function until conditions for growth and replication improve.
Parameterizing microbial ecosystem models assuming the entire
population is active could therefore lead to significant errors. The
approach described here provides a tractable and testable method
to include dormancy as a response to external forcing.
Supporting Information
Appendix S1 A summary of two-microbial-pool models.(DOCX)
Appendix S2 Mathematical derivations.(DOCX)
Acknowledgments
The authors thank Dr. Sindhu Jagadamma for her helpful comments.
Thanks also go to the two anonymous reviewers for their constructive
comments.
Author Contributions
Conceived and designed the experiments: GW MAM. Analyzed the data:
GW MAM CWS. Wrote the paper: GW MAM LG CWS. Mathematical
analysis: GW LG.
References
1. Blagodatsky SA, Heinemeyer O, Richter J (2000) Estimating the active and total
soil microbial biomass by kinetic respiration analysis. Biology and Fertility of
Soils 32: 73–81.
2. Mason C, Hamer G, Bryers J (1986) The death and lysis of microorganisms in
environmental processes. FEMS microbiology letters 39: 373–401.
3. Price PB, Sowers T (2004) Temperature dependence of metabolic rates for
microbial growth, maintenance, and survival. Proceedings of the National
Academy of Sciences of the United States of America 101: 4631–4636.
4. Stolpovsky K, Martinez-Lavanchy P, Heipieper HJ, Van Cappellen P, Thullner
M (2011) Incorporating dormancy in dynamic microbial community models.
Ecological Modelling 222: 3092–3102.
5. Lennon JT, Jones SE (2011) Microbial seed banks: the ecological and
evolutionary implications of dormancy. Nature Reviews Microbiology 9: 119–
130.
6. Anderson TH, Domsch KH (1985) Determination of ecophysiological
maintenance carbon requirements of soil microorganisms in a dormant state.
Biology and Fertility of Soils 1: 81–89.
7. Anderson TH, Domsch KH (1985) Maintenance carbon requirements of
actively-metabolizing microbial populations under in situ conditions. Soil Biology
and Biochemistry 17: 197–203.
8. Adam G, Duncan H (2001) Development of a sensitive and rapid method for the
measurement of total microbial activity using fluorescein diacetate (FDA) in a
range of soils. Soil Biology and Biochemistry 33: 943–951.
9. Jones KH, Senft JA (1985) An improved method to determine cell viability by
simultaneous staining with fluorescein diacetate-propidium iodide. Journal of
Histochemistry & Cytochemistry 33: 77–79.
10. Boulos L, Prevost M, Barbeau B, Coallier J, Desjardins R (1999) LIVE/DEADHBacLightTM: application of a new rapid staining method for direct enumeration
of viable and total bacteria in drinking water. Journal of Microbiological
Methods 37: 77–86.
11. Stocks S (2004) Mechanism and use of the commercially available viability stain,
BacLight. Cytometry Part A 61: 189–195.
12. Schulz S, Perez-de-Mora A, Engel M, Munch JC, Schloter M (2010) A
comparative study of most probable number (MPN)-PCR vs. real-time-PCR for
the measurement of abundance and assessment of diversity of alkB homologous
genes in soil. Journal of Microbiological Methods 80: 295–298.
13. Colores GM, Schmidt SK, Fisk MC (1996) Estimating the biomass of microbial
functional groups using rates of growth-related soil respiration. Soil Biology and
Biochemistry 28: 1569–1577.
14. Anderson JPE, Domsch KH (1978) A physiological method for quantitative
measurement of microbial biomass in soils. Soil Biology & Biochemistry 10: 215–
221.
15. Jenkinson DS, Powlson DS (1976) The effects of biocidal treatments on
metabolism in soil-V: A method for measuring soil biomass. Soil Biology and
Biochemistry 8: 209–213.
16. Lodge DJ (1993) Nutrient cycling by fungi in wet tropical forests. In: Isaac S,
editor. Aspects of Tropical Mycology: Symposium of the British Mycological
Society Cambridge, UK: Cambridge University Press. pp. 37–57.
17. Yarwood S, Brewer E, Yarwood R, Lajtha K, Myrold D (2013) Soil microbe
active community composition and capability of responding to litter addition
after 12 years of no inputs. Applied and Environmental Microbiology 79: 1385–
1392.
18. Alvarez C, Alvarez R, Grigera M, Lavado R (1998) Associations between
organic matter fractions and the active soil microbial biomass. Soil Biology and
Biochemistry 30: 767–773.
19. Khomutova T, Demkina T, Demkin V (2004) Estimation of the total and active
microbial biomasses in buried subkurgan paleosoils of different age. Microbi-
ology 73: 196–201.
20. Orwin KH, Wardle DA, Greenfield LG (2006) Context-dependent changes in
the resistance and resilience of soil microbes to an experimental disturbance for
three primary plant chronosequences. Oikos 112: 196–208.
21. Van de Werf H, Verstraete W (1987) Estimation of active soil microbial biomass
by mathematical analysis of respiration curves: calibration of the test procedure.
Soil Biology and Biochemistry 19: 261–265.
22. Stenstrom J, Svensson K, Johansson M (2001) Reversible transition between
active and dormant microbial states in soil. FEMS Microbiology Ecology 36: 93–
104.
23. Wang G, Post WM, Mayes MA (2013) Development of microbial-enzyme-
mediated decomposition model parameters through steady-state and dynamic
analyses. Ecological Applications 23: 255–272.
24. Moorhead DL, Lashermes G, Sinsabaugh RL (2012) A theoretical model of C-
and N-acquiring exoenzyme activities, which balances microbial demands
during decomposition. Soil Biology and Biochemistry 53: 133–141.
25. Sinsabaugh RL, Manzoni S, Moorhead DL, Richter A (2013) Carbon use
efficiency of microbial communities: stoichiometry, methodology and modelling.
Ecology Letters 16: 930–939.
26. Schimel JP, Weintraub MN (2003) The implications of exoenzyme activity on
microbial carbon and nitrogen limitation in soil: a theoretical model. Soil
Biology & Biochemistry 35: 549–563.
27. Lawrence CR, Neff JC, Schimel JP (2009) Does adding microbial mechanisms of
decomposition improve soil organic matter models? A comparison of four
models using data from a pulsed rewetting experiment. Soil Biology &
Biochemistry 41: 1923–1934.
28. Wang G, Post WM, Mayes MA, Frerichs JT, Jagadamma S (2012) Parameter
estimation for models of ligninolytic and cellulolytic enzyme kinetics. Soil
Biology and Biochemistry 48: 28–38.
29. Todd-Brown KE, Hopkins FM, Kivlin SN, Talbot JM, Allison SD (2012) A
framework for representing microbial decomposition in coupled climate models.
Biogeochemistry 109: 19–33.
30. Treseder KK, Balser TC, Bradford MA, Brodie EL, Dubinsky EA, et al. (2012)
Integrating microbial ecology into ecosystem models: challenges and priorities.
Biogeochemistry 109: 7–18.
31. Wieder WR, Bonan GB, Allison SD (2013) Global soil carbon projections are
improved by modelling microbial processes. Nature Clim Change 3: 909–912.
32. Konopka A (1999) Theoretical analysis of the starvation response under
substrate pulses. Microbial Ecology 38: 321–329.
33. Panikov NS (1996) Mechanistic mathematical models of microbial growth in
bioreactors and in natural soils: explanation of complex phenomena.
Mathematics and Computers in Simulation 42: 179–186.
34. Blagodatsky S, Richter O (1998) Microbial growth in soil and nitrogen turnover:
a theoretical model considering the activity state of microorganisms. Soil Biology
and Biochemistry 30: 1743–1755.
35. Panikov NS, Sizova MV (1996) A kinetic method for estimating the biomass of
microbial functional groups in soil. Journal of Microbiological Methods 24: 219–
230.
36. Buerger S, Spoering A, Gavrish E, Leslin C, Ling L, et al. (2012) Microbial scout
hypothesis, stochastic exit from dormancy, and the nature of slow growers.
Applied and Environmental Microbiology 78: 3221–3228.
37. Hunt HW (1977) A simulation model for decomposition in grasslands. Ecology
58: 469–484.
38. Gignoux J, House J, Hall D, Masse D, Nacro HB, et al. (2001) Design and test of
a generic cohort model of soil organic matter decomposition: the SOMKO
model. Global Ecology and Biogeography 10: 639–660.
39. Ayati BP (2012) Microbial dormancy in batch cultures as a function of substrate-
dependent mortality. Journal of Theoretical Biology 293: 34–40.
Dormant and Active Microbial Dynamics
PLOS ONE | www.plosone.org 9 February 2014 | Volume 9 | Issue 2 | e89252

40. Jones SE, Lennon JT (2010) Dormancy contributes to the maintenance of
microbial diversity. Proceedings of the National Academy of Sciences 107:
5881–5886.
41. Bar M, Hardenberg J, Meron E, Provenzale A (2002) Modelling the survival of
bacteria in drylands: the advantage of being dormant. Proceedings of the Royal
Society of London Series B: Biological Sciences 269: 937–942.
42. Locey KJ (2010) Synthesizing traditional biogeography with microbial ecology:
the importance of dormancy. Journal of Biogeography 37: 1835–1841.
43. Wang G, Post WM (2013) A note on the reverse Michaelis–Menten kinetics. Soil
Biology and Biochemistry 57: 946–949.
44. Wirtz KW (2003) Control of biogeochemical cycling by mobility and metabolic
strategies of microbes in the sediments: an integrated model study. FEMS
Microbiology Ecology 46: 295–306.
45. Panikov NS (1995) Microbial growth kinetics. London, UK: Chapman & Hall.
378 p.
46. Pirt SJ (1965) Maintenance energy of bateria in growing cultures. Proceedings of
the Royal Society of London Series B-Biological Sciences 163: 224–231.
47. Wang G, Post WM (2012) A theoretical reassessment of microbial maintenance
and implications for microbial ecology modeling. FEMS Microbiology Ecology81: 610–617.
48. Hoehler TM, Jorgensen BB (2013) Microbial life under extreme energy
limitation. Nat Rev Micro 11: 83–94.49. Beeftink HH, Van der Heijden RTJM, Heijnen JJ (1990) Maintenance
requirements: energy supply from simultaneous endogenous respiration andsubstrate consumption. FEMS microbiology letters 73: 203–209.
50. Blagodatsky S, Yevdokimov I, Larionova A, Richter J (1998) Microbial growth
in soil and nitrogen turnover: model calibration with laboratory data. SoilBiology and Biochemistry 30: 1757–1764.
51. Duan QY, Sorooshian S, Gupta V (1992) Effective and efficient globaloptimization for conceptual rainfall-runoff models. Water Resources Research
28: 1015–1031.52. Wang G, Xia J, Chen J (2009) Quantification of effects of climate variations and
human activities on runoff by a monthly water balance model: A case study of
the Chaobai River basin in northern China. Water Resources Research 45:W00A11.
Dormant and Active Microbial Dynamics
PLOS ONE | www.plosone.org 10 February 2014 | Volume 9 | Issue 2 | e89252