Costs and benefits of biological control of invasive alien plants: case studies from South Africa
Upload
khangminh22Category
view
3download
0
Jose-Luis Fernandez and Vivek U Padvetnaya Report on the evaluation of the costs and benefits of the 'Stronger Together in Warrington' programme Discussion paper [or working paper, etc.] Original citation: Fernandez, Jose-Luis and Padvetnaya, Vivek U. (2011) Report on the evaluation of the costs and benefits of the 'Stronger Together in Warrington' programme. PSSRU Discussion paper , 2822. London School of Economics and Political Science and University of Kent, London, UK. This version available at: http://eprints.lse.ac.uk/40804/ Originally available from Personal Social Services Research Unit Available in LSE Research Online: December 2011 © 2011 PSSRU LSE has developed LSE Research Online so that users may access research output of the School. Copyright © and Moral Rights for the papers on this site are retained by the individual authors and/or other copyright owners. Users may download and/or print one copy of any article(s) in LSE Research Online to facilitate their private study or for non-commercial research. You may not engage in further distribution of the material or use it for any profit-making activities or any commercial gain. You may freely distribute the URL (http://eprints.lse.ac.uk) of the LSE Research Online website.
f
University of Kent
University of Kent
Cornwallis Building
Canterbury
Kent
CT2 7NF
Tel: 01227 823963
London School of Economics
London School of Economics
LSE Health & Social Care
Houghton Street
London
WC2A 2AE
Tel: 020 7955 6238
Report on the evaluation of
the costs and benefits of
‘Stronger Together in
Warrington’ programme
José-Luis Fernandez and Vivek U Padvetnaya
Personal Social Services Research Unit
PSSRU Discussion paper 2822
December 2011
www.pssru.ac.uk
TABLE OF CONTENTS
Executive summary 1
1. Background 7
2. Aim of the study 7
3. Approach to the evaluation 8
4. Time frame 9
5. Data 10
6. Comparator and the model 13
7. Estimation of deprivation levels 14
8. Estimation of costs 15
9. Estimation of benefits 15
10. Results 18
11. Discussion on key findings 32
12. Limitations of the evaluation 36
13. Conclusions 36
14. References: List of articles reviewed 38
Appendix 1: Map of the STiW area i
Appendix 2: Population of the STiW neighbourhood at 2006 ii
Appendix 3: List of articles and reports provided by Warrington borough council iii
Appendix 4: Questionnaires of Borough-level surveys 2006, 2008 and 2010 vi
Appendix 5: Questionnaires of STiW-level surveys 2008, 2009 and 2010 li
Appendix 6: Tabulated summary of regression results for borough-level surveys lxxiv
Appendix 7: Tabulated summary of regression results for STiW-level surveys lxxvii
Appendix 8: Detailed regression results lxxix
Appendix 9: Stata log file ci
TABLE OF CONTENTS
Appendix 10: IMD scores and ranks for Warrington LSOAs clxxi
LIST OF FIGURES
FIGURE 1: CONCEPTUAL MODEL OF STIW PROGRAMME 8
FIGURE 2: EVALUATION FRAMEWORK 9
FIGURE 3: FLOW CHART DEPICTING SEQUENCE INVOLVED IN APPENDING AND MERGING DATASETS 13
FIGURE 4: REFERRAL TO VARIOUS POPULATION HEALTH SERVICES 31
LIST OF TABLES
TABLE 1: LIST OF INDICATORS USED TO ASSESS FINAL OUTCOMES 16
TABLE 2: IMD SCORES AND RANKS OF OVERALL DEPRIVATION 18
TABLE 3: YEAR WISE BREAKUP OF BOROUGH-LEVEL SURVEY SAMPLE CHARACTERISTICS 20
TABLE 4: YEAR WISE BREAKUP OF STIW-LEVEL SURVEY SAMPLE CHARACTERISTICS 20
TABLE 5: YEAR WISE BREAKUP OF BUDGETARY ESTIMATES 20
TABLE 6: INCIDENTS OF CRIME AND ANTI-SOCIAL BEHAVIOUR (ASB) 24
TABLE 7: MONETISED COST OF CRIME IN STIW NEIGHBORHOOD 24
TABLE 8: SCORES FOR CRIME DOMAIN OF IMD 25
TABLE 9: HOSPITAL EPISODE STATISTICS 29
TABLE 10: UPTAKE OF SOCIAL SERVICES 30
TABLE 11: MONETISED COST OF HEALTH OUTCOMES IN STIW NEIGHBOURHOOD 30
TABLE 12: SCORES FOR HEALTH AND DISABILITY DOMAIN OF IMD 31
LIST OF ABBREVIATIONS
STIW Stronger Together in Warrington LSOA Lower Super Output Area IMD Indices of Multiple Deprivation WBC Warrington Borough Council STiW neighbourhood Neighbourhoods in Warrington borough where STiW intervention were
taken up Non-STiW neighbourhood
Neighbourhood in Warrington borough not included under the interventions of STiW programme
SD neighbourhood: Group of LSOAs in Warrington borough with deprivation levels similar to that of LSOAs under STiW programme
RoW neighbourhood: All the neighbourhoods in Warrington borough excluding those under the interventions of the STiW programme

1 | P a g e
EXECUTIVE SUMMARY
Background
The Stronger Together in Warrington (STiW) programme, supported by Government’s Safer
and Stronger Communities Fund was launched as a pilot in 2006 with an expectation to inform
how neighbourhood working can be rolled out across the Warrington borough. The aim of the
programme was to bridge the inequality gap in deprivation levels by improving the quality of
life of people at individual and community level in the most disadvantaged neighbourhoods
through:
Neighbourhood engagement in shaping, supporting and implementing local services
New innovative services and negotiated reforming and reshaping of existing services
Improved service delivery by providers who are responsive to neighbourhood needs
The programme fostered strategic partnerships among key community stakeholders such as
the local authority, private sector and the civil societies to deliver the expected outcomes of
better community engagement, improved safety, better local environment and improved
population health.
The STiW programme provided the platform for community engagement and community led
commissioning developed using Turning Point’s Connected Care model of service integration
and community co-design.
Purpose of the study and approach to the evaluation
The purpose of the study was to conduct an evaluation of the STiW programme by considering
the accrued benefits resulting from the interventions of the programme in the STiW
neighbourhood against the costs associated with resources involved in provision of these
interventions. The evaluation used a range of statistical analysis methods. The approach to
the evaluation was based on the premise that STiW interventions bring innovativeness,
efficiency and effectiveness to new and existing council services such as police services, health
services, social services and community engagement initiatives. This will lead to better uptake
of these services by the residents, as an intermediate outcome. In turn this will result in
positive impacts at the individual and community level over a period of time in many areas
2 | P a g e
such as related to crime and safety, neighbourhood engagement, population health and
others as the final outcome.
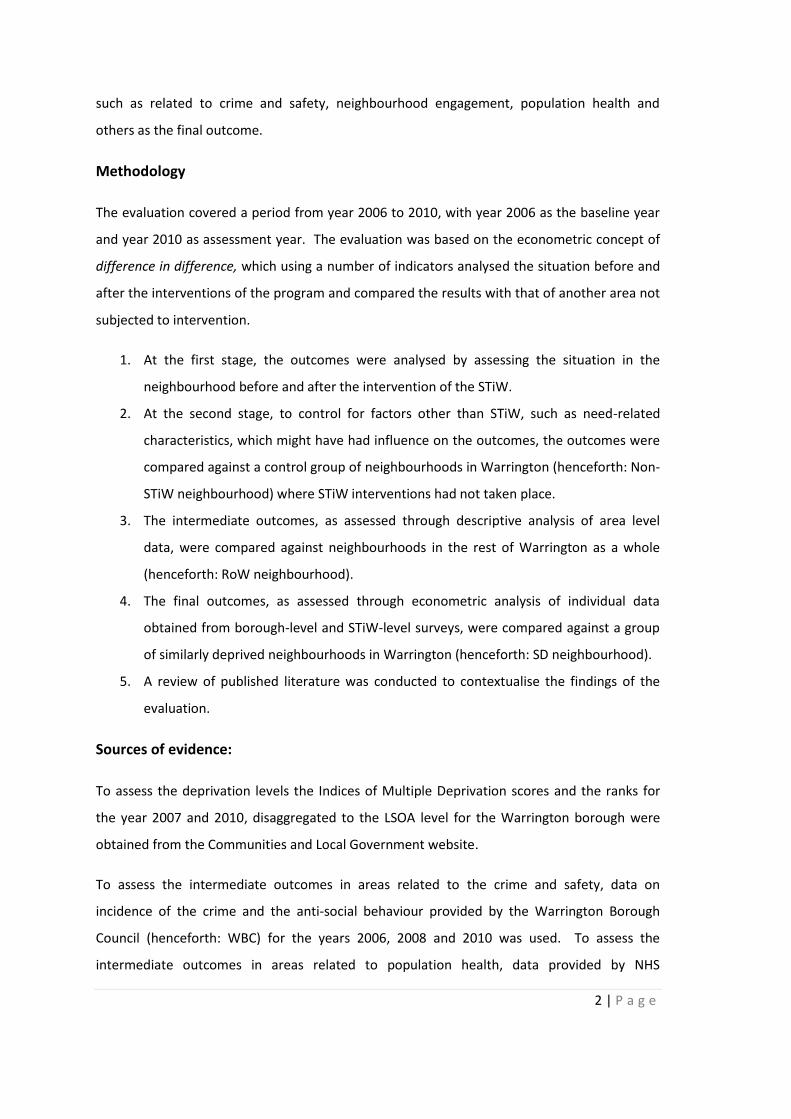
Methodology
The evaluation covered a period from year 2006 to 2010, with year 2006 as the baseline year
and year 2010 as assessment year. The evaluation was based on the econometric concept of
difference in difference, which using a number of indicators analysed the situation before and
after the interventions of the program and compared the results with that of another area not
subjected to intervention.
1. At the first stage, the outcomes were analysed by assessing the situation in the
neighbourhood before and after the intervention of the STiW.
2. At the second stage, to control for factors other than STiW, such as need-related
characteristics, which might have had influence on the outcomes, the outcomes were
compared against a control group of neighbourhoods in Warrington (henceforth: Non-
STiW neighbourhood) where STiW interventions had not taken place.
3. The intermediate outcomes, as assessed through descriptive analysis of area level
data, were compared against neighbourhoods in the rest of Warrington as a whole
(henceforth: RoW neighbourhood).
4. The final outcomes, as assessed through econometric analysis of individual data
obtained from borough-level and STiW-level surveys, were compared against a group
of similarly deprived neighbourhoods in Warrington (henceforth: SD neighbourhood).
5. A review of published literature was conducted to contextualise the findings of the
evaluation.
Sources of evidence:
To assess the deprivation levels the Indices of Multiple Deprivation scores and the ranks for
the year 2007 and 2010, disaggregated to the LSOA level for the Warrington borough were
obtained from the Communities and Local Government website.
To assess the intermediate outcomes in areas related to the crime and safety, data on
incidence of the crime and the anti-social behaviour provided by the Warrington Borough
Council (henceforth: WBC) for the years 2006, 2008 and 2010 was used. To assess the
intermediate outcomes in areas related to population health, data provided by NHS
3 | P a g e
Warrington on hospital episodes at local hospitals and the data provided by WBC on uptake of
personal social services for the years 2006, 2008 and 2010 were used. Data used for the
analysis of all intermediate outcomes were aggregated area level data and outcomes in STiW
neighbourhood were compared against Rest of Warrington (RoW) neighbourhood.
To assess the final outcomes anonymized individual level data of two sets of surveys, the
borough-level surveys (years 2006, 2008 and 2010) covering the whole Warrington borough
and STiW-level surveys (years 2006, 2009 and 2010), covering the STiW neighbourhood were
used. The outcomes in STiW neighbourhood were compared against a group of similarly
deprived (SD) neighbourhood in the analysis of borough-level surveys (Please see Table 2).
The STiW level surveys did not afford such comparison as they covered only STiW
neighbourhood.
Estimation of costs
The cost of the programme was arrived at using budgetary estimates of the STiW programme
for the period 2006 to 2010 and Health Inequalities Project for the period 2008 to 2010. The
costs were inflation adjusted to year 2010. The total budgetary estimate for the STiW
programme was £ 2.35 million and for Health Inequalities Project was £121,000.
Estimation of levels of deprivation
Deprivation levels of all the neighbourhoods in Warrington at the Lower Super Output Area
(LSOA) level were estimated by using the Indices of Multiple Deprivation (Henceforth: IMD) for
the years 2007 and 2010. IMD identifies and measures deprivation for distinct domains:
Income, employment, health and disability, education skills and training, barriers to housing
and services, living environment and crime; and then aggregates them to provide an overall
measure of multiple deprivation.
Estimation of benefits
Based on relevance to the STiW programme, availability of data at different time points and
resident’s perceptions of what is ‘important’ and what ‘needs to be improved’, the following
areas were identified for evaluation of outcomes: crime and anti-social behaviour,
involvement and empowerment of residents with regard to local council decisions,
effectiveness and satisfaction with council services and population health. Indicators used to
4 | P a g e
assess outcomes in these areas were compatible with the national indicator set (NIS), national
data sets and with those in relevant published literature. The intermediate outcomes were
assessed by analysing the patterns in crime and anti-social behaviour incidences, hospital
episodes and uptake of personal social services in the STiW neighbourhood relative to the rest
of Warrington (RoW) neighbourhood in years 2006, 2008 and 2010. The final outcomes were
assessed by analysing the changes in resident’s perceptions as captured through Warrington
borough-level surveys in 2006, 2008 and 2010 and STiW-level surveys in 2008, 2009 and 2010.
Results of borough-level surveys as against STiW-level surveys, allowed comparison relative to
a similarly deprived (SD) neighbourhood. The results from the analysis of the survey were
correlated with changes in scores for relevant domains of Indices of Multiple Deprivation
during the same period.
Summary of Findings
Crime and Anti-Social Behaviour
In STiW neighbourhood from year 2006 to 2010, overall incidence of crime dropped by 10%
relative to RoW neighbourhood (STiW: 36% and RoW: 26%). As compared with year 2006 the
monetised cost of the greater reduction in crime in STiW neighborhood relative to RoW
neighbourhood equated to £ 463,000 (5.3%) for the year 2010. A higher proportion of
residents in STiW neighbourhood perceived that the situation related to the crime and ASB
improved relative to SD neighbourhood. The crime scores relating to the Indices of Multiple
Deprivation (IMD) improved by an average of 14% in STiW neighbourhood relative to SD
neighbourhood (STiW: 29% and SD neighbourhood: 15%) from year 2007 to year 2010.
Neighbourhood Engagement and Satisfaction with the Council and its Services
In STiW neighbourhood from year 2006 to 2010, a higher proportion of residents felt the
council were acting on their concerns, were satisfied with their experience of contacting the
council, were satisfied with overall performance by the council and with the local hospital
services relative to SD neighbourhood. During the same period in the STiW neighbourhood a
higher proportion of residents wanted to get involved in local council decisions and felt
informed about it. However, this proportion had decreased in 2010 relative to 2006. From
the year 2006 to 2010 a higher proportion of residents in the STiW neighbourhood felt they
5 | P a g e
were able to influence council decisions, though it could not be compared against a control
group.
Population Health
In STiW neighbourhood from year 2006 to 2010 relative to the RoW neighbourhood;
Total attendance at outpatient services at local hospitals increased at a 9% slower rate
(STiW: 79%; RoW: 88%),
Proportion of hospital appointments cancelled increased by 121% faster rate (STiW:
362% RoW: 241%),
Proportion DNAs increased at a 20% slower rate (STiW: 44% and RoW: 64%),
Emergency admissions at local hospitals increased at a 21% slower rate (STiW: 3%;
RoW: 24%)
Attendance at A&E departments increased at a 13% slower rate (STiW: 33% RoW:
46%).
As compared with year 2006 the monetised costs of savings due to decreased DNAs, A&E
episodes and emergency admissions in STiW neighbourhood relative to RoW neighbourhood
equated to £832,000 for the year 2010. From Year 2006 to 2010, accessing and continued
usage of mental health related social services was higher in STiW (64% and 44% respectively).
Additionally, in the STiW neighbourhood proportion of people accessing population health
services and who exercise regularly, increased from year 2006 to 2010 (could not be compared
against a control group).
The health and disability scores under the Indices of Multiple Deprivation (IMD) improved by
an average of 2% for the STiW neighbourhood and 7% for the SD neighbourhood from year
2007 to year 2010.
Limitations of the study
The evaluation was limited by certain factors such as, analysis of service uptake indicators
were limited to aggregate level comparison, changes in some of the outcome indicators could
not be compared against a control group and survey data had missing values (5-7%).
6 | P a g e
Attributability of changes in service utilisation and outcomes to STiW programme cannot be
determined with certainty.
Conclusions
Based on the results of the analysis done and subject to the above limitations, the study can
conclude that:
From the analysis of outcomes for crime and safety from year 2006 to 2010, in terms
of decrease in incidents of crime, increased perception of improved crime and safety
and improved rankings of IMD-Crime, it can be concluded that there are better
outcomes in the STiW area relative to the Non-STiW area. Reduction in crime in STiW
neighbourhood has a monetised value of £463,000 at year 2010 when compared with
year 2006, 5.3% greater reduction than in the RoW neighbourhood.
From the analysis of outcomes for neighbourhood engagement from year 2006 to
2010, in terms of resident’s perception that that councils acts on their concern,
resident’s satisfaction with experience of contacting council, resident’s satisfaction
with overall performance by the council and resident’s willingness to get involved in
local decision making, it can be concluded that there is a greater sense of
empowerment among residents and increased responsiveness of the council and its
services in STiW neighbourhood relative to the SD neighbourhood.
Analysis of outcomes for population health from year 2006 to 2010, in terms of
decreased A&E episodes, improved access to social services and satisfaction of
residents with local hospital, may indicate better management of local health services
and increased awareness and responsibility of residents about their own health in
STiW areas relative to the RoW neighbourhood. Reduction in DNA’s, A&E episodes
and emergency admissions in STiW neighbourhood has a monetised value of £830,000
at year 2010 when compared with year 2006.

7 | P a g e
EVALUATION OF THE COSTS AND BENEFITS OF ‘STRONGER
TOGETHER IN WARRINGTON’ PROGRAMME
1. BACKGROUND
Warrington borough, in the north-west region of England, has some of the most
disadvantaged and impoverished neighbourhoods in England. ‘Stronger Together in
Warrington’ programme, supported by Government’s Safer and Stronger Communities Fund
was launched as a pilot in 2006 with an expectation to inform how neighbourhood working
can be rolled out across the Warrington borough. Aim of the programme was to bridge the
inequality gap in deprivation levels by improving the quality of life of people at individual and
community level in the most disadvantaged neighbourhoods through
Neighbourhood engagement in shaping, supporting and implementing local services
New innovative services and negotiated reforming and reshaping of existing services
Improved service delivery by providers who are responsive to neighbourhood needs
The programme fostered strategic partnerships among key community stakeholders such as
local authority, private sector and the civil societies to deliver the expected outcomes of better
community engagement, improved safety, better local environment and improved population
health.
The Stronger Together in Warrington (henceforth: STiW) neighbourhood comprises about
11,800 residents in four wards: Bewsey Whitecross, Orford, Poplars Hulme and Poulton North,
all located across north Warrington. Map of the STiW area is provided in Appendix 1. Age and
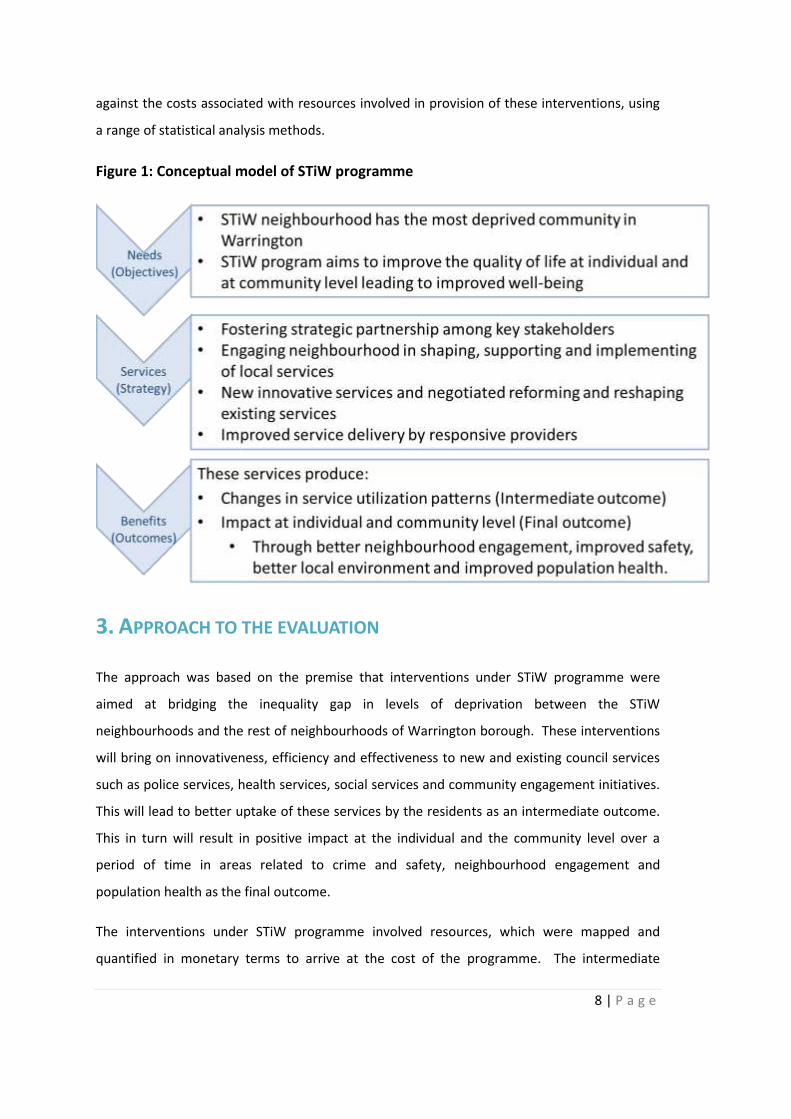
gender wise breakup of the population in STiW area is provided in Appendix 2. Conceptual
model of the STiW programme based on materials provided and the discussions had with the
Warrington borough council staff is shown in Figure 1.
2. AIM OF THE STUDY
The aim was to conduct an evaluation of the STiW programme by considering the accrued
benefits resulted by the interventions of the programme in the STiW neighbourhood as
8 | P a g e
against the costs associated with resources involved in provision of these interventions, using
a range of statistical analysis methods.
Figure 1: Conceptual model of STiW programme
3. APPROACH TO THE EVALUATION
The approach was based on the premise that interventions under STiW programme were
aimed at bridging the inequality gap in levels of deprivation between the STiW
neighbourhoods and the rest of neighbourhoods of Warrington borough. These interventions
will bring on innovativeness, efficiency and effectiveness to new and existing council services
such as police services, health services, social services and community engagement initiatives.
This will lead to better uptake of these services by the residents as an intermediate outcome.
This in turn will result in positive impact at the individual and the community level over a
period of time in areas related to crime and safety, neighbourhood engagement and
population health as the final outcome.
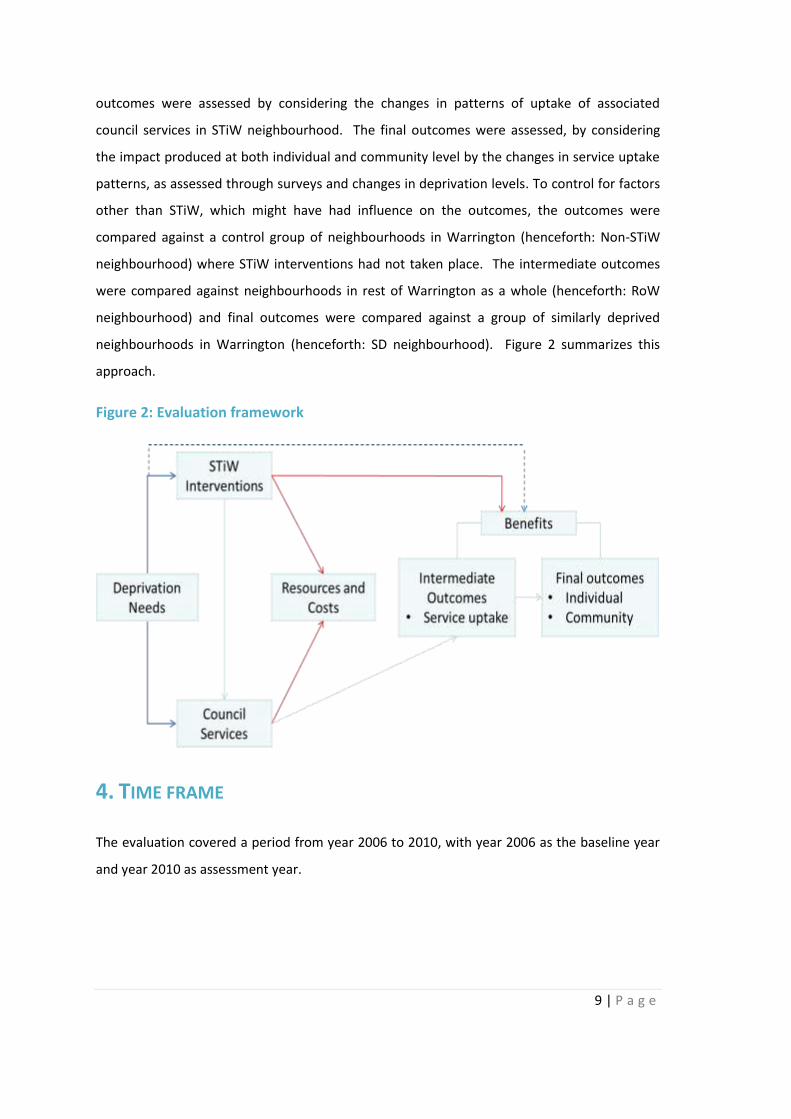
The interventions under STiW programme involved resources, which were mapped and
quantified in monetary terms to arrive at the cost of the programme. The intermediate
9 | P a g e
outcomes were assessed by considering the changes in patterns of uptake of associated
council services in STiW neighbourhood. The final outcomes were assessed, by considering
the impact produced at both individual and community level by the changes in service uptake
patterns, as assessed through surveys and changes in deprivation levels. To control for factors
other than STiW, which might have had influence on the outcomes, the outcomes were
compared against a control group of neighbourhoods in Warrington (henceforth: Non-STiW
neighbourhood) where STiW interventions had not taken place. The intermediate outcomes
were compared against neighbourhoods in rest of Warrington as a whole (henceforth: RoW
neighbourhood) and final outcomes were compared against a group of similarly deprived
neighbourhoods in Warrington (henceforth: SD neighbourhood). Figure 2 summarizes this
approach.
Figure 2: Evaluation framework
4. TIME FRAME
The evaluation covered a period from year 2006 to 2010, with year 2006 as the baseline year
and year 2010 as assessment year.
10 | P a g e
5. DATA
The evaluation used both primary and secondary data for the analysis obtained from the
Warrington Borough Council (henceforth: WBC), NHS Warrington and from the public domain.
5.1 On the STiW programme and its strategy
5.1.1 Secondary data
The activity and assessment reports of the STiW programme covering a period from year 2006
to 2010 provided by the WBC were studied. List of files reviewed is given in Appendix 3.
Key government white paper and reports on neighbourhood management, safer and stronger
communities programme, local strategic partnership and local area agreement were also
studied (CLG 2008, Blume 2009, Fisher 2006, WBC 2011, DCLG 2007a, DCLG 2008a).
5.2 To Assess deprivation levels and neighbourhood characteristics of
Warrington borough
5.2.1 Secondary data
The Indices of Multiple Deprivation (Henceforth: IMD) scores and the ranks for the year 2007
and 2010, disaggregated to the LSOA level for the Warrington borough were obtained from
the Communities and Local Government website. The scores and ranks for all the domains of
IMD for the years 2007 and 2010 which were in spreadsheet format were appended to form a
single data set in Stata® (DCLG 2008c, DCLG 2011d). Appendix 10 provides the deprivation
scores and deprivation ranks for the LSOAs of Warrington Borough for the domains of health
and disability, crime and overall deprivation, for the year 2007 and 2010. The deprivation
score and ranks were used in the evaluation to identify neighbourhood which are similarly
deprived as STiW neighbourhood, to compare and analyse changes in the scores for health
and crime domain of IMD in 2007 and 2010 between STiW and SD neighbourhood and in
regression analysis of survey data to control and account for effects of deprivation-need
related characteristics on results.
11 | P a g e
Data available in the public domain relating to disability allowance, working age benefit
claimants, job seeker’s allowance, educational achievements and provision of unpaid care
were also examined (ONS 2011b).
5.3 To assess the cost of the resources involved in STiW interventions
5.3.1 Primary data
Budgetary estimates of STiW programme for the period 2006-2010 and the Health Inequalities
Project for the period 2008-2010 provided by the council were used.
5.4 To assess the benefits of the programme
5.4.1 The intermediate outcomes: The secondary data
To assess the intermediate outcomes in areas related to crime and safety, data on incidence of
crime and anti-social behaviour provided by the WBC, for the years 2006, 2008 and 2010 was
used. To assess the intermediate outcomes in areas related to population health, data
provided by NHS Warrington on hospital episodes at local hospitals and the data provided by
WBC on uptake of personal social services for the years 2006, 2008 and 2010 were used. Data
used for the analysis of all intermediate outcomes were aggregated data and outcomes in
STiW neighbourhood were compared against RoW neighbourhood.
5.4.2 The final outcomes: The primary data
Anonymized raw data of two sets of surveys, the borough-level surveys covering the whole
Warrington borough and STiW-level surveys, covering the STiW neighbourhood were provided
by the WBC, after complying with the necessary data sharing and data protection protocol.
These surveys captured people’s perceptions about crime and safety, local environment, social
services, engagement with local authorities and effectiveness and satisfaction with council’s
services.
The data of borough-level surveys conducted in years 2006, 2008 and 2010 were converted
from SPSS® format to Stata® format using stat transfer® v.2008. The variables, the survey
questions, were categorized as explanatory variables and dependent variables based on
whether they describe individual characteristics (such as gender, age, illness and employment)
12 | P a g e
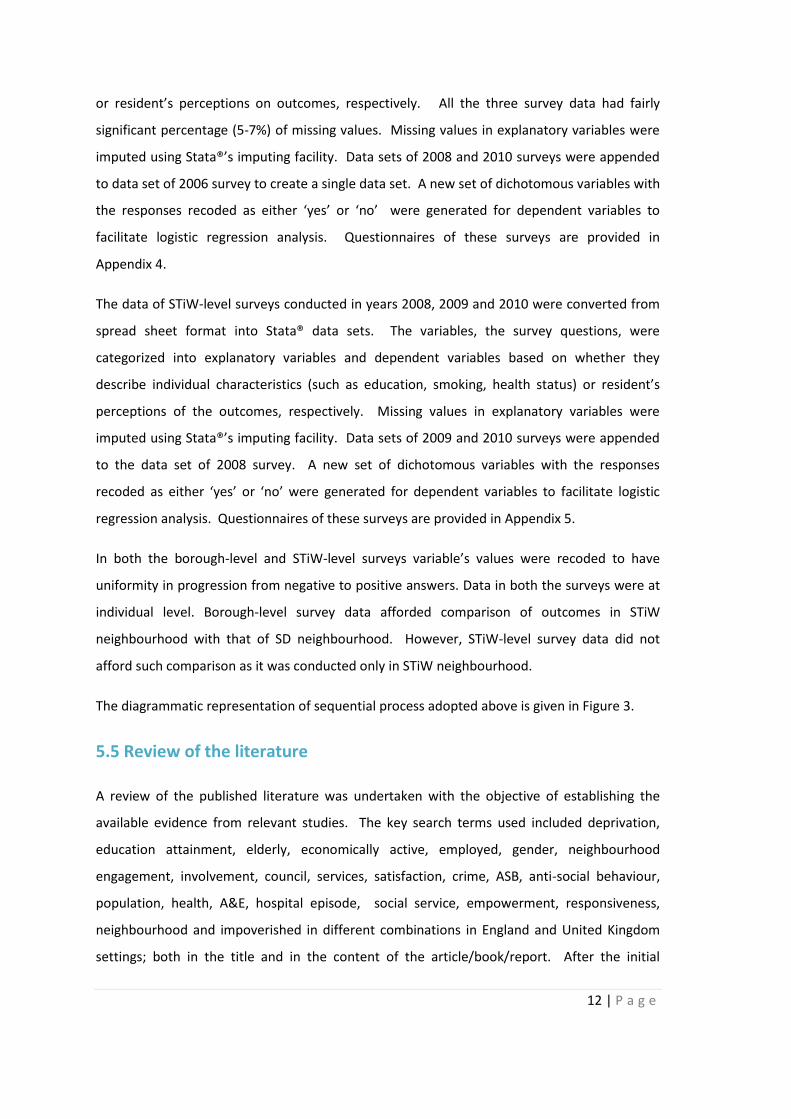
or resident’s perceptions on outcomes, respectively. All the three survey data had fairly
significant percentage (5-7%) of missing values. Missing values in explanatory variables were
imputed using Stata®’s imputing facility. Data sets of 2008 and 2010 surveys were appended
to data set of 2006 survey to create a single data set. A new set of dichotomous variables with
the responses recoded as either ‘yes’ or ‘no’ were generated for dependent variables to
facilitate logistic regression analysis. Questionnaires of these surveys are provided in
Appendix 4.
The data of STiW-level surveys conducted in years 2008, 2009 and 2010 were converted from
spread sheet format into Stata® data sets. The variables, the survey questions, were
categorized into explanatory variables and dependent variables based on whether they
describe individual characteristics (such as education, smoking, health status) or resident’s
perceptions of the outcomes, respectively. Missing values in explanatory variables were
imputed using Stata®’s imputing facility. Data sets of 2009 and 2010 surveys were appended
to the data set of 2008 survey. A new set of dichotomous variables with the responses
recoded as either ‘yes’ or ‘no’ were generated for dependent variables to facilitate logistic
regression analysis. Questionnaires of these surveys are provided in Appendix 5.
In both the borough-level and STiW-level surveys variable’s values were recoded to have
uniformity in progression from negative to positive answers. Data in both the surveys were at
individual level. Borough-level survey data afforded comparison of outcomes in STiW
neighbourhood with that of SD neighbourhood. However, STiW-level survey data did not
afford such comparison as it was conducted only in STiW neighbourhood.
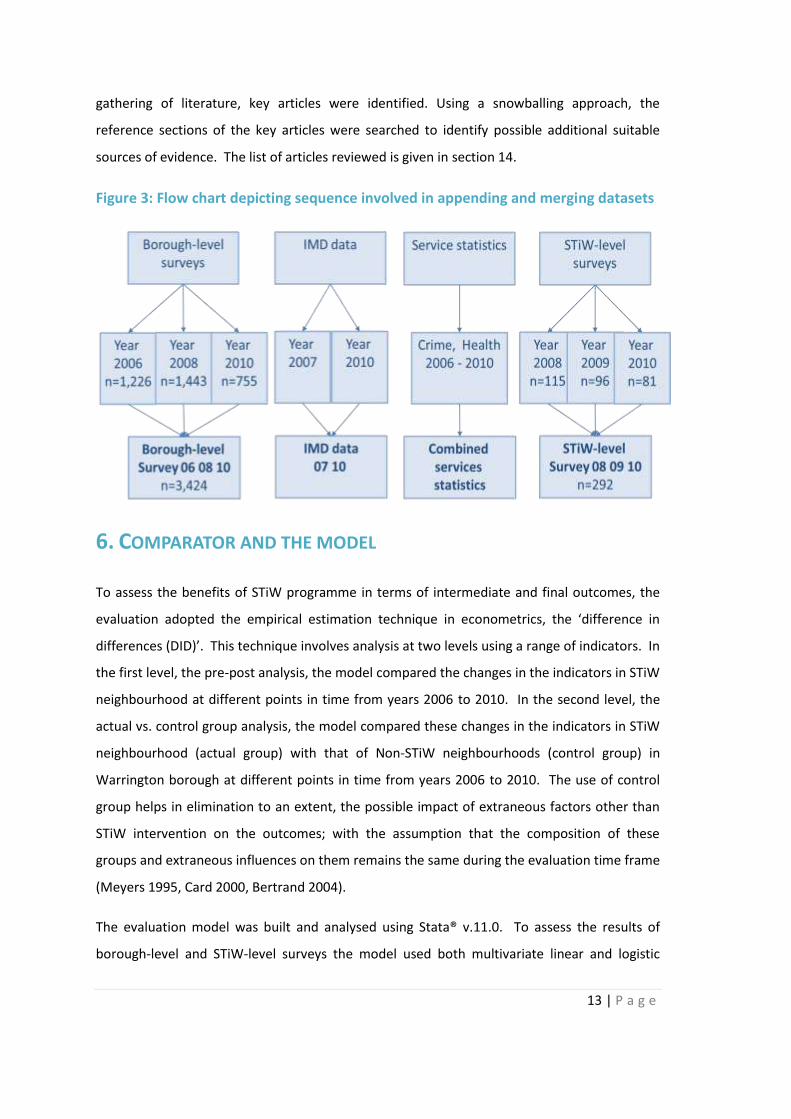
The diagrammatic representation of sequential process adopted above is given in Figure 3.
5.5 Review of the literature
A review of the published literature was undertaken with the objective of establishing the
available evidence from relevant studies. The key search terms used included deprivation,
education attainment, elderly, economically active, employed, gender, neighbourhood
engagement, involvement, council, services, satisfaction, crime, ASB, anti-social behaviour,
population, health, A&E, hospital episode, social service, empowerment, responsiveness,
neighbourhood and impoverished in different combinations in England and United Kingdom
settings; both in the title and in the content of the article/book/report. After the initial
13 | P a g e
gathering of literature, key articles were identified. Using a snowballing approach, the
reference sections of the key articles were searched to identify possible additional suitable
sources of evidence. The list of articles reviewed is given in section 14.
Figure 3: Flow chart depicting sequence involved in appending and merging datasets
6. COMPARATOR AND THE MODEL
To assess the benefits of STiW programme in terms of intermediate and final outcomes, the
evaluation adopted the empirical estimation technique in econometrics, the ‘difference in
differences (DID)’. This technique involves analysis at two levels using a range of indicators. In
the first level, the pre-post analysis, the model compared the changes in the indicators in STiW
neighbourhood at different points in time from years 2006 to 2010. In the second level, the
actual vs. control group analysis, the model compared these changes in the indicators in STiW
neighbourhood (actual group) with that of Non-STiW neighbourhoods (control group) in
Warrington borough at different points in time from years 2006 to 2010. The use of control
group helps in elimination to an extent, the possible impact of extraneous factors other than
STiW intervention on the outcomes; with the assumption that the composition of these
groups and extraneous influences on them remains the same during the evaluation time frame
(Meyers 1995, Card 2000, Bertrand 2004).
The evaluation model was built and analysed using Stata® v.11.0. To assess the results of
borough-level and STiW-level surveys the model used both multivariate linear and logistic
14 | P a g e
regression techniques. Resident’s perceptions of outcomes are influenced by need related
characteristics (DCLG (e) 2003, James 2009, Bedi 2005). For the borough-level surveys the
results were controlled for effects of the need-related characteristics such as gender, age,
economic status, deprivation levels and chronic illness. Similarly for STiW-level surveys the
results were controlled for education attainment, smoking habit, interest in new things, how
resident’s feel about themselves and their self-rated health status. The results of borough-
level surveys were much more robust than that of STiW-level surveys as they afforded
comparison with a control group. Correlation between these explanatory variables was also
examined to avoid double counting. The Stata® log file of the entire analysis is provided in
Appendix 9.
To assess the statistical significance of results, the evaluation adopted three levels of
significance (α) for ‘p’ values: High with ‘p’ value less than 0.01, Medium with ‘p’ value
between 0.01 and 0.05 and Low with ‘p’ values between 0.05 and 0.1. ‘p’ value is a measure
of probability that the results seen were merely due to a matter of chance, than any
association. However, ‘p’ value is not an indicator of causality. Higher the ‘p’ value greater is
the probability the result seen is due to chance or random occurrence.
7. ESTIMATION OF DEPRIVATION LEVELS
The Indices of Multiple Deprivation (Henceforth: IMD), based on a methodology developed by
the Social Disadvantage Research Centre at the University of Oxford, identifies levels of
deprivation at the small area level, the Lower Super Output Areas (Henceforth: LSOA). IMD
identifies and measures deprivation for distinct domains: Income, employment, health and
disability, education skills and training, barriers to housing and services, living environment
and crime; and then aggregates them to provide an overall measure of multiple deprivation.
The index scores the deprivation in these domains and then ranks them. The higher the
deprivation score higher is the degree of deprivation. The higher the deprivation rank lesser is
the degree of deprivation with the rank 1 indicating the most deprived and the rank of 32,143
indicating the least deprived LSOA in England. To assess the inequality gap between STiW and
Non-STiW neighbourhoods the evaluation mapped the deprivation levels for all LSOAs of
Warrington borough for the year 2007 and 2010 (ONS 2011, Noble et al. 2007, 2010). The IMD
scores for the year 2008 and 2009 for all the domains were derived through interpolation of
scores for the years 2007 and 2010 assuming a linear relationship.
15 | P a g e
8. ESTIMATION OF COSTS
The costs were estimated using budgetary estimates for the STiW programme for the years
2006-2010 and for Health Inequalities Project for the years 2008-2010. These estimates were
inflation adjusted to year 2010 using suitable inflators (Curtis 2010). The details of the cost
estimates are provided under section 10.2 in Table 5.
9. ESTIMATION OF BENEFITS
STiW being a broad based programme may influence outcomes in several areas. The following
rationale was used to shortlist the areas and arrive at indicators for them for the analysis of
outcomes:
Relevance to the core aims and objectives of STiW programme
Availability of data at different points in time (2006-2010)
Felt as important by the community as expressed in borough-level surveys
Felt as ‘needs to be improved’ by the community as expressed in borough-level
surveys
Discussions had with members of the steering committee at Warrington on 9th of May
2011
Based on above, crime and anti-social behaviour, involvement and empowerment of residents
with regard to local council decisions, effectiveness and satisfaction with council services and
population health were identified as main areas for evaluation of outcomes. The indicators
chosen to assess the outcomes under each of these areas were compatible with National
Indicator Set (NIS) developed by Department of Communities and Local Government
(Commission 2011) and national data sets and those in relevant published literature. The
choice also considered both payers perspective, such as satisfaction with council and its
services and societal perspective such as perceptions about safety and health.
The intermediate outcomes were assessed by analysing the changes in uptake patterns of
relevant council services at years 2008 and 2010 with year 2006 as the baseline. The final
outcomes were assessed using indicators based on resident’s perceptions as expressed in
borough-level and STiW-level surveys carried out at different points in time from year 2006 to

16 | P a g e
2010. Fulfilment of needs as expressed in baseline survey in the year 2006 was also
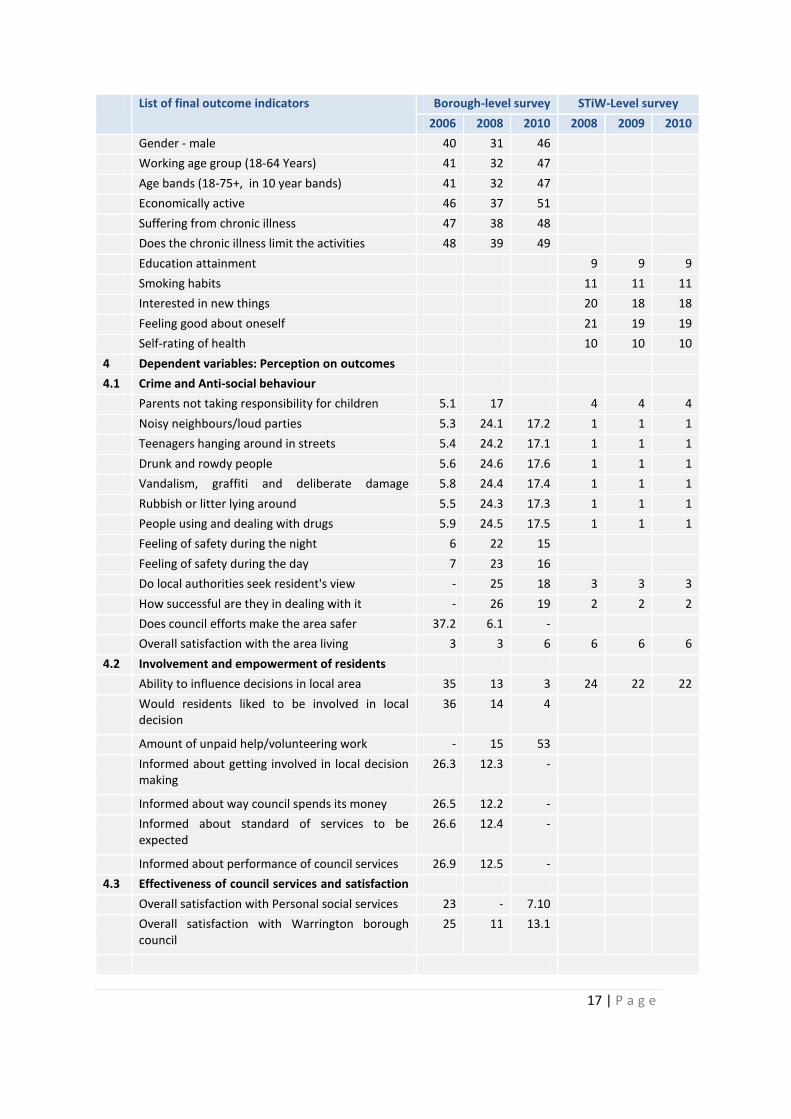
considered as an outcome. The complete list of indicators is provided in Table 1.
Table 1: List of indicators used to assess final outcomes
List of final outcome indicators Borough-level survey STiW-Level survey
2006 2008 2010 2008 2009 2010
1 Local and other characteristics
Year survey was carried out
STiW or Non-STiW neighbourhood
LSOA code
IMD overall score
IMD overall score Squared
IMD health score
IMD income score
IMD employment score
IMD education score
IMD housing score
IMD crime score
IMD living environment score
2 Expression of needs: Area which needs improvement
Access to nature 2 2 2
Activities for teenagers 2 2 2
Affordable decent housing 2 2 2
Clean streets 2 2 2
Community activities 2 2 2
Cultural facilities 2 2 2
Education provision 2 2 2
Park and open spaces 2 2 2
Sports and leisure activities 2 2 2
Health services 2 2 2
Job prospects 2 2 2
Wage level and local cost of living 2 2 2
The level of crime 2 2 2
Level of pollution 2 2 2
Traffic Congestion 2 2 2
Public Transport 2 2 2
Race/Ethnic Relations 2 2 2
Roads and pavements 2 2 2
Shopping facilities 2 2 2
3 Explanatory variables: Need related characteristics of respondents
17 | P a g e
List of final outcome indicators Borough-level survey STiW-Level survey
2006 2008 2010 2008 2009 2010
Gender - male 40 31 46
Working age group (18-64 Years) 41 32 47
Age bands (18-75+, in 10 year bands) 41 32 47
Economically active 46 37 51
Suffering from chronic illness 47 38 48
Does the chronic illness limit the activities 48 39 49
Education attainment 9 9 9
Smoking habits 11 11 11
Interested in new things 20 18 18
Feeling good about oneself 21 19 19
Self-rating of health 10 10 10
4 Dependent variables: Perception on outcomes
4.1 Crime and Anti-social behaviour
Parents not taking responsibility for children 5.1 17 4 4 4
Noisy neighbours/loud parties 5.3 24.1 17.2 1 1 1
Teenagers hanging around in streets 5.4 24.2 17.1 1 1 1
Drunk and rowdy people 5.6 24.6 17.6 1 1 1
Vandalism, graffiti and deliberate damage properties
5.8 24.4 17.4 1 1 1
Rubbish or litter lying around 5.5 24.3 17.3 1 1 1
People using and dealing with drugs 5.9 24.5 17.5 1 1 1
Feeling of safety during the night 6 22 15
Feeling of safety during the day 7 23 16
Do local authorities seek resident's view - 25 18 3 3 3
How successful are they in dealing with it - 26 19 2 2 2
Does council efforts make the area safer 37.2 6.1 -
Overall satisfaction with the area living 3 3 6 6 6 6
4.2 Involvement and empowerment of residents
Ability to influence decisions in local area 35 13 3 24 22 22
Would residents liked to be involved in local decision
36 14 4
Amount of unpaid help/volunteering work - 15 53
Informed about getting involved in local decision making
26.3 12.3 -
Informed about way council spends its money 26.5 12.2 -
Informed about standard of services to be expected
26.6 12.4 -
Informed about performance of council services 26.9 12.5 -
4.3 Effectiveness of council services and satisfaction with
Overall satisfaction with Personal social services 23 - 7.10
Overall satisfaction with Warrington borough council
25 11 13.1
18 | P a g e
List of final outcome indicators Borough-level survey STiW-Level survey
2006 2008 2010 2008 2009 2010
Overall satisfaction with Cheshire Police - 7.1 13.2 28 26 26
Overall satisfaction with GP - 7.3 13.4
Overall satisfaction with local hospital - 7.4 13.5 28 26 26
Satisfaction with experience of contacting council 33 30
Does council promote interests of local residents 37.08 6.3 -
Does council acts on concerns of local residents 37.09 6.4 -
4.4 Health
Wants to quit smoking 13 13 13
Portions of fruit and vegetable consumed per day 34 15 15 15
Frequency of moderate exercise 36 18 16 16
Frequency of vigorous exercise 37 19 17 17
Note: numbers indicate question numbers in survey questionnaires
10. RESULTS
10.1 Descriptive statistics
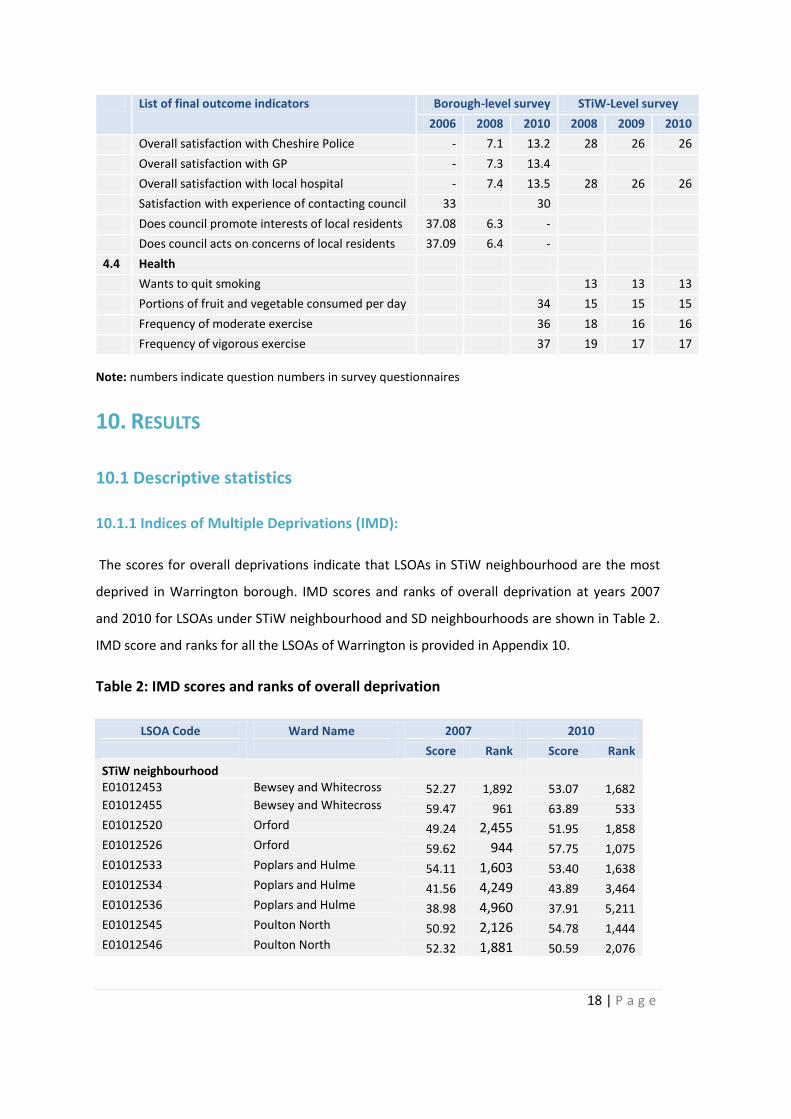
10.1.1 Indices of Multiple Deprivations (IMD):
The scores for overall deprivations indicate that LSOAs in STiW neighbourhood are the most
deprived in Warrington borough. IMD scores and ranks of overall deprivation at years 2007
and 2010 for LSOAs under STiW neighbourhood and SD neighbourhoods are shown in Table 2.
IMD score and ranks for all the LSOAs of Warrington is provided in Appendix 10.
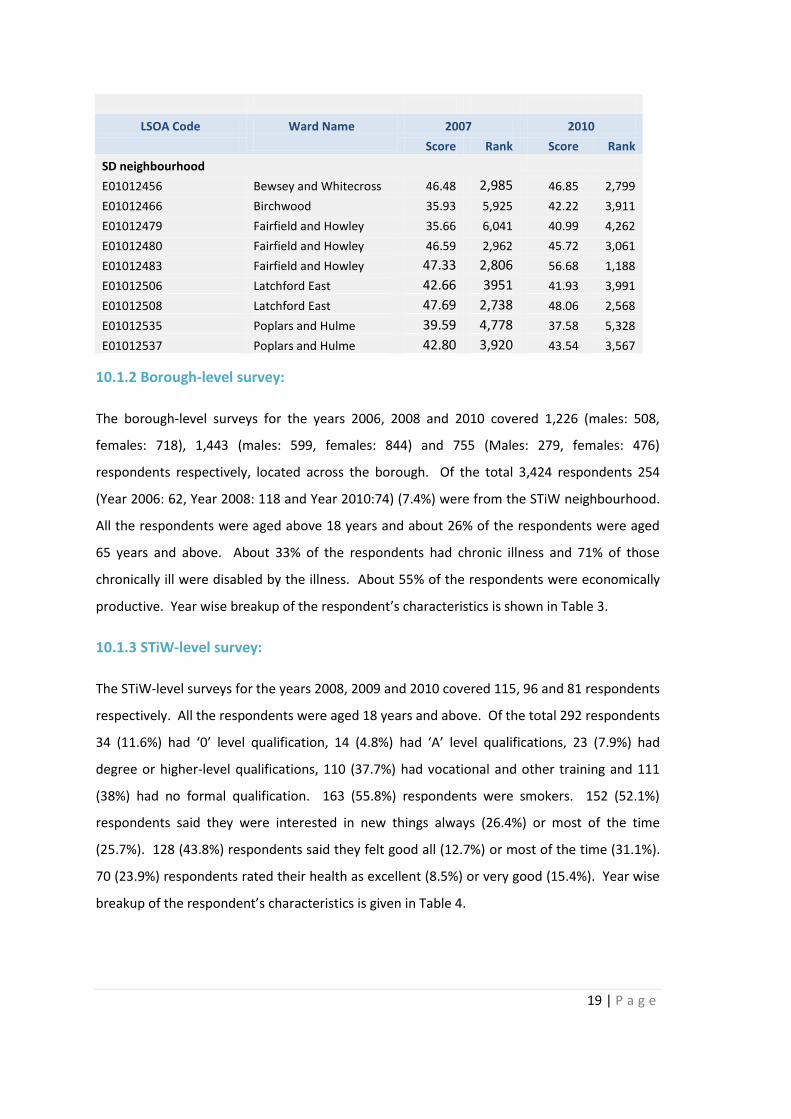
Table 2: IMD scores and ranks of overall deprivation
LSOA Code Ward Name 2007 2010
Score Rank Score Rank
STiW neighbourhood
E01012453 Bewsey and Whitecross 52.27 1,892 53.07 1,682 E01012455 Bewsey and Whitecross 59.47 961 63.89 533 E01012520 Orford 49.24 2,455 51.95 1,858 E01012526 Orford 59.62 944 57.75 1,075 E01012533 Poplars and Hulme 54.11 1,603 53.40 1,638 E01012534 Poplars and Hulme 41.56 4,249 43.89 3,464 E01012536 Poplars and Hulme 38.98 4,960 37.91 5,211 E01012545 Poulton North 50.92 2,126 54.78 1,444 E01012546 Poulton North 52.32 1,881 50.59 2,076
19 | P a g e
LSOA Code Ward Name 2007 2010
Score Rank Score Rank
SD neighbourhood
E01012456 Bewsey and Whitecross 46.48 2,985 46.85 2,799
E01012466 Birchwood 35.93 5,925 42.22 3,911
E01012479 Fairfield and Howley 35.66 6,041 40.99 4,262
E01012480 Fairfield and Howley 46.59 2,962 45.72 3,061
E01012483 Fairfield and Howley 47.33 2,806 56.68 1,188
E01012506 Latchford East 42.66 3951 41.93 3,991
E01012508 Latchford East 47.69 2,738 48.06 2,568
E01012535 Poplars and Hulme 39.59 4,778 37.58 5,328
E01012537 Poplars and Hulme 42.80 3,920 43.54 3,567
10.1.2 Borough-level survey:
The borough-level surveys for the years 2006, 2008 and 2010 covered 1,226 (males: 508,
females: 718), 1,443 (males: 599, females: 844) and 755 (Males: 279, females: 476)
respondents respectively, located across the borough. Of the total 3,424 respondents 254
(Year 2006: 62, Year 2008: 118 and Year 2010:74) (7.4%) were from the STiW neighbourhood.
All the respondents were aged above 18 years and about 26% of the respondents were aged
65 years and above. About 33% of the respondents had chronic illness and 71% of those
chronically ill were disabled by the illness. About 55% of the respondents were economically
productive. Year wise breakup of the respondent’s characteristics is shown in Table 3.
10.1.3 STiW-level survey:
The STiW-level surveys for the years 2008, 2009 and 2010 covered 115, 96 and 81 respondents
respectively. All the respondents were aged 18 years and above. Of the total 292 respondents
34 (11.6%) had ‘0’ level qualification, 14 (4.8%) had ‘A’ level qualifications, 23 (7.9%) had
degree or higher-level qualifications, 110 (37.7%) had vocational and other training and 111
(38%) had no formal qualification. 163 (55.8%) respondents were smokers. 152 (52.1%)
respondents said they were interested in new things always (26.4%) or most of the time
(25.7%). 128 (43.8%) respondents said they felt good all (12.7%) or most of the time (31.1%).
70 (23.9%) respondents rated their health as excellent (8.5%) or very good (15.4%). Year wise
breakup of the respondent’s characteristics is given in Table 4.
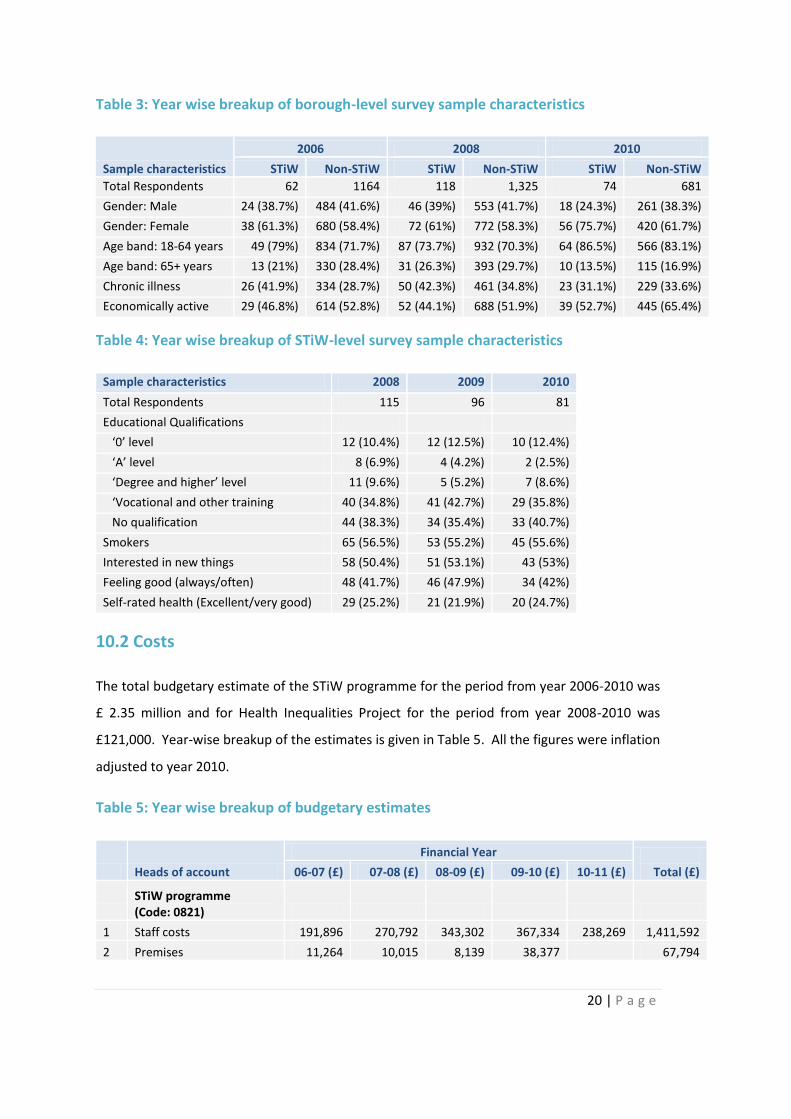
20 | P a g e
Table 3: Year wise breakup of borough-level survey sample characteristics
Sample characteristics
2006 2008 2010
STiW Non-STiW STiW Non-STiW STiW Non-STiW
Total Respondents 62 1164 118 1,325 74 681
Gender: Male 24 (38.7%) 484 (41.6%) 46 (39%) 553 (41.7%) 18 (24.3%) 261 (38.3%)
Gender: Female 38 (61.3%) 680 (58.4%) 72 (61%) 772 (58.3%) 56 (75.7%) 420 (61.7%)
Age band: 18-64 years 49 (79%) 834 (71.7%) 87 (73.7%) 932 (70.3%) 64 (86.5%) 566 (83.1%)
Age band: 65+ years 13 (21%) 330 (28.4%) 31 (26.3%) 393 (29.7%) 10 (13.5%) 115 (16.9%)
Chronic illness 26 (41.9%) 334 (28.7%) 50 (42.3%) 461 (34.8%) 23 (31.1%) 229 (33.6%)
Economically active 29 (46.8%) 614 (52.8%) 52 (44.1%) 688 (51.9%) 39 (52.7%) 445 (65.4%)
Table 4: Year wise breakup of STiW-level survey sample characteristics
Sample characteristics 2008 2009 2010
Total Respondents 115 96 81
Educational Qualifications
‘0’ level 12 (10.4%) 12 (12.5%) 10 (12.4%)
‘A’ level 8 (6.9%) 4 (4.2%) 2 (2.5%)
‘Degree and higher’ level 11 (9.6%) 5 (5.2%) 7 (8.6%)
‘Vocational and other training 40 (34.8%) 41 (42.7%) 29 (35.8%)
No qualification 44 (38.3%) 34 (35.4%) 33 (40.7%)
Smokers 65 (56.5%) 53 (55.2%) 45 (55.6%)
Interested in new things 58 (50.4%) 51 (53.1%) 43 (53%)
Feeling good (always/often) 48 (41.7%) 46 (47.9%) 34 (42%)
Self-rated health (Excellent/very good) 29 (25.2%) 21 (21.9%) 20 (24.7%)
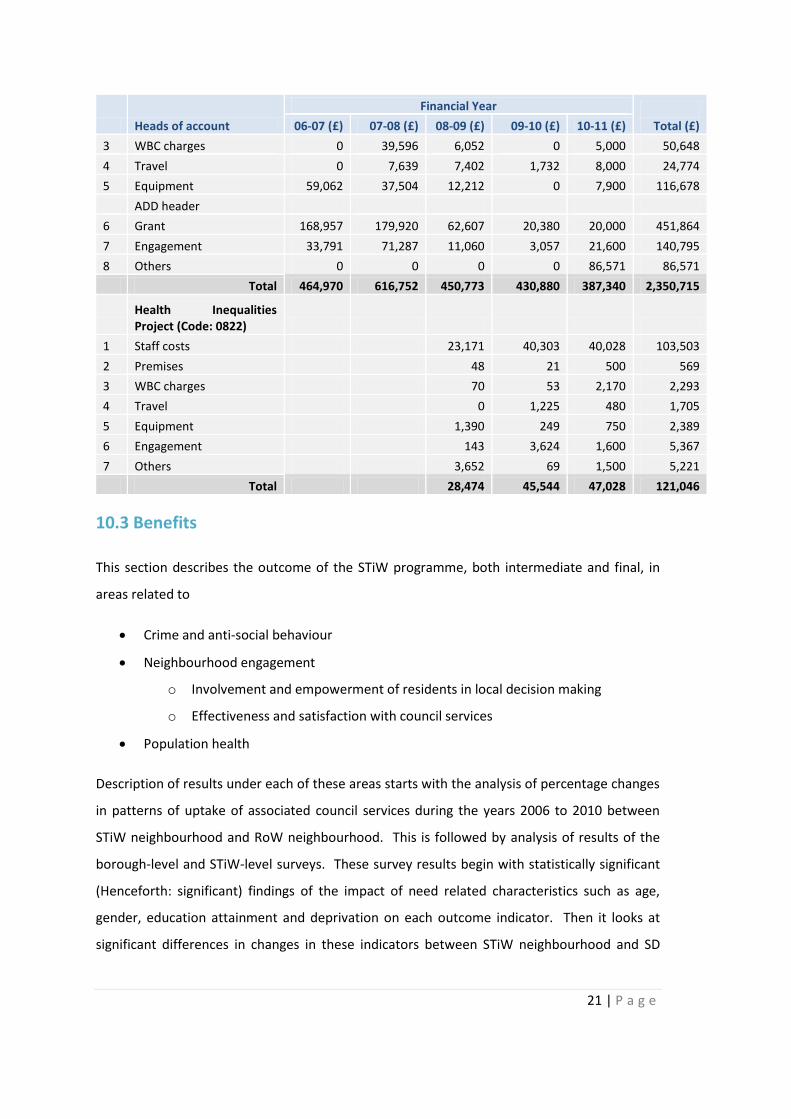
10.2 Costs
The total budgetary estimate of the STiW programme for the period from year 2006-2010 was
£ 2.35 million and for Health Inequalities Project for the period from year 2008-2010 was
£121,000. Year-wise breakup of the estimates is given in Table 5. All the figures were inflation
adjusted to year 2010.
Table 5: Year wise breakup of budgetary estimates
Heads of account
Financial Year Total (£) 06-07 (£) 07-08 (£) 08-09 (£) 09-10 (£) 10-11 (£)
STiW programme (Code: 0821)
1 Staff costs 191,896 270,792 343,302 367,334 238,269 1,411,592
2 Premises 11,264 10,015 8,139 38,377 67,794
21 | P a g e
Heads of account
Financial Year Total (£) 06-07 (£) 07-08 (£) 08-09 (£) 09-10 (£) 10-11 (£)
3 WBC charges 0 39,596 6,052 0 5,000 50,648
4 Travel 0 7,639 7,402 1,732 8,000 24,774
5 Equipment 59,062 37,504 12,212 0 7,900 116,678
ADD header
6 Grant 168,957 179,920 62,607 20,380 20,000 451,864
7 Engagement 33,791 71,287 11,060 3,057 21,600 140,795
8 Others 0 0 0 0 86,571 86,571
Total 464,970 616,752 450,773 430,880 387,340 2,350,715
Health Inequalities Project (Code: 0822)
1 Staff costs 23,171 40,303 40,028 103,503
2 Premises 48 21 500 569
3 WBC charges 70 53 2,170 2,293
4 Travel 0 1,225 480 1,705
5 Equipment 1,390 249 750 2,389
6 Engagement 143 3,624 1,600 5,367
7 Others 3,652 69 1,500 5,221
Total 28,474 45,544 47,028 121,046
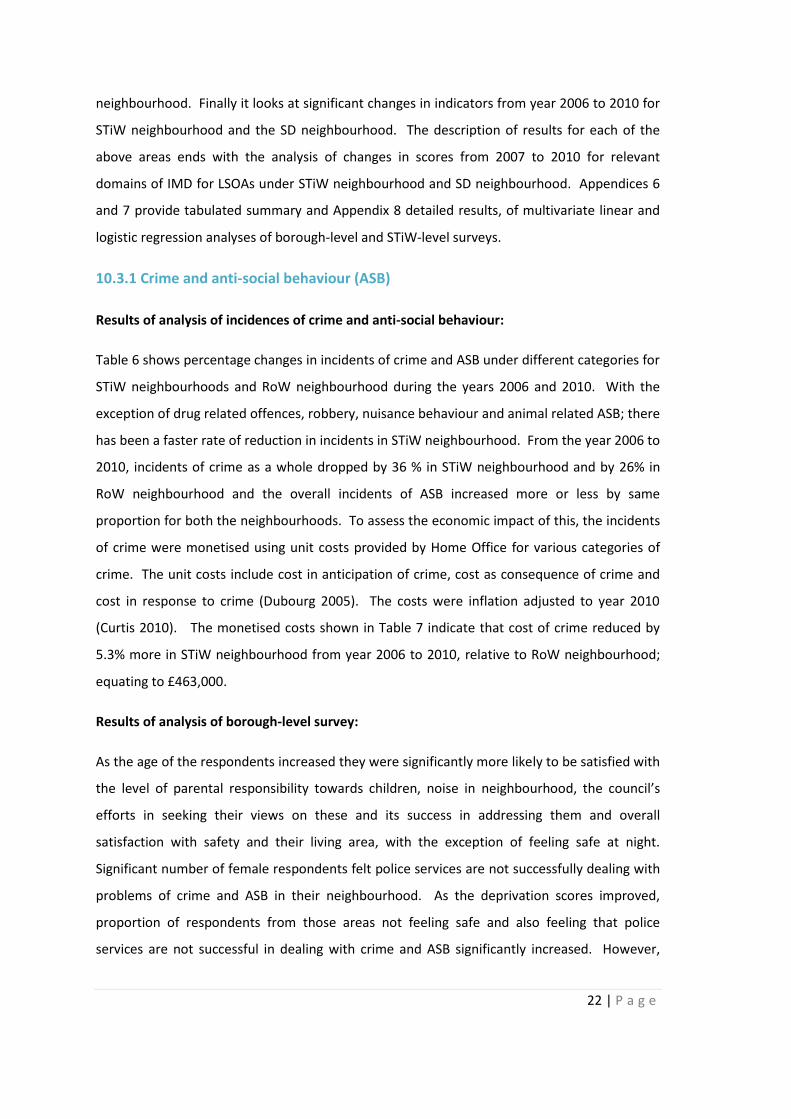
10.3 Benefits
This section describes the outcome of the STiW programme, both intermediate and final, in
areas related to
Crime and anti-social behaviour
Neighbourhood engagement
o Involvement and empowerment of residents in local decision making
o Effectiveness and satisfaction with council services
Population health
Description of results under each of these areas starts with the analysis of percentage changes
in patterns of uptake of associated council services during the years 2006 to 2010 between
STiW neighbourhood and RoW neighbourhood. This is followed by analysis of results of the
borough-level and STiW-level surveys. These survey results begin with statistically significant
(Henceforth: significant) findings of the impact of need related characteristics such as age,
gender, education attainment and deprivation on each outcome indicator. Then it looks at
significant differences in changes in these indicators between STiW neighbourhood and SD
22 | P a g e
neighbourhood. Finally it looks at significant changes in indicators from year 2006 to 2010 for
STiW neighbourhood and the SD neighbourhood. The description of results for each of the
above areas ends with the analysis of changes in scores from 2007 to 2010 for relevant
domains of IMD for LSOAs under STiW neighbourhood and SD neighbourhood. Appendices 6
and 7 provide tabulated summary and Appendix 8 detailed results, of multivariate linear and
logistic regression analyses of borough-level and STiW-level surveys.
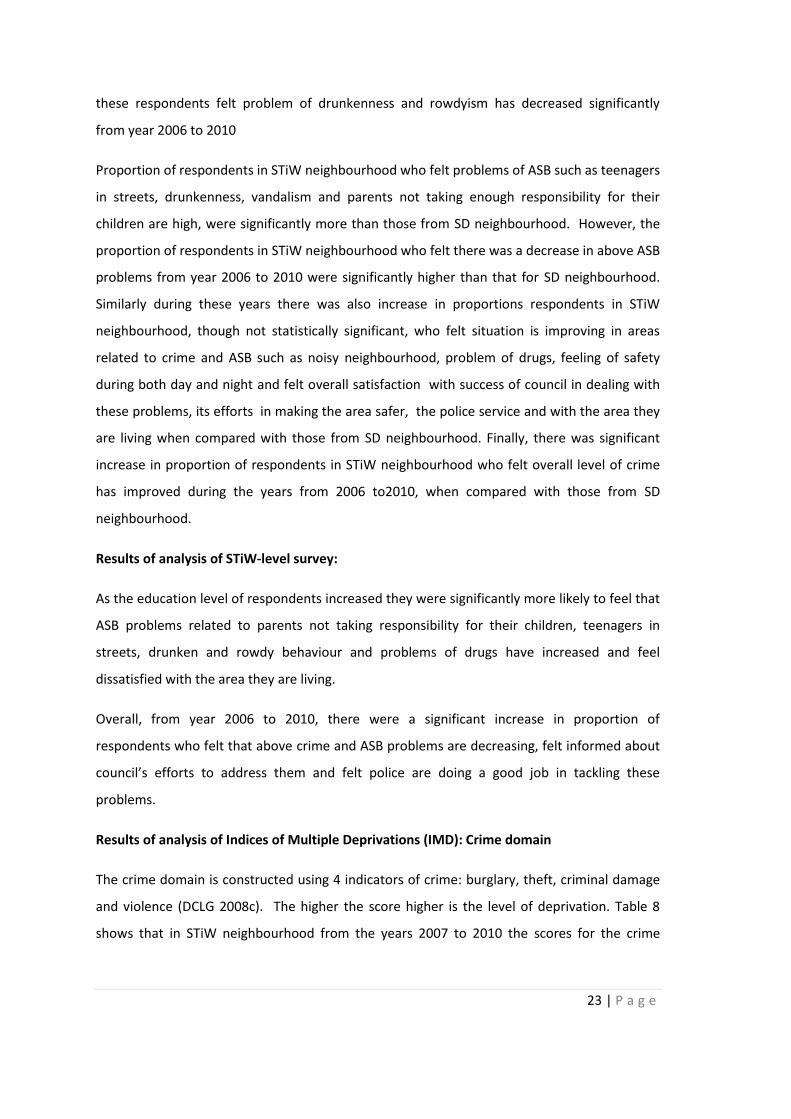
10.3.1 Crime and anti-social behaviour (ASB)
Results of analysis of incidences of crime and anti-social behaviour:
Table 6 shows percentage changes in incidents of crime and ASB under different categories for
STiW neighbourhoods and RoW neighbourhood during the years 2006 and 2010. With the
exception of drug related offences, robbery, nuisance behaviour and animal related ASB; there
has been a faster rate of reduction in incidents in STiW neighbourhood. From the year 2006 to
2010, incidents of crime as a whole dropped by 36 % in STiW neighbourhood and by 26% in
RoW neighbourhood and the overall incidents of ASB increased more or less by same
proportion for both the neighbourhoods. To assess the economic impact of this, the incidents
of crime were monetised using unit costs provided by Home Office for various categories of
crime. The unit costs include cost in anticipation of crime, cost as consequence of crime and
cost in response to crime (Dubourg 2005). The costs were inflation adjusted to year 2010
(Curtis 2010). The monetised costs shown in Table 7 indicate that cost of crime reduced by
5.3% more in STiW neighbourhood from year 2006 to 2010, relative to RoW neighbourhood;
equating to £463,000.
Results of analysis of borough-level survey:
As the age of the respondents increased they were significantly more likely to be satisfied with
the level of parental responsibility towards children, noise in neighbourhood, the council’s
efforts in seeking their views on these and its success in addressing them and overall
satisfaction with safety and their living area, with the exception of feeling safe at night.
Significant number of female respondents felt police services are not successfully dealing with
problems of crime and ASB in their neighbourhood. As the deprivation scores improved,
proportion of respondents from those areas not feeling safe and also feeling that police
services are not successful in dealing with crime and ASB significantly increased. However,
23 | P a g e
these respondents felt problem of drunkenness and rowdyism has decreased significantly
from year 2006 to 2010
Proportion of respondents in STiW neighbourhood who felt problems of ASB such as teenagers
in streets, drunkenness, vandalism and parents not taking enough responsibility for their
children are high, were significantly more than those from SD neighbourhood. However, the
proportion of respondents in STiW neighbourhood who felt there was a decrease in above ASB
problems from year 2006 to 2010 were significantly higher than that for SD neighbourhood.
Similarly during these years there was also increase in proportions respondents in STiW
neighbourhood, though not statistically significant, who felt situation is improving in areas
related to crime and ASB such as noisy neighbourhood, problem of drugs, feeling of safety
during both day and night and felt overall satisfaction with success of council in dealing with
these problems, its efforts in making the area safer, the police service and with the area they
are living when compared with those from SD neighbourhood. Finally, there was significant
increase in proportion of respondents in STiW neighbourhood who felt overall level of crime
has improved during the years from 2006 to2010, when compared with those from SD
neighbourhood.
Results of analysis of STiW-level survey:
As the education level of respondents increased they were significantly more likely to feel that
ASB problems related to parents not taking responsibility for their children, teenagers in
streets, drunken and rowdy behaviour and problems of drugs have increased and feel
dissatisfied with the area they are living.
Overall, from year 2006 to 2010, there were a significant increase in proportion of
respondents who felt that above crime and ASB problems are decreasing, felt informed about
council’s efforts to address them and felt police are doing a good job in tackling these
problems.
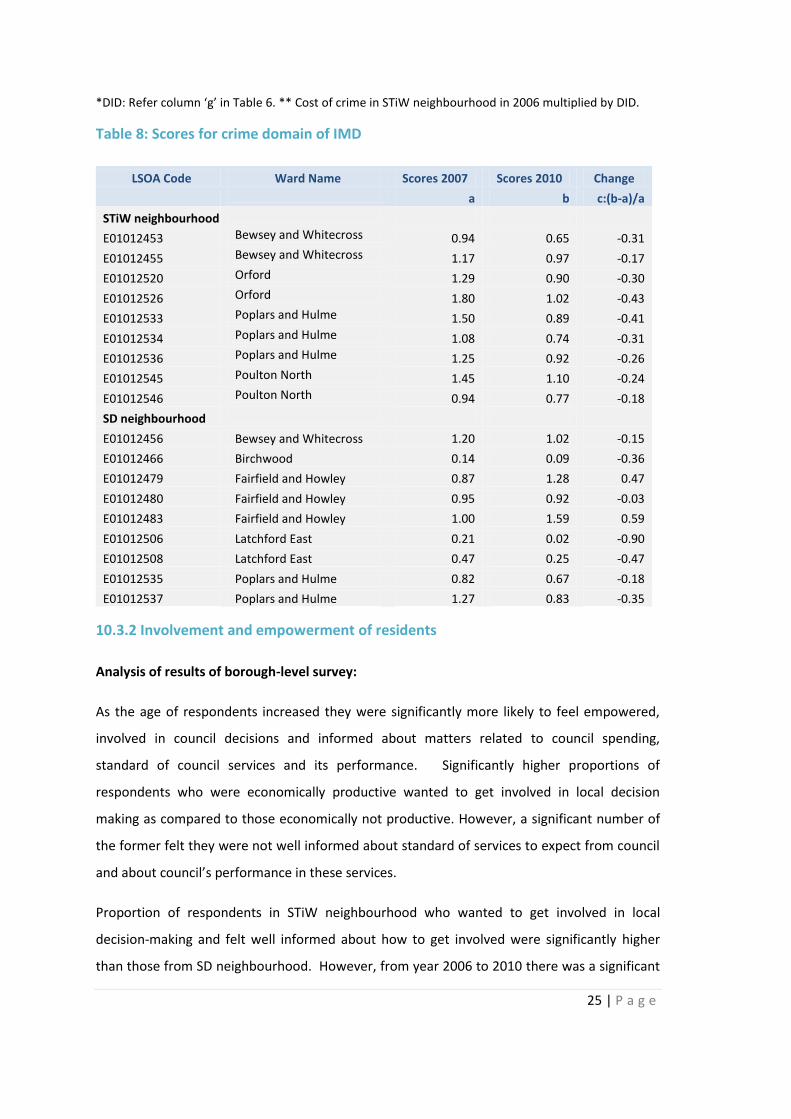
Results of analysis of Indices of Multiple Deprivations (IMD): Crime domain
The crime domain is constructed using 4 indicators of crime: burglary, theft, criminal damage
and violence (DCLG 2008c). The higher the score higher is the level of deprivation. Table 8
shows that in STiW neighbourhood from the years 2007 to 2010 the scores for the crime
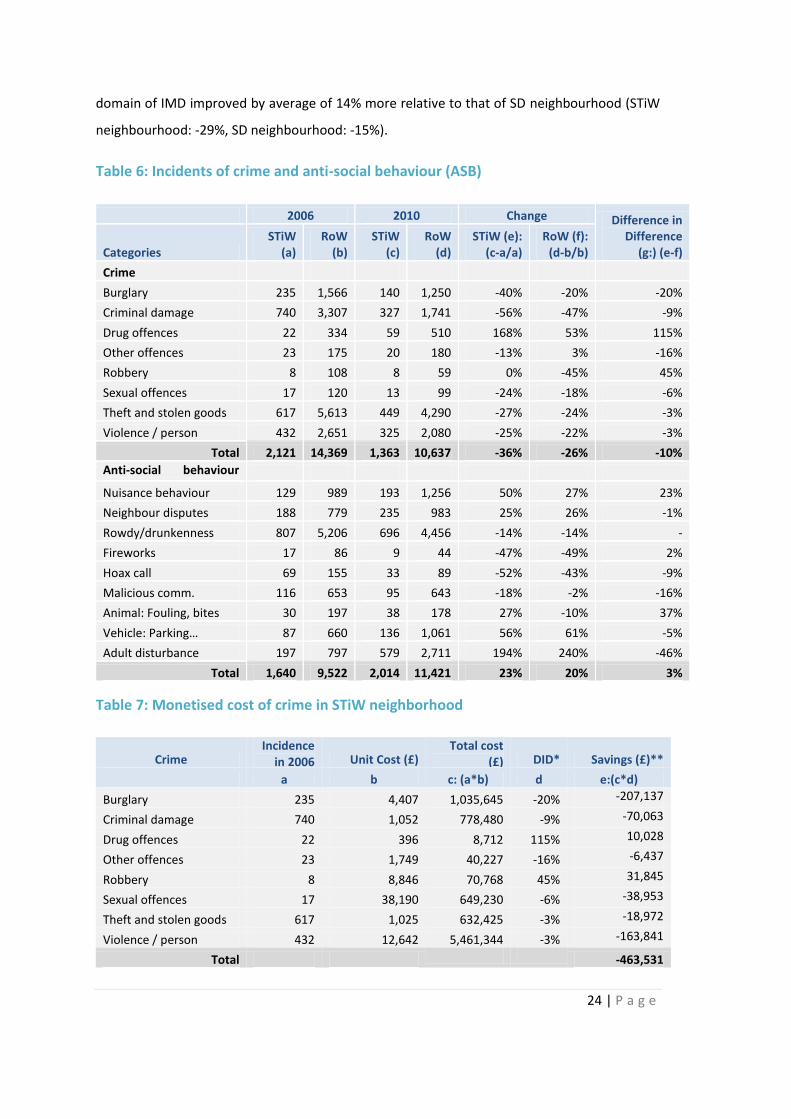
24 | P a g e
domain of IMD improved by average of 14% more relative to that of SD neighbourhood (STiW
neighbourhood: -29%, SD neighbourhood: -15%).
Table 6: Incidents of crime and anti-social behaviour (ASB)
2006 2010 Change Difference in Difference
(g:) (e-f) Categories STiW
(a) RoW
(b) STiW
(c) RoW
(d) STiW (e):
(c-a/a) RoW (f):
(d-b/b)
Crime
Burglary 235 1,566 140 1,250 -40% -20% -20%
Criminal damage 740 3,307 327 1,741 -56% -47% -9%
Drug offences 22 334 59 510 168% 53% 115%
Other offences 23 175 20 180 -13% 3% -16%
Robbery 8 108 8 59 0% -45% 45%
Sexual offences 17 120 13 99 -24% -18% -6%
Theft and stolen goods 617 5,613 449 4,290 -27% -24% -3%
Violence / person 432 2,651 325 2,080 -25% -22% -3%
Total 2,121 14,369 1,363 10,637 -36% -26% -10%
Anti-social behaviour (ASB)
Nuisance behaviour 129 989 193 1,256 50% 27% 23%
Neighbour disputes 188 779 235 983 25% 26% -1%
Rowdy/drunkenness 807 5,206 696 4,456 -14% -14% -
Fireworks 17 86 9 44 -47% -49% 2%
Hoax call 69 155 33 89 -52% -43% -9%
Malicious comm. 116 653 95 643 -18% -2% -16%
Animal: Fouling, bites 30 197 38 178 27% -10% 37%
Vehicle: Parking… 87 660 136 1,061 56% 61% -5%
Adult disturbance 197 797 579 2,711 194% 240% -46%
Total 1,640 9,522 2,014 11,421 23% 20% 3%
Table 7: Monetised cost of crime in STiW neighborhood
Crime Incidence
in 2006 Unit Cost (£) Total cost
(£) DID* Savings (£)**
a b c: (a*b) d e:(c*d)
Burglary 235 4,407 1,035,645 -20% -207,137
Criminal damage 740 1,052 778,480 -9% -70,063
Drug offences 22 396 8,712 115% 10,028
Other offences 23 1,749 40,227 -16% -6,437
Robbery 8 8,846 70,768 45% 31,845
Sexual offences 17 38,190 649,230 -6% -38,953
Theft and stolen goods 617 1,025 632,425 -3% -18,972
Violence / person 432 12,642 5,461,344 -3% -163,841
Total -463,531
25 | P a g e
*DID: Refer column ‘g’ in Table 6. ** Cost of crime in STiW neighbourhood in 2006 multiplied by DID.
Table 8: Scores for crime domain of IMD
LSOA Code Ward Name Scores 2007 Scores 2010 Change
a b c:(b-a)/a
STiW neighbourhood
E01012453 Bewsey and Whitecross 0.94 0.65 -0.31
E01012455 Bewsey and Whitecross 1.17 0.97 -0.17
E01012520 Orford 1.29 0.90 -0.30
E01012526 Orford 1.80 1.02 -0.43
E01012533 Poplars and Hulme 1.50 0.89 -0.41
E01012534 Poplars and Hulme 1.08 0.74 -0.31
E01012536 Poplars and Hulme 1.25 0.92 -0.26
E01012545 Poulton North 1.45 1.10 -0.24
E01012546 Poulton North 0.94 0.77 -0.18
SD neighbourhood
E01012456 Bewsey and Whitecross 1.20 1.02 -0.15
E01012466 Birchwood 0.14 0.09 -0.36
E01012479 Fairfield and Howley 0.87 1.28 0.47
E01012480 Fairfield and Howley 0.95 0.92 -0.03
E01012483 Fairfield and Howley 1.00 1.59 0.59
E01012506 Latchford East 0.21 0.02 -0.90
E01012508 Latchford East 0.47 0.25 -0.47
E01012535 Poplars and Hulme 0.82 0.67 -0.18
E01012537 Poplars and Hulme 1.27 0.83 -0.35
10.3.2 Involvement and empowerment of residents
Analysis of results of borough-level survey:
As the age of respondents increased they were significantly more likely to feel empowered,
involved in council decisions and informed about matters related to council spending,
standard of council services and its performance. Significantly higher proportions of
respondents who were economically productive wanted to get involved in local decision
making as compared to those economically not productive. However, a significant number of
the former felt they were not well informed about standard of services to expect from council
and about council’s performance in these services.
Proportion of respondents in STiW neighbourhood who wanted to get involved in local
decision-making and felt well informed about how to get involved were significantly higher
than those from SD neighbourhood. However, from year 2006 to 2010 there was a significant
26 | P a g e
decrease in proportion of respondents in STiW neighbourhood who would like to get involved
in local decision making as compared with those in SD neighbourhood. During the years from
2006 to 2010 there was an increase in proportion of respondents in STiW neighbourhood,
though not statistically significant, who felt better informed about the way the council spend
its money, standard of services to expect, about the performance of services and their ability
to influence council decisions as compared with those in SD neighbourhood.
Analysis of results of STiW-level survey:
From the year 2006 to 2010 there was a significant increase in proportion of respondents who
felt they have the ability to influence council decisions in local area.
10.3.3 Effectiveness and responsiveness of council services
Analysis of results of borough-level survey:
As the age of respondents increased, they were significantly more likely to feel satisfied with
police, GP, local hospital services, personal social services, council’s efforts to promote
resident’s interests and with its overall performance. Female respondents were less satisfied
with police and GP services. Respondents from less deprived areas were significantly less
satisfied with police services, GP services and council’s efforts to promote resident’s interests.
Respondents who were chronically ill were significantly satisfied with GP services. Significantly
higher proportions of respondents who were economically productive were less satisfied with
council’s efforts in promoting interest of residents and acting on concerns of residents as
compared with those who were not economically productive.
Significantly higher proportion of respondents in STiW neighbourhood were less satisfied with
the performance of council, experience of contacting council and its actions on concerns of
residents as compared with those in SD neighbourhood. However, during the years from 2006
to 2010 there was a significant increase in proportion respondents in STiW neighbourhood
who were satisfied with local hospital services, council’s actions on concerns of residents,
experience of contact with council and overall satisfaction with council’s performance as
compared with those in SD neighbourhood. Similarly during these years there was an increase
in proportion of respondents, though not statistically significant, who were satisfied with
police services and with council’s efforts in promoting interest of residents as compared with
27 | P a g e
SD neighbourhood. Please refer to Appendices 6 and 7 for tabulated summary and Appendix 8
for detailed results of the regression analysis.
Analysis of results of STiW-level survey:
From the year 2006 to 2010 there was a significant increase in proportion of respondents who
expressed satisfaction with police.
10.3.4 Population Health
Results of analysis of service uptake indicators:
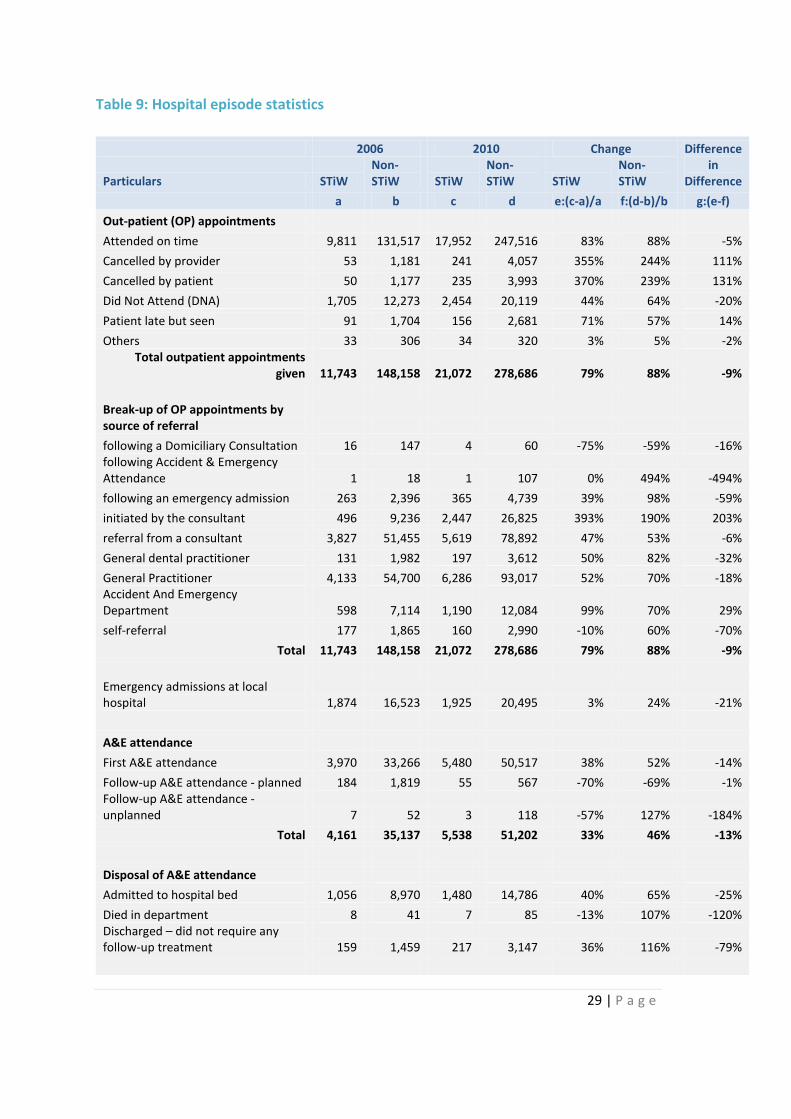
Tables 9 provides hospital episode statistics related to out-patient (OP) appointments,
emergency admissions and A&E incidences at local hospitals and Table 10 provides
information on accessing and continued usage of personal social services. From the year 2006
to 2010 proportions of OP appointments cancelled by the patient and by health care provider
had significantly increased for STiW neighbourhood (362%) as compared with RoW
neighbourhood (241%). However, during the same period proportion of ‘Did Not Attend’
(Henceforth: DNAs) increased at a slower rate for STiW neighbourhood (44%) as compared
with RoW neighbourhood (64%). The total OP appointments increased at a slower rate for
STiW neighbourhood (79%) relative to RoW neighbourhood (88%). This slower rate is seen
across all the major categories of referrals with exception of those initiated by consultant and
A&E department. Proportion of A&E attendances increased at a lesser rate for STiW
neighbourhood (33%) as compared with RoW neighbourhood (46%). Similarly emergency
related admissions increased at a lesser rate for STiW neighbourhood (3%) as compared with
RoW neighbourhood (24%).
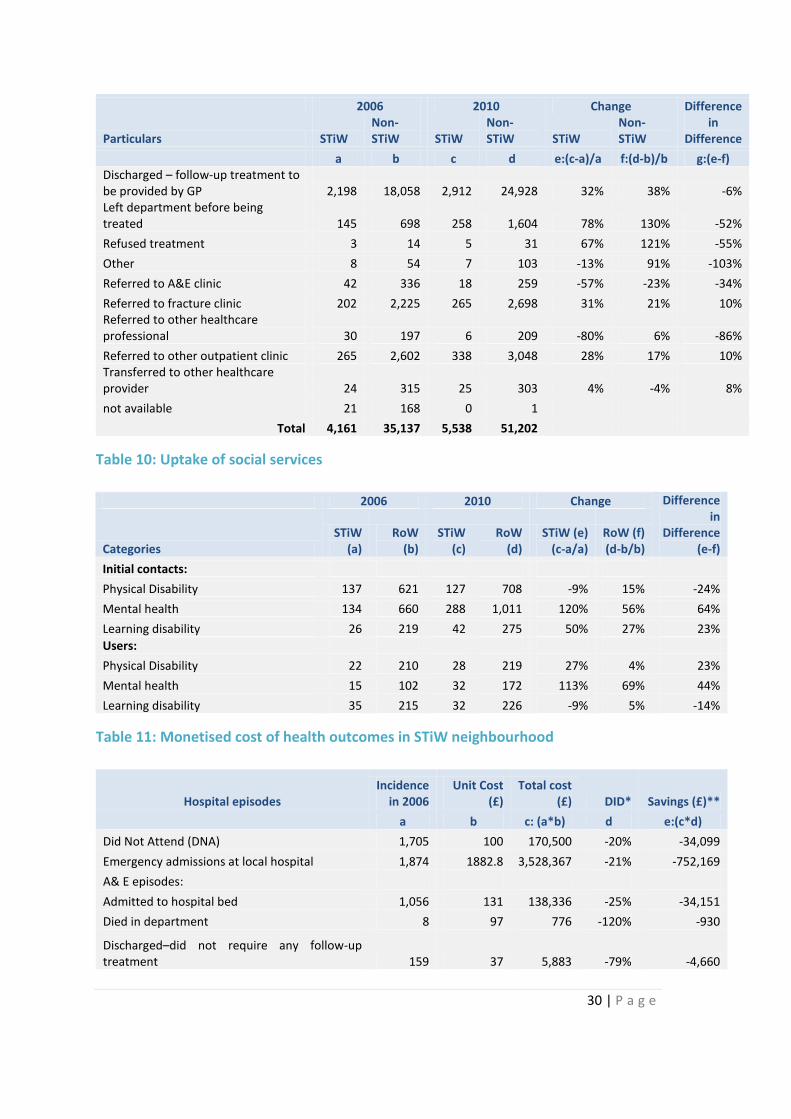
To assess the economic impact of this, the amenable outcomes were monetised using unit
costs from published literature. For emergency in-patient admissions the average length of
stay was arrived at 3.6 days and average cost per day of stay at £523. The monetised costs
shown in Table 11 indicate that savings due to decreased DNAs, A&E episodes and emergency
admissions in STiW neighbourhood from year 2006 to 2010 and can be up to £832,000 relative
to RoW neighbourhood (Stone 1999, drfoster 2009, NHS 2010, NHS 2011a, NHS 2011b, NHS
2011c NHS 2011d, Curtis 2010).
28 | P a g e
Table 10 shows proportion of initial contact with mental health related social services and
continued usage of those services increased for STiW neighbourhood (120% and 113%) as
compared with RoW neighbourhood (56% and 69%).
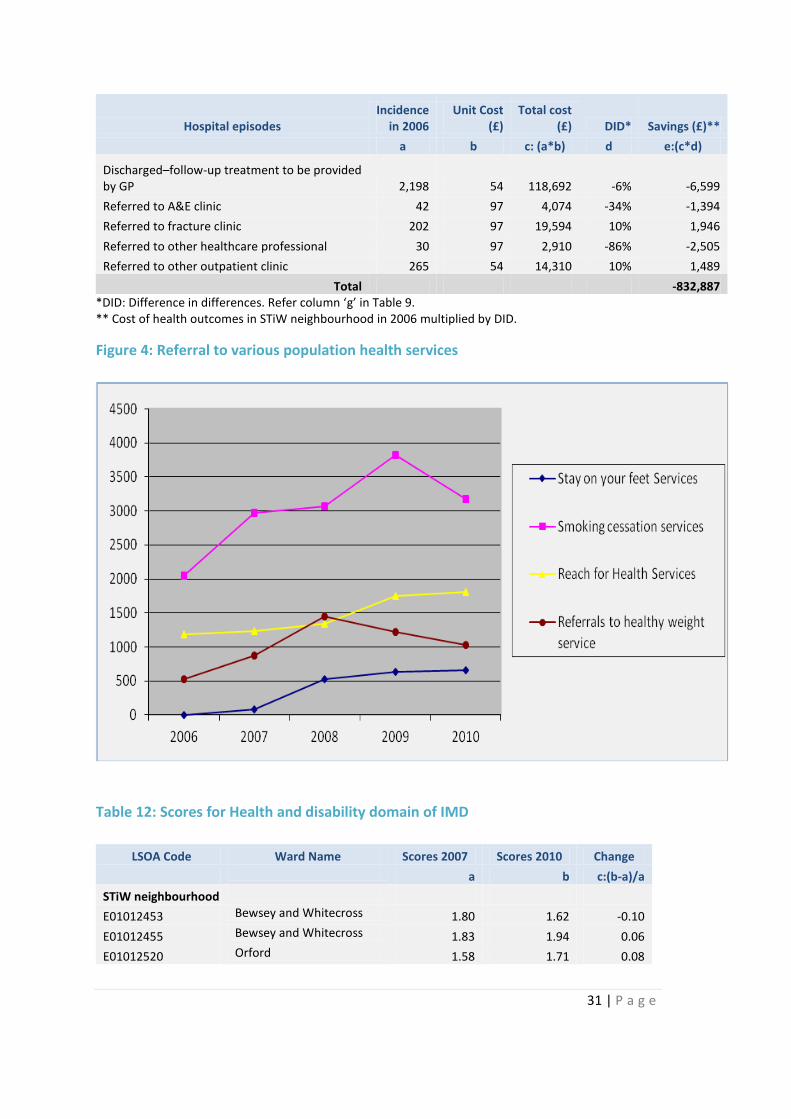
Figure 4 shows an increase in referrals from STiW neighbourhood to various services aimed at
promoting population health such as stay on your feet services for elderly, smoking cessation
services, obesity control services and reach for your health services for healthy lifestyle.
Analysis of results of borough-level survey:
Borough-level surveys with the exception of 2010 survey did not have relevant health related
indicators. Regression results of the indicators in borough-level survey 2010 were inconclusive
with the exception of; as the age of respondents increased they were less likely to be satisfied
with hospital services
Analysis of results of STiW-level survey:
Increase in educational level of respondents was associated with significant increase in healthy
life style as indicated by intake of higher quantity of fruits and frequency of vigorous exercise.
Similarly, those who felt good themselves and rated their health as very good had significantly,
better healthy life styles. Overall, during the years from 2006 to 2010 there was a significant
increase in proportion of respondents who engaged in vigorous exercise.
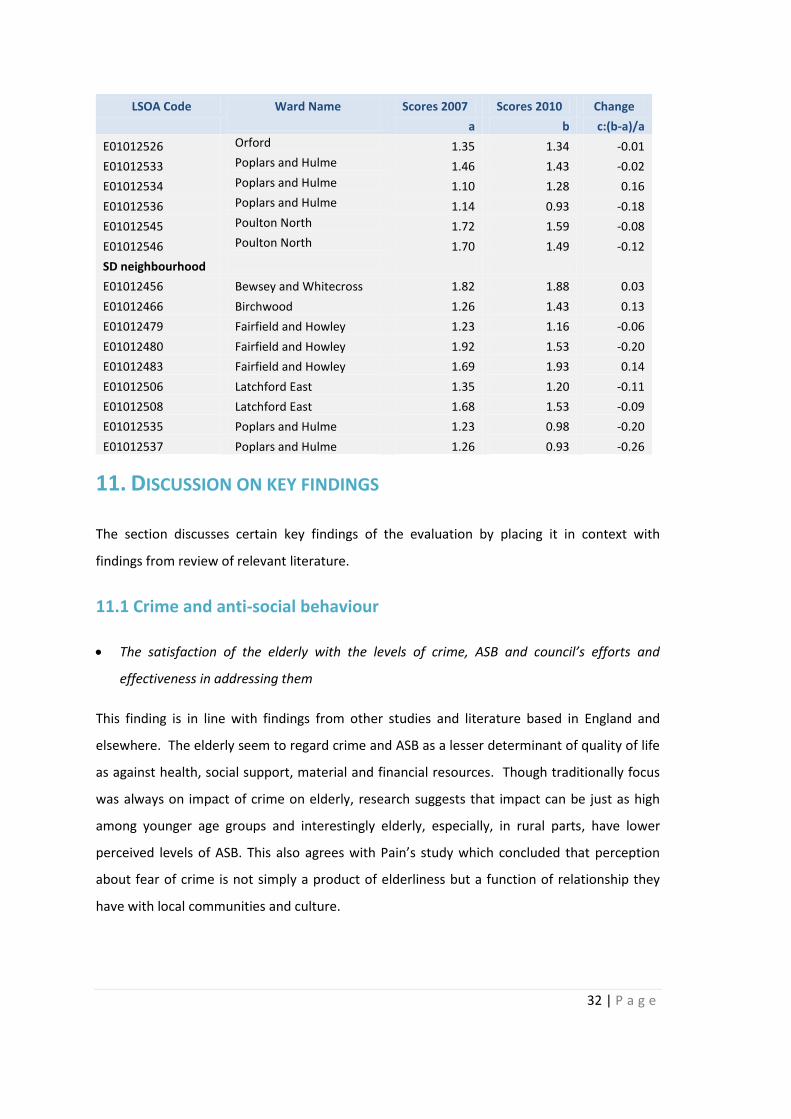
Results of analysis of Indices of Multiple Deprivations (IMD): Health and disability domain
The health and disability domain is constructed using indicators such as measures of acute
morbidity, proportion of adults under 60 years suffering from mood or anxiety disorders,
suicide mortality data and health benefits data (DCLG 2008c). The higher the score, higher is
the level of deprivation. Table 12 shows that from the years 2007 to 2010 the scores for the
health and disability domain of IMD decreased by an average of 2% for LSOAs of STiW
neighbourhood and by 7% for LSOAs of SD neighbourhood.
29 | P a g e
Table 9: Hospital episode statistics
2006 2010 Change Difference in
Difference Particulars STiW Non-STiW STiW
Non-STiW STiW
Non-STiW
a b c d e:(c-a)/a f:(d-b)/b g:(e-f)
Out-patient (OP) appointments
Attended on time 9,811 131,517 17,952 247,516 83% 88% -5%
Cancelled by provider 53 1,181 241 4,057 355% 244% 111%
Cancelled by patient 50 1,177 235 3,993 370% 239% 131%
Did Not Attend (DNA) 1,705 12,273 2,454 20,119 44% 64% -20%
Patient late but seen 91 1,704 156 2,681 71% 57% 14%
Others 33 306 34 320 3% 5% -2% Total outpatient appointments
given 11,743 148,158 21,072 278,686 79% 88% -9%
Break-up of OP appointments by source of referral
following a Domiciliary Consultation 16 147 4 60 -75% -59% -16% following Accident & Emergency Attendance 1 18 1 107 0% 494% -494%
following an emergency admission 263 2,396 365 4,739 39% 98% -59%
initiated by the consultant 496 9,236 2,447 26,825 393% 190% 203%
referral from a consultant 3,827 51,455 5,619 78,892 47% 53% -6%
General dental practitioner 131 1,982 197 3,612 50% 82% -32%
General Practitioner 4,133 54,700 6,286 93,017 52% 70% -18% Accident And Emergency Department 598 7,114 1,190 12,084 99% 70% 29%
self-referral 177 1,865 160 2,990 -10% 60% -70%
Total 11,743 148,158 21,072 278,686 79% 88% -9%
Emergency admissions at local hospital 1,874 16,523 1,925 20,495 3% 24% -21%
A&E attendance
First A&E attendance 3,970 33,266 5,480 50,517 38% 52% -14%
Follow-up A&E attendance - planned 184 1,819 55 567 -70% -69% -1% Follow-up A&E attendance - unplanned 7 52 3 118 -57% 127% -184%
Total 4,161 35,137 5,538 51,202 33% 46% -13%
Disposal of A&E attendance
Admitted to hospital bed 1,056 8,970 1,480 14,786 40% 65% -25%
Died in department 8 41 7 85 -13% 107% -120% Discharged – did not require any follow-up treatment 159 1,459 217 3,147 36% 116% -79%
30 | P a g e
2006 2010 Change Difference in
Difference Particulars STiW Non-STiW STiW
Non-STiW STiW
Non-STiW
a b c d e:(c-a)/a f:(d-b)/b g:(e-f) Discharged – follow-up treatment to be provided by GP 2,198 18,058 2,912 24,928 32% 38% -6% Left department before being treated 145 698 258 1,604 78% 130% -52%
Refused treatment 3 14 5 31 67% 121% -55%
Other 8 54 7 103 -13% 91% -103%
Referred to A&E clinic 42 336 18 259 -57% -23% -34%
Referred to fracture clinic 202 2,225 265 2,698 31% 21% 10% Referred to other healthcare professional 30 197 6 209 -80% 6% -86%
Referred to other outpatient clinic 265 2,602 338 3,048 28% 17% 10% Transferred to other healthcare provider 24 315 25 303 4% -4% 8%
not available 21 168 0 1
Total 4,161 35,137 5,538 51,202
Table 10: Uptake of social services
2006 2010 Change Difference in
Difference (e-f) Categories
STiW (a)
RoW (b)
STiW (c)
RoW (d)
STiW (e) (c-a/a)
RoW (f) (d-b/b)
Initial contacts:
Physical Disability 137 621 127 708 -9% 15% -24%
Mental health 134 660 288 1,011 120% 56% 64%
Learning disability 26 219 42 275 50% 27% 23%
Users:
Physical Disability 22 210 28 219 27% 4% 23%
Mental health 15 102 32 172 113% 69% 44%
Learning disability 35 215 32 226 -9% 5% -14%
Table 11: Monetised cost of health outcomes in STiW neighbourhood
Hospital episodes Incidence
in 2006 Unit Cost
(£) Total cost
(£) DID* Savings (£)**
a b c: (a*b) d e:(c*d)
Did Not Attend (DNA) 1,705 100 170,500 -20% -34,099
Emergency admissions at local hospital 1,874 1882.8 3,528,367 -21% -752,169
A& E episodes:
Admitted to hospital bed 1,056 131 138,336 -25% -34,151
Died in department 8 97 776 -120% -930
Discharged–did not require any follow-up treatment 159 37 5,883 -79% -4,660
31 | P a g e
Hospital episodes Incidence
in 2006 Unit Cost
(£) Total cost
(£) DID* Savings (£)**
a b c: (a*b) d e:(c*d)
Discharged–follow-up treatment to be provided by GP 2,198 54 118,692 -6% -6,599
Referred to A&E clinic 42 97 4,074 -34% -1,394
Referred to fracture clinic 202 97 19,594 10% 1,946
Referred to other healthcare professional 30 97 2,910 -86% -2,505
Referred to other outpatient clinic 265 54 14,310 10% 1,489
Total -832,887 *DID: Difference in differences. Refer column ‘g’ in Table 9. ** Cost of health outcomes in STiW neighbourhood in 2006 multiplied by DID.
Figure 4: Referral to various population health services
Table 12: Scores for Health and disability domain of IMD
LSOA Code Ward Name Scores 2007 Scores 2010 Change
a b c:(b-a)/a
STiW neighbourhood
E01012453 Bewsey and Whitecross 1.80 1.62 -0.10
E01012455 Bewsey and Whitecross 1.83 1.94 0.06
E01012520 Orford 1.58 1.71 0.08
32 | P a g e
LSOA Code Ward Name Scores 2007 Scores 2010 Change
a b c:(b-a)/a
E01012526 Orford 1.35 1.34 -0.01
E01012533 Poplars and Hulme 1.46 1.43 -0.02
E01012534 Poplars and Hulme 1.10 1.28 0.16
E01012536 Poplars and Hulme 1.14 0.93 -0.18
E01012545 Poulton North 1.72 1.59 -0.08
E01012546 Poulton North 1.70 1.49 -0.12
SD neighbourhood
E01012456 Bewsey and Whitecross 1.82 1.88 0.03
E01012466 Birchwood 1.26 1.43 0.13
E01012479 Fairfield and Howley 1.23 1.16 -0.06
E01012480 Fairfield and Howley 1.92 1.53 -0.20
E01012483 Fairfield and Howley 1.69 1.93 0.14
E01012506 Latchford East 1.35 1.20 -0.11
E01012508 Latchford East 1.68 1.53 -0.09
E01012535 Poplars and Hulme 1.23 0.98 -0.20
E01012537 Poplars and Hulme 1.26 0.93 -0.26
11. DISCUSSION ON KEY FINDINGS
The section discusses certain key findings of the evaluation by placing it in context with
findings from review of relevant literature.
11.1 Crime and anti-social behaviour
The satisfaction of the elderly with the levels of crime, ASB and council’s efforts and
effectiveness in addressing them
This finding is in line with findings from other studies and literature based in England and
elsewhere. The elderly seem to regard crime and ASB as a lesser determinant of quality of life
as against health, social support, material and financial resources. Though traditionally focus
was always on impact of crime on elderly, research suggests that impact can be just as high
among younger age groups and interestingly elderly, especially, in rural parts, have lower
perceived levels of ASB. This also agrees with Pain’s study which concluded that perception
about fear of crime is not simply a product of elderliness but a function of relationship they
have with local communities and culture.
33 | P a g e
Higher the education attainment lesser is the satisfaction with level of crime, ASB and
council’s efforts to tackle them
High resource sections of the society such as those with higher education attainment generally
have higher expectations and similar finding is reported in analysis of People’s Panel 1998.
From year 2006 to 2010, incidents of crime have improved in STiW neighbourhood relative
to RoW neighbourhood, increased proportion of respondents in STiW neighbourhood felt
situation related to crime and ASB has improved relative to SD neighbourhood and scores
for crime domain of IMD has improved in STiW neighbourhood relative to SD
neighbourhood
Studies show perceptions of fear about crime and ASB correlate with levels of incidents of
these. In line with this, overall perception in STiW neighbourhood that levels of crime are
improving correlates with decrease in incidents of these in that neighbourhood and
improvement in ranking in crime domain of IMD. Research shows incidents of crime and ASB
correlates positively with deprivation. Against this, improvement of situation in STiW
neighbourhood stands out.
The above discussion draws from studies by Howe 2001, Michalso 2000, Duffy 2000, SNAT
2007 and Pain 1995.
11.2 Involvement and empowerment of residents
Higher proportion of respondents in STiW neighbourhood felt informed about ways to get
involved in local decision-making and wanted to get involved in it relative to SD
neighbourhood. However, this proportion of residents who wanted to get involved in local
council decisions has decreased in 2010 relative to 2006.
From year 2006 to 2010 there was an increase in proportion of residents who felt they
have the ability to influence council decisions.
Effective community engagement is about enabling local people to develop their own
solutions to local problems which benefits and empowers the community as a whole.
Consumerist strategies focus on democratic consumption of council services by improving
access and responsiveness to needs of users. Participatory strategies focus on empowering
residents by providing opportunities to get involved in local decision-making. Consumerist
34 | P a g e
strategies, which are easy to implement are preferred by most council as against participatory
strategies which can be complex, costly, time consuming, hard to achieve and might find it
difficult to draw people from deprived areas. The STiW programme seems to have balanced
approach in adopting both these strategies and the above results underline the key
achievements under both these strategies, especially under difficult to achieve, participative
strategies. However, during the years 2006-2010 there was a decrease in proportion of
residents in STiW neighbourhood wanting to get involved in local decision making relative to
SD neighbourhoods. The above discussion is based on studies by Meadowcroft 2001, Young
2000 and Andrews 2006.
11.3 Effectiveness and responsiveness of council services and perception
of satisfaction with them
According to audit commission assessment of council services should be guided by the
principle of ‘not on the circumstances they find themselves in, but on the way they respond to
those circumstances’. Expectation disconfirmation hypothesis suggests that performance of
council services minus the expectation is positively correlated to perception of satisfaction and
this relationship is asymmetrical as probability of dissatisfaction falls more rapidly as
performance increasingly meets expectation especially in deprived areas. Hence the
expectations need to be taken into account while assessing perception of satisfaction with
services and in deprived areas generally the expectation are high. However, expectation is
also a function of extent to which user can exercise influence and choice regarding those
services. Lesser the perceived influence, lesser is the expectation. It is against this we have to
view the results of the evaluation.
Satisfaction of elderly in involvement in council decisions, ability to influence council
decisions and with council services
This echoes with finding in other studies also. Attitudinal research points to lower
expectations and hence lower propensity to complain among elderly. Burroughs et al. argued
that in a deprived area, this attitude might be due to ‘why add to the existing stress by
complaining about services that are perceived unalterable’. However, results of this evaluation
shows this may not be the reason as significant number of elderly felt they are informed about
council services, would like to get involved them and are able to influence these services.
35 | P a g e
Higher proportion of those who are economically productive felt council neither promotes
their interests nor acts on their concerns as compared with those who are not economically
productive
Expectation of higher resource group is generally higher and they tend to be more critical of
council and its services.
From year 2006 to 2010 higher proportions of residents in STiW neighbourhood felt
satisfaction with council services, that council was acting on their concerns and with the
experience of contacting council relative to SD neighbourhood.
Studies suggest that public services might be perceived as less effective in meeting the needs
of deprived areas, due to a number of factors including complex needs, intense demands,
lower starting levels and operational difficulties. An analysis of English local authorities found
that deprivation had a significant adverse effect on the performance of council services as it
directly affects both the ability to provide and to improve services. Against this achievement
in STiW neighbourhood significantly stands out.
Above discussions are based on studies by Audit Commission 2002a, Mori 1998, SEU 1997,
SEU 1998, Duffy 2000, Burrows 1998, Carr-Hill 1995, Rhys 2004, UNISON 2002, Haubrich 2006
and James 2009.
11.4 Population health
From year 2006 to 2010 increased proportion of cancellation of appointments by patients
or by the provider and decreased proportion of DNAs in STiW neighbourhood relative to
RoW neighbourhood.
The cancellations impact the cost, efficiency and productivity of the health services. Two most
common causes for cancellation are patients forgetting and errors by the provider. Other
causes are need related characteristics such as deprivation, age and gender (NHS 2011).
Increased cancellation is not very encouraging and decreased DNA is a positive trend.
From year 2006 to 2010 decreased proportion of emergency admissions and A&E episodes
in STiW neighbourhood relative to SD neighbourhood.
36 | P a g e
This aligns with finding of reduced incidents of crime and ASB (ref table 7). Research shows
that decrease in A&E related attendance and admissions can be good proxy indicator for
decreased level of crime and ASB (Sivarajasingam 2002), improved population health and
improved effectiveness of health related services (Kawachi 1999, Howe 2001). However,
research studies also indicate that access to A&E services can be adversely affected by
deprivation levels (Shah 2008).
From year 2006 to 2010 increased proportion of access to and usage of mental health
related social services in STiW neighbourhood relative to RoW neighbourhood.
Though research suggests that people from deprived areas have a higher access rate for social
services (ibid), causes for inequity in access are complex and multifaceted (Goddard 2001).
12. LIMITATIONS OF THE EVALUATION
Evaluation has certain limitations in terms of,
The cost estimates of the programme were budgetary estimates rather than actual
expenditure incurred for the programme.
Analysis of service uptake indicators were limited to aggregate level comparisons
Changes in some of the indicators could not be compared against a control group
The analysis could not explore the benefits of STiW programme on each of the LSOAs
in the STiW neighbourhood due to statistically insufficient sample size.
Variations in outcomes are also likely to be the effect of non-service factors. Hence
attributability of both intermediate and final outcomes in STiW neighbourhood to the
STiW programme cannot be determined with certainty.
13. CONCLUSIONS
Hilary Armstrong famously said ‘the government’s best weapons against deprivation; the
crime, educational and health services, are often less effective in the deprived areas’ (ibid).
According to Social Exclusion Unit ‘Deprived areas needs stronger community spirit, good
public and private services and the very concentration of these complex needs can cause the
support structures to cope less well’ (ibid). Number of factors impact both quality and
quantity of public services in deprived areas including complex needs, intense demands, lower

37 | P a g e
starting levels and operational difficulties. Recognizing this audit commission felt assessment
of council services should be guided by the principle of not on the circumstances they find
themselves in, but on the way they respond to those circumstances. The costs and benefits of
STiW programme needs to be viewed against this.
From the analysis of outcomes for crime and safety from year 2006 to 2010, in terms of
decrease in incidents of crime, increased perception of improved crime and safety and
improved rankings of IMD-Crime, it can be concluded that there are better outcomes in the
STiW area relative to the Non-STiW area. Reduction in crime in STiW neighbourhood has a
monetised value of £463,000 at year 2010 when compared with year 2006, 5.3% greater
reduction than in the RoW neighbourhood.
From the analysis of outcomes for neighbourhood engagement from year 2006 to 2010, in
terms of resident’s perception that that councils acts on their concern, resident’s satisfaction
with experience of contacting council, resident’s satisfaction with overall performance by the
council and resident’s willingness to get involved in local decision making, it can be concluded
that there is a greater sense of empowerment among residents and increased responsiveness
of the council and its services in STiW neighbourhood relative to the SD neighbourhood.
Analysis of outcomes for population health from year 2006 to 2010, in terms of decreased A&E
episodes, improved access to social services and satisfaction of residents with local hospital,
may indicate better management of local health services and increased awareness and
responsibility of residents about their own health in STiW areas relative to the RoW
neighbourhood. Reduction in DNA’s, A&E episodes and emergency admissions in STiW
neighbourhood has a monetised value of £830,000 at year 2010 when compared with year
2006.
Theoretical and empirical research has shown that factors which influence crime also influence
population health and community behaviour, indicating they share same social origins, most
significant of them being deprivation and cohesiveness in social relations (social capital).
Crime is not only an indicator of collective well-being, but also the very mirror of quality of
community life (ibid). The robust finding of this evaluation of improved crime situation and
increased involvement and empowerment of residents and their overall satisfaction with
council and its services underscores this.
38 | P a g e
14. REFERENCES: LIST OF ARTICLES REVIEWED
ANDREWS, R. & TURNER, D. 2006. Modeling impact of community engagement on local democracy. Local Economy, 21, 378-390.
BEDI, R., GULATI, N. & MCGRATH, C. 2005. A study of satisfaction with dental services among adults in the United Kingdom. Br Dent J, 198, 433-437.
BERTRAND, M., DUFLO, E. & MULLAINATHAN, S. 2004. How Much Should We Trust Differences-in-Differences Estimates?*. Quarterly Journal of Economics, 119, 249-275.
BLUME, T. 2009. The Handy Guide to LAAs: Local area agreements. London: Urban Forum supported by Department of Communities and Local Government.
BURROWS, R. & RHODES, D. (eds.) 1998. Unpopular Places? Area disadvantage and geography of misery, London: Chapman and hall.
CARD, D. & KRUEGER, A. B. 2000. Minimum Wages and Employment: A Case Study of the Fast-Food Industry in New Jersey and Pennsylvania: Reply. The American Economic Review, 90, 1397-1420.
CARR-HILL (ed.) 1995. Measurement of User Satisfaction, London: Chapman & Hall. CLG 2008. Communities in Control: Real People, Real Power. London: Communities and Local
Government. COMMISSION, A. 2002. A picture of performance: Early lessons from comprehensive
performance assessment. London: Audit Commission. COMMISSION, A. 2011. National Indicator SET (NIS) [Online]. Available: http://www.audit-
commission.gov.uk/localgov/audit/nis/pages/niguidancesearch.aspx [Accessed 21 July 2010].
CURTIS, L. 2010. Unit costs of health and social care. Kent: University of kent. DCLG 2003e. Emerging findings from gap analysis. London: Department of Communities and
Local Government. DCLG 2007a. Planning Together: Local strategic partnerships (LSPs) and spatial planning: A
practical guide. London: Department of Communities and Local Government. DCLG 2008b. Sustainable Communities Act 2007: A guide. London: Department of
Communities and Local Government. DCLG. 2008c. The English Indices of Deprivation 2007 [Online]. Communities and Local
Government. Available: http://www.communities.gov.uk/publications/communities/indiciesdeprivation07 [Accessed July 22 2011].
DCLG. 2011d. The English Indices of Deprivation [Online]. The Department of Communities and Local Government. Available: http://www.communities.gov.uk/publications/corporate/statistics/indices2010 [Accessed 22 July 2011].
DOBOURG, R. 2005. Estimates of economic and social cost of crime in England and Wales: Costs of crime against individuals and households. London: Home Office.
DRFOSTER 2009. Outpatient appointment no-shows cost. FISHER, J. & SARKAR, R. 2006. The LSP Guide 2006. Urban Forum. GODDARD, M. & SMITH, P. 2001. Equity of access to health care services: : Theory and
evidence from the UK. Social Science & Medicine, 53, 1149-1162. HAUBRICH, D. & MCLEAN, I. S. 2006. Assessing Public Service Performance in Local Authorities
Through CPA - A Research Note on Deprivation. National Institute Economic Review, 197, 93-105.
HAUSMAN, J. A. 1978. Specification Tests in Econometrics. Econometrica, 46, 1251-1271.
39 | P a g e
HOWE, A. & CRILLY, M. 2001. Deprivation and violence in the community: a perspective from a UK Accident and Emergency Department. Injury, 32, 349-351.
JAMES, O. 2009. Evaluating the Expectations Disconfirmation and Expectations Anchoring Approaches to Citizen Satisfaction with Local Public Services. Journal of Public Administration Research and Theory, 19, 107-123.
KAWACHI, I., KENNEDY, B. P. & WILKINSON, R. G. 1999. Crime: social disorganization and relative deprivation. Social Science & Medicine, 48, 719-731.
MEADOWCROFT, J. 2001. Community politics Representation and limits of deliberative democracy. Local Government Studies, 27, 25-42.
MEYER, B. D. 1995. Natural and Quasi-Experiments in Economics. Journal of Business & Economic Statistics, 13, 151-161.
MICAHALOS, A. C. & ZUMBO , B. D. 2000. Criminal victimization and quality of life. Social Indicators Research 50, 189-222.
MICHAEL, N. 2011. The English Indices of Deprivation 2010. MICHAEL, N. 2011. The English Indices of Deprivation 2010:. Communities and Local
Government, London. MICHAEL, N. & AL., E. 2008. The English Indices of Deprivation 2007. Communities and Local
Government, London. MORI 1998. The People's Panel. London: MORI, cabinet Office. NHS. 2010. Acute activity [Online]. Available:
http://www.isdscotlandarchive.scot.nhs.uk/isd/6415.html [Accessed]. NHS 2011a. 4% drop in new missed outpatient appointments with new reminder service. NHS. 2011b. Keep it or cancel it, don't waste it [Online]. Available:
http://www.northeast.nhs.uk/what-were-doing/campaigns/C7B52D1A575E4FA499F29882F8E9D0E9.aspx [Accessed].
NHS. 2011c. DNAs and reducing Did Not Attends [Online]. Available: http://www.institute.nhs.uk/quality_and_service_improvement_tools/quality_and_service_improvement_tools/dnas_-_reducing_did_not_attends.html [Accessed 27 July 2011].
NHS. 2011d. NHS Terminology [Online]. Available: http://www.essainfo.nhs.uk/content.asp?page_id=154 [Accessed].
ONS 2011a. Indices of Multiple Deprivation. London: Office of National Statistics. ONS. 2011b. Neighbourhood Statistics [Online]. London: The Office for National Statistics.
Available: http://www.neighbourhood.statistics.gov.uk/dissemination/datasetList.do;jsessionid=ac1f930c30d57805d8e5668247a7a00c869dab5934ae?$ph=60&updateRequired=true&step=1&CurrentTreeIndex=-1&Expand15=1&nsjs=true&nsck=true&nssvg=false&nswid=1276 [Accessed].
PAIN 1995. Fear of crime and local contexts: Elderly people in north east England. Northern Economic Review, 24, 96-111.
PANEL, P. S. 1998. People's Panel: Recruitment wave 1998. London: MORI/Cabinet Office. PROPPER, C., JONES, K., BOLSTER, A., BURGESS, S., JOHNSTON, R. & SARKER, R. 2005. Local
neighbourhood and mental health: Evidence from the UK. Social Science & Medicine, 61, 2065-2083.
RHYS, A. 2004. Analyzing deprivation and local authority performance: Implications for CPA, public money and management. Social Science Research Network, 24, 19-26.
SAUNDERS, K. Behaviour change, social marketing and black and minority ethnic groups. Ethnicity and Inequalities in Health and Social Care, 3, 27-31.
40 | P a g e
SEU 1997. National Strategy for Neighbourhood Renewal: A framework for consultation.: Social Exclusion Unit.
SEU 1998. Bringing Britain together. London: Social Exclusion Unit, HMSO. SHAH, S. M. & COOK, D. G. 2008. Socio-economic determinants of casualty and NHS Direct use.
Journal of Public Health, 30, 75-81. SIVARAJASINGAM, V., SHEPHERD, J., MATTHEWS, K. & JONES, S. 2002. Trends in violence in
England and Wales 1995–2000: an accident and emergency perspective. Journal of Public Health, 24, 219-226.
SNAT 2007. Fear of crime and perception of anti-social behaviour 2006/07. In: TEAM, S. N. A. (ed.). Warwick: Warwickshire county council.
STONE, C., JH, P. & PJ, S. 1999. Reducing non-attendance at outpatient clinics. Journal of the Royal Society of Medicine, 92, 114-118.
UNISON 2002. UNISON's response to government's consultation paper, Tackling poor performance in local government. London: UNISON.
WBC. 2011. Warrington Borough Council. Available: http://www.warrington.gov.uk/stronger/ [Accessed 22 July 2011].
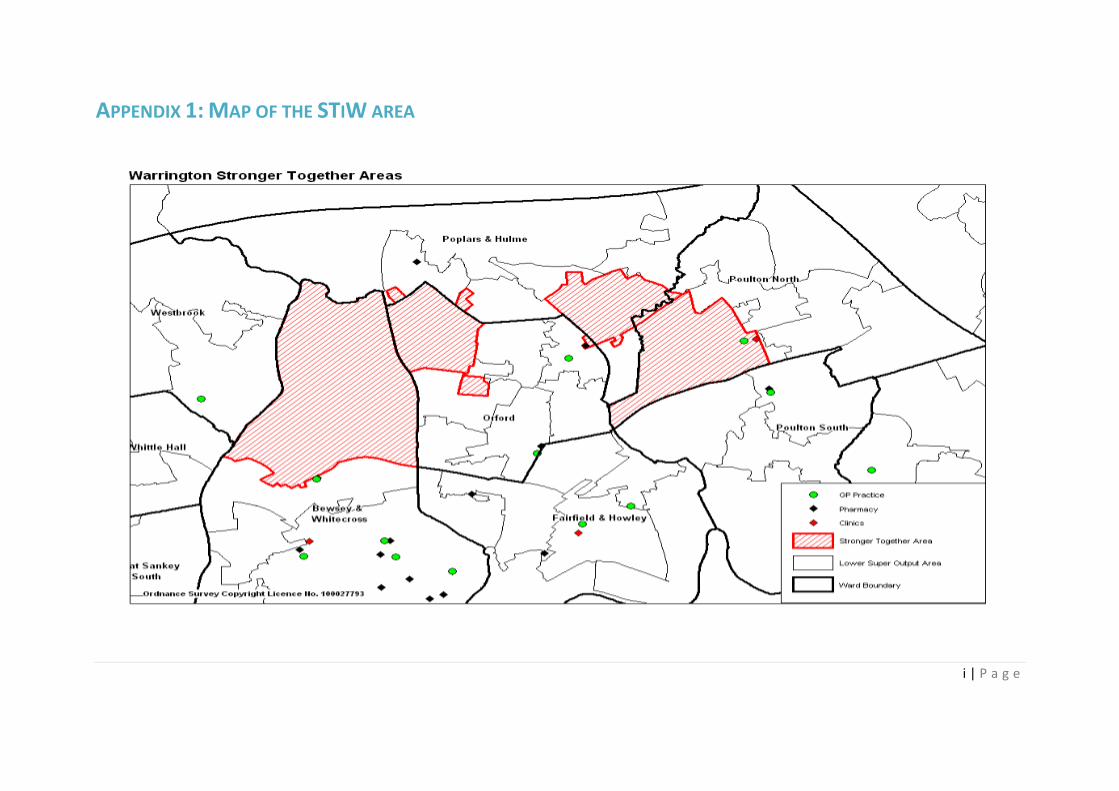
i | P a g e
APPENDIX 1: MAP OF THE STIW AREA
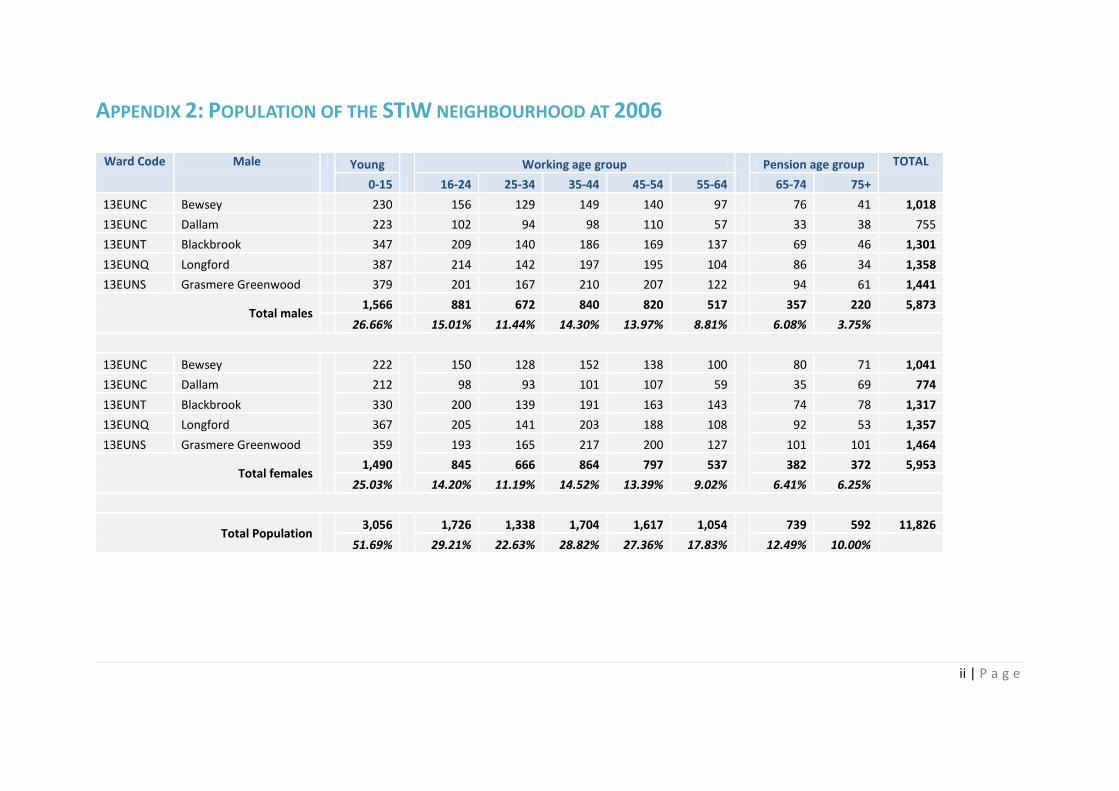
ii | P a g e
APPENDIX 2: POPULATION OF THE STIW NEIGHBOURHOOD AT 2006
Ward Code Male Young
Working age group
Pension age group TOTAL
0-15 16-24 25-34 35-44 45-54 55-64 65-74 75+
13EUNC Bewsey 230 156 129 149 140 97 76 41 1,018
13EUNC Dallam 223 102 94 98 110 57 33 38 755
13EUNT Blackbrook 347 209 140 186 169 137 69 46 1,301
13EUNQ Longford 387 214 142 197 195 104 86 34 1,358
13EUNS Grasmere Greenwood 379 201 167 210 207 122 94 61 1,441
Total males 1,566 881 672 840 820 517 357 220 5,873
26.66% 15.01% 11.44% 14.30% 13.97% 8.81% 6.08% 3.75%
13EUNC Bewsey
222
150 128 152 138 100
80 71 1,041
13EUNC Dallam 212 98 93 101 107 59 35 69 774
13EUNT Blackbrook 330 200 139 191 163 143 74 78 1,317
13EUNQ Longford 367 205 141 203 188 108 92 53 1,357
13EUNS Grasmere Greenwood 359 193 165 217 200 127 101 101 1,464
Total females 1,490 845 666 864 797 537 382 372 5,953
25.03% 14.20% 11.19% 14.52% 13.39% 9.02% 6.41% 6.25%
Total Population 3,056
1,726 1,338 1,704 1,617 1,054
739 592 11,826
51.69% 29.21% 22.63% 28.82% 27.36% 17.83% 12.49% 10.00%
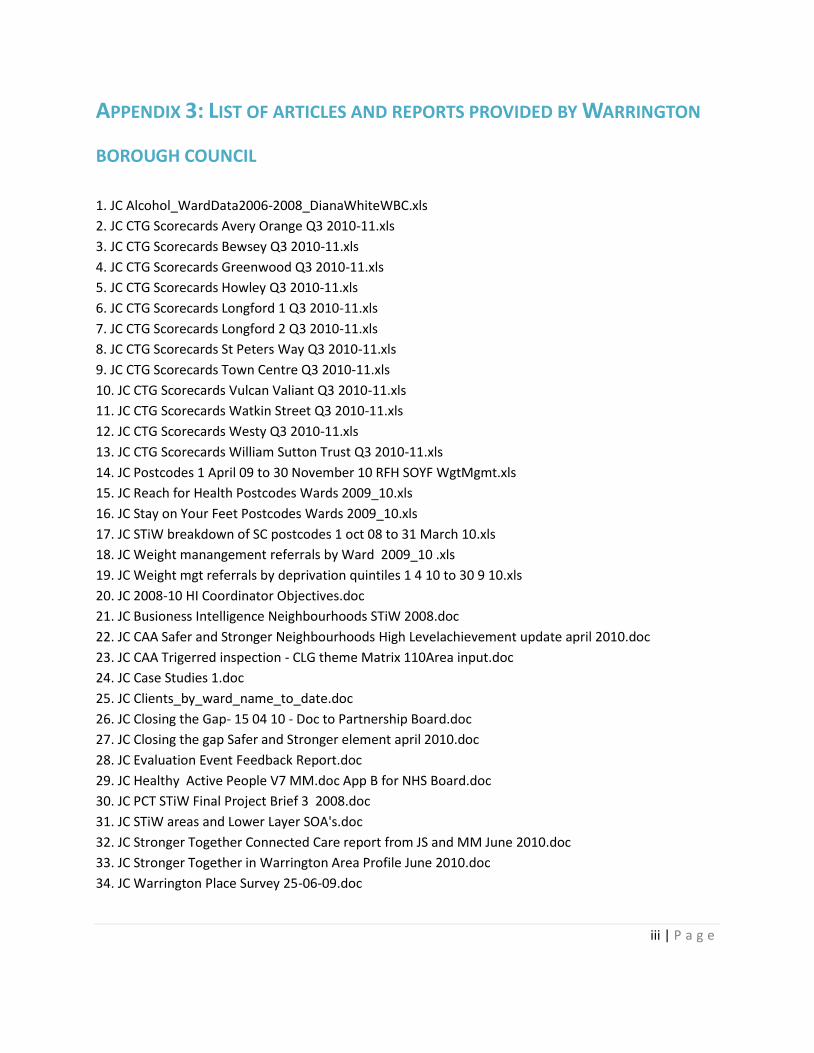
iii | P a g e
APPENDIX 3: LIST OF ARTICLES AND REPORTS PROVIDED BY WARRINGTON
BOROUGH COUNCIL
1. JC Alcohol_WardData2006-2008_DianaWhiteWBC.xls
2. JC CTG Scorecards Avery Orange Q3 2010-11.xls
3. JC CTG Scorecards Bewsey Q3 2010-11.xls
4. JC CTG Scorecards Greenwood Q3 2010-11.xls
5. JC CTG Scorecards Howley Q3 2010-11.xls
6. JC CTG Scorecards Longford 1 Q3 2010-11.xls
7. JC CTG Scorecards Longford 2 Q3 2010-11.xls
8. JC CTG Scorecards St Peters Way Q3 2010-11.xls
9. JC CTG Scorecards Town Centre Q3 2010-11.xls
10. JC CTG Scorecards Vulcan Valiant Q3 2010-11.xls
11. JC CTG Scorecards Watkin Street Q3 2010-11.xls
12. JC CTG Scorecards Westy Q3 2010-11.xls
13. JC CTG Scorecards William Sutton Trust Q3 2010-11.xls
14. JC Postcodes 1 April 09 to 30 November 10 RFH SOYF WgtMgmt.xls
15. JC Reach for Health Postcodes Wards 2009_10.xls
16. JC Stay on Your Feet Postcodes Wards 2009_10.xls
17. JC STiW breakdown of SC postcodes 1 oct 08 to 31 March 10.xls
18. JC Weight manangement referrals by Ward 2009_10 .xls
19. JC Weight mgt referrals by deprivation quintiles 1 4 10 to 30 9 10.xls
20. JC 2008-10 HI Coordinator Objectives.doc
21. JC Busioness Intelligence Neighbourhoods STiW 2008.doc
22. JC CAA Safer and Stronger Neighbourhoods High Levelachievement update april 2010.doc
23. JC CAA Trigerred inspection - CLG theme Matrix 110Area input.doc
24. JC Case Studies 1.doc
25. JC Clients_by_ward_name_to_date.doc
26. JC Closing the Gap- 15 04 10 - Doc to Partnership Board.doc
27. JC Closing the gap Safer and Stronger element april 2010.doc
28. JC Evaluation Event Feedback Report.doc
29. JC Healthy Active People V7 MM.doc App B for NHS Board.doc
30. JC PCT STiW Final Project Brief 3 2008.doc
31. JC STiW areas and Lower Layer SOA's.doc
32. JC Stronger Together Connected Care report from JS and MM June 2010.doc
33. JC Stronger Together in Warrington Area Profile June 2010.doc
34. JC Warrington Place Survey 25-06-09.doc
iv | P a g e
35. AP Overview of Household and Pop Stats.xls
36. AP pop, ben crime summary stat .pdf
37. AP Results of 2008 survey, MID of wards.pdf
38. AP Baseline audit & survey 2006.pdf
39. AP Neighbourhood Plan 2006-2009.pdf
40. AP list of files of cost benefit files sent.doc
41. AP Closing the gap Warrington LIS Proposal 25 11 10.doc
42. AP Household Survey format 2010.doc
43. AP Draft survey questionnaire.doc
44. AP File linking priorities to indicators no stats.doc
45. AP Change in indicators 2006-09.doc
46.AP PPt on some outcomes.ppt
47. NR Final Results - 31.03.07.xls
47a. NR STiW Partnership Panel Presentation1.ppt
48. NR Summary - Partnership Panel Household Survey.doc
49. CW Final Results - 31.03.08.xls
50. CW Household Survey - Feb 2008.doc
51. CW STiW Partnership Panel Household Survey 2008.doc
52. CW STiW Partnership Panel Survey 2008 Presentation.ppt
53. JB Number of Warrington Patients by postcode.xls
54. JS FINAL_-_Health_Inequalities_Project.doc
55. CW PT Evidence_collated_by_Peter_Trengove.xls
56. STiW_bestfit_SOAs.xls
57. SOA_hierarchy_in_Warrington.pdf
58 STiW periodic reports.zip
59 JM - health data.xlsx
60 JM - Health Data.xlsx
61 JM - health data.xlsx
62 analysis of 2010 survey.xls
63. FW WARRINGTON - SMOKING FIGS.htm
64.Health_economic_data_April2011.xlsx
65 H&D_data_v2(1).xlsx
66. JC LSE_Case_study_STiW_No_1.doc
67. Stronger_Together_Areas.bmp

v | P a g e
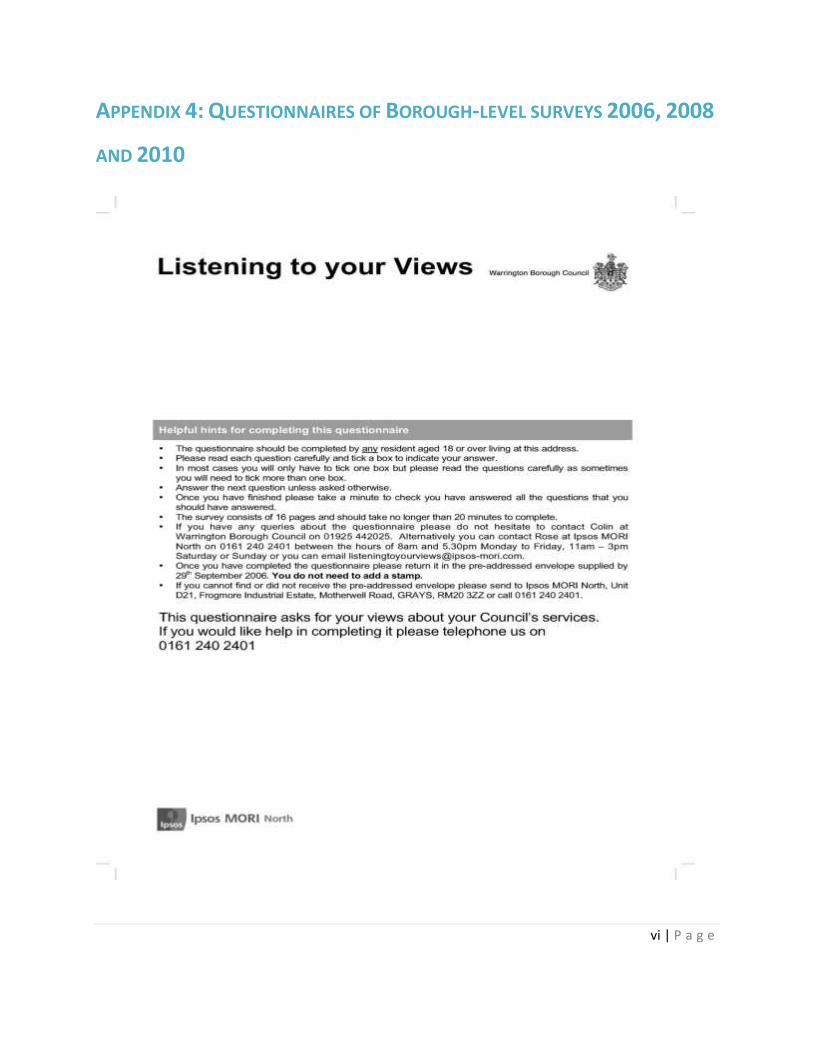
vi | P a g e
APPENDIX 4: QUESTIONNAIRES OF BOROUGH-LEVEL SURVEYS 2006, 2008
AND 2010
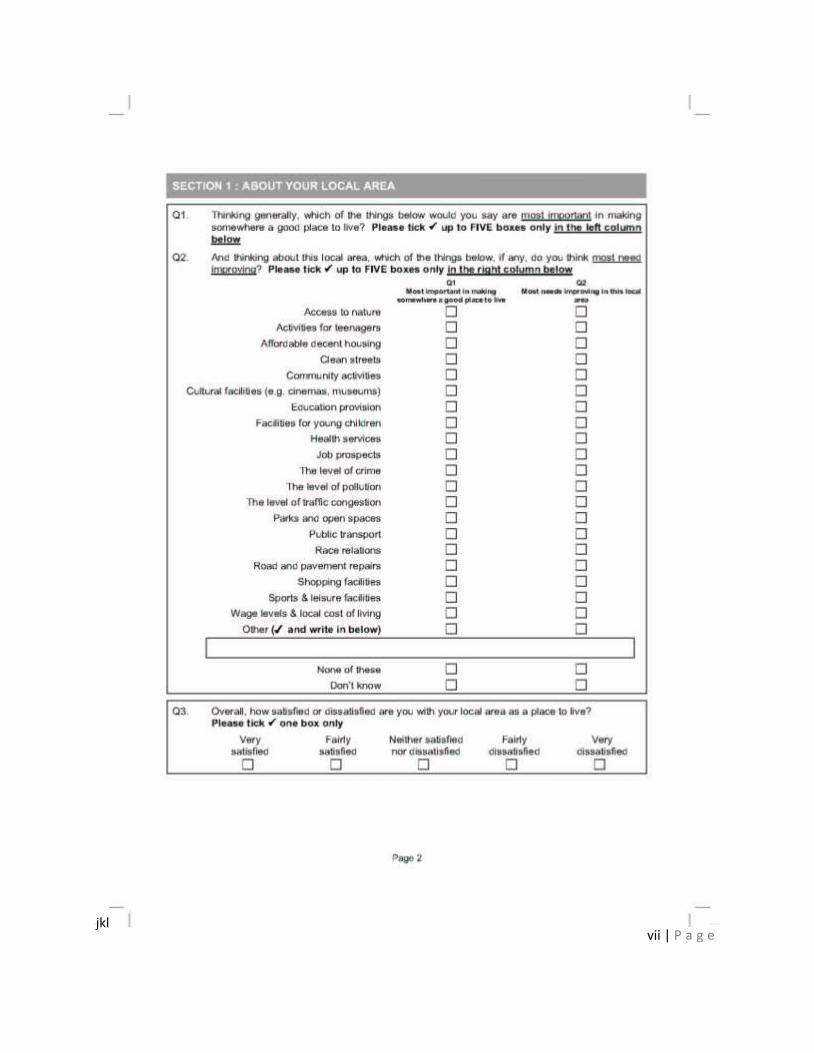
vii | P a g e
jkl
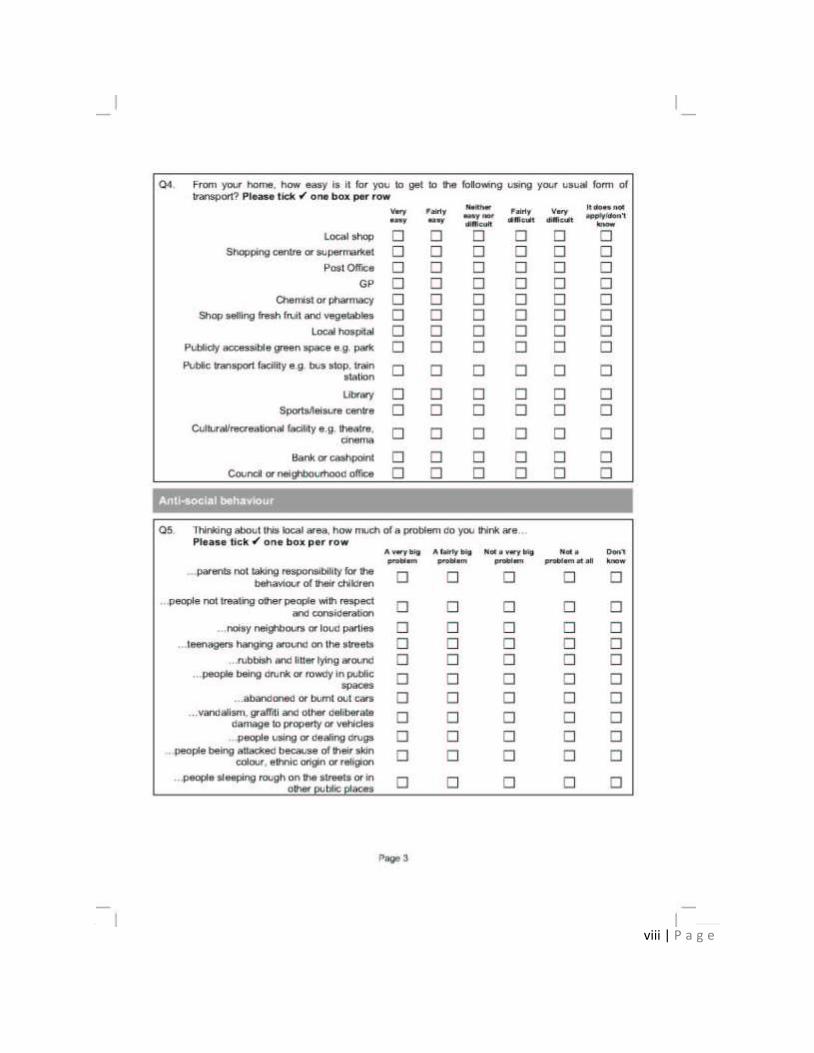
viii | P a g e
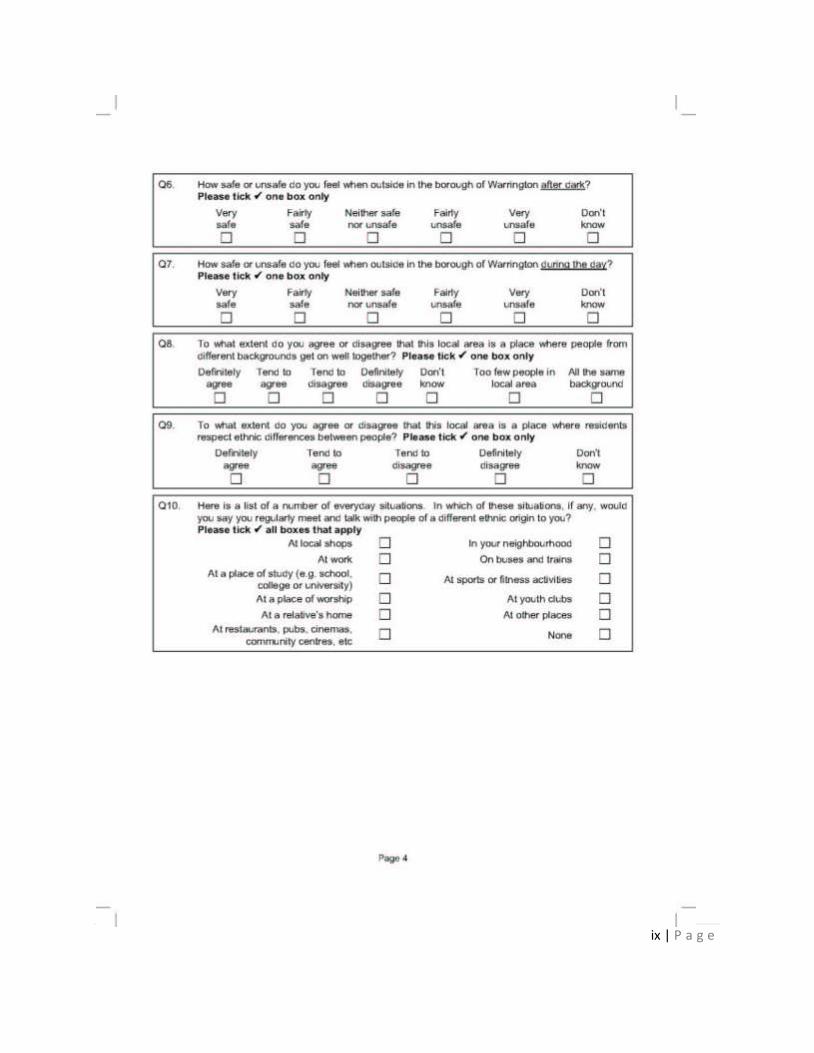
ix | P a g e
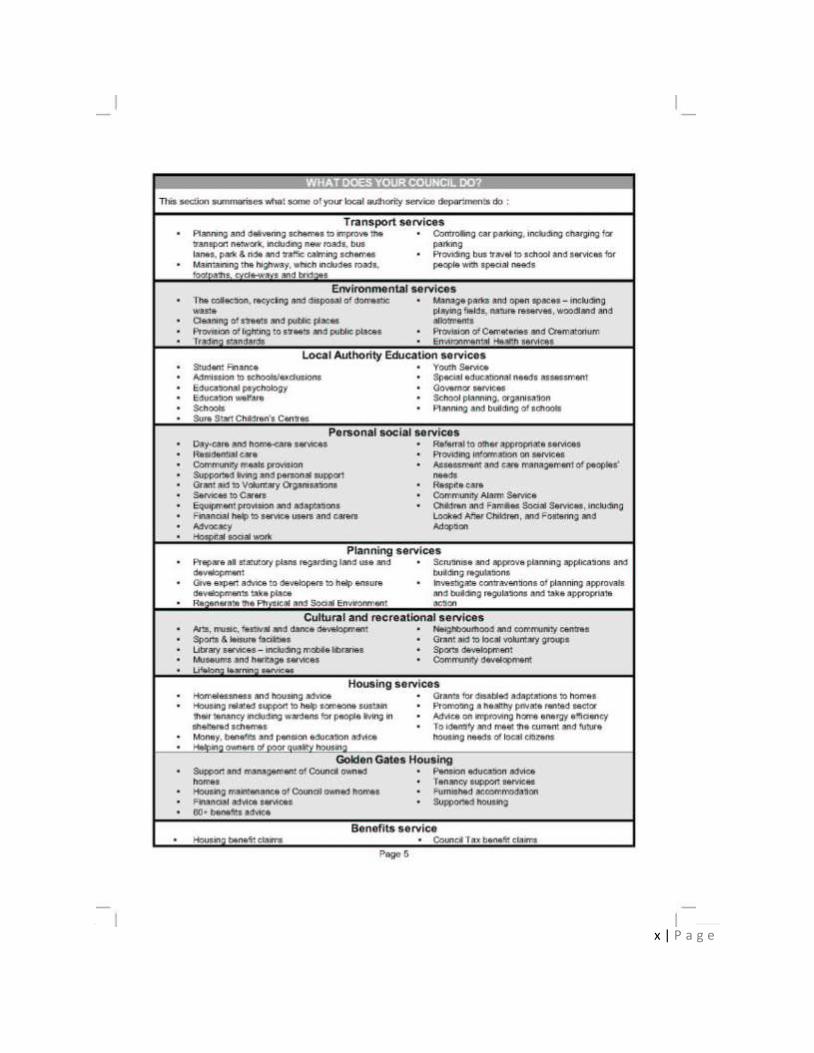
x | P a g e
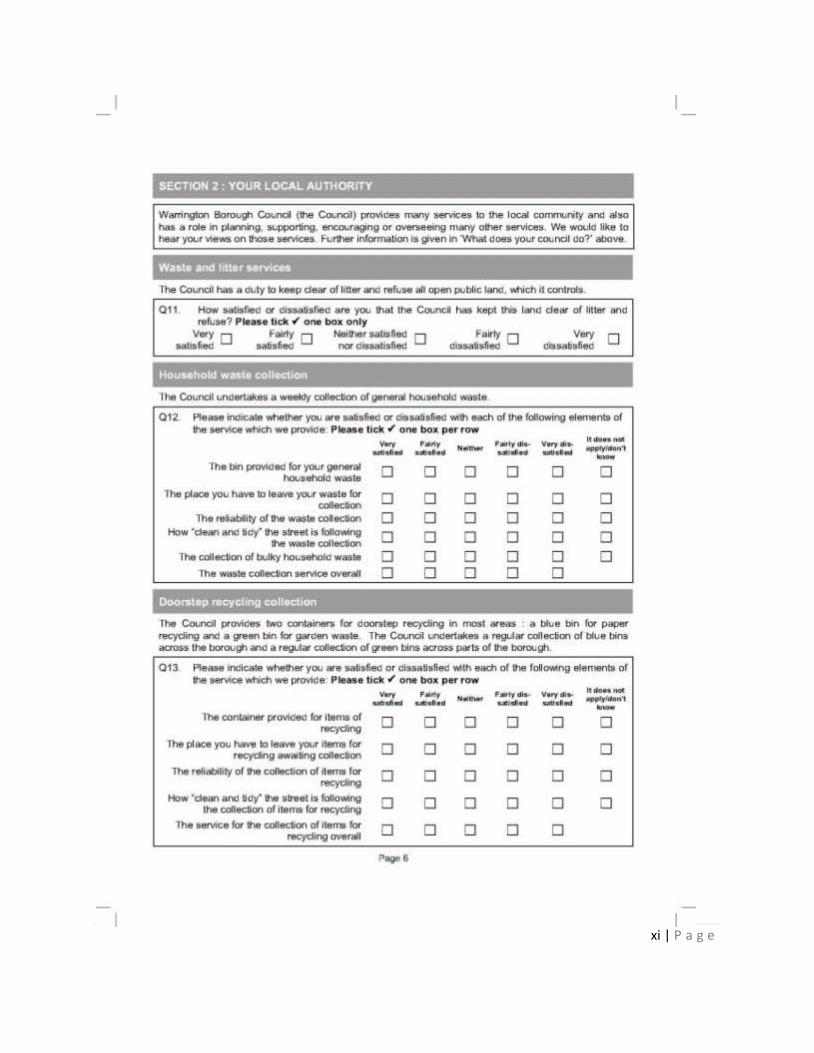
xi | P a g e
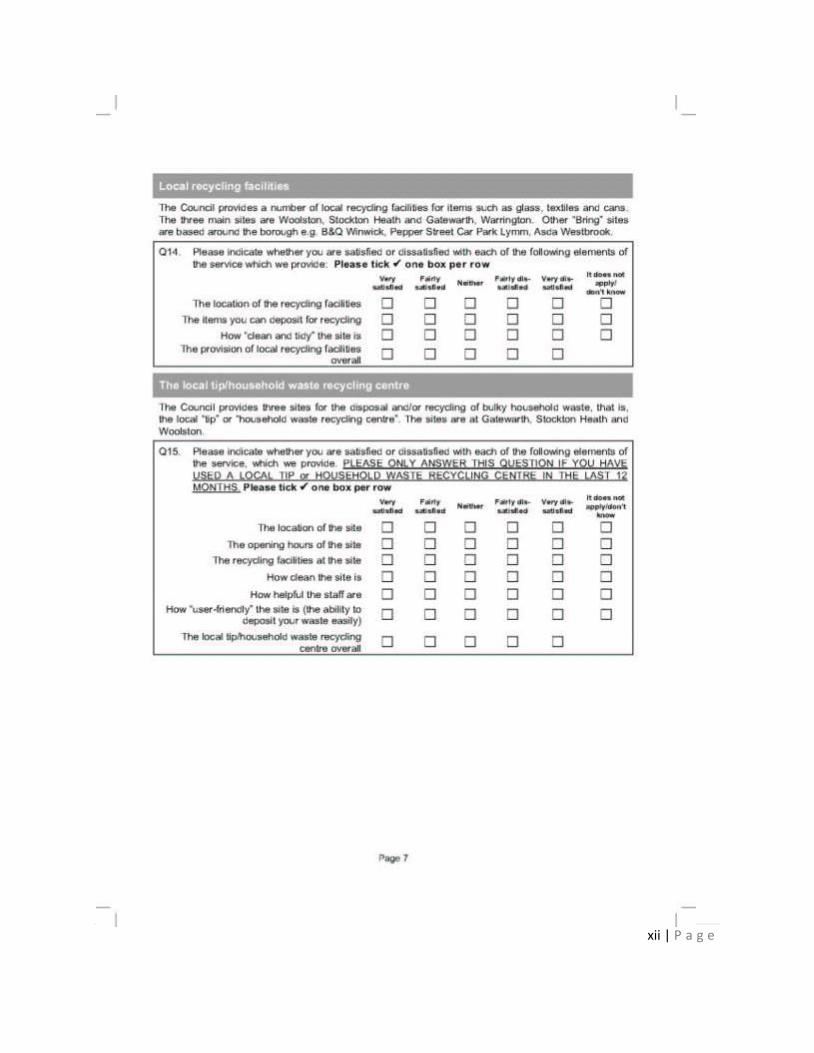
xii | P a g e
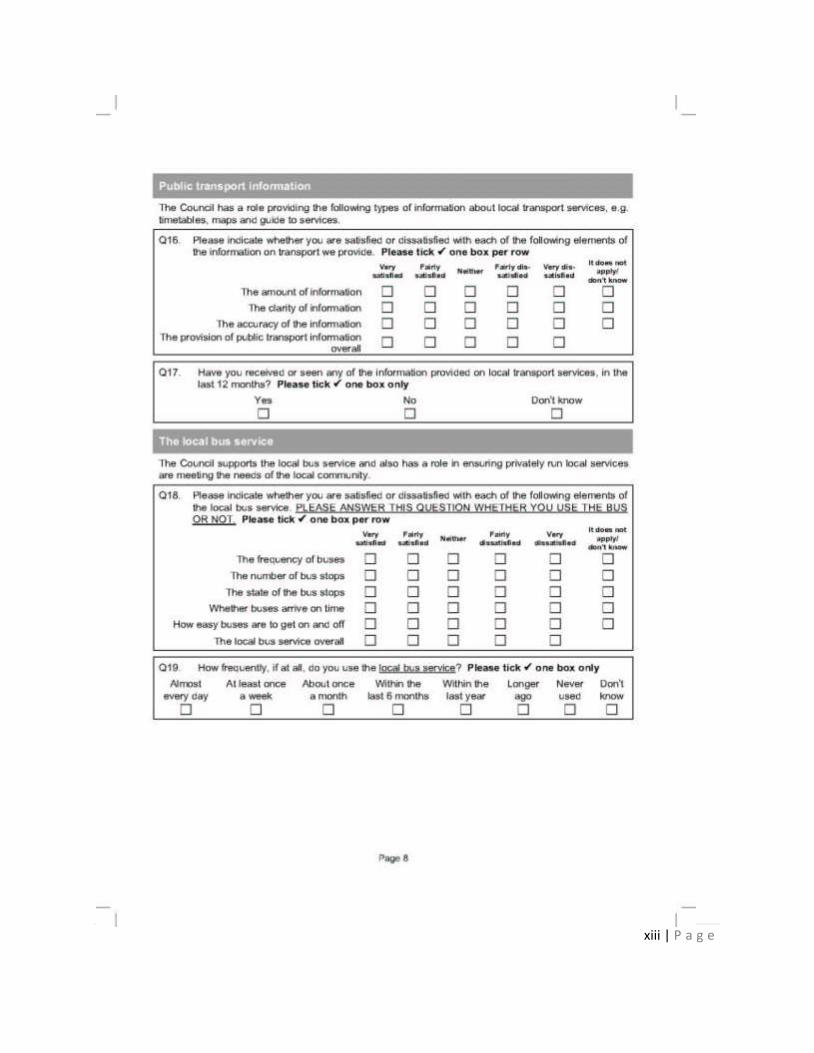
xiii | P a g e
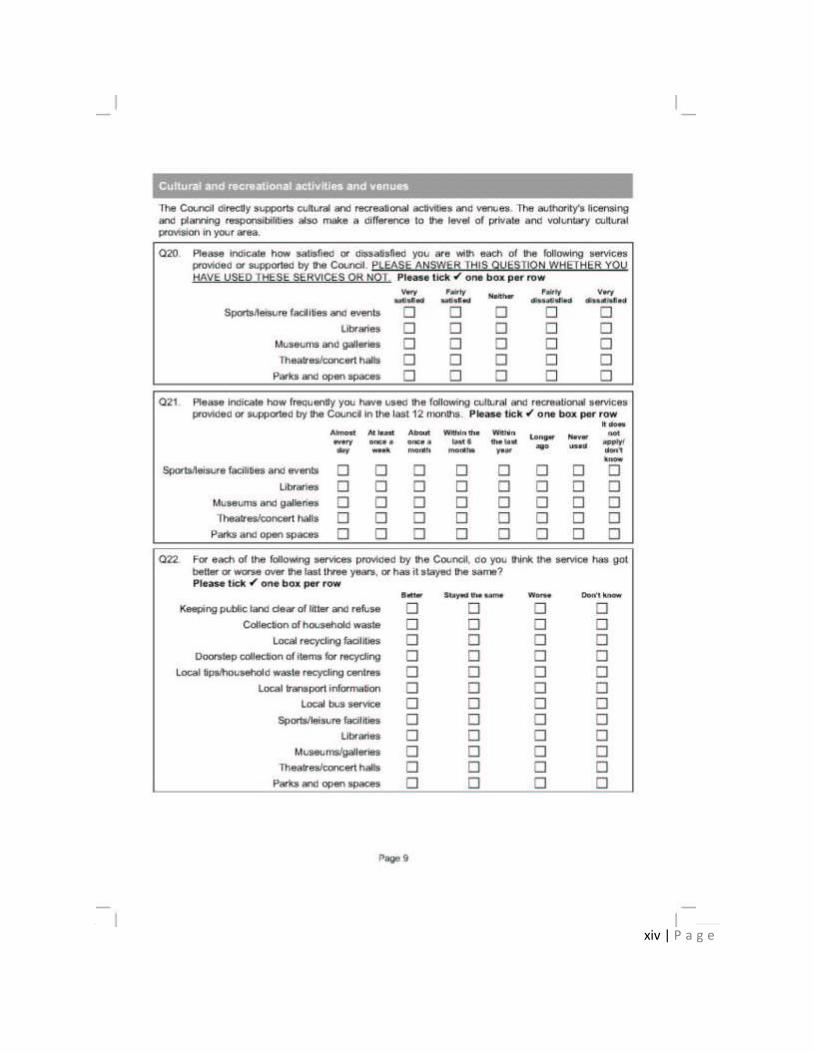
xiv | P a g e
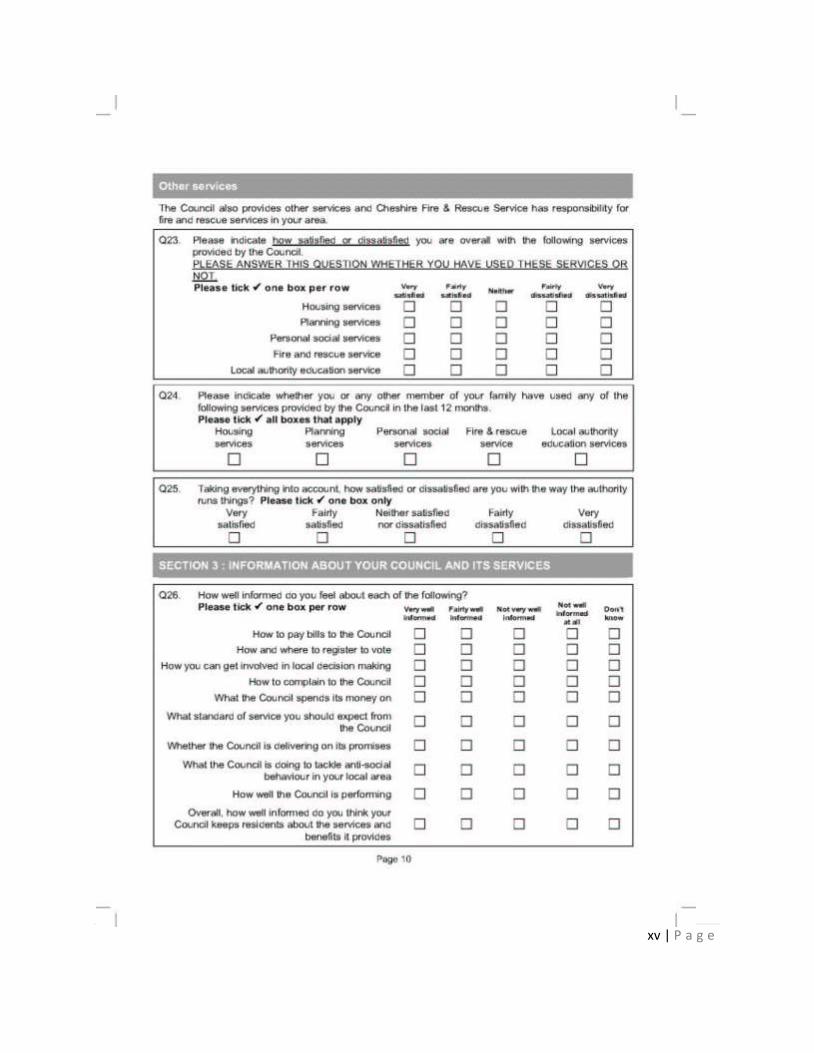
xv | P a g e
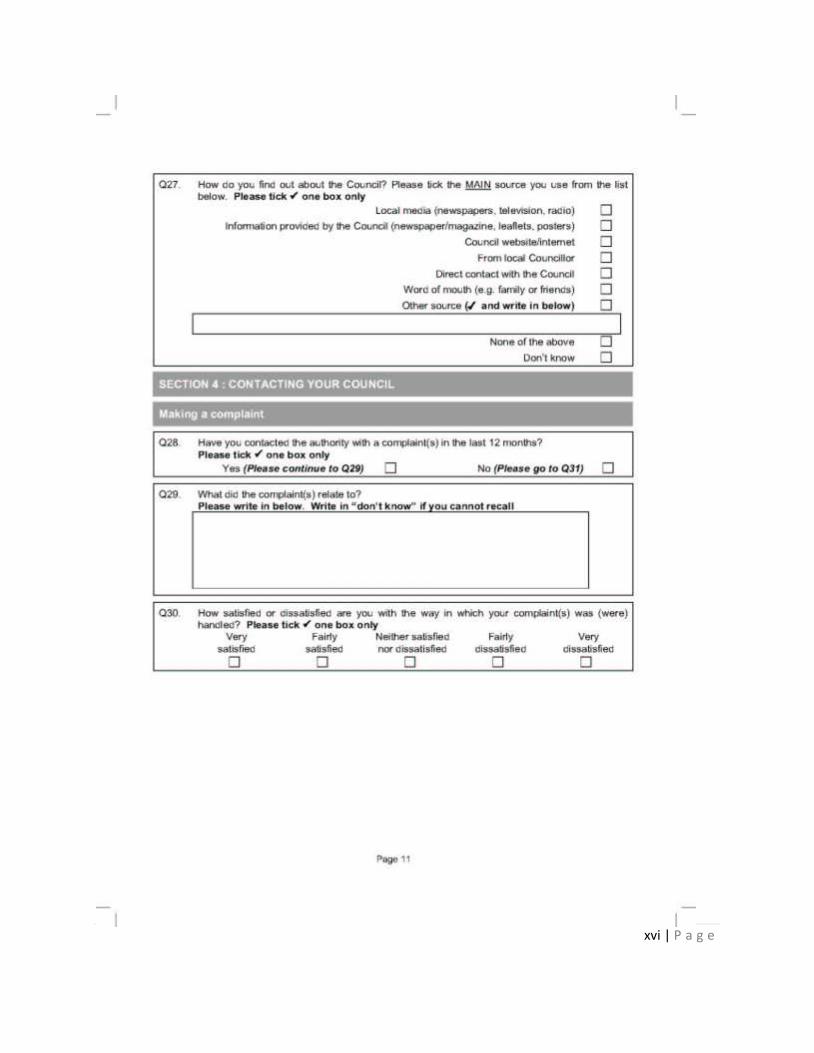
xvi | P a g e
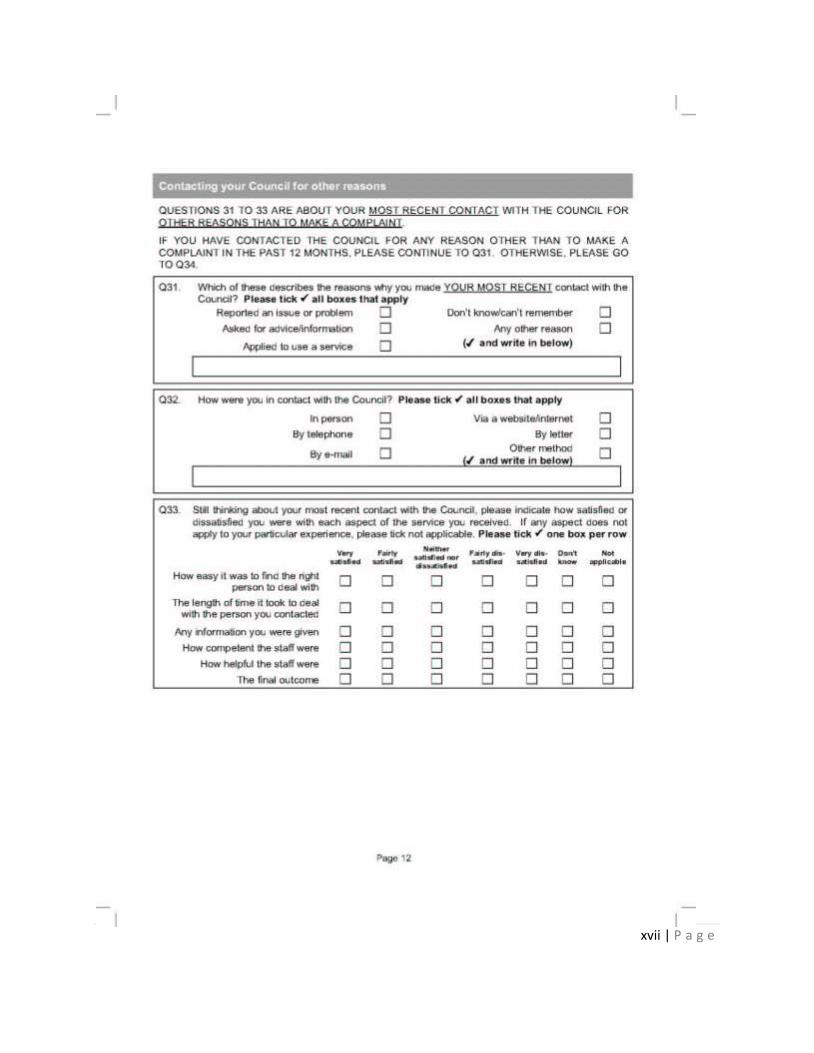
xvii | P a g e

xviii | P a g e
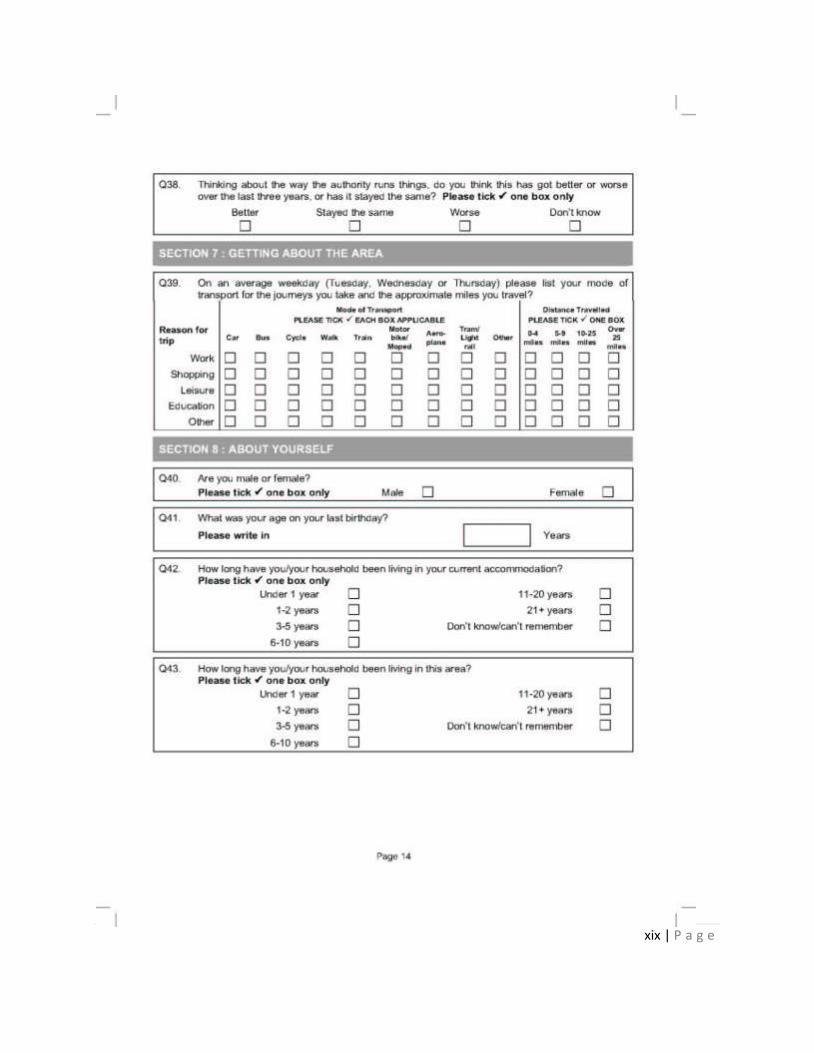
xix | P a g e

xx | P a g e
xxi | P a g e

xxii | P a g e
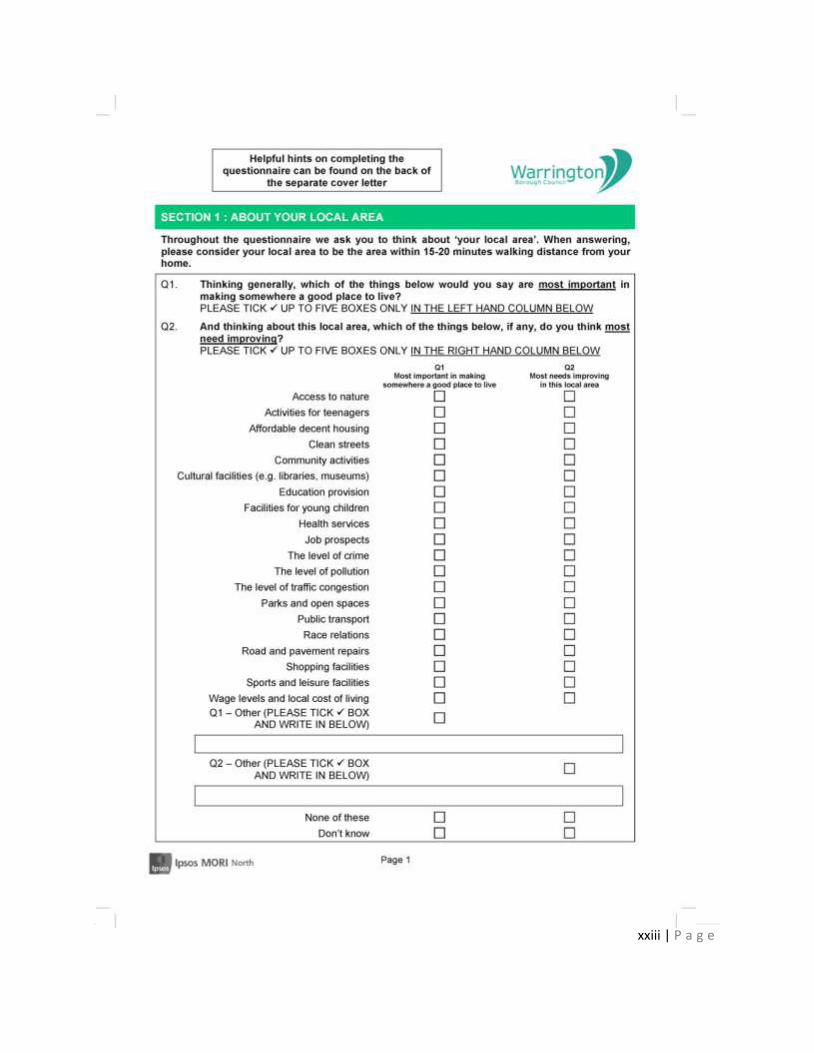
xxiii | P a g e
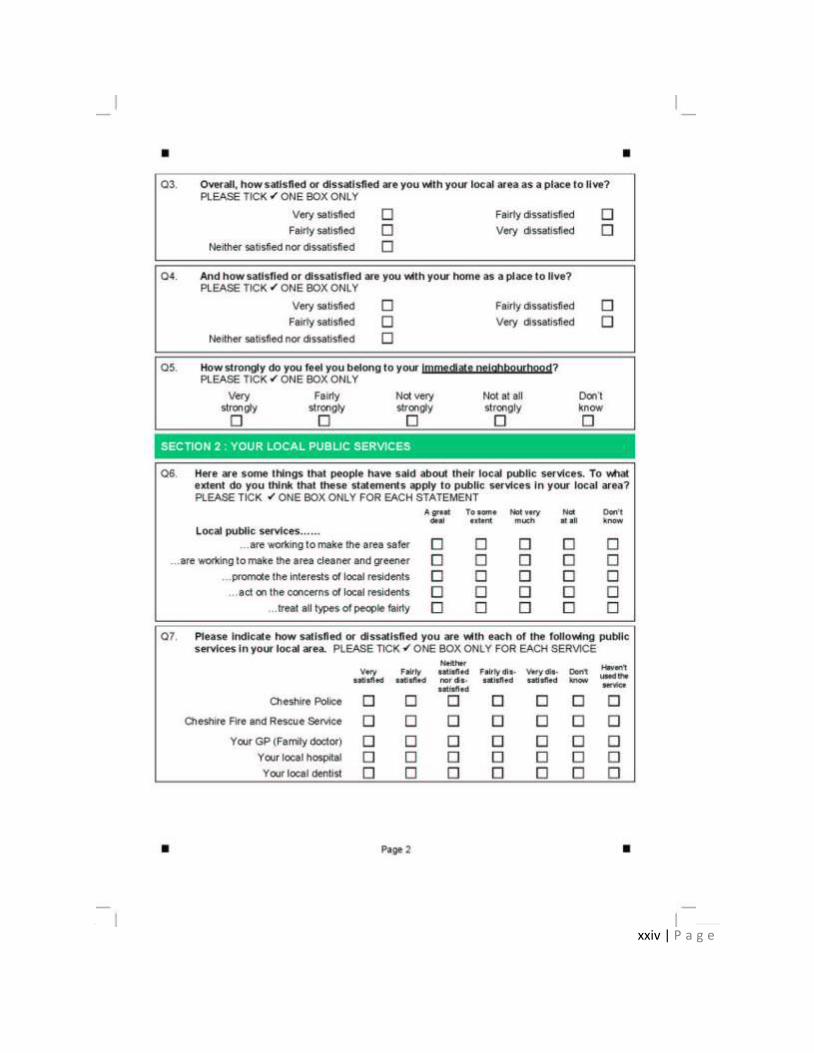
xxiv | P a g e
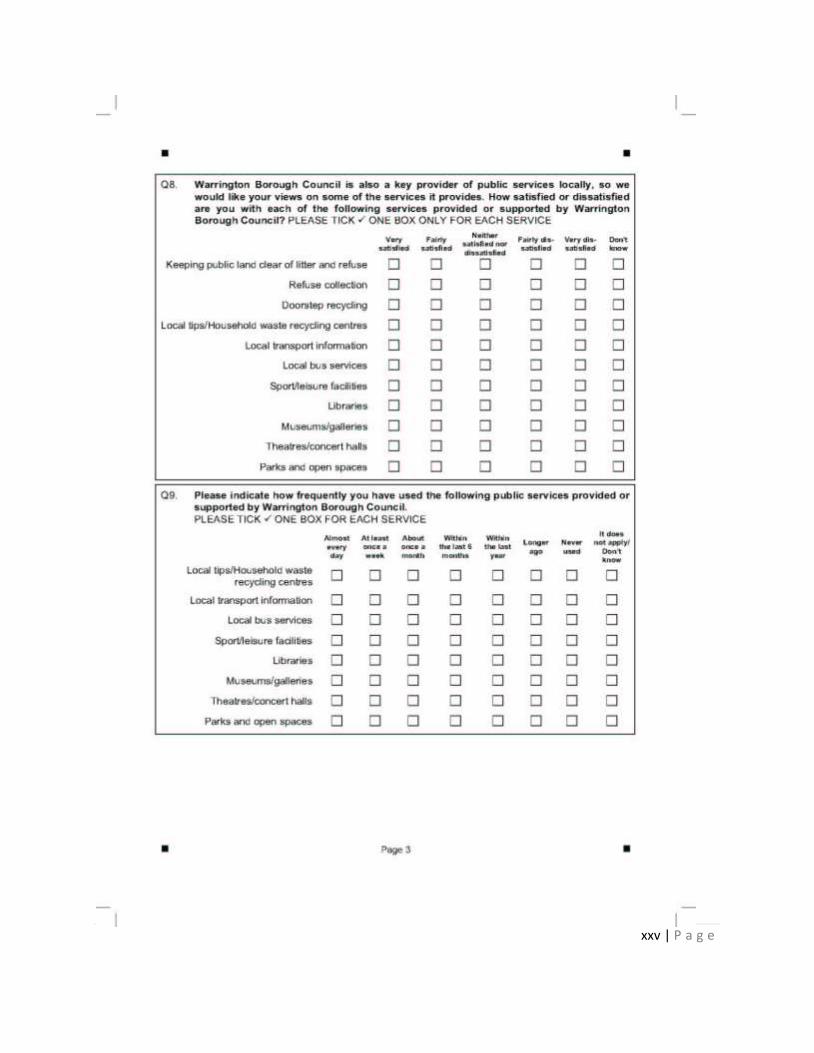
xxv | P a g e
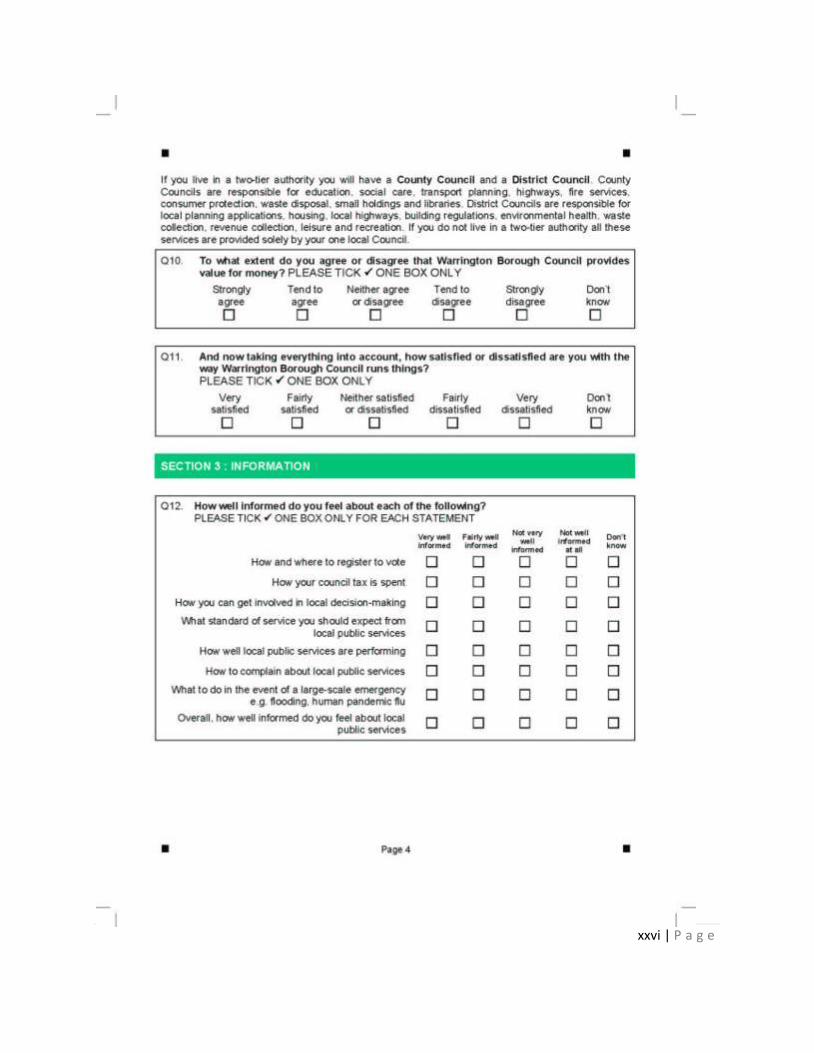
xxvi | P a g e
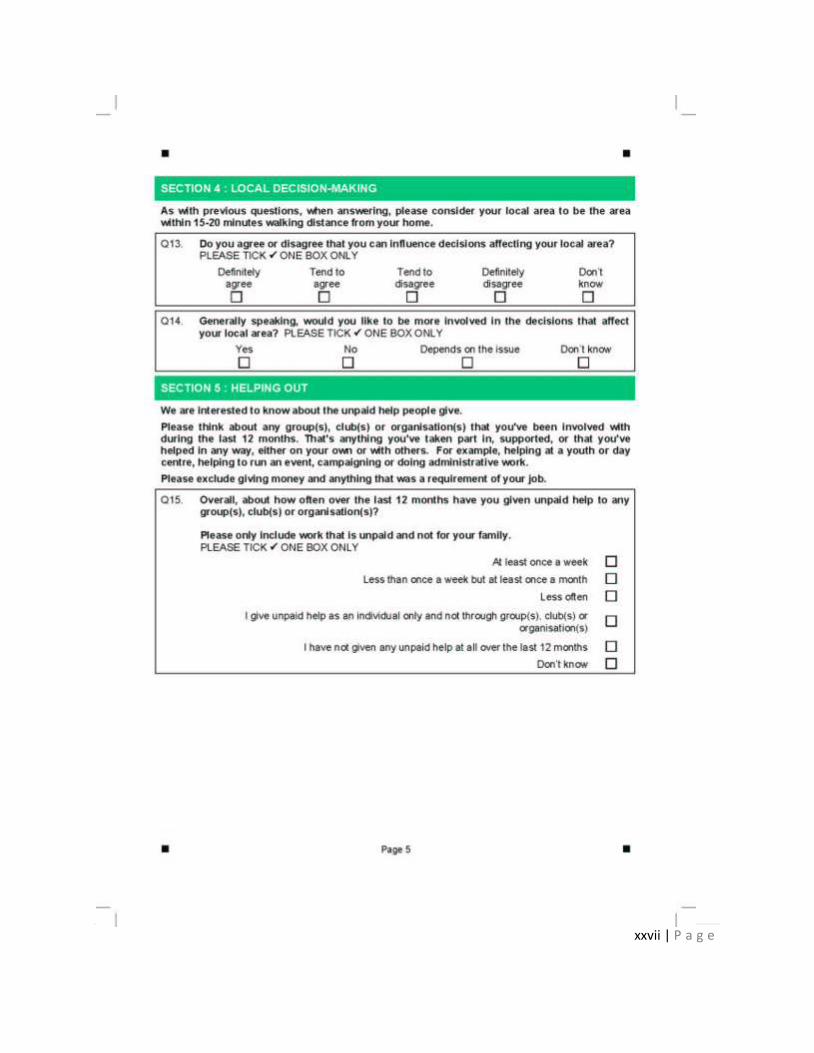
xxvii | P a g e
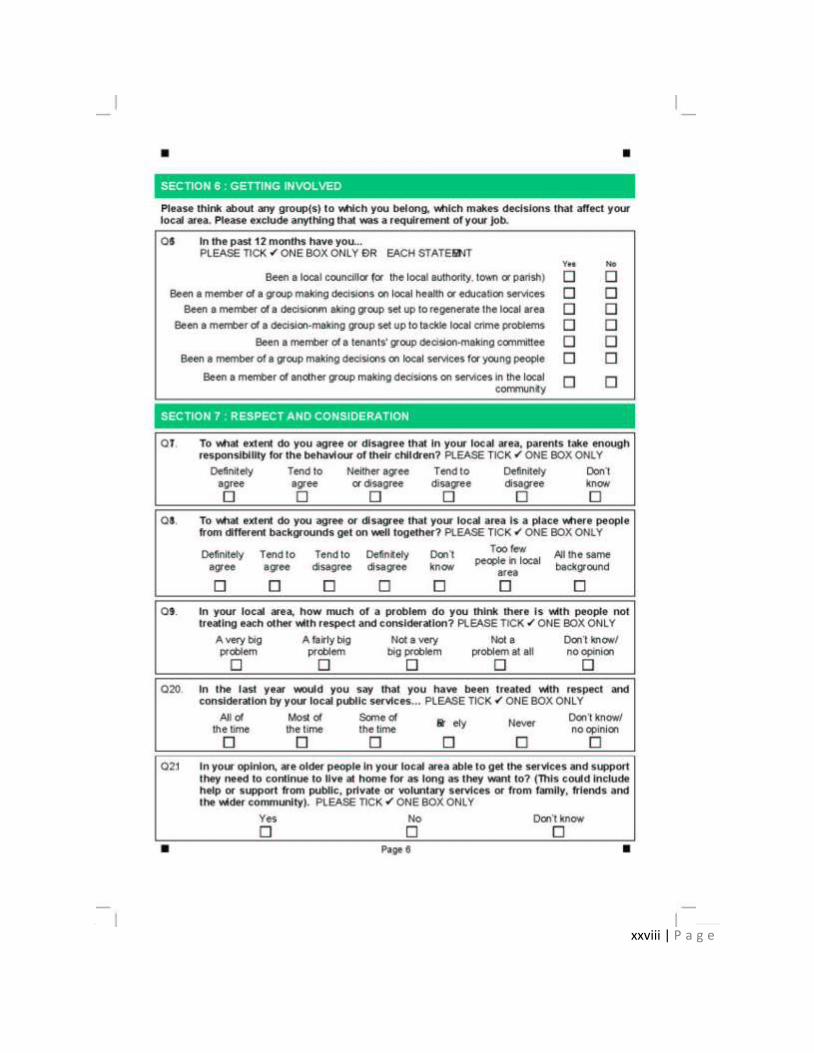
xxviii | P a g e
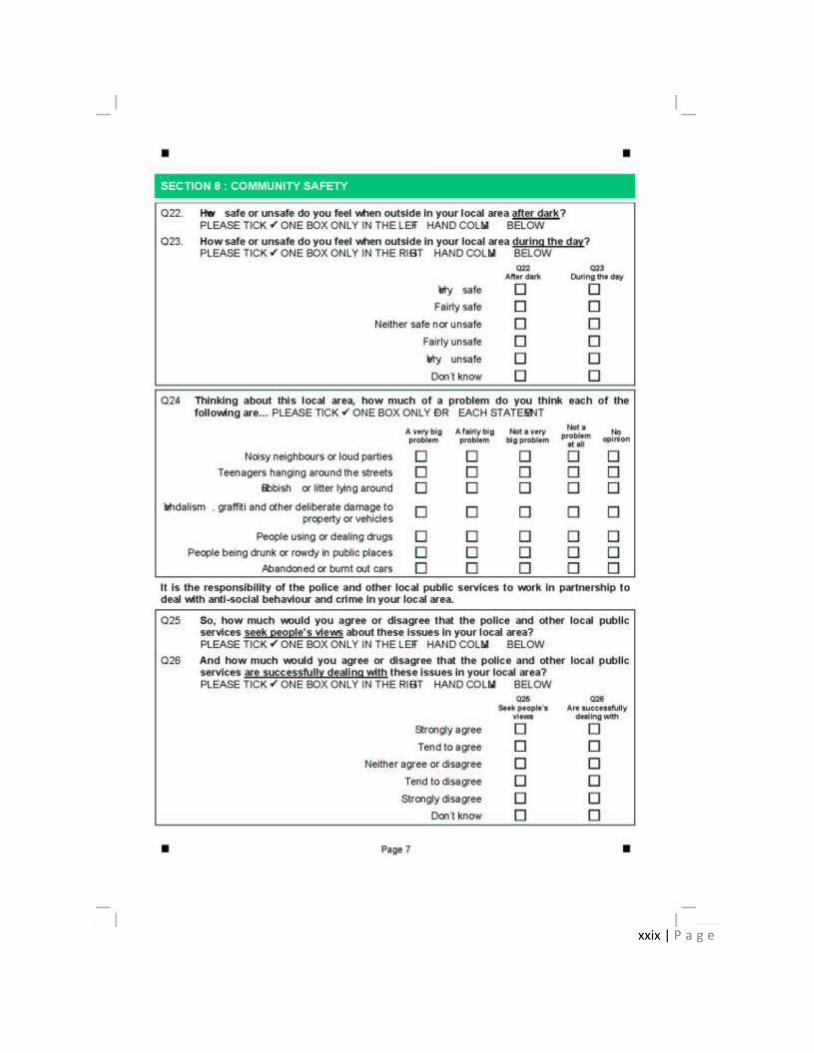
xxix | P a g e

xxx | P a g e
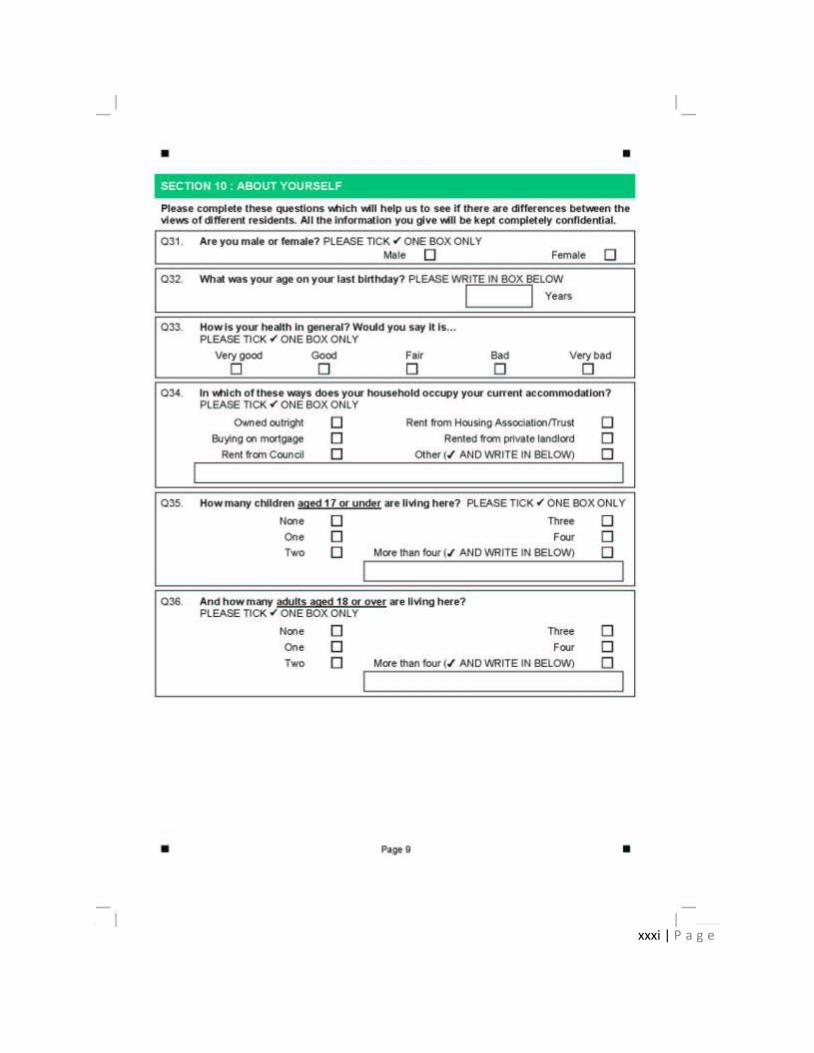
xxxi | P a g e
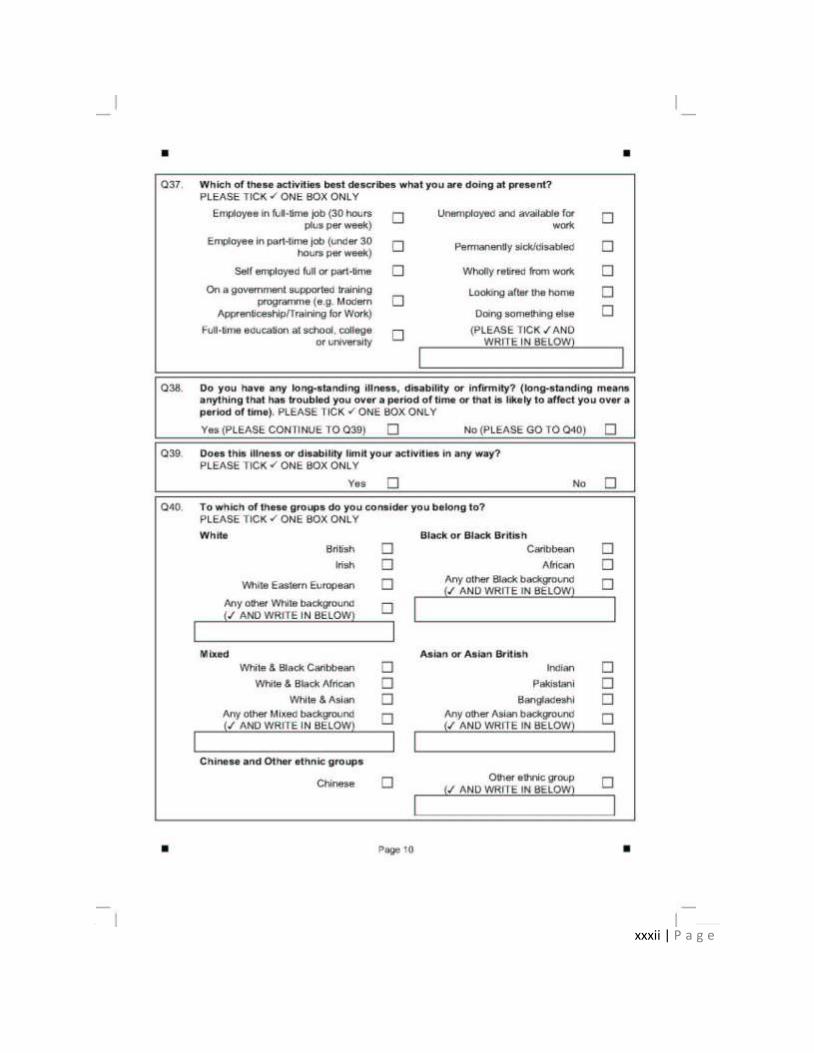
xxxii | P a g e
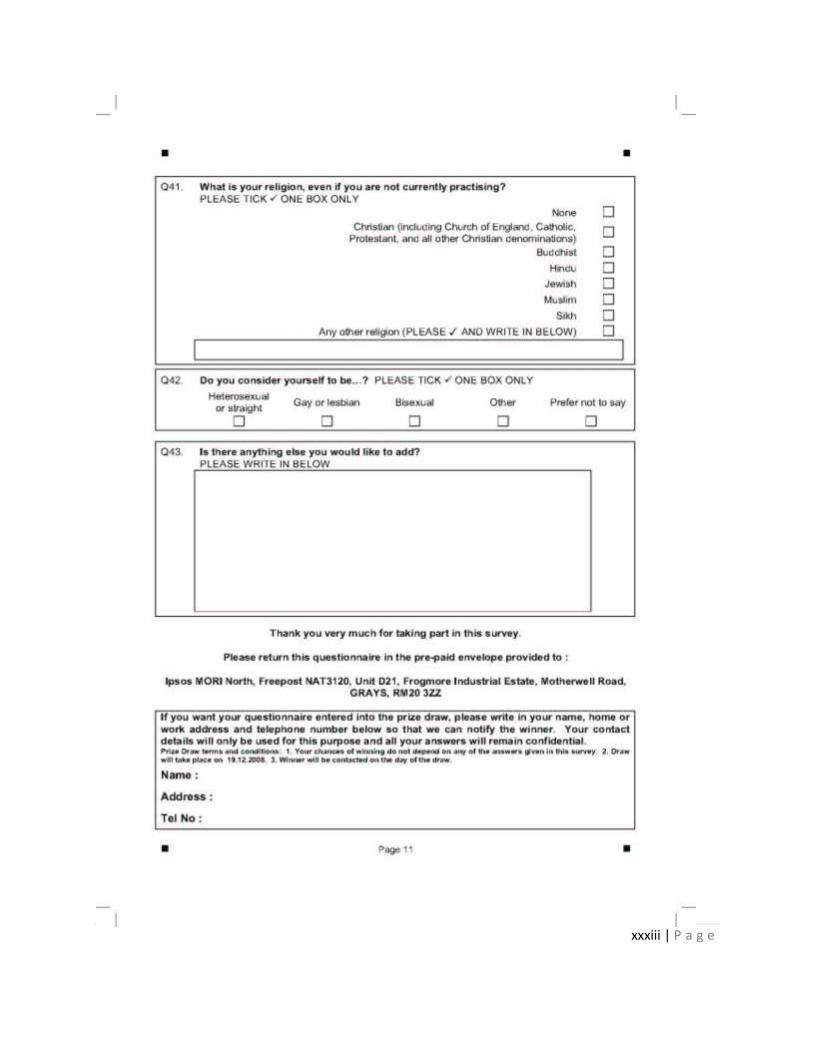
xxxiii | P a g e

xxxiv | P a g e
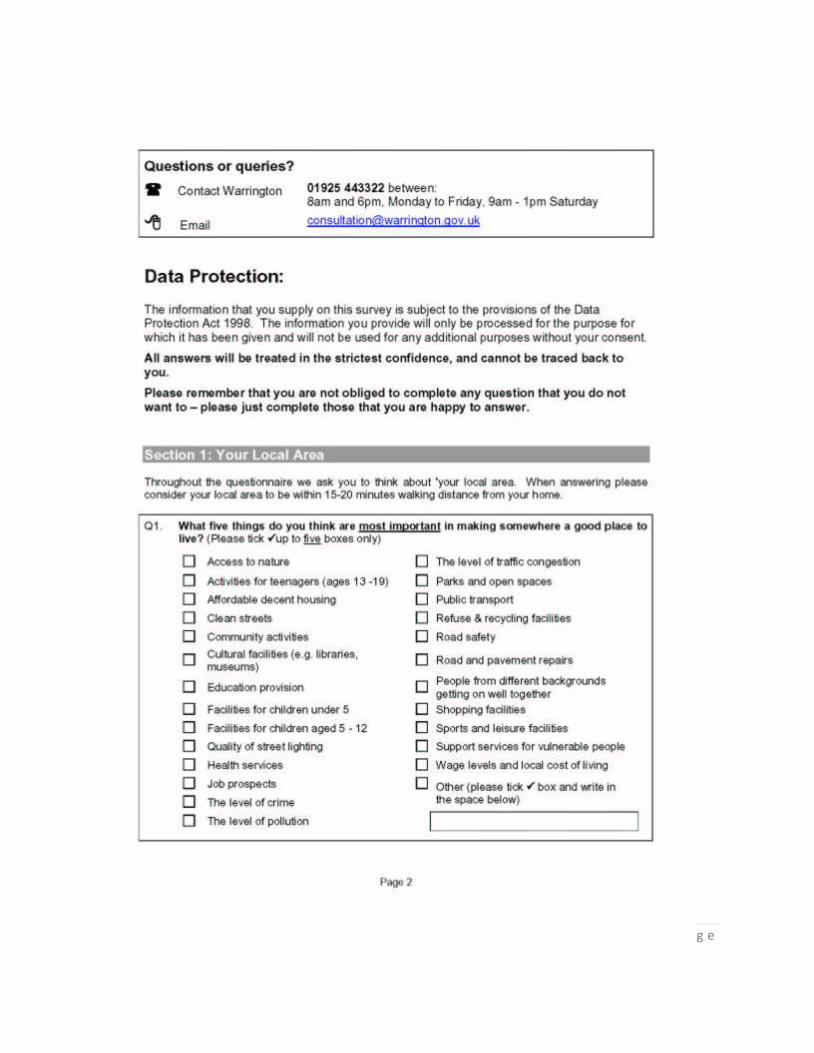
xxxv | P a g e
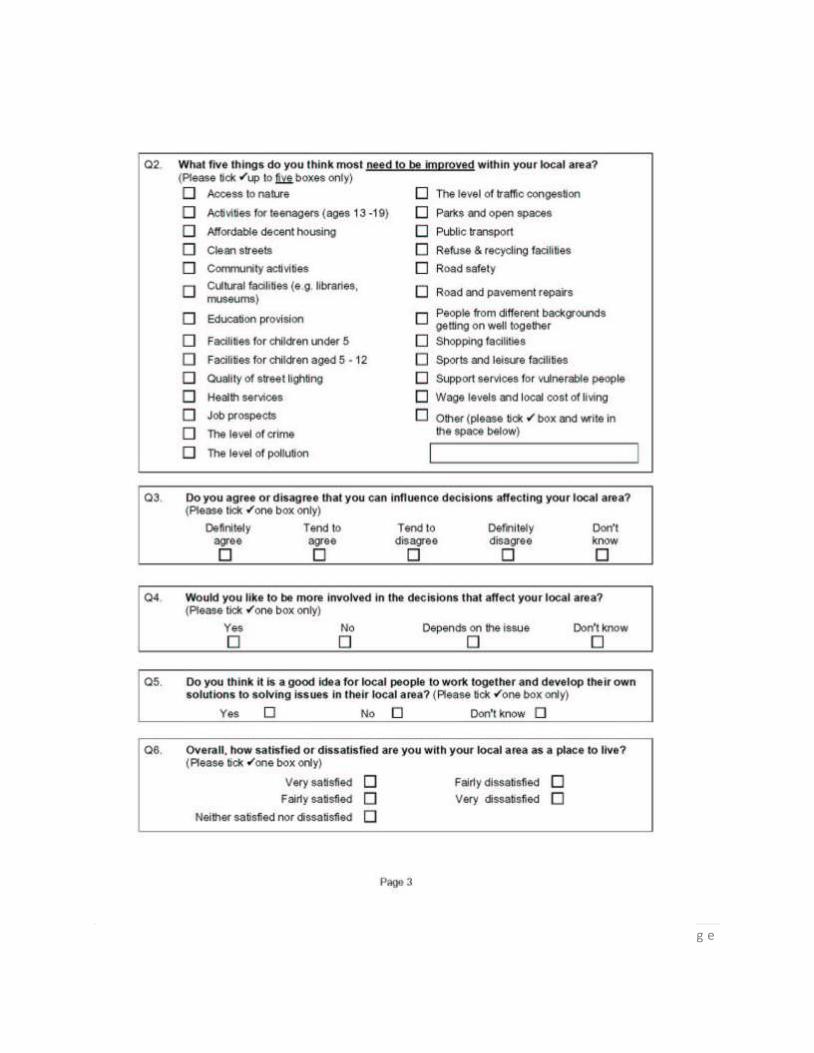
xxxvi | P a g e
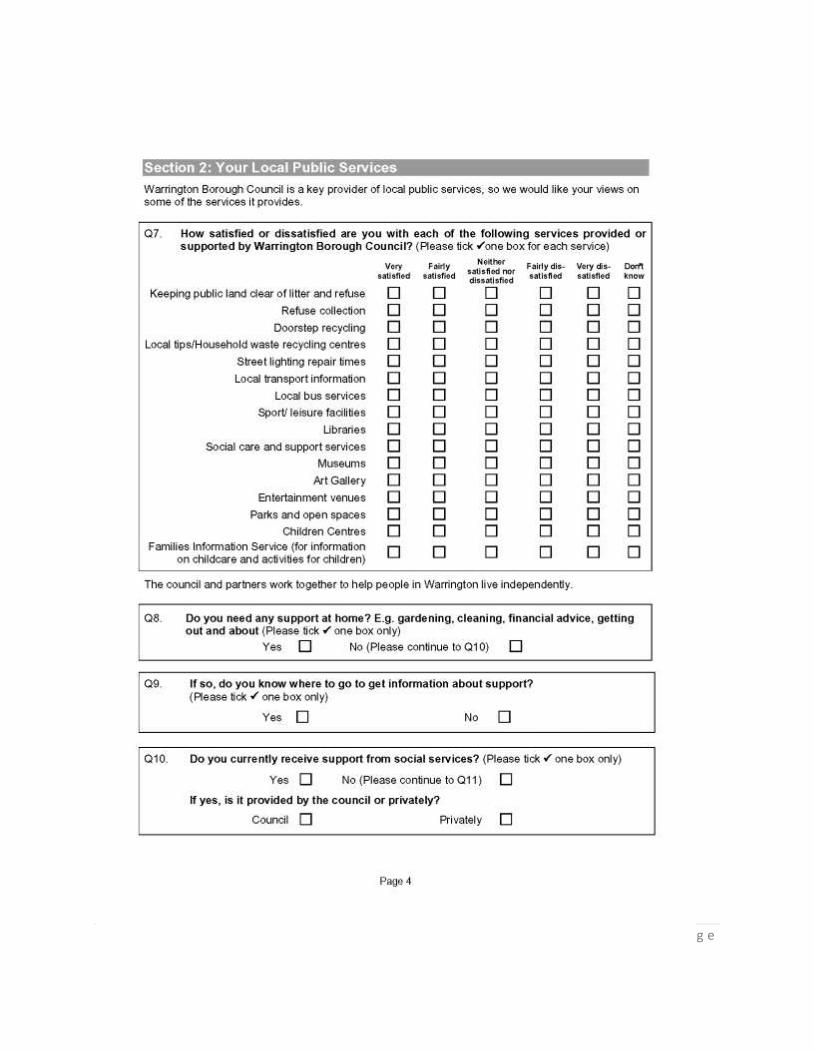
xxxvii | P a g e
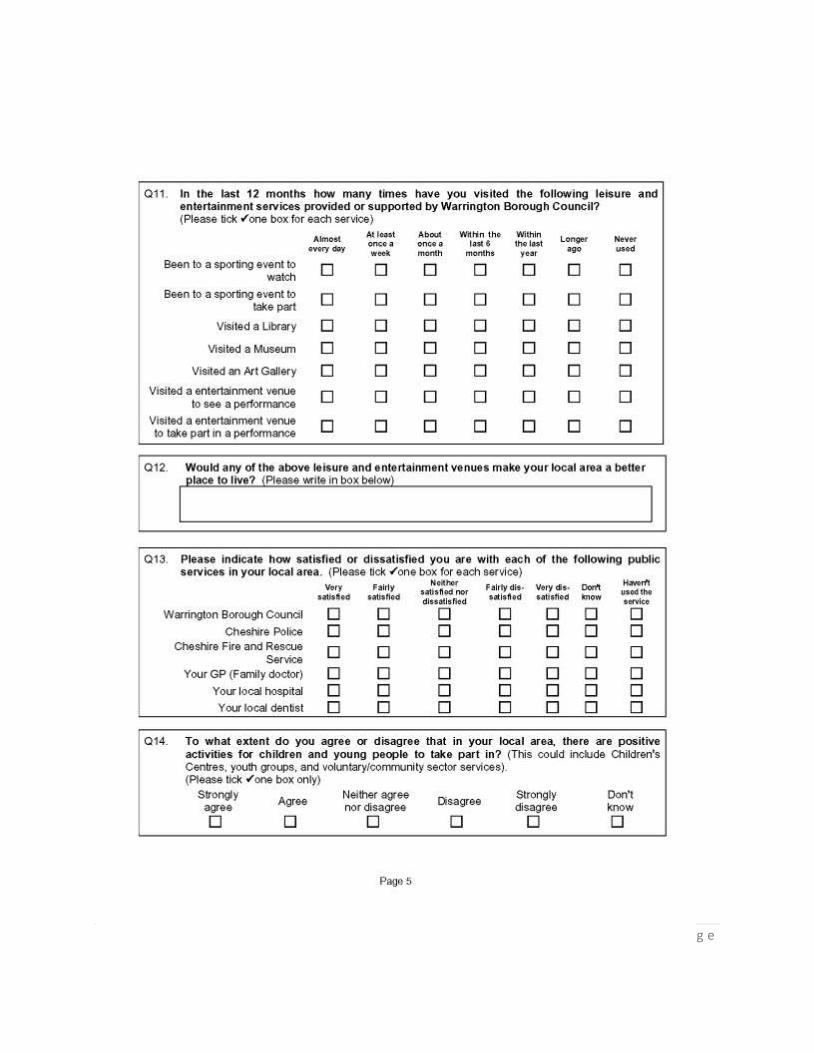
xxxviii | P a g e
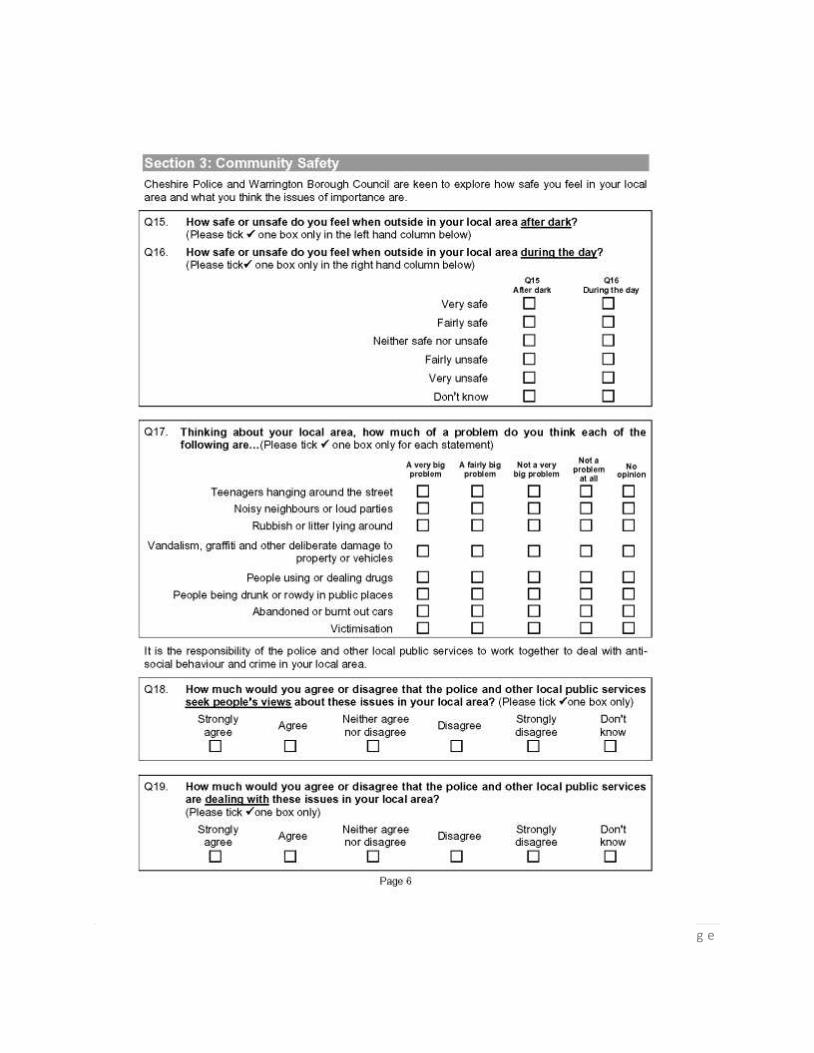
xxxix | P a g e

xl | P a g e
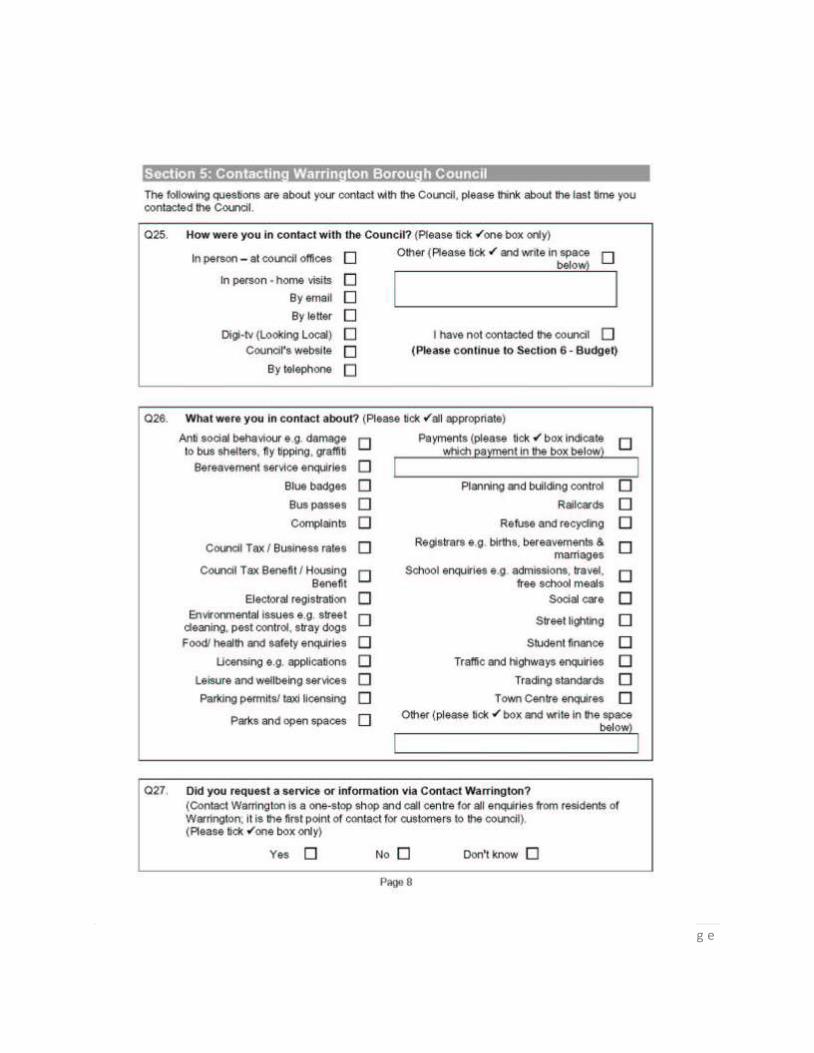
xli | P a g e
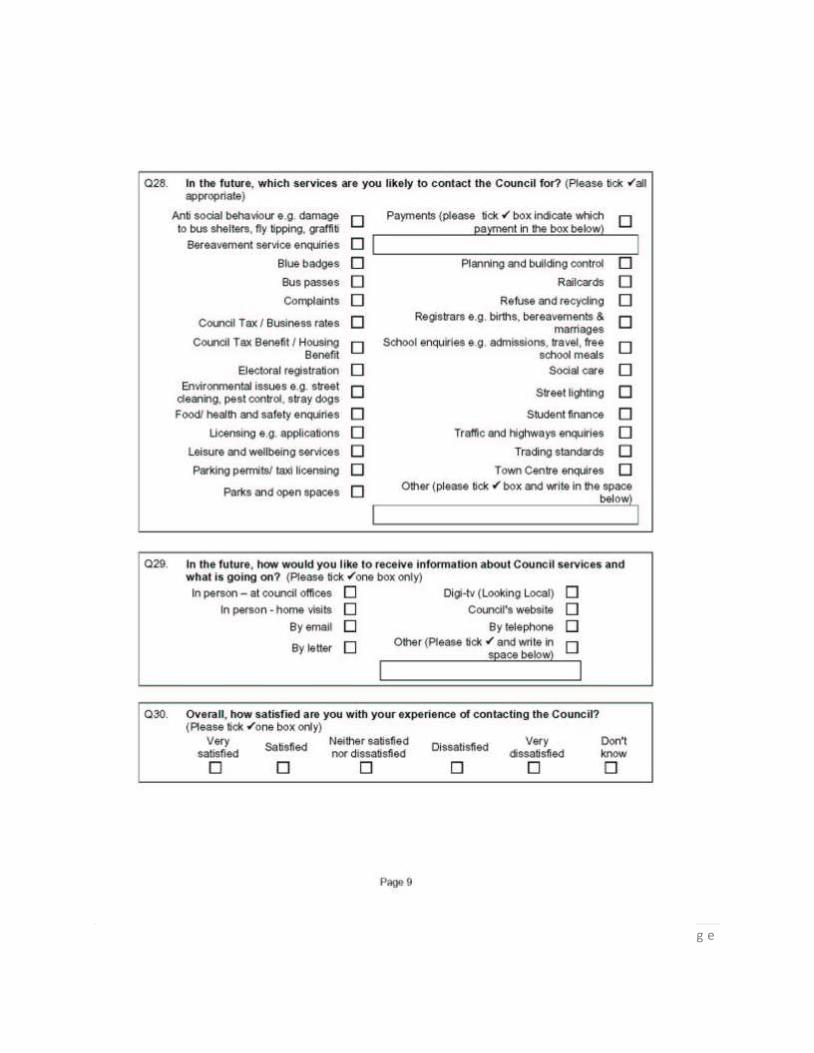
xlii | P a g e
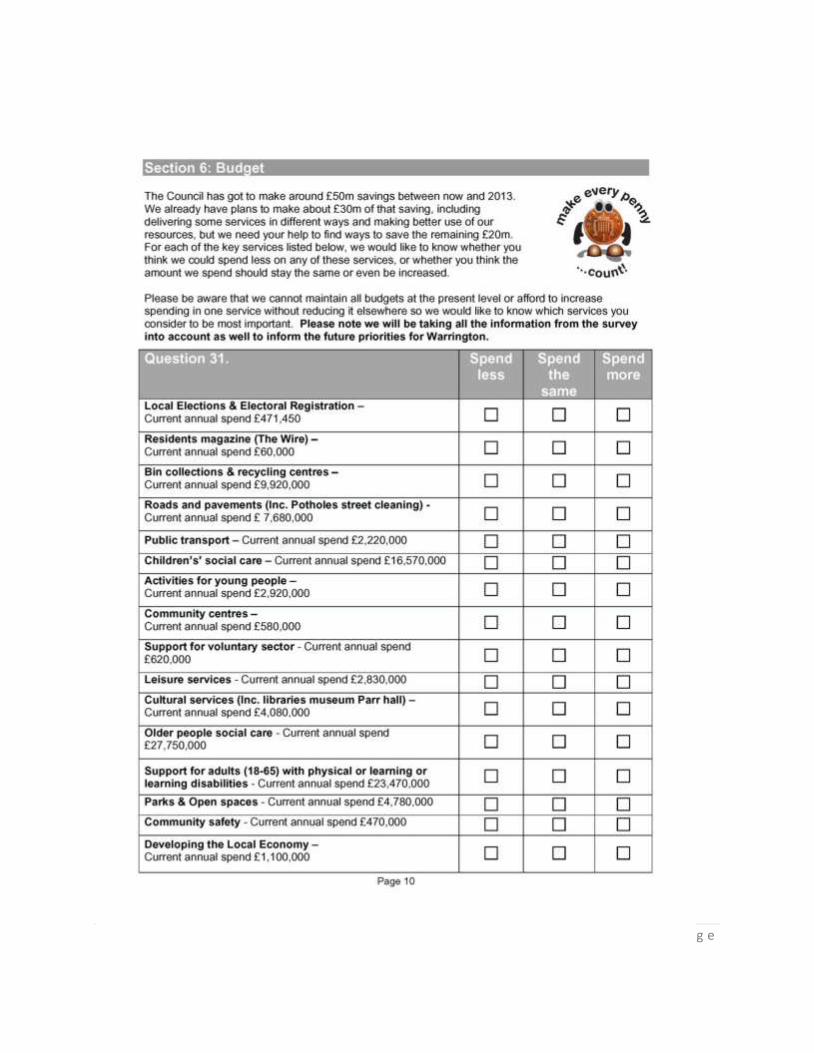
xliii | P a g e
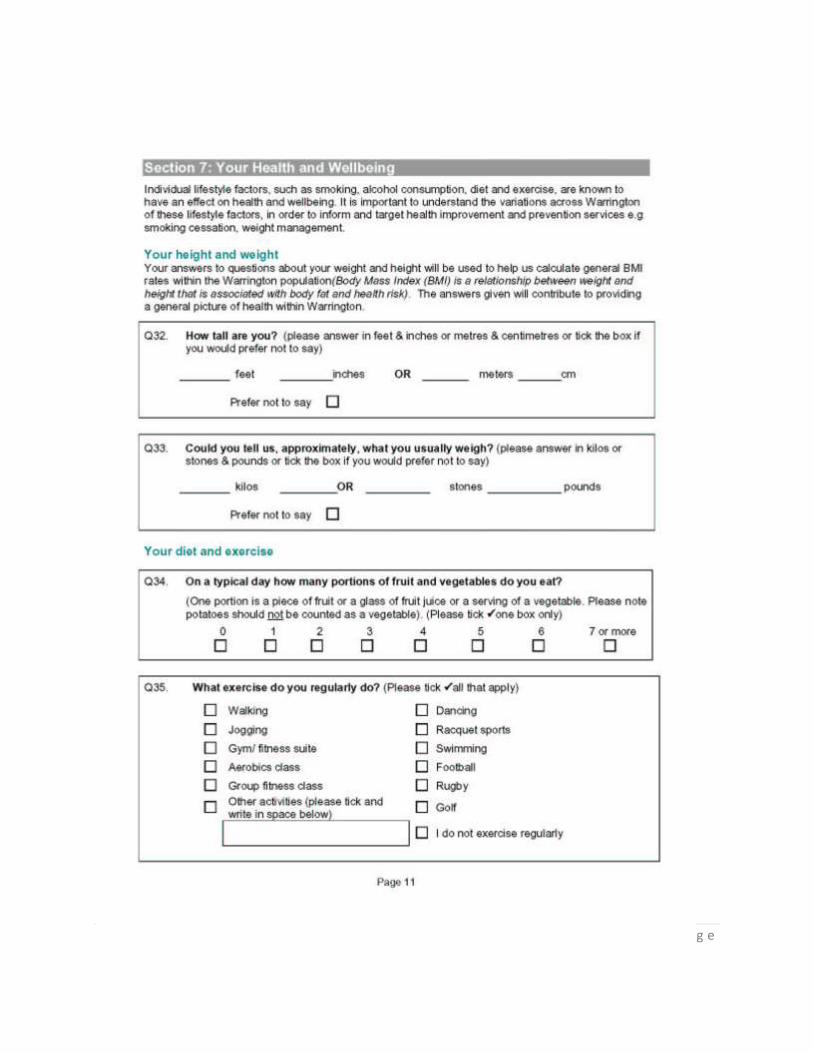
xliv | P a g e
xlv | P a g e
xlvi | P a g e
xlvii | P a g e
xlviii | P a g e
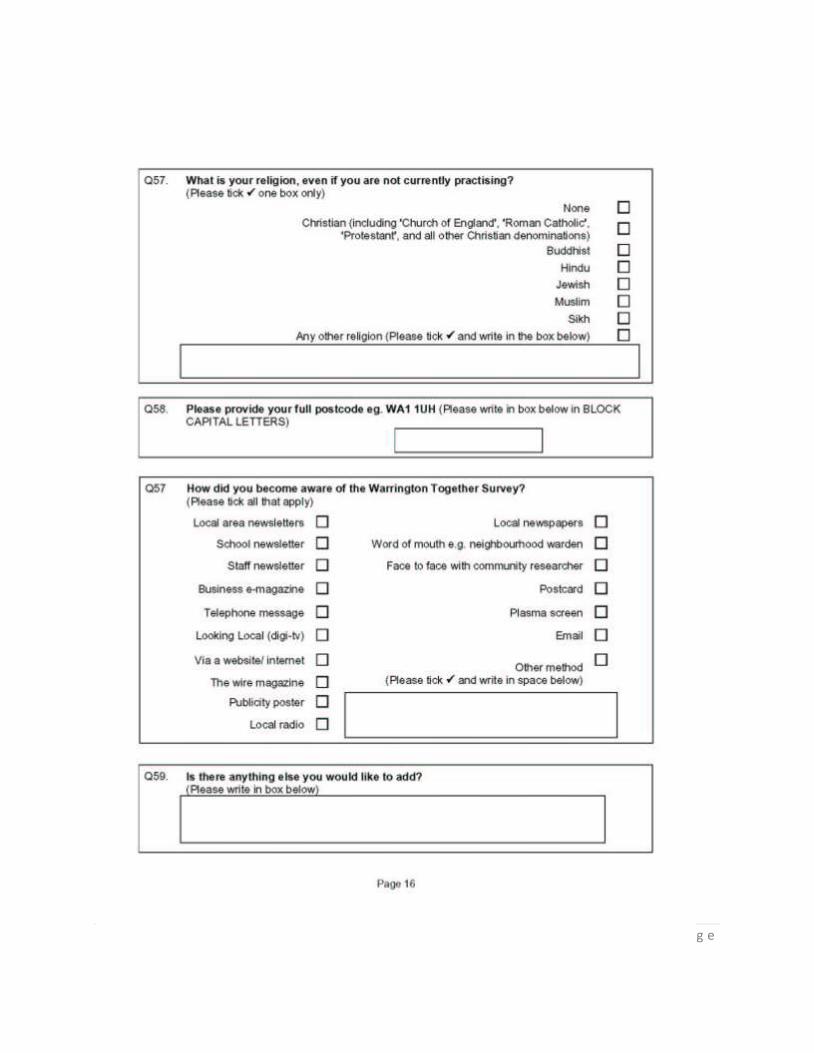
xlix | P a g e

l | P a g e

li | P a g e
APPENDIX 5: QUESTIONNAIRES OF STIW-LEVEL SURVEYS 2008, 2009 AND
2010
Survey 2008 This survey is being used to measure what you think about your neighbourhood. It should take only about 10 minutes to complete. Please remember that you are not obliged to complete any question that you do not want to on this questionnaire – please just complete those that you are happy to answer and return it to us part-completed. Please return in the freepost envelope by Friday 29
th February to be entered into a prize draw to win
£25 of Asda vouchers.
13. Crime & Community Safety
1.
1. Thinking about your local area (within 15/20 minutes walking distance), how much of a problem do you think the following are?
Please tick one box per row A very big problem
A fairly big problem
Not a very big problem
Not a problem
at all
14. Don’t
know Noisy neighbours or loud parties 1 2 3 4 5
Teenagers hanging around on the streets 1 2 3 4 5 Rubbish and litter lying around 1 2 3 4 5
People being drunk or rowdy in public spaces 1 2 3 4 5 Abandoned or burnt out cars 1 2 3 4 5
Vandalism and graffiti 1 2 3 4 5 Other deliberate damage to property or vehicles 1 2 3 4 5
People using or dealing drugs 1 2 3 4 5 People being attacked because of their skin colour,
ethnic origin or religion 1 2 3 4 5
2.
2. Thinking about Policing in your area, how do you think Cheshire Police are doing? Please tick one box only
A very good job
1
A good job
2
A fairly good job
3
A fairly bad job
4
A bad job 5
A very bad job
6 No
opinion
7
3.
3. How well informed do you feel about what is being done to tackle anti-social behaviour in your local area? Please tick one box only
Very well informed
1 Fairly well informed
2
Not very well informed
3 Not well informed
at all 4 Don’t know 5
4.
4. Do you feel that parents in your local area are made to take responsibility for the behaviour of their children? Please tick one box only
Yes 1 No 2 Don’t know 3
5.
5. Do you feel that people in your local area treat you with respect and consideration? Please tick one box only
Yes 1 No 2 Don’t know 3
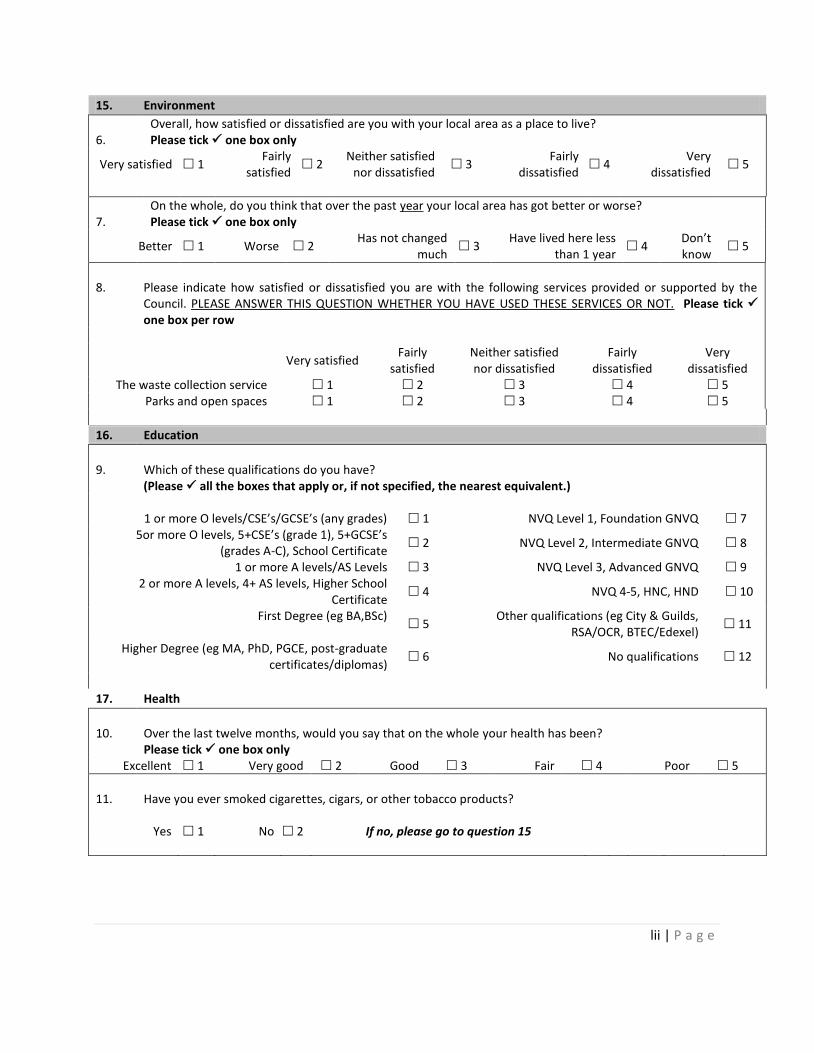
lii | P a g e
15. Environment
6.
Overall, how satisfied or dissatisfied are you with your local area as a place to live? Please tick one box only
Very satisfied 1 Fairly
satisfied 2
Neither satisfied nor dissatisfied
3 Fairly
dissatisfied 4
Very dissatisfied
5
7.
On the whole, do you think that over the past year your local area has got better or worse? Please tick one box only
Better 1 Worse 2 Has not changed
much 3
Have lived here less than 1 year
4 Don’t know
5
8.
Please indicate how satisfied or dissatisfied you are with the following services provided or supported by the Council. PLEASE ANSWER THIS QUESTION WHETHER YOU HAVE USED THESE SERVICES OR NOT. Please tick one box per row
Very satisfied Fairly
satisfied Neither satisfied nor dissatisfied
Fairly dissatisfied
Very dissatisfied
The waste collection service 1 2 3 4 5 Parks and open spaces 1 2 3 4 5
16. Education
9.
Which of these qualifications do you have? (Please all the boxes that apply or, if not specified, the nearest equivalent.)
1 or more O levels/CSE’s/GCSE’s (any grades) 1 NVQ Level 1, Foundation GNVQ 7
5or more O levels, 5+CSE’s (grade 1), 5+GCSE’s (grades A-C), School Certificate
2 NVQ Level 2, Intermediate GNVQ 8
1 or more A levels/AS Levels 3 NVQ Level 3, Advanced GNVQ 9 2 or more A levels, 4+ AS levels, Higher School
Certificate 4 NVQ 4-5, HNC, HND 10
First Degree (eg BA,BSc) 5
Other qualifications (eg City & Guilds, RSA/OCR, BTEC/Edexel)
11
Higher Degree (eg MA, PhD, PGCE, post-graduate certificates/diplomas)
6 No qualifications 12
17. Health
10.
Over the last twelve months, would you say that on the whole your health has been? Please tick one box only
Excellent 1 Very good 2 Good 3 Fair 4 Poor 5
11.
Have you ever smoked cigarettes, cigars, or other tobacco products?
Yes 1 No 2 If no, please go to question 15
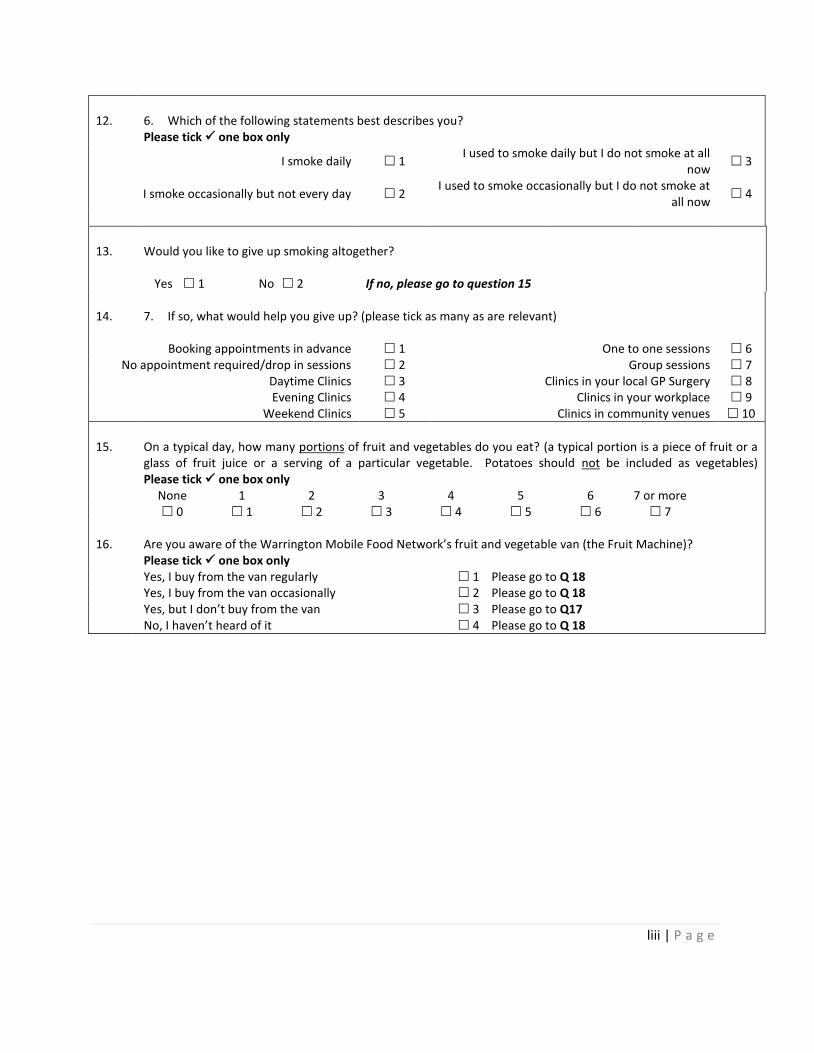
liii | P a g e
12.
6. Which of the following statements best describes you? Please tick one box only
I smoke daily 1 I used to smoke daily but I do not smoke at all
now 3
I smoke occasionally but not every day 2 I used to smoke occasionally but I do not smoke at
all now 4
13.
Would you like to give up smoking altogether?
Yes 1 No 2 If no, please go to question 15 14.
7. If so, what would help you give up? (please tick as many as are relevant)
Booking appointments in advance 1 One to one sessions 6 No appointment required/drop in sessions 2 Group sessions 7
Daytime Clinics 3 Clinics in your local GP Surgery 8 Evening Clinics 4 Clinics in your workplace 9
Weekend Clinics 5 Clinics in community venues 10
15.
On a typical day, how many portions of fruit and vegetables do you eat? (a typical portion is a piece of fruit or a glass of fruit juice or a serving of a particular vegetable. Potatoes should not be included as vegetables) Please tick one box only
None 1 2 3 4 5 6 7 or more 0 1 2 3 4 5 6 7 16.
Are you aware of the Warrington Mobile Food Network’s fruit and vegetable van (the Fruit Machine)? Please tick one box only
Yes, I buy from the van regularly 1 Please go to Q 18 Yes, I buy from the van occasionally 2 Please go to Q 18 Yes, but I don’t buy from the van 3 Please go to Q17 No, I haven’t heard of it 4 Please go to Q 18
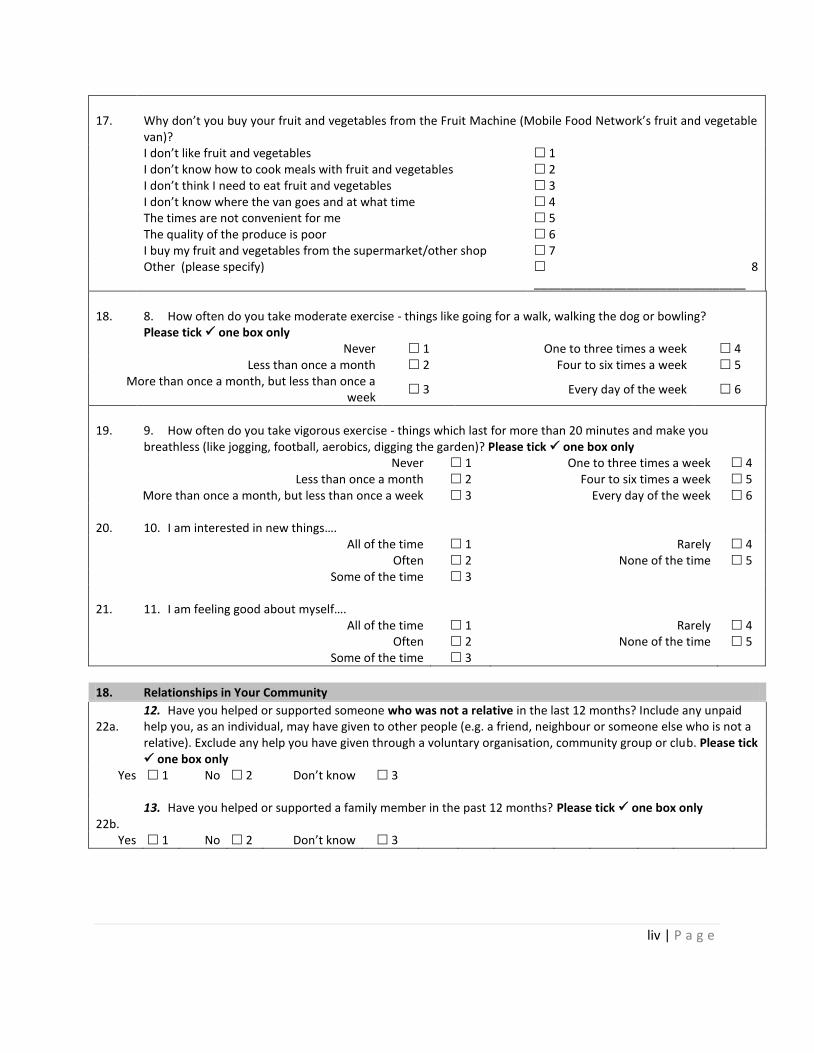
liv | P a g e
17.
Why don’t you buy your fruit and vegetables from the Fruit Machine (Mobile Food Network’s fruit and vegetable van)?
I don’t like fruit and vegetables 1 I don’t know how to cook meals with fruit and vegetables 2 I don’t think I need to eat fruit and vegetables 3 I don’t know where the van goes and at what time 4 The times are not convenient for me 5 The quality of the produce is poor 6 I buy my fruit and vegetables from the supermarket/other shop 7 Other (please specify) 8
________________________________
18.
8. How often do you take moderate exercise - things like going for a walk, walking the dog or bowling? Please tick one box only
Never 1 One to three times a week 4 Less than once a month 2 Four to six times a week 5
More than once a month, but less than once a week
3 Every day of the week 6
19.
9. How often do you take vigorous exercise - things which last for more than 20 minutes and make you breathless (like jogging, football, aerobics, digging the garden)? Please tick one box only
Never 1 One to three times a week 4 Less than once a month 2 Four to six times a week 5
More than once a month, but less than once a week 3 Every day of the week 6 20.
10. I am interested in new things….
All of the time 1 Rarely 4 Often 2 None of the time 5
Some of the time 3 21.
11. I am feeling good about myself….
All of the time 1 Rarely 4 Often 2 None of the time 5
Some of the time 3
18. Relationships in Your Community
22a.
12. Have you helped or supported someone who was not a relative in the last 12 months? Include any unpaid help you, as an individual, may have given to other people (e.g. a friend, neighbour or someone else who is not a relative). Exclude any help you have given through a voluntary organisation, community group or club. Please tick one box only
Yes 1 No 2 Don’t know 3
22b.
13. Have you helped or supported a family member in the past 12 months? Please tick one box only
Yes 1 No 2 Don’t know 3
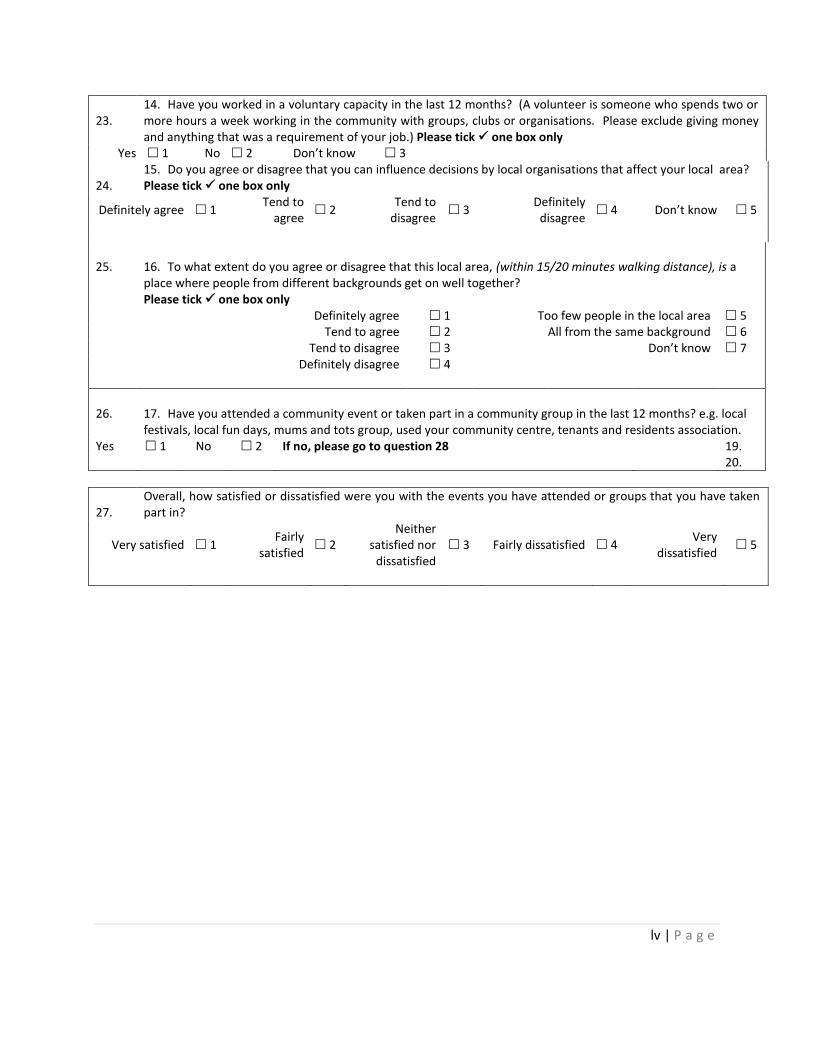
lv | P a g e
23.
14. Have you worked in a voluntary capacity in the last 12 months? (A volunteer is someone who spends two or more hours a week working in the community with groups, clubs or organisations. Please exclude giving money and anything that was a requirement of your job.) Please tick one box only
Yes 1 No 2 Don’t know 3 24.
15. Do you agree or disagree that you can influence decisions by local organisations that affect your local area? Please tick one box only
Definitely agree 1 Tend to
agree 2
Tend to disagree
3 Definitely
disagree 4 Don’t know 5
25.
16. To what extent do you agree or disagree that this local area, (within 15/20 minutes walking distance), is a place where people from different backgrounds get on well together? Please tick one box only
Definitely agree 1 Too few people in the local area 5 Tend to agree 2 All from the same background 6
Tend to disagree 3 Don’t know 7 Definitely disagree 4
26.
17. Have you attended a community event or taken part in a community group in the last 12 months? e.g. local festivals, local fun days, mums and tots group, used your community centre, tenants and residents association.
Yes 1 No 2 If no, please go to question 28 19. 20.
27.
Overall, how satisfied or dissatisfied were you with the events you have attended or groups that you have taken part in?
Very satisfied 1 Fairly
satisfied 2
Neither satisfied nor
dissatisfied 3 Fairly dissatisfied 4
Very dissatisfied
5
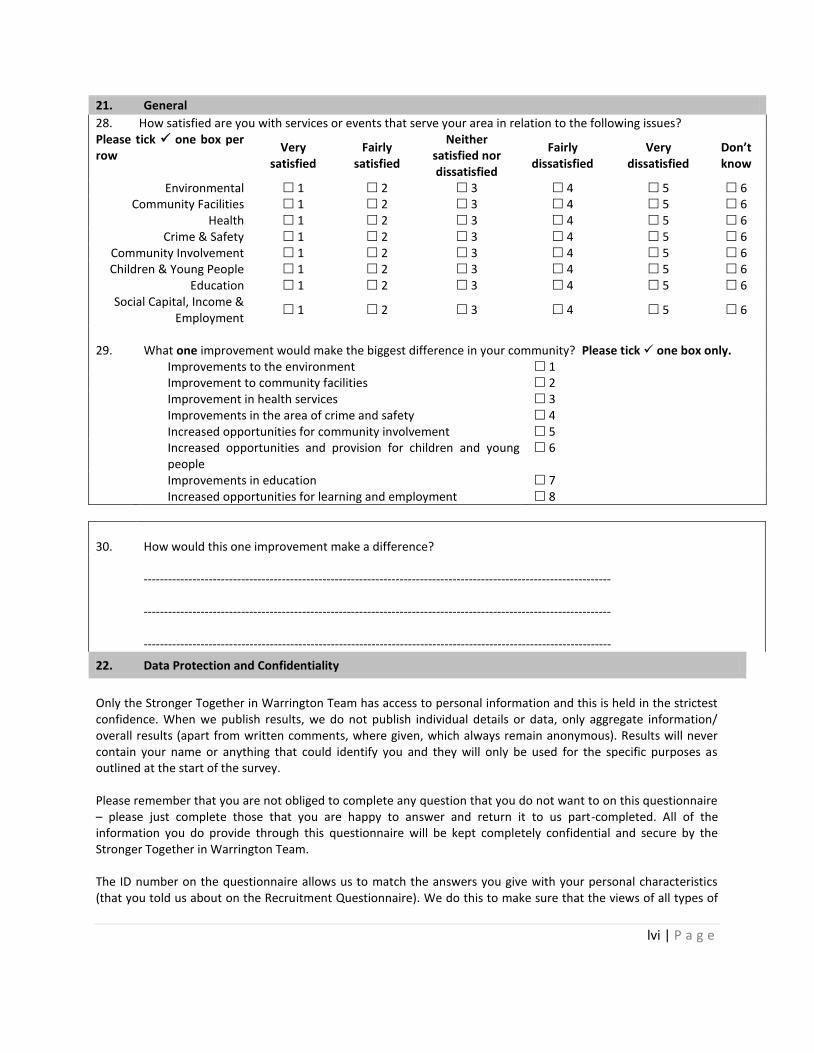
lvi | P a g e
21. General
28. How satisfied are you with services or events that serve your area in relation to the following issues? Please tick one box per row
Very satisfied
Fairly satisfied
Neither satisfied nor dissatisfied
Fairly dissatisfied
Very dissatisfied
Don’t know
Environmental 1 2 3 4 5 6 Community Facilities 1 2 3 4 5 6
Health 1 2 3 4 5 6 Crime & Safety 1 2 3 4 5 6
Community Involvement 1 2 3 4 5 6 Children & Young People 1 2 3 4 5 6
Education 1 2 3 4 5 6 Social Capital, Income &
Employment 1 2 3 4 5 6
29.
What one improvement would make the biggest difference in your community? Please tick one box only.
Improvements to the environment 1 Improvement to community facilities 2 Improvement in health services 3 Improvements in the area of crime and safety 4 Increased opportunities for community involvement 5 Increased opportunities and provision for children and young
people 6
Improvements in education 7 Increased opportunities for learning and employment 8
30.
How would this one improvement make a difference?
------------------------------------------------------------------------------------------------------------------- ------------------------------------------------------------------------------------------------------------------- -------------------------------------------------------------------------------------------------------------------
22. Data Protection and Confidentiality
Only the Stronger Together in Warrington Team has access to personal information and this is held in the strictest confidence. When we publish results, we do not publish individual details or data, only aggregate information/ overall results (apart from written comments, where given, which always remain anonymous). Results will never contain your name or anything that could identify you and they will only be used for the specific purposes as outlined at the start of the survey. Please remember that you are not obliged to complete any question that you do not want to on this questionnaire – please just complete those that you are happy to answer and return it to us part-completed. All of the information you do provide through this questionnaire will be kept completely confidential and secure by the Stronger Together in Warrington Team. The ID number on the questionnaire allows us to match the answers you give with your personal characteristics (that you told us about on the Recruitment Questionnaire). We do this to make sure that the views of all types of
lvii | P a g e
people are represented and so we can see if certain neighbourhoods have specific requirements. The ID number is also used to identify you in the Prize Draw.
Many thanks for completing this survey. Please return in the
freepost envelope enclosed by the Friday 29th
February to ensure you are entered into our free prize draw.
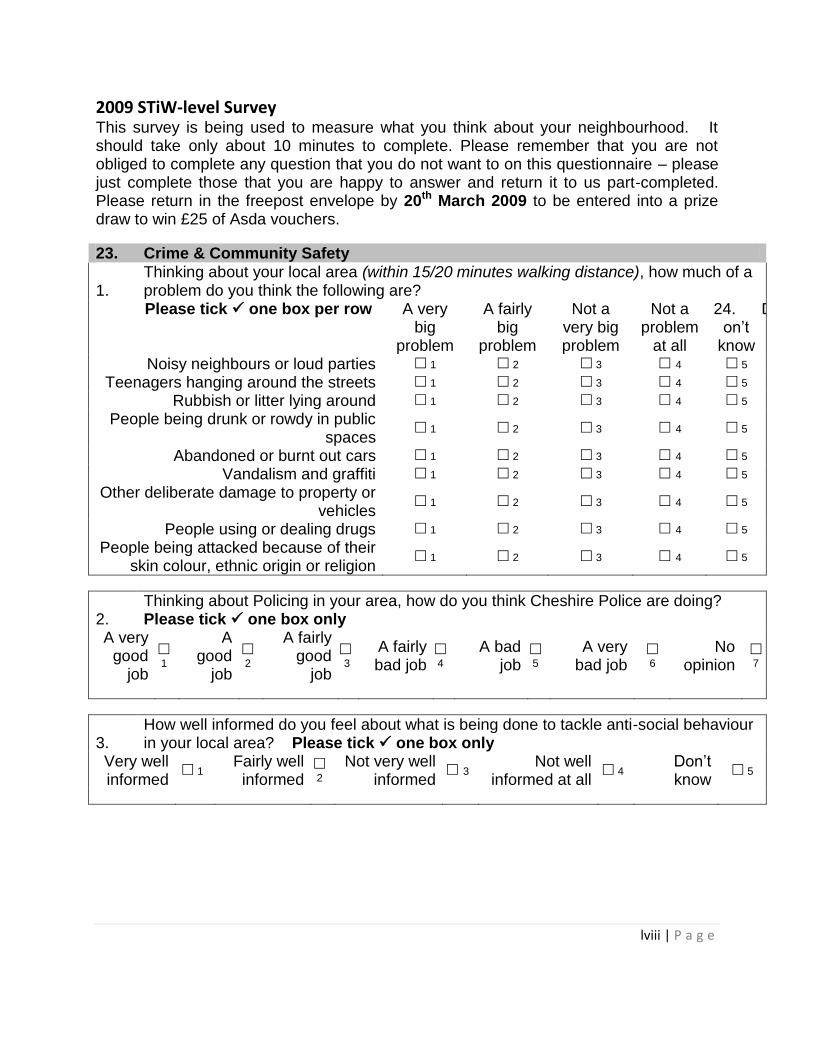
lviii | P a g e
2009 STiW-level Survey This survey is being used to measure what you think about your neighbourhood. It should take only about 10 minutes to complete. Please remember that you are not obliged to complete any question that you do not want to on this questionnaire – please just complete those that you are happy to answer and return it to us part-completed. Please return in the freepost envelope by 20th March 2009 to be entered into a prize draw to win £25 of Asda vouchers.
23. Crime & Community Safety
1.
Thinking about your local area (within 15/20 minutes walking distance), how much of a problem do you think the following are?
Please tick one box per row A very big
problem
A fairly big
problem
Not a very big problem
Not a problem
at all
24. Don’t
know Noisy neighbours or loud parties 1 2 3 4 5
Teenagers hanging around the streets 1 2 3 4 5
Rubbish or litter lying around 1 2 3 4 5
People being drunk or rowdy in public spaces
1 2 3 4 5
Abandoned or burnt out cars 1 2 3 4 5
Vandalism and graffiti 1 2 3 4 5
Other deliberate damage to property or vehicles
1 2 3 4 5
People using or dealing drugs 1 2 3 4 5
People being attacked because of their skin colour, ethnic origin or religion
1 2 3 4 5
2.
Thinking about Policing in your area, how do you think Cheshire Police are doing? Please tick one box only
A very good
job
1
A good
job
2
A fairly good
job
3
A fairly bad job
4
A bad job
5
A very bad job
6
No opinion
7
3.
How well informed do you feel about what is being done to tackle anti-social behaviour in your local area? Please tick one box only
Very well informed
1 Fairly well informed
2
Not very well informed
3 Not well
informed at all 4
Don’t know
5

lix | P a g e
4.
Do you feel that parents in your local area are made to take responsibility for the behaviour of their children? Please tick one box only
Yes 1 No 2 Don’t know 3
5.
Do you feel that people in your local area treat you with respect and consideration? Please tick one box only
Yes 1 No 2 Don’t know 3
25. Environment
6.
Overall, how satisfied or dissatisfied are you with your local area as a place to live? Please tick one box only
Very satisfied
1 Fairly
satisfied 2
Neither satisfied nor dissatisfied
3 Fairly
dissatisfied 4
Very dissatisfied
5
7.
On the whole, do you think that over the past year your local area has got better or worse? Please tick one box only
Better 1 Worse 2 Has not
changed much 3
Have lived here less than 1 year
4 Don’t know
5
8.
Please indicate how satisfied or dissatisfied you are with the following services provided or supported by the Council. PLEASE ANSWER THIS QUESTION WHETHER YOU HAVE USED THESE SERVICES OR NOT. Please tick one box per row
Very satisfied
Fairly satisfied
Neither satisfied nor dissatisfied
Fairly dissatisfied
Very dissatisfied
The waste collection service
1 2 3 4 5
Parks and open spaces 1 2 3 4 5
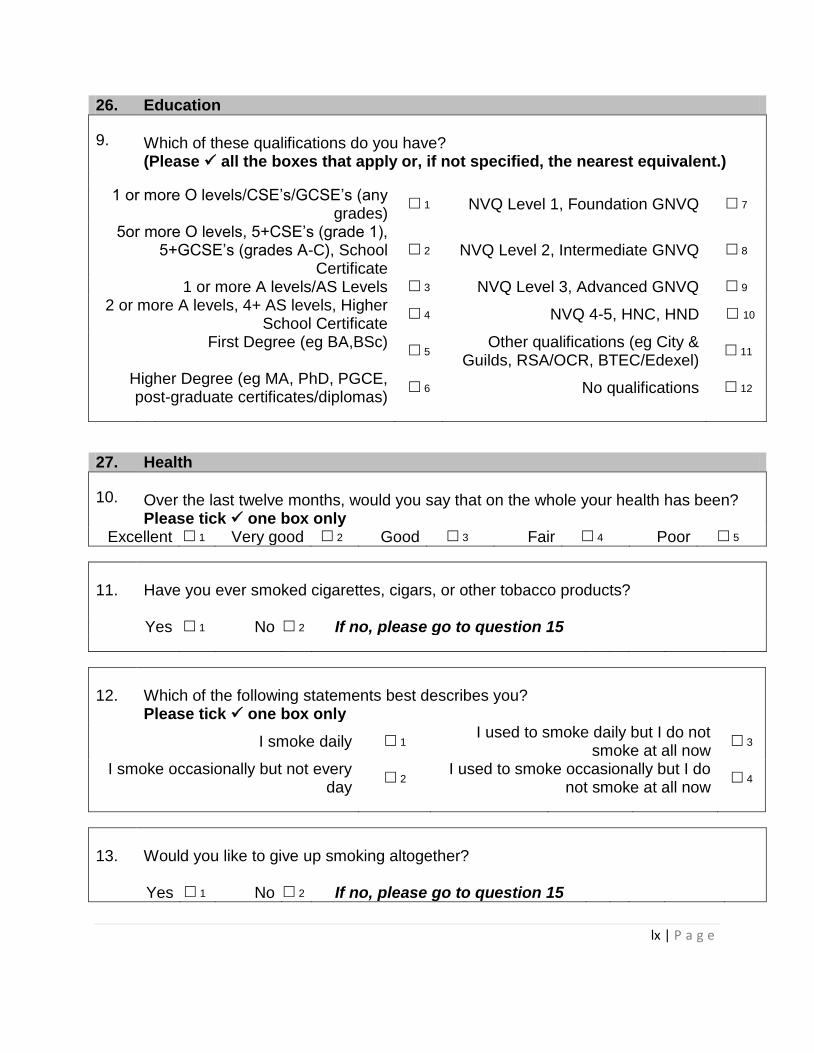
lx | P a g e
26. Education
9. Which of these qualifications do you have? (Please all the boxes that apply or, if not specified, the nearest equivalent.)
1 or more O levels/CSE’s/GCSE’s (any grades)
1 NVQ Level 1, Foundation GNVQ 7
5or more O levels, 5+CSE’s (grade 1), 5+GCSE’s (grades A-C), School
Certificate
2 NVQ Level 2, Intermediate GNVQ 8
1 or more A levels/AS Levels 3 NVQ Level 3, Advanced GNVQ 9
2 or more A levels, 4+ AS levels, Higher School Certificate
4 NVQ 4-5, HNC, HND 10
First Degree (eg BA,BSc) 5
Other qualifications (eg City & Guilds, RSA/OCR, BTEC/Edexel)
11
Higher Degree (eg MA, PhD, PGCE, post-graduate certificates/diplomas)
6 No qualifications 12
27. Health
10. Over the last twelve months, would you say that on the whole your health has been? Please tick one box only
Excellent 1 Very good 2 Good 3 Fair 4 Poor 5
11.
Have you ever smoked cigarettes, cigars, or other tobacco products? Yes 1 No 2 If no, please go to question 15
12.
Which of the following statements best describes you? Please tick one box only
I smoke daily 1 I used to smoke daily but I do not
smoke at all now 3
I smoke occasionally but not every day
2 I used to smoke occasionally but I do
not smoke at all now 4
13.
Would you like to give up smoking altogether? Yes 1 No 2 If no, please go to question 15
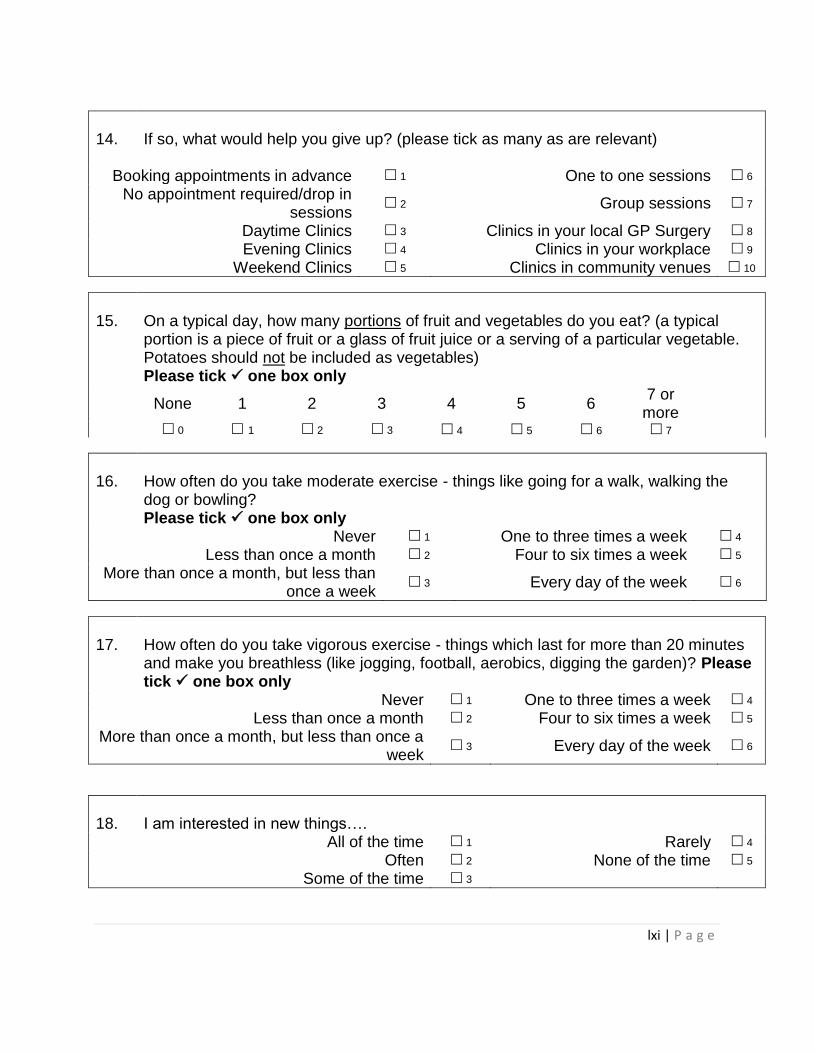
lxi | P a g e
14.
If so, what would help you give up? (please tick as many as are relevant)
Booking appointments in advance 1 One to one sessions 6
No appointment required/drop in sessions
2 Group sessions 7
Daytime Clinics 3 Clinics in your local GP Surgery 8
Evening Clinics 4 Clinics in your workplace 9
Weekend Clinics 5 Clinics in community venues 10
15.
On a typical day, how many portions of fruit and vegetables do you eat? (a typical portion is a piece of fruit or a glass of fruit juice or a serving of a particular vegetable. Potatoes should not be included as vegetables) Please tick one box only
None 1 2 3 4 5 6
7 or more
0 1 2 3 4 5 6 7
16.
How often do you take moderate exercise - things like going for a walk, walking the dog or bowling? Please tick one box only
Never 1 One to three times a week 4
Less than once a month 2 Four to six times a week 5
More than once a month, but less than once a week
3 Every day of the week 6
17.
How often do you take vigorous exercise - things which last for more than 20 minutes and make you breathless (like jogging, football, aerobics, digging the garden)? Please tick one box only
Never 1 One to three times a week 4
Less than once a month 2 Four to six times a week 5
More than once a month, but less than once a week
3 Every day of the week 6
18.
I am interested in new things….
All of the time 1 Rarely 4
Often 2 None of the time 5
Some of the time 3
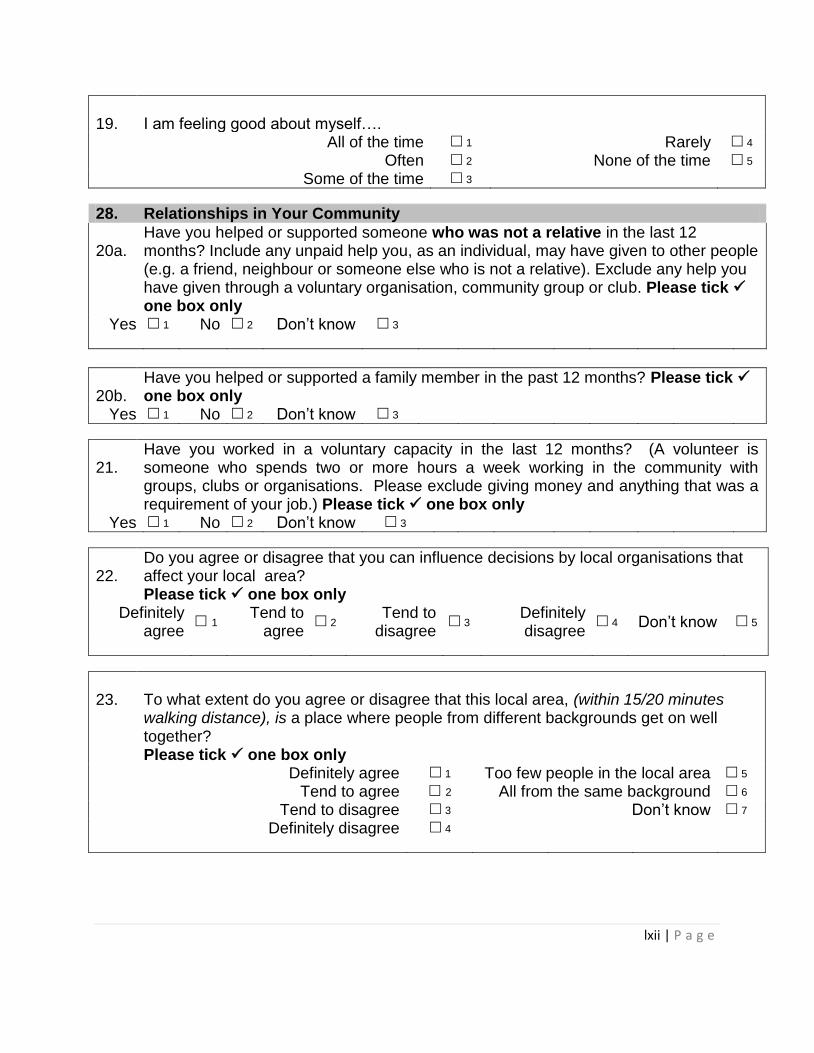
lxii | P a g e
19.
I am feeling good about myself….
All of the time 1 Rarely 4
Often 2 None of the time 5
Some of the time 3
28. Relationships in Your Community
20a.
Have you helped or supported someone who was not a relative in the last 12 months? Include any unpaid help you, as an individual, may have given to other people (e.g. a friend, neighbour or someone else who is not a relative). Exclude any help you have given through a voluntary organisation, community group or club. Please tick one box only
Yes 1 No 2 Don’t know 3
20b.
Have you helped or supported a family member in the past 12 months? Please tick one box only
Yes 1 No 2 Don’t know 3
21.
Have you worked in a voluntary capacity in the last 12 months? (A volunteer is someone who spends two or more hours a week working in the community with groups, clubs or organisations. Please exclude giving money and anything that was a requirement of your job.) Please tick one box only
Yes 1 No 2 Don’t know 3
22.
Do you agree or disagree that you can influence decisions by local organisations that affect your local area? Please tick one box only
Definitely agree
1 Tend to
agree 2
Tend to disagree
3 Definitely disagree
4 Don’t know 5
23.
To what extent do you agree or disagree that this local area, (within 15/20 minutes walking distance), is a place where people from different backgrounds get on well together? Please tick one box only
Definitely agree 1 Too few people in the local area 5
Tend to agree 2 All from the same background 6
Tend to disagree 3 Don’t know 7
Definitely disagree 4
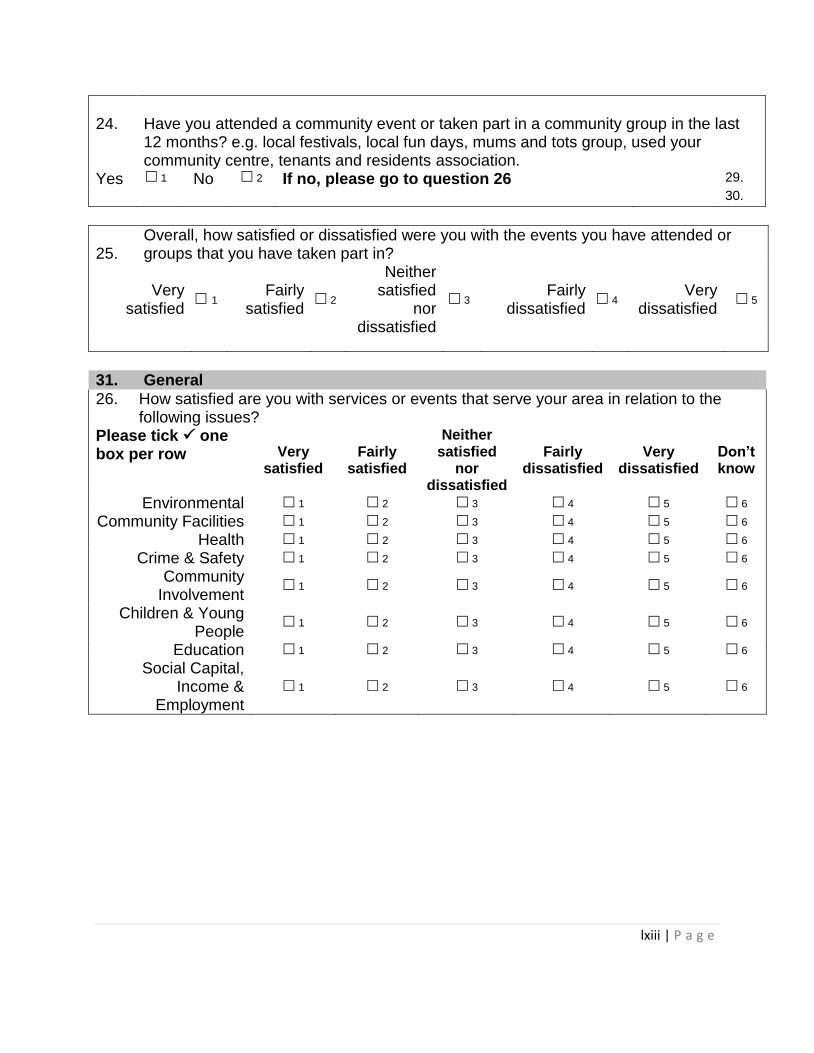
lxiii | P a g e
24.
Have you attended a community event or taken part in a community group in the last 12 months? e.g. local festivals, local fun days, mums and tots group, used your community centre, tenants and residents association.
Yes 1 No 2 If no, please go to question 26 29.
30.
25.
Overall, how satisfied or dissatisfied were you with the events you have attended or groups that you have taken part in?
Very satisfied
1 Fairly
satisfied 2
Neither satisfied
nor dissatisfied
3 Fairly
dissatisfied 4
Very dissatisfied
5
31. General
26. How satisfied are you with services or events that serve your area in relation to the following issues?
Please tick one box per row Very
satisfied Fairly
satisfied
Neither satisfied
nor dissatisfied
Fairly dissatisfied
Very dissatisfied
Don’t know
Environmental 1 2 3 4 5 6
Community Facilities 1 2 3 4 5 6
Health 1 2 3 4 5 6
Crime & Safety 1 2 3 4 5 6
Community Involvement
1 2 3 4 5 6
Children & Young People
1 2 3 4 5 6
Education 1 2 3 4 5 6
Social Capital, Income &
Employment
1 2 3 4 5 6

lxiv | P a g e
27.
Have you experienced any difficulties in accessing training and employment opportunities?
Yes 1 No 2 If no, please go to question 29 32.
33.
28.
If so, what were the difficulties you faced?
Lack of transport 1 Financial issues 5
Thought it would affect my benefits 2 The training opportunities
were not suitable for my level 6
Childcare issues 3
Other ………………………… …………………………………………………………………...
7
Did not know where to go to go to access these opportunities
4
29.
What one improvement would make the biggest difference in your community? Please tick one box only.
Improvements to the environment 1
Improvement to community facilities 2
Improvement in health services 3
Improvements in the area of crime and safety 4
Increased opportunities for community involvement
5
Increased opportunities and provision for children and young people
6
Improvements in education 7
Increased opportunities for learning and employment
8
30.
How would this one improvement make a difference?
------------------------------------------------------------------------------------------------------------------- ------------------------------------------------------------------------------------------------------------------- -------------------------------------------------------------------------------------------------------------------
lxv | P a g e
And finally…
34. Data Protection and Confidentiality
Only the Stronger Together in Warrington Team has access to personal information and this is held in the strictest confidence. When we publish results, we do not publish individual details or data, only aggregate information/ overall results (apart from written comments, where given, which always remain anonymous). Results will never contain your name or anything that could identify you and they will only be used for the specific purposes as outlined at the start of the survey. Please remember that you are not obliged to complete any question that you do not want to on this questionnaire – please just complete those that you are happy to answer and return it to us part-completed. All of the information you do provide through this questionnaire will be kept completely confidential and secure by the Stronger Together in Warrington Team. The ID number on the questionnaire allows us to match the answers you give with your personal characteristics (that you told us about on the Recruitment Questionnaire). We do this to make sure that the views of all types of people are represented and so we can see if certain neighbourhoods have specific requirements. The ID number is also used to identify you in the Prize Draw.
Many thanks for completing this survey. Please return in the
freepost envelope enclosed by the 20th March 2009 to ensure you are entered into
our free prize draw.
31.
What do you think of ‘Our Street’, the Stronger Together in Warrington newsletter?
------------------------------------------------------------------------------------------------------------------- ------------------------------------------------------------------------------------------------------------------- -------------------------------------------------------------------------------------------------------------------
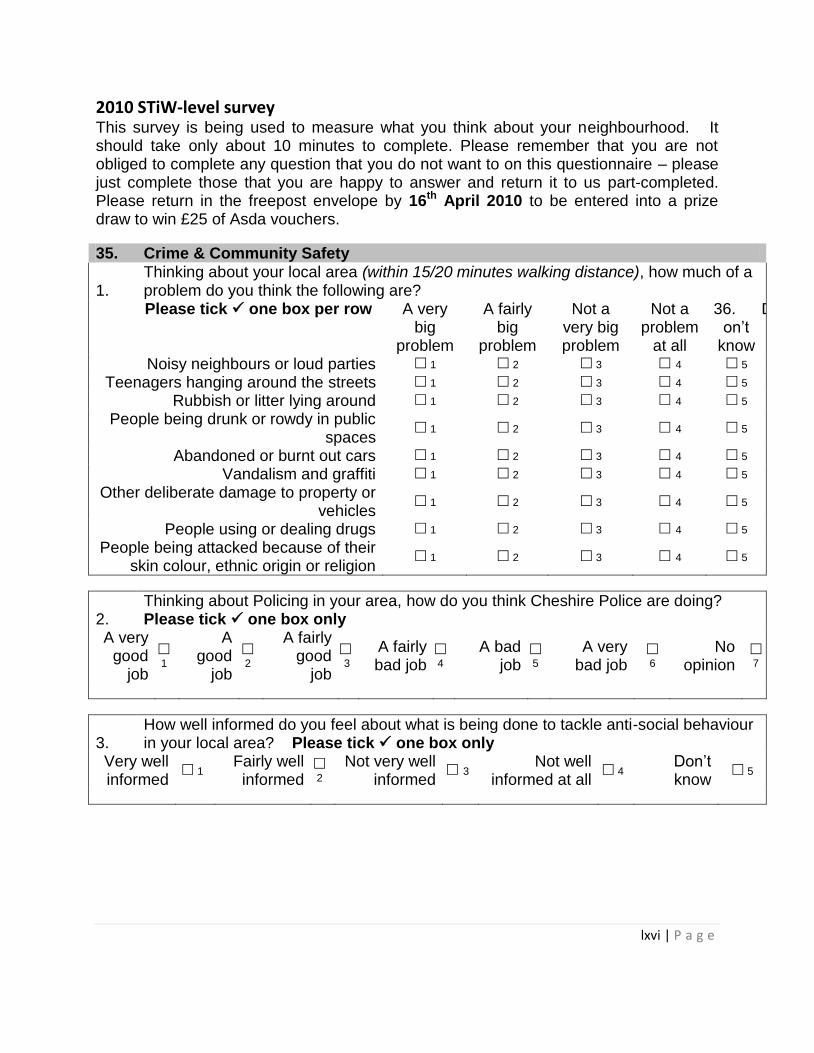
lxvi | P a g e
2010 STiW-level survey This survey is being used to measure what you think about your neighbourhood. It should take only about 10 minutes to complete. Please remember that you are not obliged to complete any question that you do not want to on this questionnaire – please just complete those that you are happy to answer and return it to us part-completed. Please return in the freepost envelope by 16th April 2010 to be entered into a prize draw to win £25 of Asda vouchers.
35. Crime & Community Safety
1.
Thinking about your local area (within 15/20 minutes walking distance), how much of a problem do you think the following are?
Please tick one box per row A very big
problem
A fairly big
problem
Not a very big problem
Not a problem
at all
36. Don’t
know Noisy neighbours or loud parties 1 2 3 4 5
Teenagers hanging around the streets 1 2 3 4 5
Rubbish or litter lying around 1 2 3 4 5
People being drunk or rowdy in public spaces
1 2 3 4 5
Abandoned or burnt out cars 1 2 3 4 5
Vandalism and graffiti 1 2 3 4 5
Other deliberate damage to property or vehicles
1 2 3 4 5
People using or dealing drugs 1 2 3 4 5
People being attacked because of their skin colour, ethnic origin or religion
1 2 3 4 5
2.
Thinking about Policing in your area, how do you think Cheshire Police are doing? Please tick one box only
A very good
job
1
A good
job
2
A fairly good
job
3
A fairly bad job
4
A bad job
5
A very bad job
6
No opinion
7
3.
How well informed do you feel about what is being done to tackle anti-social behaviour in your local area? Please tick one box only
Very well informed
1 Fairly well informed
2
Not very well informed
3 Not well
informed at all 4
Don’t know
5
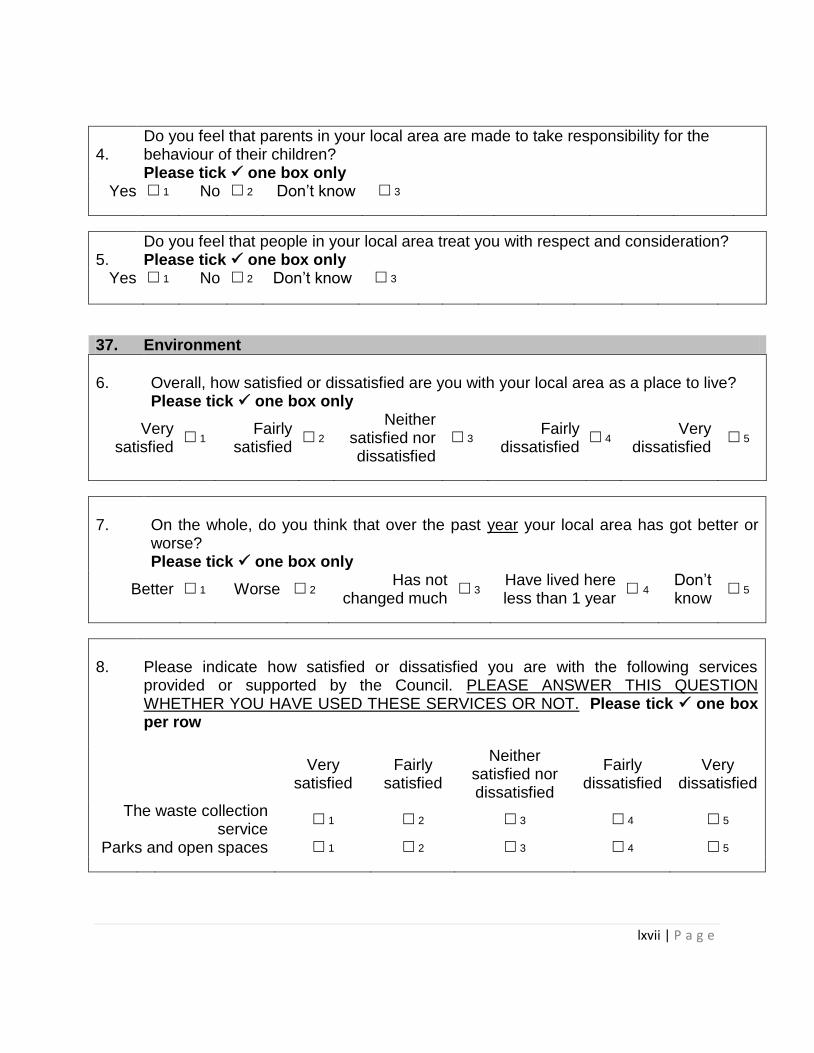
lxvii | P a g e
4.
Do you feel that parents in your local area are made to take responsibility for the behaviour of their children? Please tick one box only
Yes 1 No 2 Don’t know 3
5.
Do you feel that people in your local area treat you with respect and consideration? Please tick one box only
Yes 1 No 2 Don’t know 3
37. Environment
6.
Overall, how satisfied or dissatisfied are you with your local area as a place to live? Please tick one box only
Very satisfied
1 Fairly
satisfied 2
Neither satisfied nor dissatisfied
3 Fairly
dissatisfied 4
Very dissatisfied
5
7.
On the whole, do you think that over the past year your local area has got better or worse? Please tick one box only
Better 1 Worse 2 Has not
changed much 3
Have lived here less than 1 year
4 Don’t know
5
8.
Please indicate how satisfied or dissatisfied you are with the following services provided or supported by the Council. PLEASE ANSWER THIS QUESTION WHETHER YOU HAVE USED THESE SERVICES OR NOT. Please tick one box per row
Very satisfied
Fairly satisfied
Neither satisfied nor dissatisfied
Fairly dissatisfied
Very dissatisfied
The waste collection service
1 2 3 4 5
Parks and open spaces 1 2 3 4 5
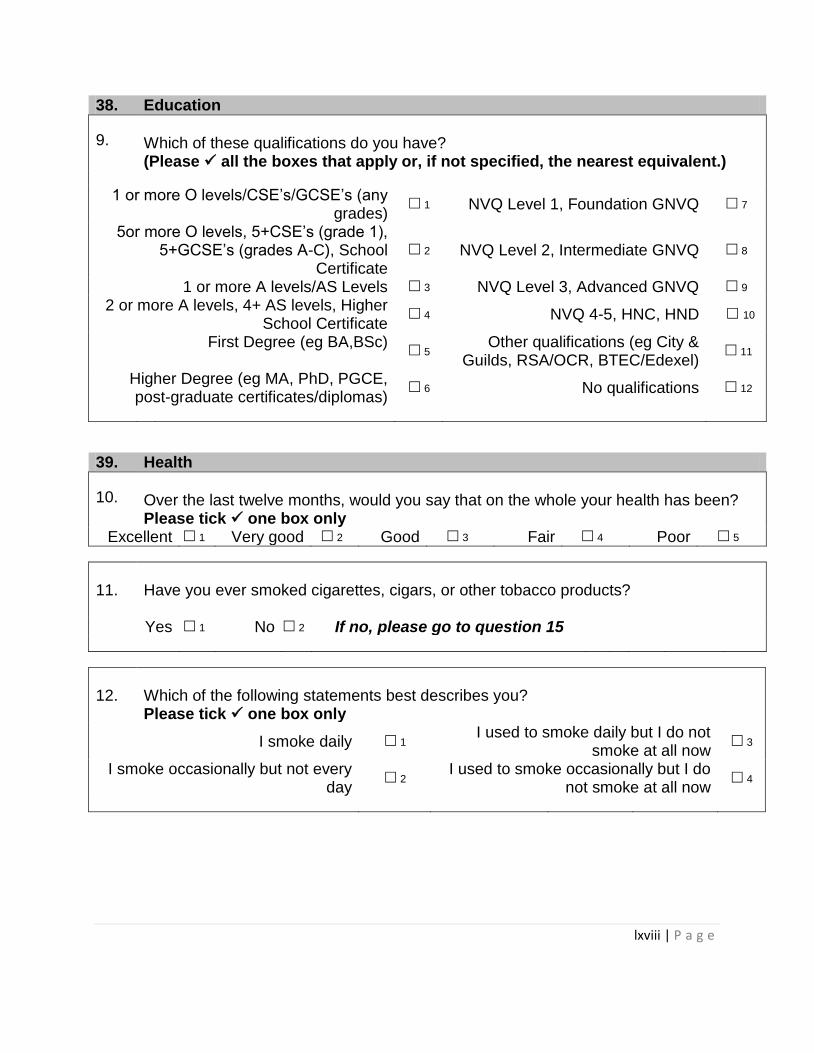
lxviii | P a g e
38. Education
9. Which of these qualifications do you have? (Please all the boxes that apply or, if not specified, the nearest equivalent.)
1 or more O levels/CSE’s/GCSE’s (any grades)
1 NVQ Level 1, Foundation GNVQ 7
5or more O levels, 5+CSE’s (grade 1), 5+GCSE’s (grades A-C), School
Certificate
2 NVQ Level 2, Intermediate GNVQ 8
1 or more A levels/AS Levels 3 NVQ Level 3, Advanced GNVQ 9
2 or more A levels, 4+ AS levels, Higher School Certificate
4 NVQ 4-5, HNC, HND 10
First Degree (eg BA,BSc) 5
Other qualifications (eg City & Guilds, RSA/OCR, BTEC/Edexel)
11
Higher Degree (eg MA, PhD, PGCE, post-graduate certificates/diplomas)
6 No qualifications 12
39. Health
10. Over the last twelve months, would you say that on the whole your health has been? Please tick one box only
Excellent 1 Very good 2 Good 3 Fair 4 Poor 5
11.
Have you ever smoked cigarettes, cigars, or other tobacco products? Yes 1 No 2 If no, please go to question 15
12.
Which of the following statements best describes you? Please tick one box only
I smoke daily 1 I used to smoke daily but I do not
smoke at all now 3
I smoke occasionally but not every day
2 I used to smoke occasionally but I do
not smoke at all now 4
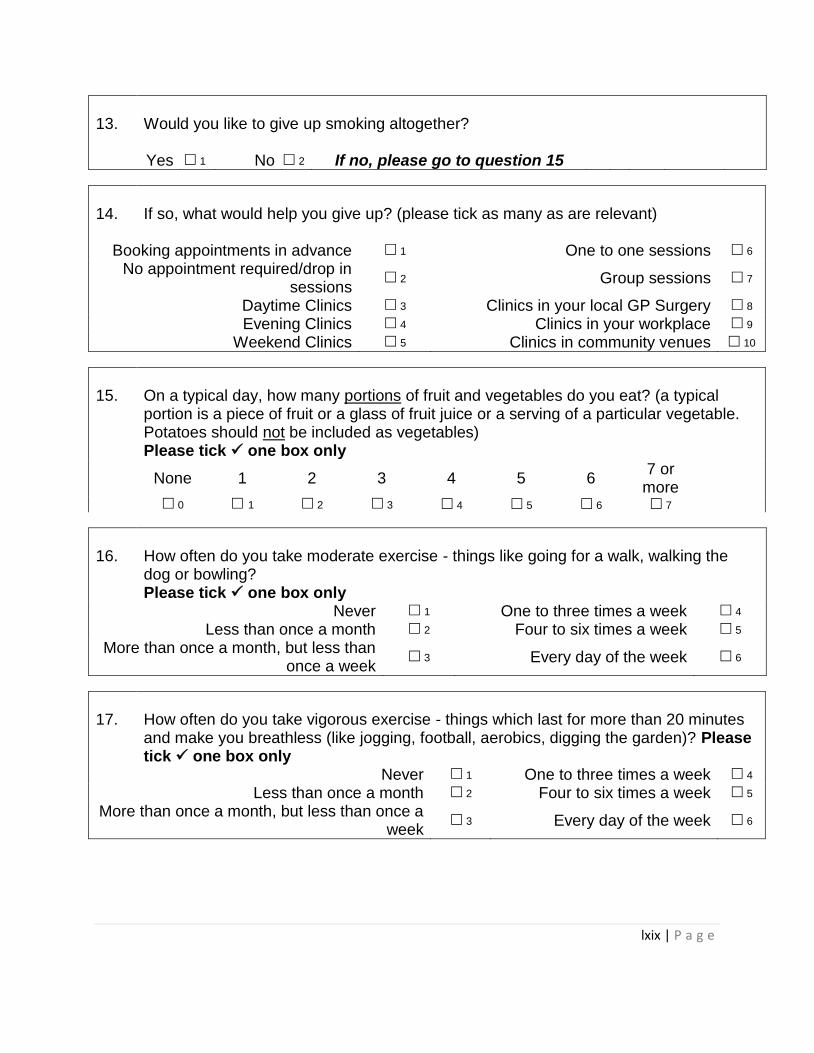
lxix | P a g e
13.
Would you like to give up smoking altogether? Yes 1 No 2 If no, please go to question 15
14.
If so, what would help you give up? (please tick as many as are relevant)
Booking appointments in advance 1 One to one sessions 6
No appointment required/drop in sessions
2 Group sessions 7
Daytime Clinics 3 Clinics in your local GP Surgery 8
Evening Clinics 4 Clinics in your workplace 9
Weekend Clinics 5 Clinics in community venues 10
15.
On a typical day, how many portions of fruit and vegetables do you eat? (a typical portion is a piece of fruit or a glass of fruit juice or a serving of a particular vegetable. Potatoes should not be included as vegetables) Please tick one box only
None 1 2 3 4 5 6
7 or more
0 1 2 3 4 5 6 7
16.
How often do you take moderate exercise - things like going for a walk, walking the dog or bowling? Please tick one box only
Never 1 One to three times a week 4
Less than once a month 2 Four to six times a week 5
More than once a month, but less than once a week
3 Every day of the week 6
17.
How often do you take vigorous exercise - things which last for more than 20 minutes and make you breathless (like jogging, football, aerobics, digging the garden)? Please tick one box only
Never 1 One to three times a week 4
Less than once a month 2 Four to six times a week 5
More than once a month, but less than once a week
3 Every day of the week 6
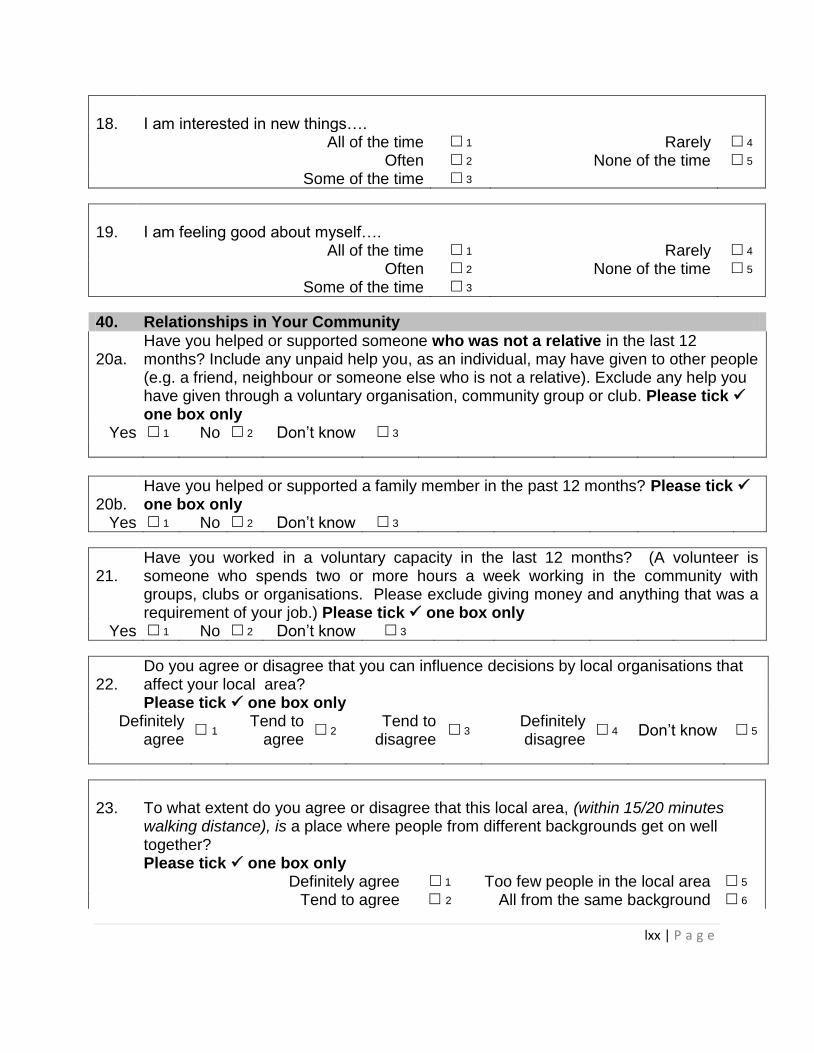
lxx | P a g e
18.
I am interested in new things….
All of the time 1 Rarely 4
Often 2 None of the time 5
Some of the time 3
19.
I am feeling good about myself….
All of the time 1 Rarely 4
Often 2 None of the time 5
Some of the time 3
40. Relationships in Your Community
20a.
Have you helped or supported someone who was not a relative in the last 12 months? Include any unpaid help you, as an individual, may have given to other people (e.g. a friend, neighbour or someone else who is not a relative). Exclude any help you have given through a voluntary organisation, community group or club. Please tick one box only
Yes 1 No 2 Don’t know 3
20b.
Have you helped or supported a family member in the past 12 months? Please tick one box only
Yes 1 No 2 Don’t know 3
21.
Have you worked in a voluntary capacity in the last 12 months? (A volunteer is someone who spends two or more hours a week working in the community with groups, clubs or organisations. Please exclude giving money and anything that was a requirement of your job.) Please tick one box only
Yes 1 No 2 Don’t know 3
22.
Do you agree or disagree that you can influence decisions by local organisations that affect your local area? Please tick one box only
Definitely agree
1 Tend to
agree 2
Tend to disagree
3 Definitely disagree
4 Don’t know 5
23.
To what extent do you agree or disagree that this local area, (within 15/20 minutes walking distance), is a place where people from different backgrounds get on well together? Please tick one box only
Definitely agree 1 Too few people in the local area 5
Tend to agree 2 All from the same background 6
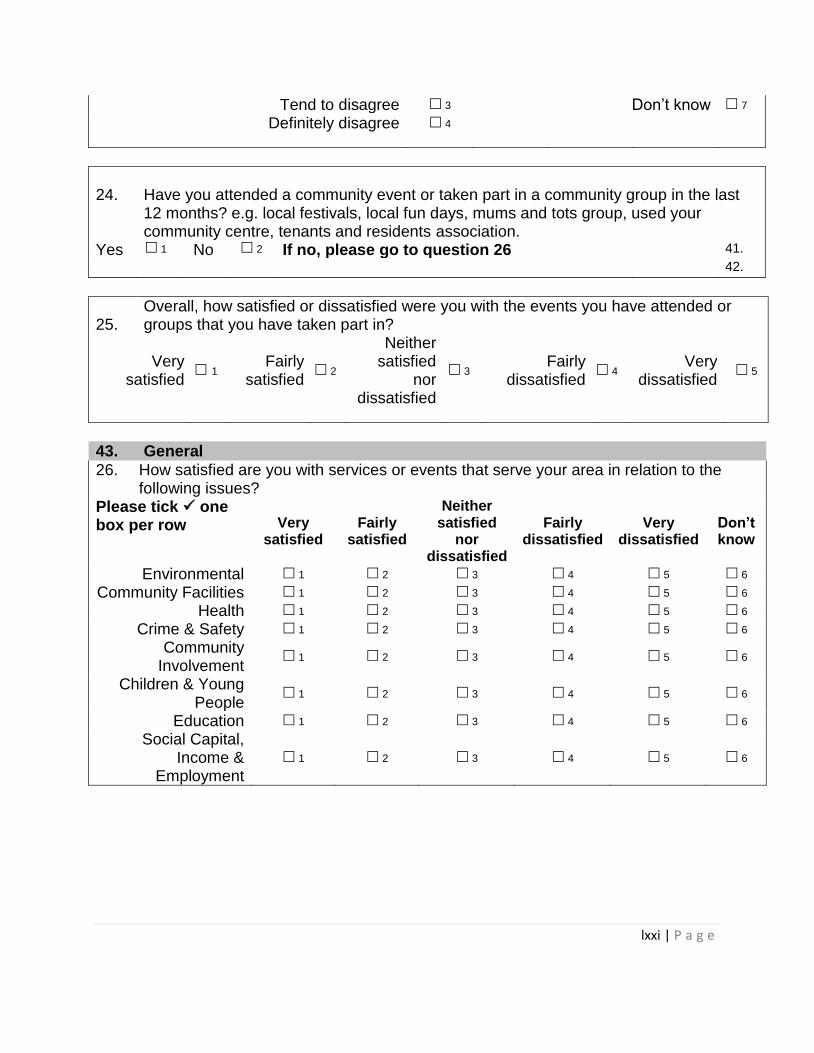
lxxi | P a g e
Tend to disagree 3 Don’t know 7
Definitely disagree 4
24.
Have you attended a community event or taken part in a community group in the last 12 months? e.g. local festivals, local fun days, mums and tots group, used your community centre, tenants and residents association.
Yes 1 No 2 If no, please go to question 26 41.
42.
25.
Overall, how satisfied or dissatisfied were you with the events you have attended or groups that you have taken part in?
Very satisfied
1 Fairly
satisfied 2
Neither satisfied
nor dissatisfied
3 Fairly
dissatisfied 4
Very dissatisfied
5
43. General
26. How satisfied are you with services or events that serve your area in relation to the following issues?
Please tick one box per row Very
satisfied Fairly
satisfied
Neither satisfied
nor dissatisfied
Fairly dissatisfied
Very dissatisfied
Don’t know
Environmental 1 2 3 4 5 6
Community Facilities 1 2 3 4 5 6
Health 1 2 3 4 5 6
Crime & Safety 1 2 3 4 5 6
Community Involvement
1 2 3 4 5 6
Children & Young People
1 2 3 4 5 6
Education 1 2 3 4 5 6
Social Capital, Income &
Employment
1 2 3 4 5 6
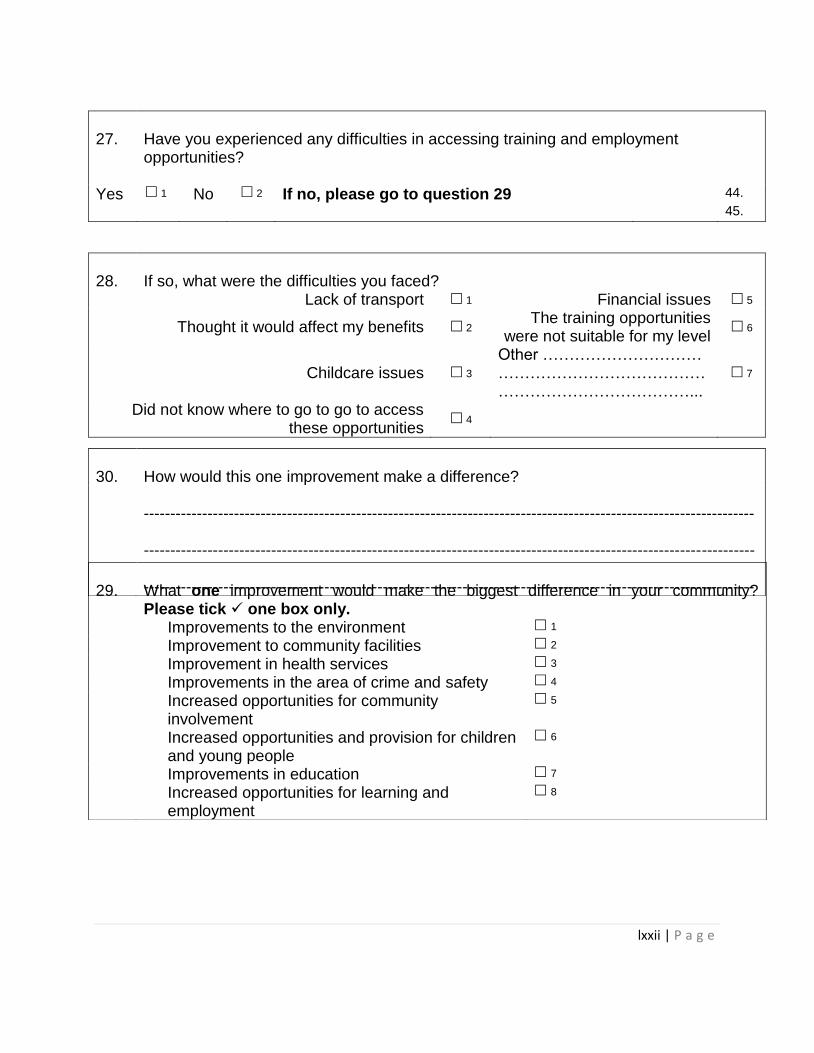
lxxii | P a g e
27.
Have you experienced any difficulties in accessing training and employment opportunities?
Yes 1 No 2 If no, please go to question 29 44.
45.
28.
If so, what were the difficulties you faced?
Lack of transport 1 Financial issues 5
Thought it would affect my benefits 2 The training opportunities
were not suitable for my level 6
Childcare issues 3
Other ………………………… …………………………………………………………………...
7
Did not know where to go to go to access these opportunities
4
29.
What one improvement would make the biggest difference in your community? Please tick one box only.
Improvements to the environment 1
Improvement to community facilities 2
Improvement in health services 3
Improvements in the area of crime and safety 4
Increased opportunities for community involvement
5
Increased opportunities and provision for children and young people
6
Improvements in education 7
Increased opportunities for learning and employment
8
30.
How would this one improvement make a difference?
------------------------------------------------------------------------------------------------------------------- ------------------------------------------------------------------------------------------------------------------- -------------------------------------------------------------------------------------------------------------------

lxxiii | P a g e
And finally…
46. Data Protection and Confidentiality
Only the Stronger Together in Warrington Team has access to personal information and this is held in the strictest confidence. When we publish results, we do not publish individual details or data, only aggregate information / overall results (apart from written comments, where given, which always remain anonymous). Results will never contain your name or anything that could identify you and they will only be used for the specific purposes as outlined at the start of the survey. Please remember that you are not obliged to complete any question that you do not want to on this questionnaire – please just complete those that you are happy to answer and return it to us part-completed. All of the information you do provide through this questionnaire will be kept completely confidential and secure by the Stronger Together in Warrington Team. The ID number on the questionnaire allows us to match the answers you give with your personal characteristics (that you told us about on the Recruitment Questionnaire). We do this to make sure that the views of all types of people are represented and so we can see if certain neighbourhoods have specific requirements. The ID number is also used to identify you in the Prize Draw.
Many thanks for completing this survey. Please return in the
freepost envelope enclosed by the 16th April 2010 to ensure you are entered into
our free prize draw.
31.
What do you think of ‘Our Street’, the Stronger Together in Warrington newsletter?
------------------------------------------------------------------------------------------------------------------- ------------------------------------------------------------------------------------------------------------------- -------------------------------------------------------------------------------------------------------------------
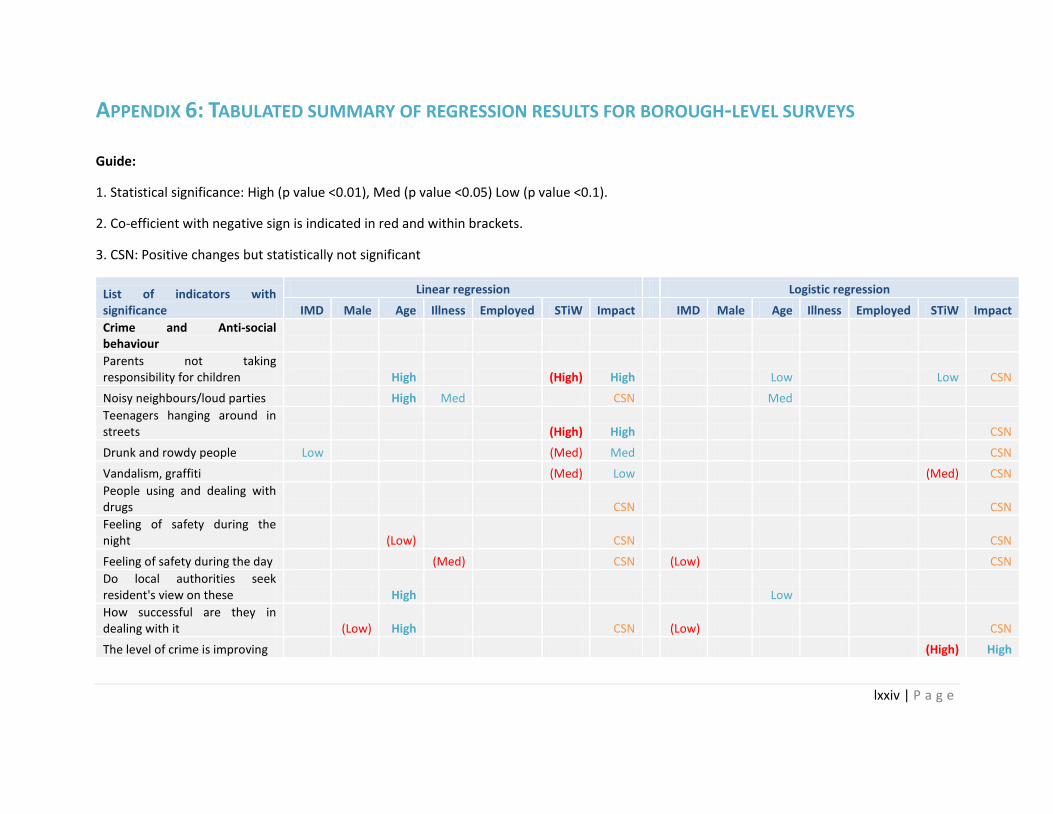
lxxiv | P a g e
APPENDIX 6: TABULATED SUMMARY OF REGRESSION RESULTS FOR BOROUGH-LEVEL SURVEYS
Guide:
1. Statistical significance: High (p value <0.01), Med (p value <0.05) Low (p value <0.1).
2. Co-efficient with negative sign is indicated in red and within brackets.
3. CSN: Positive changes but statistically not significant
List of indicators with significance
Linear regression Logistic regression
IMD Male Age Illness Employed STiW Impact IMD Male Age Illness Employed STiW Impact
Crime and Anti-social behaviour
Parents not taking responsibility for children High (High) High Low Low CSN
Noisy neighbours/loud parties High Med CSN Med
Teenagers hanging around in streets (High) High CSN
Drunk and rowdy people Low (Med) Med CSN
Vandalism, graffiti (Med) Low (Med) CSN
People using and dealing with drugs CSN CSN
Feeling of safety during the night (Low) CSN CSN
Feeling of safety during the day (Med) CSN (Low) CSN
Do local authorities seek resident's view on these High Low
How successful are they in dealing with it (Low) High CSN (Low) CSN
The level of crime is improving (High) High

lxxv | P a g e
List of indicators with significance
Linear regression Logistic regression
IMD Male Age Illness Employed STiW Impact IMD Male Age Illness Employed STiW Impact
Does council efforts make the area safer Med (Med) CSN Med CSN
Overall satisfaction with the area living currently Med CSN
Involvement and empowerment of residents
Ability to influence decisions in local area Low CSN
Would residents liked to be involved in local decision making High Low High (Med) Med High (Med)
amount of unpaid help/volunteering work CSN
Informed about getting involved in local decision making Med High Low Low (Low)
Informed about way council spends its money Med (Low) CSN
Informed about standard of services to be expected High (Low) CSN
Informed about performance of council services High (Med) (Med) CSN
Effectiveness of council services and satisfaction with them
Overall satisfaction with Personal social services Med Low
Overall satisfaction with fire and rescue services (High)
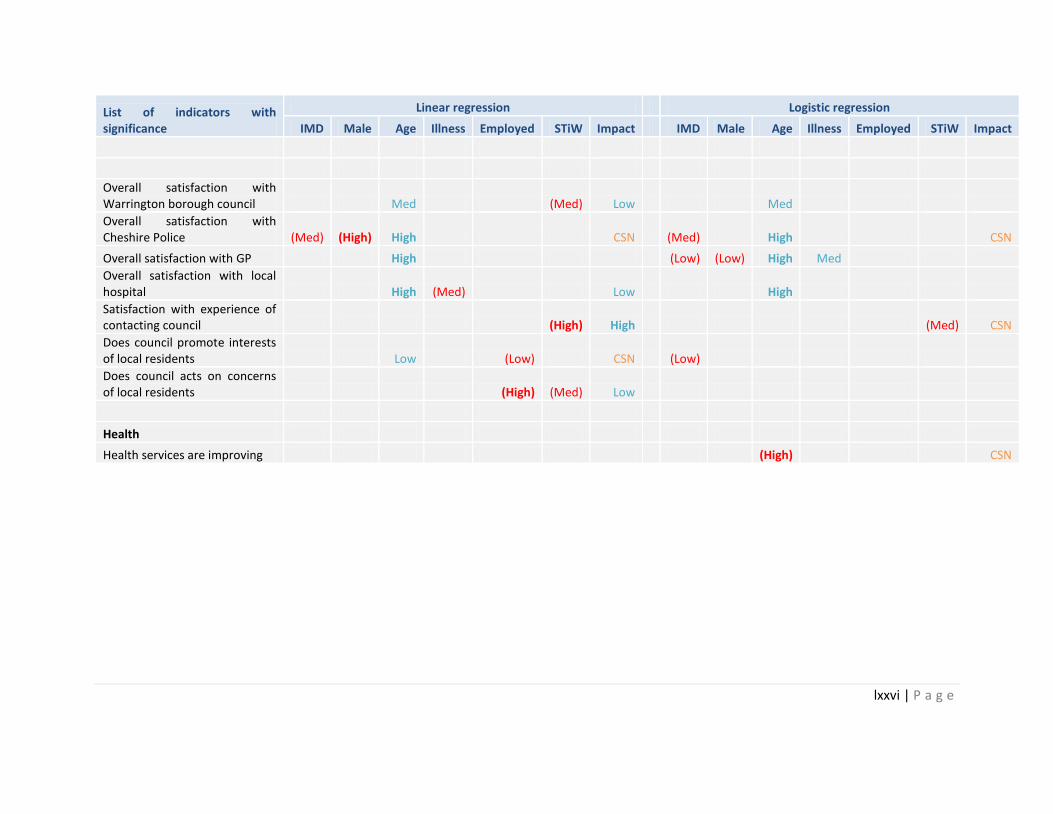
lxxvi | P a g e
List of indicators with significance
Linear regression Logistic regression
IMD Male Age Illness Employed STiW Impact IMD Male Age Illness Employed STiW Impact
Overall satisfaction with Warrington borough council Med (Med) Low Med
Overall satisfaction with Cheshire Police (Med) (High) High CSN (Med) High CSN
Overall satisfaction with GP High (Low) (Low) High Med
Overall satisfaction with local hospital High (Med) Low High
Satisfaction with experience of contacting council (High) High (Med) CSN
Does council promote interests of local residents Low (Low) CSN (Low)
Does council acts on concerns of local residents (High) (Med) Low
Health
Health services are improving (High) CSN
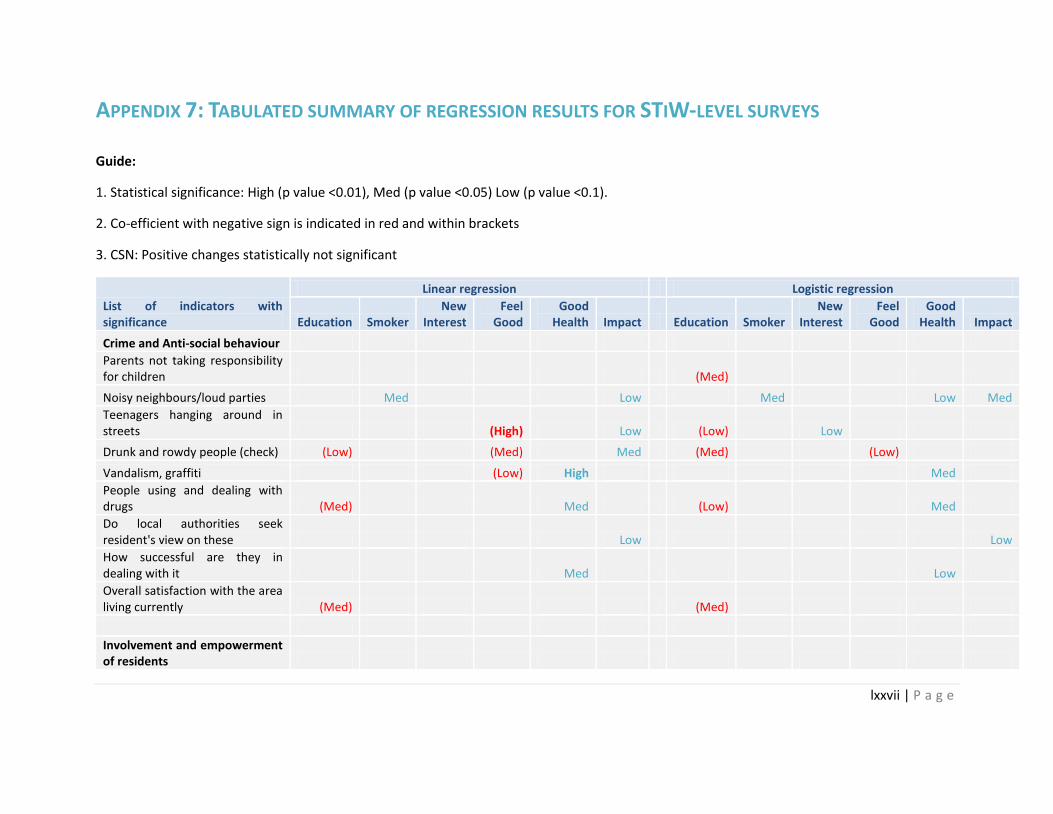
lxxvii | P a g e
APPENDIX 7: TABULATED SUMMARY OF REGRESSION RESULTS FOR STIW-LEVEL SURVEYS
Guide:
1. Statistical significance: High (p value <0.01), Med (p value <0.05) Low (p value <0.1).
2. Co-efficient with negative sign is indicated in red and within brackets
3. CSN: Positive changes statistically not significant
List of indicators with significance
Linear regression Logistic regression
Education Smoker New
Interest Feel
Good Good
Health Impact Education Smoker New
Interest Feel
Good Good
Health Impact
Crime and Anti-social behaviour
Parents not taking responsibility for children (Med)
Noisy neighbours/loud parties Med Low Med Low Med
Teenagers hanging around in streets (High) Low (Low) Low
Drunk and rowdy people (check) (Low) (Med) Med (Med) (Low)
Vandalism, graffiti (Low) High Med
People using and dealing with drugs (Med) Med (Low) Med
Do local authorities seek resident's view on these Low Low
How successful are they in dealing with it Med Low
Overall satisfaction with the area living currently (Med) (Med)
Involvement and empowerment of residents
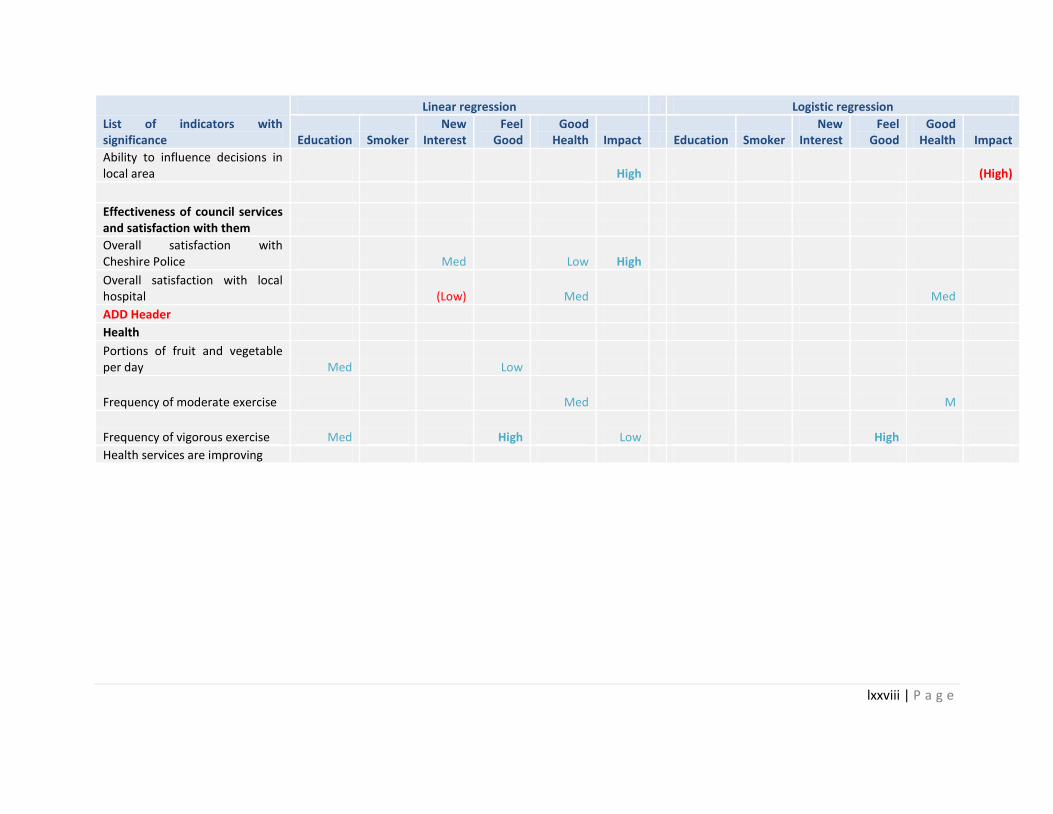
lxxviii | P a g e
List of indicators with significance
Linear regression Logistic regression
Education Smoker New
Interest Feel
Good Good
Health Impact Education Smoker New
Interest Feel
Good Good
Health Impact
Ability to influence decisions in local area High (High)
Effectiveness of council services and satisfaction with them
Overall satisfaction with Cheshire Police Med Low High
Overall satisfaction with local hospital (Low) Med Med
ADD Header
Health
Portions of fruit and vegetable per day Med Low
Frequency of moderate exercise Med M
Frequency of vigorous exercise Med High Low High
Health services are improving
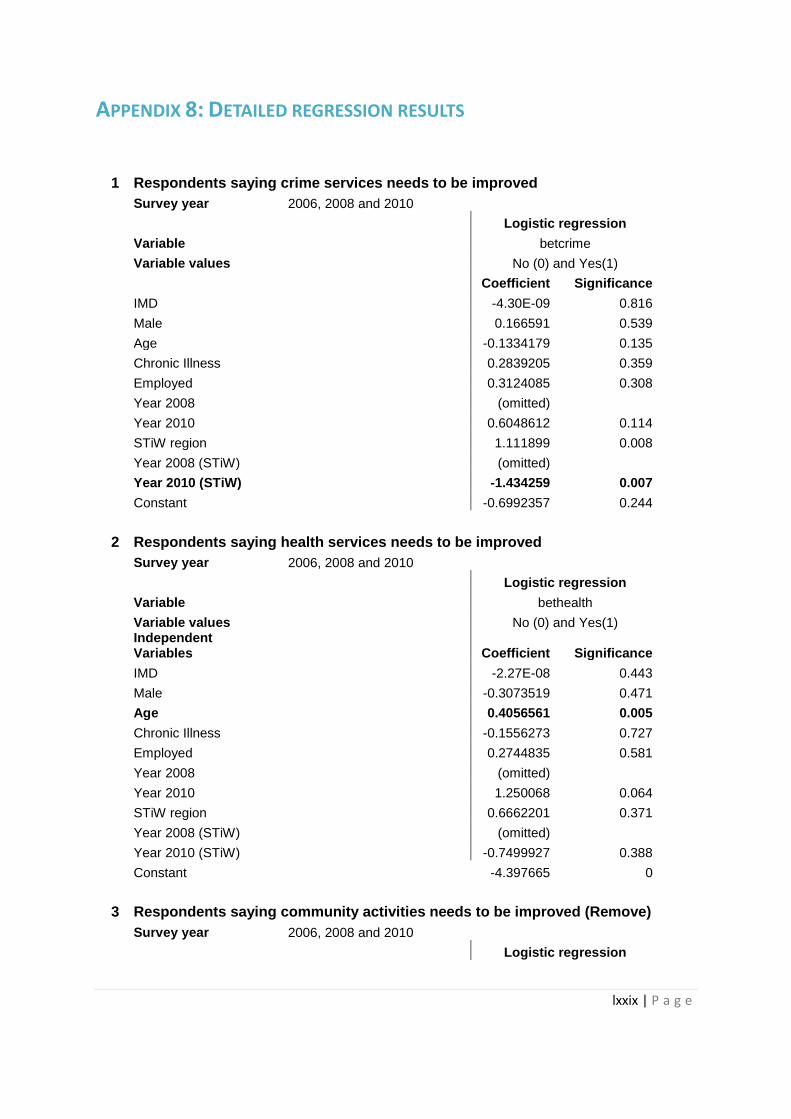
lxxix | P a g e
APPENDIX 8: DETAILED REGRESSION RESULTS
1 Respondents saying crime services needs to be improved
Survey year 2006, 2008 and 2010
Logistic regression
Variable
betcrime
Variable values
No (0) and Yes(1)
Coefficient Significance
IMD
-4.30E-09 0.816
Male
0.166591 0.539
Age
-0.1334179 0.135
Chronic Illness
0.2839205 0.359
Employed
0.3124085 0.308
Year 2008
(omitted)
Year 2010
0.6048612 0.114
STiW region
1.111899 0.008
Year 2008 (STiW)
(omitted)
Year 2010 (STiW)
-1.434259 0.007
Constant
-0.6992357 0.244
2 Respondents saying health services needs to be improved
Survey year 2006, 2008 and 2010
Logistic regression
Variable
bethealth
Variable values
No (0) and Yes(1)
Independent Variables
Coefficient Significance
IMD
-2.27E-08 0.443
Male
-0.3073519 0.471
Age
0.4056561 0.005
Chronic Illness
-0.1556273 0.727
Employed
0.2744835 0.581
Year 2008
(omitted)
Year 2010
1.250068 0.064
STiW region
0.6662201 0.371
Year 2008 (STiW)
(omitted)
Year 2010 (STiW)
-0.7499927 0.388
Constant
-4.397665 0
3 Respondents saying community activities needs to be improved (Remove)
Survey year 2006, 2008 and 2010
Logistic regression
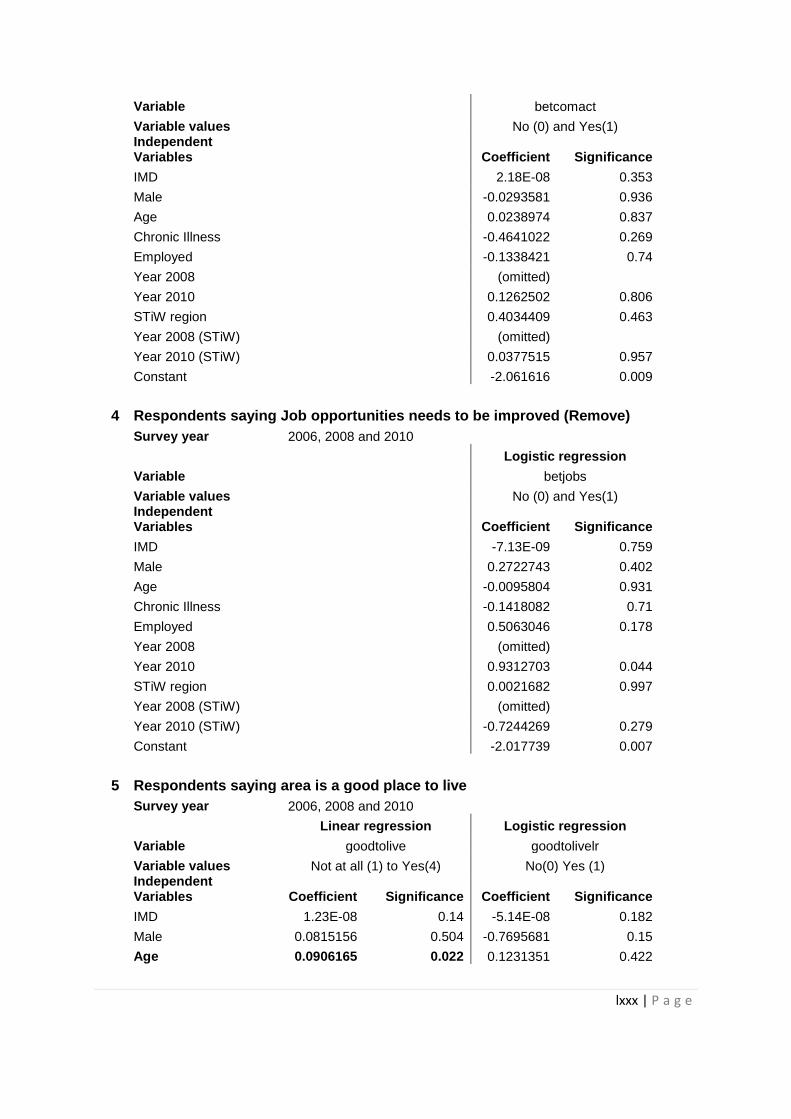
lxxx | P a g e
Variable
betcomact
Variable values
No (0) and Yes(1)
Independent Variables
Coefficient Significance
IMD
2.18E-08 0.353
Male
-0.0293581 0.936
Age
0.0238974 0.837
Chronic Illness
-0.4641022 0.269
Employed
-0.1338421 0.74
Year 2008
(omitted)
Year 2010
0.1262502 0.806
STiW region
0.4034409 0.463
Year 2008 (STiW)
(omitted)
Year 2010 (STiW)
0.0377515 0.957
Constant
-2.061616 0.009
4 Respondents saying Job opportunities needs to be improved (Remove)
Survey year 2006, 2008 and 2010
Logistic regression
Variable
betjobs
Variable values
No (0) and Yes(1)
Independent Variables
Coefficient Significance
IMD
-7.13E-09 0.759
Male
0.2722743 0.402
Age
-0.0095804 0.931
Chronic Illness
-0.1418082 0.71
Employed
0.5063046 0.178
Year 2008
(omitted)
Year 2010
0.9312703 0.044
STiW region
0.0021682 0.997
Year 2008 (STiW)
(omitted)
Year 2010 (STiW)
-0.7244269 0.279
Constant
-2.017739 0.007
5 Respondents saying area is a good place to live
Survey year 2006, 2008 and 2010
Linear regression Logistic regression
Variable goodtolive goodtolivelr
Variable values Not at all (1) to Yes(4) No(0) Yes (1)
Independent Variables Coefficient Significance Coefficient Significance
IMD 1.23E-08 0.14 -5.14E-08 0.182
Male 0.0815156 0.504 -0.7695681 0.15
Age 0.0906165 0.022 0.1231351 0.422
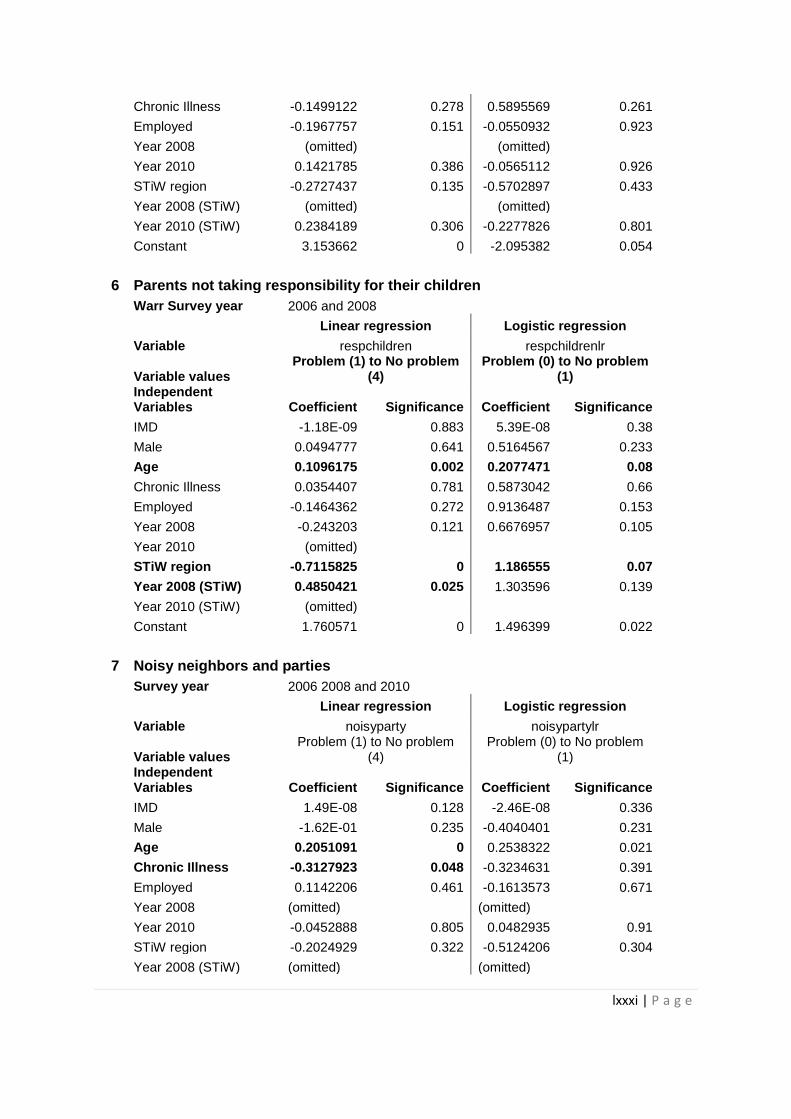
lxxxi | P a g e
Chronic Illness -0.1499122 0.278 0.5895569 0.261
Employed -0.1967757 0.151 -0.0550932 0.923
Year 2008 (omitted) (omitted)
Year 2010 0.1421785 0.386 -0.0565112 0.926
STiW region -0.2727437 0.135 -0.5702897 0.433
Year 2008 (STiW) (omitted) (omitted)
Year 2010 (STiW) 0.2384189 0.306 -0.2277826 0.801
Constant 3.153662 0 -2.095382 0.054
6 Parents not taking responsibility for their children
Warr Survey year 2006 and 2008
Linear regression Logistic regression
Variable respchildren respchildrenlr
Variable values
Problem (1) to No problem (4)
Problem (0) to No problem (1)
Independent Variables Coefficient Significance Coefficient Significance
IMD -1.18E-09 0.883 5.39E-08 0.38
Male 0.0494777 0.641 0.5164567 0.233
Age 0.1096175 0.002 0.2077471 0.08
Chronic Illness 0.0354407 0.781 0.5873042 0.66
Employed -0.1464362 0.272 0.9136487 0.153
Year 2008 -0.243203 0.121 0.6676957 0.105
Year 2010 (omitted)
STiW region -0.7115825 0 1.186555 0.07
Year 2008 (STiW) 0.4850421 0.025 1.303596 0.139
Year 2010 (STiW) (omitted)
Constant 1.760571 0 1.496399 0.022
7 Noisy neighbors and parties
Survey year 2006 2008 and 2010
Linear regression Logistic regression
Variable noisyparty noisypartylr
Variable values
Problem (1) to No problem (4)
Problem (0) to No problem (1)
Independent Variables Coefficient Significance Coefficient Significance
IMD 1.49E-08 0.128 -2.46E-08 0.336
Male -1.62E-01 0.235 -0.4040401 0.231
Age 0.2051091 0 0.2538322 0.021
Chronic Illness -0.3127923 0.048 -0.3234631 0.391
Employed 0.1142206 0.461 -0.1613573 0.671
Year 2008 (omitted) (omitted)
Year 2010 -0.0452888 0.805 0.0482935 0.91
STiW region -0.2024929 0.322 -0.5124206 0.304
Year 2008 (STiW) (omitted) (omitted)
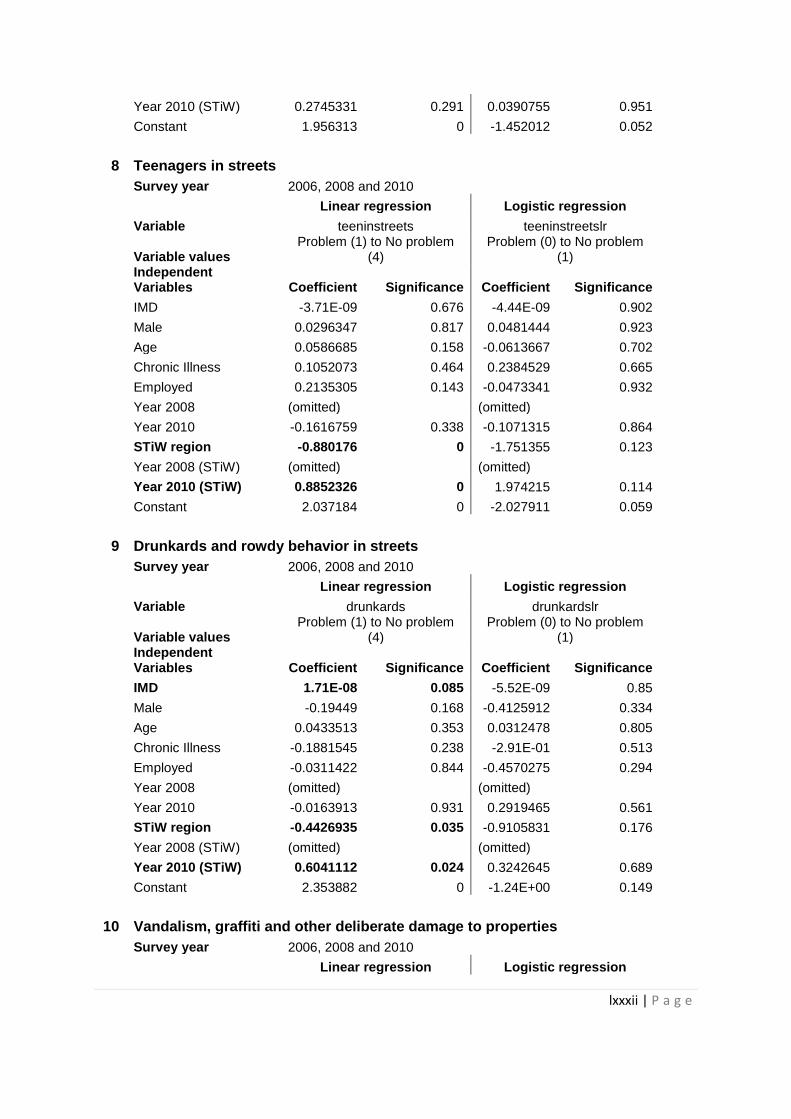
lxxxii | P a g e
Year 2010 (STiW) 0.2745331 0.291 0.0390755 0.951
Constant 1.956313 0 -1.452012 0.052
8 Teenagers in streets
Survey year 2006, 2008 and 2010
Linear regression Logistic regression
Variable teeninstreets teeninstreetslr
Variable values
Problem (1) to No problem (4)
Problem (0) to No problem (1)
Independent Variables Coefficient Significance Coefficient Significance
IMD -3.71E-09 0.676 -4.44E-09 0.902
Male 0.0296347 0.817 0.0481444 0.923
Age 0.0586685 0.158 -0.0613667 0.702
Chronic Illness 0.1052073 0.464 0.2384529 0.665
Employed 0.2135305 0.143 -0.0473341 0.932
Year 2008 (omitted) (omitted)
Year 2010 -0.1616759 0.338 -0.1071315 0.864
STiW region -0.880176 0 -1.751355 0.123
Year 2008 (STiW) (omitted) (omitted)
Year 2010 (STiW) 0.8852326 0 1.974215 0.114
Constant 2.037184 0 -2.027911 0.059
9 Drunkards and rowdy behavior in streets
Survey year 2006, 2008 and 2010
Linear regression Logistic regression
Variable drunkards drunkardslr
Variable values
Problem (1) to No problem (4)
Problem (0) to No problem (1)
Independent Variables Coefficient Significance Coefficient Significance
IMD 1.71E-08 0.085 -5.52E-09 0.85
Male -0.19449 0.168 -0.4125912 0.334
Age 0.0433513 0.353 0.0312478 0.805
Chronic Illness -0.1881545 0.238 -2.91E-01 0.513
Employed -0.0311422 0.844 -0.4570275 0.294
Year 2008 (omitted) (omitted)
Year 2010 -0.0163913 0.931 0.2919465 0.561
STiW region -0.4426935 0.035 -0.9105831 0.176
Year 2008 (STiW) (omitted) (omitted)
Year 2010 (STiW) 0.6041112 0.024 0.3242645 0.689
Constant 2.353882 0 -1.24E+00 0.149
10 Vandalism, graffiti and other deliberate damage to properties
Survey year 2006, 2008 and 2010
Linear regression Logistic regression
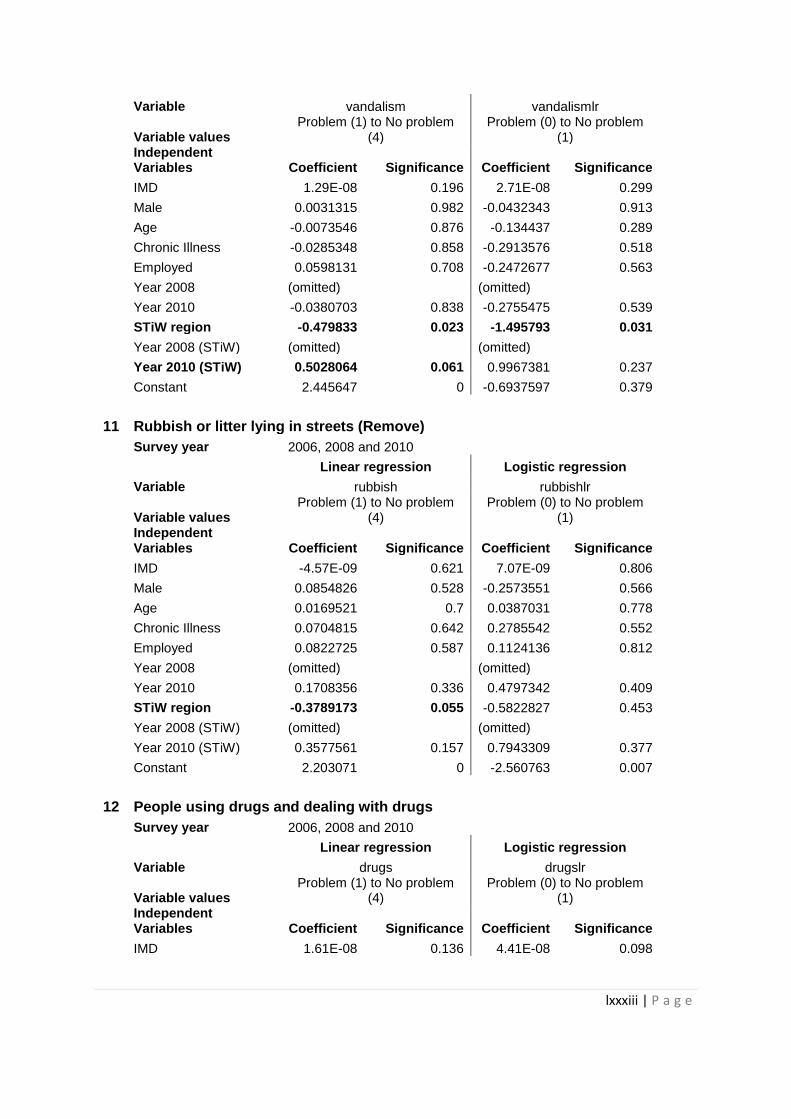
lxxxiii | P a g e
Variable vandalism vandalismlr
Variable values
Problem (1) to No problem (4)
Problem (0) to No problem (1)
Independent Variables Coefficient Significance Coefficient Significance
IMD 1.29E-08 0.196 2.71E-08 0.299
Male 0.0031315 0.982 -0.0432343 0.913
Age -0.0073546 0.876 -0.134437 0.289
Chronic Illness -0.0285348 0.858 -0.2913576 0.518
Employed 0.0598131 0.708 -0.2472677 0.563
Year 2008 (omitted) (omitted)
Year 2010 -0.0380703 0.838 -0.2755475 0.539
STiW region -0.479833 0.023 -1.495793 0.031
Year 2008 (STiW) (omitted) (omitted)
Year 2010 (STiW) 0.5028064 0.061 0.9967381 0.237
Constant 2.445647 0 -0.6937597 0.379
11 Rubbish or litter lying in streets (Remove)
Survey year 2006, 2008 and 2010
Linear regression Logistic regression
Variable rubbish rubbishlr
Variable values
Problem (1) to No problem (4)
Problem (0) to No problem (1)
Independent Variables Coefficient Significance Coefficient Significance
IMD -4.57E-09 0.621 7.07E-09 0.806
Male 0.0854826 0.528 -0.2573551 0.566
Age 0.0169521 0.7 0.0387031 0.778
Chronic Illness 0.0704815 0.642 0.2785542 0.552
Employed 0.0822725 0.587 0.1124136 0.812
Year 2008 (omitted) (omitted)
Year 2010 0.1708356 0.336 0.4797342 0.409
STiW region -0.3789173 0.055 -0.5822827 0.453
Year 2008 (STiW) (omitted) (omitted)
Year 2010 (STiW) 0.3577561 0.157 0.7943309 0.377
Constant 2.203071 0 -2.560763 0.007
12 People using drugs and dealing with drugs
Survey year 2006, 2008 and 2010
Linear regression Logistic regression
Variable drugs drugslr
Variable values
Problem (1) to No problem (4)
Problem (0) to No problem (1)
Independent Variables Coefficient Significance Coefficient Significance
IMD 1.61E-08 0.136 4.41E-08 0.098
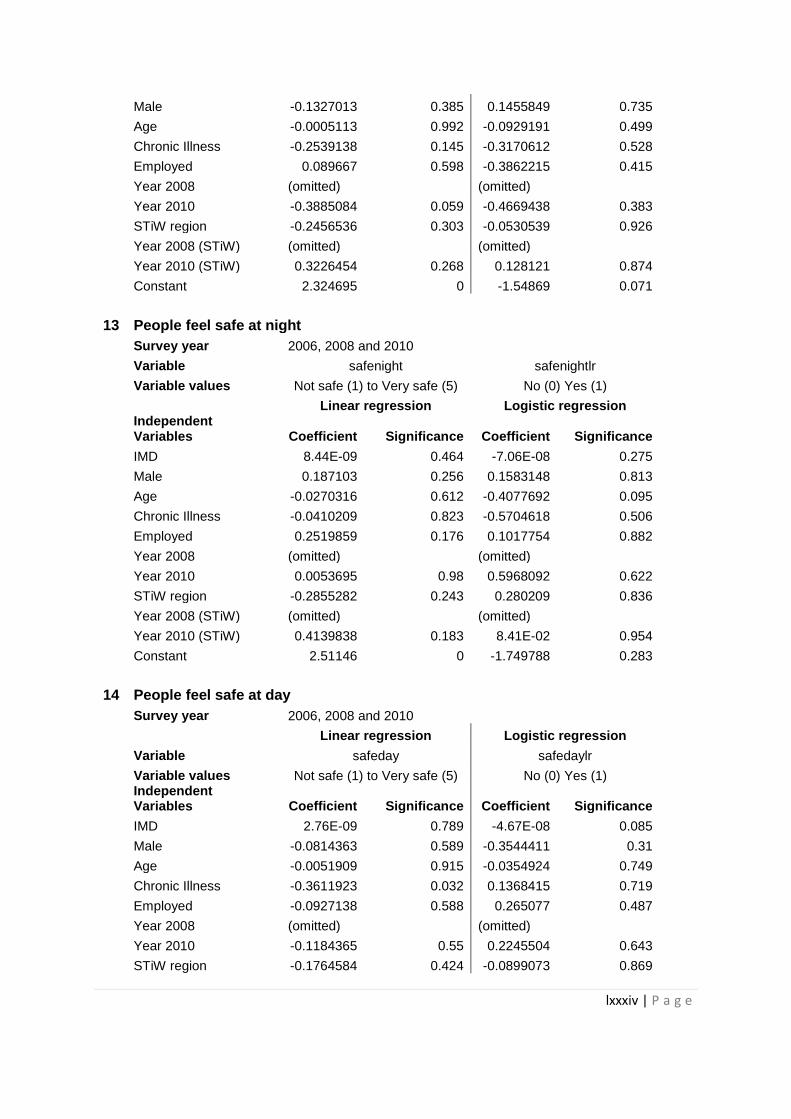
lxxxiv | P a g e
Male -0.1327013 0.385 0.1455849 0.735
Age -0.0005113 0.992 -0.0929191 0.499
Chronic Illness -0.2539138 0.145 -0.3170612 0.528
Employed 0.089667 0.598 -0.3862215 0.415
Year 2008 (omitted) (omitted)
Year 2010 -0.3885084 0.059 -0.4669438 0.383
STiW region -0.2456536 0.303 -0.0530539 0.926
Year 2008 (STiW) (omitted) (omitted)
Year 2010 (STiW) 0.3226454 0.268 0.128121 0.874
Constant 2.324695 0 -1.54869 0.071
13 People feel safe at night
Survey year 2006, 2008 and 2010
Variable safenight safenightlr
Variable values Not safe (1) to Very safe (5) No (0) Yes (1)
Linear regression Logistic regression
Independent Variables Coefficient Significance Coefficient Significance
IMD 8.44E-09 0.464 -7.06E-08 0.275
Male 0.187103 0.256 0.1583148 0.813
Age -0.0270316 0.612 -0.4077692 0.095
Chronic Illness -0.0410209 0.823 -0.5704618 0.506
Employed 0.2519859 0.176 0.1017754 0.882
Year 2008 (omitted)
(omitted)
Year 2010 0.0053695 0.98 0.5968092 0.622
STiW region -0.2855282 0.243 0.280209 0.836
Year 2008 (STiW) (omitted)
(omitted)
Year 2010 (STiW) 0.4139838 0.183 8.41E-02 0.954
Constant 2.51146 0 -1.749788 0.283
14 People feel safe at day
Survey year 2006, 2008 and 2010
Linear regression Logistic regression
Variable safeday safedaylr
Variable values Not safe (1) to Very safe (5) No (0) Yes (1)
Independent Variables Coefficient Significance Coefficient Significance
IMD 2.76E-09 0.789 -4.67E-08 0.085
Male -0.0814363 0.589 -0.3544411 0.31
Age -0.0051909 0.915 -0.0354924 0.749
Chronic Illness -0.3611923 0.032 0.1368415 0.719
Employed -0.0927138 0.588 0.265077 0.487
Year 2008 (omitted) (omitted)
Year 2010 -0.1184365 0.55 0.2245504 0.643
STiW region -0.1764584 0.424 -0.0899073 0.869
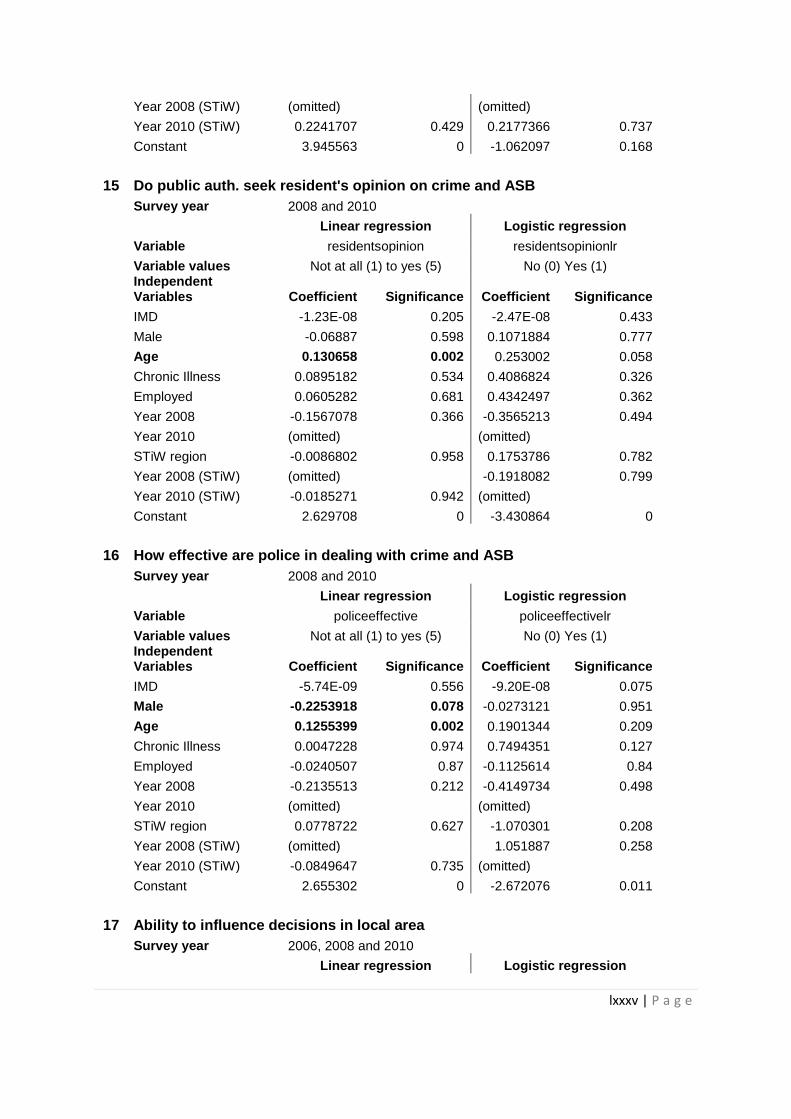
lxxxv | P a g e
Year 2008 (STiW) (omitted) (omitted)
Year 2010 (STiW) 0.2241707 0.429 0.2177366 0.737
Constant 3.945563 0 -1.062097 0.168
15 Do public auth. seek resident's opinion on crime and ASB
Survey year 2008 and 2010
Linear regression Logistic regression
Variable residentsopinion residentsopinionlr
Variable values Not at all (1) to yes (5) No (0) Yes (1)
Independent Variables Coefficient Significance Coefficient Significance
IMD -1.23E-08 0.205 -2.47E-08 0.433
Male -0.06887 0.598 0.1071884 0.777
Age 0.130658 0.002 0.253002 0.058
Chronic Illness 0.0895182 0.534 0.4086824 0.326
Employed 0.0605282 0.681 0.4342497 0.362
Year 2008 -0.1567078 0.366 -0.3565213 0.494
Year 2010 (omitted) (omitted)
STiW region -0.0086802 0.958 0.1753786 0.782
Year 2008 (STiW) (omitted) -0.1918082 0.799
Year 2010 (STiW) -0.0185271 0.942 (omitted)
Constant 2.629708 0 -3.430864 0
16 How effective are police in dealing with crime and ASB
Survey year 2008 and 2010
Linear regression Logistic regression
Variable policeeffective policeeffectivelr
Variable values Not at all (1) to yes (5) No (0) Yes (1)
Independent Variables Coefficient Significance Coefficient Significance
IMD -5.74E-09 0.556 -9.20E-08 0.075
Male -0.2253918 0.078 -0.0273121 0.951
Age 0.1255399 0.002 0.1901344 0.209
Chronic Illness 0.0047228 0.974 0.7494351 0.127
Employed -0.0240507 0.87 -0.1125614 0.84
Year 2008 -0.2135513 0.212 -0.4149734 0.498
Year 2010 (omitted) (omitted)
STiW region 0.0778722 0.627 -1.070301 0.208
Year 2008 (STiW) (omitted) 1.051887 0.258
Year 2010 (STiW) -0.0849647 0.735 (omitted)
Constant 2.655302 0 -2.672076 0.011
17 Ability to influence decisions in local area
Survey year 2006, 2008 and 2010
Linear regression Logistic regression
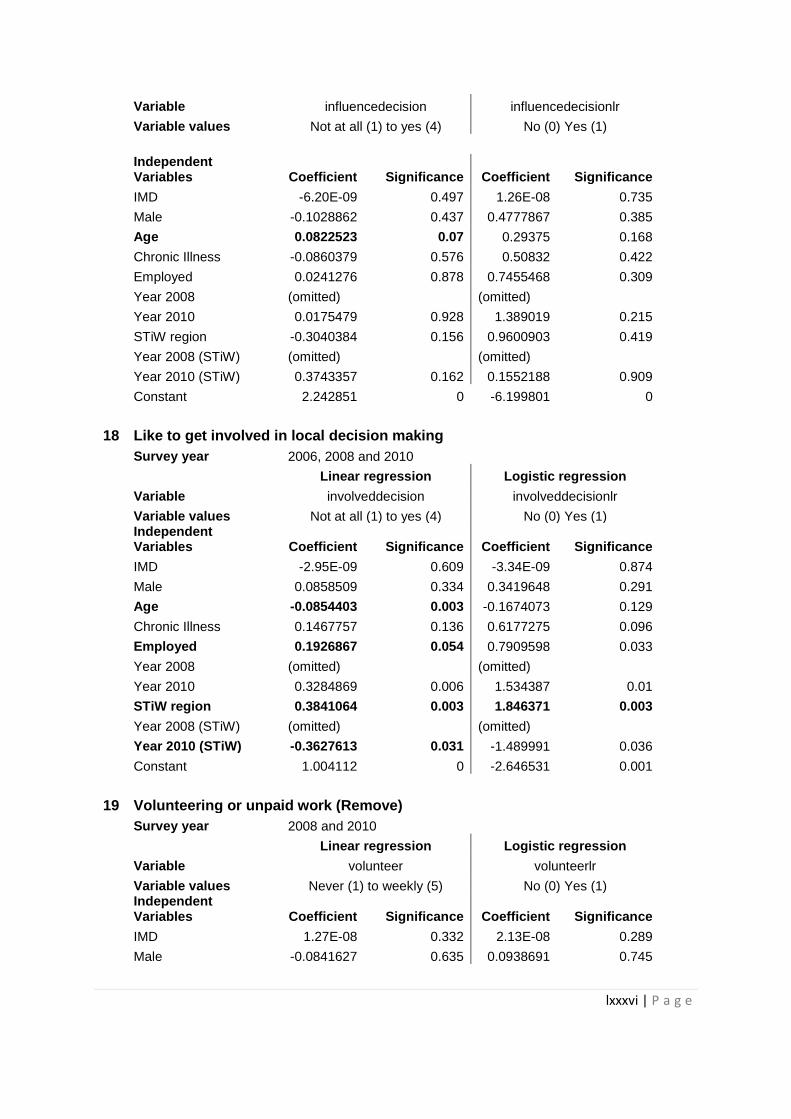
lxxxvi | P a g e
Variable influencedecision influencedecisionlr
Variable values Not at all (1) to yes (4) No (0) Yes (1)
Independent Variables Coefficient Significance Coefficient Significance
IMD -6.20E-09 0.497 1.26E-08 0.735
Male -0.1028862 0.437 0.4777867 0.385
Age 0.0822523 0.07 0.29375 0.168
Chronic Illness -0.0860379 0.576 0.50832 0.422
Employed 0.0241276 0.878 0.7455468 0.309
Year 2008 (omitted) (omitted)
Year 2010 0.0175479 0.928 1.389019 0.215
STiW region -0.3040384 0.156 0.9600903 0.419
Year 2008 (STiW) (omitted) (omitted)
Year 2010 (STiW) 0.3743357 0.162 0.1552188 0.909
Constant 2.242851 0 -6.199801 0
18 Like to get involved in local decision making
Survey year 2006, 2008 and 2010
Linear regression Logistic regression
Variable involveddecision involveddecisionlr
Variable values Not at all (1) to yes (4) No (0) Yes (1)
Independent Variables Coefficient Significance Coefficient Significance
IMD -2.95E-09 0.609 -3.34E-09 0.874
Male 0.0858509 0.334 0.3419648 0.291
Age -0.0854403 0.003 -0.1674073 0.129
Chronic Illness 0.1467757 0.136 0.6177275 0.096
Employed 0.1926867 0.054 0.7909598 0.033
Year 2008 (omitted) (omitted)
Year 2010 0.3284869 0.006 1.534387 0.01
STiW region 0.3841064 0.003 1.846371 0.003
Year 2008 (STiW) (omitted) (omitted)
Year 2010 (STiW) -0.3627613 0.031 -1.489991 0.036
Constant 1.004112 0 -2.646531 0.001
19 Volunteering or unpaid work (Remove)
Survey year 2008 and 2010
Linear regression Logistic regression
Variable volunteer volunteerlr
Variable values Never (1) to weekly (5) No (0) Yes (1)
Independent Variables Coefficient Significance Coefficient Significance
IMD 1.27E-08 0.332 2.13E-08 0.289
Male -0.0841627 0.635 0.0938691 0.745
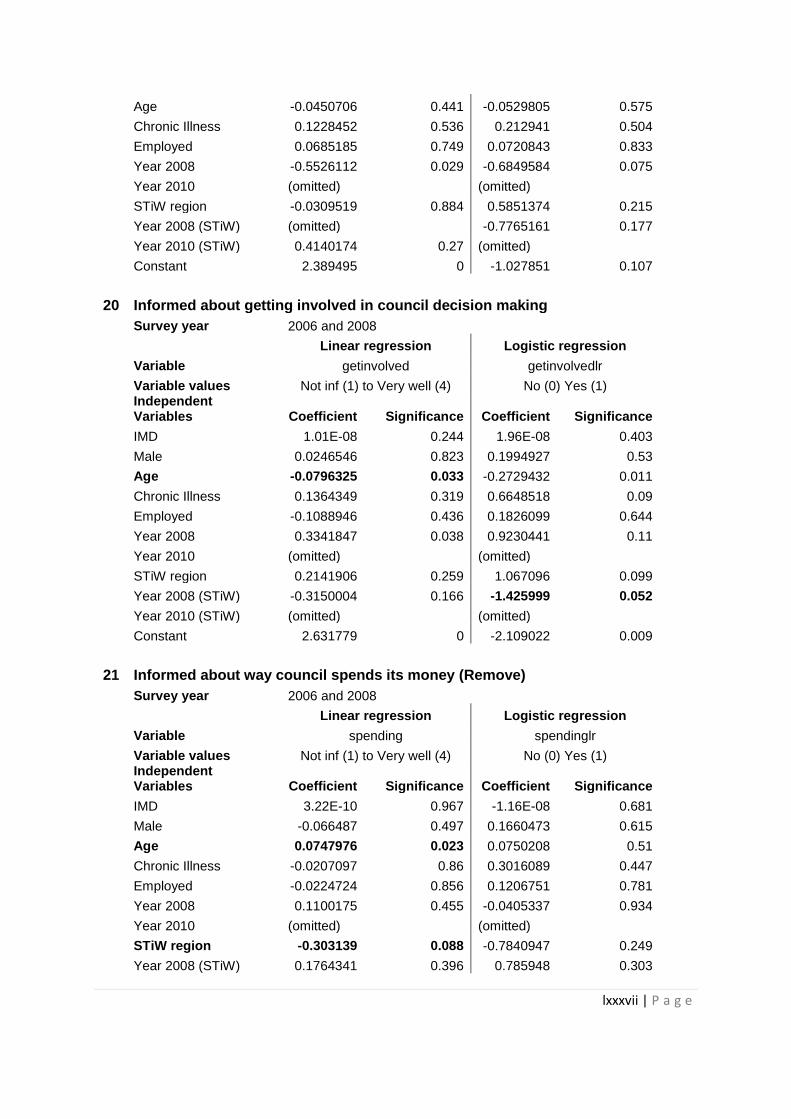
lxxxvii | P a g e
Age -0.0450706 0.441 -0.0529805 0.575
Chronic Illness 0.1228452 0.536 0.212941 0.504
Employed 0.0685185 0.749 0.0720843 0.833
Year 2008 -0.5526112 0.029 -0.6849584 0.075
Year 2010 (omitted) (omitted)
STiW region -0.0309519 0.884 0.5851374 0.215
Year 2008 (STiW) (omitted) -0.7765161 0.177
Year 2010 (STiW) 0.4140174 0.27 (omitted)
Constant 2.389495 0 -1.027851 0.107
20 Informed about getting involved in council decision making
Survey year 2006 and 2008
Linear regression Logistic regression
Variable getinvolved getinvolvedlr
Variable values Not inf (1) to Very well (4) No (0) Yes (1)
Independent Variables Coefficient Significance Coefficient Significance
IMD 1.01E-08 0.244 1.96E-08 0.403
Male 0.0246546 0.823 0.1994927 0.53
Age -0.0796325 0.033 -0.2729432 0.011
Chronic Illness 0.1364349 0.319 0.6648518 0.09
Employed -0.1088946 0.436 0.1826099 0.644
Year 2008 0.3341847 0.038 0.9230441 0.11
Year 2010 (omitted) (omitted)
STiW region 0.2141906 0.259 1.067096 0.099
Year 2008 (STiW) -0.3150004 0.166 -1.425999 0.052
Year 2010 (STiW) (omitted) (omitted)
Constant 2.631779 0 -2.109022 0.009
21 Informed about way council spends its money (Remove)
Survey year 2006 and 2008
Linear regression Logistic regression
Variable spending spendinglr
Variable values Not inf (1) to Very well (4) No (0) Yes (1)
Independent Variables Coefficient Significance Coefficient Significance
IMD 3.22E-10 0.967 -1.16E-08 0.681
Male -0.066487 0.497 0.1660473 0.615
Age 0.0747976 0.023 0.0750208 0.51
Chronic Illness -0.0207097 0.86 0.3016089 0.447
Employed -0.0224724 0.856 0.1206751 0.781
Year 2008 0.1100175 0.455 -0.0405337 0.934
Year 2010 (omitted) (omitted)
STiW region -0.303139 0.088 -0.7840947 0.249
Year 2008 (STiW) 0.1764341 0.396 0.785948 0.303
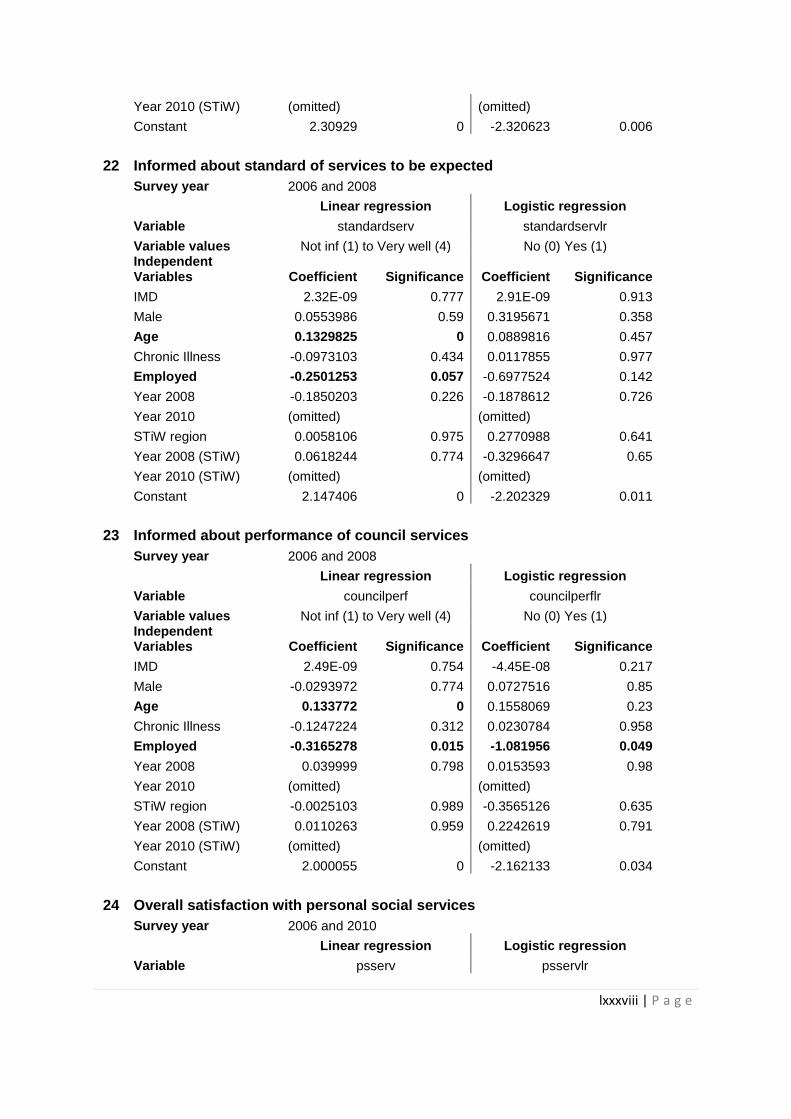
lxxxviii | P a g e
Year 2010 (STiW) (omitted) (omitted)
Constant 2.30929 0 -2.320623 0.006
22 Informed about standard of services to be expected
Survey year 2006 and 2008
Linear regression Logistic regression
Variable standardserv standardservlr
Variable values Not inf (1) to Very well (4) No (0) Yes (1)
Independent Variables Coefficient Significance Coefficient Significance
IMD 2.32E-09 0.777 2.91E-09 0.913
Male 0.0553986 0.59 0.3195671 0.358
Age 0.1329825 0 0.0889816 0.457
Chronic Illness -0.0973103 0.434 0.0117855 0.977
Employed -0.2501253 0.057 -0.6977524 0.142
Year 2008 -0.1850203 0.226 -0.1878612 0.726
Year 2010 (omitted) (omitted)
STiW region 0.0058106 0.975 0.2770988 0.641
Year 2008 (STiW) 0.0618244 0.774 -0.3296647 0.65
Year 2010 (STiW) (omitted) (omitted)
Constant 2.147406 0 -2.202329 0.011
23 Informed about performance of council services
Survey year 2006 and 2008
Linear regression Logistic regression
Variable councilperf councilperflr
Variable values Not inf (1) to Very well (4) No (0) Yes (1)
Independent Variables Coefficient Significance Coefficient Significance
IMD 2.49E-09 0.754 -4.45E-08 0.217
Male -0.0293972 0.774 0.0727516 0.85
Age 0.133772 0 0.1558069 0.23
Chronic Illness -0.1247224 0.312 0.0230784 0.958
Employed -0.3165278 0.015 -1.081956 0.049
Year 2008 0.039999 0.798 0.0153593 0.98
Year 2010 (omitted) (omitted)
STiW region -0.0025103 0.989 -0.3565126 0.635
Year 2008 (STiW) 0.0110263 0.959 0.2242619 0.791
Year 2010 (STiW) (omitted) (omitted)
Constant 2.000055 0 -2.162133 0.034
24 Overall satisfaction with personal social services
Survey year 2006 and 2010
Linear regression Logistic regression
Variable psserv psservlr
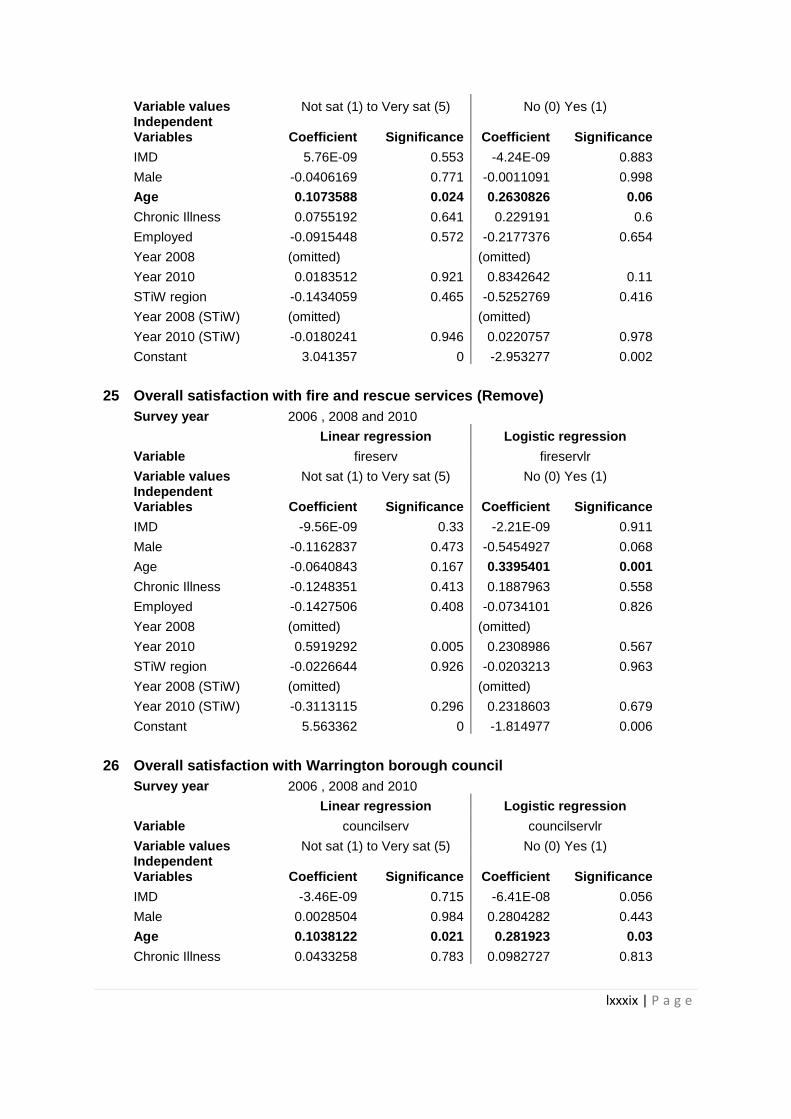
lxxxix | P a g e
Variable values Not sat (1) to Very sat (5) No (0) Yes (1)
Independent Variables Coefficient Significance Coefficient Significance
IMD 5.76E-09 0.553 -4.24E-09 0.883
Male -0.0406169 0.771 -0.0011091 0.998
Age 0.1073588 0.024 0.2630826 0.06
Chronic Illness 0.0755192 0.641 0.229191 0.6
Employed -0.0915448 0.572 -0.2177376 0.654
Year 2008 (omitted) (omitted)
Year 2010 0.0183512 0.921 0.8342642 0.11
STiW region -0.1434059 0.465 -0.5252769 0.416
Year 2008 (STiW) (omitted) (omitted)
Year 2010 (STiW) -0.0180241 0.946 0.0220757 0.978
Constant 3.041357 0 -2.953277 0.002
25 Overall satisfaction with fire and rescue services (Remove)
Survey year 2006 , 2008 and 2010
Linear regression Logistic regression
Variable fireserv fireservlr
Variable values Not sat (1) to Very sat (5) No (0) Yes (1)
Independent Variables Coefficient Significance Coefficient Significance
IMD -9.56E-09 0.33 -2.21E-09 0.911
Male -0.1162837 0.473 -0.5454927 0.068
Age -0.0640843 0.167 0.3395401 0.001
Chronic Illness -0.1248351 0.413 0.1887963 0.558
Employed -0.1427506 0.408 -0.0734101 0.826
Year 2008 (omitted) (omitted)
Year 2010 0.5919292 0.005 0.2308986 0.567
STiW region -0.0226644 0.926 -0.0203213 0.963
Year 2008 (STiW) (omitted) (omitted)
Year 2010 (STiW) -0.3113115 0.296 0.2318603 0.679
Constant 5.563362 0 -1.814977 0.006
26 Overall satisfaction with Warrington borough council
Survey year 2006 , 2008 and 2010
Linear regression Logistic regression
Variable councilserv councilservlr
Variable values Not sat (1) to Very sat (5) No (0) Yes (1)
Independent Variables Coefficient Significance Coefficient Significance
IMD -3.46E-09 0.715 -6.41E-08 0.056
Male 0.0028504 0.984 0.2804282 0.443
Age 0.1038122 0.021 0.281923 0.03
Chronic Illness 0.0433258 0.783 0.0982727 0.813
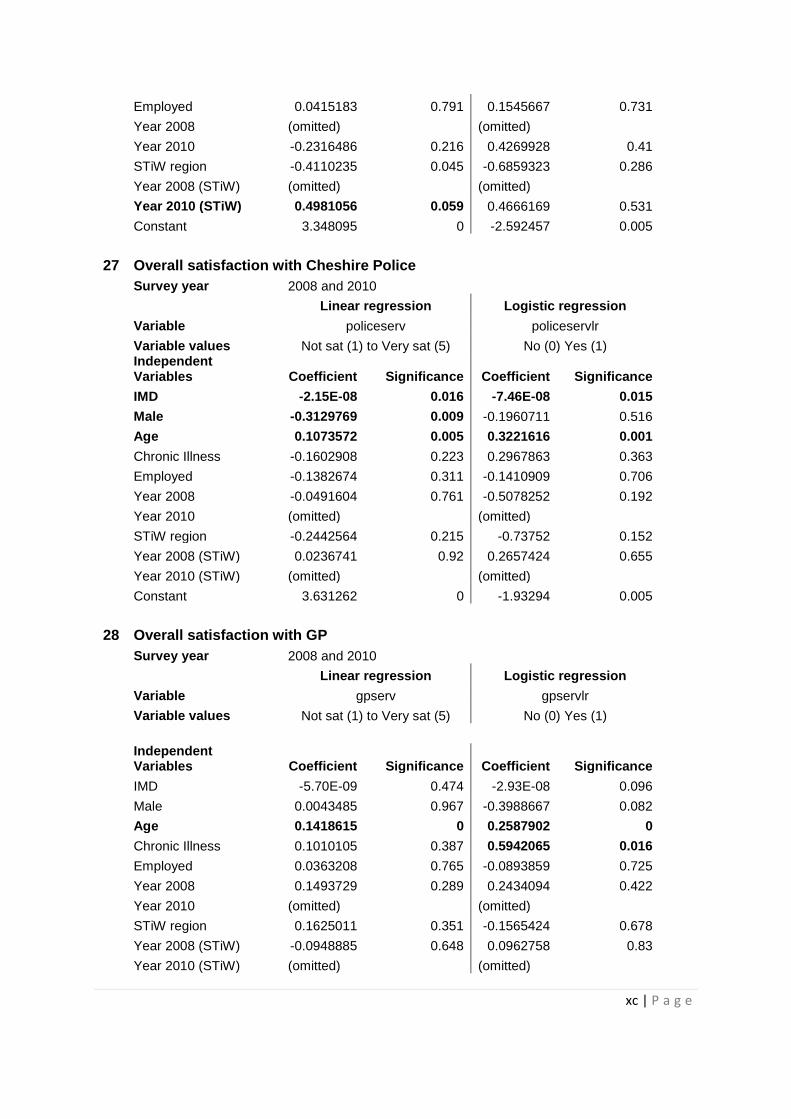
xc | P a g e
Employed 0.0415183 0.791 0.1545667 0.731
Year 2008 (omitted) (omitted)
Year 2010 -0.2316486 0.216 0.4269928 0.41
STiW region -0.4110235 0.045 -0.6859323 0.286
Year 2008 (STiW) (omitted) (omitted)
Year 2010 (STiW) 0.4981056 0.059 0.4666169 0.531
Constant 3.348095 0 -2.592457 0.005
27 Overall satisfaction with Cheshire Police
Survey year 2008 and 2010
Linear regression Logistic regression
Variable policeserv policeservlr
Variable values Not sat (1) to Very sat (5) No (0) Yes (1)
Independent Variables Coefficient Significance Coefficient Significance
IMD -2.15E-08 0.016 -7.46E-08 0.015
Male -0.3129769 0.009 -0.1960711 0.516
Age 0.1073572 0.005 0.3221616 0.001
Chronic Illness -0.1602908 0.223 0.2967863 0.363
Employed -0.1382674 0.311 -0.1410909 0.706
Year 2008 -0.0491604 0.761 -0.5078252 0.192
Year 2010 (omitted) (omitted)
STiW region -0.2442564 0.215 -0.73752 0.152
Year 2008 (STiW) 0.0236741 0.92 0.2657424 0.655
Year 2010 (STiW) (omitted) (omitted)
Constant 3.631262 0 -1.93294 0.005
28 Overall satisfaction with GP
Survey year 2008 and 2010
Linear regression Logistic regression
Variable gpserv gpservlr
Variable values Not sat (1) to Very sat (5) No (0) Yes (1)
Independent Variables Coefficient Significance Coefficient Significance
IMD -5.70E-09 0.474 -2.93E-08 0.096
Male 0.0043485 0.967 -0.3988667 0.082
Age 0.1418615 0 0.2587902 0
Chronic Illness 0.1010105 0.387 0.5942065 0.016
Employed 0.0363208 0.765 -0.0893859 0.725
Year 2008 0.1493729 0.289 0.2434094 0.422
Year 2010 (omitted) (omitted)
STiW region 0.1625011 0.351 -0.1565424 0.678
Year 2008 (STiW) -0.0948885 0.648 0.0962758 0.83
Year 2010 (STiW) (omitted) (omitted)
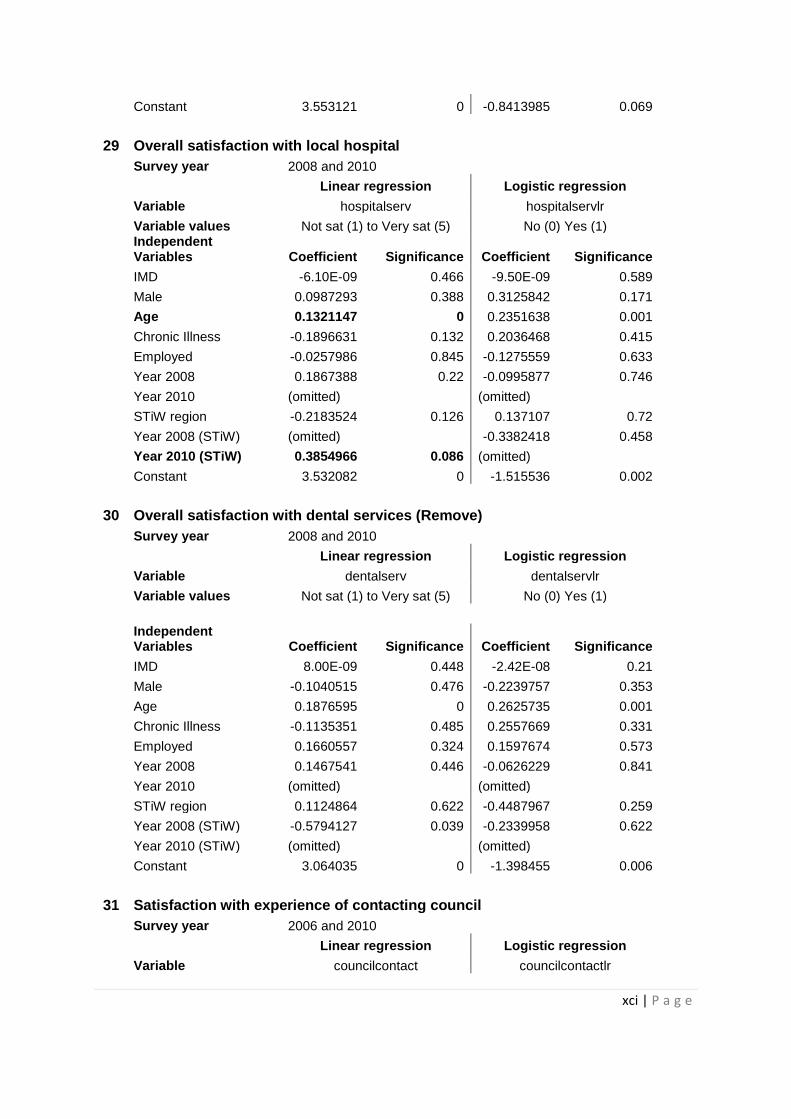
xci | P a g e
Constant 3.553121 0 -0.8413985 0.069
29 Overall satisfaction with local hospital
Survey year 2008 and 2010
Linear regression Logistic regression
Variable hospitalserv hospitalservlr
Variable values Not sat (1) to Very sat (5) No (0) Yes (1)
Independent Variables Coefficient Significance Coefficient Significance
IMD -6.10E-09 0.466 -9.50E-09 0.589
Male 0.0987293 0.388 0.3125842 0.171
Age 0.1321147 0 0.2351638 0.001
Chronic Illness -0.1896631 0.132 0.2036468 0.415
Employed -0.0257986 0.845 -0.1275559 0.633
Year 2008 0.1867388 0.22 -0.0995877 0.746
Year 2010 (omitted) (omitted)
STiW region -0.2183524 0.126 0.137107 0.72
Year 2008 (STiW) (omitted) -0.3382418 0.458
Year 2010 (STiW) 0.3854966 0.086 (omitted)
Constant 3.532082 0 -1.515536 0.002
30 Overall satisfaction with dental services (Remove)
Survey year 2008 and 2010
Linear regression Logistic regression
Variable dentalserv dentalservlr
Variable values Not sat (1) to Very sat (5) No (0) Yes (1)
Independent Variables Coefficient Significance Coefficient Significance
IMD 8.00E-09 0.448 -2.42E-08 0.21
Male -0.1040515 0.476 -0.2239757 0.353
Age 0.1876595 0 0.2625735 0.001
Chronic Illness -0.1135351 0.485 0.2557669 0.331
Employed 0.1660557 0.324 0.1597674 0.573
Year 2008 0.1467541 0.446 -0.0626229 0.841
Year 2010 (omitted) (omitted)
STiW region 0.1124864 0.622 -0.4487967 0.259
Year 2008 (STiW) -0.5794127 0.039 -0.2339958 0.622
Year 2010 (STiW) (omitted) (omitted)
Constant 3.064035 0 -1.398455 0.006
31 Satisfaction with experience of contacting council
Survey year 2006 and 2010
Linear regression Logistic regression
Variable councilcontact councilcontactlr
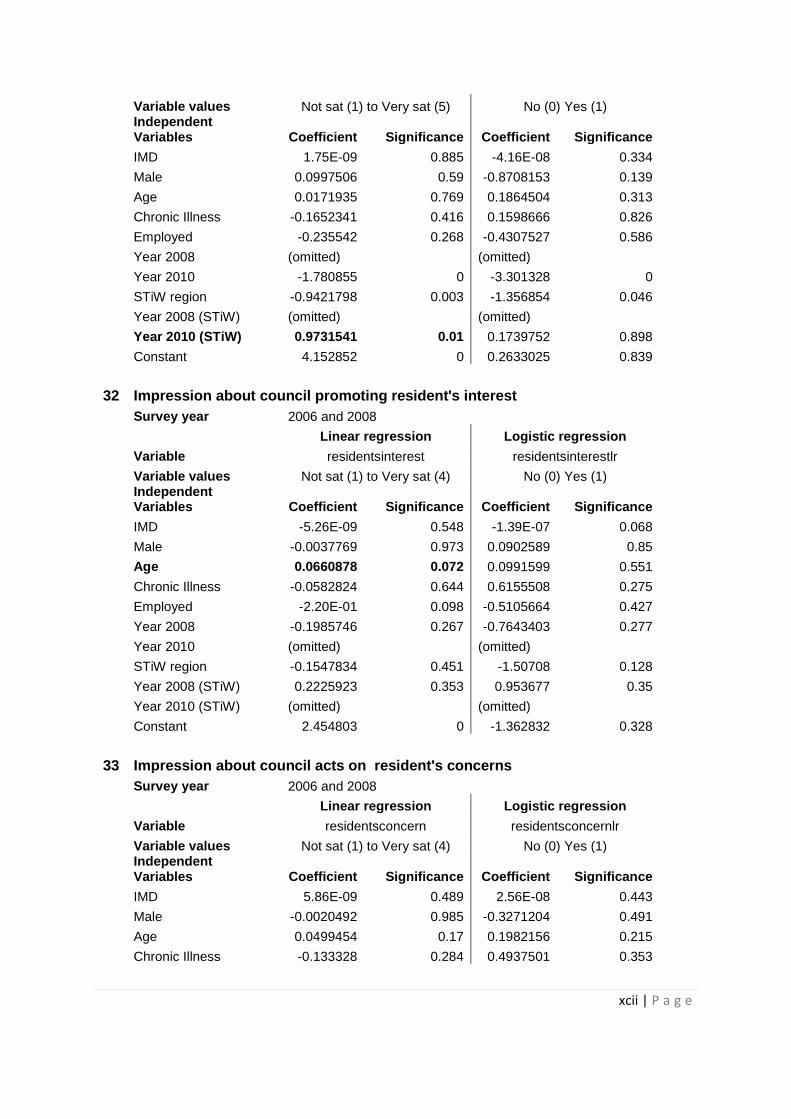
xcii | P a g e
Variable values Not sat (1) to Very sat (5) No (0) Yes (1)
Independent Variables Coefficient Significance Coefficient Significance
IMD 1.75E-09 0.885 -4.16E-08 0.334
Male 0.0997506 0.59 -0.8708153 0.139
Age 0.0171935 0.769 0.1864504 0.313
Chronic Illness -0.1652341 0.416 0.1598666 0.826
Employed -0.235542 0.268 -0.4307527 0.586
Year 2008 (omitted) (omitted)
Year 2010 -1.780855 0 -3.301328 0
STiW region -0.9421798 0.003 -1.356854 0.046
Year 2008 (STiW) (omitted) (omitted)
Year 2010 (STiW) 0.9731541 0.01 0.1739752 0.898
Constant 4.152852 0 0.2633025 0.839
32 Impression about council promoting resident's interest
Survey year 2006 and 2008
Linear regression Logistic regression
Variable residentsinterest residentsinterestlr
Variable values Not sat (1) to Very sat (4) No (0) Yes (1)
Independent Variables Coefficient Significance Coefficient Significance
IMD -5.26E-09 0.548 -1.39E-07 0.068
Male -0.0037769 0.973 0.0902589 0.85
Age 0.0660878 0.072 0.0991599 0.551
Chronic Illness -0.0582824 0.644 0.6155508 0.275
Employed -2.20E-01 0.098 -0.5105664 0.427
Year 2008 -0.1985746 0.267 -0.7643403 0.277
Year 2010 (omitted) (omitted)
STiW region -0.1547834 0.451 -1.50708 0.128
Year 2008 (STiW) 0.2225923 0.353 0.953677 0.35
Year 2010 (STiW) (omitted) (omitted)
Constant 2.454803 0 -1.362832 0.328
33 Impression about council acts on resident's concerns
Survey year 2006 and 2008
Linear regression Logistic regression
Variable residentsconcern residentsconcernlr
Variable values Not sat (1) to Very sat (4) No (0) Yes (1)
Independent Variables Coefficient Significance Coefficient Significance
IMD 5.86E-09 0.489 2.56E-08 0.443
Male -0.0020492 0.985 -0.3271204 0.491
Age 0.0499454 0.17 0.1982156 0.215
Chronic Illness -0.133328 0.284 0.4937501 0.353
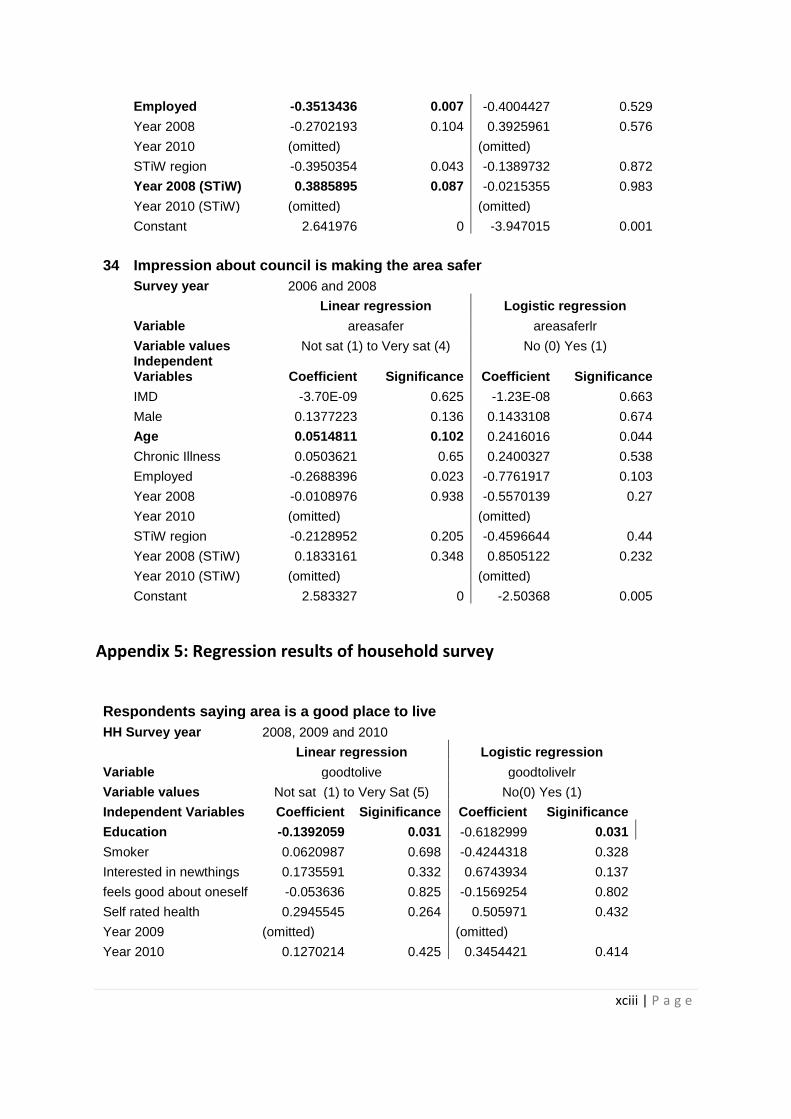
xciii | P a g e
Employed -0.3513436 0.007 -0.4004427 0.529
Year 2008 -0.2702193 0.104 0.3925961 0.576
Year 2010 (omitted) (omitted)
STiW region -0.3950354 0.043 -0.1389732 0.872
Year 2008 (STiW) 0.3885895 0.087 -0.0215355 0.983
Year 2010 (STiW) (omitted) (omitted)
Constant 2.641976 0 -3.947015 0.001
34 Impression about council is making the area safer
Survey year 2006 and 2008
Linear regression Logistic regression
Variable areasafer areasaferlr
Variable values Not sat (1) to Very sat (4) No (0) Yes (1)
Independent Variables Coefficient Significance Coefficient Significance
IMD -3.70E-09 0.625 -1.23E-08 0.663
Male 0.1377223 0.136 0.1433108 0.674
Age 0.0514811 0.102 0.2416016 0.044
Chronic Illness 0.0503621 0.65 0.2400327 0.538
Employed -0.2688396 0.023 -0.7761917 0.103
Year 2008 -0.0108976 0.938 -0.5570139 0.27
Year 2010 (omitted) (omitted)
STiW region -0.2128952 0.205 -0.4596644 0.44
Year 2008 (STiW) 0.1833161 0.348 0.8505122 0.232
Year 2010 (STiW) (omitted) (omitted)
Constant 2.583327 0 -2.50368 0.005
Appendix 5: Regression results of household survey
Respondents saying area is a good place to live
HH Survey year 2008, 2009 and 2010
Linear regression Logistic regression
Variable goodtolive goodtolivelr
Variable values Not sat (1) to Very Sat (5) No(0) Yes (1)
Independent Variables Coefficient Siginificance Coefficient Siginificance
Education -0.1392059 0.031 -0.6182999 0.031
Smoker 0.0620987 0.698 -0.4244318 0.328
Interested in newthings 0.1735591 0.332 0.6743934 0.137
feels good about oneself -0.053636 0.825 -0.1569254 0.802
Self rated health 0.2945545 0.264 0.505971 0.432
Year 2009 (omitted) (omitted) Year 2010 0.1270214 0.425 0.3454421 0.414
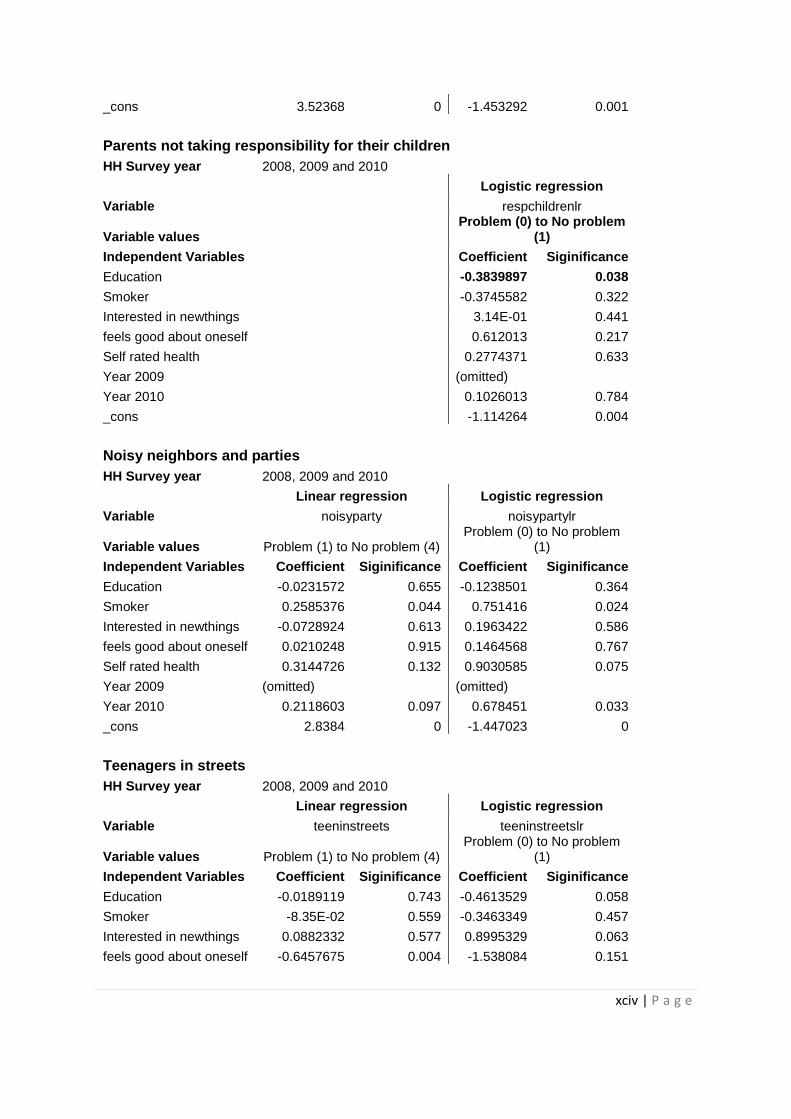
xciv | P a g e
_cons 3.52368 0 -1.453292 0.001
Parents not taking responsibility for their children
HH Survey year 2008, 2009 and 2010
Logistic regression
Variable
respchildrenlr
Variable values
Problem (0) to No problem (1)
Independent Variables
Coefficient Siginificance
Education
-0.3839897 0.038
Smoker
-0.3745582 0.322
Interested in newthings
3.14E-01 0.441
feels good about oneself
0.612013 0.217
Self rated health
0.2774371 0.633
Year 2009
(omitted) Year 2010
0.1026013 0.784
_cons
-1.114264 0.004
Noisy neighbors and parties
HH Survey year 2008, 2009 and 2010
Linear regression Logistic regression
Variable noisyparty noisypartylr
Variable values Problem (1) to No problem (4) Problem (0) to No problem
(1)
Independent Variables Coefficient Siginificance Coefficient Siginificance
Education -0.0231572 0.655 -0.1238501 0.364
Smoker 0.2585376 0.044 0.751416 0.024
Interested in newthings -0.0728924 0.613 0.1963422 0.586
feels good about oneself 0.0210248 0.915 0.1464568 0.767
Self rated health 0.3144726 0.132 0.9030585 0.075
Year 2009 (omitted) (omitted) Year 2010 0.2118603 0.097 0.678451 0.033
_cons 2.8384 0 -1.447023 0
Teenagers in streets
HH Survey year 2008, 2009 and 2010
Linear regression Logistic regression
Variable teeninstreets teeninstreetslr
Variable values Problem (1) to No problem (4) Problem (0) to No problem
(1)
Independent Variables Coefficient Siginificance Coefficient Siginificance
Education -0.0189119 0.743 -0.4613529 0.058
Smoker -8.35E-02 0.559 -0.3463349 0.457
Interested in newthings 0.0882332 0.577 0.8995329 0.063
feels good about oneself -0.6457675 0.004 -1.538084 0.151
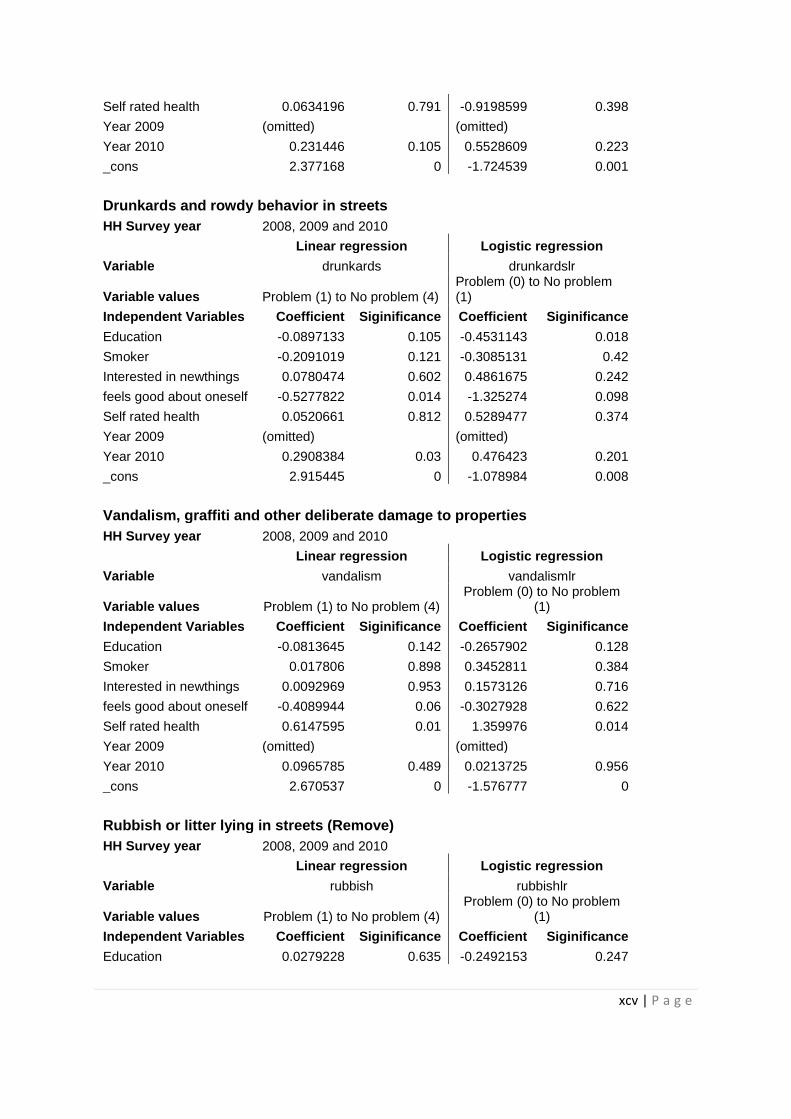
xcv | P a g e
Self rated health 0.0634196 0.791 -0.9198599 0.398
Year 2009 (omitted) (omitted) Year 2010 0.231446 0.105 0.5528609 0.223
_cons 2.377168 0 -1.724539 0.001
Drunkards and rowdy behavior in streets
HH Survey year 2008, 2009 and 2010
Linear regression Logistic regression
Variable drunkards drunkardslr
Variable values Problem (1) to No problem (4) Problem (0) to No problem (1)
Independent Variables Coefficient Siginificance Coefficient Siginificance
Education -0.0897133 0.105 -0.4531143 0.018
Smoker -0.2091019 0.121 -0.3085131 0.42
Interested in newthings 0.0780474 0.602 0.4861675 0.242
feels good about oneself -0.5277822 0.014 -1.325274 0.098
Self rated health 0.0520661 0.812 0.5289477 0.374
Year 2009 (omitted) (omitted) Year 2010 0.2908384 0.03 0.476423 0.201
_cons 2.915445 0 -1.078984 0.008
Vandalism, graffiti and other deliberate damage to properties
HH Survey year 2008, 2009 and 2010
Linear regression Logistic regression
Variable vandalism vandalismlr
Variable values Problem (1) to No problem (4) Problem (0) to No problem
(1)
Independent Variables Coefficient Siginificance Coefficient Siginificance
Education -0.0813645 0.142 -0.2657902 0.128
Smoker 0.017806 0.898 0.3452811 0.384
Interested in newthings 0.0092969 0.953 0.1573126 0.716
feels good about oneself -0.4089944 0.06 -0.3027928 0.622
Self rated health 0.6147595 0.01 1.359976 0.014
Year 2009 (omitted) (omitted) Year 2010 0.0965785 0.489 0.0213725 0.956
_cons 2.670537 0 -1.576777 0
Rubbish or litter lying in streets (Remove)
HH Survey year 2008, 2009 and 2010
Linear regression Logistic regression
Variable rubbish rubbishlr
Variable values Problem (1) to No problem (4) Problem (0) to No problem
(1)
Independent Variables Coefficient Siginificance Coefficient Siginificance
Education 0.0279228 0.635 -0.2492153 0.247
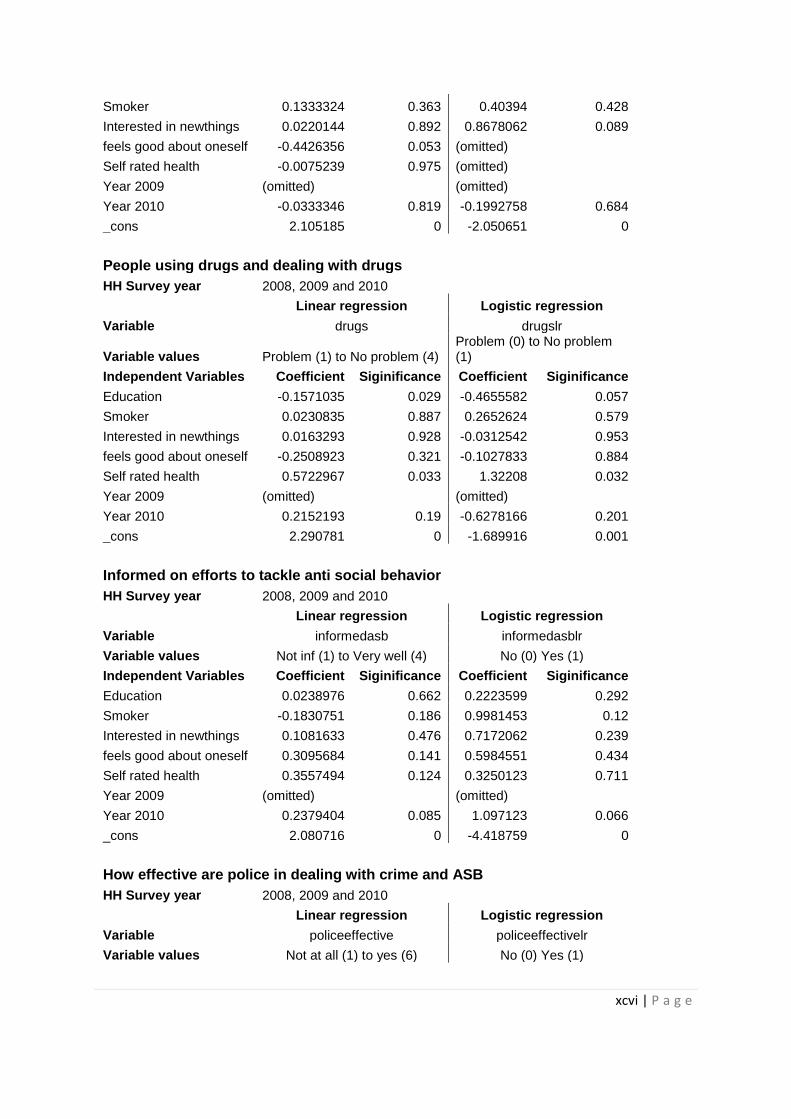
xcvi | P a g e
Smoker 0.1333324 0.363 0.40394 0.428
Interested in newthings 0.0220144 0.892 0.8678062 0.089
feels good about oneself -0.4426356 0.053 (omitted) Self rated health -0.0075239 0.975 (omitted) Year 2009 (omitted) (omitted) Year 2010 -0.0333346 0.819 -0.1992758 0.684
_cons 2.105185 0 -2.050651 0
People using drugs and dealing with drugs
HH Survey year 2008, 2009 and 2010
Linear regression Logistic regression
Variable drugs drugslr
Variable values Problem (1) to No problem (4) Problem (0) to No problem (1)
Independent Variables Coefficient Siginificance Coefficient Siginificance
Education -0.1571035 0.029 -0.4655582 0.057
Smoker 0.0230835 0.887 0.2652624 0.579
Interested in newthings 0.0163293 0.928 -0.0312542 0.953
feels good about oneself -0.2508923 0.321 -0.1027833 0.884
Self rated health 0.5722967 0.033 1.32208 0.032
Year 2009 (omitted) (omitted) Year 2010 0.2152193 0.19 -0.6278166 0.201
_cons 2.290781 0 -1.689916 0.001
Informed on efforts to tackle anti social behavior
HH Survey year 2008, 2009 and 2010
Linear regression Logistic regression
Variable informedasb informedasblr
Variable values Not inf (1) to Very well (4) No (0) Yes (1)
Independent Variables Coefficient Siginificance Coefficient Siginificance
Education 0.0238976 0.662 0.2223599 0.292
Smoker -0.1830751 0.186 0.9981453 0.12
Interested in newthings 0.1081633 0.476 0.7172062 0.239
feels good about oneself 0.3095684 0.141 0.5984551 0.434
Self rated health 0.3557494 0.124 0.3250123 0.711
Year 2009 (omitted) (omitted) Year 2010 0.2379404 0.085 1.097123 0.066
_cons 2.080716 0 -4.418759 0
How effective are police in dealing with crime and ASB
HH Survey year 2008, 2009 and 2010
Linear regression Logistic regression
Variable policeeffective policeeffectivelr
Variable values Not at all (1) to yes (6) No (0) Yes (1)

xcvii | P a g e
Independent Variables Coefficient Siginificance Coefficient Siginificance
Education -0.0369299 0.621 -0.6584111 0.072
Smoker -0.2618802 0.163 -0.0442346 0.942
Interested in newthings 0.2416573 0.234 0.2717679 0.681
feels good about oneself -0.4404714 0.118 -0.9588612 0.391
Self rated health 0.7733813 0.014 1.442217 0.059
Year 2009 (omitted) (omitted) Year 2010 0.1332551 0.479 -0.5267554 0.406
_cons 3.860877 0 -2.093703 0.001
Ability to influence decisions in local area
HH Survey year 2008, 2009 and 2010
Linear regression Logistic regression
Variable influencedecision influencedecisionlr
Variable values Not at all (1) to yes (4) No (0) Yes (1)
Independent Variables Coefficient Siginificance Coefficient Siginificance
Education 0.0374548 0.566 0.0137161 0.926
Smoker 0.2528181 0.11 0.1917984 0.606
Interested in newthings 0.0677764 0.695 0.7001435 0.071
feels good about oneself 0.2218578 0.388 0.830207 0.1
Self rated health 0.6935504 0.016 0.9065605 0.099
Year 2009 (omitted) (omitted) Year 2010 0.4910471 0.002 -1.22835 0.003
_cons 2.394951 0 -1.326793 0.001
Overall satisfaction with crime and ASB related services
HH Survey year 2008, 2009 and 2010
Linear regression Logistic regression
Variable crimeserv crimeservlr
Variable values Not sat (1) to Very sat (5) No (0) Yes (1)
Independent Variables Coefficient Siginificance Coefficient Siginificance
Education -0.0936479 0.181 -0.7637314 0.114
Smoker -0.0612709 0.711 0.3071838 0.683
Interested in newthings 0.400318 0.028 0.5845388 0.443
feels good about oneself -0.198287 0.421 (omitted) Self rated health 0.5177928 0.069 (omitted) Year 2009 (omitted) (omitted) Year 2010 0.4612031 0.006 -0.4875676 0.509
_cons 2.830705 0 -2.367792 0.002
Overall satisfaction with income/social capital/employment serv (Remove)
HH Survey year 2008, 2009 and 2010
Linear regression Logistic regression
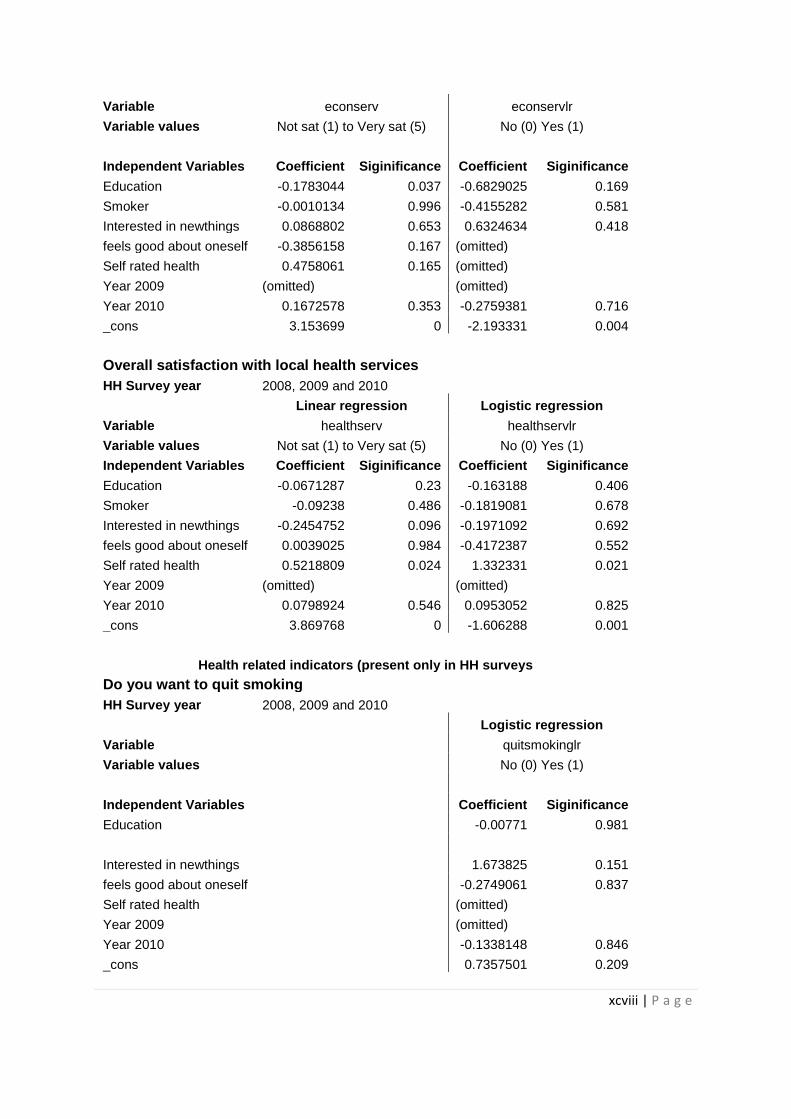
xcviii | P a g e
Variable econserv econservlr
Variable values Not sat (1) to Very sat (5) No (0) Yes (1)
Independent Variables Coefficient Siginificance Coefficient Siginificance
Education -0.1783044 0.037 -0.6829025 0.169
Smoker -0.0010134 0.996 -0.4155282 0.581
Interested in newthings 0.0868802 0.653 0.6324634 0.418
feels good about oneself -0.3856158 0.167 (omitted) Self rated health 0.4758061 0.165 (omitted) Year 2009 (omitted) (omitted) Year 2010 0.1672578 0.353 -0.2759381 0.716
_cons 3.153699 0 -2.193331 0.004
Overall satisfaction with local health services
HH Survey year 2008, 2009 and 2010
Linear regression Logistic regression
Variable healthserv healthservlr
Variable values Not sat (1) to Very sat (5) No (0) Yes (1)
Independent Variables Coefficient Siginificance Coefficient Siginificance
Education -0.0671287 0.23 -0.163188 0.406
Smoker -0.09238 0.486 -0.1819081 0.678
Interested in newthings -0.2454752 0.096 -0.1971092 0.692
feels good about oneself 0.0039025 0.984 -0.4172387 0.552
Self rated health 0.5218809 0.024 1.332331 0.021
Year 2009 (omitted) (omitted) Year 2010 0.0798924 0.546 0.0953052 0.825
_cons 3.869768 0 -1.606288 0.001
Health related indicators (present only in HH surveys
Do you want to quit smoking
HH Survey year 2008, 2009 and 2010
Logistic regression
Variable
quitsmokinglr
Variable values
No (0) Yes (1)
Independent Variables
Coefficient Siginificance
Education
-0.00771 0.981
Interested in newthings
1.673825 0.151
feels good about oneself
-0.2749061 0.837
Self rated health
(omitted) Year 2009
(omitted)
Year 2010
-0.1338148 0.846
_cons
0.7357501 0.209
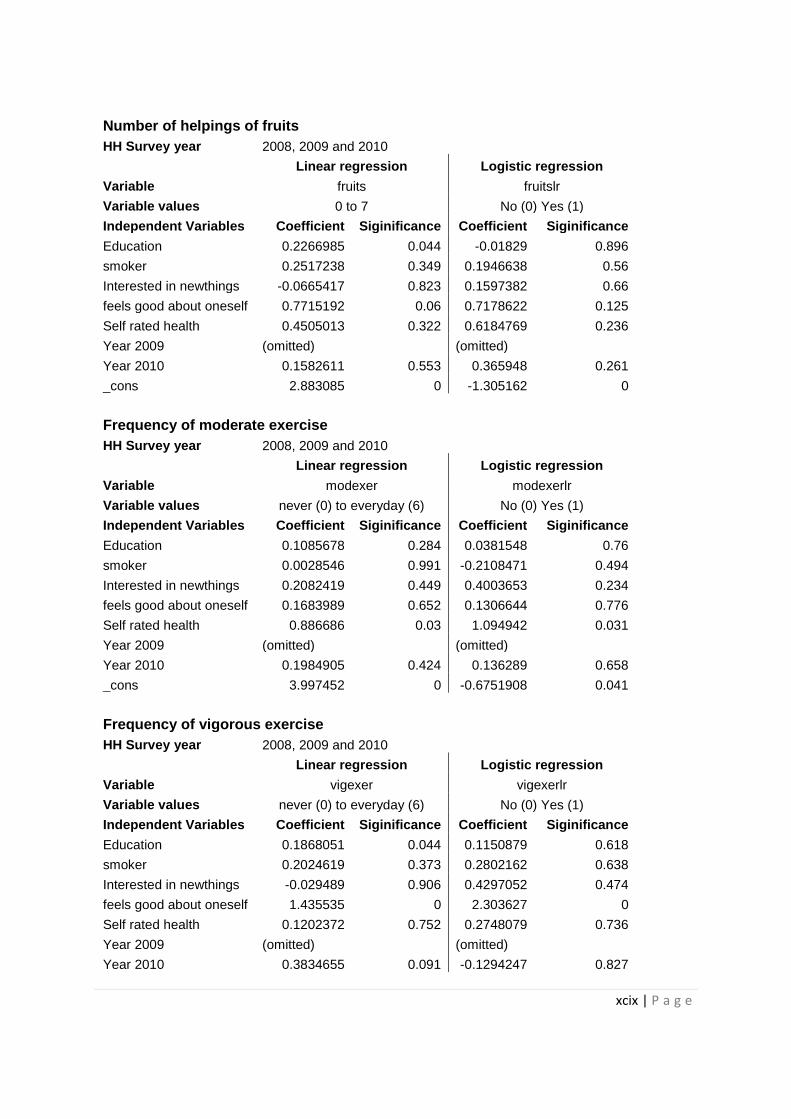
xcix | P a g e
Number of helpings of fruits
HH Survey year 2008, 2009 and 2010
Linear regression Logistic regression
Variable fruits fruitslr
Variable values 0 to 7 No (0) Yes (1)
Independent Variables Coefficient Siginificance Coefficient Siginificance
Education 0.2266985 0.044 -0.01829 0.896
smoker 0.2517238 0.349 0.1946638 0.56
Interested in newthings -0.0665417 0.823 0.1597382 0.66
feels good about oneself 0.7715192 0.06 0.7178622 0.125
Self rated health 0.4505013 0.322 0.6184769 0.236
Year 2009 (omitted) (omitted) Year 2010 0.1582611 0.553 0.365948 0.261
_cons 2.883085 0 -1.305162 0
Frequency of moderate exercise HH Survey year 2008, 2009 and 2010
Linear regression Logistic regression
Variable modexer modexerlr
Variable values never (0) to everyday (6) No (0) Yes (1)
Independent Variables Coefficient Siginificance Coefficient Siginificance
Education 0.1085678 0.284 0.0381548 0.76
smoker 0.0028546 0.991 -0.2108471 0.494
Interested in newthings 0.2082419 0.449 0.4003653 0.234
feels good about oneself 0.1683989 0.652 0.1306644 0.776
Self rated health 0.886686 0.03 1.094942 0.031
Year 2009 (omitted) (omitted) Year 2010 0.1984905 0.424 0.136289 0.658
_cons 3.997452 0 -0.6751908 0.041
Frequency of vigorous exercise HH Survey year 2008, 2009 and 2010
Linear regression Logistic regression
Variable vigexer vigexerlr
Variable values never (0) to everyday (6) No (0) Yes (1)
Independent Variables Coefficient Siginificance Coefficient Siginificance
Education 0.1868051 0.044 0.1150879 0.618
smoker 0.2024619 0.373 0.2802162 0.638
Interested in newthings -0.029489 0.906 0.4297052 0.474
feels good about oneself 1.435535 0 2.303627 0
Self rated health 0.1202372 0.752 0.2748079 0.736
Year 2009 (omitted) (omitted) Year 2010 0.3834655 0.091 -0.1294247 0.827

c | P a g e
_cons 1.905776 0 -3.52717 0

ci | P a g e
APPENDIX 9: STATA LOG FILE
Warrington survey 2006
* converted data set in SPSS to Stata using stat transfer v8.
* renaming the explanatory variables selected for analysis
*categorize the variables as explanatory and dependent
use "B:\Data files\Stata\Warrington Level surveys\New Set\2006 recoded.dta"
* Creation of value labels
label define Satisfaction 1 "Very dissatisfied" 2 "fairly dissatisfied" 3 "Neither" 4 "fairly satisfied" 5 "very satisfied" 6 "don't know" 7 "not applicable",
label define YesNo 0 "no" 1 "yes"
label define safenightorday 1 "very unsafe" 2 "fairly unsafe" 3 "Neither" 4 "fairly safe" 5 "very safe" 6 "don't know"
label define AgreeVivek 1 "Def disagree" 2 "tend to disagree" 3 "tend to agree" 4 "Def agree" 5 "dont know"
label define involveddecision 0 "No" 1 "Depends on the issue" 2 "Yes" 3 "dont know"
label define informed 1 "Not informed at all" 2 "not well informed" 3 "fairly well informed" 4 "Well informed" 5 "dont know"
label define Promotes 1 "Not at all" 2 "not very much" 3 "to some extent" 4 "great deal" 5 "dont know"
* renaming of independent variables
rename Year year
rename LSOA lsoa
replace lsoa=substr(lsoa,2,.)
destring lsoa, replace
ren ID id
rename Q34Sexofrespondent sex
rename Q35Age age
rename Q41Illness chrillness
rename Q40Employment econactive

cii | P a g e
rename Q42Limitactivities limitactive
*renaming of dependent variables
rename Accesstonature neednature
rename Activitiesforteenagers needteen
rename Affordabledecenthousing needhousing
rename Cleanstreets needstreets
rename Communityactivities needcomact
rename Culturalfacilities needcultact
rename Educationprovision neededn
rename Parksandopenspaces needparks
rename Sportsandleisurefacilities needsports
rename Healthservices needhealth
rename Jobprospects needjobs
rename Wagelevelslocalcostofliving needwages
rename Thelevelofcrime neednocrime
rename Thelevelofpollution neednopollution
rename Theleveloftrafficcongestion neednotrafffic
rename Publictransport needpubtrans
rename Racerelations needrace
rename Roadandpavementrepairs needroads
rename Shoppingfacilities needshopping
rename Accesstonature_A betnature
rename Activitiesforteenagers_A betteen
rename Affordabledecenthousing_A bethousing
rename Cleanstreets_A betstreets
rename Communityactivities_A betcomact
rename Culturalfacilities_A betcultact
rename Educationprovision_A betedn
rename Parksandopenspaces_A betparks
rename Sportsandleisurefacilities_A betsports
ciii | P a g e
rename Healthservices_A bethealth
rename Jobprospects_A betjobs
rename Wagelevelsandcostofliving betwages
rename Thelevelofcrime_A betcrime
rename Thelevelofpollution_A betpollution
rename Theleveloftrafficcongestion_A bettraffic
rename Publictransport_A betpubtrans
rename Racerelations_A betrace
rename Roadandpavementrepairs_A betroads
rename Shoppingfacilities_A betshopping
rename Overallsatisfactionwithlocalarea goodtolive
rename Parentsnottakingresponsibilityfo respchildren
rename Noisyneighboursorloudparties noisyparty
rename Teenagershangingaroundonthestree teeninstreets
rename Peoplebeingdrunkorrowdyinpublics drunkards
rename Vandalismgraffitiandotherdeliber vandalism
rename Rubbishorlitterlyingaround rubbish
rename Peopleusingordealingdrugs drugs
rename Whetherfeelssafeorunsafewhenouts safenight
rename Whetherfeelssafeorunsafewhenout0 safeday
rename Whetheragreesthatcaninfluencedec influencedecision
rename Whetherwouldliketobemoreinvolved involveddecision
rename Howandwheretoregistertovote voting
rename Howyoucangetinvolvedinlocaldecis getinvolved
rename Whatthecouncilspendsitsmoneyon spending
rename Whatstandardofserviceyoushouldex standardserv
rename Howwellthecouncilisperforming councilperf
rename PersonalsocialServices psserv
rename Fireandrescueservices fireserv
rename Overallsatisfactionwithauthority councilserv
civ | P a g e
rename Thefinaloutcome councilcontact
rename Promotestheinterestsoflocalresid residentsinterest
rename Actsontheconcernsoflocalresident residentsconcern
rename Isworkingtomaketheareasafer areasafer
* Recoding of not selecterd in question 1 (what is needed) and 2 (of these what needs to be improved)(selected=1, not selected=0)
recode neededn .=0
recode needhealth .=0
recode needjobs .=0
recode neednocrime .=0
recode neednopollution .=0
recode neednotrafffic .=0
recode needparks .=0
recode needpubtrans .=0
recode needrace .=0
recode needroads .=0
recode needshopping .=0
recode needsports .=0
recode needwages .=0
recode betnature .=0
recode betteen .=0
recode bethousing .=0
recode betstreets .=0
recode betcomact .=0
recode betcultact .=0
recode betedn .=0
recode bethealth .=0
recode betjobs .=0
recode betcrime .=0
cv | P a g e
recode betpollution .=0
recode bettraffic .=0
recode betparks .=0
recode betpubtrans .=0
recode betrace .=0
recode betroads .=0
recode betwages .=0
recode neednature .=0
recode needteen .=0
recode needhousing .=0
recode needstreets .=0
recode needcomact .=0
recode needcultact .=0
recode betshopping .=0
recode betsports .=0
codebook neednature needteen needhousing needstreets needcomact needcultact neededn needhealth needjobs neednocrime neednopollution neednotrafffic needparks needpubtrans needrace needroads needshopping needsports needwages
codebook betnature betteen bethousing betstreets betcomact betcultact betedn bethealth betjobs betcrime betpollution bettraffic betparks betpubtrans betrace betroads betshopping betsports betwages
* recoding of other indicators so that progression is one way and all 'not answered' responses recoded from 0=.
tab goodtolive
recode goodtolive 0=.
codebook goodtolive
recode goodtolive (1=6)(2=7)(3=8)(4=9)(5=10)
recode goodtolive (10=1)(9=2)(8=3)(7=4)(6=5)
label values goodtolive Satisfaction
tab respchildren
recode respchildren 0=.
cvi | P a g e
codebook respchildren
tab noisyparty
recode noisyparty 0=.
codebook noisyparty
tab teeninstreets
recode teeninstreets 0=.
codebook teeninstreets
tab drunkards
recode drunkards 0=.
codebook drunkards
tab vandalism
recode vandalism 0=.
codebook vandalism
tab rubbish
recode rubbish 0=.
codebook rubbish
tab drugs
recode drugs 0=.
codebook drugs
tab safenight
codebook safenight
recode safenight (1=11)(2=21)(3=31)(4=41)(5=51)
recode safenight (51=1)(41=2)(31=3)(21=4)(11=5)
cvii | P a g e
label values safenight safenightorday
tab safeday
recode safeday (1=11)(2=21)(3=31)(4=41)(5=51)
recode safeday (51=1)(41=2)(31=3)(21=4)(11=5)
label values safeday safenightorday
tab influencedecision
recode influencedecision 0=.
codebook influencedecision
recode influencedecision (1=11)(2=21)(3=31)(4=41)
recode influencedecision (41=1)(31=2)(21=3)(11=4)
label value influencedecision agreeVivek
tab involveddecision
recode involveddecision 0=.
codebook involveddecision
recode involveddecision 2=0
recode involveddecision 1=2
recode involveddecision 3=1
tab involveddecision
recode involveddecision 4=3
label values involveddecision involveddecision
tab involveddecision
tab voting
recode voting 0=.
codebook voting
tab getinvolved
cviii | P a g e
recode getinvolved 0=.
codebook getinvolved
recode getinvolved (1=11)(2=21)(3=31)(4=41)
recode getinvolved (41=1)(31=2)(21=3)(11=4)
label values getinvolved informed
tab getinvolved
tab spending
recode spending 0=.
codebook spending
recode spending (1=11)(2=21)(3=31)(4=41)
recode spending (41=1)(31=2)(21=3)(11=4)
label values spending informed
tab spending
tab standardserv
recode standardserv 0=.
codebook standardserv
recode standardserv (1=11)(2=21)(3=31)(4=41)
recode standardserv (41=1)(31=2)(21=3)(11=4)
label values standardserv informed
tab standardservrdserv
tab councilperf
recode councilperf 0=.
codebook councilperf
tab councilperf
recode councilperf (1=11)(2=21)(3=31)(4=41)
recode councilperf (41=1)(31=2)(21=3)(11=4)
cix | P a g e
label values councilperf informed
tab councilperf
tab psserv
recode psserv 0=.
codebook psserv
tab psserv
codebook psserv
recode psserv (1=11)(2=21)(3=31)(4=41)(5=51)
recode psserv (51=1)(41=2)(31=3)(21=4)(11=5)
label values psserv satisfaction
tab psserv
tab fireserv
recode fireserv 0=.
codebook fireserv
tab fireserv
recode fireserv (1=11)(2=21)(3=31)(4=41)(5=51)
recode fireserv (51=1)(41=2)(31=3)(21=4)(11=5)
label values fireserv Satisfaction
tab fireserv
tab councilserv
recode councilserv 0=.
codebook councilserv
recode councilserv (1=11)(2=21)(3=31)(4=41)(5=51)
recode councilserv (51=1)(41=2)(31=3)(21=4)(11=5)
label values councilserv satisfaction
tab councilserv
cx | P a g e
tab councilcontact
recode councilcontact 0=.
codebook councilcontact
recode councilcontact (1=11)(2=21)(3=31)(4=41)(5=51)
recode councilcontact (51=1)(41=2)(31=3)(21=4)(11=5)
label values councilcontact satisfaction
tab councilcontact
tab residentsinterest
recode residentsinterest 0=.
codebook residentsinterest
recode residentsinterest (1=11)(2=21)(3=31)(4=41)
recode residentsinterest (41=1)(31=2)(21=3)(11=4)
label values residentsinterest Promotes
tab residentsinterest
tab residentsconcern
recode residentsconcern 0=.
codebook residentsconcern
recode residentsconcern (1=11)(2=21)(3=31)(4=41)
recode residentsconcern (41=1)(31=2)(21=3)(11=4)
label values residentsconcern Promotes
tab residentsconcern
tab areasafer
recode areasafer 0=.
codebook areasafer
recode areasafer (1=11)(2=21)(3=31)(4=41)
cxi | P a g e
recode areasafer (41=1)(31=2)(21=3)(11=4)
label values areasafer Promotes
tab areasafer
* checking the correlation between explanatory variables (results are intuitive)
pwcorr limitactive sex
pwcorr limitactive econactive
pwcorr age sex
pwcorr age econactive
pwcorr age chrillness
pwcorr sex econactive
pwcorr sex chrillness
pwcorr econactive chrillness
* imputation of missing values for explanatory variables
*1. lsoa (one observation dropped)
codebook lsoa
summarize lsoa
list lsoa if lsoa==.
drop if lsoa==.
*2. Gender (in variable 'male' 1=male, 0=female)
tab sex
recode sex 0=.
codebook sex
impute sex lsoa chrillness econactive safeday safenight residentsconcern involveddecision influencedecision councilcontact councilperf voting getinvolved psserv goodtolive respchildren noisyparty teeninstreets rubbish drunkards vandalism drugs betcrime bethealth betedn betstreets betcultact betparks betcomact bethousing, gen(gender)
cxii | P a g e
tab gender
recode gender(min/1.5=1)(1.5/max=2)
tab gender
gen male=gender
recode male 2=0
tab male
label values male YesNo
*3 age (in variable agework, 1=working age 18-65, 0= 65+)
summarize age
codebook age
tab age if age==0
recode age 0=.
impute age lsoa gender chrillness econactive safeday safenight residentsconcern residentsinterest involveddecision influencedecision councilcontact councilperf voting getinvolved psserv goodtolive respchildren noisyparty teeninstreets rubbish drunkards vandalism drugs betcrime bethealth betedn betstreets betparks bethousing, gen(impage)
recode impage (min/25=1)(25/35=2)(35/45=3)(45/55=4)(55/65=5)(65/75=6)(75/max=7), gen (ageband)
tab ageband
recode ageband (1/5=1)(6/7=0), gen(agework)
tab agework
label values agework YesNo
*4. Economically active/employement (after imputation there is comparitively a sharp jump in student category, 'employed'1=yes )
tab econactive
summarize econactive
codebook econactive
recode econactive 0=.
impute econactive lsoa impage gender chrillness safeday safenight residentsconcern residentsinterest involveddecision influencedecision councilcontact councilperf voting getinvolved psserv goodtolive respchildren noisyparty teeninstreets rubbish drunkards vandalism drugs betcrime bethealth betedn betstreets betparks bethousing, gen(impeconactive)
cxiii | P a g e
recode impeconactive (min/1.5=1)(1.5/2.5=2)(2.5/3.5=3)(3.5/4.5=4)(4.5/5.5=5)(5.5/6.5=6)(6.5/7.5=7)(7.5/8.5=8)(8.5/9.5=9)(9.5/max=10)
tab impeconactive
tab econactive
label values impeconactive Q40Employment
codebook impeconactive
recode impeconactive (1/4=1)(4/max=0), gen (employed)
tab employed
label values employed YesNo
display 406+159+71+3
*5 Chronic Illness
codebook chrillness
recode chrillness 3=.
impute chrillness lsoa impage gender impeconactive safeday safenight residentsconcern residentsinterest involveddecision influencedecision councilperf voting getinvolved goodtolive respchildren noisyparty teeninstreets rubbish drunkards vandalism drugs betcrime bethealth betedn betstreets betparks bethousing, gen(illness)
recode illness (min/1.5=1)(1.5/max=2)
tab illness
recode illness 2=0
tab illness
codebook illness
label values illness YesNo
*6 limited activity due to illness
tab limitactive
recode limitactive 0=.
tab limitactive
recode limitactive .=2 if illness==0
cxiv | P a g e
impute limitactive lsoa impage male employed safeday safenight residentsconcern residentsinterest involveddecision influencedecision councilcontact councilperf voting getinvolved psserv goodtolive respchildren noisyparty teeninstreets rubbish drunkards vandalism drugs betcrime bethealth betstreets bethousing if illness==1, gen(disabled)
tab disabled
recode disabled (min/1=1)(1.01/2=2)
tab disabled
recode disabled (1.002/1.003=2)
recode disabled 2=0
label values disabled YesNo
recode disabled .=0
Warrington survey 2008
* converted data set in SPSS to Stata using stat transfer v8.
*categorize the variables as explanatory and dependent
* Creation of value labels
label define Satisfaction 1 "Very dissatisfied" 2 "fairly dissatisfied" 3 "Neither" 4 "fairly satisfied" 5 "very satisfied" 6 "don't know" 7 "not applicable",
label define YesNo 0 "no" 1 "yes"
label define safenightorday 1 "very unsafe" 2 "fairly unsafe" 3 "Neither" 4 "fairly safe" 5 "very safe" 6 "don't know"
label define AgreeVivek 1 "Def disagree" 2 "tend to disagree" 3 "tend to agree" 4 "Def agree" 5 "dont know"
label define involveddecision 0 "No" 1 "Depends on the issue" 2 "Yes" 3 "dont know"
label define informed 1 "Not informed at all" 2 "not well informed" 3 "fairly well informed" 4 "Well informed" 5 "dont know"
label define Promotes 1 "Not at all" 2 "not very much" 3 "to some extent" 4 "great deal" 5 "dont know"
label define q15_1 "At least once a week" 4 "Less than once a week but at least once a month" 3 "Less often" 2 "I give unpaid help as an individual only and not through group(s), club(s) or or" 1 "I have not given any unpaid help at all over the last 12 months" 6 "Don't know" 7 "Not stated", replace
* renaming of independent variables
rename Year year
rename LSOACODE lsoa

cxv | P a g e
replace lsoa=substr(lsoa,2,.)
destring lsoa, replace
ren ID id
rename q27 sex
rename q34 chrillness
rename q33 econactive
rename q35 limitactive
rename q28 age
tab r_q28_a
tab age if age >=18 & age<=24
*renaming of dependent variables
rename q1edit_1 neednature
rename q1edit_2 needteen
rename q1edit_3 needhousing
rename q1edit_4 needstreets
rename q1edit_5 needcomact
rename q1edit_6 needcultact
rename q1edit_7 neededn
rename q1edit_14 needparks
rename q1edit_19 needsports
rename q1edit_9 needhealth
rename q1edit_10 needjobs
rename q1edit_20 needwages
rename q1edit_11 neednocrime
rename q1edit_12 neednopollution
rename q1edit_13 neednotrafffic
rename q1edit_15 needpubtrans
rename q1edit_16 needrace
rename q1edit_17 needroads
cxvi | P a g e
rename q1edit_18 needshopping
rename q2edit_1 betnature
rename q2edit_2 betteen
rename q2edit_3 bethousing
rename q2edit_4 betstreets
rename q2edit_5 betcomact
rename q2edit_6 betcultact
rename q2edit_7 betedn
rename q2edit_14 betparks
rename q2edit_19 betsports
rename q2edit_9 bethealth
rename q2edit_10 betjobs
rename q2edit_20 betwages
rename q2edit_11 betcrime
rename q2edit_12 betpollution
rename q2edit_13 bettraffic
rename q2edit_15 betpubtrans
rename q2edit_16 betrace
rename q2edit_17 betroads
rename q2edit_18 betshopping
rename q3 goodtolive
rename q17 respchildren
rename q241 noisyparty
rename q242 teeninstreets
rename q246 drunkards
rename q244 vandalism
rename q243 rubbish
rename q245 drugs
rename q22 safenight
cxvii | P a g e
rename q23 safeday
rename q25 residentsopinion
rename q26 policeeffective
rename q13 influencedecision
rename q14 involveddecision
rename q15 volunteer
rename q12a voting
rename q12c getinvolved
rename q12b spending
rename q12d standardserv
rename q12e councilperf
rename q7b fireserv
rename q11 councilserv
rename q7a policeserv
rename q7c gpserv
rename q7d hospitalserv
rename q7e dentalserv
rename q6c residentsinterest
rename q6d residentsconcern
rename q6a areasafer
codebook neednature needteen needhousing needstreets needcomact needcultact neededn needhealth needjobs neednocrime neednopollution neednotrafffic needparks needpubtrans needrace needroads needshopping needsports needwages
codebook betnature betteen bethousing betstreets betcomact betcultact betedn bethealth betjobs betcrime betpollution bettraffic betparks betpubtrans betrace betroads betshopping betsports betwages
* recoding of other indicators so that progression is one way and all 'not answered' responses recoded =.
codebook goodtolive
recode goodtolive 6=.
recode goodtolive (1=6)(2=7)(3=8)(4=9)(5=10)
cxviii | P a g e
recode goodtolive (10=1)(9=2)(8=3)(7=4)(6=5)
label values goodtolive Satisfaction
tab goodtolive
tab respchildren
codebook respchildren
recode respchildren 7=.
recode respchildren 3=7
recode respchildren (1=11)(2=21)(4=41)(5=51)(6=61)(7=71)
recode respchildren (61=6)(51=1)(41=2)(21=3)(11=4)
codebook respchildren
recode respchildren (6=5)(71=6)
codebook respchildren
label values respchildren AgreeVivek
tab respchildren
codebook respchildren
recode respchildren (6=5)
codebook respchildre
codebook noisyparty
recode noisyparty 6=.
tab teeninstreets
recode teeninstreets 6=.
tab drunkard
codebook drunkards
recode drunkard 6=.
tab vandalism
cxix | P a g e
recode vandalism 6=.
codebook vandalism
tab rubbish
recode rubbish 6=.
codebook rubbish
tab drugs
recode drugs 6=.
codebook drugs
tab safenight
codebook safenight
recode safenight 7=.
recode safenight (1=11)(2=21)(3=31)(4=41)(5=51)
recode safenight (51=1)(41=2)(31=3)(21=4)(11=5)
label values safenight safenightorday
tab safeday
recode safeday 7=.
recode safeday (1=11)(2=21)(3=31)(4=41)(5=51)
recode safeday (51=1)(41=2)(31=3)(21=4)(11=5)
label values safeday safenightorday
* lable values 'agree' are replaced by 'Satisfaction' (gradations are same)
codebook residentsopinion
recode residentsopinion 7=.
recode residentsopinion (1=11)(2=21)(3=31)(4=41)(5=51)
recode residentsopinion (51=1)(41=2)(31=3)(21=4)(11=5)
label values residentsopinion Satisfaction

cxx | P a g e
codebook residentsopinion
* lable values 'agree' are replaced by 'Satisfaction' (gradations are same)
codebook policeeffective
recode policeeffective 7=.
recode policeeffective (1=11)(2=21)(3=31)(4=41)(5=51)
recode policeeffective (51=1)(41=2)(31=3)(21=4)(11=5)
label values policeeffective Satisfaction
codebook policeeffective
tab influencedecision
recode influencedecision 6=.
codebook influencedecision
recode influencedecision (1=11)(2=21)(3=31)(4=41)
recode influencedecision (41=1)(31=2)(21=3)(11=4)
label value influencedecision AgreeVivek
codebook involveddecision
recode involveddecision 5=.
recode involveddecision 2=0
recode involveddecision 1=2
recode involveddecision 3=1
tab involveddecision
recode involveddecision 4=3
label values involveddecision involveddecision
codebook involveddecision
codebook volunteer
recode volunteer 7=.
recode volunteer (1=11)(2=21)(3=31)(4=41)(5=51)
cxxi | P a g e
recode volunteer (51=1)(41=2)(31=3)(21=4)(11=5)
codebook volunteer
tab getinvolved
recode getinvolved 0=.
codebook getinvolved
recode getinvolved (1=11)(2=21)(3=31)(4=41)
recode getinvolved (41=1)(31=2)(21=3)(11=4)
label values getinvolved informed
tab getinvolved
codebook spending
recode spending 6=.
recode spending (1=11)(2=21)(3=31)(4=41)
recode spending (41=1)(31=2)(21=3)(11=4)
label values spending informed
codebook spending
codebook standardserv
recode standardserv 6=.
recode standardserv (1=11)(2=21)(3=31)(4=41)
recode standardserv (41=1)(31=2)(21=3)(11=4)
label values standardserv informed
codebook standardserv
codebook councilperf
recode councilperf 6=.
recode councilperf (1=11)(2=21)(3=31)(4=41)
recode councilperf (41=1)(31=2)(21=3)(11=4)
label values councilperf informed
cxxii | P a g e
codebook councilperf
codebook fireserv
recode fireserv (7=6)(8=.)
recode fireserv (1=11)(2=21)(3=31)(4=41)(5=51)
recode fireserv (51=1)(41=2)(31=3)(21=4)(11=5)
label values fireserv Satisfaction
tab fireserv
codebook councilserv
recode councilserv 7=.
recode councilserv (1=11)(2=21)(3=31)(4=41)(5=51)
recode councilserv (51=1)(41=2)(31=3)(21=4)(11=5)
label values councilserv Satisfaction
tab councilserv
codebook policeserv
recode policeserv (7=6)(8=.)
recode policeserv (1=11)(2=21)(3=31)(4=41)(5=51)
recode policeserv (51=1)(41=2)(31=3)(21=4)(11=5)
label values policeserv Satisfaction
codebook policeserv
codebook gpserv
recode gpserv (7=6)(8=.)
recode gpserv (1=11)(2=21)(3=31)(4=41)(5=51)
recode gpserv (51=1)(41=2)(31=3)(21=4)(11=5)
label values gpserv Satisfaction
codebook gpserv
cxxiii | P a g e
codebook hospitalserv
recode hospitalserv (7=6)(8=.)
recode hospitalserv (1=11)(2=21)(3=31)(4=41)(5=51)
recode hospitalserv (51=1)(41=2)(31=3)(21=4)(11=5)
label values hospitalserv Satisfaction
codebook hospitalserv
codebook dentalserv
recode dentalserv (7=6)(8=.)
recode dentalserv (1=11)(2=21)(3=31)(4=41)(5=51)
recode dentalserv (51=1)(41=2)(31=3)(21=4)(11=5)
label values dentalserv Satisfaction
codebook dentalserv
codebook residentsinterest
recode residentsinterest 6=.
recode residentsinterest (1=11)(2=21)(3=31)(4=41)
recode residentsinterest (41=1)(31=2)(21=3)(11=4)
label values residentsinterest Promotes
codebook residentsinterest
codebook residentsconcern
recode residentsconcern 6=.
recode residentsconcern (1=11)(2=21)(3=31)(4=41)
recode residentsconcern (41=1)(31=2)(21=3)(11=4)
label values residentsconcern Promotes
codebook residentsconcern
codebook areasafer
recode areasafer 6=.
cxxiv | P a g e
recode areasafer (1=11)(2=21)(3=31)(4=41)
recode areasafer (41=1)(31=2)(21=3)(11=4)
label values areasafer Promotes
codebook areasafer
* checking the correlation between explanatory variables (results are intuitive)
pwcorr limitactive sex
pwcorr limitactive econactive
pwcorr age sex
pwcorr age econactive
pwcorr age chrillness
pwcorr sex econactive
pwcorr sex chrillness
pwcorr econactive chrillness
* imputation of missing values for explanatory variables
*1. lsoa
codebook lsoa
summarize lsoa
*2. Gender (in variable 'male' 1=male, 0=female)
codebook sex
recode sex 3=.
impute sex lsoa chrillness econactive safeday safenight residentsconcern involveddecision influencedecision councilperf voting getinvolved goodtolive respchildren noisyparty teeninstreets rubbish drunkards vandalism drugs betcrime bethealth betedn betstreets betcultact betparks betcomact bethousing, gen(gender)
recode gender (1/1.5=1)(1.5/max=2)
codebook sex
gen male=gender
recode male 2=0
cxxv | P a g e
tab male
label values male YesNo
*3 age (in variable agework, 1=working age 18-65, 0= 65+)
summarize age
codebook age
tab age if age==0
recode age 0=.
impute age lsoa chrillness econactive gender safeday safenight residentsconcern involveddecision influencedecision councilperf voting getinvolved goodtolive respchildren noisyparty teeninstreets rubbish drunkards vandalism drugs betcrime bethealth betedn betstreets betcultact betparks betcomact bethousing, gen(impage)
recode impage (min/25=1)(25/35=2)(35/45=3)(45/55=4)(55/65=5)(65/75=6)(75/max=7), gen (ageband)
tab ageband
recode ageband (1/5=1)(6/max=0), gen(agework)
tab agework
label values agework YesNo
*4. Economically active/employement (after imputation there is comparitively a sharp jump in student category, 'employed'1=yes )
codebook econactive
recode econactive 11=.
impute econactive lsoa impage gender chrillness safeday safenight residentsconcern residentsinterest involveddecision influencedecision councilperf voting getinvolved goodtolive respchildren noisyparty teeninstreets rubbish drunkards vandalism drugs betcrime bethealth betedn betstreets betparks bethousing, gen(impeconactive)
recode impeconactive (min/1.5=1)(1.5/2.5=2)(2.5/3.5=3)(3.5/4.5=4)(4.5/5.5=5)(5.5/6.5=6)(6.5/7.5=7)(7.5/8.5=8)(8.5/9.5=9)(9.5/max=10)
label values impeconactive q33
codebook impeconactive
recode impeconactive (1/4=1)(4/max=0), gen (employed)
tab employed
cxxvi | P a g e
label values employed YesNo
*5 Chronic Illness
codebook chrillness
recode chrillness 3=.
impute chrillness lsoa impage gender impeconactive safeday safenight residentsconcern residentsinterest involveddecision influencedecision councilperf voting getinvolved goodtolive respchildren noisyparty teeninstreets rubbish drunkards vandalism drugs betcrime bethealth betedn betstreets betparks bethousing, gen(illness)
recode illness (min/1.5=1)(1.5/max=2)
tab illness
recode illness 2=0
tab illness
codebook illness
label values illness YesNo
*6 limited activity due to illness
tab limitactive
recode limitactive 3=.
recode limitactive .=2 if illness==0
impute limitactive lsoa impage male employed safeday safenight residentsconcern residentsinterest involveddecision influencedecision councilcontact councilperf voting getinvolved psserv goodtolive respchildren noisyparty teeninstreets rubbish drunkards vandalism drugs betcrime bethealth betstreets bethousing if illness==1, gen(disabled)
tab disabled
recode disabled (min/1=1)(1.003/max=2)
tab disabled
recode disabled (.=0)(2=0)
label values disabled YesNo
* Variables not considered for appending
cxxvii | P a g e
*councilcode booster q1edit_8 q1edit_21 q1edit_22 q1edit_23 q1edit_24 q1edit_25 q1ans q2edit_8 q2edit_21 q2edit_22 q2edit_23 q2edit_24 q2edit_25 q2ans q4 q3q4both q3q4base r_q3ni5 q5 r_q5ni2 q6b q6e q8a q8b q8c q8d q8e q8f q8g q8h q8i q8j q8k q9a q9b q9c q9d q9e q9f q9g q9h q10 q12f q12g q12h r_q12gni37 r_q13ni4 r_q15ni6 q161 q162 q163 q164 q165 q166 q167 q16any q16base r_q17ni22 q18 r_q18ni1 q19 r_q19ni23 q20 r_q20ni140 q21 r_q23ni139 q247 NI17score NI17score_r NI17base r_q246ni41 r_q245ni42 r_q25ni27 r_q26ni21 r_q28_a r_q28_b q29 r_q29ni119 q30 q30a r_Q30 q31 q31i q32 q32i q33a q36 q36a r_q36 q37 q37a q38 bq27 bq28_1 bq28_2 bq28_3 bq28_4 bq28_5 bq28_6 bq28_7 bq28_8 bq28_9 bq28_10 bq28_11 bq28_12 bq28_13 q41 q42 wt wtall newwt newwtall r_q28_w r_q36b r_q3 r_q11 r_q4_1 r_q5_1 r_q6a_1 r_q6b_1 r_q6c_1 r_q6d_1 r_q6e_1 r_q7a_1 r_q7b_1 r_q7c_1 r_q7d_1 r_q7e_1 r_q8a_1 r_q8b_1 r_q8c_1 r_q8d_1 r_q8e_1 r_q8f_1 r_q8g_1 r_q8h_1 r_q8i_1 r_q8j_1 r_q8k_1 r_q10_1 r_q12a_1 r_q12b_1 r_q12c_1 r_q12d_1 r_q12e_1 r_q12f_1 r_q12g_1 r_q12h_1 r_q13_1 r_q17_1 r_q18_1 r_q19_1 r_q20_1 r_q22_1 r_q23_1 r_q24a_1 r_q24b_1 r_q24c_1 r_q24d_1 r_q24e_1 r_q24f_1 r_q24g_1 r_q25_1 r_q26_1 r_bq27 r_bq27_1 filter__ LSOASHORT WARDNAME WARDCODE areacod
Warrington survey 2010
* converted data set in SPSS to Stata using stat transfer v8.
*categorize the variables as explanatory and dependent
* Creation of value labels
label define Satisfaction 1 "Very dissatisfied" 2 "fairly dissatisfied" 3 "Neither" 4 "fairly satisfied" 5 "very satisfied" 6 "don't know" 7 "not applicable",
label define YesNo 0 "no" 1 "yes"
label define safenightorday 1 "very unsafe" 2 "fairly unsafe" 3 "Neither" 4 "fairly safe" 5 "very safe" 6 "don't know"
label define AgreeVivek 1 "Def disagree" 2 "tend to disagree" 3 "tend to agree" 4 "Def agree" 5 "dont know"
label define involveddecision 0 "No" 1 "Depends on the issue" 2 "Yes" 3 "dont know"
label define informed 1 "Not informed at all" 2 "not well informed" 3 "fairly well informed" 4 "Well informed" 5 "dont know"
label define Promotes 1 "Not at all" 2 "not very much" 3 "to some extent" 4 "great deal" 5 "dont know"
label define yq53_1 5 "At least once a week" 4 "Less than once a week but at least once a month" 3 "Less often" 2 "I give unpaid help as an individual only and not through group(s), club(s) or or" 1 "I have not given any unpaid help at all over the last 12 months" 6 "Don't know" 7 "Not stated", replace
* renaming of independent variables
rename Year year
rename lsoacode lsoa
replace lsoa=substr(lsoa,2,.)
cxxviii | P a g e
destring lsoa, replace
rename yq46_1 sex
rename yq48_1 chrillness
rename yq51_1 econactive
rename yq49_1 limitactive
rename yq47sum age
*renaming of dependent variables
rename yq1_1a neednature
rename yq1_1b needteen
rename yq1_1c needhousing
rename yq1_1d needstreets
rename yq1_1e needcomact
rename yq1_1f needcultact
rename yq1_1g neededn
rename yq1_1p needparks
rename yq1_1w needsports
rename yq1_1k needhealth
rename yq1_1l needjobs
rename yq1_1y needwages
rename yq1_1m neednocrime
rename yq1_1n neednopollution
rename yq1_1o neednotrafffic
rename yq1_1q needpubtrans
rename yq1_1u needrace
rename yq1_1t needroads
rename yq1_1v needshopping
rename yq2_1a betnature
rename yq2_1b betteen
rename yq2_1c bethousing
cxxix | P a g e
rename yq2_1d betstreets
rename yq2_1e betcomact
rename yq2_1f betcultact
rename yq2_1g betedn
rename yq2_1p betparks
rename yq2_1w betsports
rename yq2_1k bethealth
rename yq2_1l betjobs
rename yq2_1y betwages
rename yq2_1m betcrime
rename yq2_1n betpollution
rename yq2_1o bettraffic
rename yq2_1q betpubtrans
rename yq2_1u betrace
rename yq2_1t betroads
rename yq2_1v betshopping
rename yq6_1 goodtolive
rename yq17_2 noisyparty
rename yq17_1 teeninstreets
rename yq17_6 drunkards
rename yq17_4 vandalism
rename yq17_3 rubbish
rename yq17_5 drugs
rename yq15_1 safenight
rename yq16_1 safeday
rename yq18_1 residentsopinion
rename yq19_1 policeeffective
rename yq3_1 influencedecision
rename yq4_1 involveddecision
rename yq53_1 volunteer
cxxx | P a g e
rename yq7_10 psserv
rename yq13_2 policeserv
rename yq13_4 gpserv
rename yq13_5 hospitalserv
rename yq13_6 dentalserv
rename yq13_3 fireserv
rename yq13_1 councilserv
rename yq30_1 councilcontact
codebook neednature needteen needhousing needstreets needcomact needcultact neededn needhealth needjobs neednocrime neednopollution neednotrafffic needparks needpubtrans needrace needroads needshopping needsports needwages
codebook betnature betteen bethousing betstreets betcomact betcultact betedn bethealth betjobs betcrime betpollution bettraffic betparks betpubtrans betrace betroads betshopping betsports betwages
* recoding of other indicators so that progression is one way and all 'not answered' responses recoded =.
codebook goodtolive
recode goodtolive 6=.
recode goodtolive (1=6)(2=7)(3=8)(4=9)(5=10)
recode goodtolive (10=1)(9=2)(8=3)(7=4)(6=5)
label values goodtolive Satisfaction
tab goodtolive
codebook noisyparty
codebook teeninstreets
codebook drunkards
codebook vandalism
codebook rubbish
codebook drugs
codebook safenight
recode safenight (1=11)(2=21)(3=31)(4=41)(5=51)
cxxxi | P a g e
recode safenight (51=1)(41=2)(31=3)(21=4)(11=5)
label values safenight safenightorday
codebook safeday
recode safeday (1=11)(2=21)(3=31)(4=41)(5=51)
recode safeday (51=1)(41=2)(31=3)(21=4)(11=5)
label values safeday safenightorday
* lable values 'agree' are replaced by 'Satisfaction' (gradations are same)
codebook residentsopinion
recode residentsopinion (1=11)(2=21)(3=31)(4=41)(5=51)
recode residentsopinion (51=1)(41=2)(31=3)(21=4)(11=5)
label values residentsopinion Satisfaction
codebook residentsopinion
* lable values 'agree' are replaced by 'Satisfaction' (gradations are same)
codebook policeeffective
recode policeeffective (1=11)(2=21)(3=31)(4=41)(5=51)
recode policeeffective (51=1)(41=2)(31=3)(21=4)(11=5)
label values policeeffective Satisfaction
codebook policeeffective
codebook influencedecision
recode influencedecision (1=11)(2=21)(3=31)(4=41)
recode influencedecision (41=1)(31=2)(21=3)(11=4)
label value influencedecision AgreeVivek
codebook influencedecision
codebook involveddecision
recode involveddecision 2=0
cxxxii | P a g e
recode involveddecision 1=2
recode involveddecision 3=1
label values involveddecision involveddecision
codebook involveddecision
codebook volunteer
recode volunteer (1=11)(2=21)(3=31)(4=41)(5=51)
recode volunteer (51=1)(41=2)(31=3)(21=4)(11=5)
codebook volunteer
codebook psserv
recode psserv (1=11)(2=21)(3=31)(4=41)(5=51)
recode psserv (51=1)(41=2)(31=3)(21=4)(11=5)
label values psserv Satisfaction
codebook psserv
codebook fireserv
recode fireserv (1=11)(2=21)(3=31)(4=41)(5=51)
recode fireserv (51=1)(41=2)(31=3)(21=4)(11=5)
label values fireserv Satisfaction
codebook fireserv
codebook councilserv
recode councilserv (1=11)(2=21)(3=31)(4=41)(5=51)
recode councilserv (51=1)(41=2)(31=3)(21=4)(11=5)
label values councilserv Satisfaction
tab councilserv
codebook policeserv
cxxxiii | P a g e
recode policeserv (1=11)(2=21)(3=31)(4=41)(5=51)
recode policeserv (51=1)(41=2)(31=3)(21=4)(11=5)
label values policeserv Satisfaction
codebook policeserv
codebook gpserv
recode gpserv (1=11)(2=21)(3=31)(4=41)(5=51)
recode gpserv (51=1)(41=2)(31=3)(21=4)(11=5)
label values gpserv Satisfaction
codebook gpserv
codebook hospitalserv
recode hospitalserv (1=11)(2=21)(3=31)(4=41)(5=51)
recode hospitalserv (51=1)(41=2)(31=3)(21=4)(11=5)
label values hospitalserv Satisfaction
codebook hospitalserv
codebook dentalserv
recode dentalserv (1=11)(2=21)(3=31)(4=41)(5=51)
recode dentalserv (51=1)(41=2)(31=3)(21=4)(11=5)
label values dentalserv Satisfaction
codebook dentalserv
* checking the correlation between explanatory variables (results are intuitive)
pwcorr limitactive sex
pwcorr limitactive econactive
pwcorr age sex
pwcorr age econactive
pwcorr age chrillness
pwcorr sex econactive

cxxxiv | P a g e
pwcorr sex chrillness
pwcorr econactive chrillness
* imputation of missing values for explanatory variables
*1. lsoa
codebook lsoa
summarize lsoa
*2. Gender (in variable 'male' 1=male, 0=female)
codebook sex
rename sex gender
gen male=gender
recode male 2=0
tab male
label values male YesNo
*3 age (in variable agework, 1=working age 18-65, 0= 65+)
codebook age
rename age ageband
recode ageband (1/5=1)(6/max=0), gen(agework)
tab agework
label values agework YesNo
*4. Economically active/employement (after imputation there is comparitively a sharp jump in student category, 'employed'1=yes )
codebook econactive
impute econactive lsoa ageband gender chrillness safeday safenight involveddecision influencedecision goodtolive noisyparty teeninstreets rubbish drunkards vandalism drugs betcrime bethealth betedn betstreets councilcontact residentsopinion betparks councilserv policeserv fireserv gpserv hospitalserv bethousing, gen(impeconactive)
cxxxv | P a g e
recode impeconactive (min/1.5=1)(1.5/2.5=2)(2.5/3.5=3)(3.5/4.5=4)(4.5/5.5=5)(5.5/6.5=6)(6.5/7.5=7)(7.5/8.5=8)(8.5/9.5=9)(9.5/max=10)
label values impeconactive yq51_1
codebook impeconactive
recode impeconactive (1/4=1)(4/max=0), gen (employed)
tab employed
label values employed YesNo
*5 Chronic Illness
codebook chrillness
impute chrillness lsoa ageband gender impeconactive safeday safenight involveddecision influencedecision goodtolive noisyparty teeninstreets rubbish drunkards vandalism drugs betcrime bethealth betedn betstreets councilcontact residentsopinion betparks councilserv policeserv fireserv gpserv hospitalserv bethousing, gen(illness)
recode illness (min/1.5=1)(1.5/max=2)
tab illness
recode illness 2=0
tab illness
codebook illness
label values illness YesNo
*6 limited activity due to illness
codebook limitactive
recode limitactive .=2 if illness==0
impute limitactive lsoa ageband gender impeconactive safeday safenight involveddecision influencedecision goodtolive noisyparty teeninstreets rubbish drunkards vandalism drugs betcrime bethealth betedn betstreets councilcontact residentsopinion betparks councilserv policeserv fireserv gpserv hospitalserv bethousing if illness==1, gen(disabled)
recode disabled (min/1.5=1)(1.5/max=2)
recode disabled (.=0)(2=0)
label values disabled YesNo

cxxxvi | P a g e
*List of variables not included for appending
*yq1_1h yq1_1i yq1_1j yq1_1r yq1_1s yq1_1x yq1_1z yq1_1aa yq2_1h yq2_1i yq2_1j yq2_1r yq2_1s yq2_1x yq2_1z yq2_1aa yq5_1 yq7_1 yq7_2 yq7_3 yq7_4 yq7_5 yq7_6 yq7_7 yq7_8 yq7_9 yq7_11 yq7_12 yq7_13 yq7_14 yq7_15 yq7_16 yq8_1 yq9_1 yq10_1 ygq10 ygq10a yq11_1 yq11_2 yq11_3 yq11_4 yq11_5 yq11_6 yq11_7 yq14_1 yq17_7 yq17_8 yq20_1 yq21_1 yq22_1 yq23_1 yq24_1 yq25_1 yq26_1a yq26_1b yq26_1c yq26_1d yq26_1e yq26_1f yq26_1g yq26_1h yq26_1i yq26_1j yq26_1k yq26_1l yq26_1m yq26_1n yq26_1o yq26_1p yq26_1q yq26_1r yq26_1s yq26_1t yq26_1u yq26_1v yq26_1w yq26_1x yq26_1y yq26_1z yq26_1aa yq26_1ab yq27_1 yq28_1a yq28_1b yq28_1c yq28_1d yq28_1e yq28_1f yq28_1g yq28_1h yq28_1i yq28_1j yq28_1k yq28_1l yq28_1m yq28_1n yq28_1o yq28_1p yq28_1q yq28_1r yq28_1s yq28_1t yq28_1u yq28_1v yq28_1w yq28_1x yq28_1y yq28_1z yq28_1aa yq28_1ab yq29_1 yq31_1 yq31_2 yq31_3 yq31_4 yq31_5 yq31_6 yq31_7 yq31_8 yq31_9 yq31_10 yq31_11 yq31_12 yq31_13 yq31_14 yq31_15 yq31_16 yq34_1 yq35_1a yq35_1b yq35_1c yq35_1d yq35_1e yq35_1f yq35_1g yq35_1h yq35_1i yq35_1j yq35_1k yq35_1l yq35_1m yq35_1n yq36_1 yq37_1 yq38_1 yq39_1 yq40_1 yq41_1 yq40_2 yq41_2 yq40_3 yq41_3 yq40_4 yq41_4 yq40_5 yq41_5 yq42_1 yq43_1 yq44_1 yq45_1 yq45_2 yq50_1 yq52_1 yq54_1 yq54_2 yq55_1 yq56_1 yq57_1 yq59_1a yq59_1b yq59_1c yq59_1d yq59_1e yq59_1f yq59_1g yq59_1h yq59_1i yq59_1j yq59_1k yq59_1l yq59_1m yq59_1n yq59_1o yq59_1p yq59_1q yq59_1r neigh pwt lsoaname lsoashort wardcode wardname
Warrington survey combined data set
*appending survey data for 2008 and 2010
append using "H:\Warrington\2008 recoded abr.dta" , nolabel
append using "H:\Warrington\2010 recoded abr.dta", nolabel
recode disabled .=0 if year==2006
*merging with IMD data
merge m:1 lsoa using "H:\Warrington\imd.dta", keepusing(imd07 imd08 imd10 imdrank)
tab year
gen imd=imd07 if year==2006
replace imd=imd08 if year==2008
replace imd=imd10 if year==2010
tab imd if imd==.
gen imdsq=imd^2
*generating comparator and stiw
recode imdrank (min/16=1)(16/max=0), gen (comparison)
cxxxvii | P a g e
gen stiw=1 if lsoa==01012453 | lsoa==01012455 | lsoa==01012520 | lsoa==01012526 | lsoa==01012533 | lsoa==01012534 | lsoa==01012536 | lsoa==01012545 | lsoa==01012546
recode stiw .=0
codebook stiw
* Checking for completeness of observations
tab year
tab lsoa year
tab gender year
tab male year
tab ageband year
tab agework year
tab impeconactive year
tab employed year
tab illness year
tab disabled year
tab policeserv year
tab gpserv year
tab hospitalserv year
tab dentalserv year
tab volunteer year
tab residentsopinion year
tab policeeffective year
tab year
codebook lsoa
tab gender year
tab male year
tab ageband year
tab agework year
tab impeconactive year
cxxxviii | P a g e
tab employed year
tab illness year
tab disabled year
*Generating Dichotomous variables for logistic regression
codebook goodtolive
recode goodtolive (5=1)(1/4=0), gen(goodtolivelr)
codebook goodtolivelr
codebook goodtolive
codebook respchildren
recode respchildren (4=1)(5=0)(1/3=0), gen(respchildrenlr)
codebook respchildrenlr
codebook noisyparty
recode noisyparty (4=1)(1/3=0)(5=0), gen(noisypartylr)
codebook noisypartylr
codebook teeninstreets
recode teeninstreets (4=1)(1/3=0)(5=0), gen (teeninstreetslr)
codebook teeninstreetslr
codebook drunkards
recode drunkards (4=1)(1/3=0)(5=0), gen(drunkardslr)
codebook drunkardslr
codebook vandalism
recode vandalism (4=1)(1/3=0)(5=0), gen(vandalismlr)
codebook vandalismlr
cxxxix | P a g e
codebook rubbish
recode rubbish (4=1)(1/3=0)(5=0), gen(rubbishlr)
codebook rubbishlr
codebook drugs
recode drugs (4=1)(1/3=0)(5=0), gen(drugslr)
codebook drugslr
codebook safenight
recode safenight (5=1)(1/4=0)(6=0), gen(safenightlr)
codebook safenightlr
codebook safeday
recode safeday (5=1)(1/4=0)(6=0), gen(safedaylr)
codebook safedaylr
codebook residentsopinion
recode residentsopinion(5=1)(1/4=0)(6=0), gen(residentsopinionlr)
codebook residentsopinionlr
codebook policeeffective
recode policeeffective(5=1)(1/4=0)(6=0), gen(policeeffectivelr)
codebook policeeffectivelr
codebook influencedecision
recode influencedecision(4=1)(1/3=0)(5=0), gen(influencedecisionlr)
codebook influencedecisionlr
codebook involveddecision
recode involveddecision (2=1)(min/1=0)(3=0), gen(involveddecisionlr)
cxl | P a g e
codebook involveddecisionlr
codebook volunteer
recode volunteer (4/5=1)(1/3=0)(6=0), gen(volunteerlr)
codebook volunteerlr
codebook getinvolved
recode getinvolved (4=1)(1/3=0)(5/max=0), gen(getinvolvedlr)
codebook getinvolvedlr
codebook spending
recode spending (4=1)(1/3=0)(5=0), gen(spendinglr)
codebook spendinglr
codebook standardserv
recode standardserv (4=1)(1/3=0)(5=0), gen(standardservlr)
codebook standardservlr
codebook councilperf
recode councilperf (4=1)(1/3=0)(5=0), gen(councilperflr)
codebook councilperflr
codebook psserv
recode psserv (5=1)(1/4=0), gen(psservlr)
codebook psservlr
codebook fireserv
recode fireserv (5=1)(1/4=0)(6/max=0), gen(fireservlr)
codebook fireservlr
cxli | P a g e
codebook councilserv
recode councilserv (5=1)(1/4=0)(6/max=0), gen(councilservlr)
codebook councilservlr
codebook policeserv
recode policeserv (5=1)(1/4=0)(6/max=0), gen(policeservlr)
codebook policeservlr
codebook gpserv
recode gpserv (5=1)(1/4=0)(6/max=0), gen(gpservlr)
codebook gpservlr
codebook hospitalserv
recode hospitalserv (5=1)(1/4=0)(6/max=0), gen(hospitalservlr)
codebook hospitalservlr
codebook dentalserv
recode dentalserv (5=1)(1/4=0)(6/max=0), gen(dentalservlr)
codebook dentalservlr
codebook councilcontact
recode councilcontact (5=1)(1/4=0)(6/max=0), gen(councilcontactlr)
codebook councilcontactlr
codebook residentsinterest
recode residentsinterest (4=1)(1/3=0)(5=0), gen(residentsinterestlr)
codebook residentsinterestlr
codebook residentsconcern
recode residentsconcern (4=1)(1/3=0)(5=0), gen(residentsconcernlr)
cxlii | P a g e
codebook residentsconcernlr
codebook areasafer
recode areasafer (4=1)(1/3=0)(5=0), gen(areasaferlr)
codebook areasaferlr
*REGRESSION
* 1. The level of crime needs improving (significant)
xi: logit betcrime imdsq male ageband illness employed i.year*stiw if (year == 2006 | year == 2010) & (stiw == 1 | comparison == 1 )
* 2. Need better health services (improved at 2010, but stat not significant)
xi: logit bethealth imdsq male ageband illness employed i.year*stiw if (year == 2006 | year == 2010) & (stiw == 1 | comparison == 1 )
* 3. Need better community activities (improved but not significant)
xi: logit betcomact imdsq male ageband illness employed i.year*stiw if (year == 2006 | year == 2010) & (stiw == 1 | comparison == 1 )
* 4. Need better job propsects ((improved at 2010, but stat not significant)
xi: logit betjobs imdsq male ageband illness employed i.year*stiw if (year == 2006 | year == 2010) & (stiw == 1 | comparison == 1 )
* 5. Agree that area is a good place to live (not significant??)(JL: interpretation between STiW(.104) Vs IyearXstiw(0.256) is it 2008 effect?)
xi: regress goodtolive imdsq male ageband illness employed i.year*stiw if (year == 2006 | year == 2010) & (stiw == 1 | comparison == 1 )
xi: logit goodtolivelr imdsq male ageband illness employed i.year*stiw if (year == 2006 | year == 2010) & (stiw == 1 | comparison == 1 )
* 6. Parents not taking resp for children (significance ??, JL: interpretation: Direction of stiw Vs Iyear2008)
xi: regress respchildren imdsq male ageband illness employed i.year*stiw if (stiw == 1 | comparison == 1 ) & (respchildren <=4)
cxliii | P a g e
xi: logit respchildrenlr imdsq male ageband illness employed i.year*stiw if (stiw == 1 | comparison == 1 )
* 7. problem of Noisy neighbours/loud parties (not significant)
tab noisyparty year
codebook noisyparty
xi: regress noisyparty imdsq male ageband illness employed i.year*stiw if (year == 2006 | year == 2010) & (stiw == 1 | comparison == 1 ) &(noisyparty<=4)
xi: logit noisypartylr imdsq male ageband illness employed i.year*stiw if (year == 2006 | year == 2010) & (stiw == 1 | comparison == 1 )
* 8. Problems of teenagers in streets (p=0 ?? JL: direction of STiW and Iyear 2010)
tab teeninstreets year
codebook teeninstreets
xi: regress teeninstreets imdsq male ageband illness employed i.year*stiw if (year == 2006 | year == 2010) & (stiw == 1 | comparison == 1 ) &(teeninstreets<=4)
xi: logit teeninstreetslr imdsq male ageband illness employed i.year*stiw if (year == 2006 | year == 2010) & (stiw == 1 | comparison == 1 )
* 9. Problem of Drunk and rowdy people (significant JL: direction of STiW and Iyear 2010 )
tab drunkards year
codebook drunkards
xi: regress drunkards imdsq male ageband illness employed i.year*stiw if (year == 2006 | year == 2010) & (stiw == 1 | comparison == 1 ) &(drunkards<=4)
xi: logit drunkardslr imdsq male ageband illness employed i.year*stiw if (year == 2006 | year == 2010) & (stiw == 1 | comparison == 1 )
* 10. Problem of vandalism (significant)
tab vandalism year
codebook vandalism
xi: regress vandalism imdsq male ageband illness employed i.year*stiw if (year == 2006 | year == 2010) & (stiw == 1 | comparison == 1 ) &(vandalism<=4)
xi: logit vandalismlr imdsq male ageband illness employed i.year*stiw if (year == 2006 | year == 2010) & (stiw == 1 | comparison == 1 )
cxliv | P a g e
*11 Problem of rubbish
tab rubbish year
codebook rubbish
xi: regress rubbish imdsq male ageband illness employed i.year*stiw if (year == 2006 | year == 2010) & (stiw == 1 | comparison == 1 ) &(rubbish<=4)
xi: logit rubbishlr imdsq male ageband illness employed i.year*stiw if (year == 2006 | year == 2010) & (stiw == 1 | comparison == 1 )
* 11. Problem of people using drugs (not significant)
tab drugs year
codebook drugs
xi: regress drugs imdsq male ageband illness employed i.year*stiw if (year == 2006 | year == 2010) & (stiw == 1 | comparison == 1 ) &(drugs<=4)
xi: logit drugslr imdsq male ageband illness employed i.year*stiw if (year == 2006 | year == 2010) & (stiw == 1 | comparison == 1 )
* 12. Feeling safe at night (improved at 2010 but not significant)
tab safenight year
codebook safenight
xi: regress safenight imdsq male ageband illness employed i.year*stiw if (year == 2006 | year == 2010) & (stiw == 1 | comparison == 1 ) &(safenight<=5)
xi: logit safenightlr imdsq male ageband illness employed i.year*stiw if (year == 2006 | year == 2010) & (stiw == 1 | comparison == 1 )
* 13. Feeling safe in day (improved at 2010 but not significant)
tab safeday year
codebook safeday
xi: regress safeday imdsq male ageband illness employed i.year*stiw if (year == 2006 | year == 2010) & (stiw == 1 | comparison == 1 ) &(safeday <=5)
xi: logit safedaylr imdsq male ageband illness employed i.year*stiw if (year == 2006 | year == 2010) & (stiw == 1 | comparison == 1 )

cxlv | P a g e
* 14. Do public services/authorities seek your view on these (Crime & ASB) (not significant)
tab residentsopinion year
codebook residentsopinion
xi: regress residentsopinion imdsq male ageband illness employed i.year*stiw if (stiw == 1 | comparison == 1 ) &(residentsopinion <=5)
xi: logit residentsopinionlr imdsq male ageband illness employed i.year*stiw if (stiw == 1 | comparison == 1 )
* 15. How effective are police in dealing with crime and ASB (not significant)
tab policeeffective year
codebook policeeffective
xi: regress policeeffective imdsq male ageband illness employed i.year*stiw if (stiw == 1 | comparison == 1 ) &(policeeffective <=5)
xi: logit policeeffectivelr imdsq male ageband illness employed i.year*stiw if (stiw == 1 | comparison == 1 )
* 16.Ability to influence local decision (improved in 2010 but stat not significant)
tab influencedecision year
codebook influencedecision
xi: regress influencedecision imdsq male ageband illness employed i.year*stiw if (year == 2006 | year == 2010) & (stiw == 1 | comparison == 1 ) &(influencedecision <=4)
xi: logit influencedecisionlr imdsq male ageband illness employed i.year*stiw if (year == 2006 | year == 2010) & (stiw == 1 | comparison == 1 )
* 17. Would you like to be involved in local decision (not significant)
tab involveddecision year
codebook involveddecision
xi: regress involveddecision imdsq male ageband illness employed i.year*stiw if (year == 2006 | year == 2010) & (stiw == 1 | comparison == 1 ) &(involveddecision <=2)
xi: logit involveddecisionlr imdsq male ageband illness employed i.year*stiw if (year == 2006 | year == 2010) & (stiw == 1 | comparison == 1 )
* 18. Amount of volunteering (improved in 2010 nut stat significant)
cxlvi | P a g e
tab volunteer year
codebook volunteer
xi: regress volunteer imdsq male ageband illness employed i.year*stiw if (stiw == 1 | comparison == 1 ) &(volunteer <=5)
xi: logit volunteerlr imdsq male ageband illness employed i.year*stiw if (stiw == 1 | comparison == 1 )
* 20. informed about how to get involved (not sigificant)
tab getinvolved year
codebook getinvolved
xi: regress getinvolved imdsq male ageband illness employed i.year*stiw if (stiw == 1 | comparison == 1 ) &(getinvolved <=4)
xi: logit getinvolvedlr imdsq male ageband illness employed i.year*stiw if (stiw == 1 | comparison == 1 )
* 21. informed about council spending (not sigificant)
tab spending year
codebook spending
xi: regress spending imdsq male ageband illness employed i.year*stiw if (stiw == 1 | comparison == 1 ) &(spending <=4)
xi: logit spendinglr imdsq male ageband illness employed i.year*stiw if (stiw == 1 | comparison == 1 )
* 21. informed about standardserv (not sigificant)
tab standardserv year
codebook standardserv
xi: regress standardserv imdsq male ageband illness employed i.year*stiw if (stiw == 1 | comparison == 1 ) &(standardserv <=4)
xi: logit standardservlr imdsq male ageband illness employed i.year*stiw if (stiw == 1 | comparison == 1 )
* 21. informed about council performance
tab councilperf year
codebook councilperf
xi: regress councilperf imdsq male ageband illness employed i.year*stiw if (stiw == 1 | comparison == 1 ) &(councilperf <=4)
cxlvii | P a g e
xi: logit councilperflr imdsq male ageband illness employed i.year*stiw if (stiw == 1 | comparison == 1 )
* 21. Satisfaction with personal social services (not significant)
tab psserv year
codebook psserv
xi: regress psserv imdsq male ageband illness employed i.year*stiw if (stiw == 1 | comparison == 1 )
xi: logit psservlr imdsq male ageband illness employed i.year*stiw if (stiw == 1 | comparison == 1 )
* 21. Satisfaction with fire services (not significant)
tab fireserv year
codebook fireserv
xi: regress fireserv imdsq male ageband illness employed i.year*stiw if (year == 2006 | year == 2010) &(stiw == 1 | comparison == 1 ) &(fireserv>=5)
xi: logit fireservlr imdsq male ageband illness employed i.year*stiw if (year == 2006 | year == 2010) &(stiw == 1 | comparison == 1 )
* 22. Satisfaction with council services (sgnificant in linear but not in logit)
tab councilserv year
tab councilserv year
xi: regress councilserv imdsq male ageband illness employed i.year*stiw if (year == 2006 | year == 2010) & (stiw == 1 | comparison == 1 ) &(councilserv <=5)
xi: logit councilservlr imdsq male ageband illness employed i.year*stiw if (year == 2006 | year == 2010) & (stiw == 1 | comparison == 1 )
* 23. Satisfaction with police services (not significant)
tab policeserv year
codebook policeserv
xi: regress policeserv imdsq male ageband illness employed i.year*stiw if (stiw == 1 | comparison == 1 ) &(policeserv <=5)
xi: logit policeservlr imdsq male ageband illness employed i.year*stiw if (stiw == 1 | comparison == 1 )
* 24. Satisfaction with GP services (not significant)

cxlviii | P a g e
tab gpserv year
codebook gpserv
xi: regress gpserv imdsq male ageband illness employed i.year*stiw if (stiw == 1 | comparison == 1 ) &(gpserv <=5)
xi: logit gpservlr imdsq male ageband illness employed i.year*stiw if (stiw == 1 | comparison == 1 )
* 25. Satisfaction with hospital services (Not significant)
tab hospitalserv year
codebook hospitalserv year
xi: regress hospitalserv imdsq male ageband illness employed i.year*stiw if (stiw == 1 | comparison == 1 ) &(hospitalserv <=5)
xi: logit hospitalservlr imdsq male ageband illness employed i.year*stiw if (stiw == 1 | comparison == 1 )
* 25. Satisfaction with dental services (Not significant)
tab dentalserv year
codebook dentalserv
xi: regress dentalserv imdsq male ageband illness employed i.year*stiw if (stiw == 1 | comparison == 1 ) &(dentalserv <=5)
xi: logit dentalservlr imdsq male ageband illness employed i.year*stiw if (stiw == 1 | comparison == 1 )
* 26. Satisfaction of contact with council (significant )
tab councilcontact year
codebook councilcontact
xi: regress councilcontact imdsq male ageband illness employed i.year*stiw if (stiw == 1 | comparison == 1 ) &(councilcontact <=5)
xi: logit councilcontactlr imdsq male ageband illness employed i.year*stiw if (stiw == 1 | comparison == 1 )
* 27. Takes into consideration residents interest (not significant)
tab residentsinterest year
codebook residentsinterest year
xi: regress residentsinterest imdsq male ageband illness employed i.year*stiw if (stiw == 1 | comparison == 1 ) &(residentsinterest <=4)
cxlix | P a g e
xi:logit residentsinterestlr imdsq male ageband illness employed i.year*stiw if (stiw == 1 | comparison == 1 )
* 28. Takes into consideration residents concerns (not significant)
tab residentsconcern year
codebook residentsconcern
xi: regress residentsconcern imdsq male ageband illness employed i.year*stiw if (stiw == 1 | comparison == 1 ) &(residentsconcern <=4)
xi: logit residentsconcernlr imdsq male ageband illness employed i.year*stiw if (stiw == 1 | comparison == 1 )
* 27. Does council makes area safer (not significant)
tab areasafer year
codebook areasafer
xi: regress areasafer imdsq male ageband illness employed i.year*stiw if (stiw == 1 | comparison == 1 ) &(areasafer <=4)
xi: logit areasaferlr imdsq male ageband illness employed i.year*stiw if (stiw == 1 | comparison == 1 )
Household survey combined data set
*Renaming variables
rename coderesp id
ren q1_1 noisyparty
label variable noisyparty "1.2 how much of a problem:Noisy neighbours or loud parties "
label variable q1_2 "1.2 how much of a problem:Teenagers hanging around on the streets"
rename q1_2 teeninstreets
label variable noisyparty "1.1 how much of a problem:Noisy neighbours or loud parties "
label variable q1_3 "1.3 how much of a problem:Rubbish and litter lying around"
rename q1_3 rubbish
label variable q1_4 "1.4 how much of a problem:People being drunk or rowdy in public spaces"
rename q1_4 drunkards
label variable q1_5 "1.5 how much of a problem:Abandoned or burnt out cars"
cl | P a g e
rename q1_5 burntcars
label variable q1_6 "1.6 how much of a problem:Vandalism and graffiti "
rename q1_6 vandalism
label variable q1_7 "1.7 how much of a problem:deliberate damage to property or vehicles"
rename q1_7 damgetoproperty
label variable q1_8 "1.8 how much of a problem:People using or dealing drugs "
rename q1_8 drugs
label variable q1_9 "1.9 how much of a problem:People being attacked because of their skin colour, "
rename q1_9 race
rename q2 policeeffective
rename q3 informedasb
label variable q4 "4. Parents not taking responsibility for children"
rename q4 respchildren
label variable policeeffective "2. How successful are police in dealing with it "
label variable policeeffective "2. How successful are police in dealing with asb "
label variable informedasb "3. informed about tackling ASB"
label variable policeeffective "2. How successful are police in dealing with ASB"
label variable q5 "5. People treat each other with respect"
rename q5 RESPECT
rename RESPECT respect
label variable q6 "6. Overall satisfaction with the area living currently"
rename q6 goodtolive
label variable q7 "7. Area got better than last year"
rename q7 areagotbetter
label variable q8_1 "8.1 satisafction with waste services"
rename q8_1 wasteserv
label variable q8_2 "8.2 satisfaction with park services"
rename q8_2 parkserv
label variable q10 "10. self rating of: health in the last one year"
rename q10 healthrating
cli | P a g e
label variable q11 "11. have you ever smoked"
rename q11 smoker
label variable q12 "12. freuqency of smoking"
rename q12 smokefreq
label variable q13 "13. like to quit smoking"
rename q13 quitsmoking
label variable q15 "15. how many portions of fruits or veg/day"
rename q15 fruits
label variable q16 "16. do you do moderate exercise "
rename q16 modexer
label variable q17 "17. do you do vigorous exercise "
rename q17 vigexer
label variable q18 "18. interest in new things."
rename q18 newthings
label variable q19 "19. feeling good about myself"
rename q19 feelgood
label variable q20a "20.a helped as relative in last 12 months"
rename q20a helprelative
label variable q20b "20.b. helped family member in last 12 months"
rename q20b helpfamily
label variable q21 "21. given unpaid help in last 12 months"
rename q21 volunteer
label variable q22 "22. Ability to influence decisions in local area"
rename q22 influencedecision
label variable q23 "23. race realtion people get on well"
label variable q24 "24. have you attended community events in 12 months"
rename q24 attendevent
label variable q25 "25. satisfaction with those events"
rename q25 satevents
label variable q26_1 "26. satisfactuion with environmental services"
clii | P a g e
rename q26_1 envserv
label variable q26_2 "26.1 satisfaction with"
rename q26_2 comfacil
label variable envserv "26.1. satisfactuion with environmental services"
label variable comfacil "26.2 satisfaction with"
label variable q26_3 "26.3 satisfaction with health services"
rename q26_3 healthserv
label variable q26_4 "26.4 satisfaction with crime services"
rename q26_4 crimeserv
label variable q26_5 "26.5 satisfaction with events "
rename q26_5 eventserv
label variable q26_6 "26.6 satisfaction with children and young people services"
rename q26_6 childserv
label variable q26_7 "26.7 satisfaction with education services"
rename q26_7 ednserv
label variable q26_8 "26.8 satisfaction with social capital/income/employment"
rename q26_8 econserv
label variable q27 "27. one thing which needs improvemnt to make biggest difference"
rename q27 needsimpr
label variable lsoaname "LSOA code"
rename lsoaname lsoa
tab year if year==., missing
*transforming lsoa variable
gen temp ="e0101"
gen lsoa=( temp+ temp2)
drop temp
drop temp2
drop if lsoa=="e0101." in 1/302 (observation with missing values for lsoa)
replace lsoa=substr(lsoa,2,.)
cliii | P a g e
destring lsoa, replace
*Generating unique id
gen tempyearstr=year
tostring tempyearstr, replace
gen uniqueid=( tempyearstr+ id)
drop tempyearstr
drop tempid
replace id=uniqueid
drop uniqueid
destring id, replace
*Explanatory varaibles
gen qualification=0
replace qualification=1 if q9_1==1
replace qualification=1 if q9_2==1
replace qualification=2 if q9_3==1
replace qualification=2 if q9_4==1
replace qualification=3 if q9_5==1|q9_6==1
replace qualification=4 if q9_7==1
replace qualification=4 if q9_8==1
replace qualification=4 if q9_9==1
replace qualification=4 if q9_10==1
replace qualification=4 if q9_11==1
replace qualification=5 if q9_12==1
recode qualification 0=.
cliv | P a g e
label define qualification 1 "O level" 2 "A level" 3 "first Degree or masters" 4 "vocational & other " 5 "no qualifications"
codebook qualification
ren qualification education
recode education (1=11)(2=21)(3=31)(4=41)(5=51)
recode education (51=0)(41=1)(11=2)(21=3)(31=4)
label define qualification 2 "O level" 3 "A level" 4 "first Degree or masters" 1 "vocational & other " 0 "no qualifications", replace
codebook education
codebook smoker
recode smoker 2=0
codebook smoker
codebook newthings
recode newthings (1=1)(2/max=0)
codebook newthings
codebook feelgood
recode feelgood (1=1) (2/max=0)
codebook feelgood
codebook healthrating
recode healthrating (1=1)(2/max=0)
codebook healthrating
pwcorr healthrating feelgood
pwcorr newthings healthrating
pwcorr feelgood newthings
clv | P a g e
drop newthingslr feelgoodlr healthratinglr
*Dependent variables
label define satisfied 5 "Very satisfied" 4 "Fairly satisfied" 3 "Neither satisfied or dissatisfied" 2 "Fairly dissatisfied" 1 "Very dissatisfied" 6 "dont know", replace
label define informed 4 "Very well informed" 3 "Fairly well informed" 2 "Not very well informed" 1 "Not well informed at all" 5 "Don't know", replace
label define job 6 "A very good job" 5 "A good job" 4 "A fairly good job" 3 "A fairly bad job" 2 "A bad job" 1 "A very bad job" 7 "No opinion", replace
label define agree 4 "Definitely agree" 3 "Tend to agree" 2 "Tend to disagree" 1 "Definitely disagree" 5 "Don't know", replace
label define yesnovivek 0 "No" 1 "Yes"
codebook goodtolive
recode goodtolive (1=11)(2=21)(3=31)(4=41)(5=51)
recode goodtolive (51=1)(41=2)(31=3)(21=4)(11=5)
codebook goodtolive
codebook respchildren
codebook noisyparty
codebook respchildrenlr
codebook noisyparty
codebook noisypartylr
codebook teeninstreets
codebook drunkards
codebook vandalism
codebook rubbish
codebook drugs
codebook informedasb
recode informedasb(1=11)(2=21)(3=31)(4=41)
recode informedasb(41=1)(31=2)(21=3)(11=4)
clvi | P a g e
codebook informedasb
codebook policeeffective
recode policeeffective (1=11)(2=21)(3=31)(4=41)(5=51)(6=61)
recode policeeffective (61=1)(51=2)(41=3)(31=4)(21=5)(11=6)
codebook policeeffective
codebook influencedecision
recode influencedecision (1=11)(2=21)(3=31)(4=41)
recode influencedecision (41=1)(31=2)(21=3)(11=4)
codebook influencedecision
codebook healthserv
recode healthserv (1=11)(2=21)(3=31)(4=41)(5=51)
recode healthserv (51=1)(41=2)(31=3)(21=4)(11=5)
codebook healthserv
codebook econserv
recode econserv (1=11)(2=21)(3=31)(4=41)(5=51)
recode econserv (51=1)(41=2)(31=3)(21=4)(11=5)
codebook econserv
codebook crimeserv
recode crimeserv (1=11)(2=21)(3=31)(4=41)(5=51)
recode crimeserv (51=1)(41=2)(31=3)(21=4)(11=5)
codebook crimeserv
* These varibale have yes or no answers and hence considered only for logit
pwcorr helprelative helpfamily
codebook helprelative
clvii | P a g e
codebook helpfamily
codebook volunteer
codebook quitsmoking
* values of these vraibles progrees positively and hence no need to change
codebook econserv
codebook crimeserv
codebook healthserv
codebook fruits
codebook healthserv
codebook fruits
codebook modexer
codebook vigexer
*generating bivariate dependent variables
tab goodtolive
recode goodtolive(1=1)(1/max=0), gen (goodtolivelr)
tab respchildren
recode respchildren(1=1)(1/max=0), gen(respchildrenlr)
label values respchildrenlr yesnovivek
codebook noisyparty
recode noisyparty(4=1)(1/3=0)(5=0), gen(noisypartylr)
label values noisypartylr yesnovivek
codebook noisyparty
codebook teeninstreets
clviii | P a g e
recode teeninstreets (4=1) (1/3=0)(5=0), gen(teeninstreetslr)
labe values teeninstreetslr yesnovivek
codebook teeninstreetslr
codebook drunkards
recode drunkards(4=1) (1/3=0)(5=0), gen(drunkardslr)
labe values drunkardslr yesnovivek
codebook drunkardslr
codebook vandalism
recode vandalism(4=1) (1/3=0)(5=0), gen(vandalismlr)
labe values vandalismlr yesnovivek
codebook vandalismlr
codebook rubbish
recode rubbish(4=1) (1/3=0), gen(rubbishlr)
labe values rubbishlr yesnovivek
codebook rubbishlr
codebook drugs
recode drugs(4=1) (1/3=0)(5=0), gen(drugslr)
labe values drugslr yesnovivek
codebook drugslr
codebook informedasb
recode informedasb(4=1) (1/3=0)(5=0), gen(informedasblr)
labe values informedasblr yesnovivek
codebook informedasblr
codebook policeeffective
clix | P a g e
recode policeeffective(6=1)(1/5=0)(7=0), gen(policeeffectivelr)
labe values policeeffectivelr yesnovivek
codebook policeeffectivelr
codebook influencedecision
recode influencedecision(4=1)(1/3=0)(5=0), gen(influencedecisionlr)
labe values influencedecisionlr yesnovivek
codebook influencedecisionlr
codebook econserv
recode econserv(5=1)(1/4=0)(6=0), gen(econservlr)
labe values econservlr yesnovivek
codebook econservlr
codebook crimeserv
recode crimeserv(5=1)(1/4=0)(6=0), gen(crimeservlr)
labe values crimeservlr yesnovivek
codebook crimeservlr
codebook healthserv
recode healthserv(5=1)(1/4=0)(6=0), gen(healthservlr)
labe values healthservlr yesnovivek
codebook healthservlr
codebook fruits
recode fruits (1/4=0)(5/7=1), gen(fruitslr)
label values fruitslr yesnovivek
codebook fruitslr
codebook modexer

clx | P a g e
recode modexer(6=1)(1/5=0), gen(modexerlr)
label values modexerlr yesnovivek
codebook modexerlr
codebook vigexer
recode vigexer(6=1)(1/5=0), gen(vigexerlr)
label values vigexerlr yesnovivek
codebook vigexerlr
recode quitsmoking (2=0)(1=1), gen(quitsmokinglr)
label values quitsmokinglr yesnovivek
codebook quitsmokinglr
recode quitsmokinglr .=0 if smoker==0
*Imouting for qualification
ren qualification qualificationv1
impute qualificationv1 noisyparty teeninstreets drunkards vandalism damgetoproperty drugs race respchildren respect healthrating smoker smokefreq quitsmoking fruits modexer vigexer newthings feelgood volunteer influencedecision attendevent healthserv crimeserv ednserv econserv needsimpr, gen(qualificationv2imp)
label values qualificationv2imp qualification
recode qualificationv2imp (min/1.5=1)(1.5/2.5=2)(2.5/3.5=3)(3.5/4.5=4)(4.5/max=5)
tab qualificationv2imp
tab year qualificationv2imp
list id qualificationv2imp if year==2009
drop if id==2009180 (as most of the values for this observation is missing)
ren qualificationv2imp qualification
*Imputing for smokers
clxi | P a g e
impute smoker drunkards drugs policeeffective informedasb respchildren healthrating smokefreq fruits modexer vigexer feelgood influencedecision ednserv econserv crimeserv healthserv comfacil attendevent qualification, gen(smokerimp)
ren smoker smokernonimputed
ren smokerimp smoker
label values smoker yesno
tab smoker
recode smoker (min/1.5=1)(1.5/max=2)
*Imputing for newthings
impute newthings attendevent satevents envserv comfacil healthserv crimeserv eventserv childserv ednserv econserv feelgood helprelative helpfamily volunteer influencedecision fruits modexer vigexer areabetter goodtolive policeeffective informedasb respchildren drunkards vandalism noisyparty teeninstreets, gen(newthingsimp)
ren newthings newthingsnonimputed
ren newthingsimp newthings
label values newthings newInterest
recode newthings (min/1.5=1)(1.5/2.5=2)(2.5/3.5=3)(3.5/4.5=4)(4.5/5.5=5)
tab newthings
*Imputing for feelgood
tab feelgood
impute feelgood econserv ednserv childserv eventserv crimeserv healthserv comfacil envserv satevents attendevent influencedecision volunteer helpfamily helprelative newthings qualification fruits modexer vigexer goodtolive areabetter respect noisyparty teeninstreets drunkards vandalism drugs race, gen(feelgoodimp)
ren feelgood feelgoodnonimputed
ren feelgoodimp feelgood
label values feelgood newInterest
recode feelgood (min/1.5=1)(1.5/2.5=2)(2.5/3.5=3)(3.5/4.5=4)(4.5/5.5=5)
*Imputing for healthrating
tab healthrating
clxii | P a g e
impute healthrating feelgood newthings smoker qualification healthserv satevents attendevent influencedecision volunteer helpfamily helprelative fruits modexer vigexer areabetter goodtolive informedasb policeeffective noisyparty teeninstreets drunkards drugs, gen(healthratingimp)
ren healthrating healthratingnonimp
ren healthratingimp healthrating
label values healthrating excellent
recode healthrating (min/1.5=1)(1.5/2.5=2)(2.5/3.5=3)(3.5/4.5=4)(4.5/5.5=5)
*Merging IMD data from warrington survey
merge m:m lsoa year using "B:\Data files\Stata\Warrington Level surveys\Recoded data\Survey_recoded_06_08_09_with_IMD.dta", keepusing(imd imdhealth imdincome imdemp imdedn imdhousing imdcrime imdenv) keep(match)
*Merging IMD data to the HH survey and recoding and realigning imds yearwise
merge m:1 lsoa using "B:\Data files\Stata\IMD\Warrington IMD 04-10.dta", keepusing(overallimdscore07 incomescore07 employmentscore07 healthscore07 educationscore07 barhousingscore07 crimescore07 livenvscore07 overallimdscore10 incomescore10 employmentscore10 healthscore10 educationscore10 barhousingscore10 crimescore10 livenvscore10) keep(match)
gen imd08= overallimdscore07+( overallimdscore10- overallimdscore07)/3
gen imd09=imd08+( overallimdscore10-imd08)/2
gen imd=imd08 if year==2008
replace imd=imd09 if year==2009
replace imd= overallimdscore10 if year==2010
replace imd=round(imd,1)
gen inc08= incomescore07+( incomescore10- incomescore07)/3
gen inc09=inc08+( incomescore10-inc08)/2
gen imdinc=inc08 if year==2008
replace imdinc=inc09 if year==2009
replace imdinc= incomescore10 if year==2010
drop imd08 imd09 inc08 inc09 _merge
gen emp08= employmentscore07+( employmentscore10- employmentscore07)/3
gen emp09=emp08+( employmentscore10-emp08)/2
gen imdemp=emp08 if year==2008
clxiii | P a g e
replace imdemp=emp09 if year==2009
replace imdemp= employmentscore10 if year==2010
drop emp08 emp09
gen hlth08= healthscore07+( healthscore10- healthscore07)/3
gen hlth09=hlth08+( healthscore10-hlth08)/2
gen imdhealth=hlth08 if year==2008
replace imdhealth=hlth09 if year==2009
replace imdhealth= healthscore10 if year==2010
drop hlth08 hlth09
gen edn08=( educationscore10- educationscore07)/3
drop edn08
gen edn08= educationscore07+( educationscore10- educationscore07)/3
gen edn09=edn08+( educationscore10-edn08)/2
gen imdedn=edn08 if year==2008
replace imdedn=edn09 if year==2009
replace imdedn= educationscore10 if year==2010
drop edn08 edn09
gen bar08= barhousingscore07+( barhousingscore10- barhousingscore07)/3
gen bar09=bar08+(barhousingscore10-bar08)/2
gen imdhousing=bar08 if year==2008
replace imdhousing=bar09 if year==2009
replace imdhousing= barhousingscore10 if year==2010
drop bar08 bar09
gen crim08= crimescore07+( crimescore10- crimescore07)/3
gen crim09=crim08+( crimescore10-crim08)/2
gen imdcrime=crim08 if year==2008
replace imdcrime=crim09 if year==2009
replace imdcrime= crimescore10 if year==2010
drop crim08 crim09
gen liv08 = livenvscore07+( livenvscore10- livenvscore07)/3
clxiv | P a g e
gen liv09=liv08+( livenvscore10-liv08)/2
gen imdenv=liv08 if year ==2008
replace imdenv=liv09 if year==2009
replace imdenv= livenvscore10 if year==2010
drop liv08 liv09
replace imdinc=round( imdinc,1)
replace imdemp=round( imdemp,1)
replace imdhealth=round( imdhealth,1)
replace imdedn=round( imdedn,1)
replace imdhousing=round( imdhousing,1)
replace imdcrime=round( imdcrime,1)
replace imdenv=round( imdenv,1)
label variable imd "Overall IMD score"
label variable imdinc "IMD income score"
label variable imdemp "IMD employment score"
label variable imdhealth "IMD health score"
label variable imdedn "IMD education score"
label variable imdhousing "IMD housing"
label variable imdcrime "IMD crime"
label variable imdenv "IMD living environment score"
label variable imdcrime "IMD crime score"
label variable imdhousing "IMD housing score"
*Quick check of vraibles
codebook education
codebook smoker
codebook newthings
codebook feelgood
codebook healthrating
clxv | P a g e
codebook year
tab lsoa year
codebook goodtolive
codebook goodtolivelr
codebook respchildren
codebook respchildrenlr
codebook noisyparty
codebook noisypartylr
codebook teeninstreets
codebook teeninstreetslr
codebook drunkards
codebook drunkardslr
codebook vandalism
codebook vandalismlr
codebook rubbish
codebook rubbishlr
codebook drugs
codebook drugslr
codebook informedasb
codebook informedasblr
codebook policeeffective
codebook policeeffectivelr
codebook influencedecision
codebook influencedecisionlr
codebook econserv
codebook econservlr
codebook crimeserv
codebook crimeservlr
codebook healthserv
codebook healthservlr
clxvi | P a g e
codebook fruits
codebook fruitslr
codebook modexer
codebook modexerlr
codebook vigexer
codebook vigexerlr
*Regression results
* checking for correlation between exp. variables (not significant, directions are intuitive)
pwcorr education smoker
pwcorr education newthings
pwcorr education feelgood
pwcorr education healthrating
pwcorr smoker feelgood
pwcorr smoker healthrating
pwcorr feelgood healthrating
pwcorr feelgood newthings
pwcorr healthrating newthings
* 1. Agree that area is a good place to live
codebook goodtolive
xi: regress goodtolive education smoker newthings feelgood healthrating i.year if (year == 2008 | year == 2010)
xi: logit goodtolivelr education smoker newthings feelgood healthrating i.year if (year == 2008 | year == 2010)
* 2. Parents taking resp for children
codebook respchildrenlr
xi: logit respchildrenlr education smoker newthings feelgood healthrating i.year if (year == 2008 | year == 2010)
clxvii | P a g e
* 3. Noisy parties
codebook noisyparty
xi: regress noisyparty education smoker newthings feelgood healthrating i.year if (year == 2008 | year == 2010) &(noisyparty <=4)
xi: logit noisypartylr education smoker newthings feelgood healthrating i.year if (year == 2008 | year == 2010)
*4. Teen agers in streets
codebook teeninstreets
xi: regress teeninstreets education smoker newthings feelgood healthrating i.year if (year == 2008 | year == 2010) &(teeninstreets <=4)
xi: logit teeninstreetslr education smoker newthings feelgood healthrating i.year if (year == 2008 | year == 2010)
* 5. drunkards and rowdy behavior in streets
codebook drunkards
* 6 Vandalism
codebook vandalism
xi: regress vandalism education smoker newthings feelgood healthrating i.year if (year == 2008 | year == 2010) &(vandalism <=4)
xi: logit vandalismlr education smoker newthings feelgood healthrating i.year if (year == 2008 | year == 2010)
* 7 Rubbish nad litter in streets
codebook rubbish
xi: regress rubbish education smoker newthings feelgood healthrating i.year if (year == 2008 | year == 2010) &(rubbish <=4)
xi: logit rubbishlr education smoker newthings feelgood healthrating i.year if (year == 2008 | year == 2010)
* 7. drugs
codebook drugs

clxviii | P a g e
xi: regress drugs education smoker newthings feelgood healthrating i.year if (year == 2008 | year == 2010) &(drugs <=4)
xi: logit drugslr education smoker newthings feelgood healthrating i.year if (year == 2008 | year == 2010)
* 8. Informed about efforts to reduce crime and ASB
codebook informedasb
xi: regress informedasb education smoker newthings feelgood healthrating i.year if (year == 2008 | year == 2010) &(informedasb <=4)
xi: logit informedasblr education smoker newthings feelgood healthrating i.year if (year == 2008 | year == 2010)
* 9. How effective are police in tackling ASB
codebook policeeffective
xi: regress policeeffective education smoker newthings feelgood healthrating i.year if (year == 2008 | year == 2010) &(policeeffective <=6)
xi: logit policeeffectivelr education smoker newthings feelgood healthrating i.year if (year == 2008 | year == 2010)
* 10 ability to influence decisions
codebook influencedecision
xi: regress influencedecision education smoker newthings feelgood healthrating i.year if (year == 2008 | year == 2010) &(influencedecision <=5)
xi: logit influencedecisionlr education smoker newthings feelgood healthrating i.year if (year == 2008 | year == 2010)
* 11 Satisfaction woth econ services
codebook econserv
xi: regress econserv education smoker newthings feelgood healthrating i.year if (year == 2008 | year == 2010) &(econserv <=5)
xi: logit econservlr education smoker newthings feelgood healthrating i.year if (year == 2008 | year == 2010)
* 12 Crime and ASB related services
codebook crimeserv

clxix | P a g e
xi: regress crimeserv education smoker newthings feelgood healthrating i.year if (year == 2008 | year == 2010) &(crimeserv <=5)
xi: logit crimeservlr education smoker newthings feelgood healthrating i.year if (year == 2008 | year == 2010)
* 13 Overall satisfaction woth health services
codebook healthserv
xi: regress healthserv education smoker newthings feelgood healthrating i.year if (year == 2008 | year == 2010) &(healthserv <=5)
xi: logit healthservlr education smoker newthings feelgood healthrating i.year if (year == 2008 | year == 2010)
* 14 want to quit smoking (75% missing values)
codebook quitsmokinglr
xi: logit quitsmokinglr education newthings feelgood healthrating i.year if (year == 2008 | year == 2010) & (smoker==1)
* 15 number of helpings of fruits
codebook fruits
xi: regress fruits education smoker newthings feelgood healthrating i.year if (year == 2008 | year == 2010)
xi: logit fruitslr education smoker newthings feelgood healthrating i.year if (year == 2008 | year == 2010)
* 16 Frequency of moderate exercise
codebook modexer
xi: regress modexer education smoker newthings feelgood healthrating i.year if (year == 2008 | year == 2010)
xi: logit modexerlr education smoker newthings feelgood healthrating i.year if (year == 2008 | year == 2010)
* 17 Frequency of vigorous exercise
codebook vigexer
xi: regress vigexer education smoker newthings feelgood healthrating i.year if (year == 2008 | year == 2010)
xi: logit vigexerlr education smoker newthings feelgood healthrating i.year if (year == 2008 | year == 2010)

clxx | P a g e
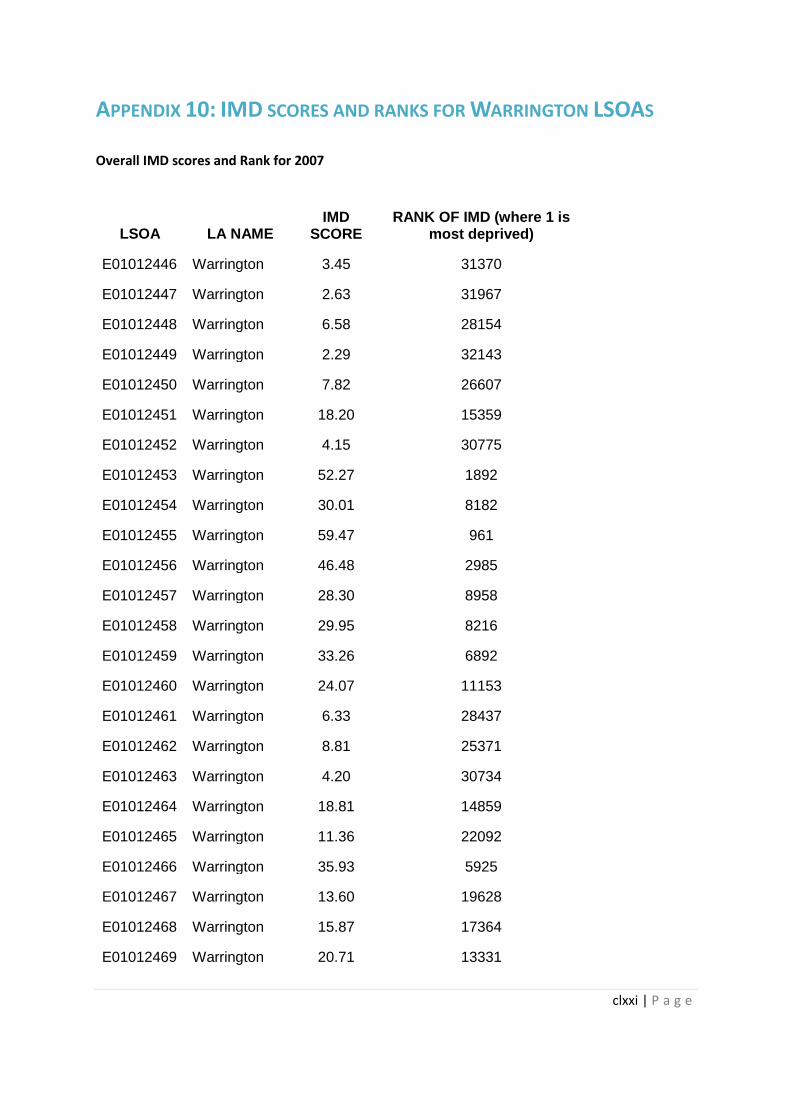
clxxi | P a g e
APPENDIX 10: IMD SCORES AND RANKS FOR WARRINGTON LSOAS
Overall IMD scores and Rank for 2007
LSOA LA NAME IMD
SCORE RANK OF IMD (where 1 is
most deprived)
E01012446 Warrington 3.45 31370
E01012447 Warrington 2.63 31967
E01012448 Warrington 6.58 28154
E01012449 Warrington 2.29 32143
E01012450 Warrington 7.82 26607
E01012451 Warrington 18.20 15359
E01012452 Warrington 4.15 30775
E01012453 Warrington 52.27 1892
E01012454 Warrington 30.01 8182
E01012455 Warrington 59.47 961
E01012456 Warrington 46.48 2985
E01012457 Warrington 28.30 8958
E01012458 Warrington 29.95 8216
E01012459 Warrington 33.26 6892
E01012460 Warrington 24.07 11153
E01012461 Warrington 6.33 28437
E01012462 Warrington 8.81 25371
E01012463 Warrington 4.20 30734
E01012464 Warrington 18.81 14859
E01012465 Warrington 11.36 22092
E01012466 Warrington 35.93 5925
E01012467 Warrington 13.60 19628
E01012468 Warrington 15.87 17364
E01012469 Warrington 20.71 13331
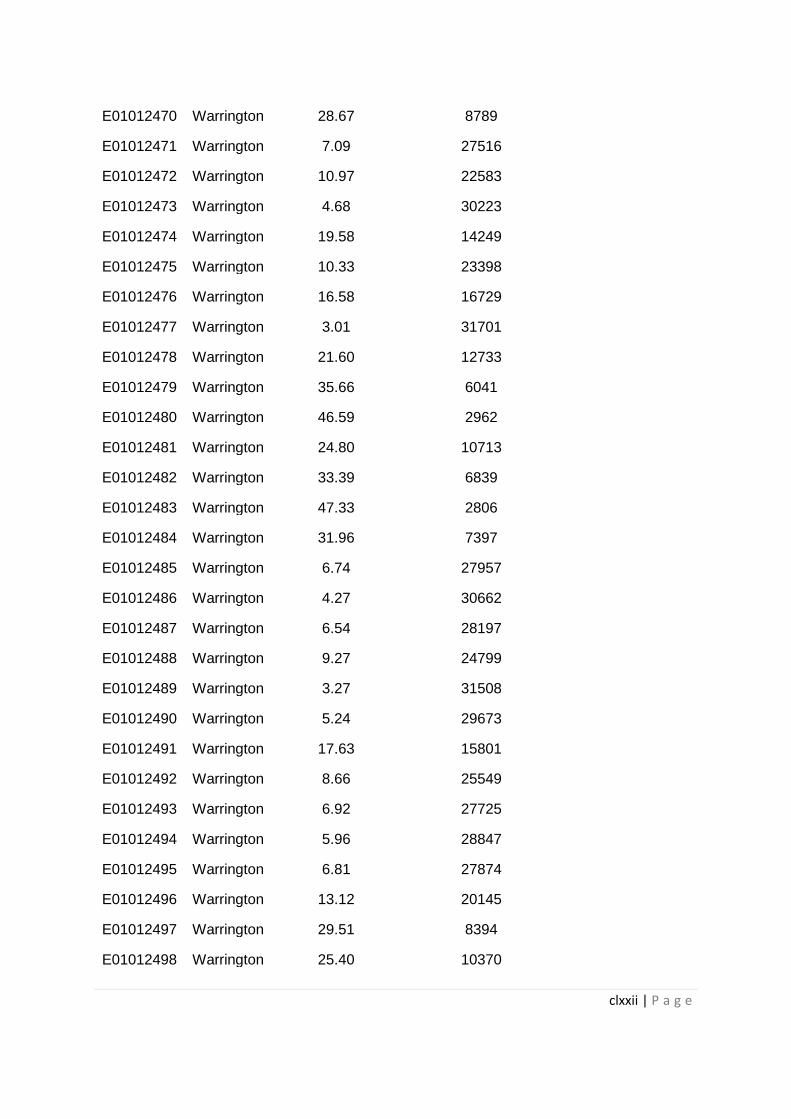
clxxii | P a g e
E01012470 Warrington 28.67 8789
E01012471 Warrington 7.09 27516
E01012472 Warrington 10.97 22583
E01012473 Warrington 4.68 30223
E01012474 Warrington 19.58 14249
E01012475 Warrington 10.33 23398
E01012476 Warrington 16.58 16729
E01012477 Warrington 3.01 31701
E01012478 Warrington 21.60 12733
E01012479 Warrington 35.66 6041
E01012480 Warrington 46.59 2962
E01012481 Warrington 24.80 10713
E01012482 Warrington 33.39 6839
E01012483 Warrington 47.33 2806
E01012484 Warrington 31.96 7397
E01012485 Warrington 6.74 27957
E01012486 Warrington 4.27 30662
E01012487 Warrington 6.54 28197
E01012488 Warrington 9.27 24799
E01012489 Warrington 3.27 31508
E01012490 Warrington 5.24 29673
E01012491 Warrington 17.63 15801
E01012492 Warrington 8.66 25549
E01012493 Warrington 6.92 27725
E01012494 Warrington 5.96 28847
E01012495 Warrington 6.81 27874
E01012496 Warrington 13.12 20145
E01012497 Warrington 29.51 8394
E01012498 Warrington 25.40 10370
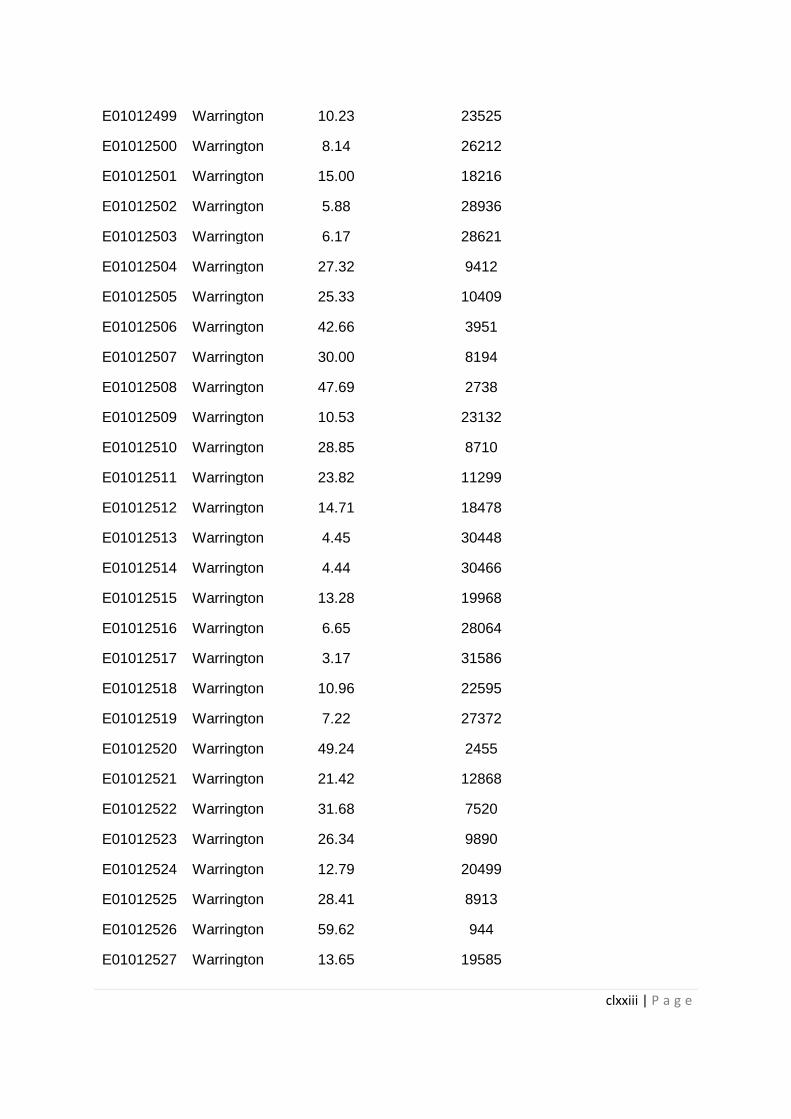
clxxiii | P a g e
E01012499 Warrington 10.23 23525
E01012500 Warrington 8.14 26212
E01012501 Warrington 15.00 18216
E01012502 Warrington 5.88 28936
E01012503 Warrington 6.17 28621
E01012504 Warrington 27.32 9412
E01012505 Warrington 25.33 10409
E01012506 Warrington 42.66 3951
E01012507 Warrington 30.00 8194
E01012508 Warrington 47.69 2738
E01012509 Warrington 10.53 23132
E01012510 Warrington 28.85 8710
E01012511 Warrington 23.82 11299
E01012512 Warrington 14.71 18478
E01012513 Warrington 4.45 30448
E01012514 Warrington 4.44 30466
E01012515 Warrington 13.28 19968
E01012516 Warrington 6.65 28064
E01012517 Warrington 3.17 31586
E01012518 Warrington 10.96 22595
E01012519 Warrington 7.22 27372
E01012520 Warrington 49.24 2455
E01012521 Warrington 21.42 12868
E01012522 Warrington 31.68 7520
E01012523 Warrington 26.34 9890
E01012524 Warrington 12.79 20499
E01012525 Warrington 28.41 8913
E01012526 Warrington 59.62 944
E01012527 Warrington 13.65 19585
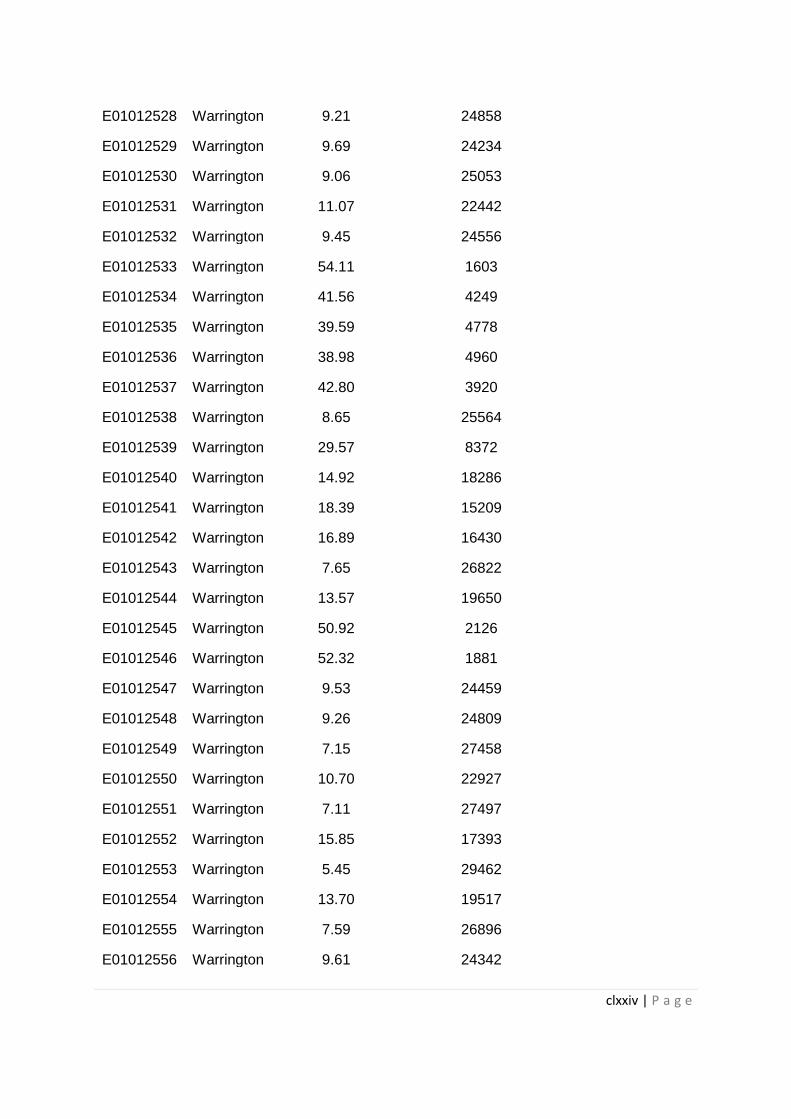
clxxiv | P a g e
E01012528 Warrington 9.21 24858
E01012529 Warrington 9.69 24234
E01012530 Warrington 9.06 25053
E01012531 Warrington 11.07 22442
E01012532 Warrington 9.45 24556
E01012533 Warrington 54.11 1603
E01012534 Warrington 41.56 4249
E01012535 Warrington 39.59 4778
E01012536 Warrington 38.98 4960
E01012537 Warrington 42.80 3920
E01012538 Warrington 8.65 25564
E01012539 Warrington 29.57 8372
E01012540 Warrington 14.92 18286
E01012541 Warrington 18.39 15209
E01012542 Warrington 16.89 16430
E01012543 Warrington 7.65 26822
E01012544 Warrington 13.57 19650
E01012545 Warrington 50.92 2126
E01012546 Warrington 52.32 1881
E01012547 Warrington 9.53 24459
E01012548 Warrington 9.26 24809
E01012549 Warrington 7.15 27458
E01012550 Warrington 10.70 22927
E01012551 Warrington 7.11 27497
E01012552 Warrington 15.85 17393
E01012553 Warrington 5.45 29462
E01012554 Warrington 13.70 19517
E01012555 Warrington 7.59 26896
E01012556 Warrington 9.61 24342
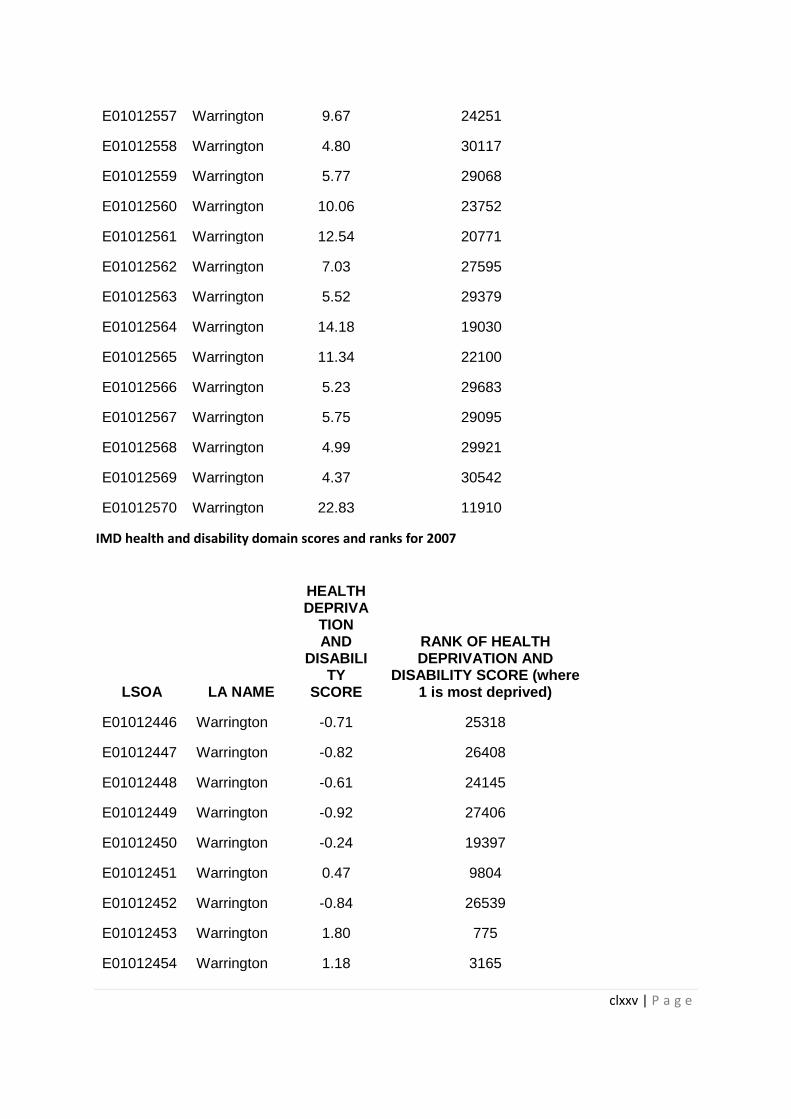
clxxv | P a g e
E01012557 Warrington 9.67 24251
E01012558 Warrington 4.80 30117
E01012559 Warrington 5.77 29068
E01012560 Warrington 10.06 23752
E01012561 Warrington 12.54 20771
E01012562 Warrington 7.03 27595
E01012563 Warrington 5.52 29379
E01012564 Warrington 14.18 19030
E01012565 Warrington 11.34 22100
E01012566 Warrington 5.23 29683
E01012567 Warrington 5.75 29095
E01012568 Warrington 4.99 29921
E01012569 Warrington 4.37 30542
E01012570 Warrington 22.83 11910
IMD health and disability domain scores and ranks for 2007
LSOA LA NAME
HEALTH DEPRIVA
TION AND
DISABILITY
SCORE
RANK OF HEALTH DEPRIVATION AND
DISABILITY SCORE (where 1 is most deprived)
E01012446 Warrington -0.71 25318
E01012447 Warrington -0.82 26408
E01012448 Warrington -0.61 24145
E01012449 Warrington -0.92 27406
E01012450 Warrington -0.24 19397
E01012451 Warrington 0.47 9804
E01012452 Warrington -0.84 26539
E01012453 Warrington 1.80 775
E01012454 Warrington 1.18 3165
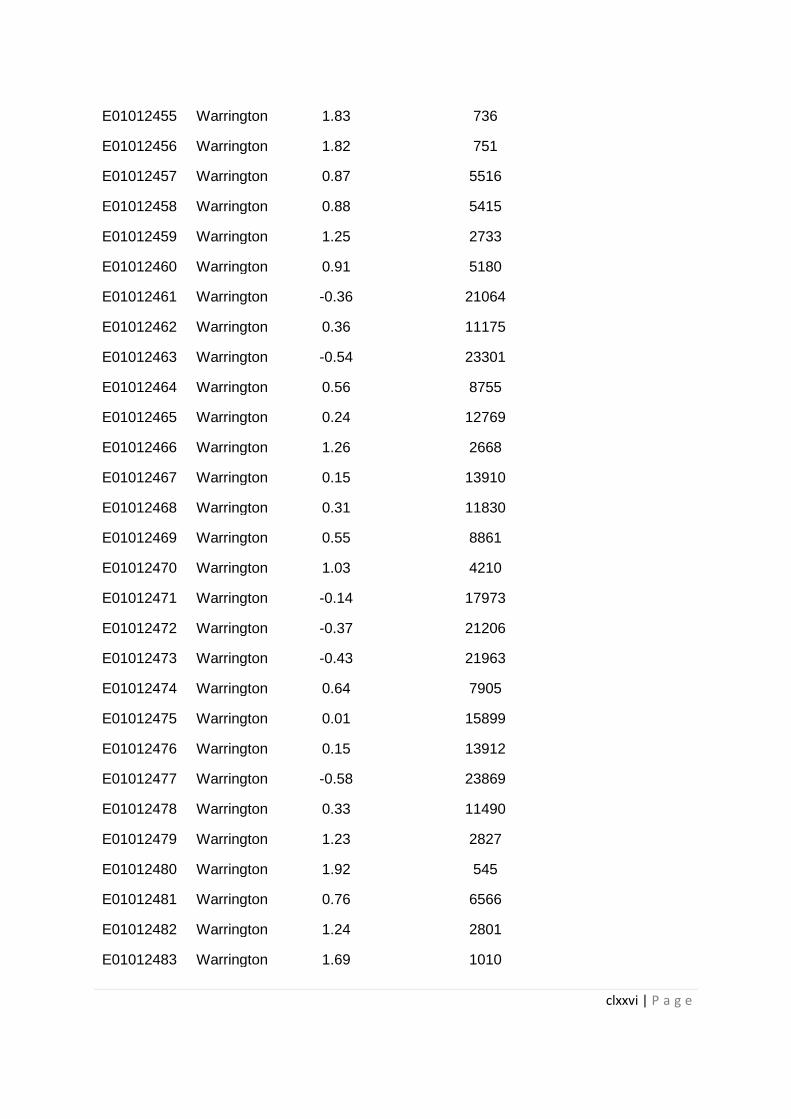
clxxvi | P a g e
E01012455 Warrington 1.83 736
E01012456 Warrington 1.82 751
E01012457 Warrington 0.87 5516
E01012458 Warrington 0.88 5415
E01012459 Warrington 1.25 2733
E01012460 Warrington 0.91 5180
E01012461 Warrington -0.36 21064
E01012462 Warrington 0.36 11175
E01012463 Warrington -0.54 23301
E01012464 Warrington 0.56 8755
E01012465 Warrington 0.24 12769
E01012466 Warrington 1.26 2668
E01012467 Warrington 0.15 13910
E01012468 Warrington 0.31 11830
E01012469 Warrington 0.55 8861
E01012470 Warrington 1.03 4210
E01012471 Warrington -0.14 17973
E01012472 Warrington -0.37 21206
E01012473 Warrington -0.43 21963
E01012474 Warrington 0.64 7905
E01012475 Warrington 0.01 15899
E01012476 Warrington 0.15 13912
E01012477 Warrington -0.58 23869
E01012478 Warrington 0.33 11490
E01012479 Warrington 1.23 2827
E01012480 Warrington 1.92 545
E01012481 Warrington 0.76 6566
E01012482 Warrington 1.24 2801
E01012483 Warrington 1.69 1010
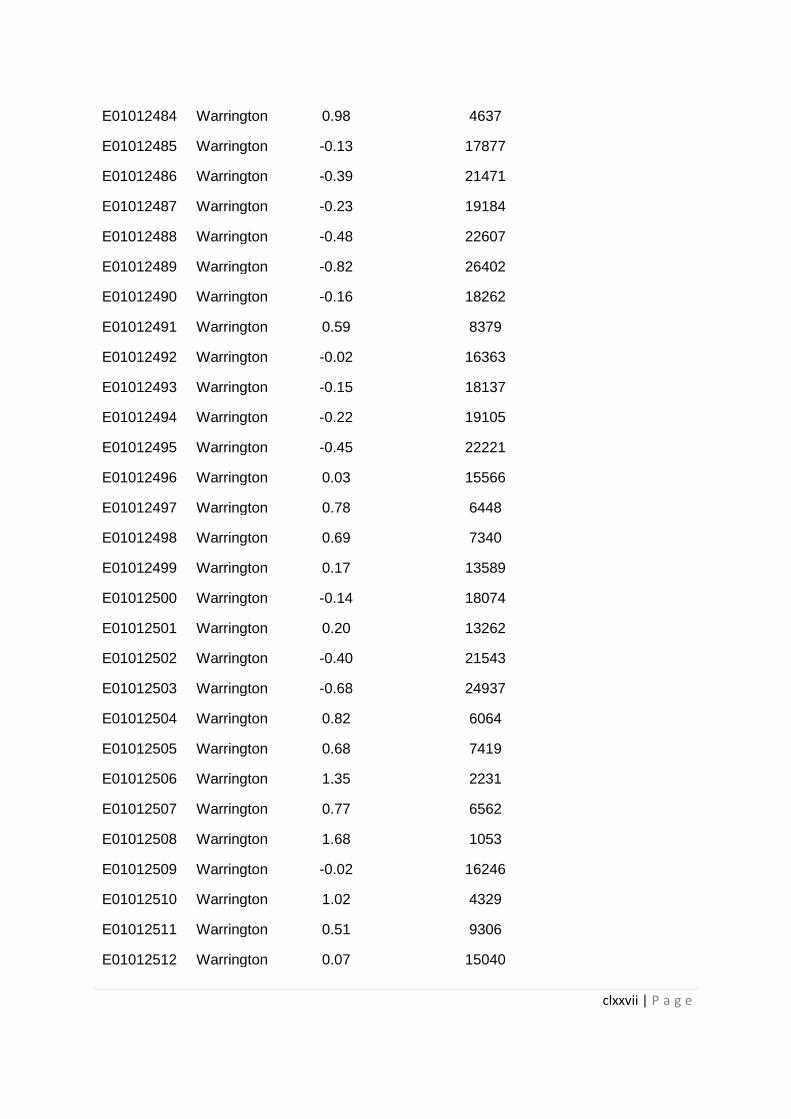
clxxvii | P a g e
E01012484 Warrington 0.98 4637
E01012485 Warrington -0.13 17877
E01012486 Warrington -0.39 21471
E01012487 Warrington -0.23 19184
E01012488 Warrington -0.48 22607
E01012489 Warrington -0.82 26402
E01012490 Warrington -0.16 18262
E01012491 Warrington 0.59 8379
E01012492 Warrington -0.02 16363
E01012493 Warrington -0.15 18137
E01012494 Warrington -0.22 19105
E01012495 Warrington -0.45 22221
E01012496 Warrington 0.03 15566
E01012497 Warrington 0.78 6448
E01012498 Warrington 0.69 7340
E01012499 Warrington 0.17 13589
E01012500 Warrington -0.14 18074
E01012501 Warrington 0.20 13262
E01012502 Warrington -0.40 21543
E01012503 Warrington -0.68 24937
E01012504 Warrington 0.82 6064
E01012505 Warrington 0.68 7419
E01012506 Warrington 1.35 2231
E01012507 Warrington 0.77 6562
E01012508 Warrington 1.68 1053
E01012509 Warrington -0.02 16246
E01012510 Warrington 1.02 4329
E01012511 Warrington 0.51 9306
E01012512 Warrington 0.07 15040
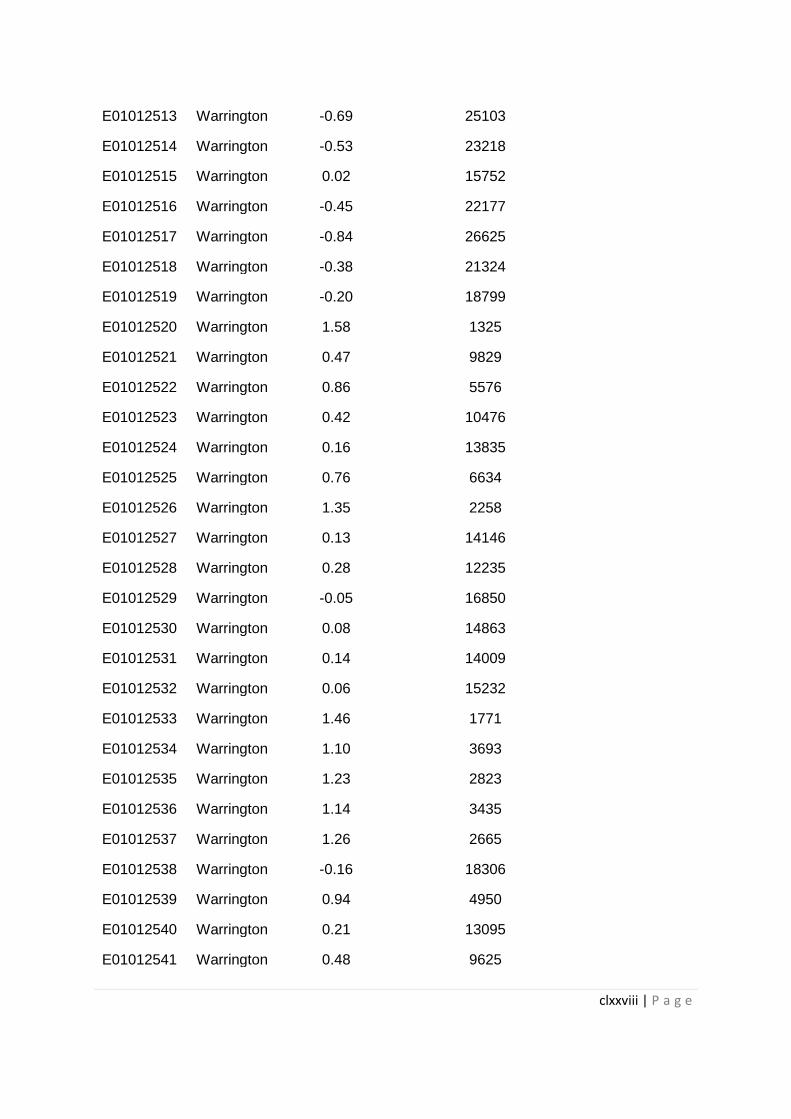
clxxviii | P a g e
E01012513 Warrington -0.69 25103
E01012514 Warrington -0.53 23218
E01012515 Warrington 0.02 15752
E01012516 Warrington -0.45 22177
E01012517 Warrington -0.84 26625
E01012518 Warrington -0.38 21324
E01012519 Warrington -0.20 18799
E01012520 Warrington 1.58 1325
E01012521 Warrington 0.47 9829
E01012522 Warrington 0.86 5576
E01012523 Warrington 0.42 10476
E01012524 Warrington 0.16 13835
E01012525 Warrington 0.76 6634
E01012526 Warrington 1.35 2258
E01012527 Warrington 0.13 14146
E01012528 Warrington 0.28 12235
E01012529 Warrington -0.05 16850
E01012530 Warrington 0.08 14863
E01012531 Warrington 0.14 14009
E01012532 Warrington 0.06 15232
E01012533 Warrington 1.46 1771
E01012534 Warrington 1.10 3693
E01012535 Warrington 1.23 2823
E01012536 Warrington 1.14 3435
E01012537 Warrington 1.26 2665
E01012538 Warrington -0.16 18306
E01012539 Warrington 0.94 4950
E01012540 Warrington 0.21 13095
E01012541 Warrington 0.48 9625

clxxix | P a g e
E01012542 Warrington 0.14 14067
E01012543 Warrington -0.19 18700
E01012544 Warrington 0.35 11264
E01012545 Warrington 1.72 948
E01012546 Warrington 1.70 985
E01012547 Warrington -0.10 17502
E01012548 Warrington -0.24 19381
E01012549 Warrington -0.13 17900
E01012550 Warrington 0.01 15930
E01012551 Warrington -0.27 19772
E01012552 Warrington 0.23 12877
E01012553 Warrington -0.32 20565
E01012554 Warrington -0.09 17324
E01012555 Warrington 0.00 16023
E01012556 Warrington -0.07 17014
E01012557 Warrington -0.23 19310
E01012558 Warrington -0.65 24625
E01012559 Warrington -0.25 19486
E01012560 Warrington -0.03 16411
E01012561 Warrington 0.58 8528
E01012562 Warrington -0.25 19578
E01012563 Warrington -0.20 18818
E01012564 Warrington 0.63 7949
E01012565 Warrington 0.01 15966
E01012566 Warrington -0.19 18681
E01012567 Warrington -0.43 21948
E01012568 Warrington -0.27 19859
E01012569 Warrington -0.61 24193
E01012570 Warrington 0.97 4674
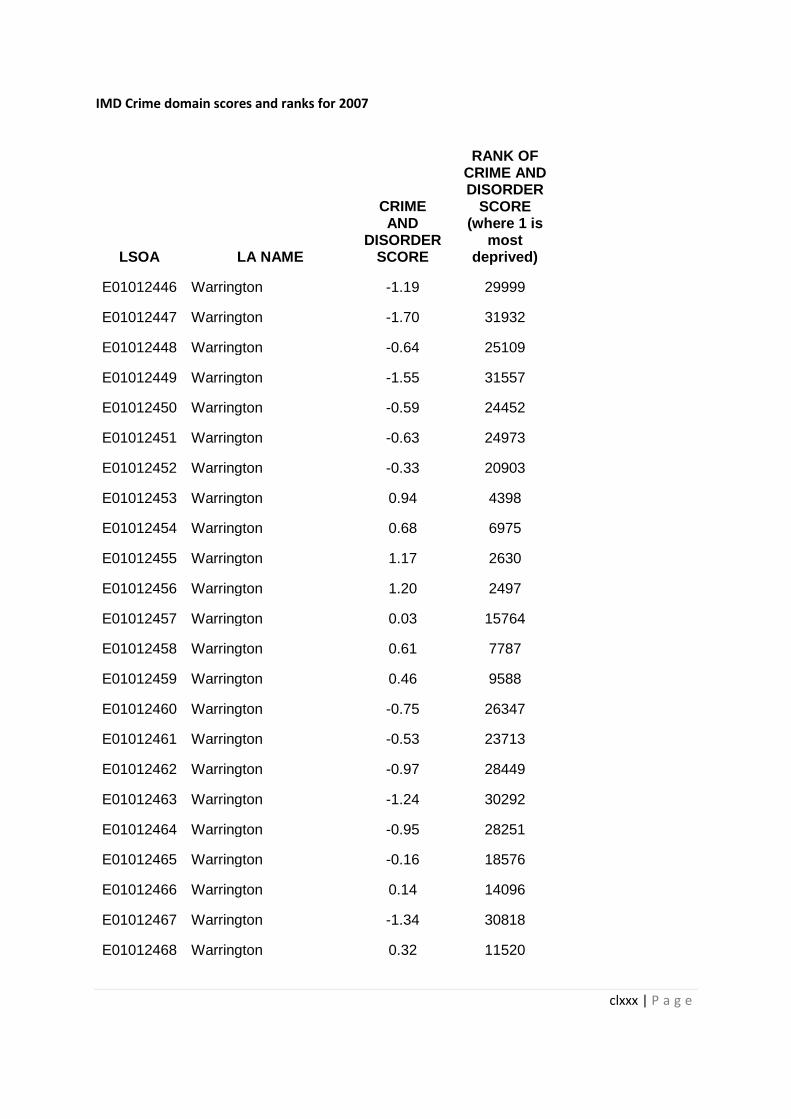
clxxx | P a g e
IMD Crime domain scores and ranks for 2007
LSOA LA NAME
CRIME AND
DISORDER SCORE
RANK OF CRIME AND DISORDER
SCORE (where 1 is
most deprived)
E01012446 Warrington -1.19 29999
E01012447 Warrington -1.70 31932
E01012448 Warrington -0.64 25109
E01012449 Warrington -1.55 31557
E01012450 Warrington -0.59 24452
E01012451 Warrington -0.63 24973
E01012452 Warrington -0.33 20903
E01012453 Warrington 0.94 4398
E01012454 Warrington 0.68 6975
E01012455 Warrington 1.17 2630
E01012456 Warrington 1.20 2497
E01012457 Warrington 0.03 15764
E01012458 Warrington 0.61 7787
E01012459 Warrington 0.46 9588
E01012460 Warrington -0.75 26347
E01012461 Warrington -0.53 23713
E01012462 Warrington -0.97 28449
E01012463 Warrington -1.24 30292
E01012464 Warrington -0.95 28251
E01012465 Warrington -0.16 18576
E01012466 Warrington 0.14 14096
E01012467 Warrington -1.34 30818
E01012468 Warrington 0.32 11520
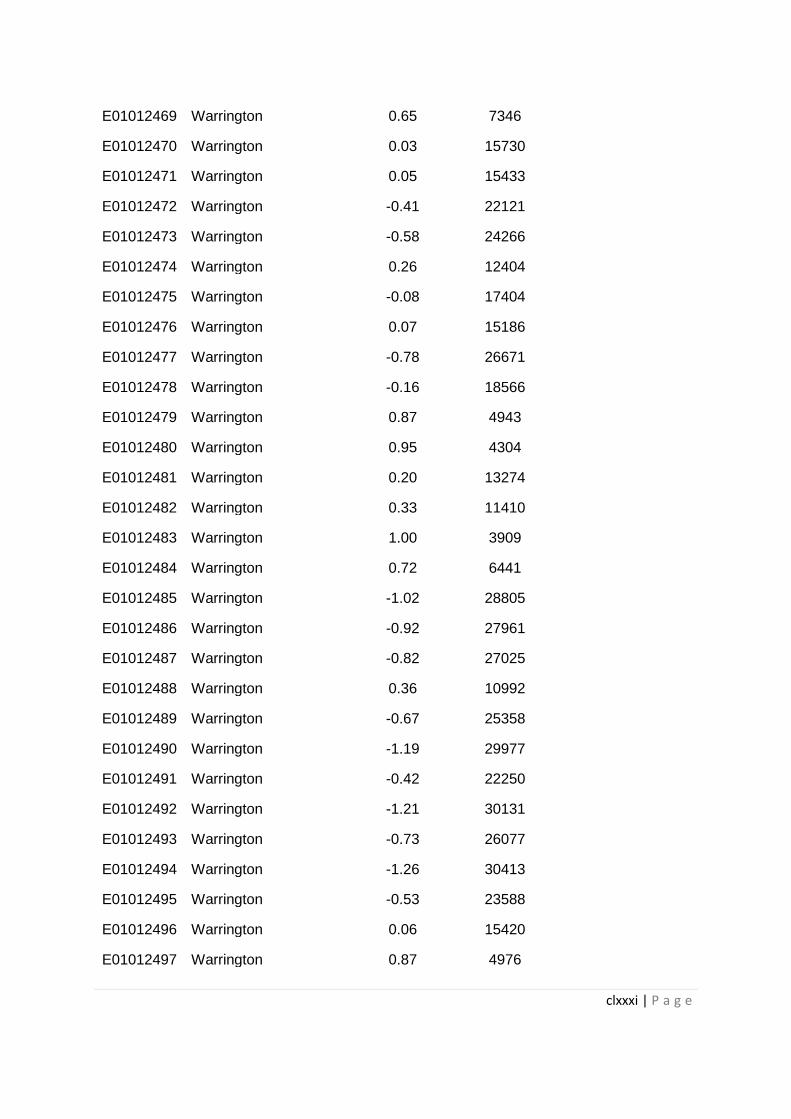
clxxxi | P a g e
E01012469 Warrington 0.65 7346
E01012470 Warrington 0.03 15730
E01012471 Warrington 0.05 15433
E01012472 Warrington -0.41 22121
E01012473 Warrington -0.58 24266
E01012474 Warrington 0.26 12404
E01012475 Warrington -0.08 17404
E01012476 Warrington 0.07 15186
E01012477 Warrington -0.78 26671
E01012478 Warrington -0.16 18566
E01012479 Warrington 0.87 4943
E01012480 Warrington 0.95 4304
E01012481 Warrington 0.20 13274
E01012482 Warrington 0.33 11410
E01012483 Warrington 1.00 3909
E01012484 Warrington 0.72 6441
E01012485 Warrington -1.02 28805
E01012486 Warrington -0.92 27961
E01012487 Warrington -0.82 27025
E01012488 Warrington 0.36 10992
E01012489 Warrington -0.67 25358
E01012490 Warrington -1.19 29977
E01012491 Warrington -0.42 22250
E01012492 Warrington -1.21 30131
E01012493 Warrington -0.73 26077
E01012494 Warrington -1.26 30413
E01012495 Warrington -0.53 23588
E01012496 Warrington 0.06 15420
E01012497 Warrington 0.87 4976
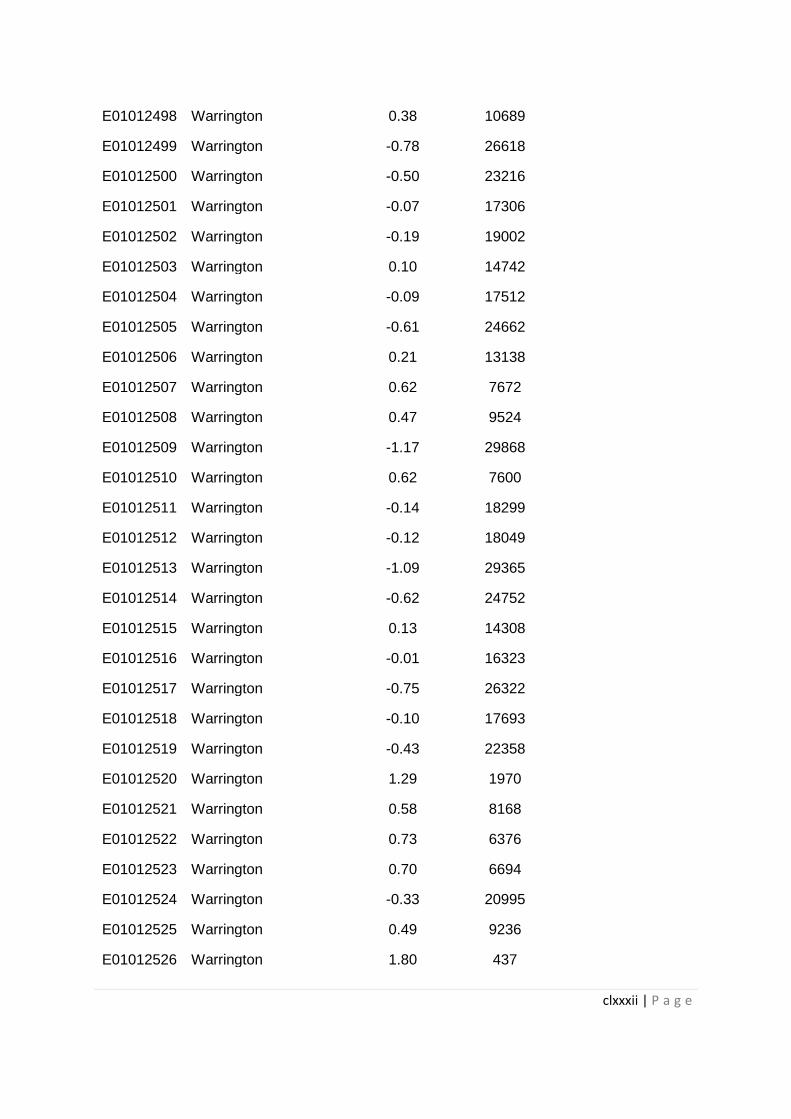
clxxxii | P a g e
E01012498 Warrington 0.38 10689
E01012499 Warrington -0.78 26618
E01012500 Warrington -0.50 23216
E01012501 Warrington -0.07 17306
E01012502 Warrington -0.19 19002
E01012503 Warrington 0.10 14742
E01012504 Warrington -0.09 17512
E01012505 Warrington -0.61 24662
E01012506 Warrington 0.21 13138
E01012507 Warrington 0.62 7672
E01012508 Warrington 0.47 9524
E01012509 Warrington -1.17 29868
E01012510 Warrington 0.62 7600
E01012511 Warrington -0.14 18299
E01012512 Warrington -0.12 18049
E01012513 Warrington -1.09 29365
E01012514 Warrington -0.62 24752
E01012515 Warrington 0.13 14308
E01012516 Warrington -0.01 16323
E01012517 Warrington -0.75 26322
E01012518 Warrington -0.10 17693
E01012519 Warrington -0.43 22358
E01012520 Warrington 1.29 1970
E01012521 Warrington 0.58 8168
E01012522 Warrington 0.73 6376
E01012523 Warrington 0.70 6694
E01012524 Warrington -0.33 20995
E01012525 Warrington 0.49 9236
E01012526 Warrington 1.80 437
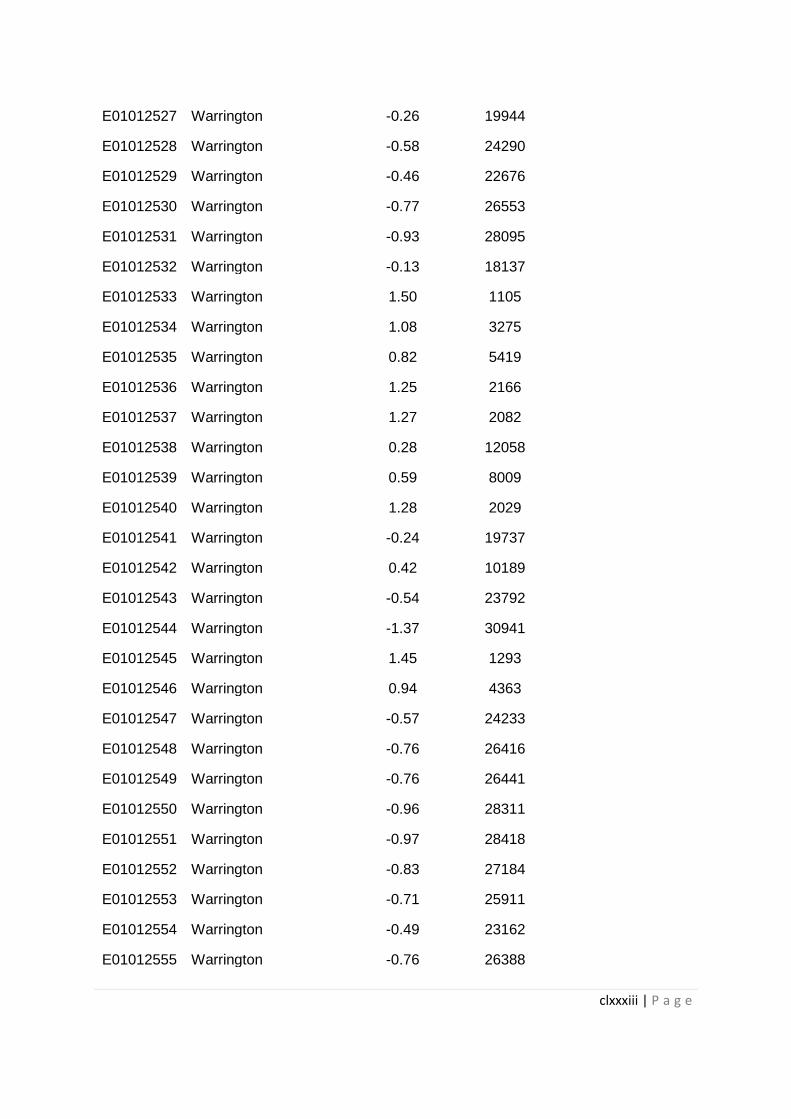
clxxxiii | P a g e
E01012527 Warrington -0.26 19944
E01012528 Warrington -0.58 24290
E01012529 Warrington -0.46 22676
E01012530 Warrington -0.77 26553
E01012531 Warrington -0.93 28095
E01012532 Warrington -0.13 18137
E01012533 Warrington 1.50 1105
E01012534 Warrington 1.08 3275
E01012535 Warrington 0.82 5419
E01012536 Warrington 1.25 2166
E01012537 Warrington 1.27 2082
E01012538 Warrington 0.28 12058
E01012539 Warrington 0.59 8009
E01012540 Warrington 1.28 2029
E01012541 Warrington -0.24 19737
E01012542 Warrington 0.42 10189
E01012543 Warrington -0.54 23792
E01012544 Warrington -1.37 30941
E01012545 Warrington 1.45 1293
E01012546 Warrington 0.94 4363
E01012547 Warrington -0.57 24233
E01012548 Warrington -0.76 26416
E01012549 Warrington -0.76 26441
E01012550 Warrington -0.96 28311
E01012551 Warrington -0.97 28418
E01012552 Warrington -0.83 27184
E01012553 Warrington -0.71 25911
E01012554 Warrington -0.49 23162
E01012555 Warrington -0.76 26388
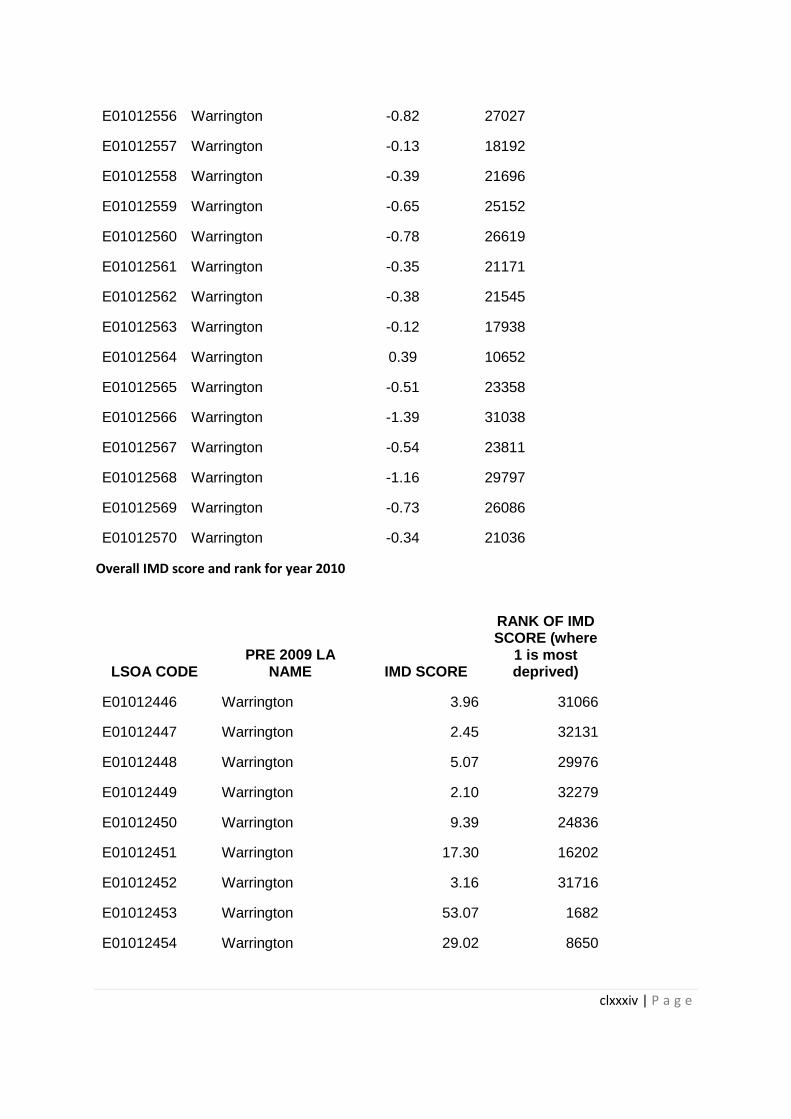
clxxxiv | P a g e
E01012556 Warrington -0.82 27027
E01012557 Warrington -0.13 18192
E01012558 Warrington -0.39 21696
E01012559 Warrington -0.65 25152
E01012560 Warrington -0.78 26619
E01012561 Warrington -0.35 21171
E01012562 Warrington -0.38 21545
E01012563 Warrington -0.12 17938
E01012564 Warrington 0.39 10652
E01012565 Warrington -0.51 23358
E01012566 Warrington -1.39 31038
E01012567 Warrington -0.54 23811
E01012568 Warrington -1.16 29797
E01012569 Warrington -0.73 26086
E01012570 Warrington -0.34 21036
Overall IMD score and rank for year 2010
LSOA CODE PRE 2009 LA
NAME IMD SCORE
RANK OF IMD SCORE (where
1 is most deprived)
E01012446 Warrington 3.96 31066
E01012447 Warrington 2.45 32131
E01012448 Warrington 5.07 29976
E01012449 Warrington 2.10 32279
E01012450 Warrington 9.39 24836
E01012451 Warrington 17.30 16202
E01012452 Warrington 3.16 31716
E01012453 Warrington 53.07 1682
E01012454 Warrington 29.02 8650
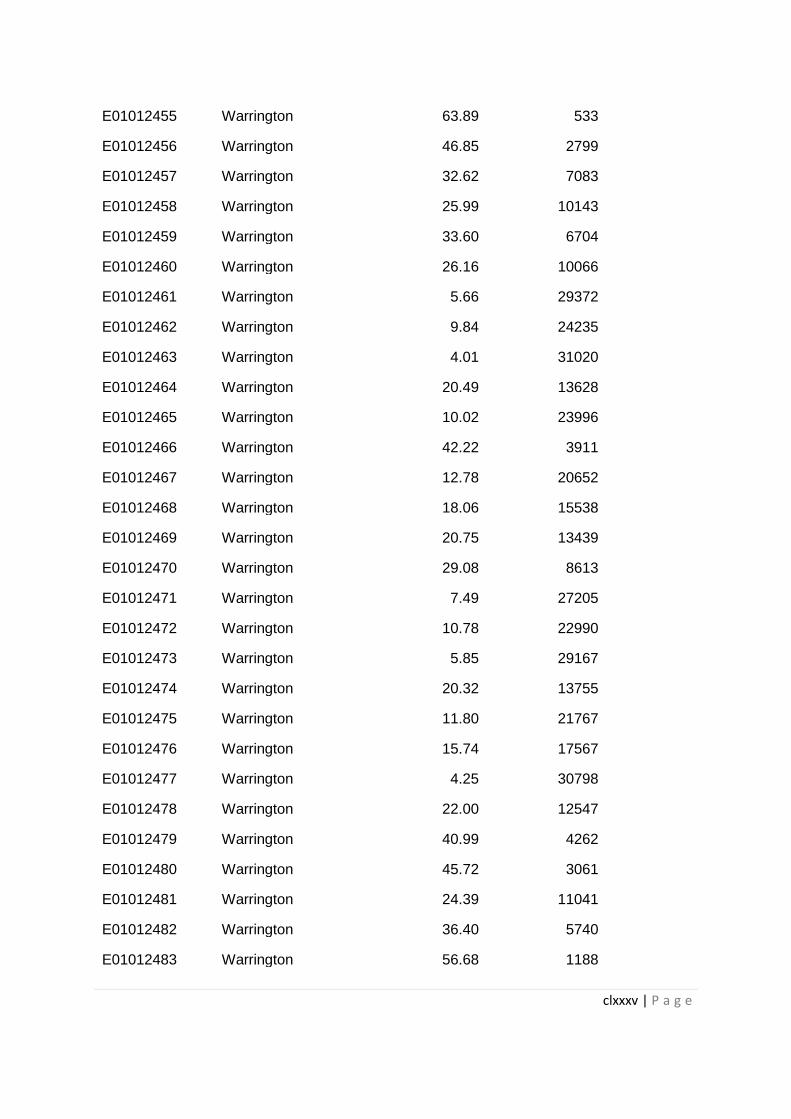
clxxxv | P a g e
E01012455 Warrington 63.89 533
E01012456 Warrington 46.85 2799
E01012457 Warrington 32.62 7083
E01012458 Warrington 25.99 10143
E01012459 Warrington 33.60 6704
E01012460 Warrington 26.16 10066
E01012461 Warrington 5.66 29372
E01012462 Warrington 9.84 24235
E01012463 Warrington 4.01 31020
E01012464 Warrington 20.49 13628
E01012465 Warrington 10.02 23996
E01012466 Warrington 42.22 3911
E01012467 Warrington 12.78 20652
E01012468 Warrington 18.06 15538
E01012469 Warrington 20.75 13439
E01012470 Warrington 29.08 8613
E01012471 Warrington 7.49 27205
E01012472 Warrington 10.78 22990
E01012473 Warrington 5.85 29167
E01012474 Warrington 20.32 13755
E01012475 Warrington 11.80 21767
E01012476 Warrington 15.74 17567
E01012477 Warrington 4.25 30798
E01012478 Warrington 22.00 12547
E01012479 Warrington 40.99 4262
E01012480 Warrington 45.72 3061
E01012481 Warrington 24.39 11041
E01012482 Warrington 36.40 5740
E01012483 Warrington 56.68 1188
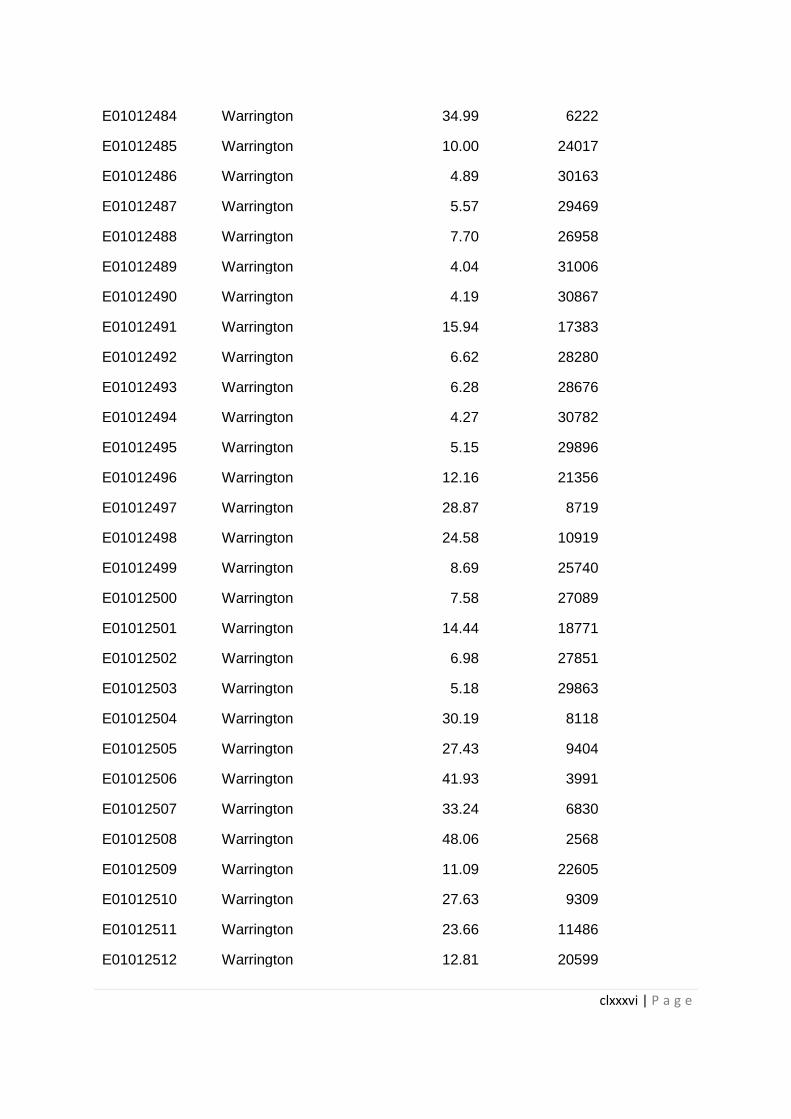
clxxxvi | P a g e
E01012484 Warrington 34.99 6222
E01012485 Warrington 10.00 24017
E01012486 Warrington 4.89 30163
E01012487 Warrington 5.57 29469
E01012488 Warrington 7.70 26958
E01012489 Warrington 4.04 31006
E01012490 Warrington 4.19 30867
E01012491 Warrington 15.94 17383
E01012492 Warrington 6.62 28280
E01012493 Warrington 6.28 28676
E01012494 Warrington 4.27 30782
E01012495 Warrington 5.15 29896
E01012496 Warrington 12.16 21356
E01012497 Warrington 28.87 8719
E01012498 Warrington 24.58 10919
E01012499 Warrington 8.69 25740
E01012500 Warrington 7.58 27089
E01012501 Warrington 14.44 18771
E01012502 Warrington 6.98 27851
E01012503 Warrington 5.18 29863
E01012504 Warrington 30.19 8118
E01012505 Warrington 27.43 9404
E01012506 Warrington 41.93 3991
E01012507 Warrington 33.24 6830
E01012508 Warrington 48.06 2568
E01012509 Warrington 11.09 22605
E01012510 Warrington 27.63 9309
E01012511 Warrington 23.66 11486
E01012512 Warrington 12.81 20599
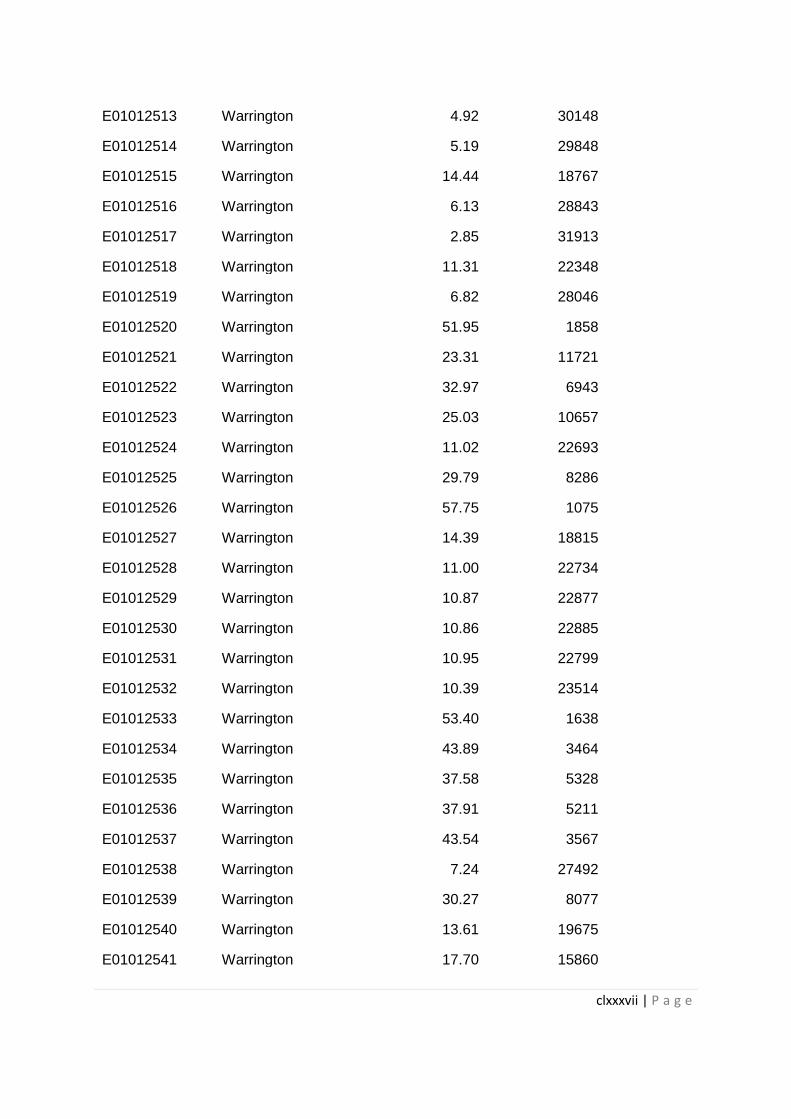
clxxxvii | P a g e
E01012513 Warrington 4.92 30148
E01012514 Warrington 5.19 29848
E01012515 Warrington 14.44 18767
E01012516 Warrington 6.13 28843
E01012517 Warrington 2.85 31913
E01012518 Warrington 11.31 22348
E01012519 Warrington 6.82 28046
E01012520 Warrington 51.95 1858
E01012521 Warrington 23.31 11721
E01012522 Warrington 32.97 6943
E01012523 Warrington 25.03 10657
E01012524 Warrington 11.02 22693
E01012525 Warrington 29.79 8286
E01012526 Warrington 57.75 1075
E01012527 Warrington 14.39 18815
E01012528 Warrington 11.00 22734
E01012529 Warrington 10.87 22877
E01012530 Warrington 10.86 22885
E01012531 Warrington 10.95 22799
E01012532 Warrington 10.39 23514
E01012533 Warrington 53.40 1638
E01012534 Warrington 43.89 3464
E01012535 Warrington 37.58 5328
E01012536 Warrington 37.91 5211
E01012537 Warrington 43.54 3567
E01012538 Warrington 7.24 27492
E01012539 Warrington 30.27 8077
E01012540 Warrington 13.61 19675
E01012541 Warrington 17.70 15860
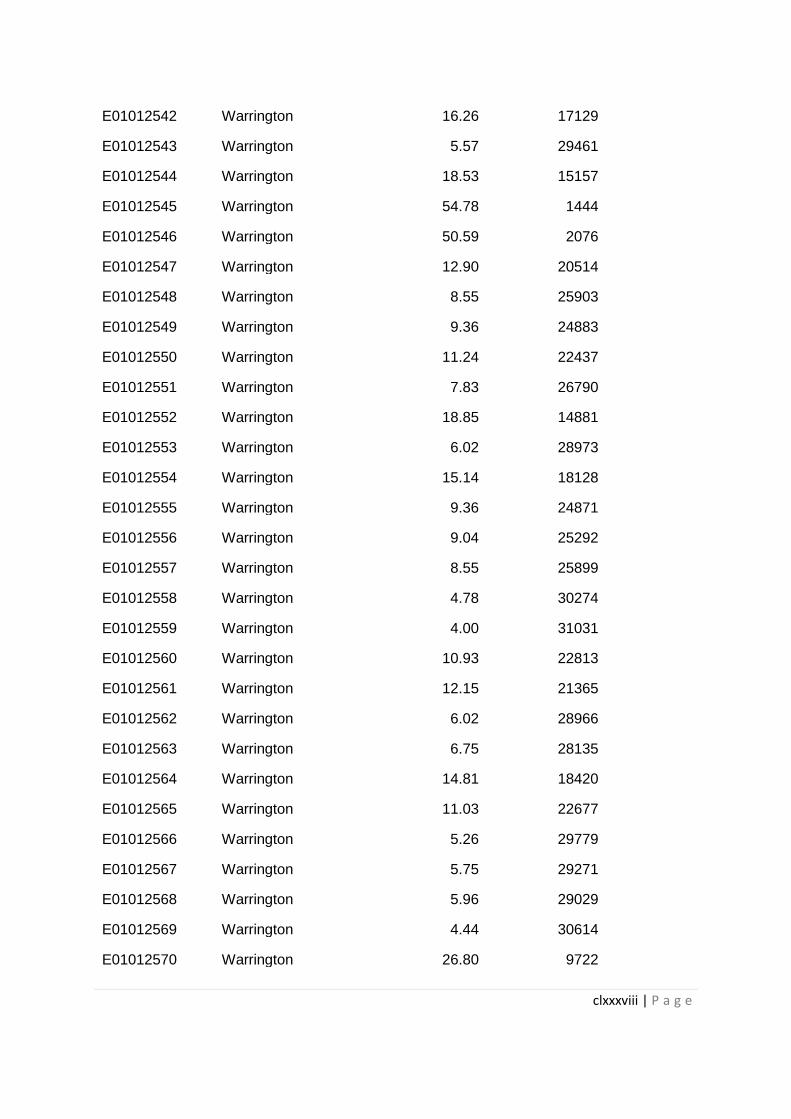
clxxxviii | P a g e
E01012542 Warrington 16.26 17129
E01012543 Warrington 5.57 29461
E01012544 Warrington 18.53 15157
E01012545 Warrington 54.78 1444
E01012546 Warrington 50.59 2076
E01012547 Warrington 12.90 20514
E01012548 Warrington 8.55 25903
E01012549 Warrington 9.36 24883
E01012550 Warrington 11.24 22437
E01012551 Warrington 7.83 26790
E01012552 Warrington 18.85 14881
E01012553 Warrington 6.02 28973
E01012554 Warrington 15.14 18128
E01012555 Warrington 9.36 24871
E01012556 Warrington 9.04 25292
E01012557 Warrington 8.55 25899
E01012558 Warrington 4.78 30274
E01012559 Warrington 4.00 31031
E01012560 Warrington 10.93 22813
E01012561 Warrington 12.15 21365
E01012562 Warrington 6.02 28966
E01012563 Warrington 6.75 28135
E01012564 Warrington 14.81 18420
E01012565 Warrington 11.03 22677
E01012566 Warrington 5.26 29779
E01012567 Warrington 5.75 29271
E01012568 Warrington 5.96 29029
E01012569 Warrington 4.44 30614
E01012570 Warrington 26.80 9722
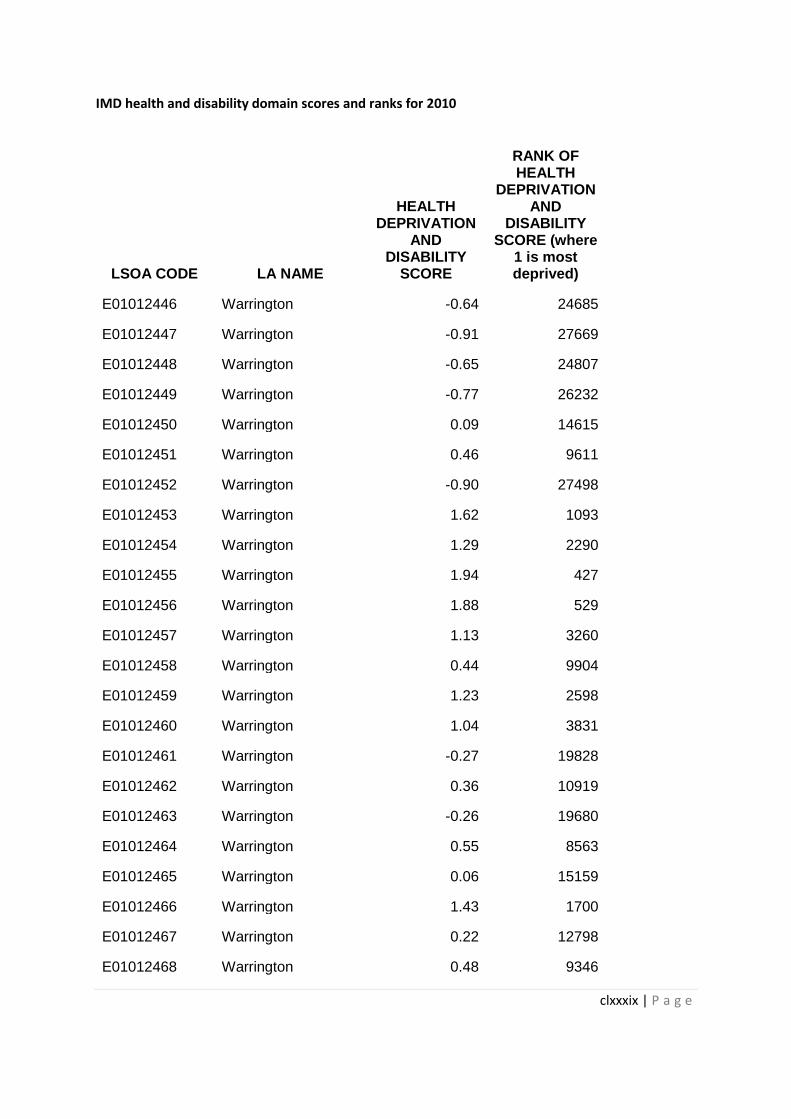
clxxxix | P a g e
IMD health and disability domain scores and ranks for 2010
LSOA CODE LA NAME
HEALTH DEPRIVATION
AND DISABILITY
SCORE
RANK OF HEALTH
DEPRIVATION AND
DISABILITY SCORE (where
1 is most deprived)
E01012446 Warrington -0.64 24685
E01012447 Warrington -0.91 27669
E01012448 Warrington -0.65 24807
E01012449 Warrington -0.77 26232
E01012450 Warrington 0.09 14615
E01012451 Warrington 0.46 9611
E01012452 Warrington -0.90 27498
E01012453 Warrington 1.62 1093
E01012454 Warrington 1.29 2290
E01012455 Warrington 1.94 427
E01012456 Warrington 1.88 529
E01012457 Warrington 1.13 3260
E01012458 Warrington 0.44 9904
E01012459 Warrington 1.23 2598
E01012460 Warrington 1.04 3831
E01012461 Warrington -0.27 19828
E01012462 Warrington 0.36 10919
E01012463 Warrington -0.26 19680
E01012464 Warrington 0.55 8563
E01012465 Warrington 0.06 15159
E01012466 Warrington 1.43 1700
E01012467 Warrington 0.22 12798
E01012468 Warrington 0.48 9346
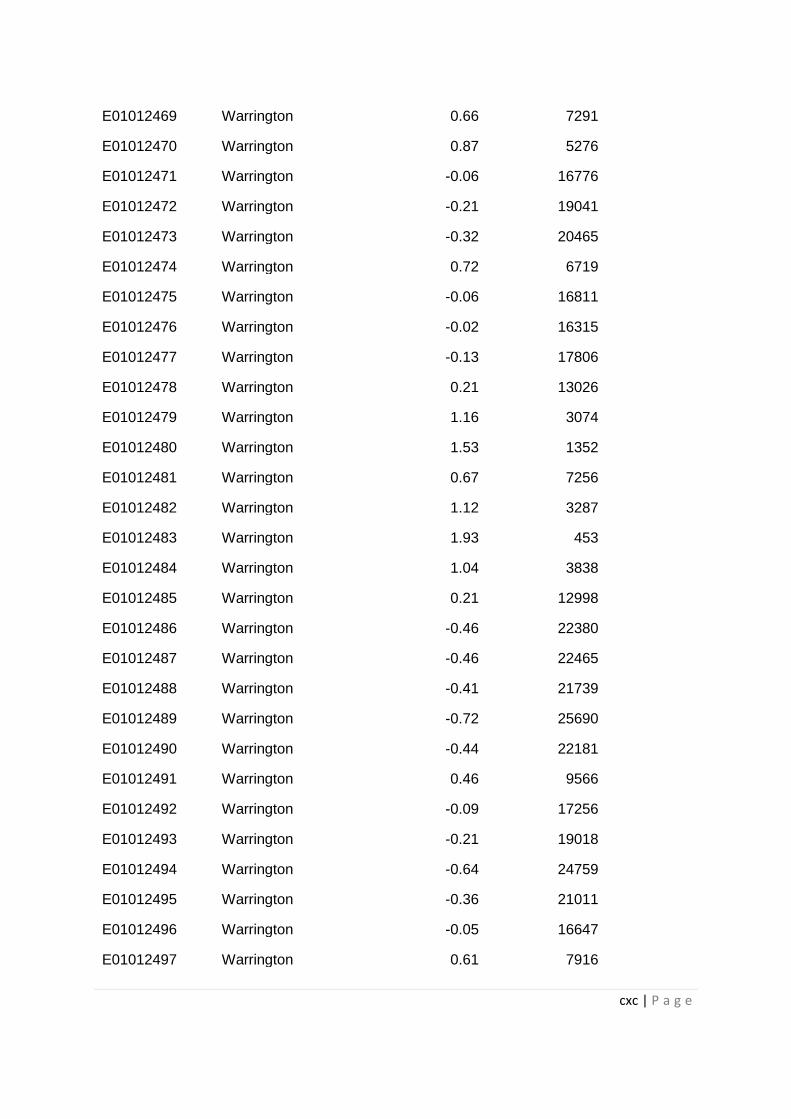
cxc | P a g e
E01012469 Warrington 0.66 7291
E01012470 Warrington 0.87 5276
E01012471 Warrington -0.06 16776
E01012472 Warrington -0.21 19041
E01012473 Warrington -0.32 20465
E01012474 Warrington 0.72 6719
E01012475 Warrington -0.06 16811
E01012476 Warrington -0.02 16315
E01012477 Warrington -0.13 17806
E01012478 Warrington 0.21 13026
E01012479 Warrington 1.16 3074
E01012480 Warrington 1.53 1352
E01012481 Warrington 0.67 7256
E01012482 Warrington 1.12 3287
E01012483 Warrington 1.93 453
E01012484 Warrington 1.04 3838
E01012485 Warrington 0.21 12998
E01012486 Warrington -0.46 22380
E01012487 Warrington -0.46 22465
E01012488 Warrington -0.41 21739
E01012489 Warrington -0.72 25690
E01012490 Warrington -0.44 22181
E01012491 Warrington 0.46 9566
E01012492 Warrington -0.09 17256
E01012493 Warrington -0.21 19018
E01012494 Warrington -0.64 24759
E01012495 Warrington -0.36 21011
E01012496 Warrington -0.05 16647
E01012497 Warrington 0.61 7916

cxci | P a g e
E01012498 Warrington 0.75 6387
E01012499 Warrington -0.12 17796
E01012500 Warrington -0.07 16984
E01012501 Warrington 0.10 14531
E01012502 Warrington -0.16 18294
E01012503 Warrington -0.70 25484
E01012504 Warrington 0.89 5064
E01012505 Warrington 0.70 6940
E01012506 Warrington 1.20 2767
E01012507 Warrington 0.94 4605
E01012508 Warrington 1.53 1366
E01012509 Warrington -0.01 16097
E01012510 Warrington 0.90 4942
E01012511 Warrington 0.56 8423
E01012512 Warrington 0.01 15796
E01012513 Warrington -0.57 23931
E01012514 Warrington -0.68 25213
E01012515 Warrington 0.06 15163
E01012516 Warrington -0.59 24092
E01012517 Warrington -0.88 27307
E01012518 Warrington -0.25 19497
E01012519 Warrington -0.35 20978
E01012520 Warrington 1.71 863
E01012521 Warrington 0.64 7533
E01012522 Warrington 0.77 6215
E01012523 Warrington 0.32 11523
E01012524 Warrington -0.28 19965
E01012525 Warrington 0.80 5919
E01012526 Warrington 1.34 2031
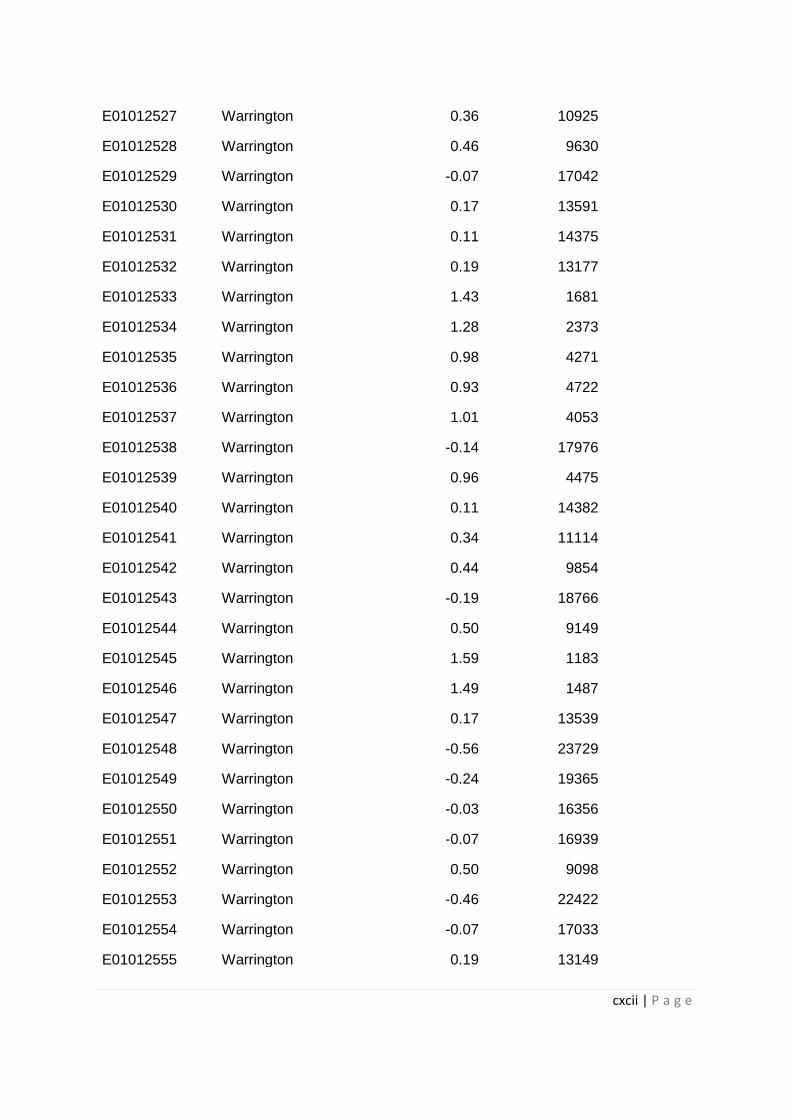
cxcii | P a g e
E01012527 Warrington 0.36 10925
E01012528 Warrington 0.46 9630
E01012529 Warrington -0.07 17042
E01012530 Warrington 0.17 13591
E01012531 Warrington 0.11 14375
E01012532 Warrington 0.19 13177
E01012533 Warrington 1.43 1681
E01012534 Warrington 1.28 2373
E01012535 Warrington 0.98 4271
E01012536 Warrington 0.93 4722
E01012537 Warrington 1.01 4053
E01012538 Warrington -0.14 17976
E01012539 Warrington 0.96 4475
E01012540 Warrington 0.11 14382
E01012541 Warrington 0.34 11114
E01012542 Warrington 0.44 9854
E01012543 Warrington -0.19 18766
E01012544 Warrington 0.50 9149
E01012545 Warrington 1.59 1183
E01012546 Warrington 1.49 1487
E01012547 Warrington 0.17 13539
E01012548 Warrington -0.56 23729
E01012549 Warrington -0.24 19365
E01012550 Warrington -0.03 16356
E01012551 Warrington -0.07 16939
E01012552 Warrington 0.50 9098
E01012553 Warrington -0.46 22422
E01012554 Warrington -0.07 17033
E01012555 Warrington 0.19 13149
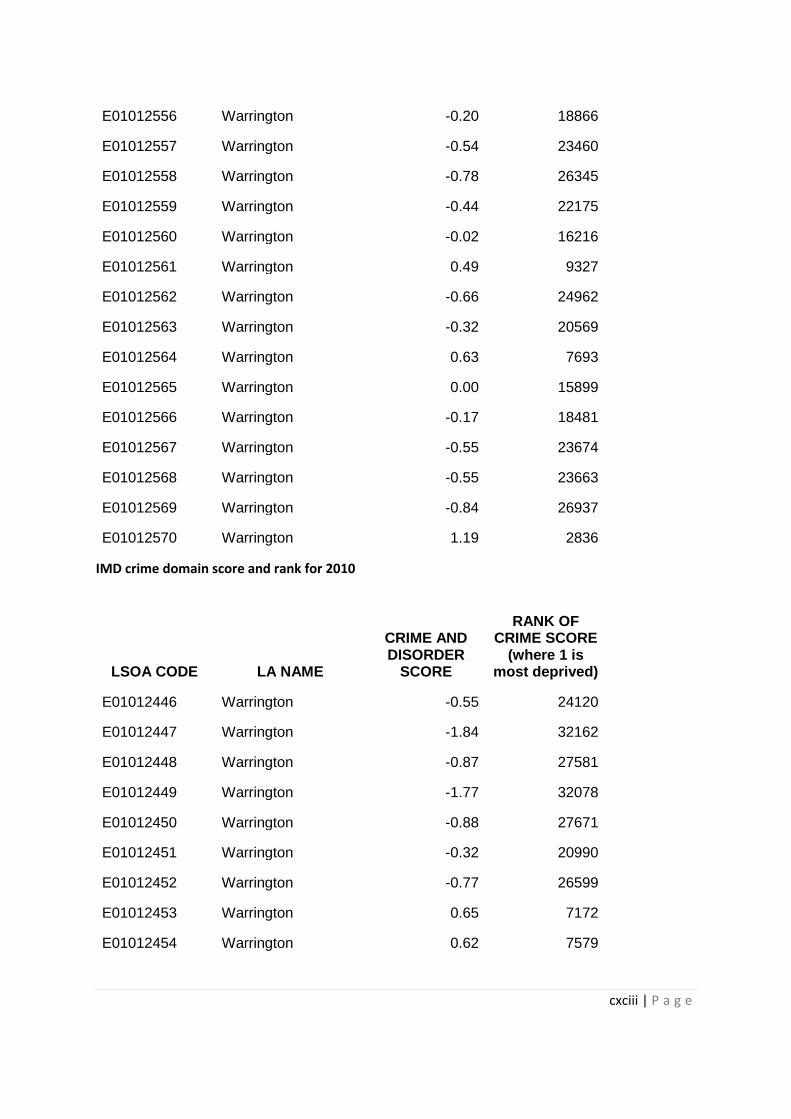
cxciii | P a g e
E01012556 Warrington -0.20 18866
E01012557 Warrington -0.54 23460
E01012558 Warrington -0.78 26345
E01012559 Warrington -0.44 22175
E01012560 Warrington -0.02 16216
E01012561 Warrington 0.49 9327
E01012562 Warrington -0.66 24962
E01012563 Warrington -0.32 20569
E01012564 Warrington 0.63 7693
E01012565 Warrington 0.00 15899
E01012566 Warrington -0.17 18481
E01012567 Warrington -0.55 23674
E01012568 Warrington -0.55 23663
E01012569 Warrington -0.84 26937
E01012570 Warrington 1.19 2836
IMD crime domain score and rank for 2010
LSOA CODE LA NAME
CRIME AND DISORDER
SCORE
RANK OF CRIME SCORE
(where 1 is most deprived)
E01012446 Warrington -0.55 24120
E01012447 Warrington -1.84 32162
E01012448 Warrington -0.87 27581
E01012449 Warrington -1.77 32078
E01012450 Warrington -0.88 27671
E01012451 Warrington -0.32 20990
E01012452 Warrington -0.77 26599
E01012453 Warrington 0.65 7172
E01012454 Warrington 0.62 7579
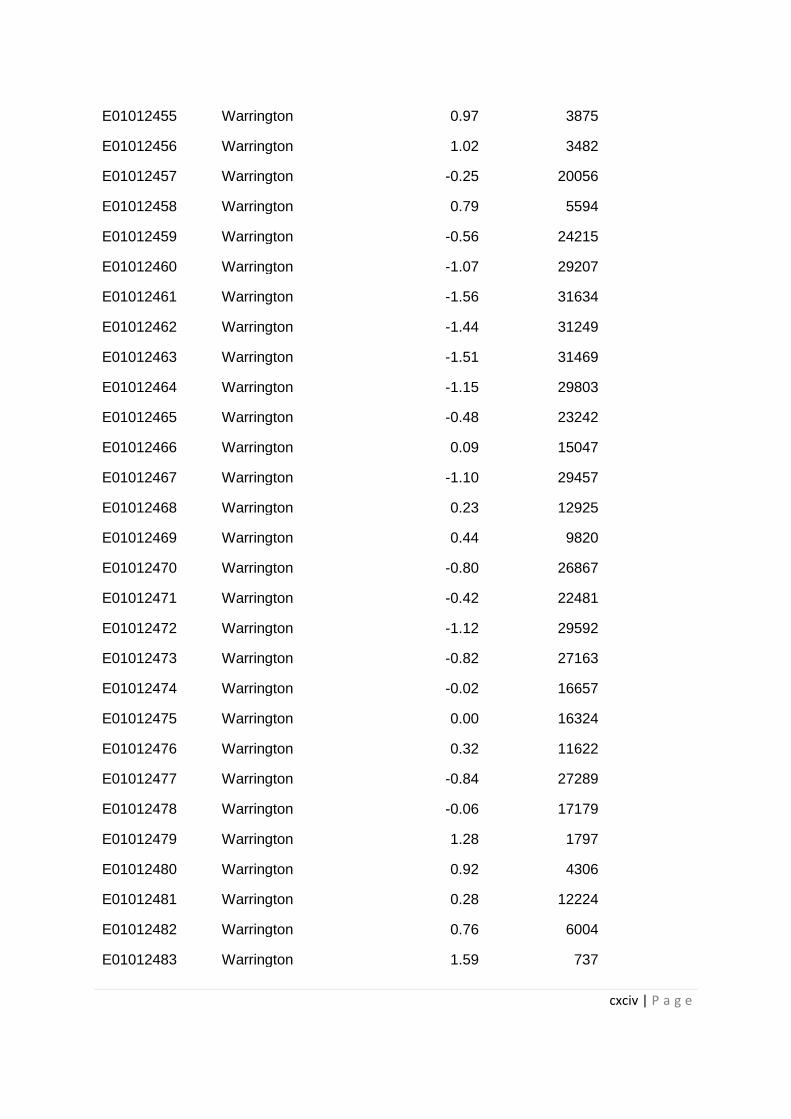
cxciv | P a g e
E01012455 Warrington 0.97 3875
E01012456 Warrington 1.02 3482
E01012457 Warrington -0.25 20056
E01012458 Warrington 0.79 5594
E01012459 Warrington -0.56 24215
E01012460 Warrington -1.07 29207
E01012461 Warrington -1.56 31634
E01012462 Warrington -1.44 31249
E01012463 Warrington -1.51 31469
E01012464 Warrington -1.15 29803
E01012465 Warrington -0.48 23242
E01012466 Warrington 0.09 15047
E01012467 Warrington -1.10 29457
E01012468 Warrington 0.23 12925
E01012469 Warrington 0.44 9820
E01012470 Warrington -0.80 26867
E01012471 Warrington -0.42 22481
E01012472 Warrington -1.12 29592
E01012473 Warrington -0.82 27163
E01012474 Warrington -0.02 16657
E01012475 Warrington 0.00 16324
E01012476 Warrington 0.32 11622
E01012477 Warrington -0.84 27289
E01012478 Warrington -0.06 17179
E01012479 Warrington 1.28 1797
E01012480 Warrington 0.92 4306
E01012481 Warrington 0.28 12224
E01012482 Warrington 0.76 6004
E01012483 Warrington 1.59 737
cxcv | P a g e
E01012484 Warrington 0.99 3760
E01012485 Warrington -1.15 29735
E01012486 Warrington -0.88 27748
E01012487 Warrington -0.84 27307
E01012488 Warrington 0.31 11758
E01012489 Warrington -0.22 19627
E01012490 Warrington -1.13 29641
E01012491 Warrington -0.87 27655
E01012492 Warrington -1.27 30455
E01012493 Warrington -1.29 30558
E01012494 Warrington -1.76 32069
E01012495 Warrington -0.61 24879
E01012496 Warrington -0.44 22669
E01012497 Warrington 0.37 10783
E01012498 Warrington -0.17 18787
E01012499 Warrington -0.91 27946
E01012500 Warrington -0.68 25634
E01012501 Warrington -0.35 21477
E01012502 Warrington -0.28 20514
E01012503 Warrington -0.85 27425
E01012504 Warrington -0.08 17505
E01012505 Warrington 0.09 14917
E01012506 Warrington 0.02 16022
E01012507 Warrington 0.71 6538
E01012508 Warrington 0.25 12646
E01012509 Warrington -0.65 25280
E01012510 Warrington 0.31 11708
E01012511 Warrington -0.06 17236
E01012512 Warrington -0.54 24003

cxcvi | P a g e
E01012513 Warrington -0.86 27554
E01012514 Warrington -0.60 24692
E01012515 Warrington 0.55 8406
E01012516 Warrington -0.39 22076
E01012517 Warrington -0.79 26850
E01012518 Warrington -0.04 16895
E01012519 Warrington -0.21 19461
E01012520 Warrington 0.90 4495
E01012521 Warrington 0.35 11131
E01012522 Warrington 0.31 11727
E01012523 Warrington 0.88 4700
E01012524 Warrington -0.25 20069
E01012525 Warrington 0.61 7682
E01012526 Warrington 1.02 3462
E01012527 Warrington -0.67 25619
E01012528 Warrington -0.63 25091
E01012529 Warrington -0.18 19002
E01012530 Warrington -0.87 27653
E01012531 Warrington -0.88 27721
E01012532 Warrington -0.51 23604
E01012533 Warrington 0.89 4574
E01012534 Warrington 0.74 6126
E01012535 Warrington 0.67 6894
E01012536 Warrington 0.92 4339
E01012537 Warrington 0.83 5135
E01012538 Warrington -0.19 19115
E01012539 Warrington 0.45 9787
E01012540 Warrington 0.58 8086
E01012541 Warrington -0.38 21849
cxcvii | P a g e
E01012542 Warrington 0.08 15179
E01012543 Warrington -0.96 28386
E01012544 Warrington -0.92 28046
E01012545 Warrington 1.10 2879
E01012546 Warrington 0.77 5781
E01012547 Warrington -0.75 26383
E01012548 Warrington -0.57 24385
E01012549 Warrington -0.96 28392
E01012550 Warrington -0.46 22903
E01012551 Warrington -0.43 22537
E01012552 Warrington -0.64 25237
E01012553 Warrington -0.51 23599
E01012554 Warrington -0.30 20813
E01012555 Warrington -0.47 23096
E01012556 Warrington -0.66 25472
E01012557 Warrington 0.31 11714
E01012558 Warrington -0.23 19649
E01012559 Warrington -0.82 27151
E01012560 Warrington -0.57 24411
E01012561 Warrington -0.89 27774
E01012562 Warrington -0.73 26222
E01012563 Warrington -0.70 25850
E01012564 Warrington 0.04 15808
E01012565 Warrington -0.33 21231
E01012566 Warrington -0.71 25961
E01012567 Warrington -1.23 30230
E01012568 Warrington -0.60 24762
E01012569 Warrington -0.82 27083
E01012570 Warrington -0.37 21709

cxcviii | P a g e
Copyright © 2022 FDOKUMEN