
Clinical Benefits, Costs, and Cost-Effectiveness of Neonatal Intensive Care in Mexico
10
Clinical Benefits, Costs, and Cost-Effectiveness of Neonatal Intensive Care in Mexico Jochen Profit 1,2 , Diana Lee 3 , John A. Zupancic 4,5 , LuAnn Papile 1 , Cristina Gutierrez 6 , Sue J. Goldie 3,7,8 , Eduardo Gonzalez-Pier 9 , Joshua A. Salomon 3,8,10 * 1 Baylor College of Medicine, Department of Pediatrics, Texas Children’s Hospital, Section of Neonatology, Houston, Texas, United States of America, 2 Baylor College of Medicine, Department of Medicine, Section of Health Services Research, Houston, Texas, United States of America, 3 Harvard University, Harvard Initiative for Global Health, Cambridge, Massachusetts, United States of America, 4 Beth Israel Deaconess Medical Center, Department of Neonatology, Boston, Massachusetts, United States of America, 5 Harvard Medical School, Department of Pediatrics, Division of Newborn Medicine, Boston, Massachusetts, United States of America, 6 Mexican Ministry of Health, Economic Analysis Unit, Me ´xico D.F., Mexico, 7 Harvard School of Public Health, Department of Health Policy and Management, Boston, Massachusetts, United States of America, 8 Harvard School of Public Health, Center for Health Decision Science, Boston, Massachusetts, United States of America, 9 Fundacio ´ n Mexicana para la Salud, Me ´xico D.F., Mexico, 10 Harvard School of Public Health, Department of Global Health and Population, Boston, Massachusetts, United States of America Abstract Background: Neonatal intensive care improves survival, but is associated with high costs and disability amongst survivors. Recent health reform in Mexico launched a new subsidized insurance program, necessitating informed choices on the different interventions that might be covered by the program, including neonatal intensive care. The purpose of this study was to estimate the clinical outcomes, costs, and cost-effectiveness of neonatal intensive care in Mexico. Methods and Findings: A cost-effectiveness analysis was conducted using a decision analytic model of health and economic outcomes following preterm birth. Model parameters governing health outcomes were estimated from Mexican vital registration and hospital discharge databases, supplemented with meta-analyses and systematic reviews from the published literature. Costs were estimated on the basis of data provided by the Ministry of Health in Mexico and World Health Organization price lists, supplemented with published studies from other countries as needed. The model estimated changes in clinical outcomes, life expectancy, disability-free life expectancy, lifetime costs, disability-adjusted life years (DALYs), and incremental cost-effectiveness ratios (ICERs) for neonatal intensive care compared to no intensive care. Uncertainty around the results was characterized using one-way sensitivity analyses and a multivariate probabilistic sensitivity analysis. In the base-case analysis, neonatal intensive care for infants born at 24–26, 27–29, and 30–33 weeks gestational age prolonged life expectancy by 28, 43, and 34 years and averted 9, 15, and 12 DALYs, at incremental costs per infant of US$11,400, US$9,500, and US$3,000, respectively, compared to an alternative of no intensive care. The ICERs of neonatal intensive care at 24–26, 27–29, and 30–33 weeks were US$1,200, US$650, and US$240, per DALY averted, respectively. The findings were robust to variation in parameter values over wide ranges in sensitivity analyses. Conclusions: Incremental cost-effectiveness ratios for neonatal intensive care imply very high value for money on the basis of conventional benchmarks for cost-effectiveness analysis. Please see later in the article for the Editors’ Summary. Citation: Profit J, Lee D, Zupancic JA, Papile L, Gutierrez C, et al. (2010) Clinical Benefits, Costs, and Cost-Effectiveness of Neonatal Intensive Care in Mexico. PLoS Med 7(12): e1000379. doi:10.1371/journal.pmed.1000379 Academic Editor: Theo Vos, University of Queensland, Australia Received August 25, 2009; Accepted November 3, 2010; Published December 14, 2010 Copyright: ß 2010 Profit et al. This is an open-access article distributed under the terms of the Creative Commons Attribution License, which permits unrestricted use, distribution, and reproduction in any medium, provided the original author and source are credited. Funding: This project was supported by funding from the Ministry of Health in Mexico. JP’s effort was also supported in part by a grant from the Eunice Kennedy Shriver National Institute of Child Health and Human Development (K23 HD056298-01). The funders had no role in study design, data collection and analysis, decision to publish, or preparation of the manuscript. Competing Interests: Josh Salomon is a member of the PLoS Medicine Editorial Board. Abbreviations: DALY, disability-adjusted life years; GA, gestational age; GDP, gross domestic product; ICER, incremental cost-effectiveness ratio; NICU, neonatal intensive care unit * E-mail: [email protected] PLoS Medicine | www.plosmedicine.org 1 December 2010 | Volume 7 | Issue 12 | e1000379
-
Upload
independent -
Category
Documents
-
view
0 -
download
0
Transcript of Clinical Benefits, Costs, and Cost-Effectiveness of Neonatal Intensive Care in Mexico
Clinical Benefits, Costs, and Cost-Effectiveness ofNeonatal Intensive Care in MexicoJochen Profit1,2, Diana Lee3, John A. Zupancic4,5, LuAnn Papile1, Cristina Gutierrez6, Sue J. Goldie3,7,8,
Eduardo Gonzalez-Pier9, Joshua A. Salomon3,8,10*
1 Baylor College of Medicine, Department of Pediatrics, Texas Children’s Hospital, Section of Neonatology, Houston, Texas, United States of America, 2 Baylor College of
Medicine, Department of Medicine, Section of Health Services Research, Houston, Texas, United States of America, 3 Harvard University, Harvard Initiative for Global
Health, Cambridge, Massachusetts, United States of America, 4 Beth Israel Deaconess Medical Center, Department of Neonatology, Boston, Massachusetts, United States
of America, 5 Harvard Medical School, Department of Pediatrics, Division of Newborn Medicine, Boston, Massachusetts, United States of America, 6 Mexican Ministry of
Health, Economic Analysis Unit, Mexico D.F., Mexico, 7 Harvard School of Public Health, Department of Health Policy and Management, Boston, Massachusetts, United
States of America, 8 Harvard School of Public Health, Center for Health Decision Science, Boston, Massachusetts, United States of America, 9 Fundacion Mexicana para la
Salud, Mexico D.F., Mexico, 10 Harvard School of Public Health, Department of Global Health and Population, Boston, Massachusetts, United States of America
Abstract
Background: Neonatal intensive care improves survival, but is associated with high costs and disability amongst survivors.Recent health reform in Mexico launched a new subsidized insurance program, necessitating informed choices on thedifferent interventions that might be covered by the program, including neonatal intensive care. The purpose of this studywas to estimate the clinical outcomes, costs, and cost-effectiveness of neonatal intensive care in Mexico.
Methods and Findings: A cost-effectiveness analysis was conducted using a decision analytic model of health andeconomic outcomes following preterm birth. Model parameters governing health outcomes were estimated from Mexicanvital registration and hospital discharge databases, supplemented with meta-analyses and systematic reviews from thepublished literature. Costs were estimated on the basis of data provided by the Ministry of Health in Mexico and WorldHealth Organization price lists, supplemented with published studies from other countries as needed. The model estimatedchanges in clinical outcomes, life expectancy, disability-free life expectancy, lifetime costs, disability-adjusted life years(DALYs), and incremental cost-effectiveness ratios (ICERs) for neonatal intensive care compared to no intensive care.Uncertainty around the results was characterized using one-way sensitivity analyses and a multivariate probabilisticsensitivity analysis. In the base-case analysis, neonatal intensive care for infants born at 24–26, 27–29, and 30–33 weeksgestational age prolonged life expectancy by 28, 43, and 34 years and averted 9, 15, and 12 DALYs, at incremental costs perinfant of US$11,400, US$9,500, and US$3,000, respectively, compared to an alternative of no intensive care. The ICERs ofneonatal intensive care at 24–26, 27–29, and 30–33 weeks were US$1,200, US$650, and US$240, per DALY averted,respectively. The findings were robust to variation in parameter values over wide ranges in sensitivity analyses.
Conclusions: Incremental cost-effectiveness ratios for neonatal intensive care imply very high value for money on the basisof conventional benchmarks for cost-effectiveness analysis.
Please see later in the article for the Editors’ Summary.
Citation: Profit J, Lee D, Zupancic JA, Papile L, Gutierrez C, et al. (2010) Clinical Benefits, Costs, and Cost-Effectiveness of Neonatal Intensive Care in Mexico. PLoSMed 7(12): e1000379. doi:10.1371/journal.pmed.1000379
Academic Editor: Theo Vos, University of Queensland, Australia
Received August 25, 2009; Accepted November 3, 2010; Published December 14, 2010
Copyright: � 2010 Profit et al. This is an open-access article distributed under the terms of the Creative Commons Attribution License, which permitsunrestricted use, distribution, and reproduction in any medium, provided the original author and source are credited.
Funding: This project was supported by funding from the Ministry of Health in Mexico. JP’s effort was also supported in part by a grant from the Eunice KennedyShriver National Institute of Child Health and Human Development (K23 HD056298-01). The funders had no role in study design, data collection and analysis,decision to publish, or preparation of the manuscript.
Competing Interests: Josh Salomon is a member of the PLoS Medicine Editorial Board.
Abbreviations: DALY, disability-adjusted life years; GA, gestational age; GDP, gross domestic product; ICER, incremental cost-effectiveness ratio; NICU, neonatalintensive care unit
* E-mail: [email protected]
PLoS Medicine | www.plosmedicine.org 1 December 2010 | Volume 7 | Issue 12 | e1000379

Introduction
Neonatal intensive care has dramatically improved the survival
of preterm babies [1,2]. However, as the borders of viability have
been pushed to ever lower gestational ages (GAs), the costs of care
have risen dramatically [3–6]. Furthermore, survival of the
youngest patients frequently is accompanied by significant
morbidity, placing substantial resource demands on patients,
families, and society [7–10]. Middle-income countries such as
Mexico have made significant progress in improving neonatal
survival over the last decades. Nevertheless, elevated mortality
rates for preterm infants persist in developing countries, compared
to those in high-income countries [11].
Since the year 2000, Mexico has undertaken a comprehensive
health system reform in order to improve access to care, equity,
quality, and fairness of financing [12]. This reform focused on the
50 million uninsured Mexicans and established in 2004 the System
of Social Protection in Health (SSPH). The SSPH contains a
subsidized insurance-based component, Popular Health Insurance
(Seguro Popular), which offers free access to an explicit set of health
care interventions. The selection of interventions has been guided
in part by evidence on the health and economic consequences of a
wide array of candidate interventions, including explicit consid-
eration of cost-effectiveness [13].
This study, undertaken as part of the process for selecting
interventions to be included in the insurance benefits package,
examined the clinical outcomes, lifetime costs, and cost-effective-
ness of neonatal intensive care in Mexico.
Methods
Analytic OverviewWe developed a decision analytic model of health and economic
outcomes following preterm birth in order to simulate the short-
term and long-term consequences of neonatal intensive care
compared to a counter-factual of no neonatal intensive care in
Mexico. Analyses were stratified by three categories of GA at
birth: 24–26 wk, 27–29 wk, and 30–33 wk. For each GA group,
we used a decision tree to model outcomes during the neonatal
period, with or without neonatal intensive care. These outcomes
included mortality, survival to 28 d with no disability, or survival
with either major or minor disability (Figure 1). Long-term
outcomes among those surviving to the end of the neonatal period
were modeled using a life table approach, with age-specific
mortality rates dependent on long-term disability category.
Outcomes were analyzed for the entire remaining lifetimes of
the individuals.
Following guidelines from the World Health Organization
(WHO) on conducting cost-effectiveness analyses [14], we adopted
a societal perspective for measuring costs and health outcomes.
Health outcomes were summarized in terms of life expectancy,
disability-free life expectancy, and disability-adjusted life years
(DALYs). Time costs were not included in the analysis under the
assumption that these costs were relatively small in comparison to
the costs of health care that were captured in the analysis. Costs
were expressed as 2005 US dollars. Prices from earlier years were
converted into 2005 units using gross domestic product (GDP)
deflators. Prices available in Mexican pesos were first deflated to
2005 values and then converted into US dollars. Costs and DALYs
were discounted at a rate of 3% per annum.
Data on MortalityKey parameters regarding health outcomes following preterm
birth with or without neonatal intensive care were derived from
Mexican vital registration and hospital discharge databases,
supplemented with studies from the published medical literature,
as needed. Because some previous studies have reported results
stratified by birthweight rather than GA, in these cases we mapped
from 500–749 g, 750–999 g, and 1,000–1,500 g birthweights to
the GA groups 24–26, 27–29, and 30–33 wk, respectively. This
mapping implied a weight-for-gestational-age around the 25th
percentile on high-income national growth curves [15], which we
intended to reflect the higher proportion of infants born small for
GA in Mexico [16]. For example, the median weight for an infant
born at 28 wk on a standard growth chart is about 1,200 g [15],
but we applied outcomes from this group to the 30–33-wk GA
group in the model.
Model input parameters relating to neonatal mortality are
shown in Table 1. Neonatal mortality rates by GA were derived
from hospital discharge records provided by the Mexican Ministry
of Health. We pooled data from the years 2000 to 2005, which
provided information on 90,526 births in the GA groups included
in this study. Since neonatal intensive care units (NICUs) are the
current standard of care in Mexico for treating preterm infants, we
Figure 1. Schematic of decision tree model for outcomes during the neonatal period, with or without neonatal intensive care.Square indicates decision node, circles indicate chance nodes, and triangles indicate endpoints. Node 2 has the same structure as Node 1 but hasdifferent probabilities governing outcomes at each branch. Long-term outcomes for the endpoints of no disability, minor disability, and majordisability are determined using a life table approach incorporating age-specific death rates defined for each disability category.doi:10.1371/journal.pmed.1000379.g001
Cost-Effectiveness of NICU in Mexico
PLoS Medicine | www.plosmedicine.org 2 December 2010 | Volume 7 | Issue 12 | e1000379
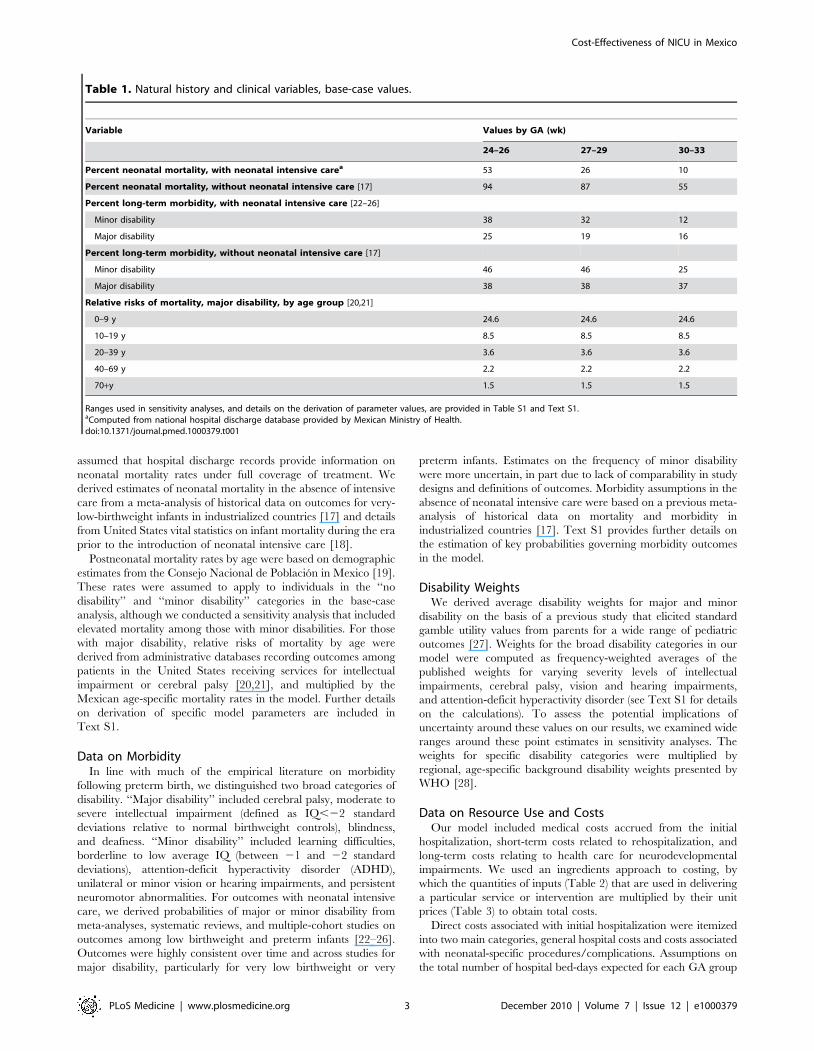
assumed that hospital discharge records provide information on
neonatal mortality rates under full coverage of treatment. We
derived estimates of neonatal mortality in the absence of intensive
care from a meta-analysis of historical data on outcomes for very-
low-birthweight infants in industrialized countries [17] and details
from United States vital statistics on infant mortality during the era
prior to the introduction of neonatal intensive care [18].
Postneonatal mortality rates by age were based on demographic
estimates from the Consejo Nacional de Poblacion in Mexico [19].
These rates were assumed to apply to individuals in the ‘‘no
disability’’ and ‘‘minor disability’’ categories in the base-case
analysis, although we conducted a sensitivity analysis that included
elevated mortality among those with minor disabilities. For those
with major disability, relative risks of mortality by age were
derived from administrative databases recording outcomes among
patients in the United States receiving services for intellectual
impairment or cerebral palsy [20,21], and multiplied by the
Mexican age-specific mortality rates in the model. Further details
on derivation of specific model parameters are included in
Text S1.
Data on MorbidityIn line with much of the empirical literature on morbidity
following preterm birth, we distinguished two broad categories of
disability. ‘‘Major disability’’ included cerebral palsy, moderate to
severe intellectual impairment (defined as IQ,22 standard
deviations relative to normal birthweight controls), blindness,
and deafness. ‘‘Minor disability’’ included learning difficulties,
borderline to low average IQ (between 21 and 22 standard
deviations), attention-deficit hyperactivity disorder (ADHD),
unilateral or minor vision or hearing impairments, and persistent
neuromotor abnormalities. For outcomes with neonatal intensive
care, we derived probabilities of major or minor disability from
meta-analyses, systematic reviews, and multiple-cohort studies on
outcomes among low birthweight and preterm infants [22–26].
Outcomes were highly consistent over time and across studies for
major disability, particularly for very low birthweight or very
preterm infants. Estimates on the frequency of minor disability
were more uncertain, in part due to lack of comparability in study
designs and definitions of outcomes. Morbidity assumptions in the
absence of neonatal intensive care were based on a previous meta-
analysis of historical data on mortality and morbidity in
industrialized countries [17]. Text S1 provides further details on
the estimation of key probabilities governing morbidity outcomes
in the model.
Disability WeightsWe derived average disability weights for major and minor
disability on the basis of a previous study that elicited standard
gamble utility values from parents for a wide range of pediatric
outcomes [27]. Weights for the broad disability categories in our
model were computed as frequency-weighted averages of the
published weights for varying severity levels of intellectual
impairments, cerebral palsy, vision and hearing impairments,
and attention-deficit hyperactivity disorder (see Text S1 for details
on the calculations). To assess the potential implications of
uncertainty around these values on our results, we examined wide
ranges around these point estimates in sensitivity analyses. The
weights for specific disability categories were multiplied by
regional, age-specific background disability weights presented by
WHO [28].
Data on Resource Use and CostsOur model included medical costs accrued from the initial
hospitalization, short-term costs related to rehospitalization, and
long-term costs relating to health care for neurodevelopmental
impairments. We used an ingredients approach to costing, by
which the quantities of inputs (Table 2) that are used in delivering
a particular service or intervention are multiplied by their unit
prices (Table 3) to obtain total costs.
Direct costs associated with initial hospitalization were itemized
into two main categories, general hospital costs and costs associated
with neonatal-specific procedures/complications. Assumptions on
the total number of hospital bed-days expected for each GA group
Table 1. Natural history and clinical variables, base-case values.
Variable Values by GA (wk)
24–26 27–29 30–33
Percent neonatal mortality, with neonatal intensive carea 53 26 10
Percent neonatal mortality, without neonatal intensive care [17] 94 87 55
Percent long-term morbidity, with neonatal intensive care [22–26]
Minor disability 38 32 12
Major disability 25 19 16
Percent long-term morbidity, without neonatal intensive care [17]
Minor disability 46 46 25
Major disability 38 38 37
Relative risks of mortality, major disability, by age group [20,21]
0–9 y 24.6 24.6 24.6
10–19 y 8.5 8.5 8.5
20–39 y 3.6 3.6 3.6
40–69 y 2.2 2.2 2.2
70+y 1.5 1.5 1.5
Ranges used in sensitivity analyses, and details on the derivation of parameter values, are provided in Table S1 and Text S1.aComputed from national hospital discharge database provided by Mexican Ministry of Health.doi:10.1371/journal.pmed.1000379.t001
Cost-Effectiveness of NICU in Mexico
PLoS Medicine | www.plosmedicine.org 3 December 2010 | Volume 7 | Issue 12 | e1000379
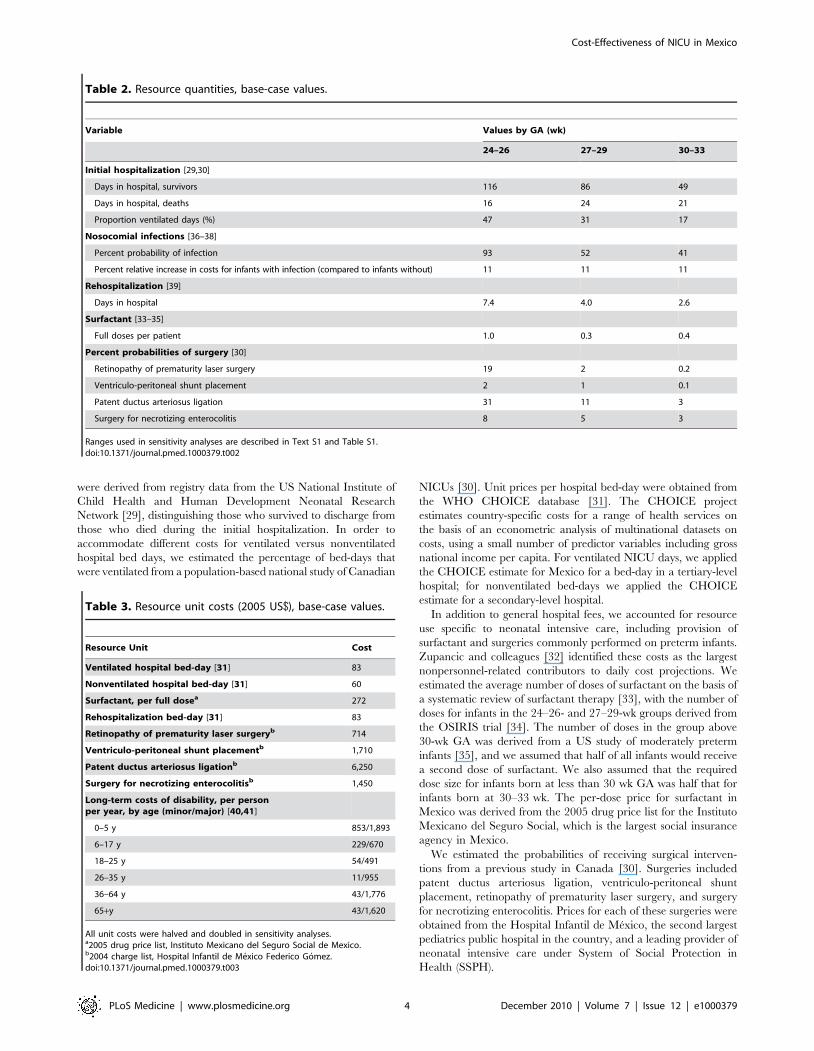
were derived from registry data from the US National Institute of
Child Health and Human Development Neonatal Research
Network [29], distinguishing those who survived to discharge from
those who died during the initial hospitalization. In order to
accommodate different costs for ventilated versus nonventilated
hospital bed days, we estimated the percentage of bed-days that
were ventilated from a population-based national study of Canadian
NICUs [30]. Unit prices per hospital bed-day were obtained from
the WHO CHOICE database [31]. The CHOICE project
estimates country-specific costs for a range of health services on
the basis of an econometric analysis of multinational datasets on
costs, using a small number of predictor variables including gross
national income per capita. For ventilated NICU days, we applied
the CHOICE estimate for Mexico for a bed-day in a tertiary-level
hospital; for nonventilated bed-days we applied the CHOICE
estimate for a secondary-level hospital.
In addition to general hospital fees, we accounted for resource
use specific to neonatal intensive care, including provision of
surfactant and surgeries commonly performed on preterm infants.
Zupancic and colleagues [32] identified these costs as the largest
nonpersonnel-related contributors to daily cost projections. We
estimated the average number of doses of surfactant on the basis of
a systematic review of surfactant therapy [33], with the number of
doses for infants in the 24–26- and 27–29-wk groups derived from
the OSIRIS trial [34]. The number of doses in the group above
30-wk GA was derived from a US study of moderately preterm
infants [35], and we assumed that half of all infants would receive
a second dose of surfactant. We also assumed that the required
dose size for infants born at less than 30 wk GA was half that for
infants born at 30–33 wk. The per-dose price for surfactant in
Mexico was derived from the 2005 drug price list for the Instituto
Mexicano del Seguro Social, which is the largest social insurance
agency in Mexico.
We estimated the probabilities of receiving surgical interven-
tions from a previous study in Canada [30]. Surgeries included
patent ductus arteriosus ligation, ventriculo-peritoneal shunt
placement, retinopathy of prematurity laser surgery, and surgery
for necrotizing enterocolitis. Prices for each of these surgeries were
obtained from the Hospital Infantil de Mexico, the second largest
pediatrics public hospital in the country, and a leading provider of
neonatal intensive care under System of Social Protection in
Health (SSPH).
Table 2. Resource quantities, base-case values.
Variable Values by GA (wk)
24–26 27–29 30–33
Initial hospitalization [29,30]
Days in hospital, survivors 116 86 49
Days in hospital, deaths 16 24 21
Proportion ventilated days (%) 47 31 17
Nosocomial infections [36–38]
Percent probability of infection 93 52 41
Percent relative increase in costs for infants with infection (compared to infants without) 11 11 11
Rehospitalization [39]
Days in hospital 7.4 4.0 2.6
Surfactant [33–35]
Full doses per patient 1.0 0.3 0.4
Percent probabilities of surgery [30]
Retinopathy of prematurity laser surgery 19 2 0.2
Ventriculo-peritoneal shunt placement 2 1 0.1
Patent ductus arteriosus ligation 31 11 3
Surgery for necrotizing enterocolitis 8 5 3
Ranges used in sensitivity analyses are described in Text S1 and Table S1.doi:10.1371/journal.pmed.1000379.t002
Table 3. Resource unit costs (2005 US$), base-case values.
Resource Unit Cost
Ventilated hospital bed-day [31] 83
Nonventilated hospital bed-day [31] 60
Surfactant, per full dosea 272
Rehospitalization bed-day [31] 83
Retinopathy of prematurity laser surgeryb 714
Ventriculo-peritoneal shunt placementb 1,710
Patent ductus arteriosus ligationb 6,250
Surgery for necrotizing enterocolitisb 1,450
Long-term costs of disability, per personper year, by age (minor/major) [40,41]
0–5 y 853/1,893
6–17 y 229/670
18–25 y 54/491
26–35 y 11/955
36–64 y 43/1,776
65+y 43/1,620
All unit costs were halved and doubled in sensitivity analyses.a2005 drug price list, Instituto Mexicano del Seguro Social de Mexico.b2004 charge list, Hospital Infantil de Mexico Federico Gomez.doi:10.1371/journal.pmed.1000379.t003
Cost-Effectiveness of NICU in Mexico
PLoS Medicine | www.plosmedicine.org 4 December 2010 | Volume 7 | Issue 12 | e1000379
Finally, we accounted for additional costs of the initial
hospitalization related to health care-associated infections because
of their high prevalence in middle-income country settings and
their significant effect on resource utilization. Rates of infection
were derived from two Brazilian studies [36,37]. The incremental
costs associated with these infections was were expressed as a
percentage of the baseline cost of the initial hospitalization, which
we estimated at 11% based on an analysis of nosocomial infections
among surviving preterm infants from 17 North American
hospitals [38].
Following the initial discharge, we estimated additional short-
term medical costs relating to the rehospitalization of NICU
survivors. Underwood [39] documented all-cause readmissions
among preterm infants in California during the first year of life
between 1992 and 2000. For each GA group, we derived average
days of hospitalization by multiplying the average number of
rehospitalizations per person by the average days per rehospital-
ization. For rehospitalizations we applied the tertiary-level bed-day
estimate for Mexico from the CHOICE database.
We approximated long-term costs of disability by adapting
estimates from a previous study on the costs of developmental
impairments in the United States [40,41]. The study estimated
annual, per-person, age-specific costs for intellectual impairments,
cerebral palsy, hearing loss, and vision impairment. We used the
direct medical cost estimates from the study, which included
physician visits, prescription medications, hospital inpatient stays,
assistive devices, therapy, and rehabilitation (for persons aged
,18 y), and long-term care (for persons aged 18–76 y), and
rescaled these estimates using the ratio of Mexican GDP per capita
to United States GDP per capita in 2005. These annual age-
specific cost estimates were then applied in the life table model to
compute discounted lifetime costs for persons in each disability
category.
AnalysisBase-case analysis. We estimated population-level neonatal
outcomes in scenarios with and without neonatal intensive care in
Mexico, for a birth cohort of around 2 million infants. We
computed long-term, individual-level outcomes stratified by GA
group, including life expectancy, disability-free life expectancy,
DALYs, and total lifetime costs, with or without neonatal intensive
care. We then calculated an incremental cost-effectiveness ratio
(ICER) expressed as the difference in costs between the NICU and
no-NICU scenarios (discounted at 3% per year), divided by the
difference in DALYs in the two scenarios (also discounted at 3%).
Following the standard benchmarks proposed in international
work on cost-effectiveness, we compared the ICER to thresholds
for cost-effectiveness defined in reference to the GDP per capita in
Mexico. Interventions are considered to be highly cost-effective
when they have ICERs that fall below the per capita GDP, and
are regarded as being potentially cost-effective if they have ICERs
between one and three times per capita GDP [42].
Sensitivity analyses. We conducted a series of univariate
sensitivity analyses that varied each model input between upper
and lower bounds reflecting uncertainty around the base-case
parameter values (see Table S1 and Text S1 for details). We also
performed a Monte Carlo probabilistic sensitivity analysis to assess
the joint effects of uncertainty around all input parameters
simultaneously (Text S1) [43]. In addition to these standard
univariate and multivariate analyses, we conducted several further
sensitivity analyses that were designed to impose deliberate bias
against neonatal intensive care, for example by combining high
estimates of mortality and morbidity associated with neonatal
intensive care with high estimates of the costs of providing this
care.
The model was implemented in Microsoft Excel 2010. Random
variables for the Monte Carlo simulations were generated using
Stata 11.
Results
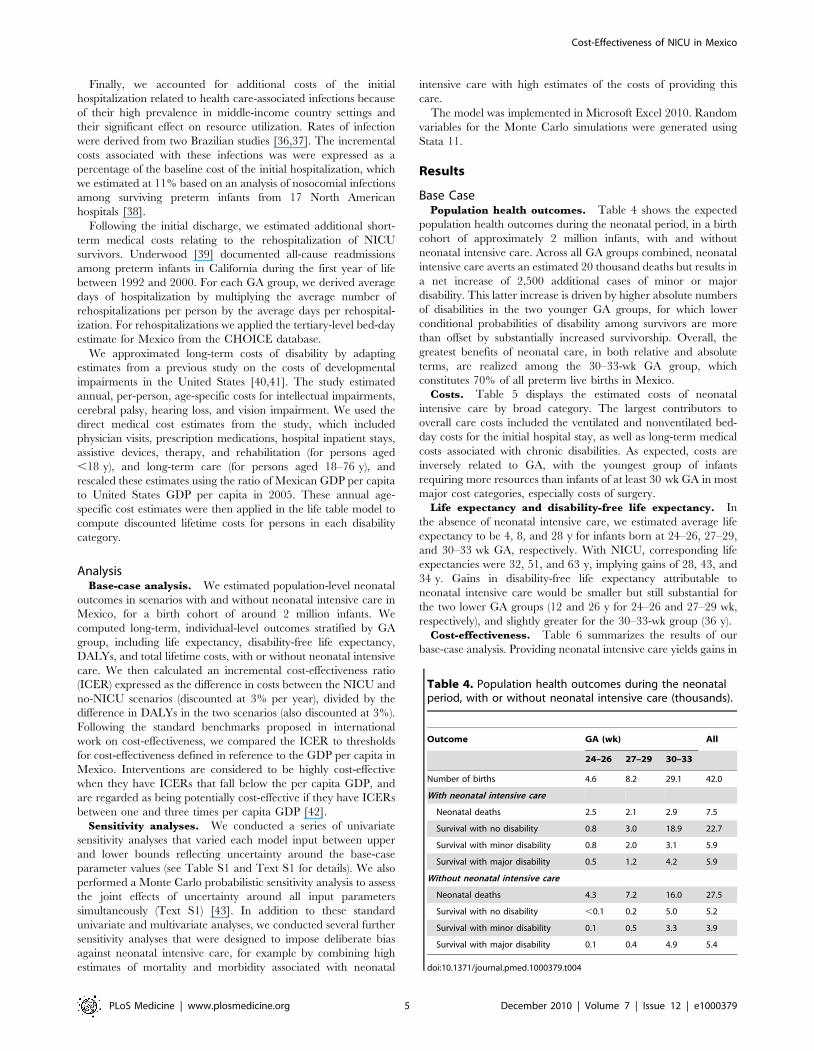
Base CasePopulation health outcomes. Table 4 shows the expected
population health outcomes during the neonatal period, in a birth
cohort of approximately 2 million infants, with and without
neonatal intensive care. Across all GA groups combined, neonatal
intensive care averts an estimated 20 thousand deaths but results in
a net increase of 2,500 additional cases of minor or major
disability. This latter increase is driven by higher absolute numbers
of disabilities in the two younger GA groups, for which lower
conditional probabilities of disability among survivors are more
than offset by substantially increased survivorship. Overall, the
greatest benefits of neonatal care, in both relative and absolute
terms, are realized among the 30–33-wk GA group, which
constitutes 70% of all preterm live births in Mexico.
Costs. Table 5 displays the estimated costs of neonatal
intensive care by broad category. The largest contributors to
overall care costs included the ventilated and nonventilated bed-
day costs for the initial hospital stay, as well as long-term medical
costs associated with chronic disabilities. As expected, costs are
inversely related to GA, with the youngest group of infants
requiring more resources than infants of at least 30 wk GA in most
major cost categories, especially costs of surgery.
Life expectancy and disability-free life expectancy. In
the absence of neonatal intensive care, we estimated average life
expectancy to be 4, 8, and 28 y for infants born at 24–26, 27–29,
and 30–33 wk GA, respectively. With NICU, corresponding life
expectancies were 32, 51, and 63 y, implying gains of 28, 43, and
34 y. Gains in disability-free life expectancy attributable to
neonatal intensive care would be smaller but still substantial for
the two lower GA groups (12 and 26 y for 24–26 and 27–29 wk,
respectively), and slightly greater for the 30–33-wk group (36 y).
Cost-effectiveness. Table 6 summarizes the results of our
base-case analysis. Providing neonatal intensive care yields gains in
Table 4. Population health outcomes during the neonatalperiod, with or without neonatal intensive care (thousands).
Outcome GA (wk) All
24–26 27–29 30–33
Number of births 4.6 8.2 29.1 42.0
With neonatal intensive care
Neonatal deaths 2.5 2.1 2.9 7.5
Survival with no disability 0.8 3.0 18.9 22.7
Survival with minor disability 0.8 2.0 3.1 5.9
Survival with major disability 0.5 1.2 4.2 5.9
Without neonatal intensive care
Neonatal deaths 4.3 7.2 16.0 27.5
Survival with no disability ,0.1 0.2 5.0 5.2
Survival with minor disability 0.1 0.5 3.3 3.9
Survival with major disability 0.1 0.4 4.9 5.4
doi:10.1371/journal.pmed.1000379.t004
Cost-Effectiveness of NICU in Mexico
PLoS Medicine | www.plosmedicine.org 5 December 2010 | Volume 7 | Issue 12 | e1000379

disability-adjusted life expectancy (which include adjustments for
decreased health status and discounting at a rate of 3% per year) of
9, 15, and 12 y, for infants born at 24–26, 27–29, and 30–33 wk
GA, respectively, at incremental costs per infant of US$11,400,
US$9,500, and US$3,000. Incremental cost-effectiveness ratios for
NICU compared to no-NICU by GA were approximately
US$1,200 per DALY for the 24–26-wk group, US$650 per
DALY for 27–29 wk, and US$240 per DALY for 30–33 wk.
Based on typical benchmarks for international cost-effectiveness
analysis, defined in reference to the national GDP per capita
(which was approximately US$8,200 in Mexico in 2005 [44]),
neonatal intensive care at all GA groups would be regarded as
exceptional value for money, costing only a fraction of the per
capita national income for each year of healthy life that it saves.
Sensitivity AnalysisIn one-way analyses that varied each parameter across a range
of values, cost-effectiveness ratios were minimally sensitive to
changes in input values (Figure S1; Table S2; Text S1). None of
the univariate analyses produced cost-effectiveness ratios exceed-
ing US$1,800 per DALY averted in the 24–26-wk group, US$900
per DALY in the 27–29-wk group, or US$500 per DALY in the
30–33-wk group. Even these maximum values fall well below the
threshold of national GDP per capita.
Notwithstanding the robustness of the conclusions to variation
in input values, interesting differences were observed in the relative
importance of different inputs across GA groups (Figure S1). In the
24–26-wk group, results were most sensitive to assumptions about
neonatal mortality, and relatively insensitive to assumptions about
disability. This finding is consistent with the high mortality rates
overall in this youngest group, which reduce the importance of
morbidity outcomes. Conversely, the results in the 30–33-wk
group were most sensitive to assumptions about major disability, in
line with the better survivorship outcomes in this group. Across all
three GA groups, costs of ventilated and nonventilated bed-days
were consistently among the most important variables as drivers of
the cost-effectiveness results.
On the basis of a set of multivariate Monte Carlo simulations in
which we jointly varied all input parameters, we constructed cost-
effectiveness acceptability curves to consider the likelihood that
NICU would be cost-effective under different thresholds for
societal willingness to pay for an additional year of healthy life
(Figure S2). If society were willing to pay up to the average per
capita income for each year of life gained, the results suggest
essentially no uncertainty in the conclusion that neonatal intensive
care would be cost-effective in all GA groups. Even at a threshold
of only US$1,000 (representing only 12% of per capita GDP), the
probabilities that neonatal intensive would be regarded as cost-
effective are 10%, 95%, and 100% in the 24–26-wk, 27–29-wk,
and 30–33-wk groups, respectively. At twice this value (or
approximately one-quarter of per capita GDP), the probabilities
are 92%, 100%, and 100%.
Given the very attractive overall cost-effectiveness ratios and the
relative insensitivity of these results to variation in individual
parameter values or joint variation across all inputs, we considered
a further set of sensitivity analyses intended to impose a strong bias
against neonatal intensive care. First, we assumed that NICU
would confer only survivorship benefits (by raising the morbidity
probabilities in the NICU strategy to be equal to those in the no-
NICU strategy). This change resulted in cost-effectiveness ratios of
US$1,600, US$1,100, and US$880 per DALY across the three GA
groups. Next, we preserved this assumption of no morbidity
benefits and also raised NICU mortality probabilities to the upper
bounds of their ranges, which were 75%, 51%, and 14%,
compared to the base-case values of 53%, 26%, and 10%,
reflecting relative increases of around 40% for the youngest and
oldest groups, and 100% for the middle group. The resulting cost-
effectiveness ratios were US$2,200, US$1,300, and US$900 per
DALY. Finally, we maintained all of the unfavorable mortality
and morbidity assumptions described above, and also doubled all
unit costs in the model, which resulted in cost-effectiveness ratios
of US$4,400, US$2,600, and US$1,800 across the groups. Overall,
these results confirm that neonatal intensive care appears highly
cost-effective even under conditions that are dramatically less
Table 5. Cost results per infant (2005 US$, thousands).
Cost Categories by Scenario GA (wk)
24–26 27–29 30–33
With neonatal intensive care
Initial hospitalization
Ventilated days 2.5 1.8 0.7
Nonventilated days 2.0 2.9 2.3
Surfactant 0.3 0.1 0.1
Surgery cost 2.2 0.8 0.2
Infection cost 0.7 0.3 0.1
Rehospitalization 0.3 0.2 0.2
Long-term costs of disability 4.0 4.9 4.1
Total (discounteda) lifetime costs 12.0 11.1 7.7
Without neonatal intensive care
Rehospitalization ,0.1 ,0.1 0.1
Long-term costs of disability 0.5 1.6 4.6
Total (discounteda) lifetime costs 0.6 1.6 4.7
aCosts are discounted at a rate of 3% per year.doi:10.1371/journal.pmed.1000379.t005
Table 6. Changes per person in life expectancy, disability-free life expectancy, DALYs, costs, and ICERs for neonatal intensive carecompared to no neonatal intensive care, base-case analysis.
GA Group Change in LE (y) Change in DFLE (y) DALYs Averted (y) Incremental Costs (2005 US$) ICER (US$/DALY)
24–26 wk 28 12 9 11,400 1,230
27–29 wk 43 26 15 9,500 650
30–33 wk 34 36 12 3,000 240
Life expectancy (LE) and disability-free life expectancy (DFLE) are undiscounted. Costs and DALYs are discounted at a rate of 3% per year.doi:10.1371/journal.pmed.1000379.t006
Cost-Effectiveness of NICU in Mexico
PLoS Medicine | www.plosmedicine.org 6 December 2010 | Volume 7 | Issue 12 | e1000379

favorable than our base-case assumptions regarding both health
benefits and costs associated with neonatal intensive care.
Discussion
In this study we undertook a comprehensive examination of the
costs and health benefits associated with providing neonatal
intensive care to preterm infants in Mexico. Contrary to the widely
held belief that neonatal intensive care imposes excessive resource
demands relative to the benefit it confers, we found that it offers
exceptional value for money even in the youngest GA group. Our
conclusions were robust to all variations from base-case assump-
tions in the model.
For middle-income countries, more widespread access to
neonatal intensive care services could be an important component
of efforts to achieve Millennium Development Goal 4—to reduce
child mortality by two-thirds by 2015 [45]. Every year it is
estimated that 4 million babies die in the first month of life, and
28% of those die from preterm birth [46]. Our study suggests that
neonatal intensive care, despite being regarded by some as
prohibitively expensive, provides high returns in health for the
amount of resources it consumes. Many highly effective prenatal
and postnatal care practices are affordable. Antenatal steroids and
maternal antibiotics for prolonged preterm rupture of membranes
can yield substantial improvements in preterm survival and
reductions in morbidity [47]. Postnatal use of low-cost interven-
tions—such as ventilation with bubble continuous positive airway
pressure, temperature support, blended oxygen, kangaroo care,
early initiation of breast milk feeding, and infection control
measures that include family members as stakeholders—have been
shown to be effective [48–53].
Many of the assumptions in our cost-effectiveness model were
deliberately biased against neonatal intensive care. For example,
we assumed a relatively modest reduction in rates of disability in
the 30–33-wk GA group compared to those to those in the 27–29-
wk group, despite some data from high-income countries
suggesting that rates are significantly lower in older preterm
infants. Likewise, our mortality estimates for the comparator
scenario of no neonatal intensive care may be too low, which
would result in an underestimate of the health benefits of intensive
care. In general, when forced to reconcile several conflicting data
sources, we elected assumptions that would be most unfavorable
toward neonatal intensive care.
In sensitivity analyses, even a worst-case scenario in which
NICU conferred substantially reduced survivorship benefits and
no benefits in terms of averting disability among survivors, and all
unit costs were twice as high as their base-case estimates, cost-
effectiveness ratios for neonatal care in all GA groups remained
well below the typical benchmark for high-value interventions.
Despite the favorable cost-effectiveness estimates, however, we
recognize that decisions regarding the care of extremely preterm
infants are complicated by a range of critical considerations that
can place significant burdens on families and necessitate
substantial financial investments in health and educational
services. Cost-effectiveness information must be regarded as only
one of several important factors to consider in making individual
decisions and designing health policies. It is essential that decisions
be informed by an array of perspectives, including ethical debate.
This study indicates that neonatal intensive care adds a significant
number of disability-free years to the population of preterm infants.
Nevertheless, with increasing survival the absolute burden of
disability is likely to rise, at least in some groups. In our model,
we find that for infants born earlier than 30 wk GA, neonatal
intensive care is expected to increase the absolute number of cases of
disability. While some of the specific impairments are relatively
minor (behavioral and learning problems or attention-deficit
hyperactivity disorder), some infants will be profoundly disabled,
for example with nonambulatory cerebral palsy, blindness, deafness,
or severe intellectual impairment.
Severe disability can place a heavy emotional and financial
burden on patients, families, and society. In line with standard
guidance for economic evaluation, the perspective of our cost-
effectiveness analysis includes all health and economic outcomes
associated with health care intervention, but omits other
dimensions of well-being that may be important to individual
decision-making. Of note, a major study on parent preferences
over pediatric impairments [27]—which we used to define health-
state valuations in this study—suggested that families typically
have strong preferences for life even with disability. In addition, as
a group, extremely preterm infants appear to enjoy similar health-
related quality of life upon reaching young adulthood, compared
with normal birthweight peers [54,55]. Health care professionals
have also been shown to vastly underestimate quality of life for
infants with disability [56]. On the other hand, it is worth noting
that another study reported substantially lower health-related
quality of life among a German preterm birth cohort compared
with Canadian and Dutch cohorts, suggesting that significant
differences may exist between countries [57]. While it is important
to realize that in Mexico neonatal intensive care is already
established practice, the substantial societal burden associated with
extreme prematurity warrants systematic evaluation and support-
ive family intervention.
Our results are compatible with previous analyses conducted in
high-income nations, which have found neonatal intensive care to
be cost-effective [5,6,58]. To our knowledge there is only one
published economic evaluation of neonatal intensive care in a
middle-income country, undertaken in Malaysia [59]. In contrast
to our study, that analysis focused on health effects and costs
during the initial hospitalization only and yielded a cost-
effectiveness ratio of US$4,200 (in 2004 US$ adjusted for inflation
using GDP deflators [60]) for infants between 1,000–1,500 g
birthweight. This ratio falls below Malaysia’s 2004 per capita
income US$4,960 [44], which indicates high value for money.
We emphasize the importance of interpreting our results in light
of the intended context of the study. Our purpose was not to
provide a precise estimate of the cost-effectiveness of neonatal
intensive care in Mexico. The required data for such an endeavor
are simply not available. Rather, we aimed to inform the debate
on funding for neonatal intensive care by synthesizing the best
available evidence. We have attempted to maximize internal and
external validity as well as generalizability. Whenever possible, we
chose amongst available data sources with an interest in parsimony
and transparency, while at the same time ensuring that the model
would be based on defensible assumptions. We gave priority to
local data wherever possible for both the base-case and sensitivity
analyses. In the interest of generalizability, we compared neonatal
intensive care to a ‘‘null’’ alternative as recommended in WHO
guidelines [14]. Therefore, we hope that the results in this study
will provide useful information in other middle-income countries
facing similar funding decisions.
Nevertheless, there remains a considerable amount of uncer-
tainty surrounding several of our model inputs. The most critical
inputs in the model are the probabilities of mortality and
morbidity and estimates of NICU costs. Our data for mortality
reflect national experience among hospitalized infants; they may
not capture the precise mortality risks faced by the currently
uninsured population to whom health insurance expansion has
been directed. It is also important to note that our results represent
Cost-Effectiveness of NICU in Mexico
PLoS Medicine | www.plosmedicine.org 7 December 2010 | Volume 7 | Issue 12 | e1000379
an overall estimate of cost-effectiveness of neonatal intensive care.
There is likely significant variability in outcomes based on
differences in population risk, socioeconomic status, and access
to health care services. Addressing these disparities will require
investments in the health care system (e.g., regionalized care and
patient transport system, early intervention therapists, medical
subspecialists) and other areas of the economy (e.g., transportation,
labor market reform, etc.). Such investments are likely to occur
over time and are beyond the scope of this analysis.
In terms of morbidity assumptions, data limitations required
that we rely on information from high-income countries, which
might contradict our approach to biasing assumptions against
neonatal intensive care. Morbidity is possibly higher in Mexico
than in high-income nations, and there have been reports of an
epidemic of blindness among survivors of neonatal intensive care
in middle-income countries [61,62]. However, we believe the our
choice of data inputs was appropriate for several reasons,
including: (1) high rates of prenatal care in Mexico; (2) high
probabilities that births occur in a health facility (93% by one
estimate) [63]; (3) low frequency of low birthweight and very low
birthweight deliveries [64]; (4) focus of health reform for 2004–
2010 on 100% coverage of preterm newborns to reduce mortality
rates among infants born at 30–34 wk [65]; (5) more favorable
pregnancy outcomes among Mexican-American women born in
Mexico compared to US-born Hispanics [66]; and (6) comparable
neurodevelopmental outcomes at 6 y (compared to Doyle et al.
[2]) in the only published recent study [67]. In addition, even an
alternative assumption of no NICU-associated reductions in
probabilities of disability for surviving infants preserved the
conclusion that neonatal intensive care is highly cost-effective in
the Mexican setting.
Our cost inputs are derived partly from estimates for Mexico
from the WHO-CHOICE database, which may only approximate
true economic costs in Mexico. These costs are predicted from an
econometric model that uses a relatively small number of
independent variables. It is therefore likely that some variation
across countries will be underestimated in the modeled prices.
Again, however, even a doubling in costs did not yield cost-
effectiveness ratios that even approached the boundaries for high-
value interventions, which provides reassurance that our conclu-
sions are robust despite imprecision of cost estimates.
Lastly, our long-term cost estimates are based on a study
conducted in the United States [40,41]. This study includes costs
for physician visits, hospital stays, assistive devices, therapy and
rehabilitation, and long-term care. These specific cost elements are
unlikely to extrapolate perfectly into practice in Mexico. On the
other hand, other complications due to preterm birth, such as
additional care required for chronic lung disease, are not captured.
Overall, we believe that this data source represented a reasonable
approximation of long-term costs in Mexico. As above, we note
further that a doubling of these costs did not alter the finding that
neonatal intensive care would be highly cost-effective.
In summary, our economic evaluation indicates that neonatal
intensive care for preterm infants in Mexico is likely to be
exceedingly cost-effective. While improving the survival of infants
above 30 wk GA provides the greatest overall population health
benefits, and at the highest value for money, intervention among
all preterm infants above 24 wk GA should be considered as a
cost-effective use of health care resources. As future research
proceeds on interventions for neonatal intensive care, the societal
value of these interventions should continue to be evaluated.
Likewise, as new evidence accumulates on health outcomes and
resource requirements associated with these interventions in a
broader array of settings, questions about costs, benefits, and
efficiency should be revisited in light of the best available evidence.
Supporting Information
Figure S1 Results from univariate sensitivity analyses, by GA
group.
Found at: doi:10.1371/journal.pmed.1000379.s001 (0.15 MB
PDF)
Figure S2 Cost-effectiveness acceptability curves for neonatal
intensive care compared to no neonatal intensive care, by GA
group.
Found at: doi:10.1371/journal.pmed.1000379.s002 (0.03 MB
PDF)
Table S1 Parameter ranges examined in sensitivity analyses.
Found at: doi:10.1371/journal.pmed.1000379.s003 (0.05 MB
PDF)
Table S2 Results from univariate sensitivity analyses.
Found at: doi:10.1371/journal.pmed.1000379.s004 (0.06 MB
PDF)
Text S1 Technical appendix. The supporting tables and figures
are available as individual files (Figures S1 and S2 and Tables S1
and S2), but are also included here for ease of access.
Found at: doi:10.1371/journal.pmed.1000379.s005 (0.46 MB
PDF)
Acknowledgments
We are grateful to Laura Petersen for reviewing the manuscript. We thank
Amanda Honeycutt for providing a detailed report on the analysis she led
on long-term costs of developmental disabilities.
Author Contributions
ICMJE criteria for authorship read and met: JP DL JAZ LP CG SJG EGP
JAS. Agree with the manuscript’s results and conclusions: JP DL JAZ LP
CG SJG EGP JAS JAS. Designed the experiments/the study: JP JAZ JAS.
Analyzed the data: JP DL JAS. Collected data/did experiments for the
study: JP DL LP CG EGP JAS. Wrote the first draft of the paper: JP JAS.
Assisted with approach and selection of data inputs; assisted with
interpretation of results: JAZ. Developed the model: JP JAS. Contributed
to revision of the paper: JP DL JAZ LP CG SJG EGP JAS. Contributed to
the study design and identification of data requirements for the model:
SJG.
References
1. Richardson DK, Gray JE, Gortmaker SL, Goldmann DA, Pursley DM, et al.
(1998) Declining severity adjusted mortality: evidence of improving neonatal
intensive care. Pediatrics 102: 893–899.
2. Doyle LW (2004) Evaluation of neonatal intensive care for extremely low birth
weight infants in Victoria over two decades: I. Effectiveness. Pediatrics 113:
505–509.
3. Shanmugasundaram R, Padmapriya E, Shyamala J (1998) Cost of neonatal
intensive care. Indian J Pediatr 65: 249–255.
4. Zupancic JA, Richardson DK, Lee K, McCormick MC (2000) Economics of
prematurity in the era of managed care. Clin Perinatol 27: 483–497.
5. Doyle LW (2004) Evaluation of neonatal intensive care for extremely low birthweight infants in Victoria over two decades: II. Efficiency. Pediatrics 113: 510–514.
6. Rogowski J (1998) Cost-effectiveness of care for very low birth weight infants.Pediatrics 102: 35–43.
7. Saigal S, Burrows E, Stoskopf BL, Rosenbaum PL, Streiner D (2000) Impact ofextreme prematurity on families of adolescent children. J Pediatr 137: 701–706.
8. Watson RS (2003) Prematurity-associated costs: more than just surfactant.
Pediatr Crit Care Med 4: 256–257.
9. Xu K, Evans DB, Kawabata K, Zeramdini R, Klavus J, et al. (2003) Household
catastrophic health expenditure: a multicountry analysis. Lancet 362: 111–117.
Cost-Effectiveness of NICU in Mexico
PLoS Medicine | www.plosmedicine.org 8 December 2010 | Volume 7 | Issue 12 | e1000379

10. Vohr BR, Wright LL, Dusick AM, Mele L, Verter J, et al. (2000)
Neurodevelopmental and functional outcomes of extremely low birth weightinfants in the National Institute of Child Health and Human Development
Neonatal Research Network, 1993-1994. Pediatrics 105: 1216–1226.
11. Straughn HK, Goldenberg RL, Tolosa JE, Daly S, de Codes J, et al. (2003)Birthweight-specific neonatal mortality in developing countries and obstetric
practices. Int J Gynaecol Obstet 80: 71–78.12. Frenk J, Gonzalez-Pier E, Gomez-Dantes O, Lezana MA, Knaul FM (2006)
Comprehensive reform to improve health system performance in Mexico.
Lancet 368: 1524–1534.13. Gonzalez-Pier E, Gutierrez-Delgado C, Stevens G, Barraza-Llorens M, Porras-
Condey R, et al. (2006) Priority setting for health interventions in Mexico’sSystem of Social Protection in Health. Lancet 368: 1608–1618.
14. Tan-Torres Edejer T, Baltussen RM, Adam T, Hutubessy R, Acharya A, et al.(2003) Making choices in health: WHO guide to cost-effectiveness analysis.
Geneva, Switzerland: World Health Organization. 312 p.
15. Kramer MS, Platt RW, Wen SW, Joseph KS, Allen A, et al. (2001) A new andimproved population-based Canadian reference for birth weight for gestational
age. Pediatrics 108: e35.16. Ceron-Mireles P, Harlow SD, Sanchez-Carrillo CI (1996) The risk of
prematurity and small-for-gestational-age birth in Mexico City: the effects of
working conditions and antenatal leave. Am J Public Health 86: 825–831.17. Lee KS, Kim BI, Khoshnood B, Hsieh HL, Chen TJ, et al. (1995) Outcome of
very low birth weight infants in industrialized countries: 1947–1987.Am J Epidemiol 141: 1188–1193.
18. Chase HC (1972) A study of infant mortality from linked records: comparison ofneonatal mortality from two cohort studies. Rockville (Maryland): US
Department of Health, Education and Welfare. National Center for Health
Statistics. (HSM) 72–1056.19. Consejo Nacional de Poblacion. Proyecciones de la poblacion de Mexico 2005–
2050 Available: http://www.conapo.gob.mx/. Accessed 19 October 2010.20. Singer RB, Strauss D, Shavelle R (1998) Comparative mortality in cerebral palsy
patients in California, 1980–1996. J Insur Med 30: 240–246.
21. Strauss D, Eyman RK (1996) Mortality of people with mental retardation inCalifornia with and without Down syndrome, 1986–1991. Am J Ment Retard
100: 643–653.22. Escobar GJ, Littenberg B, Petitti DB (1991) Outcome among surviving very low
birthweight infants: a meta-analysis. Arch Dis Child 66: 204–211.23. Lorenz JM, Wooliever DE, Jetton JR, Paneth N (1998) A quantitative review of
mortality and developmental disability in extremely premature newborns. Arch
Pediatr Adolesc Med 152: 425–435.24. Lorenz JM (2001) The outcome of extreme prematurity. Semin Perinatol 25:
348–359.25. Roberts G, Anderson PJ, Doyle LW, Victorian Infant Collaborative Study
Group (2009) Neurosensory disabilities at school age in geographic cohorts of
extremely low birth weight children born between the 1970s and the 1990s.J Pediatr 154: 829–834.
26. Saigal S, Doyle LW (2008) An overview of mortality and sequelae of pretermbirth from infancy to adulthood. Lancet 371: 261–269.
27. Carroll AE, Downs SM (2009) Improving decision analyses: parent preferences(utility values) for pediatric health outcomes. J Pediatr 155: 21–25, 25.
28. World Health Organization. CHOosing Interventions that are Cost-Effective
(WHO-CHOICE). Health State Valuations. Available: http://who.int/choice/demography/health_valuations/en/index.html. Accessed 19 October 2010.
29. Lemons JA, Bauer CR, Oh W, Korones SB, Papile LA, et al. (2001) Very lowbirth weight outcomes of the National Institute of Child Health and Human
Development Neonatal Research Network, January 1995 through December
1996. NICHD Neonatal Research Network. Pediatrics 107: e1.30. Lee SK, McMillan DD, Ohlsson A, Pendray M, Synnes A, et al. (2000)
Variations in practice and outcomes of the Canadian NICU Network 1996–7.Pediatrics 106: 1070–1079.
31. Adam T, Evans DB, Murray CJ (2003) Econometric estimation of country-
specific hospital costs. Cost Eff Resour Alloc 1: 3.32. Zupancic JA, Richardson DK (2002) Characterization of neonatal personnel
time inputs and prediction from clinical variables—a time and motion study.J Perinatol 22: 658–663.
33. Yost CC, Soll RF (2000) Early versus delayed selective surfactant treat-ment for neonatal respiratory distress syndrome. Cochrane Database Syst Rev.
CD001456.
34. Osiris Collaborative Group (1992) Early versus delayed neonatal administrationof a synthetic surfactant—the judgment of OSIRIS. Lancet 340: 1363–1369.
35. Escobar GJ, McCormick MC, Zupancic JAF, Coleman-Phox K, Armstrong MA,et al. (2006) Unstudied infants: outcomes of moderately premature infants in the
neonatal intensive care unit. Arch Dis Child - Fetal and Neonatal Edition 91:
F238–F244.36. Nagata E, Brito AS, Matsuo T (2002) Nosocomial infections in a neonatal
intensive care unit: incidence and risk factors. Am J Infect Control 30: 26–31.37. Pessoa-Silva CL, Richtmann R, Calil R, Santos RM, Costa ML, et al. (2004)
Healthcare-associated infections among neonates in Brazil. Infect Control HospEpidemiol 25: 772–777.
38. Payne NR, Carpenter JH, Badger GJ, Horbar JD, Rogowski J (2004) Marginal
increase in cost and excess length of stay associated with nosocomial bloodstreaminfections in surviving very low birth weight infants. Pediatrics 114: 348–355.
39. Underwood MA, Danielsen B, Gilbert WM (2007) Cost, causes and rates of
rehospitalization of preterm infants. J Perinatol 27: 614–619.40. Honeycutt A, Dunlap L, Chen H, Al Homsi G (2000) The cost of developmental
disabilities. Research Triangle Park (North Carolina): Research Triangle
Institute.41. Honeycutt AA, Grosse SD, Dunlap LJ, Schedel DE, Chen H, et al. (2003)
Economic costs associated with mental retardation, cerebral palsy, hearing loss,and vision impairment. Altman B, Barnartt S, Hedershot G, Larson S, eds.
Using survey data to study disability: results from the National Health Interview
Survey on disability. London: Elsevier. pp 207–228.42. Hutubessy R, Chisholm D, Edejer T, for W-C (2003) Generalized cost-
effectiveness analysis for national-level priority-setting in the health sector. CostEff Resour Alloc 1: 8.
43. Doubilet P, Begg CB, Weinstein MC, Braun P, McNeil BJ (1985) Probabilisticsensitivity analysis using Monte Carlo simulation. A practical approach. Med
Decis Making 5: 157–177.
44. World Bank. Data. Indicators. GDP per capita (current US$). Available: http://data.worldbank.org/indicator/NY.GDP.PCAP.CD. Accessed 19 October 2010.
45. UNICEF. Millenium Development Goals. Available: www.unicef.org/mdg.Accessed 19 October 2010.
46. Lawn JE, Cousens S, Darmstadt GL, Paul V, Martines J (2004) Why are 4
million newborn babies dying every year? Lancet 364: 2020.47. Darmstadt GL, Bhutta ZA, Cousens S, Adam T, Walker N, et al. (2005)
Evidence-based, cost-effective interventions: how many newborn babies can wesave? Lancet 365: 977–988.
48. Narendran V, Donovan EF, Hoath SB, Akinbi HT, Steichen JJ, et al. (2003)Early bubble CPAP and outcomes in ELBW preterm infants. J Perinatol 23:
195–199.
49. Koyamaibole L, Kado J, Qovu JD, Colquhoun S, Duke T (2006) An evaluationof bubble-CPAP in a neonatal unit in a developing country: effective respiratory
support that can be applied by nurses. Journal of Tropical Pediatrics 52:249–253.
50. Lawn JE, Mwansa-Kambafwile J, Horta BL, Barros FC, Cousens S (2010)
‘Kangaroo mother care’ to prevent neonatal deaths due to preterm birthcomplications. Int J Epidemiol 39 Suppl 1: i144–i154.
51. Askie LM, Henderson-Smart DJ, Ko H (2009) Restricted versus liberal oxygenexposure for preventing morbidity and mortality in preterm or low birth weight
infants. Cochrane Database Syst Rev. CD001077.52. Morales Y, Schanler RJ (2007) Human milk and clinical outcomes in VLBW
infants: how compelling is the evidence of benefit? Semin Perinatol 31: 83–88.
53. Soll RF (2008) Heat loss prevention in neonates. J Perinatol 28 Suppl 1:S57–S59.
54. Saigal S, Stoskopf B, Boyle M, Paneth N, Pinelli J, et al. (2007) Comparison ofcurrent health, functional limitations, and health care use of young adults who
were born with extremely low birth weight and normal birth weight. Pediatrics
119: e562–e573.55. Saigal S, Streiner D (2009) Socio-economic achievements of individuals born
very preterm at the age of 27 to 29 years. Dev Med Child Neurol 51: 848–850.56. Saigal S, Stoskopf BL, Feeny D, Furlong W, Burrows E, et al. (1999) Differences
in preferences for neonatal outcomes among health care professionals, parents,and adolescents. JAMA 281: 1991–1997.
57. Verrips E, Vogels T, Saigal S, Wolke D, Meyer R, et al. (2008) Health-related
quality of life for extremely low birth weight adolescents in Canada, Germany,and the Netherlands. Pediatrics 122: 556–561.
58. Cutler DM, McClellan M (2001) Is technological change in medicine worth it?Health Affairs 20: 11–29.
59. Cheah IGS, Soosai AP, Wong SL, Lim TO (2004) Cost-effectiveness analysis of
Malaysian neonatal intensive care units. J Perinatol 25: 47–53.60. International Monetary Fund. GDP, deflator. Available: http://www.econstats.
com/weo/V005.htm. Accessed 19 October 2010.61. Gilbert C, Rahi J, Eckstein M, O’Sullivan J, Foster A (1997) Retinopathy of
prematurity in middle-income countries. Lancet 350: 12–14.
62. Gilbert C, Fielder A, Gordillo L, Quinn G, Semiglia R, et al. (2005)Characteristics of infants with severe retinopathy of prematurity in countries
with low, moderate, and high levels of development: implications for screeningprograms. Pediatrics 115: e518–e525.
63. World Health Organization. WHO Director-General’s Roundtable with Wo-men Leaders on Millennium Development Goal 5. Country Profiles. Mexico.
Available: http://www.who.int/making_pregnancy_safer/events/2008/mdg5/
countries/cp_mexico_19_09_09.pdf. Accessed 19 October 2010.64. Rios JM, Tufino-Olivares E, Reza-Lopez S, Sanin LH, Levario-Carrillo M
(2008) Birthweight percentiles by gestational age and gender for children in theNorth of Mexico. Paediatr Perinat Epidemiol 22: 188–194.
65. Lozano R, Soliz P, Gakidou E, bbott-Klafter J, Feehan DM, et al. (2006)
Benchmarking of performance of Mexican states with effective coverage. Lancet368: 1729–1741.
66. Acevedo-Garcia D, Soobader MJ, Berkman LF (2005) The differential effect offoreign-born status on low birth weight by race/ethnicity and education.
Pediatrics 115: e20–e30.67. Martinez-Cruz CF, Poblano A, Fernandez-Carrocera LA, Jimenez-Quiroz R,
Tuyu-Torres N (2006) Association between intelligence quotient scores and
extremely low birth weight in school-age children. Archives of Medical Research37: 639–645.
Cost-Effectiveness of NICU in Mexico
PLoS Medicine | www.plosmedicine.org 9 December 2010 | Volume 7 | Issue 12 | e1000379
Editors’ Summary
Background. Most pregnancies last about 40 weeks butincreasing numbers of babies are being born preterm, beforethey reach 37 weeks of gestation (the period during which ababy develops in its mother). In developed countries andsome middle-income countries such as Mexico, improve-ments in the care of newborn babies (neonatal intensivecare) mean that more preterm babies survive now than inthe past. Nevertheless, preterm birth is still a major cause ofinfant death worldwide that challenges attainment of Target5 of Millennium Development Goal 4—the reduction of theglobal under-five mortality rate by two-thirds of the 1990rate by 2015 (the Millennium Development Goals, whichwere agreed by world leaders in 2000, aim to reduce worldpoverty). Furthermore, many preterm babies who survivehave long-term health problems and disabilities such ascerebral palsy, deafness, or learning difficulties. The severityof these disabilities and their long-term costs to families andto society depend on the baby’s degree of prematurity.
Why Was This Study Done? Mexico recently reformed itshealth system in an effort to improve access to care,particularly for the poorest sections of its population, and toimprove the quality of its health care. The central componentof this health care reform is the System of Social Protectionof Health (SSPH). The SSPH contains a family healthinsurance program—Seguro Popular—that aims to providethe 50 million uninsured people living in Mexico with freeaccess to an explicit set of health care interventions. As withany insurance program, decisions have to be made aboutwhich interventions Seguro Poplar should cover. Shouldneonatal intensive care be covered, for example? Do thebenefits of this intervention (increased survival of babies)outweigh the costs of neonatal care and of long-term carefor survivors with disabilities? In other words, is neonatalintensive care cost-effective? In this study, the researchersinvestigate this question by estimating the clinical benefits,costs, and cost-effectiveness of neonatal intensive care inMexico.
What Did the Researchers Do and Find? The researchersbuilt a decision analytic model, a mathematical model thatcombines evidence on the outcomes and costs of alternativetreatments to help inform decisions about health care policy.They gathered data about the health outcomes of pretermbirths in Mexico from registers of births and deaths and fromhospital discharge databases, and estimated the costs ofneonatal intensive care and long-term care for disabledsurvivors using data from the Mexican Ministry of Health andthe World Health Organization. They then applied theirmodel, which estimates changes in parameters such as lifeexpectancy, lifetime costs, disability-adjusted life years(DALYs; one DALY represents the loss of a year of healthylife), and incremental cost-effectiveness ratios (ICERs; theadditional cost expended for each DALY averted) for
neonatal intensive care compared to no intensive care, to agroup of 2 million infants. Neonatal intensive care for infantsborn at 24–26, 27–29, and 30–33 weeks gestation prolongedlife expectancy by 28, 43, and 34 years and averted 9, 15, and12 DALYs at incremental costs of US$11,000, US$10,000, andUS$3000, respectively, compared to no intensive care. TheICERs of neonatal intensive care for babies born at thesetimes were US$1200, US$700, and US$300 per DALY averted,respectively.
What Do These Findings Mean? Interventions with ICERsof less than a country’s per capita gross domestic product(GDP) are highly cost-effective; those with ICERs of 1–3 timesthe per capita GDP are potentially cost-effective. Mexico’sper capita GDP in 2005 was approximately US$8,200. Thus,neonatal intensive care could provide exceptional value formoney in Mexico (and maybe in other middle-incomecountries), even for very premature babies. The accuracy ofthese findings inevitably depends on the assumptions usedto build the decision analytic model and on the accuracy ofthe data fed into it, but the findings were little changed by awide range of alterations that the researchers made to themodel. Importantly, however, this cost-effectiveness analysisfocuses on health and economic consequences of differentintervention choices, and does not capture all aspects ofwell-being. Decisions regarding neonatal intensive care willneed to be based on a full consideration of all relevantfactors, including ethical issues, and cost-effectivenessanalyses should continue to be updated as new dataemerge on health outcomes and costs associated withneonatal intensive care.
Additional Information. Please access these Web sites viathe online version of this summary at http://dx.doi.org/10.1371/journal.pmed.1000379.
N The March of Dimes, a nonprofit organization forpregnancy and baby health, provides information onpreterm birth (in English and Spanish)
N The Nemours Foundation, another nonprofit organizationfor child health, also provides information on prematurebabies (in English and Spanish)
N MedlinePlus provides links to other information onpremature babies (in English and Spanish)
N The United Nations Children’s Fund (UNICEF) works forchildren’s rights, survival, development and protectionaround the world; it provides information on MillenniumDevelopment Goal 4 and its Childinfo website providesdetailed statistics about child survival and health (someinformation in several languages)
N A PLoS Medicine Policy Forum by Nuria Homedes andAntonio Ugalde discusses health care reforms in Mexico
Cost-Effectiveness of NICU in Mexico
PLoS Medicine | www.plosmedicine.org 10 December 2010 | Volume 7 | Issue 12 | e1000379