Benefits, Costs, and Coverage Sources, Methods, and State ...
88
1 Workers’ Compensation: Benefits, Costs, and Coverage Sources, Methods, and State Summaries October, 2018 Christopher McLaren and Griffin Murphy
-
Upload
khangminh22 -
Category
Documents
-
view
5 -
download
0
Transcript of Benefits, Costs, and Coverage Sources, Methods, and State ...
1
Workers’ Compensation: Benefits, Costs, and Coverage Sources, Methods, and State Summaries
October, 2018
Christopher McLaren and Griffin Murphy
National Academy of Social Insurance
2
Table of Contents I. INTRODUCTION .............................................................................................................................................................. 4
II. DATA SOURCES .............................................................................................................................................................. 5
Table A.1. Data Sources for 2016. ...................................................................................................................... 6
III. ESTIMATING WORKERS’ COMPENSATION BENEFITS AND COSTS .......................................................... 11
Private Carriers ................................................................................................................................................. 11
Benefits ........................................................................................................................................................... 11
Costs ................................................................................................................................................................ 11
State Funds......................................................................................................................................................... 12
Benefits ........................................................................................................................................................... 12
Costs ................................................................................................................................................................ 12
Deductibles ........................................................................................................................................................ 12
Subtraction Method ....................................................................................................................................... 13
Manual Premium Method .............................................................................................................................. 13
Self-Insured Employers .................................................................................................................................... 14
Benefits ........................................................................................................................................................... 14
Method 1: Estimated Using Historical Data on Self-Insured Benefits.......................................................... 15
Method 2: Estimated Using the Ratio of Self-Insured Benefits Paid to Self-Insured Payroll ...................... 16
Table A.2. Average Ratio of Self-Insurance Benefits % to Self-Insurance Payroll % ............................... 18
Costs ................................................................................................................................................................ 18
Table A.3. Ratio of Administrative Costs to Total Benefits Paid by Private Insurers .................................. 20
Second-Injury Funds, Special Funds, and Guaranty Funds ............................................................................ 22
Benefits ........................................................................................................................................................... 22
Costs ................................................................................................................................................................ 23
Trends ............................................................................................................................................................. 23
Table A.4. Total Second-Injury, Guaranty, and Special Fund Benefits Paid: 2012 to 2016 ..................... 25
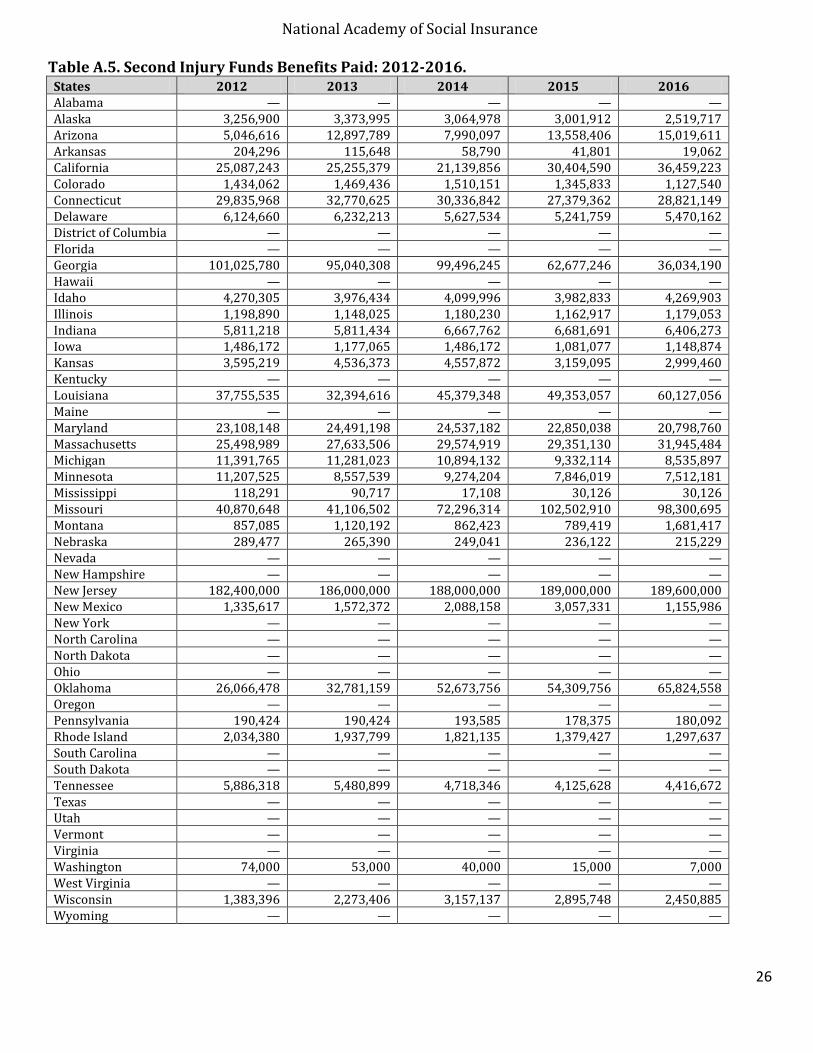
Table A.5. Second Injury Funds Benefits Paid: 2012-2016. ....................................................................... 26
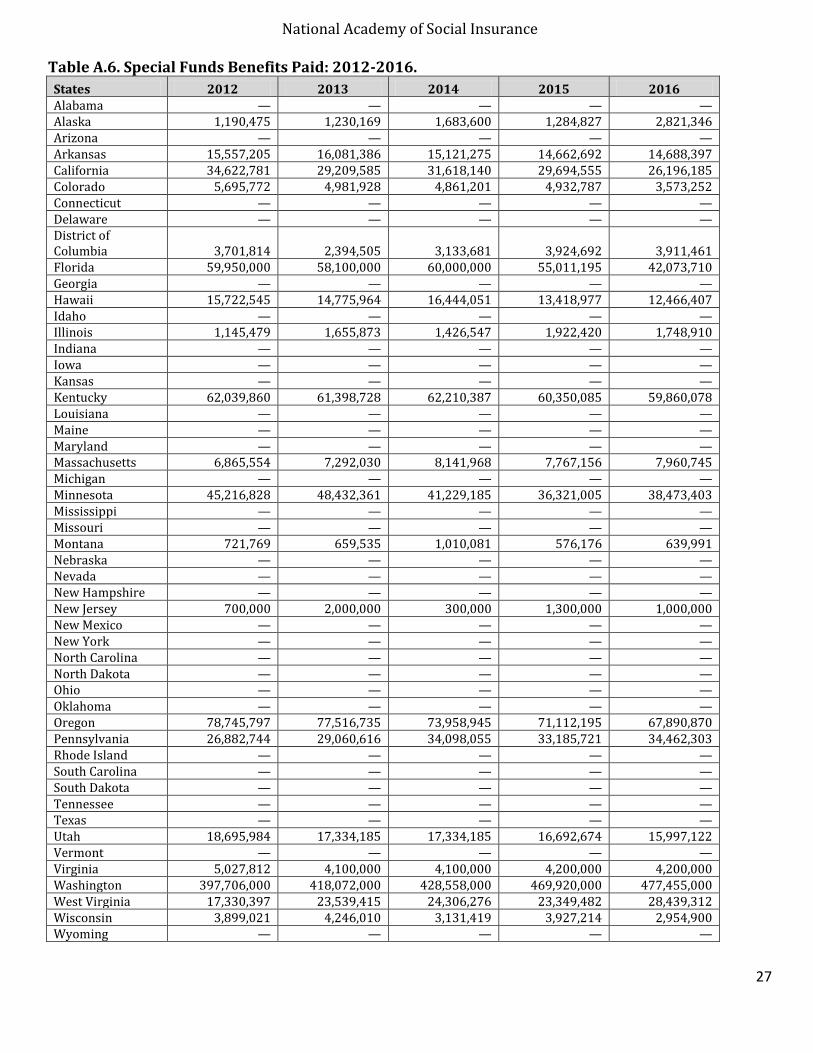
Table A.6. Special Funds Benefits Paid: 2012-2016. .................................................................................. 27
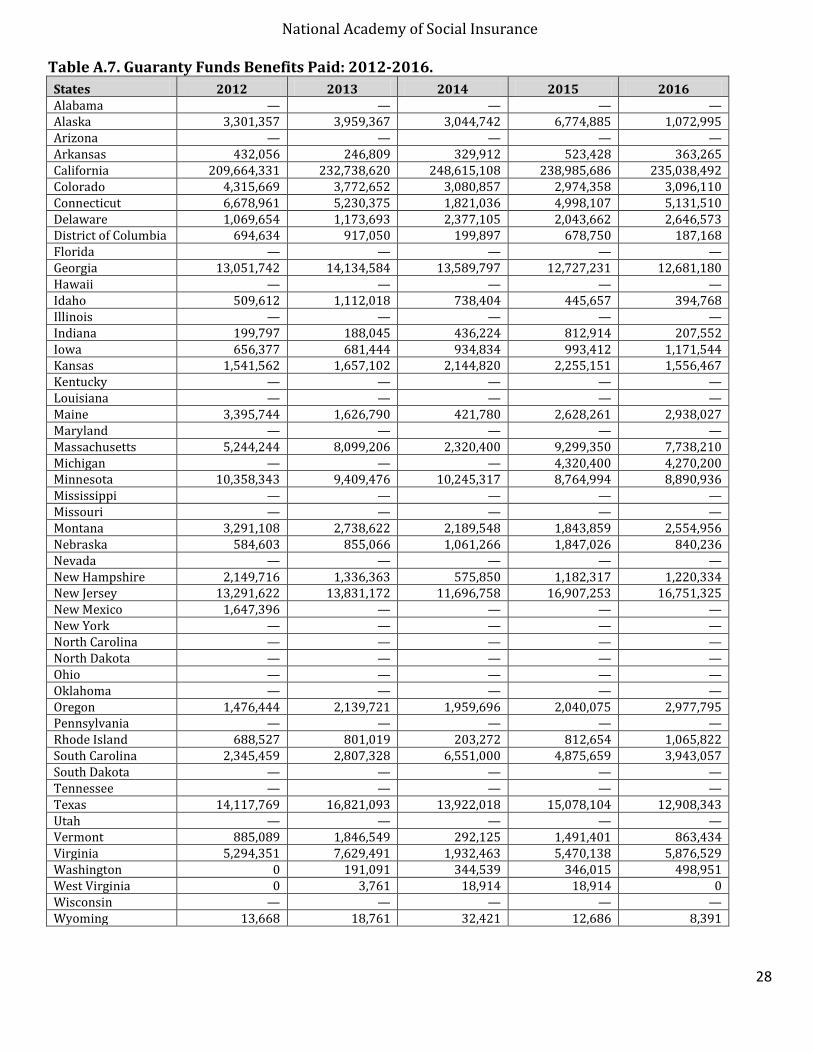
Table A.7. Guaranty Funds Benefits Paid: 2012-2016. ............................................................................... 28
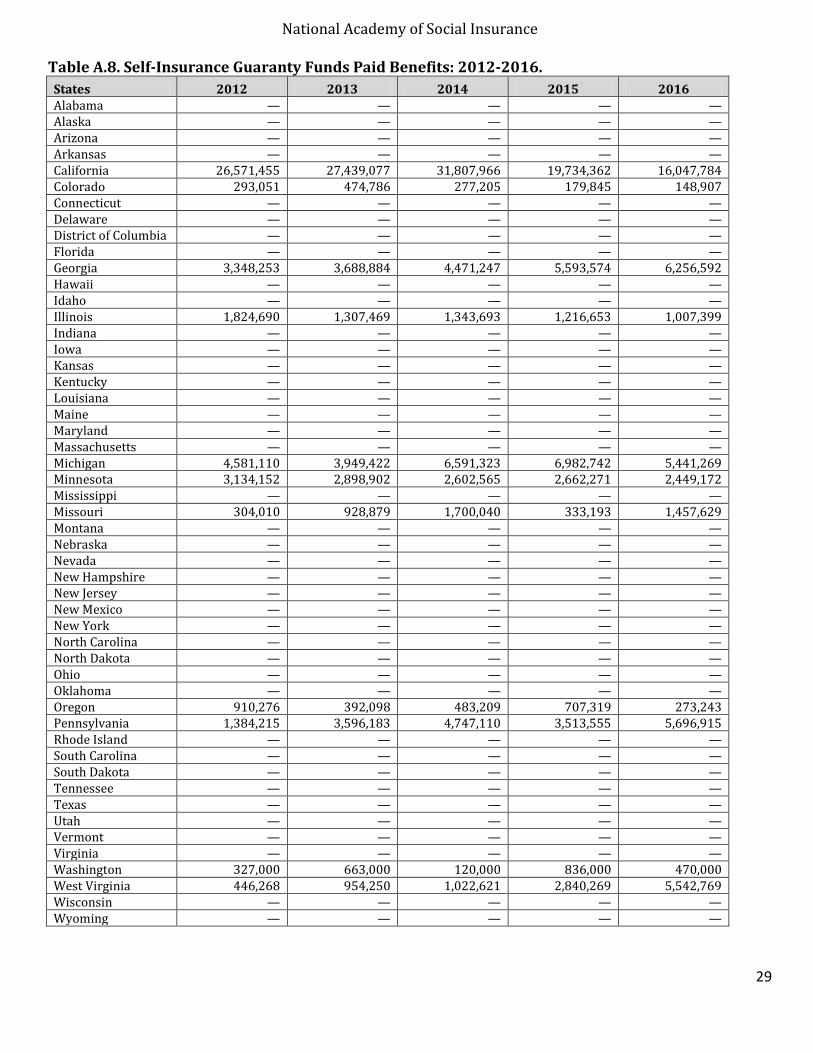
Table A.8. Self-Insurance Guaranty Funds Paid Benefits: 2012-2016. ..................................................... 29
Medical Benefits ................................................................................................................................................ 30
Table A.9. Medical Benefits Paid as a Percent of Total Benefits: 2012-2016. .......................................... 32
IV. UPDATED TABLE 9.B1 OF THE ANNUAL STATISTICAL SUPPLEMENT TO THE SOCIAL SECURITY BULLETIN. .......................................................................................................................................................................... 34
V. STATE SUMMARY TABLES ...................................................................................................................................... 36
ALABAMA ........................................................................................................................................................... 37
ALASKA .............................................................................................................................................................. 38
ARIZONA ............................................................................................................................................................ 39
ARKANSAS ......................................................................................................................................................... 40
CALIFORNIA ....................................................................................................................................................... 41
COLORADO ......................................................................................................................................................... 42
CONNECTICUT ................................................................................................................................................... 43
National Academy of Social Insurance
3
DELAWARE ........................................................................................................................................................ 44
DISTRICT OF COLUMBIA .................................................................................................................................. 45
FLORIDA ............................................................................................................................................................. 46
GEORGIA ............................................................................................................................................................ 47
HAWAII............................................................................................................................................................... 48
IDAHO ................................................................................................................................................................. 49
ILLINOIS ............................................................................................................................................................. 50
INDIANA ............................................................................................................................................................. 51
KANSAS .............................................................................................................................................................. 53
KENTUCKY ......................................................................................................................................................... 54
LOUISIANA ......................................................................................................................................................... 55
MAINE ................................................................................................................................................................ 56
MARYLAND ........................................................................................................................................................ 57
MASSACHUSETTS .............................................................................................................................................. 58
MICHIGAN .......................................................................................................................................................... 59
MINNESOTA ....................................................................................................................................................... 60
MISSISSIPPI ........................................................................................................................................................ 61
MISSOURI ........................................................................................................................................................... 62
MONTANA .......................................................................................................................................................... 63
NEBRASKA ......................................................................................................................................................... 64
NEVADA ............................................................................................................................................................. 65
NEW HAMPSHIRE ............................................................................................................................................. 66
NEW JERSEY ...................................................................................................................................................... 67
NEW MEXICO ..................................................................................................................................................... 68
NEW YORK ......................................................................................................................................................... 69
NORTH CAROLINA ............................................................................................................................................ 70
NORTH DAKOTA ................................................................................................................................................ 71
OHIO ................................................................................................................................................................... 72
OKLAHOMA ........................................................................................................................................................ 73
OREGON ............................................................................................................................................................. 74
PENNSYLVANIA ................................................................................................................................................. 75
RHODE ISLAND .................................................................................................................................................. 76
SOUTH CAROLINA ............................................................................................................................................. 77
SOUTH DAKOTA ................................................................................................................................................ 78
TENNESSEE........................................................................................................................................................ 79
TEXAS ................................................................................................................................................................. 80
UTAH .................................................................................................................................................................. 81
VERMONT .......................................................................................................................................................... 82
VIRGINIA ............................................................................................................................................................ 83
WASHINGTON ................................................................................................................................................... 84
WEST VIRGNIA .................................................................................................................................................. 85
WISCONSIN ........................................................................................................................................................ 86
WYOMING .......................................................................................................................................................... 87
UNITED STATES: Non-Federal Total ............................................................................................................... 88
National Academy of Social Insurance
4
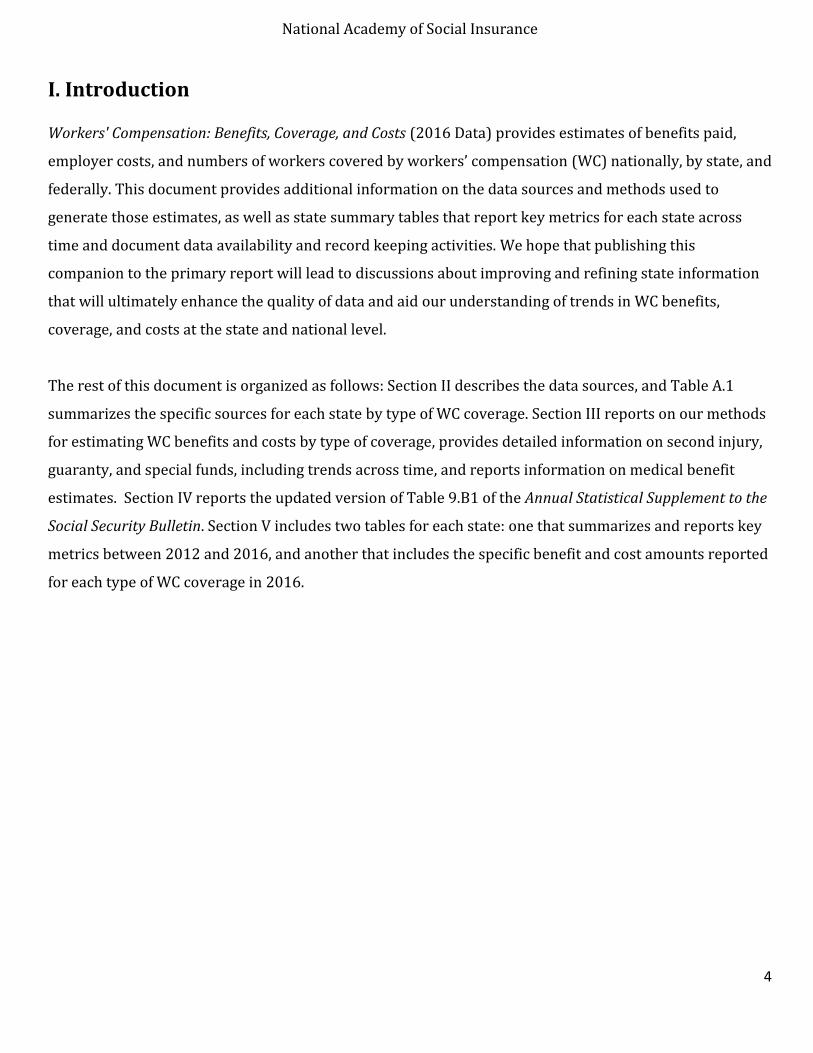
I. Introduction Workers' Compensation: Benefits, Coverage, and Costs (2016 Data) provides estimates of benefits paid,
employer costs, and numbers of workers covered by workers’ compensation (WC) nationally, by state, and
federally. This document provides additional information on the data sources and methods used to
generate those estimates, as well as state summary tables that report key metrics for each state across
time and document data availability and record keeping activities. We hope that publishing this
companion to the primary report will lead to discussions about improving and refining state information
that will ultimately enhance the quality of data and aid our understanding of trends in WC benefits,
coverage, and costs at the state and national level.
The rest of this document is organized as follows: Section II describes the data sources, and Table A.1
summarizes the specific sources for each state by type of WC coverage. Section III reports on our methods
for estimating WC benefits and costs by type of coverage, provides detailed information on second injury,
guaranty, and special funds, including trends across time, and reports information on medical benefit
estimates. Section IV reports the updated version of Table 9.B1 of the Annual Statistical Supplement to the
Social Security Bulletin. Section V includes two tables for each state: one that summarizes and reports key
metrics between 2012 and 2016, and another that includes the specific benefit and cost amounts reported
for each type of WC coverage in 2016.
National Academy of Social Insurance
5
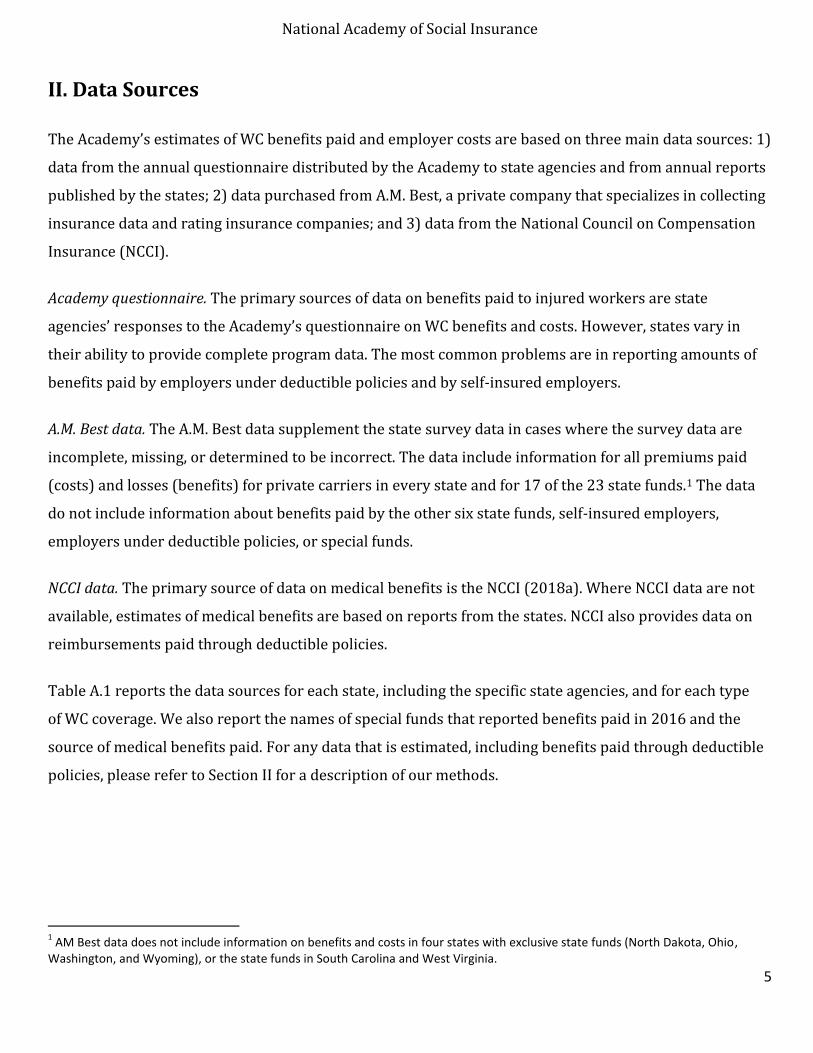
II. Data Sources
The Academy’s estimates of WC benefits paid and employer costs are based on three main data sources: 1)
data from the annual questionnaire distributed by the Academy to state agencies and from annual reports
published by the states; 2) data purchased from A.M. Best, a private company that specializes in collecting
insurance data and rating insurance companies; and 3) data from the National Council on Compensation
Insurance (NCCI).
Academy questionnaire. The primary sources of data on benefits paid to injured workers are state
agencies’ responses to the Academy’s questionnaire on WC benefits and costs. However, states vary in
their ability to provide complete program data. The most common problems are in reporting amounts of
benefits paid by employers under deductible policies and by self-insured employers.
A.M. Best data. The A.M. Best data supplement the state survey data in cases where the survey data are
incomplete, missing, or determined to be incorrect. The data include information for all premiums paid
(costs) and losses (benefits) for private carriers in every state and for 17 of the 23 state funds.1 The data
do not include information about benefits paid by the other six state funds, self-insured employers,
employers under deductible policies, or special funds.
NCCI data. The primary source of data on medical benefits is the NCCI (2018a). Where NCCI data are not
available, estimates of medical benefits are based on reports from the states. NCCI also provides data on
reimbursements paid through deductible policies.
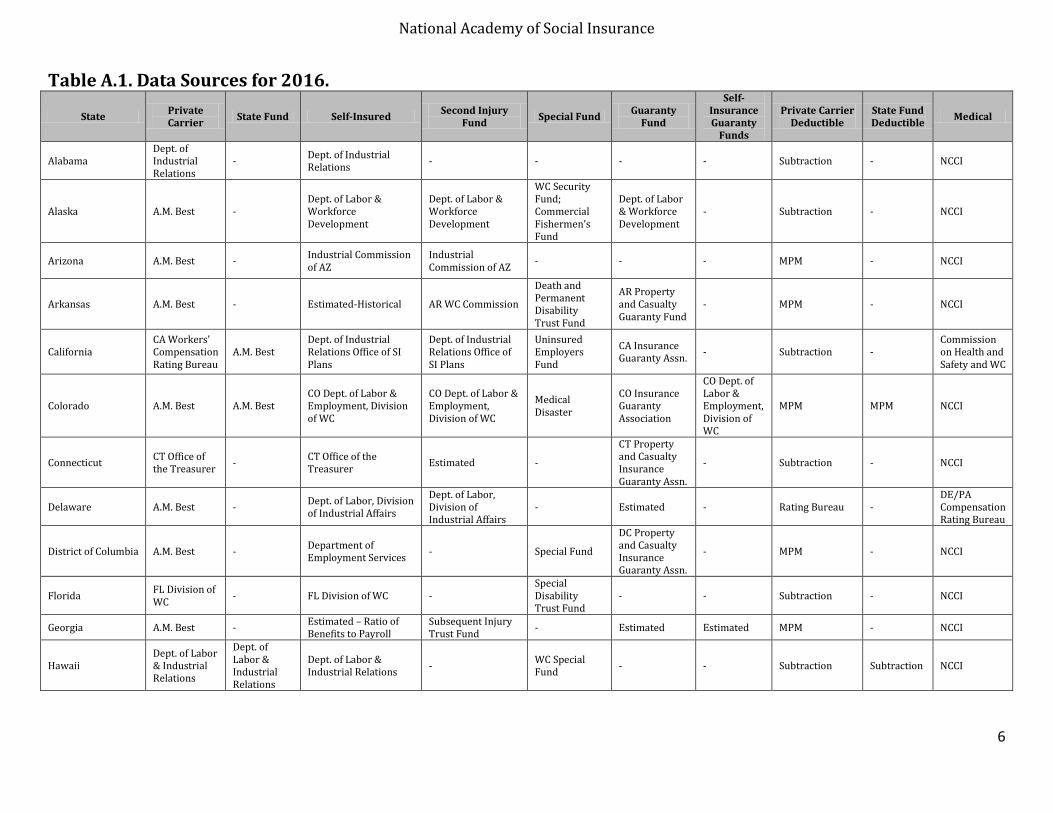
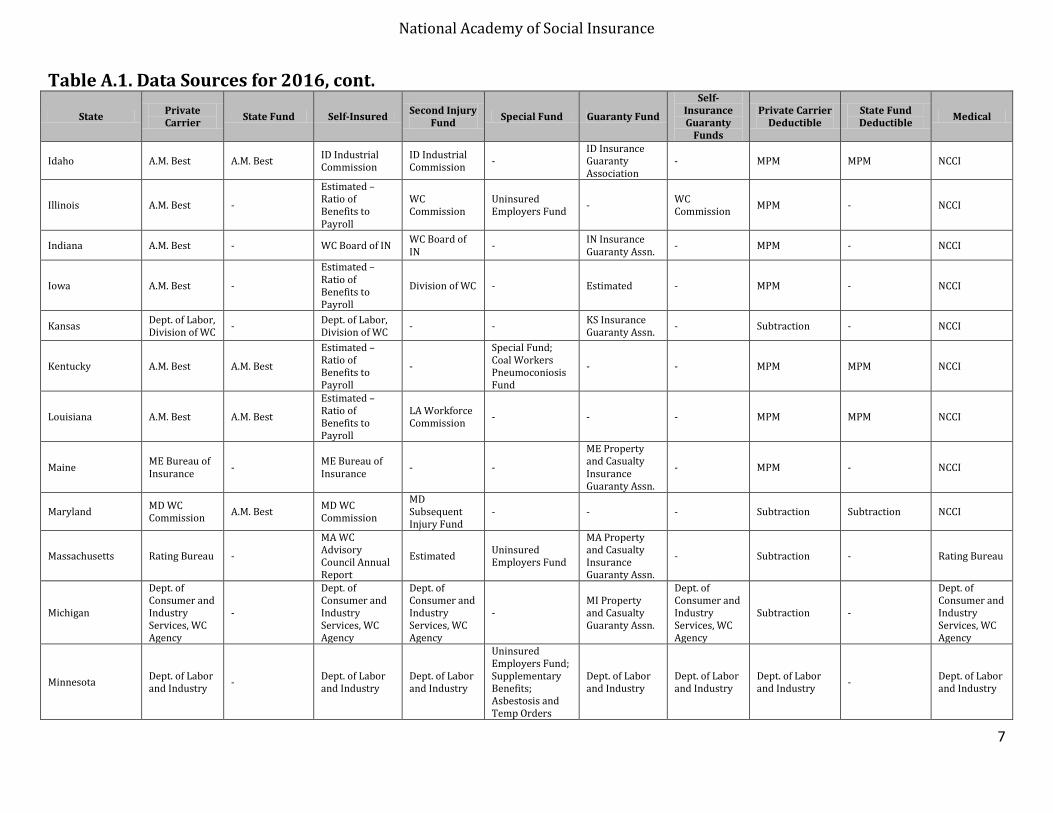
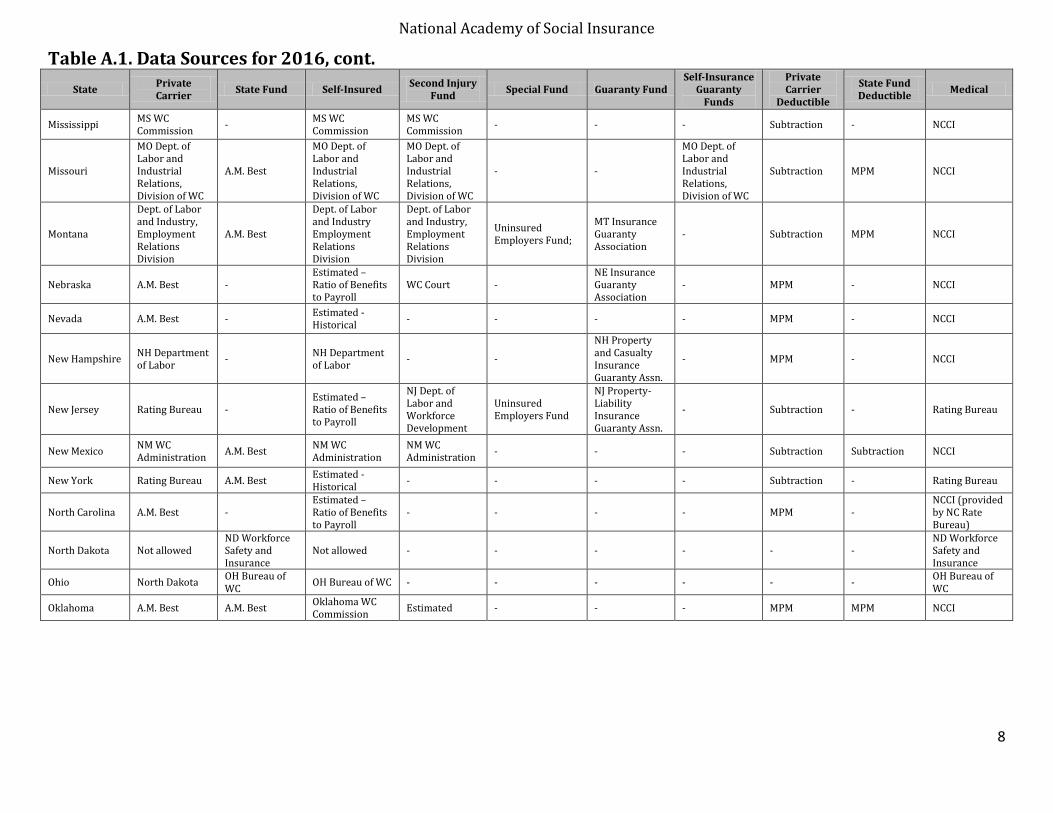
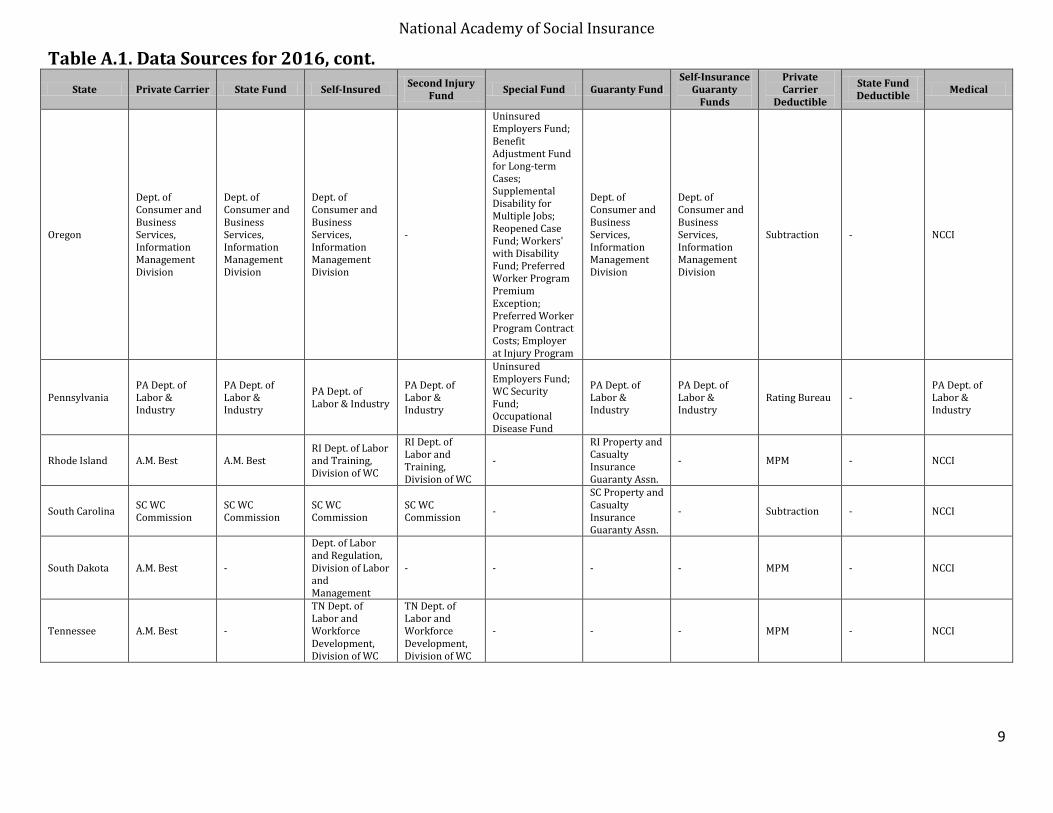
Table A.1 reports the data sources for each state, including the specific state agencies, and for each type
of WC coverage. We also report the names of special funds that reported benefits paid in 2016 and the
source of medical benefits paid. For any data that is estimated, including benefits paid through deductible
policies, please refer to Section II for a description of our methods.
1 AM Best data does not include information on benefits and costs in four states with exclusive state funds (North Dakota, Ohio,
Washington, and Wyoming), or the state funds in South Carolina and West Virginia.
National Academy of Social Insurance
6
Table A.1. Data Sources for 2016.
State Private Carrier
State Fund Self-Insured Second Injury
Fund Special Fund
Guaranty Fund
Self-Insurance Guaranty
Funds
Private Carrier Deductible
State Fund Deductible
Medical
Alabama Dept. of Industrial Relations
- Dept. of Industrial Relations
- - - - Subtraction - NCCI
Alaska A.M. Best - Dept. of Labor & Workforce Development
Dept. of Labor & Workforce Development
WC Security Fund; Commercial Fishermen's Fund
Dept. of Labor & Workforce Development
- Subtraction - NCCI
Arizona A.M. Best - Industrial Commission of AZ
Industrial Commission of AZ
- - - MPM - NCCI
Arkansas A.M. Best - Estimated-Historical AR WC Commission
Death and Permanent Disability Trust Fund
AR Property and Casualty Guaranty Fund
- MPM - NCCI
California CA Workers’ Compensation Rating Bureau
A.M. Best Dept. of Industrial Relations Office of SI Plans
Dept. of Industrial Relations Office of SI Plans
Uninsured Employers Fund
CA Insurance Guaranty Assn.
- Subtraction - Commission on Health and Safety and WC
Colorado A.M. Best A.M. Best CO Dept. of Labor & Employment, Division of WC
CO Dept. of Labor & Employment, Division of WC
Medical Disaster
CO Insurance Guaranty Association
CO Dept. of Labor & Employment, Division of WC
MPM MPM NCCI
Connecticut CT Office of the Treasurer
- CT Office of the Treasurer
Estimated -
CT Property and Casualty Insurance Guaranty Assn.
- Subtraction - NCCI
Delaware A.M. Best - Dept. of Labor, Division of Industrial Affairs
Dept. of Labor, Division of Industrial Affairs
- Estimated - Rating Bureau - DE/PA Compensation Rating Bureau
District of Columbia A.M. Best - Department of Employment Services
- Special Fund
DC Property and Casualty Insurance Guaranty Assn.
- MPM - NCCI
Florida FL Division of WC
- FL Division of WC - Special Disability Trust Fund
- - Subtraction - NCCI
Georgia A.M. Best - Estimated – Ratio of Benefits to Payroll
Subsequent Injury Trust Fund
- Estimated Estimated MPM - NCCI
Hawaii Dept. of Labor & Industrial Relations
Dept. of Labor & Industrial Relations
Dept. of Labor & Industrial Relations
- WC Special Fund
- - Subtraction Subtraction NCCI
National Academy of Social Insurance
7
Table A.1. Data Sources for 2016, cont.
State Private Carrier
State Fund Self-Insured Second Injury
Fund Special Fund Guaranty Fund
Self-Insurance Guaranty
Funds
Private Carrier Deductible
State Fund Deductible
Medical
Idaho A.M. Best A.M. Best ID Industrial Commission
ID Industrial Commission
- ID Insurance Guaranty Association
- MPM MPM NCCI
Illinois A.M. Best -
Estimated – Ratio of Benefits to Payroll
WC Commission
Uninsured Employers Fund
- WC Commission
MPM - NCCI
Indiana A.M. Best - WC Board of IN WC Board of IN
- IN Insurance Guaranty Assn.
- MPM - NCCI
Iowa A.M. Best -
Estimated – Ratio of Benefits to Payroll
Division of WC - Estimated - MPM - NCCI
Kansas Dept. of Labor, Division of WC
- Dept. of Labor, Division of WC
- - KS Insurance Guaranty Assn.
- Subtraction - NCCI
Kentucky A.M. Best A.M. Best
Estimated – Ratio of Benefits to Payroll
-
Special Fund; Coal Workers Pneumoconiosis Fund
- - MPM MPM NCCI
Louisiana A.M. Best A.M. Best
Estimated – Ratio of Benefits to Payroll
LA Workforce Commission
- - - MPM MPM NCCI
Maine ME Bureau of Insurance
- ME Bureau of Insurance
- -
ME Property and Casualty Insurance Guaranty Assn.
- MPM - NCCI
Maryland MD WC Commission
A.M. Best MD WC Commission
MD Subsequent Injury Fund
- - - Subtraction Subtraction NCCI
Massachusetts Rating Bureau -
MA WC Advisory Council Annual Report
Estimated Uninsured Employers Fund
MA Property and Casualty Insurance Guaranty Assn.
- Subtraction - Rating Bureau
Michigan
Dept. of Consumer and Industry Services, WC Agency
-
Dept. of Consumer and Industry Services, WC Agency
Dept. of Consumer and Industry Services, WC Agency
- MI Property and Casualty Guaranty Assn.
Dept. of Consumer and Industry Services, WC Agency
Subtraction -
Dept. of Consumer and Industry Services, WC Agency
Minnesota Dept. of Labor and Industry
- Dept. of Labor and Industry
Dept. of Labor and Industry
Uninsured Employers Fund; Supplementary Benefits; Asbestosis and Temp Orders
Dept. of Labor and Industry
Dept. of Labor and Industry
Dept. of Labor and Industry
- Dept. of Labor and Industry
National Academy of Social Insurance
8
Table A.1. Data Sources for 2016, cont.
State Private Carrier
State Fund Self-Insured Second Injury
Fund Special Fund Guaranty Fund
Self-Insurance Guaranty
Funds
Private Carrier
Deductible
State Fund Deductible
Medical
Mississippi MS WC Commission
- MS WC Commission
MS WC Commission
- - - Subtraction - NCCI
Missouri
MO Dept. of Labor and Industrial Relations, Division of WC
A.M. Best
MO Dept. of Labor and Industrial Relations, Division of WC
MO Dept. of Labor and Industrial Relations, Division of WC
- -
MO Dept. of Labor and Industrial Relations, Division of WC
Subtraction MPM NCCI
Montana
Dept. of Labor and Industry, Employment Relations Division
A.M. Best
Dept. of Labor and Industry Employment Relations Division
Dept. of Labor and Industry, Employment Relations Division
Uninsured Employers Fund;
MT Insurance Guaranty Association
- Subtraction MPM NCCI
Nebraska A.M. Best - Estimated – Ratio of Benefits to Payroll
WC Court - NE Insurance Guaranty Association
- MPM - NCCI
Nevada A.M. Best - Estimated - Historical
- - - - MPM - NCCI
New Hampshire NH Department of Labor
- NH Department of Labor
- -
NH Property and Casualty Insurance Guaranty Assn.
- MPM - NCCI
New Jersey Rating Bureau - Estimated – Ratio of Benefits to Payroll
NJ Dept. of Labor and Workforce Development
Uninsured Employers Fund
NJ Property-Liability Insurance Guaranty Assn.
- Subtraction - Rating Bureau
New Mexico NM WC Administration
A.M. Best NM WC Administration
NM WC Administration
- - - Subtraction Subtraction NCCI
New York Rating Bureau A.M. Best Estimated - Historical
- - - - Subtraction - Rating Bureau
North Carolina A.M. Best - Estimated – Ratio of Benefits to Payroll
- - - - MPM - NCCI (provided by NC Rate Bureau)
North Dakota Not allowed ND Workforce Safety and Insurance
Not allowed - - - - - - ND Workforce Safety and Insurance
Ohio North Dakota OH Bureau of WC
OH Bureau of WC - - - - - - OH Bureau of WC
Oklahoma A.M. Best A.M. Best Oklahoma WC Commission
Estimated - - - MPM MPM NCCI
National Academy of Social Insurance
9
Table A.1. Data Sources for 2016, cont.
State Private Carrier State Fund Self-Insured Second Injury
Fund Special Fund Guaranty Fund
Self-Insurance Guaranty
Funds
Private Carrier
Deductible
State Fund Deductible
Medical
Oregon
Dept. of Consumer and Business Services, Information Management Division
Dept. of Consumer and Business Services, Information Management Division
Dept. of Consumer and Business Services, Information Management Division
-
Uninsured Employers Fund; Benefit Adjustment Fund for Long-term Cases; Supplemental Disability for Multiple Jobs; Reopened Case Fund; Workers' with Disability Fund; Preferred Worker Program Premium Exception; Preferred Worker Program Contract Costs; Employer at Injury Program
Dept. of Consumer and Business Services, Information Management Division
Dept. of Consumer and Business Services, Information Management Division
Subtraction - NCCI
Pennsylvania PA Dept. of Labor & Industry
PA Dept. of Labor & Industry
PA Dept. of Labor & Industry
PA Dept. of Labor & Industry
Uninsured Employers Fund; WC Security Fund; Occupational Disease Fund
PA Dept. of Labor & Industry
PA Dept. of Labor & Industry
Rating Bureau - PA Dept. of Labor & Industry
Rhode Island A.M. Best A.M. Best RI Dept. of Labor and Training, Division of WC
RI Dept. of Labor and Training, Division of WC
-
RI Property and Casualty Insurance Guaranty Assn.
- MPM - NCCI
South Carolina SC WC Commission
SC WC Commission
SC WC Commission
SC WC Commission
-
SC Property and Casualty Insurance Guaranty Assn.
- Subtraction - NCCI
South Dakota A.M. Best -
Dept. of Labor and Regulation, Division of Labor and Management
- - - - MPM - NCCI
Tennessee A.M. Best -
TN Dept. of Labor and Workforce Development, Division of WC
TN Dept. of Labor and Workforce Development, Division of WC
- - - MPM - NCCI
National Academy of Social Insurance
10
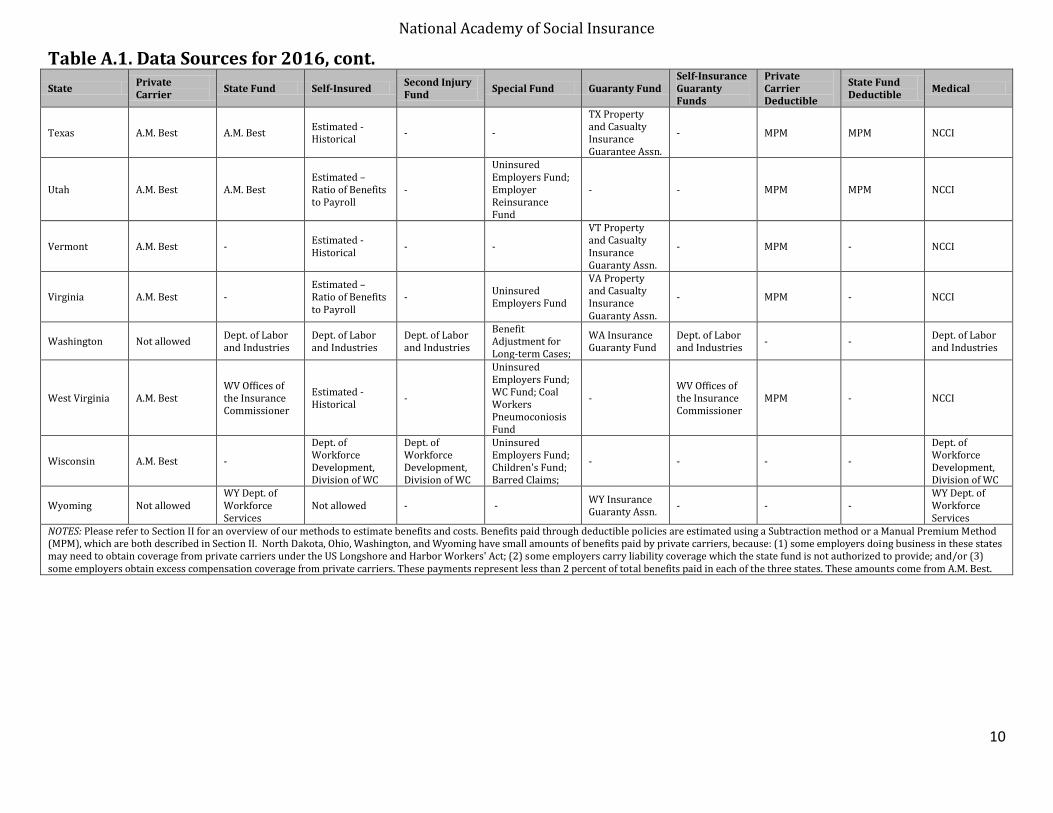
Table A.1. Data Sources for 2016, cont.
State Private Carrier
State Fund Self-Insured Second Injury Fund
Special Fund Guaranty Fund Self-Insurance Guaranty Funds
Private Carrier Deductible
State Fund Deductible
Medical
Texas A.M. Best A.M. Best Estimated - Historical
- -
TX Property and Casualty Insurance Guarantee Assn.
- MPM MPM NCCI
Utah A.M. Best A.M. Best Estimated – Ratio of Benefits to Payroll
-
Uninsured Employers Fund; Employer Reinsurance Fund
- - MPM MPM NCCI
Vermont A.M. Best - Estimated - Historical
- -
VT Property and Casualty Insurance Guaranty Assn.
- MPM - NCCI
Virginia A.M. Best - Estimated – Ratio of Benefits to Payroll
- Uninsured Employers Fund
VA Property and Casualty Insurance Guaranty Assn.
- MPM - NCCI
Washington Not allowed Dept. of Labor and Industries
Dept. of Labor and Industries
Dept. of Labor and Industries
Benefit Adjustment for Long-term Cases;
WA Insurance Guaranty Fund
Dept. of Labor and Industries
- - Dept. of Labor and Industries
West Virginia A.M. Best WV Offices of the Insurance Commissioner
Estimated - Historical
-
Uninsured Employers Fund; WC Fund; Coal Workers Pneumoconiosis Fund
- WV Offices of the Insurance Commissioner
MPM - NCCI
Wisconsin A.M. Best -
Dept. of Workforce Development, Division of WC
Dept. of Workforce Development, Division of WC
Uninsured Employers Fund; Children's Fund; Barred Claims;
- - - -
Dept. of Workforce Development, Division of WC
Wyoming Not allowed
WY Dept. of Workforce Services
Not allowed - - WY Insurance Guaranty Assn.
- - - WY Dept. of Workforce Services
NOTES: Please refer to Section II for an overview of our methods to estimate benefits and costs. Benefits paid through deductible policies are estimated using a Subtraction method or a Manual Premium Method (MPM), which are both described in Section II. North Dakota, Ohio, Washington, and Wyoming have small amounts of benefits paid by private carriers, because: (1) some employers doing business in these states may need to obtain coverage from private carriers under the US Longshore and Harbor Workers' Act; (2) some employers carry liability coverage which the state fund is not authorized to provide; and/or (3) some employers obtain excess compensation coverage from private carriers. These payments represent less than 2 percent of total benefits paid in each of the three states. These amounts come from A.M. Best.
National Academy of Social Insurance
11
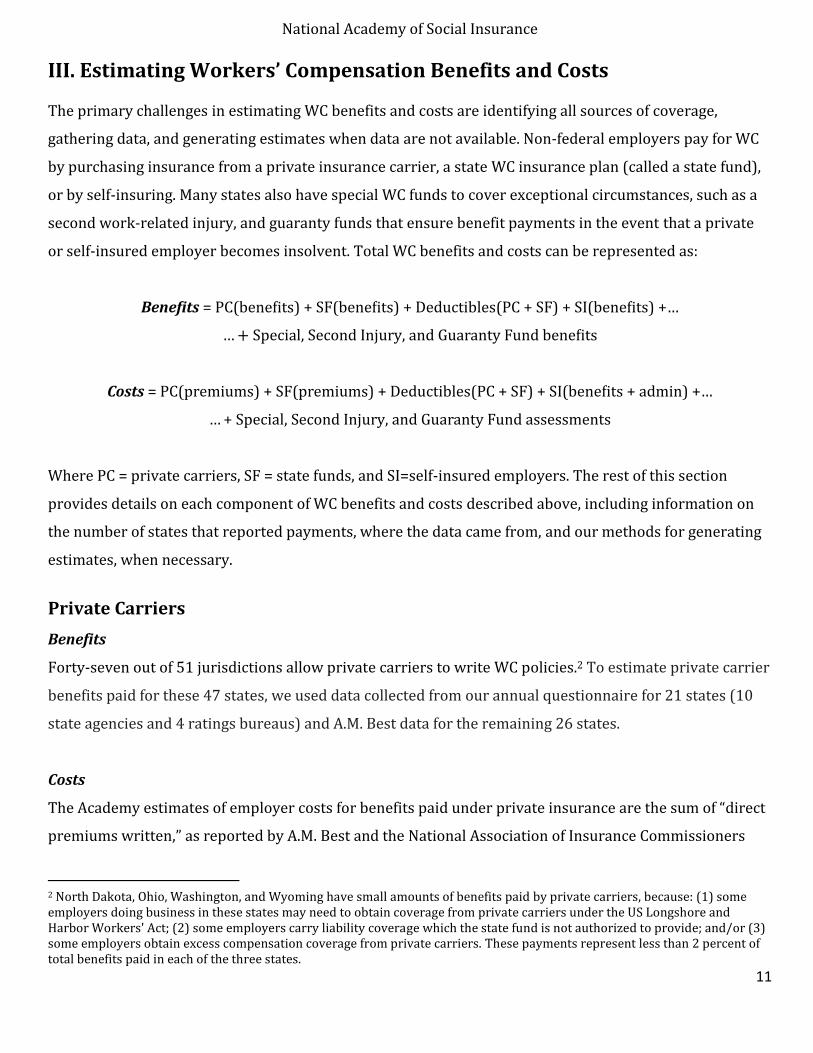
III. Estimating Workers’ Compensation Benefits and Costs The primary challenges in estimating WC benefits and costs are identifying all sources of coverage,
gathering data, and generating estimates when data are not available. Non-federal employers pay for WC
by purchasing insurance from a private insurance carrier, a state WC insurance plan (called a state fund),
or by self-insuring. Many states also have special WC funds to cover exceptional circumstances, such as a
second work-related injury, and guaranty funds that ensure benefit payments in the event that a private
or self-insured employer becomes insolvent. Total WC benefits and costs can be represented as:
C bene its bene its eductibles C bene its
pecial, econd n ury, and uaranty und bene its
C premiums premiums eductibles C bene its admin
pecial, econd n ury, and uaranty und assessments
Where PC = private carriers, SF = state funds, and SI=self-insured employers. The rest of this section
provides details on each component of WC benefits and costs described above, including information on
the number of states that reported payments, where the data came from, and our methods for generating
estimates, when necessary.
Private Carriers
Benefits
Forty-seven out of 51 jurisdictions allow private carriers to write WC policies.2 To estimate private carrier
benefits paid for these 47 states, we used data collected from our annual questionnaire for 21 states (10
state agencies and 4 ratings bureaus) and A.M. Best data for the remaining 26 states.
Costs
The Academy estimates of employer costs for benefits paid under private insurance are the sum of “direct
premiums written,” as reported by A.M. Best and the National Association of Insurance Commissioners
2 North Dakota, Ohio, Washington, and Wyoming have small amounts of benefits paid by private carriers, because: (1) some employers doing business in these states may need to obtain coverage from private carriers under the US Longshore and Harbor Workers' Act; (2) some employers carry liability coverage which the state fund is not authorized to provide; and/or (3) some employers obtain excess compensation coverage from private carriers. These payments represent less than 2 percent of total benefits paid in each of the three states.
National Academy of Social Insurance
12
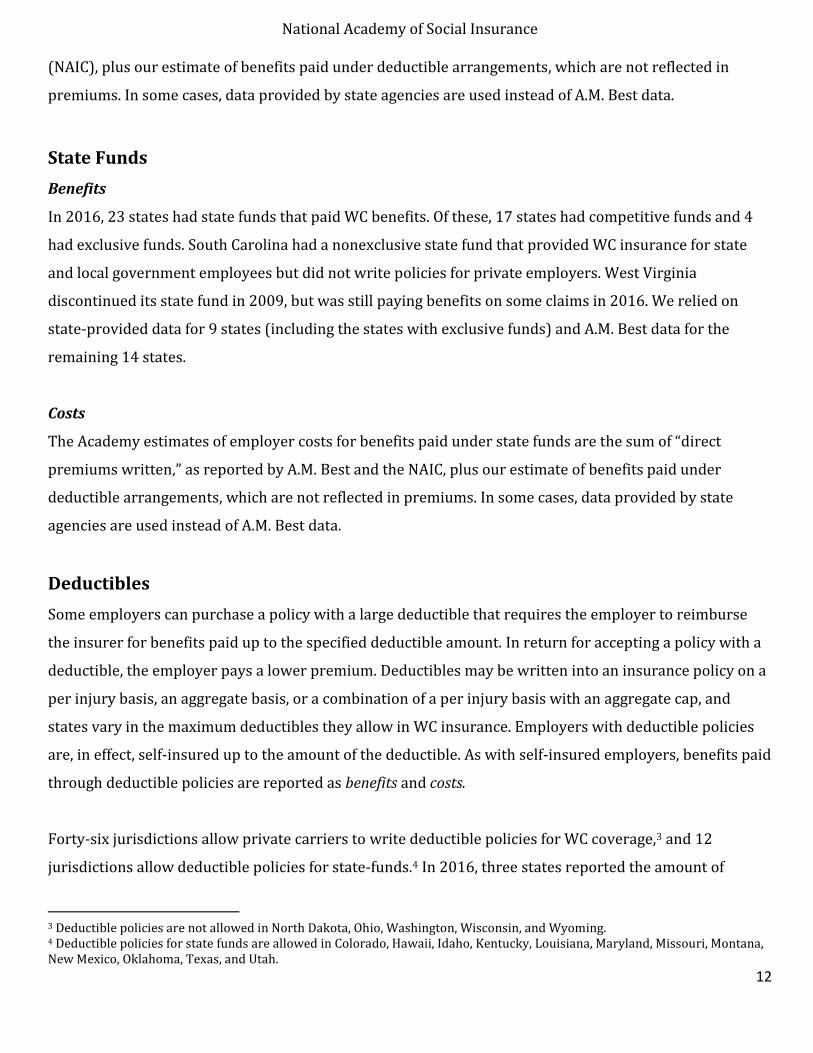
(NAIC), plus our estimate of benefits paid under deductible arrangements, which are not reflected in
premiums. In some cases, data provided by state agencies are used instead of A.M. Best data.
State Funds
Benefits
In 2016, 23 states had state funds that paid WC benefits. Of these, 17 states had competitive funds and 4
had exclusive funds. South Carolina had a nonexclusive state fund that provided WC insurance for state
and local government employees but did not write policies for private employers. West Virginia
discontinued its state fund in 2009, but was still paying benefits on some claims in 2016. We relied on
state-provided data for 9 states (including the states with exclusive funds) and A.M. Best data for the
remaining 14 states.
Costs
The Academy estimates of employer costs for benefits paid under state funds are the sum of “direct
premiums written,” as reported by A.M. Best and the NA C, plus our estimate of benefits paid under
deductible arrangements, which are not reflected in premiums. In some cases, data provided by state
agencies are used instead of A.M. Best data.
Deductibles
Some employers can purchase a policy with a large deductible that requires the employer to reimburse
the insurer for benefits paid up to the specified deductible amount. In return for accepting a policy with a
deductible, the employer pays a lower premium. Deductibles may be written into an insurance policy on a
per injury basis, an aggregate basis, or a combination of a per injury basis with an aggregate cap, and
states vary in the maximum deductibles they allow in WC insurance. Employers with deductible policies
are, in effect, self-insured up to the amount of the deductible. As with self-insured employers, benefits paid
through deductible policies are reported as benefits and costs.
Forty-six jurisdictions allow private carriers to write deductible policies for WC coverage,3 and 12
jurisdictions allow deductible policies for state-funds.4 In 2016, three states reported the amount of
3 Deductible policies are not allowed in North Dakota, Ohio, Washington, Wisconsin, and Wyoming. 4 Deductible policies for state funds are allowed in Colorado, Hawaii, Idaho, Kentucky, Louisiana, Maryland, Missouri, Montana, New Mexico, Oklahoma, Texas, and Utah.
National Academy of Social Insurance
13
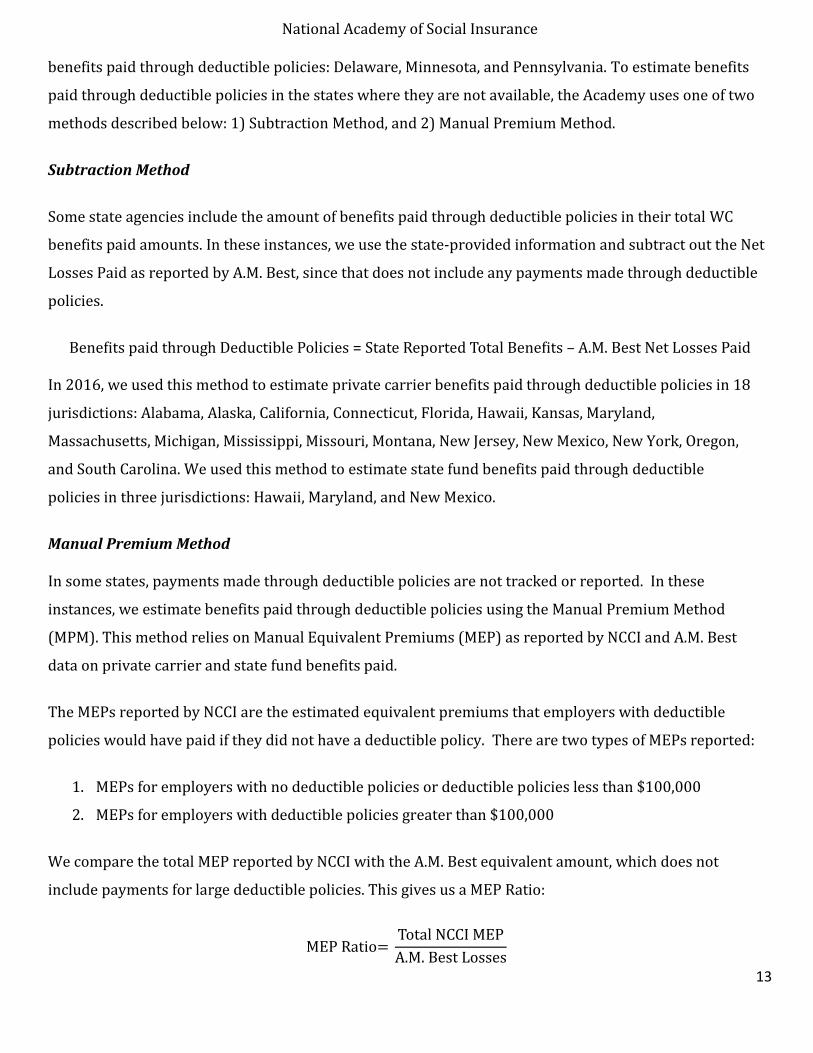
benefits paid through deductible policies: Delaware, Minnesota, and Pennsylvania. To estimate benefits
paid through deductible policies in the states where they are not available, the Academy uses one of two
methods described below: 1) Subtraction Method, and 2) Manual Premium Method.
Subtraction Method
Some state agencies include the amount of benefits paid through deductible policies in their total WC
benefits paid amounts. In these instances, we use the state-provided information and subtract out the Net
Losses Paid as reported by A.M. Best, since that does not include any payments made through deductible
policies.
Bene its paid through eductible olicies tate eported Total Bene its – A.M. Best Net osses aid
In 2016, we used this method to estimate private carrier benefits paid through deductible policies in 18
jurisdictions: Alabama, Alaska, California, Connecticut, Florida, Hawaii, Kansas, Maryland,
Massachusetts, Michigan, Mississippi, Missouri, Montana, New Jersey, New Mexico, New York, Oregon,
and South Carolina. We used this method to estimate state fund benefits paid through deductible
policies in three jurisdictions: Hawaii, Maryland, and New Mexico.
Manual Premium Method
In some states, payments made through deductible policies are not tracked or reported. In these
instances, we estimate benefits paid through deductible policies using the Manual Premium Method
(MPM). This method relies on Manual Equivalent Premiums (MEP) as reported by NCCI and A.M. Best
data on private carrier and state fund benefits paid.
The MEPs reported by NCCI are the estimated equivalent premiums that employers with deductible
policies would have paid if they did not have a deductible policy. There are two types of MEPs reported:
1. MEPs for employers with no deductible policies or deductible policies less than $100,000
2. MEPs for employers with deductible policies greater than $100,000
We compare the total MEP reported by NCCI with the A.M. Best equivalent amount, which does not
include payments for large deductible policies. This gives us a MEP Ratio:
National Academy of Social Insurance
14
We use the MEP Ratio and multiply it by the A.M. Best actual reported losses and estimate benefits paid
through deductible policies as:
eductible Bene its aid A.M. Best eported osses M atio
To distinguish the amount paid by private carriers compared to state funds (when allowed), we estimate
the total deductible benefits paid and weight it by the ratio of A.M. Best Reported Losses for private
carriers and state funds.
In 2016, we used this approach to estimate benefits paid under deductible policies through private
carriers in 25 states and through state funds in nine states.
Private Carriers: Arizona, Arkansas, Colorado, the District of Columbia, Georgia, Idaho, Illinois, Indiana,
Iowa, Kentucky, Louisiana, Maine, Nebraska, Nevada, New Hampshire, North Carolina, Oklahoma, Rhode
Island, South Dakota, Tennessee, Texas, Utah, Vermont, Virginia, and West Virginia.
State Funds: Colorado, Idaho, Kentucky, Louisiana, Missouri, Montana, Oklahoma, Texas, and Utah.
Self-Insured Employers Benefits
All jurisdictions except North Dakota and Wyoming allow employers to self-insure.5 Of the 49 jurisdictions
that allow self-insurance, 32 provided data on self-insured benefits paid. We estimated self-insured
benefits paid in the remaining 17 jurisdictions using one of two methods, depending on the information
available for the particular state.
Recall that total benefits paid (not including benefits paid by second-injury, guaranty, or special funds) for
a particular jurisdiction is equal to:
Total Bene its C bene its deductibles bene its deductibles bene its
Private carrier and state fund benefits paid and deductibles (some of which we estimate) are known for all
jurisdictions. If we knew the total benefits paid in the jurisdictions without any reported self-insured
benefits, then we could simply subtract all non-self-insured benefits from total benefits. However, we do
5 Employers in Wyoming that are required to purchase workers’ compensation insurance are not allowed to self-insure.
National Academy of Social Insurance
15
not know total benefits paid in those jurisdictions, so instead we utilize the data we do have to estimate
the fraction of self-insured benefits to total benefits:
bene its bene its
C bene its deductibles bene its deductibles bene its
Once we estimate the SI benefits % for a particular jurisdiction, we solve the above for SI benefits and
calculate estimated SI benefits paid as:
bene its C bene its deductibles bene its deductibles bene its
bene its
To estimate the SI benefits %, we use one of two methods, which are described below. The first method
utilizes historical self-insured benefits paid data. When historical data for the particular state is not
available, we rely on a second method that utilizes the ratio of self-insured benefits paid to self-insured
payroll.
Method 1: Estimated Using Historical Data on Self-Insured Benefits If we received self-insured benefit payments from a reliable agency source in a previous year (but not in
the current year), we rely on this historical data to estimate self-insured benefits. Specifically, we use the
historical SI benefits % to estimate the SI benefits % in the current year. However, relying solely on the
historical SI benefits % for a state ignores trends in the distribution of payments over time. To account for
this, we weight the historical SI benefits % in a specific state by the ratio of national SI benefits % in the
current year to the national SI benefits % in the previous year, for the states that provided self-insured
benefits data. This is represented in the equation below:
In the above equation, SI benefits % in state s, time t, is equal to the SI benefits % in state s in the most
recent year available (time t-x) multiplied by the ratio of the national SI benefits % in time t to the national
SI benefits % in time t-x. The national SI benefits % is the share of self-insured benefit payments in the
states that provided the information. In 2016, 32 states provided information on self-insured benefits and
the national SI benefits % was 25.6 percent.
National Academy of Social Insurance
16
Using data on private carrier and state fund benefit payments and deductibles, we would then use the
estimated self-insured benefit percent to calculate self-insured benefit payments as:
bene its C bene its deductibles bene its deductibles bene its
bene its
As an example, we were not able to obtain self-insured benefits paid data for Arizona in 2016. Further,
assume the most recent year we obtained information on self-insured benefits paid data in Arizona was
2012. In 2012, Arizona’s SI benefits % was 25.0 percent. To account for trends across time in the
distribution of payments, we would multiply Arizona’s benefits in 2012 by the ratio of the national SI
benefit % in 2016 (25.6%) and 2012 (25.2%). n this example, we would estimate Arizona’s share of self-
insured benefits in 2016 as:
Using the estimated benefits in 20 6, we would then calculate Arizona’s estimated benefits as:
.2
.2
In 2016, we used this approach to estimate self-insured benefits for seven states: Arkansas, Nevada, New
York, Oklahoma, Texas, Vermont, and West Virginia.
Method 2: Estimated Using the Ratio of Self-Insured Benefits Paid to Self-Insured Payroll For the remaining 10 jurisdictions (Georgia, Illinois, Iowa, Kentucky, Louisiana, Nebraska, New Jersey,
North Carolina, Utah, and Virginia) without historical self-insured benefits paid data, we used payroll data
and self-insured benefits paid across the country. First, we estimated the share of payroll covered by self-
insured employers in these jurisdictions. Second, we weighted that share of payroll by the average
relationship of SI benefits % to SI payroll % for the jurisdictions where data were available in 2016 from
an agency source.
To estimate the share of payroll covered by self-insured employers, we rely on data from the Department
of Labor (DOL), NCCI, rating bureaus, and state agencies. The DOL provides the total non-federal payroll,
while the NCCI provides private carrier and state fund payrolls for 38 states. Rating bureaus and state
National Academy of Social Insurance
17
agencies provide payroll information specifically for workers at self-insured firms, as well as for workers
covered by private carriers and state funds in an additional 10 jurisdictions.
Total payroll C payroll payroll payroll
Subtracting private carrier and state fund payroll from total payroll gives us the estimated self-insured
payroll and the percent in relation to total payroll:
payroll payroll
Total payroll
The self-insured share of payroll provides information about the total wages of self-insured workers
relative to all wages in a particular jurisdiction. But simply using the estimated SI payroll % as a substitute
for SI benefits % is inappropriate because the relationship between the two is not one-to-one. To control
for this difference, we calculate the average relationship between SI benefits % and SI payroll % for the
jurisdictions where the information is available.
Average atio of bene its to payroll
bene its
payroll
Where = each of the 31 jurisdictions where self-insured and total benefits paid data are available, as well
as self-insured payroll amounts.
Table A.2 reports the average ratio of SI benefits % to SI payroll % for the 31 jurisdictions where the data
were available in 2016. As the table reports, the ratio was less than one in each year between 2012 and
2016. If the ratio were equal to one, that would mean that there is a one-for-one relationship between
self-insured benefits paid and payroll, so as the ratio of self-insured covered payroll increases (decreases),
the share of benefits paid by self-insured employers would increase (decrease) by a similar amount. A
ratio of less than one means that the benefits paid by self-insured employers as a fraction of total benefits
are less than their representation in the total payroll.
For each of the 10 jurisdictions where we estimate SI benefits % using this approach, we multiply the SI
payroll % of the particular state, s*, with the average ratio of SI benefits % to SI payroll % in the states
where the data is available:
National Academy of Social Insurance
18
bene its payroll
bene its
payroll
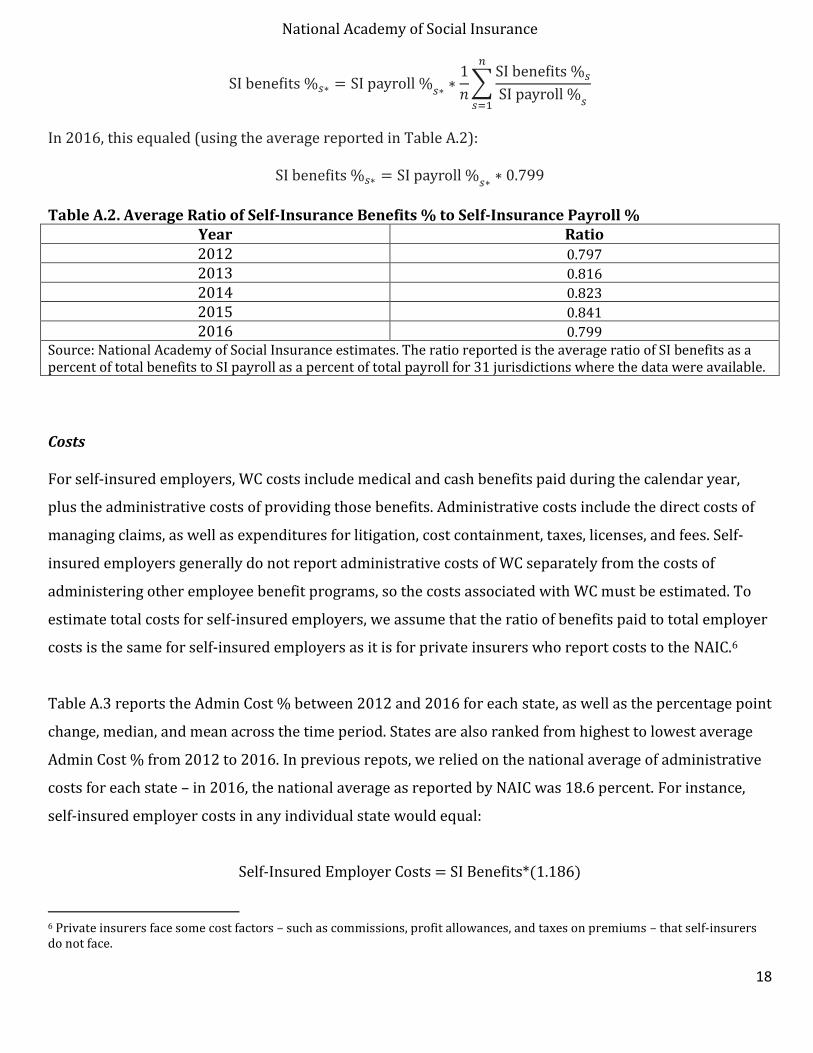
In 2016, this equaled (using the average reported in Table A.2):
bene its payroll
Table A.2. Average Ratio of Self-Insurance Benefits % to Self-Insurance Payroll % Year Ratio 2012 0.797 2013 0.816 2014 0.823 2015 0.841 2016 0.799
Source: National Academy of Social Insurance estimates. The ratio reported is the average ratio of SI benefits as a percent of total benefits to SI payroll as a percent of total payroll for 31 jurisdictions where the data were available.
Costs
For self-insured employers, WC costs include medical and cash benefits paid during the calendar year,
plus the administrative costs of providing those benefits. Administrative costs include the direct costs of
managing claims, as well as expenditures for litigation, cost containment, taxes, licenses, and fees. Self-
insured employers generally do not report administrative costs of WC separately from the costs of
administering other employee benefit programs, so the costs associated with WC must be estimated. To
estimate total costs for self-insured employers, we assume that the ratio of benefits paid to total employer
costs is the same for self-insured employers as it is for private insurers who report costs to the NAIC.6
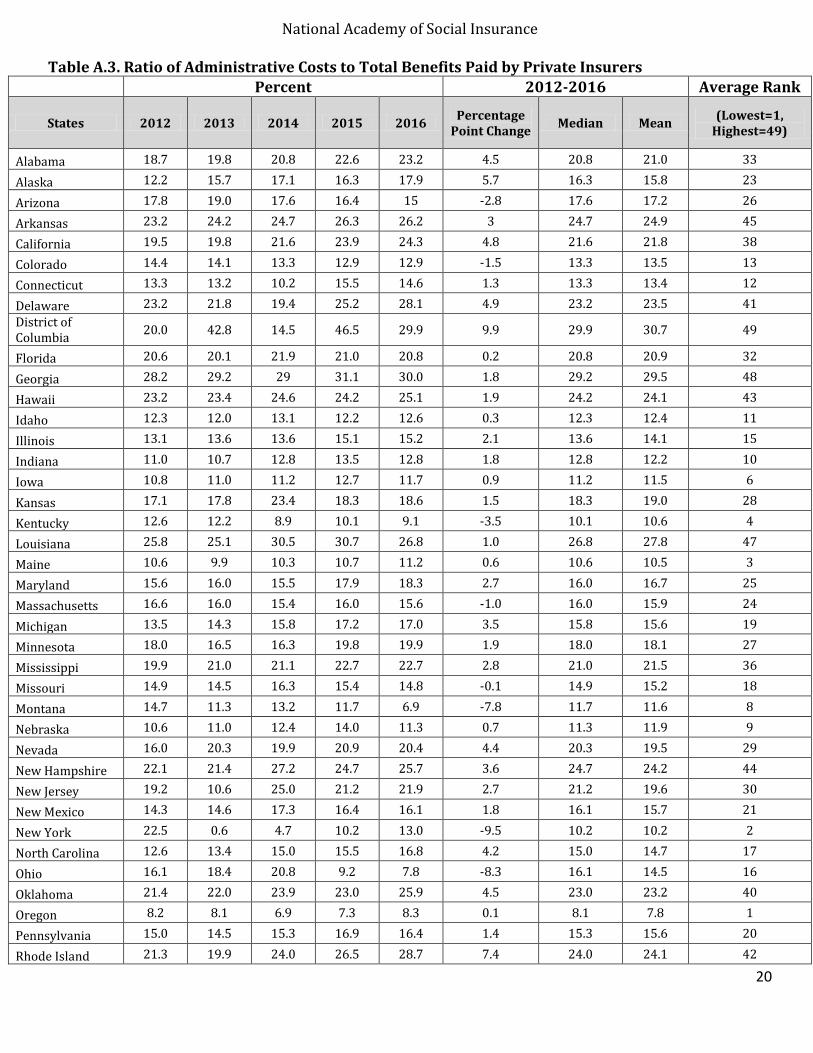
Table A.3 reports the Admin Cost % between 2012 and 2016 for each state, as well as the percentage point
change, median, and mean across the time period. States are also ranked from highest to lowest average
Admin Cost % from 2012 to 2016. In previous repots, we relied on the national average of administrative
costs for each state – in 2016, the national average as reported by NAIC was 18.6 percent. For instance,
self-insured employer costs in any individual state would equal:
6 Private insurers face some cost factors – such as commissions, profit allowances, and taxes on premiums – that self-insurers do not face.
National Academy of Social Insurance
19
However, as the Table shows, there are significant variations in administrative costs as a percent of total
benefits paid across the country. To account for these variations, and to improve our state-by-state
estimates of self-insurance employer costs, we used the state-specific administrative costs as a percent of
total benefits in 2016, with updates from 2012-2015. In the updated estimates, self-insured employer
costs equal:
Where Admin Cost % = the ratio of administrative costs to total benefits paid. The updates generated
some changes in state-by-state self-insured employer costs between 2012 and 2015, depending whether
the Admin Cost % in each state was above or below the national average. However, the impact on total
self-insured employer costs was minimal. Comparing the two approaches with 2016 data, self-insured
employer costs were less than one percent (0.05%) higher using the updated state-by-state Admin Cost %
estimates compared to using the national average Admin Cost %.7 In 2016, self-insured employer costs
represented 19.7 percent of total costs, so the impact of this change on total employer costs was
negligible.
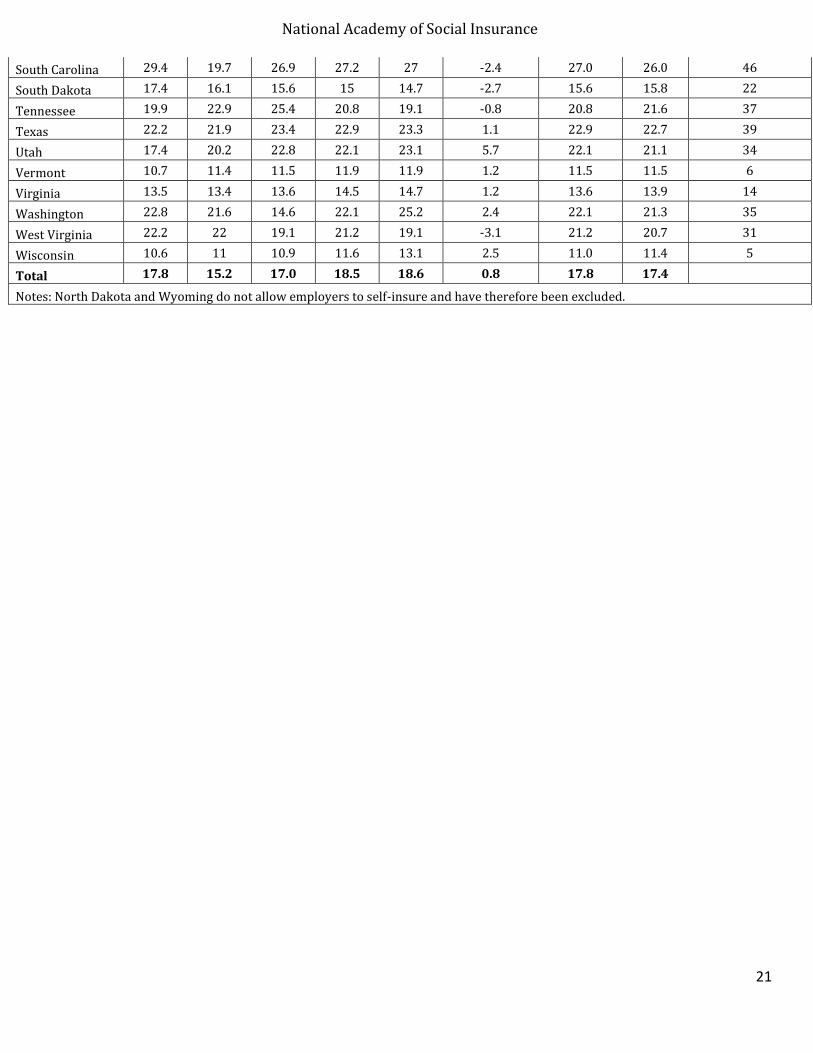
In this data there is a general trend of administrative costs increasing relative to benefits paid nationally,
as only thirteen of fifty-one jurisdictions saw this figure decrease from 2012 to 2016. The states with the
lowest average Admin Cost % across this time period were Oregon (7.8%), New York (10.2%), and Maine
(10.5%). The states with the highest average Admin Cost % were the District of Columbia (30.7%),
Georgia (29.5%), and Louisiana (27.8%). North Dakota and Wyoming are excluded from the table because
neither state allows self-insurance.
7 2016 self-insured employer costs were $17.892 billion using the updated approach. Using the old approach, self-insured employer
costs were $17.796 billion.
National Academy of Social Insurance
20
Table A.3. Ratio of Administrative Costs to Total Benefits Paid by Private Insurers Percent 2012-2016 Average Rank
States 2012 2013 2014 2015 2016 Percentage
Point Change Median Mean
(Lowest=1, Highest=49)
Alabama 18.7 19.8 20.8 22.6 23.2 4.5 20.8 21.0 33
Alaska 12.2 15.7 17.1 16.3 17.9 5.7 16.3 15.8 23
Arizona 17.8 19.0 17.6 16.4 15 -2.8 17.6 17.2 26
Arkansas 23.2 24.2 24.7 26.3 26.2 3 24.7 24.9 45
California 19.5 19.8 21.6 23.9 24.3 4.8 21.6 21.8 38
Colorado 14.4 14.1 13.3 12.9 12.9 -1.5 13.3 13.5 13
Connecticut 13.3 13.2 10.2 15.5 14.6 1.3 13.3 13.4 12
Delaware 23.2 21.8 19.4 25.2 28.1 4.9 23.2 23.5 41
District of Columbia
20.0 42.8 14.5 46.5 29.9 9.9 29.9 30.7 49
Florida 20.6 20.1 21.9 21.0 20.8 0.2 20.8 20.9 32
Georgia 28.2 29.2 29 31.1 30.0 1.8 29.2 29.5 48
Hawaii 23.2 23.4 24.6 24.2 25.1 1.9 24.2 24.1 43
Idaho 12.3 12.0 13.1 12.2 12.6 0.3 12.3 12.4 11
Illinois 13.1 13.6 13.6 15.1 15.2 2.1 13.6 14.1 15
Indiana 11.0 10.7 12.8 13.5 12.8 1.8 12.8 12.2 10
Iowa 10.8 11.0 11.2 12.7 11.7 0.9 11.2 11.5 6
Kansas 17.1 17.8 23.4 18.3 18.6 1.5 18.3 19.0 28
Kentucky 12.6 12.2 8.9 10.1 9.1 -3.5 10.1 10.6 4
Louisiana 25.8 25.1 30.5 30.7 26.8 1.0 26.8 27.8 47
Maine 10.6 9.9 10.3 10.7 11.2 0.6 10.6 10.5 3
Maryland 15.6 16.0 15.5 17.9 18.3 2.7 16.0 16.7 25
Massachusetts 16.6 16.0 15.4 16.0 15.6 -1.0 16.0 15.9 24
Michigan 13.5 14.3 15.8 17.2 17.0 3.5 15.8 15.6 19
Minnesota 18.0 16.5 16.3 19.8 19.9 1.9 18.0 18.1 27
Mississippi 19.9 21.0 21.1 22.7 22.7 2.8 21.0 21.5 36
Missouri 14.9 14.5 16.3 15.4 14.8 -0.1 14.9 15.2 18
Montana 14.7 11.3 13.2 11.7 6.9 -7.8 11.7 11.6 8
Nebraska 10.6 11.0 12.4 14.0 11.3 0.7 11.3 11.9 9
Nevada 16.0 20.3 19.9 20.9 20.4 4.4 20.3 19.5 29
New Hampshire 22.1 21.4 27.2 24.7 25.7 3.6 24.7 24.2 44
New Jersey 19.2 10.6 25.0 21.2 21.9 2.7 21.2 19.6 30
New Mexico 14.3 14.6 17.3 16.4 16.1 1.8 16.1 15.7 21
New York 22.5 0.6 4.7 10.2 13.0 -9.5 10.2 10.2 2
North Carolina 12.6 13.4 15.0 15.5 16.8 4.2 15.0 14.7 17
Ohio 16.1 18.4 20.8 9.2 7.8 -8.3 16.1 14.5 16
Oklahoma 21.4 22.0 23.9 23.0 25.9 4.5 23.0 23.2 40
Oregon 8.2 8.1 6.9 7.3 8.3 0.1 8.1 7.8 1
Pennsylvania 15.0 14.5 15.3 16.9 16.4 1.4 15.3 15.6 20
Rhode Island 21.3 19.9 24.0 26.5 28.7 7.4 24.0 24.1 42
National Academy of Social Insurance
21
South Carolina 29.4 19.7 26.9 27.2 27 -2.4 27.0 26.0 46
South Dakota 17.4 16.1 15.6 15 14.7 -2.7 15.6 15.8 22
Tennessee 19.9 22.9 25.4 20.8 19.1 -0.8 20.8 21.6 37
Texas 22.2 21.9 23.4 22.9 23.3 1.1 22.9 22.7 39
Utah 17.4 20.2 22.8 22.1 23.1 5.7 22.1 21.1 34
Vermont 10.7 11.4 11.5 11.9 11.9 1.2 11.5 11.5 6
Virginia 13.5 13.4 13.6 14.5 14.7 1.2 13.6 13.9 14
Washington 22.8 21.6 14.6 22.1 25.2 2.4 22.1 21.3 35
West Virginia 22.2 22 19.1 21.2 19.1 -3.1 21.2 20.7 31
Wisconsin 10.6 11 10.9 11.6 13.1 2.5 11.0 11.4 5
Total 17.8 15.2 17.0 18.5 18.6 0.8 17.8 17.4
Notes: North Dakota and Wyoming do not allow employers to self-insure and have therefore been excluded.
National Academy of Social Insurance
22
Second-Injury Funds, Special Funds, and Guaranty Funds Second injury funds reimburse employers or insurance carriers in cases where an employee with a pre-
existing condition related to a work-related injury experiences another work-related injury or illness. The
second injury fund pays the costs associated with the prior condition to reduce the cost burden on the
current employer. These funds encourage employers to hire workers with residual impairments who
want to return to work. The current employer is responsible only for WC benefits associated with the
second injury or illness.
Special funds administer WC benefits for specific types of workers and for workers with specific types of
injuries. For instance, there are designated funds for commercial fisherman, workers who contract
asbestosis, and certain long-term cases.
State guaranty funds ensure benefit payments to injured workers in cases where a private insurance
carrier or self-insured employer becomes insolvent and does not have sufficient assets earmarked to pay
outstanding benefits. As stated in the annual report by the National Conference of Insurance Guaranty
unds, “The purpose of state guaranty associations is to provide a mechanism for the prompt payment of
covered claims of an insolvent insurer, as those terms are defined and limited by guaranty association
statutes, so that catastrophic financial loss to certain claimants and policyholders may be avoided.” elf-
insurance guaranty funds help pay the covered WC claims of insolvent self-insurers.
Benefits
Benefits data for second in ury, guaranty, and special funds are collected through the Academy’s
questionnaire and state agency annual reports. We add these payments to the private carrier, state fund,
and self-insured benefit estimates, unless a state includes them in total benefits reported in the
questionnaire.8 Private insurance guaranty and self-insured guaranty fund benefit payments are added to
private carrier and self-insured employer benefit paid, respectively. However, second-injury and special
fund benefit payments may be paid through different types of WC coverage. To incorporate second-injury
and special fund benefit payments into our total benefits paid estimates by type of coverage, we distribute
the payments based on the share of each type of coverage in a particular jurisdiction:
8 n those cases we don’t add the special funds benefits to the carrier total, but rather just report the totals in the appendix
tables (tables A.4 through A.7). In rare cases, some states include second injury, guaranty, and/or special fund benefit paid in the total benefits paid but they do not report the specific special fund payments separately. In those cases, second injury, guaranty, and special fund benefit payments are included in total benefits, but we are unable to report separate information on the total amount of benefits paid in tables A.4 through A.7.
National Academy of Social Insurance
23
rivate Carrier Bene its aid C bene its deductibles bene its
tate und Bene its aid bene its deductibles
elf nsured Bene its aid bene its bene its
Where PC = Private Carrier, IGF = Insurance Guaranty Fund, SIF = Second Injury Fund, SPF = Special Fund,
SF = State Fund, SI = Self-Insured, SIGF = Self-Insured Guaranty Fund, and = all benefits
paid for a particular jurisdiction not including any benefits paid through second-injury, guaranty, or
special funds. C benefits and benefits are equal to the “losses” reported by A.M. Best or benefits
paid by a particular state agency.
Twenty-seven states provided data on second injury fund (SIF) benefits paid in 2016. We estimated SIF
benefits in three additional states: Connecticut, Massachusetts, and Oklahoma.9 Nineteen states provided
data on special fund benefits paid in 2016. Twenty-five states provided data for insurance guaranty funds
and we estimated benefits paid for IGFs in 3 additional states: Delaware, Georgia, and Iowa. Eleven states
provided the data for self-insurance guaranty funds.
Costs
Generally, the benefits reported in the Academy’s report for second in ury, special funds, and guaranty
funds have corresponding employer costs reported in state premiums. However, in some cases,
assessments are levied on the carriers, which are not included in the A.M. Best premiums. We obtain these
assessments by reviewing state agency annual reports. These assessments are typically less than one
percent of the total employer costs, and they are distributed across carrier costs and reported in the
Academy’s estimates of employer costs.
Trends
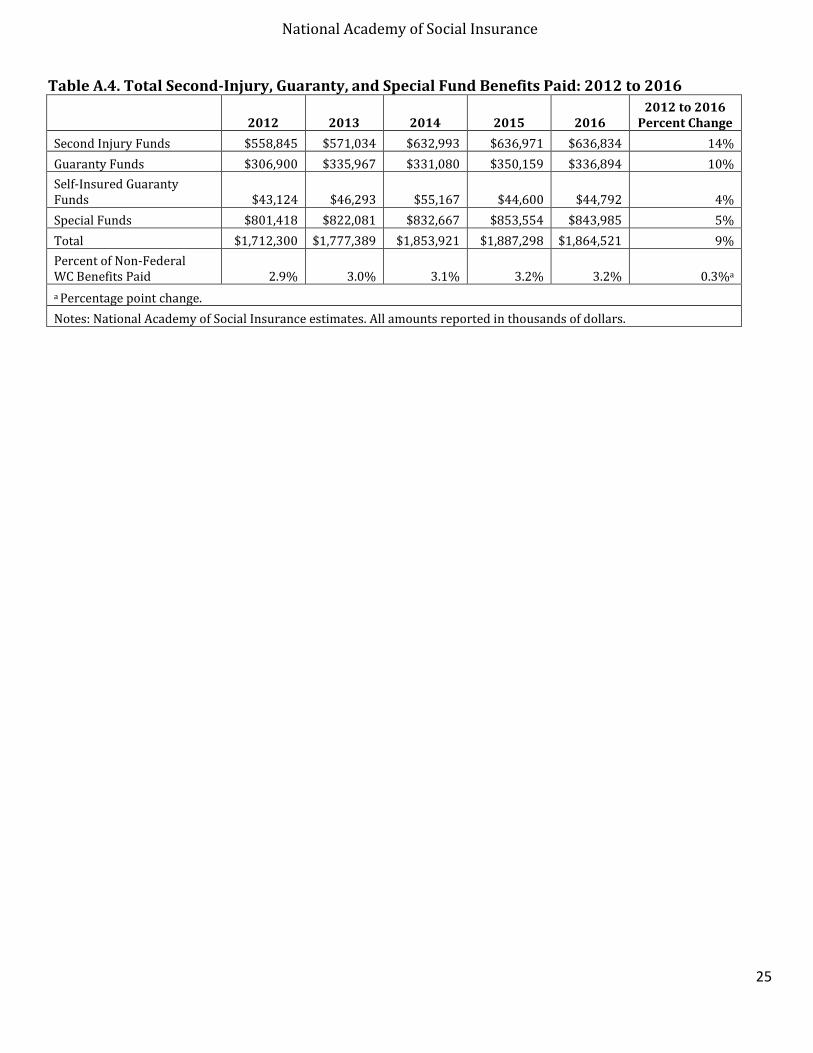
Table A.4 reports total benefits paid for second injury, guaranty, and special funds between 2012 and
2016, the percent change from 2012 to 2016, and the percent of non-federal WC benefits paid. Benefits
paid for each type of fund increased between 2012 and 2016, with the total amount increasing from
9 Benefits paid by SIF, IGF, SIGF, and Special Funds are estimated using a linear trend from the previous five years.
National Academy of Social Insurance
24
roughly $1.71 billion in 2012 to approximately $1.86 billion in 2016. As a percent of non-federal WC
benefits paid, total fund payments increased from 2.9 percent to 3.2 percent over the same time period.
Among second-injury, guaranty, and special funds, the amount of benefits paid through second injury
funds (SIFs) increased the most (14%) between 2012 and 2016. The total amount of benefits paid
through SIFs increased from approximately $560 million in 2012 to just under $640 million in 2016. This
increase was driven by three of the four highest payers of SIF benefits (Missouri, Oklahoma, and
Louisiana) that experienced increases of 141, 153, and 59 percent, respectively. Combined, these states,
accounted for roughly one third of all SIF benefits paid in the country in 2016.
Benefits paid by State Insurance Guaranty Funds (IGFs) increased by 10 percent from 2012 to 2016. The
10 percent increase was heavily influenced by California’s , which accounted for 68.3 and 69.8 percent
of total IGF benefits in 2012 and 2016, respectively. Across this time-period, California’s IGF benefits
increase 12.1 percent. Not including California in the totals, IGF benefits increased by 5 percent in the
rest of the country between 2012 and 2016. As a percent of total non-federal WC benefits paid, 0.58
percent were paid by IGFs in 2016, up from 0.52 percent in 2012.
Self-insured guaranty fund (SIGF) benefits paid grew 4 percent between 2012 and 2016. From 2012 to
2016 SIGF benefits accounted for, on average, 0.079 percent of total benefits paid in the country.
California accounts for the largest share of total SIGF benefits in the country (62% and 36% of total SIGF
benefits in 2012 and 2016, respectively), and has experienced a decline of 39.6 percent in SIGF benefits
paid from 2012 to 2016. Excluding California, SIGF benefits paid in the rest of the U.S. increased 73.6
percent between 2012 and 2016.
Special fund benefits increased 5 percent from approximately $801 million to just under $845 million
over the relevant time period. Special fund totals in the country are driven primarily by Washington
state, which accounted for 49.6 percent and 56.6 percent of total special fund benefits in 2012 and 2016,
respectively. Over this period special fund benefits grew by 20.1 percent in Washington. Excluding
Washington state, special fund benefits paid declined 9.2 percent between 2012 and 2016 in the rest of
the country.
National Academy of Social Insurance
25
Table A.4. Total Second-Injury, Guaranty, and Special Fund Benefits Paid: 2012 to 2016
2012 2013 2014 2015 2016 2012 to 2016
Percent Change
Second Injury Funds $558,845 $571,034 $632,993 $636,971 $636,834 14%
Guaranty Funds $306,900 $335,967 $331,080 $350,159 $336,894 10%
Self-Insured Guaranty Funds $43,124 $46,293 $55,167 $44,600 $44,792 4%
Special Funds $801,418 $822,081 $832,667 $853,554 $843,985 5%
Total $1,712,300 $1,777,389 $1,853,921 $1,887,298 $1,864,521 9%
Percent of Non-Federal WC Benefits Paid 2.9% 3.0% 3.1% 3.2% 3.2% 0.3%a
a Percentage point change.
Notes: National Academy of Social Insurance estimates. All amounts reported in thousands of dollars.
National Academy of Social Insurance
26
Table A.5. Second Injury Funds Benefits Paid: 2012-2016. States 2012 2013 2014 2015 2016 Alabama — — — — — Alaska 3,256,900 3,373,995 3,064,978 3,001,912 2,519,717 Arizona 5,046,616 12,897,789 7,990,097 13,558,406 15,019,611 Arkansas 204,296 115,648 58,790 41,801 19,062 California 25,087,243 25,255,379 21,139,856 30,404,590 36,459,223 Colorado 1,434,062 1,469,436 1,510,151 1,345,833 1,127,540 Connecticut 29,835,968 32,770,625 30,336,842 27,379,362 28,821,149 Delaware 6,124,660 6,232,213 5,627,534 5,241,759 5,470,162 District of Columbia — — — — — Florida — — — — — Georgia 101,025,780 95,040,308 99,496,245 62,677,246 36,034,190 Hawaii — — — — — Idaho 4,270,305 3,976,434 4,099,996 3,982,833 4,269,903 Illinois 1,198,890 1,148,025 1,180,230 1,162,917 1,179,053 Indiana 5,811,218 5,811,434 6,667,762 6,681,691 6,406,273 Iowa 1,486,172 1,177,065 1,486,172 1,081,077 1,148,874 Kansas 3,595,219 4,536,373 4,557,872 3,159,095 2,999,460 Kentucky — — — — — Louisiana 37,755,535 32,394,616 45,379,348 49,353,057 60,127,056 Maine — — — — — Maryland 23,108,148 24,491,198 24,537,182 22,850,038 20,798,760 Massachusetts 25,498,989 27,633,506 29,574,919 29,351,130 31,945,484 Michigan 11,391,765 11,281,023 10,894,132 9,332,114 8,535,897 Minnesota 11,207,525 8,557,539 9,274,204 7,846,019 7,512,181 Mississippi 118,291 90,717 17,108 30,126 30,126 Missouri 40,870,648 41,106,502 72,296,314 102,502,910 98,300,695 Montana 857,085 1,120,192 862,423 789,419 1,681,417 Nebraska 289,477 265,390 249,041 236,122 215,229 Nevada — — — — — New Hampshire — — — — — New Jersey 182,400,000 186,000,000 188,000,000 189,000,000 189,600,000 New Mexico 1,335,617 1,572,372 2,088,158 3,057,331 1,155,986 New York — — — — — North Carolina — — — — — North Dakota — — — — — Ohio — — — — — Oklahoma 26,066,478 32,781,159 52,673,756 54,309,756 65,824,558 Oregon — — — — — Pennsylvania 190,424 190,424 193,585 178,375 180,092 Rhode Island 2,034,380 1,937,799 1,821,135 1,379,427 1,297,637 South Carolina — — — — — South Dakota — — — — — Tennessee 5,886,318 5,480,899 4,718,346 4,125,628 4,416,672 Texas — — — — — Utah — — — — — Vermont — — — — — Virginia — — — — — Washington 74,000 53,000 40,000 15,000 7,000 West Virginia — — — — — Wisconsin 1,383,396 2,273,406 3,157,137 2,895,748 2,450,885 Wyoming — — — — —
National Academy of Social Insurance
27
Table A.6. Special Funds Benefits Paid: 2012-2016. States 2012 2013 2014 2015 2016 Alabama — — — — — Alaska 1,190,475 1,230,169 1,683,600 1,284,827 2,821,346 Arizona — — — — — Arkansas 15,557,205 16,081,386 15,121,275 14,662,692 14,688,397 California 34,622,781 29,209,585 31,618,140 29,694,555 26,196,185 Colorado 5,695,772 4,981,928 4,861,201 4,932,787 3,573,252 Connecticut — — — — — Delaware — — — — — District of Columbia 3,701,814 2,394,505 3,133,681 3,924,692 3,911,461 Florida 59,950,000 58,100,000 60,000,000 55,011,195 42,073,710 Georgia — — — — — Hawaii 15,722,545 14,775,964 16,444,051 13,418,977 12,466,407 Idaho — — — — — Illinois 1,145,479 1,655,873 1,426,547 1,922,420 1,748,910 Indiana — — — — — Iowa — — — — — Kansas — — — — — Kentucky 62,039,860 61,398,728 62,210,387 60,350,085 59,860,078 Louisiana — — — — — Maine — — — — — Maryland — — — — — Massachusetts 6,865,554 7,292,030 8,141,968 7,767,156 7,960,745 Michigan — — — — — Minnesota 45,216,828 48,432,361 41,229,185 36,321,005 38,473,403 Mississippi — — — — — Missouri — — — — — Montana 721,769 659,535 1,010,081 576,176 639,991 Nebraska — — — — — Nevada — — — — — New Hampshire — — — — — New Jersey 700,000 2,000,000 300,000 1,300,000 1,000,000 New Mexico — — — — — New York — — — — — North Carolina — — — — — North Dakota — — — — — Ohio — — — — — Oklahoma — — — — — Oregon 78,745,797 77,516,735 73,958,945 71,112,195 67,890,870 Pennsylvania 26,882,744 29,060,616 34,098,055 33,185,721 34,462,303 Rhode Island — — — — — South Carolina — — — — — South Dakota — — — — — Tennessee — — — — — Texas — — — — — Utah 18,695,984 17,334,185 17,334,185 16,692,674 15,997,122 Vermont — — — — — Virginia 5,027,812 4,100,000 4,100,000 4,200,000 4,200,000 Washington 397,706,000 418,072,000 428,558,000 469,920,000 477,455,000 West Virginia 17,330,397 23,539,415 24,306,276 23,349,482 28,439,312 Wisconsin 3,899,021 4,246,010 3,131,419 3,927,214 2,954,900 Wyoming — — — — —
National Academy of Social Insurance
28
Table A.7. Guaranty Funds Benefits Paid: 2012-2016. States 2012 2013 2014 2015 2016 Alabama — — — — — Alaska 3,301,357 3,959,367 3,044,742 6,774,885 1,072,995 Arizona — — — — — Arkansas 432,056 246,809 329,912 523,428 363,265 California 209,664,331 232,738,620 248,615,108 238,985,686 235,038,492 Colorado 4,315,669 3,772,652 3,080,857 2,974,358 3,096,110 Connecticut 6,678,961 5,230,375 1,821,036 4,998,107 5,131,510 Delaware 1,069,654 1,173,693 2,377,105 2,043,662 2,646,573 District of Columbia 694,634 917,050 199,897 678,750 187,168 Florida — — — — — Georgia 13,051,742 14,134,584 13,589,797 12,727,231 12,681,180 Hawaii — — — — — Idaho 509,612 1,112,018 738,404 445,657 394,768 Illinois — — — — — Indiana 199,797 188,045 436,224 812,914 207,552 Iowa 656,377 681,444 934,834 993,412 1,171,544 Kansas 1,541,562 1,657,102 2,144,820 2,255,151 1,556,467 Kentucky — — — — — Louisiana — — — — — Maine 3,395,744 1,626,790 421,780 2,628,261 2,938,027 Maryland — — — — — Massachusetts 5,244,244 8,099,206 2,320,400 9,299,350 7,738,210 Michigan — — — 4,320,400 4,270,200 Minnesota 10,358,343 9,409,476 10,245,317 8,764,994 8,890,936 Mississippi — — — — — Missouri — — — — — Montana 3,291,108 2,738,622 2,189,548 1,843,859 2,554,956 Nebraska 584,603 855,066 1,061,266 1,847,026 840,236 Nevada — — — — — New Hampshire 2,149,716 1,336,363 575,850 1,182,317 1,220,334 New Jersey 13,291,622 13,831,172 11,696,758 16,907,253 16,751,325 New Mexico 1,647,396 — — — — New York — — — — — North Carolina — — — — — North Dakota — — — — — Ohio — — — — — Oklahoma — — — — — Oregon 1,476,444 2,139,721 1,959,696 2,040,075 2,977,795 Pennsylvania — — — — — Rhode Island 688,527 801,019 203,272 812,654 1,065,822 South Carolina 2,345,459 2,807,328 6,551,000 4,875,659 3,943,057 South Dakota — — — — — Tennessee — — — — — Texas 14,117,769 16,821,093 13,922,018 15,078,104 12,908,343 Utah — — — — — Vermont 885,089 1,846,549 292,125 1,491,401 863,434 Virginia 5,294,351 7,629,491 1,932,463 5,470,138 5,876,529 Washington 0 191,091 344,539 346,015 498,951 West Virginia 0 3,761 18,914 18,914 0 Wisconsin — — — — — Wyoming 13,668 18,761 32,421 12,686 8,391
National Academy of Social Insurance
29
Table A.8. Self-Insurance Guaranty Funds Paid Benefits: 2012-2016. States 2012 2013 2014 2015 2016 Alabama — — — — — Alaska — — — — — Arizona — — — — — Arkansas — — — — — California 26,571,455 27,439,077 31,807,966 19,734,362 16,047,784 Colorado 293,051 474,786 277,205 179,845 148,907 Connecticut — — — — — Delaware — — — — — District of Columbia — — — — — Florida — — — — — Georgia 3,348,253 3,688,884 4,471,247 5,593,574 6,256,592 Hawaii — — — — — Idaho — — — — — Illinois 1,824,690 1,307,469 1,343,693 1,216,653 1,007,399 Indiana — — — — — Iowa — — — — — Kansas — — — — — Kentucky — — — — — Louisiana — — — — — Maine — — — — — Maryland — — — — — Massachusetts — — — — — Michigan 4,581,110 3,949,422 6,591,323 6,982,742 5,441,269 Minnesota 3,134,152 2,898,902 2,602,565 2,662,271 2,449,172 Mississippi — — — — — Missouri 304,010 928,879 1,700,040 333,193 1,457,629 Montana — — — — — Nebraska — — — — — Nevada — — — — — New Hampshire — — — — — New Jersey — — — — — New Mexico — — — — — New York — — — — — North Carolina — — — — — North Dakota — — — — — Ohio — — — — — Oklahoma — — — — — Oregon 910,276 392,098 483,209 707,319 273,243 Pennsylvania 1,384,215 3,596,183 4,747,110 3,513,555 5,696,915 Rhode Island — — — — — South Carolina — — — — — South Dakota — — — — — Tennessee — — — — — Texas — — — — — Utah — — — — — Vermont — — — — — Virginia — — — — — Washington 327,000 663,000 120,000 836,000 470,000 West Virginia 446,268 954,250 1,022,621 2,840,269 5,542,769 Wisconsin — — — — — Wyoming — — — — —
National Academy of Social Insurance
30
Medical Benefits We relied on medical benefits as a percent of total benefits (Medical Benefit %) from NCCI in 38 out of 51
jurisdictions (indicated in Table A.1). In the remaining 13 states, we used agency reported data.
Wisconsin represents a unique case because it is not an NCCI state, so we have to rely on agency provided
data to estimate the Medical Benefit %, but the WI Dept. of Workforce Development, ivision of Workers’
Compensation only provides cash benefits paid and does not track medical payments. To estimate medical
benefits in WI, we subtracted the cash benefits provided by the WI state agency from total benefits as
reported by A.M. Best (which includes medical and cash benefits). In 2016, this approach yielded a
Medical Benefit % in Wisconsin of 78.2 percent, the highest in the country.
For comparison, Belton (2018) analyzed data representing percent of Wisconsin’s claims in 20 6
evaluated in 2017. 10 The study found that, for claims made in 2014 at 36 months maturity, the Medical
Benefit % was 72 (excluding benefit delivery expenses). Additionally, for 2016/17 claims at 12 months
maturity, the Medical Benefit % was 74.11 The study also found that the average medical cost per claim in
Wisconsin was 58 and 51 percent higher than the 18 state median for 12 month and 36 month maturity
claims, respectively. Additionally, the Health Care Cost Institute compared care bundles in 41 jurisdictions
in 2015, and found costs in Wisconsin to be 81 percent higher than the national average.12
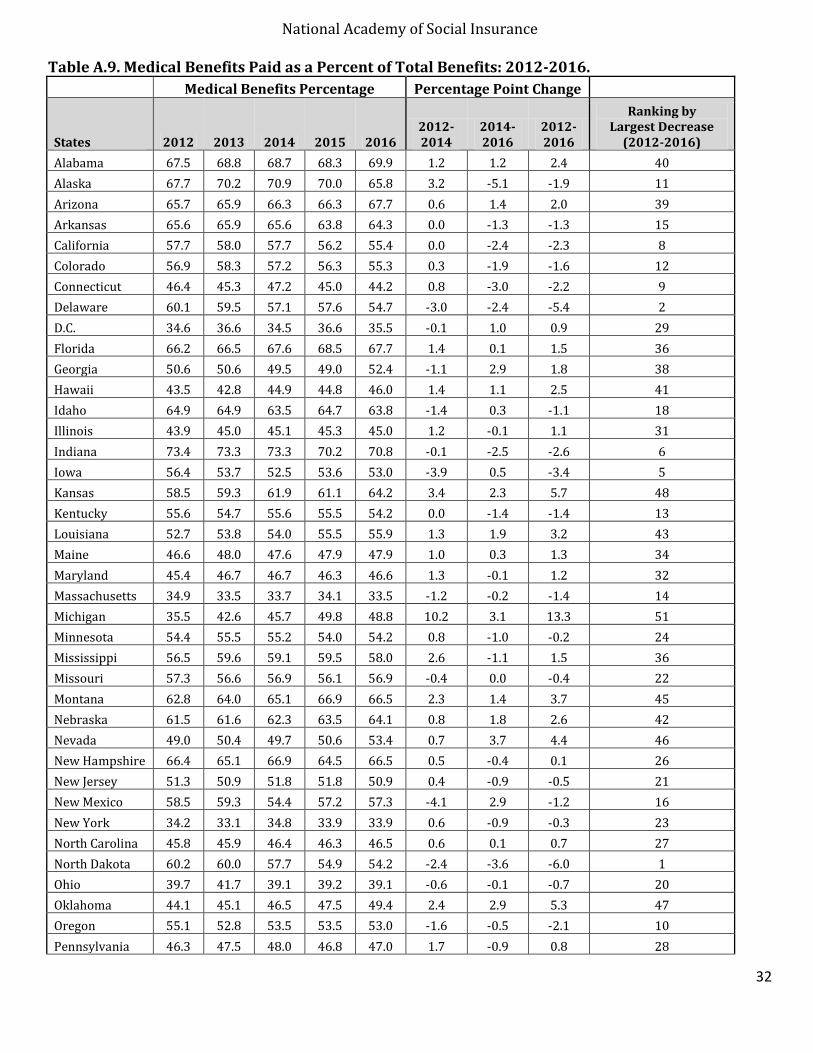
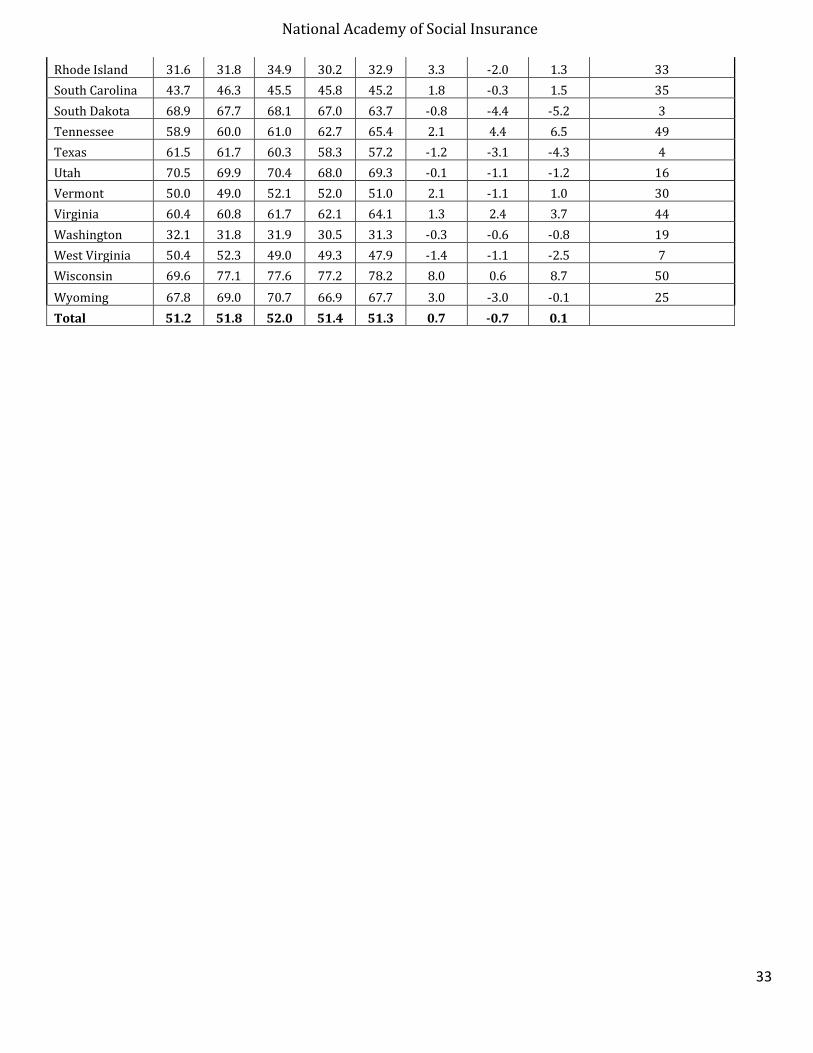
Table A.9 reports the Medical Benefit % in each state between 2012 and 2016, along with percentage
point changes and rankings by the largest percentage point decline over the time-period. It is important to
note that many factors in a state can influence the relative share of benefits for medical care as opposed to
cash benefits. A high or low Medical Benefit % is not necessarily a positive or negative outcome. Some of
the key factors that influence this ratio include:
Differences in cash benefits levels
ifferences in medical costs, medical practices, and the role of workers’ compensation programs in
regulating allowable medical costs with the use of fee schedules and other mechanisms
10 Belton, Sharon E. 2018. CompScopeTM Benchmarks for Wisconsin, April 2018, WC-18- 6. Workers’ Compensation esearch Institute. Cambridge, MA. 11 This estimate included benefit delivery expenses which could not be partialed-out because the percent of total benefits was not given. If we assume, conservatively, a 5 percent benefit delivery expense, the Medical Benefit % would be roughly 78 percent for these claims. 12 Health Care Cost nstitute. 20 6. “National Chartbook of Health Care rices—20 .” Washington, C.
National Academy of Social Insurance
31
Differences in prevalence of lump-sum settlements which can obscure ultimate medical costs
Differences in the role of the state agency, statutes, and case law in defining the limits of medical
necessity
Difference in the industry/occupation mix in each state, which influences the types of illnesses and
injuries that occur, and thus the level of medical costs.
As Table A.9 shows, nationally there was very little change in Medical Benefit % between 2012 and 2016,
but there was substantial variation at the state-level.
National Academy of Social Insurance
32
Table A.9. Medical Benefits Paid as a Percent of Total Benefits: 2012-2016. Medical Benefits Percentage Percentage Point Change
States 2012 2013 2014 2015 2016 2012- 2014
2014- 2016
2012- 2016
Ranking by Largest Decrease
(2012-2016)
Alabama 67.5 68.8 68.7 68.3 69.9 1.2 1.2 2.4 40
Alaska 67.7 70.2 70.9 70.0 65.8 3.2 -5.1 -1.9 11
Arizona 65.7 65.9 66.3 66.3 67.7 0.6 1.4 2.0 39
Arkansas 65.6 65.9 65.6 63.8 64.3 0.0 -1.3 -1.3 15
California 57.7 58.0 57.7 56.2 55.4 0.0 -2.4 -2.3 8
Colorado 56.9 58.3 57.2 56.3 55.3 0.3 -1.9 -1.6 12
Connecticut 46.4 45.3 47.2 45.0 44.2 0.8 -3.0 -2.2 9
Delaware 60.1 59.5 57.1 57.6 54.7 -3.0 -2.4 -5.4 2
D.C. 34.6 36.6 34.5 36.6 35.5 -0.1 1.0 0.9 29
Florida 66.2 66.5 67.6 68.5 67.7 1.4 0.1 1.5 36
Georgia 50.6 50.6 49.5 49.0 52.4 -1.1 2.9 1.8 38
Hawaii 43.5 42.8 44.9 44.8 46.0 1.4 1.1 2.5 41
Idaho 64.9 64.9 63.5 64.7 63.8 -1.4 0.3 -1.1 18
Illinois 43.9 45.0 45.1 45.3 45.0 1.2 -0.1 1.1 31
Indiana 73.4 73.3 73.3 70.2 70.8 -0.1 -2.5 -2.6 6
Iowa 56.4 53.7 52.5 53.6 53.0 -3.9 0.5 -3.4 5
Kansas 58.5 59.3 61.9 61.1 64.2 3.4 2.3 5.7 48
Kentucky 55.6 54.7 55.6 55.5 54.2 0.0 -1.4 -1.4 13
Louisiana 52.7 53.8 54.0 55.5 55.9 1.3 1.9 3.2 43
Maine 46.6 48.0 47.6 47.9 47.9 1.0 0.3 1.3 34
Maryland 45.4 46.7 46.7 46.3 46.6 1.3 -0.1 1.2 32
Massachusetts 34.9 33.5 33.7 34.1 33.5 -1.2 -0.2 -1.4 14
Michigan 35.5 42.6 45.7 49.8 48.8 10.2 3.1 13.3 51
Minnesota 54.4 55.5 55.2 54.0 54.2 0.8 -1.0 -0.2 24
Mississippi 56.5 59.6 59.1 59.5 58.0 2.6 -1.1 1.5 36
Missouri 57.3 56.6 56.9 56.1 56.9 -0.4 0.0 -0.4 22
Montana 62.8 64.0 65.1 66.9 66.5 2.3 1.4 3.7 45
Nebraska 61.5 61.6 62.3 63.5 64.1 0.8 1.8 2.6 42
Nevada 49.0 50.4 49.7 50.6 53.4 0.7 3.7 4.4 46
New Hampshire 66.4 65.1 66.9 64.5 66.5 0.5 -0.4 0.1 26
New Jersey 51.3 50.9 51.8 51.8 50.9 0.4 -0.9 -0.5 21
New Mexico 58.5 59.3 54.4 57.2 57.3 -4.1 2.9 -1.2 16
New York 34.2 33.1 34.8 33.9 33.9 0.6 -0.9 -0.3 23
North Carolina 45.8 45.9 46.4 46.3 46.5 0.6 0.1 0.7 27
North Dakota 60.2 60.0 57.7 54.9 54.2 -2.4 -3.6 -6.0 1
Ohio 39.7 41.7 39.1 39.2 39.1 -0.6 -0.1 -0.7 20
Oklahoma 44.1 45.1 46.5 47.5 49.4 2.4 2.9 5.3 47
Oregon 55.1 52.8 53.5 53.5 53.0 -1.6 -0.5 -2.1 10
Pennsylvania 46.3 47.5 48.0 46.8 47.0 1.7 -0.9 0.8 28
National Academy of Social Insurance
33
Rhode Island 31.6 31.8 34.9 30.2 32.9 3.3 -2.0 1.3 33
South Carolina 43.7 46.3 45.5 45.8 45.2 1.8 -0.3 1.5 35
South Dakota 68.9 67.7 68.1 67.0 63.7 -0.8 -4.4 -5.2 3
Tennessee 58.9 60.0 61.0 62.7 65.4 2.1 4.4 6.5 49
Texas 61.5 61.7 60.3 58.3 57.2 -1.2 -3.1 -4.3 4
Utah 70.5 69.9 70.4 68.0 69.3 -0.1 -1.1 -1.2 16
Vermont 50.0 49.0 52.1 52.0 51.0 2.1 -1.1 1.0 30
Virginia 60.4 60.8 61.7 62.1 64.1 1.3 2.4 3.7 44
Washington 32.1 31.8 31.9 30.5 31.3 -0.3 -0.6 -0.8 19
West Virginia 50.4 52.3 49.0 49.3 47.9 -1.4 -1.1 -2.5 7
Wisconsin 69.6 77.1 77.6 77.2 78.2 8.0 0.6 8.7 50
Wyoming 67.8 69.0 70.7 66.9 67.7 3.0 -3.0 -0.1 25
Total 51.2 51.8 52.0 51.4 51.3 0.7 -0.7 0.1
National Academy of Social Insurance
34
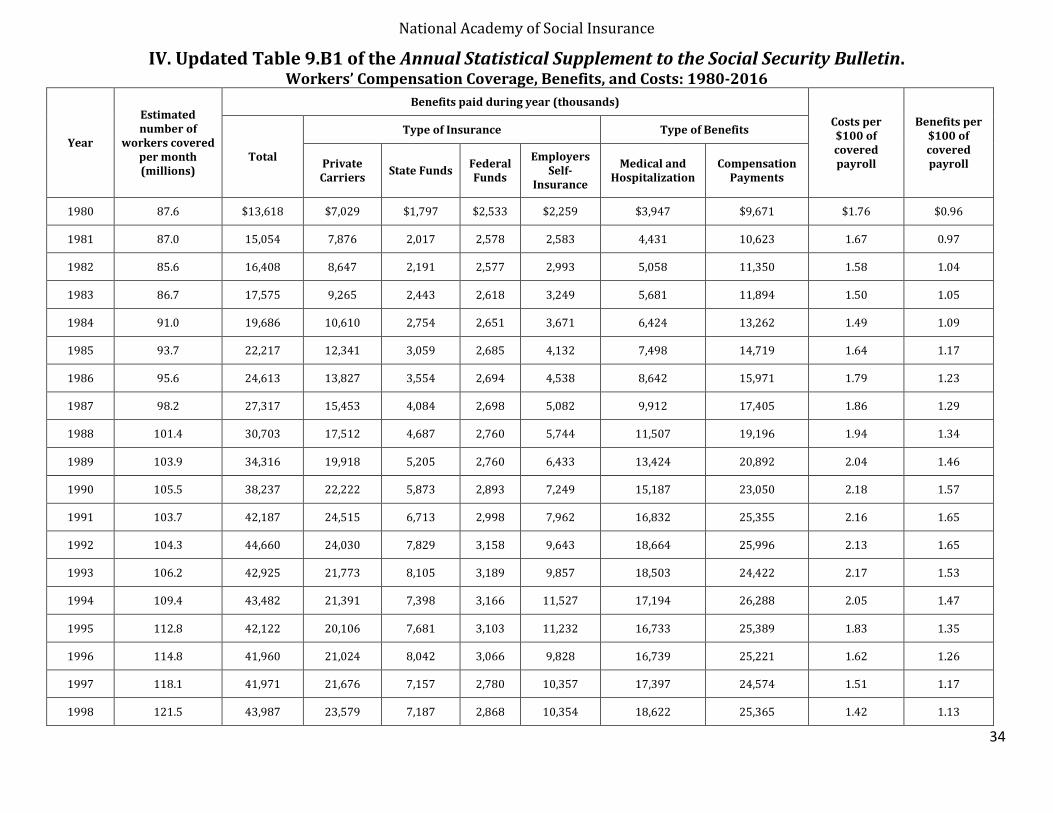
IV. Updated Table 9.B1 of the Annual Statistical Supplement to the Social Security Bulletin. Workers’ Compensation Coverage, Benefits, and Costs: 1980-2016
Year
Estimated number of
workers covered per month (millions)
Benefits paid during year (thousands)
Costs per $100 of covered payroll
Benefits per $100 of covered payroll
Total
Type of Insurance Type of Benefits
Private Carriers
State Funds Federal Funds
Employers Self-
Insurance
Medical and Hospitalization
Compensation Payments
1980 87.6 $13,618 $7,029 $1,797 $2,533 $2,259 $3,947 $9,671 $1.76 $0.96
1981 87.0 15,054 7,876 2,017 2,578 2,583 4,431 10,623 1.67 0.97
1982 85.6 16,408 8,647 2,191 2,577 2,993 5,058 11,350 1.58 1.04
1983 86.7 17,575 9,265 2,443 2,618 3,249 5,681 11,894 1.50 1.05
1984 91.0 19,686 10,610 2,754 2,651 3,671 6,424 13,262 1.49 1.09
1985 93.7 22,217 12,341 3,059 2,685 4,132 7,498 14,719 1.64 1.17
1986 95.6 24,613 13,827 3,554 2,694 4,538 8,642 15,971 1.79 1.23
1987 98.2 27,317 15,453 4,084 2,698 5,082 9,912 17,405 1.86 1.29
1988 101.4 30,703 17,512 4,687 2,760 5,744 11,507 19,196 1.94 1.34
1989 103.9 34,316 19,918 5,205 2,760 6,433 13,424 20,892 2.04 1.46
1990 105.5 38,237 22,222 5,873 2,893 7,249 15,187 23,050 2.18 1.57
1991 103.7 42,187 24,515 6,713 2,998 7,962 16,832 25,355 2.16 1.65
1992 104.3 44,660 24,030 7,829 3,158 9,643 18,664 25,996 2.13 1.65
1993 106.2 42,925 21,773 8,105 3,189 9,857 18,503 24,422 2.17 1.53
1994 109.4 43,482 21,391 7,398 3,166 11,527 17,194 26,288 2.05 1.47
1995 112.8 42,122 20,106 7,681 3,103 11,232 16,733 25,389 1.83 1.35
1996 114.8 41,960 21,024 8,042 3,066 9,828 16,739 25,221 1.62 1.26
1997 118.1 41,971 21,676 7,157 2,780 10,357 17,397 24,574 1.51 1.17
1998 121.5 43,987 23,579 7,187 2,868 10,354 18,622 25,365 1.42 1.13
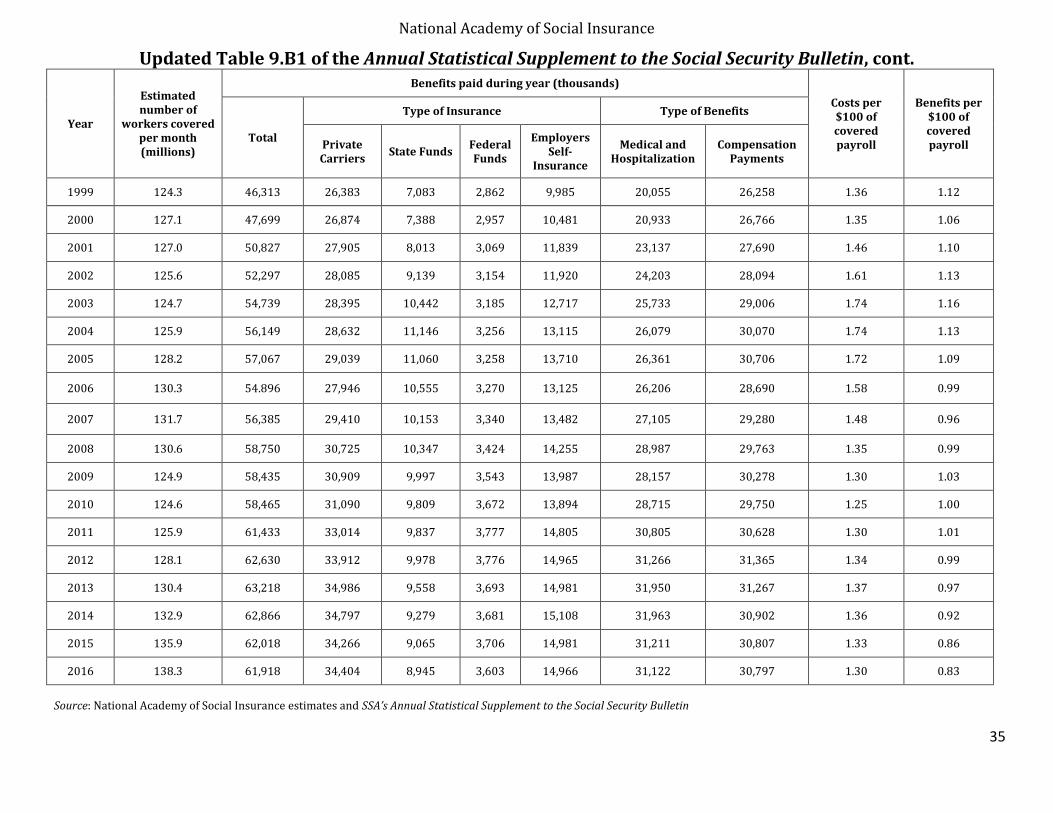
National Academy of Social Insurance
35
Updated Table 9.B1 of the Annual Statistical Supplement to the Social Security Bulletin, cont.
Year
Estimated number of
workers covered per month (millions)
Benefits paid during year (thousands)
Costs per $100 of covered payroll
Benefits per $100 of covered payroll
Total
Type of Insurance Type of Benefits
Private Carriers
State Funds Federal Funds
Employers Self-
Insurance
Medical and Hospitalization
Compensation Payments
1999 124.3 46,313 26,383 7,083 2,862 9,985 20,055 26,258 1.36 1.12
2000 127.1 47,699 26,874 7,388 2,957 10,481 20,933 26,766 1.35 1.06
2001 127.0 50,827 27,905 8,013 3,069 11,839 23,137 27,690 1.46 1.10
2002 125.6 52,297 28,085 9,139 3,154 11,920 24,203 28,094 1.61 1.13
2003 124.7 54,739 28,395 10,442 3,185 12,717 25,733 29,006 1.74 1.16
2004 125.9 56,149 28,632 11,146 3,256 13,115 26,079 30,070 1.74 1.13
2005 128.2 57,067 29,039 11,060 3,258 13,710 26,361 30,706 1.72 1.09
2006 130.3 54.896 27,946 10,555 3,270 13,125 26,206 28,690 1.58 0.99
2007 131.7 56,385 29,410 10,153 3,340 13,482 27,105 29,280 1.48 0.96
2008 130.6 58,750 30,725 10,347 3,424 14,255 28,987 29,763 1.35 0.99
2009 124.9 58,435 30,909 9,997 3,543 13,987 28,157 30,278 1.30 1.03
2010 124.6 58,465 31,090 9,809 3,672 13,894 28,715 29,750 1.25 1.00
2011 125.9 61,433 33,014 9,837 3,777 14,805 30,805 30,628 1.30 1.01
2012 128.1 62,630 33,912 9,978 3,776 14,965 31,266 31,365 1.34 0.99
2013 130.4 63,218 34,986 9,558 3,693 14,981 31,950 31,267 1.37 0.97
2014 132.9 62,866 34,797 9,279 3,681 15,108 31,963 30,902 1.36 0.92
2015 135.9 62,018 34,266 9,065 3,706 14,981 31,211 30,807 1.33 0.86
2016 138.3 61,918 34,404 8,945 3,603 14,966 31,122 30,797 1.30 0.83
Source: National Academy of Social Insurance estimates and SSA’s Annual Statistical Supplement to the Social Security Bulletin
National Academy of Social Insurance
36
V. State Summary Tables This section provides data summary tables for each state. The State Summary Table: 2012-2016 reports
the following for each state for each year between 2012 and 2016:
Covered workers
Covered wages
Benefits paid by type of coverage (private carrier, self-insurance, state-fund)
Total benefits paid
Medical benefits (percent of total)
Benefits per $100 of covered payroll
Costs by type of coverage (private carrier, self-insurance, state-fund)
Total employer costs
Costs per $100 of covered payroll
Please note that totals may not add up due to rounding. Benefits paid through second injury, guaranty,
and special funds are apportioned to private carrier, state fund, and self-insured benefits paid as
described in Section III above.
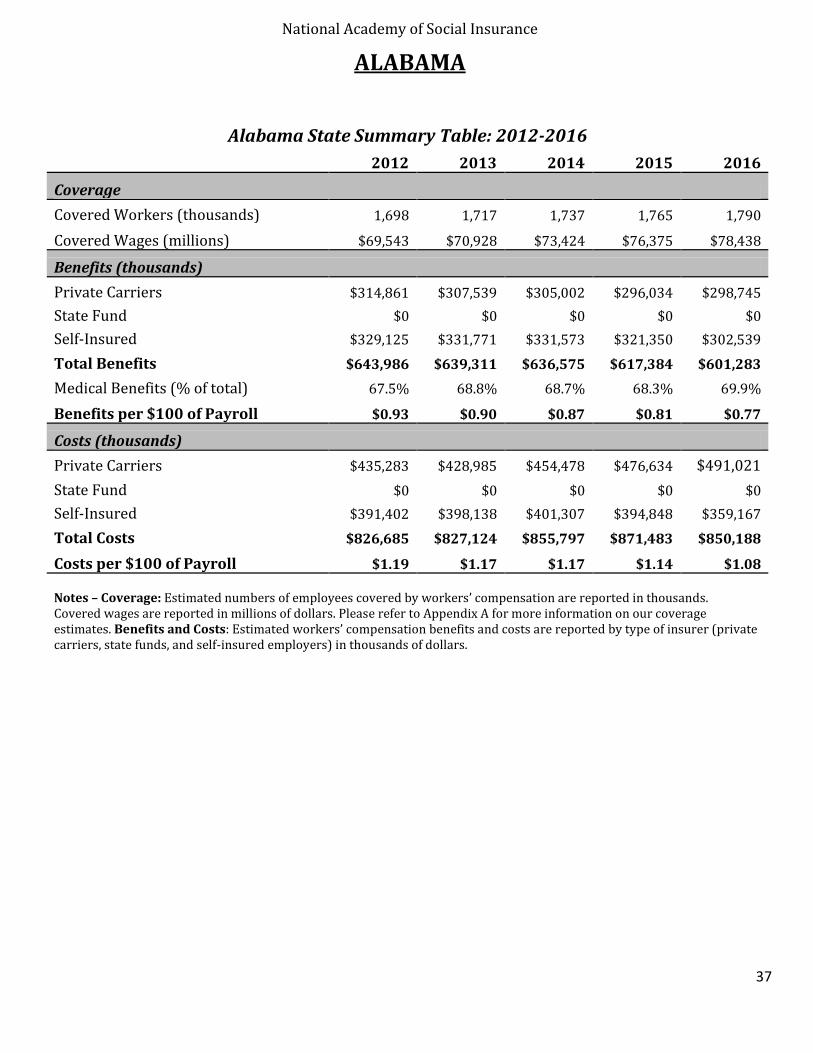
National Academy of Social Insurance
37
ALABAMA
Alabama State Summary Table: 2012-2016
2012 2013 2014 2015 2016
Coverage
Covered Workers (thousands) 1,698 1,717 1,737 1,765 1,790
Covered Wages (millions) $69,543 $70,928 $73,424 $76,375 $78,438
Benefits (thousands)
Private Carriers $314,861 $307,539 $305,002 $296,034 $298,745
State Fund $0 $0 $0 $0 $0
Self-Insured $329,125 $331,771 $331,573 $321,350 $302,539
Total Benefits $643,986 $639,311 $636,575 $617,384 $601,283
Medical Benefits (% of total) 67.5% 68.8% 68.7% 68.3% 69.9%
Benefits per $100 of Payroll $0.93 $0.90 $0.87 $0.81 $0.77
Costs (thousands)
Private Carriers $435,283 $428,985 $454,478 $476,634 $491,021
State Fund $0 $0 $0 $0 $0
Self-Insured $391,402 $398,138 $401,307 $394,848 $359,167
Total Costs $826,685 $827,124 $855,797 $871,483 $850,188
Costs per $100 of Payroll $1.19 $1.17 $1.17 $1.14 $1.08
Notes – Coverage: Estimated numbers of employees covered by workers’ compensation are reported in thousands. Covered wages are reported in millions of dollars. Please refer to Appendix A for more information on our coverage estimates. Benefits and Costs: Estimated workers’ compensation benefits and costs are reported by type of insurer (private carriers, state funds, and self-insured employers) in thousands of dollars.
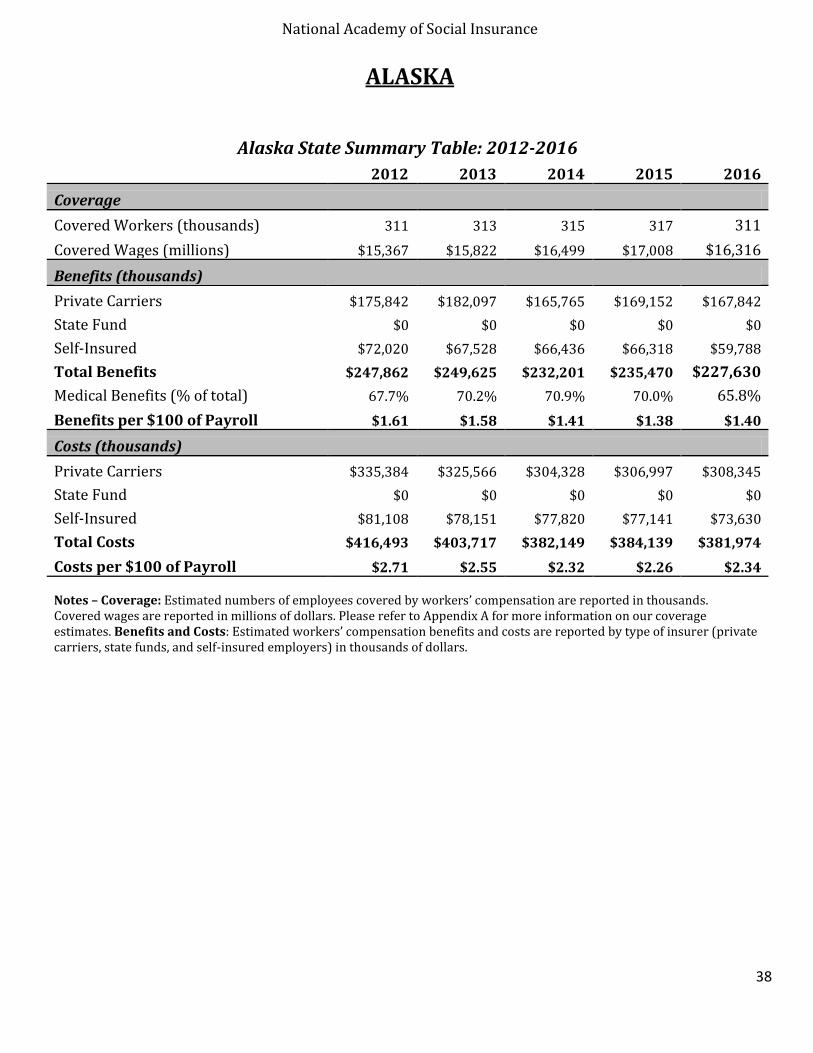
National Academy of Social Insurance
38
ALASKA
Alaska State Summary Table: 2012-2016
2012 2013 2014 2015 2016
Coverage
Covered Workers (thousands) 311 313 315 317 311
Covered Wages (millions) $15,367 $15,822 $16,499 $17,008 $16,316
Benefits (thousands)
Private Carriers $175,842 $182,097 $165,765 $169,152 $167,842
State Fund $0 $0 $0 $0 $0
Self-Insured $72,020 $67,528 $66,436 $66,318 $59,788
Total Benefits $247,862 $249,625 $232,201 $235,470 $227,630
Medical Benefits (% of total) 67.7% 70.2% 70.9% 70.0% 65.8%
Benefits per $100 of Payroll $1.61 $1.58 $1.41 $1.38 $1.40
Costs (thousands)
Private Carriers $335,384 $325,566 $304,328 $306,997 $308,345
State Fund $0 $0 $0 $0 $0
Self-Insured $81,108 $78,151 $77,820 $77,141 $73,630
Total Costs $416,493 $403,717 $382,149 $384,139 $381,974
Costs per $100 of Payroll $2.71 $2.55 $2.32 $2.26 $2.34
Notes – Coverage: Estimated numbers of employees covered by workers’ compensation are reported in thousands. Covered wages are reported in millions of dollars. Please refer to Appendix A for more information on our coverage estimates. Benefits and Costs: Estimated workers’ compensation benefits and costs are reported by type of insurer private carriers, state funds, and self-insured employers) in thousands of dollars.
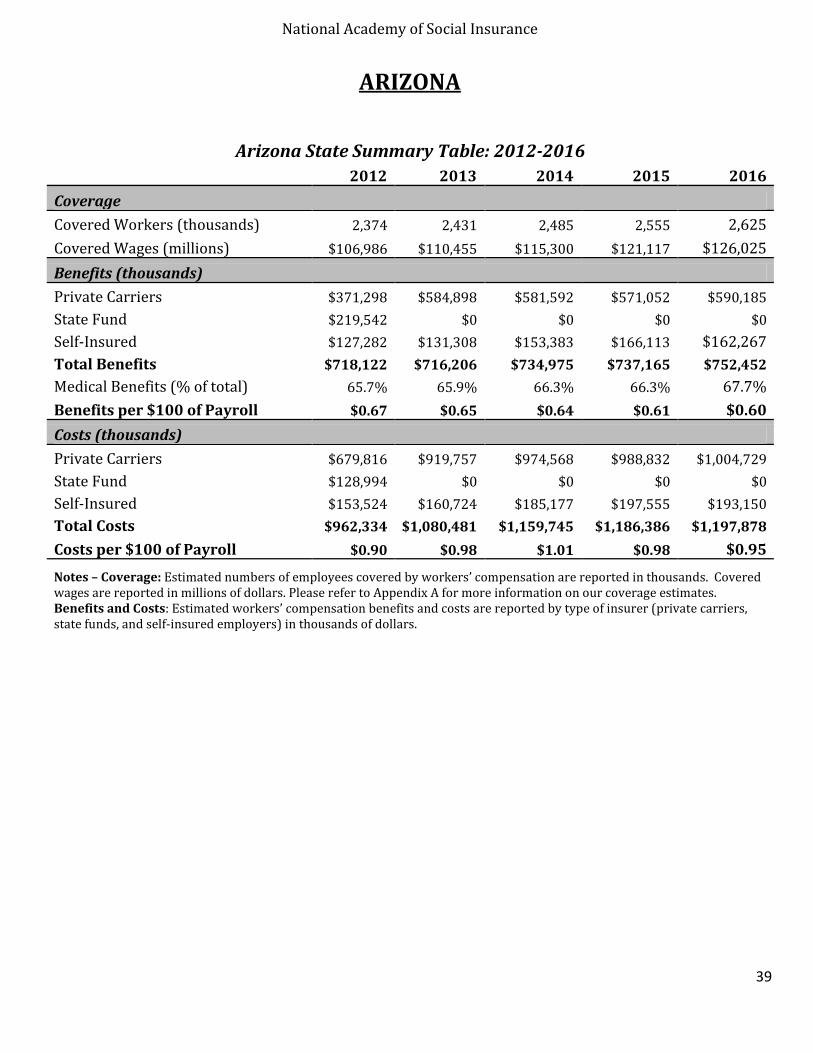
National Academy of Social Insurance
39
ARIZONA
Arizona State Summary Table: 2012-2016
2012 2013 2014 2015 2016
Coverage
Covered Workers (thousands) 2,374 2,431 2,485 2,555 2,625
Covered Wages (millions) $106,986 $110,455 $115,300 $121,117 $126,025
Benefits (thousands)
Private Carriers $371,298 $584,898 $581,592 $571,052 $590,185
State Fund $219,542 $0 $0 $0 $0
Self-Insured $127,282 $131,308 $153,383 $166,113 $162,267
Total Benefits $718,122 $716,206 $734,975 $737,165 $752,452
Medical Benefits (% of total) 65.7% 65.9% 66.3% 66.3% 67.7%
Benefits per $100 of Payroll $0.67 $0.65 $0.64 $0.61 $0.60
Costs (thousands)
Private Carriers $679,816 $919,757 $974,568 $988,832 $1,004,729
State Fund $128,994 $0 $0 $0 $0
Self-Insured $153,524 $160,724 $185,177 $197,555 $193,150
Total Costs $962,334 $1,080,481 $1,159,745 $1,186,386 $1,197,878
Costs per $100 of Payroll $0.90 $0.98 $1.01 $0.98 $0.95
Notes – Coverage: Estimated numbers of employees covered by workers’ compensation are reported in thousands. Covered wages are reported in millions of dollars. Please refer to Appendix A for more information on our coverage estimates. Benefits and Costs: Estimated workers’ compensation benefits and costs are reported by type of insurer (private carriers, state funds, and self-insured employers) in thousands of dollars.
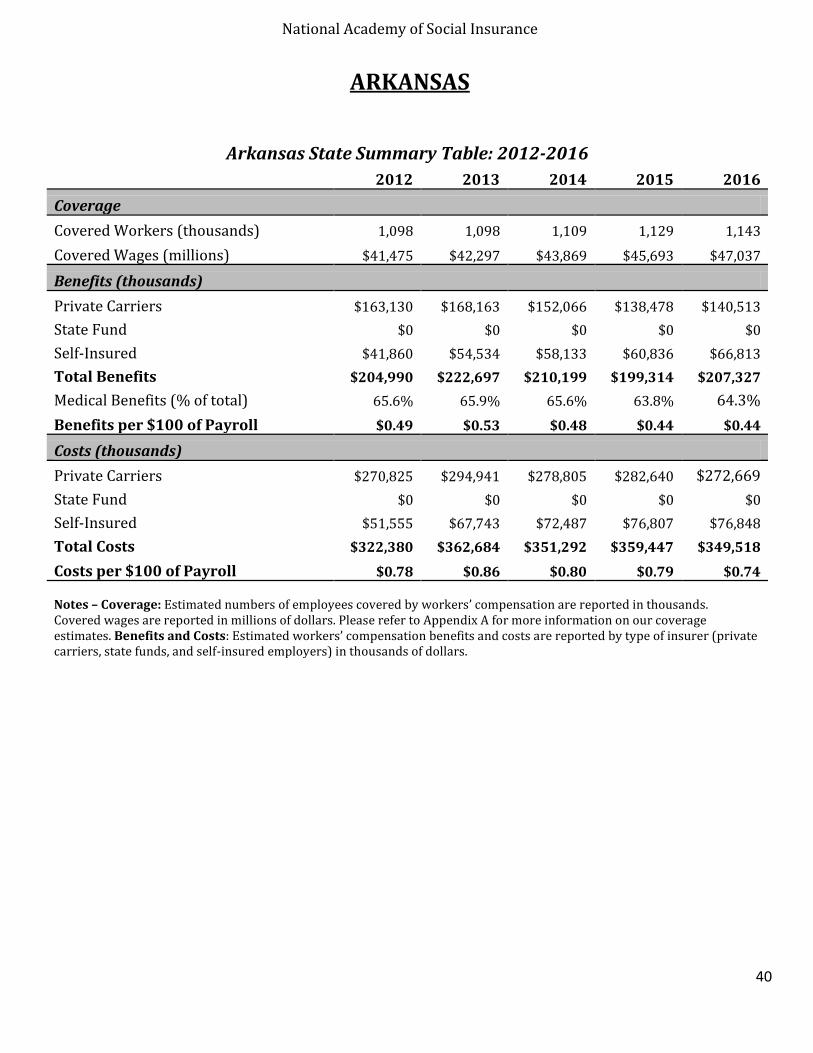
National Academy of Social Insurance
40
ARKANSAS
Arkansas State Summary Table: 2012-2016
2012 2013 2014 2015 2016
Coverage
Covered Workers (thousands) 1,098 1,098 1,109 1,129 1,143
Covered Wages (millions) $41,475 $42,297 $43,869 $45,693 $47,037
Benefits (thousands)
Private Carriers $163,130 $168,163 $152,066 $138,478 $140,513
State Fund $0 $0 $0 $0 $0
Self-Insured $41,860 $54,534 $58,133 $60,836 $66,813
Total Benefits $204,990 $222,697 $210,199 $199,314 $207,327
Medical Benefits (% of total) 65.6% 65.9% 65.6% 63.8% 64.3%
Benefits per $100 of Payroll $0.49 $0.53 $0.48 $0.44 $0.44
Costs (thousands)
Private Carriers $270,825 $294,941 $278,805 $282,640 $272,669
State Fund $0 $0 $0 $0 $0
Self-Insured $51,555 $67,743 $72,487 $76,807 $76,848
Total Costs $322,380 $362,684 $351,292 $359,447 $349,518
Costs per $100 of Payroll $0.78 $0.86 $0.80 $0.79 $0.74
Notes – Coverage: Estimated numbers of employees covered by workers’ compensation are reported in thousands. Covered wages are reported in millions of dollars. Please refer to Appendix A for more information on our coverage estimates. Benefits and Costs: Estimated workers’ compensation benefits and costs are reported by type of insurer (private carriers, state funds, and self-insured employers) in thousands of dollars.
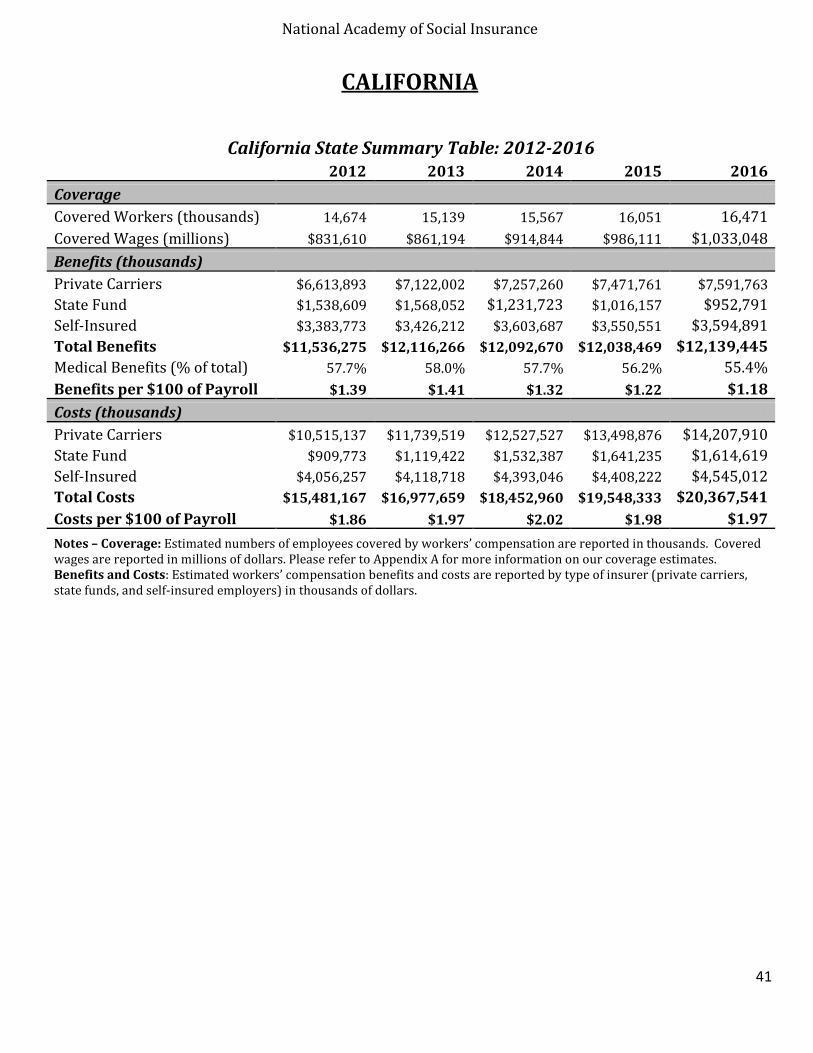
National Academy of Social Insurance
41
CALIFORNIA
California State Summary Table: 2012-2016 2012 2013 2014 2015 2016
Coverage
Covered Workers (thousands) 14,674 15,139 15,567 16,051 16,471
Covered Wages (millions) $831,610 $861,194 $914,844 $986,111 $1,033,048
Benefits (thousands)
Private Carriers $6,613,893 $7,122,002 $7,257,260 $7,471,761 $7,591,763
State Fund $1,538,609 $1,568,052 $1,231,723 $1,016,157 $952,791
Self-Insured $3,383,773 $3,426,212 $3,603,687 $3,550,551 $3,594,891
Total Benefits $11,536,275 $12,116,266 $12,092,670 $12,038,469 $12,139,445
Medical Benefits (% of total) 57.7% 58.0% 57.7% 56.2% 55.4%
Benefits per $100 of Payroll $1.39 $1.41 $1.32 $1.22 $1.18
Costs (thousands)
Private Carriers $10,515,137 $11,739,519 $12,527,527 $13,498,876 $14,207,910
State Fund $909,773 $1,119,422 $1,532,387 $1,641,235 $1,614,619
Self-Insured $4,056,257 $4,118,718 $4,393,046 $4,408,222 $4,545,012
Total Costs $15,481,167 $16,977,659 $18,452,960 $19,548,333 $20,367,541
Costs per $100 of Payroll $1.86 $1.97 $2.02 $1.98 $1.97
Notes – Coverage: Estimated numbers of employees covered by workers’ compensation are reported in thousands. Covered wages are reported in millions of dollars. Please refer to Appendix A for more information on our coverage estimates. Benefits and Costs: Estimated workers’ compensation benefits and costs are reported by type of insurer (private carriers, state funds, and self-insured employers) in thousands of dollars.
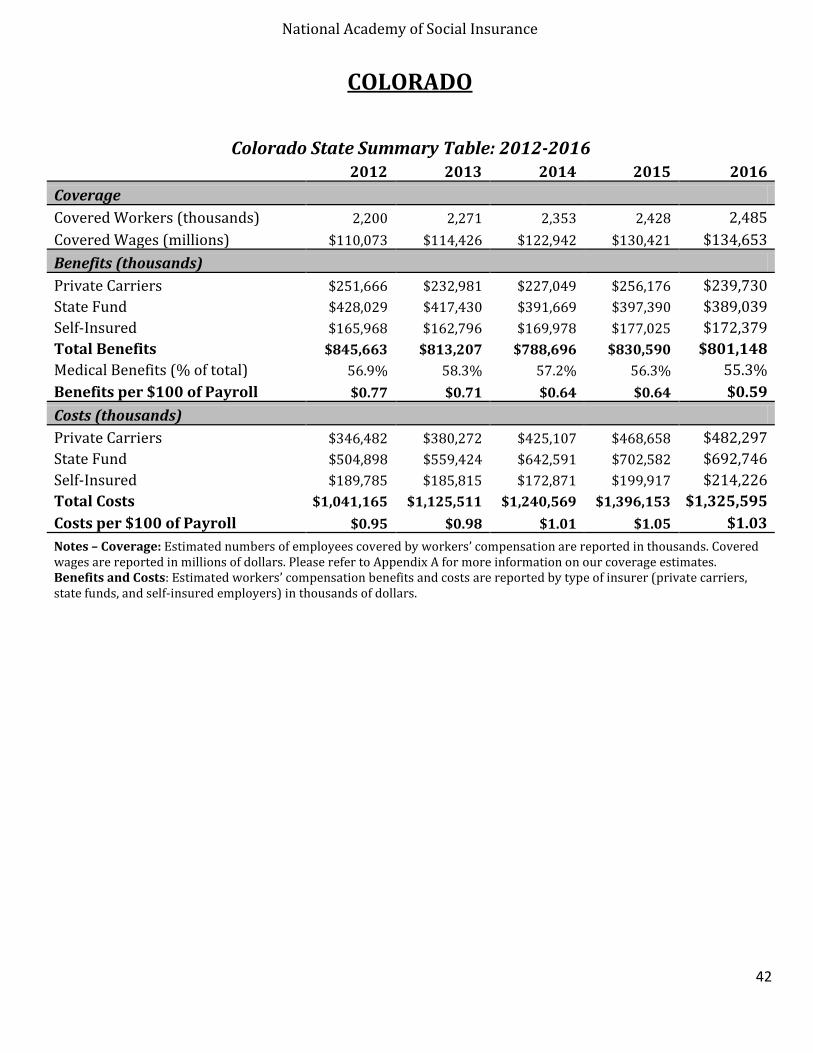
National Academy of Social Insurance
42
COLORADO
Colorado State Summary Table: 2012-2016 2012 2013 2014 2015 2016
Coverage
Covered Workers (thousands) 2,200 2,271 2,353 2,428 2,485
Covered Wages (millions) $110,073 $114,426 $122,942 $130,421 $134,653
Benefits (thousands)
Private Carriers $251,666 $232,981 $227,049 $256,176 $239,730
State Fund $428,029 $417,430 $391,669 $397,390 $389,039
Self-Insured $165,968 $162,796 $169,978 $177,025 $172,379
Total Benefits $845,663 $813,207 $788,696 $830,590 $801,148
Medical Benefits (% of total) 56.9% 58.3% 57.2% 56.3% 55.3%
Benefits per $100 of Payroll $0.77 $0.71 $0.64 $0.64 $0.59
Costs (thousands)
Private Carriers $346,482 $380,272 $425,107 $468,658 $482,297
State Fund $504,898 $559,424 $642,591 $702,582 $692,746
Self-Insured $189,785 $185,815 $172,871 $199,917 $214,226
Total Costs $1,041,165 $1,125,511 $1,240,569 $1,396,153 $1,325,595
Costs per $100 of Payroll $0.95 $0.98 $1.01 $1.05 $1.03
Notes – Coverage: Estimated numbers of employees covered by workers’ compensation are reported in thousands. Covered wages are reported in millions of dollars. Please refer to Appendix A for more information on our coverage estimates. Benefits and Costs: Estimated workers’ compensation benefits and costs are reported by type of insurer private carriers, state funds, and self-insured employers) in thousands of dollars.
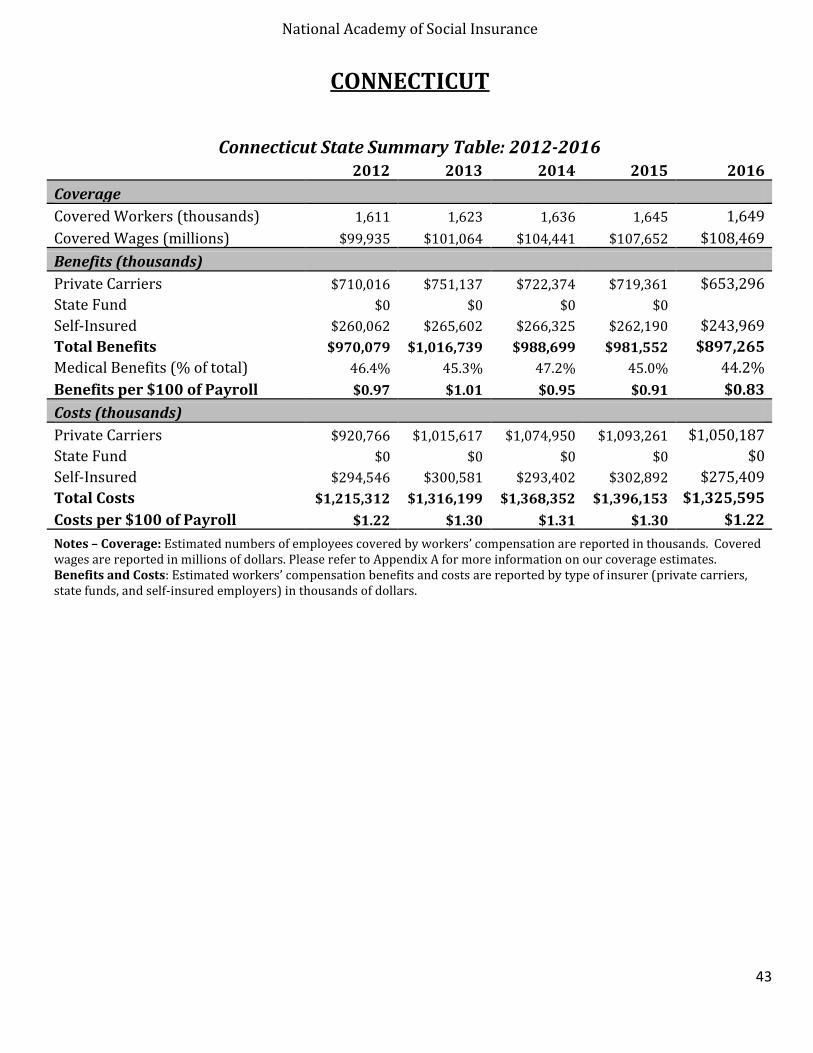
National Academy of Social Insurance
43
CONNECTICUT
Connecticut State Summary Table: 2012-2016 2012 2013 2014 2015 2016
Coverage
Covered Workers (thousands) 1,611 1,623 1,636 1,645 1,649
Covered Wages (millions) $99,935 $101,064 $104,441 $107,652 $108,469
Benefits (thousands)
Private Carriers $710,016 $751,137 $722,374 $719,361 $653,296
State Fund $0 $0 $0 $0 Self-Insured $260,062 $265,602 $266,325 $262,190 $243,969
Total Benefits $970,079 $1,016,739 $988,699 $981,552 $897,265
Medical Benefits (% of total) 46.4% 45.3% 47.2% 45.0% 44.2%
Benefits per $100 of Payroll $0.97 $1.01 $0.95 $0.91 $0.83
Costs (thousands)
Private Carriers $920,766 $1,015,617 $1,074,950 $1,093,261 $1,050,187
State Fund $0 $0 $0 $0 $0
Self-Insured $294,546 $300,581 $293,402 $302,892 $275,409
Total Costs $1,215,312 $1,316,199 $1,368,352 $1,396,153 $1,325,595
Costs per $100 of Payroll $1.22 $1.30 $1.31 $1.30 $1.22
Notes – Coverage: Estimated numbers of employees covered by workers’ compensation are reported in thousands. Covered wages are reported in millions of dollars. Please refer to Appendix A for more information on our coverage estimates. Benefits and Costs: Estimated workers’ compensation benefits and costs are reported by type of insurer (private carriers, state funds, and self-insured employers) in thousands of dollars.

National Academy of Social Insurance
44
DELAWARE
Delaware State Summary Table: 2012-2016 2012 2013 2014 2015 2016
Coverage
Covered Workers (thousands) 398 407 417 427 432
Covered Wages (millions) $20,553 $21,108 $22,104 $22,963 $23,117
Benefits (thousands)
Private Carriers $178,795 $193,163 $199,431 $176,352 $173,119
State Fund $0 $0 $0 $0 $0
Self-Insured $37,793 $47,150 $49,954 $51,888 $51,813
Total Benefits $216,588 $240,313 $249,385 $228,240 $224,932
Medical Benefits (% of total) 60.1% 59.5% 57.1% 57.6% 54.7%
Benefits per $100 of Payroll $1.05 $1.14 $1.13 $0.99 $0.97
Costs (thousands)
Private Carriers $208,740 $245,583 $255,940 $261,468 $270,969
State Fund $0 $0 $0 $0 $0
Self-Insured $47,836 $59,632 $62,001 $67,170 $61,337
Total Costs $256,577 $305,215 $318,288 $328,637 $332,306
Costs per $100 of Payroll $1.25 $1.45 $1.44 $1.43 $1.44
Notes – Coverage: Estimated numbers of employees covered by workers’ compensation are reported in thousands. Covered wages are reported in millions of dollars. Please refer to Appendix A for more information on our coverage estimates. Benefits and Costs: Estimated workers’ compensation benefits and costs are reported by type of insurer (private carriers, state funds, and self-insured employers) in thousands of dollars.
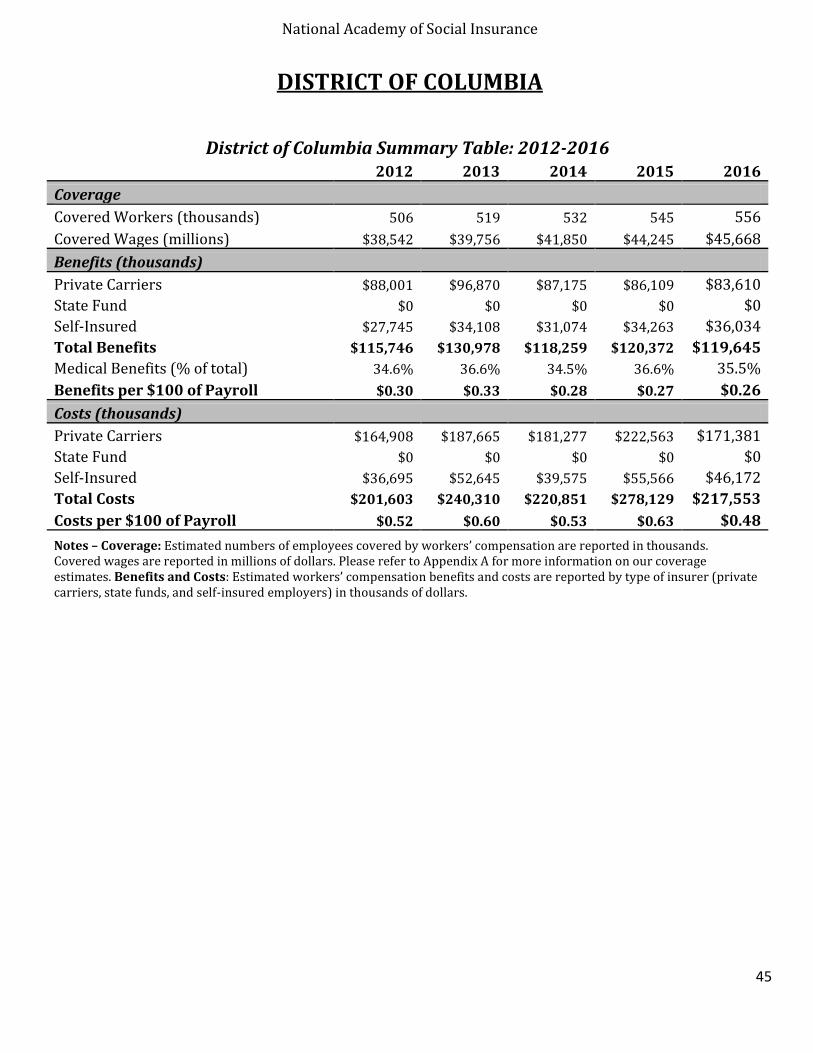
National Academy of Social Insurance
45
DISTRICT OF COLUMBIA
District of Columbia Summary Table: 2012-2016 2012 2013 2014 2015 2016
Coverage
Covered Workers (thousands) 506 519 532 545 556
Covered Wages (millions) $38,542 $39,756 $41,850 $44,245 $45,668
Benefits (thousands)
Private Carriers $88,001 $96,870 $87,175 $86,109 $83,610
State Fund $0 $0 $0 $0 $0
Self-Insured $27,745 $34,108 $31,074 $34,263 $36,034
Total Benefits $115,746 $130,978 $118,259 $120,372 $119,645
Medical Benefits (% of total) 34.6% 36.6% 34.5% 36.6% 35.5%
Benefits per $100 of Payroll $0.30 $0.33 $0.28 $0.27 $0.26
Costs (thousands)
Private Carriers $164,908 $187,665 $181,277 $222,563 $171,381
State Fund $0 $0 $0 $0 $0
Self-Insured $36,695 $52,645 $39,575 $55,566 $46,172
Total Costs $201,603 $240,310 $220,851 $278,129 $217,553
Costs per $100 of Payroll $0.52 $0.60 $0.53 $0.63 $0.48
Notes – Coverage: Estimated numbers of employees covered by workers’ compensation are reported in thousands. Covered wages are reported in millions of dollars. Please refer to Appendix A for more information on our coverage estimates. Benefits and Costs: Estimated workers’ compensation benefits and costs are reported by type of insurer (private carriers, state funds, and self-insured employers) in thousands of dollars.

National Academy of Social Insurance
46
FLORIDA
Florida State Summary Table: 2012-2016 2012 2013 2014 2015 2016
Coverage
Covered Workers (thousands) 6,866 7,045 7,278 7,561 7,821
Covered Wages (millions) $293,327 $304,273 $322,822 $346,215 $364,415
Benefits (thousands)
Private Carriers $2,440,740 $2,485,084 $2,432,184 $2,268,778 $2,255,451
State Fund $0 $0 $0 $0 $0
Self-Insured $941,057 $950,478 $938,915 $919,389 $919,633
Total Benefits $3,381,798 $3,435,562 $3,371,100 $3,188,167 $3,175,084
Medical Benefits (% of total) 66.2% 66.5% 67.6% 68.5% 67.7%
Benefits per $100 of Payroll $1.15 $1.13 $1.04 $0.92 $0.87
Costs (thousands)
Private Carriers $3,152,640 $3,411,120 $3,723,572 $3,586,507 $3,670,492
State Fund $0 $0 $0 $0 $0
Self-Insured $1,146,843 $1,154,620 $1,158,029 $1,125,645 $1,208,146
Total Costs $4,299,483 $4,565,740 $4,881,601 $4,712,151 $4,878,638
Costs per $100 of Payroll $1.47 $1.50 $1.51 $1.36 $1.34
Notes – Coverage: Estimated numbers of employees covered by workers’ compensation are reported in thousands. Covered wages are reported in millions of dollars. Please refer to Appendix A for more information on our coverage estimates. Benefits and Costs: Estimated workers’ compensation benefits and costs are reported by type of insurer (private carriers, state funds, and self-insured employers) in thousands of dollars.

National Academy of Social Insurance
47
GEORGIA
Georgia State Summary Table: 2012-2016 2012 2013 2014 2015 2016
Coverage
Covered Workers (thousands) 3,659 3,737 3,849 3,968 4,077
Covered Wages (millions) $167,072 $172,639 $183,067 $194,315 $204,371
Benefits (thousands)
Private Carriers $1,063,758 $1,024,433 $1,028,024 $980,081 $1,010,953
State Fund $0 $0 $0 $0 $0
Self-Insured $381,125 $360,191 $350,144 $332,657 $366,449
Total Benefits $1,444,882 $1,384,625 $1,378,169 $1,312,739 $1,377,402
Medical Benefits (% of total) 50.6% 50.6% 49.5% 49.0% 52.4%
Benefits per $100 of Payroll $0.86 $0.80 $0.75 $0.68 $0.67
Costs (thousands)
Private Carriers $1,450,110 $1,524,846 $1,626,487 $1,714,207 $1,775,544
State Fund $0 $0 $0 $0 $0
Self-Insured $504,509 $480,618 $466,912 $450,682 $442,944
Total Costs $1,954,619 $2,005,464 $2,093,399 $2,164,889 $2,218,488
Costs per $100 of Payroll $1.17 $1.16 $1.14 $1.11 $1.09
Notes – Coverage: Estimated numbers of employees covered by workers’ compensation are reported in thousands. Covered wages are reported in millions of dollars. Please refer to Appendix A for more information on our coverage estimates. Benefits and Costs: Estimated workers’ compensation benefits and costs are reported by type of insurer (private carriers, state funds, and self-insured employers) in thousands of dollars.
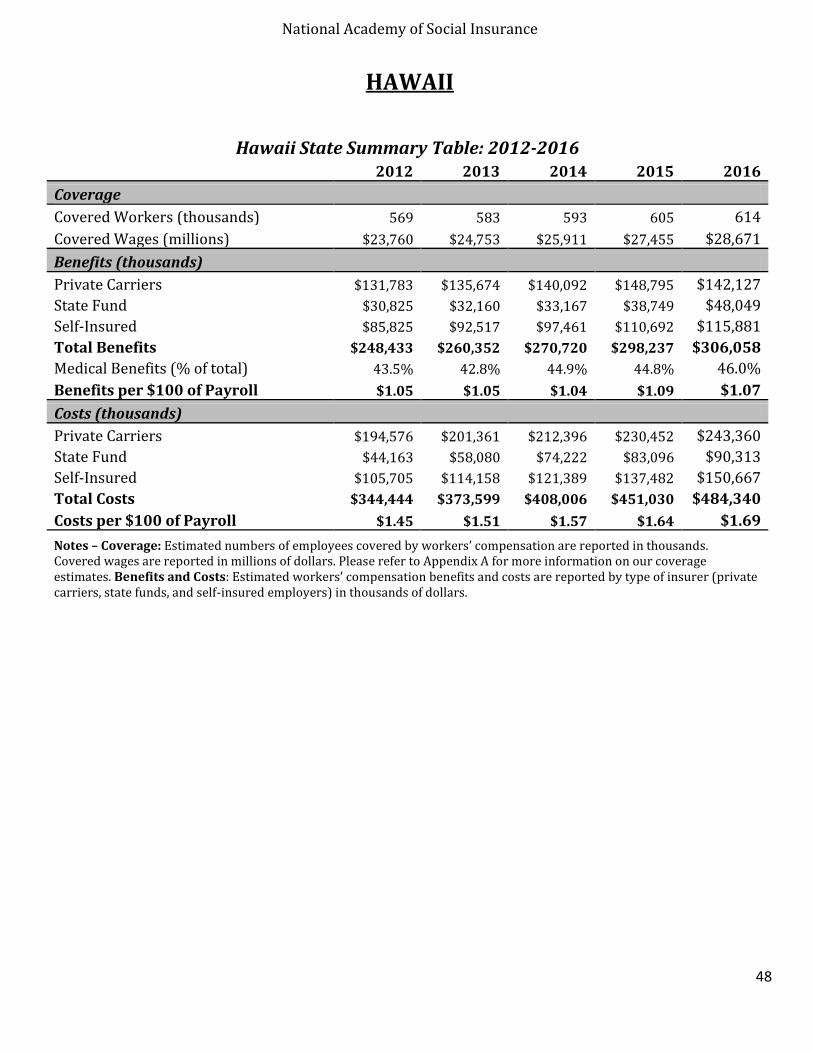
National Academy of Social Insurance
48
HAWAII
Hawaii State Summary Table: 2012-2016 2012 2013 2014 2015 2016
Coverage
Covered Workers (thousands) 569 583 593 605 614
Covered Wages (millions) $23,760 $24,753 $25,911 $27,455 $28,671
Benefits (thousands)
Private Carriers $131,783 $135,674 $140,092 $148,795 $142,127
State Fund $30,825 $32,160 $33,167 $38,749 $48,049
Self-Insured $85,825 $92,517 $97,461 $110,692 $115,881
Total Benefits $248,433 $260,352 $270,720 $298,237 $306,058
Medical Benefits (% of total) 43.5% 42.8% 44.9% 44.8% 46.0%
Benefits per $100 of Payroll $1.05 $1.05 $1.04 $1.09 $1.07
Costs (thousands)
Private Carriers $194,576 $201,361 $212,396 $230,452 $243,360
State Fund $44,163 $58,080 $74,222 $83,096 $90,313
Self-Insured $105,705 $114,158 $121,389 $137,482 $150,667
Total Costs $344,444 $373,599 $408,006 $451,030 $484,340
Costs per $100 of Payroll $1.45 $1.51 $1.57 $1.64 $1.69
Notes – Coverage: Estimated numbers of employees covered by workers’ compensation are reported in thousands. Covered wages are reported in millions of dollars. Please refer to Appendix A for more information on our coverage estimates. Benefits and Costs: Estimated workers’ compensation benefits and costs are reported by type of insurer (private carriers, state funds, and self-insured employers) in thousands of dollars.
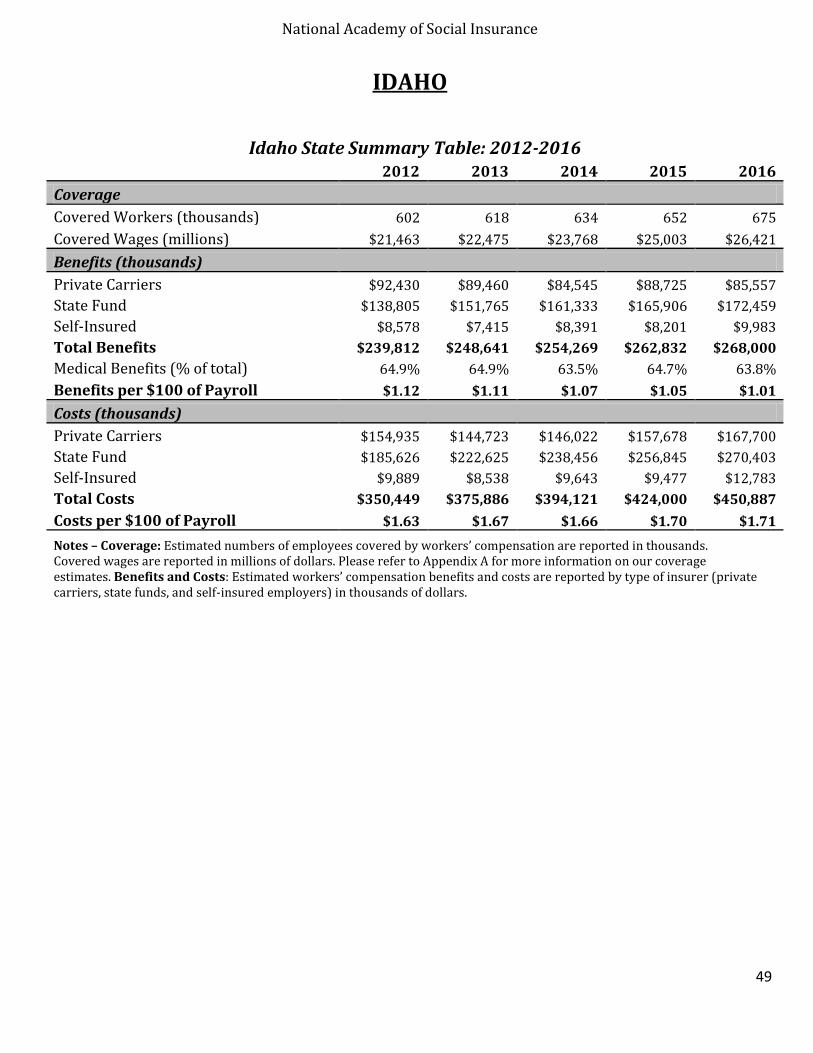
National Academy of Social Insurance
49
IDAHO
Idaho State Summary Table: 2012-2016 2012 2013 2014 2015 2016
Coverage
Covered Workers (thousands) 602 618 634 652 675
Covered Wages (millions) $21,463 $22,475 $23,768 $25,003 $26,421
Benefits (thousands)
Private Carriers $92,430 $89,460 $84,545 $88,725 $85,557
State Fund $138,805 $151,765 $161,333 $165,906 $172,459
Self-Insured $8,578 $7,415 $8,391 $8,201 $9,983
Total Benefits $239,812 $248,641 $254,269 $262,832 $268,000
Medical Benefits (% of total) 64.9% 64.9% 63.5% 64.7% 63.8%
Benefits per $100 of Payroll $1.12 $1.11 $1.07 $1.05 $1.01
Costs (thousands)
Private Carriers $154,935 $144,723 $146,022 $157,678 $167,700
State Fund $185,626 $222,625 $238,456 $256,845 $270,403
Self-Insured $9,889 $8,538 $9,643 $9,477 $12,783
Total Costs $350,449 $375,886 $394,121 $424,000 $450,887
Costs per $100 of Payroll $1.63 $1.67 $1.66 $1.70 $1.71
Notes – Coverage: Estimated numbers of employees covered by workers’ compensation are reported in thousands. Covered wages are reported in millions of dollars. Please refer to Appendix A for more information on our coverage estimates. Benefits and Costs: Estimated workers’ compensation benefits and costs are reported by type of insurer (private carriers, state funds, and self-insured employers) in thousands of dollars.
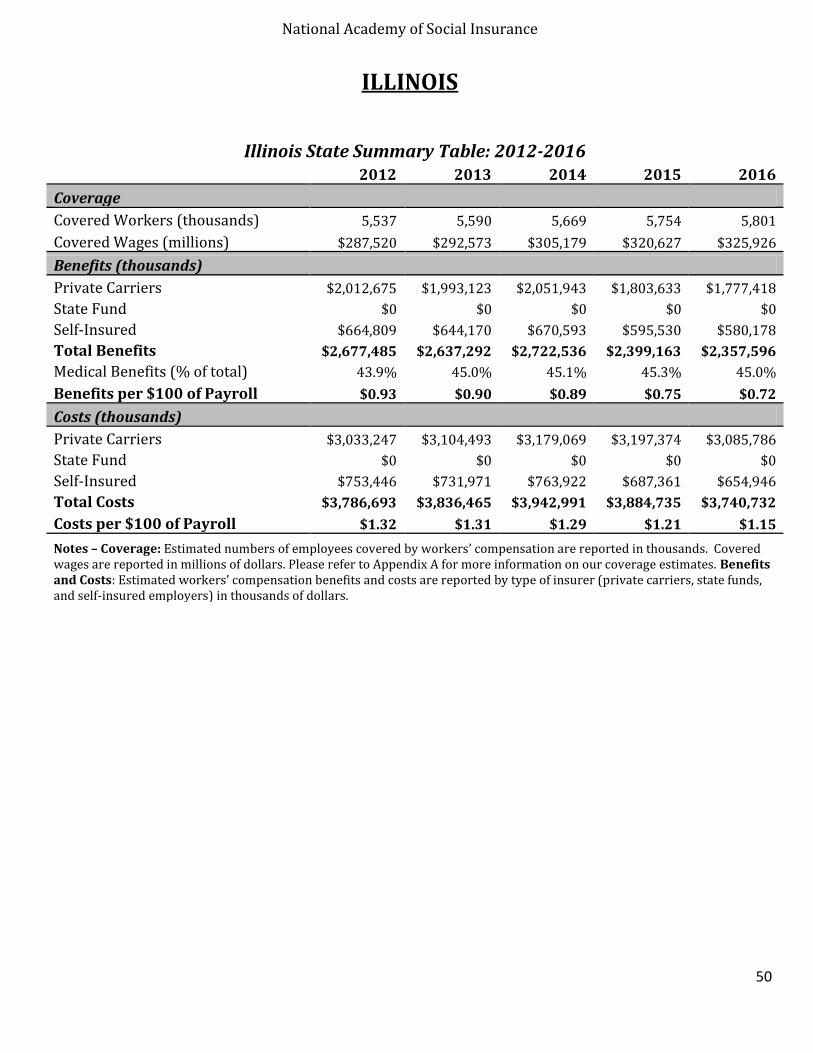
National Academy of Social Insurance
50
ILLINOIS
Illinois State Summary Table: 2012-2016 2012 2013 2014 2015 2016
Coverage
Covered Workers (thousands) 5,537 5,590 5,669 5,754 5,801
Covered Wages (millions) $287,520 $292,573 $305,179 $320,627 $325,926
Benefits (thousands)
Private Carriers $2,012,675 $1,993,123 $2,051,943 $1,803,633 $1,777,418
State Fund $0 $0 $0 $0 $0
Self-Insured $664,809 $644,170 $670,593 $595,530 $580,178
Total Benefits $2,677,485 $2,637,292 $2,722,536 $2,399,163 $2,357,596
Medical Benefits (% of total) 43.9% 45.0% 45.1% 45.3% 45.0%
Benefits per $100 of Payroll $0.93 $0.90 $0.89 $0.75 $0.72
Costs (thousands)
Private Carriers $3,033,247 $3,104,493 $3,179,069 $3,197,374 $3,085,786
State Fund $0 $0 $0 $0 $0
Self-Insured $753,446 $731,971 $763,922 $687,361 $654,946
Total Costs $3,786,693 $3,836,465 $3,942,991 $3,884,735 $3,740,732
Costs per $100 of Payroll $1.32 $1.31 $1.29 $1.21 $1.15
Notes – Coverage: Estimated numbers of employees covered by workers’ compensation are reported in thousands. Covered wages are reported in millions of dollars. Please refer to Appendix A for more information on our coverage estimates. Benefits and Costs: Estimated workers’ compensation benefits and costs are reported by type of insurer (private carriers, state funds, and self-insured employers) in thousands of dollars.

National Academy of Social Insurance
51
INDIANA
Indiana State Summary Table: 2012-2016 2012 2013 2014 2015 2016
Coverage
Covered Workers (thousands) 2,762 2,799 2,842 2,892 2,936
Covered Wages (millions) $113,017 $115,798 $120,024 $126,044 $130,020
Benefits (thousands)
Private Carriers $558,527 $576,046 $525,239 $499,842 $501,144
State Fund $0 $0 $0 $0 $0
Self-Insured $62,348 $67,227 $65,254 $66,427 $75,161
Total Benefits $620,875 $643,273 $590,493 $566,269 $576,305
Medical Benefits (% of total) 73.4% 73.3% 73.3% 70.2% 70.8%
Benefits per $100 of Payroll $0.55 $0.56 $0.49 $0.45 $0.44
Costs (thousands)
Private Carriers $890,375 $942,776 $950,607 $986,044 $973,140
State Fund $0 $0 $0 $0 $0
Self-Insured $69,188 $74,433 $73,577 $75,410 $86,566
Total Costs $959,563 $1,017,210 $1,024,183 $1,061,454 $1,059,706
Costs per $100 of Payroll $0.85 $0.88 $0.85 $0.84 $0.82
Notes – Coverage: Estimated numbers of employees covered by workers’ compensation are reported in thousands. Covered wages are reported in millions of dollars. Please refer to Appendix A for more information on our coverage estimates. Benefits and Costs: Estimated workers’ compensation benefits and costs are reported by type of insurer private carriers, state funds, and self-insured employers) in thousands of dollars.

National Academy of Social Insurance
52
IOWA
Iowa State Summary Table: 2012-2016 2012 2013 2014 2015 2016
Coverage
Covered Workers (thousands) 1,443 1,464 1,483 1,497 1,506
Covered Wages (millions) $57,861 $59,873 $62,775 $65,691 $67,335
Benefits (thousands)
Private Carriers $500,136 $497,314 $503,589 $479,067 $514,233
State Fund $0 $0 $0 $0 $0
Self-Insured $132,960 $131,471 $137,021 $136,909 $150,719
Total Benefits $633,096 $628,784 $640,610 $615,976 $664,952
Medical Benefits (% of total) 56.4% 53.7% 52.5% 53.6% 53.0%
Benefits per $100 of Payroll $1.09 $1.05 $1.02 $0.94 $0.99
Costs (thousands)
Private Carriers $778,786 $826,564 $850,712 $868,771 $868,027
State Fund $0 $0 $0 $0 $0
Self-Insured $148,217 $146,948 $153,679 $156,087 $171,818
Total Costs $927,003 $973,512 $1,004,391 $1,024,858 $1,039,845
Costs per $100 of Payroll $1.60 $1.63 $1.60 $1.56 $1.54
Notes – Coverage: Estimated numbers of employees covered by workers’ compensation are reported in thousands. Covered wages are reported in millions of dollars. Please refer to Appendix A for more information on our coverage estimates. Benefits and Costs: Estimated workers’ compensation benefits and costs are reported by type of insurer (private carriers, state funds, and self-insured employers) in thousands of dollars.

National Academy of Social Insurance
53
KANSAS
Kansas State Summary Table: 2012-2016 2012 2013 2014 2015 2016
Coverage
Covered Workers (thousands) 1,285 1,303 1,322 1,332 1,335
Covered Wages (millions) $52,268 $53,607 $55,958 $57,907 $58,383
Benefits (thousands)
Private Carriers $347,166 $323,873 $327,377 $320,238 $320,210
State Fund $0 $0 $0 $0 $0
Self-Insured $119,405 $111,620 $106,056 $103,315 $100,531
Total Benefits $466,571 $435,493 $433,433 $423,553 $420,741
Medical Benefits (% of total) 58.5% 59.3% 61.9% 61.1% 64.2%
Benefits per $100 of Payroll $0.89 $0.81 $0.77 $0.73 $0.72
Costs (thousands)
Private Carriers $554,993 $589,138 $600,327 $584,754 $546,044
State Fund $0 $0 $0 $0 $0
Self-Insured $140,831 $132,327 $131,468 $123,029 $113,165
Total Costs $695,825 $721,466 $731,795 $707,783 $659,209
Costs per $100 of Payroll $1.33 $1.35 $1.31 $1.22 $1.13
Notes – Coverage: Estimated numbers of employees covered by workers’ compensation are reported in thousands. Covered wages are reported in millions of dollars. Please refer to Appendix A for more information on our coverage estimates. Benefits and Costs: Estimated workers’ compensation benefits and costs are reported by type of insurer (private carriers, state funds, and self-insured employers) in thousands of dollars.

National Academy of Social Insurance
54
KENTUCKY
Kentucky State Summary Table: 2012-2016 2012 2013 2014 2015 2016
Coverage
Covered Workers (thousands) 1,718 1,738 1,765 1,794 1,820
Covered Wages (millions) $68,692 $70,161 $73,262 $77,074 $79,531
Benefits (thousands)
Private Carriers $366,752 $372,030 $343,129 $354,185 $328,714
State Fund $90,325 $96,566 $108,386 $121,146 $122,573
Self-Insured $212,992 $202,064 $192,968 $209,160 $202,661
Total Benefits $670,070 $670,660 $644,484 $684,491 $653,949
Medical Benefits (% of total) 55.6% 54.7% 55.6% 55.5% 54.2%
Benefits per $100 of Payroll $0.98 $0.96 $0.88 $0.89 $0.82
Costs (thousands)
Private Carriers $417,036 $419,399 $418,375 $435,539 $421,405
State Fund $143,446 $162,524 $177,968 $163,315 $168,091
Self-Insured $239,775 $226,647 $210,225 $230,199 $240,298
Total Costs $800,257 $808,571 $806,568 $829,052 $829,794
Costs per $100 of Payroll $1.16 $1.15 $1.10 $1.08 $1.04
Notes – Coverage: Estimated numbers of employees covered by workers’ compensation are reported in thousands. Covered wages are reported in millions of dollars. Please refer to Appendix A for more information on our coverage estimates. Benefits and Costs: Estimated workers’ compensation benefits and costs are reported by type of insurer (private carriers, state funds, and self-insured employers) in thousands of dollars.

National Academy of Social Insurance
55
LOUISIANA
Louisiana State Summary Table: 2012-2016 2012 2013 2014 2015 2016
Coverage
Covered Workers (thousands) 1,833 1,858 1,889 1,896 1,873
Covered Wages (millions) $78,716 $81,171 $84,992 $86,388 $84,735
Benefits (thousands)
Private Carriers $478,021 $487,509 $474,795 $451,148 $458,483
State Fund $104,034 $98,368 $88,585 $97,732 $123,195
Self-Insured $231,785 $223,783 $220,320 $224,870 $214,530
Total Benefits $813,839 $809,661 $783,699 $773,750 $796,209
Medical Benefits (% of total) 52.7% 53.8% 54.0% 55.5% 55.9%
Benefits per $100 of Payroll $1.03 $1.00 $0.92 $0.90 $0.94
Costs (thousands)
Private Carriers $741,984 $739,750 $778,164 $748,685 $727,851
State Fund $192,200 $208,178 $219,796 $209,187 $216,154
Self-Insured $300,269 $288,407 $298,575 $304,867 $228,779
Total Costs $1,234,454 $1,236,335 $1,296,535 $1,262,739 $1,172,784
Costs per $100 of Payroll $1.57 $1.52 $1.53 $1.46 $1.38
Notes – Coverage: Estimated numbers of employees covered by workers’ compensation are reported in thousands. Covered wages are reported in millions of dollars. Please refer to Appendix A for more information on our coverage estimates. Benefits and Costs: Estimated workers’ compensation benefits and costs are reported by type of insurer (private carriers, state funds, and self-insured employers) in thousands of dollars.
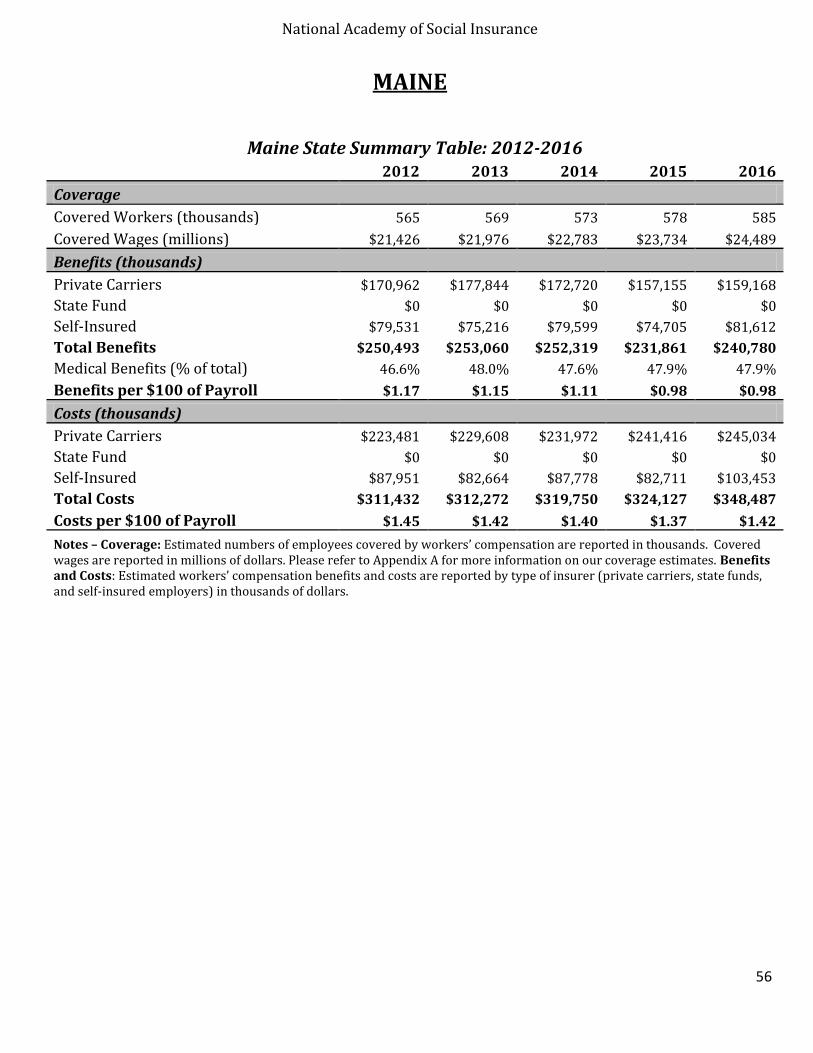
National Academy of Social Insurance
56
MAINE
Maine State Summary Table: 2012-2016 2012 2013 2014 2015 2016
Coverage
Covered Workers (thousands) 565 569 573 578 585
Covered Wages (millions) $21,426 $21,976 $22,783 $23,734 $24,489
Benefits (thousands)
Private Carriers $170,962 $177,844 $172,720 $157,155 $159,168
State Fund $0 $0 $0 $0 $0
Self-Insured $79,531 $75,216 $79,599 $74,705 $81,612
Total Benefits $250,493 $253,060 $252,319 $231,861 $240,780
Medical Benefits (% of total) 46.6% 48.0% 47.6% 47.9% 47.9%
Benefits per $100 of Payroll $1.17 $1.15 $1.11 $0.98 $0.98
Costs (thousands)
Private Carriers $223,481 $229,608 $231,972 $241,416 $245,034
State Fund $0 $0 $0 $0 $0
Self-Insured $87,951 $82,664 $87,778 $82,711 $103,453
Total Costs $311,432 $312,272 $319,750 $324,127 $348,487
Costs per $100 of Payroll $1.45 $1.42 $1.40 $1.37 $1.42
Notes – Coverage: Estimated numbers of employees covered by workers’ compensation are reported in thousands. Covered wages are reported in millions of dollars. Please refer to Appendix A for more information on our coverage estimates. Benefits and Costs: Estimated workers’ compensation benefits and costs are reported by type of insurer (private carriers, state funds, and self-insured employers) in thousands of dollars.
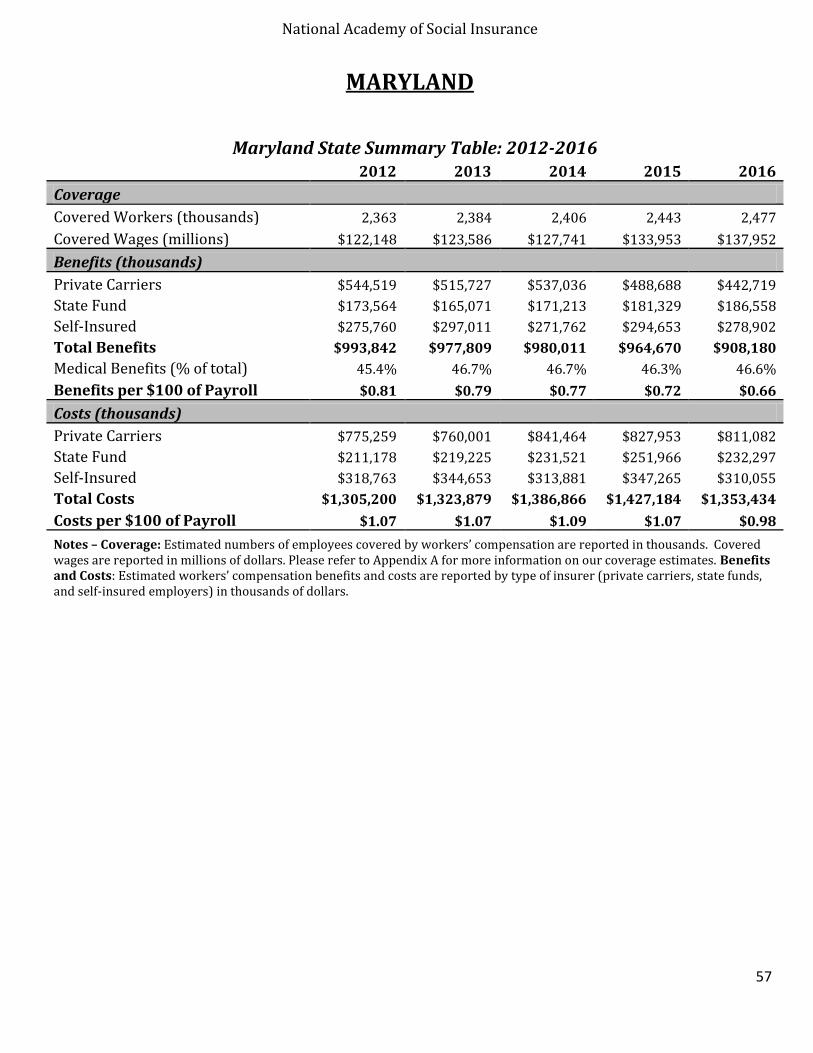
National Academy of Social Insurance
57
MARYLAND
Maryland State Summary Table: 2012-2016 2012 2013 2014 2015 2016
Coverage
Covered Workers (thousands) 2,363 2,384 2,406 2,443 2,477
Covered Wages (millions) $122,148 $123,586 $127,741 $133,953 $137,952
Benefits (thousands)
Private Carriers $544,519 $515,727 $537,036 $488,688 $442,719
State Fund $173,564 $165,071 $171,213 $181,329 $186,558
Self-Insured $275,760 $297,011 $271,762 $294,653 $278,902
Total Benefits $993,842 $977,809 $980,011 $964,670 $908,180
Medical Benefits (% of total) 45.4% 46.7% 46.7% 46.3% 46.6%
Benefits per $100 of Payroll $0.81 $0.79 $0.77 $0.72 $0.66
Costs (thousands)
Private Carriers $775,259 $760,001 $841,464 $827,953 $811,082
State Fund $211,178 $219,225 $231,521 $251,966 $232,297
Self-Insured $318,763 $344,653 $313,881 $347,265 $310,055
Total Costs $1,305,200 $1,323,879 $1,386,866 $1,427,184 $1,353,434
Costs per $100 of Payroll $1.07 $1.07 $1.09 $1.07 $0.98
Notes – Coverage: Estimated numbers of employees covered by workers’ compensation are reported in thousands. Covered wages are reported in millions of dollars. Please refer to Appendix A for more information on our coverage estimates. Benefits and Costs: Estimated workers’ compensation benefits and costs are reported by type of insurer (private carriers, state funds, and self-insured employers) in thousands of dollars.

National Academy of Social Insurance
58
MASSACHUSETTS
Massachusetts State Summary Table: 2012-2016 2012 2013 2014 2015 2016
Coverage
Covered Workers (thousands) 3,190 3,244 3,315 3,382 3,448
Covered Wages (millions) $193,733 $200,044 $211,967 $225,054 $232,040
Benefits (thousands)
Private Carriers $738,717 $785,129 $817,409 $820,966 $851,578
State Fund $0 $0 $0 $0 $0
Self-Insured $283,869 $333,657 $309,665 $275,718 $295,845
Total Benefits $1,022,585 $1,118,785 $1,127,075 $1,096,684 $1,147,423
Medical Benefits (% of total) 34.9% 33.5% 33.7% 34.1% 33.5%
Benefits per $100 of Payroll $0.53 $0.56 $0.53 $0.49 $0.49
Costs (thousands)
Private Carriers $1,189,311 $1,153,068 $1,215,172 $1,287,323 $1,367,191
State Fund $0 $0 $0 $0 $0
Self-Insured $330,991 $387,130 $357,457 $319,900 $349,881
Total Costs $1,520,301 $1,540,197 $1,572,629 $1,607,223 $1,717,072
Costs per $100 of Payroll $0.78 $0.77 $0.74 $0.71 $0.74
Notes – Coverage: Estimated numbers of employees covered by workers’ compensation are reported in thousands. Covered wages are reported in millions of dollars. Please refer to Appendix A for more information on our coverage estimates. Benefits and Costs: Estimated workers’ compensation benefits and costs are reported by type of insurer (private carriers, state funds, and self-insured employers) in thousands of dollars.
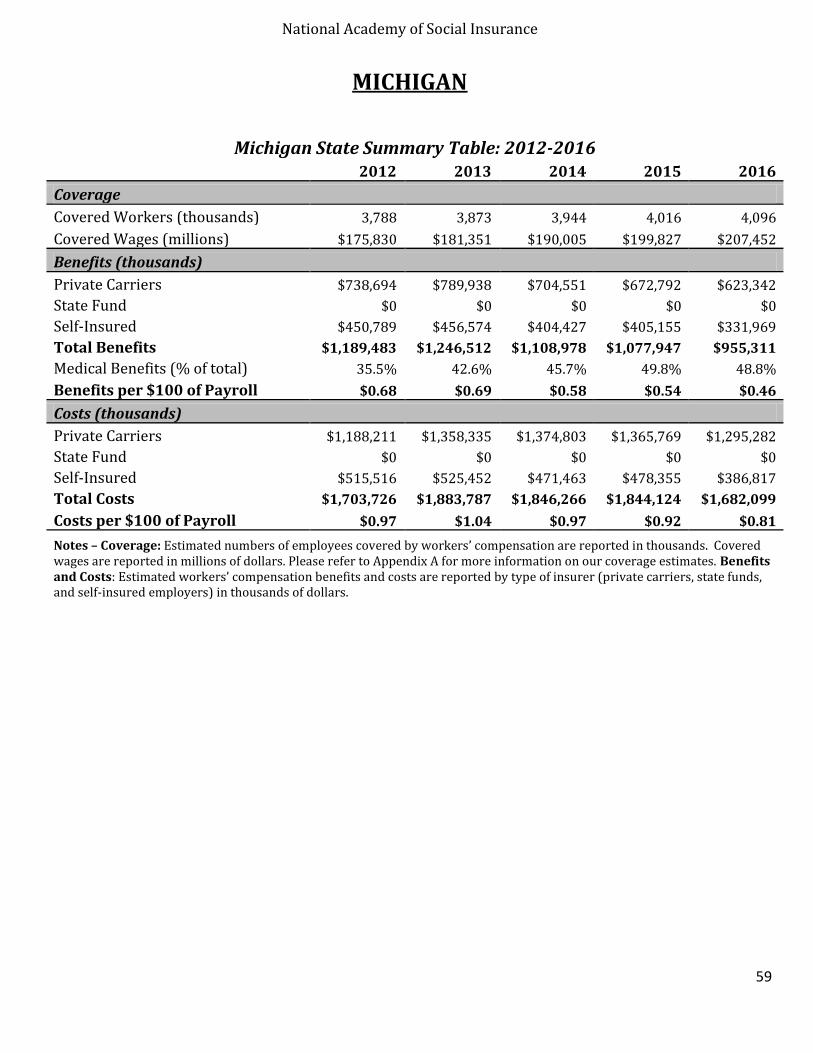
National Academy of Social Insurance
59
MICHIGAN
Michigan State Summary Table: 2012-2016 2012 2013 2014 2015 2016
Coverage
Covered Workers (thousands) 3,788 3,873 3,944 4,016 4,096
Covered Wages (millions) $175,830 $181,351 $190,005 $199,827 $207,452
Benefits (thousands)
Private Carriers $738,694 $789,938 $704,551 $672,792 $623,342
State Fund $0 $0 $0 $0 $0
Self-Insured $450,789 $456,574 $404,427 $405,155 $331,969
Total Benefits $1,189,483 $1,246,512 $1,108,978 $1,077,947 $955,311
Medical Benefits (% of total) 35.5% 42.6% 45.7% 49.8% 48.8%
Benefits per $100 of Payroll $0.68 $0.69 $0.58 $0.54 $0.46
Costs (thousands)
Private Carriers $1,188,211 $1,358,335 $1,374,803 $1,365,769 $1,295,282
State Fund $0 $0 $0 $0 $0
Self-Insured $515,516 $525,452 $471,463 $478,355 $386,817
Total Costs $1,703,726 $1,883,787 $1,846,266 $1,844,124 $1,682,099
Costs per $100 of Payroll $0.97 $1.04 $0.97 $0.92 $0.81
Notes – Coverage: Estimated numbers of employees covered by workers’ compensation are reported in thousands. Covered wages are reported in millions of dollars. Please refer to Appendix A for more information on our coverage estimates. Benefits and Costs: Estimated workers’ compensation benefits and costs are reported by type of insurer (private carriers, state funds, and self-insured employers) in thousands of dollars.

National Academy of Social Insurance
60
MINNESOTA
Minnesota State Summary Table: 2012-2016 2012 2013 2014 2015 2016
Coverage
Covered Workers (thousands) 2,597 2,643 2,682 2,727 2,765
Covered Wages (millions) $127,560 $132,003 $137,888 $145,477 $149,647
Benefits (thousands)
Private Carriers $790,022 $808,422 $829,456 $774,203 $770,437
State Fund $0 $0 $0 $0 $0
Self-Insured $252,456 $257,604 $257,240 $259,064 $258,712
Total Benefits $1,042,478 $1,066,026 $1,086,696 $1,033,268 $1,029,149
Medical Benefits (% of total) 54.4% 55.5% 55.2% 54.0% 54.2%
Benefits per $100 of Payroll $0.82 $0.81 $0.79 $0.71 $0.69
Costs (thousands)
Private Carriers $1,056,413 $1,101,163 $1,161,411 $1,221,582 $1,266,785
State Fund $0 $0 $0 $0 $0
Self-Insured $307,635 $308,736 $307,551 $320,206 $312,824
Total Costs $1,364,048 $1,409,900 $1,468,962 $1,541,788 $1,579,609
Costs per $100 of Payroll $1.07 $1.07 $1.07 $1.06 $1.06
Notes – Coverage: Estimated numbers of employees covered by workers’ compensation are reported in thousands. Covered wages are reported in millions of dollars. Please refer to Appendix A for more information on our coverage estimates. Benefits and Costs: Estimated workers’ compensation benefits and costs are reported by type of insurer (private carriers, state funds, and self-insured employers) in thousands of dollars.

National Academy of Social Insurance
61
MISSISSIPPI
Mississippi State Summary Table: 2012-2016 2012 2013 2014 2015 2016
Coverage
Covered Workers (thousands) 1,008 1,018 1,027 1,041 1,051
Covered Wages (millions) $35,511 $36,491 $37,457 $38,485 $39,396
Benefits (thousands)
Private Carriers $220,926 $225,037 $231,102 $230,760 $225,602
State Fund $0 $0 $0 $0 $0
Self-Insured $115,283 $107,753 $105,587 $100,923 $80,089
Total Benefits $336,208 $332,790 $336,689 $331,683 $305,690
Medical Benefits (% of total) 56.5% 59.6% 59.1% 59.5% 58.0%
Benefits per $100 of Payroll $0.95 $0.91 $0.90 $0.86 $0.78
Costs (thousands)
Private Carriers $345,651 $381,344 $437,026 $420,312 $409,686
State Fund $0 $0 $0 $0 $0
Self-Insured $139,318 $131,384 $128,824 $124,825 $97,029
Total Costs $484,970 $512,728 $565,850 $545,137 $506,715
Costs per $100 of Payroll $1.37 $1.41 $1.51 $1.42 $1.29
Notes – Coverage: Estimated numbers of employees covered by workers’ compensation are reported in thousands. Covered wages are reported in millions of dollars. Please refer to Appendix A for more information on our coverage estimates. Benefits and Costs: Estimated workers’ compensation benefits and costs are reported by type of insurer (private carriers, state funds, and self-insured employers) in thousands of dollars.

National Academy of Social Insurance
62
MISSOURI
Missouri State Summary Table: 2012-2016 2012 2013 2014 2015 2016
Coverage
Covered Workers (thousands) 2,436 2,467 2,496 2,541 2,578
Covered Wages (millions) $102,953 $105,206 $109,409 $114,664 $117,833
Benefits (thousands)
Private Carriers $533,548 $524,088 $580,303 $625,864 $635,297
State Fund $91,601 $101,386 $120,121 $126,612 $143,957
Self-Insured $204,200 $206,238 $217,036 $230,284 $236,269
Total Benefits $829,350 $831,711 $917,459 $982,760 $1,015,523
Medical Benefits (% of total) 57.3% 56.6% 56.9% 56.1% 56.9%
Benefits per $100 of Payroll $0.81 $0.79 $0.84 $0.86 $0.86
Costs (thousands)
Private Carriers $736,938 $757,680 $869,412 $907,950 $909,542
State Fund $154,398 $185,998 $207,987 $222,855 $241,025
Self-Insured $234,546 $236,190 $252,378 $265,854 $289,885
Total Costs $1,125,882 $1,179,869 $1,329,776 $1,396,660 $1,440,452
Costs per $100 of Payroll $1.09 $1.12 $1.22 $1.22 $1.22
Notes – Coverage: Estimated numbers of employees covered by workers’ compensation are reported in thousands. Covered wages are reported in millions of dollars. Please refer to Appendix A for more information on our coverage estimates. Benefits and Costs: Estimated workers’ compensation benefits and costs are reported by type of insurer (private carriers, state funds, and self-insured employers) in thousands of dollars.

National Academy of Social Insurance
63
MONTANA
Montana State Summary Table: 2012-2016 2012 2013 2014 2015 2016
Coverage
Covered Workers (thousands) 414 421 424 432 438
Covered Wages (millions) $15,008 $15,492 $16,159 $16,969 $17,472
Benefits (thousands)
Private Carriers $85,054 $83,891 $85,054 $84,034 $82,854
State Fund $125,176 $125,506 $118,885 $128,471 $136,125
Self-Insured $40,166 $38,647 $41,564 $40,349 $42,126
Total Benefits $250,397 $248,044 $245,504 $252,854 $261,105
Medical Benefits (% of total) 62.8% 64.0% 65.1% 66.9% 66.5%
Benefits per $100 of Payroll $1.67 $1.60 $1.52 $1.49 $1.49
Costs (thousands)
Private Carriers $146,077 $121,261 $128,544 $130,178 $132,886
State Fund $180,144 $182,178 $185,325 $190,163 $192,210
Self-Insured $46,060 $43,026 $47,069 $45,087 $48,349
Total Costs $372,281 $346,466 $360,937 $365,428 $373,445
Costs per $100 of Payroll $2.48 $2.24 $2.23 $2.15 $2.14
Notes – Coverage: Estimated numbers of employees covered by workers’ compensation are reported in thousands. Covered wages are reported in millions of dollars. Please refer to Appendix A for more information on our coverage estimates. Benefits and Costs: Estimated workers’ compensation benefits and costs are reported by type of insurer (private carriers, state funds, and self-insured employers) in thousands of dollars.

National Academy of Social Insurance
64
NEBRASKA
Nebraska State Summary Table: 2012-2016 2012 2013 2014 2015 2016
Coverage
Covered Workers (thousands) 892 905 918 931 940
Covered Wages (millions) $34,687 $35,821 $37,450 $39,527 $40,613
Benefits (thousands)
Private Carriers $243,865 $242,041 $257,359 $242,030 $249,855
State Fund $0 $0 $0 $0 $0
Self-Insured $58,470 $56,649 $61,070 $59,176 $64,041
Total Benefits $302,335 $298,689 $318,429 $301,206 $313,896
Medical Benefits (% of total) 61.5% 61.6% 62.3% 63.5% 64.1%
Benefits per $100 of Payroll $0.87 $0.83 $0.85 $0.76 $0.77
Costs (thousands)
Private Carriers $393,727 $419,903 $434,581 $437,541 $435,633
State Fund $0 $0 $0 $0 $0
Self-Insured $64,875 $63,070 $68,768 $67,619 $68,635
Total Costs $458,602 $482,973 $503,349 $505,160 $504,267
Costs per $100 of Payroll $1.32 $1.35 $1.34 $1.28 $1.24
Notes – Coverage: Estimated numbers of employees covered by workers’ compensation are reported in thousands. Covered wages are reported in millions of dollars. Please refer to Appendix A for more information on our coverage estimates. Benefits and Costs: Estimated workers’ compensation benefits and costs are reported by type of insurer (private carriers, state funds, and self-insured employers) in thousands of dollars.
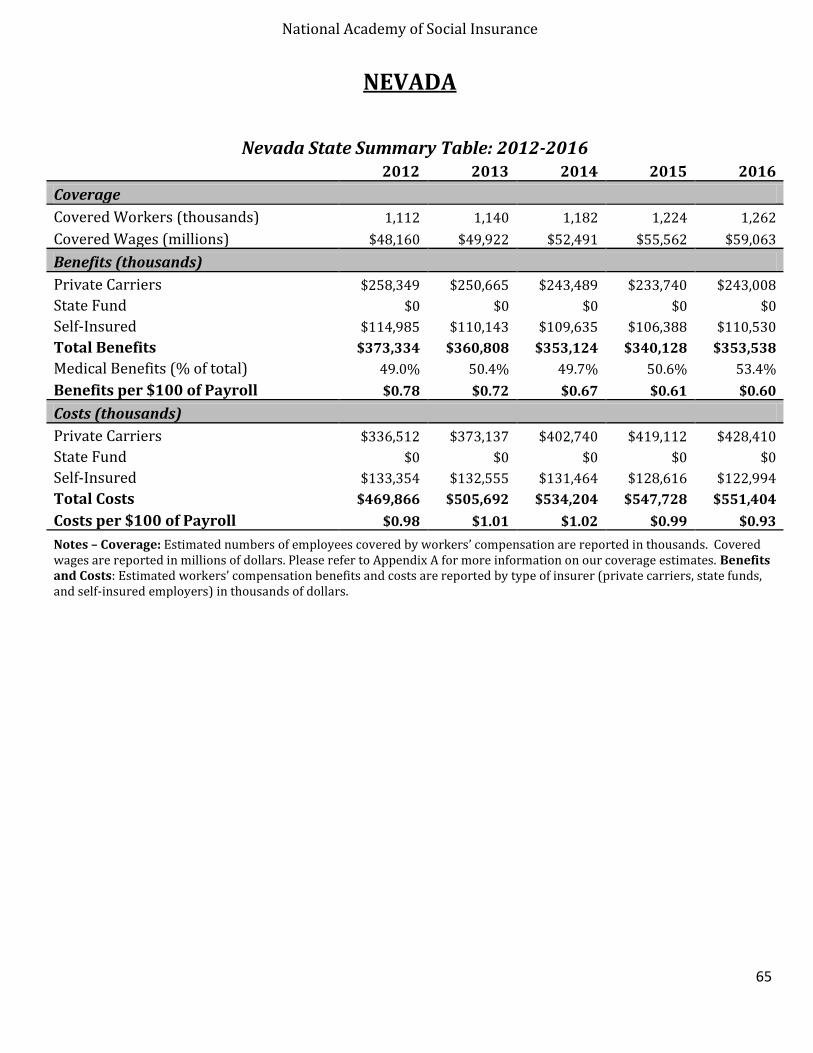
National Academy of Social Insurance
65
NEVADA
Nevada State Summary Table: 2012-2016 2012 2013 2014 2015 2016
Coverage
Covered Workers (thousands) 1,112 1,140 1,182 1,224 1,262
Covered Wages (millions) $48,160 $49,922 $52,491 $55,562 $59,063
Benefits (thousands)
Private Carriers $258,349 $250,665 $243,489 $233,740 $243,008
State Fund $0 $0 $0 $0 $0
Self-Insured $114,985 $110,143 $109,635 $106,388 $110,530
Total Benefits $373,334 $360,808 $353,124 $340,128 $353,538
Medical Benefits (% of total) 49.0% 50.4% 49.7% 50.6% 53.4%
Benefits per $100 of Payroll $0.78 $0.72 $0.67 $0.61 $0.60
Costs (thousands)
Private Carriers $336,512 $373,137 $402,740 $419,112 $428,410
State Fund $0 $0 $0 $0 $0
Self-Insured $133,354 $132,555 $131,464 $128,616 $122,994
Total Costs $469,866 $505,692 $534,204 $547,728 $551,404
Costs per $100 of Payroll $0.98 $1.01 $1.02 $0.99 $0.93
Notes – Coverage: Estimated numbers of employees covered by workers’ compensation are reported in thousands. Covered wages are reported in millions of dollars. Please refer to Appendix A for more information on our coverage estimates. Benefits and Costs: Estimated workers’ compensation benefits and costs are reported by type of insurer (private carriers, state funds, and self-insured employers) in thousands of dollars.

National Academy of Social Insurance
66
NEW HAMPSHIRE
New Hampshire State Summary Table: 2012-2016 2012 2013 2014 2015 2016
Coverage
Covered Workers (thousands) 605 611 619 629 640
Covered Wages (millions) $29,005 $29,762 $31,506 $32,889 $34,090
Benefits (thousands)
Private Carriers $170,401 $162,664 $150,431 $155,272 $146,004
State Fund $0 $0 $0 $0 $0
Self-Insured $60,835 $62,836 $62,348 $58,651 $59,659
Total Benefits $231,235 $225,500 $212,778 $213,923 $205,663
Medical Benefits (% of total) 66.4% 65.1% 66.9% 64.5% 66.5%
Benefits per $100 of Payroll $0.80 $0.76 $0.68 $0.65 $0.60
Costs (thousands)
Private Carriers $297,257 $308,652 $309,608 $304,006 $297,170
State Fund $0 $0 $0 $0 $0
Self-Insured $77,212 $79,950 $82,861 $76,797 $76,366
Total Costs $374,469 $388,602 $392,468 $380,803 $373,536
Costs per $100 of Payroll $1.29 $1.31 $1.25 $1.16 $1.10
Notes – Coverage: Estimated numbers of employees covered by workers’ compensation are reported in thousands. Covered wages are reported in millions of dollars. Please refer to Appendix A for more information on our coverage estimates. Benefits and Costs: Estimated workers’ compensation benefits and costs are reported by type of insurer (private carriers, state funds, and self-insured employers) in thousands of dollars.

National Academy of Social Insurance
67
NEW JERSEY
New Jersey State Summary Table: 2012-2016 2012 2013 2014 2015 2016
Coverage
Covered Workers (thousands) 3,725 3,769 3,793 3,841 3,905
Covered Wages (millions) $217,495 $223,167 $229,085 $238,725 $244,360
Benefits (thousands)
Private Carriers $1,733,109 $1,767,458 $1,788,124 $1,784,678 $1,820,599
State Fund $0 $0 $0 $0 $0
Self-Insured $508,880 $534,534 $546,699 $561,023 $538,765
Total Benefits $2,241,989 $2,301,992 $2,334,823 $2,345,701 $2,359,364
Medical Benefits (% of total) 51.3% 50.9% 51.8% 51.8% 50.9%
Benefits per $100 of Payroll $1.03 $1.03 $1.02 $0.98 $0.97
Costs (thousands)
Private Carriers $2,404,346 $2,708,169 $2,886,316 $2,952,795 $3,018,470
State Fund $0 $0 $0 $0 $0
Self-Insured $611,686 $595,198 $686,730 $685,244 $683,572
Total Costs $3,016,032 $3,303,367 $3,573,046 $3,638,039 $3,702,042
Costs per $100 of Payroll $1.39 $1.48 $1.56 $1.52 $1.51
Notes – Coverage: Estimated numbers of employees covered by workers’ compensation are reported in thousands. Covered wages are reported in millions of dollars. Please refer to Appendix A for more information on our coverage estimates. Benefits and Costs: Estimated workers’ compensation benefits and costs are reported by type of insurer (private carriers, state funds, and self-insured employers) in thousands of dollars.
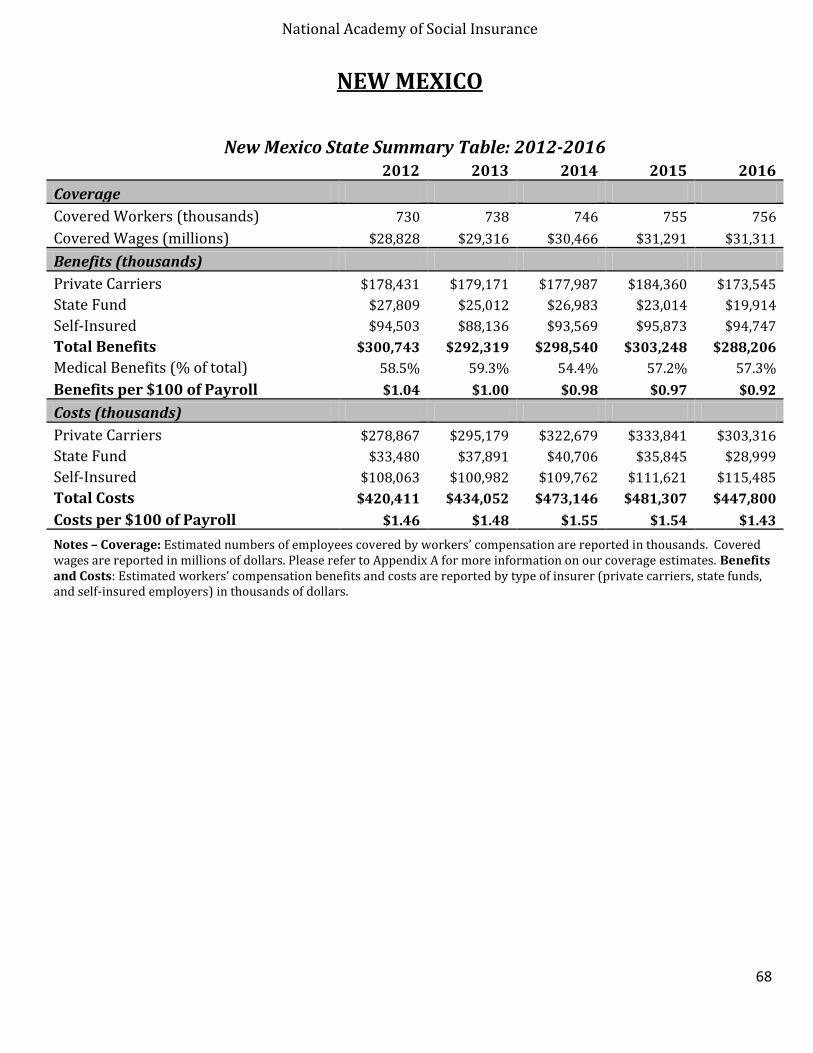
National Academy of Social Insurance
68
NEW MEXICO
New Mexico State Summary Table: 2012-2016 2012 2013 2014 2015 2016
Coverage
Covered Workers (thousands) 730 738 746 755 756
Covered Wages (millions) $28,828 $29,316 $30,466 $31,291 $31,311
Benefits (thousands)
Private Carriers $178,431 $179,171 $177,987 $184,360 $173,545
State Fund $27,809 $25,012 $26,983 $23,014 $19,914
Self-Insured $94,503 $88,136 $93,569 $95,873 $94,747
Total Benefits $300,743 $292,319 $298,540 $303,248 $288,206
Medical Benefits (% of total) 58.5% 59.3% 54.4% 57.2% 57.3%
Benefits per $100 of Payroll $1.04 $1.00 $0.98 $0.97 $0.92
Costs (thousands)
Private Carriers $278,867 $295,179 $322,679 $333,841 $303,316
State Fund $33,480 $37,891 $40,706 $35,845 $28,999
Self-Insured $108,063 $100,982 $109,762 $111,621 $115,485
Total Costs $420,411 $434,052 $473,146 $481,307 $447,800
Costs per $100 of Payroll $1.46 $1.48 $1.55 $1.54 $1.43
Notes – Coverage: Estimated numbers of employees covered by workers’ compensation are reported in thousands. Covered wages are reported in millions of dollars. Please refer to Appendix A for more information on our coverage estimates. Benefits and Costs: Estimated workers’ compensation benefits and costs are reported by type of insurer (private carriers, state funds, and self-insured employers) in thousands of dollars.
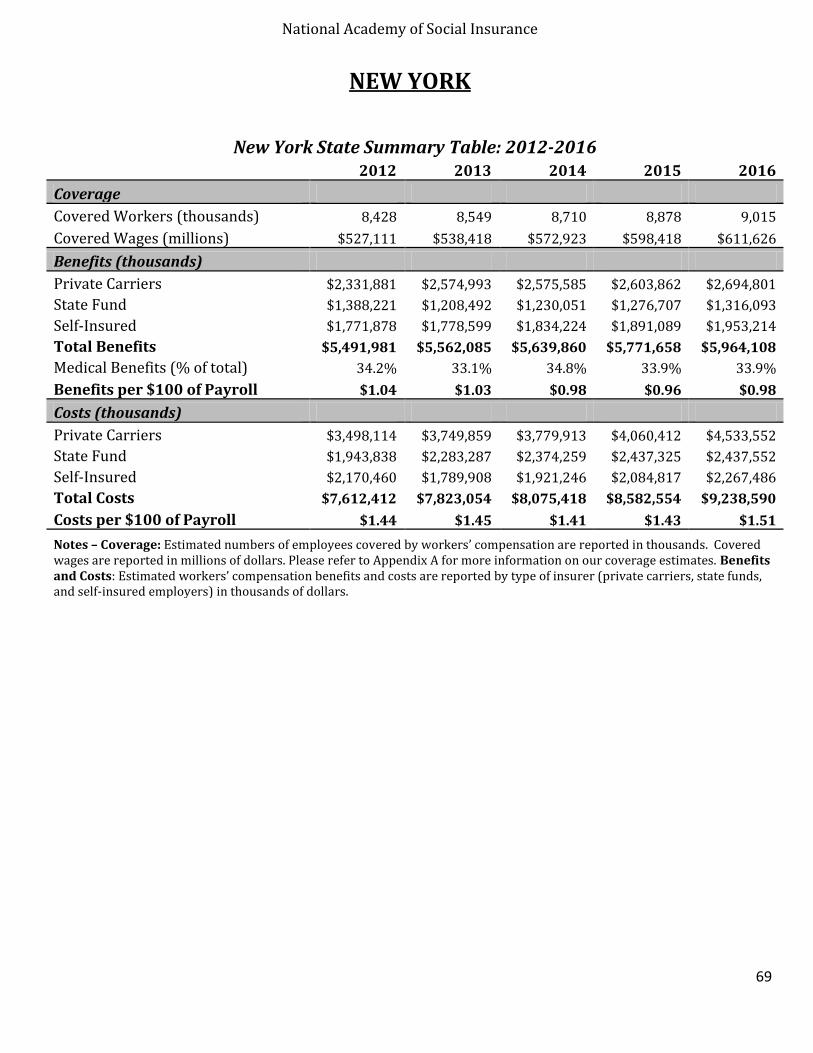
National Academy of Social Insurance
69
NEW YORK
New York State Summary Table: 2012-2016 2012 2013 2014 2015 2016
Coverage
Covered Workers (thousands) 8,428 8,549 8,710 8,878 9,015
Covered Wages (millions) $527,111 $538,418 $572,923 $598,418 $611,626
Benefits (thousands)
Private Carriers $2,331,881 $2,574,993 $2,575,585 $2,603,862 $2,694,801
State Fund $1,388,221 $1,208,492 $1,230,051 $1,276,707 $1,316,093
Self-Insured $1,771,878 $1,778,599 $1,834,224 $1,891,089 $1,953,214
Total Benefits $5,491,981 $5,562,085 $5,639,860 $5,771,658 $5,964,108
Medical Benefits (% of total) 34.2% 33.1% 34.8% 33.9% 33.9%
Benefits per $100 of Payroll $1.04 $1.03 $0.98 $0.96 $0.98
Costs (thousands)
Private Carriers $3,498,114 $3,749,859 $3,779,913 $4,060,412 $4,533,552
State Fund $1,943,838 $2,283,287 $2,374,259 $2,437,325 $2,437,552
Self-Insured $2,170,460 $1,789,908 $1,921,246 $2,084,817 $2,267,486
Total Costs $7,612,412 $7,823,054 $8,075,418 $8,582,554 $9,238,590
Costs per $100 of Payroll $1.44 $1.45 $1.41 $1.43 $1.51
Notes – Coverage: Estimated numbers of employees covered by workers’ compensation are reported in thousands. Covered wages are reported in millions of dollars. Please refer to Appendix A for more information on our coverage estimates. Benefits and Costs: Estimated workers’ compensation benefits and costs are reported by type of insurer private carriers, state funds, and self-insured employers) in thousands of dollars.

National Academy of Social Insurance
70
NORTH CAROLINA
North Carolina State Summary Table: 2012-2016 2012 2013 2014 2015 2016
Coverage
Covered Workers (thousands) 3,744 3,814 3,899 4,002 4,099
Covered Wages (millions) $160,075 $165,770 $173,996 $184,809 $192,332
Benefits (thousands)
Private Carriers $1,096,071 $1,083,575 $983,801 $937,584 $914,322
State Fund $0 $0 $0 $0 $0
Self-Insured $343,374 $329,414 $294,237 $278,394 $290,301
Total Benefits $1,439,445 $1,412,988 $1,278,038 $1,215,978 $1,204,624
Medical Benefits (% of total) 45.8% 45.9% 46.4% 46.3% 46.5%
Benefits per $100 of Payroll $0.90 $0.85 $0.73 $0.66 $0.63
Costs (thousands)
Private Carriers $1,505,384 $1,612,656 $1,656,382 $1,699,396 $1,699,587
State Fund $0 $0 $0 $0 $0
Self-Insured $386,617 $373,442 $338,230 $321,576 $327,926
Total Costs $1,892,001 $1,986,098 $1,994,611 $2,020,972 $2,027,514
Costs per $100 of Payroll $1.18 $1.20 $1.15 $1.09 $1.05
Notes – Coverage: Estimated numbers of employees covered by workers’ compensation are reported in thousands. Covered wages are reported in millions of dollars. Please refer to Appendix A for more information on our coverage estimates. Benefits and Costs: Estimated workers’ compensation benefits and costs are reported by type of insurer (private carriers, state funds, and self-insured employers) in thousands of dollars.
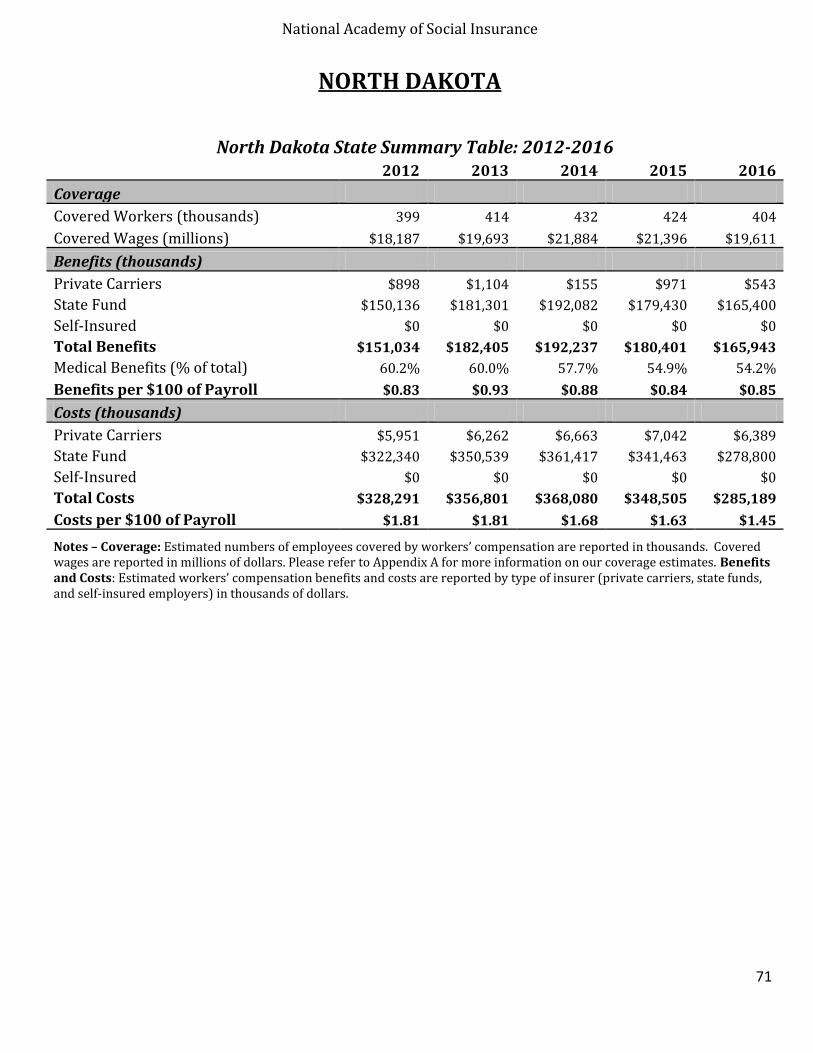
National Academy of Social Insurance
71
NORTH DAKOTA
North Dakota State Summary Table: 2012-2016 2012 2013 2014 2015 2016
Coverage
Covered Workers (thousands) 399 414 432 424 404
Covered Wages (millions) $18,187 $19,693 $21,884 $21,396 $19,611
Benefits (thousands)
Private Carriers $898 $1,104 $155 $971 $543
State Fund $150,136 $181,301 $192,082 $179,430 $165,400
Self-Insured $0 $0 $0 $0 $0
Total Benefits $151,034 $182,405 $192,237 $180,401 $165,943
Medical Benefits (% of total) 60.2% 60.0% 57.7% 54.9% 54.2%
Benefits per $100 of Payroll $0.83 $0.93 $0.88 $0.84 $0.85
Costs (thousands)
Private Carriers $5,951 $6,262 $6,663 $7,042 $6,389
State Fund $322,340 $350,539 $361,417 $341,463 $278,800
Self-Insured $0 $0 $0 $0 $0
Total Costs $328,291 $356,801 $368,080 $348,505 $285,189
Costs per $100 of Payroll $1.81 $1.81 $1.68 $1.63 $1.45
Notes – Coverage: Estimated numbers of employees covered by workers’ compensation are reported in thousands. Covered wages are reported in millions of dollars. Please refer to Appendix A for more information on our coverage estimates. Benefits and Costs: Estimated workers’ compensation benefits and costs are reported by type of insurer (private carriers, state funds, and self-insured employers) in thousands of dollars.
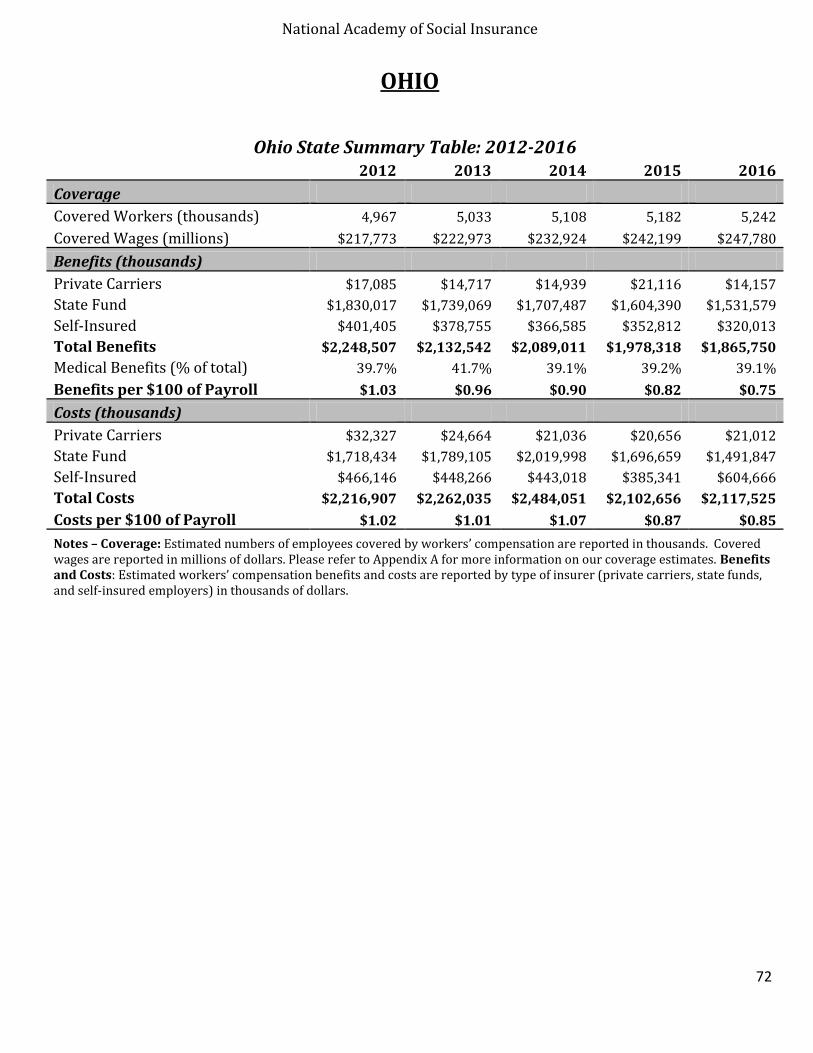
National Academy of Social Insurance
72
OHIO
Ohio State Summary Table: 2012-2016 2012 2013 2014 2015 2016
Coverage
Covered Workers (thousands) 4,967 5,033 5,108 5,182 5,242
Covered Wages (millions) $217,773 $222,973 $232,924 $242,199 $247,780
Benefits (thousands)
Private Carriers $17,085 $14,717 $14,939 $21,116 $14,157
State Fund $1,830,017 $1,739,069 $1,707,487 $1,604,390 $1,531,579
Self-Insured $401,405 $378,755 $366,585 $352,812 $320,013
Total Benefits $2,248,507 $2,132,542 $2,089,011 $1,978,318 $1,865,750
Medical Benefits (% of total) 39.7% 41.7% 39.1% 39.2% 39.1%
Benefits per $100 of Payroll $1.03 $0.96 $0.90 $0.82 $0.75
Costs (thousands)
Private Carriers $32,327 $24,664 $21,036 $20,656 $21,012
State Fund $1,718,434 $1,789,105 $2,019,998 $1,696,659 $1,491,847
Self-Insured $466,146 $448,266 $443,018 $385,341 $604,666
Total Costs $2,216,907 $2,262,035 $2,484,051 $2,102,656 $2,117,525
Costs per $100 of Payroll $1.02 $1.01 $1.07 $0.87 $0.85
Notes – Coverage: Estimated numbers of employees covered by workers’ compensation are reported in thousands. Covered wages are reported in millions of dollars. Please refer to Appendix A for more information on our coverage estimates. Benefits and Costs: Estimated workers’ compensation benefits and costs are reported by type of insurer (private carriers, state funds, and self-insured employers) in thousands of dollars.

National Academy of Social Insurance
73
OKLAHOMA
Oklahoma State Summary Table: 2012-2016 2012 2013 2014 2015 2016
Coverage
Covered Workers (thousands) 1,406 1,435 1,461 1,472 1,455
Covered Wages (millions) $57,466 $60,015 $62,943 $64,185 $62,791
Benefits (thousands)
Private Carriers $457,752 $466,816 $393,867 $342,486 $316,677
State Fund $245,726 $224,642 $212,875 $232,099 $197,651
Self-Insured $176,401 $151,152 $152,833 $156,590 $144,154
Total Benefits $879,879 $842,610 $759,575 $731,174 $658,483
Medical Benefits (% of total) 44.1% 45.1% 46.5% 47.5% 49.4%
Benefits per $100 of Payroll $1.53 $1.40 $1.21 $1.14 $1.05
Costs (thousands)
Private Carriers $754,545 $766,538 $674,647 $607,367 $541,878
State Fund $320,387 $339,967 $327,152 $305,716 $239,927
Self-Insured $214,144 $184,411 $189,385 $192,652 $155,461
Total Costs $1,289,077 $1,290,915 $1,191,184 $1,105,735 $937,266
Costs per $100 of Payroll $2.24 $2.15 $1.89 $1.72 $1.49
Notes – Coverage: Estimated numbers of employees covered by workers’ compensation are reported in thousands. Covered wages are reported in millions of dollars. Please refer to Appendix A for more information on our coverage estimates. Benefits and Costs: Estimated workers’ compensation benefits and costs are reported by type of insurer (private carriers, state funds, and self-insured employers) in thousands of dollars.
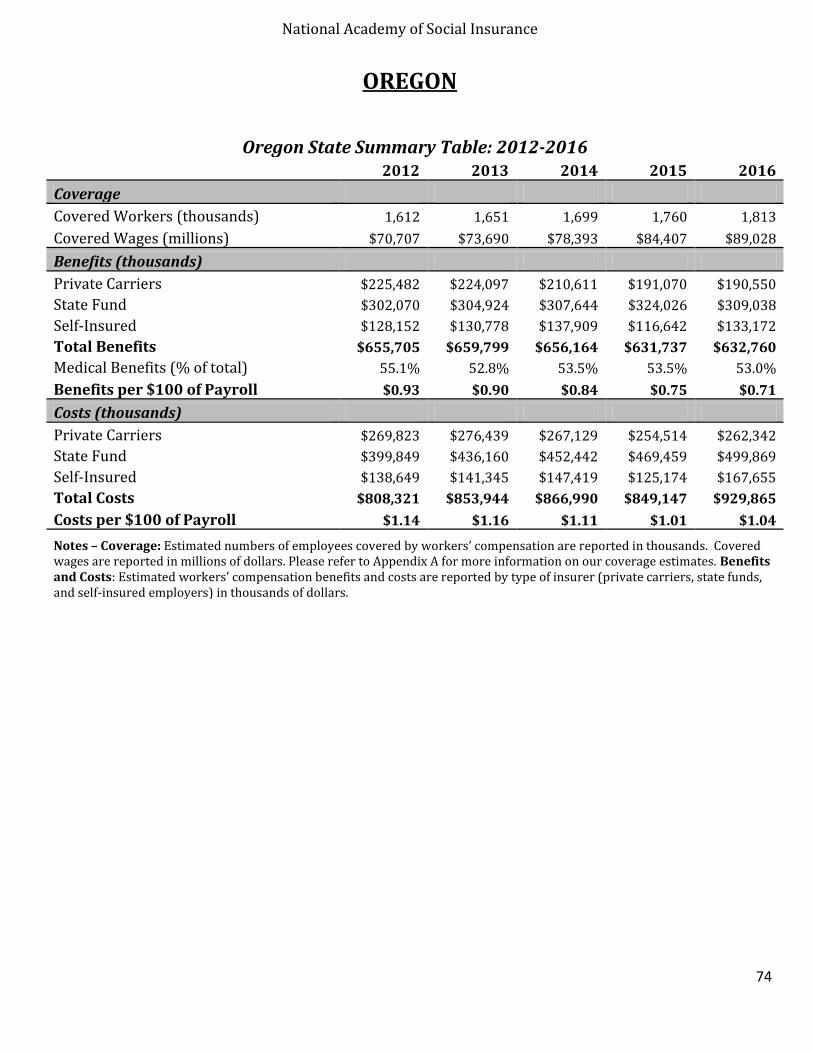
National Academy of Social Insurance
74
OREGON
Oregon State Summary Table: 2012-2016 2012 2013 2014 2015 2016
Coverage
Covered Workers (thousands) 1,612 1,651 1,699 1,760 1,813
Covered Wages (millions) $70,707 $73,690 $78,393 $84,407 $89,028
Benefits (thousands)
Private Carriers $225,482 $224,097 $210,611 $191,070 $190,550
State Fund $302,070 $304,924 $307,644 $324,026 $309,038
Self-Insured $128,152 $130,778 $137,909 $116,642 $133,172
Total Benefits $655,705 $659,799 $656,164 $631,737 $632,760
Medical Benefits (% of total) 55.1% 52.8% 53.5% 53.5% 53.0%
Benefits per $100 of Payroll $0.93 $0.90 $0.84 $0.75 $0.71
Costs (thousands)
Private Carriers $269,823 $276,439 $267,129 $254,514 $262,342
State Fund $399,849 $436,160 $452,442 $469,459 $499,869
Self-Insured $138,649 $141,345 $147,419 $125,174 $167,655
Total Costs $808,321 $853,944 $866,990 $849,147 $929,865
Costs per $100 of Payroll $1.14 $1.16 $1.11 $1.01 $1.04
Notes – Coverage: Estimated numbers of employees covered by workers’ compensation are reported in thousands. Covered wages are reported in millions of dollars. Please refer to Appendix A for more information on our coverage estimates. Benefits and Costs: Estimated workers’ compensation benefits and costs are reported by type of insurer (private carriers, state funds, and self-insured employers) in thousands of dollars.
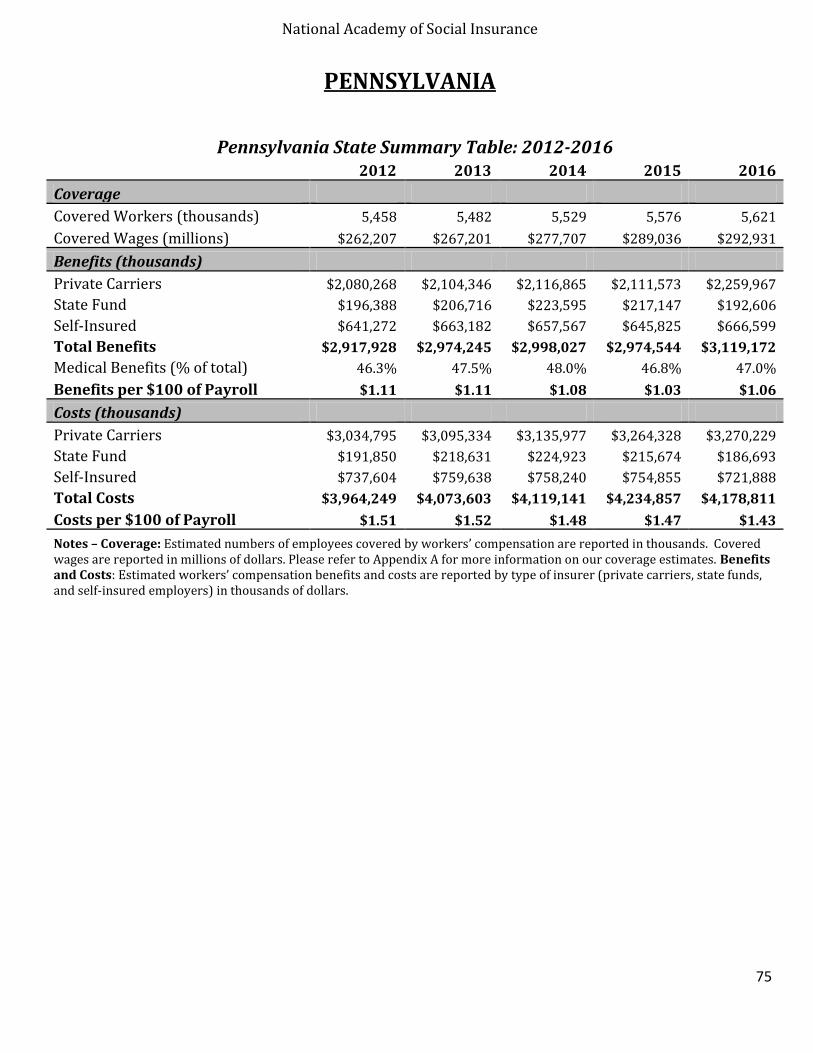
National Academy of Social Insurance
75
PENNSYLVANIA
Pennsylvania State Summary Table: 2012-2016 2012 2013 2014 2015 2016
Coverage
Covered Workers (thousands) 5,458 5,482 5,529 5,576 5,621
Covered Wages (millions) $262,207 $267,201 $277,707 $289,036 $292,931
Benefits (thousands)
Private Carriers $2,080,268 $2,104,346 $2,116,865 $2,111,573 $2,259,967
State Fund $196,388 $206,716 $223,595 $217,147 $192,606
Self-Insured $641,272 $663,182 $657,567 $645,825 $666,599
Total Benefits $2,917,928 $2,974,245 $2,998,027 $2,974,544 $3,119,172
Medical Benefits (% of total) 46.3% 47.5% 48.0% 46.8% 47.0%
Benefits per $100 of Payroll $1.11 $1.11 $1.08 $1.03 $1.06
Costs (thousands)
Private Carriers $3,034,795 $3,095,334 $3,135,977 $3,264,328 $3,270,229
State Fund $191,850 $218,631 $224,923 $215,674 $186,693
Self-Insured $737,604 $759,638 $758,240 $754,855 $721,888
Total Costs $3,964,249 $4,073,603 $4,119,141 $4,234,857 $4,178,811
Costs per $100 of Payroll $1.51 $1.52 $1.48 $1.47 $1.43
Notes – Coverage: Estimated numbers of employees covered by workers’ compensation are reported in thousands. Covered wages are reported in millions of dollars. Please refer to Appendix A for more information on our coverage estimates. Benefits and Costs: Estimated workers’ compensation benefits and costs are reported by type of insurer (private carriers, state funds, and self-insured employers) in thousands of dollars.
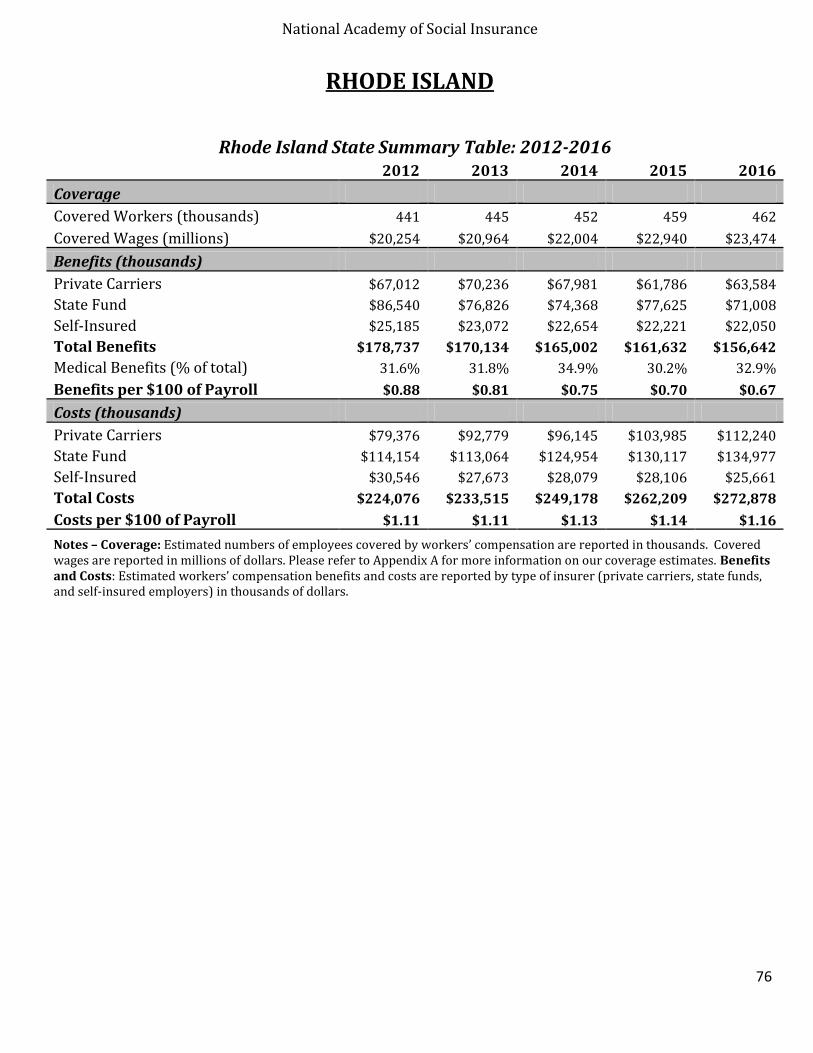
National Academy of Social Insurance
76
RHODE ISLAND
Rhode Island State Summary Table: 2012-2016 2012 2013 2014 2015 2016
Coverage
Covered Workers (thousands) 441 445 452 459 462
Covered Wages (millions) $20,254 $20,964 $22,004 $22,940 $23,474
Benefits (thousands)
Private Carriers $67,012 $70,236 $67,981 $61,786 $63,584
State Fund $86,540 $76,826 $74,368 $77,625 $71,008
Self-Insured $25,185 $23,072 $22,654 $22,221 $22,050
Total Benefits $178,737 $170,134 $165,002 $161,632 $156,642
Medical Benefits (% of total) 31.6% 31.8% 34.9% 30.2% 32.9%
Benefits per $100 of Payroll $0.88 $0.81 $0.75 $0.70 $0.67
Costs (thousands)
Private Carriers $79,376 $92,779 $96,145 $103,985 $112,240
State Fund $114,154 $113,064 $124,954 $130,117 $134,977
Self-Insured $30,546 $27,673 $28,079 $28,106 $25,661
Total Costs $224,076 $233,515 $249,178 $262,209 $272,878
Costs per $100 of Payroll $1.11 $1.11 $1.13 $1.14 $1.16
Notes – Coverage: Estimated numbers of employees covered by workers’ compensation are reported in thousands. Covered wages are reported in millions of dollars. Please refer to Appendix A for more information on our coverage estimates. Benefits and Costs: Estimated workers’ compensation benefits and costs are reported by type of insurer (private carriers, state funds, and self-insured employers) in thousands of dollars.

National Academy of Social Insurance
77
SOUTH CAROLINA
South Carolina State Summary Table: 2012-2016 2012 2013 2014 2015 2016
Coverage
Covered Workers (thousands) 1,717 1,755 1,804 1,858 1,904
Covered Wages (millions) $66,736 $69,139 $72,860 $77,269 $80,863
Benefits (thousands)
Private Carriers $592,982 $614,774 $615,575 $611,809 $629,176
State Fund $67,310 $68,777 $71,118 $66,790 $63,375
Self-Insured $210,615 $206,164 $208,836 $211,576 $210,344
Total Benefits $870,907 $889,715 $895,530 $890,175 $902,895
Medical Benefits (% of total) 43.7% 46.3% 45.5% 45.8% 45.2%
Benefits per $100 of Payroll $1.30 $1.29 $1.23 $1.15 $1.12
Costs (thousands)
Private Carriers $877,658 $933,245 $963,784 $984,087 $1,036,523
State Fund $69,200 $73,950 $78,750 $76,900 $76,000
Self-Insured $279,296 $257,053 $275,310 $279,824 $282,064
Total Costs $1,226,154 $1,264,249 $1,317,844 $1,340,811 $1,394,586
Costs per $100 of Payroll $1.84 $1.83 $1.81 $1.74 $1.72
Notes – Coverage: Estimated numbers of employees covered by workers’ compensation are reported in thousands. Covered wages are reported in millions of dollars. Please refer to Appendix A for more information on our coverage estimates. Benefits and Costs: Estimated workers’ compensation benefits and costs are reported by type of insurer (private carriers, state funds, and self-insured employers) in thousands of dollars.
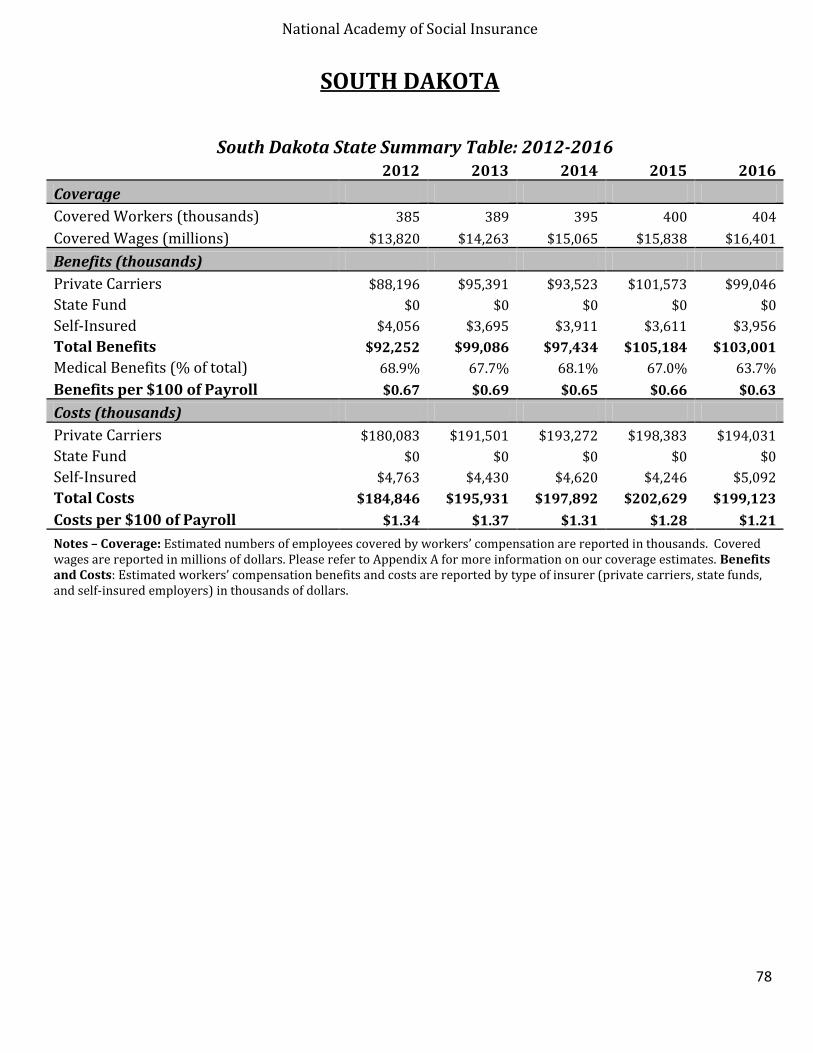
National Academy of Social Insurance
78
SOUTH DAKOTA
South Dakota State Summary Table: 2012-2016 2012 2013 2014 2015 2016
Coverage
Covered Workers (thousands) 385 389 395 400 404
Covered Wages (millions) $13,820 $14,263 $15,065 $15,838 $16,401
Benefits (thousands)
Private Carriers $88,196 $95,391 $93,523 $101,573 $99,046
State Fund $0 $0 $0 $0 $0
Self-Insured $4,056 $3,695 $3,911 $3,611 $3,956
Total Benefits $92,252 $99,086 $97,434 $105,184 $103,001
Medical Benefits (% of total) 68.9% 67.7% 68.1% 67.0% 63.7%
Benefits per $100 of Payroll $0.67 $0.69 $0.65 $0.66 $0.63
Costs (thousands)
Private Carriers $180,083 $191,501 $193,272 $198,383 $194,031
State Fund $0 $0 $0 $0 $0
Self-Insured $4,763 $4,430 $4,620 $4,246 $5,092
Total Costs $184,846 $195,931 $197,892 $202,629 $199,123
Costs per $100 of Payroll $1.34 $1.37 $1.31 $1.28 $1.21
Notes – Coverage: Estimated numbers of employees covered by workers’ compensation are reported in thousands. Covered wages are reported in millions of dollars. Please refer to Appendix A for more information on our coverage estimates. Benefits and Costs: Estimated workers’ compensation benefits and costs are reported by type of insurer (private carriers, state funds, and self-insured employers) in thousands of dollars.
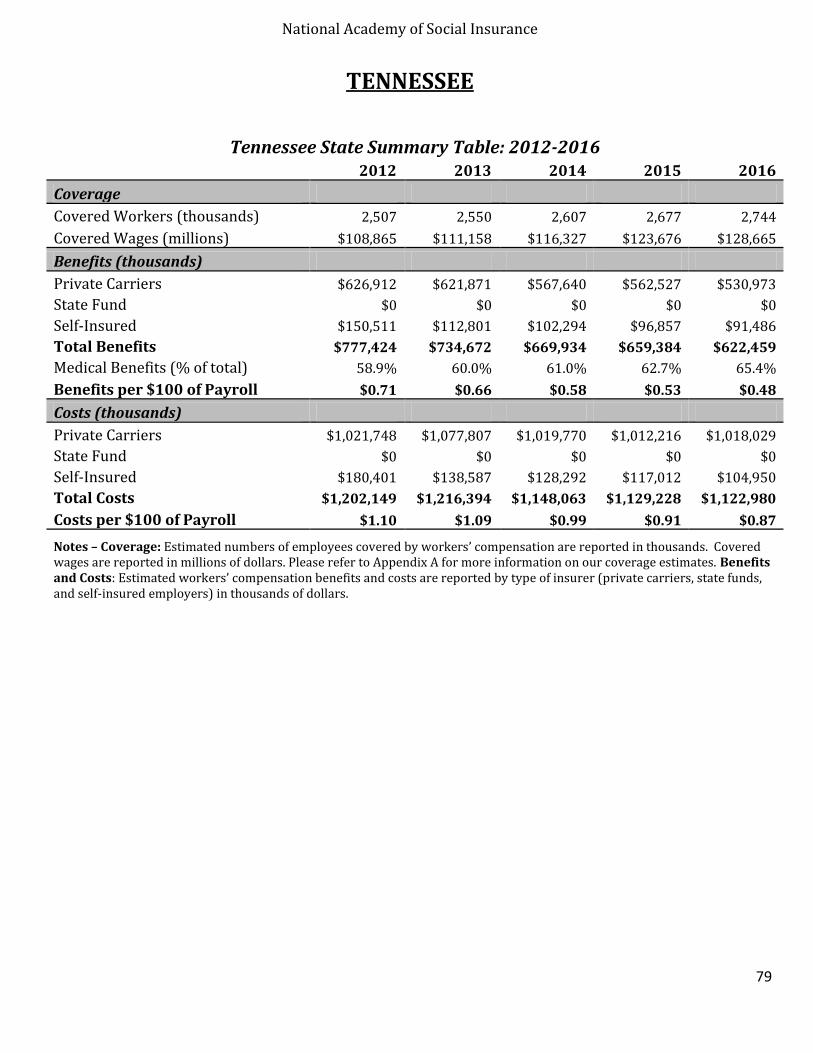
National Academy of Social Insurance
79
TENNESSEE
Tennessee State Summary Table: 2012-2016 2012 2013 2014 2015 2016
Coverage
Covered Workers (thousands) 2,507 2,550 2,607 2,677 2,744
Covered Wages (millions) $108,865 $111,158 $116,327 $123,676 $128,665
Benefits (thousands)
Private Carriers $626,912 $621,871 $567,640 $562,527 $530,973
State Fund $0 $0 $0 $0 $0
Self-Insured $150,511 $112,801 $102,294 $96,857 $91,486
Total Benefits $777,424 $734,672 $669,934 $659,384 $622,459
Medical Benefits (% of total) 58.9% 60.0% 61.0% 62.7% 65.4%
Benefits per $100 of Payroll $0.71 $0.66 $0.58 $0.53 $0.48
Costs (thousands)
Private Carriers $1,021,748 $1,077,807 $1,019,770 $1,012,216 $1,018,029
State Fund $0 $0 $0 $0 $0
Self-Insured $180,401 $138,587 $128,292 $117,012 $104,950
Total Costs $1,202,149 $1,216,394 $1,148,063 $1,129,228 $1,122,980
Costs per $100 of Payroll $1.10 $1.09 $0.99 $0.91 $0.87
Notes – Coverage: Estimated numbers of employees covered by workers’ compensation are reported in thousands. Covered wages are reported in millions of dollars. Please refer to Appendix A for more information on our coverage estimates. Benefits and Costs: Estimated workers’ compensation benefits and costs are reported by type of insurer (private carriers, state funds, and self-insured employers) in thousands of dollars.
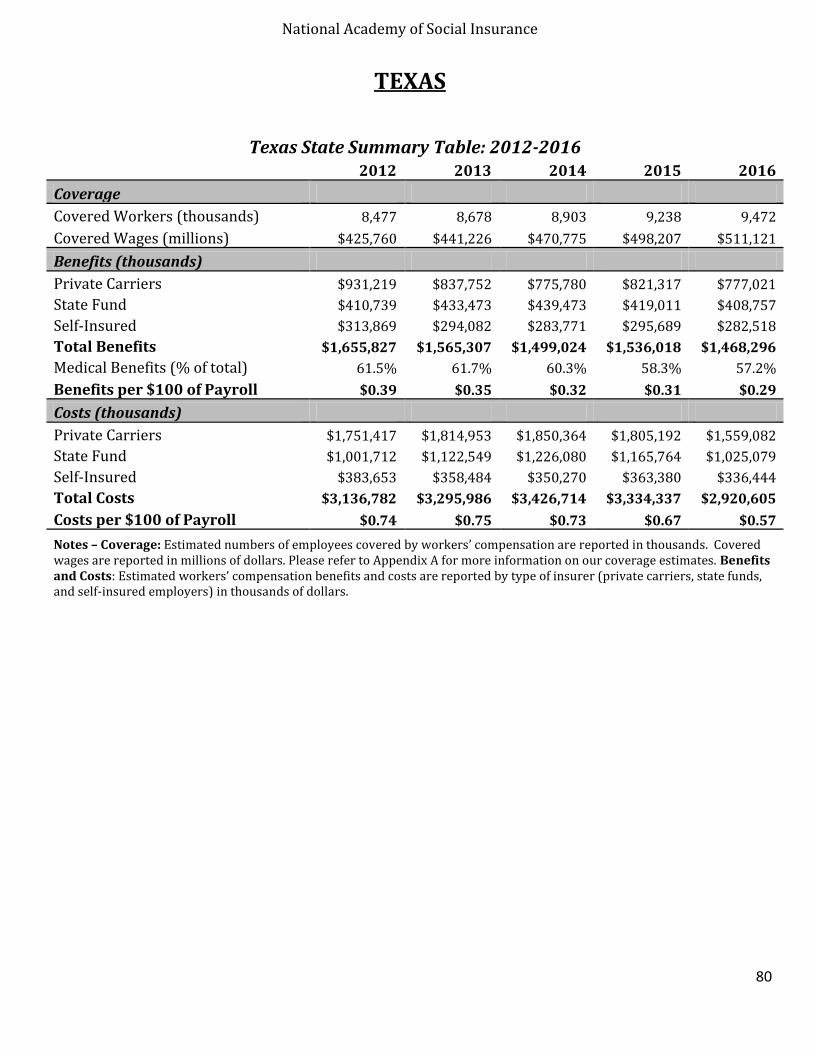
National Academy of Social Insurance
80
TEXAS
Texas State Summary Table: 2012-2016 2012 2013 2014 2015 2016
Coverage
Covered Workers (thousands) 8,477 8,678 8,903 9,238 9,472
Covered Wages (millions) $425,760 $441,226 $470,775 $498,207 $511,121
Benefits (thousands)
Private Carriers $931,219 $837,752 $775,780 $821,317 $777,021
State Fund $410,739 $433,473 $439,473 $419,011 $408,757
Self-Insured $313,869 $294,082 $283,771 $295,689 $282,518
Total Benefits $1,655,827 $1,565,307 $1,499,024 $1,536,018 $1,468,296
Medical Benefits (% of total) 61.5% 61.7% 60.3% 58.3% 57.2%
Benefits per $100 of Payroll $0.39 $0.35 $0.32 $0.31 $0.29
Costs (thousands)
Private Carriers $1,751,417 $1,814,953 $1,850,364 $1,805,192 $1,559,082
State Fund $1,001,712 $1,122,549 $1,226,080 $1,165,764 $1,025,079
Self-Insured $383,653 $358,484 $350,270 $363,380 $336,444
Total Costs $3,136,782 $3,295,986 $3,426,714 $3,334,337 $2,920,605
Costs per $100 of Payroll $0.74 $0.75 $0.73 $0.67 $0.57
Notes – Coverage: Estimated numbers of employees covered by workers’ compensation are reported in thousands. Covered wages are reported in millions of dollars. Please refer to Appendix A for more information on our coverage estimates. Benefits and Costs: Estimated workers’ compensation benefits and costs are reported by type of insurer (private carriers, state funds, and self-insured employers) in thousands of dollars.

National Academy of Social Insurance
81
UTAH
Utah State Summary Table: 2012-2016 2012 2013 2014 2015 2016
Coverage
Covered Workers (thousands) 1,177 1,216 1,253 1,301 1,348
Covered Wages (millions) $47,795 $50,081 $53,039 $56,871 $60,227
Benefits (thousands)
Private Carriers $111,775 $99,411 $94,846 $98,139 $97,173
State Fund $126,189 $128,517 $126,356 $131,621 $129,152
Self-Insured $46,381 $42,360 $37,906 $39,128 $48,835
Total Benefits $284,345 $270,288 $259,108 $268,887 $275,160
Medical Benefits (% of total) 70.5% 69.9% 70.4% 68.0% 69.3%
Benefits per $100 of Payroll $0.59 $0.54 $0.49 $0.47 $0.46
Costs (thousands)
Private Carriers $191,463 $198,740 $213,543 $216,459 $230,440
State Fund $193,379 $209,470 $226,771 $235,405 $240,574
Self-Insured $54,469 $50,915 $46,557 $47,779 $60,230
Total Costs $439,311 $459,126 $486,871 $499,643 $531,244
Costs per $100 of Payroll $0.92 $0.92 $0.92 $0.88 $0.88
Notes – Coverage: Estimated numbers of employees covered by workers’ compensation are reported in thousands. Covered wages are reported in millions of dollars. Please refer to Appendix A for more information on our coverage estimates. Benefits and Costs: Estimated workers’ compensation benefits and costs are reported by type of insurer (private carriers, state funds, and self-insured employers) in thousands of dollars.

National Academy of Social Insurance
82
VERMONT
Vermont State Summary Table: 2012-2016 2012 2013 2014 2015 2016
Coverage
Covered Workers (thousands) 290 292 295 298 298
Covered Wages (millions) $11,739 $12,133 $12,533 $12,983 $13,248
Benefits (thousands)
Private Carriers $127,918 $132,416 $131,762 $130,817 $122,270
State Fund $0 $0 $0 $0 $0
Self-Insured $18,123 $18,571 $18,797 $18,864 $17,622
Total Benefits $146,041 $150,987 $150,560 $149,681 $139,892
Medical Benefits (% of total) 50.0% 49.0% 52.1% 52.0% 51.0%
Benefits per $100 of Payroll $1.24 $1.24 $1.20 $1.15 $1.06
Costs (thousands)
Private Carriers $193,117 $216,660 $205,186 $215,125 $217,726
State Fund $0 $0 $0 $0 $0
Self-Insured $20,070 $20,687 $20,964 $21,116 $21,693
Total Costs $213,187 $237,347 $226,150 $236,241 $239,419
Costs per $100 of Payroll $1.82 $1.96 $1.80 $1.82 $1.81
Notes – Coverage: Estimated numbers of employees covered by workers’ compensation are reported in thousands. Covered wages are reported in millions of dollars. Please refer to Appendix A for more information on our coverage estimates. Benefits and Costs: Estimated workers’ compensation benefits and costs are reported by type of insurer (private carriers, state funds, and self-insured employers) in thousands of dollars.
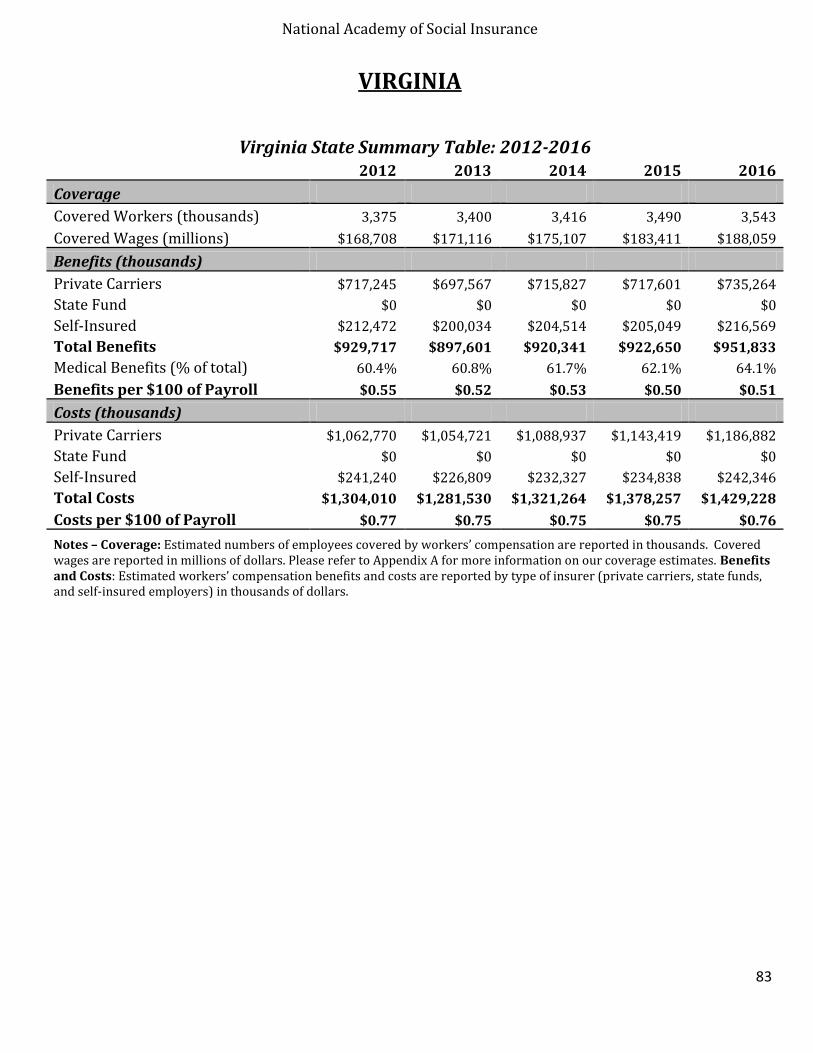
National Academy of Social Insurance
83
VIRGINIA
Virginia State Summary Table: 2012-2016 2012 2013 2014 2015 2016
Coverage
Covered Workers (thousands) 3,375 3,400 3,416 3,490 3,543
Covered Wages (millions) $168,708 $171,116 $175,107 $183,411 $188,059
Benefits (thousands)
Private Carriers $717,245 $697,567 $715,827 $717,601 $735,264
State Fund $0 $0 $0 $0 $0
Self-Insured $212,472 $200,034 $204,514 $205,049 $216,569
Total Benefits $929,717 $897,601 $920,341 $922,650 $951,833
Medical Benefits (% of total) 60.4% 60.8% 61.7% 62.1% 64.1%
Benefits per $100 of Payroll $0.55 $0.52 $0.53 $0.50 $0.51
Costs (thousands)
Private Carriers $1,062,770 $1,054,721 $1,088,937 $1,143,419 $1,186,882
State Fund $0 $0 $0 $0 $0
Self-Insured $241,240 $226,809 $232,327 $234,838 $242,346
Total Costs $1,304,010 $1,281,530 $1,321,264 $1,378,257 $1,429,228
Costs per $100 of Payroll $0.77 $0.75 $0.75 $0.75 $0.76
Notes – Coverage: Estimated numbers of employees covered by workers’ compensation are reported in thousands. Covered wages are reported in millions of dollars. Please refer to Appendix A for more information on our coverage estimates. Benefits and Costs: Estimated workers’ compensation benefits and costs are reported by type of insurer (private carriers, state funds, and self-insured employers) in thousands of dollars.
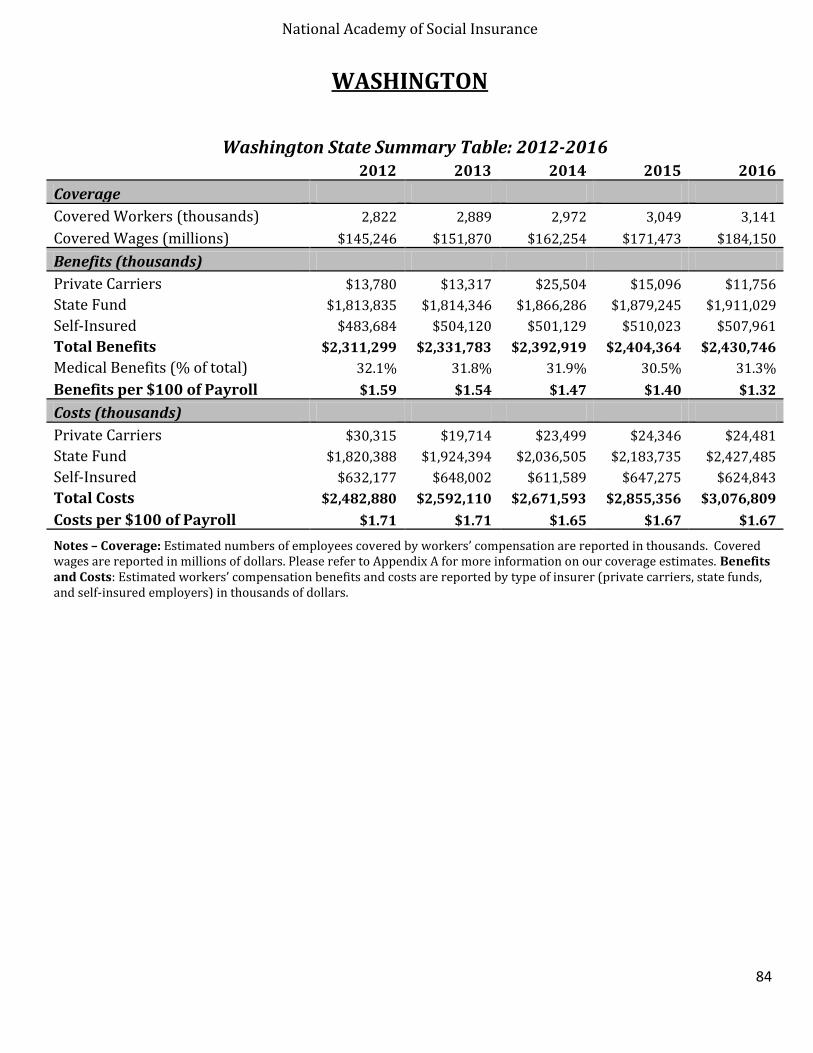
National Academy of Social Insurance
84
WASHINGTON
Washington State Summary Table: 2012-2016 2012 2013 2014 2015 2016
Coverage
Covered Workers (thousands) 2,822 2,889 2,972 3,049 3,141
Covered Wages (millions) $145,246 $151,870 $162,254 $171,473 $184,150
Benefits (thousands)
Private Carriers $13,780 $13,317 $25,504 $15,096 $11,756
State Fund $1,813,835 $1,814,346 $1,866,286 $1,879,245 $1,911,029
Self-Insured $483,684 $504,120 $501,129 $510,023 $507,961
Total Benefits $2,311,299 $2,331,783 $2,392,919 $2,404,364 $2,430,746
Medical Benefits (% of total) 32.1% 31.8% 31.9% 30.5% 31.3%
Benefits per $100 of Payroll $1.59 $1.54 $1.47 $1.40 $1.32
Costs (thousands)
Private Carriers $30,315 $19,714 $23,499 $24,346 $24,481
State Fund $1,820,388 $1,924,394 $2,036,505 $2,183,735 $2,427,485
Self-Insured $632,177 $648,002 $611,589 $647,275 $624,843
Total Costs $2,482,880 $2,592,110 $2,671,593 $2,855,356 $3,076,809
Costs per $100 of Payroll $1.71 $1.71 $1.65 $1.67 $1.67
Notes – Coverage: Estimated numbers of employees covered by workers’ compensation are reported in thousands. Covered wages are reported in millions of dollars. Please refer to Appendix A for more information on our coverage estimates. Benefits and Costs: Estimated workers’ compensation benefits and costs are reported by type of insurer (private carriers, state funds, and self-insured employers) in thousands of dollars.

National Academy of Social Insurance
85
WEST VIRGNIA
West Virginia State Summary Table: 2012-2016 2012 2013 2014 2015 2016
Coverage
Covered Workers (thousands) 674 668 665 661 649
Covered Wages (millions) $26,114 $26,218 $26,741 $26,888 $26,336
Benefits (thousands)
Private Carriers $182,968 $171,087 $160,668 $162,168 $158,710
State Fund $230,907 $199,763 $193,243 $184,814 $179,024
Self-Insured $63,035 $64,884 $65,758 $67,358 $76,028
Total Benefits $476,910 $435,734 $419,669 $414,340 $413,762
Medical Benefits (% of total) 50.4% 52.3% 49.0% 49.3% 47.9%
Benefits per $100 of Payroll $1.83 $1.66 $1.57 $1.54 $1.57
Costs (thousands)
Private Carriers $412,264 $370,907 $345,264 $349,588 $287,495
State Fund $0 $0 $0 $0 $0
Self-Insured $77,037 $79,180 $78,330 $81,605 $95,182
Total Costs $489,301 $450,086 $423,594 $431,193 $382,677
Costs per $100 of Payroll $1.87 $1.72 $1.58 $1.60 $1.45
Notes – Coverage: Estimated numbers of employees covered by workers’ compensation are reported in thousands. Covered wages are reported in millions of dollars. Please refer to Appendix A for more information on our coverage estimates. Benefits and Costs: Estimated workers’ compensation benefits and costs are reported by type of insurer (private carriers, state funds, and self-insured employers) in thousands of dollars.

National Academy of Social Insurance
86
WISCONSIN
Wisconsin State Summary Table: 2012-2016 2012 2013 2014 2015 2016
Coverage
Covered Workers (thousands) 2,601 2,628 2,666 2,701 2,734
Covered Wages (millions) $108,688 $111,983 $116,352 $122,023 $125,303
Benefits (thousands)
Private Carriers $975,985 $1,024,714 $1,066,463 $1,036,310 $1,026,970
State Fund $0 $0 $0 $0 $0
Self-Insured $147,875 $142,158 $137,539 $133,445 $142,599
Total Benefits $1,123,861 $1,166,872 $1,204,002 $1,169,754 $1,169,568
Medical Benefits (% of total) 69.6% 77.1% 77.6% 77.2% 78.2%
Benefits per $100 of Payroll $1.03 $1.04 $1.03 $0.96 $0.93
Costs (thousands)
Private Carriers $1,737,652 $1,761,103 $1,817,668 $1,953,797 $2,017,159
State Fund $0 $0 $0 $0 $0
Self-Insured $165,526 $159,845 $154,315 $150,540 $171,501
Total Costs $1,903,178 $1,920,948 $1,971,983 $2,104,336 $2,188,660
Costs per $100 of Payroll $1.75 $1.72 $1.69 $1.72 $1.75
Notes – Coverage: Estimated numbers of employees covered by workers’ compensation are reported in thousands. Covered wages are reported in millions of dollars. Please refer to Appendix A for more information on our coverage estimates. Benefits and Costs: Estimated workers’ compensation benefits and costs are reported by type of insurer (private carriers, state funds, and self-insured employers) in thousands of dollars.
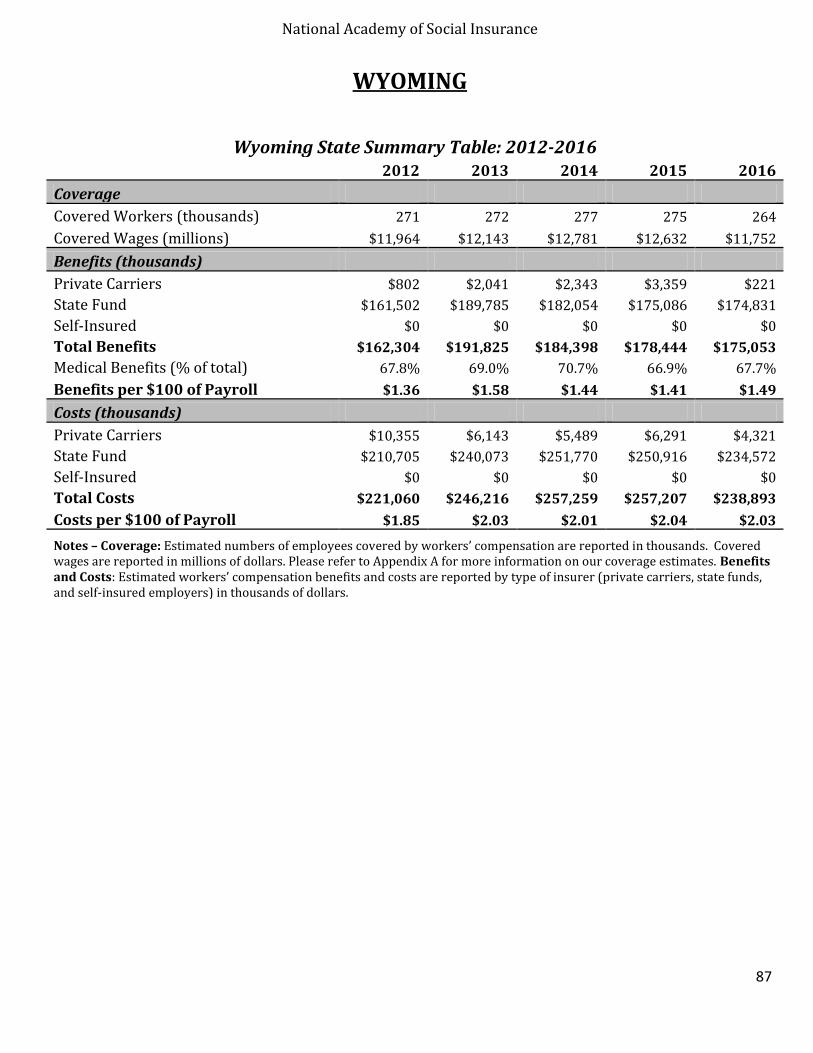
National Academy of Social Insurance
87
WYOMING
Wyoming State Summary Table: 2012-2016 2012 2013 2014 2015 2016
Coverage
Covered Workers (thousands) 271 272 277 275 264
Covered Wages (millions) $11,964 $12,143 $12,781 $12,632 $11,752
Benefits (thousands)
Private Carriers $802 $2,041 $2,343 $3,359 $221
State Fund $161,502 $189,785 $182,054 $175,086 $174,831
Self-Insured $0 $0 $0 $0 $0
Total Benefits $162,304 $191,825 $184,398 $178,444 $175,053
Medical Benefits (% of total) 67.8% 69.0% 70.7% 66.9% 67.7%
Benefits per $100 of Payroll $1.36 $1.58 $1.44 $1.41 $1.49
Costs (thousands)
Private Carriers $10,355 $6,143 $5,489 $6,291 $4,321
State Fund $210,705 $240,073 $251,770 $250,916 $234,572
Self-Insured $0 $0 $0 $0 $0
Total Costs $221,060 $246,216 $257,259 $257,207 $238,893
Costs per $100 of Payroll $1.85 $2.03 $2.01 $2.04 $2.03
Notes – Coverage: Estimated numbers of employees covered by workers’ compensation are reported in thousands. Covered wages are reported in millions of dollars. Please refer to Appendix A for more information on our coverage estimates. Benefits and Costs: Estimated workers’ compensation benefits and costs are reported by type of insurer (private carriers, state funds, and self-insured employers) in thousands of dollars.
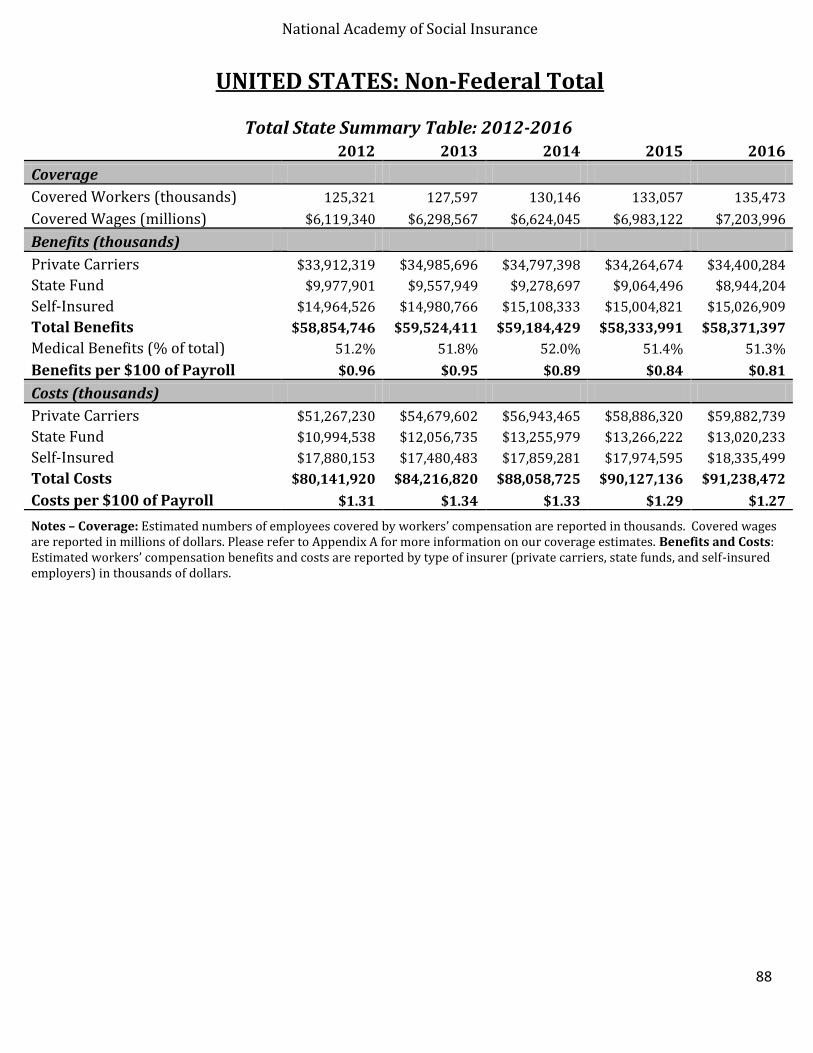
National Academy of Social Insurance
88
UNITED STATES: Non-Federal Total
Total State Summary Table: 2012-2016 2012 2013 2014 2015 2016
Coverage
Covered Workers (thousands) 125,321 127,597 130,146 133,057 135,473
Covered Wages (millions) $6,119,340 $6,298,567 $6,624,045 $6,983,122 $7,203,996
Benefits (thousands)
Private Carriers $33,912,319 $34,985,696 $34,797,398 $34,264,674 $34,400,284
State Fund $9,977,901 $9,557,949 $9,278,697 $9,064,496 $8,944,204
Self-Insured $14,964,526 $14,980,766 $15,108,333 $15,004,821 $15,026,909
Total Benefits $58,854,746 $59,524,411 $59,184,429 $58,333,991 $58,371,397
Medical Benefits (% of total) 51.2% 51.8% 52.0% 51.4% 51.3%
Benefits per $100 of Payroll $0.96 $0.95 $0.89 $0.84 $0.81
Costs (thousands)
Private Carriers $51,267,230 $54,679,602 $56,943,465 $58,886,320 $59,882,739
State Fund $10,994,538 $12,056,735 $13,255,979 $13,266,222 $13,020,233
Self-Insured $17,880,153 $17,480,483 $17,859,281 $17,974,595 $18,335,499
Total Costs $80,141,920 $84,216,820 $88,058,725 $90,127,136 $91,238,472
Costs per $100 of Payroll $1.31 $1.34 $1.33 $1.29 $1.27
Notes – Coverage: Estimated numbers of employees covered by workers’ compensation are reported in thousands. Covered wages are reported in millions of dollars. Please refer to Appendix A for more information on our coverage estimates. Benefits and Costs: Estimated workers’ compensation benefits and costs are reported by type of insurer (private carriers, state funds, and self-insured employers) in thousands of dollars.