the costs and benefits of electrifying electrifying rural ghana ...
88
THE COSTS AND BENEFITS OF THE COSTS AND BENEFITS OF ELECTRIFYING ELECTRIFYING RURAL GHANA RURAL GHANA NATIONAL DEVELOPMENT PLANNING COMMISSION COPENHAGEN CONSENSUS CENTER FRANCIS KEMAUSUOR KWAKU AMANING ADJEI JOHN BOSCO DRAMANI PRINCE BOAKYE FRIMPONG Director The Brew-Hammond Energy Centre, KNUST, Kumasi Senior Lecturer and Fellow The Brew-Hammond Energy Centre, KNUST, Kumasi Lecturer, Department of Economics, Kwame University of Science and Technology, Ghana, Kumasi Lecturer, Department of Economics, Kwame University of Science and Technology, Ghana, Kumasi
-
Upload
khangminh22 -
Category
Documents
-
view
3 -
download
0
Transcript of the costs and benefits of electrifying electrifying rural ghana ...
THE COSTS AND BENEFITS OFTHE COSTS AND BENEFITS OF
ELECTRIFYING ELECTRIFYING RURAL GHANARURAL GHANA
NATIONAL DEVELOPMENT PLANNING COMMISSION
COPENHAGEN CONSENSUS CENTER
FRANCIS KEMAUSUOR
KWAKU AMANING ADJEI
JOHN BOSCO DRAMANI
PRINCE BOAKYE FRIMPONG
DirectorThe Brew-Hammond Energy Centre, KNUST, Kumasi
Senior Lecturer and FellowThe Brew-Hammond Energy Centre, KNUST, Kumasi
Lecturer, Department of Economics, Kwame University of Science and Technology, Ghana, Kumasi
Lecturer, Department of Economics, Kwame University of Science and Technology, Ghana, Kumasi

© 2020 Copenhagen Consensus Center [email protected] www.copenhagenconsensus.com This work has been produced as a part of the Ghana Priorities project.
Some rights reserved
This work is available under the Creative Commons Attribution 4.0 International license (CC BY 4.0). Under the Creative Commons Attribution license, you are free to copy, distribute, transmit, and adapt this work, including for commercial purposes, under the following conditions:
Attribution Please cite the work as follows: #AUTHOR NAME#, #PAPER TITLE#, Ghana Priorities, Copenhagen Consensus Center, 2020. License: Creative Commons Attribution CC BY 4.0.
Third-party-content Copenhagen Consensus Center does not necessarily own each component of the content contained within the work. If you wish to re-use a component of the work, it is your responsibility to determine whether permission is needed for that re-use and to obtain permission from the copyright owner. Examples of components can include, but are not limited to, tables, figures, or images.

PRELIMINARY DRAFT AS OF APRIL 29, 2020
The Costs and Benefits of Electrifying
Rural Ghana
Ghana Priorities
Francis Kemausuor, Kwaku Amaning Adjei, John Bosco Dramani, Prince Boakye Frimpong,
and the Copenhagen Consensus Center

I
Academic Abstract
This short note brings together information contained in two essays to conduct cost-benefit
analyses of interventions to expand electrification in rural Ghana. We estimate the return on
investment of three interventions:
• Grid expansion to communities for which the grid is the least-costly solution (less-
remote communities)
• Solar and diesel micro-grids to suitable remaining communities
• Grid expansion to remaining communities of more than 200 people
Our results indicate that grid expansion to communities where grid is the least-costly solution,
has the highest benefit-cost ratio (BCR) of 4.5. Microgrid expansion for suitable remote
communities has a BCR of 1.7-1.8 depending on the technology type and discount rate, while
grid expansion to more remote communities has a BCR of 1.1. The results indicate that it is
more cost-effective to electrify a subset of rural households, typically those that are less remote,
with higher electricity demand and near existing grid infrastructure. For households in more
remote communities, providing grid-based electricity just passes a cost-benefit test. If
electrification is deemed a must-have by policy-makers, then providing microgrids to remote
communities does yield slightly higher BCR than grid electrification to these same
communities under current conditions. These results are based on a large jump in consumption
due to electrification. More modest assumptions in line with experience in other countries
produce lower BCRs but do not change the rank order of interventions.

II
Policy Abstract
The problem
According to Ghana Energy Commission (2019), the electricity access rate in rural areas was
67.2% in 2018. The recently published Ghana Living Standards Survey (Ghana Statistical
Service, 2019), indicates that regions in the northern parts of the country have much lower
access to electricity, compared to regions in the southern parts of the country. In all three
northern regions, national grid connection is less than 70%. This unfortunate situation emanates
from the fact that most communities in the northern parts of the country are mostly of lower
population densities and are quite far from major medium voltage lines. Furthermore, many of
these communities are difficult to access due to poor road infrastructure and difficult terrain.
The analysis in this report focuses on the Gushiegu Municipality of the Northern Region. It is
assumed that this region is representative of other unelectrified rural communities, and the
policy implications arising from this analysis are therefore broadly applicable across rural
Ghana.
Intervention 1: Expand grid-based electrification to less
remote communities
Overview
This intervention extends the national grid to 79 communities with a population of around
40,000. In the first year 4,547 people will be connected corresponding to 743 households. In
2027 no more capital investment is required and 42,000 people (7,005 households) will be
connected. Over time as the population expands, the number of households will grow within
the community such that by 2040, 55,334 people across 9,222 households are connected to the
grid without any additional large-scale capital investment required.
Costs
The intervention will require GHS 59m in investments over 8 years, using an 8% discount rate.
Cost of electricity generation is assumed to equal 31 GHp per kWh, and distribution 45.2 GHp
per kWh based on tariffs set by the regulatory agency in Ghana. The total discounted costs are

III
GHS 59m of investment (GHS 6,378 per household) and GHS 42m in ongoing operations and
maintenance costs (GHS 4,563 per household) for a total of GHS 101m (10,940) over 20 years.
Benefits
The intervention will lead to several benefits including a 46% increase in household income
and improved health services. These benefits are worth GHS 378m (GHS 40,973 per
household) and 74m (GHS 7,976 per household), respectively. Total benefits are 4.5 times the
cost.
Intervention 2: Microgrids for selected ‘more remote
communities’
Overview
A micro-grid generates less than 10MW of electricity and distributes to a limited number of
customers via a distribution grid that can operate in isolation from national electricity
transmission networks. Here we consider both diesel and solar micro-grid options. The
modelling suggests diesel micro-grids are suitable for 3 communities with expected higher
energy demand (300 households), while solar micro-grids are suitable for 46 communities
(1911 households).
Costs
For diesel microgrids, the levelized cost is GHS 4.3 ($0.94) per kWh and includes all
investment, maintenance, distribution and fuel costs. For solar microgrids the levelized cost is
GHS 5.1. For diesel microgrids there are also a small amount of negative externalities
associated with reduced health from exposure to air pollution and carbon emissions.
Benefits
For diesel microgrids, main benefit is an increase in household income equivalent to GHS
39,454 per household over the time period of analysis. There is also an improvement in health
associated with electrification equivalent to GHS 5,891 per household. For solar micro-grids
the main benefit is an increase in household income equivalen to GHS 28,137 per household.

IV
There is also an improvement in health associated with electrification equivalent to GHS 5,912
per household.
Intervention 3: Expand grid-based electrification to more
remote communities
Overview
This intervention models costs and benefits for expanding the grid to more remote communities
above a threshold value of 200 people for a total of 2,493 households.
Costs
The costs of the intervention include an investment cost of GHS 58m (GHS 23,224 per
household) and ongoing operations and maintenance cost of GHS 25m (GHS 10,026 per
household) over 20 years.
Benefits
The main benefit is an expected income increase of GHS 84m (GHS 33,782 per household)
over 20 years. Additional health benefits are worth GHS 7m (GHS 2,979 per household)

V
Costs (GHS millions)
Benefits (GHS millions) BCR
Electricity grid for less remote communities 100.9 451.4 4.5 Diesel micro-grid for more remote communities 7.6 13.6 1.8 Solar micro-grid for more remote communities 38.4 65.1 1.7 Electricity grid for more remote communities 82.9 91.6 1.1
Costs per household (GHS)
Benefits per household (GHS) BCR
Electricity grid for less remote communities 10,940 48,948 4.5 Diesel micro-grid for more remote communities 25,358 45,344 1.8 Solar micro-grid for more remote communities 20,099 34,048 1.7 Electricity grid for more remote communities 33,250 36,761 1.1

VI
INTRODUCTION ............................................................................................................................................... 1
INTERVENTION 1: EXPAND GRID-BASED ELECTRIFICATION TO LESS REMOTE COMMUNITIES .......................... 2
OVERVIEW ...................................................................................................................................................... 2
COSTS AND BENEFITS ........................................................................................................................................ 3
Costs ....................................................................................................................................................... 3
Benefits ................................................................................................................................................... 3
SUMMARY OF RESULTS ...................................................................................................................................... 5
DISCUSSION AND SENSITIVITY ANALYSIS ................................................................................................................. 5
INTERVENTION 2: MICROGRIDS FOR SELECTED ‘MORE REMOTE COMMUNITIES’ ............................................ 7
OVERVIEW ...................................................................................................................................................... 7
Diesel Micro-grids.................................................................................................................................... 7
COSTS AND BENEFITS ........................................................................................................................................ 7
Costs ....................................................................................................................................................... 7
Benefits ................................................................................................................................................... 8
SUMMARY OF RESULTS ...................................................................................................................................... 8
DISCUSSION AND SENSITIVITY ANALYSIS ................................................................................................................. 9
Solar Micro-grids ..................................................................................................................................... 9
COSTS AND BENEFITS ........................................................................................................................................ 9
Costs ....................................................................................................................................................... 9
Benefits ................................................................................................................................................... 9
SUMMARY OF RESULTS .................................................................................................................................... 10
DISCUSSION AND SENSITIVITY ANALYSIS ............................................................................................................... 10
INTERVENTION 3: EXPAND GRID-BASED ELECTRIFICATION TO MORE REMOTE COMMUNITIES ..................... 11
OVERVIEW .................................................................................................................................................... 11
COSTS ......................................................................................................................................................... 11
BENEFITS ...................................................................................................................................................... 11
SUMMARY OF RESULTS .................................................................................................................................... 12
DISCUSSION AND SENSITIVITY ANALYSIS ............................................................................................................... 12
CONCLUSION ................................................................................................................................................. 13
REFERENCES ................................................................................................................................................... 15

1
Introduction
According to Ghana Energy Commission (2019), the electricity access rate in rural areas was
67.2% in 2018. The recently published Ghana Living Standards Survey (Ghana Statistical
Service, 2019), indicates that regions in the northern parts of the country have much lower
access to electricity, compared to regions in the southern parts of the country. In all three
northern regions, national grid connection is less than 70%. This unfortunate situation emanates
from the fact that most communities in the northern parts of the country are mostly of lower
population densities and are quite far from major medium voltage lines. Furthermore, many of
these communities are difficult to access due to poor road infrastructure and difficult terrain.
A combination of energy solutions is required in order to bridge the gap in an optimal way.
Such combinations could involve the use of both renewable and non-renewable sources of
energy through grid extensions and the development of local off-grid solutions.
This short note brings together information contained in two detailed essays to conduct cost-
benefit analyses of interventions to expand electrification in rural Ghana. The first essay,
Kemausour and Adjei (2020), uses geo-spatial software to model the least-cost technology mix
required to electrify a series of unelectrified communities in the Gushiegu Municipality of the
Northern Region. Their analysis indicates that for 79 communities with a population of
~42,000, expanding the national grid would be the most cost-effective option, requiring an
(undiscounted) investment of GHc 80 million over seven years, while installing a mix of solar
and diesel microgrids for 14,000 people in remote communities would require capital
investments of GHc 20 million. The second essay, Dramani and Frimpong (2020) uses three
waves of Ghana Living Standard Surveys, along with data on electrification to conduct
difference-in-difference analyses of the impact of electrification on welfare. The headline
figure from their analysis is that connecting to the grid generates a 46% increase in household
income. The results of these two papers, one focusing on costs and one focusing on benefits of
electrification, are brought together in this note to estimate the return on investment of three
interventions:
• Grid expansion to communities for which the grid is the most cost-effective solution
• Solar and diesel micro-grids to suitable remaining communities
• Grid expansion to remaining communities of more than 100 households
2
For ease of exposition we refer to communities for which grid is most cost-effective as ‘less-
remote communities’, while remaning communites are referred to as ‘more remote
communities’. Solar and diesel micro-grids are only suitable for some of the more remote
communities.
These electrification options were modeled on unelectrified rural communities in the Gushiegu
Municipality in the Northern region. The Gushiegu Municipality was selected for the pilot
because it has rural communities with a mix of population sizes, ranging between less than 200
to about 1500, presenting a good population mix for studies like this. It is assumed that the
results from this municipality are broadly generalizable to other parts of rural Ghana.
Our results indicate that grid expansion to less-remote communities has the highest benefit-
cost ratio (BCR) of 4.5. Microgrid expansion for suitable more remote communities has a BCR
of 1.7-1.8 depending on the technology type, while grid expansion for more remote
communities has a BCR of 1.1. The results indicate that it is most cost-effective to electrify a
subset of rural households, typically those that are less remote, with higher electricity demand
and near existing grid infrastructure. For households in more remote communities, providing
grid-based electricity just passes a benefit-cost test. If electrification is deemed a must-have by
policy-makers, then providing microgrids to remote communities does yield slightly higher
BCR than grid electrification to these same communities under current conditions. These
results are based on a large jump in consumption due to electrification. More modest
assumptions in line with experience in other countries produce lower BCRs but do not change
the rank order of interventions.
Intervention 1: Expand grid-based electrification to less
remote communities
Overview
Software for spatial analysis and planning, load forecasting, optimization of supply options
was used to generate a rural electrification blueprint using several technologies namely:
expansion of the grid, diesel and solar micro-grids (Kemausuor and Adjei (2020). Out of 159
communities in the Gushiegu Municipality, the model results show that 79 communities are
optimal for grid connection.
3
Traditionally, grid extension in Ghana is undertaken by the distribution utility, with support
from the Ministry of Energy. The households are only responsible for wiring their homes to
receive the power. The electrification of the 79 communities is expected to be undertaken in 8
years, between 2020 and 2027.
In the first year 4,547 people will be connected corresponding to 743 households. In 2027
42,120 people (7,005 households) will be connected. Over time as the population expands, the
number of households will grow within the community such that by 2040, 55,334 people across
9,222 households are connected to the grid without any additional large-scale capital
investment required after 2027.
Costs and Benefits
Costs and benefits are measured over 20 years.
Costs
• Cost of connecting the 79 communities with MV lines, transformers, LV lines, and
meters estimated at GHS 59 million using an 8% discount rate. This is based on GHS
80 million undiscounted (US$17.8 million) figure documented in Kemausuor and Adjei
(2020), but with a discount rate applied.
• Cost of electricity generation is assumed to equal 31 GHp per kWh, and distribution
45.2 GHp per kWh based on tariffs set by the regulatory agency in Ghana (July 2019,
Public Utilities Regulatory Commission) matching the forecasted demand. These tariffs
are assumed to represent operations and maintenance costs of electricity delivery via
the grid. This cost is estimated at GHS 42m over 20 years using an 8% discount rate.
Benefits
• Using the data from the fifth, sixth and seventh waves of the Ghana Living Standards
Survey (GLSS) collected respectively in 2005/2006, 2012/2013 and 2017/2018 and a
difference-in-differences analysis, there is a statistically significant increase in gross
household income of 46% relative the non-electrified households for grid extension
(Dramani and Frimpong, 2020). This significant increase would incorporate increased
productivity through use of electricity in farm and non-farm-based activities. It is
assumed that each household has one primary worker, earning GHS 10,040 per year in
the first year rising with projections to GHS 19,760 by 2040 (2018 figures).

4
• Improved health outcomes from better supporting environment for health services and
staff were also included. Some studies have suggested that electrification generates
health benefits associated with reduced indoor air pollution due to the switch from wood
cooking and kerosene lighting (e.g. Spalding Fecher, 2005; Barron and Torero, 2014).
However, discussants at a validation roundtable held at the Ministry of Energy in Ghana
in January 2020 indicate that this benefit was unlikely to materialize in the Ghanaian
context. This is because Ghanaian households tend not to use electricity for cooking,
even when the house is electrified and do not use kerosense for lighting.
• Instead, it was suggested that the presence of electricity would incentivize staff to move
to rural communities, thereby increasing availability of health services. This is
supported by discrete choice experiments for Ghanaian health workers and final year
medical students (Shiratori et al. 2016; Kruk et al. 2010). We focus here on the impacts
of electricity on severe health outcomes, proxied by hospitalization rates and associated
deaths. A focus on severe health outcomes is motivated by the fact that it likely captures
a significant majority of societal health costs, and is not as affected by availability of
health infrastructure as with less severe ailments.1
• Difference-in-difference analysis indicates that the presence of electricity is associated
with a reduction in annual hospitalizations by 35% (Dramani and Frimpong, 2020).
Data from the Ghanaian Health Service (2018) suggests 1.6% of the entire population
required hospitalization in 2017. Using the effect size from Dramani and Frimpong and
assuming that the split of hospitalizations between electrified and non-electrified
households follows the national split of electrification (79:21), leads to an estimated
reduction in hospitalization of 0.8 pp from electrification. 2 Given a hospitalization
fatality rate of 2.8% (Ghana Health Service, 2018), we estimate that electrification
would avoid 1 death per ~4,500 individuals connected per year. In the current scenario
this means 1 avoided death in the first year, gradually increasing to a long run value of
9 deaths per year for 42,000 connected indivdiuals in 7,844 households. Each life saved
1 For example, if electricity generates a greater propensity to visit the doctor, it woul be unclear whether that is due to increased availability of local primary health care facilities (positive outcome) or that the population is more sick overall (negative outcome). In the case of severe events requiring hospitalization it is assumed that individuals, with or without electricity, will be more likely to seek medical care due to the seriousness of the ailment, even if hospitals are not close to their residence. Therefore, hospitalization rates are less impacted by the availability of (local) health services, and can be considered a cleaner, albeit still imperfect, indication of overall population health in response to electrification. 2 To be specific, the estimated annual hospitalization rate for non-electrified households is 2.3%, while for electrified households it is 1.5%.

5
is assumed to avoid 36 years of life lost (YLL) and each YLL is valued using standard
Ghana Priorities assumptions of 1.3x GDP per capita.
Summary of Results
Total discounted costs and benefits for 9,222 households over 20 years in million cedi
5% 8% 14%
Cost: extending grid 65.3 58.8 48.7 Cost: electricity generation and distribution
57.7 42.1 24.2
Cost: TOTAL 123.0 100.9 72.9
Benefit: income increase 521.6 377.9 216.7 Benefit: improved health 103.3 73.6 40.8 Benefit: TOTAL 624.9 451.4 257.5
BCR 5.1 4.5 3.5
Total discounted costs and benefits per household over 20 years in cedi
5% 8% 14%
Cost: extending grid 7,077 6,378 5,282 Cost: electricity generation and distribution
6,257 4,563 2,626
Cost: TOTAL 13,334 10,940 7,908
Benefit: income increase 56,554 40,973 23,501 Benefit: improved health 11,205 7,976 4,420 Benefit: TOTAL 67,759 48,948 27,920
BCR 5.1 4.5 3.5
Discussion and Sensitivity Analysis
The results indicate that for less remote communities, extending the national grid generates
around two times benefits relative to costs. Increased income represents ~80% of the benefit,
with improved health the remaining 20%.
The main driver of benefits is the 46% increase in household income, resulting from increased
productivity (Dramani and Frimpong, 2020). However, there is little evidence in the literature
documenting income and/or productivity benefits of rural electrification at that magnitude in
Africa. In a highly-referenced review of the literature, Peters and Sievert (2015) present
evidence from the African continent regarding the more popularly-cited benefits: education
benefits from increased study time; health benefits from the reduction in kerosene use, and

6
income benefits from increased non-agricultural activities. They find that (1) electrification
does not lead to a change in occupation of household members; little effects of electrification
on firm creation and firm development; (2) in none of the studies could a shift in time use
towards income generation be observed. Changes in the daily routines mostly relate to how
people spend their leisure time and to some extent to studying. They conclude that lacking
access to markets is much more important for the development of non-agricultural activities
than electrification, and it consequently cannot be overcome in the short or mid-term by the
provision of electricity.
More recently, a World Bank working paper by Grimm et al (2016) investigated usage behavior
and the changes in people’s living conditions when households make this first step toward
modern energy based on a randomized controlled trial (RCT), implemented in 15 remote
villages in rural Rwanda. They find that the reduction of kerosene use improves household air
quality. Secondly, children, boys in particular, shift part of their homework into the evening
hours and increase their total study time. Furthermore, in both the control and treatment groups,
housework is done primarily during the daytime, and the total time dedicated to domestic work
per day does not change significantly; neither does the time that household members are awake.
Lastly, they do find that both the head of household and the spouse slightly increase the time
they dedicate to income generation, but this difference is not statistically significant from the
control group. Most recently, similar results are observed in an RCT in 150 rural communities
in Kenya by Lee et al (2019). Surveys extending 32 months post-connection show no detectable
effects on asset ownership, consumption levels, health outcomes, or student test scores.
A sensitivity analysis was undertaken to determine the impact on the benefit-cost ratio when
the income benefits are adjusted/removed. A literature review by the Asian Development Bank
on the impact from rural electrification presents the results from different regions of the world,
which includes India, Brazil, Vietnam, Rwanda, Bangladesh, and Indonesia. The median
income effect from access to electricity is 18%.
The BCR is sensitive to the assumption of a single average rural income of per household
(10,040 cedi in 2020) increasing 46% (4,620 cedi increase in 2020). If the income increase due
to electrification is assumed to be 18% (1,808 cedi increase in 2020), the BCR is approximately
halved to 2.2 at 8% discount rate. If each household is assumed to have two average rural
incomes (27,141 cedi in 2020) and it increases 46% thanks to electrification then the BCR
increases to 8.2 using 8% discount rate. The results do not include any residual value of

7
infrastructure at the end of the 20-year analysis period, and so may be considered as slightly
conservative.
Intervention 2: Microgrids for selected ‘more remote
communities’
Overview
A micro-grid generates less than 10MW of electricity and distributes to a limited number of
customers via a distribution grid that can operate in isolation from national electricity
transmission networks. Here we consider both diesel and solar micro-grid options (though
results indicate that the BCR is similar for both technology types and have therefore been
included together as a generic micro-grid intervention).
Diesel Micro-grids
Three remote and small communities were considered in this analysis. The first 27 households
in each community will be connected in 2020. In 2029 100 households are estimated to be
connected, in each of the three communities totalling 300 households.
Costs and Benefits
The usable life of a micro-grid is assumed to be 10 years. However, costs and benefits are
modelled over 20 years to ensure the full benefits of the micro-grids are captured.
Costs
• The levelized cost is GHS 4.3 ($0.94) per kWh and includes all investment,
maintenance, distribution and fuel costs (Kemausuor and Adjei, 2020)
• Negative health impacts from the diesel emmissions 0.000004 DALY per kWh (enea-
quantis life cycle analysis 2013, and A Markandya 2018). Using the value of statistical
life year for the project this corresponds to 7.3 GHP (0.073 cedi) per kWh.
• Social cost of carbon emmissions is the value of negative impacts from climate change
in the future caused by additional emmissions today. At 5% discount rate the present
value of the damage is 1.6 GHP (0.016 cedi) per kWh produced from diesel genset.

8
Benefits
• The benefit components are the same as for the case of grid electrification: improved
welfare in the form of increased gross household income; the health benefits of
improved health services. However, the forecasted electricity demand per household
from the diesel microgrid is not equivalent to the households with grid electricity, and
lower or higher electricity consumption is assumed to generate lower or higher income
and health benefits, so the income and health benefits for households are indexed using
the average grid electrified household as base. Due to the higher energy demand in these
communities, the expected income increase for households is between 46-61%.
Summary of Results
Total discounted costs and benefits for 300 households over 20 years in million cedi
5% 8% 14% Cost: electricity 9.4 7.4 4.9
Cost: emmission health impact 0.2 0.2 0.1
Cost: climate change impact 0.0 - -
Cost: TOTAL 9.6 7.6 5.0
Benefit: income increase 14.7 11.8 8.1
Benefit: improved health 2.2 1.8 1.2
Benefit: TOTAL 17.0 13.6 9.3
BCR 1.8 1.8 1.8 Total discounted costs and benefits per households over 20 years in cedi
5% 8% 14%
Cost: electricity 31,296 24,824 16,466 Cost: emmission health impact
690 534 338
Cost: climate change impact 144 0 0
Cost: TOTAL 32,131 25,358 16,804
Benefit: income increase 49,127 39,454 27,003 Benefit: improved health 7,385 5,891 3,970 Benefit: TOTAL 56,512 45,344 30,973
BCR 1.8 1.8 1.8
9
Discussion and Sensitivity Analysis
Results indicate that diesel microgrids have higher benefits than costs with a central BCR of
1.8. The BCR is sensitive to the assumption of a single average rural income of per household
(10,040 cedi in 2020) increasing 46%. If the income increase due to electrification is assumed
to be 18% the BCR is more than halved to 0.8 (8% discounting). If each household is assumed
to have two average rural incomes and it increases 46% due to electrification then the BCR
almost doubles to 3.3.
Solar Micro-grids
Solar technology is considered for the 46 of the communities deemed not optimal for grid
connection in the analysis.
The first 11-13 households in each community will be connected in 2020 for a total of 580
households. In 2029, 42 households are estimated to be connected, in each of the 46
communities totalling 1,911 households.
Costs and Benefits
As before, solar micro-grids are assumed to last for 10 years, and the analysis is modeled for
20 years to ensure full capture of all benefits.
Costs
• Levelized costs per kWh ranges between US$ 1.07 and US$ 1.28/kWh with an average
value of US$ 1.12 (Kemausuor and Adjei, 2020). This includes mostly capital costs
such as solar panels, inverters, batteries and LV lines.
Benefits
• The benefit components are the same as for the case of grid electrification: improved
welfare in the form increased gross household income and health benefits of improved
services. However, the forecasted electricity demand per household from each minigrid
is not equivalent to the households with grid electricity, and lower or higher electricity
consumption is assumed to generate lower or higher income and health benefits, so the
income and health benefits for households are indexed using the average grid electrified

10
household as base. Due to the lower energy demand in these communities, the expected
income increase for each household is 37%.
Summary of Results
Total discounted costs and benefits for 1,911 households over 20 years in million cedi 5% 8% 14%
Cost: electricity 47.1 38.4 26.9
Cost: TOTAL 47.1 38.4 26.9 Benefit: income increase
64.7 53.8 39.3
Benefit: improved health
14.1 11.3 7.7
Benefit: TOTAL 78.8 65.1 47.0
BCR 1.7 1.7 1.7
Total discounted costs and benefits per household over 20 years in cedi
5% 8% 14%
Cost: electricity 24,650 20,099 14,075
Cost: TOTAL 24,650 20,099 14,075 Benefit: income increase
33,861 28,137 20,551
Benefit: improved health
7,376 5,912 4,021
Benefit: TOTAL 41,238 34,048 24,572
BCR 1.7 1.7 1.7
Discussion and Sensitivity Analysis
Results indicate that solar microgrids have slightly higher benefits relative to costs, with a
central BCR of 1.7. The BCR is sensitive to the assumption of a single average rural income
of per household (10,040 cedi in 2020) increasing 46%. If the income increase due to
electrification is assumed to be 18% the BCR is more than halved, 0.8 (8% discounting). If
each household is assumed to have two average rural incomes and it increases 46% thanks to
electrification then the BCR almost doubles to 3.1.

11
Intervention 3: Expand grid-based electrification to more
remote communities
Overview
After presenting preliminary results at a validation seminar in January 2020, representatives at
the Ministry of Energy requested a cost-benefit analysis of expanding grid-based electrification
to more remote communities. This was modelled in the software as forcing grid extension to
all communities above a certain (small) threshold value of 100 people.
The costs and benefits of this scenario were estimated and then subtracted from the costs and
benefits of Intervention 1 to determine the costs and benefits of grid extension to more remote
communities. The results are for 2,493 households in more remote communities. These include
both the households that the software determined are suitable for micro-grid, as well as a large
number of significantly smaller communities.
Costs
• Cost of connecting households from remote communities is GHS 58m at an 8%
discount rate and includes MV lines, transformers, LV lines, and meters. It should be
noted that this figure is almost the same for connecting 9,222 households in less remote
communities (GHS 59m), demonstrating the vast differences in unit costs between
connecting more and less remote communities
• Cost of electricity generation is assumed to equal 31 GHp per kWh, and distribution
45.2 GHp per kWh based on tariffs set by the regulatory agency in Ghana (July 2019,
Public Utilities Regulatory Commission) matching the forecasted demand. These tariffs
are assumed to incorporate operations and maintenance costs.
Benefits
• The benefit components are the same as for the case of grid electrification: improved
welfare in the form increased gross household income and health benefits of improved
services. The average electricity demanded per household in this scenario is less than
the electricity demanded documented in Intervention 1. As with the micro-grids
analysis, lower or higher electricity consumption is assumed to generate lower or higher

12
income and health benefits, so the income and health benefits for households are
indexed using the average grid electrified household from Intervention 1 as base.
Summary of Results
Total discounted costs and benefits for 2,493 households over 20 years in million cedi
5% 8% 14%
Cost: extending grid 69.7 57.9 40.7 Cost: electricity generation and distribution
36.5 25.0 12.4
Cost: TOTAL 106.2 82.9 53.2
Benefit: income increase 120.7 84.2 44.2 Benefit: improved health 11.2 7.4 3.5 Benefit: TOTAL 131.9 91.6 47.7
BCR 1.24 1.11 0.90
Total discounted costs and benefits per household over 20 years in cedi
5% 8% 14%
Cost: extending grid 27,951 23,224 16,337 Cost: electricity generation and distribution
14,655 10,026 4,986
Cost: TOTAL 42,606 33,250 21,323
Benefit: income increase 48,424 33,782 17,733 Benefit: improved health 4,474 2,979 1,393
Benefit: TOTAL 52,898 36,761 19,125
BCR 1.24 1.11 0.90
Discussion and Sensitivity Analysis
Results indicate that grid extension to more remote communities just passes a benefit cost test.
The BCR is sensitive to the assumption of a single average rural income of per household
(10,040 cedi in 2020) increasing 46%. If the income increase due to electrification is assumed
to be 18%, the BCR is almost halved, 0.5 (8% discounting). If each household is assumed to
have two average rural incomes and it increases 46% thanks to electrification then the BCR
almost doubles to 2.1.

13
Conclusion
Our results indicate that grid expansion to less remote communities has the highest benefit-cost
ratio (BCR) of 4.5. Microgrid expansion for suitable ‘more remote communities’ has a BCR of
1.7-1.8 depending on the technology type, while grid expansion to more remote communities
has a BCR of 1.1. The results indicate that it is only cost-effective to electrify a subset of rural
households, typically those that are less remote, with higher electricity demand and near
existing grid infrastructure. For households in more remote communities, grid electricity just
passes a cost-benefit test. If electrification is deemed a must-have by policy makers, then
providing microgrids is more cost-effective than expanding the grid, under current conditions.
Total discounted costs and benefits over 20 years in million cedi (8% discount rate)
Costs (GHS millions)
Benefits (GHS millions) BCR
Electricity grid for less remote communities 100.9 451.4 4.5 Diesel micro-grid for more remote communities 7.6 13.6 1.8 Solar micro-grid for more remote communities 38.4 65.1 1.7 Electricity grid for more remote communities 82.9 91.6 1.1
Total discounted costs and benefits per household over 20 years in cedi (8% discount rate)
Costs per household (GHS)
Benefits per household (GHS) BCR
Electricity grid for less remote communities 10,940 48,948 4.5 Diesel micro-grid for more remote communities 25,358 45,344 1.8 Solar micro-grid for more remote communities 20,099 34,048 1.7 Electricity grid for more remote communities 33,250 36,761 1.1

15
References
Barron, M and Torero M, (2014). Household Electrification: Short-Term Effects with Long-Term Implications, mimeo, Department of Agricultural and Resource Economics, University of California, Berkeley.
Dramani, JB and Frimpong PB (2020), The impacts of rural electrification in Ghana: A
difference-in-difference analysis using survey data, Ghana Priorities, Copenhagen Consensus
Energy Commission of Ghana (2019). National Energy Statistics: 2009-2018, November
2019, Strategic planning and policy directorate.
http://www.energycom.gov.gh/files/ENERGY_STATISTICS_2019_Updated.pdf
Ghanaian Health Service (2018), Facts and Figures for 2017. Available at:
https://www.ghanahealthservice.org/ghs-item-details.php?cid=2&scid=55&iid=128
Grimm, M. et al. (2016). A First Step Up the Energy Ladder? Low cost solar kits and
household welfare in rural Rwanda, World Bank, Policy Research Working Paper no. 7859,
October 2016.
http://documents.shihang.org/curated/zh/966011476292381076/pdf/WPS7859.pdf
Kemausuor F and Adjei KA, 2020, Modeling Electrification Costs in Rural Ghana, Ghana
Priorities, Copenhagen Consensus
Kruk ME, Johnson JE, Gyakobo M, et al. (2010), Rural practice preferences among medical
students in Ghana: a discrete choice experiment, Bulletin of the World Health Organization,
88(5), 333-341
Lee, K. et al (2019). Experimental Evidence on the Economics of Rural Electrification,
Energy Policy Institute at the University of Chicago, working paper no. 2019-48,
https://bfi.uchicago.edu/wp-content/uploads/BFIEPIC_WP_201948.pdf
Peters, J. & Sievert, M. (2015). Impacts of Rural Electrification Revisited: The African
Context. Revue d'économie du développement, vol. 23(HS), 77-98.
doi:10.3917/edd.hs03.0077.
Raitzer, D.A. et al. (2019). Impact evaluation of energy interventions: a review of the
evidence, Asian Development Bank, April 2019.
16
https://www.adb.org/sites/default/files/publication/502271/impact-evaluation-energy-
interventions.pdf
Spalding-Fecher, 2005, Health benefits of electrification in developing countries: a
quantitative assessment in South Africa, Energy for Sustainable Development, 9(1); 53-62
Shiratori S, Agyekum EO, Shibanuma A et al. (2016), Motivation and incentive preferences
of community health officers in Ghana: an economic behavioral experiment approach,
Human Resources for Health, 14:53 DOI 10.1186/s12960-016-0148-1
Quartey, J.D. and Ametorwotia, W.D. (2017). Assessing the total economic value of
electricity in Ghana, IGC, reference no. E-33402-GHA-1, August 2017.
https://www.theigc.org/wp-content/uploads/2018/06/Quartey-Ametorwotia-2017-Final-
report.pdf

Cost-benefit Analysis of Interventions to Improve Electricity Access in Ghana
Ghana Priorities
John Bosco Dramani Lecturer, Department of Economics, Kwame University of Science and Technology, Ghana, Kumasi
Prince Boakye Frimpong Lecturer, Department of Economics, Kwame University of Science and Technology, Ghana, Kumasi

I
Academic Abstract The national electricity coverage in Ghana is currently about 84 percent. The 16 percent of the
population who are without electricity comprise of communities that are densely populated and
qualify to benefit from the Self-Help Electricity Project (SHEP). In addition, the population
without electricity also include the island communities in the middle of Ghana’s Lake Volta as
well as the Afram Plains. There is a growing demand for electricity for productive use such as
irrigation in these communities without electricity and which are usually sparsely populated.
Further, some of the communities without electricity are situated far away from the existing
grid line and their island nature makes it expensive and uneconomical to extend the national
grid to them. The aim of this project is to analyze two interventions addressing rural
electrification in the context of Ghana. First, we study the benefits of expanding electrical grid
to communities that qualify for SHEP. This intervention envisages connecting all unelectrified
households to the electricity grid with a daily continuous 24 hours supply. Second, we study
the socio-economic benefits of off-grid connections such as solar stand alone, mini-grids with
solar batter or diesel generator back-up and solar home systems extension to island and lakeside
communities. Overall, we find that rural electrification intervention led to an increase in gross
income of about 46% higher relative to non-electrified households for grid extension.
Similarly, we find that being connected to off-grid compared with those without any form of
electrification marginally improves welfare through reduction in patient’s admission to
healthcare facilities.
Keywords: Difference-in-difference, Electricity, Ghana, Mini-Grid, Propensity Score
Matching

II
1.THE PROBLEM ............................................................................................................................................... 1
2. INTERVENTION 1: SELF-HELP ELECTRIFICATION PROGRAM (SHEP) ............................................................... 3
2.1 OVERVIEW ................................................................................................................................................ 3
2.2 IMPLEMENTATION CONSIDERATIONS ................................................................................................................ 3
2.3 RELATED LITERATURE ................................................................................................................................... 4
2.4 DATA AND METHODS ................................................................................................................................... 6
2.4.1 Data and descriptive statistics ......................................................................................................... 6
2.4.2 Identification and Estimation Methods ............................................................................................ 8
2.5 ANALYSIS OF BENEFITS ............................................................................................................................... 11
2.6. PROPENSITY SCORE MATCHING AND BALANCING TESTS ....................................................................................... 12
2.7 ECONOMIC BENEFITS OF ELECTRIFICATION ....................................................................................................... 12
2.8 MECHANISMS .......................................................................................................................................... 16
3 INTERVENTION 2: OFF-GRID EXTENSION ..................................................................................................... 17
3.1 OVERVIEW .............................................................................................................................................. 17
3.2 IMPLEMENTATION CONSIDERATIONS .............................................................................................................. 18
3.3 LITERATURE REVIEW .................................................................................................................................. 18
3.4 ECONOMIC BENEFITS OF OFF-GRIDS .............................................................................................................. 19
3.5 GRID VERSUS MICRO-GRID TECHNOLOGIES IN GHANA ......................................................................................... 20
4. CONCLUSION ............................................................................................................................................. 22
5. REFERENCES ............................................................................................................................................... 23

1
1.The Problem By the beginning of 2019, about 84% of the population of Ghana had access to grid-connected
electricity – the second highest level in Sub-Saharan Africa (African Energy Reports, 2019).
Even though overall access rate in Ghana is high, there exists huge significant differences
between the access rates in the urban and rural areas. For instance, in 1993 about 74.6% of
urban population had access to electricity. In contrast, 2.8% of rural population had access to
electricity in the same year. In 2017, electricity access rate in Ghana for the total, urban and
rural population were 78.3%, 90.8 and 65% respectively. Even though the current access rate
among the urban population is almost 30% higher than the rural population, the relative trends
of the rate indicates a significant improvement in electricity access of rural population (Adu et
al., 2018). This major achievement was accomplished in 27 years, up from 1.08% in 1991 with
an average annual growth rate of 2.3% (Blimpo & Cosgrove-Davies, 2019). The current rate
of growth of electrification appears low and may prevent Ghana from accomplishing her target
of universal access by the year 2020. According to Kumi (2017), Ghana can meet her target of
universal access in 2020 if the current rate of electrification is raised to about 4.38% per annum.
On the basis of the current national electricity access rate, about 16% of the population
constituting about 5 million who are qualified to received grid connection are without
electricity. This figure comprises communities that are densely populated, with high demand
and qualify to benefit from the Self-Help Electrification Project (SHEP) – a complementary
electrification program to support the National Electrification Scheme (NES). Under the SHEP,
communities that are within 20km from an existing 33kV or 11kV sub-transmission line can
qualify for electrification if they procure all the power poles and have a minimum of 30 percent
of the houses within the community wired. Once these conditions are met, the Government
provides the conductors, pole-top arrangements, transformers and other installation
requirements needed to provide supply to the community. In addition, 2.9 million of the
population living in the island communities in the middle of Ghana’s Lake Volta as well as the
Afram Plains where there is a growing demand for electricity for productive use such as
irrigation are without electricity. Communities in these areas are usually less and sparsely
populated, situated far away from the existing grid line and their island nature makes it
expensive and uneconomical to extend the national grid to them. Thus, alternative technologies
such as off-grid solar photovoltaic, biomass gasifier-based power generation and mini-grids
are relatively more cost competitive compared to grid extension in the promotion of

2
electrification (Mahapatra & Dasappa, 2012). Based on this, Ghana Energy Development and
Access project (GEDAP), through a World Bank facility installed five pilot mini-grids in four
island communities in 2016. These mini-grids are hybrid systems with solar battery and diesel
generator back-ups and have a generation capacity of 1.5 Megawatts. Since the installation,
they have served about 417 households inhabiting 10, 000 people.
The general objective of this project is to undertake analysis of interventions addressing rural
electrification in the context of Ghana. First, we study the benefits of expanding electrical grid
to communities that qualify for SHEP. This intervention envisages connecting all unelectrified
households to the electricity grid with daily continuous 24 hours supply. Second, we study the
socio-economic benefits of solar micro-grids backed by diesel generators, solar stand-alone
and solar home system extension to island communities. This intervention envisages providing
electricity to all unelectrified households by installing solar micro grids distributed across
villages as per local capacity requirement. The National Mini Grid Policy has also undertaken
an investment plan to scale-up renewable energy aimed at providing off-grid electricity to the
island and lakeside population with electricity.
We expect that these interventions will provide more benefits than cost, to justify the need for
the government of Ghana to spend an extra cedi in the extension of either the grid or mini-grid
to the communities which are currently without electricity. In many cases, decisions concerning
the technology to apply to increase access to electricity are being taken without prior adequate
empirical evidence (Lee et al., 2016). Many existing studies suggest rural electrification
generates important economic benefits which bring significant changes to an economy. These
benefits include improvement in employment among female section of the population
(Dinkelman, 2011), higher profit margins for firms connected to electricity (Akpan et al., 2013)
and time relocation which promote productivity (Bernard & Torero, 2011). Other studies such
as Chakravorty et al. (2016) and Lee et al., (2019) compared the benefits and costs of rural
electrification and concluded that the benefits outweigh the cost.
However, to effectively make informed decisions on which rural areas to earmark for
electrification, which technology should be considered, the amount of finance and incentives
required to facilitate utilization, policymakers will need empirical evidence on the benefits and
costs of rural electrification. With respect to Ghana, there are limited studies that have
simultaneously estimated and compared the benefits and costs of extending electricity to the
remaining 16 percent of the population who are without electricity. In fact, all past studies (Adu
3
et al., 2018) estimate only the benefits of rural electrification and neglect the pathways
especially the health pathways and cost of extension. Our study relies on microdata on income
of households to estimate the effect of rural electrification in Ghana. In addition, we estimate
the monetary costs of extension and compare these estimates in benefit-cost ratio framework.
2. Intervention 1: Self-Help Electrification Program (SHEP)
2.1 Overview
SHEP was introduced as a complementary electrification program to support the National
Electrification Scheme. It aimed at accelerating the process of connecting all communities in
Ghana unto the national grid by encouraging communities to undertake self-help
developmental initiatives. Communities that initiated the process of getting connected to the
national electricity grid received government support to complete the projects at earlier dates
than scheduled dates of completion under the National Electrification Master Plan (NEMP).
SHEP was implemented in phases (Ministry of Energy, 2010). The first phase was
implemented between 1990 and 1991 and 50 communities were connected to the national grid.
The second phase was rolled out between 1992 and 1994 and assisted the connection of 250
communities to the national grid. The third phase identified 1400 communities qualified for
connection to the national grid. Due to the large number of communities who had met the
requirements for connection, the third phase was subdivided into four phases, of which the first
sub-phase commenced in 1996 and ended in 1998, benefiting 170 communities. The second
sub-phase started in 1998 and completed in 2000 and provided 480 communities with
electricity extension. Sub-phase three started in 2001 and ended in 2010 with electricity
extension to 700 communities. The fourth sub-phase commenced in 2011 and it is still ongoing.
2.2 Implementation Considerations
To benefit from SHEP a community must register to join the intervention and must be situated
within 20km of the existing 11kv or 33kv network that are appropriate for extension. The nearer
the communities are to the 11kv or 33kv the more economical and less cumbersome it is to
extend electricity to them. In addition, communities must purchase and erect the required
number of low voltage electrical poles that are needed for the local network. The communities
must also show evidence that a minimum of one-third of the houses in the communities have
been wired and are ready to be connected to the national grid. Communities which meet these

4
conditions are then supported by the government with conductors, pole-top arrangements,
transformers and other relevant equipment and resources required to supply the electricity to
the communities. Government also encourages the private sector initiatives to obtain electricity
connection if they can fund it.
2.3 Related Literature
Electricity is considered an infrastructure that greatly improves the lives of people especially
under certain complementary conditions. The benefits of electricity access are realized when it
leads to increases in consumer surplus. Consumer surplus is the difference between the price
consumers are willing to pay for electricity and what they actually pay. At a given price, the
area under the demand curve, represent the stream of benefits attributed to access to electricity.
Consumer surplus is high when the benefits are greater than the cost of extending and
connecting to grid (Kirubi et al., 2009). The extension of electricity to the island, lake side and
Northern sector of Ghana will require households to pay and get connected. Thus,
improvements in the welfare of these households through electricity access can be represented
by a higher stream of benefits relative to the extension and connection costs. Barido et al.
(2017) point out that access to electricity by way of grid extension is relatively cheaper
especially for areas with high demand and population densities. According to Bernard & Torero
(2011), access to grid electricity allows households to save time which can be channelled into
other productive activities. Dinkelman (2011) finds that access to electricity connection in
disadvantaged regions in South Africa increased employment opportunities especially for rural
women. Women are able to set up enterprises and spend longer hours working. This does not
only bring about a positive income shock but also reduces fertility since the opportunity cost
of giving birth to many children is now high. Akpan et al. (2013) find that enterprises with
access to grid electricity achieve higher profit margins up to 16% more than unconnected ones.
Similarly, Bernard & Torero (2009) find that access to grid connection improves the social
status of individuals. The authors note that a household’s connection to the grid is related to
the behaviour of their neighbours as grid electricity access confers a higher status to them
within the community. A study by Chakravorty et al. (2016) follow a three-step approach. The
authors first did a projection of grid electricity expansion using a least-cost first principle. The
projected expansion then became an instrument used to evaluate the effect of electricity
infrastructure on expenditure and income of households in Philippines. Finally, the authors
compare these expenditure and income benefits of electricity expansion with cost of extension
to the villages. The findings reveal that the monetary cost of electricity expansion is recovered

5
in a year after income improvements of households. Further, the authors find agricultural
income as a key transmission channel of electricity expansion on income improvements. This
implies rural electrification is channelled for productive use in agriculture which drives income
gains. Burlig and Preonas (2016) analysis note that electricity expansion to rural communities
may not be a key solution for the reduction in poverty and kick-starting major economic
transformation in a country. The authors indicate that short-term and modest economic benefits
such as income, labor hours, household wealth, asset ownership and education due to
electrification cannot rationalize the huge investment needs of electrifying rural communities.
The findings suggest that rural electrification is not very beneficial. Lee et al. (2019) used an
experimental design to study the demand and supply of rural electrification in Kenya. Clusters
of households were selected randomly with each given the chance to join the grid at subsidized
rates. By giving households the opportunity to connect at various subsidized rates and the
length of extending the grid, the study produced exogenous differences regarding price and
cost of extension. Based on this, the study estimated the demand, average and marginal costs
curves associated with both connection to and extension of the grid and compared the demand
and costs curves to estimate the welfare issues of rural electricity. The findings show that
household demand for grid connection is low even when they are highly subsidized. However,
the cost of grid extension is very high and as a result, the estimated consumer surplus is very
low relative to overall cost of connection. The findings point to a conclusion that electricity
extension to local communities does not promote the enhancements of welfare.
For existing firms, access to electricity increases the productivity of individuals as they make
use of electric equipment which would otherwise have been impossible. A fashion designer
can now use an electric sowing machine which allows greater production than a manual one.
Electricity access also increases the hours individuals can work because they can work during
the night as well and this raises their productivity (Bernard & Torero, 2011; Cabraal et al.,
2005). Mention can also be made of improvements in the health and educational sectors with
access to electricity. Health practitioners get to work with modern equipment and patients
receive better ventilation due to electricity access. Students also get the opportunity to study at
night with better lighting and can make use of modern computers and equipment to enhance
their studies. The end result of this is an improvement in human capital which also raises
productivity of individuals (Torero, 2015). Electricity access also enhances the establishment
of small and medium scale enterprises (Van de walle et al., 2013). New line non-agriculture

6
enterprises such as cold store, barber shops, café and internet services are made possible due
to electricity access in rural areas.
Electricity access enhances a shift from the use of biomass to the use of electric stoves and this
has two important implications. First, it allows females to increase the supply of labour as they
spend their extra labour time in micro enterprises as well as other self-employment which
enhances welfare. The extended working hours further allows males to reduce off-farm hours
(leisure) and increases time in other labour activities. Ceteris paribus, an increase in time
reallocation to work increases household income. The expected higher income in electrified
communities has the potential of increasing consumption expenditure per households which
can improve welfare (Khandker et al., 2008; Bensch et al., 2011). Second, a shift from the use
of biomass to electricity reduces indoor pollution which can decrease the incidence and
percentage of children under 5 years and their mother from getting lower respiratory infections.
2.4 Data and Methods
2.4.1 Data and descriptive statistics
We utilize data from the fifth, sixth and seventh waves of the Ghana Living Standards Survey
(GLSS) collected respectively in 2005/2006, 2012/2013 and 2017/2018. For the first part of
the analyses, the study combined data from a geo-referenced data on the location electrified in
Ghana. We do not use the geo-referenced data on the latest survey because as at the time of the
analysis, we had still not obtained the GPS coordinates from the Ministry of Energy and Power
Distribution Service. The GLSS are nationally representative cross-sectional survey of
households conducted by the Ghana Statistical Service with the support from the World Bank
and other agencies. The population living in private households constitute the sampling frame
of the survey. This sample frame is then divided into two sampling units (i.e., primary and
secondary sampling units). The primary sampling unit is defined as the census enumerated
areas that are stratified into ten administrative regions of Ghana based on proportional
allocation using the population in each of the regions. In contrast, the secondary sampling unit
is defined as the households living in each of the enumeration areas. All data in the three waves
are geo-referenced except that in the last wave, where the geo-referenced dataset was not
utilized due to the reason given above. The communities within which the households are
located have GPS coordinates. That is to say the GPS coordinates are somewhat displaced to
locate the exact households. This is done to ensure anonymity of the households being
interviewed.

7
Table 1 presents the sample description of the variables. It must be stressed that the sample
includes only households located in the rural parts of Ghana. Pooling the three waves of GLSS
together, the total number of households according to the data is 17717 of which 75% are
headed by males with an average age of about 47 years. Out of this sample, about 64% had no
education with a paltry 3% with higher education. The average household size in the sample is
4.9 members with about 62% of the sample are currently married. The average gross income
for a household in the sample is roughly GH¢ 8516.68. Turning to the group analysis, 71% of
the households are headed by males in the treated group whereas it is 78% in the control group.
Focusing on the main outcome variable, the data presented in Table 2 indicates some marked
variation across survey waves and the treatment. For instance, mean gross income shows
consistently increase over the survey rounds. Since the estimated effects are usually related to
the baseline outcomes, we also present the average gross income across waves and the control
group. When we consider only the last wave, the average gross income for the control group,
that is, the un-electrified households is GH¢ 9714. Pooling the sample together, the average
income for the control group is GH¢ 5642.
Table 1: Sample description of the variables
(1) (2) (3) Overall Treated Control count mean count mean count mean Male 17717 0.75 6857 0.71 10860 0.78 Age 17717 47.31 6857 46.48 10860 47.83 Educational level No 17717 0.64 6857 0.50 10860 0.74 Basic 17717 0.27 6857 0.36 10860 0.21 Secondary 17717 0.06 6857 0.09 10860 0.04 Higher 17717 0.03 6857 0.05 10860 0.01 Marital status 17717 0.62 6857 0.58 10860 0.66 Household size 17717 4.87 6857 4.60 10860 5.04 Women with higher edu 17717 0.03 6857 0.05 10860 0.02 Female/male ratio 17717 0.26 6857 0.28 10860 0.24 Gross income 17717 8516.78 6857 13068.85 10860 5642.61

8
Table 2: Summary Statistics on Gross Income in the Sample
Observations Mean (GH¢) GLSS 5 4,601 1045.891 GLSS 6 6,895 7356.749 GLSS 7 6,221 15327.91 GLSS 7 & Control group 2,651 9714.375 Pooled Sample 17,717 8516.782 Pooled Sample & Control group 10,860 5642.611
2.4.2 Identification and Estimation Methods
We conduct our empirical analysis by appealing two main estimation methods. At the first
instance, we rely on estimating the average effect of electrification on outcomes following Adu
et al. (2018) and complement the analysis using a seemingly robust estimator. Thus, we seek
to compare the outcomes of households who are electrified with those who are not by using
data from the 2005/2006, 2012/2013 and 2017/2018 GLSS. Another objective of this project
is to estimate the socio-economic benefits of providing micro grids to communities particularly
island or lakeside communities. As a consequence, we compare households who have been
connected to these mini grids with those without electricity. It is important to note that,
information on mini grids is only found in the latest wave of the GLSS. Thus, we are compelled
to provide a difference in means estimator when the analysis is focused on the benefits of mini
grids.
Regarding the first objective, we seek to identify the average effect of electrification on
outcomes (e.g., gross income) in households which are electrified (i.e., the average impact of
treatment on the treated). Specifically, we are interested in comparing outcomes when
households are electrified to the counterfactual, that is, outcomes when households are not
electrified in the treatment areas at the same point in time. The counterfactual is unobservable
and ought to be estimated. Conventionally, we would like to assign randomly ‘electricity’ or
‘no electricity’ across households and compare the average outcomes of the two groups. We
are compelled to use nonexperimental methods in the absence of a controlled randomized
experiment under some reasonable assumptions.
One major concern is that households that are electrified could be different from households
that are not and that these differences may be correlated with outcomes. For instance, richer
households in somewhat influential districts in which gross incomes and expenditures were
higher may have been the ones that were electrified. Consequently, the correlation between

9
rural electrification and outcomes would be confounded with the wealth effect. Many of these
types of unobservable characteristics that may in principle confound with our identification are
those that vary across districts and households that are fixed over time. To control for time-
invariant unobserved heterogeneity is to we use panel data (repeated cross section) and estimate
difference-in-differences models.
We therefore utilise a difference-in-differences approach which compares the change in
outcomes in the treatment group before and after the intervention to the change in outcomes in
the control group. By comparing changes, we control for observed and unobserved time-
invariant households and community characteristics that might be correlated with
electrification as well as with outcomes. The change in outcomes in the treatment households,
controls for fixed characteristics while the change in outcomes in the controlled households,
controls for time-varying factors that are common to both controlled and treatment households.
To put it more tersely, the change in the controlled group is an estimate of the true
counterfactual, that is, what would have happened to the treatment group if there had been no
intervention.
We formally specify the difference-in-differences model as a two-way fixed-effect linear
regression model as:
( )ijdt ijdt ijdt ijdt ijdt t j d ijdty Electric Post Electric Post = + + + + + + +x (1)
where ijty is the outcome variable (e.g., gross income) for household i in community j
located in district d in time period [0,1]t = , ( )ijdtElectric Post is an indicator variable which
takes on the value one if a household in a community has been electrified in a particular district
in year t and zero otherwise, ijdtx is a vector of control variables that vary across both districts
and time, j and d are fixed effects unique to community j and district d respectively and t
is a time effect common to all districts in period t .
The error ijdt is a district time-varying error which is assumed to be distributed independently
of all d and t . The errors ijdt might be correlated across time and space. For instance, the
persistence of economic activities intended to reduce poverty could induce time-series
correlation at the district level. The errors could also be present in the cross-section dimension
in that, economic activities present in one area could affect neighbouring districts. Moreover,

10
various poverty reduction programmes implemented by the government of Ghana would
typically apply to all districts in a region at the same time particularly in the era of
decentralization. To address these potential biases in the estimation of the standard errors, we
first allow for an arbitrary covariance structure within districts over time by computing our
standard errors clustered at the district level.
In equation (1), is the difference-in-differences estimate of the (average) effect of rural
electrification on outcomes. Our identifying assumption for this interpretation is that the change
in outcomes in the control households is an unbiased estimate of the counterfactual. Another
key concern worthy of notice is that the impact of rural electrification may not be homogeneous
across households but may vary as a function of the characteristics of the households. For
example, the impact of rural electrification may matter more in households in which families
are better educated. Thus, estimation using simple difference-in-differences may suffer from
two additional sources of bias (Heckman et al., 1997). The first source of bias arises when there
are some electrified households but there are no comparable households for there was no
electrification. The second source of bias arises when we have different distributions of the
vector of observable variables ( x ) that affect the outcomes within the two groups. Therefore,
we implement matching methods to eliminate these two potential sources of biases by pairing
electrified households (treatments) with non-electrified households (controls) that have similar
observed attributes. To eliminate the first source of potential bias, we use observations in the
treatment and controlled groups over the region of common support in the distribution of x .
Further, to eliminate the bias due to different distributions of x between the treated and
controlled households within this common support, we reweight the controlled group
observations.
Conventionally, matching methods assume that, conditional on the observed variables x , the
counterfactual outcome distributed of the treated units is the same as the observed outcome
distribution of the units in the controlled group. The assumption is that, there is no selection
into treatment based on unobservables. Heckman et al. (1998) propose a generalized
difference-in-differences matching estimator as a means of circumventing the assumption of
no selection on unobservables. This estimator identifies the parameter of interest without
precluding selection into treatment based on time-invariant unobservables. Stated differently,
the generalized difference-in-differences estimator conditions on fixed effects to estimate the
parameters of interest.

11
The basic idea is to construct a control group by finding controls with observed x ’s similar to
those in the treatment. To match treated and untreated individuals on the basis of x is equivalent
to matching them using a balancing score ( )B x (Rosenbaum and Rubin, 1983). The coarsest
balancing score is the propensity score that gives the conditional probability of receiving
treatment given the pre-treatment values of the vector x , that is ( ) ( 1| )P Pr D= =x x . The
method then assumes that, conditional on ( )P x , the counterfactual outcome distribution of the
treated units is the same as the observed outcome distribution of the controls. We use nearest
neighbour with replacement matching procedure to obtain the generalized difference-in-
differences matching estimator.
Regarding the analysis on the micro grids as stated before, we conduct a simple difference in
means analysis to estimate the effect of being connected to these grids on outcomes.
Consequently, we specify the following:
ijd ijd ijd ijdy Mgrid = + +x ………2
where all the variables are as previously defined except ijdMgrid which is an indicator equal to
1 if a household in a community has been connected to the mini grid and 0 if the household has
neither been connected to the national grid nor mini grid and does not use any form of power
generation 1 . The outcomes in this specification include the log of per capita household
expenditure, the probability of consulting a physician due to illness and the probability of being
admitted at the hospital or health facility.
2.5 Analysis of Benefits
The impacts of electrification are estimated using two distinct approaches: difference-in-
difference (DD) and propensity score matching (PSM). We first provide the results at the
household level while acknowledging that these households are not the same in the various
survey waves. Stated alternately, the GLSS provides repeated cross-section data making it
impossible to implement DD design at the household-level since the same households may not
have been observed at different point in time. In a standard DD design, we need to observe the
progression in a particular outcome for a particular unit (e.g., a household) at different points
1 The treatment assignment of the household is done this way because we found that in the data, some households used private generators and solar powered inverters. We believe using households with no electric power generation as control would be ideal for better comparison with the treatment group.
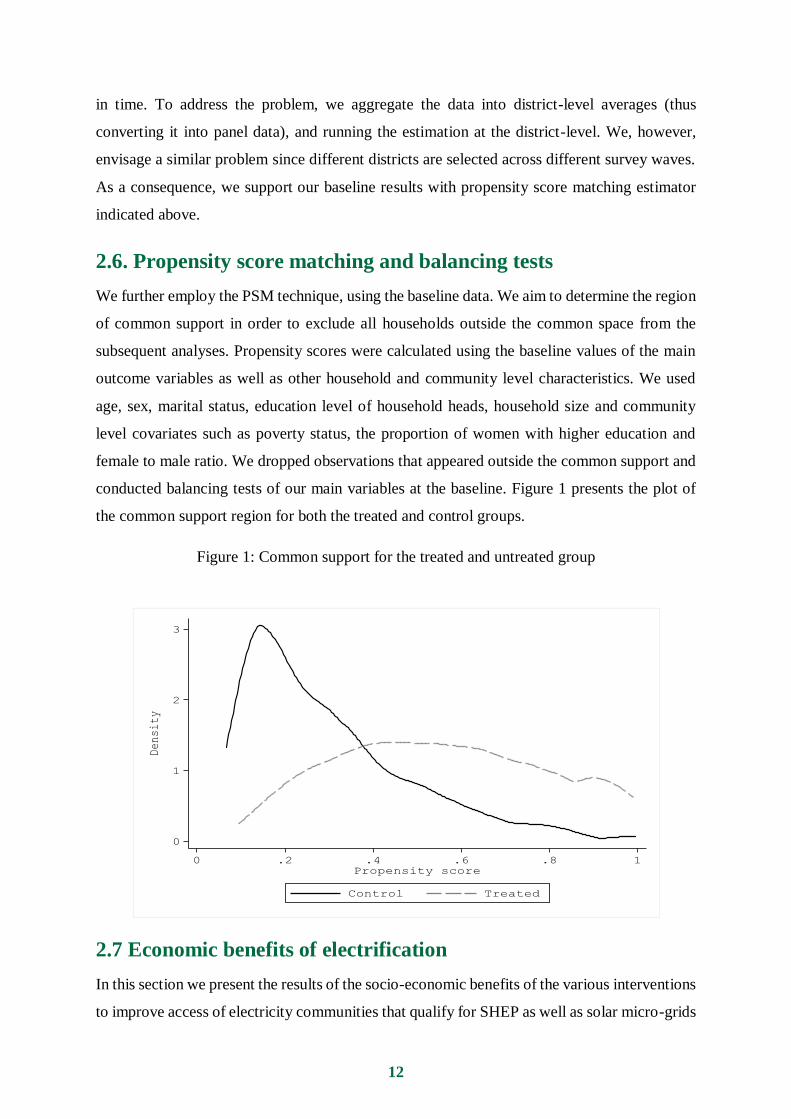
12
in time. To address the problem, we aggregate the data into district-level averages (thus
converting it into panel data), and running the estimation at the district-level. We, however,
envisage a similar problem since different districts are selected across different survey waves.
As a consequence, we support our baseline results with propensity score matching estimator
indicated above.
2.6. Propensity score matching and balancing tests
We further employ the PSM technique, using the baseline data. We aim to determine the region
of common support in order to exclude all households outside the common space from the
subsequent analyses. Propensity scores were calculated using the baseline values of the main
outcome variables as well as other household and community level characteristics. We used
age, sex, marital status, education level of household heads, household size and community
level covariates such as poverty status, the proportion of women with higher education and
female to male ratio. We dropped observations that appeared outside the common support and
conducted balancing tests of our main variables at the baseline. Figure 1 presents the plot of
the common support region for both the treated and control groups.
Figure 1: Common support for the treated and untreated group
2.7 Economic benefits of electrification
In this section we present the results of the socio-economic benefits of the various interventions
to improve access of electricity communities that qualify for SHEP as well as solar micro-grids

13
extension to island communities. We analyse the results by relying on two quasi-experimental
methods: diff-in-diff and propensity score matching and report the results in Tables 3 and 4
respectively. Overall, we find that rural electrification intervention led to an increase in gross
income of about 46% higher relative to the non-electrified households for grid extension. The
coefficient is 0.379 but because the dependent variable is in logarithm, the actually effect is
estimated as 0.379( 1) 100% 46.1%e − = . This compares favourably with the results from the
matching estimation which estimates the average treatment effect on the treatment which is
around 42.3% (see Table 4). We also find improvement in gross income of about 62% higher
for households with grid connection without control. Without control we introduce fixed effects
to capture district-level and household-level characteristics that be related to both the decision
to connect and to the outcome of electrification.
A key identifying assumptions for the DD design requires that there are no other unobserved,
time-varying factors that could be influencing outcomes. To this end, we account for external
validility capturing the households connected to the grid who have never moved from their
districts and those connected who have moved before. The results show that connected
households who have never moved capturing control are most likely to increase their gross
income by 69% relative to non-connected households who have never moved and about 86%
without controls.

14
Table 3: Impact of electrification on household economic outcomes: Double Difference
Full sample Never movers (1) (2) (3) (4)
logY logY logY logY Electric × Post 0.620*** 0.379*** 0.864** 0.698** (0.142) (0.121) (0.380) (0.215) Controls No Yes No Yes District fixed effect No Yes No Yes Mean dep variable 7.39 7.39 7.39 7.39 Observations 17,717 17,717 7,869 7,869 R-squared 0.064 0.350 0.051 0.341 Notes: Electric×Post is the difference-in-difference indicator. Robust standard errors clustered at the district level are in parentheses. Y is household gross income. All regressions are weighted by the sample weights in the survey. All regressions include district fixed effects, as well as demographic and community level covariates unless otherwise stated in the table. Demographic covariates include household size, age of the household head, sex and marital status of the head. Community level covariates include fraction of households living below the poverty line, share of female-headed households, and fraction of women with completed higher education. Mean dependent variable is the logarithm of gross income for the control group. *** p<0.01, ** p<0.05, * p<0.1
In Table 4 we present results for PSM estimation as a robust measure for the DD estimations.
Basically, we sought to compensate for the non-existence of a selection rule for randomizing
the households into treatment and control groups. We apply the nearest neighbour (NN) PSM
to ensure that the control observation associated with the evaluated probability value nearest to
the treated household is choosen. The findings show that electricity connection to a household
improves gross household income. For instance, electricity connection has a high probability
of increasing gross income by about 42% respectively relative to comparable households not
connected at the district. In doing this we control for demographic covariates such as household
size, age of the household head, sex and marital status of the household head. After controlling
for district fixed effects, the impact increased slightly particularly for the gross income and
welfare. Thus, electrified households are seen to be performing better in terms of the outcomes
presented compared with non-electrified households.
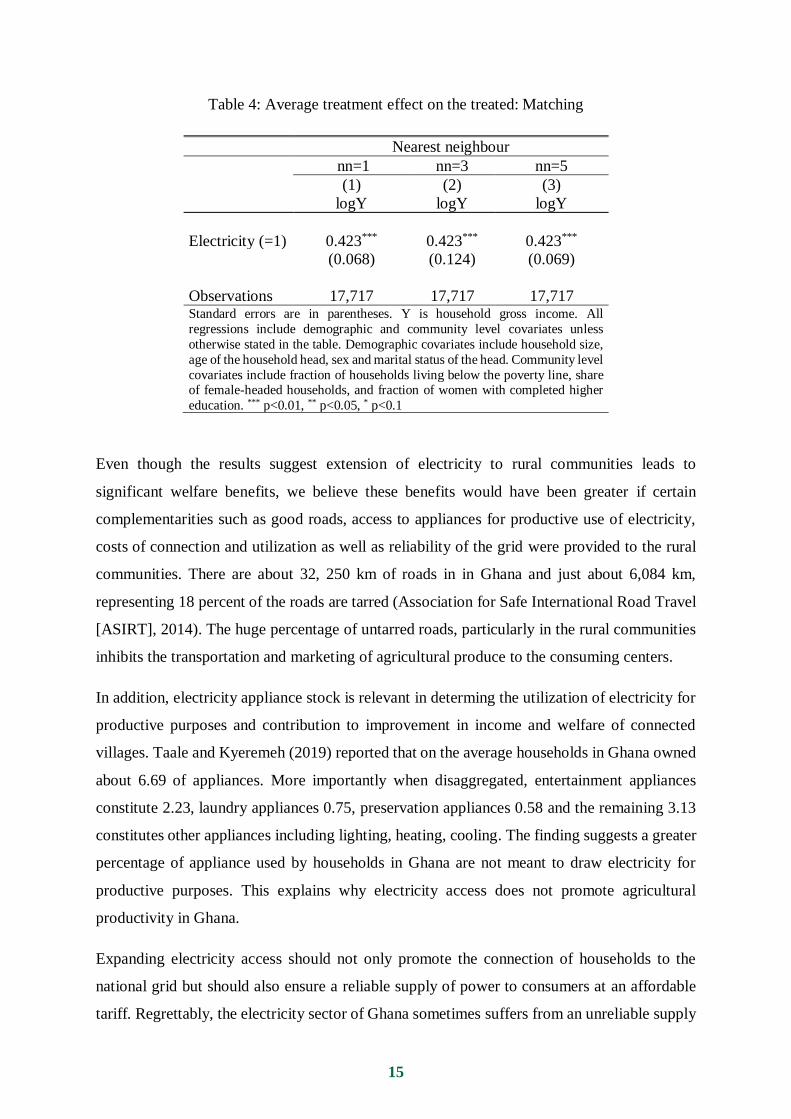
15
Table 4: Average treatment effect on the treated: Matching
Nearest neighbour nn=1 nn=3 nn=5 (1) (2) (3) logY logY logY Electricity (=1) 0.423*** 0.423*** 0.423*** (0.068) (0.124) (0.069) Observations 17,717 17,717 17,717 Standard errors are in parentheses. Y is household gross income. All regressions include demographic and community level covariates unless otherwise stated in the table. Demographic covariates include household size, age of the household head, sex and marital status of the head. Community level covariates include fraction of households living below the poverty line, share of female-headed households, and fraction of women with completed higher education. *** p<0.01, ** p<0.05, * p<0.1
Even though the results suggest extension of electricity to rural communities leads to
significant welfare benefits, we believe these benefits would have been greater if certain
complementarities such as good roads, access to appliances for productive use of electricity,
costs of connection and utilization as well as reliability of the grid were provided to the rural
communities. There are about 32, 250 km of roads in in Ghana and just about 6,084 km,
representing 18 percent of the roads are tarred (Association for Safe International Road Travel
[ASIRT], 2014). The huge percentage of untarred roads, particularly in the rural communities
inhibits the transportation and marketing of agricultural produce to the consuming centers.
In addition, electricity appliance stock is relevant in determing the utilization of electricity for
productive purposes and contribution to improvement in income and welfare of connected
villages. Taale and Kyeremeh (2019) reported that on the average households in Ghana owned
about 6.69 of appliances. More importantly when disaggregated, entertainment appliances
constitute 2.23, laundry appliances 0.75, preservation appliances 0.58 and the remaining 3.13
constitutes other appliances including lighting, heating, cooling. The finding suggests a greater
percentage of appliance used by households in Ghana are not meant to draw electricity for
productive purposes. This explains why electricity access does not promote agricultural
productivity in Ghana.
Expanding electricity access should not only promote the connection of households to the
national grid but should also ensure a reliable supply of power to consumers at an affordable
tariff. Regrettably, the electricity sector of Ghana sometimes suffers from an unreliable supply

16
of power mostly attributed to a litany of factors such as insufficient rainfall to generate
electricity using hydro source, shortfall in natural gas supply from Nigeria and Atuobo plant,
frequent breakdown of transmission and distribution equipment and rising world crude oil
prices. The unreliable nature of the power system may to a large extent prevent the productive
use of electricity by the rural communities to futher raise the benefits of electrification in the
remaining un-electrified communities in Ghana.
2.8 Mechanisms
In this section we evaluate possible pathways for which electricity access can impact gross
income of households at the district level. To accomplish this, we extracted information on
health indicators such as illness within the last two weeks, admission at the hospital within the
last two weeks, consulted a medical doctor within the two week and hospitalized within the
last twelve months before the survey. The results are presented in Table 5. The finding shows
that there is a high likelihood for electrified relative to non-electrified households to reduce
admision and being hospitalized at a health facility. This implies households in electrified
districts with healthcare spent less on healthcare relative to comparable households in dictricts
without electricity. The marginal effects of the probit model are -0.310 and -0.353 for admit
and hospitalized repectively and they are statistically significant at 5% level of significance.
These marginal effects imply that the likelihood of a household member in a district with
electricity connection to be admitted and hospitalized is about 31% and 35.3% lower than
comparable households in districts without electricity access.

17
Table 5: Impact of Rural Electrification – Health Pathways
(1) (2) (3) (4) Illness Admit Consult Hospitalise Electric × Post 0.080 -0.310** 0.054 -0.353**
(0.075) (0.130) (0.152) (0.142)
Mean dep var 0.63 0.01 0.13 0.08
Observations 17756 17756 17756 17756
Notes: Electric×Post is the difference-in-difference indicator. Illness is an indicator which is equal to one if the respondent has been ill or suffered an injury two weeks preceding the survey and zero otherwise; Admit is a dummy variable which is equal to one if the respondent had been admitted at a facility two weeks preceding the survey; Consult is also an indicator if the respondent consulted a doctor two weeks preceding the survey and Hospitalise is an indicator which is equal to one if the respondent has been hospitalised in the last 12 months preceding the survey. Robust standard errors clustered at the district level are in parentheses. All regressions are weighted by the sample weights in the survey. All regressions include district fixed effects, as well as demographic and community level covariates unless otherwise stated in the table. Demographic covariates include household size, age of the household head, sex and marital status of the head. Community level covariates include fraction of households living below the poverty line, share of female-headed households, and fraction of women with completed higher education. Mean dependent variable is the logarithm of gross income for the control group. *** p<0.01, ** p<0.05, * p<0.1
3 Intervention 2: Off-Grid Extension
3.1 Overview
As part of a national strategy to bring electricity to the remote and sparsely dispersed
population, off-grid solutions comprising the deployment of Solar Pico Systems (SPS) and
Solar Home Systems (SHS), mini mini-grids using solar and wind technologies, with diesel
generators back up have been used to supply electricity. These communities comprising
lakeside and islands h are beyond the national grid, thus making grid extension uneconomical.
Since off-grid solutions such as mini-grids and stand-alone solar provide collective solutions
at relatively lower cost to facilitate basic needs and stimulate productive use of electricity. The
International Energy Agency (2017) indicated that mini-grid and other off-grid connections
will be needed to provide electricity to about 400 million people by 2030 to achieve the
Sustainable Energy for All goal of universal energy access.
In the light of the above discussion, off-grid extensions offer another great opportunity to
connect a large chunk of the rural population to electricity or to have some form of electricity
in their household. While micro grids were the original consideration, the data available on
them at the moment is quite scanty. Thus, statistical analysis on it seems to lose power.
Consequently, due to the number of observations on the micro grids, we club the other sources

18
of lighting except the main grid (electricity) to constitute off-grid. For instance, in the GLSS 7,
72.14% have been connected to the national grid whereas 24.95% do not have any form of
connectivity to electricity. The remaining are split between those who have mini-grids, solar
lanterns, solar home systems, private generators, rechargeable batteries and others. We
therefore consider these as off-grid extensions and compare the outcomes of these individuals
to those without any form of electricity.
3.2 Implementation Considerations
The World Bank-funded Ghana Energy Development and Access Project (GEDAP), has
introduced five pilot mini grid projects in 2016 with a total installed capacity of 1.7 MW. These
grids provide electricity to four island communities with a population of over 10, 000 people.
Besides provision of electricity for residential purposes, the mini-grids and other off-grid
solutions stimulated produective use of electricity as they were used for irrigation and other
commercial ventures.
While the benefits of the mini grids for these communities are clear, there are still many
challenges if these projects are to be scaled up to 200 more island communities without
electricity access. The mini grid sector still lacks policy and regulatory clarity, and the pilot
projects mainly rely on intermittent funding primarily sourced from development partners and
nongovernmental organizations.
3.3 Literature Review
A key challenge of grid-powered electricity is the difficulty in reaching scattered communities
with very small population size and which cannot be reached by road. These characteristics
increase the cost of grid extension not to mention the additional costs incurred in maintaining
them (Torero, 2015). It is in situations like this that off-grid electricity sources such as solar
and diesel power becomes very essential. According to Torero (2015), off-grid electricity
sources like stand-alone solar, mini-grids with solar battery and diesel back-ups can provide
viable means of increasing access for people in remote areas. The difficulty with grid electricity
in these scattered settlements makes solar electricity access cost effective in delivering benefits
of electricity to such people. Switching to off-grid electricity access will also be a step in the
right direction in reducing indoor air pollution and global warming with its attendant negative
effects (Rom & Gunther, 2017). Grogan & Sandanand (2012) document how access to off-grid
electricity enabled women in Nicaragua to work for more hours in the day using lighting. The

19
authors note that more than 1% of Nicaraguans used off-grid electricity like solar for their
lighting in 2005. In Ghana, Gyamfi et al. (2015) examine how the provision of electricity can
be improved by exploiting the huge potential in renewable energy sources like wind and solar
PV. The authors note one way to expand the generating capacity in the country is to increase
the use of these renewable energies which is being under-utilized. Conversely, Kumi (2017)
note that solar electricity access is a viable option for areas with hot temperatures like the
northern part of Ghana. Solar panels can easily be powered to generate power since they are
mostly disadvantaged with regards to access to electricity.
3.4 Economic Benefits of Off-Grids
We analyse the effect of being connected to an off-grid extension in this section as described
in the overview. We rely on the latest wave of the GLSS in this analysis since no information
on off-grids particularly mini-grids is found in the preceding waves. Though, less than 3 percent
of the households are connected to the off-grid, we still present the result, taking into account
the possible loss of power of the significant tests due to the small sample. Nonetheless, we do
well to provide a first-hand but quite important estimate of the effect of being connected to the
mini grid on outcomes. Here, we analyse the effect on outcomes such as household per capita
expenditure (as a measure of welfare), the probability of consulting a doctor and the probability
of being admitted at the hospital or health facility and on the time an individual spents doing
his/her homework while in school. We deem it appropriate to include some health variables
since electricity can affect many economic outcomes through its impact on health. The health
variables found in the GLSS are quite scanty so we were compelled to use these two proxies
for this purpose.
Ideally, it would be appropriate to conduct field experiments to identify the effect of those
using off-grid extensions on education and health variables, the present study nonetheless tries
to quantify some of these benefits by resorting to the data available. Regarding the education
benefits, we argue that if an individual has some source of lighting, it can increase the length
of time he/she studies at night and hence would be able to do his/her homework. Thus, we
utilise this information in the data in order to estimate the effect of being connected to an off-
grid on the time spent doing homework. All analyses done on the off-grid are at the individual
levels instead of the household level.

20
Table 6: Impact of mini grid connection on outcomes: Difference in means estimates
(1) (2) (3) (4) (5) (6) (7) (8) logW Consult Admit Homework logW Consult Admit Homework Off-Grid 0.171 0.043*** 0.003 0.095 0.209* 0.045*** 0.005* 0.129 (0.119) (0.015) (0.003) (0.195) (0.114) (0.016) (0.003) (0.221) Observations 3,088 15,117 15,117 3,374 3,084 13,049 13,049 3,122 R-squared 0.004 0.002 0.000 0.000 0.072 0.011 0.002 0.037 Controls No No No No Yes Yes Yes Yes Robust standard errors clustered at the cluster level are in parentheses. W is real household per capita expenditure as a measure of welfare. Consult is an indicator variable which is equal to one if the respondent indicated consulting the doctor two weeks preceding the survey and zero otherwise. Admit is an indicator which is equal to one if the respondent indicated admitted to a hospital or health facility and zero otherwise. Homework is the number of hours spent on homework a week preceding the survey. All regressions include demographic characteristics. Demographic covariates include household size, age, sex and marital status. *** p<0.01, ** p<0.05, * p<0.1
We find that being connected to off-grid compared with those without any form of
electrification marginally improves welfare. This is evident in column (5). We do not find any
effect on education – there is no significant effect of being exposed to off-grid connection on
the hours spent doing homework.
3.5 Grid versus micro-grid technologies in Ghana
Many factors influence the choice of connecting to the national grid or a mini grid in the rural
or an isolated area in Ghana. These facors comprise of economic, financial, social,
environmental, and technical parameters (Energy Management Assistance Program [EMAP],
2017). Grid connection has become the preferable method of electricfication globally, because
it generates high economies of scale which reduces the cost of supply. Customers connected to
the grid will thus have a lower cost and will be generally provided with electricity on a more
reliable and stable basis than customers connected to mini grid. In addition, grid provides a
much wider end-user usage of electricity relative to mini grid. PwC and KITE (2012) in a
survey revealed that more than 90% of households interviewed lamented the limited capability
of mini grid and solar energy by indicating that apart from charging of phone battery and
lighting these sources of electricity cannot be used for any other activity. However, despite its
merits, grid technology is incapable of reaching many isolated areas such as islands, lakeside
and sparsely populated communities due to high extension costs. The only cost-effective means
of getting electricity to these communities is through mini grids or solar PVs. Mini grids have
thus, become important in the provision of electricity to communities with lower demand for
electricity and at a cost lower than the fixed capital cost of grid extension.

21
Installed capacity for the provision of grid connection has increased significantly leading a high
level of reliability of the national grid. For instance, in Table 6, the total installed capacity of
on-grid electricity supply is 35,130 kw representing about 82% of total installed capacity from
2013 to 2017 while off-grid and mini- grid contributed only 7614 kw denoting 8%. In addition,
in 2019, the dependable capacity of grid connected electricity was about 90% of total installed
capacity while mini-grid and off-grid recorded a dependable capacity of 0% (Republic of
Ghana, 2019).
Table 6: Installed renewable electricity generation capacity, 2013 – 2017, kw
Year Off-grid On-grid Mini-Grid Installed (kW) Solar Wind Dist.SPV Utility
Solar W2E Hydro Solar Wind
2013 - - 495 2,500 - - - - 2,995 2014 1,350 - 443 - - - - - 1,793 2015 4,003 20 700 20,000 100 4,000 256 11 29,090 2016 1,238 - 2,626 - - - - - 3,865 2017 678 - 4,266 - - - 58 5,002
TOTAL 7,269 20 8,530 22,500 100 4,000 314 11 42,774 Source: Energy Commission (2018)
With respect to tariffs, there exist two major schemes; deregulated cost- reflective tariffs and
uniform utility tariffs (Reber et al., 2018). Deregulated tariffs ensure that mini-grid developers
are allowed to generate electricity and set their own rates to cover both capital and operational
costs. Even though deregulated tariffs are subjected to regulatory approval, the tariffs charge
though even higher than those charged by the national grid operator, they will still be lower
than cost of using kerosene and other forms of energy. Unfortunately, deregulated tariffs
schemes are rarely practiced in Ghana. On the other hand, national utility tariffs scheme ensures
consumers of electricity are charged a uniform rate regardless of connection to national grid or
mini-grid. The principal intention is to provide fairness and equality among consumers. Tariffs
are based on the utility grid rates or are tied to the utility’s cost-of-service. In most cases the
tariffs are either cross-subsidized or the government provides the subsidy by making the cost
of electricity affordable. The intention of government to make electricity affordable compels
micro-grid developers to compete with tariffs that are below cost-recovery rates. In 2019,
electricity tariffs in Ghana range from a lifeline rate of Ghp35.36 per kWh (USD 0.077) to
Ghp97.09 per kWh (USD 0.233) for residential customers. The highest tariff for commercial
consumers was Ghp162 per kWh (Reber et al., 2018). The tariffs rise with increases in
consumption of electricity. The highest commercial rate is a huge challenge to min-grid
developers as they are unable to build financially viable system. Ghana Energy Development

22
and Access Project (GEDAP) has developed 5 micro-grid projects. However, the tariffs
charged are inadequate to cover the variable cost. As a result, subsidies needed to cover the
operational cost ranges from GHS 5.82 and GHS 55.73 (USD 0.01 and 0.13) per kWh per
month conditional on the category of tariff (Reber et al., 2018).
4. Conclusion By the beginning of 2019, about 84% of the population of Ghana had access to electricity – the
second highest level in Sub-Saharan Africa. This significant achievement was accomplished in
27 years, up from 1.08% in 1991 with an average annual growth rate of 2.3% (Blimpo &
Cosgrove-Davies, 2019) through the National Electrification Scheme. The current rate of
growth of electrification appears low and may prevent Ghana from accomplishing her target of
universal access by the year 2020. Experts have indicated that Ghana can meet her target of
universal access in 2020 if the current rate of electrification is raised to about 4.38% per annum.
To increase the rate of electrification and to speed the universal coverage dream, the
government of Ghana introduced the SHEP and off-grid electricity connections technologies
to supply electricity to island and lakeside communities who do not have access. The general
objective of this project is to undertake cost-benefit analyses of two interventions addressing
rural electrification in the context of Ghana. First, we study the benefits of expanding electrical
grid to communities that qualify for SHEP. This intervention envisages connecting all
unelectrified households to the electricity grid with daily continuous 24 hours supply. Second,
we study the socio-economic benefits of solar micro-grids back by dieseal generators, solar
stand-alone and solar home system extension to island communities. Overall, we find that rural
electrification intervention led to an increase in gross income of about 46% higher relative the
non-electrified households for grid extension. Similarly, we find that being connected to off-
grid compared with those without any form of electrification marginally improves welfare.
23
5. References Adu, G., Dramani, J.B., Oteng-Abayie, E.F. and Frimpong, P.B. (2018). Powering the
Powerless: the economic impact of rural electrification in Ghana, Energy Economics (under
review).
Akpan, U., Essien, M. & Isihak, S. (2013). The impact of rural electrification on rural micro-enterprises in Niger Delta, Nigeria. Energy for Sustainable Development, 17 (2013) 504–509.
Association for Safe International Road Travel (2014), Road Travel Report: Ghana
Bernard, T. & Torero, M. (2011). Randomizing the “Last Mile”: A Methodological Note on
Using a Voucher-Based Approach to Assess the Impact of Infrastructure Projects. IFPRI Discussion Papers 1078, International Food Policy Research Institute (IFPRI).
Bensch, G., Kluve, J. and Peters, J. (2011), Impacts of rural electrification in Rwanda,
Journal of Development Effectiveness, 3(4): 567–88.
Bernard, T. & Torero, M. (2009). Social Interaction Effects and Connection to Electricity: Experimental Evidence from Rural Ethiopia, Mimeo. International Food Policy Research Institute, Washington, D.C.
Blimpo, M.P. and Cosgrove-Davies, M. (2019), Electricity Access in Sub-Saharan Africa Uptake, Reliability, and Complementary Factors for Economic Impact, 9 International Bank for Reconstruction and Development / The World Bank.
Burlig, Fiona, and Louis Preonas. 2016. “Out of the Darkness and Into the Light?
Development Effects of Rural Electrification.” Energy Institute at Haas Working Paper #268.
https://ei.haas.berkeley.edu/ research/papers/WP268.pdf
Cabraal, R. A., Barnes, D.F. and Agarwal, S.G. (2005). Productive Uses of Energy for Rural
Development. Annual Review of Environment and Resources 30: 117-44.
Chakravorty, U., Emerick, K., and Ravago, M.L. (2016), Lighting up the last mile: The
benefits and costs of extending electricity to the rural poor, United States Agency for
International Development (USAID) and the Energy Policy for Development Program
(EPDP) at the University of the Philippines (UP).
Dinkelman, T. (2011), The Effects of Rural Electrification on Employment: New Evidence
from South Africa, American Economic Review, 101(7): 3078–108.
Energy Commission (2018), Ghana Energy Statistic Hnadbook, Government of Ghana.
Khandker, S. R., Barnes, D.F. and Samad, H.A. (2013), The Welfare Impacts of Rural
Electrification in Bangladesh, Development Economic and Cultural Change, 61(3): 659-692.

24
Kirubi, C., Jacobson, A., Kammen, D.M. & Mills, A. (2009). Community-Based Electric Micro-Grids Can Contribute to Rural Development: Evidence from Kenya. World Development, doi:10.1016/j.worlddev.2008.11.005.
Heckman, J.J., Hidehiko I., and Petra T. (1997), Matching as an Econometric Evaluation Estimator: Evidence from Evaluating a Job Training Programme, Rev. Econ. Studies 64 (October): 605–54. Heckman, J.J., Hidehiko I., and Petra T. (1998), Matching as an Econometric Evaluation Estimator, Rev. Econ. Studies 65 (April): 261-294. Kumi, E.N. (2017), The Electricity Situation in Ghana: Challenges and Opportunities, CGD Policy Paper. Washington, DC: Center for Global Development. https://www.cgdev.org/ publication/electricity-situation-ghana-challenges-and-opportunities
Lee, K., Miguel, E., and Wolfram, C. (2019), Experimental Evidence on the Demand for and Costs of Rural Electrification, NBER Working Paper Series, Working Paper 22292.
Mahapatra, S. and Dasappa, S. (2012), Rural electrification: Optimising the choice between decentralised renewable energy sources and grid extension, Energy for Sustainable Development Volume 16, Issue 2, 146-154.
Ministry of Energy (2010), National Electrification Scheme (NES) Master Plan Review (2011-2020), Draft Report,Volume 1 of 12 Main Report.
Ponce de Leon Barido, D., Nsutezo, F.M. & Taneja, J. (2017). The natural and capital infrastructure of potential post-electrification wealth creation in Kenya. Energy, Sustainability and Society, 7(28).
Reber, T., Booth, S., Cutler, D., Li, X., and Salasovich, J. (2018), Tariff considerations for micro-grids in sub-saharan Africa, National Renewable Energy Laboratory, NREL/TP-7A40-69044. Republic of Ghana (2019), An Outlook of the Power Supply Situation for 2019 and Highlights of Medium Term Power Requirements, 2019 Electricity Supply Plan for the Ghana Power System. Rosenbaum, Paul R., and Donald B. Rubin. (1983). “The Central Role of the Propensity
Score in Observational Studies for Causal Effects.” Biometrika 70 (April): 41-55. Taale, F., and Kyeremeh, C. (2019), Drivers of households’ electricity expenditure in Ghana, Energy & Buildings (2019), doi: https://doi.org/10.1016/j.enbuild.2019.109546. World Health Organization. Ghana: WHO statistical profile. 2015 January [cited 26 August 2014]. In: Global Health Observatory (GHO) data [Internet]. http://www.who.int/gho/countries/gha.pdf.

25
Van de walle, D., Ravallion, M., Mendiratta, V. & Koolwal, G. (2013). Long-Term Impacts of Household Electrifcation in Rural India. Policy Research Working Paper Series 6527, The World Bank.

i
Modeling Electrification Costs in Rural Ghana
Ghana Priorities
Francis Kemausuor Director The Brew-Hammond Energy Centre, KNUST, Kumasi
Kwaku Amaning Adjei Senior Lecturer and Fellow The Brew-Hammond Energy Centre, KNUST, Kumasi

I
Academic Abstract Ensuring affordable, reliable, sustainable and modern energy for all by 2030 remains possible
but will require more sustained efforts, particularly to reach some of the world’s poorest
populations and to improve energy sustainability. A combination of energy solutions is
required in order to bridge the gap in an optimal way. Such combinations could involve the use
of large hydro, thermal and adoption of renewable energy technologies where applicable. An
appropriate electrification plan is a key element for policy-makers to set policy direction and
develop programme-roadmaps on energy access. Such programmes can utilize both renewable
and non-renewable sources of energy through grid extensions and the development of local
off-grid solutions. This study modelled electrification options for unelectrified rural
communities in a Ghanaian district to show which of the options present least cost for
electrification of the communities.
Key Words: Grid extension, mini-grids, rural communities, least cost

II
1. INTRODUCTION AND LITERATURE REVIEW .................................................................................................. 1
1.1 BACKGROUND ............................................................................................................................................ 1
1.2 BRIEF REVIEW OF LITERATURE ........................................................................................................................ 2
2. METHODOLOGY ........................................................................................................................................... 5
2.1 PILOT STUDY DISTRICT ................................................................................................................................. 5
2.2 APPLICATION OF GEOSIM DECISION PLANNING TOOL........................................................................................... 8
2.2.1 Spatial Analyst ................................................................................................................................ 9
2.2.2 Demand Analyst ........................................................................................................................... 10
Load Forecast ........................................................................................................................................ 10
2.2.3 Network Options ........................................................................................................................... 11
2.2.4 Distributed Energy ........................................................................................................................ 11
2.3 DATA REQUIREMENTS ................................................................................................................................ 11
2.3.1 Grid Extension............................................................................................................................... 12
2.3.2 Mini-grid systems ......................................................................................................................... 12
3. COST OF ELECTRIFICATION INTERVENTIONS – PRELIMINARY RESULTS ....................................................... 12
3.1 LOAD FORECAST ....................................................................................................................................... 12
3.2 INTERVENTION 1: GRID CONNECTION ............................................................................................................ 15
3.2.1 Overview and Implementation ...................................................................................................... 15
3.2.2 Costs and Benefits......................................................................................................................... 16
3.3 INTERVENTION 2: MINI-GRIDS ...................................................................................................................... 17
3.3.1 Overview and Implementation ...................................................................................................... 17
3.3.2 Costs and Benefits......................................................................................................................... 18
3.4 INTERVENTION 3: GRID CONNECTION FOR ALL COMMUNITIES WITH POPULATION ABOVE 200 ....................................... 21
3.4.1 Overview and Implementation ...................................................................................................... 21
3.4.2 Costs and Benefits......................................................................................................................... 21
5. CONCLUSION ............................................................................................................................................. 22
6. REFERENCES ............................................................................................................................................... 24
7. APPENDIX 1 – KEY INPUT PARAMETERS FOR MODELLING.......................................................................... 26
8. APPENDIX 2 – UNELECTRIFIED SETTLEMENT INFORMATION, GUSHIEGU MUNICIPALITY............................ 29

1
1. Introduction and Literature Review
1.1 Background
One of the significant drivers of socio-economic development of a country is access to
electricity (Duer and Christensen, 2010; Kanagawa and Nakata, 2007). Access to electricity
contributes to improvements in health delivery, education, environmental sustainability and
agricultural development including crop irrigation, agro-processing, and preservation of farm
produce (Haanyika, 2008; Sokona et al., 2012).
Reports from the International Energy Agency (IEA), the International Renewable Energy
Agency (IRENA), and the United Nations Statistics Division (UNSD) in 2019 suggests that
despite significant progress in recent years, the world is falling short of meeting the global
energy targets set in the United Nations Sustainable Development Goals (SDG) for 2030.
Ensuring affordable, reliable, sustainable and modern energy for all by 2030 remains possible
but will require more sustained efforts, particularly to reach some of the world’s poorest
populations and to improve energy sustainability.
Notable progress has been made on energy access in recent years, with the number of people
living without electricity dropping to roughly 840 million from 1 billion in 2016 and 1.2 billion
in 2010 (World Bank, 2019). India, Bangladesh, Kenya and Myanmar are among countries that
made the most progress since 2010 according to data from the International Energy
Agency. However, without more sustained and stepped-up actions, 650 million people will
still be left without access to electricity in 2030. Nine out of 10 of them will be living in sub-
Saharan Africa (United Nations Statistics Division, 2019).
Insufficient financial resources, lack of effective planning, fast population growth and a high
population density with widely dispersed rural inhabitants are just some of the many challenges
in Africa’s bid to attaining energy access (Nerini et al., 2016). African governments struggle
to find solutions that can provide an acceptable level of energy access to the larger segment of
their population without exceeding the limited budgets that they have to work with. A
combination of energy solutions is required in order to bridge the gap in an optimal way. Such
combinations could involve the use of large hydro, thermal and adoption of renewable energy
technologies where applicable. An appropriate electrification plan is a key element for policy-
makers to set policy direction and develop programme-roadmaps on energy access (Szabó et

2
al, 2011). Such programmes can utilize both renewable and non-renewable sources of energy
through grid extensions and the development of local off-grid solutions.
In view of this, the aim of this research paper is to model electrification options for unelectrified
rural communities in Ghana. This is expected to be achieved using grid and mini-grid
interventions as follows:
i. Expansion of Electrical Grid
This intervention envisages connecting un-electrified households to the electricity grid with
daily continuous 24 hours supply.
ii. Solar Micro-grids
This intervention envisages providing electricity to un-electrified households by installing solar
micro grids distributed across villages as per local capacity requirement.
iii. Diesel Micro-grids
This intervention envisages developing diesel generator based micro grids distributed across
villages as per local capacity required to provide electricity to all un-electrified households.
1.2 Brief Review of Literature
Despite the poor state of electrification access in Africa, Ghana has an enviable position on the
African continent, with regards to access to electricity. The 2019 Energy Ststaistics Publication
from the Energy Commission (Energy Commission, 2019) reveals that total grid electricity
generation in the country was 16,246 Gigawatt-hours (GWh) in 2018, comprising 62.8%
thermal generation, 37% from large hydro and 0.2% from other renewable energy sources
(solar and biogas).
By the beginning of 2019, over 84% of the population of Ghana had access to electricity, with
urban access rate at about 93% and rural at around 71%. The recently published Ghana Living
Standards Survey (Ghana Statistical Service, 2019), indicates that regions in the northern parts
of the country have much lower access to electricity, compared to regions in the southern parts
of the country (See Table 1). In all three northern regions highlighted in Table 1, national grid
connection is less than 70%. This unfortunate situation emanates from the fact that most
communities in the northern parts of the country are mostly of lower population densities and
are quite far from major medium voltage lines. Furthermore, many of these communities are

3
difficult to access due to poor road infrastructure and difficult terrain (Palit and
Bandyopadhyay, 2016). The situation is worse in rural communities.
Table 1: Source of electricity supply to households by Region
Region National Grid Connection
Local Mini Grid
Private Generator
Solar Home System
Solar Lantern/ Lighting System
Other No Electric Power
Western 82.9 0.0 0.1 0.1 0.6 0.8 15.0 Central 84.4 0.0 0.1 0.2 0.9 13.8 Greater Accra 93.7 0.0 0.0 0.1 0.0 5.8 Volta 75.3 0.0 0.0 0.1 0.7 0.3 23.7 Eastern 73.8 0.6 0.2 0.2 0.6 0.2 24.0 Ashanti 89.2 0.0 0.0 0.0 0.2 0.6 9.5 Brong Ahafo 72.5 0.8 0.1 0.1 0.1 0.2 25.9 Northern 66.1 0.0 0.0 0.4 0.3 0.2 32.1 Upper East 47.7 0.0 0.2 0.7 5.3 0.6 38.8 Upper West 57.8 0.9 0.0 0.4 0.2 0.0 40.5
Northern Ghana (as used in Table 1, before its split in early 2019) has the largest land area and
contributes to about 10% of the total population of the country. The population portfolio has
created more rural communities than urban areas with a low population density. Agriculture,
hunting, and forestry are the main economic activities which altogether account for the
employment of 71.2% of the economically active population. The prevailing economic and
demographic characteristics present accessibility challenges as most of these communities are
dispersed and far from the existing grid. Weather conditions average 32 ℃ in the north which
could be favourable for the use of Solar PV systems and other forms of renewables. These
conditions make interesting case for research to explore possibilities for using different
electrification approaches for the remaining unelectrified communities.
Studies exploring least cost electrification options for settlements have been conducted using
a number of planning tools. Kemausuor et al (2014) used the Network Planner to explore costs
of different electrification technology options in un-electrified communities in Ghana. The aim
of the study was to recommend electrification technology options for 2600 unelectrified
communities in Ghana and determine the estimated cost of electrification and other inputs (such
as length of medium and low voltage lines), for these communities at different penetration
rates. The study found that by the end of a 10-year period, the cost optimized option for the
majority of the un-electrified communities in each of the regions in the country will be grid
electrification, accounting for more than 85% of the total un-electrified communities in each
region. The high rate of grid extension was attributed to the extensive pre-existing grid network

4
coverage over the country, which reduces the distances and thus the costs, to connect remaining
communities. Mini-grids accounted for 8% and standalone systems accounted for 7%.
Using Geographical theory and Graphical Information Systems, Mentis et al. (2015) applied
geographical tools to explore all electrification options for rural communities in Ethiopia. The
integration of energy system models and Geographic Information Systems (GIS) and the
development of combined tools were deemed fundamental for a better understanding of the
spatio-temporal dynamics of energy planning. The research applied such a methodology
drawing on GIS tools and remote sensing data to fill data gaps in national databases, such as
renewable energy resources, actual costs of diesel at the point of consumption, population
density linked to energy demand and transmission infrastructure. The paper illustrated two
major aspects of energy planning; 1) how the optimal electrification mix is influenced by a
range of parameters including population density, existing and planned transmission networks
and power plants, economic activities, tariffs for grid-based electricity, technology costs for
mini-grid and off-grid systems, and fuel costs for consumers and 2) how the electrification mix
differs from location to location. Using 2030 as the time horizon for this planning, the study
concluded that grid connections were optimal for the majority of the rural communities that
were targeted for the exercise; grid extension constituted the lowest cost option for
approximately 93% of the newly electrified population. The geographical tool also found some
remote areas with low population density where a mini-grid or a stand-alone solution were the
recommended economic solution.
In another study, the techno-economic analysis of stand-alone wind micro-grids, compared
with PV and diesel in Africa was investigated by Gabra et al (2019). The study analyzed the
economic feasibility of small-scale wind systems for rural electrification in Africa. A spatial
mapping model was used to enable the visualization of the electrification costs of wind systems
across the African continent. The results of the analysis were integrated with previous work
performed for photovoltaic (PV) and diesel systems. This integration produced a map
indicating whether PV, diesel or wind systems are the least cost off-grid electrification option
across the continent. The results show that PV and diesel systems are the most economically
viable method of rural electrification in Africa, while wind systems are economically
advantageous only within the horn of Africa and across few dispersed areas.
In order to argue for the adoption of decentralized renewable energy in South Asia’s Lao PDR,
Martin and Susanto (2014) developed decision aid modules that undertook a cost-benefit

5
analysis of the existing grid expansion module to alternative decentralized renewable energy
(DRE) options. The tool was developed to compare the financial limitations, flexibility and
decentralized operational capabilities of DREs. The study showed that DREs possessed
flexibility that suits the fluctuating nature of demand in rural communities. However, grid-
extension was a cheaper and consequently possessed more subsidy for the consumers.
Additionally, Zeyringer et al. (2015) used micro-data from a national household survey to
estimate electricity demand for households that are within reach of electricity infrastructure to
predict latent demand in unconnected households. They used this to analyse the cost-effective
electrification solution for Kenya comparing grid extension with stand-alone PV systems.
Results suggested that decentralized PV systems could make an important contribution in areas
with low demand and high connection costs. The findings showed that up to 17% of the
population can be reached cost-effectively by off-grid PV systems for up to five years.
The challenges of access to electricity was also studied across five federal states in Nigeria to
ascertain the required combination of energy systems it might take to provide 100%
electrification. The modelling process looked at grid extension, hybrid minigrids, and solar
home systems in a technically and economically sound way for different implementation
phases. The study showed that investments of approximately $1600 million for medium-
voltage (MV) and low-voltage distribution infrastructure, minigrids, and smallscale systems
were required to achieve a 100% electrification rate. An overall load of about 1804 MW
characterized the simulated electricity system of the five states.
The studies cited above are few indications of how decision aid tools and modules influence
energy supply and access to electricity across the African continent. The outputs from these
tools influence energy policies and investment decisions in order to make efficient utilization
of the rarely available financial resources in the energy sector.
2. Methodology
2.1 Pilot Study District
This pilot study was conducted in the Northern Electricity Distribution Company (NEDCo)
operational area, which consist of the seven regions in the northern parts of the country (until
2019, there were only four regions, which have since been split into seven regions). The
northern part of the country was chosen for this study because of the lower access to electricity
in the region and the dispersed nature of communities, making it ideal for this pilot study. Even

6
though there are several island communities in the Southern parts of the country, government
already has a major mini-grid electrification plan for the island communities. Research into
electrification options for mainland rural communities could assist in the prioirtisation of
resources for electrification of those remaining rural communities, using appropriate
technologies.
The Gushiegu Municipality in the Northern Region was selected for the pilot because if it has
rural communities with a mix of population sizes, ranging between less than 100 to about 3000,
presenting a good population mix for studies like this. The Gushegu Municipality is one of the
sixteen Metropolitan, Municipal and District Assemblies (MMDAs) in the new Northern
Region. It is located on the north-eastern corridor of the country (see Figure 1). The
Administrative capital of the Municipality is Gushiegu and is about 105 kilometers north-east
of Tamale, the regional capital. The total land area of the Municipality is approximately 2,674.1
square kilometers. The Municipality shares boundaries to the east with Saboba and Chereponi
Districts, Karaga District to the west, East Mamprusi Municipal to the north and Yendi
Municipality and Mion District to the south. As of the 2010 population and housing census,
the population of the Municipality was 111,259 with 54,186 males and 57,073 females.

7
Figure 1: Map showing position of Gushiegu in Ghana

8
2.2 Application of GeoSim Decision Planning Tool
The study used a decision support tool focused on rural electrification planning designed by
Innovation Energie Developpement (IED) based in France. The software, GEOSIM, is based
on a Geographical Information System (GIS) technology and operates in the MANIFOLD
environment. GEOSIM can be used to identify key development centers, grid extension and
least cost decentralized projects using renewable energy resources. The available energy supply
options together with the spatial, economic and existing energy demand data are also used to
recommend an optimum electrification plan and to determine the estimated cost of
electrification and other inputs (such as length of the medium and low voltage lines), for these
communities.
GEOSIM consists of four interdependent modules: Spatial Analyst, Demand Analyst, Network
options, and Distributed Energy. The sequence of operation is as demonstrated in Figure 2. The
interface of the model is shown in Figure 3.
Figure 2: GEOSIM planning process
Spatial Analysis
•Spatial Analysis and Planning
Demand Analysis
•Load forecasting
Network options
•Optimization of supply options
Distributed Energy
•Standalone Systems
Output: Rural electrification blueprint for the target study area

9
Figure 3: Interface of GeoSim Tool
2.2.1 Spatial Analyst
The main feature of this module is the Spatial Analysis and multisectoral planning aid. Through
the concepts of development poles and hinterlands, the tool identified and analyzed settlements
with high potential for social and economic development as priority, in order to maximize the
impact of rural electrification. Given that the major limitation to achieving higher
electrification is often financial, the spatial analysis tool optimizes the planning system by
prioritizing projects that will benefit the largest number of people through access to improved
social services (health, education, portable water) and local opportunities like businesses and
employment.
The spatial analysis module initiated the planning process by completing the following tasks:
i. Calculation of the Indicator of Potential Development (IPD) for each settlement. The
IPD is a measure of the quality of socio-economic services provided by a given
settlement. Its structure is inspired from the Human Development Index (HDI), and as
such comprises three main themes: health, education and local economy;
ii. Selection of the development poles (areas with high priority) according to this indicator;
iii. Calculation of the population covered by each development pole;
iv. Ranking of the development poles;
v. Mapping of hinterlands or areas of attractions; and

10
vi. Identification of isolated areas – settlements with low accessibility to social and
economic services provided by the development poles.
2.2.2 Demand Analyst
Demand Analyst is a specialized tool for forecasting village or cluster of village demand. By
its ‘bottom-up’ approach the model predicts reliable demand in the medium and long term. The
bottom-up approach requires data gathering from the demand of end-users or small
administrative units moving up to the larger scales.
The Demand Analyst tool was used to model and forecast the demand for electricity at the
village level using average consumption patterns of different types of end-users (poor, medium,
rich households, schools, shops, other productive activities, etc.). The tool calculated the
following load characteristics for each village of the study area and supply scenario:
i. Number of clients (both low and middle voltage);
ii. Peak demand (kW);
iii. Yearly consumption (kWh); and
iv. Load duration curves.
The tool also considered outliers classified as special demand in the data driven process. This
special demand tag was assigned to end-users whose power consumption significantly
outweighs the consumption of a single settlement and can be of the same order of magnitude
than a small cluster of settlements. These large specific demands are typical of large
agribusinesses or factories.
Load Forecast
The demand calculation was preceded by the provision of key parameters which includes
definition of planning period, study area, scenario type and other miscellaneous parameters.
Planning period definition requires the use of population data, existing household connection
rates (if available), infrastructure and services connection rate and the corresponding growth
rates for households and services in the mid-term and final year of the planning period.
In the study area data, the population growth rate and the number of people per household were
provided based on latest census data gathered in the targeted rural communities. A ‘scenario
type’ defines the number of hours of productive power consumption. For this pilot study, it was
assumed that power is available 24 hours a day, though not necesairly translating to 24 hours
of usage of every appliance. Miscellaneous parameters provided for overall estimated technical

11
losses and the proximity of households to the grid. These parameters were used for forecasting
the expansion of the electrical grid to possible non-electrified areas.
2.2.3 Network Options
Prior to undertaking the least-cost sizing of decentralized supply options, the Network Options
module first defines the areas unlikely to be connected to the grid in the near future. This
forecast of the national grid network is done by simulating the extension of the national grid,
taking into account several possible constraints (distance to substations, investment budgets,
available energy on the grid, etc.). The module was used to find the best decentralized option
to supply electricity to previously identified development poles and their surrounding
settlements, using selected projects with the lowest actualized cost of electricity.
The network module is designed with sophisticated least-cost path algorithm that draws
medium voltage lines according to natural and infrastructure constraints such as forests, lakes,
protected areas, etc. The network module is run from the GIS database using the following
layers; settlements, existing grid network lines, hydro potential, wind turbines and biomass
potentials of the target communities. For this pilot case, GIS data for hydro, wind and biomass
potential is not available and was not considered. Mini-grids for this pilot were therefore
assessed using diesel gensets and solar systems.
While we understand that consumer preference is often for grid connected power, it is also
important to stress that policy makers would consider what is best within the overall energy
policy framework of the country. The results from this analysis is based purely on least cost
options and does not factor consumer preferences. Indeed, Ghana Government’s mini-grid
interventions on the island and lakeside communities are based purely on costs, otherwise, the
grid is the most preferred electrification technology in Ghana,
2.2.4 Distributed Energy
The final module is used to assess the feasibility of pre-electrification programmes for
communities that are far from the development poles and not electrified in the planning
horizon. The tool was not used in this analysis, as it falls outside the scope of the objectives of
this study.
2.3 Data Requirements
Data requirements to run the model were obtained from various sources. A summary of data
obtained to run the model are as follows.

12
2.3.1 Grid Extension
- Cost of extending medium voltage lines;
- Cost of extending low voltage lines;
- Cost of transformers; and
- Cost of other accessories
2.3.2 Mini-grid systems
- Cost of solar panels;
- Cost of wind turbines;
- Cost of diesel gensets;
- Cost of storage systems;
- Cost of fuel; and
- Cost of other accessories
Data on unelectrified communities and their population and GIS information was obtained
from NEDCo. NEDCo also provided data on cost of medium voltage lines, low voltage lines,
transformers, and other accessories. Data on renewable energy systems were obtained from the
Ministry of Energy pilot mini-grids on the islands. Data on diesel gensets were obtained from
Mantrac Ghana. Other data sources include the National Petroleum Authority for diesel costs.
See Appendix 1 for details of the dataset used for the analysis.
3. Cost of Electrification Interventions – Preliminary Results
3.1 Load Forecast
A total of 175 unelectrified rural communities in the Gushiegu Municipality were modeled to
assess which electrification technologies are best suited for which communities for electricity
access. The year 2010 population estimate for these 175 unelectrified communities, based on
data provided by the utility, NEDCo, is 46,160 (see Appendix 2). Load forecasts were done
from 2020, chosen as the first year for electrification projects, to 2030, the last year. Population
forecast for the year 2020 was done using the Ghana Statistical Service growth rate of 2.9%
for the region. The first year assumes a conservative demand level, with 30% connection rate
and predominantly low-income households, resulting in a low demand per household and
community.

13
Figure 4: Map showing estimated community demand in 2020
In subsequent years, availability of electricity is expected to increase income levels of
households, and lead to an increased connection rate, as well as increased demand for
households, translating to multiple increases for the comunities. It is assumed that 90% of
households would have been connected by 2030, and a higher percentage of these households
would have increased income by the end date. This will result in an overall increased demand
for communities, and hence the district. Total electricity demand and peak demand maps for
the municipality for the year 2020 are shown in Figures 4 and 5 respectively. Map showing
2030 projected demand for communities is shown in Figure 6.

14
Figure 5: Map showing projected Community peak in 2020

15
Figure 6: Projected 2030 demand by community
3.2 Intervention 1: Grid Connection
3.2.1 Overview and Implementation
Grid connection is the most common and preferred electricity access option in Ghana today,
accounting for more than 95% of all connections in the country. In this first intervention, grid
connection is retricted to communities where grid extension is the most cost optimized
electrification solution. In this approach, a community that is deemed ‘isolated’ based on its
location, may not be recommended for grid connection because it may require longer medium
voltage (MV) lines, making grid connection more expensive than a mini-grid. Based on the
stepwise modeling approach used in this pilot, 79 communities are viable for grid
electrification in the district. This accounts for about 45% of the currently unelectrified
communities in the district. The electrification of the 79 communities is expected to be
undertaken in 8 years, between 2020 and 2027. Traditionally, grid exention in Ghana is
understaken by the distribution utility, with support from the Ministry of Energy. Depending
on the model adopted, the community may contribute some items, either from their own
resources, or through philanthropic or local government assistance. Recent rural electrification
is often entirely covered by the Ministry of Energy and the utility. The households are only

16
responsible for wiring their homes to receive the power. This is the model that is likely to be
implemented for rural electrification, going forward.
3.2.2 Costs and Benefits
Costs
Details of medium voltage line extension expected, as well as investment costs for other major
components are provided in Table 2. The population expected to be electrified per year is
shown in Figure 7. Electrification cost indicators are summarized in Table 3. Costs are inclusive
of connection costs. Total investment per inhabitant for grid electrification is US$ 411.
Table 2: Grid Extension Results
Year No. of communities
MV line length (m)
Investment (US$) MV Lines LV Lines Other costs Total
2020 10 15,600 702,000 521,664 60,746 1,284,410 2021 10 25,794 1,160,730 608,608 62,919 1,832,257 2022 10 28,437 1,279,665 560,560 62,961 1,903,186 2023 10 27,642 1,243,890 570,856 63,294 1,878,040 2024 10 39,909 1,795,905 565,136 63,221 2,424,262 2025 10 37,754 1,698,930 539,968 60,486 2,299,384 2026 10 44,827 2,017,215 663,520 69,929 2,750,664 2027 9 34,869 1,569,105 1,257,256 87,858 2,914,219 Total 79 254,832 11,467,440 5,287,568 531,414 17,286,422
Figure 7: Population Electrified per year
4,547
5,315
4,551 4,619 4,559 4,061
5,032
9,436
-
1,000
2,000
3,000
4,000
5,000
6,000
7,000
8,000
9,000
10,000
2020 2021 2022 2023 2024 2025 2026 2027
Popu
lati
on
Population electrified per year

17
Table 3: Electrification cost indicators
Indicator Cost Unit
Distribution / locality 73,658 US$
Connection / locality 145,157 US$
Total Investment / locality 218,815 US$
Total Investment / inhabitant 411 US$
3.3 Intervention 2: Mini-grids
3.3.1 Overview and Implementation
Franz et al. (2014) define mini-grids as involving ‘small-scale electricity generation, and the
distribution of electricity to a limited number of customers via a distribution grid that can
operate in isolation from national electricity transmission networks and supply relatively
concentrated settlements with electricity at grid quality level’. They go on to define micro-
grids as similar to mini-grids but operating at a smaller size and generation capacity of 1-10
kW. USAID (2011) also defines mini-grid as a ‘set of electricity generators and possibly energy
storage systems interconnected to a distribution network that supplies electricity to a localized
group of customers via a distribution grid that can operate in isolation from national electricity
transmission networks’. The definitions point out three main issues: (1) mini-grids are small
scale, often less than 10 MW; (2) mini-grids serve limited customers, compared to the national
grid; and (3) mini-grids are isolated from the national transmissions network. While mini-grids
are by their design made to operate independent of the central grid, they may be designed with
the option to connect to the central grid when the grid reaches a community where a mini-grid
operates (Verma and Singh, 2013).
Ghana’s current mini-grid policy places the burden of mini-grid development and operation on
the government, through the energy sector utilities. According to the policy, every aspect of
mini-grid development from design to operation will be public sector led, with private sector
participating only through contracts for services, such as construction, for example. The policy
requires that mini-grids only charge electricity tariffs approved by the Public Utility Regulatory
Commission for grid customers, limiting investment opportunities for the private sector. It is a
matter of fact that mini-grid tariffs are always higher than grid tariffs in almost every country
where mini-grids are operated. The government is not willing to pay any subisdies to private

18
sector investors, nor allow for the charging of ‘cost-recovery’ tariffs required to make private
investment profitable. In view of this public sector approach, the Energy Commission is yet to
develop a regulation to guide mini-grid development in Ghana.
3.3.2 Costs and Benefits
Costs
Communities that were not connected to the grid within the planning period were analysed for
diesel and solar mini-grids. In all, 46 communities were modelled for diesel and solar mini-
grids. Typical of mini-grids, levelized costs are much higher than current electricity cost of
electricity from the grid. Levelised costs are extremely higher in this analysis because the
planning period only covers the period between 2020 and 2030. Typically, some mini-grid
assests could last for up to 25 and 30 years, hence levelized costs would be lower if analysed
over a longer lifespan. Other indicators such as investment cost, cost per customer and energy
demand for the first and last years are provided in Table 4. Figure 8 shows a map of solar
projects. Costs are inclusive of connection costs. The levelized costs for mini-grids is computed
using the life cycle costs, which factors operation and maintenance costs for the duration of the
projects. Mini-grid investments in Ghana are strictly public sector driven, and cost recovery is
not currently an objective in their development. Rather, economic and social benefits are the
overarching aim for government’s investment into mini-grids. The Public Utilities Regularoty
Commission, the institution that sets tariffs in Ghana, has been tasked to include the costs of
mini-grid investments in the computation of electricity tariffs, so that there is cross subsidy
across board. In view of this, mini-grid customers in Ghana do not pay a premium tariff. They
are charged uniform tariffs that are same as customers on the grid. Mini-grids are sized to
provide same power that the grid would provide, including power for productive purposes.
However, government only targets communities where the grid is not expected to reach for
many years, or where the cost of grid extension is prohibitive, such as small island communities
that require underwater cables for grid extension. Where a community is located along the route
of the national grid’s extension, government often priortises grid connection over mini-grid
options, irrespective of the size of the community.

19
Table 4: Mini-grid Projects Results
SN Grid Connected
Levelized Cost (kWh)
Starting Investment (US$)
Investment/ Customer (US$)
Cluster Population (Year 1)
LV Customers Energy Demand (kWh)
First year
Last year
First Year Last Year
1 DIESEL CLUSTERS
363,918 4,493 1,816 81 300 114,648 1,267,059
2 Kuduli No 0.94 121,306 4,493 599 27 100 38,216 422,353
3 Ngbalenchere (Mancheri)
No 0.94 121,306 4,493 603 27 100 38,216 422,353
Mongola No 0.94 121,306 4,493 614 27 100 38,216 422,353
SOLAR PROJECTS
3,990,754 6,881 12,353 580 1,115 829,108 2,515,581
1 Klugon No 1.07 96,216 7,401 270 13 27 20,198 61,495 2 Sambik No 1.07 96,216 7,401 274 13 27 20,198 61,495 3 Zeei No 1.28 69,083 6,280 228 11 19 13,800 41,637 4 Pumo No.2 No 1.07 96,216 7,401 294 13 27 20,198 61,495 5 Nakoli No 1.07 96,216 7,401 276 13 27 20,198 61,495 6 Dakogu No 1.07 96,216 7,401 287 13 27 20,198 61,495 7 Wakpan Nayili No 1.07 96,216 7,401 293 13 27 20,198 61,495 8 Nasimbugu No 1.07 96,216 7,401 279 13 27 20,198 61,495 9 Maaga No 1.07 96,216 7,401 287 13 27 20,198 61,495 10 Tukyea No 1.07 96,216 7,401 262 13 27 20,198 61,495 11 Jagatinli No 1.07 96,216 7,401 254 13 27 20,198 61,495 12 Lalak No 1.28 69,083 6,280 206 11 19 13,800 41,637 13 Sakogu No 1.07 96,216 7,401 273 13 27 20,198 61,495 14 Bonbong No 1.07 96,216 7,401 276 13 27 20,198 61,495 15 Nangbam No 1.28 69,083 6,280 229 11 19 13,800 41,637 16 Nabuso No 1.07 96,216 7,401 295 13 27 20,198 61,495 17 Champongyili No 1.28 69,083 6,280 202 11 19 13,800 41,637 18 Gorugu No 1.28 69,083 6,280 244 11 19 13,800 41,637 19 Lagunguni No 1.07 96,216 7,401 268 13 27 20,198 61,495 20 Tamani No 1.28 69,083 6,280 245 11 19 13,800 41,637 21 Largu No 1.28 69,083 6,280 244 11 19 13,800 41,637 22 Sambanga No 1.28 69,083 6,280 222 11 19 13,800 41,637

20
23 Kpakalga No 1.28 69,083 6,280 233 11 19 13,800 41,637 24 Lomba No 1.28 69,083 6,280 228 11 19 13,800 41,637 25 Tog No 1.28 69,083 6,280 242 11 19 13,800 41,637 26 Gingana No 1.07 96,216 7,401 254 13 27 20,198 61,495 27 Dogu No 1.07 96,216 7,401 270 13 27 20,198 61,495 28 Shetan No 1.07 96,216 7,401 293 13 27 20,198 61,495
29 Bogu-Kambon Nayili
No 1.07 96,216 7,401 262 13 27 20,198 61,495
30 Pushiegu No 1.28 69,083 6,280 209 11 19 13,800 41,637 31 Tono No 1.28 69,083 6,280 249 11 19 13,800 41,637 32 Gosum No 1.07 96,216 7,401 295 13 27 20,198 61,495 33 Kanbonayili No.2 No 1.07 96,216 7,401 294 13 27 20,198 61,495 34 Yapkperiya No 1.28 69,083 6,280 234 11 19 13,800 41,637 35 Toti No 1.28 69,083 6,280 220 11 19 13,800 41,637 36 Gungula No 1.07 96,216 7,401 285 13 27 20,198 61,495 37 Bilsinga No 1.28 69,083 6,280 248 11 19 13,800 41,637 38 Kanshegu No 1.28 69,083 6,280 228 11 19 13,800 41,637 39 Buguya (Buya) No 0.95 123,303 6,850 425 18 35 26,616 81,415 40 Tindapeyili No 0.78 230,873 6,790 827 34 68 54,536 165,262 41 Tinguli No 1.28 69,083 6,280 217 11 19 13,800 41,637 42 Nakunfudo No 1.28 69,083 6,280 226 11 19 13,800 41,637 43 Tindangni No 1.28 69,083 6,280 217 11 19 13,800 41,637 44 Offin No 1.28 69,083 6,280 226 11 19 13,800 41,637 45 Zamashegu No 1.07 96,216 7,401 261 13 27 20,198 61,495
46 Kantanbuguri (Katangbugli)
No 1.28 69,083 6,280 202 11 19 13,800 41,637
Total 4,354,672 6,588 14,169 661 1,415 943,756 3,782,640

21
Figure 8: Solar projects map
3.4 Intervention 3: Grid connection for all communities with population above 200
3.4.1 Overview and Implementation
This intervention was inspired by the Ministry of Energy’s policy to continue to increase grid
connection in mainland rural areas as much as possible, with productive use and social benefits
in mind, rather than cost. To wit, this intervention is similar to Intervention 1, except that the
model was ‘forced’ to extend grid electricity to all communities with population above 200,
irrespective of costs. Implementation is therefore the same as that of Intervention 1.
3.4.2 Costs and Benefits
Costs
Results for this intervention is shown in Table 5, with cost indicators presented in Table 6. In
this intervention, 85% of the presently unlectrified population will be connected to electricity
using grid connection. It can be noted from Table 6 that total investment per inhabitant in
Intervention 3 is higher than the case in Intervention 1, US$ 679 compared to US$ 411.

22
Table 5: Grid Extension Results
Year Electrified
Population MV line length (m)
Investment (US$)
MV lines LV lines Other costs TOTAL
2020 3 764 10 852 324 855 414 128 72 061 811 044
2021 5 589 29 354 878 712 660 088 75 868 1 614 667
2022 6 001 57 712 1 727 607 724 152 76 259 2 528 017
2023 5 622 83 865 2 510 500 690 976 78 343 3 279 819
2024 6 827 97 411 2 916 000 868 296 79 660 3 863 954
2025 5 042 137 225 4 107 829 663 520 77 483 4 848 833
2026 5 890 160 029 4 790 469 766 480 76 524 5 633 474
2027 6 623 187 774 5 621 014 914 056 82 045 6 617 112
2028 7 185 241 698 7 235 230 994 136 88 106 8 317 470
2029 3 989 10 561 316 144 554 840 15 716 886 700
TOTAL 56 532 1 016 481 30 428 360 7 250 672 722 065 38 401 090
Table 6: Electrification cost indicators
Indicator Cost Unit
Distribution / locality 58 538 US$
Connection / locality 223 738 US$
Total Investment / locality 282 276 US$
Total Investment / inhabitant 679 US$
5. Conclusion The aim of this paper research paper was to model electrification options for unelectrified rural
communities in Ghana, using the Gushiegu Municipality as a first pilot case. Three
electrification technologies were considered. There were: grid extension and mini-grids using
either diesel or solar. A total of 175 unelectrified communities were identified from data
provided by the utility. An electrification planning model, GEOSIM was used to model the
system. The results showed that grid extension will be the most cost-effective technology,
recommended for approximately 79 communities, or 68.4% of the population. Options for
mini-grids using diesel gensets and solar PV systems have also been provided, accounting for
49 of the communities. The study recommends that planning tools are engaged to plan the last
mile electrification system, as they provide decision makers with a shorter planning time in
making value-for-money decisions.

24
6. References AfDB., 2013, The High Cost of Electricity Generation in Africa. Retrieved from African
Development Bank Group: <https://www.afdb.org/en/blogs/afdb-championinginclusive-
growth-across-africa/post/the-high-cost-of-electricity-generation-in-africa11496/>.
Arranz-Piera, P., Kemausuor, F., Darkwah, L., Edjekumhene, I., Cortés, J. and Velo, E., 2018.
Mini-grid electricity service based on local agricultural residues: Feasibility study in rural
Ghana. Energy, 153, pp.443-454.
Blechinger, P., Cader, C. and Bertheau, P., 2019. Least-Cost Electrification Modeling and
Planning—A Case Study for Five Nigerian Federal States. Proceedings of the IEEE, 107(9),
pp.1923-1940.
Duer, H. and Christensen, P.O., 2010. Socio-economic aspects of different biofuel
development pathways. Biomass and Bioenergy, 34(2), pp.237-243.
Energy Commission of Ghana. National energy statistics 2009 – 2018, pp. 4-7.
Franz, M., Peterschmidt, N., Rohrer, M. and Kondev, B., 2014. Mini-grid Policy Toolkit: policy
and Business Frameworks for Successful Mini-grid Roll-outs. Africa-EU Renewable Energy
Cooperation Programme (RECP), European Union Energy Initiative Partnership Dialogue
Facility
<http://www.ren21.net/Portals/0/documents/Resources/MGT/MinigridPolicyToolkit_Se
p2014_EN.pdf>.
Gabra, S.G., Miles, J. and Scott, S.A., 2019. Techno-economic analysis of stand-alone wind
micro-grids, compared with PV and diesel in Africa. Renewable Energy, 143, pp. 1928-1938
Ghana Statistical Service, 2019. Ghana Living Standards Survey (GLSS 7). pp.150
Haanyika, C.M., 2008. Rural electrification in Zambia: A policy and institutional
analysis. Energy policy, 36(3), pp.1044-1058.
Kemausuor, F., Adkins, E., Adu-Poku, I., Brew-Hammond, A. and Modi, V, 2014.
‘Electrification planning using Network Planner tool: The case of Ghana’, Energy for
Sustainable Development, 19, pp. 92–101.

25
Martin, S. and Susanto, J., 2014. Supplying power to remote villages in Lao PDR: The role of
off-grid decentralised energy options. Energy for sustainable development, 19, pp.111-121.
Mentis, D., Hermann, S., Howells, M., Welsch, M. and Siyal, S.H., 2015. Assessing the
technical wind energy potential in Africa a GIS-based approach. Renewable Energy, 83,
pp.110-125
Mentis, D., Welsch, M., Nerini, F.F., Broad, O., Howells, M., Bazilian, M. and Rogner, H.,
2015. A GIS-based approach for electrification planning—A case study on Nigeria. Energy for
Sustainable Development, 29, pp.142-150.
Nyarko, E.K., 2017. The Electricity Situation in Ghana: Challenges and Opportunities, CGD
Policy Paper. Washington, DC: Center for Global Development.
Roy, A., Kedare, S.B. and Bandyopadhyay, S., 2010. Optimum sizing of wind-battery systems
incorporating resource uncertainty. Applied Energy, 87(8), pp.2712-2727.
Rushman, J.F., Thanarak, P., Artkla, S. and Maneechot, P., 2019. Electrical Power Demand
Assessment of a Rural Community and the Forecast of Demand Growth for Rural
Electrification in Ghana. International Energy Journal, 19(1).
Szabó, S., Moner-Girona, M., Kougias, I., Bailis, R. and Bódis, K., 2016. Identification of
advantageous electricity generation options in sub-Saharan Africa integrating existing
resources. Nature Energy, 1(10), pp.16140.
USAID, 2011. Hybrid mini-grids for rural electrification: lessons learned.
<https://www.ruralelec.org/sites/default/files/hybrid_mini-grids_for_rural_electrification_2014.pdf>.
Verma, R. K. and Singh, S. N., 2013. A review of mini-grid used for electrification in rural
area. American International Journal of Research in Science, Technology, Engineering &
Mathematics, 3(2), p. 140-144
World Bank 2019. Tracking SDG7: The Energy Progress Report 2019. Viewed October 31,
2019. <https://www.worldbank.org/en/topic/energy/publication/tracking-sdg7-the-energy-
progress-report-2019>.
Zeyringer, M., Pachauri, S., Schmid, E., Schmidt, J., Worrell, E. and Morawetz, U.B., 2015.
Analyzing grid extension and stand-alone photovoltaic systems for the cost-effective
electrification of Kenya. Energy for Sustainable Development, 25, pp.75-86.

26
7. APPENDIX 1 – KEY INPUT PARAMETERS FOR MODELLING
General Unit Parameter
Year of simulation Years 2020
Planning horizon Years 10
Minimum population for grid electrification
Persons 200
Population growth rate % 2.9
Household connection rates (starting year)
% 30
Household connection rates (mid-year) % 60
Household connection rates (10th year) % 90
Household consumption growth rate (first 5 years)
% 10
Household consumption growth rate (6th to 10th year)
% 6
Infrastructure and services connection rate (mid-year)
% 50
Infrastructure and services connection rate (mid-year)
% 70
Infrastructure and services connection rate (10th year)
% 100
Infrastructure and services growth rate (first 5 years)
% 5
Infrastructure and services growth rate (6th to 10th year)
% 3
Economics Unit Parameter Source
Discount rate for financial analysis
% 5, 8, 14 Copenhagen Consensus / Various Sources
Local inflation rate % 8.5 Ghana Statistical Service for 2019
Power Purchase price from utility in base year /kWh
US $ 0.09 PURC (average of lifeline and 51-300 kWh tariff)

27
Diesel Unit Parameter Source
Hours of service per day h 24
Genset safety margin % 10
Maintenance down time % 5
Diesel Price (including vat/tax etc.)
US$/bbl 159 National Petroleum Authority
Solar Unit Parameter Source
Solar Panel Cost US$/kWp 800 Estimated from various sources
Inverter cost US$/kW 300 Estimated from various sources
Battery cost US$/kWh 200 Estimated from various sources
Battery Round trip Efficiency % 80 Estimated from various sources
Solar Panel Lifetime Years 30 Estimated from various sources
Inverter Lifetime Years 10 Estimated from various sources
Solar Panel O&M Cost ratio % 2 Estimated from various sources
Depth of Discharge (DoD) % 50

28
Network Unit Parameter Source
Lifetime of LV line Years 30
Lifetime of MV line Years 30
Lifetime of transformer Years 10
LV line km cost US $ 33,000 NEDCo
MV (11 kV) line km cost US $ 29,935 NEDCo
Low capacity meter price US $ 15 ECG (GHC 82.5) http://ecgonline.info/index.php/customer-service/services/getting-electricity
High capacity meter price US $ 32 ECG (GHC 176)
LV line O&M annual cost % 0.5 Estimated
MV line O&M annual cost % 0.5 Estimated
Transformer O&M annual cost % 0.5 Estimated
Project Interconnection Unit Parameter Source
Network Connection Cost US $ 10 Estimated for rural electrification. ECG is GHC 400
Network connection lifetime Years 30
Network connection O&M cost ratio
% 2

29
8. APPENDIX 2 – UNELECTRIFIED SETTLEMENT INFORMATION, GUSHIEGU MUNICIPALITY
SN Name Population
(2010) Population Y1
(2020)
No. of Households Y1
(2020) 1 Zeei 171 228 38 2 Nakoli 207 276 46 3 Champongyili 152 202 34 4 Gorugu 183 244 41 5 Lagunguni 201 268 45 6 Tamani 184 245 41 7 Largu 183 244 41 8 Sambanga 167 222 37 9 Kotogu 351 467 78
10 Kpakalga 175 233 39 11 Lomba 171 228 38 12 Tog 182 242 40 13 Toti 165 220 37 14 Kanshegu 171 228 38 15 Tinguli 163 217 36 16 Kuduli 450 599 100 17 Tukyea 197 262 44 18 Jagatinli 191 254 42 19 Kumbom (Champong Yili) 473 630 105 20 Batei 346 461 77 21 Kpandana 320 426 71 22 Nankari 302 402 67 23 Nanyiri 342 455 76 24 Tujung (Tiginga) 229 305 51 25 Zuoyili 226 301 50 26 Gosum 222 295 49 27 Gungula 214 285 48 28 Nawuni 263 350 58 29 Gbani 272 362 60 30 Kantanbuguri (Katangbugli) 152 202 34 31 Klugon 203 270 45 32 Waawu 301 401 67 33 Pumo No.1 486 647 108 34 Pumo No.2 221 294 49 35 Ngbalenchere (Mancheri) 453 603 100 36 Nakyam 289 385 64 37 Yiyamba 541 720 120 38 Gingana 191 254 42 39 Kanbonayili No.2 221 294 49 40 Bilsinga 186 248 41

30
41 Buguya (Buya) 319 425 71 42 Tindangni 163 217 36 43 Lunlua 260 346 58 44 Zamashegu 196 261 44 45 Kulikpang 478 636 106 46 Sambik 206 274 46 47 Petuli 237 315 52 48 Patan 231 307 51 49 Yidana 243 323 54 50 Busum 323 430 72 51 Wakpong 285 379 63 52 Dogu 203 270 45 53 Bogu-Kambon Nayili 197 262 44 54 Pushiegu 157 209 35 55 Pulo 411 547 91 56 Lebo 334 445 74 57 Offin 170 226 38 58 Kpakpiliga 762 1014 169 59 Salogu 259 345 57 60 Yidua 207 276 46 61 Majevugu 305 406 68 62 Lunluwa 315 419 70 63 Pabuni 277 369 62 64 Baambuli 475 632 105 65 Mongola 461 614 102 66 Nangbam 172 229 38 67 Nabuso 222 295 49 68 Salwia (Namamba) 484 644 107 69 Salbone 281 374 62 70 Mangbali 294 391 65 71 Shetan 220 293 49 72 Naalua 250 333 56 73 Yapkperiya 176 234 39 74 Tindapeyili 621 827 138 75 Dinyogu 576 767 128 76 Kpekuni 187 249 42 77 Yapala 325 433 72 78 Wakpan Nayili 220 293 49 79 Namongbani 301 401 67 80 Lalak 155 206 34 81 Bonbong 207 276 46 82 Nangani 321 427 71 83 Tono 187 249 42 84 Sampibiga 296 394 66 85 Nabuligu 306 407 68 86 Jinwow 504 671 112

31
87 Nangbani 163 217 36 88 Kpalubu 203 270 45 89 Guma 210 279 46 90 Binkoli 203 270 45 91 Nabaliba 411 547 91 92 Fintoli 244 325 54 93 Dakogu 216 287 48 94 Nasimbugu 210 279 46 95 Sakogu 205 273 46 96 Nachem 237 315 52 97 Kaboyiri 339 451 75 98 Yilang 186 248 41 99 Suguri 267 355 59 100 Nakpaliga 198 264 44 101 Gbanglua 590 785 131 102 Napoligu 240 319 53 103 Sakulo 283 377 63 104 Piong 544 724 121 105 Natigu 256 341 57 106 Nasandi 427 568 95 107 Adutili 271 361 60 108 Gombeni (Dombini) 270 359 60 109 Maaga 216 287 48 110 Namiboe 247 329 55 111 Tandogu 241 321 54 112 Nakogu 233 310 52 113 Nakunfudo 170 226 38 114 Tambowku 1145 1524 254 115 Yagbogu 281 374 62 116 Pukura 374 498 83 117 Lantani 251 334 56 118 Tintariga 233 310 52 119 Yagbaa 269 358 60 120 Gbenjaga 349 464 77 121 Nakpandule 343 457 76 122 Tindongo 373 496 83 123 Nalogu (Taloli) 625 832 139 124 Tuzei 224 298 50 125 Kpubo 233 310 52 126 Bagkurli 705 938 156 127 Tuyiri 190 253 42 128 Jankpinhi 335 446 74 129 Yibee 263 350 58 130 Tabion 339 451 75 131 Jung 198 264 44 132 Kabtun 180 240 40
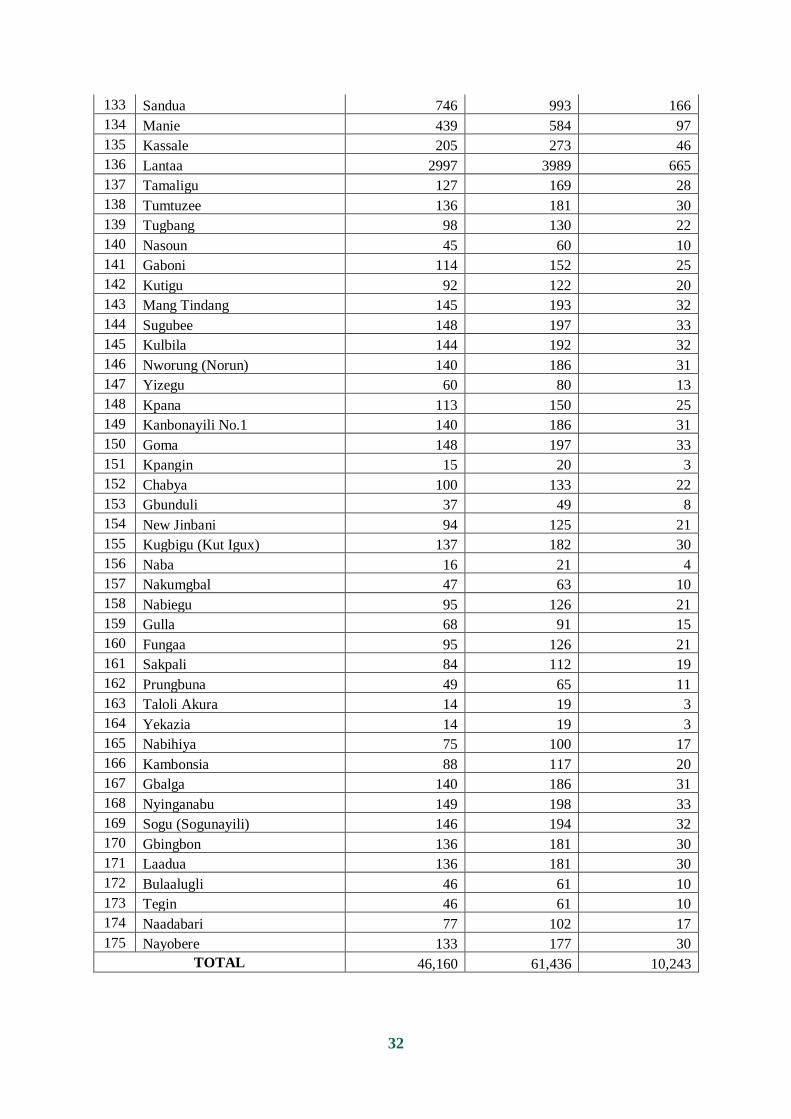
32
133 Sandua 746 993 166 134 Manie 439 584 97 135 Kassale 205 273 46 136 Lantaa 2997 3989 665 137 Tamaligu 127 169 28 138 Tumtuzee 136 181 30 139 Tugbang 98 130 22 140 Nasoun 45 60 10 141 Gaboni 114 152 25 142 Kutigu 92 122 20 143 Mang Tindang 145 193 32 144 Sugubee 148 197 33 145 Kulbila 144 192 32 146 Nworung (Norun) 140 186 31 147 Yizegu 60 80 13 148 Kpana 113 150 25 149 Kanbonayili No.1 140 186 31 150 Goma 148 197 33 151 Kpangin 15 20 3 152 Chabya 100 133 22 153 Gbunduli 37 49 8 154 New Jinbani 94 125 21 155 Kugbigu (Kut Igux) 137 182 30 156 Naba 16 21 4 157 Nakumgbal 47 63 10 158 Nabiegu 95 126 21 159 Gulla 68 91 15 160 Fungaa 95 126 21 161 Sakpali 84 112 19 162 Prungbuna 49 65 11 163 Taloli Akura 14 19 3 164 Yekazia 14 19 3 165 Nabihiya 75 100 17 166 Kambonsia 88 117 20 167 Gbalga 140 186 31 168 Nyinganabu 149 198 33 169 Sogu (Sogunayili) 146 194 32 170 Gbingbon 136 181 30 171 Laadua 136 181 30 172 Bulaalugli 46 61 10 173 Tegin 46 61 10 174 Naadabari 77 102 17 175 Nayobere 133 177 30
TOTAL 46,160 61,436 10,243


The Ghanaian economy has been growing swiftly, with remarkable GDP growth higher than The Ghanaian economy has been growing swiftly, with remarkable GDP growth higher than
five per cent for two years running. This robust growth means added pressure from special five per cent for two years running. This robust growth means added pressure from special
interest groups who demand more public spending on certain projects. But like every country, interest groups who demand more public spending on certain projects. But like every country,
Ghana lacks the money to do everything that citizens would like. It has to prioritise between Ghana lacks the money to do everything that citizens would like. It has to prioritise between
many worthy opportunities. What if economic science and data could cut through the noise many worthy opportunities. What if economic science and data could cut through the noise
from interest groups, and help the allocation of additional money, to improve the budgeting from interest groups, and help the allocation of additional money, to improve the budgeting
process and ensure that each cedi can do even more for Ghana? With limited resources and process and ensure that each cedi can do even more for Ghana? With limited resources and
time, it is crucial that focus is informed by what will do the most good for each cedi spent. The time, it is crucial that focus is informed by what will do the most good for each cedi spent. The
Ghana Priorities project will work with stakeholders across the country to find, analyze, rank Ghana Priorities project will work with stakeholders across the country to find, analyze, rank
and disseminate the best solutions for the country.and disseminate the best solutions for the country.
Copenhagen Consensus Center is a think tank that investigates and publishes the best Copenhagen Consensus Center is a think tank that investigates and publishes the best policies policies
and investment opportunities based on social good (measured in dollars, but also incorporat-and investment opportunities based on social good (measured in dollars, but also incorporat-
ing e.g. welfare, health and environmental protection) for every dollar spent. The Copenhagen ing e.g. welfare, health and environmental protection) for every dollar spent. The Copenhagen
Consensus was conceived to address a fundamental, but overlooked topic in international Consensus was conceived to address a fundamental, but overlooked topic in international
development: In a world with limited budgets and attention spans, we need to find effective development: In a world with limited budgets and attention spans, we need to find effective
ways to do the most good for the most people. The Copenhagen Consensus works with 300+ ways to do the most good for the most people. The Copenhagen Consensus works with 300+
of the world’s top economists including 7 Nobel Laureates to prioritize solutions to the world’s of the world’s top economists including 7 Nobel Laureates to prioritize solutions to the world’s
biggest problems, on the basis of data and cost-benefit analysis.biggest problems, on the basis of data and cost-benefit analysis.
© Copenhagen Consensus Center 2020© Copenhagen Consensus Center 2020
F O R M O R E I N F O R M A T I O N V I S I T W W W. G H A N A P R I O R I T I E S . C O MF O R M O R E I N F O R M A T I O N V I S I T W W W. G H A N A P R I O R I T I E S . C O M