Best Practices for Compiling and Distributing a Board Package
Upload
khangminh22Category
view
0download
0
Electrifying the Poor: Distributing Power in India
Brian Min∗
Assistant Professor
Department of Political Science
University of Michigan
7634 Haven Hall
505 S. State St.
Ann Arbor, MI, 48109-1045
[email protected]: 734-546-6824
∗I thank Alberto Diaz-Cayeros, Thad Dunning, Miriam Golden, Daniel Posner, Anoop Sarbahi, Ashutosh Varshney,
Erik Wibbels, Steven Wilkinson, and Andreas Wimmer for valuable feedback. In India, I received guidance and insight
from Rajeev and Poonam Mishra, Ajit Kumar Singh, Anjoo and Priyankar Upadhyaya, and Anil Verma. I thank Yogesh
Uppal for sharing data on Indian elections. Several officials at the Uttar Pradesh Power Corporation generously answered
questions and provided access to data. Financial support was provided from the NSF and the Institute on Global Conflict
and Cooperation. Earlier versions of this paper were presented at the World Bank, Yale, and at the annual meetings of
the American Political Science Association and the Public Choice Society. All errors are my own.

Electrifying the Poor: Distributing Power in India
Abstract
A growing empirical literature suggests that developing democracies are ineffective in deliv-ering public services to their poor. In the presence of corruption, clientelism, and patronage, theoutcomes of elections may matter little to the livelihoods of the poor. Contrary to these expecta-tions, I link the electoral rise of a pro-poor, low-Caste party to improved electricity provision tovillages in northern India. Drawing on a novel set of satellite imagery of the earth at night thatavoids the biases and missing data problems affecting traditional measures, I construct annualindicators of electrification for all 98,000 villages in Uttar Pradesh. By observing temporal vari-ations in nighttime light output at the village level over three election cycles from 1992 to 2003,I demonstrate that low-Caste party representation has increased village electrification rates.
1

1 Introduction
Despite a long theoretical tradition extolling the virtues of democracy, recent research argues that
developing democracies are ineffective in meeting the needs of the poor. In the presence of clien-
telism, patronage, or ethnic favoritism, the outcomes of elections appear to make little difference
to those most dependent on the state for basic services like electricity, clean water, or education.
Contrary to these claims, this paper uses a novel empirical strategy to show that elections play an
important role in the distribution of scarce electrical power to villages across Uttar Pradesh, India’s
largest state. By analyzing satellite imagery of the earth at night, I measure annual changes in the
availability of electricity for all 98,000 villages in India’s largest state across three election cycles
from 1992 to 2003. The data provide a new perspective on the distribution of a critical public
service at an unprecedented level of geographic detail. I show that elections shape the targeting
of electricity to villages, where most of India’s poor reside. I also demonstrate that the electoral
rise of the low-Caste Bahujan Samaj Party (BSP) has led to higher rates of village electrification,
especially in constituencies that elected a BSP legislator. The findings contradict the conventional
wisdom in India that who one votes for makes little difference to the everyday lives of the poor.
More people in India lack electricity than any other country in the world, and nowhere more so
than in Uttar Pradesh where an estimated 60 million people have no electrical connection at home.
Even for those fortunate to be on the grid, power cuts are ubiquitous and unpredictable, imposing
severe costs to both citizens and businesses. More than simply a modern convenience, access
to electricity is a life-altering transformation that improves quality of life and enables economic
development. Electric light extends a day’s productive hours, allows children to study after the
sun has set, and enhances safety at night. Powered water pumps reduce the effort needed to
collect clean water. Refrigeration allows for the preservation of food and medicines. Yet Uttar
Pradesh lacks the electricity supply to provide to all who need or want it and its provision is heavily
rationed. Given that the flow and distribution of electricity is controlled by the state and its agents,
political priorities are reflected in who gets electricity and who does not.
Using existing data sources, it is difficult to detect patterns in the geographic distribution of
electricity and whether they change over time. Electricity indicators from surveys like the Living
Standards and Measurement Surveys (LSMS) and Demographic and Health Surveys (DHS) are
2
precise but have limited village coverage and are infrequently updated. Indian Census data are
collected for all villages but only once per decade. Meanwhile, administrative data from state
agencies are typically aggregated in geographic units comprised of hundreds of villages, making
it hard to discern distribution within these units. I overcome these challenges by analyzing satel-
lite imagery to identify annual levels and changes in electricity provision for all villages in Uttar
Pradesh. By using nighttime light output as an indicator of electricity availability and consump-
tion, I construct a village-year dataset spanning twelve years and comprised of up to 1.2 million
observations. The analysis below suggests that the satellite imagery provide a valid and reliable
indicator of village-level electrification. Moreover, the imagery reveals the actual use of electricity,
not simply the presence of power lines and transformers which provide no benefit during black-
outs or when they are in disrepair. The timeframe of my analysis captures a period of dramatic
political change and electoral competition, especially between the powerful right-wing Bharatiya
Janata Party (BJP) and the emergent low-Caste Bahujan Samaj Party (BSP), whose core support
lies primarily among poor and rural Scheduled Caste (SC) voters. Drawing on the full set of village
observations and controlling for an array of village- and constituency-level covariates, I show that
villages in State Assembly constituencies represented by the low-Caste BSP were significantly more
likely to be electrified than those represented by the BJP and other parties.
However, direct analysis of observational data do not easily reflect causal effects, since that
requires the evaluation of a counterfactual: would a village’s electrification status change if it
had been represented by another party rather than the BSP? I attempt to get closer to the true
causal effects of BSP representation by focusing on a subset of villages around the pivotal 2002
state election in which power shifted from the right-wing BJP to the low-Caste BSP. Exploiting the
abundance of data, I use matching techniques to identify similar villages that differ only on whether
they switch to BSP representation or retained BJP representation. Based on multilevel regression
analysis of the matched data, I show a strong positive treatment effect of BSP representation on
the probability of village electrification. I also investigate which villages are targeted with new
electrification and find that villages with a large surplus of core BSP supporters are significantly less
likely to benefit from new electricity than villages with many swing voters.
This research contributes to an important debate regarding the effects of democratic elections
on the welfare of the poor. A generation of theorists have argued that democracies will provide
3

more public goods than states that do not hold elections (Meltzer & Richard 1981, Wittman 1989,
Gradstein 1993). Given that the typical median voter is poor, elections should reflect the pref-
erences of the needy for more public services like electricity, water, and sanitation. A similar
theme is echoed by Acemoglu & Robinson (2006, p. 18) who state, “nondemocracy is gener-
ally a regime for the elite and the privileged; comparatively, democracy is a regime more ben-
eficial to the majority of the populace, resulting in policies relatively more favorable to the ma-
jority.” Anecdotal observations — like Amartya Sen’s (1999) famous claim that famines do not
occur in democracies — and some empirical studies have supported this expectation (Lake &
Baum 2001, Bueno de Mesquita et al. 2003, Brown & Mobarak 2009). Yet there appears to be
little cross-national evidence that democracy improves the welfare of the poorest or most vul-
nerable segments of society (Keefer 2005, Ross 2006). Keefer & Khemani observe that “poli-
cymakers in poor democracies regularly divert spending away from areas that most benefit the
poor or fail to implement policies that improve the services that are known to disproportionately
benefit poor people” (2005, p. 2). Meanwhile, an internal evaluation of 120 World Bank elec-
trification projects, most of them in democratic states, laments that “the larger share of benefits
from rural electrification is captured by the non-poor” (World Bank 2008, p. xv). Numerous
studies also suggest that clientelistic and patrimonial practices may corrode the supposed virtues
of electoral accountability in both the developing and industrialized worlds (Bratton & van de
Walle 1994, Chandra 2004, Stokes 2005, Scheiner 2006, Kitschelt & Wilkinson 2007, Diaz-Cayeros,
Magaloni & Estevez Forthcoming).
Underlying this debate are concerns about the quality of data used in our tests (Behrman &
Rosenzweig 1994, Ross 2006, Treier & Jackman 2008). How can we reliably estimate the effects
of democracy when public service provision is so poorly measured due to variations in definitions,
data-gathering practices, bureaucratic capacity, and possibilities of fraud? In much of the world
we simply do not know who gets public services, and reliable data is scarcest where poverty is
most persistent. This paper harnesses new data collection technologies to confront these difficult
challenges.
This paper also adds to empirical research evaluating the role of politics on local public goods
provision in India. Chhibber & Nooruddin (2004) use state-level data to show higher rates of public
goods provision in states with more effective parties competing in state assembly elections. Elec-
4

toral competitiveness has also been linked to higher levels of development spending by members of
Parliament (Keefer & Khemani 2009). Several studies have focused on public goods provision at the
local level. Foster & Rosenzweig (2004) use a twenty-year panel dataset of 250 villages to measure
the effects of local democracy. They find evidence that increases in the share of poor residents lead
village councils to invest more heavily in roads, which enhance the welfare of the landless, relative
to irrigation facilities, which enhance the welfare of landowners. Drawing on survey data from 500
villages, Besley, Pande & Rao (2007) show that the heads of local-level Panchayat councils exer-
cise substantial political opportunism by directing more public goods projects to their own villages.
Meanwhile, Dunning & Nilekani (2010) finds no evidence of public goods targeting resulting from
the reservation of village council seats for Scheduled Castes in Karnataka. Banerjee & Somanathan
(2007) is the only study that collects data for all villages in India. However, they aggregate their
data into national parliamentary constituencies and test only for the effects of social divisions on
public goods provision and do not look at the effects of electoral competitiveness or other political
processes. This research expands considerably upon earlier efforts by analyzing village-level data
while retaining a broad geographic scope encompassing all villages in India’s largest state.
The next two sections provide context regarding the politics of electricity in Uttar Pradesh. I
then describe my estimation strategy and data before presenting my results.
2 Politics in Uttar Pradesh
Uttar Pradesh (UP) is the most populous state in India. Home to over 190 million people in an
area about half the size of California, it has more people than all but four countries in the world.
Located in the north of India and spanning much of the fertile plains of the Ganges river, the densely
populated state remains predominantly rural, with 80% of the population living in the countryside
in some 98,000 villages. With tens of millions of farmers ploughing fields of cereal crops like wheat,
rice, and millet, agriculture is the largest economic activity in UP, accounting for nearly half the
state product in 1991 and employing nearly three-quarters of workers.
Many of India’s most eminent political leaders have their roots in Uttar Pradesh, including
India’s first Prime Minister, Jawaharlal Nehru and his prominent descendants like Congress Party
leaders Sonia Gandhi and Rahul Gandhi. Eight of India’s fourteen Prime Ministers have come from
5

Uttar Pradesh. The state controls 80 out of 545 seats in the national parliament, nearly double
the contingent of the next largest state. Yet despite its size and influential progeny, Uttar Pradesh
remains among India’s poorest states. It ranks at or near the bottom across a wide range of socio-
economic indicators, including per capita income, infant mortality rates, literacy levels, access
to medical facilities, teacher-pupil ratios, and electricity use and access (Uttar Pradesh Planning
Department 2006). The World Bank estimates that 8% of the world’s poor live in Uttar Pradesh
alone.1
In the first four decades after independence, the Indian National Congress party enjoyed nearly
uninterrupted control of UP’s Vidhan Sabha (Legislative Assembly). It consistently campaigned on
a sweeping pro-poor agenda. However, according to many observers, “While socialist rhetoric was
used to try to build political capital, policies in favor of the poor were seldom pursued vigorously”
(Kohli 2004, p. 258). By the late 1980s, cracks in the Congress’s broad umbrella coalition had
widened, and its hegemony in Uttar Pradesh deteriorated rapidly (Brass 1994, Hasan 2002). Voters
splintered away towards a new crop of political parties with narrower political agendas. Among
these new entrants were two lower-Caste parties, the Bahujan Samaj Party (BSP), drawing on the
numerical strength of Scheduled Caste voters, especially among the Chamar, and the Samajwadi
Party (SP), supported by many Other Backward Class (OBC) and Muslim voters (Duncan 1999, Pai
2002, Jaffrelot 2003, Chandra 2004). In addition, the Bharatiya Janata Party (BJP), a conservative
Hindu nationalist party, popular among upper-Caste and middle class voters, emerged as a powerful
force in Uttar Pradesh and Indian politics (Hansen 1999). Following Congress’s loss of control over
the UP state assembly in the 1989 elections, the BJP, BSP and SP emerged as the most powerful
parties in the state, jockeying for power during a decade of intense competition and fragile power-
sharing coalitions.
The alignment of voters across these new parties reflected an intensifying polarization of poli-
tics along Caste lines (Banerjee & Pande 2007). Caste is a system of social stratification that defines
individuals along endogamous hereditary lines. Castes, or jatis, were traditionally associated with
specific occupations and the most ritually unclean jobs were assigned to those with the very lowest
social status, variously referred to as Untouchables, Harijans, or Dalits. Members of these low-1Based on an international poverty line of $1.08/person/day in 1993 PPP adjusted prices, 1998 estimates (World
Bank 2002, p. i).
6
est Castes, officially designated Scheduled Castes (SC) according to classifications dating back to
British rule, were historically subject to extreme discrimination and segregation (Mendelsohn &
Vicziany 1998, Bayly 1999). Though Caste-based discrimination is formally outlawed, wide dispar-
ities in social and economic welfare persist: in 2000, rural SC residents were nearly twice as likely
to be below the poverty line and 40% more likely to be illiterate than their non-SC counterparts
(Gang, Sen & Yun 2008). In Uttar Pradesh, the significant size of both low-Caste and high-Caste
groups — 21% of the population are SC and 10% are Brahmin, both high relative to other Indian
states2 — make them electorally significant voting blocs that parties have courted vigorously.
Responding to and nourishing the mobilization of the rural poor throughout the 1990s, succes-
sive UP state governments launched efforts to expand social welfare programs and improve public
service provision to historically under-privileged communities. Several projects, championed by
the BSP and its charismatic leader, Mayawati Kumar, specifically targeted predominantly SC vil-
lages and Dalit bastis (neighborhoods). As Chief Minister (briefly) in the late-1990s, Mayawati
initiated the Ambedkar Village program (Ambedkar Gram Vikas Yojana), promising to provide over
11,000 of the poorest villages with electrification, roads, and irrigation. Prominently identified by
the erection of statues of the SC hero and architect of the Indian constitution, B.R. Ambedkar, the
village program remains one of Mayawati and the BSP’s most signature achievements. Indicative
of the state’s current political climate, her critics have characterized the program as a mismanaged
“pet” project, reflecting her “obsession with the Dalit agenda.”3
The BSP’s electoral success grew rapidly throughout the 1990s. Its share of assembly seats rose
from 12 out of 425 seats in the 1991 elections to 67, 66, and 98 seats in the 1993, 1996, and 2002
elections respectively.4 In the 1996 state elections, the BSP won 62% of the Dalit vote, increasing
to 69% in the 2002 election.5 The 2002 election in particular was a landmark contest representing
an inflection point in UP politics as the BSP secured more seats than the incumbent BJP which
had governed both UP and the national government in Delhi. While no party commanded a clear
majority in 2002, the BSP’s strength and influence was sufficient to secure the Chief Minister’s post2Data from http://censusindia.gov.in/Tables_Published/SCST/scst_main.html and
http://www.outlookindia.com/article.aspx?2347833Tripathi, Purnima S., “Mayawati in Deep Trouble,” Frontline, Volume 19, Issue 19, September 14-27, 2002.4The number of assembly seats in UP was reduced to 403 after the partition of Uttarakhand out of the state in 2000.5Source: Uttar Pradesh Assembly Election Study, CSDS Data Unit, http://www.india-seminar.com/2007/571/571_
sanjay_kumar.htm.
7

for Mayawati in May of that year.
3 Electricity and the Politics of Distribution
Since at least the time of Gandhi, India has had a longstanding commitment to alleviate poverty,
especially in its rural villages where over 70% of Indians live. Yet aggregate levels of public service
provision remain low (Kohli 1987, Varshney 1995, Chandra 2004, Chhibber & Nooruddin 2004),
including in the provision of electricity. In 2007, peak national demand for electricity outstripped
supply by 15%, not even taking into consideration the latent demand from the 600 million Indians
who lack a household electrical connection. Striking variations in access persist across the country.
According to official Ministry of Power data, less than 60% of Uttar Pradesh’s villages were electri-
fied in 2005 compared with well over 90% of villages in the neighboring states of Rajasthan and
Madhya Pradesh (see Figure 1). The variation in power access is notable given “the fact that the
Indian government, for many years and at all levels, has been explicitly committed to equalizing
access to public goods” (Banerjee, Somanathan & Iyer 2005, p. 641).
The power situation in Uttar Pradesh is dismal.6 Against a typical total available supply of
6 gigawatts, the baseline demand for power is ordinarily around 7.5 gigawatts and as high as 9
gigawatts during peak periods like the Diwali festival. This chronic supply shortage means that
roughly 20% to 30% of demand must go unmet, requiring massive and relentless power cuts
blacking out huge swaths of the state every day of the year. What electrical power is available
is distributed through an intricate network of generating plants, substations, transformers, and
thousands of miles of power lines, much of it in disrepair. To protect the fragile power grid, electri-
cal power is rationed across the state through a process guided by formal load-shedding guidelines
as well as informal and unscheduled day-to-day adjustments and exceptions to the power delivery
schedule.
All electricity transmission, distribution, and supply within the state is managed by the government-
operated Uttar Pradesh Power Corporation Limited (UPPCL).7 The most important distributional
decisions regarding how, when, and where power is transmitted across the vast state are centrally6Within India’s federal structure, electricity distribution and supply is primarily a state-level responsibility, making
the state and state-level politics the appropriate level of analysis (Kale 2004, Modi 2005).7It assumed these responsibilities from its predecessor agency, the Uttar Pradesh State Electricity Board, which was
unbundled in 2000.
8

Figure 1: Village electrification rates in Indian states, 2005Source: Government of India, Ministry of Power.
9
executed within a single office at UPPCL, the Central Load Dispatching Station (CLDS). The CLDS
monitors the power grid and coordinates the allocation of electrical power across the state via or-
ders to four regional Area Load Dispatch Stations (ALDS) located in Sarnath, Panki, Moradabad,
and Meerut. Following instructions from the CLDS, the ALDS in turn make allocations of their
limited supply to regional and local electric utilities. Local utilities can make further allocation
decisions as necessary, for example, making unscheduled power cuts to certain neighborhoods or
villages within their jurisdiction.
Load shedding, or power cuts, affect almost everyone in the state. Official policy dictates any-
where from four hours of daily power cuts in the largest cities to twelve hours of cuts for rural
villages. Yet even these minimum targets are usually not met, especially during the hot summer
months. In Kanpur, known as the “Manchester of the East” and the state’s largest industrial cen-
ter, daily power cuts from 9AM to 1PM choke production, shuts down offices and businesses, and
leaves schools without lights and homes without fans or refrigeration. Those who can afford it run
off of diesel generators and power inverters that store up power overnight, but these alternatives
are expensive and not practical for large loads.
A few privileged areas are designated by the state as load shed-free zones and enjoy uninter-
rupted power supply. This includes the capital city of Lucknow, where power is deemed necessary
for the government to function; Agra, home of India’s most important tourist destination, the Taj
Mahal; and since the 2007 elections, Noida, the technology and outsourcing hub outside New
Delhi (incidentally where Mayawati’s hometown is located). The prestigious university campuses
of Banaras Hindu University and the Indian Institutes of Technology are also exempt from power
cuts as are the railways and specially designated industrial zones. Yet even these areas are not
immune from the state’s power woes. In September 2008, an executive order to impose night-time
power cuts on industrial zones was met by outrage and accusations that the Mayawati government
was pandering to Muslim voters by attempting to ensure uninterrupted power supply to Muslim
localities during the month of Ramadan.8
Exemptions to the standard load shedding schedule are made daily. Special allowances are often
made for local holidays and festivals, typically as a result of petitions from local leaders. Protection
from power cuts are also granted for the Chief Minister, whose travel schedule is communicated8Khan, Atiq, “Power supply curtailed for industries in U.P.,” The Hindu, 8 September 2008
10

to the CLDS. It is often said in Uttar Pradesh that you can tell when the Chief Minister is in town
because the power will be working. Visits by high level dignitaries like the Indian Prime Minister
or foreign heads of state also receive special consideration.
Given that electricity is a key input into many productive economic activities, access to electrical
power is an important issue for voters. In a 2007 pre-election survey in Uttar Pradesh, nearly four
in ten voters noted that development issues including electricity, road, and water concerns were
their most important consideration in deciding whom to vote for.9 Indeed, it is often said that
Indian politics centers around bijli, sadak, paani (electricity, roads, water). In the World Bank
Enterprise Survey of Indian businesses in 2006, more firms cited access to reliable electricity as the
number one obstacle facing their business (35%) than any other concern, including taxes (25%)
and corruption (11%). Firms estimated losing 6.6% of sales as a result of power outages with 40%
reporting that they owned or shared access to a generator.
Since the provision of electrical power is mediated by politically appointed officials located cen-
trally within arm’s reach of the legislative assembly, I hypothesize that the availability of electrical
power within different areas of the state should reflect the influence and power of competing po-
litical interests. The ability of a small coterie of engineers and power officials to make decisions
with such profound effects on access to a critical basic public service creates enormous pressures
on the office and attracts substantial efforts at political intervention. Engineers at CLDS describe
an intricate balancing act in which they must manage competing requests from officials at all levels
of influence from across the vast state. In one memorable account, a state assemblyman who had
negotiated power cut exemptions from UP’s Chief Minister threatened to shoot the CLDS engineer
who had turned off the power to his constituency during a severe power crisis.
Anecdotal evidence suggests that politicians routinely interfere in the operation of the state
electricity board, from patronage transfers of employees, interventions in the selection of villages
for electrification projects, and the assertion of influence on when, where, and how, power cuts
are timed and distributed. A Supreme Court-appointed committee diagnosed a culture of political
interference in the day-to-day operations of the state electricity board. Among its findings, the
Kaul Committee found that board membership was heavily packed by “political bosses” and that
‘’the State Government appears to be exercising unbridled power of interference in the day to day9Lokniti, Uttar Pradesh Pre-poll 2007.
11

working of the Electricity Board. This interference in transfers and postings with political patronage
has totally destroyed the autonomous nature of the electricity board. . . ”10 In a government audit of
the Ambedkar Village program, a third of program spending, or $50 million, could not be accounted
for, presumably lost to kickbacks and fraud. During the 1997 to 2001 period, the audit revealed that
numerous villages had been illegitimately electrified, including six villages in the Barabanki district
just east of Lucknow. Several other villages were found to have been selected for electrification by
intervention of the Energy Minister, contrary to program guidelines (Wilkinson 2006).
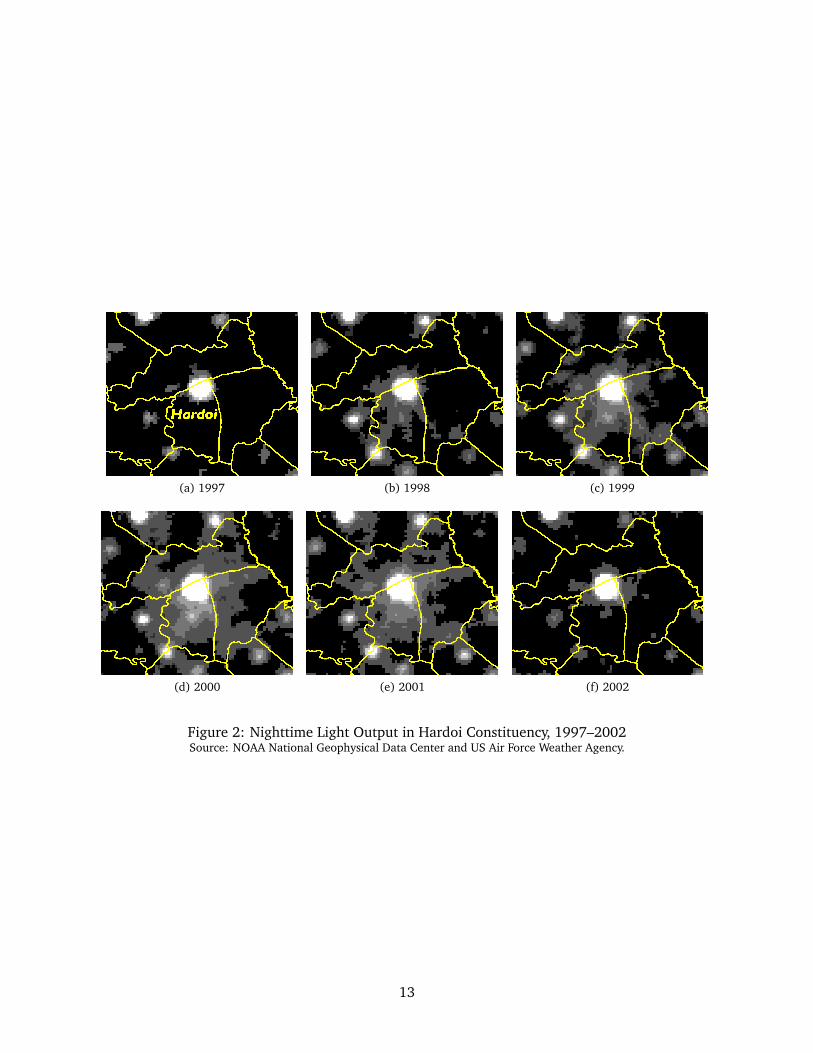
In October 1997, Naresh Agarwal defected from the Congress Party and transferred his support
and that of his followers to the BJP, enabling it to take over the reins of UP’s state government.
In return, Agarwal was granted the plum position of Energy Minister. Figure 2 reveals the effects
of his ascendancy in his constituency, Hardoi. From 1998 onwards, light output across Hardoi
increased in intensity and extent as “blackout-free electricity reached even the most rustic areas
of [Agarwal’s] constituency”11. Then in August 2001, Agarwal was removed from his cabinet post
for disloyalty. With no further influence on UP’s scarce electricity supply, satellite imagery revealed
a massive decline in power provision to Hardoi, with the 2002 image showing a reversion almost
back to levels before Agarwal’s promotion.
Media reports often describe similar instances where powerful politicians are able to ensure bet-
ter electricity access in their constituencies than in others. The Samajwadi Party’s leader Mulayam
Singh Yadav’s home village of Saifai in Etawah district is said to enjoy high levels of development,
including new highways, a stadium, an airport and a dedicated substation providing a reliable sup-
ply of electricity. According to one account, the village of 4,500 has enjoyed protection against
load shedding: “While all districts in the state, including Lucknow, face severe power cuts, Saifai
has been spared. ‘We thank the chief minister for uninterrupted power supply,’ says Amar Yadav, a
resident of the village.”12 Similar stories are alleged regarding the stability of the power supply in
Badalpur, the home village of BSP leader Mayawati (often referred to as Behenji by her followers).
Following the BSP’s surprising majority victory in the 2007 elections, the village pradhan (chief) of
Badalpur, Bhim Singh, told one reporter, “We get just 7 to 8 hours electricity. All of it will change
now.” Meanwhile, the newly elected BSP legislator for the district announced,“We will give 24-hour10Suresh Chandra Sharma vs Chairman, UPSEB & Ors. RD-SC 20 (13 January 1998).11“Caste Adrift in India,” The Economist, 7 February 2002.12Chakraborty, Tapas, “Air and star power for CM village,” The Telegraph, 5 September 2004
12
(a) 1997 (b) 1998 (c) 1999
(d) 2000 (e) 2001 (f) 2002
Figure 2: Nighttime Light Output in Hardoi Constituency, 1997–2002Source: NOAA National Geophysical Data Center and US Air Force Weather Agency.
13

electricity supply to the village as in the previous Behenji regime. All projects announced by Be-
henji earlier for the village will be revived.”13 Another story described how the new Chief Minister
had issued orders changing the districts to which the UPPCL was to ensure uninterrupted power
supply.14
4 Research Design
Has the rise of the BSP improved the provision of electricity to villages in Uttar Pradesh? To
evaluate this question, I compare state assembly election results to village-level observations of
electrification status from 1992–2003.15 I conduct two sets of analyses. The first evaluates party
effects using time-series cross-sectional data for all 98,000 villages in Uttar Pradesh over 12 years, a
total of nearly 1.2 million village-year observations. While it is straightforward to use pooled cross-
sectional data to estimate the conditional probability of being lit in constituencies that voted for
the BSP versus those that did not, such cross-sectional analysis alone cannot easily elucidate causal
effects. To estimate the causal effect of party treatment requires the evaluation of a counterfactual
claim: Would the dark village have been lit if it had voted for a different party? If villages were
randomly assigned to BSP treatment, then estimating the causal effect of BSP rule would be easy.
Since this is not the case, in the second analysis, I use matching techniques to generate more
reliable estimates of the causal effect of BSP representation on the electrification status of villages.
Following standard notation of the Rubin causal model, the causal effect is the difference in
potential outcomes under treatment and control, only one of which is observed for each observa-
tion. Let Yi1 denote the electrification level for village i that switches representation to the low
Caste party and Yi0 be the electrification level for villages that remain represented by the non-low
Caste party. Treatment is denoted, Ti, equaling 1 when i is in the treatment regime and 0 other-
wise. The observed outcome for i is Yi = TiYi1 + (1 − Ti)Yi0 and thus the treatment effect for i is
τi = Yi1 − Yi0. In experimental settings with perfect randomization, individuals in both treatment
and control groups are equally as likely to receive treatment and so estimation of the treatment ef-
fect is simply the mean difference in observed outcomes between the treatment and control groups.13Sharma, Aman, “Maya magic sweeps Noida,” Indian Express, 13 May 2007.14“Maya sends shockwaves down UPPCL,” Indian Express, 21 May 2007.15State Assembly elections were held in 1993, 1996, and 2002.
14

However, in observational settings like that here, treatment is not randomly assigned and treated
and control groups are likely to differ along multiple dimensions. If we assume that selection into
the treated group depends only on observable covariates Xi, we can estimate the average treatment
effect on the treated, or ATT:16
τ |(T = 1) = E{E(Yi|Xi, Ti = 1)− E(Yi|Xi, Ti = 0)|Ti = 1} (1)
In words, I identify the treatment effect of BSP representation as the expected difference in
electrification status between a village that received BSP representation and the expected status of
the village had it not received the BSP treatment, conditional on a set of covariates, X.
4.1 Methodological Issues
The unit of analysis is the village, even though the key treatment regarding election of state legisla-
tors occurs at the assembly constituency level. The data are therefore structured as hierarchical or
multilevel data, in which individual observations are clustered within groups and the key treatment
is applied at the group level. An alternative design could aggregate the village observations into
constituency-level totals and means. However, using village-level data efficiently uses all the data
that is available, enables the detection of heterogeneous effects within constituencies, and helps
avoid aggregation problems, including those of ecological inference and the related modifiable
areal unit problem.
To account for the grouped nature of the village data, I employ different strategies including
the use of computationally intensive multilevel models where possible, including fixed effects at
the constituency-level,17 or by clustering the standard errors within constituency.
An additional form of non-independence exists among observations across space, particularly
among geographically proximate villages. Since electrification is a networked phenomenon, it
seems probable that a village will be more likely to be electrified where the grid is dense and other
villages already have power nearby than in remote villages or those located in areas where the16More fully, we make the strong ignorability assumption, which assumes that conditional on X, treatment assignment
is unconfounded, Y0, Y1 ⊥ T |X, and that there is overlap, 0 < Pr(T = 1|X) < 1 (Rosenbaum and Rubin 1983).17A significant disadvantage of including constituency-level dummies is that the region fixed effects can only be esti-
mated where there is variation on the dependent variable. Observations in constituencies with no variation are dropped,resulting in missing data.
15

grid is sparse. This spatial dependence or spatial autocorrelation needs to be taken into account to
derive correct standard errors. However, standard methods for controlling for spatial dependence
are not tractable for networks as large as that observed here. In the typical approach using Moran’s
I, a spatial weights matrix is created. This implies working with a matrix of nearly 100,000 ×
100,000 for all of UP’s villages, which is not computationally tractable. Moreover, spatial lag
models with binary dependent variables do not have closed-form solutions and are difficult to
estimate (Ward & Gleditsch 2002).
A simpler strategy adopted here is to include controls that relate directly to the extent and den-
sity of the electrical grid, including a village’s distance from the nearest town (since all towns are
connected to the grid) and the sum of all nighttime light emissions within the constituency in the
first year of my series, 1992 (which should correlate highly with initial power grid density). The
inclusion of fixed effects or the use of multilevel modeling will also help account for unmeasured
regional variations in the power grid by allowing the intercepts to vary across constituencies. A
shortcoming of these approaches is that unlike spatial lag models which allow the degree of simi-
larity to be measured continuously across all villages, varying-intercept models can only control for
fixed spatial autocorrelation across constituencies and not within each constituency.
I also evaluate robustness using spatial sampling , in which models are run on a small random
subset of villages where spatial autocorrelation is unlikely given the physical distance between
sampled villages.
5 Data
The analysis is based on a dataset of all 98,000 villages in Uttar Pradesh, structured in village-
constituency-year format, with annual indicators of electrification status from 1992 to 2003. Vil-
lages are located within 403 state assembly constituencies. On average, each constituency has
400,000 people, 80% of whom are rural living in some 240 villages. Members are elected directly
via a single-member simple-plurality rule and state elections were held in 1993, 1996, and 2002.
The complete dataset contains approximately 1.2 million village-year observations, which I use
to generate broad descriptive trends before defining much smaller subsamples to investigate the
causal effects of BSP representation.
16

5.1 Dependent Variable: Detecting Electrification from Space
I construct annual indicators of electrification status for all villages using a novel set of satellite
imagery of the earth at night. The satellite images come from the Defense Meteorological Satellite
Program’s Operational Linescan System (DMSP-OLS), a set of military weather satellites that have
been flying since 1970 in polar orbit recording high resolution images of the entire earth each night
between 20:00 and 21:30 local time. Captured at an altitude of 830 km above the earth, these
images reveal concentrations of outdoor lights, fires, and gas flares at a fine resolution of 0.56 km
and a smoothed resolution of 2.7 km. Beginning in 1992, all DMSP-OLS images were digitized,
facilitating their analysis and use by the scientific community. While daily images are available, the
primary data products used by most scientists are a series of annual composite images. These are
created by overlaying all images captured during a calendar year, dropping images where lights
are shrouded by cloud cover or overpowered by the aurora or solar glare (near the poles), and
removing ephemeral lights like fires and other noise. The result is a series of images of time stable
night lights covering the globe for each year from 1992 to 2003 (Elvidge et al. 1997a, Imhoff
et al. 1997, Elvidge et al. 2001). Since the DMSP program may have more than one satellite in
orbit at a time, some years have two annual images created from composites from each satellite,
resulting in a total availability of 23 annual composite annual images. Images are scaled onto a
geo-referenced 30 arc-second grid (approximately 1 km2). Each pixel is encoded with a measure
of its annual average brightness on a 6-bit scale from 0 to 63. Figure 3 shows an image of 2002
time stable night lights in Uttar Pradesh. The very brightly lit patch in the upper left is New Delhi,
with a large drop-off in light output immediately at its border with Uttar Pradesh. The state’s large
cities are clearly visible, including the capital Lucknow, and the manufacturing center of Kanpur.
But given that 80% of UP’s population is rural, the image also reveals vast areas of darkness with
no detectable light emission. This is not simply because the satellite lacks the resolution to detect
low-levels of light: in fact, thousands of small villages emit detectable levels of light, though this is
not clear on the printed page. Because the imagery is collected consistently across space, the fact
that pixels are lit in the digital imagery for one village and unlit for another otherwise very similar
village suggests instead differences in the availability and use of electricity.
Compared with traditional data on energy production and consumption, the satellite images
17

reveal explicitly the geographic distribution of electrical power, providing a clearer picture of the
beneficiaries of public infrastructure across space. Moreover, since the satellite images are captured
electronically through an automated process with little human intervention, the data have the great
virtue of being unbiased, consistent, and complete. Analysis of the set of annual images from 1992–
2003 show that most of the variation in light output is cross-sectional, or across constituencies.
About 20% of the variance is observed over time within constituencies.
The primary dependent variable is a dichotomous measure indicating whether a village is elec-
trified or not, by which I mean whether a village emits visible night lights as detected by satellite in
each year from 1992 to 2003.18 The emission of light at night reveals both the presence of electri-
cal infrastructure and the regular flow of electrical power converted into outdoor lighting at night.
The ability to detect outdoor lighting is meaningful because it is a useful application of electricity
with broad public benefits and suggests contexts in which electricity is generating public goods and
positive externalities.
I use GIS software to spatially match and extract average annual nighttime light output for all
98,000 villages in Uttar Pradesh from 1992–2003.19 I also compute constituency-level measures
of total light output by summing the pixel values within each of UP’s 403 assembly constituencies
in each year. Satellite data are available as annual composites. In years where more than one
satellite was in orbit, I average the light pixel values across the two sensors. In each year, I classify
all villages with positive non-zero values of light emission as electrified (lit). Since the frequency
and intensity of power cuts can vary significantly over time, villages that benefit from a regular
provision of electrical power in the evening hours are more likely to appear lit in satellite imagery
than a village whose access to power is highly irregular or inconsistent.
Using night lights to detect electrification differs from conventional survey-based approaches or
Census definitions which typically ask whether a village or town is connected to the power grid,
regardless of whether electricity is actually available or being productively used. Moreover, con-
ventional indicators are usually static, implying that once a village is electrified, it stays electrified.
Electrification status measured in these standard ways distorts the actual situation on the ground18I also compute a continuous measure of total light detected at the village level. However, I prefer the dichoto-
mous variable which is less sensitive to variations in the sensitivity of the satellite’s recording instruments or variableatmospheric conditions over time.
19The village location data are from ML Infomap’s VillageMap which provides the point location of all villages in UttarPradesh.
18
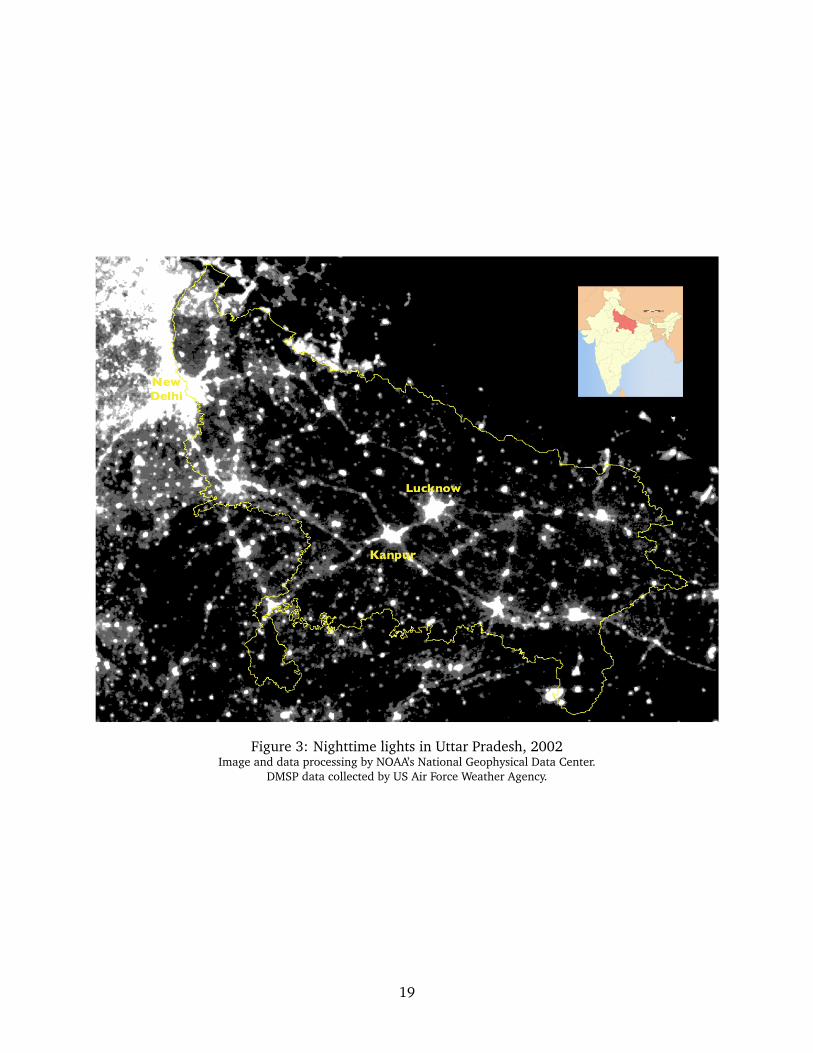
Figure 3: Nighttime lights in Uttar Pradesh, 2002Image and data processing by NOAA’s National Geophysical Data Center.
DMSP data collected by US Air Force Weather Agency.
19

in much of the developing world, where access to power is often the exception rather than the rule.
For citizens, new electric poles and wires are irrelevant if the supply of power is inconsistent or
unreliable. As one villager in a newly “electrified” village told me, “We have only had a few hours
of power since the men came to install the poles. It is worse now. Now we get a bill even though
there is no electricity!”
How reliable are satellite images as an indicator of electricity use? Previous studies have found
high correlations between nighttime light output and electricity use at the national level (Elvidge
et al. 1997b) but the relationship at smaller sub-national units has not been robustly evaluated.20
In India, state agencies collect a range of electricity measures that allow comparisons of administra-
tive data against satellite-measured nighttime light output. Official data on electricity distribution
come from the Uttar Pradesh Power Corporation, who report electricity consumption for 150 elec-
tricity supply zones, which I aggregate up to the district level to enable spatial comparisons against
satellite imagery. Figure 4a plots UPPCL’s district-level electricity consumption totals against the
pixel-by-pixel sum of all light output within each district in 2002. With a correlation of .82, the
data suggests a log-linear relationship between electricity provision measured at the power station
to nighttime light emissions detected from space.
How do nighttime lights compare against household electrification rates? Based on 2001 India
Census tables, the Uttar Pradesh Human Development Report provides estimates at the district level
of the percentage of households using electricity as the primary source of lighting. These household
electrification data are plotted against the total light output within each district in Figure 4b. There
is again a log-linear relationship, though the pattern is noisier than the comparison with energy
consumption data.
5.2 Independent Variables
The primary variable of interest is a BSP party indicator that is coded 1 in years in which a village is
represented by a BSP legislator in the State Assembly. The Scheduled Caste population share variable
codes the proportion of the population classified as Scheduled Caste according to the 2001 Indian
Census. Given the very high rates of support for the BSP among SC voters, this variable serves20For some exceptions, see Elvidge et al. (2001), Ebener et al. (2005), Doll, Muller & Morley (2006), Kiran Chand
et al. (2009), Townsend & Bruce (2010).
20

Figure 4: Comparison of satellite and official estimates of electrification, Uttar Pradesh districts
(a) Light output and electricity consumption, 2002
(b) Light output and household electricity use, 2001
Sources: Author’s calculations from DMSP-OLS data; 2006 Uttar Pradesh Human Development Report; Uttar PradeshPower Corp.
21

as a proxy for BSP core voters. I create an interaction term BSP × SC population share to explore
heterogeneous effects of BSP representation depending on the proportion of core voters within a
village. Some Assembly Constituency seats are Reserved for Scheduled Caste candidates.
To reliably evaluate whether villages under BSP rule were more likely to be electrified and lit,
we need to control for factors that might make a village easier to electrify compared to others. For
example, very remote villages are more difficult to electrify than one adjacent to a large city. If the
kinds of villages that are more likely to be represented by the BSP are systematically different from
villages represented by other parties like the BJP, then we need to control for these differences as
best as we can. I therefore collect data on a range of village and constituency-level controls.
Village population identifies both the number of potential consumers of electricity in a village
and also the number of potential voters. The presence of complementary infrastructure like a
School or Medical Facility in the village might create a higher local demand for electricity, including
for lights so students can study, or refrigeration for medicines. Existing infrastructure, as well
as the Literacy Rate of village residents, may also reflect some latent factor associated with the
ability of local residents to secure government projects in their village. Distance to Nearest Town is
measured in kilometers. Along with Paved Approach Road, these measures provide an indication of
remoteness. Since all towns are electrified, this also provides an upper bound estimate of distance
to the electric grid.
To account for variations in the level of industrialization and development across the state,
Income Index is calculated based on the adjusted district per capita income in PPP, scaled to an index
between 0 and 1 (Uttar Pradesh Planning Department 2006). The district-level income data are
available for 1991 and 2001 for all 70 districts and are the most disaggregated estimates of income
of which I am aware. I also compute the log of the total Light Output within each constituency in
each year. In many models, I include the 1992 value as a proxy indicator for the initial density and
capacity of the electrical grid. This is important since future electrification is highly conditional on
the extent of the existing electrical grid.
Additional party indicator variables are coded for the BJP, SP, Congress, and all Other Parties.
To account for serial correlation in a village’s electrification status over time, I include a full set of
year dummies in all models (Beck, Katz & Tucker 1998).
22

6 Results and Analysis
6.1 Time-Series Cross-Sectional Analysis
Table 1 shows a set of logit regressions to evaluate party effects on the likelihood that a village will
be lit in satellite imagery. To help account for non-independence of village observations within the
same constituency, standard errors are clustered at the constituency level.21
Model 1 is a reduced model that includes the party dummies, a constituency-level control for
the initial income level in 1991, and the constituency’s initial nighttime light output in 1992. The
Congress Party, which was the hegemonic party in prior decades, is the omitted reference cate-
gory. The income variable helps account for initial differences in level of economic development.
The initial light output measure accounts for existing disparities in electrical infrastructure, the
cumulative product of investments made under the former Congress regime. Controlling for these
initial regional variations, there are important differences across political parties on the probability
that a village within their constituency will be lit. The effects of BSP representation (significant
at p=0.06) are positive and substantially larger than those of the BJP, SP, or the Congress parties.
The large and significant coefficient on Other Party is notable and could indicate the effects of high
candidate quality within this group of legislators, a plausible prerequisite for electoral success out-
side the banner of a mainstream party. (However, the variable is insignificant with the addition of
constituency fixed effects. See below).
Controlling for a wide range of additional village- and constituency-level covariates in Model 2
has only a small effect on the party coefficient estimates, with BSP-represented villages still having
a higher likelihood of being lit. Model 3 looks only at more remote villages located at least 10
km from the nearest town. This sample, comprising slightly less than half of UP’s villages, includes
villages whose electrification status are less likely to be affected by the proximity of urban overglow.
Among remote villages as well, the positive BSP effect remains visible.
Model 4 adds fixed effects for all 403 constituencies to help account for unobserved factors that
may be associated with different patterns of electrification across the state. The fixed effects are
significant, suggesting that there are indeed unobserved factors that are omitted from the model.21The size of the full dataset precludes the use of more sophisticated techniques to account for the grouped nature of
the data.
23

Table 1: Predictors of Village Electrification, 1992–2003
Outcome is village lit or not (1) (2) (3) (4)Reduced model Full model Remote villages only Constituency
(> 10 km from town) Fixed Effects
BSP (Bahujan Samaj Party) 0.2275 0.1754 0.2433 0.2045**(0.1411) (0.1376) (0.2064) (0.0146)
BJP (Bharatiya Janata Party) -0.0848 -0.1104 0.1475 -0.0016(0.1329) (0.1269) (0.1907) (0.0133)
SP (Samajwadi Party) 0.0994 0.0650 0.0006 -0.0331*(0.1288) (0.1244) (0.1929) (0.0133)
Other Party 0.3151* 0.2526 0.2878 0.0245(0.1471) (0.1424) (0.2089) (0.0164)
Village-level controlsVillage population (thousands) 0.0682** 0.0599** 0.0515**
(0.0104) (0.0135) (0.0020)Scheduled Caste population, proportion 0.1579** 0.1446 0.0931**
(0.0599) (0.0829) (0.0119)Literacy rate in village 2.6076** 3.0227** 1.8015**
(0.2418) (0.3004) (0.0215)School in village -0.2530** -0.2783** -0.1505**
(0.0323) (0.0416) (0.0057)Medical facility in village 0.0531 0.0908* 0.0037
(0.0299) (0.0409) (0.0059)Paved approach road to village 0.3630** 0.3385** 0.2659**
(0.0273) (0.0387) (0.0050)Distance to nearest town (in km) -0.0443** -0.0077 -0.0513**
(0.0039) (0.0043) (0.0004)Constituency-level controlsIncome index, 1991 -2.2241 -2.3671* -3.1667* -4.2079**
(1.1660) (0.9715) (1.2832) (0.2636)Nighttime light output in constituency, 1992 1.0689** 0.9854** 1.0351** 1.2470**
(0.0655) (0.0611) (0.0742) (0.0958)Reserved constituency -0.0523 0.0285 2.0709**
(0.1156) (0.1376) (0.3898)Scheduled Caste population in constituency -1.1134 -2.3321*
(0.9907) (1.1156)
Year fixed effects Yes Yes Yes Yes
AC fixed effects No No No Yes
Constant -7.1393** -7.0442** -7.8050** 0.2879**(0.6341) (0.6151) (0.7408) (0.0608)
Observations 1,171,356 1,171,356 403,212 1,165,644
Constituency-clustered robust standard errors in parentheses.** p-value ≤ .01, two-tailed test. * p-value ≤ .05, two-tailed test.
24

Now the effect of BSP representation is significant and represents a much larger positive effect than
that for any other party. All other party categories have coefficients close to zero.22
These results are notable given the widespread lament in India that all parties have been inef-
fective in addressing the needs of the poor. When it comes to village electrification, the differences
across parties are substantial, and the most positive effects are in villages located in BSP con-
stituencies. However, we cannot easily conclude that these patterns reflect a true causal effect of
BSP representation, since it could be biased by an omitted variable in which an unobserved factor
is associated with both BSP electoral success and higher electrification rates. For example, former
Congress party representation might be such a confounder if, in prior decades, the Congress party
initiated village electrification projects in locales with large SC populations that later switched sup-
port to the BSP in the 1990s. While the inclusion of constituency fixed effects in Model 4 should
absorb time-invariant factors that operate within constituencies, and the year dummies should ac-
count for broad temporal trends affecting the whole state, these statistical adjustments provide only
a partially satisfying response to such concerns. In the next section, I focus on a smaller subset of
villages and years and use matching techniques to derive a more compelling estimate of the true
causal effect of BSP representation on the incidence of village electrification.
6.2 Deriving Causal Estimates of BSP Representation on Village Electrification
I focus here on the effects of new BSP representation resulting from the 2002 state elections. This
critical election marked an inflection point in the ascendancy of the BSP, demonstrating that it was
able to leverage its support among its Scheduled Caste voter base to achieve significant electoral
success and compete successfully against India’s dominant political parties. At the turn of the
century, the BJP had emerged as the most powerful force in Indian politics, controlling both the
national government and the state government in UP. Yet the 2002 UP elections dealt a dramatic
defeat to the BJP, with its seat share plummeting from 157 seats to 88 seats. For the BSP, whose seat
share climbed from 66 to an unprecedented 98 seats, the election was an impressive achievement,
subduing skeptics who could not foresee the ascendancy of a party whose support base lay among22I also evaluated the robustness of these results to potential lingering spatial dependence using a spatial sampling
procedure. To do so, I randomly selected 5% of villages resulting in a sparser sample where electrification rates are lesslikely to be spatially correlated. The beta coefficient on BSP remained nearly identical to those reported, with a mean of.21 and never below zero across 1000 random 5% draws.
25
India’s most marginalized citizens. Replacing the BJP leader Rajnath Singh, the BSP’s Mayawati
was named Chief Minister of UP and served in that post for 16 months from May 2002 through
August 2003.23 Given the dramatic transition in power from BJP to BSP governance during this
timeframe, I focus on the period immediately prior to and following the 2002 election to evaluate
party effects on changes in village electrification rates.
To define my sphere of analysis, I begin with the 157 assembly constituencies that were rep-
resented by the BJP prior to the election. As a result of the election, 37 of these constituencies
switched their support to the BSP while 52 retained BJP representation.24 Based on this study
sample, I ask whether unlit villages in constituencies that switched to BSP representation (the
“treatment” group) were more likely to become lit than if they had retained BJP representation
(the “control” group). Constituencies that have no unlit villages (mostly urban areas) are excluded
from the analysis. This results in a sample which comprises a treatment group of 2,679 villages in
29 constituencies that switch to BSP representation, and a control group of 3,223 villages in 29 ACs
that retain BJP representation. The contingency table in Table 2 presents a first comparison of the
data. Within the treatment group, 10% of villages that switched to BSP representation in the 2002
election gained light in 2003. That rate is more than twice as high as for villages that retained their
BJP representatives.
The results, while suggestive, do not reflect the true treatment effect so long as treatment and
control groups differ systematically across pre-treatment covariates, which is likely since represen-
tatives are decided by elections and not by random assignment. To illustrate, Table 3 summarizes
the distribution of variables across treatment and control groups within the dark sample. To ad-
dress selection bias and reduce the dependence of results on model specification and parametric
assumptions, I use matching in an effort to achieve the highest level of balance across all observed
covariates between the treatment and control groups. Matching seeks to make the treated group
look as similar as possible to the control group, allowing analysis that is less sensitive to choices
of functional form and model selection. By achieving balance, matching reduces model depen-
dence and reduces bias and variance (Ho, Imai, King & Stuart 2007). Having identified a matched23The 2002 election results were somewhat more complicated than this. The SP won more seats (143) than either
the BSP or BJP but was unable to form a government. In a purely opportunistic arrangement, the BJP and BSP formeda tactical alliance with the Chief Minister’s office ceded to the BSP. When the alliance collapsed in August 2003, the SPtook over the government and its leader, Mulayam Singh, served as Chief Minister until the 2007 election.
24For the purposes of this analysis, I ignore BJP constituencies that switch to other parties.
26

Table 2: Comparing Changes in Village Electrification 2001–2003
RETAINS BJP SWITCHES TO BSP TOTALBJP 2001 → BJP 2003 BJP 2001 → BSP 2003
Unlit 2001 → Lit 2003 4.8% 10.1% 7.2%154 villages 272 villages 426 villages
Unlit 2001 → Unlit 2003 95.2% 89.8% 92.8%3,069 2,407 5,476
Total 100% 100% 100%3,223 2,679 5,902
Table 3: Characteristics of Unlit Villages in Study Group, 2001
RETAINS BJP IN 2002 ELECTION SWITCHES TO BSP IN 2002 ELECTIONBJP 2001 → BJP 2003 BJP 2001 → BSP 2003
3,223 villages in 2,679 villages in29 Assembly Constituencies 29 Assembly Constituencies
Mean SD Min Max Mean SD Min MaxVillage level variablesScheduled Caste population share 0.23 0.19 0 1 0.29 0.22 0 1Village population (thousands) 1.31 1.26 0.001 11.61 1.39 1.51 0.001 15.54Village literacy rate 0.35 0.13 0 1 0.40 0.13 0 1School in village 0.71 0.45 0 1 0.75 0.43 0 1Medical facility in village 0.27 0.44 0 1 0.25 0.44 0 1Paved approach road to village 0.52 0.50 0 1 0.51 0.50 0 1Distance to nearest town (in km) 11.90 9.31 0 105 12.14 10.26 0 99Assembly Constituency level variablesIncome index (district) 0.40 0.04 0.35 0.50 0.43 0.04 0.37 0.652001 total nighttime light output (log) 7.17 0.71 5.44 8.65 7.54 0.54 6.56 9.09Reserved seat 0.23 0.42 0 1 0.20 0.40 0 1Avg. Scheduled Caste population share 0.22 0.07 0.10 0.40 0.26 0.05 0.14 0.34
27

sample, I then run analysis to estimate the treatment effect of BSP representation on village electri-
fication rates (for comparative purposes, the Appendix shows the same analysis on the unmatched
samples).
To identify matches, I use the genetic search algorithm, GenMatch (Sekhon Forthcoming),
which is well suited to optimizing balance in contexts where the dimensionality of covariates is
large. Using one-to-one matching with replacement. I match on the 7 village and 4 constituency-
level covariates listed in Table 3. Empirical-QQ plots of all continuous variables in Figure 5 shows
substantial improvement in balance after matching, especially on the village-level covariates.
If matching achieved perfect balance across all covariates, the treatment effect could be esti-
mated by comparing the mean outcomes across treatment and control groups. This is not the case
in this observational setting. As a result, I continue the analysis on the matched sample, condi-
tioning on covariates by estimating multilevel models using random effects logistic regression. The
multilevel approach is a preferable strategy to dealing with grouped data than the simple clus-
tering of standard errors used above and is now computationally feasible. Specifically, the model
estimates:
Pr(yi = 1) = logit−1(Xiβ + αj[i]), for i = 1, . . . , n (2)
αj = N(Ujγ,σ2α), for j = 1, . . . , 403, (3)
where X is a matrix of village-level covariates and j[i] is an index indicating the constituency in
which village i is located. At the constituency level, U is a matrix of constituency-level predictors, γ
is the vector of coefficients for the predictors, and σ2α is the variance of the constituency-level errors
(Gelman & Hill 2007). The multilevel model estimates both equations at the same time, thus
avoiding collinearity problems, while accounting for both village- and constituency-level variations
in estimating the key constituency-level coefficient of BSP representation.
Table 4 presents the main results on the matched sample and evaluate whether unelectrified
villages that switched to BSP representation were more likely to be lit than those that stayed with
the BJP. The coefficient on the BSP treatment indicator is positive and statistically significant in both
the reduced (model 1) and full specifications (model 2). The fact that BSP legislators are effective
at getting villages newly electrified is notable given the technical constraints that constrain power
28

Figure 5: Empirical-QQ Plots of Key Covariates, Before and After Matching
29

engineers. In periods of severe electricity shortage, the power load must be balanced to prevent
overloads and protect the electrical grid. Massive blackouts roll across vast swaths of the state
at a time and all villages in its path suffer indiscriminately. On the other hand getting a village
electrified is a targeted action that requires positive steps and coordination on the part of a string
of officials. Against the backdrop of endemic power blackouts, the emergence of new lights is
a particularly notable and visible sign of political effort towards voters. The positive BSP party
coefficient suggests that new BSP legislators have indeed taken an active role in ensuring new
village electrification.
Having established an overall positive effect of BSP representation, I turn now to asking what
kinds of villages within BSP constituencies were most likely to garner the attention of their leg-
islators. Specifically, I look for heterogenous effects of BSP representation across villages with
different concentrations of Scheduled Caste residents by including an interaction term between
BSP representation and the SC population share in each village. Scheduled Caste voters represent
the strongest core support group for the BSP, and their concentration varies widely across villages,
even within the same constituency. The interaction term takes advantage of the fact that the level
of core support for the BSP can be estimated in an unusually precise way using Census data on SC
residents in each village.
Combining the coefficients on the interaction term and the main terms reveals a notable trend:
villages in new BSP constituencies with large Scheduled Caste population shares are less likely to
gain electrification than those with smaller SC populations. What the data reveal is that new BSP
legislators seek to electrify villages with lower SC populations and thus fewer core supporters and
more swing voters, even after controlling for a wide range of factors.
For BSP politicians, an even more relevant number may be how the share of core supporters
relates to the percentage of votes needed to win the seat, since competitiveness can vary across
constituencies. The Surplus of core support variable is the difference between the village SC popu-
lation share and the vote share received by the BSP in the constituency in 2002.25 Positive values
identify high core support villages with a higher share of SC residents than that needed to win the
seat, while negative values indicate relatively low core support villages. For example, in the con-
stituency of Sarvankhera just west of Kanpur, the BSP candidate, Ram Swaroop Singh, won with25In the 2002 election, successful BSP candidates won with an average vote share of 33%.
30

Table 4: Evaluating BSP Treatment Effects on Village ElectrificationRandom Effects Logistic Regressions on Matched Sample
Outcome: Newly Lit in 2003(1) (2) (3)
BSP treatmentvillages only
BSP treatment 1.6680* 1.9314*(0.7663) (0.7910)
Scheduled Caste population share 1.3190** 12.8829*(0.4435) (6.0193)
BSP treatment × SC pop. share -1.7844**(0.5930)
Surplus of core support -13.3258*(SC pop. share − BSP vote share) (6.0032)
Village-level controlsVillage population (thousands) -0.0527 0.0817
(0.0477) (0.0567)Literacy rate in village 2.3317** 2.5245**
(0.5875) (0.7913)School in village -0.3617* 0.0530
(0.1663) (0.2261)Medical facility in village 0.0299 -0.3357
(0.1295) (0.1905)Paved approach road to village 0.5063** 0.4118*
(0.1203) (0.1766)Distance to nearest town (in km) -0.0368** -0.0481**
(0.0090) (0.0133)
Constituency-level controlsIncome index 12.0242* 6.4064 29.3182**
(5.7739) (6.1200) (6.6172)2001 Nighttime light output (log) 1.0654 1.2930*
(0.6189) (0.5682)Reserved constituency -0.2551 -1.5314
(0.9561) (6.0473)Scheduled Caste pop. share -0.5918 -20.8200**
(6.8396) (6.0473)Constant -9.3191** -15.5634** -24.8634**
(2.4363) (4.6062) (4.8631)Observations 5358 5358 2679Constituencies in sample 56 56 29
Standard errors in parentheses.** p-value ≤ .01, two-tailed test. * p-value ≤ .05, two-tailed test.
31

32% of the vote, beating the BJP incumbent Mathura Prasad. Of the 127 villages that were unlit in
2001 during the BJP era, 11 villages were newly lit by 2003. Among the 11 newly lit villages, the
villages of Gadanpur and Mohana had SC population shares of 54% and 36%, or a core support
surplus of 22% and 4% respectively. The other 9 villages had an average SC population share of
20%, or an average core support deficit of −12%. Thus in Sarvankhera, most of the villages that
benefited from new electrification were places with presumedly low levels of core support.
Model 3 evaluates how the surplus of core support affects village electrification rates within
new BSP constituencies. Since I am interested in evaluating the relative effects of a surplus or
deficit of core supporters, I retain the SC population share variable in the models. The results
show that while the probability of gaining new electrification is increasing as a function of SC
population share, villages with a large surplus of core supporters are significantly less likely to gain
new electrification than villages with small numbers of core supporters. When it comes to the
likelihood of becoming unelectrified, the effects of SC population share and surplus core support
are insignificant.
Figure 6 plots the predicted probability of a village gaining light in a BSP constituency as a
function of SC population shares. The downward sloping line shows that a dark village with a 70%
SC population share has a 5.0% probability of being newly lit compared to a 6.4% probability for a
village with a 10% SC population share. By contrast, the probability is increasing in SC population
for BJP constituencies.
The fact that villages with fewer SC voters and core supporters were more likely to be lit under
the new BSP regime is interesting given the strong pro-SC slogans and party platform of the BSP.
Mayawati’s Ambedkar Village program, for example, was explicitly oriented to pour development
funds into the poorest Dalit villages. Yet the electrification patterns observed in 2003 suggest that
within their constituencies, BSP legislators were more effective at electrifying villages with fewer
Dalits, even after controlling for a wide range of other village and constituency-level factors.
This pattern plausibly reflects the consequences of UP’s ethnically polarized political climate.
Caste-based voting was the dynamic by which the BSP has been able to achieve electoral success.
But when voters support a party based on ethnic or Caste-based affinities, politicians have few in-
centives to cater to the needs of their core supporters, since their votes are assured. Given that SC
voters have few credible party alternatives to support, BSP legislators appear to be making calcu-
32

Figure 6: Predicted probability of being newly lit in BSP versus BJP constituencies
Scheduled Caste population in village
Pred
icte
d pr
obab
ility
of b
eing
lit
BSP
BJP
95% confidence intervals
Predicted probabilities based on Table 4, Model 3. All other variables set at means; BSP vote share set at 0.33.
33

lated decisions to invest their resources in villages with fewer core supporters. The patterns also
foreshadow the remarkably successful 2007 BSP electoral strategy in which it built unprecedentedly
broad coalitions of poor supporters, including across Caste lines.
The control variables behave mostly as expected. Less remote villages that are closer to a town
and have a paved access road have a higher likelihood of being electrified. Similarly, villages with
higher literacy rates are more likely to be newly lit. Other village characteristics are less statistically
significant, although villages with a school appear slightly less likely to receive new electrification.
This could be a substitution effect in which politicians target electrification to villages that have less
infrastructure. Once village-level factors are accounted for, the average income level of the con-
stituency is no longer a significant predictor of changes in electrification. There is partial evidence
that new electrification depends on the existing density and quality of the power grid, proxied here
by the total light output in constituencies in 2001.
7 Conclusion
This paper uses a novel set of satellite imagery of the earth at night to study variations in the
provision of electrical power across Uttar Pradesh. I show that elections have a significant and
visible effect on the distribution of electricity to villages where most poor reside. Using annual
data from 1992 to 2003, I demonstrate that the probability a village gets electricity is higher in
constituencies represented by the low-Caste BSP party. I also find a positive BSP treatment effect
in a more limited test using matching techniques to evaluate similar villages that differ only on
whether they switched to BSP representation in the critical 2002 elections. The findings contradict
an influential conventional wisdom that who the poor vote for in India makes little difference to
their welfare.
For much of the world’s poor, access to basic public services like electricity, clean water, and
education is mediated by the state. And yet few sources of fine-grained data are typically available
on how governments shape the provision of such services to poor areas. In India, Census data
provide indicators of whether a village is electrified or not, but the data are collected only every
decade. Moreover, official data belie the reality of endemic power cuts which can last hours, days,
or longer. Remote sensing technologies may help to overcome some of the limitations of traditional
34

data sources by providing indicators that have complete geographic coverage and are regularly
updated using a consistent measurement approach.
on the distribution of basic services. Existing data on electrification, most notably from the
Census village amenities dataset, are too infrequently collected to enable study of changes that
happen year over year. Moreover, official classifications of whether a village is electrified or not are
meaningless
These findings have broader implications for the study of distributive politics in the developing
world. To some, the political manipulation of electricity might seem like further evidence of a
characteristic pathology of weak democracies, in which politicians stay in office by buying votes
with material inducements. Depending on the context, such unsavory practices are labeled as
patronage, clientelism, or pork-barrel politics. Yet this perspective discounts the harsh limits of
scarcity that define the developing world. When governments operate with constrained resources,
universal provision of public services is out of reach. According to International Energy Agency
data, the typical developing country is barely able to provide electricity to half their populations
(International Energy Agency 2002).
The ways in which resources are rationed, targeted, and manipulated are defining features
of the politics of scarcity. Thus the traditional distinctions between targetable and nontargetable
goods, private and public goods (Bueno de Mesquita et al. 2003), tactical versus programmatic
distribution (Dixit & Londregan 1996), are less useful in contexts like northern India. When state
resources are scarce, the question is less whether governments target or not (they must), but rather
the effects of those choices. In that respect, it is striking how little has changed in the five decades
since Myron Weiner described how scarcity shapes Indian politics: “Given the limited resources
possessed by government, a vast gap remains between what organized groups demand and what
government is capable of providing. Indeed the government’s concern for long-term economic
planning means that it must place limits on the extent to which it will satisfy the demands of
specific groups. The requirements of political responsiveness and the requirements of economic
planning are thus often at odds with one another” (Weiner 1962, p. xviii).
Given the competition for scarce electrical power between wealthy and poor, urban and rural,
industry and households, the findings here suggest that governments are indeed responsive to
the ballot choices made by voters. The competitive negotiation between voters and their leaders
35

over scarce resources is a necessary condition for electoral accountability to be effective. Indeed,
as Gabriel Almond noted in his foreword to Wiener’s book, “Nothing can be more destructive of
democratic culture than a conception of national interest which deprives special interests of the
opportunity to bargain, to be heard, to enter creatively into the flow of demands and policies of the
political process.” Understanding how this vibrant process impacts the welfare of special interests,
including the poor, represents an ongoing challenge that will be enriched with new and improved
data sources and technologies.
36

References
Acemoglu, Daron & James A. Robinson. 2006. Economic origins of dictatorship and democracy. New
York: Cambridge University Press.
Banerjee, Abhijit & Rohini Somanathan. 2007. “The political economy of public goods: Some
evidence from India.” Journal of Development Economics 82(2):287–314.
Banerjee, Abhijit, Rohini Somanathan & Lakshmi Iyer. 2005. “History, social divisions and public
goods in rural India.” Journal of the European Economic Association 3(2–3):639–647.
Banerjee, Abhijit V. & Rohini Pande. 2007. “Parochial Politics: Ethnic Preferences and Politician
Corruption.” SSRN eLibrary .
Bayly, Susan. 1999. Caste, society and politics in India from the eighteenth century to the modern age.
Cambridge, U.K.; New York: Cambridge University Press.
Beck, Nathaniel, Jonathan N. Katz & Richard Tucker. 1998. “Taking time seriously: Time-series-
cross-section analysis with a binary dependent variable.” American Journal of Political Science
42(4):1260–1288.
Behrman, Jere R. & Mark R. Rosenzweig. 1994. “Caveat emptor: cross-country data on education
and the labor force.” Journal of Development Economics 44(1):147–171.
Besley, Timothy, Rohini Pande & Vijayendra Rao. 2007. “Just rewards? Local
politics and public resource allocation in south India.” Unpublished. October.
http://sticerd.lse.ac.uk/dps/de/dedps49.pdf.
Brass, Paul R. 1994. The politics of India since independence. New York: Cambridge University Press.
Bratton, Michael & Nicholas van de Walle. 1994. “Neopatrimonial regimes and political transitions
in Africa.” World Politics 46(4):453–489.
Brown, David S. & A. Mushfiq Mobarak. 2009. “The Transforming Power of Democracy: Regime
Type and the Distribution of Electricity.” American Political Science Review 103(02):193–213.
Bueno de Mesquita, Bruce et al. 2003. The logic of political survival. Cambridge, MA: MIT Press.
37

Chandra, Kanchan. 2004. Why ethnic parties succeed. Cambridge, UK; New York, NY: Cambridge
University Press.
Chhibber, Pradeep & Irfan Nooruddin. 2004. “Do party systems count? The number of parties and
government performance in the Indian states.” Comparative Political Studies 37(2):152–187.
Diaz-Cayeros, Alberto, Beatriz Magaloni & Estevez. Forthcoming. “Vote-buying, poverty and democ-
racy: The politics of social programs in Mexico, 1989–2006.” Unpublished manuscript.
Dixit, Avinash & John Londregan. 1996. “The determinants of success of special interests in redis-
tributive politics.” The Journal of Politics 58(4):1132–1155.
Doll, CNH, JP Muller & JG Morley. 2006. “Mapping regional economic activity from night-time
light satellite imagery.” Ecological Economics 57(1):75–92.
Duncan, Ian. 1999. “Dalits and politics in rural north India: The Bahujan Samaj Party in Uttar
Pradesh.” Journal of Peasant Studies 27(1):35–60.
Dunning, Thad & Janhavi Nilekani. 2010. “Caste, political parties, and distribution in Indian village
councils.” Unpublished manuscript.
Ebener, S et al. 2005. “From wealth to health: modelling the distribution of income per capita at the
sub-national level using night-time light imagery.” International journal of health geographics
4(1):5.
Elvidge, Christopher et al. 1997a. “Mapping city lights with nighttime data from the DMSP Opera-
tional Linescan System.” Photogrammetric Engineering & Remote Sensing 63(6):727–734.
Elvidge, Christopher et al. 1997b. “Relation between satellite observed visible-near infrared emis-
sions, population, economic activity, and power consumption.” International Journal of Remote
Sensing 18(6):1373–1379.
Elvidge, Christopher et al. 2001. “Night-time lights of the world: 1994–1995.” ISPRS Journal of
Photogrammetry & Remote Sensing 56:81–99.
38

Foster, Andrew D. & Mark R. Rosenzweig. 2004. “Democratization, decentralization
and the distribution of local public goods in a poor rural economy.” Unpublished.
http://adfdell.pstc.brown.edu/papers/democ.pdf.
Gang, Ira N., Kunal Sen & Myeong-Su Yun. 2008. “Poverty in rural India: caste and tribe.” Review
of Income and Wealth 54(1):50–70.
Gelman, Andrew & Jennifer Hill. 2007. Data analysis using regression and multilevel/hierarchical
models. New York: Cambridge University Press.
Gradstein, Mark. 1993. “Rent seeking and the provision of public goods.” Economic Journal
103(420):1236–1243.
Hansen, Thomas Blom. 1999. The saffron wave: Democracy and Hindu nationalism in modern India.
Princeton, NJ: Princeton University Press.
Hasan, Zoya, ed. 2002. Parties and party politics in India. New Delhi: Oxford University Press.
Ho, Daniel E., Kosuke Imai, Gary King & Elizabeth A. Stuart. 2007. “Matching as nonparamet-
ric preprocessing for reducing model dependence in parametric causal inference.” Political
Analysis .
Imhoff, Mark L. et al. 1997. “A technique for using composite DMSP/OLS “city lights” satellite data
to map urban area.” Remote Sensing of Environment 61(3):361–370.
International Energy Agency. 2002. World Energy Outlook 2002. Paris, France: Organisation for
Economic Cooperation and Development (OECD)/IEA.
Jaffrelot, Christophe. 2003. India’s silent revolution: the rise of the low castes in North Indian politics.
New Delhi: Permanent Black.
Kale, Sunila S. 2004. “Current Reforms: The Politics of Policy Change in India’s Electricity Sector.”
Pacific Affairs pp. 467–491.
Keefer, Philip. 2005. Democratization and clientelism: why are young democracies badly governed?
Working Paper Series No. 3594. World Bank. Washington, DC: World Bank.
39
Keefer, Philip & Stuti Khemani. 2005. “Democracy, public expenditures, and the poor: Understand-
ing political incentives for providing public services.” World Bank Research Observer 20(1):1–
27.
Keefer, Philip & Stuti Khemani. 2009. “When do legislators pass on pork? The role of political
parties in determining legislator effort.” American Political Science Review 103(01):99–112.
Kiran Chand, T.R et al. 2009. “Spatial characterization of electrical power consumption patterns
over India using temporal DMSP-OLS night-time satellite data.” International Journal of Re-
mote Sensing 30(3):647–661.
Kitschelt, Herbert & Steven Wilkinson. 2007. Patrons, clients, and policies: Patterns of democratic
accountability and political competition. New York: Cambridge University Press.
Kohli, Atul. 1987. The state and poverty in India: the politics of reform. New York: Cambridge
University Press.
Kohli, Atul. 2004. State-directed development: Political power and industrialization in the global
periphery. New York: Cambridge University Press.
Lake, David A. & Matt Baum. 2001. “The invisible hand of democracy: political control and the
provision of public services.” Comparative Political Studies 34(6):587–621.
Meltzer, Allan H. & Scott F. Richard. 1981. “A rational theory of the size of government.” Journal
of Political Economy 89(5):914–927.
Mendelsohn, Oliver & Marika Vicziany. 1998. The untouchables: subordination, poverty, and the
state in modern India. Cambridge, UK: Cambridge University Press.
Modi, Vijay. 2005. Improving electricity services in rural India. Working Paper 30 Earth Institute at
Columbia University.
Pai, Sudha. 2002. Dalit assertion and the unfinished democratic revolution: The Bahujan Samaj Party
in Uttar Pradesh. New Delhi: .
Ross, Michael L. 2006. “Is Democracy Good for the Poor?” American Journal of Political Science
50(4):860–874.
40
Scheiner, Ethan. 2006. Democracy without competition in Japan: Opposition failure in a one-party
dominant state. New York: Cambridge University Press.
Sekhon, Jasjeet S. Forthcoming. “Multivariate and propensity score matching software with au-
tomated balance optimization: The matching package for R.” Journal of Statistical Software
.
Sen, Amartya. 1999. Development as freedom. New York: Oxford University Press.
Stokes, Susan C. 2005. “Perverse accountability: A formal model of machine politics with evidence
from Argentina.” American Political Science Review 99(03):315–325.
Townsend, A.C & D.A Bruce. 2010. “The use of night-time lights satellite imagery as a measure of
Australia’s regional electricity consumption and population distribution.” International Jour-
nal of Remote Sensing 31(16):4459–4480.
Treier, Shawn & Simon Jackman. 2008. “Democracy as a latent variable.” American Journal of
Political Science 52(1):201–217.
Uttar Pradesh Planning Department. 2006. Uttar Pradesh Human Development Report 2006. Tech-
nical report Government of Uttar Pradesh. Lucknow, India.
Varshney, Ashutosh. 1995. Democracy, Development, and the Countryside: Urban-Rural Struggles in
India. Cambridge University Press.
Ward, Michael D. & Kristian Skrede Gleditsch. 2002. “Location, location, location: An MCMC
approach to modeling the spatial context of war and peace.” Political Analysis 10(3):244–260.
Weiner, Myron. 1962. The Politics of Scarcity: Public Pressure and Political Response in India. Chicago,
IL: University of Chicago Press.
Wilkinson, Steven I. 2006. “The politics of infrastructural spending in India.” Background paper for
Dancing with Giants: China, India, and the Global Economy. Institute for Policy Studies and
the World Bank, Washington, DC. July.
Wittman, Donald. 1989. “Why democracies produce efficient results.” Journal of Political Economy
97(6):1395–1424.
41

World Bank. 2002. Poverty in India: The Challenge of Uttar Pradesh. Report No. 22323-IN. Poverty
Reduction and Economic Management Sector Unit, South Asia Region.
World Bank. 2008. The welfare impact of rural electrification: A reassessment of the costs and
benefits. Technical report Independent Evaluation Group (IEG). Washington, DC: World Bank.
42

Appendix
Table 5: Evaluating BSP Treatment Effects on Village ElectrificationRandom Effects Logistic Regressions on Unmatched Samples
Outcome: Newly Lit in 2003(1) (2) (3)
BSP treatmentvillages only
BSP treatment 1.0236 0.9037(0.6084) (0.6305)
Scheduled Caste population share -0.4696 12.8829*(0.6558) (6.0193)
BSP treatment X SC pop. share -0.0997(0.7565)
Surplus of core support -13.3258*(SC pop. share − BSP vote share) (6.0032)
Village-level controlsPopulation, village (in thousands) 2.5873** 0.0817
(0.5593) (0.0567)Literacy rate in village 0.0705 2.5245**
(0.1628) (0.7913)School in village -0.2326 0.0530
(0.1460) (0.2261)Medical facility in village 0.2097 -0.3357
(0.1306) (0.1905)Paved approach road to village -0.0287** 0.4118*
(0.0091) (0.1766)Distance to nearest town (in km) 12.8120* -0.0481**
(5.4762) (0.0133)
Constituency-level controlsIncome index 16.6825** 0.0140 29.3182**
(5.2632) (0.5251) (6.6172)Nighttime light output, 2001 (log) 0.7046 1.2930*
(0.4454) (0.5682)Reserved constituency 0.0527 -20.8200**
(0.0477) (6.0473)Scheduled Caste pop. share -2.5379 -20.8200**
(5.4108) (6.0473)Constant -10.7466 -14.5531** -24.8634**
(2.2399) (3.3334) (4.8631)Observations 5902 5902 2679Assembly Constituencies in sample 58 58 29
Note: Model 3 is identical to results in Table 4 and presented for comparison purposes.Standard errors in parentheses. ** p-value ≤ .01, two-tailed test. * p-value ≤ .05, two-tailed test.
43
Copyright © 2022 FDOKUMEN