Principle and Practice of Distributing Low and High Resolution ...
98
FACULTY OF SCIENCE DEPARTMENT OF COMPUTER SCIENCE Principle and Practice of Distributing Low and High Resolution Display Content from One Computer to Many Computers in Stand-alone or Display Wall Configurations Yong Liu A dissertation for the degree of Philosophiae Doctor December 2010
-
Upload
khangminh22 -
Category
Documents
-
view
0 -
download
0
Transcript of Principle and Practice of Distributing Low and High Resolution ...

FACULTY OF SCIENCEDEPARTMENT OF COMPUTER SCIENCE
Principle and Practice of Distributing Low and High Resolution Display Content from One Computer to Many Computers in Stand-alone or Display Wall Configurations
Yong Liu
A dissertation for the degree ofPhilosophiae DoctorDecember 2010


Abstract
Computer-based collaboration typically implies sharing display content between different display de-vices. This is complicated by (1) display differences, such as resolution, size, and display type, (2)different network characteristics, (3) limited network performance, (4) limited computing resources, (5)different graphical approaches, such as different architectures and graphical libraries. These complica-tions result in the following problems: (i) there is no common cross platform and application independentsolution to sharing display content across different displays; (ii) in lack of a common platform, the widelyused remote desktop pixel-based approach to sharing display content does not scale well as the numberof clients increases. Even with one client at typical desktop resolution, the frame rate will be limited sothat users cannot get all of the shared display content. This situation will increasingly become worse asthe resolution goes up.
Existing approaches to sharing display content include an application level model, a graphical levelmodel, a pixel level model and a hardware level model. These approaches are distinguished accordingto the level at which display content is distributed. Applications are responsible for sharing displaycontent in an application level model. It’s dependent on the graphical library and the operating system.A graphical level model uses a graphical library to distribute display content. This is transparent toapplications, but is dependent on the operating system. In a pixel level model, pixels are read from theframe buffer and distributed over a network. This is transparent to applications. It’s independent of thegraphical library, but not of the operating system. A hardware level model uses hardware to read andtransfer pixels over a network. This is transparent to applications and independent of the graphical libraryand the operating system.
The characteristics of the pixel level model and its wide deployment make it realistic and interesting forfurther research. The VNC (Virtual Network Computing) is a widely used pixel level model. VNC usesa server-client architecture. The server encodes and transfers screen update regions in response to clientupdate requests.
MultiStream was developed to see if the performance limitations of the pixel level model as indicatedby its use in VNC can be overcome by architectural changes. MultiStream aims to let many clientsview the same low resolution display content customized for each client characteristic. The idea ofMultiStream is to use media streaming to share display content. There are many available compressionmethods for media streaming. They typically balance performance and lossyness. Media players areubiquitous on most devices. The architecture of MultiStream has three components: (i) a video-creatingproducer which transforms display content into a video and streams it to the video streaming service; (ii)the video streaming service which relays customized videos to clients; (iii) a consumer viewing a videorepresenting display content.
However, as the resolution goes up, creating videos becomes too time-consuming. So the MultiStreamapproach is not suited for high resolution display walls. A display wall is a distributed tiled display. Be-
iii

iv
cause of the display distribution and high resolution, traditional operating systems cannot directly drivea display wall. VNC has already been applied to create a large desktop to fill a wall-size tiled display.For each tile, a VNC viewer requests pixel updates for the tile from the VNC server. These updates aredisplayed as soon as they are received with no update synchronization between tiles. However, this desk-top is too CPU- and network- intensive to achieve a high frame rate using VNC. In order to overcomethis problem, several changes were done to VNC architecture and implementation. The changes includeusing the Intel SIMD instruction set to parallelize pixel movement, changing VNC to a multi-threadarchitecture and using GPUs.
A series of experiments were conducted to document the performance characteristics of MultiStreamand VNC architecture and implementation for the two usage scenarios of many low resolution clientsand of a single high resolution client. The experimental platform includes a 28-node display wall cluster,a video server, a server for display wall desktops and a laptop. For the first usage scenario, we measuredthe frame rate of 3DMark with and without concurrently encoding a video of the display output from3DMark. We measured the CPU, memory and network load on the video server increasing the numberof clients from 28 to 560. We also measured the CPU load of the VNC server, while playing back videos,increasing the number of clients from 1 to 4 for VNC. For the second usage scenario, we profiled twoVNC implementations, RealVNC and TightVNC, and chose the one with the higher frame rate for furtherimprovements. We benchmarked each improved version, playing back two videos at 3 mega-pixels and6.75 mega-pixels on the display wall, and compared them with the chosen one.
For the first usage scenario, FPS of 3DMark is reduced by 2/3 when MultiStream encodes the displayoutput from 3DMark. With 28 clients, the CPU load on the video server is close to 0. The CPU loadwith 560 clients is about 50%. With 28 clients, the memory load on the video server is less than 0.5%of the 2GB physical memory. The memory load with 560 clients is 3%. With 28 clients, the networkload from the video server is about 2 MB/s. The network load with 560 clients is about 35 MB/s.With one client, the CPU load of the VNC server is about 72%. The CPU load with two, three andfour clients is about 92%. For the second usage scenario, TightVNC had a higher FPS than RealVNC,so we chose TightVNC for improvement. Tuning VNC improves the frame rate from 8.14 to 10 forthe video at 3 mega-pixels per frame, and from 4.3 to 5.9 for the video at 6.75 mega-pixels per frame.The improvement using a multi-thread architecture increases the frame rate from 8.14 to about 14 at 3mega-pixels per frame and from 4.3 to about 6 at 6.75 mega-pixels per frame. When a GPU is used tocopy and encode pixels, the FPS decreases from 8.14 to 1.6 at 3 mega-pixels per frame.
For the first usage scenario, the experimental result shows that the MultiStream architecture can scaleto two orders of magnitude more clients than the VNC architecture. Both MultiStream and VNC arepixel level models, but their different architectures result in different performance. The reason is thatMultiStream architecture separates between producing display content, capturing pixels, creating videos,and distributing videos. This allows us to use several nodes, one for distribution and another for the rest.Two different architectures result in different usages. The VNC architecture usually provides a losslesspixel stream with bad frame rates and high CPU load to support fewer viewers. In contrast, MultiStreamhas lossy videos for display content with good frame rates to support many viewers. So MultiStreamis better suited than VNC for dynamic documents, where lossyness is acceptable, and for main clients.This can typically be the case in computer-based collaboration.
For the second usage scenario, the profiling of the TightVNC X server shows that pixel copying andencoding are the bottlenecks. This is also confirmed by the higher frame rate gained from changes doneto the pixel copying and encoding, and by using a multi-threaded architecture to overlap encoding pixelsbetween tiles. But the improved FPS is still limited. For the current implementation, using a GPU failedto improve the frame rate. This can be because of a combination of GPU characteristics including that
v
each GPU core is slower than the CPU doing pixel comparisons, and because of the number of coresoverlapping in pixel comparisons. For practical reasons, the resolutions used in the experiments areless than 22 mega-pixels. Creating 22 mega-pixels takes too much time. Single videos are as such notsuited to fill display wall with content used in experiments, and further improvements of the experimentalmethodology are needed. A display wall desktop using the VNC approach with a single VNC server canonly support limited resolutions, although display walls are able to implement unlimited resolution. Themaximum bandwidth of a display wall is subject to the minimum bandwidth of all devices, which isusually a network device. A 1 Gbit Ethernet will support about 25 mega-pixels (100 MB) per secondwithout compression.
The MultiStream system documents that the pixel level model can support hundreds of clients viewingshared display content at a typical desktop resolution. It is VNC that limits the pixel level model. Weexpect that MultiStream can support thousands of clients with emerging network technology.
We conclude that, even if the VNC architecture can drive the display wall, the frame rate is bound to below. The VNC architecture makes it impossible in principle and in practice to drive a tens of mega-pixelsdisplay wall at 25 FPS today. The VNC architecture makes it possible in principle to drive a tens ofmega-pixels display wall at 25 FPS with emerging technology.

vi

Acknowledgments
I would like to thank many friends who have encouraged and helped me to finish this dissertation.
First and foremost, I would like to express my deepest gratitude to my supervisor, Professor Otto J.Anshus. He has provided me with valuable guidance in every stage of my PH.D. program. Without hisguidance, I could not complete my dissertation. His effective suggestions make the dissertation in theright direction.
I would like to thank Professor Ninghui Sun in China. He gave me a chance to study in the universityof Tromsø. It’s impossible for me to realize my dream for a PH.D. degree abroad without his help. Ilearned much from him.
I also want to express thanks to my co-advisor Professor John Markus Bjøndalen for his guidance andhelp. He gave many suggestions with respect to ideas. He also helped me to discuss experimental resultsand write papers.
Thanks to Professor Tore Larsen for helping to comment and write papers.
I would like to thank other research fellows (especially Daniel Stødel and Phuong Hoai Ha) in a displaywall group. They gave me many valuable comments and discussion.
The technical staffs in the department of computer science, especially Jon Ivar Kristiansen and Ken-ArneJensen, are very helpful to provide technical support. They helped me to build experimental equipments.I also thank the administrative staffs, especially Svein-Tore Jensen, and Jan Fuglesteg, for their kind help.
Finally, I would like to express many thanks to my wife, Yueqiu Jiang. Her encouragement and supporthas sustained me through frustration and depression during writing this dissertation.
vii

viii

Contents
Abstract iii
Acknowledgments vii
1 Introduction 11.1 Sharing Problems in Hyper-display Based Collaboration . . . . . . . . . . . . . . . . . 11.2 Existing Approaches to Sharing Display Content . . . . . . . . . . . . . . . . . . . . . 21.3 CPU and Network Challenges Using a Pixel Level Model . . . . . . . . . . . . . . . . . 4
1.3.1 Moore’s Law and CPU Frequency . . . . . . . . . . . . . . . . . . . . . . . . . 41.3.2 Amdahl’s Law and Parallel Speedup . . . . . . . . . . . . . . . . . . . . . . . . 5
1.4 Methodology . . . . . . . . . . . . . . . . . . . . . . . . . . . . . . . . . . . . . . . . 71.5 Contributions . . . . . . . . . . . . . . . . . . . . . . . . . . . . . . . . . . . . . . . . 7
1.5.1 Principles . . . . . . . . . . . . . . . . . . . . . . . . . . . . . . . . . . . . . . 71.5.2 Model . . . . . . . . . . . . . . . . . . . . . . . . . . . . . . . . . . . . . . . . 81.5.3 Artefacts . . . . . . . . . . . . . . . . . . . . . . . . . . . . . . . . . . . . . . 91.5.4 Claims . . . . . . . . . . . . . . . . . . . . . . . . . . . . . . . . . . . . . . . 9
1.6 Organization of Dissertation . . . . . . . . . . . . . . . . . . . . . . . . . . . . . . . . 10
2 Hardware and Software for Low and High Resolution 112.1 Default Displays . . . . . . . . . . . . . . . . . . . . . . . . . . . . . . . . . . . . . . 112.2 Hyper Displays . . . . . . . . . . . . . . . . . . . . . . . . . . . . . . . . . . . . . . . 11
2.2.1 Introduction . . . . . . . . . . . . . . . . . . . . . . . . . . . . . . . . . . . . . 112.2.2 Display Walls . . . . . . . . . . . . . . . . . . . . . . . . . . . . . . . . . . . . 122.2.3 Software at Display Walls . . . . . . . . . . . . . . . . . . . . . . . . . . . . . 142.2.4 Pixel Level Architecture on the Tromsø Display Wall . . . . . . . . . . . . . . . 15
3 Low Resolution Display Content Viewing By Many Clients 173.1 Introduction . . . . . . . . . . . . . . . . . . . . . . . . . . . . . . . . . . . . . . . . . 173.2 Related Work . . . . . . . . . . . . . . . . . . . . . . . . . . . . . . . . . . . . . . . . 183.3 Motivation . . . . . . . . . . . . . . . . . . . . . . . . . . . . . . . . . . . . . . . . . . 23
3.3.1 Device Polymorphism . . . . . . . . . . . . . . . . . . . . . . . . . . . . . . . 233.3.2 Scalability . . . . . . . . . . . . . . . . . . . . . . . . . . . . . . . . . . . . . 243.3.3 3D applications . . . . . . . . . . . . . . . . . . . . . . . . . . . . . . . . . . . 24
3.4 MultiStream . . . . . . . . . . . . . . . . . . . . . . . . . . . . . . . . . . . . . . . . . 253.4.1 Idea . . . . . . . . . . . . . . . . . . . . . . . . . . . . . . . . . . . . . . . . . 25
3.5 Architecture . . . . . . . . . . . . . . . . . . . . . . . . . . . . . . . . . . . . . . . . . 263.6 Design . . . . . . . . . . . . . . . . . . . . . . . . . . . . . . . . . . . . . . . . . . . . 27
3.6.1 Capturing and Encoding . . . . . . . . . . . . . . . . . . . . . . . . . . . . . . 283.6.2 Scale Video Server . . . . . . . . . . . . . . . . . . . . . . . . . . . . . . . . . 28
3.7 Implementation . . . . . . . . . . . . . . . . . . . . . . . . . . . . . . . . . . . . . . . 28
ix

x Contents
3.8 Experiments and Results . . . . . . . . . . . . . . . . . . . . . . . . . . . . . . . . . . 293.8.1 Experiment Setup . . . . . . . . . . . . . . . . . . . . . . . . . . . . . . . . . . 293.8.2 Producer Performance . . . . . . . . . . . . . . . . . . . . . . . . . . . . . . . 293.8.3 Scalability on the Streaming Server . . . . . . . . . . . . . . . . . . . . . . . . 313.8.4 Comparison with VNC . . . . . . . . . . . . . . . . . . . . . . . . . . . . . . . 32
3.9 Discussion . . . . . . . . . . . . . . . . . . . . . . . . . . . . . . . . . . . . . . . . . . 323.10 Conclusion . . . . . . . . . . . . . . . . . . . . . . . . . . . . . . . . . . . . . . . . . 34
4 High Resolution Display Wall Desktops 354.1 Introduction . . . . . . . . . . . . . . . . . . . . . . . . . . . . . . . . . . . . . . . . . 354.2 Related Work . . . . . . . . . . . . . . . . . . . . . . . . . . . . . . . . . . . . . . . . 364.3 Experimental Methodology . . . . . . . . . . . . . . . . . . . . . . . . . . . . . . . . . 394.4 Selecting a VNC Implementation for Improvement . . . . . . . . . . . . . . . . . . . . 42
4.4.1 Selecting . . . . . . . . . . . . . . . . . . . . . . . . . . . . . . . . . . . . . . 424.4.2 Profiling . . . . . . . . . . . . . . . . . . . . . . . . . . . . . . . . . . . . . . 43
4.5 Improving the Selected VNC . . . . . . . . . . . . . . . . . . . . . . . . . . . . . . . . 444.5.1 Instruction Level Improvement . . . . . . . . . . . . . . . . . . . . . . . . . . . 454.5.2 Using a Multi-thread Architecture . . . . . . . . . . . . . . . . . . . . . . . . . 474.5.3 The Improvement Using GPUs of TightVNC . . . . . . . . . . . . . . . . . . . 53
4.6 Discussion . . . . . . . . . . . . . . . . . . . . . . . . . . . . . . . . . . . . . . . . . . 574.7 Conclusion . . . . . . . . . . . . . . . . . . . . . . . . . . . . . . . . . . . . . . . . . 60
5 Discussion 615.1 Background . . . . . . . . . . . . . . . . . . . . . . . . . . . . . . . . . . . . . . . . . 615.2 Model for Sharing Display Content . . . . . . . . . . . . . . . . . . . . . . . . . . . . . 645.3 Sharing Display Content without Compression . . . . . . . . . . . . . . . . . . . . . . 65
5.3.1 Evaluation Equation for CPU and Network . . . . . . . . . . . . . . . . . . . . 655.3.2 Discussion . . . . . . . . . . . . . . . . . . . . . . . . . . . . . . . . . . . . . 665.3.3 Conclusion . . . . . . . . . . . . . . . . . . . . . . . . . . . . . . . . . . . . . 67
5.4 Sharing Display Content with Compression . . . . . . . . . . . . . . . . . . . . . . . . 675.4.1 Evaluation Equation for CPU and Network . . . . . . . . . . . . . . . . . . . . 675.4.2 Discussion . . . . . . . . . . . . . . . . . . . . . . . . . . . . . . . . . . . . . 685.4.3 Conclusion . . . . . . . . . . . . . . . . . . . . . . . . . . . . . . . . . . . . . 71
6 Conclusion 73
7 Future Work 75
8 Appendix A - Published papers 778.1 MultiStream - A Cross-platform Display Sharing System Using Multiple Video Streams 778.2 Improving the Performance of VNC for High-Resolution Display Walls . . . . . . . . . 848.3 Using Multi-Threading and Server Update Pushing to Improve the Performance of VNC
for a Wall-sized Tiled Display Wall . . . . . . . . . . . . . . . . . . . . . . . . . . . . . 93
9 Appendix B - Unpublished papers 1119.1 gTiledVNC - a 22 Mega-pixel Display Wall Desktop Using GPUs and VNC . . . . . . . 111
Reference 125
List of Figures
1.1 Scenario of Sharing Display Content . . . . . . . . . . . . . . . . . . . . . . . . . . . . 21.2 Approaches to Sharing Display Content . . . . . . . . . . . . . . . . . . . . . . . . . . 31.3 Intel CPU Speed Trend Since 1994 (Each data point shows that the CPU frequency in
one year is higher than those in previous years. Source data is gathered from [31, 66].) . 51.4 Amdahl’s Law . . . . . . . . . . . . . . . . . . . . . . . . . . . . . . . . . . . . . . . . 6
2.1 A 22 Megapixels Tromsø Display Wall . . . . . . . . . . . . . . . . . . . . . . . . . . . 132.2 The Architecture of a Tromsø Display Wall. Each projector is plugged into a computer
that displays one tile of the desktop. . . . . . . . . . . . . . . . . . . . . . . . . . . . . 142.3 The Pixel Level Architecture for the Tromsø Display Wall . . . . . . . . . . . . . . . . 16
3.1 The VNC Architecture [46] . . . . . . . . . . . . . . . . . . . . . . . . . . . . . . . . . 183.2 Major Components of the SLIM Architecture [50] . . . . . . . . . . . . . . . . . . . . . 193.3 The THINC Architecture . . . . . . . . . . . . . . . . . . . . . . . . . . . . . . . . . . 203.4 The TARANTELLA Architecture [53] . . . . . . . . . . . . . . . . . . . . . . . . . . . 213.5 The NX Architecture [19] . . . . . . . . . . . . . . . . . . . . . . . . . . . . . . . . . . 223.6 An Example of the LBX System [41] . . . . . . . . . . . . . . . . . . . . . . . . . . . . 233.7 The LBX Architecture [41] . . . . . . . . . . . . . . . . . . . . . . . . . . . . . . . . . 233.8 Least Common Denominator . . . . . . . . . . . . . . . . . . . . . . . . . . . . . . . . 263.9 The Idea of MultiStream . . . . . . . . . . . . . . . . . . . . . . . . . . . . . . . . . . 263.10 MultiStream Architecture . . . . . . . . . . . . . . . . . . . . . . . . . . . . . . . . . . 273.11 MultiStream Design . . . . . . . . . . . . . . . . . . . . . . . . . . . . . . . . . . . . . 273.12 Producer on MultiStream . . . . . . . . . . . . . . . . . . . . . . . . . . . . . . . . . . 283.13 MultiStream Setup . . . . . . . . . . . . . . . . . . . . . . . . . . . . . . . . . . . . . 303.14 3D-Mark FPS with/without Encoding Videos . . . . . . . . . . . . . . . . . . . . . . . 303.15 CPU Load on the Streaming Server and the TightVNC Server . . . . . . . . . . . . . . . 313.16 Memory Load on the Streaming Server . . . . . . . . . . . . . . . . . . . . . . . . . . . 313.17 Network Bandwidth Usage . . . . . . . . . . . . . . . . . . . . . . . . . . . . . . . . . 32
4.1 The Architecture of Display Wall Desktop Using VNC . . . . . . . . . . . . . . . . . . 364.2 The Architecture of WireGL [21] . . . . . . . . . . . . . . . . . . . . . . . . . . . . . . 374.3 The Architecture of Chromium for a Tiled Display [22]. . . . . . . . . . . . . . . . . . . 374.4 The Architecture of Vizserver [52] . . . . . . . . . . . . . . . . . . . . . . . . . . . . . 384.5 The Architecture of Teravision [54] . . . . . . . . . . . . . . . . . . . . . . . . . . . . 384.6 The Architecture of SGE Software [43] . . . . . . . . . . . . . . . . . . . . . . . . . . 394.7 The Architecture of SAGE [26] . . . . . . . . . . . . . . . . . . . . . . . . . . . . . . . 404.8 The Architecture of XDMX . . . . . . . . . . . . . . . . . . . . . . . . . . . . . . . . . 404.9 Critical Annotated Program Blocks . . . . . . . . . . . . . . . . . . . . . . . . . . . . . 434.10 TightVNC CPU Distribution . . . . . . . . . . . . . . . . . . . . . . . . . . . . . . . . 444.11 TightVNC L2 Cache Miss . . . . . . . . . . . . . . . . . . . . . . . . . . . . . . . . . 45
xi

xii List of Figures
4.12 Improved VNC CPU Distribution . . . . . . . . . . . . . . . . . . . . . . . . . . . . . 474.13 Improved VNC L2 Cache Miss . . . . . . . . . . . . . . . . . . . . . . . . . . . . . . . 484.14 Multi-thread Display Wall Desktop . . . . . . . . . . . . . . . . . . . . . . . . . . . . . 494.15 Time Distribution . . . . . . . . . . . . . . . . . . . . . . . . . . . . . . . . . . . . . . 504.16 FPS at the Display Wall . . . . . . . . . . . . . . . . . . . . . . . . . . . . . . . . . . . 514.17 FPS at the VNC Server . . . . . . . . . . . . . . . . . . . . . . . . . . . . . . . . . . . 514.18 UFP . . . . . . . . . . . . . . . . . . . . . . . . . . . . . . . . . . . . . . . . . . . . . 524.19 CUDA Thread Batching . . . . . . . . . . . . . . . . . . . . . . . . . . . . . . . . . . 544.20 Pixel Bitblt with CUDA in gTiledVNC . . . . . . . . . . . . . . . . . . . . . . . . . . . 554.21 Hextile Encoding Each Block in gTiledVNC . . . . . . . . . . . . . . . . . . . . . . . . 574.22 Performance of Display Wall Desktop Using GPU . . . . . . . . . . . . . . . . . . . . . 58
5.1 Data Path of Sharing Display Content . . . . . . . . . . . . . . . . . . . . . . . . . . . 625.2 The Relationship between Pixels and Data Size . . . . . . . . . . . . . . . . . . . . . . 635.3 Sharing Display Content for One Viewer . . . . . . . . . . . . . . . . . . . . . . . . . . 645.4 VNC Model for Multiple Viewers . . . . . . . . . . . . . . . . . . . . . . . . . . . . . 655.5 MultiStream Model for Multiple Viewers . . . . . . . . . . . . . . . . . . . . . . . . . 65

List of Tables
2.1 Existing Projector-based Displays . . . . . . . . . . . . . . . . . . . . . . . . . . . . . 14
3.1 The RFB Protocol . . . . . . . . . . . . . . . . . . . . . . . . . . . . . . . . . . . . . . 193.2 The SLIM Protocol [50] . . . . . . . . . . . . . . . . . . . . . . . . . . . . . . . . . . 193.3 The THINC Protocol [5] . . . . . . . . . . . . . . . . . . . . . . . . . . . . . . . . . . 203.4 Sample Request Translations of Tarantella [53] . . . . . . . . . . . . . . . . . . . . . . 223.5 The Configuration of the Devices in the Experiment . . . . . . . . . . . . . . . . . . . . 293.6 Comparison between VNC and MultiStream . . . . . . . . . . . . . . . . . . . . . . . . 33
4.1 RealVNC Vs. TightVNC . . . . . . . . . . . . . . . . . . . . . . . . . . . . . . . . . . 424.2 Results of Improved VNC . . . . . . . . . . . . . . . . . . . . . . . . . . . . . . . . . 464.3 Time to Play Back a 120 Seconds Long Video . . . . . . . . . . . . . . . . . . . . . . 524.4 Experimental Configuration in gTiledVNC . . . . . . . . . . . . . . . . . . . . . . . . . 56
5.1 Bandwidth of Devices . . . . . . . . . . . . . . . . . . . . . . . . . . . . . . . . . . . . 625.2 Memory Bandwidth at Rockslcd . . . . . . . . . . . . . . . . . . . . . . . . . . . . . . 625.3 Increasing Trend of Ethernet Network Speed . . . . . . . . . . . . . . . . . . . . . . . . 665.4 The Required Minimum Ratio to Achieve 25 FPS for 28 Viewers . . . . . . . . . . . . . 71
xiii

xiv List of Tables

Chapter 1
Introduction
This chapter presents an overview of the dissertation. First, hyper display and hyper-display based collab-oration are introduced, as well as two problems regarding sharing display content in a scenario. Second,four approaches to sharing display content are demonstrated, and the reasons for using one of the mod-els in the dissertation are presented. Third, the performance problems are addressed, when the chosenmodel is applied in the collaboration. The challenge is to design a high performance platform for hyper-display based collaboration. Fourth, the methodology is demonstrated. Finally, the contributions andorganization of the dissertation are presented.
1.1 Sharing Problems in Hyper-display Based Collaboration
A ”hyper display” is a display device, where the display area is from several times to dozens of timesmore than the area of regular displays for personal computers; even as big as walls or larger. The increas-ing performance and decreasing cost of hardware for graphics acceleration makes it feasible to constructa hyper display. Hyper displays become a possible option for users. They are widely used in collabora-tion, research, simulation, entertainment, visualization and everyday office work. The affordable cost ofhyper displays makes it possible that they can be applied in computer-supported collaborative systems,where hyper displays can implement more visualization space and improve collaboration performance.
A scenario of hyper-display based computer-supported collaboration is described in Figure 1.1, whichuses a hyper display as the collaboration centre. The scenario involves many participants and multipledisplay devices. In this scenario, display content is an important media for communication in the col-laboration. So it is important to efficiently share display content between participants and hyper displaysin the scenario. Users need a way to share their display content. A hyper display also requires a wayto produce high resolution display output for more visualization space. The system is required to sup-port various networks, such as Ethernet networks and wireless networks, and various devices, such asnotebooks and handheld devices. The scenario raises two problems about sharing display content:
1. How is display content shared between users?
2. How is a hyper display driven efficiently?
1

2 Introduction
Hyper Displays
Sharing Display Content at Low Resolution
Hyper Display (Resolution>10
megapixels)
Sharing Display Content at High Resolution
PDA Notebook
Lossless/lossy quality
Figure 1.1: Scenario of Sharing Display Content
The first problem is related to the sharing interface from low resolution displays to multiple devices.Thin clients, such as THINC [5], may be a general solution. However, the devices are required to installsoftware to access the shared content. A more general solution is preferred, which can reuse existingapplications in the devices to view shared display content.
The second problem is related to the consistent output at a hyper display. A hyper display may not bedriven by a single computer directly, especially in the case of high resolution. Throughout the disserta-tion, high resolution is referred to as a resolution of more than 10 mega-pixels which regular computerscan support. Low resolution is less than 10 mega-pixels. The limit was decided according to the resolu-tion of IBM T220/221 [60]. One method of solving this is to drive a hyper display with multiple nodes,where each node outputs part of the hyper display.
The scenario in Figure 1.1 illustrates sharing display content to be a one-to-many sharing model at lossyand lossless quality. There are four possible combinations between low/high resolution and lossless/lossyquality. This dissertation will focus on high resolution with lossless quality and low resolution with lossyquality. Lossless quality is used to drive a hyper display at high resolution over a high speed network.Lossy quality is used to share display content at low resolution over various networks.
1.2 Existing Approaches to Sharing Display Content
In this section, approaches to sharing display content are demonstrated in a hyper-display system, beforeperformance problems are discussed. We divide existing solutions to sharing display content into fourdifferent levels, which are shown in Figure 1.2. The approaches include an application level model,a graphical level model [22], a pixel level model [47], and a hardware level model [54]. The figuredescribes the level structure as well as the comparison of network performance and independence.
An application level model requires that the same copy of one application is installed on each shared

1.2. Existing Approaches to Sharing Display Content 3
2D Libraries 3D Libraries
Using software to read pixel data
Using hardware to read pixel data
Network Performance
Independence
Low
High
High
Low
Figure 1.2: Approaches to Sharing Display Content
computational device. The devices only keep synchronized commands across a network. As a result,we can expect that there are light loads in the network and that the performance is good. However,applications can hardly support different hardware and software architectures. Rewriting applicationssometimes requires access to the source code of the application. The individual copies of the applicationneed to be synchronized, data may need to be exchanged, and user input and other I/O have to be solvedon an application-by-application basis. This may be too complex and time consuming depending on theapplication.
A graphical level model packs and forwards 2D or 3D graphical primitives to the shared devices, whereeach node needs the same existing graphical libraries. The advantage of this model is that there areno modifications for running applications. The model easily supports remote 3D output. For instance,OpenGL [51] as an open source code makes it possible to render 3D visualization content into hyperdisplay. There are many successful projects based on OpenGL, such as Chromium [22]. Applicationsdon’t need rewriting, but for some libraries, they need re-linking. The requirements of access and mod-ification of graphical libraries makes it difficult to develop. Using OpenGL or Chromium will not byitself increase the resolution of the output from an application. To increase the resolution the applicationmust be modified. The dependence on the specific library also limits the range of the model.
A pixel level model which gets display output from a virtual frame buffer is simple. Reading pixels andencoding them are implemented with software in this model. So it is highly independent of applicationsand platforms. For instance, virtual network computing (VNC) [47] is a successful case of the pixel levelmodel, which simply puts a rectangle of pixel data at the specified position of the destination.
A hardware level model involves the use of special hardware to read pixels from the hardware framebuffer directly. The advantage is that it is completely independent of operating systems where sharedapplications run. The disadvantage is that special hardware is used.
Two dimensions can help us to evaluate models: network performance and independence of sharedapplications, as shown in Figure 1.2. Different sharing models can provide different performance and

4 Introduction
independence and fit in with application scenarios. Generally speaking, an application level model willgive the best performance, and a hardware level model gains the most independence.
This dissertation argues that a pixel level model is the best one for the scenario in the hyper-display basedcollaboration because of high independence of shared applications and no need for special hardware.Hyper-display based collaboration needs to reuse existing applications. A pixel level model can supportthis better than the other methods. Since the pixel level model is independent of specific applications, themodel also makes it possible to support various devices. However, the model raises CPU and networkperformance problems, because the model has to deal with a lot of pixels to encode and transmit overa network. We argue that these operations are CPU- and network- intensive so that CPU and networkperformance challenges have to be addressed in the dissertation.
1.3 CPU and Network Challenges Using a Pixel Level Model
A pixel level model makes it possible to construct a cross-platform system to share display content inhyper-display based collaboration. However, one centre node is used, because of one-to-many sharing,to display content of the node to other devices over the network. With increasing resolutions, the ar-chitecture will result in dramatically increasing demand on CPU cycles. For example, if the resolutionin each frame is up to 20 mega-pixels and the targeted frame rate is 25, then about 0.5 giga-pixels persecond will need to be encoded and transferred for one client. Even if those pixels are only copied oncein main memory, it will consume 1 GHz when one memory copy instruction uses 20 cycles in a 64-bitIntel CPU and each pixel occupies 32-bit. About 0.5 giga-pixels per second will consume 2 giga-bytesnetwork bandwidth per second when pixel compression is not applied. This shows that sharing displaycontent is very CPU- and network-intensive. In that case, we need more powerful machines or betteralgorithms. However, the computing performance of applications cannot be gained by simply upgradingthe hardware. The growth pattern of CPU performance has changed from simply relying on increas-ing CPU frequency. The two following laws are used to help us to understand the challenge of sharingdisplay content in a hyper display.
1.3.1 Moore’s Law and CPU Frequency
Moore’s law [33] has described a long-term increasing trend of the number of transistors on a chip. Itstates that the number of transistors on a chip has doubled approximately every two years [23]. Moore’slaw implies the efficient and effective usage of the transistors. Moore’s law is also useful to demonstratethe trend of the capabilities of many digital electronic devices, such as processing speed. The transistorcount can sometimes reflect processing speed. The improvement of CPU frequency will lead directlyto the better performance of CPU-intensive applications. The question is whether processing speed canfollow Moore’s law. In order to demonstrate it, the increasing trend of Intel processing speed is shownin Figure 1.3.
Figure 1.3 shows that the processing speed has doubled every two years from 1994 to 2002. The increas-ing CPU frequency means that CPUs can provide faster computing. One of the driving forces behind thegrowth is the increased computing demands of operating systems and applications [64]. Modern graph-ical interfaces are in need of more CPU cycles. The figure also shows that the rate of increase in CPUspeed decreases after 2002. It is known that the maximum processing speed is still 3.8 GHz in 2009. Itis an interesting phenomenon and it means that computing performance cannot benefit from upgrading

1.3. CPU and Network Challenges Using a Pixel Level Model 5
2
2.5
3
3.5
4
ed (GHz)
0
0.5
1
1.5
2
1994 1995 1996 1997 1998 1999 2000 2001 2002 2003 2004 2005
CPU Spee
Year
Figure 1.3: Intel CPU Speed Trend Since 1994 (Each data point shows that the CPU frequency in oneyear is higher than those in previous years. Source data is gathered from [31, 66].)
CPU directly now. The increasing pattern of CPU performance has changed.
Processing speeds haven’t increased at the same speed as Moore’s law expects. The reason is that thenumber of the transistors is not directly the driving force behind processing speed. Due to increaseddynamic power dissipation and design complexity, it is argued that this trend of processing speed islimited with maximum CPU frequencies around 4GHz [42]. CPU frequencies Higher than 4 GHz willbe unrealized. As a result, Moore’s law will have almost no influence on the processing speed of onesingle core. The increasing transistor number is expressed in more CPU cores in one chip. The founderof startup Tilera believes that a corollary of Moore’s Law is that the number of cores will double every18 months [32]. It shows that Multi-core CPU is an inevitable trend.
It is shown that GPU has started to join in the general computing field, such as CUDA [36] and OpenCL[20]. Graphical processors have become a general-purpose computing device from a special-purposehardware acceleration. At the moment, GPU can provide more cores in one chip than CPU. For exam-ple, there are 480 cores in GTX 295 [37]. Many-core GPU has provided another solution to improvecomputing performance [48, 65].
1.3.2 Amdahl’s Law and Parallel Speedup
The increasing pattern of performance has changed into multiple or many cores. As a result, one appli-cation cannot benefit from multi-core CPU or many-core GPU directly. It means that applications mustbe aware of multiple or many cores architectures to get better performance. Applications, which stopscaling with Moore’s Law, either because they lack sufficient parallelism or because their developers nolonger rewrite them, will be evolutionary dead ends [28]. Sequential applications have to be rewrittento gain the improvement. Awareness of multi-core or many-core for applications will increase the com-plexity of program design. Even if a parallel application has been implemented, it is still a problem toknow what the maximum speedup factor that we can gain is. Amdahl’s law [4] is introduced in order toexplain it.

6 Introduction
Amdahl’s law shows that the speedup factor of one application is subject to the sequential part. Thespeedup is limited even with unlimited processors. The law is used to find the maximum expectedimprovement to an overall system when only part of the system can be parallel. It is often used inparallel computing to predict the theoretical maximum speedup using multiple processors. The speedupof multi-core CPUs can be described with the equation as follows, where N stands for the number ofprocessors and f stands for parallel portion.
Speedup =1
(1− f) + fN
The limit of Speedup is as follows:
limN→∞
Speedup = limN→∞
1
(1− f) + fN
=1
1− f
Figure 1.4: Amdahl’s Law
The speedup factor can be illustrated as in Figure 1.4. When f = 95%, limSpeedup = 20. It shows thatthe maximum speedup factor depends on the parallel part of applications and the number of processors.It is difficult to get a high speedup factor. Only when the parallel portion is 100% is the speedup equalto the number of processors. Unfortunately, sharing display content in a hyper display is not that case.In our scenario, Ethernet network is a sequential part using a pixel level model. This leads to a limitedspeedup factor. According to our experience, speedup factor is less than 2 when a 4-core CPU is used.This law gives us the following lessons. An application has to use techniques such as multi-threadingto make use of multiple cores, and the application must minimize the proportion of the sequential part.For sharing display content, the proper pixel number for tiled display will be selected carefully for betterperformance.
The two above discussions show that it is necessary to improve software of sharing display content forbetter performance from hardware. The discussions guide us to evaluate and improve the performanceof a hyper display at lossless quality.

1.4. Methodology 7
1.4 Methodology
The methodology used in this dissertation follows the process of problems, models, prototypes, evalua-tion and discussion. It begins with the existing problems. In order to overcome them, ideas or models canbe produced from general observations. Then prototype systems are developed according to models, andexperiments are evaluated to verify the models. The discussion of the results may cause new problems,which will lead to a new research cycle.
Two architectures are used to answer the two questions about sharing display content in the dissertation.One is a decentralized architecture, MultiStream, to use video streaming to share display content for lowresolution clients. Clients can view shared display content with a media player. This is based on theobservation that devices usually support video streaming. Another is the VNC architecture to build ahigh resolution desktop for hyper displays.
The experimental platform includes a 28-node display wall cluster, a video server, a server for displaywall desktops and a laptop. Evaluation metrics include resource consumption, such as CPU and networkusage, and performance of viewing display content, such as the frames per second that users can have.
A series of experiments were conducted to document the performance characteristics of MultiStreamand display wall desktops. For MultiStream, we measured the frame rate of 3DMark with and withoutconcurrently encoding a video of the display output from 3DMark. We measured the CPU, memory, andnetwork load on the video server increasing the number of clients from 28 to 560. We also measured theCPU load of the VNC server, while playing back videos, increasing the number of clients from 1 to 4 forVNC. For the high resolution display wall desktop, we profiled two VNC implementations, RealVNCand TightVNC, and chose the one with the higher frame rate for further improvements. We benchmarkedeach improved version, playing back two videos at 3 mega-pixels and 6.75 mega-pixels on the displaywall, and compared them with the chosen one.
1.5 Contributions
1.5.1 Principles
Normal Desktop Usage of VNC and MultiStream
1. For a centralized, pull-model, non-distributed architecture (such as VNC), where the applicationsand the encoding server are on the same node. We claim that:
(a) NetworkIt is possible both in principle and in practice for network bandwidth to support tens of clientswith standard resolution desktop with emerging network technology.
(b) ProcessingIt is impossible both in principle and in practice to support tens of clients with standardresolution desktop using a single core CPU. Multi-core CPUs or many-core GPUs must beapplied to achieve it.
2. A decentralized, push-model, distributed architecture (such as MultiStream), where the applica-tions and the encoding server share the computer and where the distribution servers use multiple

8 Introduction
computers to share display content, we claim that:
(a) Network
It is possible in principle and in practice for MultiStream using 1 Gbit Ethernet network tosupport hundreds of clients today, and thousands with emerging network technology.
(b) Processing
It is possible in principle and in practice for MultiStream to be handled with one single coreCPU to support hundreds of clients today.
Principle for High Resolution Display Wall Desktops
The X VNC server is a centralized, non-distributed architecture. The difference compared with a normaldesktop is that the resolution of a high resolution display wall desktop has more than ten times theresolution of a normal desktop.
1. Network
It is impossible in principle and in practice to drive a tens of mega-pixels display wall desktopat 25 FPS without using compression and with 1 Gbit Ethernet network. It is possible in princi-ple to support it with emerging network technology. It’s possible in principle to support it withcompression today.
2. Processing
It is impossible in principle and in practice to drive a tens of mega-pixels display wall desktop at 25FPS with a single core. It is possible in principle to drive it at 25 FPS with emerging technology.
1.5.2 Model
1. MultiStream model is a cross-platform solution for sharing display content over various displaydevices. It is designed to share display content over devices with architectural and performancedifferences. MultiStream model is a decentralized architecture, including live streaming producers,streaming servers and live streaming consumers. Display content is encoded as continuous videostreaming, and a video server processes and distributes customized or fixed rate videos to viewers.By using standard media players and video stream formats we reduce or avoid several of thesecomplexities and performance bottlenecks. High compression ratio and the separated server nodesimprove the scalability of sharing display content.
2. VNC model is a centralized architecture to use an X VNC server desktop environment as a highresolution display wall desktop. The virtual frame buffer is in memory, which means that theresolution is only limited by available memory. Because of high resolution, the desktops areCPU- and network- intensive to achieve a high frame rate using VNC. Several changes to VNCarchitecture and implementation are made in order to overcome this. The changes include usingthe Intel SIMD instruction set to parallelize pixel movement, changing VNC to a multi-threadarchitecture and using GPUs.

1.5. Contributions 9
1.5.3 Artefacts
There are four systems presented in this dissertation.
1. MultiStream: MultiStream is developed as a cross-platform sharing of display content at low res-olution. MultiStream is implemented with FFmpeg [18] which is a cross-platform tool to streamvideo and audio. Sharpshooter is one prototype of producers implemented by us, which is de-veloped with visual C++. Sharpshooter supports display sharing of desktop and 3D applications.Streaming server is a video HTTP server. Standard media player is used as live streaming con-sumers.
2. Tuning VNC: Tuning VNC is developed to improve the performance of VNC. First we profiled,measured and compared the performance of two existing implementations of the VNC model,TightVNC [63] and RealVNC [2], when playing back a 3 megapixel and a 7 megapixel video.Then we selected the best performing implementation, TightVNC, and modified it by using theIntel SSE2 instruction set to speed up data movement, and by using assembler language to speedup the encoding of the pixels.
3. Multi-thread VNC (TiledVNC): TiledVNC is developed to better adapt VNC to a display wall andimprove performance over an existing implementation, TightVNC. The changes include multi-threading, a server push update protocol, and pushing updates for the same frame to all viewers.Multi-threading is implemented with POSIX threads [11].
4. GPU VNC (gTiledVNC): GPU VNC is developed to allow use of a GPU to improve the perfor-mance of VNC. Running parts of the VNC server on a GPU can potentially increase the perfor-mance by taking advantage of the highly parallel architecture of the GPU. GPU VNC has beenimplemented, where zero-copy buffer is used as virtual frame buffer on integrated GTX 295. Pixelencoding and the operations related to virtual frame buffer are implemented on the GPU usingCUDA.
1.5.4 Claims
• A universal and simple display method using media player to display the shared content.
• A new approach to using media players to display content on display wall. Multiple output ofmedia players can be put together into a seamless desktop.
• A new approach to evaluate performance of high resolution desktop by playing videos, where theimprovement has been implemented according to the results of the evaluation.
• It is shown that high resolution desktop is presently a computing-intensive application. It uses pixelcompression to reduce the requirement of network bandwidth. The bottleneck at high resolutiondesktop is image update and pixel encoding.
• A high resolution desktop is a highly computing-parallel application, because connections areindependent of each other. It makes it possible to improve the performance of a high resolutiondesktop.

10 Introduction
1.6 Organization of Dissertation
The rest of the dissertation is organized as follows.
Chapter 2: This chapter presents hardware and software for low resolution and high resolution in hyperdisplays. The chapter demonstrates hardware configuration of a display wall, which is one of hyperdisplays. The advantages and disadvantages of a display wall are discussed. Software for a display wallis introduced. A pixel level model at Tromsø display wall is demonstrated.
Chapter 3: This chapter discusses the case of sharing display content from low resolution displays toother devices. The problems of sharing display content at low resolutions are presented. The architectureof MultiStream is demonstrated, where the universal video format is used to simplify client applications.According to the evaluation results, multiple video streams are efficient to support more than 500 clientsconcurrently. The chapter also makes a comparison of MultiStream model and VNC model.
Chapter 4: The chapter describes how to drive a display wall as a high resolution seamless display.The architecture of a high resolution desktop is presented, based on the VNC protocol. Developmentplatform decision is demonstrated by comparing TightVNC and RealVNC. The improvements are im-plemented with instruction level parallel, a multi-thread architecture, and computing using GPU. Theperformance of the improvement is evaluated. It shows that using a multi-thread architecture gave thebest performance.
Chapter 5: The chapter discusses the research line for sharing display content. In order to demonstratethe performance problems regarding sharing display content, two models, MultiStream model and VNCmodel, are described. By two evaluation equations, we discuss whether it is possible to achieve sharingdisplay content at the targeted frame rate (25 FPS) with compression or without compression.
Chapter 6: The chapter summarizes the dissertation, and the contributions are listed.
Chapter 7: The chapter lists some possible ideas for future work.
Appendix A contains the published papers, and one unpublished paper is in Appendix B.

Chapter 2
Hardware and Software for Low and HighResolution
2.1 Default Displays
A default display is related to a personal computer or a hand-held device, which is usually low resolutionand small display size. Because of the difference and dispersion of default displays, a general solution tosharing display content is preferred. There is existing software for sharing display content from a defaultdisplay to other display devices. For example, VNC is designed as a cross-platform protocol to sharedisplay content, which supports sharing of display content from one to many devices. The advantage isthe independence and thin-client due to using a pixel level model. The disadvantage is that software hasto be installed and differences between devices are ignored.
2.2 Hyper Displays
2.2.1 Introduction
A hyper display can be built with single or many monitors and projectors, including single-monitordisplays, single-projector displays, monitor-based displays and projector-based displays. The first twotypes are usually low resolution.
LCD (Liquid Crystal Display) has become mainstream for single-monitor displays. It is possible forsingle display devices to create enough display area for collaboration. But it is difficult for LCD toproduce hyper displays at high resolution. One of the most display sizes is 108-inch display producedby Sharp, whose display area is up to about 3.2 m2 [3]. The maximum resolution of that LCD displayis 1920 × 1080 pixels, about 2 mega-pixels. However, it is low resolution. The 108-inch LCD costsup to about $100,000. It shows that too much money is paid on low resolution. In contrast, one of thehighest resolutions supported by 22-inch IBM T220/T221 [60] is up to 3840×2400 pixels. It costs about$10,000.
Single projectors can be used widely in teaching and collaboration. The types of projectors include
11

12 Hardware and Software for Low and High Resolution
slip projectors, video projectors, movie projectors, and so on. For computer based collaboration, videoprojectors are used to project the output from personal computers for other people to view. It is possiblefor a single projector to build a high-resolution hyper display. For example, JVC has produced a 10megapixel 4K projector, and JVC announced a 32 megapixel 8K projector in 2008 [57]. One 4K projectorcosts about $150,000. The distance between screens and projectors will have an impact on image quality.
A monitor-based display is when multiple monitors are attached to one computer or cluster. A typicalscenario is one personal computer with two monitors, which can be directly supported by operatingsystems. Now manufacturers have provided one extra monitor on notebooks. NVIDIA workstation cansupport multiple monitor output directly. Czerwinski [15] claimed that as many as 20% of Windowsoperating system users ran multiple monitors from one PC or laptop. There are also some hyper displaysat high resolution using multiple monitors. A monitor-based display is created successfully with 8x317-inch LCD monitors, whose resolution is about 32M pixels in total [68]. However, monitor-baseddisplays are not seamless displays.
A projector-based display is an effective and affordable way to achieve a hyper display at high resolu-tion, using multiple commodity projectors and computers. Projectors are tiled together for a seamlessdisplay. It is scalable for projector-based displays so that it is possible to build unlimited resolutions[25]. Projector-based displays can be divided into planar displays, curved displays and dome displays[27] according to the geometry surface of a hyper display. Curved displays provide a wider field of viewthan planar displays [59]. They create a more immersive visual.
Much research has shown that there are some advantages of hyper displays: (1) Hyper displays canprovide improvement of performance for users, such as information navigation [34, 61, 62, 68]. It isshown that performance was more efficient and more accurate because of the additional data; (2) Userscan benefit cognitively from hyper displays [15]; (3) Hyper displays help to eliminate gender bias [15].
2.2.2 Display Walls
A display wall is a kind of cluster-based tiled display. Specifically, it belongs to a planar projector-baseddisplay, where the projection screen is planar. It is reported in [30] that techniques and applications wereused to build cluster-based tiled displays. There are comprised of a cluster, a projector matrix and awall-size projection screen. Each projector is driven by one node connected to one projector. A displaywall is committed to construct an economic and scalable display platform, because the cluster platformuses commodity hardware at economical cost.
Projectors are physically aligned into a matrix and rear-projected onto a projection screen. The projectorsare tiled into an N ×M matrix, where N and M are two dimensions of the projector matrix. N ×Mis the total number of the projectors. The projector matrix will help to build a seamless display screenby physical position configuration of the matrix. All the projectors will project the display content fromthe node attached to each projector into a wall-size display. There is a software control mechanism ina display wall, by which unified display content is formed. One tile is referred to as one display areaprojected by one projector at the display wall. Each tile has w× h pixels, where w and h are resolutionsof width and height respectively. The number of pixels of the display wall is W × H in total, whereW = (N × w) and H = (M × h).
About ten years ago, it was expensive to build projector-based displays. The displays were only consid-ered in a limited number of institutes, due to the extremely expensive infrastructure. For example, paper

2.2. Hyper Displays 13
Figure 2.1: A 22 Megapixels Tromsø Display Wall
[49] presented a 2x2 tiled high resolution projector-based display wall using a pair of SGI Onyx2 visu-alization servers with several Tbytes of fiber-channel disk storage. Professional hardware of SGI infinityReality would cost more $1 million. A detail cost comparison was presented between projector-baseddisplays using professional infrastructure and cluster-based tiled displays in [7]. It is shown that it ismore affordable to use cluster-based tiled displays now.
In addition to scalable resolution and lower cost, one advantage is that a cluster can make a display walla more flexible hardware upgrade strategy. It is easy for a cluster to update some graphical cards orupgrade nodes for better performance. Each node of the cluster is usually equipped with a powerfulgraphical card. Those graphical cards can be used to implement parallel rendering for 3D applications.
There are some disadvantages of using a display wall. It is difficult for a display wall to automaticallyconstruct distributed projectors together and produce one uniformity of brightness and colour because ofdistributed tiles. However, there are some existing solutions to this. Automatic calibration [69] has beendeveloped to reduce difficulty for the configuration of tiled display. The hyper display uses augmentedprojectors, where a camera is attached to each projector. Automatic calibration uses cameras to provideon-line close-loop control. Paper [8] used a special chip to produce the same illumination and colour.Another disadvantage is that a 1 Gigabit network is usually served as a cluster network and will probablylead to a bottleneck for visualization applications because the maximum network bandwidth is limited toaround 100 MB.
Tromsø Display Wall
One display wall used in Tromsø is a high resolution hyper display. There are 29 nodes to together drivethe display wall. 28 projectors are used to project the output from 28 nodes, and the 29th node is usedas a server node in the display wall cluster. The network is a switched Gigabit Ethernet. Each node isa Dell 370s workstation, which includes Intel Pentium 4 EM64T at 3.2 GHz, 2GB RAM and NVIDIAQuadro FX 3400 with 256 MB VRAM.
The Tromsø display wall is shown in Figures 2.1 and 2.2. Figure 2.1 shows an example of the projectionscreen, which is equivalent to a 230-inch display device. Figure 2.2 describes a physical hardwareconfiguration. There is a 7 × 4 matrix of projectors at our display wall, with 1024 × 768 pixels per tilegiving in total almost 22 mega-pixels. The area of the display wall is 18 m2.

14 Hardware and Software for Low and High Resolution
Figure 2.2: The Architecture of a Tromsø Display Wall. Each projector is plugged into a computer thatdisplays one tile of the desktop.
Hyper Displays Projectors Size(m2) Mega-pixels Used ForPowerWall [39] 4 4.5 8 Scientific visualization, images
Infinity Wall [14] 4 10 3 Virtual RealityScryer [25] 15 36 23 Stingray image API
Toronto Display Wall [6] 10 13 ScaleViewDisplay wall [55] 6 15 4.8 Foveal inset
Princeton Display Wall [12] 24 13.4 18 Image viewer, parallel renderingCalifornia Display Wall [7] 9 7.4 7 High resolution images
Tromsø Display Wall 28 18 22 2D X desktop, AutoSim [1]
Table 2.1: Existing Projector-based Displays
The Tromsø display wall was built in 2004. Each node cost about NOK 15,000, and the cluster costNOK 435,000. Each projector was Dell 4100MP projector. Each projector cost around NOK 15,000,and about NOK 420,000 was spent on display wall projectors in total. The whole display wall cost aboutNOK 1,000,000, or $17,000, including other devices, such as the back-projecting screen with frame. Allcosts occurred in 2004, and the same prices can buy higher performance hardware and build a betterdisplay wall now.
2.2.3 Software at Display Walls
The usage of a display wall includes indirect use and direct use. Indirect use refers to applications thatrun outside the display wall cluster, such as from personal computers. The display content is shown onthe display wall. That means that an interface has to be provided at the cluster. By the interface, thedisplay content from default displays can be shared on the display wall. In contrast, direct use meansthat applications run inside the cluster directly. Both of them need 2D and 3D visualization.

2.2. Hyper Displays 15
Due to the distribution of tiled displays, it is difficult to drive a display wall directly. There are variousdifferent application platforms on display walls for 2D and 3D visualization, as shown in Table 2.1. Itshows that no standard solution to 2D and 3D visualization is available for a display wall. Each of themdevelops their own visualization and interaction systems.
On a display wall, 2D visualization at a pixel or hardware level can be used for both direct use andindirect use. For example on our display wall, a media player can show the display content from personalcomputers or the display wall.
3D visualization is one important application type, because of the large display area and many powerfulgraphical cards on a display wall. At a graphical level, there are two main types of 3D visualization ondisplay walls, based on OpenGL and scene graph. Both of them can be used directly or indirectly.
OpenGL
OpenGL (Open Graphics Library) is a standard specification, which is a cross-language, cross-platformAPI to write graphical applications. The interface consists of over 250 different function calls which canbe used to draw complex three-dimensional scenes from simple primitives. OpenGL is an immediate-mode API.
The open source makes OpenGL easy to extend applications to run in tiled displays, such as WireGL [9]and Chromium [22]. These studies can help us to extend display wall applications to 3D visualization,even for huge scenes. Our display wall desktop is currently 2D visualization. Chromium has workedwith VNC viewers [45]. It is possible for our desktops to use Chromium to support 3D visualization.
Scene-graph
Scene graph is referred to as a data structure which arranges the logical or spatial representation ofgraphical scenes. Scene-graph will gain better network performance because geometry dataset resides ateach node. The OpenSceneGraph [10] is an open source, cross-platform, high performance 3D graph-ics toolkit, which is written entirely in Standard C++ and OpenGL. Clustering is supported nativelyin OpenSceneGraph. Each node in a cluster will run a copy of scene graph data and synchronizationis communicated with broadcast or multicast. AutoSim [1] is a car driving simulator system based onOpenSceneGraph. We have a visualization application using the AutoSim database in the Tromsø displaywall.
2.2.4 Pixel Level Architecture on the Tromsø Display Wall
A high resolution hyper display is desired on the Tromsø display wall. We also want to reuse existing2D applications on our display wall. These two requirements make us use a pixel level model to drivea high resolution seamless display desktop. The pixel level architecture is demonstrated in Figure 2.3,which illustrates how a high resolution display is driven by sharing pixels from a frame buffer over thenetwork.
The secret of a high resolution desktop comes from a virtual frame buffer. A frame buffer is referred

16 Hardware and Software for Low and High Resolution
Server Node running Applications
Resolution <= 22 MB pixels
1 Gb Network
Resolution: 1024 x 768 Resolution: 1024 x 768
Resolution: 1024 x 768 Resolution: 1024 x 768
H=4x768
W=7x1024
Figure 2.3: The Pixel Level Architecture for the Tromsø Display Wall
to as a video output device containing a complete frame of pixel data. A frame buffer can be a virtualdevice which resides in the main memory. In that case, the buffer is called a virtual frame buffer, and theresolution will not be subject to the maximum resolutions of graphical hardware. On our display wall,pixels of the virtual frame buffer in one centre node are read and transferred to the tiles on the displaywall. The pixel level architecture supports the running of existing applications without modification. Sothe architecture is independent of specific applications. That also results in a thin viewer at the tiles,where pixels are received and displayed simply. There is no need for input from tiles.
In Figure 2.3, the resolution of each tile is fixed on our display wall: 1024× 768 (0.75 mega-pixels). Sothe display wall with 28 tiles has 22 mega-pixels in total, and that resolution is the same as the resolutionof the virtual frame buffer in the server node. The possible maximum resolution of the display wall issubject to the projectors and graphical cards. When we want to increase the resolution of a seamlessdisplay wall, the resolution of each tile and the virtual frame buffer will be adjusted correspondingly.
The implementation of the architecture is required to decide whether a pull mode or a push mode is used.A pull mode is a passive mode, and the server only responds to requests. A push mode is an active mode,and the server decides when pixels are sent to tiles.
An X VNC server is used to implement the pixel model architecture. The VNC server uses a 22 mega-pixels virtual frame buffer, where the resolution is equal to the total resolution of the tiles on the displaywall. The server uses a passive request mode to respond to the request of pixel update from the tiles.Each tile only requests corresponding pixel content in the virtual frame buffer from the server.
When an application needs to produce display output to the frame buffer at the centre node, the serverfor sharing pixels needs a notification mechanism for update information. There are a few different waysto get information about an update on the frame buffer. When an X VNC server is used, it is simple toknow update information from the related graphical primitives called when the virtual frame buffer isupdated.

Chapter 3
Low Resolution Display Content ViewingBy Many Clients
3.1 Introduction
With the development of hardware technology, the number and diversity of personal computational de-vices (PCs, laptops, PDAs, etc.) is increasing. As a result, this increased dispersion of personal devicesresults in an increasing need for the dynamic sharing of information and computational resources as usersmove between different networked environments where they want both to interact and to make use ofavailable devices. Disks, printers, and projectors are well established examples of devices that need tobe shared.
Those devices have to also be supported in hyper-display based collaboration systems, because moreusers start using multiple devices and the number of individual participants increases at display walls.They have a strong willingness to use their own devices to access or share information. However, al-though the various devices hold the requirements of different users, they also cause complexity of shar-ing between them. For distributed collaborative environments, there is a need also to share displaysdynamically among a wide range of display resources ranging in size from PDAs to large tiled displaywalls.
In our own working environment we experience this need as researchers collaborate locally and remotelyusing personal and shared devices including laptops, PDAs, and a large tiled display wall for sharedvisual access. It’s believed that this represents usage scenarios that offer wider applicability than justcomputer science researchers.
Low resolution is less than 10 mega-pixels, which is based on the resolution of IBM T220. Most personaldisplay devices belong to low resolution. In fact, the resolutions of personal computers are around 2mega-pixels. When one client views the shared display content at 24 FPS and 2 mega-pixels per frame,CPU cycles can support it. Memory usage can be afforded, because personal computers are usuallyequipped with 2 GB main memory. If the number of clients increases, sharing display content willconsume more CPU, memory, and network. The scenario raises several issues:
1. Which model of sharing will support the needs for collaborative work in the environment of these
17

18 Low Resolution Display Content Viewing By Many Clients
technologies?
2. What will be an adaptable architecture to support the model?
3. What is the performance of the model, such as bandwidth and scalability?
3.2 Related Work
Microsoft Remote desktop uses Remote Desktop Protocol (RDP) [13] to provide users with a remotegraphical desktop. RDP, as an extension of the ITU T.120 family of protocols, is a protocol basedon multiple channels. RDP supports separate virtual channels to transfer device communication dataand graphical data from the server. RDP servers have their own video drivers, keyboard drivers, andmouse drivers. The protocol is to pack the graphical information and send them over the network inRDP servers. RDP clients receive graphical data and interpret the packets into corresponding MicrosoftWin32 graphics device interface API calls. Mouse and keyboard events are redirected from clients to theserver. It supports encrypted data of client mouse and keyboard events.
Virtual Network Computing (VNC) [47] is designed as a graphical system to support the access to theremote graphical interface. VNC uses the RFB protocol [46], which is a simple protocol for remoteaccess with key/mouse interaction. The messages of the RFB protocol are described in Table 3.1. TheRFB architecture uses the remote frame buffer protocol to implement a desktop sharing system, shownin Figure 3.1. It relays the graphical screen updates back over a network. Each VNC client is drivenby event triggering. It transmits the keyboard and mouse events. However, the shared applications arerequired to run in VNC environments.
Figure 3.1: The VNC Architecture [46]
SLIM (Stateless, Low-level Interface Machine) [50] is designed as a low-level hardware- and software-independent protocol, which distributes the computational resources to users-accessible devices overa low-cost network. The SLIM architecture is comprised of the interconnect fabric (IF), the SLIMprotocol, the consoles, and the servers, as shown in Figure 3.2. The IF is a dedicated connection used as aprivate communication medium to provide high interactive performance. The server provides computingresources to users. In addition to this, the server has daemons for authentication management, sessionmanagement and remote device management. The SLIM protocol is described in Table 3.2. The console
3.2. Related Work 19
Messages Message Type DescriptionSetPixelFormat Client to Server Set the pixel formatSetEncodings Client to Server Set the encoding types of pixel dataFramebufferUpdateRequest Client to Server Request a regionKeyEvent Client to Server A key event of a key press or releasePointerEvent Client to Server A pointer eventClientCutText Client to Server Send the content in the cut bufferFramebufferUpdate Server to Client Send the update to the clientSetColourMapEntries Server to Client Send the colour mapBell Server to Client Ring a bell on the clientServerCutText Server to Client Send the cut buffer to the client
Table 3.1: The RFB Protocol
Command Type DescriptionSET Set literal pixel values of a rectangular regionBITMAP Expand a bitmap to fill a rectangular regionFILL Fill a rectangular region with one pixel valueCOPY Copy a rectangular region of the frame buffer to another locationCSCS Colour space convert rectangular region from YUV to RGB
Table 3.2: The SLIM Protocol [50]
is simply a dumb frame buffer. It receives display primitives, decodes them, and hands off the pixels tothe graphics controller. SLIM was implemented as a virtual device driver in the X11 server, where all Xapplications can run without modification. SLIM uses the UDP/IP protocol to transmit SLIM protocolbecause the interconnect fabric is reliable. The experimental result shows that a SUN Ray 1 consolecan support a 720x480 video at 20Hz. Quake can be played at 480x360. The problem is that there is nopixel compression in SLIM, which only uses some basic compression methods, such as copy and bitmap.SLIM depends on a high reliable networking, which cannot be applied in an Ethernet network.
Figure 3.2: Major Components of the SLIM Architecture [50]
THINC [5] is designed as a remote display system for high performance thin-client in both LAN and

20 Low Resolution Display Content Viewing By Many Clients
Command Type DescriptionRAW Display raw pixel data at a given locationCOPY Copy frame buffer area to specified coordinatesSFILL Fill an area with a given pixel colour valuePFILL Fill an area with a given pixel patternBITMAP Fill a region using a bitmap image
Table 3.3: The THINC Protocol [5]
WAN networking. The THINC architecture adopts a thin-client server-push model. The server will main-tain all persistent state. The server pushes the display updates only when the display content changes.The server-push method is supposed to maximize display response time. THINC is located in the videodevice abstract layer above the frame buffer. The translation primitives are described in Table 3.3 fromdisplay draw requests to the THINC protocol. A command queue is used for each client. The commandsare distinguished between opaque and non-opaque commands in the queue. The former can be overwrit-ten by the previous commands, but the latter cannot. The queue guarantees that there is no overlap amongopaque commands. So a command has to be checked when it is inserted into the command queue. Inorder to protect from blocking of the server, a per-client command buffer based on the command queueis used. A multi-queue Shortest-Remaining-Size-First (SRSF) preemptive scheduler is used to flush thecommand buffers, where remaining size required to deliver to clients is used as the scheduler criterion.In addition to this, a real-time queue is used for the high interactivity requirement. The command bufferswill be flushed in increasing queue order. THINC uses an off-screen drawing awareness mechanism.Drawing commands related to offscreen memory are tracked. The commands which affect the displayare sent over networks when offscreen data are copied to the display. It also supports YUV pixel formatsin order to save network bandwidth and utilize client hardware speedup. A prototype THINC server isimplemented in Linux as a virtual video device driver, which can work with all X servers. RAW com-mands are the only commands applied to additional compression with PNG [44]. THINC uses XVideoextension to export YV12 format to application. Audio uses a virtual ALSA audio device to interpretaudio data over networks. RC4, a streaming cipher, is used to improve network security.
Frame Buffer
THINC video driver
Window System
THINC Server
A Real-time Queue
Scheduler
SRSF Scheduler
Figure 3.3: The THINC Architecture
Tarantella [53] is an adaptive Internet protocol (AIP) system, which is designed to support remote users

3.2. Related Work 21
across networks with various network bandwidth and latency. Tarantella adopts a client-server architec-ture, as shown in Figure 3.4. The term ”engine” in the figure refers to a process or method. The serveris made up of five engines: administrative, data store, status manager, session manager, and protocol.The administrative engine is to publish applications and documents to users and manage user profile andsessions. Status manager engine, as the first engine when the system starts up, provides initialization andcontrol of the other server engines. Data store engine is an interface to data store, which stores infor-mation regarding services, network devices, user and application data. Protocol engines are to translatestandard protocols, such as X window protocol, into AIP protocol. The translation sample from X win-dows to AIP is given in Table 3.4. Display engine as Java applets can be downloaded on demand byclients, which renders the application onto the client displays and provides interaction for users. Sizesof display engines are usually around 200 KB, which makes display engines quickly downloadable overlow-bandwidth networks. When a client accesses the web server, the boot-strap applet is downloaded ondemand, which connects with the data store engine by the login applet. If authentication is successful,the webtop is given to the client. The webtop is a web desktop with different application icons. After oneicon is chosen, the corresponding display engine is downloaded on demand. Each display engine willdo several tests to determine display operations and display performance factor on the client display. Itsupports different compression methods according to this information. For example, run length encod-ing (RLE) is used if the request contains text or an image. If the bandwidth is less than 300 KB/s, Z-libcompression is applied.
Web Browser
X Windows Applications
Windows Applications
Character-based
Applications
Data Store Engine
Status Manager Engine
Session Manager Engine
Protocol EnginesData
Store
Administrative Engine
WebPages Store
Web Server Boot-strap applet
Login applet
Webtop
Figure 3.4: The TARANTELLA Architecture [53]
NoMachine’s NX [38] is designed as an X proxy, which can improve the performance of the native Xprotocol with the encryption support. The NX architecture is described in Figure 3.5. This architecturecontains two NX components: NX proxy and NX agent. NX proxy is used to translate between the Xprotocol and the NX protocol. NX proxy supports three basic methods, compression with ZLIB, cachingfor X traffic and round trip Suppression. NX agent is used to avoid most round trips for the X traffic.NX uses SSH to build a secure connection between a server and a client. It provides near local speed
22 Low Resolution Display Content Viewing By Many Clients
X11 Windows Request AIP Requests ExplanationChangeGC - Set Fore-ground Colour Polyline
AIP SETFGAIP POLYLINE
Simple polyline requiresonly foreground colour
ChangeGC - Set dashedline style Polyline
AIP POLYSEGMENT Dashed lines are drawn as aseries of line segments
ChangeGC - Set line widthto 10 Polyline
AIP POLYFILLRECT Wide lines are drawn as aseries of filled rectangles
ChangeGC - Set Solid FillPolyFillRect
AIP SETFILLSTYLEAIP POLYFILLRECT
Simple fill request executeddirectly
Table 3.4: Sample Request Translations of Tarantella [53]
application responsiveness over high latency, low bandwidth links [19]. The NX proxy can achieve evena 1:1000 compression ratio.
NX proxy Client
NX Agent
X Client X
Server
NX proxy Server
SSH networking
X protocol
X protocol
NX protocol NX protocol
Figure 3.5: The NX Architecture [19]
Low-bandwidth X (LBX) [17, 41] is designed as an X proxy server, which provides an X environmentover low bandwidth and high latency networks. An example of the LBX system is given in Figure 3.6,where a LBX server and a LBX proxy are included in the LBX system. Regular X applications accessthe LBX server via the proxy. The LBX architecture is described in Figure 3.7, where the X requestsundergo several compression methods. One of them is short circuiting because there are small requestsfor unchanging information from the server, such as the predefined atom list and pixel allocation forcommon colours. Short circuiting will change these synchronous requests into asynchronous requests,even eliminating these requests with cached data in the proxy. By re-encoding the X protocol, the amountof data can be reduced before they are passed to a general stream compressor. One type of re-encodingis image data re-encoding, which is lossless image compression techniques used in the LBX system,such as RLL encoding for multi-bit images. The LBX server is implemented as an X extension insteadof a completely new protocol of LBX. The LBX proxy uses the X server code for networking, requestdispatching and authorization. Keith [40] argued that there has never been a significant effort to widely

3.3. Motivation 23
deploy it as LBX is only able to slightly improve application performance over slow network links.
Figure 3.6: An Example of the LBX System [41]
Figure 3.7: The LBX Architecture [41]
3.3 Motivation
3.3.1 Device Polymorphism
Sharing display content has another challenge in addition to the requirement of bandwidth. Most appli-cations are designed for specific platforms. In particular, 3D applications heavily depend on graphicslibraries in one specific platform, which are not cross-platform. However, there are many differencesbetween the platforms, such as hardware and software architectures. The big differences lead to devicepolymorphism.
Device polymorphism refers to whether a general interface can be found to share a display in various
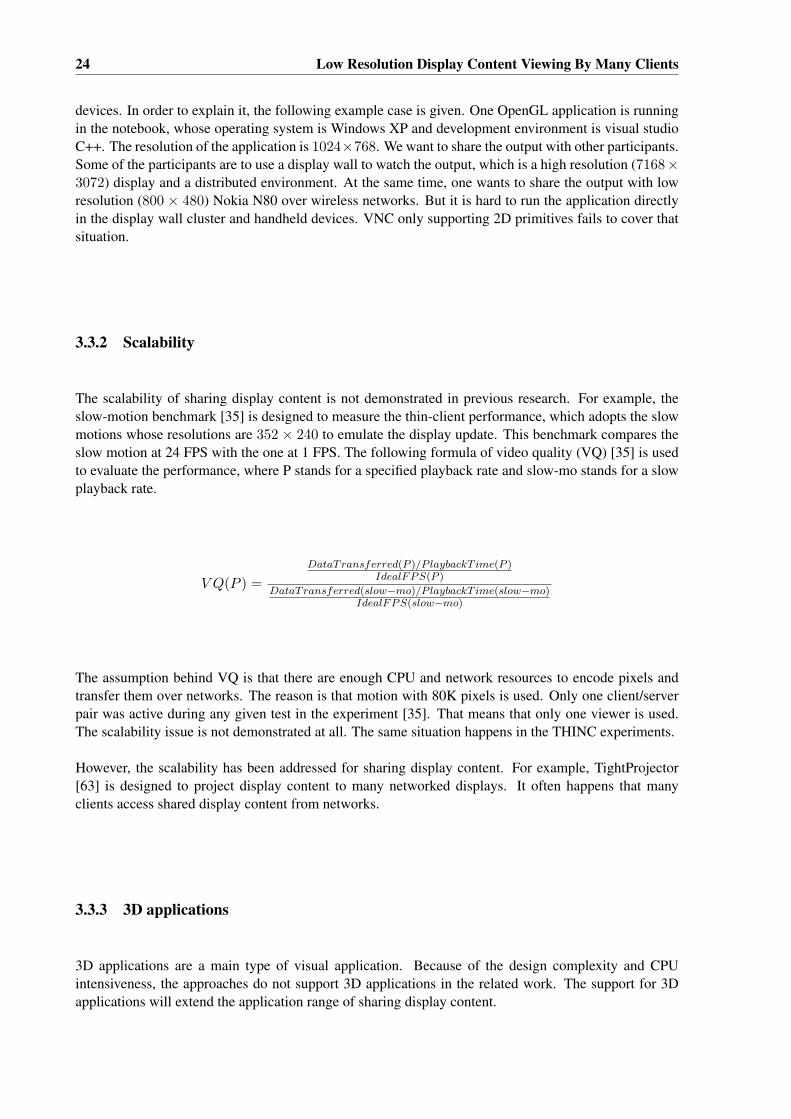
24 Low Resolution Display Content Viewing By Many Clients
devices. In order to explain it, the following example case is given. One OpenGL application is runningin the notebook, whose operating system is Windows XP and development environment is visual studioC++. The resolution of the application is 1024×768. We want to share the output with other participants.Some of the participants are to use a display wall to watch the output, which is a high resolution (7168×3072) display and a distributed environment. At the same time, one wants to share the output with lowresolution (800 × 480) Nokia N80 over wireless networks. But it is hard to run the application directlyin the display wall cluster and handheld devices. VNC only supporting 2D primitives fails to cover thatsituation.
3.3.2 Scalability
The scalability of sharing display content is not demonstrated in previous research. For example, theslow-motion benchmark [35] is designed to measure the thin-client performance, which adopts the slowmotions whose resolutions are 352 × 240 to emulate the display update. This benchmark compares theslow motion at 24 FPS with the one at 1 FPS. The following formula of video quality (VQ) [35] is usedto evaluate the performance, where P stands for a specified playback rate and slow-mo stands for a slowplayback rate.
V Q(P ) =
DataTransferred(P )/P laybackT ime(P )IdealFPS(P )
DataTransferred(slow−mo)/P laybackT ime(slow−mo)IdealFPS(slow−mo)
The assumption behind VQ is that there are enough CPU and network resources to encode pixels andtransfer them over networks. The reason is that motion with 80K pixels is used. Only one client/serverpair was active during any given test in the experiment [35]. That means that only one viewer is used.The scalability issue is not demonstrated at all. The same situation happens in the THINC experiments.
However, the scalability has been addressed for sharing display content. For example, TightProjector[63] is designed to project display content to many networked displays. It often happens that manyclients access shared display content from networks.
3.3.3 3D applications
3D applications are a main type of visual application. Because of the design complexity and CPUintensiveness, the approaches do not support 3D applications in the related work. The support for 3Dapplications will extend the application range of sharing display content.

3.4. MultiStream 25
3.4 MultiStream
3.4.1 Idea
Existing Solutions
Sharing display content between various devices over networks has four different models, includingan application level model, a graphical level model, a pixel level model, and a hardware level model.They are demonstrated in Chapter 1. RDP, VNC, and THINC adopt the pixel level model. Tarantella,NoMachine’s NX, and LBX belong to protocols using the graphical level model.
But there is no general display sharing solution that is adopted across the range of display devices that weaddress. Different sharing protocols are applied between notebooks, display walls, and PDAs. For ex-ample, the virtual network computing protocol (VNC) may be used to share desktop content among PCs;while a display wall typically needs a modified VNC to distribute and share desktop content across tilesand externally. For reasons of computing and power restrictions, PDAs require other solutions. The sce-nario also requires that differences in network performance capabilities, display size and resolution, andgraphic processing capabilities are handled. There are many applications with real-time requirements,such as 3D rendering. VNC achieves poor 3D frame rates, and effectively only supports 2D applications.In summary, achieving seamless sharing of display content across the range of devices addressed raisesseveral issues for which there are no established answers.
Observations
In order to find a solution to device polymorphism, we try to observe the general least common denomi-nator of sharing display content. Least common denominator means that we spend the least cost to sharedisplay content between the devices, including the support for the less powerful devices. We obtainedthree observations after careful examination of various devices.
1. Networking is ubiquitous. Since networks are widely used, intelligent devices usually providenetworking support. Although network types provide different communication bandwidth, net-working makes it possible to share display in various devices.
2. All computing devices understand pixels. The shared display is composed of pixels. Pixel dataare easier to transfer over a network. There are many different formats to represent pixel data, suchas image and video files.
3. The media player is ubiquitous. Most devices provide media player tools to support video streams.Media player usually supports video streaming over a network. The media player ubiquity is toprovide a chance to watch shared data without extra tools. That means they have no need of extrastream client software to access shared content video streams.
Based on the above observations, the architecture of least common denominator is described in Figure3.8. In this figure, pixel and networking have the minimum values of the least common denominator forsharing display content. Media streaming is treated as the higher value of the least common denominator,because media streaming is produced by encoding pixels. We conclude that MultiStream adopts the idea

26 Low Resolution Display Content Viewing By Many Clients
at the media streaming level. Namely, the pixels of applications are encoded into video streams overnetworks. In contrast with the pixel level model, which uses pixel and networking, the disadvantage isless portable because of the higher value. The advantage is that media streaming is usually supportedby devices. There are many different compression methods supported by media streaming, which makesharing display content adaptable to different networks. So media streaming is the least common de-nominator of sharing a display across devices. According to this conclusion, the idea of MultiStream isshown in Figure 3.9.
Pixel
Media Streaming
Least common denominator
Networking
Figure 3.8: Least Common Denominator
Display Pixels
Media player
Media Streaming
Figure 3.9: The Idea of MultiStream
We argue that this idea can address the issues in the Introduction section. The media streaming is used toaddress the first issue. The multiple media encoding methods can provide the adaptable architecture. Itcan be expected that the adaptable architecture will produce the scalable performance. This idea is calledMultiStream, where multiple streams are used.
3.5 Architecture
According to our idea, the architecture of MultiStream is described in Figure 3.10, which contains threecomponents: producers, services and consumers. One producer is used to produce shared display contentof applications and encode the content into video formats over networks. Before one producer sends theshared display content to one service, the producer requests the video information from the service.After the service sends back the requested video information, the producer encodes the data accordingto the video information. As soon as the producer gets the pixels from the shared applications, theproducer encodes the pixels into video streams and sends the video streams to the service over networks.The service provides all of the shared data. It also supports video qualities for various platforms. Oneconsumer is a media player to watch the shared pixels. Firstly, the consumer searches all of sharedinformation lists from the server. After the consumer chooses one shared data, the consumer sends therequest to the server. Finally, the consumer can watch the shared display sent by the server over thenetwork.

3.6. Design 27
To support multiple users with a range of different devices and applications, MultiStream must cap-ture visual content without requiring the shared applications to be modified and provide for heteroge-neous clients that may require different video resolutions and encodings. To support multiple platforms,MultiStream uses standard video streams as the communication protocol to share content. Many videocompression approaches make it possible to reduce network bandwidth usage.
Push streaming
Request
Send
Figure 3.10: MultiStream Architecture
3.6 Design
The design of MultiStream includes three components: (1) live streaming producers, (2) streamingservers, and (3) live streaming consumers. This is shown in Figure 3.11. MultiStream adopts a server-client model. Live streaming producers include 3D application streaming producer which shares 3Dapplications, desktop application streaming producer which shares 2D applications or a desktop system,and other live streaming producers which share some special applications such as videos. The shareddisplay content can be viewed from notebooks, PDAs, or display walls. There are one or more streamingservers to distribute network load. Any client connected will be redirected to a server that has capacityto serve it.
3D Application LiveStreaming Producer
Desktop LiveStreaming Producer
Other LiveStreaming Producer
Display Walls
Streaming Server
PDA
Notebook
Figure 3.11: MultiStream Design

28 Low Resolution Display Content Viewing By Many Clients
3.6.1 Capturing and Encoding
The goal of the live streaming producer is to produce video stream sources. The function of the pro-ducer includes capturing and encoding pixels. The producer avoids dependence on specific applicationsbecause the producer adopts the pixel model which reads pixels directly from frame buffers. Pixelsare encoded into video streams and are transmitted to streaming servers. The video format is decidedaccording to the network bandwidth. For example, PDA will use high compression video format.
3D Render Operation
Sharpshooter Reading Pixels
Original 3D Render
Video Streaming Threads
Figure 3.12: Producer on MultiStream
3.6.2 Scale Video Server
Streaming servers will receive multiple video streams from the producers and provide them to consumersover networks. Streaming servers also need to support some extra functions, such as converting betweendifferent resolutions of various devices and forwarding video streams between streaming servers in orderto improve performance.
3.7 Implementation
Sharpshooter is one prototype of producers implemented by us, which is developed with visual C++.Sharpshooter supports sharing of display content of desktop and 3D applications. Sharpshooter em-ploys Windows hooking, which is a technique using hooks to make a chain of procedures as an eventhandler. A hook is a point in the system message handling mechanism. When Sharpshooter starts, itregisters the hook procedure which notifies Sharpshooter before activating, creating, destroying, min-imizing, maximizing, moving, or sizing a window. When the system receives the window messages,Sharpshooter gains a chance to check whether the hooked application is needed to capture pixels. IfSharpshooter finds that the application is interesting, it modifies a few of the graphics library functionsaddresses. These functions are used to render the graphics into the frame buffer so that Sharpshooterreads the pixels data from the frame buffer when the hooked application updates the frame buffer eachtime. Sharpshooter sends the data to one thread, which is to encode pixels into video streams and send

3.8. Experiments and Results 29
Devices ConfigurationT43p Intel Pentium M 2.2 GHz, 2G memory, ATI Mobility FireGL V3200 256MB, WinXPDell 370 Intel Pentium 4 EM64T 3.2 GHz, 2G memory, NVIDIA Quadro FX 3400, Rocks4.1Cluster Network 1 Gb Ethernet
Table 3.5: The Configuration of the Devices in the Experiment
video over the network. Figure 3.12 describes the architecture of Sharpshooter. When the frame bufferis updated, Sharpshooter reads back the pixels from the frame buffer and transfers them to the workerthreads to encode. Sharpshooter uses FFmpeg [18] library to deal with video/audio encoding.
We implement one scale video server with the FFmpeg library, which is an http video server. Oneconsumer uses http protocol to access data. The server also needs to provide flexible video qualities, suchas different video formats, resolutions and frame rates, in order to address the device’s polymorphism.When the server finds requests from one consumer is different in video quality, the server scales thevideo into the requested video quality and sends the scaled video to the consumer.
3.8 Experiments and Results
3.8.1 Experiment Setup
The experiments focus on sharing display content from one computer to many viewers. The relatedhardware is described in Table 3.5. One producer computer is Thinkpad laptop T43p. The other PC is aDell 370, with Linux and Rocks 4.1.
We report on the performance of a system comprised of a video producing computer with an applicationwhose main output window is being encoded into a video and streamed to a PC (the video streamingserver). The experiment setup is described in Figure 3.13. The setup includes one producer, one streamserver, and 28 viewers. The network connection between the video producer (laptop) and the videostreaming server (Dell PC) is a switched 100Mbits/sec Ethernet. The network between the streamingserver and the clients (Dell PCs) is a switched 1Gbits/sec Ethernet.
Sharpshooter runs in T43p. The streaming server is an HTTP server. Each node will run one or moreviewers. The application whose output window is encoded into a video stream is 3DMark-03, which is abenchmarking tool for the performance of 3D rendering and CPU processing (http://www.futuremark.com).The videos are played back by from 1 to 560 clients, distributed over 28 PCs. The video resolution was320× 200, 640× 480, 800× 600, 1024× 768, and 1600× 1200. Each experiment ran for 10 minutes.
3.8.2 Producer Performance
We have measured the frame rate which the 3DMark application can achieve with and without concur-rently encoding a video of the frames. The result is shown in Figure 3.14. The five values on the X-axisis the number of kilobytes per frame for each of the five resolutions, respectively. Each pixel is encodedby four bytes. The y-axis is the frame rate of 3DMark. When 3DMark runs without encoding a video ofits frames, the frame rate drops from about 50 to 18 with increasing resolution. When encoding is done

30 Low Resolution Display Content Viewing By Many Clients
T43P (Producer) Streaming server
Cluster (consumers)
100Mb network 1Gb network
Dell 370
Dell 370
Figure 3.13: MultiStream Setup
Figure 3.14: 3D-Mark FPS with/without Encoding Videos

3.8. Experiments and Results 31
Figure 3.15: CPU Load on the Streaming Server and the TightVNC Server
Figure 3.16: Memory Load on the Streaming Server
concurrently with running 3DMark, the frame rate drops from about 38 to 4.
The trend of FPS change is a progressive decrease in both the experiments with encoding videos and theexperiments without encoding videos, when the resolution increases. The reason is that higher resolutionconsumes more CPU resources, which leads to the lower FPS. The FPS number with encoding videos islower than that without encoding videos, for encoding pixels also need CPU cycles. We conclude thatFPS is still acceptable, although encoding videos competes over CPU cycles with applications on theproducer.
3.8.3 Scalability on the Streaming Server
To support many clients, the scalability of the video distribution server is important. We have measuredthe CPU, memory, and bandwidth load experienced by the server at four different video resolutions, andwith the number of clients increasing from 28 to 560. The video, encoded with 25 FPS, of the 3DMarkapplication is streamed to the video streaming server from a Thinkpad T43p laptop. The server is ona PC, and the clients are distributed over 28 PCs as explained earlier. The results are shown in Figure3.15, 3.16, and 3.17. When the number of clients increase, the CPU load increases from a few percentto 30%-50%, depending on the resolution of the video. Lower resolutions have the highest CPU loadbecause the frame rate is higher. Consequently, more bytes are being streamed. This can be seen when

32 Low Resolution Display Content Viewing By Many Clients
Figure 3.17: Network Bandwidth Usage
comparing with Figure 3.17, showing the network bandwidth. The memory load for a single video, evenwith 560 clients, is insignificant in all cases. We conclude that we, with a single streaming server, cansupport a realistic large number of clients. In our usage scenario, collaborative sharing of display content,we would expect approximately 5-50 clients, rather than 560.
3.8.4 Comparison with VNC
To compare the performance of VNC with our video based system, we used a variant of VNC calledTightVNC [63], which uses ”tight encoding” of areas. The benchmark we use to measure the CPU loadwhen using TightVNC is a 60 seconds long customized video with 25 frames per second, and a resolutionof 1024× 768. The pixels of each frame are completely different from the pixels of the next frame. Werun the TightVNC server and the media player on a Dell 370 PC. We vary the number of clients viewingthe video (using the TightVNC viewer) from one to four. Each client is on a separate Dell 370 PC.
Figure 3.15 shows the CPU load on the computer running the TightVNC server and the media player.With one client viewing, the CPU load on the computer running the TightVNC server is about 72 percent.The CPU load with 2, 3, and 4 clients is about 92-93 percent. The CPU load is significantly higher thanthe CPU load on our video streaming server. We conclude that TightVNC does not scale beyond twoclients simultaneously viewing the video using the TightVNC viewer. Our system scales to over 600clients.
3.9 Discussion
The assumption behind the idea of using videos to share display content is that for some applicationsand collaborative work scenarios, it is better to have lossy low resolution videos at good frame ratessupporting many viewers, rather than having a lossless stream at significantly higher cost with regards toCPU load and frame rate, and with significantly fewer clients.
By building a prototype, we have documented that such video-based systems can be arranged with all the
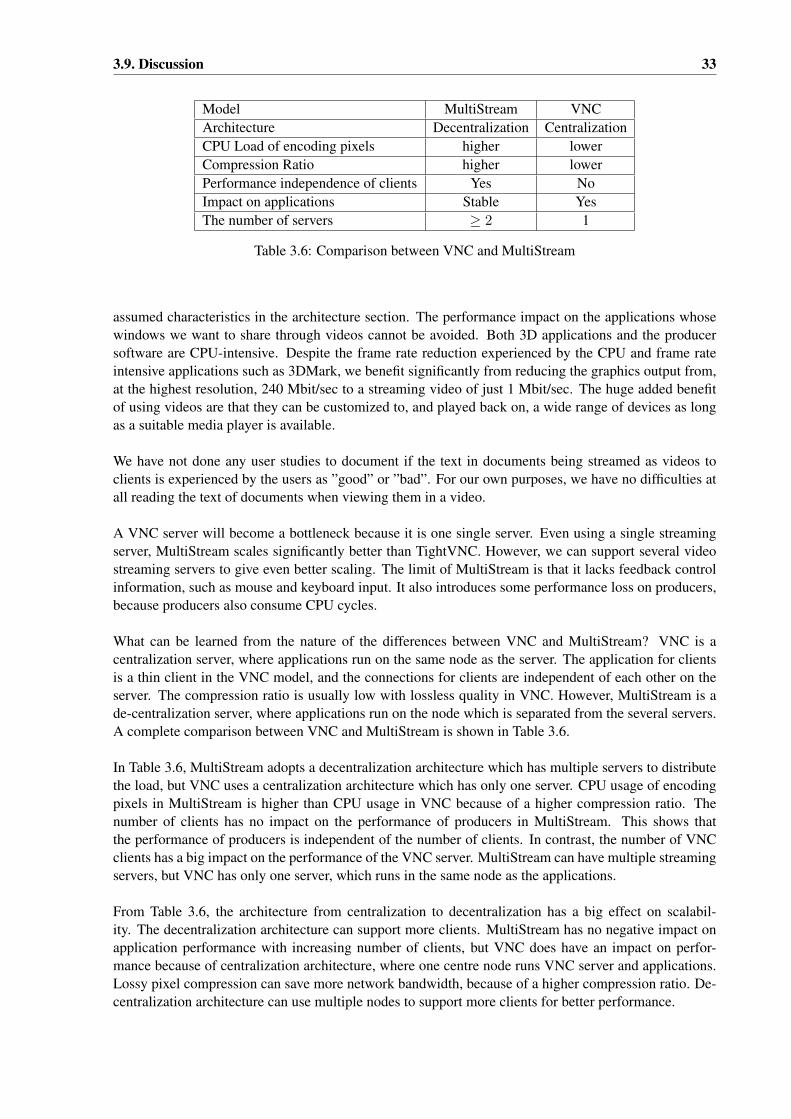
3.9. Discussion 33
Model MultiStream VNCArchitecture Decentralization CentralizationCPU Load of encoding pixels higher lowerCompression Ratio higher lowerPerformance independence of clients Yes NoImpact on applications Stable YesThe number of servers ≥ 2 1
Table 3.6: Comparison between VNC and MultiStream
assumed characteristics in the architecture section. The performance impact on the applications whosewindows we want to share through videos cannot be avoided. Both 3D applications and the producersoftware are CPU-intensive. Despite the frame rate reduction experienced by the CPU and frame rateintensive applications such as 3DMark, we benefit significantly from reducing the graphics output from,at the highest resolution, 240 Mbit/sec to a streaming video of just 1 Mbit/sec. The huge added benefitof using videos are that they can be customized to, and played back on, a wide range of devices as longas a suitable media player is available.
We have not done any user studies to document if the text in documents being streamed as videos toclients is experienced by the users as ”good” or ”bad”. For our own purposes, we have no difficulties atall reading the text of documents when viewing them in a video.
A VNC server will become a bottleneck because it is one single server. Even using a single streamingserver, MultiStream scales significantly better than TightVNC. However, we can support several videostreaming servers to give even better scaling. The limit of MultiStream is that it lacks feedback controlinformation, such as mouse and keyboard input. It also introduces some performance loss on producers,because producers also consume CPU cycles.
What can be learned from the nature of the differences between VNC and MultiStream? VNC is acentralization server, where applications run on the same node as the server. The application for clientsis a thin client in the VNC model, and the connections for clients are independent of each other on theserver. The compression ratio is usually low with lossless quality in VNC. However, MultiStream is ade-centralization server, where applications run on the node which is separated from the several servers.A complete comparison between VNC and MultiStream is shown in Table 3.6.
In Table 3.6, MultiStream adopts a decentralization architecture which has multiple servers to distributethe load, but VNC uses a centralization architecture which has only one server. CPU usage of encodingpixels in MultiStream is higher than CPU usage in VNC because of a higher compression ratio. Thenumber of clients has no impact on the performance of producers in MultiStream. This shows thatthe performance of producers is independent of the number of clients. In contrast, the number of VNCclients has a big impact on the performance of the VNC server. MultiStream can have multiple streamingservers, but VNC has only one server, which runs in the same node as the applications.
From Table 3.6, the architecture from centralization to decentralization has a big effect on scalabil-ity. The decentralization architecture can support more clients. MultiStream has no negative impact onapplication performance with increasing number of clients, but VNC does have an impact on perfor-mance because of centralization architecture, where one centre node runs VNC server and applications.Lossy pixel compression can save more network bandwidth, because of a higher compression ratio. De-centralization architecture can use multiple nodes to support more clients for better performance.
34 Low Resolution Display Content Viewing By Many Clients
3.10 Conclusion
We have documented through a prototype and experiments with the idea, architecture, design, and imple-mentation, the performance characteristics of using live streaming videos to share display content. Usinglaptops and PCs, the performance benefit over systems like VNC is significant. Even if we have not yetdocumented how handheld devices and cell phones will benefit, the availability of media players on suchdevices and the low cost of viewing streaming videos bode well. We have designed and implementedone new display sharing system, MultiStream, which uses the pixel level model. Different from otherdesktop sharing systems, such as VNC, MultiStream provides video streams over a network.
The advantages of MultiStream are listed as follows:
• Media players as consumers. MultiStream utilizes media players as consumers of live displaycontent since media players are supported by most devices and computers.
• Zero modification. The live streaming producer captures stream sources without modifications forcaptured applications.
• Scalability. The MultiStream system scales significantly better than using a VNC mode. It useslower CPU and bandwidth, while supporting at least an order of magnitude more clients. In addi-tion, the MultiStream architecture supports scalability as several streaming servers can be used.
• Adaptable. MultiStream is adaptable to network bandwidth. Video streaming supports multiplecompression approaches with different compression ratios.
The disadvantages of MultiStream are listed as follows:
• The encoding of the live video will impact the CPU load of the computer running the encodingsoftware. This will impact the performance of applications on the computer.
• There are no mouse and keyboard inputs.

Chapter 4
High Resolution Display Wall Desktops
4.1 Introduction
A display wall is comprised of distributed display tiles. A display wall desktop is used to drive a displaywall. There are two requirements for a display wall desktop. One requirement is that a display walldesktop is high resolution. A high resolution desktop makes a display wall provide more visualizationspace and see more details. Another requirement is to keep a display wall desktop compatible withexisting applications in order to simplify the use of the display wall. To keep compatible with existingapplications, sharing display content is one solution from a shared traditional desktop system, such asMicrosoft Windows, to each tile.
An X server using the VNC protocol (an X VNC server) is considered as a solution to meeting these tworequirements. A VNC system is a simple way of creating a large enough desktop to fill a display wall.VNC uses a virtual frame buffer (VFB) to create a large desktop. VFB resides in the main memory sothat the X VNC server can support a high resolution. A 100 megapixel desktop will consume 400 MBmemory when each pixel uses 4 bytes. The size is usually less than the demand of main memory that acomputer has. Each display computer runs a VNC viewer requesting desktop updates from the server forthe region of the desktop corresponding to its tile, and displays it. VNC adopts a thin-client architecture.VNC viewers only receive pixels from a VNC server and forward interaction events to the VNC server.The architecture of a high resolution display wall desktop is shown in Figure 4.1, which is an instanceof Figure 2.3, using the VNC protocol. A VNC server runs on a computer together with applicationsdisplaying onto the desktop.
When an application needs to produce output to the desktop, it uses normal X library calls to requestthe X server to output pixels. This call is, transparently to the application, sent to the VNC server whichupdates the virtual desktop correspondingly. To get updates, a VNC viewer polls the VNC server. Basedon its position in the projector matrix, each viewer requests the corresponding pixel area from the VNCserver. The server then, on demand, checks for updates in the desktop area covered by the requestingviewer. If there are updates, the server encodes and transmits them to the VNC viewer.
The advantage is that this architecture makes X applications run without awareness of distributed tiles of adisplay wall. The disadvantage is that the VNC desktop has no graphics hardware support. Consequently,encoding is done by the CPU and with the frame buffer for the virtual desktop in the computer’s randomaccess memory. Each pixel produced by the application is copied from the application’s address space
35
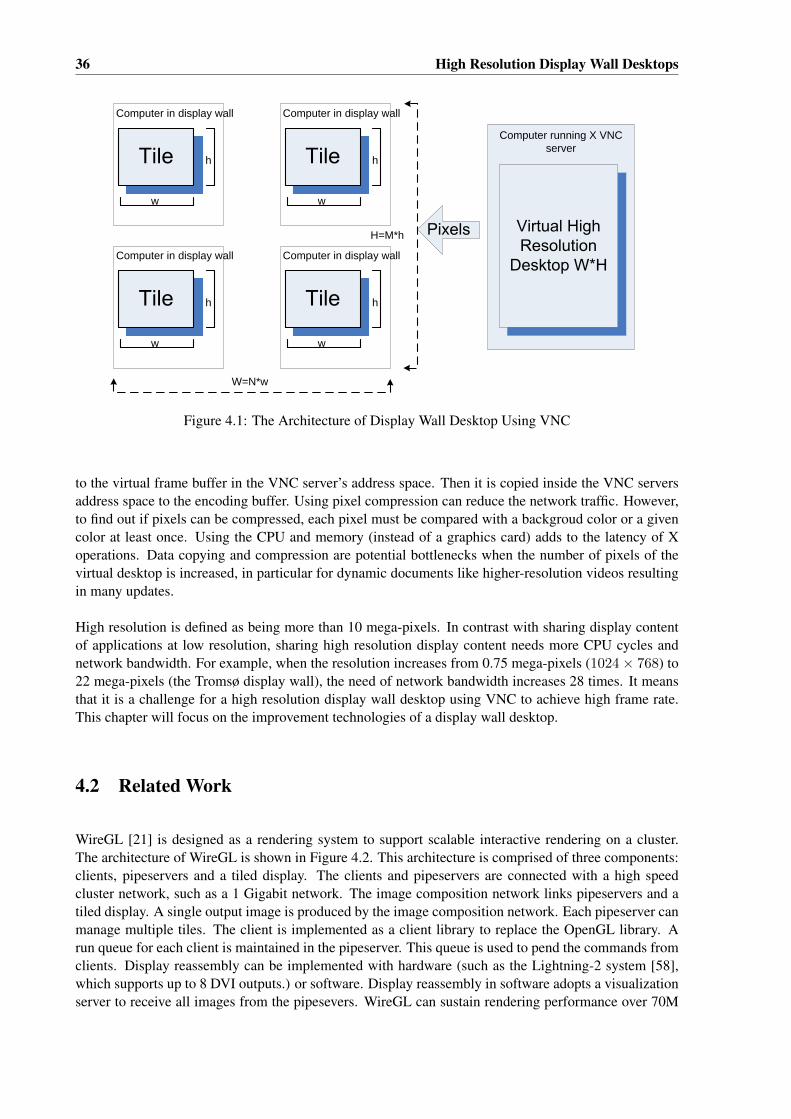
36 High Resolution Display Wall Desktops
w
h
Computer in display wall
w
h
Computer in display wall
w
h
Computer in display wall
w
h
Computer in display wall
W=N*w
H=M*h
Computer running X VNC server
Figure 4.1: The Architecture of Display Wall Desktop Using VNC
to the virtual frame buffer in the VNC server’s address space. Then it is copied inside the VNC serversaddress space to the encoding buffer. Using pixel compression can reduce the network traffic. However,to find out if pixels can be compressed, each pixel must be compared with a backgroud color or a givencolor at least once. Using the CPU and memory (instead of a graphics card) adds to the latency of Xoperations. Data copying and compression are potential bottlenecks when the number of pixels of thevirtual desktop is increased, in particular for dynamic documents like higher-resolution videos resultingin many updates.
High resolution is defined as being more than 10 mega-pixels. In contrast with sharing display contentof applications at low resolution, sharing high resolution display content needs more CPU cycles andnetwork bandwidth. For example, when the resolution increases from 0.75 mega-pixels (1024× 768) to22 mega-pixels (the Tromsø display wall), the need of network bandwidth increases 28 times. It meansthat it is a challenge for a high resolution display wall desktop using VNC to achieve high frame rate.This chapter will focus on the improvement technologies of a display wall desktop.
4.2 Related Work
WireGL [21] is designed as a rendering system to support scalable interactive rendering on a cluster.The architecture of WireGL is shown in Figure 4.2. This architecture is comprised of three components:clients, pipeservers and a tiled display. The clients and pipeservers are connected with a high speedcluster network, such as a 1 Gigabit network. The image composition network links pipeservers and atiled display. A single output image is produced by the image composition network. Each pipeserver canmanage multiple tiles. The client is implemented as a client library to replace the OpenGL library. Arun queue for each client is maintained in the pipeserver. This queue is used to pend the commands fromclients. Display reassembly can be implemented with hardware (such as the Lightning-2 system [58],which supports up to 8 DVI outputs.) or software. Display reassembly in software adopts a visualizationserver to receive all images from the pipesevers. WireGL can sustain rendering performance over 70M

4.2. Related Work 37
triangle/s using 16 computers and 16 rendering nodes.
Application client
Application client
Application client
High Speed Cluster Network
Pipeserver
Pipeserver
Pipeserver
Tiled Display
OpenGL OpenGL Pixels
Image Reassembly
Figure 4.2: The Architecture of WireGL [21]
Chromium[22] is designed as a system for scalable rendering on a cluster, which is derived from WireGL.Chromium adopts a stream processing model, where OpenGL commands are converted into streams.Chromium introduces Streaming Processing Units (SPUs) to perform stream transformations which takea single stream of OpenGL commands and produce zero or more streams. Chromium provides someSPUs, such as render and tilesort. The render SPU is to render OpenGL commands into a window. Thetilesort SPU is to drive tiled displays. An SPU does not have to implement an entire OpenGL interface. Asimple chromium configuration for a tiled display is shown in Figure 4.3, where the tilesort SPU dividesthe frame buffer into tiles and the render SPU outputs the incoming streams into local graphical devices.SPUs are implemented as dynamically loadable libraries that provide OpenGL interface [22]. The fakerOpenGL library is used to replace the standard OpenGL library. This faker library translates OpenGLcommands into streams over networks.
Application
Tilesort
Chromium Server
Render
Render
Render
Render
Chromium Server
Chromium Server
Chromium Server
Figure 4.3: The Architecture of Chromium for a Tiled Display [22].
OpenGL Vizserver[52] is designed as an application and desktop sharing system, which distributesgraphics from powerful visual servers to remote clients. Vizserver renders OpenGL remotely and trans-mits the rendered frame buffer to the collaborator. Vizserver adopts a server-client architecture. Thearchitecture is described in Figure 4.4. This architecture enables X11 and OpenGL applications to beshared remotely, with machines that do not have specialist high-performance graphics hardware. When

38 High Resolution Display Wall Desktops
an event for a buffer swap in a window happens, the event triggers OpengGL Vizserver to read backthe frame buffer of the application. After pixels are compressed, compressed data are transmitted overthe networks. The client receives data, uncompresses them and outputs to the local display. Vizserversupports multiple compression approaches, such as JPEG, ZLIB and lossless compression. However, itrequires applications developed with OpenGL.
Application
vs interface
X/OpenGL
Xserver
Graphics pipes
Server manager (vizserver)
Session Manager [vssesion]
Compression modules
Client process(Vizserver)
Decompression modules
Client display
Client keyboard and mouse input
Figure 4.4: The Architecture of Vizserver [52]
Teravision[54] is designed as a scalable platform-independent display sharing system with a frame grab-ber card. The idea is to treat Teravision as a network-enabled PowerPoint projector. The architectureof Teravision is described in Figure 4.5. The server captures videos from the video source. The clientreceives video streams from the server over networks. The video data are only transferred from the serverto the client. The video capture hardware is used to capture videos in the server. Network transmissionsupports TCP and UDP. The experimental test shows that the best performance can be up to 37 FPS whenTCP is used and the video format is 1024x768 at 24 bpp. In this case, the client CPU usage is close to100%.
Figure 4.5: The Architecture of Teravision [54]

4.3. Experimental Methodology 39
Scalable graphics engine (SGE) [43] is designed as a distributed hardware frame buffer at the pixel levelfor parallel computers. The architecture of SGE software is shown in Figure 4.6, where disjoint pixelfragments are joined within the SGE frame buffer and displayed as a high-resolution, contiguous image.Tunnel lib is to implement tunneling which transfers graphical data to SGE. The X window creation andevent handling is performed in a master node, and events are distributed to other nodes with tunnel lib.The SGE is capable of updating 8 display driver cards with a peak performance of 720 mega-pixels persecond [43].
Figure 4.6: The Architecture of SGE Software [43]
SAGE[26] is designed as a flexible and scalable software approach of SGE without any special hardware.The architecture of SAGE is described in Figure 4.7. SAGE is made up of the Free Space Manager(FSManager), SAGE Application Interface Library (SAIL), SAGE Receivers, synchronization channel,and UI clients. FSManager is functioned as a window manager, which is used to receive user commandsfrom UI clients. SAIL is an interface to the SAGE framework, which communicates with FSManagerand transfers pixels to SAGE receivers. SAGE receivers are to receive pixel streams which may be fromdifferent applications. Synchronization channel adopts a master-slave model, where the master nodesends synchronization signals to all nodes. After the signals are received, nodes start to render newframes when they are ready.
XDMX [16] is designed as a proxy X server, which supports multi-head X functionality across differentcomputers. The idea of XDMX is to extend multi-head from one computer to multiple computers.The architecture of XDMX is described in Figure 4.8. XDMX includes a front-end server and a set ofback-end servers. The standard X protocol is used to communicate between the front-end server andthe back-end servers. The back-end servers output pixels onto the attached displays. XDMX can beused with Xinerama [67], which is an extension to the X Window System which uses multiple graphicaldevices in the same machine to create one large virtual display. The user will see a single unified display.It does not support pixel compression.
4.3 Experimental Methodology
A display wall desktop is implemented by sharing pixels from a remote virtual frame buffer. The updatemechanism of a display wall desktop using VNC is on demand. After a viewer requests a region, thepixels in this region will be transmitted when this region is updated in the virtual frame buffer. The worstcase is that the whole frame buffer is updated. As a result, the whole frame buffer has to be sent to

40 High Resolution Display Wall Desktops
Tiled Display
SAGE Receiver
SAGE Receiver
SAGE Receiver
SAGE Receiver
SAIL
App1
SAIL
App1
SAIL
App1
FreeSpaceManager
UI Client
UI Client
Synchronization Channel Pixel Stream SAGE Messages
Figure 4.7: The Architecture of SAGE [26]
A front-end server
X Client
A back-end server
A back-end server
A back-end server
X protocol
X protocol
Figure 4.8: The Architecture of XDMX

4.3. Experimental Methodology 41
viewers. In order to evaluate the performance in this case, we use playing videos to emulate the updateof the whole buffer.
Two videos at 3 and 6.75 mega-pixels are used to emulate updates to a high-resolution desktop. Thevideos are played with a media player, one at a time, on the computer running the VNC server and aredisplayed to the VNC virtual desktop. The VNC viewers request updates from the VNC server as oftenas they can manage, and display them physically to the display wall tiles.
The two videos are made using FFmpeg [18] at the resolutions 2048× 1536 (R1) and 3072× 2304 (R2).The videos are encoded as MPEG4 at 30 FPS, each video lasting 120 seconds for a total of 3600 frames.The VNC server compression ratio using hextile encoding on the videos is about 5.
The R1 video covers exactly four (two by two) tiles and its area is 2.6m2. We assume that this area isrepresentative of the area used by several typical streaming applications on the display wall. At nine tiles(three by three) the R2 video covers an even larger area of the display wall.
Ffplay [18] is used as the video media player. The media player runs on the same computer as theVNC server, displaying into the virtual desktop. It plays images one by one, and does not drop imagesbecause of timeouts. This is important, as the computer and VNC server cannot keep up with the 30FPSframerate, slowing down ffplay and extending the time spent on playing back the video.
For each experiment, a virtual frame buffer (a desktop) is defined at the VNC server matching the con-figuration of the video we play back, and at a colour depth of 32 bits. By doing this we get each videoto exactly cover the whole VNC virtual desktop, avoiding complicating issues arising from having thevideo play back partially on more than four (or nine) tiles of the display wall.
Three performance metrics are used to evaluate performance of the VNC model for display wall desktops.
1. FPS (Frames per second): FPS is the number of updates received by the VNC viewers or by theVNC server per second. FPS represents how many frames are seen in front of the display wall.During playing videos, received frames are recorded each tile. FPS per tile is the frames divided bythe playing time. While we measure and calculate the FPS per tile, we only report on the averageFPS over all four or nine tiles. Higher is better. The FPS for the server is computed as the numberof video frames divided by the time it takes ffplay to actually play the video.
2. UFP (Updated frames percent): The percentage of video frames played back by the media playerwhich are seen on the display wall. The higher the UFP, the less updates are missed by the displaywall. First, we count the accumulated average number of updates sent to the VNC viewers until avideo finishes. We then, because each video is 3600 frames long, divide the accumulated averageof frame updates by 3600 to compute the UPS. This is possible since ffplay does not drop frames,and will draw every frame on the desktop. UFP is 100% when each update is seen by all viewers,and is less than 100% when the application updates the VNC virtual frame buffer faster than theviewers get updates. The higher the UFP, the less updates are missed by the VNC viewers. Higheris better.
3. Time: This is the time measured at the display wall to play the 120 seconds long video beingplayed back by the media player into the virtual desktop. Closer to 120 is better.
We prepare to implement high resolution display wall desktops as X VNC servers to meet the two re-quirements. There are several existing X VNC servers, such as TightVNC or RealVNC. TightVNC and

42 High Resolution Display Wall Desktops
RealVNC are open source projects. We decide to develop our desktops based on the better one of the two,because a high resolution desktop is computing intensive. After the performance (FPS, UFP and time) iscompared, we profile the chosen platform to show the bottleneck of this platform. Three improvementapproaches are applied to improve the performance.
4.4 Selecting a VNC Implementation for Improvement
4.4.1 Selecting
Using videos, we did the measurements to compare TightVNC and RealVNC. Table 4.1 shows the resultsfrom the performance experiments done on TightVNC and RealVNC. TightVNC has from 1.4 to 2 timesthe higher frame rate than RealVNC while they both lose about 1/3 of the frames as seen by the displaywall. For a user looking at the display wall, this means that the 120 seconds long video being playedback into the virtual desktop, takes from 2.5 to 7 times longer to view using TightVNC, and from 3.7 to9.5 times longer using RealVNC.
Even though TightVNC clearly has a better performance than RealVNC, it still degraded the originalvideos 30 FPS to respectively 8 and 4 FPS, and increased the playing time from the original 120 secondsto respectively 297 and 836 seconds. We also observe that while TightVNC has about 2 times higherFPS at 12 MB/frame, this is reduced to only 1.4 times better FPS at 27 MB/frame. Consequently,TightVNC seems to degrade faster than RealVNC when the number of pixels of the desktop goes up.Further experiments are needed to document this behaviour better.
For the highest resolution video, UFP is nearly 100%, meaning that most of the frames are indeed dis-played on the display wall. This is because the VNC server now needs so much more time to prepare andsend each new frame to the display wall VNC viewers that the viewers have time to send a new updaterequest to the VNC server before the server sends its next frame. As a result, less updated frames areskipped. However, because of the server being a bottleneck, the playing time still becomes longer andthe FPS decreases.
Resolution RealVNC TightVNC
2048x1536(R1)FPS 4.13 8.14UFP 67% 65%Time 446 297
3072x2304(R2)FPS 3.1 4.3UFP 99.6% 99.5%Time 1145 836
Table 4.1: RealVNC Vs. TightVNC
Even though TightVNC had better performance than RealVNC in the experiments we did, it still de-graded the original 30FPS and 120 seconds long video significantly. Because there is no hardware sup-port for the frame buffer of a virtual desktop, TightVNC can be expected to be both CPU and memoryintensive because it needs to do a lot of both pixel copying in memory and comparisons to compress up-dated areas. When the pixel count increases, the CPU and memory bus loads can be expected to increaserapidly. To more precisely identify the performance limiting bottlenecks, we profiled TightVNC.

4.4. Selecting a VNC Implementation for Improvement 43
4.4.2 Profiling
Experimental Design
We profiled it with regards to CPU load distribution and the number of L2 data cache misses. Oprofile[29] was used as the profiler. Oprofile is a profiling system for Linux profiling all parts of a runningsystem using performance counters provided by the CPU. Oprofile is low overhead in most commoncases [29]. Oprofile is always running when a video is playing.
Using Oprofile, two events are focused on: GLOBAL POWER EVENTS (time during which the pro-cessor is not stopped) and BSQ CACHE REFERENCE (level 2 data cache misses). The first event typeis used to find the relative CPU distribution of all running code in the computer. The second is used tofind the distribution of L2 data cache misses. In Figure 4.9, the configurations of Oprofile and for thetwo event types are given. Before an experiment starts, we use opcontrol to set up the event types we areinterested in, and after an experiment is done, we use opreport and opannotate to get the sampled eventdata.
Figure 4.9: Critical Annotated Program Blocks
Experimental Results and Discussion
The relative CPU usage behavior and L2 cache misses for TightVNC are shown in Figures 4.10 and4.11 respectively when playing the 2048 × 1536 (R1) video. In the figures, the only parts not directlyassociated with functionality of TightVNC are tagged ffplay media player, Linux kernel, libc (the Clibrary with system calls to the Linux kernel), and (some of the) others. Even if we will not modify these,

44 High Resolution Display Wall Desktops
we will avoid using some of their functionality to improve the performance. The rest are measurementsabout the functions of the TightVNC. The function RfbSendRectEncodingHextile is used to encodepixels with Hextile encoding, cfb32DoBitbltCopy is used to copy pixels, and rfbTranslateNone is usedto translate pixels between colour formats.
Figure 4.10: TightVNC CPU Distribution
Figure 4.10 shows that TightVNC and libc use 54% of the CPU with the hextile encoding being thesingle most ex-pensive part. Figure 4.11 shows that TightVNC and libc have 76% of the total number ofL2 cache misses, with the pixel copying being the single most expensive part. We also observe that libccreates 21% cache misses.
Clearly, the pixel copying and hextile encoding are prime candidates for improvement. In addition theuse of libc should be considered. We use the opannotate command to gain insight into the annotatedsource codes for these three functions. The critical program blocks that have the most number of eventsamples are shown in Figure 4.9. The numbers to the left under each function are the event samplecount and the percentage of all events created by the function. We will focus on improving the hextileencoding, and especially to change the copy function to get rid of the high number of cache misses.
4.5 Improving the Selected VNC
According to the above profile result, a high resolution desktop is CPU-intensive. The critical codesare data movement and pixel encoding. We want to provide a smooth desktop to users, the desktophas to get enough computing resources. In order to overcome this challenge of a cluster environment,different methods of performance improvement are used, including instruction level improvement, usinga multi-thread architecture and GPU computing to improve data movement and pixel encoding.

4.5. Improving the Selected VNC 45
4.5.1 Instruction Level Improvement
The approach at instruction level is to use assemble language to implement single instruction multipledata (SIMD), cache prefetching and optimizing critical codes.
Data Copying
There are at least two copy operations per pixel in the TightVNC X server before an update is ready tobe transmitted to the viewers of the display wall. First, pixels are copied to the in-memory virtual framebuffer of the virtual desktop. This is done by the function cfb32DoBitbltCopy. Second, pixels are copiedto the in-memory encoding buffer by the function rfbTranslateNone using the libc function memcpy. Thefunction cfb32DoBitbltCopy does the copying pixel by pixel, at 32 bits per copy. This approach resultsin both low memory copying bandwidth and many cache misses. The function rfbTranslateNone callsthe memcpy function of libc, which also results in many cache misses. Consequently, we can expectbetter performance if we can improve on the copying of pixels and avoid the use of memcpy.
The Intel Pentium 4 processors support SSE2 (Streaming SIMD Extensions 2) [24]. SSE2 is one of theIntel SIMD instruction sets, which has eight 128-bit special registers and supports 128-bit operations.If we copy 128 bits at a time instead of 32, we can expect four times improvements in the copyingperformance. However, a memory operand of SSE2 instructions must be aligned on a 16-byte memoryboundary so we must align the virtual frame buffer and the encoding buffer accordingly. Instead of usingmemcpy in rfbTranslateNone, we use two MOVDQA instructions to copy 128 bits at a time from thesource to the virtual frame buffer.
Figure 4.11: TightVNC L2 Cache Miss

46 High Resolution Display Wall Desktops
We observe that for the function cfb32DoBitbltCopy, the pixel data are not needed immediately. There-fore to copy data we use the instruction MOVNTDQA because it writes data directly to memory withouttouching the cache, potentially resulting in fewer cache misses. To prepare the L2 cache for use weapply the instruction prefetchnta which does prefetching of data to the L2 cache. We have done all ofthe improvements using assembler language to have better control over what is actually taking place atrun-time.
Hextile Encoding
We improve on the TightVNC pixel encoding using several techniques. First, we do some tighteningof the code, meriting no further comments. Second, the hextile encoding used in TightVNC dividesupdated areas into pixel blocks and encodes the blocks one by one. The size of each block depends onhow large the updated area is. Instead, we propose to statically divide updated areas into fixed 16x16pixel blocks. We save by not having to access memory to find the width and height of the pixel blocks.Third, where appropriate, we replace multiplication instructions by add and shift instructions. Forth,where appropriate, we replace data branch instructions with the Intel conditional MOVCC instruction.
Fifth, we remove some branch instructions altogether. The hextile encoding implementation in TightVNCwill, when having two overlapping pixel blocks of the same colour but of different sizes, choose thelargest pixel block in order to get the best compression. However, in most cases, the pixel block thatis biggest is the ”vertical” block. Therefore we remove the branch instructions needed to decide andstatically always choose the vertical block. In practice, the compression ratio remains the same, but thecompression becomes slightly faster.
Experimental Design
The hardware and software platform is a display wall comprised of a single computer running the im-proved VNC server and the media player, and twenty-eight computers running a VNC viewer each. Eachof the twenty-eight computers has a projector attached. All computers are Dell precision 370 PCs, run-ning 32-bit Rocks/Linux 4.1. The network between the nodes is a 1 Gigabit switched Ethernet. FPS,UFP and time of the improved VNC server are evaluated.
Experimental Results and Discussion
Video Resolution TightVNC Improved VNC
2048x1536(R1)FPS 8.14 10UFP 65% 65%Time 297 232
3072x2304(R2)FPS 4.3 5.9UFP 99.5% 99.5%Time 836 608
Table 4.2: Results of Improved VNC
After applying the changes to TightVNC, we did the previously described experiments again, this time

4.5. Improving the Selected VNC 47
using the improved version of VNC. The results are shown in Table 4.2. The modifications have im-proved the frame rate by 23-37%, while the playing time has been shortened by 22-27%. At the sametime, the improved version does not lose more frames than TightVNC. Figure 4.12 shows the relativeCPU distribution of the improved VNC. The improved version uses almost 10% less of the CPU vs.TightVNC, leaving more CPU cycles for applications.
Figure 4.12: Improved VNC CPU Distribution
Figure 4.13 shows the cache misses for the improved version. The results show that the improved versionhas 23% fewer L2 cache misses.
We do not have sufficiently fine granularity in the performance measurements to document how muchof the performance contributions are the result of the improved data copying vs. the improved hextileencoding. We believe that the largest contribution comes from using the Intel SSE2 instructions toimprove the data copying.
4.5.2 Using a Multi-thread Architecture
The approach using multi-thread architecture is designed to benefit from multiple CPUs. Multiple CPUhas become a new trend of CPU performance, but TightVNC X server is a single thread, which can-not benefit from multiple CPUs. So a Multi-thread architecture and design have to be developed andimplemented.
To adapt VNC to a display wall and improve performance, we made several changes, and used theTightVNC implementation of VNC as a starting point for the resulting TiledVNC system. To utilizemulti-core architectures, we change the VNC server from being single-threaded to multi-threaded. Tocontrol the load on both the server and client side we change the update protocol of the VNC serverfrom a viewer pull to a server push model. The server initially waits until all viewers connect to it, and

48 High Resolution Display Wall Desktops
Figure 4.13: Improved VNC L2 Cache Miss
then the server periodically pushes updates to the viewers. To reduce the period when tiles show contentfrom different frames, we only push updates for the same frame to all viewers. This was simplified bythe server push model. We also remove the mouse and keyboard input handler from all viewers becausein the case of a display wall using VNC all input devices can be connected directly to the VNC servercomputer instead of to the viewers.
From Single-Threading to Multi-Threading
Figure 4.14 illustrates the architecture of the TiledVNC multi-threaded VNC server. The idea is to havea set of threads waiting on a timer. When a timeout happens, the threads get a task from a pool of tasks.Each task indicates an area of the virtual frame buffer corresponding to a tile of the display wall. A threadscans the frame buffer for dirty regions that needs to be updated, and if there are any, it will compressthe data and send it to the corresponding viewer. Then the thread goes to the pool of tasks and gets a newarea to check. A counter is used to keep track of the number of remaining tasks. When all tasks are done,the threads block for the next timeout. We implemented the server in C, using the Pthread [11] threadpackage. We use a Pthread monitor condition variable to have threads wait.
From Viewer Pull to Server Push
We have changed the viewer pull model to a server push model to let the server have better control overits work load and the update rate. The assumption is that the viewers always will have more resourcesavailable than they need to display the updates sent from the server.
A VNC server usually uses a viewer pull model. The server waits for requests for updates from the
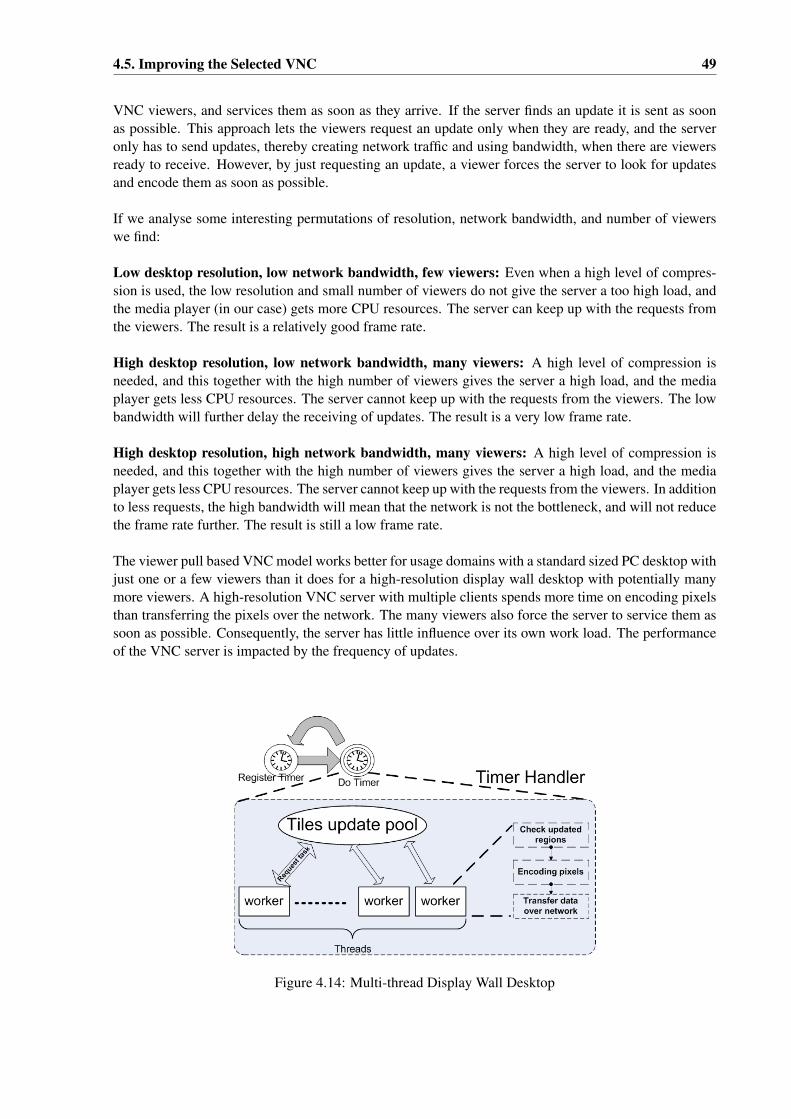
4.5. Improving the Selected VNC 49
VNC viewers, and services them as soon as they arrive. If the server finds an update it is sent as soonas possible. This approach lets the viewers request an update only when they are ready, and the serveronly has to send updates, thereby creating network traffic and using bandwidth, when there are viewersready to receive. However, by just requesting an update, a viewer forces the server to look for updatesand encode them as soon as possible.
If we analyse some interesting permutations of resolution, network bandwidth, and number of viewerswe find:
Low desktop resolution, low network bandwidth, few viewers: Even when a high level of compres-sion is used, the low resolution and small number of viewers do not give the server a too high load, andthe media player (in our case) gets more CPU resources. The server can keep up with the requests fromthe viewers. The result is a relatively good frame rate.
High desktop resolution, low network bandwidth, many viewers: A high level of compression isneeded, and this together with the high number of viewers gives the server a high load, and the mediaplayer gets less CPU resources. The server cannot keep up with the requests from the viewers. The lowbandwidth will further delay the receiving of updates. The result is a very low frame rate.
High desktop resolution, high network bandwidth, many viewers: A high level of compression isneeded, and this together with the high number of viewers gives the server a high load, and the mediaplayer gets less CPU resources. The server cannot keep up with the requests from the viewers. In additionto less requests, the high bandwidth will mean that the network is not the bottleneck, and will not reducethe frame rate further. The result is still a low frame rate.
The viewer pull based VNC model works better for usage domains with a standard sized PC desktop withjust one or a few viewers than it does for a high-resolution display wall desktop with potentially manymore viewers. A high-resolution VNC server with multiple clients spends more time on encoding pixelsthan transferring the pixels over the network. The many viewers also force the server to service them assoon as possible. Consequently, the server has little influence over its own work load. The performanceof the VNC server is impacted by the frequency of updates.
Figure 4.14: Multi-thread Display Wall Desktop

50 High Resolution Display Wall Desktops
Figure 4.15 describes time distribution during two contiguous frame updates. The time ∆T between twocontiguous updates is the sum of Tx, Ttransfer and Tdelay, as shown in Figure 4.15.
Tx and Ttransfer are insignificant for the standard PC desktop resolution case. When the size of thedesktop increases, Tx and Ttransfer grow larger. Tx in particular can become large in the high resolution.Tdelay is the duration between updates. During this time the media player application may also get moreCPU resources because the server may wait idle for new viewer requests or for the timeout. Reducingthe update frequency will reduce the server load. This can be achieved by increasing Tdelay.
Consistency between Tiles
The viewer pulls update protocol used by VNC, when used in a tiled display wall, resulting in thepossibility of viewers displaying content from different frames. This is because each viewer requests andgets updates independently of each other. The server push update protocol makes it simple to reduce theperiod when tiles show content from different frames by simply pushing updates from the same frame toall viewers before the next frame is pushed out. Even if viewers receive the updates at slightly differenttimes, the updates are from the same frame. This works well as long as the viewers have sufficientresources to receive and display all updates. This is a realistic assumption for a display wall with manyviewers and a heavily loaded server.
Experimental Design
The period between timeouts, the delay, lets the server control its load and impact the performance.Different numbers of threads can be used. We used a computer with a 3.8 GHz Intel(R) Xeon(TM) CPUand 8 G RAM memory to run a TiledVNC server. The operating system is 64-bit Redhat Linux RHEL5. The TiledVNC server is configured to use four threads to handle updates. FPS, UFP and time areevaluated by playing videos.
Figure 4.15: Time Distribution

4.5. Improving the Selected VNC 51
Experimental Results and Discussion
The results from the experiments are shown in Figures 4.16, 4.17 and 4.18. TiledVNC in the figuresis an implementation of multi-thread architecture. The X-axis is the delay between timeouts, Tdelay inmilliseconds. The Y-axis is the frame rate (FPS) or the percentage of updated frames (UFP).
Figure 4.16: FPS at the Display Wall
Figure 4.17: FPS at the VNC Server
The results show that the best frame rate as seen by the viewers for the 3 mega-pixels video was achievedwhen updates were done every 30ms. In this case TiledVNC increased the frame rate to 14 FPS, or about34% more than TightVNC. About 80% of the updates done at the server side were displayed on thedisplay wall.
The best frame rate as seen by the viewers for the 6.75 mega-pixels video was achieved when updates

52 High Resolution Display Wall Desktops
Figure 4.18: UFP
Tdelay 30 ms 70 msTiledVNC R1 211 216TiledVNC R2 679 579TightVNC R1 283 257TightVNC R2 712 869
Table 4.3: Time to Play Back a 120 Seconds Long Video
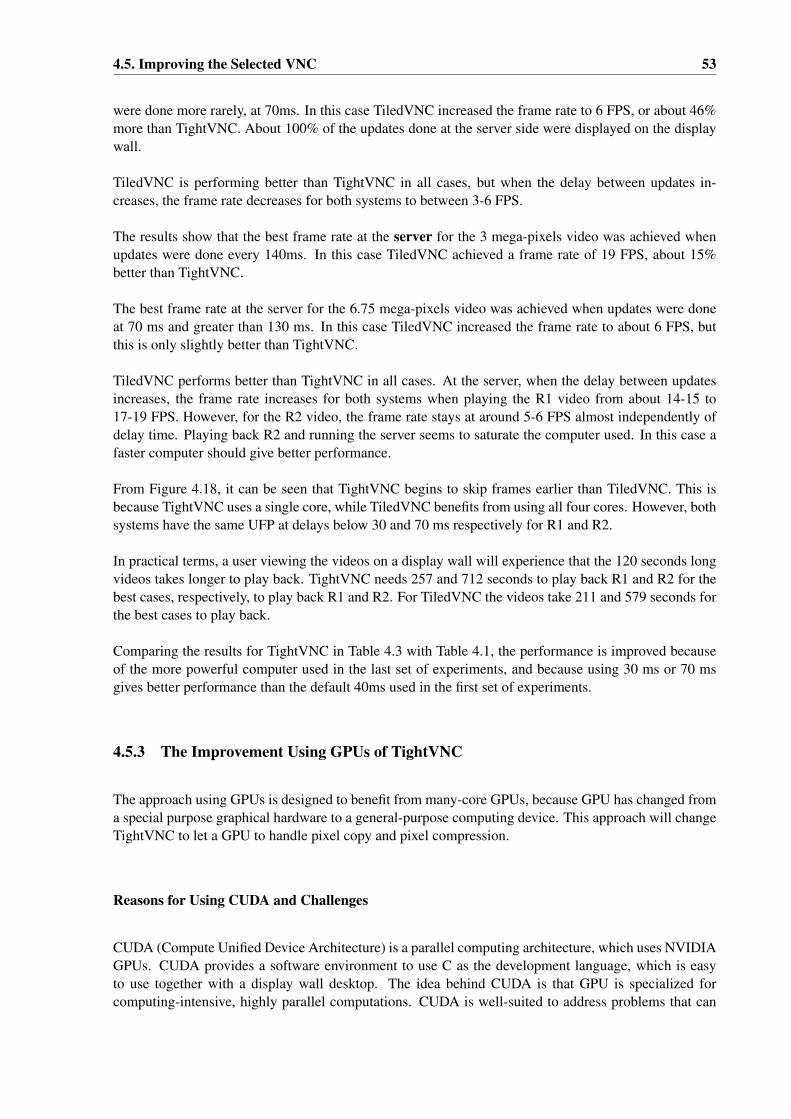
4.5. Improving the Selected VNC 53
were done more rarely, at 70ms. In this case TiledVNC increased the frame rate to 6 FPS, or about 46%more than TightVNC. About 100% of the updates done at the server side were displayed on the displaywall.
TiledVNC is performing better than TightVNC in all cases, but when the delay between updates in-creases, the frame rate decreases for both systems to between 3-6 FPS.
The results show that the best frame rate at the server for the 3 mega-pixels video was achieved whenupdates were done every 140ms. In this case TiledVNC achieved a frame rate of 19 FPS, about 15%better than TightVNC.
The best frame rate at the server for the 6.75 mega-pixels video was achieved when updates were doneat 70 ms and greater than 130 ms. In this case TiledVNC increased the frame rate to about 6 FPS, butthis is only slightly better than TightVNC.
TiledVNC performs better than TightVNC in all cases. At the server, when the delay between updatesincreases, the frame rate increases for both systems when playing the R1 video from about 14-15 to17-19 FPS. However, for the R2 video, the frame rate stays at around 5-6 FPS almost independently ofdelay time. Playing back R2 and running the server seems to saturate the computer used. In this case afaster computer should give better performance.
From Figure 4.18, it can be seen that TightVNC begins to skip frames earlier than TiledVNC. This isbecause TightVNC uses a single core, while TiledVNC benefits from using all four cores. However, bothsystems have the same UFP at delays below 30 and 70 ms respectively for R1 and R2.
In practical terms, a user viewing the videos on a display wall will experience that the 120 seconds longvideos takes longer to play back. TightVNC needs 257 and 712 seconds to play back R1 and R2 for thebest cases, respectively, to play back R1 and R2. For TiledVNC the videos take 211 and 579 seconds forthe best cases to play back.
Comparing the results for TightVNC in Table 4.3 with Table 4.1, the performance is improved becauseof the more powerful computer used in the last set of experiments, and because using 30 ms or 70 msgives better performance than the default 40ms used in the first set of experiments.
4.5.3 The Improvement Using GPUs of TightVNC
The approach using GPUs is designed to benefit from many-core GPUs, because GPU has changed froma special purpose graphical hardware to a general-purpose computing device. This approach will changeTightVNC to let a GPU to handle pixel copy and pixel compression.
Reasons for Using CUDA and Challenges
CUDA (Compute Unified Device Architecture) is a parallel computing architecture, which uses NVIDIAGPUs. CUDA provides a software environment to use C as the development language, which is easyto use together with a display wall desktop. The idea behind CUDA is that GPU is specialized forcomputing-intensive, highly parallel computations. CUDA is well-suited to address problems that can
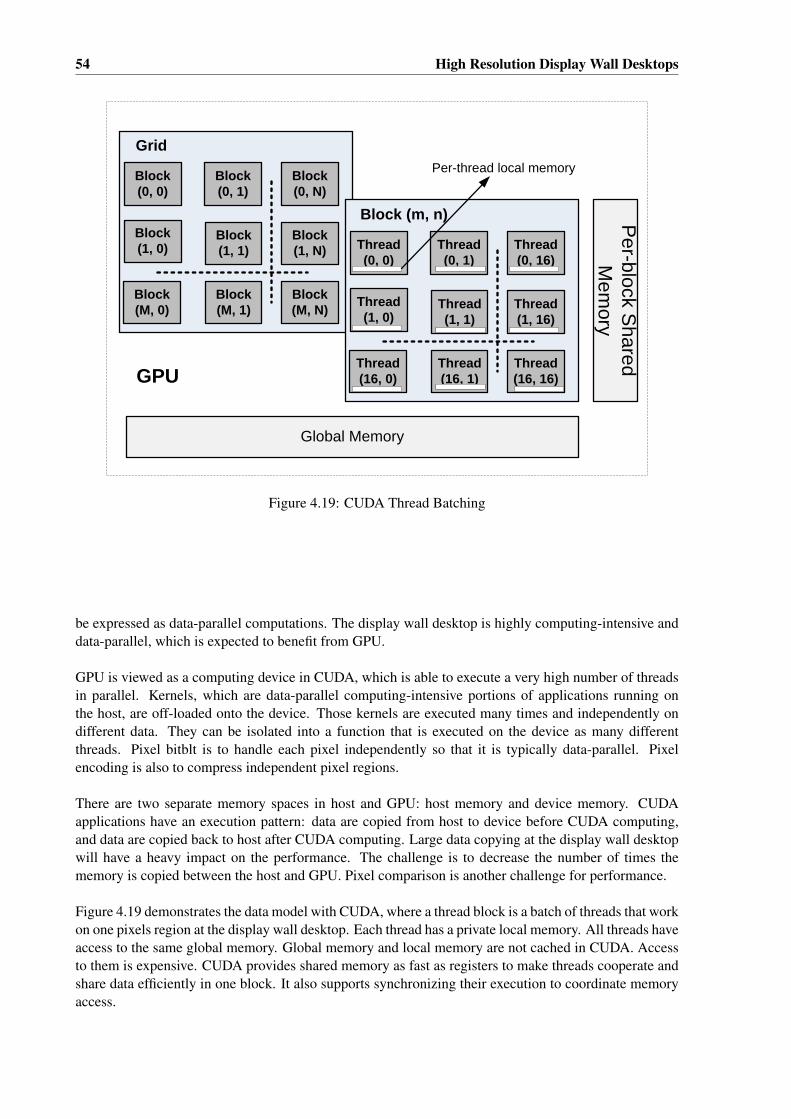
54 High Resolution Display Wall Desktops
Block(0, 0)
Block (0, 1)
Block (0, N)
Block (1, 0)
Block (1, 1)
Block (1, N)
Block (M, 0)
Block (M, 1)
Block (M, N)
Grid
Thread(0, 0)
Thread (0, 1)
Thread (0, 16)
Thread (1, 0)
Thread (1, 1)
Thread (1, 16)
Thread (16, 0)
Thread (16, 1)
Thread (16, 16)
Block (m, n)
Global Memory
Per-block S
hared M
emory
Per-thread local memory
GPU
Figure 4.19: CUDA Thread Batching
be expressed as data-parallel computations. The display wall desktop is highly computing-intensive anddata-parallel, which is expected to benefit from GPU.
GPU is viewed as a computing device in CUDA, which is able to execute a very high number of threadsin parallel. Kernels, which are data-parallel computing-intensive portions of applications running onthe host, are off-loaded onto the device. Those kernels are executed many times and independently ondifferent data. They can be isolated into a function that is executed on the device as many differentthreads. Pixel bitblt is to handle each pixel independently so that it is typically data-parallel. Pixelencoding is also to compress independent pixel regions.
There are two separate memory spaces in host and GPU: host memory and device memory. CUDAapplications have an execution pattern: data are copied from host to device before CUDA computing,and data are copied back to host after CUDA computing. Large data copying at the display wall desktopwill have a heavy impact on the performance. The challenge is to decrease the number of times thememory is copied between the host and GPU. Pixel comparison is another challenge for performance.
Figure 4.19 demonstrates the data model with CUDA, where a thread block is a batch of threads that workon one pixels region at the display wall desktop. Each thread has a private local memory. All threads haveaccess to the same global memory. Global memory and local memory are not cached in CUDA. Accessto them is expensive. CUDA provides shared memory as fast as registers to make threads cooperate andshare data efficiently in one block. It also supports synchronizing their execution to coordinate memoryaccess.
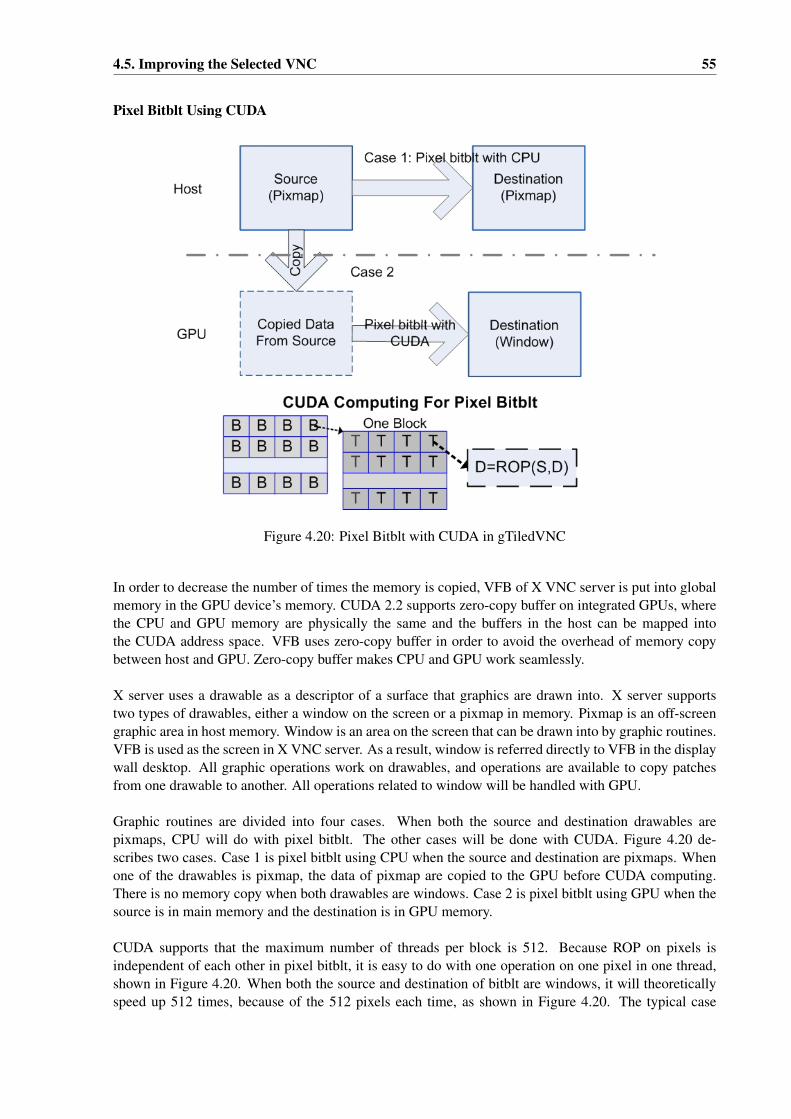
4.5. Improving the Selected VNC 55
Pixel Bitblt Using CUDA
Figure 4.20: Pixel Bitblt with CUDA in gTiledVNC
In order to decrease the number of times the memory is copied, VFB of X VNC server is put into globalmemory in the GPU device’s memory. CUDA 2.2 supports zero-copy buffer on integrated GPUs, wherethe CPU and GPU memory are physically the same and the buffers in the host can be mapped intothe CUDA address space. VFB uses zero-copy buffer in order to avoid the overhead of memory copybetween host and GPU. Zero-copy buffer makes CPU and GPU work seamlessly.
X server uses a drawable as a descriptor of a surface that graphics are drawn into. X server supportstwo types of drawables, either a window on the screen or a pixmap in memory. Pixmap is an off-screengraphic area in host memory. Window is an area on the screen that can be drawn into by graphic routines.VFB is used as the screen in X VNC server. As a result, window is referred directly to VFB in the displaywall desktop. All graphic operations work on drawables, and operations are available to copy patchesfrom one drawable to another. All operations related to window will be handled with GPU.
Graphic routines are divided into four cases. When both the source and destination drawables arepixmaps, CPU will do with pixel bitblt. The other cases will be done with CUDA. Figure 4.20 de-scribes two cases. Case 1 is pixel bitblt using CPU when the source and destination are pixmaps. Whenone of the drawables is pixmap, the data of pixmap are copied to the GPU before CUDA computing.There is no memory copy when both drawables are windows. Case 2 is pixel bitblt using GPU when thesource is in main memory and the destination is in GPU memory.
CUDA supports that the maximum number of threads per block is 512. Because ROP on pixels isindependent of each other in pixel bitblt, it is easy to do with one operation on one pixel in one thread,shown in Figure 4.20. When both the source and destination of bitblt are windows, it will theoreticallyspeed up 512 times, because of the 512 pixels each time, as shown in Figure 4.20. The typical case

56 High Resolution Display Wall Desktops
is putimage, where the source is a pixmap and the destination is a window. In that case, there is onememory copying between the host memory and the device memory.
Hextile Encoding Using CUDA
Hextile is relatively fast compared with other pixel encoding methods at the display wall. There are thefollowing steps in hextile encoding: (1) In order to improve the compression ratio, the background andforeground pixels are selected first in each 16x16 tile; (2) The sub-rectangles are looked for in one tile,which are the same colours and not the background pixel; (3) When a sub-rectangle is found, pixels areencoded and the sub-rectangle is filled with the background pixel. If the length of final encoded datais more than the length of raw data, raw encoding will be used. Although hextile is an efficient pixelcompression, the time complexity is very high when CPU is used to implement it in the high resolutioncase.
Hextile encoding of TightVNC is re-implemented using CUDA. This method is that one grid handleshextile encoding and each thread is to finish encoding pixels in one 16x16 tile. Figure 4.21 demonstrateshextile encoding with CUDA. Each thread chooses background (bg) color and foreground (fg) color, andfinds and encodes some sub-rectangles where pixel’s color is same. After each thread has done hextileencoding, synchronization has to be used to wait for all threads finishing pixel encoding. The reason isthat the length of compressed data in one tile is not fixed. The position of each tile in the data buffercannot be calculated until all information of the lengths is collected. After each thread gets its positionin the data buffer, the encoded data can be written into the data buffer.
The challenge is that all of doing this is involved in a lot of pixel comparison and memory copies. Thoseoperations have an impact on the performance of CUDA. The background pixel can efficiently increasethe compression ratio.
Experimental Design
gTiledVNC has been implemented based on TightVNC, where the codes include a CUDA interfacelibrary and some modifications for window bitblt and hextile encoding. The display wall computers run32-bit Rocks 4.1 Linux on a cluster of Dell Precision WS 370s, each with 2GB RAM and a 3.2 GHz IntelP4 Prescott CPU. The server node has 2.5GB RAM, 3.2 GHz CPU, and one integrated GeForce GTX295. That node runs 64-bit Ubuntu 9.04 and installs CUDA 2.2. We use one video, which is 3 mega-pixels each frame, 30 FPS, 3000-frame, and MPEG4 encoding to emulate updates to a high-resolutiondesktop. The video plays with ffplay [18] on the server. It plays back on the display wall with vncviewer.
A CPU with VFB in hostB CPU with VFB in GPUC Bitblt using GPUD Encoding using GPUE Bitblt and encoding using GPU
Table 4.4: Experimental Configuration in gTiledVNC
Table 4.4 describes the experimental configuration in gTiledVNC. Case A is using CPU-only with VFBin host. VFB uses zero-copy buffer in the other cases. Case B is when VFB uses zero-copy buffer and

4.6. Discussion 57
Figure 4.21: Hextile Encoding Each Block in gTiledVNC
CPU does all computation. Case C only uses GPU to do bitblt. Case D only uses GPU to do hextileencoding. Case E uses GPU to do bitblt and hextile, where each block has 15 threads and one tile iscopied into shared memory first.
Experimental Results and Discussion
The result is shown in Figure 4.22. FPS on the Y-axis is the number of frames per second seen in frontof the display wall. The X-axis represents different cases using GPU. FPS of A and B is same, which is9.9. FPS of E decreases to 1.8.
FPS of A and B is same. It shows that VFB using zero-copy buffer has no impact on FPS. Hextileencoding using GPU is mainly a bottleneck because FPS of D is almost the same as FPS of E.
4.6 Discussion
Two videos at 3 and 6.75 mega pixels were used in the experiments. While these videos played backon all the computers we had available, a 22 mega-pixel video did not, making it impractical to use it inthe experiments. However, the lower resolution videos do reflect interesting collaboration settings wherefull desktop updates are rare. One such setting is collaboration using many static documents and a fewvideos and web sites with animations.

58 High Resolution Display Wall Desktops
Figure 4.22: Performance of Display Wall Desktop Using GPU
There are two characteristics behind the implementation of a display wall desktop. One is that VFBresides in the main memory and resolution at the display wall desktop is very high. This results in thatmemory operations are CPU-consuming. Another is pixel comparison. Because of high resolution, pixelcomparison is also CPU-consuming. Pixel compression is used to reduce the requirement of networkbandwidth.
The size of each frame of a 22 mega pixel desktop at 32-bit colour depth is 84MB, or about 0.6 Gbits. Forthe 3 and 6.75 mega-pixel videos the size of each frame is, respectively, 12 MB and 28 MB. The 1 GbitEthernet we are using can sustain an end-to-end bandwidth of about, or less than, 0.8 Gbit/sec, resultingin only 1-2 FPS when updating all the pixels of a 22 mega-pixel desktop without using compression onthe pixel data. To update all the pixels at 25 FPS without using compression, we must send at about 2GB/sec, or 16 Gbits/sec. The gigabit Ethernet has about 20 times less bandwidth than is needed to dothis. Even for the 3 and 6.75 mega-pixels videos the Gigabit Ethernet has too low bandwidth to sustain25 FPS when using raw pixel data. Consequently, either a much faster network is needed, or pixel datacompression must be used in order to at least reduce the network bottleneck and achieve better framerates. Faster networks are available, but are not yet commodified and are therefore still expensive. Ifcompression is used, it must be done using CPU and memory because the VNC server does not use thegraphics processing unit (GPU). For dynamic documents, like a video, compression puts a heavy loadon the CPU and the compression ratio may still not be very good. For more static documents, like PDFdocuments and web pages, the CPU load will also be high, but at least the compression ratio becomesgood cutting down on network traffic.
The improvements at the instruction level to TightVNC were focused on improving the data copyingusing the Intel SSE2 instruction set, and improving the hextile encoding. Of the techniques applied, theimproved data copying can be used in other data copying intensive applications. Cache fetch is helpfulfor memory movement. The hextile encoding has a more limited usage but can be applied in otherdisplay related systems. However, the total improvements of performance are limited because SSE2 hasa 128-bit memory bus and there is four times speedup in the best case.

4.6. Discussion 59
The single computer running the VNC server and the applications does not have the resources to com-press and transmit a high-resolution desktop at more than a single digit frame rate. In a collaborativesetting the performance can be acceptable or not depending on how the display wall is used. If it is usedto view a set of static documents with little or light scrolling through the documents, the performanceusing VNC is in our experience not an obstacle to the work flow. This is also the case when, say, apaper is done collaboratively on a display wall. In this case a typical setup is to have open 3-10 editorwindows, the PDF version of the paper, and all the figures and tables in separate windows. The largesize and resolution of a display wall implies that many documents or many pages of a few documentscan be displayed all at the same time thereby reducing the need for updates. When dynamic documentsare used, like scrolling through complex documents and images, playing videos, running simulationsand doing visualizations of large scientific data sets, using VNC will in our experience result in framerates and application performance low enough to frustrate the users and reduce the effectiveness of thecollaboration. Our measurements support our subjective experiences.
In comparison with the instruction level and GPU, multi-thread architecture (TiledVNC) leads to betterperformance. FPS of TiledVNC has 34% more than FPS of TightVNC. Although the performance ofTiledVNC is better than TightVNC, it still suffers from low FPS. One main reason is that updating thevirtual frame buffer has no hardware (GPU) support. However, we still benefit from multiple cores. Thecompression rate of the hextile encoding used by TightVNC and TiledVNC is about 5. When Tdelay =30ms, TiledVNC sends about 34 MB/sec and 29 MB/sec into the network when playing back the 3and 6.75 mega-pixels videos, respectively. The gigabit Ethernet can support about 100 MB/sec. Withmore cores the multi-threaded TiledVNC should be able to push more updates into the network. For the 3-megapixel video, we estimate that using eight cores may give us about 19 FPS. This is about 45 MB/sec,and still less than what a gigabit Ethernet will support. This is interesting because it indicates that thereare performance benefits for TiledVNC to be expected from more cores, and it is simpler to update to acomputer with more cores than to update the whole network.
The performance of using GPUs is much lower than 15 FPS using multi-CPUs. There are 480 processorsin GeForce GTX 295, but FPS does not vary with an increasing number of threads per block. It cannotutilize the capacity of GPU efficiently when the code is ported directly from CPU to GPU, where onethread does hextile encoding for one tile. One block works together to implement hextile encoding forone tile in the future, where many threads can speedup hextile encoding. One block for one tile can alsoutilize shared memory to improve the performance.
CUDA has two distinct memory spaces. One is on the GPU, and another is on the main memory ofthe host. It interchanges data by coping data between CPU and GPU. However, high resolution desktopmeans a great number of pixel copies between CPU and GPU, which leads to the big overhead. CUDAsupports zero-copy mode in integrated GPUs. When zero-copy buffer is used as VFB, the overhead islittle compared with the buffer in the host, according to the experimental results. The advantage is thatzero-copy buffer implements data interchange without buffer copies. The disadvantage is that it dependson integrated GPUs and consumes the memory in host.
Hextile encoding using CUDA has a large negative impact on performance. The reasons are that GPUis not good to do a lot of pixel comparison and memory operations. An amount of pixel comparisonleads to heavy performance penalty on the GPU. When each thread does hextile encoding for one tile,encoding is in need of memory buffer. Each thread consumes 1KB buffer to copy pixels in one tile. Theperformance of using shared memory is better than that of using local memory, because shared memoryis as fast as the registers. However, it supports 16KB for one block. As a result, the number of threadsper block is only up to 15 when shared memory is used for hextile encoding.

60 High Resolution Display Wall Desktops
4.7 Conclusion
This chapter describes the architecture of high resolution display wall desktops, using X server and VNCprotocol. This architecture can provide high resolution and remain compatible with existing applications.By profiling desktops, it is found that it is CPU-intensive, and two main bottlenecks are data movementand pixel encoding. As a result, performance improvements have to be applied. Three improvementsare implemented in this chapter, including using instruction level, multi-CPUs, and GPUs. According toexperimental results, multi-thread architecture gains the best improvement.

Chapter 5
Discussion
5.1 Background
We argue that a pixel level model is well-suited to share display content at low resolution and highresolution. However, this model also introduces some performance problems, such as high CPU andnetwork usage. In particular, it is more CPU- and network- intensive when display content is sharedat high resolution, even if we have already applied three improvement approaches to high resolutiondisplay wall desktops. These approaches are: using SIMD instructions, using a multi-thread architectureand using many-core GPUs. The best improvement is to use a multi-thread architecture, which is up toabout 14 FPS at 3 mega-pixels per frame. When the size per frame increases to 6.75 mega-pixels, thebest FPS is about 6. It shows that FPS decreases heavily when the resolution increases.
In order to demonstrate this FPS problem, the data path for sharing display content from a server to aviewer is shown in Figure 5.1. Data path includes a lot of memory copies and transmission of networkpackets. A server reads back pixels from a virtual frame buffer and encodes those pixels. This work isdone by the CPU and memory systems. The encoded data are sent via network cards. CPUs usuallyaccess network cards via a PCI interface. According to this data path from CPU to network, sharingdisplay content depends on CPU devices, memory devices, PCI devices and Ethernet devices in currentcomputer systems. It is known from the data path that the performance of sharing display content has tobe subject to the minimum bandwidth of those devices.
The bandwidth of devices, which are used by personal computers, is shown in Table 5.1. The bandwidthnumber is peak transfer rate in the table. The DDR peak transfer rate is obtained by memory clock rate* bus clock multiplier * data rate * number of bits transferred / number of bits per byte. For example,the memory clock rate of DDR3-1600 is 200 MHz. If data are transferred 64 bits at a time, the peaktransfer rate of DDR3-1600 is 200× 4× 2× 64/8 = 12800 MB/s. The peak rate of Ethernet devicesare calculated by max transfer rate / number of bits per byte.
The peak bandwidth of CPU is related with CPU frequency. However, CPU frequency is less than 4 GHzfrom Chapter 1. If we assume that read and write operations can be done in one cycle, then the peakread or write bandwidth of 4 GHz CPU is 32 GB/s when data are transferred 64 bits at a time. In fact,the real bandwidth of read or write operations are much less than this number. One of the reasons is thatread and write operations cannot be done in one cycle.
61

62 Discussion
Ethernet
Memory CPU
Network Card
R/W
R/W Memory CPU
Network Card
R/W
R/W
Figure 5.1: Data Path of Sharing Display Content
Device Type Peak Transfer Rate (MB/s)Memory DDR3-1600 12800Memory DDR2-533 4266Network Fast Ethernet 12.5Network Gigabit Ethernet 125
Table 5.1: Bandwidth of Devices
Because there is a lot of data movement during sharing of the display content, the cost of memory copyis used to evaluate the performance of memory and CPU systems. In order to give an example, an actualplatform, rockslcd, is used to get real performance information. Rockslcd has 64-bit 3.2 GHz CPU, 2.5GB DDR2-533 memory. Table 5.2 gives memory bandwidth data, which are the result of lmbench3[56] at rockslcd. The bandwidth of memory read is 4715 MB/s, and the bandwidth of memory writeis 2000 MB/s. Libc copy contains a read operation and a write operation at a time. The bandwidth ofLibc copy is 1470 MB/s, which is 34.5% of DDR2-533’s peak transfer rate.
From Table 5.2, the cycles for one memory copy (C) can be estimated.
3.2× 64/8
C=
1470
1024⇒C ≈ 18
This means that CPU cycles for one memory copy are about 18. This number will be used for thefollowing discussion.
This chapter will discuss what kind of hardware can satisfy the requirement to support one or manyviewers receiving display content at 25 FPS. Users will not be aware of the latency of visualization at 25FPS. However, it is still difficult to reach the target, 25 FPS at the viewers. So it is necessary to answerthe following questions:
Memory Operation Memory Read Memory Write Libc CopyBandwidth(MB/s) 4715 2000 1470
Table 5.2: Memory Bandwidth at Rockslcd

5.1. Background 63
• Is it possible to achieve our target which is to drive a viewer or a display wall at 25 FPS?
• Do we only need to wait for better hardware to meet the requirement?
• Do we have to improve the software even if we have better hardware?
1500
2000
2500
MB 25FPS
1FPS
0
500
1000
Pixels1024x768 7168x30721600x1200
Figure 5.2: The Relationship between Pixels and Data Size
In order to answer the above questions, a model is needed to evaluate the performance of sharing displaycontent. To simplify the discussion, it is assumed specifically that the size of each frame at viewers is1600× 1200, which is usually supported by personal computers now. The targeted FPS is 25 at viewers.Each pixel is represented with 32-bit (4 bytes). So the data size of one frame Ndataperframe is:
Ndataperframe =1600× 1200× 4
1024× 1024≈ 7.3 MB
The total size of 25 frames (Ndata) per second is:
Ndata = Ndataperframe× 25 ≈ 183.1 MB
That means that the server must be able to transmit data to each viewer at 183.1 MB per second in orderto reach 25 FPS.
In order to show the relationship between different resolutions and data, Figure 5.2 is given, which givesthree different resolutions (1024 × 768, 1600 × 1200, 7168 × 3072) at 1 FPS and 25 FPS. From thisfigure, we know that the data to handle increases when the resolution goes up. When FPS increases, thedata to handle increases.
In the discussion, 28 viewers are used to represent ”many viewers” for simplification of the discussion.The reason for this decision is that we have already an experimental platform, a 28-node display wallcluster. That number is equal to the number of the nodes in the display wall cluster. This makes thediscussion controllable. So when the number of viewers is up to 28 at 25 FPS on the server, the bandwidthrequired is as follows: Ndata× 28 = 183.1× 28 = 5126.8 MB/s.

64 Discussion
The performance of sharing display content is subject to Moore’s Law and Amdahl’s Law. AlthoughMoore’s Law states that the density of transistors on a chip will double every 18 months, the clockspeeds haven’t increased at the same speed because of thermal issues. As a result, one single core willbe the bottleneck of the whole system. Multi-core CPUs are an option. However, applications cannotbenefit from multi-core CPUs directly. Parallel programming must be used for better performance. Sothe effect of multi-core CPUs will be discussed.
5.2 Model for Sharing Display Content
Figure 5.3 describes how display content is shared to one viewer. Applications are not included in thisfigure in order to simplify the description of sharing display content. This figure describes the minimumsteps needed to share display content. In fact, the real data path is more complex and longer from userspace to Ethernet in modern operating systems. The first step is to copy the content of VFB to a localin-memory buffer, and the final step is to copy the content to a network buffer for transmission to viewersover networks. So pixels undergo at least two copies. Pixel compression before transmission is optional.Whether pixel compression is used depends on the specific hardware environment. For example, it isusually without pixel compression when the server and viewers run in the same node. However, if aviewer accesses the server via a wireless network, a pixel compression has to be used for better FPS.Compression is to decrease the requirement of network bandwidth.
Memory Copy Memory Copy
Pixel Compre
ssion
Transmission
Copy, Compression, & Transmission
Figure 5.3: Sharing Display Content for One Viewer
When Figure 5.3 is extended to multiple viewers, there are two following models, VNC model andMultiStream model. VNC model is illustrated in Figure 5.4, which is a centralized, pull-model, non-distributed architecture. In VNC model, copy, compression and transmission will be done in one servernode. However, MultiStream model is a little different in Figure 5.5, where the display content is sentto another server node which is responsible for the distribution of the display content to viewers. As aresult, VNC model is simple in comparison with MultiStream model. However, MultiStream model ismore scalable. These two models will be applied in the discussion.

5.3. Sharing Display Content without Compression 65
Copy, Compression, Transmission
Copy, Compression, Transmission
Copy, Compression, Transmission
VNC Server
Figure 5.4: VNC Model for Multiple Viewers
Copy, Compression, Transmission
MultiStream Producer
Server
Figure 5.5: MultiStream Model for Multiple Viewers
5.3 Sharing Display Content without Compression
5.3.1 Evaluation Equation for CPU and Network
In order to reach 25 FPS at one viewer, the time (T) which is spent to send 25 frames from the server toa viewer must be less than 1 second. So the following equation is obtained.
T =Ndata
Bwnetwork+ 2(
Ndata
Bwmemcpy) ≤ 1
Where Bwnetwork stands for bandwidth of network and Bwmemcpy stands for bandwidth of memorycopy. Memory is copied at least twice according to Figure 5.3, including copying the content of VFB tolocal buffers for encoding and copying the encoded data for network transmission.
When the number of viewers (Nviewer) increases in VNC model, T ≤ 1Nviewer . This shows that the

66 Discussion
Network Type Fast Ethernet Giga Ethernet 10 GbE 100 GbEBandwidth 100 Mb/s 1 Gb/s 10 Gb/s 100 Gb/s
Initial standard 1995 1998 2002 2010Widely Used 2000 2009 N/A N/A
Table 5.3: Increasing Trend of Ethernet Network Speed
number of viewer connections will impact a VNC server in a VNC model in order to keep 25 FPS. Whenthe number increases, the VNC server has to transfer frames faster. However, the condition is still T ≤ 1in MultiStream model.
5.3.2 Discussion
1. Bwmemcpy →∞This assumption is that the capability of CPU and memory systems is infinite. Namely, the time forreading and encoding pixels is close to 0. Ndata = 183.1 MB is used in the following discussion.
T =Ndata
Bwnetwork+ 2(
Ndata
Bwmemcpy) =
183.1
Bwnetwork+ 2(
183.1
∞ ) ≤ 1
⇒ Bwnetwork ≥ 183.1 MB/s = 1464.8 Mbit/s = 1.4 Gbit/s
This means that bandwidth of the network must be more than 1.4 Gbit/s if 25 FPS is to be achievedon one viewer when infinite CPU and memory resources are available. The bandwidth is more thanthe max bandwidth of 1 Giga Ethernet. So 1 Giga Ethernet cannot support 25 FPS at one viewer.When the number of viewers is up to 28, the bandwidth must be 41014.4 Mbits/s = 40.1 Gbit/s.
Table 5.3 shows the increasing trend of Ethernet network speed. 100 GbE is still in development,which can support the 40 Gb/s that we need. But it is not used yet.
2. Bwnetwork →∞This assumption is that the capability of network is infinite. Namely, the time for transferringencoded pixels trends to 0.
T =Ndata
Bwnetwork+ 2(
Ndata
Bwmemcpy) =
Ndata
∞ + 2(183.1
Bwmemcpy) ≤ 1
⇒ Bwmemcpy ≥ 366.2 MB/s = 0.358 GB/s = 2.86 Gbit/s
This means that the memory system can sustain one viewer at 25 FPS when the bandwidth of thenetwork is infinite. For example, bandwidth of memory copy is 1470 MB/s (11.48 Gbit/s) atrockslcd, which can satisfy the requirement of one viewer. And rockslcd can support 4 viewers atmaximum at the same time, where 1470
366.2 ≈ 4.
3. If rockslcd is used, Bwmemcpy = 1470 MB/s, then
T =Ndata
Bwnetwork+ 2(
Ndata
Bwmemcpy) =
183.1
Bwnetwork+ 2(
183.1
1470) ≤ 1
⇒ Bwnetwork ≥ 243.8 MB/s = 1950.8 Mbit/s = 1.9 Gbit/s
This means that the requirement of Bwnetwork increases 33.2% at rockslcd. Memory overheadhas an influence on the actual performance. The requirement ofBwnetwork is more than the maxbandwidth of 1 Giga Ethernet, so rockslcd cannot support one viewer without compression at 25FPS over 1 Giga Ethernet.

5.4. Sharing Display Content with Compression 67
4. If 100 GbE is used, or Bwnetwork = 100 Gb/s = 12.5 GB/s, how much bandwidth of memorycopy is required to support 28 viewers at 25 FPS?
T =Ndata
Bwnetwork+ 2(
Ndata
Bwmemcpy) =
183.1
12.5 ∗ 1024+ 2(
183.1
Bwmemcpy) ≤ 1/28
⇒ Bwmemcpy ≥ 17089.3 MB/s = 16.7 GB/s = 133.5 Gbit/s
This shows that the bandwidth of memory copy is at least 16.7 GB/s, when the bandwidth con-sumption of shared applications is ignored. Now the peak bandwidth of DDR3-1600 is up to about12 GB/s. So we can expect that peak memory bandwidth can meet this requirement. However,how many CPU frequencies are required to support 16.7 GB/s memory copy?
Freqcpu =(Bwmemcpy ∗ C)
64/8=
(16.7G ∗ 18)
64/8≈ 38 GHz
It means that the required frequency of one single CPU is about 38 GHz. However, it’s notachieved. We have no idea how long we can achieve it. One possible solution is to use multi-core CPUs, which are about 10 cores, so that multi-thread architecture has to be used.
5.3.3 Conclusion
• It is impossible for VNC model to support one viewer, where the size of one frame is 1600x1200and FPS is 25 without compression in Giga Ethernet.
• It is impossible for VNC model to support 28 viewers at 25 FPS without compression, because itrequires about 38 GHz CPU to handle memory copy even in 100 Gb Ethernet. Multi-thread has tobe used when the number of viewers is up to 28.
Based on these conclusions, pixel compression and Multi-core CPUs must be used to share displaycontent.
5.4 Sharing Display Content with Compression
5.4.1 Evaluation Equation for CPU and Network
When pixel compression is applied, the time (T) will contain the time of pixel compression. The equationis shown as follows.
T =Ndata
Bwnetwork× 1
Ratio+
Ndata
Bwmemcpy× (1 +
1
Ratio)
+Npixel × f × Cyclesforonecomparison
Frequency≤ 1
Where Ratio represents the compression ratio of pixels (Ratio=uncompressed pixels/compressed pixels),Frequency stands for CPU frequency, and f represents the number of the comparison times for onepixel. Cyclesforonecomparison is cycles of one memory read, one memory write and one pixel
68 Discussion
comparison. According to 18 cycles for one memory copy in the background section, it’s reasonableto assume Cyclesforonecomparison = 20. In hextile encoding, one pixel must be compared 3 timesat least. The first time is to get the background pixel and foreground pixel. The second time is forcomparison with the background pixel. There is at least one pixel comparison in order to find one samecolour rectangle. So it is reasonable to assume that f ≥ 3.
5.4.2 Discussion
1. Bwmemcpy →∞This assumption is that the capability of CPU and memory systems is infinite. Namely, the time forreading and encoding pixels is close to 0. When 1 Gbit Ethernet network is used, Bwnetwork =125 MB/s.
T =Ndata
Bwnetwork× 1
Ratio=
183.1
125× 1
Ratio≤ 1⇒ Ratio ≥ 1.5
That means that the compression ratio is 1.5 when one viewer is at 25 FPS. This is easy to satisfy.For example, the compression ratio in our experimental videos is about 5. So it’s possible tosupport one viewer at 25 FPS in Giga Ethernet.
When the number of viewers is up to 28 and VNC model is used,
T =Ndata
Bwnetwork× 1
Ratio=
183.1
125× 1
Ratio≤ 1/28⇒ Ratio ≥ 41
This means that the size of the uncompressed pixels has to be at least 41 times than that of thecompressed pixels. Hextile encoding is used to explain what this ratio means. Hextile encodingmethod encodes tiles into same colour rectangles, each of which consumes 6 bytes. One tileincludes 16x16 pixels. Each tile uses one additional byte to show the number of rectangles. So ifhextile encoding is used, the number of rectangles can be estimated.
Ratio =16× 16× 4
6×Nrectangle+ 1≥ 41⇒ Nrectangle ≤ 4
The number of rectangles in one tile is at most 4. That means that it’s limited to applicationshaving few different colours, such as static documents.
When the number of viewers is up to 28 and MultiStream model is used,
T =Ndata
Bwnetwork× 1
Ratio=
183.1
125× 1
Ratio≤ 1⇒ Ratio ≥ 1.5
This means that the size of the uncompressed pixels has to be at least 1.5 times than the size of thecompressed pixels. This is easier to achieve with MultiStream model than with VNC model.
So when the capability of CPU and memory systems is infinite and Giga Ethernet is used, Multi-Stream model requires a little less ratio than VNC model.
2. If rockslcd is used, Bwmemcpy = 1470 MB/s, then
T =Ndata
Bwnetwork× 1
Ratio+
Ndata
Bwmemcpy× (1 +
1
Ratio)

5.4. Sharing Display Content with Compression 69
+Npixel × f × Cyclesforonecomparison
Frequency
=183.1
125× 1
Ratio+
183.1
1470× (1 +
1
Ratio) +
1600× 1200× 3× 20
3.2× 1024× 1024× 1024≤ 1
⇒ Ratio ≥ 1.9
That means that rockslcd can support one viewer at 25 FPS, when Ratio is more than 1.9. However,it is difficult to reach it at rockslcd. The reason is that the applications and network transmissionconsume CPU cycles. As a result, peak memory bandwidth and CPU cycles are impossible to beused for sharing display content.
3. If peak transfer rate of memory →∞ and Bwnetwork →∞, how many number of viewerscan support in one single 3.2 GHz 64-bit CPU?
The assumption peak transfer rate of memory → ∞ means that read or write can be donein one cycle. So Bwmemcpy = 3.2 ∗ 64/8 = 25.6 GB/s = 26214.4 MB/s. Ndata
Bwmemcpy =183.1
26214.4 = 0.007.
T =Ndata
Bwmemcpy× (1 +
1
Ratio) +
Npixel × f × Cyclesforonecomparison×NviewerFrequency
= 0.007× (1 +1
Ratio) +
1600× 1200× 3× 20×Nviewer3.2× 1024× 1024× 1024
≤ 1
Nviewer
⇒ Nviwer ≤ 5
That means that 3.2 GHz CPU can support only 5 viewers at maximum, even if the bandwidth ofmemory and network is infinite.
4. WhenBwmemcpy = 2 GB/s, andBwnetwork = 10 Gb/s, is it possible to support 28 viewers?
This assumption is that the bandwidth of memory copy is able to support 2 GB/s and the peakbandwidth of the network is 10 Gb/s. A 64-bit 4 GHz CPU can read or write 32 GB data persecond when read or write can be done each cycle. The cycles of one memory copy is about 18.So it’s reasonable to assume Bwmemcpy = 2 GB/s.
If VNC model is used,
T =Ndata
Bwnetwork× 1
Ratio+
Ndata
Bwmemcpy× (1 +
1
Ratio)
+Npixel × f × Cyclesforonecomparison
Frequency
T =183.1
10× 1024÷ 8× 1
Ratio+
183.1
2× 1024× (1 +
1
Ratio)
+1600× 1200× 3× 20
3.2× 1024× 1024× 1024≤ 1/28
⇒ Ratio = φ.
φ means that this ratio is impractical because the ratio is negative. That means it’s impossible toimplement 28 viewers at 25 FPS with 3.2 GHz CPU and a single thread at the same time.
If MultiStream model is used,
T =Ndata
Bwnetwork× 1
Ratio+
Ndata
Bwmemcpy× (1 +
1
Ratio)
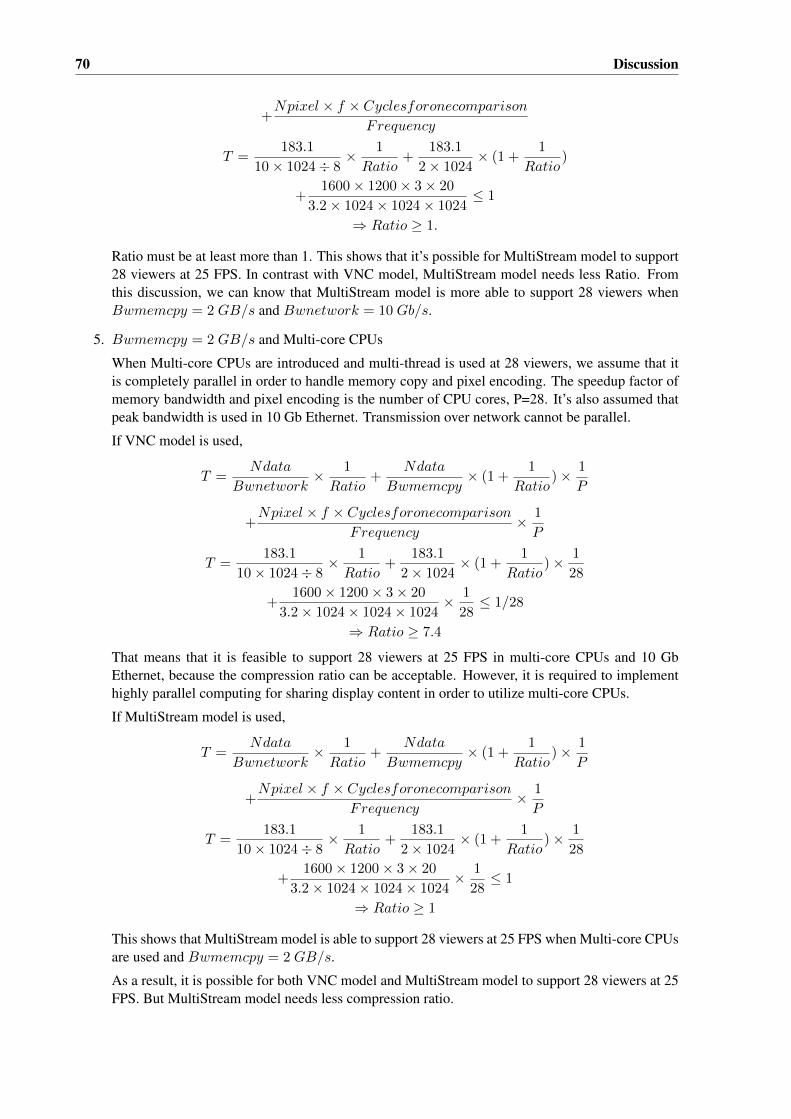
70 Discussion
+Npixel × f × Cyclesforonecomparison
Frequency
T =183.1
10× 1024÷ 8× 1
Ratio+
183.1
2× 1024× (1 +
1
Ratio)
+1600× 1200× 3× 20
3.2× 1024× 1024× 1024≤ 1
⇒ Ratio ≥ 1.
Ratio must be at least more than 1. This shows that it’s possible for MultiStream model to support28 viewers at 25 FPS. In contrast with VNC model, MultiStream model needs less Ratio. Fromthis discussion, we can know that MultiStream model is more able to support 28 viewers whenBwmemcpy = 2 GB/s and Bwnetwork = 10 Gb/s.
5. Bwmemcpy = 2 GB/s and Multi-core CPUs
When Multi-core CPUs are introduced and multi-thread is used at 28 viewers, we assume that itis completely parallel in order to handle memory copy and pixel encoding. The speedup factor ofmemory bandwidth and pixel encoding is the number of CPU cores, P=28. It’s also assumed thatpeak bandwidth is used in 10 Gb Ethernet. Transmission over network cannot be parallel.
If VNC model is used,
T =Ndata
Bwnetwork× 1
Ratio+
Ndata
Bwmemcpy× (1 +
1
Ratio)× 1
P
+Npixel × f × Cyclesforonecomparison
Frequency× 1
P
T =183.1
10× 1024÷ 8× 1
Ratio+
183.1
2× 1024× (1 +
1
Ratio)× 1
28
+1600× 1200× 3× 20
3.2× 1024× 1024× 1024× 1
28≤ 1/28
⇒ Ratio ≥ 7.4
That means that it is feasible to support 28 viewers at 25 FPS in multi-core CPUs and 10 GbEthernet, because the compression ratio can be acceptable. However, it is required to implementhighly parallel computing for sharing display content in order to utilize multi-core CPUs.
If MultiStream model is used,
T =Ndata
Bwnetwork× 1
Ratio+
Ndata
Bwmemcpy× (1 +
1
Ratio)× 1
P
+Npixel × f × Cyclesforonecomparison
Frequency× 1
P
T =183.1
10× 1024÷ 8× 1
Ratio+
183.1
2× 1024× (1 +
1
Ratio)× 1
28
+1600× 1200× 3× 20
3.2× 1024× 1024× 1024× 1
28≤ 1
⇒ Ratio ≥ 1
This shows that MultiStream model is able to support 28 viewers at 25 FPS when Multi-core CPUsare used and Bwmemcpy = 2 GB/s.
As a result, it is possible for both VNC model and MultiStream model to support 28 viewers at 25FPS. But MultiStream model needs less compression ratio.
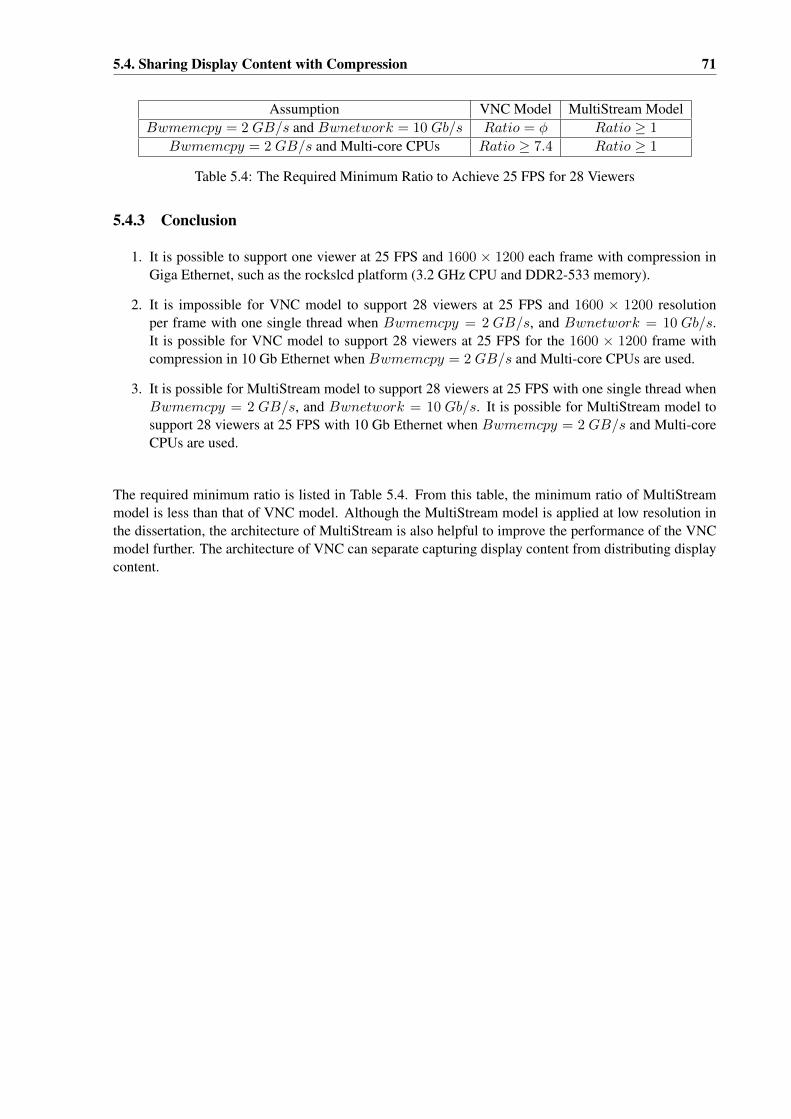
5.4. Sharing Display Content with Compression 71
Assumption VNC Model MultiStream ModelBwmemcpy = 2 GB/s and Bwnetwork = 10 Gb/s Ratio = φ Ratio ≥ 1
Bwmemcpy = 2 GB/s and Multi-core CPUs Ratio ≥ 7.4 Ratio ≥ 1
Table 5.4: The Required Minimum Ratio to Achieve 25 FPS for 28 Viewers
5.4.3 Conclusion
1. It is possible to support one viewer at 25 FPS and 1600 × 1200 each frame with compression inGiga Ethernet, such as the rockslcd platform (3.2 GHz CPU and DDR2-533 memory).
2. It is impossible for VNC model to support 28 viewers at 25 FPS and 1600 × 1200 resolutionper frame with one single thread when Bwmemcpy = 2 GB/s, and Bwnetwork = 10 Gb/s.It is possible for VNC model to support 28 viewers at 25 FPS for the 1600 × 1200 frame withcompression in 10 Gb Ethernet when Bwmemcpy = 2 GB/s and Multi-core CPUs are used.
3. It is possible for MultiStream model to support 28 viewers at 25 FPS with one single thread whenBwmemcpy = 2 GB/s, and Bwnetwork = 10 Gb/s. It is possible for MultiStream model tosupport 28 viewers at 25 FPS with 10 Gb Ethernet when Bwmemcpy = 2 GB/s and Multi-coreCPUs are used.
The required minimum ratio is listed in Table 5.4. From this table, the minimum ratio of MultiStreammodel is less than that of VNC model. Although the MultiStream model is applied at low resolution inthe dissertation, the architecture of MultiStream is also helpful to improve the performance of the VNCmodel further. The architecture of VNC can separate capturing display content from distributing displaycontent.

72 Discussion
Chapter 6
Conclusion
Hyper-display based collaboration requires sharing display content at low resolution and high resolution.We argue that a pixel level model is well suited to share display content. This model provides com-patibility with existing applications. However, this model also introduces some problems, such as highCPU and network usage. This dissertation has discussed the problems when display content is sharedat low resolution and high resolution. Two principles are presented about sharing display content at lowresolution and high resolution. Each of them is described from two dimensions, network bandwidth andprocessing.
Two different architectures for sharing display content at low resolution are a centralized, pull-model,non-distributed architecture and a decentralized, push-model, distributed architecture. We conclude thatit is possible both in principle and in practice for network bandwidth to support tens of clients with a stan-dard resolution desktop with emerging network technology in a centralized, pull-model, non-distributedarchitecture. It is not a case using a single core CPU. We also conclude that multi-core CPUs or many-core GPUs must be applied to a centralized, pull-model, non-distributed architecture. It is possiblein principle and in practice for MultiStream to support hundreds of clients today and thousands withemerging network technology in a de-centralized, push-model, distributed architecture, and it is possiblein principle and in practice for MultiStream to be handled with one single core CPU in a decentralized,push-model, distributed architecture.
The X VNC server is a centralized, non-distributed architecture. The principle is described as follows. Itis impossible in principle and in practice to drive a tens of mega-pixels display wall desktop at 25 FPSwithout using compression and with 1 Gbit Ethernet network. It is possible in principle to support itwith emerging network technology. It is possible in principle to support it with compression today. It isimpossible in principle and in practice to drive a tens of mega-pixels display wall desktop at 25 FPS witha single core. It is possible in principle to drive it at 25 FPS with emerging technology.
This PHD progress designs and implements MultiStream and display wall desktops to share displaycontent, using media streaming and VNC protocol respectively. MultiStream is designed for displaycontent at low resolution. MultiStream is a cross-platform solution to sharing display content over vari-ous display devices, which is designed to share display content over devices which have architectural andperformance differences. By using standard media players and video stream formats we reduce or avoidseveral of these complexities and performance bottlenecks. Display content is encoded as continuousvideo streaming, and a video server processes and distributes customized or fixed rate videos to view-ers. High compression ratio and the separated server node improve the performance of sharing display
73

74 Conclusion
content.
A display wall desktop is used to fill a display wall. This desktop is a high resolution 2D X serverdesktop environment, which uses the VNC protocol. It is used to utilize display wall to implement moredisplay space. The output of all VNC clients running in all tiles of display wall is put together so that aseamless X desktop is provided. VNC protocol uses lossless compression. Applications and the serverrun in the same node so that applications have to compete for computing resources against the server.According to the performance evaluation, a display wall desktop is CPU-intensive. The critical partsare data movement and pixel encoding. Three different approaches are applied to display wall desktops.These approaches use instruction level improvement, a multi-thread architecture and GPUs. Accordingto the experimental results, a multi-thread architecture gains the best improvement.

Chapter 7
Future Work
This chapter will present some possible lines for future work in a hyper-display based environment.
An evaluation system is required to be built in order to evaluate the performance of a high resolutiondisplay wall. Our evaluation system is derived from the slow motion evaluation method. Althoughwe have played back media videos to evaluate our desktop system, this method is suited well to lowresolutions. When the resolution increases, applications need more CPU cycles and have to competewith the server for CPU resources. This is the reason that we don’t use the same resolution as theresolution of the desktop. It shows that playing back videos is not fit for a high resolution desktop.At the same time, a typical usage is not evaluated in a display wall, such as navigating documents andviewing images. A new evaluation system is required to be investigated.
The performance of a high resolution display wall desktop is required to be improved further. I argue thatusing GPU is still one possible line of improvement. Although an implementation of display wall desktopis done with CUDA, the performance is a little lower than that of the Multi-thread architecture. Thisdissertation has demonstrated three improvement approaches separately to the high resolution displaywall desktop, but they were not implemented together. In the future, the further improvements must beimplemented together.
A greater compression ratio is required. A display wall is a cluster-based tiled display, which is scal-able and economical. However, computing distribution and display distribution lead to the complexityof running applications at a display wall and low performance, especially at high resolution. All of im-provements are related to the implementation of a high resolution desktop using VNC protocol. VNCprotocol supports pixel compression to save network bandwidth. But nothing does with the compressionof X11 protocol. NX can achieve 1000:1 compression of X11 data. It shows that a greater compressionratio can come from X11 data in addition to pixel compression.
3D applications are an important application area at a display wall. It is necessary for a display wall tosupport 3D applications at a display wall desktop. However, VNC protocol cannot support 3D directly.The possible solution is to forward 3D commands to tiles at a display wall, and the tiles render 3D output.
Usage and performance of mobile display devices are required to be demonstrated further at a displaywall. Although MultiStream supports mobile devices to view display content, we didn’t evaluate systemperformance, such as how many devices can be supported in a wireless network and what is the adaptionperformance of display content from one resolution to another resolution.
75

76 Future Work
How many pixels are best suited to display wall collaboration? We use a display wall desktop at 22mega-pixels now. It is possible to change resolutions to tradeoff the visualization space and the framerate. We require investigation of how resolutions affect information navigation.


Bibliography
[1] AutoSim AS. http://www.autosim.no/.
[2] RealVNC. http://www.realvnc.com/.
[3] Sharp 108-inch LCD. http://www.sharp-world.com/corporate/news/080613.html.
[4] Gene M. Amdahl. Validity of the single processor approach to achieving large scale computingcapabilities. In AFIPS ’67 (Spring): Proceedings of the April 18-20, 1967, spring joint computerconference, pages 483–485, New York, NY, USA, 1967. ACM.
[5] Ricardo A. Baratto, Leonard N. Kim, and Jason Nieh. Thinc: a virtual display architecture forthin-client computing. In SOSP ’05: Proceedings of the twentieth ACM symposium on Operatingsystems principles, pages 277–290, New York, NY, USA, 2005. ACM.
[6] Anastasia Bezerianos. Using alternative views for layout, comparison and context switching tasksin wall displays. In OZCHI ’07: Proceedings of the 19th Australasian conference on Computer-Human Interaction, pages 303–310, New York, NY, USA, 2007. ACM.
[7] Ezekiel S. Bhasker, Ray Juang, and Aditi Majumder. Advances towards next-generation flexiblemulti-projector display walls. In EDT ’07: Proceedings of the 2007 workshop on Emerging displaystechnologies, page 11, New York, NY, USA, 2007. ACM.
[8] Nicole Bordes and Bernard Pailthorpe. High resolution scalable displays: manufacturing and use.In APVis ’04: Proceedings of the 2004 Australasian symposium on Information Visualisation, pages151–156, Darlinghurst, Australia, Australia, 2004. Australian Computer Society, Inc.
[9] Ian Buck, Greg Humphreys, and Pat Hanrahan. Tracking graphics state for networked rendering.In HWWS ’00: Proceedings of the ACM SIGGRAPH/EUROGRAPHICS workshop on Graphicshardware, pages 87–95, New York, NY, USA, 2000. ACM.
[10] Don Burns and Robert Osfield. Open scene graph a: Introduction, b: Examples and applications.In VR ’04: Proceedings of the IEEE Virtual Reality 2004, page 265, Washington, DC, USA, 2004.IEEE Computer Society.
[11] David R. Butenhof. Programming with POSIX threads. Addison-Wesley Longman Publishing Co.,Inc., Boston, MA, USA, 1997.
[12] Han Chen, Rahul Sukthankar, Grant Wallace, and Kai Li. Scalable alignment of large-format multi-projector displays using camera homography trees. In VIS ’02: Proceedings of the conference onVisualization ’02, pages 339–346, Washington, DC, USA, 2002. IEEE Computer Society.
[13] Brian Craiq Cumberland, Andrew Muir, and Gavin Carius. Microsoft windows nt server 4.0, ter-minal server edition: Technical reference. Microsoft Press, 1999.
121

Bibliography
[14] Marek Czernuszenko, Dave Pape, Daniel Sandin, Tom DeFanti, Gregory L. Dawe, and Maxine D.Brown. The immersadesk and infinity wall projection-based virtual reality displays. SIGGRAPHComput. Graph., 31(2):46–49, 1997. 271303.
[15] Mary Czerwinski, George Robertson, Brian Meyers, Greg Smith, Daniel Robbins, and Desney Tan.Large display research overview. In CHI ’06: CHI ’06 extended abstracts on Human factors incomputing systems, pages 69–74, New York, NY, USA, 2006. ACM.
[16] R. E. Faith and K. E. Martin. Xdmx: distributed multi-head x. http://dmx.sourceforge.net/.
[17] X Web FAQ. http://www.broadwayinfo.com/bwfaq.htm.
[18] FFmpeg. http://ffmpeg.mplayerhq.hu/.
[19] FreeNX. http://freenx.berlios.de/.
[20] Khronos Group. Opencl. http://www.khronos.org/opencl/.
[21] Greg Humphreys, Matthew Eldridge, Ian Buck, Gordan Stoll, Matthew Everett, and Pat Hanrahan.Wiregl: a scalable graphics system for clusters. In SIGGRAPH ’01: Proceedings of the 28th annualconference on Computer graphics and interactive techniques, pages 129–140, New York, NY, USA,2001. ACM.
[22] Greg Humphreys, Mike Houston, Ren Ng, Randall Frank, Sean Ahern, Peter D. Kirchner, andJames T. Klosowski. Chromium: a stream-processing framework for interactive rendering on clus-ters. ACM Trans. Graph., 21(3):693–702, 2002. 566639.
[23] Intel. Excerpts from a conversation with gordon moore: Moore’s law.In Video transcript. ftp://download.intel.com/museum/Moores Law/Video-Transcripts/Excepts A Conversation with Gordon Moore.pdf, 2005.
[24] Intel. Intel R© 64 and ia-32 architectures software developer’s manual volume 1: Basic architecture.http://www.intel.com/design/processor/manuals/253665.pdf, 2008.
[25] Christopher Jaynes. Ultra displays and the challenge of unlimited resolution. In EDT ’07: Pro-ceedings of the 2007 workshop on Emerging displays technologies, page 10, New York, NY, USA,2007. ACM.
[26] Byungil Jeong, Luc Renambot, Ratko Jagodic, Rajvikram Singh, Julieta Aguilera, Andrew John-son, and Jason Leigh. High-performance dynamic graphics streaming for scalable adaptive graphicsenvironment. In SC ’06: Proceedings of the 2006 ACM/IEEE conference on Supercomputing, page108, New York, NY, USA, 2006. ACM.
[27] Ed Lantz. A survey of large-scale immersive displays. In EDT ’07: Proceedings of the 2007workshop on Emerging displays technologies, page 1, New York, NY, USA, 2007. ACM.
[28] James Larus. Spending moore’s dividend. Commun. ACM, 52(5):62–69, 2009.
[29] J. Levon. Oprofile. http://oprofile.sourceforge.net.
[30] Kai Li, Han Chen, Yuqun Chen, Douglas W. Clark, Perry Cook, Stefanos Damianakis, GeorgEssl, Adam Finkelstein, Thomas Funkhouser, Timothy Housel, Allison Klein, Zhiyan Liu, EmilPraun, Rudrajit Samanta, Ben Shedd, Jaswinder Pal Singh, George Tzanetakis, and Jiannan Zheng.Building and using a scalable display wall system. IEEE Comput. Graph. Appl., 20(4):29–37, 2000.
[31] Christian Ludloff. sandpile. http://www.sandpile.org/, 2008.

123
[32] Rick Merritt. Cpu designers debate multi-core feature. EE Times, 2008.
[33] Gordon E. Moore. Cramming more components onto integrated circuits. Electronics, 1965.
[34] Tao Ni, Doug A. Bowman, and Jian Chen. Increased display size and resolution improve taskperformance in information-rich virtual environments. In GI ’06: Proceedings of Graphics Inter-face 2006, pages 139–146, Toronto, Ont., Canada, Canada, 2006. Canadian Information ProcessingSociety.
[35] Jason Nieh, S. Jae Yang, and Naomi Novik. Measuring thin-client performance using slow-motionbenchmarking. ACM Trans. Comput. Syst., 21(1):87–115, 2003.
[36] NVIDIA. Nvidia cuda architecture. http://developer.download.nvidia.com/compute/cuda/docs/CUDA Architecture Overview.pdf.
[37] NVIDIA. Gtx 295. http://www.nvidia.com/object/product geforce gtx 295 us.html, 2009.
[38] NoMachine NX. http://www.nomachine.com/.
[39] The University of Minnesota. Powerwall. http://www.lcse.umn.edu/research/powerwall/powerwall.html.
[40] Keith Packard. An lbx postmortem. http://keithp.com/ keithp/talks/lbxpost/paper.html.
[41] Keith Packard. Designing lbx: An experiment based standard. In Eighth Annual X TechnicalConference. The X Resource no. 9, O’Reilly & Associates, 1994.
[42] Jeff Parkhurst, John Darringer, and Bill Grundmann. From single core to multi-core: preparing fora new exponential. In ICCAD ’06: Proceedings of the 2006 IEEE/ACM international conferenceon Computer-aided design, pages 67–72, New York, NY, USA, 2006. ACM.
[43] Kenneth A. Perrine and Donald R. Jones. Parallel graphics and interactivity with the scaleablegraphics engine. Proceedings of the 2001 ACM/IEEE conference on Supercomputing, pages 5–5,November 2001.
[44] Portable Network Graphics (PNG). http://www.libpng.org/pub/png/.
[45] VNC proxy. http://vncproxy.sourceforge.net/.
[46] Tristan Richardson. The rfb protocol. http://www.realvnc.com/docs/rfbproto.pdf, 2009.
[47] Tristan Richardson, Quentin Stafford-Fraser, Kenneth R. Wood, and Andy Hopper. Virtual networkcomputing. IEEE Internet Computing, 2(1):33–38, 1998. 613221.
[48] Denis Robilliard, Virginie Marion, and Cyril Fonlupt. High performance genetic programming ongpu. In BADS ’09: Proceedings of the 2009 workshop on Bio-inspired algorithms for distributedsystems, pages 85–94, New York, NY, USA, 2009. ACM.
[49] Daniel R. Schikore, Richard A. Fischer, Randall Frank, Ross Gaunt, John Hobson, and Brad Whit-lock. High resolution multiprojector display walls. Computer Graphics and Applications, IEEE,20(4):38–44, 2000.
[50] Brian K. Schmidt, Monica S. Lam, and J. Duane Northcutt. The interactive performance of slim:a stateless, thin-client architecture. In SOSP ’99: Proceedings of the seventeenth ACM symposiumon Operating systems principles, pages 32–47, New York, NY, USA, 1999. ACM.
[51] Mark Segal and Kurt Akeley. The opengl graphics system: A specification (version 2.1). 2006.

Bibliography
[52] SGI. Opengl vizserver 3.5: Application-transparent remote interactive visualization and collabora-tion. http://www.sgi.com, 2005.
[53] Andrew Shaw, Karl Richard Burgess, John Marcus Pullan, and Peter Charles Cartwright. Methodof display an application on a variety of client devices in a client/server network. United StatesPatent, patent number: 6104392, 2000.
[54] R. Singh, Byungil Jeong, L. Renambot, A. Johnson, and J. Leigh. Teravision: a distributed, scal-able, high resolution graphics streaming system. In CLUSTER ’04: Proceedings of the 2004 IEEEInternational Conference on Cluster Computing, pages 391–400, Washington, DC, USA, 2004.IEEE Computer Society.
[55] Oliver G. Staadt, Benjamin A. Ahlborn, Oliver Kreylos, and Bernd Hamann. A foveal inset for largedisplay environments. In VRCIA ’06: Proceedings of the 2006 ACM international conference onVirtual reality continuum and its applications, pages 281–288, New York, NY, USA, 2006. ACM.
[56] Carl Staelin and Hewlett packard Laboratories. lmbench: Portable tools for performance analysis.In In USENIX Annual Technical Conference, pages 279–294, 1996.
[57] Rod Sterling. Jvc d-ila high resolution, high contrast projectors and applications. In IPT/EDT’08: Proceedings of the 2008 workshop on Immersive projection technologies/Emerging displaytechnologiges, pages 1–6, New York, NY, USA, 2008. ACM.
[58] Gordon Stoll, Matthew Eldridge, Dan Patterson, Art Webb, Steven Berman, Richard Levy, ChrisCaywood, Milton Taveira, Stephen Hunt, and Pat Hanrahan. Lightning-2: a high-performancedisplay subsystem for pc clusters. In SIGGRAPH ’01: Proceedings of the 28th annual conferenceon Computer graphics and interactive techniques, pages 141–148, New York, NY, USA, 2001.ACM.
[59] Wei Sun, Irwin Sobel, Bruce Culbertson, Dan Gelb, and Ian Robinson. Calibrating multi-projectorcylindrically curved displays for ”wallpaper” projection. In PROCAMS ’08: Proceedings of the 5thACM/IEEE International Workshop on Projector camera systems, pages 1–8, New York, NY, USA,2008. ACM.
[60] T220/221. http://en.wikipedia.org/wiki/IBM T220/T221 LCD monitors.
[61] Desney S. Tan, Darren Gergle, Peter Scupelli, and Randy Pausch. With similar visual angles, largerdisplays improve spatial performance. In CHI ’03: Proceedings of the SIGCHI conference onHuman factors in computing systems, pages 217–224, New York, NY, USA, 2003. ACM.
[62] Desney S. Tan, Darren Gergle, Peter Scupelli, and Randy Pausch. Physically large displays improveperformance on spatial tasks. ACM Trans. Comput.-Hum. Interact., 13(1):71–99, 2006. 1143521.
[63] TightVNC. http://www.tightvnc.com/.
[64] Ilkka Tuomi. The lives and death of moore’s law. First Monday, 7(11), 2002.
[65] Manuel Ujaldon and Nicolas Guil. High performance circle detection through a gpu rasterizationapproach. In IbPRIA ’09: Proceedings of the 4th Iberian Conference on Pattern Recognition andImage Analysis, pages 273–281, Berlin, Heidelberg, 2009. Springer-Verlag.
[66] Wikipedia. Intel pentium 4. http://en.wikipedia.org/wiki/List of Intel Pentium 4 microprocessors,2010.
[67] Xinerama. http://sourceforge.net/projects/xinerama/.

125
[68] Beth Yost, Yonca Haciahmetoglu, and Chris North. Beyond visual acuity: the perceptual scalabilityof information visualizations for large displays. In CHI ’07: Proceedings of the SIGCHI conferenceon Human factors in computing systems, pages 101–110, New York, NY, USA, 2007. ACM.
[69] Jin Zhou, Liang Wang, Amir Akbarzadeh, and Ruigang Yang. Multi-projector display with continu-ous self-calibration. In PROCAMS ’08: Proceedings of the 5th ACM/IEEE International Workshopon Projector camera systems, pages 1–7, New York, NY, USA, 2008. ACM.


ISBN