Replacing Mineral Fertilisers for Bio-Based ... - WUR eDepot
21
Citation: Hendriks, C.M.J.; Shrivastava, V.; Sigurnjak, I.; Lesschen, J.P.; Meers, E.; Noort, R.v.; Yang, Z.; Rietra, R.P.J.J. Replacing Mineral Fertilisers for Bio-Based Fertilisers in Potato Growing on Sandy Soil: A Case Study. Appl. Sci. 2022, 12, 341. https://doi.org/ 10.3390/app12010341 Academic Editors: Marco Grella, Fabrizio Stefano Gioelli, Paolo Marucco and Jordi Llop Casamada Received: 2 December 2021 Accepted: 27 December 2021 Published: 30 December 2021 Publisher’s Note: MDPI stays neutral with regard to jurisdictional claims in published maps and institutional affil- iations. Copyright: © 2021 by the authors. Licensee MDPI, Basel, Switzerland. This article is an open access article distributed under the terms and conditions of the Creative Commons Attribution (CC BY) license (https:// creativecommons.org/licenses/by/ 4.0/). applied sciences Article Replacing Mineral Fertilisers for Bio-Based Fertilisers in Potato Growing on Sandy Soil: A Case Study Chantal M. J. Hendriks 1, * ,† , Vaibhav Shrivastava 2,† , Ivona Sigurnjak 2 , Jan Peter Lesschen 1 , Erik Meers 2 , Rembert van Noort 3 , Zhongchen Yang 4 and Rene P. J. J. Rietra 1 1 Team Sustainable Soil Management, Wageningen Environmental Research, Wageningen University & Research, P.O. Box 47, 6700 AA Wageningen, The Netherlands; [email protected] (J.P.L.); [email protected] (R.P.J.J.R.) 2 Department of Green Chemistry and Technology, Faculty of Bioscience Engineering, Ghent University, Coupure Links 653, 9000 Ghent, Belgium; [email protected] (V.S.); [email protected] (I.S.); [email protected] (E.M.) 3 Southern Agriculture and Horticulture Organisation (ZLTO), Onderwijsboulevard 225, 5223 DE ’s-Hertogenbosch, The Netherlands; [email protected] 4 Team Animal Drug 2, Wageningen Food Safety Research, Wageningen University & Research, P.O. Box 47, 6700 AA Wageningen, The Netherlands; [email protected] * Correspondence: [email protected] † These authors contributed equally to this manuscript. Featured Application: Use bio-based fertilisers as a replacement for mineral fertiliser or slurry manure. Abstract: The refinement level of bio-based fertilisers (BBFs) can influence environmental and agronomic performance. This study analyses the environmental and agronomic effect of different BBFs on potato growing in sandy soil. A less refined product (liquid fraction of digestate (LFD)), two refined products (ammonium sulphate (AS) and potassium concentrate (KC)), and mineral fertilizer (MF) are compared by conducting: (i) a nitrogen (N) incubation experiment where the N release rate of the BBFs is determined, (ii) a greenhouse gas emission experiment where N 2 O, CO 2 , and CH 4 emissions after BBF application are measured, (iii) a pot experiment where the nutrient fertiliser replacement value (NFRV) of the BBF is calculated, and (iv) a full-scale field trial where the potato quality and quantity and the remaining N residues in the soil after harvest are assessed. The N release rate and the NFRV of AS (142 ± 19% and 1.13, respectively) was higher compared with the LFD (113 ± 24% and 1.04) and MF (105 ± 16% and 1.00). Lowest N 2 O emissions were observed after the application of the less refined product (0.02 ± 0.01 per 100 g N applied) and highest for MF urea (0.11 ± 0.02 per 100 g N applied). In the full-scale field trial, no significant difference in potato yield was observed in the plots that received manure in combination with BBF or MF. This study showed that all three BBFs can safely be used in potato growing on sandy soils. However, the adoption of BBFs can be stimulated by (i) solving the practical issues that occurred during the application of LFD, (ii) making sure BBFs are on the list of RENURE materials so they can legally replace mineral fertiliser, and (iii) reducing the surplus of slurry manure to stimulate the use and fair pricing of BBF products. Keywords: agricultural circularity; sustainable agriculture; environmental impact; manure process- ing; GHG emissions; fertiliser replacement value 1. Introduction European farming systems are among the most efficient production systems in the world [1]. However, these systems are often input-intensive as they consume large quanti- ties of mineral fertiliser, water, fuel and pesticides [2]. In Europe, 46% of the total N applied to agricultural soil comes from mineral fertiliser [3]. A transition towards sustainable Appl. Sci. 2022, 12, 341. https://doi.org/10.3390/app12010341 https://www.mdpi.com/journal/applsci
-
Upload
khangminh22 -
Category
Documents
-
view
0 -
download
0
Transcript of Replacing Mineral Fertilisers for Bio-Based ... - WUR eDepot
�����������������
Citation: Hendriks, C.M.J.;
Shrivastava, V.; Sigurnjak, I.;
Lesschen, J.P.; Meers, E.; Noort, R.v.;
Yang, Z.; Rietra, R.P.J.J. Replacing
Mineral Fertilisers for Bio-Based
Fertilisers in Potato Growing on
Sandy Soil: A Case Study. Appl. Sci.
2022, 12, 341. https://doi.org/
10.3390/app12010341
Academic Editors: Marco Grella,
Fabrizio Stefano Gioelli,
Paolo Marucco and Jordi Llop
Casamada
Received: 2 December 2021
Accepted: 27 December 2021
Published: 30 December 2021
Publisher’s Note: MDPI stays neutral
with regard to jurisdictional claims in
published maps and institutional affil-
iations.
Copyright: © 2021 by the authors.
Licensee MDPI, Basel, Switzerland.
This article is an open access article
distributed under the terms and
conditions of the Creative Commons
Attribution (CC BY) license (https://
creativecommons.org/licenses/by/
4.0/).
applied sciences
Article
Replacing Mineral Fertilisers for Bio-Based Fertilisers in PotatoGrowing on Sandy Soil: A Case StudyChantal M. J. Hendriks 1,*,†, Vaibhav Shrivastava 2,† , Ivona Sigurnjak 2, Jan Peter Lesschen 1, Erik Meers 2 ,Rembert van Noort 3, Zhongchen Yang 4 and Rene P. J. J. Rietra 1
1 Team Sustainable Soil Management, Wageningen Environmental Research, Wageningen University &Research, P.O. Box 47, 6700 AA Wageningen, The Netherlands; [email protected] (J.P.L.);[email protected] (R.P.J.J.R.)
2 Department of Green Chemistry and Technology, Faculty of Bioscience Engineering, Ghent University,Coupure Links 653, 9000 Ghent, Belgium; [email protected] (V.S.);[email protected] (I.S.); [email protected] (E.M.)
3 Southern Agriculture and Horticulture Organisation (ZLTO), Onderwijsboulevard 225,5223 DE ’s-Hertogenbosch, The Netherlands; [email protected]
4 Team Animal Drug 2, Wageningen Food Safety Research, Wageningen University & Research, P.O. Box 47,6700 AA Wageningen, The Netherlands; [email protected]
* Correspondence: [email protected]† These authors contributed equally to this manuscript.
Featured Application: Use bio-based fertilisers as a replacement for mineral fertiliser or slurrymanure.
Abstract: The refinement level of bio-based fertilisers (BBFs) can influence environmental andagronomic performance. This study analyses the environmental and agronomic effect of differentBBFs on potato growing in sandy soil. A less refined product (liquid fraction of digestate (LFD)), tworefined products (ammonium sulphate (AS) and potassium concentrate (KC)), and mineral fertilizer(MF) are compared by conducting: (i) a nitrogen (N) incubation experiment where the N release rateof the BBFs is determined, (ii) a greenhouse gas emission experiment where N2O, CO2, and CH4
emissions after BBF application are measured, (iii) a pot experiment where the nutrient fertiliserreplacement value (NFRV) of the BBF is calculated, and (iv) a full-scale field trial where the potatoquality and quantity and the remaining N residues in the soil after harvest are assessed. The N releaserate and the NFRV of AS (142 ± 19% and 1.13, respectively) was higher compared with the LFD(113 ± 24% and 1.04) and MF (105 ± 16% and 1.00). Lowest N2O emissions were observed after theapplication of the less refined product (0.02 ± 0.01 per 100 g N applied) and highest for MF urea(0.11 ± 0.02 per 100 g N applied). In the full-scale field trial, no significant difference in potato yieldwas observed in the plots that received manure in combination with BBF or MF. This study showedthat all three BBFs can safely be used in potato growing on sandy soils. However, the adoption ofBBFs can be stimulated by (i) solving the practical issues that occurred during the application of LFD,(ii) making sure BBFs are on the list of RENURE materials so they can legally replace mineral fertiliser,and (iii) reducing the surplus of slurry manure to stimulate the use and fair pricing of BBF products.
Keywords: agricultural circularity; sustainable agriculture; environmental impact; manure process-ing; GHG emissions; fertiliser replacement value
1. Introduction
European farming systems are among the most efficient production systems in theworld [1]. However, these systems are often input-intensive as they consume large quanti-ties of mineral fertiliser, water, fuel and pesticides [2]. In Europe, 46% of the total N appliedto agricultural soil comes from mineral fertiliser [3]. A transition towards sustainable
Appl. Sci. 2022, 12, 341. https://doi.org/10.3390/app12010341 https://www.mdpi.com/journal/applsci

Appl. Sci. 2022, 12, 341 2 of 21
agriculture is needed, not only to reduce the environmental impact of agricultural systems,but also to become more resilient to economic and societal challenges such as fluctuatingproduction prices, changing consumer behaviour, and extreme weather events. Awarenessof the urgency for sustainable and resilient farming systems has increased among policymakers, businesses, and the scientific community [4]. The European Commission empha-sises this by the large number of policy initiatives that were recently established: the EUGreen Deal, Farm to Fork Strategy, Chemicals Strategy for Sustainability, New EU Strategyon Adaptation to Climate Change, Organic Farming Action Plan, Zero Pollution ActionPlan for Air, Water and Soil, New Soil Strategy, Fertilizing Product Regulation revision, andthe Fit for 55 Climate Package.
One way to stimulate the transition towards sustainable and resilient farming systemsis circular agriculture because it aims to minimise external inputs and negative dischargesto the environment, and to close nutrient cycles. Therefore, it allows crop and livestockproduction without the depletion of non-renewable sources and harming the environment.In 2018, the European agricultural sector consumed 10.2 million tonnes of mineral nitrogen(N) fertiliser and 1.1 million tonnes of mineral phosphorus (P) fertiliser [5]. Reducingthese numbers by using technologies that valorise biowaste into bio-based fertiliser (BBF)products can stimulate circularity [6–10]. Different techniques have been developed forthe recycling of nutrients from biowaste [11]. For example, liquid and solid separationcan be carried out through centrifuge, screw or belt press, and pressurized membranefiltration techniques such as microfiltration, ultrafiltration, or reversed osmosis can be usedto refine the products [11,12]. BBF products that meet the criteria of being referred to asrecovered nitrogen from manure (RENURE) are safe to use as N fertiliser [13]. However,criteria define quality and handling rules that BBF should comply in order to be classifiedas RENURE [13]. This process of being classified as RENURE product is still ongoing forseveral BBFs.
The adoption of (potential) RENURE products in the agricultural sector depends oncollaborations between the biowaste producers (e.g., pig farmers), biowaste processingindustry, and end users of BBFs. This study collaborated with all three stakeholders and incombination with laboratory and pot and field experiments, this study provides a uniqueand complete picture of the potential adoption of the tested BBFs. This way of analysingthe adoption of BBFs is important because each stakeholder has different interests [6]. Forexample, factors influencing the decision of end users to adopt BBFs depends especiallyon the agronomic efficiency of BBFs [14]. These end users are questioning whether theagronomic efficiency of refined or less refined BBFs differs. Therefore, the hypothesis ofthis study is to test whether refined BBFs perform environmentally and agronomicallybetter compared with less-refined BBFs. This study aims to analyse the environmental andagronomic effect of using BBFs that differ in refinement level.
2. Materials and Methods
The following experiments were carried out in this study: (i) a nitrogen (N) incubationexperiment where the N release rate of the BBFs is determined, (ii) a greenhouse gasemission experiment where the N2O, CO2, and CH4 emissions after BBF application aremeasured, (iii) a pot experiment where the nutrient fertiliser replacement value (NFRV) ofthe BBF is calculated, and (iv) a full-scale field trial where the potato quality and quantityand the remaining N residues in the soil after harvest are assessed.
2.1. Study Area2.1.1. Bio-Based Fertiliser Products
Three BBFs were investigated in this study and compared with mineral fertiliser (MF):liquid fraction of digestate (LFD); potassium concentrate (KC); and ammonium sulphatesolution (AS). The BBFs were obtained from a mesophilic (38 ◦C) anaerobic co-digestion(AD) plant located at the premises of a pig farmer in Oirschot (the Netherlands). The biogasinstallation produces 1000 m3 gas h−1, which corresponds to 9.8 MWh. The AD plant has a

Appl. Sci. 2022, 12, 341 3 of 21
hydraulic retention time of 30 days, and an input feed consisting of 60% pig slurry and 40%plant-based products (i.e., crop residues, food waste). LFD was obtained after mechanicalseparation of raw digestate by means of a belt filter press system. The product was furtherrefined for the production of AS and KC by inducing ammonia volatilisation from LFD in a4-stage thermal vacuum evaporation system during increased temperature regime. Theammonia rich gas stream was washed by H2SO4 solution to dissolve ammonia and formAS. After the evaporation of LFD, most of the N was removed and the remaining productis characterised by a high concentration of suspended solids and potassium, referred to asKC.
The chemical composition of the BBFs is reported in Table 1. Each BBF was analysedby a certified laboratory that uses standardized methods, and therefore it was assumedthat the analysis of a single sample was representative for the entire BBF batch. The sameapplies to the other analyses carried out in this study. The dry matter (DM) content wasdetermined as the residual weight after 48 h of drying at 105 ◦C. Organic matter (OM) ofthe applied products was determined by ashing the samples at 550 ◦C for 5 h. Total Nwas determined using Kjeldahl destruction, whereas NH4
+-N and NO3-N (excluded fromTable 1) were measured colourimetrically by a continuous flow auto-analyser (ChemlabSystem 4, Skalar, the Netherlands) after subsequent extraction in 1 M KCl, conform ISO14256. The organic N was further calculated by subtracting mineral N (i.e., NH4
+-N andNO3-N) from total N. The total carbon was analysed by using dumas dry combustionmethod. The total organic carbon (TOC) was measured using the MachereyNagel 985093method and measuring the solution in a P-PRO-32 spectrophotometer (Macherey-Nagel,Düren, Germany). To analyse the P and K content, the BBFs were pre-treated accordingto NEN7431, P and K were extracted according to NEN7433, and analysed according toNEN7435. During pre-treatment, the products were homogenised, dried, and crushed.For the extraction, sulphuric acid, hydrogen peroxide, and copper sulphate were used.The P content was analysed using the continuous flow auto-analyser (Chemlab System4, Skalar, the Netherlands), and the K content was analysed using inductively coupledplasma optical emission spectrometry (ICP-OES) (Varian Vista MPX, Santa Clara, California,USA). The sulphur (S) content was measured by DIN EN ISO 11885: 2009-09, EG2003/2003.The pH and electrical conductivity (EC) were determined on the fresh sample using anOrion-520A pH meter (USA) and Orion-star A212 conductivity meter, respectively. Allthree experiments used the BBFs from the same batch to avoid potential differences inchemical composition of the tested products.
Table 1. The chemical composition of ammonium sulphate (AS), potassium concentrate (KC), liquidfraction of the digestate (LFD), and pig slurry manure (Man).
DryMatter
%
OMg kg−1
Ng kg−1
NH4+-N
g kg−1Organic N
g kg−1Total Cg kg−1
TOCg L−1
C/NRatio
Pg kg−1
Kg kg−1
Sg kg−1 pH EC mS
cm−1
AS 36 N/A 81.6 81.6 N/A 0.3 0.1 N/A 0.1 N/A 11.9 2.8 278KC 12 69 6.4 2.5 3.9 41.4 27.8 6.5 4.9 20.7 3 7.4 59
LFD 3 9 4.5 3.7 0.8 9.2 2.8 2 0.7 6.9 0.1 8.0 44Man 3.8 2.4 4.0
TOC: total organic carbon; EC: electrical conductivity; OM: organic matter; total K and OM were not detected inAS solution.
2.1.2. Bio-Based Fertiliser End User
The agronomic and environmental performance of two BBFs were tested in a cropfield of a potato farmer that specialises in using precision agriculture. This field experimentwas carried at a field in Eersel (51◦21′14.6” N, 5◦19′58.0” E), 34 km from the location wherethe BBFs were produced. The crop rotation is based on one year of potato and three yearsof maize. The soil is typically referred to as a plaggic Anthrosol [15], which indicates thatthe topsoil is enriched by OM through the plaggic farming system that existed in the areabefore mineral fertiliser started to be used. The subsoil is poor in OM and consists of coversand, which was deposited during the Weichselian glaciation. The elevation of the field

Appl. Sci. 2022, 12, 341 4 of 21
ranges from 25.4 m above sea level in the east to 26.2 m above sea level in the west. Theweather during the growing season was extremely dry and warm (Appendix A) and thefarmer did not have the capacity to apply irrigation.
Soil of the topsoil layer (0–30 cm, loamy sand) was collected from this crop fieldin April 2020 and used for the experiments on the N release rate, the GHG emissions,and the nutrient fertiliser replacement value (NFRV). The soil characteristics are given inTable 2. Near infrared spectroscopy (NIRS) and CaCl2 extraction, common practices of thelaboratory Eurofins, were used for the soil analysis and the analysis was elaborated witha fertiliser recommended for consumption potato (Table 2). The soil of the potato field isrich in potassium (K) and therefore it is not recommended to test the NFRV of KC on thissoil. A K-poor soil was used instead for NFRV determination (Wageningen, 51◦59′14.8” N,5◦39′54.4” E). The texture of the K-poor soil is also loamy sand (88% sand, 6% silt, and 2%clay), with a pH-H2O of 6, OM content of 3.6%, an initial total N and mineral N contentof 3930 kg N ha−1 and 45 kg N ha−1, respectively (Table 2). For the analyses, the N or Kapplication rate varied while other nutrients were kept at optimal condition by followingthe fertiliser recommendation for consumption potatoes.
Table 2. Initial characteristics of the two soils that were used for this study and the fertiliser recom-mendations for growing consumption potatoes.
Soil Characteristics Fertiliser Recommendation
Potato FieldSoil K-Poor Soil Potato Field
Soil K-Poor Soil
N total stock (kg ha−1) 4030 3930N-supply capacity (kg ha−1) 60 45 N kg ha−1 yr−1 310 310
C/N-ratio 13 17Plant available S (kg ha−1) 4 161 SO3 kg ha−1 yr−1 23 23Plant available P (kg ha−1) 6.5 5.4 P2O5 kg ha−1 yr−1 0 60Plant available K (kg ha−1) 500 115 K2O kg ha−1 yr−1 70 265Plant available Ca (kg ha−1) 190 55 CaO kg ha−1 yr−1 75 75Plant available Mg (kg ha−1) 300 115 MgO kg ha−1 yr−1 0 21Plant available Na (kg ha−1) <20 <20
pH 5.8 6C-organic (%) 1.5 2
OM (%) 3.1 3.6 Effective OM kgha−1 yr−1 1020 1095
Clay (%) 2 2Silt (%) 12 6
Sand (%) 83 88
OM: organic matter.
2.2. N Release Rate of Bio-Based Fertilisers
An incubation experiment was set-up to test the mineralisation rate of BBFs. Prior tothe incubations, the soil was air-dried for 5 weeks and sieved through a 2 mm screen. Afterair-drying and sieving, the collected soil was pre-incubated at 35% water-filled pore space(WFPS) for a week. Following existing procedures [16,17], 271 g of pre-incubated soil wasmixed with AS, LFD, or KC, and calcium ammonium nitrate (CAN; 30%) that was used asa reference for the experiment. Additionally, unfertilised soil was used as a control for alltreatments. After mixing the soil and respective fertiliser thoroughly, the mixture was filledin cylindrical tubes (dimensions: 18cm height, 3.6cm diameter) and compacted to the bulkdensity of 1.4 Mg m−3 (10 cm compacted height). Subsequently, the WFPS of the mixturewas increased to 50% using distilled water. A total of 120 tubes (4 replicates × 5 treatments× 6 sampling moments) were incubated for 120 days. The fertilisers were added at thedose corresponding to 170 kg total N ha−1 yr−1, which is the maximum permissible limitof livestock manure in the nitrate vulnerable zones [18].

Appl. Sci. 2022, 12, 341 5 of 21
At every 20 day interval, destructive sampling was done during which 10 g of soil pertube was mixed with 50mL of 1M KCl, and the suspension was shaken end-over-end for 30min, and subsequently filtered. The filtrate was measured colourimetrically by a continuousflow auto-analyser (Chemlab System 4, Skalar, the Netherlands) for the determination ofammonium (NH4
+-N) and nitrate (NO3−-N). For the N incubations, the net N-release
(Nrel,net, Equation (1)) and N-mineralisation rate (Nmin,net, Equation(2)) were calculated.The net N release is the difference between mineral-N available in the fertilized soil andmineral-N available in the control (Ncontrol) divided over the total N applied in the fertilisedtreatment (Equation (1)) [19].
Nrel,net(%) =([NO−3 −N,treatment]−[NO−3 −N,control])+([NH+
4 −N,treatment]−[NH+4 −N,control])
Ntotal applied × 100 (1)
The calculation of Nmin,net was carried out via subtracting net N release rate at aparticular time (Nrel,net(t)) with the amount of mineral N already present in the products atthe start of the experiment ((Nrel,net(t = 0)) [20] (Equation (2)).
Nmin,net(t; %total N) = Nrel,net(t)− Nrel,net(t = 0) (2)
A positive value in the above equation signifies the net mineralisation and a negativevalue indicates immobilisation.
2.3. GHG Emissions of the Bio-Based Fertilisers after Soil Application
A GHG experiment was conducted under controlled conditions in soil microcosms tostudy the outcome of fertiliser addition on soil respiration under controlled conditions. Forthis, the air-dried soil was pre-incubated at 40% WFPS for 7 days followed by applicationof fertilisers at 170 kg N/ha soil and incubation at 80% WPFS. Each microcosm was madeusing a 1L borosilicate glass bottle (height—23.6 cm, diameter—10.8 cm) fitted with a GL45-thread smart cap (model: SW45-2A). Each smart cap has two 2 mm threaded openings thatcan be closed with blind plugs or fitted with valves to serve as inlet and outlet ports forsampling.
At 80% WFPS, 568 g of pre-incubated soil mixed with fertilisers was moderatelycompacted in Duran bottles to attain the bulk density of 1.3 kg m−3. The slightly lower bulkdensity (compared with incubations) was chosen in this case to maintain effective aerobicconditions inside the mesocosm. A total of 15 mesocosms (3 replicates× 3 BBFs; 2 replicateseach of CAN, urea and unfertilized blank) were established for the study. One of the twothreaded openings on the smart cap were left open allowing aerobic respiration. Over aperiod of 18 days, the GHG monitoring was carried out by using a photoacoustic infraredspectroscopy multi-gas analyser (Gasera 1; Turku, Finland) calibrated for measurements ofCO2, CH4, and N2O. The measurement was carried out on days 0, 1, 2, 4, 7, 9, 11, 14, 16, and18. The analyser was connected to the mesocosm via two 1 m long Teflon tubes with 2 mminner diameter in a closed circuit. During the measurement, gases were pumped out of theheadspace (at flow rate of 800 mL/min), passed through the analyser, and then returnedto the mesocosm in a closed loop. Gas concentrations in the headspace of the mesocosmswere measured at 4, 8, 12, and 16 min after connecting the tubing to the mesocosm. Duringeach 4 min time step, the analyser detected the change in concentration of the measuredgases.
For the gaseous emissions, the fluxes of CO2, CH4, and N2O, were calculated from con-centration change over time, considering the volume of the headspace, the piping, and thearea of the soil surface. The measurement of NH3 was not considered due to unreliabilityof photoacoustic gas analysers in measuring ammonia gas. The conversion of gas concen-trations (in ppm) to emission flux was carried out using ideal gas law (Equation (3)) [21]:
Fluxarea =∆gas
∆t× P×M× n
R× T× V
A(3)

Appl. Sci. 2022, 12, 341 6 of 21
where Flux area is the elemental flux released as a gas, in µg m−2 h−1 or µg kg−1 h−1;∆gas/∆t is the slope of the linear regression of gas concentration against time; P is thepressure in the cell (0.838 atm); M is the molar mass of the element (e.g., 14 for N); n is thenumber of atoms of the element in the gas (e.g., 2 N in N2O); R is the ideal gas constant(0.08206 L atm mol−1 K−1); T is the average atmospheric temperature (294 K); V is the totalvolume of the headspace, tubing, and analyser cell (0.623 L); and A is the surface area ofthe soil in the mesocosm (0.0069 m2).
A linear interpolation between two measurement days was used to compute thecumulative flow for each gas. In all cumulative fertiliser emissions, the cumulative fluxesobtained with the soil control were deducted. The emission factors (EF%) for the gaseswere expressed as an amount of fertiliser applied (in kg ha−1) and was calculated usingEquation (4) [21]:
EF% =
[cum gas flux (fertilizer) − cum gas flux(control)
]N (or C) applied
× 100 (4)
where EF% is the emission factor (N2O-N, CO2-C, or CH4-C emitted as a % of fertiliserapplied); cum gas emission(fertiliser) and cum gas emission(control) are cumulative emissionsin kg N ha−1; and N (or C) applied is the N (or C) application rate in kg N (or C) ha−1.
2.4. Nutrient Fertiliser Replacement Value
The NFRV quantifies the ability of BBF to replace mineral fertiliser in terms of nutrientsupply to a crop [22–24] (Figure 1). The yield response curve method and the nutrientrecovery method are two commonly used methods to assess the NFRV. In this study, theresponse yield curve method was used. This method first fits a yield curve based on thecrop yields that correspond, in our case, to different mineral N or K fertiliser applicationrates. Secondly, the yields obtained from the treatments that received BBFs are also plottedin the graph. The NFRV can now be calculated by Equation (5):
NFRV =Y2 − Y0
Y1 − Y0(5)
where, Y0 is the yield obtained from the yield curve when no mineral fertiliser is applied,Y1 is the yield obtained from the yield curve when a fixed amount of mineral fertiliser isapplied, and Y2 is the yield obtained from the treatment that received BBF.
Appl. Sci. 2022, 11, x FOR PEER REVIEW 7 of 22
Figure 1. Calculation of the nitrogen fertiliser replacement value (NFRV) using the response yield curve method (adapted from [24]).
In a pot experiment with potato, the NFRV of the three BBFs was assessed. The fresh weight of the potato tubers was used to indicate the crop yield. A previous study men-tioned that obtaining the NFRV based on the fresh or dry weight or the N uptake is valid although the value of NFRV of BBFs obtained by fresh or dry weight might be slightly higher [25]. To be able to draw a yield curve, 0%, 20%, 50%, 70%, and 100% of the recom-mended amount of N or K was applied, which corresponds to 0 kg, 62 kg, 124 kg, 217 kg, and 310 kg N ha−1, and for the K-treatments to 0 kg, 53 kg, 106 kg, 186 kg, and 265 kg K ha−1 (Table 2). Mineral fertilisers CAN and KCl were used for these treatments as they are the most commonly used synthetic counterparts for the used BBFs. A deficit amount of BBF (40% of the recommended amount of N or K) was applied to test the difference in plant growth between plants that received mineral fertiliser and plants that received BBF. Other nutrients were kept at optimal conditions, which correspond to the fertilisation rec-ommendation of consumption potatoes (Table 2). Tables 3 and 4 show the fertilisation scheme of the N (Table 3) and K treatments (Table 4).
Table 3. The fertilisation scheme of the N-treatments and the equivalent amount of nutrients applied in the different treatments of the pot experiment.
The Total Application Rate On each Pot Equivalent to Elements Applied to
the Field
Treatments CAN Kali60 MgSO4 TSP LFD AS N K2O P2O5 SO3
g pot−1 g pot−1 g pot−1 g pot−1 g pot−1 g pot−1 kg ha−1 kg ha−1 kg ha−1 kg ha−1 CAN—0% of the ad-
vised amount N 0 0.7 0.3 0 0 0 0 70 0 23
CAN—20% of the advised amount N 1.4 0.7 0.3 0 0 0 62 70 0 23
CAN—40% of the advised amount N 2.8 0.7 0.3 0 0 0 124 70 0 23
CAN—70% of the advised amount N
4.9 0.7 0.3 0 0 0 217 70 0 23
CAN—100% of the advised amount N 7.1 0.7 0.3 0 0 0 310 70 0 23
LFD—40% of the ad-vised amount N 0 0 0.2 0 5.1 0 124 190 19 23
AS—40% of the ad-vised amount N
0 0.7 0.04 0 0 3.4 124 70 0 23
CAN: calcium ammonium nitrate; Kali60: potassium chloride 60% K2O; MgSO4: magnesium sul-phate; TSP: triple superphosphate; LFD: liquid fraction of digestate; and AS: ammonium sulphate solution.
Figure 1. Calculation of the nitrogen fertiliser replacement value (NFRV) using the response yieldcurve method (adapted from [24]).
In a pot experiment with potato, the NFRV of the three BBFs was assessed. Thefresh weight of the potato tubers was used to indicate the crop yield. A previous studymentioned that obtaining the NFRV based on the fresh or dry weight or the N uptakeis valid although the value of NFRV of BBFs obtained by fresh or dry weight might beslightly higher [25]. To be able to draw a yield curve, 0%, 20%, 50%, 70%, and 100% of the

Appl. Sci. 2022, 12, 341 7 of 21
recommended amount of N or K was applied, which corresponds to 0 kg, 62 kg, 124 kg,217 kg, and 310 kg N ha−1, and for the K-treatments to 0 kg, 53 kg, 106 kg, 186 kg, and265 kg K ha−1 (Table 2). Mineral fertilisers CAN and KCl were used for these treatmentsas they are the most commonly used synthetic counterparts for the used BBFs. A deficitamount of BBF (40% of the recommended amount of N or K) was applied to test thedifference in plant growth between plants that received mineral fertiliser and plants thatreceived BBF. Other nutrients were kept at optimal conditions, which correspond to thefertilisation recommendation of consumption potatoes (Table 2). Tables 3 and 4 show thefertilisation scheme of the N (Table 3) and K treatments (Table 4).
Table 3. The fertilisation scheme of the N-treatments and the equivalent amount of nutrients appliedin the different treatments of the pot experiment.
The Total Application Rate On each Pot Equivalent to Elements Applied to the Field
TreatmentsCAN Kali60 MgSO4 TSP LFD AS N K2O P2O5 SO3
g pot−1 g pot−1 g pot−1 g pot−1 g pot−1 g pot−1 kg ha−1 kg ha−1 kg ha−1 kg ha−1
CAN—0% of theadvised amount N 0 0.7 0.3 0 0 0 0 70 0 23
CAN—20% of theadvised amount N 1.4 0.7 0.3 0 0 0 62 70 0 23
CAN—40% of theadvised amount N 2.8 0.7 0.3 0 0 0 124 70 0 23
CAN—70% of theadvised amount N 4.9 0.7 0.3 0 0 0 217 70 0 23
CAN—100% of theadvised amount N 7.1 0.7 0.3 0 0 0 310 70 0 23
LFD—40% of theadvised amount N 0 0 0.2 0 5.1 0 124 190 19 23
AS—40% of theadvised amount N 0 0.7 0.04 0 0 3.4 124 70 0 23
CAN: calcium ammonium nitrate; Kali60: potassium chloride 60% K2O; MgSO4: magnesium sulphate; TSP: triplesuperphosphate; LFD: liquid fraction of digestate; and AS: ammonium sulphate solution.
Table 4. The fertilisation scheme of the K-treatments and the equivalent amount of nutrients appliedin the different treatments of the pot experiment.
The Total Application Rate on Each Pot Equivalent to Elements Applied to the Field
Treatments CAN KCLSolution MgSO4 TSP LFD KC N K2O P2O5 SO3
g pot−1 g pot−1 g pot−1 g pot−1 kg ha−1 g pot−1 kg ha−1 kg ha−1 kg ha−1 g pot−1
KCl solution at 0% ofadvised amount K 7.1 0 0.3 0.8 0 0 310 0 60 23
KCl solution at 20% ofadvised amount K 7.1 0.5 0.3 0.8 0 0 310 53 60 23
KCl solution at 40% ofadvised amount K 7.1 1.1 0.3 0.8 0 0 310 106 60 23
KCl solution at 70% ofadvised amount K 7.1 1.9 0.3 0.8 0 0 310 186 60 23
KCl solution at 100%of advised amount K 7.1 2.7 0.3 0.8 0 0 310 265 60 23
LFD at 40% of advisedamount K 5.2 0 0.3 0.7 2.8 0 310 106 60 23
KC at 40% of advisedamount K 6.9 0 0.1 0.5 0 3.8 310 106 60 23
CAN: calcium ammonium nitrate; Kali60: potassium chloride 60% K2O; MgSO4: magnesium sulphate; TSP: triplesuperphosphate; LFD: liquid fraction of digestate; and AS: ammonium sulphate solution.
The pot experiment was carried out between May and September 2020. During thegrowing season, field conditions were mimicked by cultivating potatoes in a semi-opennetting tunnel, letting the potatoes grow in a pot filled with the soil of the potato field,and applying fertiliser at two moments in time. The potatoes were planted in 12 L PVCpots with a 28 cm diameter. Each pot had three drainage holes at the bottom. The soilmoisture content was kept constant at each pot. The soil moisture content at the start of theexperiment was assessed by weighing 80 g of soil and drying it in the oven under 105 ◦Cfor 24 h. The moisture content of the soil of the potato field corresponded to 22% and of theK-poor soil to 10%. Secondly, the water holding capacity (WHC) of the soil was measured

Appl. Sci. 2022, 12, 341 8 of 21
by weighing the fresh soil and then weighing it again after saturation was reached. Thepotato field soil was at 75% of the maximum WHC and therefore this soil was kept at 75%of the maximum WHC throughout the experiment. The K-poor soil was at 34% of themaximum WHC and therefore this soil was kept at a standard 60% of the maximum WHC.Before the pot filling, the soils were sieved through a 10 mm screen to remove the roots anddebris. All pots were filled with 10 kg fresh soil and the first fertilisation dose was applied:approximately 50% of the total N amounts mentioned in Table 4 and 100% of the amount ofKali60 and MgSO4 for the N-treatments and 50% of the amounts of K and 100% of the otherfertilisers for the K-treatments. The first fertilisation dose of the BBFs was 4.8 g AS pot−1
and 69.4 g LFD pot−1 (equal to 59 kg N ha−1 and 52 kg N ha−1) for the N-treatments, and45.3 g LF pot−1 and 5.4 g KC pot−1 (equal to 51 kg K2O ha−1 and 19 kg K2O ha−1) for theK-treatments. The soil, fertilisers, and additional water (required for the K-treatments only)were mixed thoroughly before the pot was filled. Each treatment had four replicates, whichresulted in a total of 56 pots.
On 11 May 2020, potato tubers were planted in the pots. A hole was drilled in themiddle of each pot (diameter of 5 cm; depth of 8 cm). One intact potato tuber (weightof approximately 65g; diameter of about 5cm) was put into the hole and the hole wasthen filled with soil. The overall weight of each pot was recorded. After emergence of thepotatoes, the soil moisture content was checked regularly to keep the soil at 75% or 60%of its WHC. The second fertilisation took place on 19 June 2020, at the beginning of thetuber bulking stage. The second fertilisation dose of the BBFs was 5.1 g AS pot−1 and 98.4 gLFD pot−1, equal to 64 kg N ha−1 and 73 kg N ha−1. To mimic the common technique ofside-dressing, the fertiliser was applied in a circular band about 10 cm away from the stemsin every pot. This way of fertiliser application minimises the direct contact of plant rootsand fertilisers, which can reduce the risk of salt stress. During the plant growing period,besides daily irrigation, the location of the pots was randomised every two weeks. Thisis because the pots at different places in the netting tunnel received different intensitiesof sunlight. Once a week, a chemical spraying to prevent Phytophthora infection wasconducted. The potatoes were harvested at the moment that the leaves of one plant wiltedcompletely because it indicated that all plants had an equal number of days for nutrientuptake. The plants were harvested on 10 and 11 August 2020. The fresh and underwaterweight of the tubers, and the N-content in the tubers were measured; in addition, the size,the number of potatoes, and other remarks (e.g., black spots) were noted.
2.5. Applicability of Bio-Based Fertilisers in a Full-Scale Field Trial
Two of the BBFs (LFD and AS) were tested in a full-scale field trial in Eersel (Figure 2).The soil characteristics of the field and the fertiliser recommendations are reported inTable 2. Before the growing season, the field was ploughed using a Lemken Juwel 8 ploughand scanned using a Dualem 21 (H)S soil scanner. All treatments, except the control,received 100% of the recommended amount of N (310 kg N/ha) to analyse the maximumperformance of the BBFs. Additionally, all treatments, including the control, received 23 kgSO3/ha, 70kg K2O/ha, and 75 kg CaO/ha, which was recommended for potato growing(Table 2). The LFD and AS were tested in combinations applied with and without a baseapplication of pig manure. This resulted in six treatments: (1) MF CAN and manure,(2) LFD and manure, (3) AS and manure, (4) only LFD, (5) only AS, and (6) a blank controlwith no application of N fertiliser. Each treatment had 3 replicates, which resulted in a totalof 18 plots. The plots with and without manure treatment were arranged randomly andthe surface area of one plot was approximately 0.75 ha (Figure 2). Manure (80 t ha−1) wasapplied at the left side of the field at the beginning of the growing season using a draghose injector (April 2020). The composition of the manure is given in Table 1. At the samemoment in time, the fields with only LFD or AS received 31 t ha−1 LFD and 2 t ha−1 AS,which corresponds to the amount of N that the manure-treated plots received. AS wasapplied using a Duport Liquiliser and LFD was applied using a precision agriculture tankTandem Premium Line in combination with the Terraject Disc.

Appl. Sci. 2022, 12, 341 9 of 21Appl. Sci. 2022, 11, x FOR PEER REVIEW 10 of 22
Figure 2. The location where the bio-based fertilisers were produced (Oirschot, yellow dot), and the location where the field experiment took place (Eersel, red dot) (A), together with the location of the different replenished treatments in the field (three repetitions) (B).
On April 29th, the consumption potatoes (variety Fontane, size 40–50mm) were planted using a Miedema CP42 planter. The distance between the planting rows was 75 cm and the distance between the potatoes in the row was about 30 cm. The second fertili-sation took place on 11 June, and was applied at the beginning of the tuber bulking stage. Both BBFs were applied between the ridges using a drag hose system to ensure the tuber did not have direct contact with the fertiliser which can cause burning. Besides, fertiliser recommendations for K (70 kg ha−1) and S (23 kg ha−1) were met by complementing the fertilisation with Kali60 and MgSO4 where needed. Manual test probing and drone flights to obtain thermal and NIR images took place at three moments during the growing season to monitor the plant growth. The test probing took place on 19 June, 28 July, and Septem-ber 8, and the thermal and NIR images were taken on 21 June, 19 July, and August 7. The potatoes were harvested on October 14. After harvest, the underwater weight, number, and size of the tubers, and net yield were measured using a robot that was specifically designed for the potato farmer.
The NO3-N residue in the soil profile (0–90 cm) was measured after harvest. We as-sume this to be a good indicator for potential N leaching to ground and surface water, which causes a serious environmental risk in the Netherlands. To measure NO3-N residue in the soil profile, homogenised soil samples were taken per plot at three depths (0–30 cm, 30–60 cm, and 60–90 cm) using an auger. A 5-point sampling strategy (the centre and the 4 corners) was used to obtain a representative soil sample from each plot. The samples were collected in polyethylene sampling bags and transported from the crop field to the laboratory and stored in the freezer (−18 °C) until the analysis. The collected soil samples were extracted with 1M KCl and measured colourimetrically by a continuous flow auto-analyser (Skalar Chemlab System 4) for NO3-N.
2.6. Statistics The results were analysed using one-way ANOVA and Tukey’s honestly significant
difference (HSD). The effects of tested fertilisers were compared with the treatments and also against the used reference treatments. To investigate correlations between variables, Pearson’s correlation analysis was used. Using the SPSS 22.0 software for Windows, all tests were run at a probability (p) level of 0.05.
3. Results and Discussion
Figure 2. The location where the bio-based fertilisers were produced (Oirschot, yellow dot), and thelocation where the field experiment took place (Eersel, red dot) (A), together with the location of thedifferent replenished treatments in the field (three repetitions) (B).
On April 29th, the consumption potatoes (variety Fontane, size 40–50mm) wereplanted using a Miedema CP42 planter. The distance between the planting rows was 75 cmand the distance between the potatoes in the row was about 30 cm. The second fertilisationtook place on 11 June, and was applied at the beginning of the tuber bulking stage. BothBBFs were applied between the ridges using a drag hose system to ensure the tuber didnot have direct contact with the fertiliser which can cause burning. Besides, fertiliserrecommendations for K (70 kg ha−1) and S (23 kg ha−1) were met by complementing thefertilisation with Kali60 and MgSO4 where needed. Manual test probing and drone flightsto obtain thermal and NIR images took place at three moments during the growing seasonto monitor the plant growth. The test probing took place on 19 June, 28 July, and September8, and the thermal and NIR images were taken on 21 June, 19 July, and August 7. Thepotatoes were harvested on October 14. After harvest, the underwater weight, number, andsize of the tubers, and net yield were measured using a robot that was specifically designedfor the potato farmer.
The NO3-N residue in the soil profile (0–90 cm) was measured after harvest. Weassume this to be a good indicator for potential N leaching to ground and surface water,which causes a serious environmental risk in the Netherlands. To measure NO3-N residuein the soil profile, homogenised soil samples were taken per plot at three depths (0–30 cm,30–60 cm, and 60–90 cm) using an auger. A 5-point sampling strategy (the centre and the4 corners) was used to obtain a representative soil sample from each plot. The sampleswere collected in polyethylene sampling bags and transported from the crop field to thelaboratory and stored in the freezer (−18 ◦C) until the analysis. The collected soil sampleswere extracted with 1M KCl and measured colourimetrically by a continuous flow auto-analyser (Skalar Chemlab System 4) for NO3-N.
2.6. Statistics
The results were analysed using one-way ANOVA and Tukey’s honestly significantdifference (HSD). The effects of tested fertilisers were compared with the treatments andalso against the used reference treatments. To investigate correlations between variables,Pearson’s correlation analysis was used. Using the SPSS 22.0 software for Windows, alltests were run at a probability (p) level of 0.05.

Appl. Sci. 2022, 12, 341 10 of 21
3. Results and Discussion3.1. N Release Rate of Bio-Based Fertilisers
At the start of the incubation, all tested products were applied at the same rate of170 kg total N ha−1 and most of the mineral N was present in the form of NH4
+-N. However,due to nitrification, the concentration of NH4
+-N was heavily reduced for all the treatmentsat day 20 and went down further below detection limits by day 40. As the concentration ofNH4
+-N was negligible after day 40, the total mineral N followed the same trend as theproduction of NO3
−-N.The average net N release (Nrel,net calculated using Equation (1)) amounted to 140 ± 20%
for AS, 113 ± 24% for LFD, 54 ± 15% for KC, and 105 ± 15% for CAN throughout theincubation (Figure 3). Net N release of AS and LFD was in general comparable with theone of CAN as a result of the high NH4-N/total N ratio of these BBFs which amounted to100% and 82%, respectively [12]. As AS solution is 100% in mineral N form, the observednet N mineralisation is seen as a result of the positive priming effect of AS on OM presentin the soil [26], hence resulting in N-release value >100%. A similar result was observedin the LFD treatment from day 80 until the end of the experiment when N release valuesabove 100% were measured. The average net N mineralisation (Nmin,net, calculated usingEquation (2)) from amended treatments throughout incubation duration was 40 ± 14%for AS, 36 ± 12% for LFD, and 20 ± 3% for KC (Figure 3). In general, the values werestatistically different between the products (p < 0.05). For instance, on day 100, the valuesof KC and CAN are significantly different from AS and LFD (Figure 3).
Appl. Sci. 2022, 11, x FOR PEER REVIEW 11 of 22
3.1. N Release Rate of Bio-Based Fertilisers At the start of the incubation, all tested products were applied at the same rate of 170
kg total N ha−1 and most of the mineral N was present in the form of NH4+-N. However, due to nitrification, the concentration of NH4+-N was heavily reduced for all the treat-ments at day 20 and went down further below detection limits by day 40. As the concen-tration of NH4+-N was negligible after day 40, the total mineral N followed the same trend as the production of NO3−-N.
The average net N release (Nrel,net calculated using Equation (1)) amounted to 140 ± 20% for AS, 113 ± 24% for LFD, 54 ± 15% for KC, and 105 ± 15% for CAN throughout the incubation (Figure 3). Net N release of AS and LFD was in general comparable with the one of CAN as a result of the high NH4-N/total N ratio of these BBFs which amounted to 100% and 82%, respectively [12]. As AS solution is 100% in mineral N form, the observed net N mineralisation is seen as a result of the positive priming effect of AS on OM present in the soil [26], hence resulting in N-release value >100%. A similar result was observed in the LFD treatment from day 80 until the end of the experiment when N release values above 100% were measured. The average net N mineralisation (Nmin,net, calculated using Equation (2)) from amended treatments throughout incubation duration was 40 ± 14% for AS, 36 ± 12% for LFD, and 20 ± 3% for KC (Figure 3). In general, the values were statisti-cally different between the products (p < 0.05). For instance, on day 100, the values of KC and CAN are significantly different from AS and LFD (Figure 3).
Figure 3. Net N release (in % of total N applied) for applied fertilisers over a time span of 120 days. Legend: AS—ammonium sulphate, LFD—liquid fraction of digestate, KC—potassium concentrate, and CAN—calcium ammonium nitrate. Lower case letters (a,b,c,d) denote statistically significant differences in means (Tukey’s Test for p < 0.05) among the products for each sample time (t = 20, 40, 60, 80, 100, and 120).
In the case of KC, a positive net mineralisation is observed due to mineralisation of organic N present in the product. However, the net N release was inhibited throughout the incubation period. This is due to the C/N ratio > 7 and NH4+-N/total N < 50%. This relatively high C/N ratio and lower NH4+-N/total N promotes a very slow release of total N applied, reaching a stagnant release after some days [17,27]. This hypothesis could be cross confirmed from Appendix B, where Pearson correlation analysis shows a strong in-verse interaction between % N released and C/Ntotal ratio (r = −0.999, p = 0.03). Additionally, it is also mentioned in previous studies that the C/N and NH4+-N/Ntotal ratios of applied products typically influence the Nrel,net and Nmin,net (%) [20,28–30]. However, in this case, even if the Pearson correlation effect of NH4+-N/Ntotal and Nrel,net (or Nmin,net) (%) is strong (r = 0.999, p = 0.023), suggesting a direct relation between variables, note that there can be
Figure 3. Net N release (in % of total N applied) for applied fertilisers over a time span of 120 days.Legend: AS—ammonium sulphate, LFD—liquid fraction of digestate, KC—potassium concentrate,and CAN—calcium ammonium nitrate. Lower case letters (a–d) denote statistically significantdifferences in means (Tukey’s Test for p < 0.05) among the products for each sample time (t = 20, 40,60, 80, 100, and 120).
In the case of KC, a positive net mineralisation is observed due to mineralisation oforganic N present in the product. However, the net N release was inhibited throughoutthe incubation period. This is due to the C/N ratio > 7 and NH4
+-N/total N < 50%. Thisrelatively high C/N ratio and lower NH4
+-N/total N promotes a very slow release of total Napplied, reaching a stagnant release after some days [17,27]. This hypothesis could be crossconfirmed from Appendix B, where Pearson correlation analysis shows a strong inverseinteraction between % N released and C/Ntotal ratio (r = −0.999, p = 0.03). Additionally, itis also mentioned in previous studies that the C/N and NH4
+-N/Ntotal ratios of appliedproducts typically influence the Nrel,net and Nmin,net (%) [20,28–30]. However, in this case,even if the Pearson correlation effect of NH4
+-N/Ntotal and Nrel,net (or Nmin,net) (%) isstrong (r = 0.999, p = 0.023), suggesting a direct relation between variables, note that there

Appl. Sci. 2022, 12, 341 11 of 21
can be some bias caused by the relatively high initial NH4-N concentrations of AS and LFDcompared with the NH4-N concentrations of K [31].
3.2. Emissions from the Bio-Based Fertilisers
The N2O emissions of all three BBFs were measured over 18 days and comparedwith mineral fertilisers (i.e., CAN and urea). In the mesocosm, the principle of productionof N2O follows simultaneous nitrification (oxidation of NH4
+ to NO3− via NO2
−) anddenitrification (reduction of NO3
− to N2O and N2) [32]. Following this process, the mineralfertilisers showed highest emission of N2O (0.11 ± 0.02% for urea and 0.11 ± 0.01% forCAN) (Figure 4A). This is because of the rapid hydrolysis of products after application,resulting in increased NH4 availability. This further led to nitrification followed by den-itrification, resulting in N2O production. This could also be observed in the case of AS(0.03 ± 0.008% of AS N applied) and LFD (0.02 ± 0.005% of LFD N applied), where theinitial concentration of mineral N was ~100% and ~80% of total N (Table 5). Additionally,a similar result to CAN is observed for KC, where emission of 0.05 ± 0.03% of KC Napplied could be observed. These results for KC are expected due to the combination of twofactors—a moderate NH4 percentage at the initial application (~33%), and a high TOC con-tent in the fertiliser (Table 1). As the OC serves as an energy source for denitrification, theoverall oxygen content in the soil decreases, promoting denitrification of NH4 in BBFs [33].This shows a strong correlation between the N2O emissions and initial ammonium (NH4
+)content which is also supported by different studies [20,28–30]. Therefore, highest N2Oemissions were observed in the soils that were treated with mineral fertiliser, which is alsoconfirmed by [34].
Appl. Sci. 2022, 11, x FOR PEER REVIEW 12 of 22
some bias caused by the relatively high initial NH4-N concentrations of AS and LFD com-pared with the NH4-N concentrations of K [31].
3.2. Emissions from the Bio-Based Fertilisers The N2O emissions of all three BBFs were measured over 18 days and compared with
mineral fertilisers (i.e., CAN and urea). In the mesocosm, the principle of production of N2O follows simultaneous nitrification (oxidation of NH4+ to NO3− via NO2−) and denitri-fication (reduction of NO3− to N2O and N2) [32]. Following this process, the mineral ferti-lisers showed highest emission of N2O (0.11 ± 0.02% for urea and 0.11 ± 0.01% for CAN) (Figure 4A). This is because of the rapid hydrolysis of products after application, resulting in increased NH4 availability. This further led to nitrification followed by denitrification, resulting in N2O production. This could also be observed in the case of AS (0.03 ± 0.008% of AS N applied) and LFD (0.02 ± 0.005% of LFD N applied), where the initial concentra-tion of mineral N was ~100% and ~80% of total N (Table 5). Additionally, a similar result to CAN is observed for KC, where emission of 0.05 ± 0.03% of KC N applied could be observed. These results for KC are expected due to the combination of two factors—a moderate NH4 percentage at the initial application (~33%), and a high TOC content in the fertiliser (Table 1). As the OC serves as an energy source for denitrification, the overall oxygen content in the soil decreases, promoting denitrification of NH4 in BBFs [33]. This shows a strong correlation between the N2O emissions and initial ammonium (NH4+) con-tent which is also supported by different studies [20,28–30]. Therefore, highest N2O emis-sions were observed in the soils that were treated with mineral fertiliser, which is also confirmed by [34].
Figure 4. Cumulative emissions of nitrous oxide (mg N2O-N per m2 of soil) (A), carbon dioxide (g CO2-C per m2 of soil) (B), and methane (mg CH4-C per m2 of soil) (C) emissions measured during incubation of digestate-derived organic fertilisers. Legend: AS—ammonium sulphate, LFD—liquid fraction of digestate, KC—potassium concentrate, and CAN—calcium ammonium nitrate.
Table 5. Emission factors of nitrous oxide (N2O), carbon dioxide (CO2), and methane (CH4) ex-pressed per 100 g of N applied for tested bio-based fertilisers and mineral N fertilisers.
Fertiliser Type N2O CO2 CH4 *
per 100g N Applied Liquid fraction of digestate 0.02 ± 0.005 53 ± 9 −0.11
A B
C
Figure 4. Cumulative emissions of nitrous oxide (mg N2O-N per m2 of soil) (A), carbon dioxide (gCO2-C per m2 of soil) (B), and methane (mg CH4-C per m2 of soil) (C) emissions measured duringincubation of digestate-derived organic fertilisers. Legend: AS—ammonium sulphate, LFD—liquidfraction of digestate, KC—potassium concentrate, and CAN—calcium ammonium nitrate.
The CO2 flux developed in the soil is mainly produced by the respiration of soilmicroorganisms and dead plant roots. The CO2 emissions from the mesocosms are directlydependent on the initial OC content available in the BBFs and mineral fertilisers. The KCand LFD had the highest amount of OC resulting respectively in emissions of 8.97 ± 3%and 25.9 ± 5% of total C added from the product. Urea also consisted of 20% carbon andshowed rapid mineralisation due to hydrolysis, hence resulting in around 60% of CO2
Appl. Sci. 2022, 12, 341 12 of 21
emissions within the first five days of the experiment. In general, organic fertilisers produceconsiderably higher outcomes because they enhance the fraction of OC in the soil, whichis more readily available for microorganisms in respiration [35]. Therefore, the releasedC from BBFs in soils is seen as biogenic C and is considered to be C-neutral as it does notcontribute to the net CO2 increase. The results for AS and CAN are not shown in Figure 4Bas a negligible amount of OC is present in both cases to cause any CO2 emissions. Anytype of CO2 emissions seen in these products is due to the positive priming effect of thealready available carbon present in the soil.
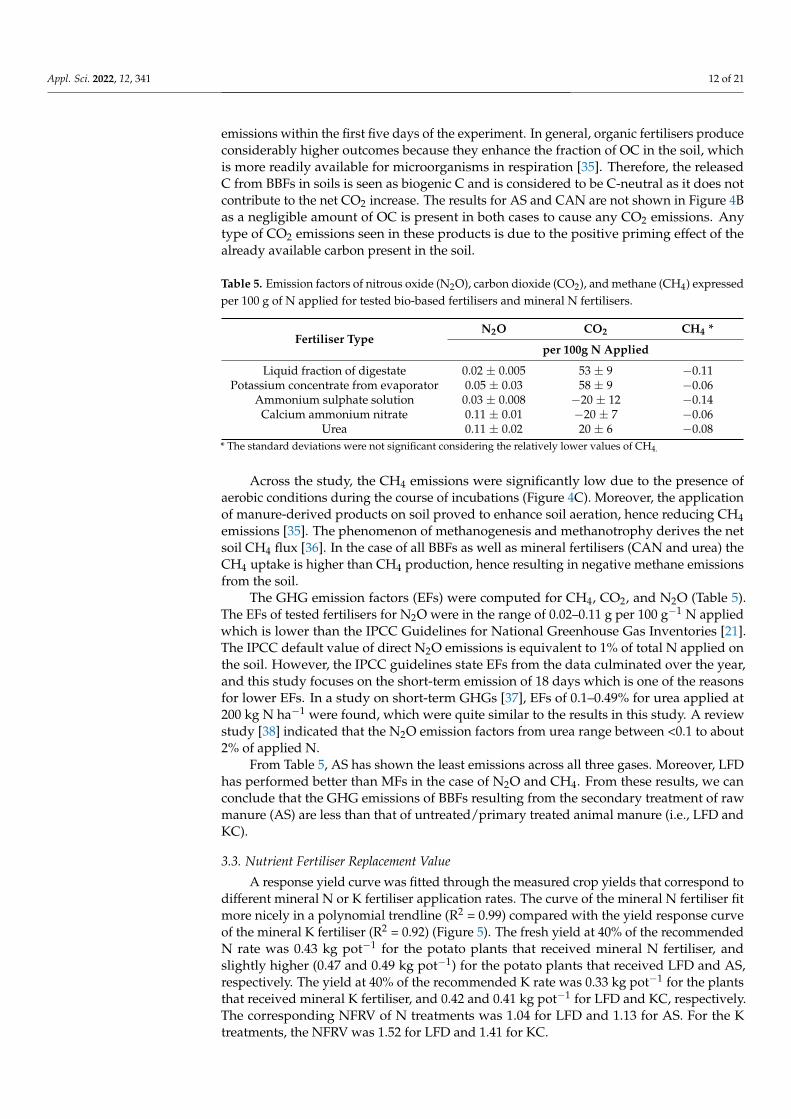
Table 5. Emission factors of nitrous oxide (N2O), carbon dioxide (CO2), and methane (CH4) expressedper 100 g of N applied for tested bio-based fertilisers and mineral N fertilisers.
Fertiliser TypeN2O CO2 CH4 *
per 100g N Applied
Liquid fraction of digestate 0.02 ± 0.005 53 ± 9 −0.11Potassium concentrate from evaporator 0.05 ± 0.03 58 ± 9 −0.06
Ammonium sulphate solution 0.03 ± 0.008 −20 ± 12 −0.14Calcium ammonium nitrate 0.11 ± 0.01 −20 ± 7 −0.06
Urea 0.11 ± 0.02 20 ± 6 −0.08* The standard deviations were not significant considering the relatively lower values of CH4.
Across the study, the CH4 emissions were significantly low due to the presence ofaerobic conditions during the course of incubations (Figure 4C). Moreover, the applicationof manure-derived products on soil proved to enhance soil aeration, hence reducing CH4emissions [35]. The phenomenon of methanogenesis and methanotrophy derives the netsoil CH4 flux [36]. In the case of all BBFs as well as mineral fertilisers (CAN and urea) theCH4 uptake is higher than CH4 production, hence resulting in negative methane emissionsfrom the soil.
The GHG emission factors (EFs) were computed for CH4, CO2, and N2O (Table 5).The EFs of tested fertilisers for N2O were in the range of 0.02–0.11 g per 100 g−1 N appliedwhich is lower than the IPCC Guidelines for National Greenhouse Gas Inventories [21].The IPCC default value of direct N2O emissions is equivalent to 1% of total N applied onthe soil. However, the IPCC guidelines state EFs from the data culminated over the year,and this study focuses on the short-term emission of 18 days which is one of the reasonsfor lower EFs. In a study on short-term GHGs [37], EFs of 0.1–0.49% for urea applied at200 kg N ha−1 were found, which were quite similar to the results in this study. A reviewstudy [38] indicated that the N2O emission factors from urea range between <0.1 to about2% of applied N.
From Table 5, AS has shown the least emissions across all three gases. Moreover, LFDhas performed better than MFs in the case of N2O and CH4. From these results, we canconclude that the GHG emissions of BBFs resulting from the secondary treatment of rawmanure (AS) are less than that of untreated/primary treated animal manure (i.e., LFD andKC).
3.3. Nutrient Fertiliser Replacement Value
A response yield curve was fitted through the measured crop yields that correspond todifferent mineral N or K fertiliser application rates. The curve of the mineral N fertiliser fitmore nicely in a polynomial trendline (R2 = 0.99) compared with the yield response curveof the mineral K fertiliser (R2 = 0.92) (Figure 5). The fresh yield at 40% of the recommendedN rate was 0.43 kg pot−1 for the potato plants that received mineral N fertiliser, andslightly higher (0.47 and 0.49 kg pot−1) for the potato plants that received LFD and AS,respectively. The yield at 40% of the recommended K rate was 0.33 kg pot−1 for the plantsthat received mineral K fertiliser, and 0.42 and 0.41 kg pot−1 for LFD and KC, respectively.The corresponding NFRV of N treatments was 1.04 for LFD and 1.13 for AS. For the Ktreatments, the NFRV was 1.52 for LFD and 1.41 for KC.

Appl. Sci. 2022, 12, 341 13 of 21
Appl. Sci. 2022, 11, x FOR PEER REVIEW 14 of 22
The corresponding NFRV of N treatments was 1.04 for LFD and 1.13 for AS. For the K treatments, the NFRV was 1.52 for LFD and 1.41 for KC.
Figure 5. The yield response curves of mineral fertiliser N (A) and K (B) together with the perfor-mance of the liquid fraction of digestate (LFD), the ammonium sulphate solution (AS), and the K-concentrate (KC). Y0 is the yield obtained from the yield curve when no mineral fertiliser is applied, Y1 is the yield obtained from the yield curve when a fixed amount of mineral fertiliser is applied, and Y2 is the yield obtained from the treatment that received BBF.
The potato yield of the plants that received BBFs are in all cases slightly higher com-pared with the mineral fertiliser, in which it turned out that all NFRVs are above the re-sponse yield curve. Other studies showed that often only assessments on long-term NFRV reach yields above the response yield curve [22]. However, because the total potato yield per pot is low, slightly higher yields (in our case between 40 g and 90 g) can result in NFRV > 1. The values should therefore be evaluated with caution. This experiment showed that (i) both BBF perform well in comparison with mineral fertiliser, and (ii) the level of refinement does not seem to influence the NFRV.
Other characteristics of the potato also do not show significant differences between the treatments with a highly refined BBF, a less refined BBF, or mineral N or K fertiliser. The size and number of tubers did not differ much between the treatments, but within a treatment sometimes a large variation exists. The ‘40% K concentration using LFD’-treat-ment counted, for example, between 1 and 12 potatoes smaller than 3 cm. The total N concentration in the tubers differed significantly, but the total K concentration in the tu-bers did not differ significantly. The N-content in the potato tubers increased from 6.5 ± 0.3 g kg−1 DM when 0 kg ha−1 N was applied to 11.3 ± 0.4 g kg−1 DM when 310 kg N ha−1 was applied. A N application rate of 40% of MF resulted in a total N content in the potato tuber of 8.9 ± 0.7 g kg−1 DM. A N application rate of 40% in the form of LFD and AS resulted in a total N content in the potato tuber of 8.1 ± 1.0 g kg−1 DM and 8.7 ± 1.0 g kg−1 DM, respectively. Calculating the NFRV based on the N uptake in the potato tuber resulted in a NFRV of 0.50 for LFD and 0.60 for AS. Similar to the NFRV resulting from the fresh potato yield, the NFRV resulting from the N uptake in the tuber was slightly higher in the more refined AS product compared with the less refined LFD product. The slower release of N by LFD compared with AS or mineral N fertiliser can clarify this lower NFRV.
3.4. Applicability of Bio-Based Fertilisers in a Full-Scale Field Trial At the start of the growing season, a soil scan was carried out to provide insight in
the spatial variation in the soil electric conductivity (EC) within the experimental field. The average EC per plot at 1 m depth ranged between 10.0 and 13.2 mS m−1, with highest values in the north and west and lowest values in the south and east (Figure 6B). A gas pipe line was identified as a straight line in the upper part of the field. At three moments during the growing season thermal and NIR images of the field were collected. The
Figure 5. The yield response curves of mineral fertiliser N (A) and K (B) together with the performanceof the liquid fraction of digestate (LFD), the ammonium sulphate solution (AS), and the K-concentrate(KC). Y0 is the yield obtained from the yield curve when no mineral fertiliser is applied, Y1 is theyield obtained from the yield curve when a fixed amount of mineral fertiliser is applied, and Y2 is theyield obtained from the treatment that received BBF.
The potato yield of the plants that received BBFs are in all cases slightly highercompared with the mineral fertiliser, in which it turned out that all NFRVs are above theresponse yield curve. Other studies showed that often only assessments on long-termNFRV reach yields above the response yield curve [22]. However, because the total potatoyield per pot is low, slightly higher yields (in our case between 40 g and 90 g) can result inNFRV > 1. The values should therefore be evaluated with caution. This experiment showedthat (i) both BBF perform well in comparison with mineral fertiliser, and (ii) the level ofrefinement does not seem to influence the NFRV.
Other characteristics of the potato also do not show significant differences between thetreatments with a highly refined BBF, a less refined BBF, or mineral N or K fertiliser. The sizeand number of tubers did not differ much between the treatments, but within a treatmentsometimes a large variation exists. The ‘40% K concentration using LFD’-treatment counted,for example, between 1 and 12 potatoes smaller than 3 cm. The total N concentration inthe tubers differed significantly, but the total K concentration in the tubers did not differsignificantly. The N-content in the potato tubers increased from 6.5 ± 0.3 g kg−1 DMwhen 0 kg ha−1 N was applied to 11.3 ± 0.4 g kg−1 DM when 310 kg N ha−1 was applied.A N application rate of 40% of MF resulted in a total N content in the potato tuber of8.9 ± 0.7 g kg−1 DM. A N application rate of 40% in the form of LFD and AS resulted ina total N content in the potato tuber of 8.1 ± 1.0 g kg−1 DM and 8.7 ± 1.0 g kg−1 DM,respectively. Calculating the NFRV based on the N uptake in the potato tuber resulted in aNFRV of 0.50 for LFD and 0.60 for AS. Similar to the NFRV resulting from the fresh potatoyield, the NFRV resulting from the N uptake in the tuber was slightly higher in the morerefined AS product compared with the less refined LFD product. The slower release of Nby LFD compared with AS or mineral N fertiliser can clarify this lower NFRV.
3.4. Applicability of Bio-Based Fertilisers in a Full-Scale Field Trial
At the start of the growing season, a soil scan was carried out to provide insight inthe spatial variation in the soil electric conductivity (EC) within the experimental field.The average EC per plot at 1 m depth ranged between 10.0 and 13.2 mS m−1, with highestvalues in the north and west and lowest values in the south and east (Figure 6B). A gas pipeline was identified as a straight line in the upper part of the field. At three moments duringthe growing season thermal and NIR images of the field were collected. The weighted(near-infrared-red) difference vegetation index (WDVI) image taken at the beginning of thegrowing season showed little difference in the treatments that received manure (left side ofthe field), and the control plots are clearly visible (Figure 6C). The other NIR images showed

Appl. Sci. 2022, 12, 341 14 of 21
similar results. The thermal map taken at the end of the growing season showed clearindications of heat stress (Figure 6D). The plots treated with AS had a lower temperaturecompared with the other plots. Again, no clear pattern was visible in the plots that receivedmanure. The control plots showed clearly lower yields (60 ± 13.6 t ha−1) compared withthe other plots (Figure 6E). Highest yields were obtained in the plots that were treatedwith AS (73 ± 9.1 t ha−1) followed by the plots treated with manure and mineral fertiliser(68 ± 5.9 t/ha). The other treatments showed quite similar results (65 ± 7.8 t ha−1 for LFD,65 ± 4.1 t ha−1 for the manure and AS treatment, and 63 ± 1.7 t ha−1 for the manure andLFD treatment).
Appl. Sci. 2022, 11, x FOR PEER REVIEW 16 of 22
Figure 6. Summary of the field performance during the growing season. The different treatments and repetitions (A), the electric conductivity (mS m−1) (B), the weighted (near-infrared-red) differ-ence vegetation index (-) measured on 21 June 2020 (C), the thermal heat map (°C) measured on 7 August 2020 (D), and the average potato yield per plot (t ha−1) (E).
After harvest, the NH4-N and NO3-N residues in the soil were analysed (Figure 7). The potential for residual nitrate leaching to the ground and surface water is one of the important aspects of the safe application of BBFs. The residual nitrate in the soil profile (0–90cm) in the post-harvest period showed no significant difference in leaching risk for BBFs in comparison with the used mineral fertiliser. However, all the treatments (includ-ing the unfertilised control) resulted in relatively high nitrate residues. In the Netherlands, there is no legal limit on maximum allowable nitrate residue. On the other hand, in Flan-ders, in the neighbouring region, nitrate residue in potato cultivation should not exceed (depending on the location of the field) the maximum limit of 165 kg NO3-N ha−1 according to current Flemish environmental standards (VLM, 2021). In general, high nitrate residue is considered common in the case of potatoes due to their ability to uptake only 50–60% of the applied N [39], and also their shorter root depth [40]. Additionally, the effect of rainfall during the growing season is also found to be inversely proportional to the nitrate residue in 0–90cm soil depth [39]. The high application of N (310 kg ha−1) resulted in high residue concentrations in the soil. The NO3-N residue in the soil profile was on average highest in the plots that only received AS (264 kg ha−1), but the residues in plots that re-ceived mineral fertiliser and manure (256 kg ha−1), LFD and manure (258 kg ha−1), and AS and manure (245 kg ha−1) were almost as high. The NO3-N residue in the soil profile was, except from the control, lowest in the plots that only received LFD.
Figure 6. Summary of the field performance during the growing season. The different treatments andrepetitions (A), the electric conductivity (mS m−1) (B), the weighted (near-infrared-red) differencevegetation index (-) measured on 21 June 2020 (C), the thermal heat map (◦C) measured on 7 August2020 (D), and the average potato yield per plot (t ha−1) (E).
For the market, consumption potatoes need to have an underwater weight between70 g and 80 g kg−1. The treatments with only LFD are at the lower part of this range(72.2 g kg−1), the treatments with mineral N fertiliser are at the upper part of this range(80 g kg−1), and the control treatment (no mineral N fertiliser) is far above (92 g kg−1).Looking at the size distribution of the potato tubers, the control treatment that received noN fertiliser and the treatment with manure and LFD had a large number of small potatotubers compared with the other treatments. In these treatments, 70%, in the case where noN fertiliser applied, and 59%, in the case where manure and LFD was applied, had a sizesmaller than 5 cm of the total numbers of potato tubers counted during test probing. In themineral N fertiliser-treated plots only 39% of the counted potato tubers had a size smaller

Appl. Sci. 2022, 12, 341 15 of 21
than 5 cm during the test probing. For the other treatments, the size of the potatoes werecomparable with the treatment with mineral N fertiliser. The number of tubers that werecounted during test probing were lowest in the plot that received LDF only (45 tubers). Thenumber of tubers for the other treatments were very similar and ranged between 57 for thetreatment with LFD and manure, and 66 for the treatments with AS and manure. Theseresults illustrate the slightly poorer performance of LFD compared with AS.
After harvest, the NH4-N and NO3-N residues in the soil were analysed (Figure 7).The potential for residual nitrate leaching to the ground and surface water is one of theimportant aspects of the safe application of BBFs. The residual nitrate in the soil profile(0–90cm) in the post-harvest period showed no significant difference in leaching risk forBBFs in comparison with the used mineral fertiliser. However, all the treatments (includingthe unfertilised control) resulted in relatively high nitrate residues. In the Netherlands,there is no legal limit on maximum allowable nitrate residue. On the other hand, inFlanders, in the neighbouring region, nitrate residue in potato cultivation should notexceed (depending on the location of the field) the maximum limit of 165 kg NO3-N ha−1
according to current Flemish environmental standards (VLM, 2021). In general, high nitrateresidue is considered common in the case of potatoes due to their ability to uptake only50–60% of the applied N [39], and also their shorter root depth [40]. Additionally, the effectof rainfall during the growing season is also found to be inversely proportional to thenitrate residue in 0–90cm soil depth [39]. The high application of N (310 kg ha−1) resultedin high residue concentrations in the soil. The NO3-N residue in the soil profile was onaverage highest in the plots that only received AS (264 kg ha−1), but the residues in plotsthat received mineral fertiliser and manure (256 kg ha−1), LFD and manure (258 kg ha−1),and AS and manure (245 kg ha−1) were almost as high. The NO3-N residue in the soilprofile was, except from the control, lowest in the plots that only received LFD.
Appl. Sci. 2022, 11, x FOR PEER REVIEW 17 of 22
Figure 7. Amount of nitrate residue (kg ha−1 in 0–90 cm soil depth) in post-harvest period for five treatments (MF + M = CAN + manure, LFD + M = liquid fraction of digestate and manure, AS + M = ammonium sulphate solution and manure, only LFD = standalone treatment from liquid fraction of digestate, and only AS = standalone treatment from ammonium sulphate solution). Red dotted line represents the legislative limit (165 kg ha−1) according to Flemish environmental standards.
3.5. Environmental and Agronomic Evaluation This study showed that all three BBFs are safe to use in potato growing from an ag-
ronomic and environmental perspective (Figure 8). Possibly, the effect can be influenced more strongly by soil type, e.g., soil pH, rather than by quantity and quality of the applied BBF [41]. Summarized, after soil application, AS has a relatively low N2O emission factor. It has highest N release rate and NFRV, and also in the field trial the N concentration in the potato tuber, the potato yield, and the NO3-N residue in the soil after harvest were comparable with the results of the MF-treated plots. The potato yield of the plot that only received AS was highest of all plots. However, in the Netherlands it is not very likely that AS is applied without manure. AS is tested for being classified as RENURE product 13. Acidification of the soil is a concern of using AS frequently. This can have negative im-pacts on mineral composition and biodiversity [34].
Figure 8. Summary of the results to compare refined bio-based fertilisers (ammonium sulphate (AS) and potassium concentrate solution (KC)) with less refined bio-based fertiliser (liquid fraction of digestate (LFD)) and mineral fertiliser (MF) with and without manure (man) on: (i) greenhouse gas
Figure 7. Amount of nitrate residue (kg ha−1 in 0–90 cm soil depth) in post-harvest period for fivetreatments (MF + M = CAN + manure, LFD + M = liquid fraction of digestate and manure, AS + M =ammonium sulphate solution and manure, only LFD = standalone treatment from liquid fraction ofdigestate, and only AS = standalone treatment from ammonium sulphate solution). Red dotted linerepresents the legislative limit (165 kg ha−1) according to Flemish environmental standards.
3.5. Environmental and Agronomic Evaluation
This study showed that all three BBFs are safe to use in potato growing from anagronomic and environmental perspective (Figure 8). Possibly, the effect can be influencedmore strongly by soil type, e.g., soil pH, rather than by quantity and quality of the appliedBBF [41]. Summarized, after soil application, AS has a relatively low N2O emission factor.It has highest N release rate and NFRV, and also in the field trial the N concentration in

Appl. Sci. 2022, 12, 341 16 of 21
the potato tuber, the potato yield, and the NO3-N residue in the soil after harvest werecomparable with the results of the MF-treated plots. The potato yield of the plot that onlyreceived AS was highest of all plots. However, in the Netherlands it is not very likely thatAS is applied without manure. AS is tested for being classified as RENURE product 13.Acidification of the soil is a concern of using AS frequently. This can have negative impactson mineral composition and biodiversity [34].
Appl. Sci. 2022, 11, x FOR PEER REVIEW 17 of 22
Figure 7. Amount of nitrate residue (kg ha−1 in 0–90 cm soil depth) in post-harvest period for five treatments (MF + M = CAN + manure, LFD + M = liquid fraction of digestate and manure, AS + M = ammonium sulphate solution and manure, only LFD = standalone treatment from liquid fraction of digestate, and only AS = standalone treatment from ammonium sulphate solution). Red dotted line represents the legislative limit (165 kg ha−1) according to Flemish environmental standards.
3.5. Environmental and Agronomic Evaluation This study showed that all three BBFs are safe to use in potato growing from an ag-
ronomic and environmental perspective (Figure 8). Possibly, the effect can be influenced more strongly by soil type, e.g., soil pH, rather than by quantity and quality of the applied BBF [41]. Summarized, after soil application, AS has a relatively low N2O emission factor. It has highest N release rate and NFRV, and also in the field trial the N concentration in the potato tuber, the potato yield, and the NO3-N residue in the soil after harvest were comparable with the results of the MF-treated plots. The potato yield of the plot that only received AS was highest of all plots. However, in the Netherlands it is not very likely that AS is applied without manure. AS is tested for being classified as RENURE product 13. Acidification of the soil is a concern of using AS frequently. This can have negative im-pacts on mineral composition and biodiversity [34].
Figure 8. Summary of the results to compare refined bio-based fertilisers (ammonium sulphate (AS) and potassium concentrate solution (KC)) with less refined bio-based fertiliser (liquid fraction of digestate (LFD)) and mineral fertiliser (MF) with and without manure (man) on: (i) greenhouse gas
Figure 8. Summary of the results to compare refined bio-based fertilisers (ammonium sulphate (AS)and potassium concentrate solution (KC)) with less refined bio-based fertiliser (liquid fraction ofdigestate (LFD)) and mineral fertiliser (MF) with and without manure (man) on: (i) greenhouse gas(GHG) emission factor (EF) (blue), (ii) N release rate (yellow), (iii) nutrient fertiliser replacementvalue (NFRV), and (iv) potential field application (green).
The N2O emission after the application of LFD was low. The N release rate and theNFRV are lower compared with the highly refined BBF AS, but higher compared with MF.In the field trial, the plots that were treated with LFD showed lowest N concentration in thetuber and lowest potato yield, and performed poorest in the qualitative assessment of thepotatoes after harvest. In practice, farmers are restricted to the amount of N from livestockmanure they can apply on the field (170 kg N/ha). A meta-data analysis showed thatLFD met the criteria of RENURE in only 43% to 58% of the analysed data [42]. Therefore,it is not very likely that LFD will become a RENURE product. However, it can serveas a replacement for slurry manure in areas where the application is restricted by the Pregulations because the P content in LFD is lower (0.7 instead of 2.4 g kg−1). However, theadoption of LFD will depend on the price farmers receive or pay for the product. Long-termapplication of LFD can build up nutrients in the soil which can improve the NFRV [22]. Itis recommended to investigate the effect of BBF refinement on long-term application or onthe use of precision fertigation.
NH3 emissions were not measured, but it is expected that NH3 emissions are lowduring the application of AS because of the low pH of the product. The farmer had problemsapplying the small amounts of AS to the plots and prefers to dilute the product. NH3emissions increase when the pH of the product increases above pH 5 and should thereforebe taken into account when AS is diluted. The NH3 emissions during the application ofLFD depend strongly on the application method [12]. Confirmed by a fertiliser machinerydeveloper in the Netherlands, machinery for injecting LFD during the potato growingseason does not exist. The dispensing nozzles will be clogged by the fibres in the LFD.Therefore, surface application of LFD is unavoidable at the moment.
The highly refined BBF KC showed moderate N2O emissions. The N release rate is, asexpected, the lowest of all fertiliser products tested. The NFRV is higher compared with MF,but lower compared with the less refined BBF LFD. Because of the high K-concentration in
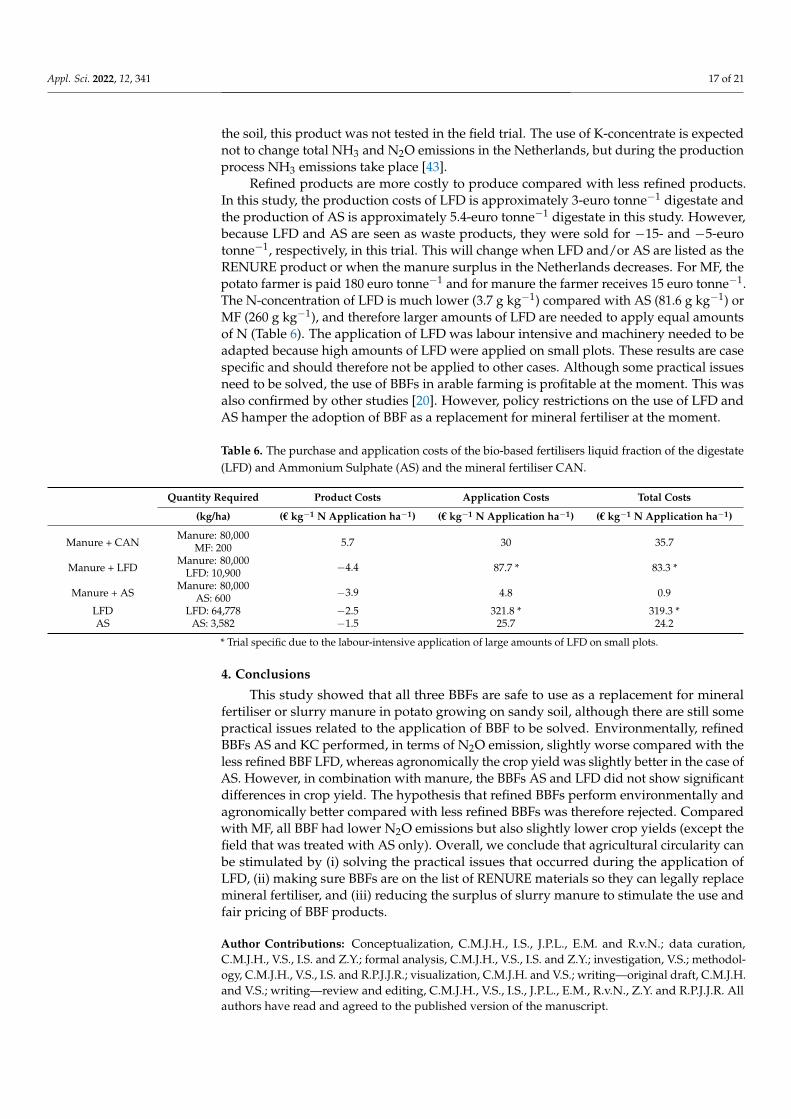
Appl. Sci. 2022, 12, 341 17 of 21
the soil, this product was not tested in the field trial. The use of K-concentrate is expectednot to change total NH3 and N2O emissions in the Netherlands, but during the productionprocess NH3 emissions take place [43].
Refined products are more costly to produce compared with less refined products.In this study, the production costs of LFD is approximately 3-euro tonne−1 digestate andthe production of AS is approximately 5.4-euro tonne−1 digestate in this study. However,because LFD and AS are seen as waste products, they were sold for −15- and −5-eurotonne−1, respectively, in this trial. This will change when LFD and/or AS are listed as theRENURE product or when the manure surplus in the Netherlands decreases. For MF, thepotato farmer is paid 180 euro tonne−1 and for manure the farmer receives 15 euro tonne−1.The N-concentration of LFD is much lower (3.7 g kg−1) compared with AS (81.6 g kg−1) orMF (260 g kg−1), and therefore larger amounts of LFD are needed to apply equal amountsof N (Table 6). The application of LFD was labour intensive and machinery needed to beadapted because high amounts of LFD were applied on small plots. These results are casespecific and should therefore not be applied to other cases. Although some practical issuesneed to be solved, the use of BBFs in arable farming is profitable at the moment. This wasalso confirmed by other studies [20]. However, policy restrictions on the use of LFD andAS hamper the adoption of BBF as a replacement for mineral fertiliser at the moment.
Table 6. The purchase and application costs of the bio-based fertilisers liquid fraction of the digestate(LFD) and Ammonium Sulphate (AS) and the mineral fertiliser CAN.
Quantity Required Product Costs Application Costs Total Costs
(kg/ha) (€ kg−1 N Application ha−1) (€ kg−1 N Application ha−1) (€ kg−1 N Application ha−1)
Manure + CANManure: 80,000
5.7 30 35.7MF: 200
Manure + LFDManure: 80,000 −4.4 87.7 * 83.3 *LFD: 10,900
Manure + ASManure: 80,000 −3.9 4.8 0.9AS: 600
LFD LFD: 64,778 −2.5 321.8 * 319.3 *AS AS: 3,582 −1.5 25.7 24.2
* Trial specific due to the labour-intensive application of large amounts of LFD on small plots.
4. Conclusions
This study showed that all three BBFs are safe to use as a replacement for mineralfertiliser or slurry manure in potato growing on sandy soil, although there are still somepractical issues related to the application of BBF to be solved. Environmentally, refinedBBFs AS and KC performed, in terms of N2O emission, slightly worse compared with theless refined BBF LFD, whereas agronomically the crop yield was slightly better in the case ofAS. However, in combination with manure, the BBFs AS and LFD did not show significantdifferences in crop yield. The hypothesis that refined BBFs perform environmentally andagronomically better compared with less refined BBFs was therefore rejected. Comparedwith MF, all BBF had lower N2O emissions but also slightly lower crop yields (except thefield that was treated with AS only). Overall, we conclude that agricultural circularity canbe stimulated by (i) solving the practical issues that occurred during the application ofLFD, (ii) making sure BBFs are on the list of RENURE materials so they can legally replacemineral fertiliser, and (iii) reducing the surplus of slurry manure to stimulate the use andfair pricing of BBF products.
Author Contributions: Conceptualization, C.M.J.H., I.S., J.P.L., E.M. and R.v.N.; data curation,C.M.J.H., V.S., I.S. and Z.Y.; formal analysis, C.M.J.H., V.S., I.S. and Z.Y.; investigation, V.S.; methodol-ogy, C.M.J.H., V.S., I.S. and R.P.J.J.R.; visualization, C.M.J.H. and V.S.; writing—original draft, C.M.J.H.and V.S.; writing—review and editing, C.M.J.H., V.S., I.S., J.P.L., E.M., R.v.N., Z.Y. and R.P.J.J.R. Allauthors have read and agreed to the published version of the manuscript.

Appl. Sci. 2022, 12, 341 18 of 21
Funding: This research was funded by the Nutri2Cycle project who receives funding from theEuropean Union’s Horizon 2020 Framework Programme for Research and Innovation under GrantAgreement no 773682 and from the Dutch Ministry of Agriculture (AF-EU-18030).
Institutional Review Board Statement: Not applicable.
Informed Consent Statement: Not applicable.
Data Availability Statement: Data are available on request due to restrictions, e.g., privacy or ethical.The data presented in this study are available on request from the corresponding author. The data arenot publicly available due to privacy.
Acknowledgments: This research was carried out in collaboration with Van den Borne Potatoes,Practice Center for Precision Agriculture, a pig farmer, and VP-Hobe. We are very grateful for theircontributions.
Conflicts of Interest: The authors declare no conflict of interest.
Appendix A
Appl. Sci. 2022, 11, x FOR PEER REVIEW 20 of 22
Appendix A
Figure A1. Weather data during the growing season, including the air temperature (°C) (A), solar radiation (J/cm2) and humidity (%) (B), precipitation (in mm) (C), and wind speed (m/s) and direc-tion (per 24 h) (D).
Appendix B
Table A1. Pearson correlation analysis between different parameters in relation to the BBFs, N re-lease, and N mineralization dynamics (n = 3).
Parameters OC (g kg−1)
Ntot (g kg−1)
NH4-N (g kg−1)
C/Ntot C/Organic
N NH4-
N/Ntot Organic N/Ntot
Total N-min (mg
kg−1)
N Re-lease (%)
N Mineral-ization (%)
Ntot Added
(mg)
NH4-N Added
(mg)
OC Added (mg)
OC (g kg−1) -
Ntot (g kg−1) −0.558 -
NH4-N (g kg−1)
−0.588 0.999 * -
C/Ntot 0.977 −0.721 −0.746 -
C/organic N 0.711 −0.98 −0.987 0.844 -
NH4-N/Ntot −0.996 0.633 0.661 −0.993 −0.774 -
Figure A1. Weather data during the growing season, including the air temperature (◦C) (A), solarradiation (J/cm2) and humidity (%) (B), precipitation (in mm) (C), and wind speed (m/s) anddirection (per 24 h) (D).

Appl. Sci. 2022, 12, 341 19 of 21
Appendix B
Table A1. Pearson correlation analysis between different parameters in relation to the BBFs, N release,and N mineralization dynamics (n = 3).
ParametersOC (gkg−1)
Ntot (gkg−1)
NH4-N (gkg−1)
C/Ntot C/OrganicN
NH4-N/Ntot
OrganicN/Ntot
TotalN-min (mg
kg−1)
N Release(%)
N Mineral-ization
(%)
NtotAdded
(mg)
NH4-NAdded
(mg)
OCAdded(mg)
OC (g kg−1) -Ntot (g kg−1) −0.558 -
NH4-N (g kg−1) −0.588 0.999 * -C/Ntot 0.977 −0.721 −0.746 -
C/organic N 0.711 −0.98 −0.987 0.844 -NH4-N/Ntot −0.996 0.633 0.661 −0.993 −0.774 -
OrganicN/Ntot 0.996 −0.633 −0.661 0.993 0.774 −1.000 ** -Total N-min (mg kg−1) −0.962 0.762 0.786 −0.998 * −0.875 0.984 −0.984 -
N release (%) −0.986 0.688 0.714 −0.999 * −0.818 0.997 * −0.997 * 0.994 -N mineralization (%) −0.96 0.769 0.792 −0.997 * −0.88 0.982 −0.982 1.000 ** 0.993 -
Ntot added (mg) 0.528 −0.999 * −0.997 * 0.696 0.972 −0.605 0.605 −0.739 −0.661 −0.745 -NH4-N added (mg) −0.996 0.629 0.657 −0.992 −0.77 1.000 ** −1.000 ** 0.983 0.997 * 0.981 −0.6 -
OC added (mg) 0.935 −0.227 −0.263 0.839 0.415 −0.898 0.898 −0.803 −0.863 −0.797 0.192 −0.9 -
* Correlation is significant at the 0.05 level (2-tailed). ** Correlation is significant at the 0.01 level (2-tailed).
References1. Liu, Y.; Pan, X.; Li, J. A 1961–2010 record of fertilizer use, pesticide application and cereal yields: A review. Agron. Sustain. Dev.
2015, 35, 83–93. [CrossRef]2. Pinsard, C.; Martin, S.; Léger, F.; Accatino, F. Robustness to import declines of three types of European farming systems assessed
with a dynamic nitrogen flow model. Agric. Syst. 2021, 193, 103215. [CrossRef]3. Duan, Y.-F.; Bruun, S.; Stoumann Jensen, L.; Van Gerven, L.; Hendriks, C.M.J.; Stokkermans, L.; Groenedijk, P.; Lesschen, J.P.;
Prado, J.; Fangueiro, D. Nutri2Cycle: D1.5 Mapping and Characterization of CNP Flows and Their Stoichiometry in Main FarmingSystems in Europe. 2020. Available online: https://www.nutri2cycle.eu/wp-content/uploads/2021/05/D1.5-Nutri2Cycle_Report-on-the-mapping-and-charcaterization-of-CNP-flows.pdf (accessed on 2 November 2021).
4. Schütz, L.; Gattinger, A.; Meier, M.; Müller, A.; Boller, T.; Mäder, P.; Mathimaran, N. Improving Crop Yield and Nutrient UseEfficiency via Biofertilization—A Global Meta-analysis. Front. Plant Sci. 2018, 8, 2204. [CrossRef] [PubMed]
5. EUROSTAT. Agri-Environmental Indicator-Mineral Fertiliser Consumption. 2020. Available online: https://ec.europa.eu/eurostat/statistics-explained/index.php?title=Agri-environmental_indicator_-_mineral_fertiliser_consumption (accessed on 15October 2021).
6. Chojnacka, K.; Moustakas, K.; Witek-Krowiak, A. Bio-based fertilizers: A practical approach towards circular economy. Bioresour.Technol. 2020, 295, 122223. [CrossRef] [PubMed]
7. Bhardwaj, D.; Ansari, M.W.; Sahoo, R.K.; Tuteja, N. Biofertilizers function as key player in sustainable agriculture by improvingsoil fertility, plant tolerance and crop productivity. Microb. Cell Fact. 2014, 13, 66. [CrossRef]
8. Carsel, R.F.; Smith, C.N.; Mulkey, L.A.; Dean, J.D.; Jowise, P. User’s Manual for the Pesticide Root Zone Model (PRZM): Release 1;Environmental Research Laboratory: Athens, GA, USA, 1984.
9. Ye, L.; Zhao, X.; Bao, E.; Li, J.; Zou, Z.; Cao, K. Bio-organic fertilizer with reduced rates of chemical fertilization improves soilfertility and enhances tomato yield and quality. Sci. Rep. 2020, 10, 177. [CrossRef] [PubMed]
10. Sigurnjak, I.; Brienza, C.; Snauwaert, E.; De Dobbelaere, A.; De Mey, J.; Vaneeckhaute, C.; Michels, E.; Schoumans, O.; Adani,F.; Meers, E. Production and performance of bio-based mineral fertilizers from agricultural waste using ammonia (stripping-)scrubbing technology. Waste Manag. 2019, 89, 265–274. [CrossRef]
11. Bamelis, L.; Blancke, S.; Camargo-Valero, M.A.; De Clercq, L.; Haumont, A.; De Keulenaere, B.; Delvigne, F.; Meers, E.;Michels, E.; Ramirez-Sosa, D.R.; et al. BIOREFINE: Recycling Inorganic Chemicals from Digestate Derivatives. 2011. Availableonline: https://www.biorefine.eu/wp-content/uploads/2021/03/wp2a5_gxabt_20151216_recovery_techniques_-_digestate.pdf(accessed on 17 December 2021).
12. Regelink, I.; Van Puffelen, J.L.; Ehlert, P.A.I.; Schoumans, O.F. Evaluatie van Verwerkingsinstallaties voor Mest en Co-Vergiste Mest;Wageningen Environmental Research: Wageningen, The Netherlands, 2021.
13. Huygens, D.; Orveillon, G.; Lugato, E.; Tavazzi, S.; Comero, S.; Jones, A.; Gawlik, B.; Saveyn, H. Technical Proposals for the SafeUse of Processed Manure above the Threshold Established for Nitrate Vulnerable Zones by the Nitrates Directive (91/676/EEC).2020. Available online: https://op.europa.eu/en/publication-detail/-/publication/b135440f-f7c4-11ea-991b-01aa75ed71a1/language-en (accessed on 17 December 2021).
14. Tur-Cardona, J.; Bonnichsen, O.; Speelman, S.; Verspecht, A.; Carpentier, L.; Debruyne, L.; Marchand, F.; Jacobsen, B.H.; Buysse, J.Farmers’ reasons to accept bio-based fertilizers: A choice experiment in seven different European countries. J. Clean. Prod. 2018,197, 406–416. [CrossRef]
15. Chesworth, W.; Camps Arbestain, M.; Macías, F.; Spaargaren, O.; Spaargaren, O.; Mualem, Y.; Morel-Seytoux, H.J.; Horwath,W.R.; Almendros, G.; Chesworth, W.; et al. Classification of Soils: World Reference Base (WRB) for soil resources. In Encyclopediaof Soil Science; Chesworth, W., Ed.; Springer: Dordrecht, The Netherlands, 2008; pp. 120–122, ISBN 978-1-4020-3995-9.

Appl. Sci. 2022, 12, 341 20 of 21
16. Ameloot, N.; Sleutel, S.; Das, K.C.; Kanagaratnam, J.; de Neve, S. Biochar amendment to soils with contrasting organic matterlevel: Effects on N mineralization and biological soil properties. GCB Bioenergy 2015, 7, 135–144. [CrossRef]
17. Egene, C.E.; Sigurnjak, I.; Regelink, I.C.; Schoumans, O.F.; Adani, F.; Michels, E.; Sleutel, S.; Tack, F.M.G.; Meers, E. Solid fractionof separated digestate as soil improver: Implications for soil fertility and carbon sequestration. J. Soils Sediments 2021, 21, 678–688.[CrossRef]
18. European Union. Council Directive 91/676/EEC of 12 December 1991 concerning the protection of waters against pollutioncaused by nitrates from agricultural sources. Off. J. L 1991, 375, 12.
19. De Neve, S.; Hofman, G. Modelling N mineralization of vegetable crop residues during laboratory incubations. Soil Biol. Biochem.1996, 28, 1451–1457. [CrossRef]
20. Sigurnjak, I.; De Waele, J.; Michels, E.; Tack, F.M.G.; Meers, E.; De Neve, S. Nitrogen release and mineralization potential ofderivatives from nutrient recovery processes as substitutes for fossil fuel-based nitrogen fertilizers. Soil Use Manag. 2017, 33,437–446. [CrossRef]
21. De Klein, C.; Novoa, R.S.A.; Ogle, S.; Smith, K.A.; Rochette, P.; Wirth, T.C.; McConkey, B.G.; Mosier, A.; Rypdal, K.; Walsh, M.;et al. Chapter 11: N2O Emissions from Managed Soils, and CO2 Emissions from Lime and Urea Applica. 2006. Available online:https://www.ipcc-nggip.iges.or.jp/public/2006gl/pdf/4_Volume4/V4_11_Ch11_N2O&CO2.pdf (accessed on 17 December2021).
22. Hijbeek, R.; ten Berge, H.F.M.; Whitmore, A.P.; Barkusky, D.; Schröder, J.J.; van Ittersum, M.K. Nitrogen fertiliser replacementvalues for organic amendments appear to increase with N application rates. Nutr. Cycl. Agroecosyst. 2018, 110, 105–115. [CrossRef]
23. Schröder, J. Manure as a Suitable Component of Precise Nitrogen Nutrition. In Proceedings No. 574; International Fertiliser Society:York, UK, 2005; pp. 1–32.
24. Delin, S. Fertilizer value of nitrogen in hen and broiler manure after application to spring barley using different applicationtiming. Soil Use Manag. 2011, 27, 415–426. [CrossRef]
25. Jensen, L.S. Animal Manure Fertiliser Value, Crop Utilisation and Soil Quality Impacts. In Animal Manure Recycling: Treatment andManagement; Wiley: Hoboken, NJ, USA, 2013; pp. 295–328, ISBN 9781118676677. [CrossRef]
26. Kuzyakov, Y.; Friedel, J.K.; Stahr, K. Review of mechanisms and quantification of priming effects. Soil Biol. Biochem. 2000, 32,1485–1498. [CrossRef]
27. Calderón, F.J.; McCarty, G.W.; Reeves, J.B. Analysis of manure and soil nitrogen mineralization during incubation. Biol. Fertil.Soils 2005, 41, 328–336. [CrossRef]
28. Grigatti, M.; Di Girolamo, G.; Chincarini, R.; Ciavatta, C.; Barbanti, L. Potential nitrogen mineralization, plant utilization efficiencyand soil CO2 emissions following the addition of anaerobic digested slurries. Biomass Bioenergy 2011, 35, 4619–4629. [CrossRef]
29. Azeez, J.O.; Van Averbeke, W. Nitrogen mineralization potential of three animal manures applied on a sandy clay loam soil.Bioresour. Technol. 2010, 101, 5645–5651. [CrossRef] [PubMed]
30. Abubaker, J.; Risberg, K.; Pell, M. Biogas residues as fertilisers—Effects on wheat growth and soil microbial activities. Appl.Energy 2012, 99, 126–134. [CrossRef]
31. Bean, W.T.; Stafford, R.; Brashares, J.S. The effects of small sample size and sample bias on threshold selection and accuracyassessment of species distribution models. Ecography 2012, 35, 250–258. [CrossRef]
32. Oertel, C.; Matschullat, J.; Zurba, K.; Zimmermann, F.; Erasmi, S. Greenhouse gas emissions from soils—A review. Geochemistry2016, 76, 327–352. [CrossRef]
33. Velthof, G.L.; Rietra, R.P.J.J. Nitrogen Use Efficiency and Gaseous Nitrogen Losses from the Concentrated Liquid Fraction of PigSlurries. Int. J. Agron. 2019, 2019, 9283106. [CrossRef]
34. Velthof, G.L.; Rietra, R.P.J.J. Nitrous Oxide Emission from Agricultural Soils; Wageningen Environmental Research: Wageningen, TheNetherlands, 2018.
35. Ren, F.; Zhang, X.; Liu, J.; Sun, N.; Wu, L.; Li, Z.; Xu, M. A synthetic analysis of greenhouse gas emissions from manure amendedagricultural soils in China. Sci. Rep. 2017, 7, 8123. [CrossRef]
36. Shashank, T.; Shankar, S.J.; Pratap, S.D. Methanotrophs and CH4 sink: Effect of human activity and ecological perturbations.Clim. Change Environ. Sustain. 2015, 3, 35–50.
37. Harty, M.A.; Forrestal, P.J.; Watson, C.J.; McGeough, K.L.; Carolan, R.; Elliot, C.; Krol, D.; Laughlin, R.J.; Richards, K.G.; Lanigan,G.J. Reducing nitrous oxide emissions by changing N fertiliser use from calcium ammonium nitrate (CAN) to urea basedformulations. Sci. Total Environ. 2016, 563–564, 576–586. [CrossRef]
38. de Klein, C.A.M.; Sherlock, R.R.; Cameron, K.C.; van der Weerden, T.J. Nitrous oxide emissions from agricultural soils in NewZealand—A review of current knowledge and directions for future research. J. R. Soc. N. Z. 2001, 31, 543–574. [CrossRef]
39. Bélanger, G.; Ziadi, N.; Walsh, J.R.; Richards, J.E.; Milburn, P.H. Residual Soil Nitrate after Potato Harvest. J. Environ. Qual. 2003,32, 607–612. [CrossRef]
40. Joshi, M.; Fogelman, E.; Belausov, E.; Ginzberg, I. Potato root system development and factors that determine its architecture. J.Plant Physiol. 2016, 205, 113–123. [CrossRef]
41. Panuccio, M.R.; Romeo, F.; Mallamaci, C.; Muscolo, A. Digestate Application on Two Different Soils: Agricultural Benefit andRisk. Waste Biomass Valorization 2021, 12, 4341–4353. [CrossRef]

Appl. Sci. 2022, 12, 341 21 of 21
42. Reuland, G.; Sigurnjak, I.; Dekker, H.; Michels, E.; Meers, E. The Potential of Digestate and the Liquid Fraction of Digestate asChemical Fertiliser Substitutes under the RENURE Criteria. Agronomy 2021, 11, 1374. [CrossRef]
43. Velthof, G.L. Mineral Concentrate from Processed Manure as Fertiliser; Wageningen Environmental Research: Wageningen,The Netherlands, 2015.