
REPEATED INTERACTIONS & CONTRACT STRUCTURE: EVIDENCE FROM
53
Repeated Interactions & Contract Structure Evidence from Technology Development Contracts Michael D. Ryall ∗ and Rachelle C. Sampson ± ∗ Melbourne Business School, University of Melbourne ± University of Maryland Intellectual Property Research Institute of Australia The University of Melbourne Intellectual Property Research Institute of Australia Working Paper No. 11.05 ISSN 1447-2317 April 2005 Intellectual Property Research Institute of Australia The University of Melbourne Law School Building Victoria 3010 Australia Telephone: 61 (0) 3 8344 1127 Fax: 61 (0) 3 9348 2353 Email: [email protected] www.ipria.org
Transcript of REPEATED INTERACTIONS & CONTRACT STRUCTURE: EVIDENCE FROM

Repeated Interactions & Contract Structure Evidence from Technology Development Contracts
Michael D. Ryall∗ and Rachelle C. Sampson± ∗Melbourne Business School, University of Melbourne
± University of Maryland Intellectual Property Research Institute of Australia
The University of Melbourne
Intellectual Property Research Institute of Australia Working Paper No. 11.05
ISSN 1447-2317
April 2005
Intellectual Property Research Institute of Australia The University of Melbourne
Law School Building Victoria 3010 Australia
Telephone: 61 (0) 3 8344 1127 Fax: 61 (0) 3 9348 2353
Email: [email protected] www.ipria.org

REPEATED INTERACTIONS & CONTRACT STRUCTURE: EVIDENCE FROM TECHNOLOGY DEVELOPMENT CONTRACTS
Michael D. Ryall Rachelle C. Sampson*
Melbourne Business School
University of Maryland
ABSTRACT
Formal contracting addresses the coordination difficulties inherent in inter-firm deals via explicit terms designed to achieve incentive alignment. Alternatively, when firms expect to interact repeatedly, implicit mechanisms may achieve similar results and without the associated costs. Hence, other things equal, we expect firms will rely upon implicit mechanisms whenever possible. Whether firms actually do substitute implicit mechanisms for explicit ones in the presence of repeated interaction is an empirical question that forms the basis of this paper. We study a sample of 52 joint technology development contracts in the telecommunications and microelectronics industries and devise a coding scheme to allow empirical comparison of contract terms. Counter to the traditional intuition, we find that a firm’s contracts are more detailed and more likely to include penalties when it engages in frequent joint development deals (whether with the same or different partners).
Keywords: contracts, governance, repeated interactions, R&D JEL Classifications: L14, O32, K12
*Corresponding author: Smith School of Business, University of Maryland, Van Munching Hall 3301, College Park, MD 20742-1815; [email protected]. We thank Juan Alćacer, Adam Brandenburger, Gary Dushnitsky, Joshua Gans, Robert Gibbons, Michelle Gittelman, Bill Greene, Josh Lerner, Scott Masten, Joanne Oxley, Per Strömberg and Bernard Yeung for valuable feedback and comments; seminar participants at the US Department of Justice (Antitrust), Wharton School, Ohio State University, the Strategy Research Forum at Washington University and the University of Maryland for thoughtful suggestions; and participants at the NBER Conference on Corporate Alliances for helpful suggestions that led to the development of this paper.

1. INTRODUCTION
One of the most resilient game theoretic findings on the nature of joint economic
activity in the presence of moral hazard is that the anticipation of repeated interaction can
lead to cooperative outcomes without reliance upon external enforcement mechanisms.1
Of course, game theory’s real contribution here is essentially to formalize the strong,
economic intuition that agents faced with an opportunity for frequent cooperation are
likely to substitute the carrot of continued collaboration for the relatively more costly
stick of formal sanctions enforced by outside parties.2 This intuition is supported by
theoretical findings (most famously, Green and Porter, 1984) and reinforced by more
recent work such as Bernheim and Whinston (1998:902) who show that it may often be
optimal to implement a contract that is less complete than otherwise feasible.
The purpose of this study is to examine the empirical relationship between the
frequency of interaction between parties engaged in joint economic activity and the
composition of the contracts they execute. Originally, the aim was to refine our
understanding of the degree to which the implicit mechanisms available in long-term
relationships are actually substituted for explicit provisions in contracts governing short-
term deals. Instead, contrary to the aforementioned intuition, we find that contracts
between parties that interact frequently are more detailed, in terms of firm rights,
1 The theoretical literature on this topic is vast; we do not attempt a complete review here. The insight is an implication of the result that, in infinitely repeated games, any feasible, individually rational payoff can be supported in equilibrium provided players are sufficiently patient; see, e.g., Fudenberg and Tirole (1998, p. 145-206) and survey papers by Aumann (1986) and Mertens (1987). Important theoretical contributions that are more closely related to this study include Bull (1987), Matsushima (1989), Porter (1983), Radner (1980, 1986), and Radner, Meyerson and Maskin (1986).
2 The costs of using formal contracts to align incentives are well-studied and include the direct expenses of implementation, difficulties in specifying complete agreements with relevant contingencies, inefficiencies in external enforcement through the court system and the erosion of personal relationships through adversarial negotiations (see, e.g., Crocker and Masten, 1991; Macaulay, 1963).
1

obligations and development plans and are more likely to include penalties for
underperformance.
These results are puzzling; we are aware of no theoretical work with which they are
entirely consistent. We conjecture that one of the two following explanations is most
likely. The first is that, either in this industry specifically or in deals of this kind more
generally, explicit contractual contingencies somehow complement implicit mechanisms.
This possibility is suggested by Baker, Gibbons and Murphy (1994) who illustrate, in the
context of a principal-agent problem, conditions under which introduction of objective
performance measures increase the use of subjective measures by increasing the value of
the on-going relationship.3
Alternatively, particularly given the high degree of uncertainty likely to be
associated with technology development projects, organizational learning may be the
driving factor. That is, it may be that as agents refine their understanding of the process
governing technology development, they are simply better equipped to formulate more
complete contracts. This latter explanation is consistent with our finding that contracts
become more detailed whether a firm’s frequent projects are with the same or different
partners. Still, to the extent an improved understanding of the process could also be used
to strengthen implicit arrangements, it is not immediately clear why firms would increase
reliance upon explicit terms in situations where, arguably, the efficacy of the implicit
mechanism is stronger. We return to discuss these issues after presenting the empirical
details.
In addition to the results mentioned above, we also find several interesting
characteristics of joint technology development arrangements through our examination of
contractual provisions in 52 joint technology development contracts in the
3 While their construction does not directly apply in the situation we analyze (i.e., due to important distinctions between the principal-agent and joint production settings), similar forces may be at work here.
2

telecommunications equipment and microelectronics industries. Firms in the majority of
these contracts formally waive their rights to pursue dispute resolution in a court of law,
instead relying on a variety of private adjudication methods, including CEO meetings and
arbitration with specified arbitrators. Additionally, firms engaged in joint development,
according to their contracts, rarely engage in their joint activities under the same roof –
‘co-location’ of joint development happens in only 11.5% of our contracts. Intellectual
property rights over jointly developed technology do not appear to be divided equally in
most agreements, but rather split according to technology contributions. On first glance,
it appears that the intellectual property rights are allocated to the firm that has the most
related technology to the project and, presumably, the more significant contribution to
make to the joint development activities. Finally, joint venture formation is relatively
rare, occurring in only 11.5% of the joint development agreements in our sample.4 These
descriptive elements of the paper complement a growing literature on the structure and
details of financial contracting.5 More details on the contracts are set out below.
The paper proceeds as follows. Section 2 describes our sample and the contracts in
detail. In Section 3, we empirically examine the relationship between contract structure
and repeated interactions. Finally, in Section 4 we discuss the implications of our results
and observations for existing theory and future avenues for theoretical development.
2. SAMPLE & DESCRIPTION OF CONTRACTS Technology development across firm boundaries is a fertile environment for moral
hazard problems. Typically, R&D projects are passed back and forth between firms at
various stages, making it difficult to observe the behavior of one’s partner. The inherent
nature of these projects makes it challenging to infer partner behavior based upon what
4 The fact that both co-location and joint venture formation occurs in 11.5% of the sample is purely coincidental. Joint venture contracts and co-location contracts do not perfectly overlap.
5 Recent examples of detailed descriptive and empirical work on contract structure include Kaplan and Strömberg (2003); Elfenbein and Lerner (2003); and Robinson and Stuart (2002).
3

one actually does observe.6 Often, firms are concerned about unintended leakage of
intellectual property, since joint technology development often requires some exposure of
a firm’s intellectual property to its partners. The contracts in our sample capture the
attempts of partnering firms to address these issues.7
2.1 The Contract Sample
Our source of joint technology development contracts is SEC filings. Public firms,
under SEC disclosure requirements, submit ‘material contracts’ as part of their 8K, 10K,
10Q and S-1 filings, including joint technology development contracts. In order to obtain
the largest sample possible, our contracts are collected for the years 1991 to 2000,
inclusive. Since the SEC requirement is to file material documents and not joint
development contracts specifically, filing of these contracts is somewhat discretionary.
As a result, firms tend to file contracts for their most substantial or important deals. The
natural limitation of this data is obvious – we observe only contracts of public companies
and likely only the largest and most important deals for these firms. Small firms do
appear, but only when they partner with public companies who file with the SEC.
We collected contracts in the telecommunications equipment and microelectronics
industries. The convergence of the telecommunications equipment with computer and
microelectronics markets in the late 1980’s substantially accelerated the pace of
technological development (e.g., The Economist 9/13/97). Product life cycles shortened
while the cost of development increased. To gain access to different technologies, realize
6 As Holmstrom (1989:309) notes, R&D projects are: “...(a) risky - there is a high probability of failure, but also extraordinary returns; (b) unpredictable - many future contingencies are impossible to foresee; (c) long term and multistage - the project has an invention, a development and a completion stage, and can be terminated between those; (d) labor intensive - all stages require substantial human effort; and (e) idiosyncratic - not easily comparable to other projects.”
7 Contractual solutions to coordination problems include the allocation of control or residual rights to induce efficient ex ante investments by the firms (i.e., property rights theory as developed in part by Grossman and Hart 1986), or the design of incentives and adjustment mechanisms to reduce ex post bargaining and hold up threats (i.e., transaction cost economics as expounded by Williamson 1975).
4

economies of scale in R&D, and spread the risk and expense of development, firms in
these industries frequently collaborated in their R&D activities.
The firms included in our sample range in size from the largest players in each
industry such as Motorola and IBM, to much smaller, more specialized firms like Global
Village Communication and Positron Fiber Systems.8 Collaborations take many forms,
including cross-licensing arrangements, joint technology development agreements and
formal joint ventures for development and manufacturing. There are no cases of basic
research in our sample.9 Rather, projects in our sample focus on end-product or
manufacturing process driven R&D.
To collect a sample of representative contracts, we began with a list of firms with
primary operations in SIC 366 or 367 from Compustat (approximately 625 firms). From
this list, we downloaded all SEC filings from the EDGAR database and supplemented
these filings with those from Disclosure, Inc. (a company that provides SEC filings on
request for a fee).10 From roughly 12,500 filings, we obtained over 120 technology
development contracts. Screening for deals involving some form of joint development,
reduces our sample size to 52 contracts.11 These deals, even when confined to those for
joint technological development, cover a broad spectrum of purposes, from development
8 Global Village Communication, Inc. is a firm that specializes in creating websites for corporate clients, while Positron Fiber Systems is a broadband equipment manufacturer.
9 According to the NSF, applied research makes up roughly 77% of industrial spending on R&D. (NSF 2002).
10 The EDGAR database, maintained by the SEC, provides electronic filings from 1996 onwards. For filings prior to 1996, we used Disclosure, Inc.
11 Thus, we explicitly exclude those deals that are solely licensing arrangements. Licensing arrangements - typically, defined technology transfers or usage agreements with royalties attached - are an interesting class of contracts to consider, but do not involve the same contracting issues as joint development agreements between firms do. Since our focus is on the contract heterogeneity that may result from repeated interactions, we try to control for other sources of heterogeneity by limiting our scope of examination and, thus, excluding licensing contracts.
5

of new microprocessor cores based on existing technology12 to developing a ‘next-
generation’ ferroelectric chip.13 A brief description of each deal is set out in Table 1.
[Table 1 here.]
For data on the frequency of deals between firms, we relied upon the Securities Data
Company (SDC) Database on Alliances and Joint Ventures. The SDC database compiles
information on a firm’s alliance activity from news reports, SEC filings, industry and
trade journals. While coverage by SDC is inevitably incomplete, since firms are not
required to report alliance activity, this database represents one of the most
comprehensive sources of information on inter-firm deals.
Using SDC data, we captured all repeated deal activity for a firm and broke this
information down into two components: (1) prior deals for a firm where the partners are
the same as partners in our sample contracts for that firm; and (2) prior deals for a firm
where partners differ from those in our sample contracts for the firm. We did not
discriminate between the types of prior deals; that is, we did not differentiate between
prior deals for manufacturing, marketing, or R&D. Information on prior deals was
collected for the years 1985 to present. We supplemented this data with financial
information (including R&D spending) where available from Compustat, collected for
the year prior to the contract date.
2.2 Descriptive Overview
First, consider the descriptive summary of the joint technology deals and partner firm
characteristics presented in Table 2. Several patterns are revealed. Most of the joint
development deals involve R&D only (i.e., no manufacturing or marketing). A slight
majority are cross border deals, involving firms headquartered in different countries.
12 For example, the 1997 alliance between Fujitsu and Ross Technology is for the development of a microprocessor core based on Ross’ ‘Colorado 4 Architecture’ for use by Fujitsu as an embedded microcontroller.
13 The 1999 alliance between Ramtron International and Fujitsu was for this purpose.
6

Partners do not typically have a history together; i.e., most firms do not have prior
alliances with the same partner as in the current deal. However, over 80% of our firms do
have prior deal experience of some kind with different partners. Co-location of joint
development activities occurs in only 11.5% of our contracts. Equity holdings between
partners (whether majority, minority or cross equity) occur in about a third of the deals,
while joint venture formation (i.e., formation of a new firm for joint activities, where
each partner holds equity in the new firm) is infrequent, occurring in just over 11% of the
cases. Intellectual property is typically not shared equally among partners, but is split
between partners according to input contributions, each firm’s area of technological
expertise, and end product market. Finally, firms tend to set a fixed termination date for
the joint development: on average, just over three years from the contract date.
[Table 2 here.]
Next, there are several contractual features that appear regularly across the sample.
Most contracts contain provisions: 1) to ensure confidentiality of partner technologies
and to protect against leakage to third parties, 2) to terminate the deal on bankruptcy or
change in key management of a partner, 3) to limit liability, and 4) to resolve disputes
via arbitration rather than through the courts. These common terms likely reflect the
issues shared by most joint technology development deals – concerns over knowledge
leakage to third parties, fundamental changes in partner status (such as ownership), and
the inefficiency of external dispute resolution.
While not the primary focus of our study, the common reliance upon arbitration is
interesting. Most of the contracts in our sample stipulate arbitration as the sole recourse
in the event of disputes. Several contracts explicitly waive firm rights to bring disputes
before the courts or other administrative bodies, such as the US International Trade
Commission. Some arbitration provisions also create disincentives for seeking
arbitration. For example, in the case of a cross-border joint development agreement,
7

arbitration was required to be conducted in the language and country of the partner firm
not bringing the dispute.14 These provisions likely reflect the inefficiency of courts in
resolving disputes of a highly complex, technical nature. Courts often have difficulty
inferring the intentions of the respective parties and, as a result, produce sub-optimal
remedies in comparison to arbitration.15
Still common, but less frequent, are clauses specifying cross licensing of all partner
patents so as to avoid infringement over the course of the project (whether related to the
technology in the agreement or not). In joint ventures, percentage stakes in the venture
are usually specified, as are the establishment and composition of a board of directors.
When firms are engaged in multiple deals with the same partner, these common terms are
identical between contracts. Examples of the contract language used in these common
terms are set out in Table 3.
[Table 3 here.]
The terms that vary from contract to contract likely arise out of differences in
development goals, environmental uncertainty, and propensity for strategic behavior.
Unfortunately, the existing literature provides few guidelines for identifying and
categorizing clauses of relevance to our study. Therefore, our approach was primarily
inductive. We conducted an in depth analysis of the contracts of a few firms in the
sample to discover the forms taken by their governance mechanisms (those intended to
ensure or encourage cooperative behavior). We focused on terms that set incentives, 14 The joint development agreement between Ramtron International and ULVAC (Japan) (dated 4/9/97) requires arbitration to take place in Japan and be conducted in Japanese if Ramtron, a Colorado microelectronics company, initiates the dispute, and in the US in English if ULVAC initiates the dispute.
15 Crocker and Masten (1991:71) note, “The legal system does not costlessly and unerringly assess remedies. On the contrary, there are reasons to believe that courts systematically deviate from efficient awards. Claims for damages, for example, are subject to a requirement of ‘proof with reasonable certainty.’ In cases where lost profits cannot be adequately established, recovery is likely to be limited to the cost of reliance, implying lower than optimal awards on average. An even if court-determined damages were not systematically biased, the cost of adjudicating damage awards would diminish the attractiveness of litigated enforcement.” Further, legal remedies for breach of contract under neoclassical law are limited and often frustrated by various excuse doctrines (Macneil, 1978).
8

defined the obligations of the parties, established monitoring rights, and elaborated
penalties for non-compliance. For a more detailed discussion, see Appendix A.
We found three broad categories that account for a large portion of the variance
across contracts: (1) the extent to which firm obligations are precisely specified; (2) how
much monitoring is explicitly provided for; and (3) whether penalties exist for non-
compliant behavior. 16 We identify six types of clauses that illustrate the extent to which
partner rights and obligations are detailed or specified in the contracts, five types of
clauses that outline monitoring rights, and two primary forms that penalties take. These
terms capture the three key areas of contract variance analyzed and are illustrated in
Table 4, Panel A, below.
[Table 4, Panel A, here.]
The frequency and cross frequency of these terms across our sample contracts are set
out in Table 4, Panel B.
[Table 4, Panel B, here.]
Table 4, Panel B, reveals the heterogeneity of the contracts. No single term is used in
all contracts in the sample; the highest percentage of term usage is 51.9% (i.e., time
frames for completion of stages specified). A relatively large proportion of the contracts
require some sort of periodic reviews (46.2%), while penalties, particularly financial
penalties, are somewhat rare, occurring in only 11.5% of the sample contracts. Co-
occurrence of terms is relatively low; the terms that more frequently appear together are:
(1) time frames for completion specified and reviews of development work required (co-
occurring in 28.8% of contracts); (2) time frames for completion specified and right to
terminate for underperformance (co-occurring in 25% of contracts); (3) reviews of
development work required and the timing of reviews specified (28.8%); and (4)
16 Each of these categories is multidimensional. For example, in addition to defining the specific technologies a firm is obligated to contribute, a contract may also specify time frames for completion of tasks, the division of intellectual property, and individuals to manage the project.
9

development output specifications included and specific technologies to be contributed
described (23.1%). Given this low incidence of co-occurrence of terms, it does not appear
that the contract terms are used in clusters in our sample.
3. CONTRACT STRUCTURE & REPEATED INTERACTIONS As the descriptive overview illustrates, there is considerable variance in the structure
of our sample contracts. The three apparent sources of this heterogeneity are: (1) the
purpose of the deal (e.g., whether the deal involves radical technological development or
simple customization of existing technology); (2) firm preferences for contract structure,
based on history, prior experience and relative bargaining power; and (3) repeated
interactions or relationships between firms. We wish to discover whether the observed
variance in contract structure is systematically related to the presence of repeated
interactions.
As a first step, we examine mean frequency differences in contract terms among four
groups: 1. the full sample; 2. those observations where firms have no repeated deals; 3.
those observations where partners have repeated deals with the same partner; and 4. those
observations where partners have repeated deals, but not with the same partner. 17 These
frequencies and mean difference tests are set out in Table 5 below.
[Table 5 here.]
Contracts by firms that have repeat dealings are more likely to include terms
specifying the content of reviews, allowing physical audits of joint development work
and requiring reviews of all firms in the deal (rather than just one firm). Further, these
contracts are also more likely to include financial penalties, to specify specific persons
for management of the development work and to detail the specific technologies to be
contributed to the joint work. Thus, contracts between firms with repeat dealings (either
17 Note that we use ‘repeated interactions’ to refer to the theoretical concept of expected future interactions with a firm or group of firms and ‘repeated deals’ to refer to the empirical proxy in our discussion below.
10

with each other or with other firms) have more detailed contracts and are more likely to
include monitoring and penalty clauses.
While these patterns are interesting, it is difficult to assess whether the patterns here
are related to the existence of a prior relationship between the firms or other
characteristics of the development task (e.g., whether the task represents next generation
technology development or not). Thus, we estimate several simple regressions to better
assess the effect of repeated deals on the inclusion of particular contract terms (i.e., by
attempting to control for alternative sources of heterogeneity). We examine several
measures, including the number of terms in a contract within each of the three broad
categories of variance (detail, monitoring, and penalties) and rough classifications based
on a threshold number of clauses included in a contract within these groups.
Measures of a firm’s prior dealings, both with the same partner as in the contract
examined as well as with other firms, are used as independent variables. We distinguish
between prior and contemporaneous deals with the same partner based on the starting
date for the contract. The reason for this is that our aim is to relate these results to the
theoretic results on indefinitely repeated games; contemporaneous deals may be a better
proxy for expectations of future interactions with a specific firm than prior deals (since
they are ongoing at the time the sample contract was signed). Thus, we use three proxies
for repeated interactions: 1) prior deals with the same partner firm as in the sample
contract; 2) contemporaneous deals with the same firm as in the sample contract; and 3)
prior or contemporaneous deals with other firms. The unit of analysis is the sample
contract.
We create two dummy variables, “Prior deals” and “Concurrent deals”, which equal
one if there are prior or contemporaneous deals, respectively, between the firms in the
sample contract. To capture prior deals with other firms, we create an ordered ranking
based upon the average number of prior deals by partners. The distribution of prior deals
among firms in our sample is set out in Table 6.
11
[Table 6 here.]
This table reveals a skewed distribution of prior deals among firms. Most firms have
no prior deals (43.6% of sample firms). The next largest group has only one prior deal
(14.10%) and less than 35.9% of sample firms have more than 2 prior deals.
Approximately 23% of sample firms have more than 10 prior deals. Given this
distribution, we use an ordered ranking to reflect that the difference between one and two
prior deals is likely greater than the difference between seven and eight prior deals. “Prior
deals” equals zero if the partners have no prior deals with other firms, one if the partners
have between one and ten prior deals, and two if the partners have greater than ten prior
deals.
In addition to the influence of repeated interaction, there are several other factors that
we expect affect the ease (and, hence, cost) of crafting detailed contracts. Generally,
items that increase the uncertainty or complexity associated with a joint project should
affect the level of contract detail, monitoring and penalty provisions, albeit in ambiguous
ways. We identify four elements that likely increase the uncertainty and/or complexity
associated with the deal: (1) technology breadth; (2) long project or contract duration; (3)
manufacturing and/or marketing activities in addition to joint development; (4) cross
border coordination between partners (i.e., an international deal).
To see why these factors have ambiguous effects, consider the specification of
development steps and completion times. The marginal cost of specifying an additional
step is likely to be higher under conditions of greater complexity. However, greater
complexity may also imply a higher marginal benefit to specifying an additional step
since firms may have more project-critical contingencies to consider.19 The effect of
18 That is, we calculate ‘Prior Deals’ based on the number of prior deals averaged between partners.
19 For example, Robinson and Stuart (2002) use length of contracts as a proxy for deal complexity in biotechnology financing contracts.
12

complexity on penalties is similarly unclear. Penalties may be less likely under conditions
of ambiguity since a penalty may be triggered by poorly assessed contingencies that are
unrelated to firm efforts. The converse is also possible, since firms are more likely to
attempt to define their own penalties for underperformance when deals are characterized
by greater uncertainty, (i.e., given the difficulties of court assessment under these
circumstances).
The four sources of uncertainty/complexity described above are measured as follows.
Technology breadth is classified as incremental if the project involves customization of
existing technologies for new uses and next generation if it involves radical changes to
the existing technology. “Technology breadth” equals one if the development is next
generation, zero otherwise. Contract duration is taken from the agreement termination
clauses; “Long term deal” equals one if the joint development activity is expected to last
more than one year, zero otherwise.20 We set the “Manufacturing &/or marketing”
variable to one if the deal involves joint manufacturing or marketing in addition to the
joint development activities, zero otherwise. Finally, “Cross border” equals one if the
deal involves firms from in different countries, zero otherwise.
[Table 7 here.]
We first estimate the relationship between contract detail and repeated deals in Table
7. Six specifications are estimated: three using an ordered probit based on the number of
‘detail’ clauses a contract contains (zero to six) and three using a simple probit based on a
dummy ranking (set to one if the contract contains three or more of the relevant clauses,
zero otherwise).21 Columns 1 and 4 include the prior deal measures and controls 20 Around half of the deals in our sample (46%) last one year or less.
21 A limitation of this approach is that it allocates equal weight across the clauses. Thus, for example, partners specifying detailed development steps and the timing for these steps will be coded as having a contract that is similarly detailed to partners specifying a particular manager and firm technology contributions for the joint development project. The equivalence of these contracts may or may not be accurate. At this stage, a defensible means and justification to allocate weights to each of the clauses is not apparent and we default to an equal weighting of the clauses.
13

discussed above. Columns 2 and 5 add a dummy to capture equity holdings between
partners, which equals one if there is any type of equity holding between the partners
(whether minority, majority or cross equity holdings), zero otherwise. This variable is
intended to control for the possibility that partners with equity holdings have alternative
means of control and incentive alignment and, possibly, a reduced need for more detailed
contracts. Finally, columns 3 and 6 add a scaled measure for R&D spending by the
partner firms. R&D spending is the R&D expense reported by the partner firm with the
largest R&D program in the year prior to the contract date, scaled.22 We report scaled
R&D spending for the partner with the largest R&D expense in the deal, since it is likely
the maximum size of any partner’s R&D program (rather than the average among
partners) that drives the marginal cost of additional detail or provisions in a deal contract.
We also control for the fact that some firms have more than one contract in the
sample. Contracts that involve the same firms, even if all partners are not the same, may
not be independent. Firms may use similar contract structure in their deals with different
partners. We correct for this possible lack of independence using a technique by Huber
(1967). Where firms are involved in more than one contract in our sample, we sum the
likelihood scores for that firm to create a “super observation” (Ibid.). Thus, each group of
observations for a firm is reduced to a single observation for the purpose of calculating
standard errors.23 If a contract can be assigned to more than one firm group (i.e., because 22 To scale R&D spending, we divide R&D by 10,000. This control is included for a number of reasons. R&D spending proxies for firm size and the size of a firm’s R&D program, which likely influences the extent of resources available to the firm for such joint R&D projects (such as in-house counsel). The marginal cost of drafting a more detailed contract is likely less for firms with in-house legal departments than for firms without such resources. These firms (i.e., those with greater resources and larger R&D programs) are more likely to have greater experience with technology development projects and may be more influential in the contract drafting process.
23 Using this correction, the standard variance estimate for maximum likelihood estimation is:
, where: V̂)'(V̂ˆn
1i∑=
= ji
ji uuV 1
2
2
)ln(V̂ −
∂∂
=β
L , and ∑∑∈∈ ∂∂
==ji
i
jii
ji
Luuβ
ln .
Here, ui is the contribution of the ith observation to the scores of firm j and is the contribution of firm j to the overall likelihood function.
jiu
14

both partner firms have multiple contracts in the sample), then the contract is assigned to
the firm with the greater number of contracts in the sample for the purposes of correcting
standard errors. No adjustment to parameter estimates is necessary since maximum
likelihood estimates are still unbiased and consistent when the assumption of
independence is violated (Greene 1990).24
Across specifications, two patterns emerge. First, prior deals with the same partner as
in the current contract appear to be correlated with more detailed contracts.25 The
probability of a more detailed contract increases by 0.48 (i.e., 48%) if firms in the current
deal have a prior deal with the same partner.26 Interestingly, concurrent deals (i.e.,
occurring at the same time as the deal represented by the sample contract) decrease the
probability of a more detailed contract by 33% (i.e., the marginal effect is -0.33). Prior
deals (i.e., with any partner, excluding the firm(s) in the sample contract) are positively
correlated with the detail of joint development contracts; this result is consistent across
specifications. The probability of a more detailed contract is increased by 24% when
firms have prior deals with any partner other than the partner in the sample contract.
24 Fixed effects are not used, since most firms in our sample contracts are involved only in one contract. The use of fixed effects would cut our sample by more than half.
25 Parameter estimates are less significant for the effect of prior deals with the same partner than for the effect of prior deals with any firm. However, given the small number of observations and the fact that these estimates are on the margin of significance for a two tailed test, this lowered significance may be explained by the lack of power in the test. Lowered significance may also arise out of the use of asymptotic results to compute the standard errors in maximum likelihood estimation; conventional significance levels may be too restrictive, since the asymptotic calculation of standard errors does not take into account the greater variability inherent in small samples. Given the small number of observations, the magnitude of the effects is quite large. Further, the marginal effects of these results, which are discussed below, are highly significant. Thanks to Bill Greene for a helpful comments on this point.
26 Marginal effects for Table 7 are reported on specifications (4) through (6) and represent the change in probability that a contract is more detailed, given a categorical change in the independent variable discussed (i.e., the independent variable changes from zero to one). The marginal effects discussed are consistent across specifications (4) through (6) and are statistically significant at the 0.01 level. Since marginal effects are calculated as a function of all coefficients, it is possible for marginal effects to be significant even while some coefficient estimates are not.
15

Control variables suggest that the effects of deal complexity on contract detail
depend on the source of the added complexity. Broad technology deals are less likely to
have detailed contracts. Equity holdings between partners appear to be correlated with
less detailed contracts, while cross border deals and partners with relatively larger R&D
programs tend to include more detail in their deal contracts. These control variables,
however, are not consistently significant across specifications.
To investigate whether repeated deals are correlated with the usage of monitoring
and penalty provisions, we repeat the analysis above with monitoring and penalties as
dependent variables in Tables 8 and 9, respectively. The Monitoring and Penalty
dependent variables are similar in construction to Contract Detail. Monitoring is
constructed both as an ordered variable (0 to 5), based on the number of possible
monitoring clauses included in a contract, and a binary variable taking the value of one if
the contract contains three or more monitoring clauses, zero otherwise. Similarly, penalty
is an ordered variable (0 to 2) based on the number of penalties included in the contract
as well as a binary variable that takes the value of one if the contract includes one or
more penalty clauses, zero otherwise.
[Table 8 here.]
[Table 9 here.]
The effects of prior and concurrent deals on the probability that the contract includes
(more) monitoring provisions are not statistically significant, with the exception of prior
deal experience with any partner in specifications (4) and (5). Firms with prior deals with
any partner are 11% more likely to include monitoring provisions in their current deal
contracts.27 No other independent variables appear to be significantly correlated with
inclusion of monitoring provisions.
27 This marginal effect is calculated for specifications (4) and (5) from Table 8.
16

In contrast, prior deals do appear to be highly correlated with the inclusion of penalty
clauses. Prior deal experience with any partner increases the probability that penalty
clauses are included in the sample contract by 25%. Similarly, prior deals with a specific
partner increase the likelihood that penalty provisions are included in the sample contract
by 51%.28
Further investigation of the data suggests that the firms including penalty clauses in
their contracts are those with a greater number of prior deals. For example, 85% of the
contracts with penalty clauses are written by firms with prior deals and 57% of the
contracts with penalty clauses involve firms with extensive prior deals (i.e., greater than
ten prior deals). Of the twenty one contracts with penalty clauses, eight have bilateral
penalties (i.e., where either party may exercise the penalty) and thirteen have unilateral
penalties (i.e., where only one party to the contract may exercise the penalty). In the case
of these unilateral penalty clauses, the party penalized is usually the party with fewer
prior deals. Penalty clauses also seem to be correlated with vertical agreements; most
deals with unilateral penalties involve more vertical development arrangements (e.g.,
where one firm is developing a technology at the direction and often with the funding of
the other firm).
Of the control variables, only one is consistently significant. Broad technology
development projects are characterized by fewer penalty clauses; the probability of
including penalties in the deal contract decreases by 34% when the technology developed
is next generation or a radical change over existing technology. In specifications (4)
through (6), cross border deals appear to decrease the probability of penalties, which may
28 The marginal effects discussed here are calculated based on the probit estimates in Table 9, columns (4) through (6), and are statistically significant at the 0.05 level. Note that while the parameter estimates for prior deals with a specific partner are not statistically significant in specifications (4) through (6), the marginal effects are highly significant, both statistically and in terms of magnitude. See endnote #26 for more detail on significant marginal effects where coefficient estimates are insignificant.
17

be explained by the difficulty of assessing contingencies that would trigger a penalty
when the distance between partners is great.
4. DISCUSSION Several of the preceding results are interesting in light of the traditional theoretical
literature on repeated games. Based on this literature, our strong intuition is that, whether
a firm has a relationship with one partner of indefinite length or engages in one-shot deals
with an indefinite series of partners, we should observe fewer explicit discipline devices
as the efficacy of implicit mechanisms increases. Instead, we find that the use of penalty
clauses is increasing in both repeated dealings with the same and multiple partners.
Similarly, the level of contract detail is also increasing on these dimensions. Not only is
our intuition unsupported, but the estimated relationships appear to oppose our intuition.
In order to be more specific on the implications of these results for theory, it is
helpful to highlight some of the well-known findings in the theory of repeated games. In
the next section, we review several of the most significant and closely-related
propositions in this (extensive) literature. We are then in a position to discuss the
relevance of our findings in more detail and offer some speculation on our results.
4.1 Contracting under repeated interaction
The ability of agents to sustain relatively efficient outcomes in non-cooperative
settings under repeated interaction is exceedingly well-studied. Generally speaking, firms
that repeatedly interact over an indefinite number of periods can mitigate their moral
hazard problems through implicit mechanisms. Green and Porter (1984) demonstrate that
a cartel is sustainable without explicit coordination when firms repeatedly interact; Telser
(1980) argues that agreements can be self-enforcing, even when incomplete, if the parties
value the future relationship sufficiently; Radner (1986) shows that efficiency can be
maintained in infinitely repeated partnerships. The enforcement mechanisms in these
18
settings are implicit in the sense that no formal contract or agreement is required to
achieve the more efficient outcome.
Certain results for joint production in non-repeated settings suggest the added value
of implicit mechanisms in repeated settings. For example, Holmstrom (1982)
demonstrates that when contracts are forced to meet budget balancing conditions (i.e.,
split up the value produced only), then efficient outcomes cannot be generated in one-
shot deals. The reason is that budget balancing precludes the ability to impose
punishments that are sufficiently harsh to induce efficient behavior. Similar effects may
result from institutional barriers; e.g., limited liability laws. Fudenberg, Levine and
Maskin (1994, hereafter FLM) show that these problems are eliminated in dynamic
settings through the use of implicit mechanisms.29
Similarly, long-term players in a market – including those who interact only
infrequently with any specific partner – may be compelled by reputational considerations
to behave in a cooperative manner even without the presence of contractual requirements
to do so. Kreps (1990:116) argues that good reputations may prevent firms from behaving
opportunistically if the firm believes that its good reputation influences future trading
opportunities: “the reputation of a trusted party can be a powerful tool for avoiding the
transaction costs of specifying and enforcing the terms of the transaction….the trusted
party will honor that trust because to abuse it would preclude or substantially limit
opportunities to further engage in future valuable transactions.” Klein and Leffler (1981)
lend support to these arguments through simulation, finding that the threat of lost
reputation is a means to enforce promises on quality, which are otherwise
unenforceable.30
29 More recently, a number of papers study interactions with both externally enforced and self-enforced components (see, e.g., the discussion in Watson, 2004). For example, Bernheim and Whinston (1998) make the point that implicit mechanisms may be preferred even when contracts can be written to control individual actions.
30 We note that sociologists and legal scholars have informally made similar arguments on the relative importance of implicit versus more formal or contractual governance. Macaulay (1963), for example,
19

The implications of this literature with respect to the incidence of contractual
penalties in the presence of feasible self-enforcement are fairly consistent. Other things
equal, reliance upon costly formal mechanisms should be at least weakly decreasing in
the availability of their implicit counterparts. Regarding the level of detail elaborated in a
contract, much less is known. What is known appears to support the intuition that the
contracts associated with repeated interactions should be less detailed. For example, FLM
show that, when their pairwise-identifiability condition is met, balanced payoffs can be
fashioned that deliver efficient equilibria in one-shot deals. The minimum number of
events upon which the payoff function must be conditioned, presumably in the form of
formal penalties, can be calculated directly. This minimum is always strictly positive.
However, the need for explicit payoff conditioning is eliminated in the repeated case.
4.2 Interpretation and speculation
One explanation for our findings may be that our repeated deal variables are not
positively correlated with a firm’s expectations regarding the likelihood of future
interactions and, hence, implicit mechanisms may simply not be in play. While this may
well be true, it is hard to see how this reasoning explains the significant increases in
contract detail and use of penalty clauses in the presence of more frequent dealings.
Alternatively, firms with more experience in a certain class of projects may face
lower costs when contracting on deals associated with this class. Perhaps, in certain
situations, these experience effects more than offset increased self-enforcement under
repeated interaction, resulting in greater use of formal mechanisms. Unfortunately, the
precise circumstances required to support this reasoning are not obvious; we are aware of
no studies that focus on the relationship between experience and mechanisms of this type.
For example, the results in FLM indicate that, for a given technology, partners in a one-
argued that firms rarely rely on legal sanctions to uphold terms of economic exchange and that reputation or social norms may serve to ensure cooperative behavior.
20

shot deal can achieve efficiency with a specific number of state-contingent penalties.
However, lower marginal costs of contracting as a result of experience do not imply an
increase in this number of penalties. Another phenomenon indicated in our study is
variation in the symmetry of penalties. We find that the penalty clauses in some contracts
are bilateral (which is consistent, e.g., with FLM) while others are unilateral. Moreover,
the likelihood of being the only penalized party in a contract is related to one’s
experience. Again, we are aware of no theoretical work that would help understand these
outcomes.
The bottom line is that our empirical findings are not neatly consistent with the
results of any established theory. In the setting studied here – high technology
development projects – the connection between actions and consequences is, typically,
highly uncertain and poorly understood. As a result, identification of relevant
contingencies and accurate assessment of their likelihoods is difficult at best. When
implementing implicit contracts, firms must have a precise understanding of their
situation. True, certain information may be hidden from certain firms during an
interaction (e.g., the actions taken by their partners), but the stochastic laws, relevant
event space and payoff functions must all be known in order to construct efficient
strategies. Yet, in the real world of complex technology development deals, it is hard to
imagine any firm knowing any of these elements with a high degree of precision.
Thus, it does seem reasonable to expect that experience and learning play an
important role in explaining results of the kind we present –though in subtler ways than
the somewhat simplistic marginal cost/benefit reasoning suggested above. Examination
of the effects of ambiguous beliefs and learning upon contract formation is a small but
growing area of theoretical research.31 None of this work relates directly to our setting,
31 Papers in this line include Ghiardato (1994), Mukerji (1998), and Lopomo et al. (2005).
21

though we hope that the results presented here will stimulate further theoretical work in
this area.
We conjecture that there is typically some level of experience at which beliefs are
sufficiently refined such that mechanisms of the kind contemplated in FLM can actually
be implemented. If so, then the correlation between experience and the likelihoods of
both penalties and additional contract detail should be positive. Presumably, under such
conditions, penalties are not added piecemeal, but are either included in their entirety or
not at all, since the number of penalties required to achieve efficiency does not vary with
contracting costs (under the FLM model). Moreover, firms with a more refined
knowledge of the relevant contingencies are more valuable partners and, hence, may be
able to extract some of this value through asymmetric penalty clauses.
4. CONCLUSIONS In this paper, we examine the relationship between contracts for inter-firm
technology development and repeated interactions between firms. While these contracts
are highly heterogeneous, they exhibit some consistent patterns. Contrary to the usual
intuition, contracts are more detailed with repeated interactions. Moreover, not only are
many of the terms in these agreements not verifiable or easily enforceable in a court of
law, the majority of contracts in our sample waive rights to court access for disputes.
These latter findings make the former even more puzzling since, presumably, they must
also be consistent with the increased use of implicit mechanisms. As discussed above,
there are several possible explanations for these results, none of which are fully
articulated in the existing theoretical literature. We leave additional theoretical analysis
along the lines suggested in the preceding section to a future paper.
Naturally, there are important limitations to our work here. First, the substantial
heterogeneity makes true comparison between contracts difficult at best. While we
attempt to control for sources of heterogeneity, our measures are blunt instruments, which
22

do not perfectly capture, for example, the breadth of the underlying technologies
developed. Further, while access to actual contracts permits more detailed analysis, the
difficulty in accessing these contracts prevents collection of large samples. The relatively
low number of observations is a barrier to more sophisticated econometric analysis. We
may also experience several forms of sample selection, in the sense that we only observe
contracts for public firms and only those contracts that the firms choose to file with the
SEC. While some of this selectivity works in our favor (e.g., we more likely observe
contracts on more important deals that actually took place), we acknowledge that our
results may be impacted by some form of sample selection that we have not yet
considered.
Notwithstanding these limitations, our results provide some potentially provocative
evidence on link between repeated interactions and contract structure. Further, the
richness of the data we present facilitates a greater understanding of industrial
organization in R&D; we observe the details of how firms organize their joint
development activities and respond to challenging coordination issues. As an initial
exploration that provides both stylized facts and more formal empirical analysis, we
believe this study highlights a potentially fertile area for theoretical exploration and hope
to motivate such complementary analysis.
23

Appendix A Illustrations of Actual Terms
The contracts of Ramtron International Corporation and Fujitsu Ltd. are used to identify
terms that exemplify each of the categories described above. Below, we give brief
backgrounds on these firms and highlight various terms that form the governance
structure of the deal in question (i.e., those designed to coordinate behavior and induce
cooperation).
Ramtron International
Ramtron is a developer of specialty high performance semiconductor memory
devices. Ramtron has two primary product lines: ferroelectric random access memory
(FRAM) and high-speed dynamic random access memory (DRAM). These memories are
used in many electronic devices, including PCs, communications devices, laser printers
and video graphics systems. Ramtron is a US based company, with its headquarters in
Colorado Springs.1 Ramtron filed two technology development agreements during the
sample period: (1) with ULVAC Japan in 1997; and (2) with Fujitsu Ltd. in 1999.
Ramtron’s contract with ULVAC2 was for the joint development of thin film process
systems and materials used in its FRAM technology. This 1997 agreement was the first
between the two parties. The contract is a detailed one, relative to several others in our
sample. Via the ‘Statement of Work’ incorporated in the contract, work schedules and
milestones set out a fairly detailed framework for planned activities and events. The firms
detail two development phases for developing manufacturing improvements using four
types of ULVAC fabrication equipment. These development phases are well defined; the
contract specifies the time frame for completion and the requirements for the completion
1 Sources: Media General, Dow Jones and Hoover’s Inc.
2 ULVAC Japan, Ltd., is a Japanese based global supplier of production systems, instrumentation, vacuum pumps and components for semiconductor, flat panel display, disk/magnetic media and industrial vacuum and medical applications. (Source: Dow Jones)
24

of some, but not all, phases. Perhaps more importantly, the contracts describe the
contributions required by each firm. For example, Ramtron is responsible for providing a
minimum of fifty wafers per month for development, while machine time and technical
support for joint development work will be at ULVAC’s cost. Specific persons are
designated in the contract as project leaders for the joint development work. The contract
also clearly sets out intellectual property rights for each of the parties: both firms retain
intellectual property rights for their respective technologies developed prior to the deal,
while IP rights on inventions by either party during the deal are shared equally (even if
independently developed). Also specified are how the two firms will share costs and the
termination date of the deal (four years from the date signed, unless extended by mutual
agreement). Overall, the contract is quite detailed, with explicit contributions,
benchmarks, and property rights set out. Notwithstanding this, the contract does not have
provisions for monitoring development progress by either party or penalties for
underperformance. Some clauses do allow flexibility in, for example, determining the
completion of phases; however, there are no explicit clauses for renegotiation or
adjustment of terms over the life of the contract.
The contract between Ramtron and Fujitsu Ltd., for the development of a new
ferroelectric chip, is also well specified. While the development goal is broader in this
joint development project, with the parties aiming to develop a ‘next generation’
ferroelectric chip, the project length is shorter3 and the contract appears to be as well
specified as the Ramtron/ULVAC contract. A detailed development plan with target
dates, the number of engineers and specific equipment to be provided by each party, and
responsibilities for maintaining equipment is included as part of the alliance contract.
Both firms specify particular managers to serve on the joint development project. In this 3 The contract lasts only, ‘until the end of calendar year 2000,’ which is little over eighteen months from the signing date. However, given the parties had a substantial pre-existing working relationship with several deals since beginning to work together in 1996, this short clock for completion of the tasks may not be entirely unrealistic.
25

alliance, each firm is largely responsible for the work conducted at its own facility, in
contrast to the assignment of tasks by function in the Ramtron/ULVAC alliance.
However, specific technological contributions from each side are set out in the contract,
independent of location. Intellectual property rights are specified similarly to the
Ramtron/ULVAC contract. A common thread of these two contracts is that both have
fixed termination dates and are reasonably detailed contracts, in terms of specifying
inputs, intellectual property rights, and milestones for completion.
Notwithstanding these similarities, important distinctions exist. First, Fujitsu has the
right to terminate the contract if Ramtron does not meet the milestones set out in the
development plan; Ramtron has no similar right to terminate. This early termination on
underperformance is a form of penalty clause. Second the Fujitsu/Ramtron contract
provides for some limited monitoring, via joint quarterly reviews of progress compared to
the development plan. This review is contemporaneous with payments of approximately
$1M by Fujitsu to Ramtron. Finally, the firms have explicitly provided for adjustments to
the development plan over the course of the deal. These differences may be attributable
to bargaining power differences between the firms. Fujitsu is a substantially larger firm
with extensive prior alliance experience and may be in a better position to require penalty
and monitoring terms for its partners. The existence of prior alliances between Fujitsu
and Ramtron, in contrast to Ramtron and ULVAC who have no prior alliances together
and more limited alliance experience generally, may also drive the differences between
these contracts.
Fujitsu Limited
Fujitsu Ltd. is a manufacturer of computers and information processing systems with
applications in the software, information processing, telecommunications and electronic
device sectors.4 Fujitsu is substantially larger than Ramtron, with over $41 billion in
4 Source: Worldscope.
26

assets compared to Ramtron’s $38 million, and is much more diversified than Ramtron.
Fujitsu filed four joint technology contracts during our sample period. These contracts are
with (1) Ramtron International (as discussed above); (2) Ross Technology in 1997, (2
contracts); and (3) Advanced Micro Devices (‘AMD’) in 1993.
Fujitsu’s multiple deals with Ross Technology5,6 surround the development of a
microprocessor core for Fujitsu based on Ross’ proprietary microcontroller technology.
The first of two related contracts (dated 3/31/97) is scheduled to terminate on completion
of particular goals. Contributions are specified for both parties: Ross is to develop a new
microprocessor core in conformance with specifications supplied in the agreement, while
Fujitsu bears all silicon and other development costs. Fujitsu also pays Ross for the
development work, suggesting that, while Fujitsu is covering costs, Ross is providing the
bulk of the technology and development work. Explicit payment terms are set out in the
contract; Fujitsu pays a total of $4.5M to Ross upon completion of various benchmarks.
While Fujitsu is to provide ‘reasonable assistance’ and input regarding the
development of the specifications of the new microprocessor, the bulk of the
development work rests with Ross. Thus, in contrast to the contracts described above,
where firms engage in more joint development with each contributing technologies, this
alliance resembles a ‘fee for services’ arrangement more closely than a collaborative
development venture. As we might expect with service type contracts, the party paying
the fee has explicit rights to review progress and levy penalties for failure to meet
deadlines. Ross is to provide written progress reports on Fujitsu’s request and Fujitsu has
the right to conduct physical reviews at Ross’ premises. If Ross fails to deliver on
5 Two of these deals are discussed here. However, Fujitsu entered into more than half a dozen alliance contracts with Ross International (previously Cypress Semiconductor) over the sample period. Information on other deals during the period comes from the Securities Data Corporation (‘SDC’) Database on Joint Ventures & Alliances.
6 Ross Technology is a supplier of SPARC microprocessors and SPARC system products to both OEM and end user markets. (Source: Dow Jones)
27

schedule, Fujitsu can reduce the specified benchmark payment by 10% and may
terminate the contract in the case of repeated failures. If the contract is so terminated,
Ross is required to pay offset fees to Fujitsu of up to $1.5M. Interestingly, Ross retains
ownership of developed intellectual property and all new inventions over the course of
the deal remain the sole property of the inventor. Joint technology developments, though
not anticipated by the parties, are to be discussed on a case-by-case basis. This allocation
of intellectual property rights may reflect the relative importance of each firm’s upfront
investment. That is, consistent with property rights theory (e.g., Grossman and Hart,
1986), residual rights over developed assets are left with the firm whose contribution is
more important for the success of the deal.
Fujitsu’s second deal with Ross (dated 4/1/97) also is for the development of Ross
technology for Fujitsu purposes. The technology under the contract is a different
technology than that in the contract described above and the terms vary slightly. Like the
first contract, the agreement terminates automatically on completion of the specified
tasks. However, this second contract differs from the first on several dimensions. First,
Fujitsu is more involved technologically in the development, supplying licensed
technologies and making its engineers available to Ross. Second, intellectual property
rights on jointly developed technologies are jointly owned. Finally, Ross has five times to
correct an error in a deliverable before termination for underperformance, in contrast to
the two attempts allowed under the first contract. Ross is also permitted to request
modification of the milestone schedules, which was not permitted in the first contract.
These differences may reflect a more uncertain development project, with the resulting
need to allow broader tolerances for performance, and/or the joint involvement of both
parties from a technological standpoint.
The final Fujitsu contract is with AMD (dated 3/26/93) and is for the purposes of
developing CMOS (flash memory) technology for the AMD-Fujitsu joint venture (Fujitsu
AMD Semiconductor Ltd.). Unlike the prior agreements considered here, the joint
28

development contract is of indefinite duration – no termination date or event is specified.
Some obligations of the firms are specified in the contract. For example, firms are
required to contribute managers to a Joint Development Committee, which has the right
to amend the joint development program by consensual decision making. This joint
decision making facilitates adjustment by mutual agreement over the course of the
alliance. AMD and Fujitsu both are also required to set up process development teams
with co-leaders from each firm. The development processes are set out in a reasonable
level of detail, specifying development steps for both new processes and new products.
While this process and benchmarks are specified, there is little specification of actual
inputs required of each firm. No particular managers or personnel are specified, in
contrast to the Ramtron/ULVAC contract agreement for example, and while
contributions are valued in the agreement, specific contributions are not laid out. Each
firm is to bear its own costs in the course of the development and design work. The lack
of detail in this agreement, relative to the agreements discussed above, may be
attributable to the extensive prior dealings AMD and Fujitsu have together as well as the
fact that the two firms are much closer in size than, for example, Fujitsu and Ross,
leading to a more equal distribution of bargaining power.
Unlike the other contracts considered so far, the joint development work in this deal
is actually co-located – the contract stipulates that the development work is to be jointly
conducted at the same location.7 This is a relatively rare provision. Several of the
development contracts thus far analyzed permit some engineer exchange, but few actually
stipulate co-located development. This, along with a pre-existing joint venture between
7 Section 2.3: ‘The parties shall fully cooperate with each other in performing such development and design work and will jointly conduct such work at the same location to the extent possible to enable Fujitsu and AMD to develop a better understanding of each other’s technological culture and methodology. In the event that, during the term of this Agreement, any portion of such work is required to be performed independently by one party, such party shall provide the other party with regular progress reports on the status of such work so that the other party might join in such work and shall inform the other party of all results of such work immediately upon its completion.’ Emphasis added.
29

the firms, suggests that the level of technological interdependence between the Fujitsu
and AMD is high. While such co-location allows greater monitoring of partner activities,
it also increases the likelihood of unintended technology transfer.
Intellectual property rights over jointly developed technology are shared and neither
firm may patent the new technology without the consent of the other. However, both
Fujitsu and AMD have the right to use and sell products related to the new technology
independently, without permission of the other firm. If the technology is developed
independently without the use of the other firm’s technology, the developer retains
exclusive rights to the technology. This is in contrast to some of the above contracts,
where firms may retain exclusive rights to new technologies if the new technology relates
to the firm’s existing core technologies. This may reflect the fact that Fujitsu and AMD
have much more technological overlap than partners in above considered agreements.
30

REFERENCES AUMANN, R. 1986. “Repeated Games,” in Issues in Contemporary Microeconomics, ed. G.
Feiwel. Macmillan.
BULL, C., 1987. “The Existence of Self-Enforcing Implicit Contracts,” Quarterly Journal of Economics, CII, 147-59.
BAKER, G., R. GIBBONS & K.J. MURPHY. 1994. “Subjective Performance Measures in Optimial Incentive Contracts,” Quarterly Journal of Economics, November, 1125-56.
BERNHEIM, B.D. & M.D. WHINSTON. 1998. "Incomplete Contracts and Strategic Ambiguity." American Economic Review 88(4): 902-32.
CROCKER, K.J., & S.E. MASTEN. 1991. "Pretia ex Machina? Prices and Process in Long Term Contracts," Journal of Law and Economics XXXIV :69-99.
ECONOMIST. 1997. “A Survey of Telecommunications.” September 13: 3-34.
ELFENBEIN, D. W. AND J. LERNER. 2003. "Ownership and Control Rights in Internet Portal Alliances, 1995-1999." Rand Journal of Economics 34(2): 356-69.
GHIRARDATO, P. 1994. "Agency Theory with Non-Additive Uncertainty," Unpublished working paper, Cal. Tech.
GOLDBERG, P.V., & J.R. ERICKSON. 1987. "Quantity and Price Adjustment in Long-Term Contracts: A Case Study of Petroleum Coke," Journal of Law and Economics XXX :369-398.
GREEN, E.J., & R.H. PORTER. 1984. "Noncooperative Collusion Under Imperfect Price Information," Econometrica 52 :87-100.
GREENE, W.H. 1990. Econometric Analysis. Englewood Cliffs, NJ, Prentice-Hall.
GROSSMAN, S.J., & O.D. HART. 1986. "The Costs and Benefits of Vertical Ownership: A Theory of Vertical and Lateral Integration," Journal of Political Economy. 94:691-719.
FUDENBERG, D., D. LEVINE, & E. MASKIN. 1984. "The Folk Theorem with Imperfect Public Information," Econometrica 62(5): 997-1039.
FUDENBERG, D., & J. TIROLE. 1998. Game Theory. Cambridge: The MIT Press.
HOLMSTROM, B. 1984. “Moral Hazard in Teams,” The Bell Journal of Economics 13(2): 324-40.
HOLMSTROM, B. 1989. "Agency Costs and Innovation," Journal of Economic Behavior and Organization 12:305-327.
HUBER, P. J. 1967. "The Behavior of Maximum Likelihood Estimates Under Non-Standard Conditions." Proceedings of the Berkeley Symposium on Mathematical Statistics and Probability 1: 221-233.
KAPLAN, S.N. & P. STROMBERG. 2003. "Financial Contracting Theory Meets the Real World: An Empirical Analysis of Venture Capital Contracts." Review of Economic Studies 70: 281-315.
KLEIN, B. & K.B. LEFFLER. 1981. “The Role of Market Forces in Assuring Contractual Performance,” Journal of Political Economy. 89:615-641.
KREPS, D.M. 1990. "Corporate Culture and Economic Theory," J. E. Alt, & K. A. Shepsle (eds),
31

Perspectives on Positive Political Economy (pp. 90-143). Cambridge: Cambridge University Press.
LAZZARINI, S. G., G.J. MILLER, & T.R. ZENGER. 2004. "Order with Some Law: Complementarity versus Substitution of Formal and Informal Arrangements." Journal of Law, Economics and Organization. 20(2): 261-98.
LOPOMO, G., L. RIGOTTI, AND C. SHANNON. 2004. "Uncertainty in Mechanism Design," Unpublished working paper, Duke University.
MACAULAY, S. 1963. “Non-Contractual Relations in Business: A Preliminary Study,” American Sociological Review. 28:55-67.
MACNEIL, I.R. 1978. “Contracts: Adjustment of Long-term Economic Relations under Classical, Neoclassical and Relational Contract Law,” Northwestern University Law Review. 72:854-905.
MACNEIL, I.R. 1981. "Economic Analysis of Contractual Relations: Its Shortfalls and the Need for a 'Rich Classificatory Apparatus'." Northwestern University Law Review. 75:1018-1063.
MATSUSHIMA, H. 1989. “Efficiency in Repeated Games with Imperfect Monitoring,” Journal of Economic Theory 48: 428-42.
MERTENS, J.–F. 1987. “Repeated Games,” in Proceedings of the International Congress of Mathematicians 1986.
MUKERJI, S. 1998. “Ambiguity Aversion and Incompleteness of Contractual Form,” American Economic Review 88(5): 1207-31.
PORTER, R. 1983. “Optimal Cartel Trigger-Price Strategies,” Journal of Economic Theory 29: 313-38.
RADNER, R. 1980. “Collusive Behavior in Non-Cooperative Epsilon Equilibria of Oligopolies with Long but Finite Lives,” Journal of Economic Theory 22: 121-57.
RADNER, R. 1986. “Repeated Partnership Games with Imperfect Monitoring and no Discounting,” Review of Economic Studies 53: 43-58.
RADNER, R., R. MEYERSON, AND E. MASKIN 1986. “An Example of a Repeated Partnership Game with Discounting and with Uniformly Inefficient Equilibria,” Review of Economic Studies 53: 59-70
ROBINSON, D.T. AND T.E. STUART. 2002. “Financial Contracting in Biotech Strategic Alliances.” Columbia University Working Paper.
TELSER, L.G. 1980. “A Theory of Self-Enforcing Contracts,” Journal of Business. 53:27-44.
WATSON, J. 2004. “Contract and Game Theory: Basic Concepts for Settings with Finite Horizons,” unpublished working paper. UCSD.
WILLIAMSON, O.E. 1975. Markets and Hierarchies: Analysis and Antitrust Implications. New York: Free Press.
WILLIAMSON, O.E. 1985. The Economic Institutions of Capitalism. New York: Free Press.
32

Table I: Deal Descriptions
PARTIES DATE PURPOSE
Aavid Air Systems, Inc. & Energy Innovations, Inc.
08/05/93 Develop new product concepts in thermal management for electronics
Aavid Air Systems Inc. & Aavid Engineering Inc.
08/01/93 Develop new product concepts in thermal management for electronics
AltiGen Communications Inc., Nitsuko Corporation & Sumisho Electronics Co. Ltd.
07/14/99 Develop, market, and distribute a Japanese version of AltiServ for Nitsuko’s telecom server platform
AM Communications Inc. and Scientific-Atlanta, Inc.
06/14/96 Develop next generation status monitoring products, especially transponders
AMD Saxony Holding GmbH & Advanced Micro Devices, Inc.
03/11/97 AMD Saxony to provide research, design and development of semiconductor products for Advanced Micro Devices, Inc.
Apple Computer, Inc. & Global Village Communication, Inc.
08/31/92 Software development
Artesyn North America Inc. & e-Power Co., Ltd.
05/12/00 Joint development of external power supply products
AT&T Paradyne Corporation & Westell, Inc.
12/18/92 Joint development of DSL product line to incorporate technologies of both firms
Benchmarq Microelectronics Inc & Acer Laboratories Inc
03/11/94 Development to incorporate Benchmarq core chip design into Acer products
Benchmarq Microelectronics Inc & Opti Inc
10/14/93 To jointly develop, manufacture and market integrated circuits and chip sets
Benchmarq Microelectronics Inc & Sanyo Energy Corp
04/17/95 Joint development of integrated circuits by Benchmarq that can be used with batteries developed by Sanyo
Benchmarq Microelectronics Inc & ST Microelectronics
09/22/93 Joint development of CMOS flash memory
Centillium Technology Corporation & Askey Computer Corporation
11/30/97 Jointly develop integrated circuit solutions for the copper interface portion of transmission systems
Centillium Technology Corporation & Mitsubishi Electric Corporation
08/25/97 Jointly develop Interface Device technologies and systems with a view to developing the broadband telecommunications market
Centillium Technology Corporation & NEC Corporation
04/03/98 Joint development of integrated circuit solutions for transmission systems and specialized interfaces for the Japanese market
Centillium Technology & Sungmi Telecom Electronics
03/02/98 Joint development of Interface Device technologies and systems
Centillium Technology & Sumitomo Electric Industries
10/15/97 Jointly develop Interface Device technologies and systems
33

PARTIES DATE PURPOSE
Cisco Systems Inc. & Applied Innovation Inc.
11/12/96 AI to design and build a router unit based on Cisco technology of local and wide area network routing
Fujitsu Limited & Advanced Micro Devices, Inc.
03/26/93 Develop and transfer certain design and process technologies related to integrated circuits
Fujitsu Limited & Ramtron International Corporation
03/05/99 Jointly develop the next generation ferroelectric processes and technologies (chip)
Fujitsu Limited & Ross Technology, Inc.
04/01/97 Further develop and manufacture a proprietary UltraSPARC compatible microprocessor
Fujitstu Limited & Ross Technology, Inc.
03/30/98 Develop a 64-bit Sparc microprocessor
Hewlett Packard & JABIL Circuit, Inc.
09/15/93 Joint development of a “custom board set” by JABIL for HP
International Business Machines Corporation & Hutchinson Technology Incorporated
09/01/94 Develop and manufacture high performance integrated lead suspensions
Integrated Security Systems, Inc. & Innovative Security Technologies, Inc.
09/01/96 Joint software development to integrate various ‘control products’
Kubota Corporation & C Cube Microsystems
07/11/90 Develop and manufacture image compression/decompression software and hardware
LoJack Venture Corporation & Micrologic Inc.
12/01/95 Developing a next generation LoJack Unit for automobile security
Lucent Technologies Inc. & Broadband Technologies
02/04/98 Perform R&D on a project by project basis
MEMC Electronics Materials, Inc. & Khazanah Nasional Berhad
12/20/96 Developing and manufacturing silicon wafers
MEMC Electronics Materials, Inc. & MEMC Kulim Electronics Materials
12/20/96 Similar joint development agreement (to above) between parent and joint venture in Malaysia
MEMC Electronics Materials, Inc. & TASIL Electronic Materials Corporation
10/24/94 Transfer of wafer development technology to facility in China
MEMC Pasadena, Inc. & Albemarle Corporation
07/31/95 Albemarle to transfer technologies for electronic materials, including granular polysilicon for manufacturing to MEMC
Minnesota Mining and Manufacturing Company and Polycom, Inc.
03/28/97 3M to provide assistance in the research and further development of Polycom’s dataconferencing device
Minnesota Mining and Manufacturing Company and Polycom, Inc.
06/10/97 Joint development of teleconferencing products
34

PARTIES DATE PURPOSE
Motorola Inc & Comdial Corporation
12/02/93 Motorola to develop specialized application of existing paging software and equipment for Comdial
OIS Optical Imaging Systems Inc. & The Advanced Research Projects Agency
08/26/93 Develop active matrix liquid crystal displays
Osicom Technologies Inc. & Asia Broadcasting and Communications Network Ltd.
03/21/97 Develop and manufacture technology for high speed internet access and online services
Ramtron International Corporation & ULVAC Japan, Ltd.
04/09/97 To develop thin film process systems and materials used in FRAM
Ramtron International Corporation & Hitachi, Ltd.
01/15/98 Develop, design and manufacture RF/ID chip technology
Read Rite Corporation & Sumitomo Metal Industries Ltd.
06/14/91 Develop and manufacture thin film recording heads
Samsung Electronics Company Limited & AST Research, Inc.
07/31/95 Joint R&D to develop products and reduce “product time to market”
SICAN GmbH & ZYCAD Corporation
09/23/93 Jointly develop and implement advanced GateField FPGA-based technology and market advanced emulation technology consulting services
Silicon Image Inc. & Inter-University Semiconductor Research Center of Seoul National University
01/01/00 Conduct joint research and development on ‘Multi-Gigabit Serial Links’
Smartdisk Corporation & Sony Corporation
06/30/99 Develop a FlashPath adaptor for Sony’s Memory Stick
Spectrapoint Wireless LLC & Remec Inc.
12/16/99 Develop local multipoint distribution service (LDMS) systems technology
Spectrian & Matra Communication 03/24/93 Develop power amplifier for telecommunications products
Summa Four, Inc. & Junction, Inc. 06/11/91 Jointly develop and test prototype
Summa Four, Inc. & Junction, Inc. 04/03/98 Form a joint development entity to develop a programmable switching platform for use in telecommunications
Toshiba Corporation & Neomagic Corporation
01/21/97 Joint development of integrated circuit chips
UDC Inc. & Trustees of Princeton University
08/01/97 Contract research by Princeton for UDC for flat panel displays
Viewstar Corporation & Digital Systems International, Inc.
09/20/96 Integrate Digital Systems call-center technology with Viewstar workflow and document-handling software
Xerographic Laser Images Corporation, Inc. & Samsung Electronics Co., Ltd.
04/26/95 XLI to incorporate their design and technology into a multi- function device with Samsung, which Samsung will produce.
35

N Mean SD Min Max
Average deal value 17 91.147 178.198 1 700 ($millions)
Technology breadth 52 0.404 0.495 0 1 (0 to 1, with 1 being next generation)
Average deal length in years 47 3.426 7.711 0 50(where specified)
Prior deal exists - same partner 52 0.096 0.298 0 1(dummy variable)
Contemporaneous deal exists - same partner 52 0.173 0.382 0 1(dummy variable)
Prior deal exists - different partner 52 0.808 0.398 0 1(dummy variable)
Average prior deal activity for firm, not including same partner 52 31.480 61.454 0 370.5 (since 1985)
Average prior deal activity for firm, not including same partner 52 25.049 54.784 0 362.5(5 years prior to contract date)
Manufacturing 52 0.481 0.505 0 1(dummy variable)
Marketing 52 0.192 0.398 0 1(dummy variable)
Cross Border 52 0.558 0.502 0 1(dummy variable)
Firms physically co-locate for joint development 52 0.115 0.323 0 1(dummy variable)
Development is primarily vertical (one firm for the other) 52 0.423 0.499 0 1(dummy variable)
Equity stake exists (cross, majority or minority equity) 52 0.308 0.466 0 1(dummy variable)
Intellectual property shared equally 52 0.212 0.412 0 1(dummy variable)
Joint venture formed 52 0.115 0.323 0 1(dummy variable)
Termination date set in contract 52 0.808 0.398 0 1(dummy variable)
Firm size (total assets) 64 10,955.84 21,120.97 0.419 81,091.00 ($millions)
Firm size (net sales) 64 10,236.11 19,062.16 0.094 75,094.00 ($millions)
R&D spending 64 748.95 1,311.00 0.28 5,094.00 ($millions)
Table II: Deal & Firm Descriptives78 organizations involved in 52 joint development deals
36

Table III: Examples of Common Contract Terms
TYPE OF COMMON TERM EXAMPLES 1. Arbitration ⋅ ‘Each party waives any rights to bring any dispute, controversy or claim in any
other forum or proceeding, including without limitation, the International Trade Commission of the United States or any other administrative or judicial forum.’
⋅ ‘ABCN and Osicom agree to attempt to resolve any question or dispute that arises regarding or under this Agreement through prompt good faith discussions between their respective officers with decision making authority….Any and all claims…which have not been resolved by good faith negotiations between the parties shall be resolve exclusively by final and binding arbitration in Washington, DC,.. by a three person arbitration panel. ABCN and Osicom shall each have the right to choose one of the arbitrators and the third shall be mutually chosen…’
⋅ ‘Any dispute… that has not been amicably resolved between the parties, shall be finally settled by binding arbitration…. The arbitration shall be conducted in Japanese and take place in Japan if it is initiated by Ramtron [US firm] or conducted in English and take place in the United States if it is initiated by ULVAC [Japanese firm]’
⋅ ‘The award of arbitration shall be final and binding upon the parties hereto and shall not be subject to appeal to any court, and shall not be entered in any court of competent jurisdiction for execution forthwith.’
2. Confidentiality ⋅ ‘The recipient of Confidential Information will not… use any portion of the confidential Information for any purpose other than those contemplated by this agreement and will hold the information in the strictest confidence and will exercise the same care with respect thereto as it exercises with respect to its own proprietary and confidential information….’
⋅ ‘7.01 Each party agrees: i. that it will not use the Lucent Information (in the case of BBT) or the BBT
Information (in the case of Lucent), except as expressly provided herein; ii. that it shall keep the Lucent Information or BBT Information, as the case
may be, confidential; iii. that it will not, without the other party’s express written permission, make or
have made, or permit to be made, more copies of any of the Lucent Information or the BBT Information, as the case may be, than are necessary for its use hereunder;…’
3. Right to Terminate: ⋅ ‘Both Benchmarq and SGS-Thomson reserve the right to terminate this Agreement at any time by written notice for default, without prejudice of their other legal rights and legal position under the following conditions: i. Filing of a petition in bankruptcy…by the other party, or the appointment of
a receiver for the business of the other party…; ii. Material breach of the provisions of this agreement, which breach has not be
cured within thirty (30) days after written notice of said breach.’ ⋅ ‘Lucent may terminate this Agreement by notice in writing to BBT upon the
occurrence of (1) a Change of Control of BBT,…’ 4. Limitation of
Liability: ⋅ ‘This Article 19 states each party’s total liability and responsibility, and each
party’s sole remedy, for any actual or alleged infringement of any patent, trademark, copyright, or other intellectual property right…. In no event shall either party be liable for any indirect, special, incidental, or consequential damages resulting from such infringement.’
⋅ ‘Liability of SGS-Thomson to Benchmarq for damages for any cause whatsoever, and regardless of the form of any action, whether in contract or in tort, including but not limited to, negligence, shall be limited to the greater of $10,000 or the
37

price specified in the sale contact for the specific product or products that caused the damages…in no event shall SGS-Thomson be liable to Benchmarq or others for a loss of goodwill, loss of profits, loss of use or other special, collateral, incidental or consequential damages, regardless of the form of action therefore…’
5. Cross Licensing: ⋅ ‘(a) In the event Sanyo Energy or Sanyo Electric incorporate any of their respective existing technology, technical information, proprietary information or know-how (“Existing Sanyo Technology”) into [integrated circuits] developed pursuant to this Agreement, Sanyo Energy shall grant… to Benchmarq a non-exclusive world-wide, royalty-free license with no right to sublicense… for the limited use of Benchmarq… solely in applications regarding the design, manufacture and sale of [integrated circuits]…’ (An identical provision for licensing by Benchmarq to Sanyo follows.)
6. Patent Indemnity: ⋅ ‘Benchmarq will, at its own expense, indemnify and hold SGS-Thomson harmless from and against any expenses or loss resulting from any actual or claimed infringement of any United States Intellectual Property Right, including patent, trademark, copyright, or mask work right to the extent arising from SGS-Thomson’s compliance with any of Benchmarq’s specifications, designs or instructions…’
7. Percentage Stakes (Joint Venture Only):
⋅ ‘Shareholding Percentages. …the total issued share capital of the JVC shall… be held by the Parties… in the respective percentages stated… below: MEMC 75% Khazanah 25%…’
8. Board of Directors (Joint Venture Only):
⋅ ‘Nomination There shall be no fewer than 7 (seven) and no more than 10 (ten) JVC Director… the JVC Board shall be constituted as nearly as may be possible,… in the Shareholding Percentages… (seven) JVC Directors shall be nominated by MEMC; and (two) JVC Directors shall be nominated by Khazanah.’
38
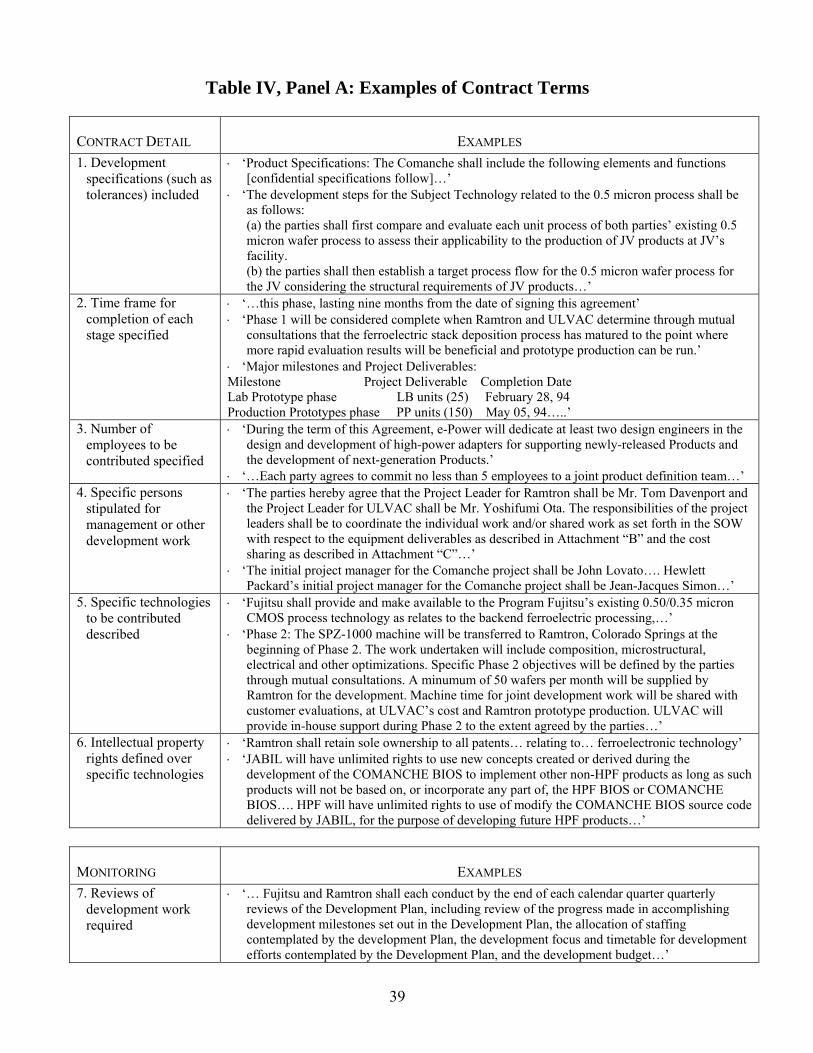
Table IV, Panel A: Examples of Contract Terms
CONTRACT DETAIL EXAMPLES 1. Development
specifications (such as tolerances) included
⋅ ‘Product Specifications: The Comanche shall include the following elements and functions [confidential specifications follow]…’
⋅ ‘The development steps for the Subject Technology related to the 0.5 micron process shall be as follows: (a) the parties shall first compare and evaluate each unit process of both parties’ existing 0.5 micron wafer process to assess their applicability to the production of JV products at JV’s facility. (b) the parties shall then establish a target process flow for the 0.5 micron wafer process for the JV considering the structural requirements of JV products…’
2. Time frame for completion of each stage specified
⋅ ‘…this phase, lasting nine months from the date of signing this agreement’ ⋅ ‘Phase 1 will be considered complete when Ramtron and ULVAC determine through mutual
consultations that the ferroelectric stack deposition process has matured to the point where more rapid evaluation results will be beneficial and prototype production can be run.’
⋅ ‘Major milestones and Project Deliverables: Milestone Project Deliverable Completion Date Lab Prototype phase LB units (25) February 28, 94 Production Prototypes phase PP units (150) May 05, 94…..’
3. Number of employees to be contributed specified
⋅ ‘During the term of this Agreement, e-Power will dedicate at least two design engineers in the design and development of high-power adapters for supporting newly-released Products and the development of next-generation Products.’
⋅ ‘…Each party agrees to commit no less than 5 employees to a joint product definition team…’ 4. Specific persons
stipulated for management or other development work
⋅ ‘The parties hereby agree that the Project Leader for Ramtron shall be Mr. Tom Davenport and the Project Leader for ULVAC shall be Mr. Yoshifumi Ota. The responsibilities of the project leaders shall be to coordinate the individual work and/or shared work as set forth in the SOW with respect to the equipment deliverables as described in Attachment “B” and the cost sharing as described in Attachment “C”…’
⋅ ‘The initial project manager for the Comanche project shall be John Lovato…. Hewlett Packard’s initial project manager for the Comanche project shall be Jean-Jacques Simon…’
5. Specific technologies to be contributed described
⋅ ‘Fujitsu shall provide and make available to the Program Fujitsu’s existing 0.50/0.35 micron CMOS process technology as relates to the backend ferroelectric processing,…’
⋅ ‘Phase 2: The SPZ-1000 machine will be transferred to Ramtron, Colorado Springs at the beginning of Phase 2. The work undertaken will include composition, microstructural, electrical and other optimizations. Specific Phase 2 objectives will be defined by the parties through mutual consultations. A minumum of 50 wafers per month will be supplied by Ramtron for the development. Machine time for joint development work will be shared with customer evaluations, at ULVAC’s cost and Ramtron prototype production. ULVAC will provide in-house support during Phase 2 to the extent agreed by the parties…’
6. Intellectual property rights defined over specific technologies
⋅ ‘Ramtron shall retain sole ownership to all patents… relating to… ferroelectronic technology’ ⋅ ‘JABIL will have unlimited rights to use new concepts created or derived during the
development of the COMANCHE BIOS to implement other non-HPF products as long as such products will not be based on, or incorporate any part of, the HPF BIOS or COMANCHE BIOS…. HPF will have unlimited rights to use of modify the COMANCHE BIOS source code delivered by JABIL, for the purpose of developing future HPF products…’
MONITORING EXAMPLES 7. Reviews of
development work required
⋅ ‘… Fujitsu and Ramtron shall each conduct by the end of each calendar quarter quarterly reviews of the Development Plan, including review of the progress made in accomplishing development milestones set out in the Development Plan, the allocation of staffing contemplated by the development Plan, the development focus and timetable for development efforts contemplated by the Development Plan, and the development budget…’
39

8. Reviews of outcome only required
⋅ ‘ASKEY will evaluate Centillium’s first prototype of the Interface Devices. Centillium will provide evaluation boards to ASKEY for this evaluation.’
⋅ ‘…Once Motorola has customized and/or modified the Equipment, a prototype of the Equipment will be sent to Comdial… for acceptance testing….. Comdial …shall test the resulting product to determine whether the Equipment is operating in conformity with the specifications set forth in Appendix A…’
9. Discretionary reviews available
⋅ ‘Apple may conduct periodic reviews, including reviews at Global Village’s premises, of the Product. At Apple’s reasonable request, Global Village will provide Apple with written reports regarding its work on the Product in form and substance acceptable to Apple and with copies of any work in progress and related materials.’
⋅ ‘With respect to each Milestone, ALI shall have thirty (30) days after the date of receipt of the completed Milestone Deliverables to examine and test them to determine whether they satisfy the applicable Milestone Criteria…’
10. Timing of reviews specified
⋅ ‘Benchmarq shall issue a design status report no less frequently than twice per month.’ ⋅ ‘Fujitsu & Ramtron shall conduct by the end of each calendar quarter, quarterly reviews of the
Development Plan, including review of the progress made in accomplishing development milestones set out in the development plan…’
11. Content of reviews specified
⋅ ‘As part of such review, Benchmarq shall provide the following deliverables: a) Test tape program for Terradyne 386 tester; b) Source tapes; c) Hardware documentation; d) Working hardware; e) Program Flows..’
⋅ ‘… including review of the progress made in accomplishing development milestones set out in the Development Plan, the allocation of staffing contemplated by the Development Plan, the development focus and timetable for development efforts contemplated by the Development Plan, and the development budget associated with the various components of the Development Plan.’
12. Physical audits of development work permitted
⋅ ‘BENCHMARQ maintains the right to audit the OPTi manufacturing facility for conformance to agreed upon manufacturing flows at any time.’
⋅ ‘In the event that development or design work is performed at one party’s facility or facilities, the other party may at all reasonable times visit the facility or facilities, observe the development or design work being performed, and bring back to such other party’s facilities all information and results obtained in the course of such work…’
13. Reviews required of both (all) firms
⋅ ‘…In the event that, during the term of this Agreement, any portion of such work is required to be performed independently by one party, such party shall provide the other party with regular progress reports on the status of such work…’
⋅ ‘AltiGen may accept or reject the end products within thirty (30) days of delivery by Nitsuko. AltiGen may reject the end products if it materially fails to meet the requirements… except normal bugs…Nitsuko may accept or reject the end products within thirty (30) days of delivery by AltiGen. Nitsuko may reject the end products if it materially fails to meet the requirements… except normal bugs…’
PENALTIES EXAMPLES 14. Financial penalties
for underperformance ⋅ ‘…For each Deliverable that is delivered more than thirty (30) days late…Fujitsu will reduce
the applicable milestone payment by ten percent (10%)…’ ⋅ ‘If the JVC fails to pay on due date, any sums payable hereunder, the JVC shall pay to
MEMC…. interest on the aforesaid sums calculated at a rate equivalent to 2% (two percent) per annum above the prevailing Base Lending Rate of Malayan Banking Berhad…’
15. Right to terminate for underperformance (as distinct from ‘material breach’)
⋅ ‘If Ross fails to deliver a Deliverable without errors or otherwise acceptable to Fujitsu after two attempts, Fujitsu may terminate this Agreement…’
⋅ ‘If Ramtron does not cure such defaults and satisfy the Delinquent Milestones within the applicable grace period, then Fujitsu may terminate the Program by providing written notice…’
⋅ ‘In the event that Jabil fails to deliver to HP acceptable Deliverables for any Milestone within sixty (60) calendar days after the original target date therefore, HPF may at its sold option either (i) terminate this Agreement….’
40

41
Con
trac
t Det
ail:
1D
evel
opm
ent o
utpu
t spe
cific
atio
ns (s
uch
as to
lera
nces
) inc
lude
d22
42.3
%17
32.7
%4
7.7%
815
.4%
1223
.1%
815
.4%
2Ti
me
fram
e fo
r com
plet
ion
of e
ach
stag
e sp
ecifi
ed27
51.9
%17
32.7
%6
11.5
%7
13.5
%15
28.8
%8
15.4
%3
Num
ber o
f em
ploy
ees
to b
e co
ntrib
uted
spe
cifie
d8
15.4
%4
7.7%
611
.5%
35.
8%4
7.7%
35.
8%4
Spe
cific
per
sons
stip
ulat
ed fo
r man
agem
ent o
r oth
er d
evel
opm
ent w
ork
1426
.9%
815
.4%
713
.5%
35.
8%4
7.7%
59.
6%5
Spe
cific
tech
nolo
gies
to b
e co
ntrib
uted
des
crib
ed23
44.2
%12
23.1
%15
28.8
%4
7.7%
47.
7%7
13.5
%6
Inte
llect
ual p
rope
rty ri
ghts
def
ined
ove
r spe
cific
tech
nolo
gies
1732
.7%
815
.4%
815
.4%
35.
8%5
9.6%
713
.5%
Mon
itorin
g:7
Rev
iew
s of
dev
elop
men
t wor
k re
quire
d24
46.2
%11
21.2
%15
28.8
%3
5.8%
917
.3%
917
.3%
1019
.2%
8R
evie
ws
of o
utco
me
only
requ
ired
1121
.2%
35.
8%6
11.5
%0
0.0%
11.
9%5
9.6%
611
.5%
9D
iscr
etio
nary
revi
ews
avai
labl
e8
15.4
%4
7.7%
59.
6%1
1.9%
11.
9%6
11.5
%2
3.8%
10Ti
min
g of
revi
ews
spec
ified
1528
.8%
815
.4%
1019
.2%
35.
8%7
13.5
%7
13.5
%3
5.8%
11C
onte
nt o
f rev
iew
s sp
ecifi
ed8
15.4
%6
11.5
%7
13.5
%3
5.8%
47.
7%7
13.5
%2
3.8%
12Ph
ysic
al a
udits
of d
evel
opm
ent w
ork
perm
itted
1426
.9%
815
.4%
1121
.2%
11.
9%3
5.8%
1019
.2%
35.
8%13
Rev
iew
s re
quire
d of
bot
h (a
ll) fi
rms
1325
.0%
815
.4%
1019
.2%
35.
8%3
5.8%
1019
.2%
35.
8%
Pena
lties
:14
Fina
ncia
l pen
altie
s fo
r und
erpe
rform
ance
611
.5%
47.
7%5
9.6%
11.
9%1
1.9%
59.
6%1
1.9%
15R
ight
to te
rmin
ate
for u
nder
perfo
rman
ce (d
istin
ct fr
om ‘m
ater
ial b
reac
h’)
1732
.7%
1019
.2%
1325
.0%
59.
6%4
7.7%
1019
.2%
59.
6%
Tabl
e IV
, Pan
el B
: Con
trac
t Ter
m F
requ
ency
& C
ross
-Fre
quen
cy
Freq
uenc
y(n
=52)
Tech
nolo
gyC
ontr
ibut
ions
5IP
Rsp
ecifi
ed
6
fram
eM
anag
ersp
ecifi
ed
4N
umbe
r of
3
empl
oyee
s
Con
trac
t Det
ail:
Dev
elop
men
tSp
ecifi
catio
ns
12
Tim
e

Con
trac
t Det
ail:
1D
evel
opm
ent o
utpu
t spe
cific
atio
ns (s
uch
as to
lera
nces
) inc
lude
d11
21.2
%3
5.8%
47.
7%8
15.4
%6
11.5
%8
15.4
%8
15.4
%4
7.7%
1019
.2%
2Ti
me
fram
e fo
r com
plet
ion
of e
ach
stag
e sp
ecifi
ed15
28.8
%6
11.5
%5
9.6%
1019
.2%
713
.5%
1121
.2%
1019
.2%
59.
6%13
25.0
%3
Num
ber o
f em
ploy
ees
to b
e co
ntrib
uted
spe
cifie
d3
5.8%
00.
0%1
1.9%
35.
8%3
5.8%
11.
9%3
5.8%
11.
9%5
9.6%
4Sp
ecifi
c pe
rson
s st
ipul
ated
for m
anag
emen
t or o
ther
dev
elop
men
t wor
k9
17.3
%1
1.9%
11.
9%7
13.5
%4
7.7%
35.
8%3
5.8%
11.
9%4
7.7%
5Sp
ecifi
c te
chno
logi
es to
be
cont
ribut
ed d
escr
ibed
917
.3%
59.
6%6
11.5
%7
13.5
%7
13.5
%10
19.2
%10
19.2
%5
9.6%
1019
.2%
6In
telle
ctua
l pro
perty
righ
ts d
efin
ed o
ver s
peci
fic te
chno
logi
es10
19.2
%6
11.5
%2
3.8%
35.
8%2
3.8%
35.
8%3
5.8%
11.
9%5
9.6%
Mon
itorin
g:7
Rev
iew
s of
dev
elop
men
t wor
k re
quire
d5
9.6%
11.
9%15
28.8
%6
11.5
%6
11.5
%10
19.2
%2
3.8%
611
.5%
8R
evie
ws
of o
utco
me
only
requ
ired
59.
6%0
0.0%
00.
0%1
1.9%
11.
9%2
3.8%
11.
9%4
7.7%
9D
iscr
etio
nary
revi
ews
avai
labl
e1
1.9%
00.
0%0
0.0%
11.
9%7
13.5
%1
1.9%
35.
8%4
7.7%
10Ti
min
g of
revi
ews
spec
ified
1528
.8%
00.
0%0
0.0%
611
.5%
59.
6%8
15.4
%2
3.8%
47.
7%11
Con
tent
of r
evie
ws
spec
ified
611
.5%
11.
9%1
1.9%
611
.5%
47.
7%4
7.7%
35.
8%3
5.8%
12Ph
ysic
al a
udits
of d
evel
opm
ent w
ork
perm
itted
611
.5%
11.
9%7
13.5
%5
9.6%
47.
7%5
9.6%
59.
6%6
11.5
%13
Rev
iew
s re
quire
d of
bot
h (a
ll) fi
rms
1019
.2%
23.
8%1
1.9%
815
.4%
47.
7%5
9.6%
35.
8%7
13.5
%
Pena
lties
:14
Fina
ncia
l pen
altie
s fo
r und
erpe
rform
ance
23.
8%1
1.9%
35.
8%2
3.8%
35.
8%5
9.6%
35.
8%2
3.8%
15R
ight
to te
rmin
ate
for u
nder
perfo
rman
ce (d
istin
ct fr
om ‘m
ater
ial b
reac
h’)
611
.5%
47.
7%4
7.7%
47.
7%3
5.8%
611
.5%
713
.5%
23.
8%
Tabl
e IV
, Pan
el B
(con
t.): C
ontr
act T
erm
Fre
quen
cy &
Cro
ss-F
requ
ency
Pena
lties
:7
89
1011
12C
onte
nt o
fPh
ysic
alR
evie
ws
for
Mon
itorin
g:
Rev
iew
Out
com
eD
iscr
etio
nary
Tim
ing
ofPe
nalti
es
1314
15
Pena
lties
Fina
ncia
lTe
rmin
atio
nre
view
sau
dits
all f
irms
Req
uire
dO
nly
Rev
iew
sre
view
s
42

43
Con
tract
term
freq
uenc
ies
acco
rdin
g to
whe
ther
and
wha
t kin
d of
repe
at d
eals
exi
st. M
ean
diffe
renc
e te
sts
calc
ulat
ed b
etw
een
the
grou
p an
d its
com
plem
ent.
For e
xam
ple,
the
com
plem
ent g
roup
for (
B) i
s th
e gr
oup
of o
bser
vatio
ns w
ith re
peat
dea
ls o
f som
e ki
nd, w
heth
er w
ith th
e sa
me
partn
er o
r not
.Te
rm fr
eque
ncy
diffe
rs b
etw
een
grou
ps a
t the
1%
***
, 5%
** a
nd 1
0% *
leve
ls.
Con
trac
t Det
ail:
1D
evel
opm
ent o
utpu
t spe
cific
atio
ns (s
uch
as to
lera
nces
) inc
lude
d22
42.3
%2
20.0
%*
440
.0%
2047
.6%
*2
Tim
e fra
me
for c
ompl
etio
n of
eac
h st
age
spec
ified
2751
.9%
440
.0%
440
.0%
2354
.8%
3N
umbe
r of e
mpl
oyee
s to
be
cont
ribut
ed s
peci
fied
815
.4%
220
.0%
220
.0%
614
.3%
4Sp
ecifi
c pe
rson
s st
ipul
ated
for m
anag
emen
t or o
ther
dev
elop
men
t wor
1426
.9%
110
.0%
*1
10.0
%*
1331
.0%
*5
Spec
ific
tech
nolo
gies
to b
e co
ntrib
uted
des
crib
ed23
44.2
%2
20.0
%*
550
.0%
2150
.0%
*6
Inte
llect
ual p
rope
rty ri
ghts
def
ined
ove
r spe
cific
tech
nolo
gies
1732
.7%
330
.0%
220
.0%
1433
.3%
Mon
itorin
g:7
Rev
iew
s of
dev
elop
men
t wor
k re
quire
d24
46.2
%4
40.0
%4
40.0
%20
47.6
%8
Rev
iew
s of
out
com
e on
ly re
quire
d11
21.2
%3
30.0
%1
10.0
%8
19.0
%9
Dis
cret
iona
ry re
view
s av
aila
ble
815
.4%
110
.0%
220
.0%
716
.7%
10Ti
min
g of
revi
ews
spec
ified
1528
.8%
220
.0%
330
.0%
1331
.0%
11C
onte
nt o
f rev
iew
s sp
ecifi
ed8
15.4
%0
0.0%
***
220
.0%
819
.0%
***
12Ph
ysic
al a
udits
of d
evel
opm
ent w
ork
perm
itted
1426
.9%
110
.0%
*3
30.0
%13
31.0
%*
13R
evie
ws
requ
ired
of b
oth
(all)
firm
s13
25.0
%0
0.0%
***
550
.0%
*13
31.0
%**
*
Pena
lties
:14
Fina
ncia
l pen
altie
s fo
r und
erpe
rform
ance
611
.5%
00.
0%**
*2
20.0
%6
14.3
%**
*15
Rig
ht to
term
inat
e fo
r und
erpe
rform
ance
(dis
tinct
from
‘mat
eria
l bre
ach
1732
.7%
330
.0%
550
.0%
1433
.3%
Tabl
e V:
Con
trac
t Ter
m F
requ
ency
by
Gro
up
Rep
eat D
eals
:Sa
me
Part
ner
Dea
lsN
o R
epea
t
(n=1
0)
(D)
(n=4
2)
(A)
(B)
(C)
(n=1
0)(n
=52)
Full
Sam
ple
Rep
eat D
eals
:D
iffer
ent P
artn
ers

Number of deals Number of Percentage Cumulativein past 5 years firms in group of total percentage
0 34 43.59 43.591 11 14.10 57.692 5 6.41 64.103 1 1.28 65.384 2 2.56 67.955 2 2.56 70.516 2 2.56 73.087 1 1.28 74.368 1 1.28 75.649 1 1.28 76.9212 2 2.56 79.4916 1 1.28 80.7718 1 1.28 82.0521 1 1.28 83.3323 1 1.28 84.6233 1 1.28 85.9035 1 1.28 87.1836 1 1.28 88.4654 1 1.28 89.7479 1 1.28 91.0387 1 1.28 92.3191 1 1.28 93.59112 1 1.28 94.87144 1 1.28 96.15153 1 1.28 97.44167 1 1.28 98.72725 1 1.28 100.00
Total 78 100
Table VI: Prior Deal Frequency
44

Ordered probit and probit models of the effect of prior deals on the level of contract detail.Columns (1) - (3) use an ordered ranking of a contract's detail, based on how many of the six clausesthe contract contains (i.e., detail = 0 if no detail clauses, 1 if 1 clause, 2 if 2 clauses, etc.).Columns (4) - (6) use a dummy ranking of a contract's detail (i.e., detail = 1 if the contract containsthree or more detail clauses, zero otherwise.)
(1) (2) (3) (4) (5) (6)
Prior deals 1.417 1.608 ** 1.072 * 1.290 * 1.781 *** 1.270 **(partner specific) (0.875) (0.660) (0.569) (0.698) (0.587) (0.645)
Concurrent deals -1.267 ** -1.002 -0.937 -1.425 ** -1.649 *** -1.594 ***(partner specific) (0.630) (0.719) (0.689) (0.596) (0.630) (0.617)
Prior deal experience 0.442 ** 0.552 *** 0.359 * 0.733 ** 0.883 *** 0.634 **(any partner) (0.183) (0.202) (0.192) (0.307) (0.318) (0.282)
Technology breadth 0.050 0.002 0.139 -0.820 * -0.928 * -0.741(=1 if 'next generation', 0 otherwise) (0.304) (0.326) (0.340) (0.437) (0.548) (0.565)
Long term deal -0.097 -0.308 -0.300 -0.486 -0.705 -0.760(=1 if >1 year, 0 otherwise) (0.354) (0.388) (0.404) (0.426) (0.500) (0.523)
Manufacturing &/or marketing -0.098 0.066 -0.053 0.027 0.275 0.128(0.322) (0.333) (0.323) (0.435) (0.431) (0.435)
Cross border deal 0.194 0.199 0.173 0.900 * 1.063 ** 1.038 *(0.329) (0.327) (0.340) (0.490) (0.532) (0.532)
Equity holding -1.191 ** -0.969 * -1.177 * -0.918(0.497) (0.497) (0.604) (0.633)
R&D spending 2.637 *** 2.218(0.909) (1.420)
Constant -1.244 ** -1.204 * -1.105 *(0.576) (0.657) (0.630)
n 52 52 49 52 52 49Log likelihood -81.16 -75.98 -69.59 -24.07 -21.66 -20.15
Chi-square 10.47 26.30 *** 35.37 *** 24.68 *** 36.52 *** 42.13 ***d.o.f. 7 8 9 7 8 9
*, **, *** significant at 10%, 5%, and 1% level for 2-tailed testsstandard errors in parentheses
Table VII: Contractual Detail and Repeated Deals
Ordered ProbitDetail = 0 to 6 Detail =0,1
Simple Probit
45

Ordered probit and probit models of the effect of prior deals on inclusion of monitoring clauses.Columns (1) - (3) use an ordered ranking of monitoring clauses in a contract, based on how many of the five clausesthe contract contains (i.e., monitor = 0 if no monitoring clauses, 1 if 1 clause, 2 if 2 clauses, etc.).Columns (4) - (6) use a dummy ranking of a contract's monitoring clauses (i.e., monitor = 1 if the contract containsthree or more monitoring clauses, zero otherwise.)
(1) (2) (3) (4) (5) (6)
Prior deals -0.112 -0.120 -0.609 0.000 0.005 -0.168(partner specific) (0.654) (0.658) (0.688) (0.542) (0.538) (0.659)
Concurrent deals 0.348 0.432 0.422 1.041 1.095 1.045(partner specific) (0.546) (0.671) (0.657) (0.670) (0.774) (0.784)
Prior deal experience 0.278 0.287 0.124 0.419 ** 0.427 ** 0.346(any partner) (0.188) (0.189) (0.248) (0.212) (0.205) (0.221)
Technology breadth 0.564 0.554 0.559 0.352 0.337 0.396(=1 if 'next generation', 0 otherwise) (0.345) (0.345) (0.351) (0.419) (0.411) (0.411)
Long term deal 0.156 0.120 0.275 0.508 0.500 0.552(=1 if >1 year, 0 otherwise) (0.378) (0.420) (0.439) (0.469) (0.487) (0.497)
Manufacturing &/or marketing 0.177 0.204 0.230 0.065 0.088 0.119(0.308) (0.304) (0.311) (0.422) (0.411) (0.417)
Cross border deal -0.202 -0.204 -0.160 -0.772 -0.768 -0.677(0.351) (0.349) (0.353) (0.511) (0.509) (0.510)
Equity holding -0.200 -0.057 -0.141 -0.110(0.471) (0.474) (0.570) (0.589)
R&D spending 2.260 0.755(1.432) (1.599)
Constant -1.560 ** -1.541 ** -1.582 **(0.629) (0.668) (0.682)
n 52 52 49 52 52 49Log likelihood -77.51 -77.36 -72.44 -22.90 -22.86 -22.35
Chi-square 7.18 7.77 11.97 9.60 9.56 7.78d.o.f. 7 8 9 7 8 9
*, **, *** significant at 10%, 5%, and 1% level for 2-tailed testsstandard errors in parentheses
Table VIII: Monitoring and Repeated Deals
Ordered Probit Simple ProbitMonitor = 0 to 5 Monitor = 0,1
46

Ordered probit and probit models of the effect of prior deals on inclusion of penalty clauses.Columns (1) - (3) use an ordered ranking of penalty clauses in a contract, based on how many of the two clausesthe contract contains (i.e., penalty = 0 if no monitoring clauses, 1 if 1 clause, 2 if 2 clauses).Columns (4) - (6) use a dummy ranking of contract penalties (i.e., penalty = 1 if the contract containsone or more monitoring clauses, zero otherwise.)
(1) (2) (3) (4) (5) (6)
Prior deals 1.354 ** 1.361 ** 1.031 * 1.428 1.451 1.219(partner specific) (0.599) (0.587) (0.566) (0.920) (0.944) (0.877)
Concurrent deals -0.095 -0.176 -0.232 -0.094 -0.126 -0.175(partner specific) (0.550) (0.564) (0.564) (0.630) (0.668) (0.664)
Prior deal experience 0.728 ** 0.707 ** 0.583 * 0.666 ** 0.659 ** 0.586 *(any partner) (0.321) (0.313) (0.303) (0.317) (0.312) (0.315)
Technology breadth -1.041 *** -1.017 *** -0.985 *** -0.972 ** -0.966 ** -0.929 **(=1 if 'next generation', 0 otherwise) (0.327) (0.315) (0.334) (0.397) (0.393) (0.406)
Long term deal 0.020 0.038 0.146 0.151 0.160 0.238(=1 if >1 year, 0 otherwise) (0.381) (0.385) (0.402) (0.445) (0.466) (0.473)
Manufacturing &/or marketing 0.532 0.481 0.482 0.550 0.534 0.577(0.410) (0.425) (0.426) (0.446) (0.455) (0.452)
Cross border deal -0.692 -0.702 -0.619 -0.963 ** -0.965 ** -0.857 *(0.427) (0.428) (0.429) (0.439) (0.442) (0.453)
Equity holding 0.259 0.377 0.076 0.088(0.442) (0.500) (0.494) (0.504)
R&D spending 1.630 0.840(1.717) (1.762)
Constant -0.711 -0.718 -0.790(0.580) (0.587) (0.567)
n 52 52 49 52 52 49Log likelihood -32.72 -32.53 -31.39 -26.78 -22.86 -25.98
Chi-square 19.73 *** 19.18 ** 16.19 * 12.81 * 9.56 11.79d.o.f. 7 8 9 7 8 9
*, **, *** significant at 10%, 5%, and 1% level for 2-tailed testsstandard errors in parentheses
Table IX: Penalties and Repeated Deals
Ordered Probit Simple ProbitPenalty = 0 to 2 Penalty = 0,1
47

IPRIA Working Papers No. Title Author(s)
11/05
Repeated Interactions & Contract Structure: Evidence from Technology Development Contracts
Ryall / Sampson
10/05
Operationalizing Value-Based Business Strategy
Gans / MacDonald / Ryall
09/05
Determinants of International Patent Examination Outcomes
Palangkaraya / Jensen / Webster
08/05
Intellectual Property Strategy and Business Strategy: Connections Through Innovation Strategy
Samson
07/05
An Empirical Investigation into Patent Enforcement in Australian Courts
Weatherall / Jensen
06/05
Patent Application Outcomes Across the Trilateral Patent Offices
Jensen / Palangkaraya / Webster
05/05
The Effects on Firm Profits of the Stock of Intellectual Property Rights
Griffiths / Jensen / Webster
04/05
Capitalised Intangibles and Financial Analysis
Matolcsy / Wyatt
03/05
Reach-through Patent Claims in Biotechnology: An Analysis of the Examination Practices of the United States, European and Japanese Patent Offices
Lim / Christie
02/05 Venture Capital Taxation in Australia and New Zealand
Stewart
01/05
The New Right of Communication in Australia
Christie / Dias
18/04
Trends in the Value of Intellectual Property in Australia
Griffiths / Webster
17/04
On Technology Locks and the Proper Scope of Digital Copyright Laws – Sony in the High Court
Weatherall
16/04
Techniques for Measuring Intangible Capital: A Review of Current Practice
Wyatt / Webster / Hunter
15/04
Achieving the Optimal Power of Patent Rights
Jensen / Webster

14/04
On The Interaction Between Patent Policy and Trade Secret Policy
Erkal
13/04
The Determinants of Research and Development and Intellectual Property Usage among Australian Companies 1989 – 2002
Griffiths / Webster
12/04 Regulating Private Copying of Musical Works: Lessons from the U.S. Audio Home Recording Act of 1992
Elkman / Christie
11/04 Droit de Suite Down Under: Should Australia Introduce a Resale Royalties Scheme for Visual Artists?
Hudson / Waller
10/04 The Research Exemption to Patent Infringement: A Doctrine In Search of a Principle
Elkman
09/04 SMEs and their Use of Intellectual Property Rights in Australia
Jensen / Webster
08/04 Catching Up or Standing Still? National Innovative Productivity Among “Follower Nations”. 1978 – 1999
Furman / Hayes
07/04
Patent Length and the Timing of Innovative Activity
Gans / King
06/04 Moving Beyond Tacit and Explicit: Four Dimensions of Knowledge
Casselman / Samson
05/04 Examining Biases in Measures of Firm Innovation
Jensen / Webster
04/04 Principle or Compromise?: Understanding the original thinking behind statutory licence and levy schemes for private copying
Gaita / Christie
03/04 Patterns of Trademarking Activity in Australia Jensen / Webster
02/04 Protecting Indigenous Signs And Trade Marks Under The New Zealand Trade Marks Act 2002
Morgan
01/04 Patent Renewal Fees and Self-Funding Patent Offices
Gans / King / Lampe
12/03 Accounting for Intangible Assets: A Conceptual Framework for Measurement and Reporting on Intangible Assets
Wyatt / Abernethy

11/03 The Decision to Patent, Cumulative Innovation, and Optimal Policy
Erkal
10/03 The Protection of National Icons under the Trade Marks Act 1995
Morgan
09/03 An Analysis Of The Approaches Of The Trilateral and Australian Patent Offices to Patenting Partial DNA Sequences
Howlett / Christie
08/03 Accounting for Intangible Assets: Theory and Evidence on the Influence of Technology and Property Rights Related Conditions
Wyatt
07/03 Using Patent-Based Metrics to Understand the Value of Companies
Matolcsy / Wyatt
06/03 The Economics of Patent Design: A Selective Survey
Lampe / Niblett
05/03 An Analysis of the Approach of the European, Japanese and United States Patent Offices to Patenting Partial DNA Sequences (ESTs)
Howlett / Christie
04/03 The Rise of Trade Marking in Australia in the 1990s
Loundes / Rogers
03/03 Forces Shaping Firms’ Decisions To Innovate: Evidence from Large Australian Organisations
Webster
02/03 Virtual Markets for Virtual Goods: An Alternative Conception of Digital Copyright
Eckersley
01/03 Managing Ideas: Commercialization Strategies for Biotechnology
Gans / Stern
07/02 Intellectual Property Rights: A Grant of Monopoly or an Aid to Competition
Gans / Williams / Briggs
06/02 Intellectual Capital: Accumulation and Appropriation
Hunter
05/02 The Product Market and the Market for “Ideas”. Commercialization Strategies for Technology Entrepreneurs
Gans / Stern

04/02 When does Funding Research by Smaller Firms Bear Fruit?
Gans / Stern
03/02 Network Externalities and the Myth of Profitable Piracy King / Lampe
02/02 When Does Start-Up Innovation Spur the Gale of Creative Destruction?
Gans / Hsu / Stern
01/02 Intangible and Intellectual Capital: A Review of the Literature
Webster
Electronic copies of all IPRIA working papers are available at: www.ipria.org/publications/workingpapers.html