Convergent evolution as natural experiment: the tape of life ...
Upload
khangminh22Category
view
1download
0
RELIABILITY OF BROSELOW TAPE – LENGTH BASED EMERGENCY
WEIGHT ESTIMATION IN PAEDIATRIC POPULATION OF SOUTHERN
TAMILNADU
DISSERTATION SUBMITTED FOR THE DEGREE OF
M.D BRANCH VII
(PAEDIATRIC MEDICINE)
APRIL 2018
THE TAMILNADU DR. M.G.R MEDICAL UNIVERSITY
CHENNAI, TAMIL NADU

CERTIFICATE
This is to certify that the dissertation entitled “RELIABILITY OF BROSELOW
TAPE – LENGTH BASED EMERGENCY WEIGHT ESTIMATION IN
PAEDIATRIC POPULATION OF SOUTHERN TAMILNADU” is the
bonafide work of Dr. D. SANJEEV KUMAR in partial fulfilment of the
university regulations of the Tamil Nadu Dr. M.G.R Medical University, Chennai,
for M.D Degree Branch VII – PAEDIATRIC MEDICINE examination to be held
in April 2017.
Dr. D. MARUTHUPANDIAN M.S., FICS, FAIS
Dean, Madurai Medical College,
Government Rajaji Hospital,
Madurai – 625020

BONAFIDE CERTIFICATE
This is to certify that the dissertation entitled “RELIABILITY OF BROSELOW
TAPE – LENGTH BASED EMERGENCY WEIGHT ESTIMATION IN
PAEDIATRIC POPULATION OF SOUTHERN TAMILNADU” submitted by
Dr. D. SANJEEV KUMAR to the faculty of Pediatrics, The Tamil Nadu Dr.
M.G.R Medical University, Chennai in partial fulfillment of the requirement for
the award of M.D Degree Branch VII (PAEDIATRIC MEDICINE) is a bonafide
research work carried out by him under our direct supervision and guidance.
Dr. M.S.RAJARAJESWARAN MD DCH
Professor of Paediatrics
Institute of Child Health
& Research Centre,
Madurai Medical College,
Madurai
Dr. K. MATHIARASAN MD DCH
Director & Professor of Paediatrics
Institute of Child Health
& Research Centre,
Madurai Medical College,
Madurai

DECLARATION
I, Dr. D. SANJEEV KUMAR, solemnly declare that the dissertation titled
“RELIABILITY OF BROSELOW TAPE – LENGTH BASED
EMERGENCY WEIGHT ESTIMATION IN PAEDIATRIC POPULATION
OF SOUTHERN TAMILNADU” has been conducted by me at Institute of Child
Health and Research Centre, Madurai under the guidance and supervision of Prof.
Dr. M. S. RAJARAJESHWARAN M.D.,DCH..
This is submitted in part of fulfillment of the regulations for the award of
M.D Degree Branch VII (Paediatric Medicine) for the April 2017 examination to
be held under The Tamil Nadu Dr. M.G.R Medical University, Chennai. This has
not been submitted previously by me for any Degree or Diploma from any other
University.
Place : Madurai Dr. D. SANJEEV KUMAR
Date :

CONTENTS
Sl. No Title Page no
1. Introduction 1
2. Review of Literature 5
3. Aims and Objectives 28
4. Materials and Methods 29
5. Observation and Results 36
5. Discussion 61
6. Conclusion 67
7. Strength of this Study 69
8. Limitations 70
9. Recommendations 71
Annexures :
Bibliography
Proforma
Abbreviations
Master Chart
Ethical Clearance
Plagiarism Certificate.

ACKNOWLEDGEMENT
First, I would like to thank the almighty for giving me this
opportunity. My sincere thanks to Prof. Dr. D. MARUTHUPANDIAN, Dean,
Government Rajaji Hospital and Madurai Medical College for permitting me to do
this study and utilize the institutional facilities.
I express my sincere thanks and gratitude to Prof. Dr. K. Mathiarasan,
Professor and Director, Institute of Child Health & Research Centre, Madurai, for
his able supervision, encouragement, valuable suggestions and support for this
study.
I am greatly indebted to my teacher, Prof. Dr. M. S. Rajarajeswaran who
guided me throughout my study. I am also greatly thankful for his able supervision,
critical review, constant encouragement and full support rendered in every aspect
of this study..
I would extend my sincere thanks to Prof. Dr. S. Balasankar, Prof. Dr. M.
Kulandaivel, Prof. Dr. S. Shanmugasundaram and Prof. Dr. Nandhini, Prof.
Dr. M. Balasubramaniam, Prof. Dr. N. Muthukumaran for their valuable
advice and encouragement at every stage of this study.
I wish to express my sincere thanks to my Assistant Professors of Pediatrics,
Dr. P. Murugalatha, Dr. P. Ramasubramaniam, Dr. P. Kannan, Dr. K.

Ramya for their constant guidance, encouragement and support throughout my
study. I also extend my thanks to Dr. D. Rajkumar, Dr. E. Sivakumar, Dr. P. Guna,
Dr. J. Balasubramanian, Dr. S. Murugesalakshmanan, Dr. Vanitha, Dr. R. Suresh
for their guidance, supervision, valuable suggestions and support throughout this
study.
I thank the Institutional Ethical Committee for granting me permission to
conduct the study. I also express my gratitude to all my fellow Postgraduates for
their kind cooperation in carrying out this study and for their critical analysis.
Last but not the least, I submit my heartfelt thanks to the children and their
parents for extending full co –operation to complete my study successfully.

1
INTRODUCTION
Resuscitation of a critically ill child in the Emergency Department (ED)
adds an emotional stress to the treating physician. Calculating, prescribing,
preparing, and delivering accurate drug doses to children in the ED can be
challenging at the best of times and consequently medication errors in children
have been shown to be very common. Reliable paediatric weight estimation is the
keystone in child resuscitation in the ED. Knowledge on estimated body weight
is crucial in drug dosage calculation, determination of tube size, intravenous drug
administration, defibrillation and other life-saving measures(1). A series of steps
(as shown in figure 1) must be followed to avoid drug dose-related errors and
there is potential for medication error at any stage of the drug identification, dose
calculation, drug dilution or drug/dilution delivery. Flawed weight estimation
may lead on to negative effects on the child during resuscitation such as non-
responsiveness or increased adverse effects to the intervention(2).
Therefore, it is evident that accurate estimate of weight is imperative in
drug dose calculation system to
Ensure the efficacy of the drug administered
Prevent the plausible complications and side-effects of overdosing the
patient

2
Critically ill child in the resuscitation room
Identification of correct medication
Determination of correct base dose (mg/kg)
Correct calculation of total dose WEIGHT
REQUIRED
Accurate verbal or written prescription
Correct interpretation of prescription
Accurate determination of drug dilution
Accurate performance of drug dilution
Accurate calculation of ml volume to deliver
Accurate delivery of correct volume
Figure 1: The sequential steps required for the correct calculation, dilution,
preparation and delivery of medications to children during emergency
medical management or resuscitation.

3
The ideal method for weight estimation is to weigh the child on a scale,
which is often inappropriate in emergency situations as this requires fixed
equipment and adequate time(3). In developing countries like India and in
emergencies, limited time or resources makes it difficult for actual weight
measurement(4,5).
Multiple methods of weight estimation on the basis of age alone or on a
combination of age and height have been reported in the literature(6-12). Age based
weight estimation was preferred because of the ease of calculation, reliability and
rapidity. Recently the accuracy of these methods have been challenged(6,13,14) as
these methods gives rise to a significant deviation in weight estimation(12).
Most methods to estimate weight from age are based on western pediatric
populations(6,7). In India, the age-derived weight methods using the Nelson
formula or APLS in pediatrics is often used(8,18). There are no standardized
methods in use for rapid weight estimation in children admitted for acute pediatric
emergencies in trauma centers in Madurai, India. Physicians currently make an
educated guess from experience and/or ask parents for the last known weight.
The Broselow Tape (Broselow Paediatric Emergency Tape, 2002 Edition,
Drs James Broselow and Robert Luten, Armstrong Medical Industries, 575
Knightbridge Parkway, Lincolnshire, IL 60069, USA) was developed using
height/weight correlations from Western data. This validated tape estimates
weight (hence intervention doses/sizes) of the supine child based on length(15,16).

4
The Broselow tape has been conclusively shown to improve accuracy in weight
prediction and eliminate the need for memorization and calculation in such
situations(17). This study attempts to investigate the accuracy and clinical utility
of the Broselow tape in paediatric population of Madurai, India.
The rationale behind my study is that, I found the Broselow-Luten tape is
underutilized in our setup as the medical personnel or the staff preferred age based
mathematical formulae.

5
REVIEW OF LITERATURE
Management of a critically ill child in the Emergency Department (ED)
requires greater confidence for optimum care as they are a diverse population in
weight, size, shape and developmental level(13). Obtaining an accurate weight of
a child allows for optimum care of the child. Dosage errors from wrong weight
calculation contributes to most adverse drug events(17).
Measuring the weight of a child requires time and a systematic and uniform
approach. This literature review will delineate the common methods of weight
estimation used in healthcare system and analyse current study in relation to
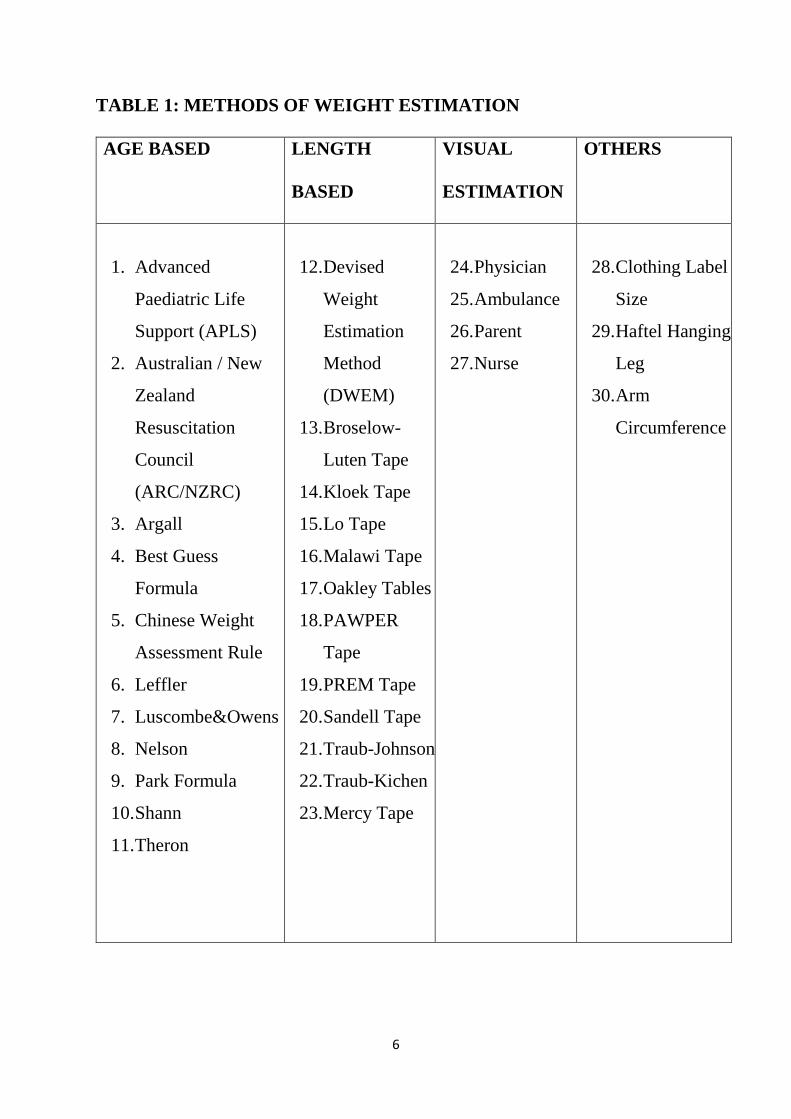
these. Different methods of weight estimation (as shown in table 1) were followed
and are broadly classified into
1. Age based
2. Length based
3. Visual estimation
4. Other methods
From the table 1, it is evident that there are numerous weight estimation
methods. Nonetheless, methods which measure the precision of weight
estimation are not consistent across studies. Authors report accuracy based on
selection of clinically relevant cut-off; most frequently, weight estimates within
10% of a child’s measured weight(22,25,26). Some authors use mean percentage
error, mean percentage difference or actual error in kg to report statistical
significance(6,12,13).
6
TABLE 1: METHODS OF WEIGHT ESTIMATION
AGE BASED LENGTH
BASED
VISUAL
ESTIMATION
OTHERS
1. Advanced
Paediatric Life
Support (APLS)
2. Australian / New
Zealand
Resuscitation
Council
(ARC/NZRC)
3. Argall
4. Best Guess
Formula
5. Chinese Weight
Assessment Rule
6. Leffler
7. Luscombe&Owens
8. Nelson
9. Park Formula
10. Shann
11. Theron
12. Devised
Weight
Estimation
Method
(DWEM)
13. Broselow-
Luten Tape
14. Kloek Tape
15. Lo Tape
16. Malawi Tape
17. Oakley Tables
18. PAWPER
Tape
19. PREM Tape
20. Sandell Tape
21. Traub-Johnson
22. Traub-Kichen
23. Mercy Tape
24. Physician
25. Ambulance
26. Parent
27. Nurse
28. Clothing Label
Size
29. Haftel Hanging
Leg
30. Arm
Circumference

7
History of weight estimation methods in children
In the early 1980s, age based weight estimation methods and educated
guesses by the treating physician were commonly used for calculating weight in
seriously ill children in Emergency Department(7).
The earliest record of age based formula of weight estimation available in
literature was given by Alexander Weech in 1956(31) with a series of equations to
predict height and weight in children in metric and imperial units. Weech
formulas incorporated the one which later become as the APLS formula.
The likely time of introduction of APLS formula is sometime from 1952
to 1956, derived from post war children in the UK. Traub and Johnson(32) and
Traub and Kichen(33) formulas were developed in early 1980s.

8
FL
OW
CH
AR
T 2
: T
IME
LIN
E F
OR
WE
IGH
T E
ST
IMA
TIO
N M
ET
HO
DS

9
TABLE 2: HISTORY IN A NUTSHELL
YEAR
AUTHOR
NAME
METHOD
1986
Jeffrey Garland(34)
Devised Weight-
Estimating
Method (DWEM)
Only technique
which includes
body habitus in a
weight estimation
technique
1988
Peter Oakley(35)
Reference table of
Weight-for-length
for children.
1988
Deborah Lubitz(7)
First validation
study on the
Broselow
Paediatric
Emergency Tape
Early 1980s
James Broselow(19)
Broselow tape
Length based
Weight
estimation
method, based on
50th centile of the
1979 NCHS
weight-for-length
growth charts
1990
Anthony Haftel
Hanging leg-
weight technique
1997
Leffler(36)
Age based weight
estimation
method
2000
Shann(37) Age based weight
estimation
method
2003
Argall(3)
Age based weight
estimation
method
2004
Nelson(18)
Age based weight
estimation
method
2007
Luscombe(12)
Age based weight
estimation
method

10
2007
Tinning(10)
Best Guess
Age based weight
estimation
method
OTHER TAPE BASED WEIGHT ESTIMATION METHODS
1995 Lo tape / rod
modification(37)
Developed in
Hong Kong
1999 Elizabeth Molyneux Blantyre tape(38) Malawi
2000 Walter Kloeck Kloeck tape(39) South Africa
2004 Julian Sandell Sandell tape(40) UK
2005 Joe Brierly Paediatric
Resuscitation
Emergency
Management
(PREM) tape(41)
2008 Michael David John
Wells
Paediatric
Advanced Weight
Prediction in the
Emergency Room
(PAWPER) tape

11
WEIGHT ESTIMATION METHODS
1. LENGTH BASED
(i) Broselow-Luten tape: James Broselow, a North Carolina–based
emergency physician, developed a simple tool to improve weight estimation
using established height-weight correlations in the early 1980s(19). The Broselow
tape is a colour-coded tape which gives a weight estimate based on child’s length
from head to heel. The Broselow tape is a full-scale depiction of the NCHS 2000
weight-for-length growth chart, with the weight divisions of the tape representing
the 50th centile. The tape is calibrated in kilograms rather than any measurement
of length, and information relating to drug dosaging or equipment sizing may be
found within each weight division This Tape has been validated in western
population and has shown to decrease errors in paediatric weight estimation
particularly in emergency department.
Based on the literature available, it is said that the most common paediatric
drug errors are dosage errors and are often based on flawed weight estimates(20).
Previous versions of Broselow tape gave a weight estimate, but further
calculations were required to obtain the medication dose. Newer versions has
resolved these problems and the printed versions of the Broselow tape contains
weight estimated by length and resuscitation drug doses and equipment size
included to decrease the risk of error.
The Broselow-Luten Tape was first validated in the USA in 1988 in a study
by Lubitz, et al., set in Emergency Departments and Outpatients Clinics. They

12
concluded that the SD remains small for all age groups (<3.67), giving it
precision, nonetheless, when assessing the total population actual error spans 15
kg, which according to Mackway-Jones et al could cause a significant difference
in drug dosage or equipment size during resuscitation. Lubitz et al., showed in
their study that Broselow-Luten tape was highly precise in comparison with other
methods which were in use during that time period. However, most studies in
Table 3 show that with increasing age or weight, the accuracy of the Broselow-
Luten Tape decreases. One exception to this finding is a South African study in
2011 where the Broselow tape estimated 65.38% of 6-10 years children as within
10% of measured weight which is of more precision then the younger age group
which is also shown in table 3.
There have been several iterations of the Broselow-Luten Tape with
updates to weight and drug information. The most recent of which is the 2011
version, which is used in this study. This recent version of the Broselow tape has
its own limitations such as the data used to create this was from North American
children making it difficult for use in other parts of the world(21). However, many
studies worldwide have found length-based methods such as the Broselow-Luten
tape, the most accurate of the weight estimation methods tested(6.13,22,23,24).
Main limitation of any length based weight estimation method is that,
during measurement of weight, child needs to be either in a standing posture or
laying flat. This is practically difficult(22) in some emergency resuscitation
situations, for example in cases of severe asthma, laying flat is contraindicated

13
making length based methods of estimation ineffective. Since Broselow tape has
been the most widely used method of weight estimation during resuscitation for
the last few decades, it has also been the object of the most critical review in
literature.
Some of the concerns relevant to the use of the Broselow tape in Madurai, India
include:
It has not been formally validated in a South Indian population.
It has been shown to underestimate weight in overweight children(42) and
overestimate weight in underweight children(43). As a result it has proved to be
inaccurate in populations where a significant proportion of children are above
average weight-for-length.
Since the number of overweight children is increasing in many countries
worldwide, Including India, the potential for an escalating underestimation of
weight is concerning. There is also, on the other hand, a sizeable population of
undernourished children in India who are at risk of having an overestimation of
weight. Our population is thus at risk at both ends of the spectrum for inaccurate
weight estimation. Hence, we decided to validate this tape in our population for
further use during resuscitation in Emergency Department.

14
TABLE 3: Summary of studies assessing the accuracy of the Broselow-
Luten Tape using percent of estimates within 10% of measured weight
Authors N Age/Weight
group
Within 10% LOA Country Setting
Lubitz et
al (1988)
395
449
93
937
3.5 to 10 kg
10 to 25 kg
> 25kg
Total
55.9%
65.0%
49.5%
59.7%
SD 0.95
SD 1.62
SD 3.67
AE -5.7 to
15.7 kg
USA Prospective,
observational
multicentre
study in ED &
OPD
Nieman,
Manacci,
Super,
Mancuso
and Fallon
(20006) –
2249
1403
1224
2937
Infant
Toddlers
Preschool
School Aged
59.5% /
55.0%
64.3% /
60.0%
61.4% /
59.4%
57.6% /
51.2%
USA Prospective,
observational
study set in
School &
Paediatric
Clinic. Tape
Version 1998 /
2002A
Abdel-
Rahman et
al. (2013a)
976 2 – 14 years 55.3% USA Prospective,
multicentre,
observational,
children from
Hospital
Milne,
Yasin,
Knight,
Noel,
Lubell and
Filler
(2012)
6361 <10 years 56.3% -7.71 –
10.95 kg
Canada Prospective,
observational
study in Urban
& Rural Health
Centre /
School
Geduld et
al. (2011)
2832 1-4 years
6-10 years
63.46%
65.38%
±0.65
±0.90
South
Africa
Prospective via
database at
hospital
Trakulsric
hai et al.
(2012)
300
(ED)
295
(OPD)
< 10 kg
10 – 25 kg
25 – 40 kg
> 40 kg
60.36%
59.68%
43.20%
N/A
-2.68 - 6.31
-3.91 - 4.48
-13.22- 7.26
Thailand Prospective
observational
study in OPD
& ED

15
FIGURE 2: BROSELOW PAEDIATRIC EMERGENCY TAPE

16
(ii) Oakley Chart: developed in 1988 using a reference chart from which
weight could be read after the child’s age was determined or height or length was
measured. It was based on the same principle as that of growth chart method. This
method was used in some parts of the world, but the chart can be found only in
the original publication(44). Major limitations of the chart was, it is derived from
old growth charts making it a time consuming one to use. Also literature shows
that this method has been found to significantly underestimate the weight of
children, most specifically in children >25 kg(6).
(iii) DWEM Table: developed in 1986, which is produced with a table of
weights for children with slim, average and heavy frames at 50mm intervals of
length based on th 5th (slim), 50th (average) and 95th (heavy) 1979 NCHS weight-
for-length growth chart centiles. This method involves measuring child’s length,
assessing their frame size and habitus and then reading the appropriate weight off
the table. Because of its complex nature in the measurement of weight, it has not
seen much clinical use since its inception.
(iv) Traub – Johnson formula:
Weight (kg) = 2.05 x e0.02X
Used for children aged 1 to 18 years. X = height or length in cm.
(v) Traub – Kichen formula:
weight (kg) = 2.396 x 1.0188X
Used in children over 74cm and aged 1-17 years. X = height or length in cm.

17
Both these equations are formidable to the treating emergency physician
and requires use of a scientific calculator which makes the use of these formulas
vulnerable to failure and to errors which might not be readily detectable.
(vi) Blantyre tape: developed in Malawi in 1999 as an alternative to
Broselow tape as the authors felt that Broselow tape overestimated weight in their
community and also owing to the fact that they did not have the same drugs
available that were represented on the Broselow tape(38). This tape is a hand drawn
tape with divisions at 50mm intervals corresponding to a weight reflecting 85%
to 90% of the 50th centile of the NCHS 2000 weight-for-length chart.
The validation study of the tape had some methodological shortcomings in
the design and analysis, particularly that a large margin of error in weight
estimation (20%) was considered acceptable. The tape is still in use in the Queen
Elizabeth Central Hospital in Blantyre but has not been tested in successive
studies.
(vii) Sandell tape: This tape is much similar to the Broselow tape in that
it embraces information regarding drug dose, emergency equipment sizes related
to length. It is based on the 1996 UK growth charts and was designed primarily
for the prehospital environment. This tape was used by ambulance services in
UK. There are no studies assessing it utility or accuracy.
(viii) PREM tape: The Paediatric Resuscitation Emergency Management
(PREM) tape was developed in United Kingdom, the basis of which is the
UK1996 growth charts. This tape is disposable, exclusively used to estimate

18
weight with an accompanying booklet which helps to calculate drug dose and
equipment sizes. No studies are available in literature validating its precision.
(ix) Kloeck tape: developed in South Africa by Walter Kloeck. It is an
inexpensive, laminated paper tape. On one side of the tape, regular tape measure
is printed and the other side has the same colour zones as that of Broselow tape.
No validation studies available in the literature.
(x) PAWPER tape: developed in South Africa. This tape includes both a
measure of length and of body habitus in the methodology. With this tape, if a
length based weight has been estimated, this weight can be altered according to
the child’s body habitus. The weight can be acclimatized up or down or left
unmodified based on whether the child is thought to be overweight, underweight
or of average weight, respectively. The weights for children with above or below
average weight-for-length can be found on the tape itself, within each weight
division.
2. AGE BASED WEIGHT ESTIMATION METHODS
(i) Advanced Paediatric Life Support (APLS) weight estimation
formula: This method is used worldwide and inculcated during Advanced
Paediatric Life Support (APLS) courses worldwide(8). The first reference to the
APLS course was in the Journal of Paediatrics in 1982 as a scheduled course,
content was not disclosed and therefore, it can only be assumed that a weight
estimation formula was included in this course ("Scheduled meetings," 1982).

19
The most well known formula is that taught on the Advanced Paediatric Life
Support (APLS) course(27):
Weight (kg) = (age in years + 4) X 2 (or)
Weight (kg) = (2 X age in years) + 8
This formula was derived from National Centre for Health Statistics
(NCHS) population data from 1977 in the United States(28). However, subsequent
studies from the USA and the UK have suggested that the APLS formula
underestimates children’s weight by up to 20% in developed countries(6,29). In the
United Kingdom, the APLS formula has been updated to reflect the increasing
weight of children aged 6 to 12 years (Resuscitation Council United Kingdom,
2012):
1 - 12 months = (0.5 x age months) + 4
1 - 5 years = (2 x age years) + 8
6 - 12 years = (3 x age years) + 7
A study of New Zealand Maori and Pacific children by Theron et al. (2005)
showed that these populations were considerably heavier than others in Auckland,
therefore, the APLS formula consistently underestimated the weight of these
children. The variability in weight-for-age is significantly higher than that for
weight-for-length and therefore none of these age-based formulas have ever been
shown to perform better than length based systems(6,43). Validation studies
performed to assess the accuracy of age based weight estimation methods is given
in table 4 & 5.

20
TABLE 4: VALIDATION STUDIES PERFORMED TO ASSESS THE
ACCURACY OF APLS FORMULA
FORMULA
POPULATION
ERROR
APLS
UK
Australia
Pacific Islands
Australia
Australia
Malawi
India
<20% within 10% of actual weight
34% within 10% of actual weight
95%CI -7.7kg to 13.4kg
MPE -15%
MPE -17%
MPE 10%
Mean overestimate 2kg
MPE – Mean Percentage Error

21
Most experts advocate that age-based formulas should only be used if no
better weight-estimation system is available(45). One of the advantages of age-
based formula methods is that they are independent of any equipment and so
constitute a highly resilient weight-estimation technique, as long as the child’s
correct age is known, the formula is remembered correctly and the arithmetic
performed accurately. The memorisation of age-based formulas is encouraged on
advanced life support courses, but memory is capricious in emergencies and leads
to mistakes(46).
(ii) Nelson’s formula:
Children aged 3 – 12 months = [age in months + 9] / 2
Children aged 1 – 6 years = 2 x [age in years + 4]
Children aged 7 – 12 years = {[age in years x 7] – 5} / 2
This method has only been evaluated in only one published study from a
population of Indian children which showed poor overall accuracy (a mean error
of 5.2 ± 4.3kg) and particularly in children under 12 months and over 7 years of
age(5).
(iii) Argall’s formula: developed in UK. Validation studies included only
a sample of children in UK and studies outside UK yielded poor results.
Weight (kg) = 3 x (completed years of age + 2)
This formula is used in children from 1 – 10 years of age.

22
(iv) Luscombe’s formula: This formula was also developed in a
population of children from UK. This formula has not been validated outside of
the original study population.
Weight (kg) = (3 x completed years of age) + 7
This formula is used in children aged 1 – 10 years.
(v) Shann’s formula:
Weight (kg) = (age in years x 2) + 9
This formula is for children from 1 – 9 years of age.
Weight (kg) = (age in years x 3)
This formula is for children aged >9 years.
The Shann formula has been shown to perform better than other age-based
formulas in Maori and Pacific Island children(13). The analysis in this study was
methodologically incomplete and therefore the conclusions might not be valid.
This formula has not found universal acceptance.
(vi) Leffler’s formula:
Weight (kg) = (age in months + 8) / 2
This formula is used in children <1 year of age.
Weight (kg) = (age in years x 2) + 10
This formula is used in children aged 1 – 10 years of age.
The Leffler formula has been evaluated only in a single study since its
publication in 1997. In this study it was shown to perform no better than the Shann

23
and APLS formulas, demonstrating a significant error in both bias and
precision(13).
(vii) Best Guess (Tinning’s) formula:
Weight (kg) = (age in months + 9) / 2
This formula is used for children ≤12 months of age.
Weight (kg) = (age in years x 2) + 10
This formula is used for children aged 1 – 5 years.
Weight (kg) = age in years x 4
This formula is used for children aged 6 – 14 years.
The “Best Guess” formulas were developed in Australia. The validation
studies published failed to show acceptable accuracy of these formulas(47,48).

24
TABLE 5: VALIDATION STUDIES PERFORMED TO ASSESS THE
ACCURACY OF OTHER AGE BASED FORMULAS
FORMULA
POPULATION
ERROR
TINNING
Australia
Australia
Australia
42% within 10% of actual weight
MPE 8%
<50% within 10% of actual weight
LUSCOMBE
Malawi MPE 17%
SHANN
Pacific Islands 95%CI -8.7kg to 12.3kg
ARGALL
Australia
Australia
37% within 10% of actual weight
37% within 10% of actual weight
TRAUB-JOHNSON
Australia MPE 10%
TRAUB-KICHEN
Australia MPE 12%
NELSON
India Mean Overestimate 2kg
LEFFLER
Pacific Islands 95%CI -7.3kg to 11.3kg
MPE – Mean Percentage Error

25
3. ESTIMATION OF WEIGHT BY THE PARENT/S
The applicability of parental estimates of their child’s weight is dependent on
the parent being present and accessible to healthcare personnel at the time of the
child’s presentation in the ED. The precision of weight is decided by knowing if
the parent is the regular caregiver of the child or not. Usually parents recall the
recently recorded weight, which is assumed to be more accurate than any
estimation. However, reports are conflicting about the ability of parents to
accurately estimate the weight. But, in general, parents can estimate the weight
of their children better than healthcare workers and with sufficient accuracy for
acceptable resuscitation drug dose calculation(4,35,49,50).
4. ESTIMATION OF WEIGHT BY THE HEALTHCARE PROVIDER
The efficiency of Emergency Physician, Professional nurses and supporting
paramedics to estimate the weight of children precisely in emergency situations
remains limited(51-53). Previous literature shows that children who fall within 10%
of their actual body weight is 25 – 50%. This fallacy is lesser in infants compared
to older children(53). Usually the health care provider estimates weight of children
by either one of the following methods. If age of child is known, they use age
based weight estimation formulas (like APLS etc.). If age of the child is not
known, a pure guess based on the three dimensional conformation of the child is
made which is less commonly used and the least accurate method.

26
5. GROWTH CHART METHOD
This method is generally not convenient in an emergency setting and it used
weight for age or weight for length growth charts for estimating weight from
child’s age or measured length. It is relatively a time-consuming method
compared to other methods of weight estimation. Using a growth chart needs
expertise and acquaintance with those charts. Minor differences between various
growth charts exist, however, 50th centiles are almost same and the choice of
growth chart to be used is not critical(54,55)
OTHER METHODS OF WEIGHT ESTIMATION
(i) The hanging leg-weight technique: was developed in 1990 by
Anthony Haftel and his fellow emergency physicians from Los Angeles
Children’s Hospital(56). The authors made a measurement of 100 anaesthetised
children with a spring scale, both their legs suspended in a sling around the heels.
The sling was raised to 450 from horizontal, at which point hanging leg weight
was recorded. This was then compared with the total body weight and found it to
predict body weight precisely, especially in children >10kg body weight.
Weight (kg) = (5.176 x Hanging leg weight in kg) + 3.487
(ii) The infant foot-length technique: is an indigenous technique
developed in India. A group of paediatricians under the leadership of Sandeep
Bavdekar met at KEM Hospital, Mumbai in 2006 and developed this formula to
estimate the weight of infants <2 years of age by measuring the foot-length(60).

27
Weight (kg) = -5.15 + (foot length in cm x 1.35)
The study showed that foot length was compatible with body weight and
can be used in infant resuscitations. The authors then created a table of foot length
(in 1 mm increments from 45mm to 80mm) with the corresponding weight
(0.94kg to 5.67kg) and doses of resuscitation drugs. It was found that the study
had methodological weakness in the analysis part with respect to the accuracy
and precision of the technique, however, the technique appears to be promising.
No furher studies were done in India or elsewhere to support the technique.
(iii) Carroll technique: described by Carroll and colleagues in 2001(61), to
predict weight from the coalition of an age based weight estimation formula; shoe
size and mid arm circumference. This formula is too difficult to use in emergency
department.

28
AIMS AND OBJECTIVES
1. To determine the degree to which the length based weight estimation tape
(Broselow tape) predicts measured weight in children of Madurai.
2. To validate the length based weight estimation tape (Broselow tape) for
use in our clinical setting.

29
MATERIALS AND METHODS
The design was a prospective observational hospital based study, inclusive
of children aged less than 12 years attending the Outpatient department, Institute
of Child Health & Research Centre (ICH&RC), Government Rajaji Hospital,
Madurai. The study was conducted over a period of one year (April 2016 – March
2017). This tape measures between 46 cm – 143 cm and children with length of
this range only were included apart from other exclusion criteria. This
measurement has got an added advantage that the growth spurt which occurs
during adolescent age group will be nullified, avoiding bias.
SAMPLE SZE ESTIMATION
N=size per group; d=; δ0= the real mean difference between two group; S2=
Polled standard deviation of both comparison groups. ἀ= precision (0.05) and =
90%.
To detect a 5% difference between the Broselow-predicted weight and the
Actual weight a minimum sample size of 204 children was required in each
subgroup to produce a power of >0.9, with a minimum aggregate of 408 children.

30
Exclusion criteria of the study were, children who
require emergency resuscitation
are severely dehydrated
have joint contractures
Institutional ethical committee approval was obtained.
After getting an informed parental consent, data were collected which
included demographic information such as gender, age in years. The Broselow
tape weights were determined, according to the tape directions. Child was made
to lie in supine position with head kept at neutral position with no pillow in place.
One end of the tape mentioned “MEASURE FROM THIS END” which was kept
at the vertex and then the tape was stretched to the child’s heel by straightening
the hip and knee joints while the ankle was flexed at 90°. The heel markings were
made on the tape and child’s weight was noted from the tape at that point. Height
or Length is not reported by the Broselow tape and is not a variable in our study.
Then the child was weighed using a child weighing scale or baby weighing scale.
Child was either undressed or minimally dressed. These weighing scales were
calibrated daily.
Performance of Broselow tape was compared with the actual weight ie.,
reference weight in order to validate the tape. Other factors considered were the
difference in tape predicted weight and reference weight which is considered as
a measure of estimation bias, the standard deviation of the difference in weight

31
PICTURE 1: WEIGHING MACHINE USED IN OUR STUDY
32
which is considered as a measure of estimation of precision, measure of tape
accuracy.
STATISTICAL ANALYSIS
The data collected were entered in Microsoft excel sheet 2010. Results
were analyzed using the SPSS version 20 (IBM corporation, New York, U.S.A).
Reporting of the data was done using mean with standard deviation and 95%
confidence interval for parametric and interval data; median with interquartile
range for ordinal and nonparametric interval data.
Agreement between the weight predicted by Broselow tape and the
reference weight was determined by Spearman correlation analysis.
The difference between estimated and measured weight was calculated
using, difference (kg) = predicted weight – measured weight. These difference
were considered in Bland-Altman graphs, which uses a reformed technique to
plot the difference against the measured weight, rather than the mean of the
estimated and measured weights. Bland-Altman technique is a standardised
analysis used to compare two measurement or analysis methodologies to provide
a measure of bias and precision. With this technique, accuracy or bias is
determined from the mean of the difference between the two values, while
precision is determined from the standard deviation of those differences. This was
used in literature that have validated Broselow tape previously.
The percentage difference (MPE) between weights predicted by the
Broselow tape and the actual weight was calculated using

33
Error % = 100 X [predicted weight – reference weight] / reference weight
These percentage errors were compared and analysed using the t-test for
dependent samples, both for the entire sample as well as the different genders,
weight categories.
The percentage error values of each of the measurement techniques were
categorised:
Within 5% of actual weight.
Within 5 to 10%.
10 to 15%.
15 to 20%.
>20% error.
P value of <0.05 was considered statistically significant.

34
PICTURE 2: MEASURING WEIGHT BY BROSELOW TAPE


36
OBSERVATION AND RESULTS
During the study period, 1099 children were included in our study. 211
children were grouped under 10kg, 543 children were included in 10 – 20kg
group, 250 children in 20 – 30kg group and 95 children in >30kg group as shown
in table 6.
TABLE 6: POPULATION CHARACTERISTICS – NUMBER OF CASES
GROUP NUMBER OF CASES (N)
<10kg 211 (19.2%)
10 – 20kg 543 (49.4%)
20 – 30kg 250 (22.8%)
>30kg 95 (8.6%)
TOTAL 1099 (100%)
The study enrolled 748 (68.1%) male children and 351 (31.9%) female
children. The overall mean ± standard deviation for age was 4.6 ± 3.1 years
(median age 4.0 years). The mean ± standard deviation for measured weight
was 17.5 ± 8.3kg (median 15kg). The mean ± standard deviation for
Broselow tape weight was 19.2 ± 9.8kg. Demographic characteristics
are summarised in table 7.

37
TABLE 7: DEMOGRAPHIC CHARACTERISTICS
WEIGHT GROUPS
<10kg
10 – 20kg
20 – 30kg
>30kg
TOTAL
Number
(N)
211
543
250
95
1099
Age (years)
mean ± SD
1.0 ± 0.5
3.65 ± 1.55
7.6 ± 1.59
10.29 ± 1.3
4.6 ± 3.1
Male 141
(66.8%)
286
(71.1%)
167
(66.8%)
54
(56.8%)
768
(68.1%)
Female 70
(33.2%)
157
(28.9%)
83
(33.2%)
41
(43.2%)
351
(31.9%)
Actual
weight (kg)
Mean ± SD
7.7 ± 1.85
14.7 ± 2.9
25.8 ± 3.0
34.0 ± 3.1
17.5 ± 8.3
Broselow
weight (kg)
mean ± SD
8.6 ± 2.15
15.4 ± 3.7
28.8 ± 5.1
38.3 ± 3.5
19.2 ± 9.8

38
FIGURE SHOWING DISTRIBUTION OF CASES
0
100
200
300
400
500
600
<10 Kg 10 - 20 Kg 20 - 30 Kg >30 Kg
NUMBER OF CASES
NUMBER OF CASES

39
The correlation between actual weight and tape weight was excellent, with
the r2 values for the Broselow tape being 0.97. Correlation was generally best in
lesser weight groups ie., infants and younger children when compared with older
children. Table 8 shows the correlation between actual measured weight and the
Broselow tape weight. Figure 3-7 shows correlation between actual and broselow
weight.
TABLE 8
CORRELATION BETWEEN ACTUAL AND BROSELOW WEIGHT
Measured Weight Groups
Overall <10kg 10 – 20kg 20 – 30kg >30kg
Correlation
coefficient
0.97 0.86 0.89 0.78 0.44
Significance
level
p<0.001 p<0.001 p<0.001 p<0.001 p<0.001

40
FIGURE 3: CORRELATION BETWEEN ACTUAL AND BROSELOW
WEIGHT (OVERALL STUDY)
FIGURE 3: CORRELATION BETWEEN ACTUAL AND BROSELOW WEIGHT
Bro
selow
weigh
t

41
FIGURE 4: CORRELATION BETWEEN ACTUAL AND BROSELOW
WEIGHT (<10Kg)
FIGURE 4: CORRELATION BETWEEN ACTUAL AND BROSELOW
WEIGHT (<10Kg)
Bro
selow
weigh
t

42
FIGURE 5: CORRELATION BETWEEN ACTUAL AND BROSELOW
WEIGHT (10-20Kg)
FIGURE 5: CORRELATION BETWEEN ACTUAL AND BROSELOW WEIGHT
(10-20Kg)

43
FIGURE 6: CORRELATION BETWEEN ACTUAL AND BROSELOW
WEIGHT (20-30Kg)
FIGURE 6: CORRELATION BETWEEN ACTUAL AND BROSELOW WEIGHT
(20-30Kg)
Bro
selo
w w
eigh
t

44
FIGURE 7: CORRELATION BETWEEN ACTUAL AND BROSELOW
WEIGHT (>30Kg)
FIGURE 7: CORRELATION BETWEEN ACTUAL AND BROSELOW WEIGHT
(>30Kg)
Bro
selow
weigh
t

45
BLAND-ALTMAN ANALYSIS
The overall bias, as demonstrated by Bland-Altman methodology was an
underestimation of 1.6 kg for the Broselow tape. Precision of our study with 95%
confidence limits of the Bland-Altman methodology was -4.7kg to 3.5kg. Figure
8-12 shows Bland-Altman plots for weight estimation technique of the entire
population and of the sub-categories.
FIGURE 8: BLAND-ALTMAN PLOT SHOWING BIAS AND LIMITS OF
AGREEMENT FOR THE ENTIRE STUDY POPULATION
-4.7 -4.7
3.46 3.46
-1.61 -1.61
-20
-15
-10
-5
0
5
10
15
0 10 20 30 40 50 60
BR
OSE
LOW
WEI
GH
T-A
CTU
AL
WEI
GH
T (K
G)
Bland altman analysis LOA UOA BIAS

46
FIGURE 9: Bland-Altman plot illustrating the bias and limits of agreement
for the cohort of patients with a body weight of ≤10kg.
-0.92 -0.92
0.76 0.76
-2.6 -2.6
-3.5
-3
-2.5
-2
-1.5
-1
-0.5
0
0.5
1
1.5
2
0 2 4 6 8 10 12 14 16
BR
OSE
LOW
WEI
GH
T-A
CTU
AL
WEI
GH
T (K
G)
Linear (UPPER LIMIT) Linear (LOWER LIMIT)

47
FIGURE 10: Bland-Altman plot illustrating the bias and limits of agreement
for the cohort of patients with a body weight of 10-20kg.
-0.75 -0.75
2.55 2.55
-4.03 -4.03
-14
-12
-10
-8
-6
-4
-2
0
2
4
0 5 10 15 20 25
Bro
selo
w w
eigh
t-A
ctu
al w
eigh
t (k
g)
Linear (BIAS) Linear (UPPER LIMIT) Linear (LOWER LIMIT)

48
FIGURE 11: Bland-Altman plot illustrating the bias and limits of agreement
for the cohort of patients with a body weight of 20-30kg.
-3.05 -3.05
2.85 2.85
-8.95 -8.95
-15
-10
-5
0
5
10
0 5 10 15 20 25 30 35
BR
OSE
LOW
WEI
GH
T -
AC
TUA
L W
EIG
HT
(KG
)
AXIS TITLE
Series1 Linear (BIAS) Linear (UPPER LIMIT) Linear (LOWER LIMIT)

49
FIGURE 12: Bland-Altman plot illustrating the bias and limits of agreement
for the cohort of patients with a body weight of >30kg.
-4.27 -4.27
4.2 4.2
-12.74 -12.74
-15
-10
-5
0
5
10
15
0 10 20 30 40 50 60
Series1 Linear (BIAS) Linear (UPPER LIMIT) Linear (LOWERLIMIT)

50
The other major indicator of bias, the mean percentage error (MPE),
showed an underestimation of 8.5%. And the precision for MPE, reflected by
Standard deviation was 11.49. The percentage of cases falling within each
percentage error category is shown in table 9.
TABLE 9: CATEGORISED PERCENTAGE ERROR DATA FOR
ENTIRE STUDY POPULATION
Percentage Error (%) Number of Cases (N) Percentage %
>-15 313 28.5
-10 to -15 200 18.2
-5 to -10 214 19.5
0 to -5 53 4.8
0 to 5 160 14.6
5 to 10 97 8.8
10 to 15 41 3.7
>15 21 1.9
TOTAL 1099 100

51
FIGURE 13: CATEGORISED PERCENTAGE ERROR DATA FOR
ENTIRE STUDY POPULATION
0
50
100
150
200
250
300
350
>-15 -10 to -15 -5 to -10 0 to -5 0 to 5 5 to 10 10 to 15 >15
NUMBER OF CASES
NUMBER OF CASES

52
TABLE 10: CATEGORISED PERCENTAGE ERROR DATA FOR <10kg
CHILDREN
Percentage Error (%) Number of Cases (N) Percentage %
>-15 82 38.9
-10 to -15 46 21.8
-5 to -10 30 14.2
0 to -5 8 3.8
0 to 5 30 14.2
5 to 10 6 2.8
10 to 15 8 3.8
>15 1 0.5
TOTAL 211 100

53
FIGURE 14: CATEGORISED PERCENTAGE ERROR DATA FOR <10kg
CHILDREN
NUMBER OFCASES
0
10
20
30
40
50
60
70
80
90
>-15 -10 TO -15 -5 TO -10 0 TO -5 0 TO 5 5 TO 10 10 TO 15 >15
NUMBER OF CASES
NUMBER OF CASES

54
TABLE 11: CATEGORISED PERCENTAGE ERROR DATA FOR
10 -20kg CHILDREN
Percentage Error (%) Number of Cases (N) Percentage %
>-15 80 14.7
-10 to -15 78 14.4
-5 to -10 140 25.8
0 to -5 28 5.2
0 to 5 99 18.2
5 to 10 83 15.3
10 to 15 22 4.1
>15 13 2.4
TOTAL 543 100

55
FIGURE 15: CATEGORISED PERCENTAGE ERROR DATA FOR
10 -20kg CHILDREN
0 20 40 60 80 100 120 140 160
>-15
-10 to -15
-5 to -10
0 to -5
0 to 5
5 to 10
10 to 15
>15
NUMBER OF CASES
NUMBER OF CASES

56
TABLE 12: CATEGORISED PERCENTAGE ERROR DATA FOR
20 -30kg CHILDREN
Percentage Error (%) Number of Cases (N) Percentage %
>-15 99 39.6
-10 to -15 53 21.2
-5 to -10 35 14
0 to -5 17 6.8
0 to 5
28 11.2
5 to 10
7 2.8
10 to 15
9 3.6
>15
2 0.8
TOTAL 250 100

57
FIGURE 16: CATEGORISED PERCENTAGE ERROR DATA FOR
20 -30kg CHILDREN
>-1540%
-10 to -1521%
-5 to -1014%
0 to -57%
0 to 511%
5 to 103%
10 to 153%
>151%
NUMBER OF CASES
>-15 -10 to -15 -5 to -10 0 to -5 0 to 5 5 to 10 10 to 15 >15

58
TABLE 13: CATEGORISED PERCENTAGE ERROR DATA FOR >30kg
CHILDREN
Percentage Error (%) Number of Cases (N) Percentage %
>-15 52 54.7
-10 to -15 23 24.2
-5 to -10 9 9.5
0 to -5 0 0.0
0 to 5
3 3.2
5 to 10
1 1.1
10 to 15
2 2.1
>15
5 5.3
TOTAL 95 100

59
FIGURE 17: CATEGORISED PERCENTAGE ERROR DATA FOR >30kg
CHILDREN
0 10 20 30 40 50 60
>-15
-10 to -15
-5 to -10
0 to -5
0 to 5
5 to 10
10 to 15
>15
NUMBER OF CASES
NUMBER OF CASES

60
The above analysis shows the performance of Broselow tape in estimating
weight of the children, in which only 47.7% of children have predicted weight
within 10% of actual weight. 69.6% cases are within 15% of actual weight. From
our analysis, the prediction accuracy of the Broselow tape in estimating weight
of children was not significant in any of the groups (p<0.0001). In this study
population, Broselow tape did not perform well in estimating weight.

61
DISCUSSION
Safety of patients and reducing the medical errors, both, are contemporary
issues in emergency settings(58). In our settings, we have found that ED has been
the most error prone place with drug dosage error as the principal cause and
paediatric age group as the most common patients(59).
In an emergency resuscitation situation, management of critically ill
children requires accurate weight to determine drug doses. Hence we need a
reliable method of estimating weight in that particular emergent setting. The end
point in estimation of weight, therefore, should be more than just the weight itself,
which means during management of sick children, the resuscitation team must
concentrate on medical management of patient and should not get distracted by
other issues such as determination of drug doses and equipment sizes which can
be made easy by incorporating evidence based resuscitation aids such as looking
them on a chart or computer that does not require active or non-automatic
thinking or memory. In view of this simple reason, a complete system is ideal for
use during the paediatric resuscitation so that one or more devices can be used
automatically to predict weight, to guide on equipment size selection and to
provide drug dosaging, dilution and delivery information. Other issues that are
important in the selection or development of a resuscitation aid include cost,
availability, ease of use, disposability and transportability.
There are 2 components in a resuscitation aid. First one being the weight
estimation system, which are best embodied in a length-based tape system. Even

62
these tape based systems are vulnerable to errors because of incorrect
measurement or inaccurate weight estimation. The second component is to
provide essential information to the resuscitation team on drug doses and
equipment sizes which should not be trusted to memory. It may come from a tape
or a chart or a booklet that should be specifically designed to provide relevant
information to the entire team and not just the doctor to minimise the possibility
of errors during a time of high cognitive load and emotional stress. This aspect of
the resuscitation aid has not been addressed in any way in this study.
Currently Broselow tape is used during resuscitation aid and this tape have
incorporated both the components. The discussion of the concept of resuscitation
aids is important because the design of a weight estimation system should be
determined largely by its ability to improve patient care and not just provide an
estimate of weight. Our study is a validation study and has just taken weight
estimation part alone and has not touched regarding accuracy of drug dosaging
and equipment sizes.
Previous studies have used target estimation error of within 10% as
acceptable for drug dose calculation and this error percentage has been followed
by most in weight estimation studies(60). Few studies have been done using a
weight-estimation error of within 20% as acceptable(61). Our study also have used
10% error as acceptable for drug dose calculation. The reason why an error
percentage of 10 has been allowed was other latent, unavoidable and undetectable
errors may occur. It is outrageous to expect weight estimation to be more precise

63
than the drug dose error that is already possible because of drug concentration
variability. Errors related to the rounding-off of body weight also contributes to
a remarkable degree of variability that cannot easily be determined.
In our study, Broselow tape estimated weight of 47.7% of the study
population within 10% of a child’s measured weight. This statistics was found to
be lower when compared to other studies. The outcome shows that more than half
of the study population had a weight estimate with an error exceeding 10%. In a
study by Saily Britnell et al, they have found that Broselow tape included 73.4%
of children within 10% of a child’s measured weight. In a study by Michael David
John Wells et al, the percentage of children within 10% of measured weight was
around 64%. From this comparison, it is evident that Broselow tape did not
perform well in our study population. The number of children in this study with
a weight estimation of ≤10% error was lower and the number of our children with
a weight estimation error of >15% was also greater. Similar negative findings
were shown in studies done by Ramarajan N et al, Kun W et al, Theron l et al.
In our study, Broselow tape underestimated weight by 1.6 kg, where as in
a study by Michael David John Wells et al, Broselow tape underestimated weight
by 0.9 kg. In a study by Farhad Asskaryar et al, they found that Broselow tape
overestimates weights with a 5–15 % mean percentage difference in the Indian
children and misclassifies them into a wrong color zone on the Broselow tape,
usually to a higher color zone.

64
The variations may be due to varied number of reasons. In Indian children,
there are several possible factors for this trend. Level of nourishment, exclusive
breast feeding, low birth weight, socio-economic factors are the possible
contributory factors to highlight current data and their relevance to lag in ideal
height for weight and weight for age in the indian population.
In a recent survey in southern India, where our study was conducted, one
study has determined that the prevalence of undernutrition (≤80 percentage of
standard weight for age) was 66.5 %. Such prevalence tends to increase with age
and there is a stark difference between male (76.9 %) and female (56.3 %)
genders. The prevalence of grade 1 malnourishment was 46.2 %. The prevalence
decreased as the socioeconomic status improved and the duration of EBF had an
influence on the nutritional status of the growing child(62).
The coefficient correlation of the agreement between measured weight and
weight predicted by Broselow tape for entire study population and for each
groups are comparable with other studies. Our study had a correlation coefficient
of 0.97. The study by Michael David John Wells et al had a correlation coefficient
of 0.946 and in the study by Farhad Asskaryar et al the correlation coefficient was
found to be 0.954 for boys and 0.9 for girls.
65
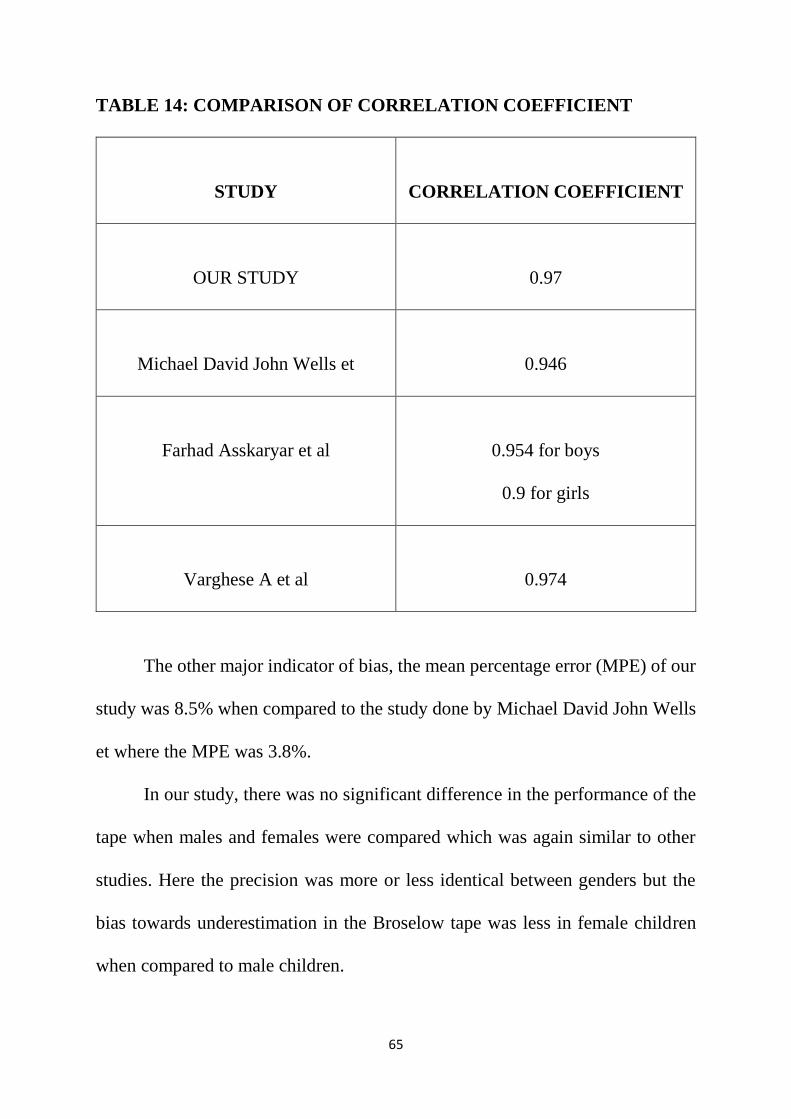
TABLE 14: COMPARISON OF CORRELATION COEFFICIENT
STUDY
CORRELATION COEFFICIENT
OUR STUDY
0.97
Michael David John Wells et
0.946
Farhad Asskaryar et al
0.954 for boys
0.9 for girls
Varghese A et al
0.974
The other major indicator of bias, the mean percentage error (MPE) of our
study was 8.5% when compared to the study done by Michael David John Wells
et where the MPE was 3.8%.
In our study, there was no significant difference in the performance of the
tape when males and females were compared which was again similar to other
studies. Here the precision was more or less identical between genders but the
bias towards underestimation in the Broselow tape was less in female children
when compared to male children.

66
The reasons why the tape has not performed better in our population may
possibly be the use of NCHS 2000 weight for length charts by the Broselow tape
and the positioning of the child in the tape because the divisions in Broselow tape
occupy the area below the 50th centile which could have made the tape to
underestimate weight in children.

67
CONCLUSION
The correlation with actual weight was better overall and in each weight
category.
Both measures of the tape bias (Mean Percentage Error and Bland-Altman
analysis) were significantly higher in the study population.
The measure of tape precision (SD of Mean Percentage Error) was
significantly worse in the study population.
Broselow tape predicted weight within 10% of actual weight only in 47.7%
of the entire study population.
The results was similar in each weight category. In 10-20 kg weight
category, tape predicted weight within 10% ofn actual weight in over 60%
of children but it was not statistically significant to prove that the tape was
useful in estimating weight in that category.
Broselow tape often underestimates weight in our study population.
Statistical analysis shows that the tape has underestimated weight by 1.6
kg.
The Mean percentage error was 8.5%, which is high. SD of MPE was
11.49.
Broselow tape did not perform well in our study population.
The implication of this study is that Broselow tape is relatively inaccurate
and that with increasing age and weight they become more inaccurate.

68
Further work is required to revise the methods by which weight estimation
is performed;
Additional research is urgently needed to establish a pharmacokinetic
“target weight” which should be used for drug dose calculation, and
therefore weight estimation strategies

69
STRENGTH OF THIS STUDY
This is a prospective study to validate an existing instrument (tape).
The study population was exclusively used for validation of the instrument
(tape) and did not contribute to the development of new instrument.
This study was adequately powered to allow for accurate equivalence
within 4 subgroups.
The actual tape was used to obtain measurement rather than a tape measure.
Children were measured in supine position to obtain a true length rather
than height.
Bland-Altman plot and Mean Percentage Error were used in analysis as a
measurement of bias and precision.

70
LIMITATIONS
Our study is a single centre prospective study.
Although our study sample is diverse and representative of all geographic
regions and socioeconomic backgrounds in the Indian population, it is
collected at one tertiary clinic.
There is no comparable NCHS data pool available in India that would allow a
precise estimate of height and weight for each color zone.
In this study, we have considered only gender difference, and other categories
such as social class, income, parent education level, differences in ethnicity, and
regional areas are not considered in the analysis. We could not with certainty verify the age of the children in our data
sample and relied on the information obtained from the parents or guardian. Children requiring emergency treatment were excluded and this may have
introduced some bias in two respects: children with critical illness or injury
may be different to ambulant paediatric patients in terms of their body
composition; and the usual physical, psychological and cognitive stresses
experienced by healthcare personnel during a paediatric resuscitation were
not present. Our study is a validation study and did not include other features of the
tape such as testing the dosages and equipment sizes whether or not
appropriate for the study population.

71
RECOMMENDATIONS
The Broselow tape needs to be evaluated in a number of different
populations to establish its accuracy across a range of socio-economic
strata and ethnic and racial characteristics.

72
HEIGHT OF INDIAN CHILDREN (BOYS AND GIRLS AGED 0-18 YRS)

73
WEIGHT OF INDIAN CHILDREN (BOYS AND GIRLS AGED 0-18
YEARS)

74
BIBLIOGRAPHY
1. Kaushal R, Bates DW, Landrigan C, 2001. Medication errors and adverse
drug events in pediatric inpatients. JAMA, 285:2114-2120.
2. Shah AN, Frush K, Luo X, Wears RL. Effect of an intervention
standardization system on pediatric dosing and equipment size
determination: a crossover trial involving simulated events. Arch Pediatr
Adolesc Med 2003; 157: 934.
3. Argall JAW, Wright N, Mackway-Jones K, Jackson R, 2003. A
comparison of two commonly used methods of weight estimation. Arch
Dis Child, 88:789–790.
4. Krieser D, Nguyen K, Kerr D, Damien J, Clooney M, Anne-Maree K,
2007. Parental weight estimation of their child's weight is more accurate
than other weight estimation methods for determining children's weight in
an emergency department? Emerg Med J, 24(11):756-759.
5. Varghese A, Vasudevan VK, Lewin S, Indumathi CK, Dinakar C, Rao SD,
2006. Do the Length-based (Broselow) Tape, APLS, Argall and Nelson’s
formulae accurately estimate weight of Indian children? Indian Pediatr,
43(17):889-894.
6. Black K, Barnett P, Wolfe R, Young S, 2002. Are methods used to estimate
weight in children accurate? Emerg Med, 14:160–165.

75
7. Lubitz DS, Seidel JS, Chameides L, Luten RC, Zaritsky AL, Campbell FW,
1988. A rapid method for estimating weight and resuscitation drug doses
from weight in the pediatric age group. Ann Emerg Med, 17(6):576-81.
8. Mackway-Jones K, Molyneux E, Phillips B, Wieteska S, 2001. Advanced
pediatric life support: The practical approach. 3rd Ed. London: BMJ
Publishing Group, p: 7.
9. Vilke GM, Marino A, Fisher R, Chan TC, 2001. Estimation of paediatric
weight by EMT-PS. J Emerg Med, 21:1125–1128.
10. Tinning KK, Acworth JP, 2006. Make your best guess: an updated method
for paediatric weight estimation. Proceedings of Annual Scientific
Meeting. Australasian College for Emergency Medicine.
11. DuBois D, Baldwin S, King WD, 2007. Accuracy of weight estimation
methods for children. Pediatr Emerg Care, 23(4):227-230.
12. Luscombe M, Owens B, 2007. Weight estimation in resuscitation: is the
current formula still valid? Arch Dis Child, 92(5): 412–415.
13. Theron L, Adams A, Jansen K, Robinson E, 2005. Emergency weight
estimation in Pacific Island and Maori children who are large-for-age.
Emerg Med Australas, 17:238-243.
14. Nguyen K, Krieser D, Kerr D, Jolley D, Clooney M, Kelly AM, 2007.
Failed validation of the Argall weight formula for estimating children's
weight in an Australian ED. Acad Emerg Med, 14(5):486-488.

76
15. Hofer CK, Ganter M, Tucci M, Klaghofer R, Zollinger A. How reliable is
length-based determination of body weight and tracheal tube size in
pediatric age group? The Broselow tape reconsidered. Br J Anaesth 2002;
88: 283- 285.
16. Luten RC, Wears RL, Broselow J, Zaritsky A, Barnett TM, Lere T, et al.
Length-based endo-tracheal tube and emergency equipment in pediatrics.
Ann Emerg Med 1992; 21:900-904.
17. Bates DW, Cullen D, Laird N, et al. Incidence of adverse drug events and
potential adverse drug events: implications for prevention. JAMA.
1995;274:29-34.
18. Nelson textbook of pediatrics; 20th edition, kleigman, Stanton, St Geme,
Schor.
19. Broselow J, inventor, Luten R, inventor Vital Signs, Inc, assignee.
Broselow Pediatric Emergency Tape. US patents 4 713 888, December 22,
1987; 4 823 469, April 25, 1989; 5 010 656, April 30, 1991.
20. Ferner, R. E. (2012). Medication errors. British Journal of Clinical
Pharmacology, 73(6), 912-916. doi:10.1111/j.1365-2125.2012.04236.
21. Park, J., Kwak, Y. H., Kim do, K., Jung, J. Y., Lee, J. H., Jang, H. Y., . . .
Hong, K. J. (2012). A new age-based formula for estimating weight of
Korean children. Resuscitation, 83(9), 1129-1134.
doi:10.1016/j.resuscitation.2012.01.023.

77
22. Cattermole, G. N., Leung, M. P., So, H. K., Mak, P. S., Graham, C. A., &
Rainer, T. H. (2011). Age-based formulae to estimate children's weight in
the emergency department. Emergency Medicine Journal, 28(5), 390-396.
23. Lulic, I., & Kovic, I. (2010). Comparing methods for weight estimation of
children: A preliminary study. Resuscitation, 81(2), S77.
doi:10.1016/j.resuscitation.2010.09.315.
24. Sandell, J. M., & Charman, S. C. (2009). Can age-based estimates of
weight be safely used when resuscitating children? Emergency Medicine
Journal, 26(1), 43-47. doi:10.1136/emj.2008.061119.
25. Geduld, H., Hodkinson, P. W., & Wallis, L. A. (2011). Validation of
weight estimation by age and length based methods in the Western Cape,
South Africa population. Emergency Medicine Journal, 28(10), 856-860.
doi:10.1136/emj.2010.098640.
26. Abdel-Rahman, S. M., Ahlers, N., Holmes, A., Wright, K., Harris, A.,
Weigel, J., . . . Kearns, G. L. (2013a). Validation of an improved pediatric
weight estimation strategy. The Journal of Pediatric Pharmacology and
Therapeutics, 18(2), 112-121. doi:10.5863/1551-6776-18.2.112
27. Advanced Life Support Group. Advanced paediatric life support: the
practical approach. 4th edn. London: BMJ Publishing Group, 2005.
28. Hamill PV, Drizd TA, Johnson CL, et al. NCHS growth curves for children
birth-18 years: United States. Vital Health Stat 11 1977;165: 174.

78
29. Carrol W, Alexander J. Towards a better weight estimation in the seriously
ill child - a comparison of methods. Arch Dis Child 2001;84(Suppl I):A12.
30. Weech A. Signposts on the highway of growth. AJDC 1956;88:452-457.
31. Traub SL, CE J. Comparison of methods of estimating creatinine clearance
in children. Am J Hosp Pharm 1980;37:195-201.
32. Traub SL, Kitchen L. Estimating ideal body mass in children. Am J Hosp
Pharm 1983;40:107-110.
33. Garland JS, Kishaba RG, Nelson DB, Losek JD, Sobocinski KA. A rapid
and accurate method of estimating body weight. Am J Emerg Med
1986;4:390-393.
34. Oakley P. Inaccuracy and delay in decision making in paediatric
resuscitation, and a proposed reference chart to reduce error. BMJ
1988;297:817-819.
35. Leffler S, Hayes M. Analysis of parental estimates of children's weights in
the ED. Ann Emerg Med 1997;30:167-170.
36. Hazell W. Emergency medicine at your fingertips. 2nd ed. New Zealand:
Medimedia (NZ); 2000; 132
37. Lo C, Chan K, Chik S. A tape measure to aid paediatric resuscitation -
modification for local use. HKJEM 1995;2(1):51-57.
38. Molyneux E, Brogan R, Mitchell G, Gove S. Children's weights: guess or
measure by tape. Lancet 1999;354:1616.
39. Kloeck W. The Kloeck tape. Personal communication 2008.

79
40. Sandell J. The Sandell tape. 2004 [cited 2008 11 November]; Available
from: www.sandelltape.com.
41. Brierly J. The paediatric resuscitation emergency management system.
2005 [cited 2008 11 November]; Available from: www.premsystem.co.uk.
42. Nieman CT, Manacci CF, Super DM, Mancuso C, Fallon WF. Use of the
Broselow tape may result in the underresuscitation of children. Acad
Emerg Med 2006;13:1011–1019.
43. Ramarajan N, Krishnamoorthi R, Strehlow M, Quinn J, Mahadevan SV.
Internationalizing the Broselow tape: how reliable is weight estimation in
Indian children. Acad Emerg Med 2008;15:431–436.
44. Kun W, Cheng K, Yuen M, Tung W. How good is the Broselow tape
measurement for estimation of body weights in paediatric patients for
application in Hong Kong? HK J Paediatr 2000;5(1):25-30.
45. Dieckmann RA. The dilemma of paediatric drug dosing and equipment
sizing in the era of patient safety. Emerg Med Australas 2007;19:490-493.
46. Deboer S, Seaver M, Broselow J. Color coding to reduce errors. Am J Nurs
2005;105(8):68-71.
47. Thompson MT, Reading MJ, Acworth JP. Best Guess method for agebased
weight estimation in paediatric emergencies validation and comparison
with current methods. Emerg Med Australas 2007;19:535-542.

80
48. Kelly A-M, Kerr D, Clooney M, Krieser D, Nguyen K. External validation
of the Best Guess formulae for paediatric weight estimation. Emerg Med
Australas 2007;19:543-546.
49. Banach A, Wade TJ, Cairney J, Hay JA, Faught BE, O'Leary DD.
Comparison of anthropometry and parent-reported height and weight
among nine year olds. Can J Public Health 2007;98(4):251-253.
50. Goldman RD, Buskin S, Augarten A. Parental estimates of their child's
weight: accurate for resuscitation drug doses. Pediatr Emerg Care
1999;15(1):19-21.
51. Dearlove CB, Dearlove O. Visual estimation of children's weights.
Anaesthesia 1999;54(12):1228-1229.
52. DuBois D, Baldwin S, King WD. Accuracy of weight estimation methods
for children. Pediatr Emerg Care 2007;23(4):227-230.
53. Menon S, Kelly AM. How accurate is weight estimation in the emergency
department? Emerg Med Australas 2005;17(2):113-116.
54. Nash A, Corey M, Sherwood K, Secker D, Joanne Saab, OConnor DL
Growth assessment in infants and toddlers using three different reference
charts. J Pediatr Gastroenterol Nutr 2005;40:283-288.
55. Nash A, Secker D, Corey M, Dunn M, O’Connor DL. Field testing of the
2006 World Health Organisation growth charts from birth to 2 years -
assessment of hospital undernutrition and overnutrition rates and the
usefulness of BMI. J Parent Ent Nutr 2008;32(2):145-153.

81
56. Haftel AJ, Khan N, Lev R, Schonfeld N. Hanging leg weight -- a rapid
technique for estimating total body weight in pediatric resuscitation. Ann
Emerg Med 1990;19(5):523-526.
57. Bavdekar SB, Sathe S, Jani P. Prediction of weight of Indian children aged
up to two years based on foot-length: implications for emergency areas.
Indian Pediatr 2006;43(2):125-130.
58. Kohn L, Corrigan J, Donaldson M. To err is human: building a safer health
system. IOM, editor. Washington, DC: National Academy Press; 2001;
59. Cohen AL, Budnitz DS, Weidenbach KN, et al. National surveillance of
emergency department visits for outpatient adverse drug events in children
and adolescents. J Pediatr 2008;152:416-421.
60. Nieman CT, Manacci CF, Super DM, Mancuso C, Fallon WF. Use of the
Broselow tape may result in the underresuscitation of children. Acad
Emerg Med 2006;13:1011–1019.
61. Thompson MT, Reading MJ, Acworth JP. Best Guess method for agebased
weight estimation in paediatric emergencies validation and comparison
with current methods. Emerg Med Australas 2007;19:535-542.
62. NFHS-3 2005–2006. http://www.rchiips.org/nfhs. Accessed April 05,
2015.

PROFORMA
NAME :
AGE :
SEX :
ADDRESS :
OP/IP NO :
ANTHROPOMETRY
WEIGHT (ACTUAL) :
WEIGHT (BROSELOW) :
HEIGHT :
MAC :

ABBREVIATIONS
APLS - Advanced Paediatric Life Support
ED - Emergency Department
MPE - Mean percentage Error
NCHS - National Center for Health Statistics
OPD - Out Patient Department
PAWPER - Paediatric Advanced Weight Prediction in the
Emergency Room
PREM - Paediatric Resuscitation Emergency Management
SD - Standard Deviation
SPSS - Statistical Package for the Social Sciences

Name Age M-1 F-2 Actual Wt Group Tape Wt Group krishnan 4 1 12 2 12 2arun 5 1 15 2 14 2shasthika 1 2 7 1 8 1kiruba 3 1 11 2 10 1kirthi 7 2 17 2 16 2kannan 10 1 28 3 30 3niranjan 5.5 1 16 2 17 2mani 0.5 1 5 1 6 1manikanda 9 1 25 3 24 3jakan 12 1 30 3 32 4janani 10 2 32 4 36 4sowmiya 8 2 29 3 32 4sanjana 2 2 10 1 12 2saran 2.5 1 11 2 12 2aaradhna 2 2 9 1 10 1kamal 1 1 7.5 1 8 1ajish 1.5 1 8.5 1 8 1lalitha 7 2 20 2 20 2kiran 6 1 23 3 22 3suresh 5 1 20 2 20 2vinoth 5 1 21 3 22 3karthikeyan 5 1 27 3 30 3mahesh 9 1 30 3 34 4madhan 8 1 28 3 32 4viji 10 2 35 4 38 4kesavan 11 1 39 4 38 4murali 6 1 23 3 22 3pushkar 4.5 1 20 2 22 3pooja 8 2 30 3 36 4kirthi 8.8 2 28 3 34 4keerthana 9 2 31 4 36 4nandhini 9 2 33 4 38 4ilakia 11 2 32 4 38 4kavitha 2 2 11 2 12 2vanitha 1.5 2 9 1 10 1rajkamal 3.5 1 14 2 14 2rajesh 6 1 20 2 20 2arul 8 1 30 3 26 3paandi 7 1 28 3 30 3soundar 4 1 15 2 14 2vijay 3.5 1 13 2 12 2anurega 4 2 14 2 14 2aravind 2.5 1 11 2 12 2sumathi 6 2 18 2 16 2karuppu 8 1 25 3 24 3muthu 4 1 13 2 12 2b/o rani 0.1 2 4 1 4 1rahul 5 1 17 2 16 2sudharsan 4.7 1 15 2 14 2

gokul 6.2 1 20 2 18 2vasanth 6.7 1 21 3 20 2thomas 7 1 24 3 26 3nilofer 8 2 27 3 28 3asmath 7.5 1 25 3 26 3asmaas 7 1 26 3 30 3amul 3 1 13 2 12 2raja 7 1 20 2 20 2rajashri 9 1 27 3 30 3vasanthi 10 2 31 4 36 4kalpana 11 2 33 4 38 4suganya 6 2 20 2 18 2anitha 3 2 11 2 12 2kannan 2 1 10 1 10 1karthikeyan 5 1 15 2 14 2rani 2 2 11 2 12 2durai 2.5 1 14 2 12 2gowtham 8 1 23 3 26 3shoban 6 1 20 2 24 3harish 2 1 12 2 10 1nithish 1.5 1 9 1 10 1nirupama 1 2 8 1 8 1claret 1 1 8.5 1 8 1anton 3 1 13 2 12 2suganthi 3 2 13.5 2 12 2suthan 3.5 1 15 2 14 2lohith 7 1 20 2 18 2sujith 5 1 18 2 18 2aathi 3 1 14 2 14 2nagul 2 1 11 2 12 2vijay 5 1 18 2 18 2ajith 9 1 31 4 36 4setupathi 2.5 1 12 2 12 2kumaran 1.5 1 9 1 10 1jana 0.5 1 4.5 1 6 1balaji 2 1 11 2 10 1arunan 4 1 17 2 16 2valli 5 2 16 2 16 2petchi 6 2 20 2 18 2karuppan 7 1 21 3 24 3kanmani 10 2 35 4 40 4kishore 2 1 11 2 12 2vignesh 5 1 19 2 18 2varathan 1 1 9 1 10 1senthil 0.3 1 6 1 6 1kanthan 3 1 13 2 12 2vishal 0.5 1 5.5 1 6 1surya 7 1 20 2 18 2shtuthi 4 2 15 2 14 2venmathi 8 2 22 3 20 2

girija 2 2 12 2 12 2suganya 4 2 16 2 16 2thangam 9 2 30 3 38 4veena 11 2 29 3 36 4vanthana 6 2 21 3 20 2selvam 4.5 1 18 2 16 2selvi 6.5 2 25 3 24 3rajgopal 3 1 12 2 12 2ramanan 1 1 8 1 10 1rajiv 3 1 13 2 12 2anbu 2.5 1 14 2 14 2rajaram 6 1 24 3 22 3joseph 7 1 23 3 24 3john 5 1 20 2 24 3christy 1 1 8 1 10 1jameela 1.5 2 9 1 8 1mohd.sam 3 1 12 2 10 1kiruba 3.5 2 12 2 10 1sameera 6 2 23 3 22 3diana 9 2 28 3 34 4daisy 2 2 11 2 10 1ganesh 3.5 1 15 2 14 2perumal 1 1 8 1 8 1ramu 1 1 7.7 1 10 2rasiga 1.5 2 9.4 1 8 1santhi 3 2 13.6 2 16 2jeyanthi 4 2 15 2 14 2jaya 6 2 18 2 22 3karnan 5.5 1 17 2 18 2gopal 5 1 17 2 16 2harish 2 1 11 2 10 1jagadesh 2.5 1 13 2 12 2govarthan 6 1 18 2 16 2girija 5.5 2 17 2 14 2girish 4 1 16 2 16 2saran 1 1 9 1 10 2sarath 1.3 1 10 1 10 2saratha 8 2 28 3 34 4saravanan 10 1 30 3 34 4tamizh 4 1 17 2 16 2nagulan 3 1 15 2 14 2surendar 4 1 16 2 14 2sarathy 5.5 1 18 2 20 2priya 8 2 26 3 34 4priya 2 2 12 2 12 2nisha 1 2 7.9 1 8 1jeslin 3 2 14.7 2 12 2bakrudhen 12 1 36 4 40 4jayakumar 2 1 13 2 12 2rajavel 6 1 19 2 20 2

kumar 3 1 14 2 14 2vennila 2 2 11 2 12 2varun 1.5 1 10 1 10 2bharathi 7 2 22 3 22 3ilamaran 4 1 18 2 16 2seeman 9 1 32 4 36 4ramasamy 2 1 12 2 12 2rajathi 2.5 2 13 2 12 2rajan 6 1 25 3 22 3vaishnavi 4 2 19 2 26 3vasikaran 3.5 1 15 2 14 2vaishali 1 2 9 1 8 1vaijayanthi 0.5 2 6 1 8 1karthiga 10 2 Feb-00 4 40 4kirthika 7 2 27 3 32 4prasanna 8 1 26 3 30 3prasath 1 1 8.5 1 8 1prabakar 1.5 1 9.5 1 10 1pranesh 1 1 8 1 10 1prema 1 2 9 1 10 1pradeep 0.5 1 5.5 1 6 1sankar 11 1 33 4 36 4ramya 12 2 38 4 40 4ramesh 2 1 11 2 12 2rajini 3 1 14 2 14 2siva 5 1 20 2 20 2nagarajan 6 1 24 3 22 3sundar 8 1 29 3 36 4sudhir 2 1 11 2 12 2arunan 1 1 9 1 10 1aruna 1.5 2 11 2 12 2rajeev 3.5 1 16 2 16 2pachamuth 4.5 1 18 2 20 2sivnesh 2.5 1 14 2 14 2sivakaran 3 1 17 2 18 2muzzamil 2 1 12 2 12 2sanjay 1 1 9 1 10 1kicha 1.5 1 11 2 12 2sham 3 1 15 2 16 2harini 6 2 21 3 24 3paapu 8 2 30 3 36 4padma 9 2 32 4 38 4lacanya 3 2 12 2 12 2latchana 5 2 17 2 20 2lagubaran 7 1 21 3 26 3mano 10 1 33 4 38 4manoj 2 1 12 2 12 2manoharan 2 1 12 2 12 2pallavan 1 1 9 1 10 1harshini 3 2 14 2 16 2

jothi 2 2 12 2 12 2vetrivel 2.5 1 12 2 14 2yashvanth 1.5 1 10 1 10 1nithish 6 1 22 3 24 3thulasi 1.5 2 10 1 12 2anushri 1 2 8 1 10 1rithesh 1.5 1 11 2 12 2arun 1.5 1 11 2 12 2peadeep 2.5 1 14 2 12 2devandran 2 1 10 1 12 2pandi 4 1 15 2 16 2shanmugam 7 1 20 2 22 3naveen 2.5 1 14 2 16 2abdul 5 1 22 3 22 3arivarasan 8 1 30 4 34 4siva 12 1 36 4 40 4dharsini 0.5 2 5.5 1 6 1tarun 4 1 16 2 16 2bathrakaal 4.5 2 17 2 16 2ashwin 3 1 11 2 12 2vennila 2.5 2 12 2 12 2kanmani 8 2 29 3 34 4yaashrai 6 1 25 3 28 3sanjana 4.5 2 20 2 22 3rishwana 8 2 28 3 34 4martin 9 1 30 3 34 4vimal 1 1 9 1 10 1sasi 2 1 12 2 12 2dinesh 12 1 35 4 40 4swetha 2.5 2 15 2 16 2sham 5 1 19 2 17 2lingam 11 1 32 4 36 4vicky 5 1 20 2 22 3rajpriya 7.5 2 28 3 34 4ashwin 6 1 28 3 36 4ramani 0.5 2 5 1 6 1john 9 1 29 3 34 4suber 12 1 38 4 42 4b/o ramya 0.2 2 4 1 4 1mumtaz 11 2 31 4 34 4sanish 2 1 12 2 12 2kirmani 1 1 9 1 10 1dhoni 11 1 32 4 42 4dharman 3 1 14 2 12 2murugesh 4 1 17 2 14 2mayil 8 1 29 3 36 4kumar 5 1 20 2 22 3revathy 0.7 2 7.5 1 10 1revathi 2 2 12.5 2 12 2ramprabhu 1.5 1 11 2 12 2

vicky 1.5 1 10.5 2 12 2logesh 2.5 1 13 2 12 2logeshwara 3 1 12.5 2 12 2pranesh 4 1 15 2 14 2suresh 8 1 27.5 3 32 4valavan 9 1 30 3 32 4raghuvaran 1 1 8.5 1 10 1guru 0.4 1 5 1 6 1rahavan 4 1 16 2 16 2prabhu 3 1 14 2 14 2karthikeyan 7 1 24 3 28 3vikram 9 1 29 3 34 4dhruva 8 1 28 3 32 4santhosh 5 1 20 2 22 3chandru 4 1 17 2 20 2chandran 7 1 26 3 30 3kumari 3 2 14 2 15 2kaanchana 6.5 2 24 3 28 3cinthiya 2 2 11 2 12 2sindhu 1.5 2 10.5 2 12 2sindhuja 12 2 36 4 42 4vanthana 11 2 35 4 42 4vatchala 10 2 35 4 42 4varuni 9 2 32 4 42 4dhivya 8 2 27 3 34 4manohari 7 2 28 3 34 4sudharsan 6 1 25 3 30 3velmuruga 5 1 20 2 22 3palani 4 1 17.6 2 20 2vijay 4.5 1 22 3 24 3sethu 3 1 16 2 20 2karupan 3.5 1 15 2 18 2goutham 2.5 1 12 2 12 2sabari 2 1 10.5 2 12 2visu 1.5 1 11 2 12 2jakan 1 1 8.5 1 10 1kesavan 0.5 1 5.5 1 6 1pethukani 0.5 2 5.5 1 6 1dorian 2 1 11 2 12 2selvakuma 3.5 1 13 2 14 2selvaraj 5 1 18 2 20 2kamesh 3 1 13 2 15 2rajkumar 2.5 1 12 2 14 2balaji 3.5 1 12 2 14 2bala 3 1 14 2 12 2balan 1 1 8 1 10 1ganapathy 6 1 21 3 20 2vaani 7 2 25 3 20 2laxmi 3 2 13 2 12 2laxmanan 8 1 30 3 26 3

sasivarnan 9 1 27 3 24 3vetrivel 2 1 12 2 10 1yashvanth 1 1 8 1 7 1nithish 1.5 1 10 1 12 2thulasi 3 2 14 2 14 2kanika 6 2 19 2 20 2kanishka 4 2 16 2 18 2anisha 8 2 29 3 32 3anusha 9 2 28 3 36 4arun 10 1 35 4 42 4pradeep 12 1 38 4 44 4mano 2.5 1 13 2 14 2manoj 4.5 1 20 2 20 2manish 6.5 1 23 3 24 3devenran 8 1 28 3 32 4pandi 7 1 25 3 28 3parthi 2 1 12 2 14 2shanmugam 1.5 1 9 1 10 1martin 0.5 1 5 1 6 1vimal 12 1 31 4 44 4rahman 11 1 28 3 42 4arivarasan 3 1 13 2 14 2siba 2.5 1 12 2 12 2dharsini 5 2 16 2 16 2bathrakali 6 2 19 2 20 2ashwin 4 1 18 2 20 2vennila 8 2 30 3 36 4kannika 9 2 27 3 30 3kaamesh 12 1 33 4 38 4rasool 4.5 1 19 2 20 2moideen 4.5 1 17 2 20 2arul 6 1 20 2 20 2sasi 7 1 21 3 22 3dinesh 8 1 25 3 24 3swetha 9 2 29 3 34 4sham 2 1 10 1 12 2lingam 1 1 8.5 1 10 1lingesh 1.5 1 10 1 10 1rajpriya 1.5 2 12 2 12 2rampaul 1 1 7.9 1 10 1mumtaz 0.5 2 4.5 1 6 1abirami 1 2 8 1 10 1anton 1 1 8.3 1 10 1vaishali 2 2 12.5 2 14 2jana 2.5 1 13.5 2 16 2balaji 3.5 1 16 2 16 2prasanna 4.5 1 15.6 2 16 2viji 5.5 2 20 2 24 3b/o guna 6 2 22.5 3 24 3ramani 7 2 21 3 24 3

aneesh 6.5 1 22 3 24 3sujith 3 1 14 2 16 3sharav 5 1 17 2 20 2abhinav 8 1 27 3 32 3abhinesh 9 1 28 3 34 4elangovan 9.5 1 30 3 34 4dalton 5 1 18 2 20 2kingston 6 1 20 2 24 3satya 2.5 1 13 2 14 2sankar 3 1 14 2 16 2srinivasan 1.5 1 11 2 12 2sivakaran 10 1 33 4 40 4prathap 9 1 32 4 40 4pranesh 4 1 14 2 16 2jagadesh 5.5 1 19 2 22 3govarthan 3 1 13 2 14 2navaneeth 4 1 15 2 16 2udhay 3.5 1 13 2 14 2ilankumara 2 1 11 2 12 2jayaprakas 2.5 1 12 2 14 2rajkamal 2 1 12 2 14 2michael 6 1 19 2 22 3daniel 7 1 23 3 24 3harish 5.6 1 27 3 30 3najih 6 1 24 3 26 3sowmiya 2 2 13 2 14 2aravind 1.5 1 10 1 12 2ravichandr 1 1 6.9 1 10 1menaka 0.5 2 4.8 1 6 1kalai 0.6 2 5.2 1 6 1kovalan 0.3 1 4.4 1 6 1senthil 1 1 8.7 1 10 1velavan 1 1 9.2 1 10 1mani 0.2 1 4 1 6 1valluvan 2 1 13.5 2 14 2kamaraj 3 1 13 2 14 2devar 1 1 9 1 10 1palani 4 1 16 2 18 2logesh 3.5 1 14.5 2 16 2sivakumar 8 1 32 4 38 4kannaki 7 2 30 3 38 4salman 6 1 28 3 34 4eswaran 11 1 32 4 40 4kamalesh 2 1 12 2 14 2tamizh 2.5 1 14 2 14 2pugazh 3 1 13 2 14 2aadhi 3.5 1 15 2 16 2arul 7 1 22 3 24 3murugan 7.5 1 24 3 26 3ramanan 8 1 28 3 32 4

ramana 2 1 11 2 14 2kishore 9 1 24 3 26 3veeraraj 10 1 23 3 24 3nagarathna 0.2 2 4 1 4 1kaaleswari 0.7 2 8 1 10 1atchaya 1.5 2 10 1 10 1sanmitha 0.5 2 5.5 1 6 1kathirvel 0.6 1 7 1 8 1gubendran 3 1 11 2 10 1syed 10 1 20 2 32 3maheswari 5 2 15 2 14 2aswanth 7.5 1 22 3 24 3varmith 0.4 1 4 1 4 1vignesh 12 1 29 3 32 4dharsan 0.8 2 6 1 6 1santhosh 5.5 1 13 2 14 2madhan 11 1 36.4 4 42 4vasanth 7 1 15.7 2 18 2ratchan 3 1 11 2 12 2thangesh 0.6 1 7.6 1 8 1mithun 12 1 23 3 24 3harishkuma 7 1 18 2 20 2sabari 0.3 1 4.5 1 6 1veeranan 6 1 19.2 2 22 3bhuvana 3 2 11 2 12 2sivasankar 0.8 1 18.2 2 20 2kamal 0.7 1 7.6 1 8 1vaishnavi 6 2 16.8 2 18 2arulkumara 6 1 18 2 20 2kishorepan 7 1 15 2 16 2sabaripriya 6 2 13.7 2 14 2udhaykuma 7 1 18.6 2 20 2tina 3 2 12.5 2 14 2diwakar 6 1 17.4 2 18 2yogeshwar 11 1 28.4 2 32 4mareeswar 8 2 20 2 28 3hansika 6 2 17.5 2 22 3ezhilarasan 4.5 1 15.1 2 18 2azrina 10 2 28.7 3 34 4nivas 8 1 28 3 28 3shenbagav 12 2 35.7 4 44 4sonasri 1.5 2 8.3 1 10 1poorvika 3 2 12.5 2 16 2sandyari 8 2 16.9 2 18 2sibana 1.5 2 10 1 12 2rithik 2.5 1 12.5 2 14 2dasarathan 3.5 1 12.5 2 14 2nagalaxmi 12 2 23.9 3 28 3nithish 8 1 22 3 26 3bhuvana 3.5 2 11.4 2 14 2

vimalesh 2 1 10.8 2 12 2riyaskhan 7 1 15.9 2 18 2sujai 5 1 14.8 2 18 2lisi 7 2 22.1 3 24 3dharika 5 2 15 2 18 2harishwara 7 1 18.2 2 20 2samitha raj 4.5 2 13 2 14 2gokulkanna 3.5 1 8.8 1 10 2muganthes 2 1 10.5 2 12 2krithika 9 2 25 3 24 3senthilkum 2.5 1 8.9 1 10 1pattaveera 11 1 22.7 3 24 3saravanaku 8.5 1 17.4 2 18 2muthukavit 6.5 2 13.6 2 14 2akashpand 4.5 1 14 2 14 2dinesh 7 1 12.4 2 14 2yuvaraj 1.5 1 10.1 2 12 2nithika 2 2 7.5 1 8 1vignesh 12 1 31.5 4 38 4ayyapan 4 1 12.9 2 14 2sandhya 3.5 2 13.7 2 14 2srimathy 7 2 21.9 3 26 3nagoremee 8 2 20.3 3 24 3navin 11 1 19.8 2 22 3arulsandha 5 1 11.3 2 12 2kani 3 2 11.4 2 12 2anbu 4.5 1 13.2 2 14 2kumanan 12 1 26 3 30 3guru 10 1 29 3 32 4karthick 2.5 1 10.3 2 12 2sudha 7 2 20 2 24 3vanitha 4 2 13 2 14 2dhuruvan 8 1 22.6 3 28 3geetha 4.5 2 15.1 2 16 2kumaresan 6.5 1 19 2 22 3kannapan 7.5 1 23.7 3 28 3anbukarasi 3.5 2 14 2 16 2ilakia 6 2 16.6 2 18 2kannan 5 1 15.7 2 18 2ramesh kum 11 1 27 3 30 3krithick 9 1 25.6 3 28 3keerthi 3 2 12 2 14 2arulprakash 2.5 1 10.5 2 12 2aravind 3 1 10 1 12 2soundar 3 1 13.3 2 14 2vinupriya 12 2 25.4 3 28 3arjunprabh 4 1 16 2 18 2dhanusri 7 2 20.3 3 22 3varun 7 1 21.2 3 22 3chandru 10 1 26 3 32 4

snehan 2 1 12 2 12 2aarav 3.5 1 15 2 14 2anupama 2 2 11 1 12 2sherly 1 2 9 1 10 1princy 5 2 20 2 24 3mary 5 2 18 2 20 2mariam 7 2 22 3 24 3preethi 6 2 19 2 24 3julie 9 2 27 3 32 4anbu 8 1 30 3 34 4rajaram 7 1 25 3 28 3prabha 5.5 1 22 3 24 3shalini 1.5 2 10 1 12 2shailaja 1 2 8 1 10 1kulandai 3 1 13 2 12 2rambabu 2 1 12 2 12 2paneer 8 1 24 3 30 3nalan 1 1 7.5 1 8 1nimisha 0.4 2 4.8 1 4 1manisha 1.5 2 10.5 2 12 2bharath 2 1 13 2 14 2velammal 2 2 13.5 2 14 2kathir 0.5 1 5.5 1 6 2chathriyan 1 1 8 1 10 1kesav 5 1 20 2 24 3gourav 4 1 16 2 18 2keerthy 9.5 2 32 4 40 4williams 2.5 1 14 2 16 2koushik 5.5 1 20 2 24 3vivek 6.6 1 28 3 32 4sabarivasan 5.5 1 24 3 26 3garudan 4.5 1 18 2 22 3dhanush 3.5 1 14 2 16 2dev 2.5 1 13 2 14 2diya 9 2 31 4 36 4dhruvan 8 1 28 3 34 4kamala 7 1 28 3 34 4kamal 6 1 24 3 26 3devan 5 1 22 3 24 3ponraj 4 1 17 2 20 2ponpaandi 3 1 14 2 16 2stallin 2 1 11 2 12 2periyar 10 1 35 4 40 4hitler 11 1 32 4 38 4jackie 0.2 1 4 1 4 1maaran 1 1 7.5 1 8 1prasanth 0.5 1 5 1 6 1karupan 2.5 1 13 2 14 2muthu 2.5 1 11.5 2 12 2meera 2 2 12 2 12 2

nesamani 9 1 30 3 38 4christophe 7 1 28 3 32 4varathan 3.5 1 16 2 20 2dheivanai 3 2 13 2 14 2muthamil 8 2 28 3 32 4kaleel 7.5 1 30 3 34 4ibrahim 5.5 1 21 3 24 3syed aham 5 1 24 3 28 3vetrivel 0.6 1 7 1 8 1velusamy 0.2 1 4 1 4 1velmuruga 0.5 1 5.5 1 6 1velunaiker 1.5 1 9 1 10 1bobby 1 1 8.5 1 10 1sarath 1 1 8 1 10 1babuji 4 1 17 2 18 2samrutha 2 2 12 2 14 2amsavarthi 9 2 35 4 40 4malini 5.5 2 23 3 26 4oviya 4 2 18 2 20 2ramky 7.5 1 29 3 34 4arjun 7 1 31 4 34 4arasan 5 1 20 2 22 3daniel 1.5 1 10 1 12 2dhilip 0.5 1 5.5 1 6 1justin 0.5 1 5 1 6 1joel 1.5 1 8.9 1 10 1jacob 2.5 1 12.5 2 14 2nestle 3.5 1 15.5 2 14 2arockiyam 3 1 13 2 16 2manju 8 2 29 3 34 4arushi 0.5 2 6.3 1 8 1westley 4.5 1 20 2 24 3sivaraman 2.5 1 13 2 14 2venkat 11 1 34 4 40 4abubacker 9 1 30 3 36 4abi 0.5 2 5 1 6 1sheik 6.5 1 23 3 24 3rupesh 4 1 16 2 18 2natraj 4 1 18 2 22 3mathi 3.5 1 14 2 16 2raju 2 1 13 2 14 2murugesh 10 1 35 4 40 4varnesh 0.5 1 5.8 1 6 1sarath 7 1 26 3 32 4boopathy 4.6 1 19 2 24 3boopalan 3.5 1 13.7 2 14 2nimilan 5 1 17.4 2 20 2pinky 10 2 41 4 38 4kiruba 12 1 37.8 4 42 4devaki 3 2 12.9 2 14 2

kannan 4 1 16.9 2 20 2dharman 1 1 7.5 1 8 1murugesh 3 1 13 2 14 2mayil 7 1 24 3 26 3kumar 9 1 34 4 38 4revathy 8 2 29 3 34 4revathi 5 2 19 2 22 3ramprabhu 4 1 16 2 16 2vicky 7 1 28 3 34 4logesh 3 1 13 2 14 2logeshwara 6.5 1 21 3 22 3pranesh 2 1 12.5 2 14 2suresh 1.5 1 10 1 10 1valavan 12 1 45 4 38 4raghuvaran 11 1 30 4 36 4guru 10 1 28 3 34 4rahavan 9 1 35 4 34 4prabhu 8 1 32 4 28 3karthikeyan 7 1 30 3 34 4vikram 6 1 26 3 28 3dhruva 5 1 20 2 22 3santhosh 4 1 16 2 18 2chandru 4.5 1 15 2 16 2chandran 3 1 12.5 2 14 2kumari 3.5 2 15 2 14 2kaanchana 2.5 2 13 2 14 2cinthiya 2 2 12 2 14 2sindhu 1.5 2 11.7 2 12 2sindhuja 1 2 8.9 1 10 1vanthana 0.5 2 4.9 1 6 1vatchala 0.5 2 5.3 1 6 1varuni 2 2 11.6 2 12 2dhivya 3.5 2 14.2 2 14 2manohari 5 2 17.3 2 16 2sudharsan 3 1 14.1 2 14 2velmuruga 2.5 1 13.9 2 14 2palani 3.5 1 13.9 2 14 2vijay 3 1 14.5 2 14 2sethu 1 1 8.3 1 10 1karupan 6 1 29 3 34 4goutham 7 1 27.3 3 26 3sabari 3 1 14.1 2 14 2visu 8 1 32 4 38 4jakan 9 1 37 4 44 4kesavan 2 1 12.8 2 14 2pethukani 1 2 7.9 1 10 1dorian 1.5 1 9.2 1 10 1selvakuma 3 1 13.9 2 14 2selvaraj 6 1 21.9 3 26 3kamesh 4 1 15.8 2 18 2

rajkumar 8 1 34.8 4 42 4balaji 9 1 40.7 4 36 4bala 10 1 34.7 4 40 4balan 12 1 32.9 4 44 4ganapathy 2.5 1 13.6 2 14 2vaani 4.5 2 17.2 2 18 2laxmi 6.5 2 21.6 3 24 3laxmanan 8 1 28 3 34 4sasivarnan 7 1 28 3 32 4vetrivel 2 1 12.8 2 14 2yashvanth 1.5 1 11.8 2 12 2nithish 0.5 1 5.2 1 6 1thulasi 12 2 46 4 36 4kanika 11 2 34 4 40 4kanishka 3 2 12.9 2 14 2anisha 2.5 2 12.7 2 14 2anusha 5 2 18.9 2 22 3arun 6 1 24.5 3 22 3pradeep 4 1 16 2 18 2mano 8 1 30 3 28 3lalitha 9 2 29.5 3 34 4kiran 12 2 28 3 40 4suresh 4.5 1 15.9 2 18 2vinoth 4.5 1 17 2 20 2karthikeyan 6 1 19.2 2 24 3mahesh 7 1 25.2 3 28 3madhan 8 1 28 3 34 4viji 9 2 29 3 38 4kesavan 2 1 12.5 2 14 2murali 1 1 8.4 1 10 1pushkar 1.5 1 10 1 12 2pooja 1.5 2 9.9 1 10 1kirthi 1 2 8.5 1 10 1keerthana 0.5 2 6 1 6 1nandhini 1 2 7.9 1 10 1ilakia 1 2 9 1 10 1kavitha 2 2 12.3 2 14 2vanitha 2.5 2 13.1 2 14 2rajkamal 3.5 1 13.9 2 14 2rajesh 4.5 1 15.7 2 16 2arul 5.5 1 16.3 2 16 2paandi 6 1 21 3 22 3soundar 7 1 26.2 3 30 3vijay 6.5 1 27.4 3 30 3anurega 3 2 13.3 2 14 2aravind 5 1 19.1 2 22 3sumathi 8 2 31 4 38 4karuppu 9 1 29 3 34 4muthu 9.5 1 41 4 28 3b/o rani 5 2 20 2 22 3

rahul 6 1 23.2 3 26 3krishnan 2.5 1 12 2 12 2arun 3 1 15 2 14 2shasthika 1 2 7 1 8 1kiruba 3 1 11 2 10 1kirthi 7 2 17 2 16 2kannan 10 1 28 3 30 3niranjan 5.5 1 16 2 17 2mani 0.5 1 5 1 6 1manikanda 9 1 25 3 24 3jakan 12 1 30 3 32 4janani 10 2 32 4 36 4sowmiya 8 2 29 3 32 4sanjana 2 2 10 1 12 2saran 2.5 1 11 2 12 2aaradhna 2 2 9 1 10 1kamal 1 1 7.5 1 8 1ajish 1.5 1 8.5 1 8 1lalitha 7 2 20 2 20 2kiran 6 1 23 3 22 3suresh 5 1 20 2 20 2vinoth 5 1 21 3 22 3karthikeyan 5 1 27 3 30 3mahesh 9 1 30 3 34 4madhan 8 1 28 3 32 4viji 10 2 35 4 38 4kesavan 11 1 39 4 38 4murali 6 1 23 3 22 3pushkar 4.5 1 20 2 22 3pooja 8 2 30 3 36 4kirthi 8.8 2 28 3 34 4keerthana 9 2 31 4 36 4nandhini 9 2 33 4 38 4ilakia 11 2 32 4 38 4kavitha 2 2 11 2 12 2vanitha 1.5 2 9 1 10 1rajkamal 3.5 1 14 2 14 2rajesh 6 1 20 2 20 2arul 8 1 30 3 26 3paandi 7 1 28 3 30 3soundar 4 1 15 2 14 2vijay 3.5 1 13 2 12 2anurega 4 2 14 2 14 2aravind 2.5 1 11 2 12 2sumathi 6 2 18 2 16 2karuppu 8 1 25 3 24 3muthu 4 1 13 2 12 2b/o rani 0.1 2 4 1 4 1rahul 5 1 17 2 16 2sudharsan 4.7 1 15 2 14 2

gokul 6.2 1 20 2 18 2vasanth 6.7 1 21 3 20 2thomas 7 1 24 3 26 3nilofer 8 2 27 3 28 3asmath 7.5 1 25 3 26 3asmaas 7 1 26 3 30 3amul 3 1 13 2 12 2raja 7 1 20 2 20 2rajashri 9 1 27 3 30 3vasanthi 10 2 31 4 36 4kalpana 11 2 33 4 38 4suganya 6 2 20 2 18 2anitha 3 2 11 2 12 2kannan 2 1 10 1 10 1karthikeyan 5 1 15 2 14 2rani 2 2 11 2 12 2durai 2.5 1 14 2 12 2gowtham 8 1 23 3 26 3shoban 6 1 20 2 24 3harish 2 1 12 2 10 1nithish 1.5 1 9 1 10 1nirupama 1 2 8 1 8 1claret 1 1 8.5 1 8 1anton 3 1 13 2 12 2suganthi 3 2 13.5 2 12 2suthan 3.5 1 15 2 14 2lohith 7 1 20 2 18 2sujith 5 1 18 2 18 2aathi 3 1 14 2 14 2nagul 2 1 11 2 12 2vijay 5 1 18 2 18 2ajith 9 1 31 4 36 4setupathi 2.5 1 12 2 12 2kumaran 1.5 1 9 1 10 1jana 0.5 1 4.5 1 6 1balaji 2 1 11 2 10 1arunan 4 1 17 2 16 2valli 5 2 16 2 16 2petchi 6 2 20 2 18 2karuppan 7 1 21 3 24 3kanmani 10 2 35 4 40 4kishore 2 1 11 2 12 2vignesh 5 1 19 2 18 2varathan 1 1 9 1 10 1senthil 0.3 1 6 1 6 1kanthan 3 1 13 2 12 2vishal 0.5 1 5.5 1 6 1surya 7 1 20 2 18 2shtuthi 4 2 15 2 14 2venmathi 8 2 22 3 20 2

girija 2 2 12 2 12 2suganya 4 2 16 2 16 2thangam 9 2 30 3 38 4veena 11 2 29 3 36 4vanthana 6 2 21 3 20 2selvam 4.5 1 18 2 16 2selvi 6.5 2 25 3 24 3rajgopal 3 1 12 2 12 2ramanan 1 1 8 1 10 1rajiv 3 1 13 2 12 2anbu 2.5 1 14 2 14 2rajaram 6 1 24 3 22 3joseph 7 1 23 3 24 3john 5 1 20 2 24 3christy 1 1 8 1 10 1jameela 1.5 2 9 1 8 1mohd.sam 3 1 12 2 10 1kiruba 3.5 2 12 2 10 1sameera 6 2 23 3 22 3diana 9 2 28 3 34 4daisy 2 2 11 2 10 1ganesh 3.5 1 15 2 14 2perumal 1 1 8 1 8 1ramu 1 1 7.7 1 10 2rasiga 1.5 2 9.4 1 8 1santhi 3 2 13.6 2 16 2jeyanthi 4 2 15 2 14 2jaya 6 2 18 2 22 3karnan 5.5 1 17 2 18 2gopal 5 1 17 2 16 2harish 2 1 11 2 10 1jagadesh 2.5 1 13 2 12 2govarthan 6 1 18 2 16 2girija 5.5 2 17 2 14 2girish 4 1 16 2 16 2saran 1 1 9 1 10 2sarath 1.3 1 10 1 10 2saratha 8 2 28 3 34 4saravanan 10 1 30 3 34 4tamizh 4 1 17 2 16 2nagulan 3 1 15 2 14 2surendar 4 1 16 2 14 2sarathy 5.5 1 18 2 20 2priya 8 2 26 3 34 4priya 2 2 12 2 12 2nisha 1 2 7.9 1 8 1jeslin 3 2 14.7 2 12 2bakrudhen 12 1 36 4 40 4jayakumar 2 1 13 2 12 2rajavel 6 1 19 2 20 2

kumar 3 1 14 2 14 2vennila 2 2 11 2 12 2varun 1.5 1 10 1 10 2bharathi 7 2 22 3 22 3ilamaran 4 1 18 2 16 2seeman 9 1 32 4 36 4ramasamy 2 1 12 2 12 2rajathi 2.5 2 13 2 12 2rajan 6 1 25 3 22 3vaishnavi 4 2 19 2 26 3vasikaran 3.5 1 15 2 14 2vaishali 1 2 9 1 8 1vaijayanthi 0.5 2 6 1 8 1karthiga 10 2 Feb-00 4 40 4kirthika 7 2 27 3 32 4prasanna 8 1 26 3 30 3prasath 1 1 8.5 1 8 1prabakar 1.5 1 9.5 1 10 1pranesh 1 1 8 1 10 1prema 1 2 9 1 10 1pradeep 0.5 1 5.5 1 6 1sankar 11 1 33 4 36 4ramya 12 2 38 4 40 4ramesh 2 1 11 2 12 2rajini 3 1 14 2 14 2siva 5 1 20 2 20 2nagarajan 6 1 24 3 22 3sundar 8 1 29 3 36 4sudhir 2 1 11 2 12 2arunan 1 1 9 1 10 1aruna 1.5 2 11 2 12 2rajeev 3.5 1 16 2 16 2pachamuth 4.5 1 18 2 20 2sivnesh 2.5 1 14 2 14 2sivakaran 3 1 17 2 18 2muzzamil 2 1 12 2 12 2sanjay 1 1 9 1 10 1kicha 1.5 1 11 2 12 2sham 3 1 15 2 16 2harini 6 2 21 3 24 3paapu 8 2 30 3 36 4padma 9 2 32 4 38 4lacanya 3 2 12 2 12 2latchana 5 2 17 2 20 2lagubaran 7 1 21 3 26 3mano 10 1 33 4 38 4manoj 2 1 12 2 12 2manoharan 2 1 12 2 12 2pallavan 1 1 9 1 10 1harshini 3 2 14 2 16 2

jothi 2 2 12 2 12 2vetrivel 2.5 1 12 2 14 2yashvanth 1.5 1 10 1 10 1nithish 6 1 22 3 24 3thulasi 1.5 2 10 1 12 2anushri 1 2 8 1 10 1rithesh 1.5 1 11 2 12 2arun 1.5 1 11 2 12 2peadeep 2.5 1 14 2 12 2devandran 2 1 10 1 12 2pandi 4 1 15 2 16 2shanmugam 7 1 20 2 22 3naveen 2.5 1 14 2 16 2abdul 5 1 22 3 22 3arivarasan 8 1 30 4 34 4siva 12 1 36 4 40 4dharsini 0.5 2 5.5 1 6 1tarun 4 1 16 2 16 2bathrakaal 4.5 2 17 2 16 2ashwin 3 1 11 2 12 2vennila 2.5 2 12 2 12 2kanmani 8 2 29 3 34 4yaashrai 6 1 25 3 28 3sanjana 4.5 2 20 2 22 3rishwana 8 2 28 3 34 4martin 9 1 30 3 34 4vimal 1 1 9 1 10 1sasi 2 1 12 2 12 2dinesh 12 1 35 4 40 4swetha 2.5 2 15 2 16 2sham 5 1 19 2 17 2lingam 11 1 32 4 36 4vicky 5 1 20 2 22 3rajpriya 7.5 2 28 3 34 4ashwin 6 1 28 3 36 4ramani 0.5 2 5 1 6 1john 9 1 29 3 34 4suber 12 1 38 4 42 4b/o ramya 0.2 2 4 1 4 1mumtaz 11 2 31 4 34 4sanish 2 1 12 2 12 2kirmani 1 1 9 1 10 1dhoni 11 1 32 4 42 4dharman 3 1 14 2 12 2murugesh 4 1 17 2 14 2mayil 8 1 29 3 36 4kumar 5 1 20 2 22 3revathy 0.7 2 7.5 1 10 1revathi 2 2 12.5 2 12 2ramprabhu 1.5 1 11 2 12 2

vicky 1.5 1 10.5 2 12 2logesh 2.5 1 13 2 12 2logeshwara 3 1 12.5 2 12 2pranesh 4 1 15 2 14 2suresh 8 1 27.5 3 32 4valavan 9 1 30 3 32 4raghuvaran 1 1 8.5 1 10 1guru 0.4 1 5 1 6 1rahavan 4 1 16 2 16 2prabhu 3 1 14 2 14 2karthikeyan 7 1 24 3 28 3vikram 9 1 29 3 34 4dhruva 8 1 28 3 32 4santhosh 5 1 20 2 22 3chandru 4 1 17 2 20 2chandran 7 1 26 3 30 3kumari 3 2 14 2 15 2kaanchana 6.5 2 24 3 28 3cinthiya 2 2 11 2 12 2sindhu 1.5 2 10.5 2 12 2sindhuja 12 2 36 4 42 4vanthana 11 2 35 4 42 4vatchala 10 2 35 4 42 4varuni 9 2 32 4 42 4dhivya 8 2 27 3 34 4manohari 7 2 28 3 34 4sudharsan 6 1 25 3 30 3velmuruga 5 1 20 2 22 3palani 4 1 17.6 2 20 2vijay 4.5 1 22 3 24 3sethu 3 1 16 2 20 2karupan 3.5 1 15 2 18 2goutham 2.5 1 12 2 12 2sabari 2 1 10.5 2 12 2visu 1.5 1 11 2 12 2jakan 1 1 8.5 1 10 1kesavan 0.5 1 5.5 1 6 1pethukani 0.5 2 5.5 1 6 1dorian 2 1 11 2 12 2selvakuma 3.5 1 13 2 14 2selvaraj 5 1 18 2 20 2kamesh 3 1 13 2 15 2rajkumar 2.5 1 12 2 14 2balaji 3.5 1 12 2 14 2bala 3 1 14 2 12 2balan 1 1 8 1 10 1ganapathy 6 1 21 3 20 2vaani 7 2 25 3 20 2laxmi 3 2 13 2 12 2laxmanan 8 1 30 3 26 3

sasivarnan 9 1 27 3 24 3sanjay 1 1 7.2 1 7 1ramesh 0.5 1 5.5 1 6 1praksh 0.2 1 4 1 4 1parnetha 2 2 12 2 12 2kajal 3.5 2 14.2 2 14 2kajol 6 2 19.2 2 20 2raveena 5 2 21 3 20 2dhilip 4.5 1 17.1 2 18 2sunny deol 7 1 25 3 24 3shrukh 9 1 31 4 36 4salman 11 1 30 3 38 4aamir 3.5 1 14.1 2 14 2aaradhna 0.3 2 4.7 1 4 1sanjeev 1 1 8.2 1 10 1anitha 1.5 2 9.9 1 10 1avila 4 2 15.9 2 16 2ananya 7 2 22.8 3 26 3ananyasri 3 2 12.9 2 14 2saritha 2.5 2 13 2 14 2sangeetha 12 2 39 4 28 3sangitha 2.4 2 10.9 2 12 2sangeeth 1.5 1 9.7 1 10 1maarimuth 3 1 12.5 2 12 2aishwarya 6 2 20.5 3 22 3aniruth 4 1 15 2 16 2iman 3.5 1 12.9 2 14 2vadivel 0.4 1 4.5 1 6 1singamuthu 1 1 7.5 1 8 1saravanan 2 1 11.9 2 12 2uday 3 1 13.5 2 14 2chandar 2.5 1 13 2 14 2chandru 2 1 12.1 2 12 2charlie 1 1 7.9 1 8 1salim 0.5 1 5.3 1 6 1karnan 0.6 1 6 1 6 1lolitha 2.5 2 13.1 2 14 2harsha 5 2 19 2 22 3robin 6 1 19.9 2 22 3davidson 7.5 1 25 3 28 3harrison 2.5 1 13.5 2 14 2nelson 1 1 9 1 10 1vijay 1 1 8.6 1 10 1anoop 1.7 1 10.2 2 12 2piyush 0.4 1 5.1 1 6 1gupta 10 1 31 4 24 3ganga 11 2 29 3 40 4komal 3 2 12.9 2 14 2valli 4 2 14 2 16 2brindha 5 2 19.5 2 22 3

riya 2 2 12.4 2 14 2roopa 3 2 13.7 2 14 2roobini 5 2 21 3 26 3idhaya 8 2 29 3 34 4rohini 6 2 25 3 28 3roshini 2.5 2 12 2 12 2vasantha 1.5 2 10.9 2 12 2meena 3 2 12.7 2 14 2nirosha 2 2 11.9 2 12 2raahini 2.5 2 13.1 2 14 2raadhika 1.5 2 10 1 12 2varsha 1 2 9.1 1 10 1venamathi 2.5 2 13 2 14 2megha 5 2 20.1 3 22 3yazhini 6 2 18.3 2 20 2shamili 7 2 20.5 3 24 3sharvani 2 2 10.9 2 12 2kalyani 2.5 2 11.2 2 12 2kannan 1.5 1 9.7 1 12 2siddharth 0.4 1 5.9 1 6 1vasanth 1 1 8.9 1 10 1vedha 1.5 1 9.8 1 12 2vickram 2 1 10.8 2 12 2shri 3 1 13.5 2 16 2kaniyan 2.5 1 12.9 2 14 2subbu 4 1 14.2 2 16 2poongundr 3 1 13.5 2 14 2medley 3.5 1 13 2 14 2kaliyugan 5 1 17.5 2 20 2bramman 6.5 1 19.2 2 22 3nelson 10 1 30 3 36 4gahi 11 1 29 3 34 4varunan 2.5 1 12.6 2 14 2sarav 1.5 1 11 2 12 2kicha 1 1 9 1 10 1dhaksin 0.5 1 5.2 1 6 1charles 1 1 7.9 1 10 1claret 1 1 8.3 1 10 1rooban 1 1 8.7 1 10 1dharsan 1.5 1 9.3 1 12 2boopalan 2 1 11.4 2 14 2jakan 2.5 1 12.9 2 14 2kesavan 3 1 13 2 16 2nayagan 3.5 1 13.4 2 16 2soori 3 1 13 2 16 2vadivel 4 1 14.2 2 16 2vivek 4.5 1 13.9 2 16 2prem 2.5 1 12 2 14 2karthikeyan 2 1 11.2 2 14 2kennedy 1 1 9 1 10 1

prabhu 1 1 8.9 1 10 1

ANNEXURE V- CONSENT FORM IN REGIONAL LANGUAGE (TAMIL)
ஆரா��சி ஒ��த� ப�வ�
ேததி:
ஆரா��சி தைல��:
ெபய�:
வய�: உ�ேநாயாள� எ�:
பா�: ஆரா��சி ேச��ைக எ�:
இ�த ஆரா��சிய�� வ�பர�க�� அத� ேநா�க�க�� ��ைமயாக என��
வ�ள�க�ப�ட�. என�� வ�ள�க�ப�ட வ�ஷய�கைள ����ெகா�� என� ச�மத�ைத
ெத�வ��கிேற�.
இ�த ஆரா��சிய�� ப�ற�� நி�ப�தமி�றி எ� ெசா�த வ���ப�தி� ேப�� நா�
ப�� ெப�கிேற�, ம��� நா� இ�த ஆரா��சிய�லி��� எ�த ேநர�� ப��வா�கலா�
எ�பைத��, அதனா� எ�த பாதி��� ஏ�படா� எ�பைத��, நா� ���� ெகா�ேட�.
நா� எ��ைடய �யநிைன�ட� ம��� �� �த�திர��ட� இ�த ம���வ
ஆரா��சிய�� எ�ைன ேச����ெகா�ள ச�மதி�கிேற� ���கைள அ�ல�
க����கைள ெவள�ய��� ேபாேதா அ�ல� ஆரா��சிய�� ேபாேதா எ��ைடய
ெபயைரேயா அ�ல� அைடயாள�கைளேயா ெவள�ய�டமா�டா�க� எ�பைத�� அறி��
ெகா�ேட�.
என� ேநாய�� த�ைம ம��� ப��வ�ைள�கைள�� ��ைமயாக
����ெகா�ேட�. இ�த ஆரா��சிய�� என� ேநாய�� �ல��� ம��� த�ைமைய
ம��ேம ஆரா�வா�க� எ�பைத அறி�� ெகா�ேட�.
இதனா� எ� ைவ�திய �ைறகள�� எ�த மா�ற�� பா�ைவ�திறன�� எ�தவ�த
பாதி��� ஏ�படா� எ�பைத�� ெத���ெகா�ேட�. என�� வ�ள�க�ப�ட
வ�ஷய�கைள ��ைமயாக ����ெகா�� இ�த ஆரா��சிய�� ப��ெகா�ள எ� ��
மன�ட� ஒ���ெகா�கிேற�.
ஆரா��சியாள� ைகெயா�ப� ப�ேக�பாள� ைகெயா�ப�
ேததி:

Urkund Analysis Result Analysed Document: Reliability of broselow tape-length based emergency weight
estimation.docx (D31688018)Submitted: 10/25/2017 9:48:00 PM Submitted By: [email protected] Significance: 0 %
Sources included in the report:
Instances where selected sources appear:
0
U R K N DU

CERTIFICATE
This is to certify that this dissertation work titled “RELIABILITY OF
BROSELOW TAPE-LENGTH BASED EMERGENCY ESTIMATION IN
PAEDIATRIC POPULATION OF SOUTHERN TAMIL NADU” of the
candidate Dr.D.SANJEEV KUMAR with registration number 201517105 for the
done for award of M.D Degree Branch VII – PAEDIATRIC MEDICINE. I
personally verified the urkund.com website for the purpose of plagiarism check. I
found that the uploaded thesis file contained from introduction to conclusion pages
and result shows 0% of plagiarism in the dissertation.
Guide and Supervisor sign with seal
Copyright © 2022 FDOKUMEN