Relationship Between Patterns of Visual Field Loss and Retinal Nerve Fiber Layer Thickness...
10
Relationship Between Patterns of Visual Field Loss and Retinal Nerve Fiber Layer Thickness Measurements ESTHER M. HOFFMANN, MD, FELIPE A. MEDEIROS, MD, PAMELA A. SAMPLE, PHD, CATHERINE BODEN, PHD, CHRISTOPHER BOWD, PHD, RUPERT R. BOURNE, MD, LINDA M. ZANGWILL, PHD, AND ROBERT N. WEINREB, MD ● PURPOSE: To investigate the association between pat- terns of visual field (VF) loss and retinal nerve fiber layer (RNFL) thickness measurements. ● DESIGN: Observational cross-sectional study. ● METHODS: One hundred twenty-one glaucoma patients and 65 healthy subjects from the Diagnostic Innovations in Glaucoma Study (DIGS) were included. All glaucoma patients had repeatable abnormal VFs and scanning laser polarimetry (SLP) RNFL thickness measurements. RNFL measurements were obtained from 16 equal para- papillary sectors. Patterns of VF loss were classified as arcuate, partial arcuate, nasal step, or paracentral in each VF hemifield. Logistic regression analysis was performed to determine which RNFL sectors were associated with each VF pattern. The ability of SLP to discriminate between eyes with different VF patterns and healthy eyes using receiver operating characteristic (ROC) curve analyses also was investigated. ● RESULTS: VF patterns in the superior hemifield were significantly associated with RNFL sectors in the temporal inferior hemiretina (P < .05). ROC curve areas for dis- crimination between eyes with different VF patterns and healthy eyes ranged from 0.85 to 0.95. VF patterns in the inferior hemifield were most strongly associated with tem- poral superior RNFL sectors (P < .05). ROC curve areas for discrimination between different VF patterns and healthy eyes ranged from 0.73 to 0.98. SLP could discrim- inate between apparently unaffected VF hemifields in glau- coma eyes and VF hemifields in healthy eyes. ● CONCLUSIONS: Parapapillary RNFL thickness was to- pographically related to patterns of VF loss. SLP can differentiate between apparently unaffected VF hemi- fields in glaucoma eyes and normal VF hemifields in healthy eyes. (Am J Ophthalmol 2006;141:463– 471. © 2006 by Elsevier Inc. All rights reserved.) I T IS LIKELY THAT THERE IS A TOPOGRAPHIC RELATION- ship between the location of glaucomatous visual field (VF) loss and retinal nerve fiber layer (RNFL) damage in glaucoma eyes. VF loss in glaucoma patients follows recognizable patterns dictated by the corresponding spe- cific arrangement of the nerve fiber bundles in the retina. 1 Moreover, clinically identifiable patterns of glaucomatous VF loss including temporal wedge, nasal step, paracentral, partial arcuate, and arcuate have been described in detail by several investigators. 2–9 The structure-function rela- tionship between RNFL and optic disk topographic mea- surements and standardized automated perimetry in glaucoma patients has been investigated over a wide range of glaucoma severities. 10 –16 Histopathologic studies of both human and monkey eyes with glaucoma demonstrate that there is a correlation between VF defects and retinal ganglion cell loss. 17,18 These studies provide an indirect validation of functional measurements as well as possible surrogates for retinal ganglion cell measurements and also a better understanding of the pathology of glaucoma. However, no study has evaluated the association of clini- cally identifiable patterns of VF loss and localized RNFL loss. The purpose of this study was to investigate this relationship using recently standardized VF classification criteria 19 and sectoral RNFL measurements obtained by scanning laser polarimetry (SLP). METHODS PATIENTS AND HEALTHY SUBJECTS WERE RECRUITED FROM the University of California, San Diego, Diagnostic Inno- Accepted for publication Oct 11, 2005. From the Hamilton Glaucoma Center, Department of Ophthalmology, University of California of San Diego, La Jolla, California. Supported by a research fellowship from the Deutsche Forschungsge- meinschaft Ho 3277/1-1 (E.M.H.), NIH grant EY08208 (P.A.S.), and NIH grant EY11008 (L.M.Z.). These grants had no role in the design and conduct of the study, collection, management, analysis, and interpreta- tion of the data. Inquiries to Robert N. Weinreb, MD, Hamilton Glaucoma Center, Department of Ophthalmology, University of California, San Diego, 9500 Gilman Drive, La Jolla, California 92093-0946; e-mail: weinreb@ eyecenter.ucsd.edu © 2006 BY ELSEVIER INC.ALL RIGHTS RESERVED. 0002-9394/06/$32.00 463 doi:10.1016/j.ajo.2005.10.017
Transcript of Relationship Between Patterns of Visual Field Loss and Retinal Nerve Fiber Layer Thickness...
●
t(●
●
aippRpaVtebua●
sichipfhic
A
U
mNct
DGe
0d
Relationship Between Patterns of Visual FieldLoss and Retinal Nerve Fiber Layer
Thickness Measurements
ESTHER M. HOFFMANN, MD, FELIPE A. MEDEIROS, MD, PAMELA A. SAMPLE, PHD,CATHERINE BODEN, PHD, CHRISTOPHER BOWD, PHD, RUPERT R. BOURNE, MD,
LINDA M. ZANGWILL, PHD, AND ROBERT N. WEINREB, MD
●
pdfih©
IircMVpbtsgohtgvsaHclrcs
P
PURPOSE: To investigate the association between pat-erns of visual field (VF) loss and retinal nerve fiber layerRNFL) thickness measurements.
DESIGN: Observational cross-sectional study.METHODS: One hundred twenty-one glaucoma patients
nd 65 healthy subjects from the Diagnostic Innovationsn Glaucoma Study (DIGS) were included. All glaucomaatients had repeatable abnormal VFs and scanning laserolarimetry (SLP) RNFL thickness measurements.NFL measurements were obtained from 16 equal para-apillary sectors. Patterns of VF loss were classified asrcuate, partial arcuate, nasal step, or paracentral in eachF hemifield. Logistic regression analysis was performed
o determine which RNFL sectors were associated withach VF pattern. The ability of SLP to discriminateetween eyes with different VF patterns and healthy eyessing receiver operating characteristic (ROC) curvenalyses also was investigated.RESULTS: VF patterns in the superior hemifield were
ignificantly associated with RNFL sectors in the temporalnferior hemiretina (P < .05). ROC curve areas for dis-rimination between eyes with different VF patterns andealthy eyes ranged from 0.85 to 0.95. VF patterns in thenferior hemifield were most strongly associated with tem-oral superior RNFL sectors (P < .05). ROC curve areasor discrimination between different VF patterns andealthy eyes ranged from 0.73 to 0.98. SLP could discrim-nate between apparently unaffected VF hemifields in glau-oma eyes and VF hemifields in healthy eyes.
ccepted for publication Oct 11, 2005.From the Hamilton Glaucoma Center, Department of Ophthalmology,niversity of California of San Diego, La Jolla, California.Supported by a research fellowship from the Deutsche Forschungsge-einschaft Ho 3277/1-1 (E.M.H.), NIH grant EY08208 (P.A.S.), andIH grant EY11008 (L.M.Z.). These grants had no role in the design and
onduct of the study, collection, management, analysis, and interpreta-ion of the data.
Inquiries to Robert N. Weinreb, MD, Hamilton Glaucoma Center,epartment of Ophthalmology, University of California, San Diego, 9500
tilman Drive, La Jolla, California 92093-0946; e-mail: weinreb@
yecenter.ucsd.edu
© 2006 BY ELSEVIER INC. A002-9394/06/$32.00oi:10.1016/j.ajo.2005.10.017
CONCLUSIONS: Parapapillary RNFL thickness was to-ographically related to patterns of VF loss. SLP canifferentiate between apparently unaffected VF hemi-elds in glaucoma eyes and normal VF hemifields inealthy eyes. (Am J Ophthalmol 2006;141:463–471.2006 by Elsevier Inc. All rights reserved.)
T IS LIKELY THAT THERE IS A TOPOGRAPHIC RELATION-
ship between the location of glaucomatous visual field(VF) loss and retinal nerve fiber layer (RNFL) damage
n glaucoma eyes. VF loss in glaucoma patients followsecognizable patterns dictated by the corresponding spe-ific arrangement of the nerve fiber bundles in the retina.1oreover, clinically identifiable patterns of glaucomatousF loss including temporal wedge, nasal step, paracentral,artial arcuate, and arcuate have been described in detaily several investigators.2–9 The structure-function rela-ionship between RNFL and optic disk topographic mea-urements and standardized automated perimetry inlaucoma patients has been investigated over a wide rangef glaucoma severities.10–16 Histopathologic studies of bothuman and monkey eyes with glaucoma demonstrate thathere is a correlation between VF defects and retinalanglion cell loss.17,18 These studies provide an indirectalidation of functional measurements as well as possibleurrogates for retinal ganglion cell measurements and also
better understanding of the pathology of glaucoma.owever, no study has evaluated the association of clini-
ally identifiable patterns of VF loss and localized RNFLoss. The purpose of this study was to investigate thiselationship using recently standardized VF classificationriteria19 and sectoral RNFL measurements obtained bycanning laser polarimetry (SLP).
METHODS
ATIENTS AND HEALTHY SUBJECTS WERE RECRUITED FROM
he University of California, San Diego, Diagnostic Inno-
LL RIGHTS RESERVED. 463
vsstbjH
brduimses
●
gfi�
n(2atVHmle
nphr
●
orw�wo
●
Ffi(at
4
ations in Glaucoma Study (DIGS), a prospectively de-igned study, to compare visual function and optic nervetructure in glaucoma. Informed written consent was ob-ained from all participants and all methods were approvedy the University of California, San Diego, Human Sub-ects Committee. The study adhered to the Declaration ofelsinki for research involving human subjects.Subjects included in this longitudinal study had a
est-corrected visual acuity of 20/40 or better, a sphericalefraction within � 5.0 diopters, and cylinder � 3.0iopters, and were at least 18 years of age. All subjectsnderwent complete ophthalmologic examination includ-ng slit-lamp biomicroscopy, intraocular pressure measure-ent, dilated stereoscopic fundus examination, and
tereophotography of the optic nerve heads. One eye ofach subject was randomly chosen for inclusion in thetudy.
DEFINITION OF GLAUCOMA: Eyes were classified aslaucomatous if they had two consecutive abnormal visualelds within 6 months (pattern standard deviation (PSD)
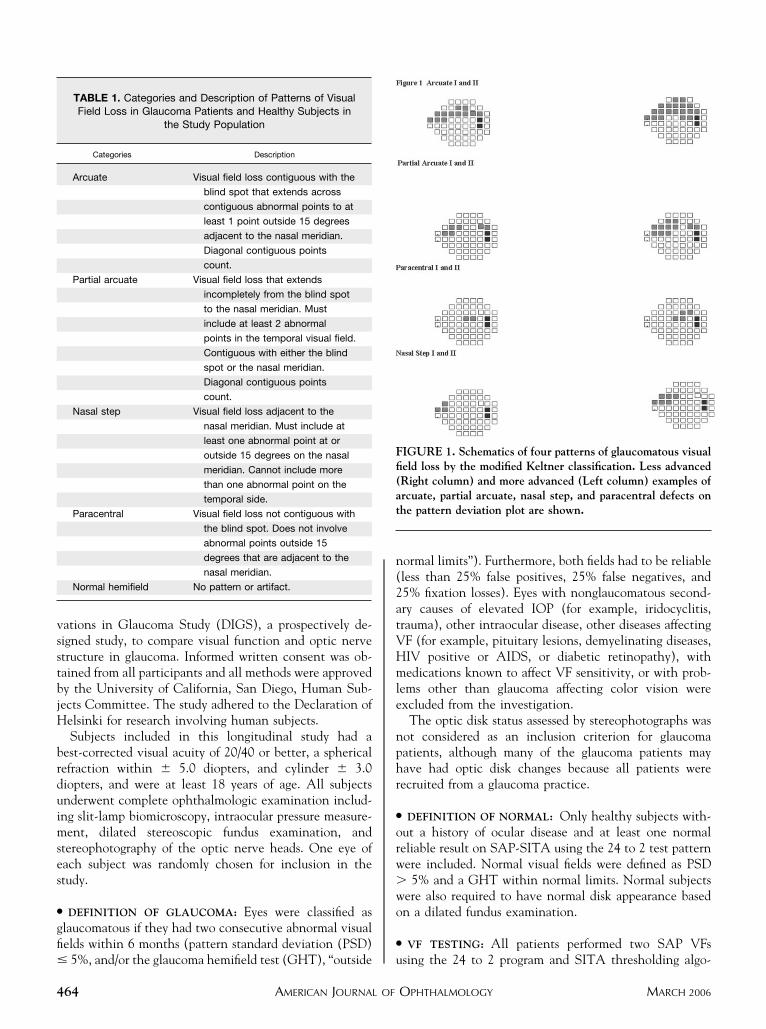
TABLE 1. Categories and Description of Patterns of VisualField Loss in Glaucoma Patients and Healthy Subjects in
the Study Population
Categories Description
Arcuate Visual field loss contiguous with the
blind spot that extends across
contiguous abnormal points to at
least 1 point outside 15 degrees
adjacent to the nasal meridian.
Diagonal contiguous points
count.
Partial arcuate Visual field loss that extends
incompletely from the blind spot
to the nasal meridian. Must
include at least 2 abnormal
points in the temporal visual field.
Contiguous with either the blind
spot or the nasal meridian.
Diagonal contiguous points
count.
Nasal step Visual field loss adjacent to the
nasal meridian. Must include at
least one abnormal point at or
outside 15 degrees on the nasal
meridian. Cannot include more
than one abnormal point on the
temporal side.
Paracentral Visual field loss not contiguous with
the blind spot. Does not involve
abnormal points outside 15
degrees that are adjacent to the
nasal meridian.
Normal hemifield No pattern or artifact.
5%, and/or the glaucoma hemifield test (GHT), “outside u
AMERICAN JOURNAL OF64
ormal limits”). Furthermore, both fields had to be reliableless than 25% false positives, 25% false negatives, and5% fixation losses). Eyes with nonglaucomatous second-ry causes of elevated IOP (for example, iridocyclitis,rauma), other intraocular disease, other diseases affectingF (for example, pituitary lesions, demyelinating diseases,IV positive or AIDS, or diabetic retinopathy), withedications known to affect VF sensitivity, or with prob-
ems other than glaucoma affecting color vision werexcluded from the investigation.
The optic disk status assessed by stereophotographs wasot considered as an inclusion criterion for glaucomaatients, although many of the glaucoma patients mayave had optic disk changes because all patients wereecruited from a glaucoma practice.
DEFINITION OF NORMAL: Only healthy subjects with-ut a history of ocular disease and at least one normaleliable result on SAP-SITA using the 24 to 2 test patternere included. Normal visual fields were defined as PSD
5% and a GHT within normal limits. Normal subjectsere also required to have normal disk appearance basedn a dilated fundus examination.
VF TESTING: All patients performed two SAP VFs
IGURE 1. Schematics of four patterns of glaucomatous visualeld loss by the modified Keltner classification. Less advancedRight column) and more advanced (Left column) examples ofrcuate, partial arcuate, nasal step, and paracentral defects onhe pattern deviation plot are shown.
sing the 24 to 2 program and SITA thresholding algo-
OPHTHALMOLOGY MARCH 2006
rI(bpnn
cwdrHKrpadsgrTsHwbttg
afi
cpbtaco
pmK
●
acfiup
FrpsR
FgigUi
V
ithm of the Humphrey Field Analyzer (Carl Zeiss Meditecnc, Dublin, California, USA). A white Goldmann size III0.43 degrees) stimulus was presented on a 31.5 apostilbackground. The 24 to 2 test pattern consists of 54 testoints covering the central field out to 24 degrees, exceptasally where it extends to 30 degrees. The two locationsearest the blind spot were not included in the analysis.To classify patterns of VF loss, a modified version of a
lassification system developed by Keltner and associates19
as employed. This classification system was originallyeveloped for the Optic Neuritis Treatment Trial20 andecently used to describe VF abnormalities in the Ocularypertension Treatment Study (OHTS).19 According toeltner, VF abnormalities were divided into three catego-
ies: (1) VF patterns characteristic of glaucoma, (2) VFatterns uncharacteristic of glaucoma, and (3) testingrtifacts. Seventeen mutually exclusive categories wereeveloped to describe the superior and inferior hemifieldseparately. For this study, only VF patterns characteristic oflaucoma were included. Fields with artifacts or defectselated to other disorders were not included in the analysis.he VF patterns were described as temporal wedge, nasal
tep, paracentral, partial arcuate, and arcuate VF patterns.emifields could also be normal. The VF pattern temporaledge was not found in this study subgroup. Grading wasased solely on the pattern deviation plot and not on theotal deviation plot as originally described by Keltner,19 ashe purpose of the current study was to relate patterns oflaucomatous VF loss with sectoral RNFL results.
To be evaluated for VF patterns (arcuate, partial arcu-te, nasal step, paracentral, temporal wedge),19 one hemi-
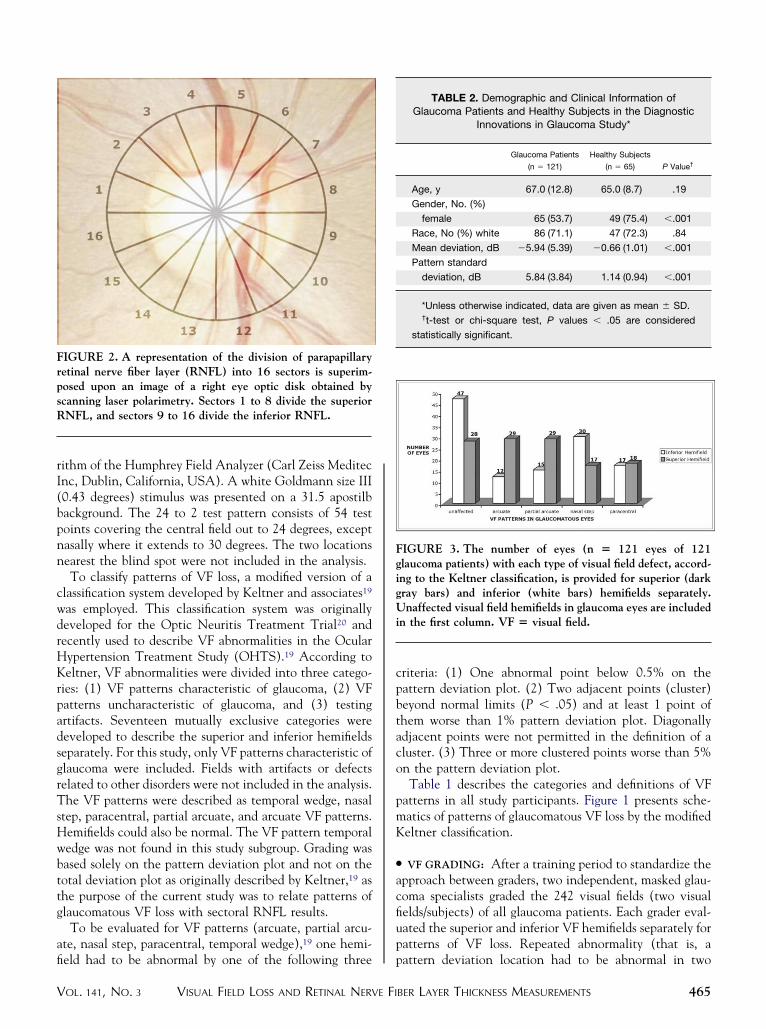
IGURE 2. A representation of the division of parapapillaryetinal nerve fiber layer (RNFL) into 16 sectors is superim-osed upon an image of a right eye optic disk obtained bycanning laser polarimetry. Sectors 1 to 8 divide the superiorNFL, and sectors 9 to 16 divide the inferior RNFL.
eld had to be abnormal by one of the following three p
VISUAL FIELD LOSS AND RETINAL NERVE FIOL. 141, NO. 3
riteria: (1) One abnormal point below 0.5% on theattern deviation plot. (2) Two adjacent points (cluster)eyond normal limits (P � .05) and at least 1 point ofhem worse than 1% pattern deviation plot. Diagonallydjacent points were not permitted in the definition of aluster. (3) Three or more clustered points worse than 5%n the pattern deviation plot.Table 1 describes the categories and definitions of VF
atterns in all study participants. Figure 1 presents sche-atics of patterns of glaucomatous VF loss by the modifiedeltner classification.
VF GRADING: After a training period to standardize thepproach between graders, two independent, masked glau-oma specialists graded the 242 visual fields (two visualelds/subjects) of all glaucoma patients. Each grader eval-ated the superior and inferior VF hemifields separately foratterns of VF loss. Repeated abnormality (that is, a
IGURE 3. The number of eyes (n � 121 eyes of 121laucoma patients) with each type of visual field defect, accord-ng to the Keltner classification, is provided for superior (darkray bars) and inferior (white bars) hemifields separately.naffected visual field hemifields in glaucoma eyes are included
n the first column. VF � visual field.
TABLE 2. Demographic and Clinical Information ofGlaucoma Patients and Healthy Subjects in the Diagnostic
Innovations in Glaucoma Study*
Glaucoma Patients
(n � 121)
Healthy Subjects
(n � 65) P Value†
Age, y 67.0 (12.8) 65.0 (8.7) .19
Gender, No. (%)
female 65 (53.7) 49 (75.4) �.001
Race, No (%) white 86 (71.1) 47 (72.3) .84
Mean deviation, dB �5.94 (5.39) �0.66 (1.01) �.001
Pattern standard
deviation, dB 5.84 (3.84) 1.14 (0.94) �.001
*Unless otherwise indicated, data are given as mean � SD.†t-test or chi-square test, P values � .05 are considered
statistically significant.
attern deviation location had to be abnormal in two
BER LAYER THICKNESS MEASUREMENTS 465
cr(r
●
tVpCsellottpaardsasa
gfitv
irmataafpaihtrssawh
) pat
4
onsecutive fields to be included as part of the pattern) wasequired. The two graders achieved agreement in 23597%) of the VFs. The seven cases of disagreement wereesolved by adjudication of a third grader.
SCANNING LASER POLARIMETRY: Glaucoma detec-ion system with variable cornea compensation, GDxCC, measurements were taken with a scanning laserolarimeter (GDx VCC, Carl Zeiss Meditec Inc, Dublin,alifornia, USA) with customized corneal compensation,
oftware version 5.0.1. The principle has been describedlsewhere.21 In brief, the GDx VCC is a modified scanningaser polarimeter with variable corneal compensation. Theight source, a polarized laser beam (780 nm), is directednto the retina, and the reflected light that double-passeshe RNFL is detected to obtain the retardation image athat point. Images are performed by scanning in a rasterattern, covering an image field 40 degrees horizontallynd 20 degrees vertically, including both the parapapillarynd macular regions of the eye. The GDx VCC incorpo-ates the method of variable corneal compensation asescribed by Zhou and Weinreb.22 To measure the eye-pecific corneal polarization axis and magnitude, imagesre first acquired from the macula, without any compen-ation. The resulting retardation profile represents the
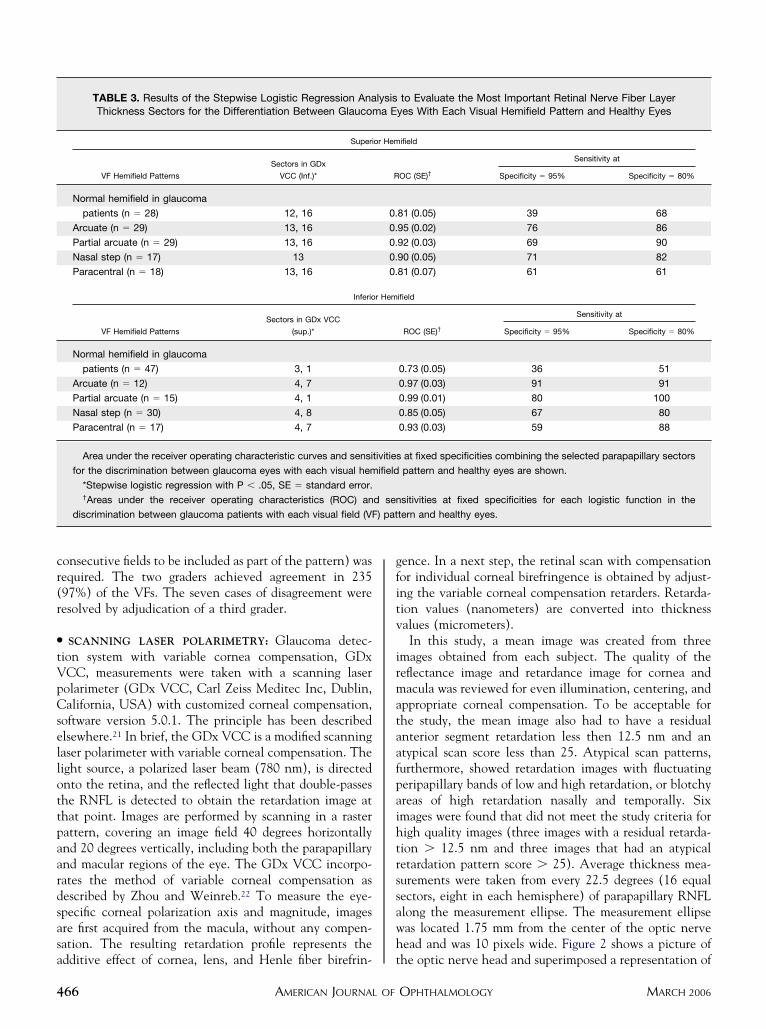
TABLE 3. Results of the Stepwise Logistic Regression AnaThickness Sectors for the Differentiation Between Glaucom
Superi
VF Hemifield Patterns
Sectors in GDx
VCC (Inf.)*
Normal hemifield in glaucoma
patients (n � 28) 12, 16
Arcuate (n � 29) 13, 16
Partial arcuate (n � 29) 13, 16
Nasal step (n � 17) 13
Paracentral (n � 18) 13, 16
Inferio
VF Hemifield Patterns
Sectors in GDx VCC
(sup.)*
Normal hemifield in glaucoma
patients (n � 47) 3, 1
Arcuate (n � 12) 4, 7
Partial arcuate (n � 15) 4, 1
Nasal step (n � 30) 4, 8
Paracentral (n � 17) 4, 7
Area under the receiver operating characteristic curves and sensi
for the discrimination between glaucoma eyes with each visual hem
*Stepwise logistic regression with P � .05, SE � standard error.†Areas under the receiver operating characteristics (ROC) an
discrimination between glaucoma patients with each visual field (VF
dditive effect of cornea, lens, and Henle fiber birefrin- t
AMERICAN JOURNAL OF66
ence. In a next step, the retinal scan with compensationor individual corneal birefringence is obtained by adjust-ng the variable corneal compensation retarders. Retarda-ion values (nanometers) are converted into thicknessalues (micrometers).In this study, a mean image was created from three
mages obtained from each subject. The quality of theeflectance image and retardance image for cornea andacula was reviewed for even illumination, centering, and
ppropriate corneal compensation. To be acceptable forhe study, the mean image also had to have a residualnterior segment retardation less then 12.5 nm and antypical scan score less than 25. Atypical scan patterns,urthermore, showed retardation images with fluctuatingeripapillary bands of low and high retardation, or blotchyreas of high retardation nasally and temporally. Sixmages were found that did not meet the study criteria forigh quality images (three images with a residual retarda-ion � 12.5 nm and three images that had an atypicaletardation pattern score � 25). Average thickness mea-urements were taken from every 22.5 degrees (16 equalectors, eight in each hemisphere) of parapapillary RNFLlong the measurement ellipse. The measurement ellipseas located 1.75 mm from the center of the optic nerveead and was 10 pixels wide. Figure 2 shows a picture of
to Evaluate the Most Important Retinal Nerve Fiber Layeryes With Each Visual Hemifield Pattern and Healthy Eyes
ifield
OC (SE)†
Sensitivity at
Specificity � 95% Specificity � 80%
81 (0.05) 39 68
95 (0.02) 76 86
92 (0.03) 69 90
90 (0.05) 71 82
81 (0.07) 61 61
ifield
ROC (SE)†
Sensitivity at
Specificity � 95% Specificity � 80%
0.73 (0.05) 36 51
0.97 (0.03) 91 91
0.99 (0.01) 80 100
0.85 (0.05) 67 80
0.93 (0.03) 59 88
at fixed specificities combining the selected parapapillary sectors
pattern and healthy eyes are shown.
sitivities at fixed specificities for each logistic function in the
tern and healthy eyes.
lysisa E
or Hem
R
0.
0.
0.
0.
0.
r Hem
tivities
ifield
d sen
he optic nerve head and superimposed a representation of
OPHTHALMOLOGY MARCH 2006
t1
●
wivRptspsuehmtIsai
awigcahpaaViLwmsrsud
V
he division of parapapillary retinal nerve fiber layer into6 sectors in the right eye.
STATISTICAL ANALYSIS: Student t-tests or �2 testsere used to compare clinical and demographic character-
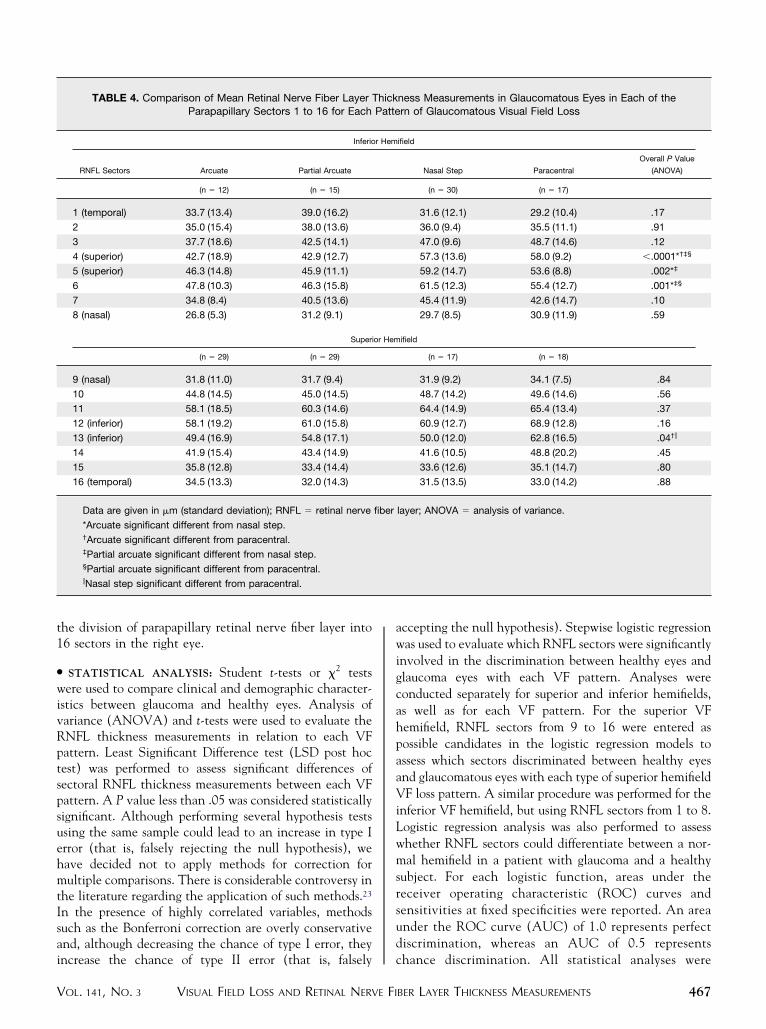
stics between glaucoma and healthy eyes. Analysis ofariance (ANOVA) and t-tests were used to evaluate theNFL thickness measurements in relation to each VFattern. Least Significant Difference test (LSD post hocest) was performed to assess significant differences ofectoral RNFL thickness measurements between each VFattern. A P value less than .05 was considered statisticallyignificant. Although performing several hypothesis testssing the same sample could lead to an increase in type Irror (that is, falsely rejecting the null hypothesis), weave decided not to apply methods for correction forultiple comparisons. There is considerable controversy in
he literature regarding the application of such methods.23
n the presence of highly correlated variables, methodsuch as the Bonferroni correction are overly conservativend, although decreasing the chance of type I error, they
TABLE 4. Comparison of Mean Retinal Nerve Fiber Layer TParapapillary Sectors 1 to 16 for Each
Inferio
RNFL Sectors Arcuate Partial Arcuate
(n � 12) (n � 15)
1 (temporal) 33.7 (13.4) 39.0 (16.2)
2 35.0 (15.4) 38.0 (13.6)
3 37.7 (18.6) 42.5 (14.1)
4 (superior) 42.7 (18.9) 42.9 (12.7)
5 (superior) 46.3 (14.8) 45.9 (11.1)
6 47.8 (10.3) 46.3 (15.8)
7 34.8 (8.4) 40.5 (13.6)
8 (nasal) 26.8 (5.3) 31.2 (9.1)
Superi
(n � 29) (n � 29)
9 (nasal) 31.8 (11.0) 31.7 (9.4)
10 44.8 (14.5) 45.0 (14.5)
11 58.1 (18.5) 60.3 (14.6)
12 (inferior) 58.1 (19.2) 61.0 (15.8)
13 (inferior) 49.4 (16.9) 54.8 (17.1)
14 41.9 (15.4) 43.4 (14.9)
15 35.8 (12.8) 33.4 (14.4)
16 (temporal) 34.5 (13.3) 32.0 (14.3)
Data are given in �m (standard deviation); RNFL � retinal nerve
*Arcuate significant different from nasal step.†Arcuate significant different from paracentral.‡Partial arcuate significant different from nasal step.§Partial arcuate significant different from paracentral.�Nasal step significant different from paracentral.
ncrease the chance of type II error (that is, falsely c
VISUAL FIELD LOSS AND RETINAL NERVE FIOL. 141, NO. 3
ccepting the null hypothesis). Stepwise logistic regressionas used to evaluate which RNFL sectors were significantly
nvolved in the discrimination between healthy eyes andlaucoma eyes with each VF pattern. Analyses wereonducted separately for superior and inferior hemifields,s well as for each VF pattern. For the superior VFemifield, RNFL sectors from 9 to 16 were entered asossible candidates in the logistic regression models tossess which sectors discriminated between healthy eyesnd glaucomatous eyes with each type of superior hemifieldF loss pattern. A similar procedure was performed for the
nferior VF hemifield, but using RNFL sectors from 1 to 8.ogistic regression analysis was also performed to assesshether RNFL sectors could differentiate between a nor-al hemifield in a patient with glaucoma and a healthy
ubject. For each logistic function, areas under theeceiver operating characteristic (ROC) curves andensitivities at fixed specificities were reported. An areander the ROC curve (AUC) of 1.0 represents perfectiscrimination, whereas an AUC of 0.5 represents
ness Measurements in Glaucomatous Eyes in Each of thern of Glaucomatous Visual Field Loss
ifield
Nasal Step Paracentral
Overall P Value
(ANOVA)
(n � 30) (n � 17)
31.6 (12.1) 29.2 (10.4) .17
36.0 (9.4) 35.5 (11.1) .91
47.0 (9.6) 48.7 (14.6) .12
57.3 (13.6) 58.0 (9.2) �.0001*†‡§
59.2 (14.7) 53.6 (8.8) .002*‡
61.5 (12.3) 55.4 (12.7) .001*‡§
45.4 (11.9) 42.6 (14.7) .10
29.7 (8.5) 30.9 (11.9) .59
ifield
(n � 17) (n � 18)
31.9 (9.2) 34.1 (7.5) .84
48.7 (14.2) 49.6 (14.6) .56
64.4 (14.9) 65.4 (13.4) .37
60.9 (12.7) 68.9 (12.8) .16
50.0 (12.0) 62.8 (16.5) .04†�
41.6 (10.5) 48.8 (20.2) .45
33.6 (12.6) 35.1 (14.7) .80
31.5 (13.5) 33.0 (14.2) .88
layer; ANOVA � analysis of variance.
hickPatte
r Hem
or Hem
fiber
hance discrimination. All statistical analyses were
BER LAYER THICKNESS MEASUREMENTS 467
cC
O
ttgsht
●
tlapga“
sgTf
dtpihctwobwbfiil
●
q((g3V(b
4
arried out using the SPSS version 11.0.2 (SPSS Inc,hicago, Illinois, USA).
RESULTS
NE HUNDRED TWENTY-ONE EYES OF 121 GLAUCOMA PA-
ients and 65 eyes of 65 healthy subjects were included inhis study. Age and race did not differ appreciably betweenlaucoma patients and healthy subjects. There were con-iderably more women in the glaucoma group compared withealthy subjects. The clinical and demographic characteris-ics of all study participants are summarized in Table 2.
SUPERIOR HEMIFIELD VF PATTERNS: Figure 3 showshe number of glaucomatous eyes with each pattern of VFoss. Twenty-nine eyes had arcuate defects, 29 had partialrcuate defects, 17 had a nasal step pattern, and 18 showedaracentral VF loss in the superior hemifield. Twenty-eightlaucoma eyes had no VF defect in the superior hemifieldnd these hemifields will be described subsequently asunaffected” hemifields.
Table 3 shows the sectors identified as most relevant bytepwise logistic regression for the discrimination betweenlaucoma eyes with each VF loss pattern and healthy eyes.able 3 also shows the ROC curve areas for the logistic
TABLE 5. Mean Retinal Nerve Fiber Layer Thickness MGlaucomatous Eyes with Unaffected Visual Field Hemifields
Inferio
RNFL Sector Unaffected Hemifield
(n � 47)
1 (temporal) 34.4 (10.9)
2 40.6 (11.9)
3 57.9 (15.6)
4 (superior) 68.7 (15.5)
5 (superior) 62.4 (14.9)
6 60.3 (13.6)
7 47.4 (10.4)
8 (nasal) 33.2 (8.8)
Superi
(n � 28)
9 (nasal) 30.8 (10.7)
10 46.6 (15.4)
11 61.4 (16.6)
12 (inferior) 64.0 (15.4)
13 (inferior) 62.2 (18.9)
14 51.8 (16.9)
15 32.2 (11.7)
16 (temporal) 28.7 (11.1)
Data are given in �m (standard deviation); RNFL � retinal nerve
*t-test.
unctions combining the selected RNFL sectors for the t
AMERICAN JOURNAL OF68
iscrimination between glaucoma eyes with each VF pat-ern and healthy eyes. For arcuate, partial arcuate, andaracentral patterns, only the RNFL sectors 13 (temporalnferior parapapillary hemiretina) and 16 (temporalemiretina) were selected as most relevant. The ROCurve areas for the logistic functions discriminating be-ween glaucoma eyes with these patterns and healthy eyesere 0.95, 0.92, and 0.81, respectively. Sector 13 was thenly sector significantly associated with discriminationetween eyes with nasal step VF loss and healthy eyes,ith an ROC curve area of 0.90. For discriminationetween glaucoma eyes with unaffected superior VF hemi-elds and healthy eyes, RNFL sectors 12 and 16 weredentified by the stepwise logistic regression model and theogistic function had an ROC curve area of 0.81.
INFERIOR HEMIFIELD VF PATTERNS: The most fre-uent VF pattern in the inferior hemifield was nasal stepn � 30), followed by paracentral (n � 17), partial arcuaten � 15), and arcuate VF pattern (n � 12). Forty-sevenlaucoma eyes had no inferior VF hemifield defect (Figure). For arcuate, partial arcuate, nasal step, and paracentralF patterns in the inferior hemifield, the RNFL sector 4
temporal superior parapapillary hemiretina) discriminatedest in the stepwise logistic regression model between
ements in Each of the Parapapillary Sectors 1 to 16 inared with Healthy Eyes with Normal Visual Field Hemifields
ifield
Normal Hemifield P Value*
(n � 65)
27.5 (8.6) .02
38.3 (9.1) .34
61.8 (12.8) � .001
74.4 (9.1) �.001
68.7 (12.1) �.001
66.8 (11.8) �.001
51.9 (11.3) �.001
34.1 (9.5) .08
ifield
(n � 65)
34.4 (6.8) .1
55.5 (11.0) .01
74.6 (13.5) �.0001
77.0 (12.9) �.0001
71.0 (10.9) .03
53.9 (14.7) .56
29.0 (12.1) .21
23.1 (10.20 .02
layer.
easurComp
r Hem
or Hem
fiber
hese patterns and healthy eyes. Depending on the specific
OPHTHALMOLOGY MARCH 2006
VaAct
hfis
●
T
T
ml1tapiw
vaaRwesatdpt
●
A
N
sgehm1t
I
nVtita
tRtpdleTtswmt
isRVtoldlVcoprtsbstmttbaseigpiesw
(pVtra
V
F pattern, RNFL sectors 1, 7, and 8 were also identifieds relevant for the discrimination from healthy eyes.reas under the ROC curves for the logistic functions
ombining the selected RNFL sectors ranged from 0.85o 0.99 (Table 3).
The best discrimination between unaffected inferior VFemifields of glaucoma eyes and normal inferior VF hemi-elds of healthy eyes was achieved by a combination ofectors 3 and 1, with an ROC curve area of 0.73.
SECTORAL RNFL THICKNESS MEASUREMENTS RELA-
IVE TO EACH GLAUCOMATOUS VF HEMIFIELD PAT-
ERN: Table 4 shows average RNFL thicknesseasurements in each sector for glaucoma eyes with each VF
oss pattern. For eyes with superior VF defects, only sector3 was significantly different among the groups. RNFLhickness in sector 13 was considerably lower in eyes withrcuate defects and nasal step compared with eyes witharacentral loss. No significant differences were observedn sectoral RNFL thickness measurements between eyesith superior arcuate and partial arcuate defects.For glaucoma eyes with inferior defects, RNFL thickness
alues in the sectors 4, 5, and 6 were considerably differentmong the groups with specific VF patterns. Eyes withrcuate or partial arcuate defects had considerably lowerNFL thickness values in sectors 4, 5, and 6 comparedith eyes with nasal step pattern. When compared withyes with paracentral loss, eyes with partial arcuate defectshowed considerably thinner RNFL thickness in sectors 4nd 6, whereas eyes with arcuate defects had considerablyhinner RNFL in sector 4. Similar to eyes with superiorefects, eyes with inferior arcuate defects and eyes withartial arcuate defects did not differ significantly in any ofhe RNFL sectors.
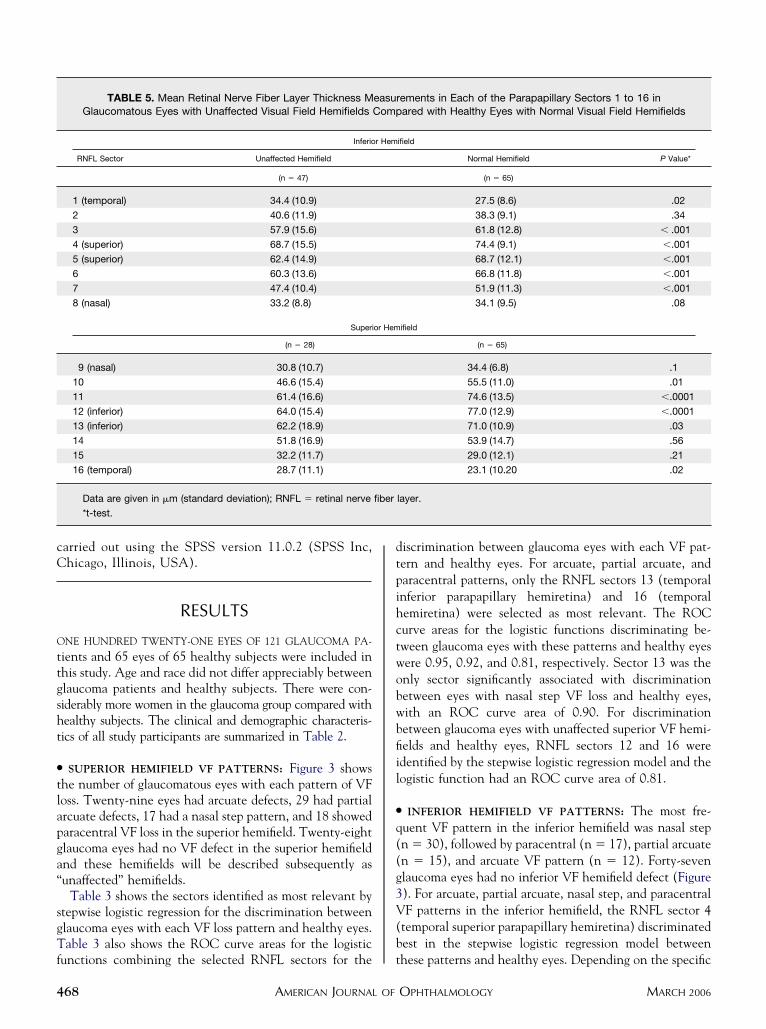
SECTORAL RNFL THICKNESS MEASUREMENTS IN UN-
FFECTED VF HEMIFIELDS OF GLAUCOMA EYES AND
ORMAL HEMIFIELDS OF HEALTHY EYES: Table 5 pre-ents sectoral RNFL thickness measurement results inlaucoma eyes with unaffected VF hemifields and healthyyes. For most sectors, glaucoma eyes with unaffectedemifields had appreciably lower RNFL thickness measure-ents than healthy eyes, except for sectors 2, 8, 9, 14, and
5, were no significant differences were found between thewo groups.
DISCUSSION
N THIS STUDY, POLARIMETRIC ESTIMATES OF RNFL THICK-
ess differentiated glaucoma eyes with specific patterns ofF loss from healthy eyes. Moreover, some sectors around
he optic disk were identified as more relevant than othersn this differentiation. Positive structural-functional rela-ionships between RNFL measurements using polarimetry
nd VF have been reported previously,2,13,15,21,24–26 and sVISUAL FIELD LOSS AND RETINAL NERVE FIOL. 141, NO. 3
he current study supports this findings. As expected,NFL thickness in the superior temporal and inferior
emporal sectors was significantly associated with theresence of VF loss. The superior temporal sector 4 (67.5egrees to 90 degrees) consistently was identified in allogistic functions for discrimination between glaucomayes with each inferior VF defect pattern and healthy eyes.he same was observed with regards to the inferior
emporal sector 13 (270 degrees to 292.5 degrees) whenuperior VF patterns were analyzed. This is in accordanceith the hypothesis that glaucomatous disk changes occurore frequently in the superior temporal and inferior
emporal disk regions.2,27,28
Some differences were found between superior andnferior VF patterns and their associations with RNFLectors. Superior VF defects were associated with fewerNFL sectors than inferior VF defects (Table 3). SuperiorF defects tend to occur earliest in glaucoma and might,
herefore, be associated with fewer RNFL sectors becausef a less advanced disease. Both nasally and temporallyocated RNFL sectors were identified as relevant foretection of inferior VF patterns, whereas only temporallyocated sectors were significantly associated with superiorF patterns. This might be attributable to the asymmetri-
al orientation of retinal nerve fiber bundles around theptic disk, particularly superiorly and inferiorly. It is alsoossible that some of the observed differences in theelationship between RNFL sectors and visual field pat-erns were the result of the method of analysis used. Thetepwise logistic regression identifies the RNFL sector thatest discriminates, then includes the next best RNFLector and so on. The stepwise procedure is not guaranteedo identify the “best” model, and it can happen that manyodels are about as good as or even better than the one
hat is singled out by the stepwise procedure. Given thathe discriminating ability between two RNFL sectors maye similar because they are highly correlated with onenother, it is likely that two or more models may provideimilar discriminating power. The nasal RNFL sectors, forxample (RNFL sectors 7 and 8, Table 3) were included asmportant for the differentiation between healthy andlaucoma eyes with arcuate, nasal, and paracentral VFatterns. It is likely, that if the temporal sectors werencluded in the model instead of nasal sectors, the differ-nces between these models would not be statisticallyignificant. That is, with temporal or nasal sectors includedould explain a similar amount of variability.Surprisingly, RNFL thicknesses in the sectors 1 and 16
temporal hemiretina) were thinner in healthy eyes com-ared with glaucomatous eyes, independent of the type ofF pattern. The reason for this is unknown. RNFL
hickness measurements obtained by scanning laser pola-imetry in the temporal sector might be affected byrtifactual retardance coming from the sclera.29,30
Different VF patterns probably reflect differences in
everity of damage. Nasal step, paracentral, and partialBER LAYER THICKNESS MEASUREMENTS 469
aatstwtnwdvodwtsl
�sSIewcdtpTswasc
mwsardmtetpgomnasaotfi
cdw
tia
GrPwmh
1
1
1
1
1
4
rcuate defects represent earlier loss that occurs in nasalnd circumscribed arcuate regions, which may later spreado become an arcuate defect. Based on differences ineverity and location of the defects, it would be expectedhat broader and more extensive RNFL defects in patientsith arcuate VF loss would involve more RNFL sectors
han in patients with a nasal step, for example. It isoteworthy, however, that only a few of the RNFL sectorsere appreciably different among glaucoma eyes withifferent patterns of VF loss. It is possible that theariability of RNFL measurements makes the identificationf differences in RNFL thickness for some of the sectorsifficult. Moreover, the relatively small number of patientsith each type of VF pattern may have reduced the ability
o detect significant differences in RNFL thickness mea-urements between glaucoma eyes with each pattern of VFoss.
We excluded subjects with a refractive error greater than5 diopters from the investigation. The inclusion of these
ubjects would probably make it more difficult to interpretLP results and different VF patterns typical for glaucoma.t has been shown that VF defects (for example, annlarged blind spot) may occur in myopic normal subjectsithout having glaucoma. A decline in sensitivity in theentral VF tends to occur in individuals with more than 5iopters of myopia.31 Furthermore, SLP might give resultshat are difficult to interpret because of atypical retardationatterns in myopic eyes or eyes with peripapillary atrophy.o avoid the confounding effect of refractive changes to
tructural and functional measures in our data, patientsith refractive errors greater than �5.0 diopters patientsre excluded from our studies. A separate analysis of thetructure-function relationship in high ametropic eyesompared with normal eyes would be interesting.
Our results showed that polarimetric RNFL thicknesseasurements can differentiate between glaucoma eyesith unaffected hemifields and healthy eyes. With 95%
pecificity, 39% and 36% of the glaucoma patients withpparently unaffected superior and inferior hemifields,espectively, were identified as abnormal. The significantifferences in 11 of the 16 sectoral RNFL thicknesseasurements between unaffected and normal eyes support
hese findings (Table 5). These results provide additionalvidence that SLP RNFL changes may be detected beforehe appearance of VF defects in standard automatederimetry.16,32 Early RNFL changes based on clinicalrading has been shown to predict the later developmentf VF loss as well.33–36 Two previous studies address theeasurement of RNFL thickness in areas with apparentlyormal visual hemifield sensitivity.24,37 Both studies founddecrease in RNFL in the respective “normal” hemifield
uggesting that early RNFL changes may already exist inpparently unaffected visual hemifields. To our knowledge,ur study is the first study to report differences in RNFLhickness between glaucoma eyes with unaffected hemi-
elds and healthy eyes using SLP with customized cornealAMERICAN JOURNAL OF70
ompensation. Follow-up of these participants is needed toetermine whether VF defects will develop in the areasith thinner RNFL.This study contributes to an enhanced understanding of
he structure-function relationship in glaucoma by betterdentifying the relationship between specific RNFL sectorsnd associated patterns of VF loss.
ACKNOWLEDGMENTS
laucoma medication provided at no cost as a participantetention incentive by Alcon Laboratories Inc, Allergan,fizer Inc, and Santen Inc. (P.A.S.). Drs Weinreb, Zang-ill and Sample have received research support (instru-ents) from Carl Zeiss Meditec. Dr Weinreb receivedonoraria from Carl Zeiss Meditec.
REFERENCES
1. Werner EB, Drance SM. Early visual field disturbances inglaucoma. Arch Ophthalmol 1977;95:1173–1175.
2. Garway-Heath DF, Poinoosawmy D, Fitzke FW, Hitchings RA.Mapping the visual field to the optic disk in normal tensionglaucoma eyes. Ophthalmology 2000;107:1809–1815.
3. Lau LI, Liu CJ, Chou JC, Hsu WM, Liu JH. Patterns of visualfield defects in chronic angle-closure glaucoma with differentdisease severity. Ophthalmology 2003;110:1890–1894.
4. Lee AJ, Wang JJ, Rochtchina E, Healey P, Chia EM,Mitchell P. Patterns of glaucomatous visual field defects in anolder population: the Blue Mountains Eye Study. ClinExperiment Ophthalmol 2003;31:331–335.
5. Aulhorn E. [Visual field in glaucoma]. Ophthalmologica1969;158:469–487.
6. Drance SM. The early field defects in glaucoma. InvestOphthalmol 1969;8:84–91.
7. Nicholas SP, Werner EB. Location of early glaucomatousvisual field defects. Can J Ophthalmol 1980;15:131–133.
8. Aulhorn E KH. Frequency distribution in early glaucomatousvisual field defects. Doc Ophthalmol Proc Ser 1977;14:75–83.
9. Heijl A, Lundqvist L. The frequency distribution of earliestglaucomatous visual field defects documented by automaticperimetry. Acta Ophthalmol (Copenh) 1984;62:658–664.
0. Anton A, Yamagishi N, Zangwill L, Sample PA, Weinreb RN.Mapping structural to functional damage in glaucoma withstandard automated perimetry and confocal scanning laserophthalmoscopy. Am J Ophthalmol 1998;125:436–446.
1. Girkin CA. Relationship between structure of optic nerve/nerve fiber layer and functional measurements in glaucoma.Curr Opin Ophthalmol 2004;15:96–101.
2. Tannenbaum DP, Zangwill LM, Bowd C, Sample PA,Weinreb RN. Relationship between visual field testing andscanning laser polarimetry in patients with a large cup-to-disk ratio. Am J Ophthalmol 2001;132:501–506.
3. Bowd C, Zangwill LM, Weinreb RN. Association betweenscanning laser polarimetry measurements using variable cor-neal polarization compensation and visual field sensitivity inglaucomatous eyes. Arch Ophthalmol 2003;121:961–966.
4. Johnson CA, Sample PA, Cioffi GA, Liebmann JR, Weinreb
RN. Structure and function evaluation (SAFE): I. criteria forOPHTHALMOLOGY MARCH 2006
1
1
1
1
1
2
2
2
2
2
2
2
2
2
2
3
3
3
3
3
3
3
3
V
glaucomatous visual field loss using standard automatedperimetry (SAP) and short wavelength automated perimetry(SWAP). Am J Ophthalmol 2002;134:177–185.
5. Bagga H, Greenfield DS. Quantitative assessment of struc-tural damage in eyes with localized visual field abnormalities.Am J Ophthalmol 2004;137:797–805.
6. Mohammadi K, Bowd C, Weinreb RN, Medeiros FA, SamplePA, Zangwill LM. Retinal nerve fiber layer thickness mea-surements with scanning laser polarimetry predict glaucoma-tous visual field loss. Am J Ophthalmol 2004;138:592–601.
7. Harwerth RS, Carter-Dawson L, Smith EL, Crawford ML.Scaling the structure-function relationship for clinical perim-etry. Acta Ophthalmol Scand 2005;83:448–455.
8. Harwerth RS, Carter-Dawson L, Smith EL, 3rd, Barnes G,Holt WF, Crawford ML. Neural losses correlated with visuallosses in clinical perimetry. Invest Ophthalmol Vis Sci2004;45:3152–3160.
9. Keltner JL, Johnson CA, Cello KE, et al. Classification ofvisual field abnormalities in the ocular hypertension treat-ment study. Arch Ophthalmol 2003;121:643–650.
0. Keltner JL, Johnson CA, Spurr JO, Beck RW. Baseline visualfield profile of optic neuritis. The experience of the opticneuritis treatment trial. Optic Neuritis Study Group ArchOphthalmol 1993;111:231–234.
1. Weinreb RN, Shakiba S, Zangwill L. Scanning laser pola-rimetry to measure the nerve fiber layer of normal andglaucomatous eyes. Am J Ophthalmol 1995;119:627–636.
2. Zhou Q, Weinreb RN. Individualized compensation of an-terior segment birefringence during scanning laser polarim-etry. Invest Ophthalmol Vis Sci 2002;43:2221–2228.
3. Perneger TV. What’s wrong with Bonferroni adjustments.BMJ 1998;316:1236–1238.
4. Reyes RD, Tomita G, Kitazawa Y. Retinal nerve fiber layerthickness within the area of apparently normal visual field innormal-tension glaucoma with hemifield defect. J Glaucoma1998;7:329–335.
5. Kook MS, Sung K, Kim S, Park R, Kang W. Study of retinalnerve fibre layer thickness in eyes with high tension glau-coma and hemifield defect. Br J Ophthalmol 2001;85:1167–1170.
6. Emdadi A, Zangwill L, Sample PA, Kono Y, Anton A,
Weinreb RN. Patterns of optic disk damage in patients withVISUAL FIELD LOSS AND RETINAL NERVE FIOL. 141, NO. 3
early focal visual field loss. Am J Ophthalmol 1998;126:763–771.
7. Ogden TE, Duggan J, Danley K, Wilcox M, Minckler DS.Morphometry of nerve fiber bundle pores in the optic nervehead of the human. Exp Eye Res 1988;46:559–568.
8. Quigley HA, Addicks EM. Regional differences in the structureof the lamina cribrosa and their relation to glaucomatous opticnerve damage. Arch Ophthalmol 1981;99:137–143.
9. Bozkurt B, Irkec M, Gedik S, et al. Effect of peripapillarychorioretinal atrophy on GDx parameters in patients withdegenerative myopia. Clin Experiment Ophthalmol 2002;30:411–414.
0. Hoh ST, Greenfield DS, Liebmann JM, et al. Factorsaffecting image acquisition during scanning laser polarim-etry: authors’ response. Ophthalmic Surg Lasers 1999;30:411– 412.
1. Rudnicka AR, Edgar DF. Automated static perimetry inmyopes with peripapillary crescents—Part I. OphthalmolPhysiol Opt 1995;15:409–412.
2. Medeiros FA, Zangwill LM, Bowd C, Mohammadi K, Wein-reb RN. Comparison of scanning laser polarimetry usingvariable corneal compensation and retinal nerve fiber layerphotography for detection of glaucoma. Arch Ophthalmol2004;122:698–704.
3. Quigley HA, Reacher M, Katz J, Strahlman E, Gilbert D,Scott R. Quantitative grading of nerve fiber layer photo-graphs. Ophthalmology 1993;100:1800–1807.
4. Quigley HA, Miller NR, George T. Clinical evaluation ofnerve fiber layer atrophy as an indicator of glaucomatousoptic nerve damage. Arch Ophthalmol 1980;98:1564–1571.
5. Quigley HA, Katz J, Derick RJ, Gilbert D, Sommer A. Anevaluation of optic disk and nerve fiber layer examinations inmonitoring progression of early glaucoma damage. Ophthal-mology 1992;99:19–28.
6. Quigley HA, Enger C, Katz J, Sommer A, Scott R, Gilbert D.Risk factors for the development of glaucomatous visual fieldloss in ocular hypertension. Arch Ophthalmol 1994;112:644–649.
7. Matsumoto C, Shirato S, Haneda M, Yamashiro H, Saito M.Study of retinal nerve fiber layer thickness within normalhemivisual field in primary open-angle glaucoma and nor-
mal-tension glaucoma. Jpn J Ophthalmol 2003;47:22–27.BER LAYER THICKNESS MEASUREMENTS 471

EGs
4
Biosketch
sther M. Hoffmann, MD, is currently completing a clinical and research fellowship in glaucoma at the Hamiltonlaucoma Center, Department of Ophthalmology, University of California at San Diego. Her research interests include
tructure and function in glaucoma.
AMERICAN JOURNAL OF OPHTHALMOLOGY71.e1 MARCH 2006