Bilateral nanophthalmos, pigmentary retinal dystrophy, and angle closure glaucoma--a new syndrome?
Comparative Study of Retinal Nerve Fiber LayerMeasurement by StratusOCT and GDx VCC, II:Structure/Function Regression Analysis in Glaucoma
Christopher Kai-shun Leung,1 Kelvin Kam-Long Chong,2 Wai-man Chan,2
Cedric Ka-Fai Yiu,3 Man-yee Tso,1 Jackson Woo,1 Moon-Kwong Tsang,1 Kwok-kay Tse,1
and Wing-ho Yung4
PURPOSE. To evaluate the structure/function relationship be-tween visual field sensitivity and retinal nerve fiber layer(RNFL) thickness measured by StratusOCT (Carl Zeiss Meditec,Inc., Dublin, CA) and GDx VCC (Laser Diagnostic Technolo-gies, Inc., San Diego, CA).
METHODS. Eighty-nine subjects (27 who had healthy eyes, 21who were glaucoma suspect, 41 who had glaucoma) wereenrolled in this cross-sectional study. RNFL thickness was mea-sured using the StratusOCT and the GDx VCC, and visual field(VF) was examined using the Humphrey VF analyzer. Therelationship between RNFL thickness and VF sensitivity—ex-pressed in terms of mean deviation (MD) in decibel (dB) scale,unlogged 1/lambert (L), and Advanced Glaucoma InterventionStudy (AGIS) and Collaborative Initial Glaucoma TreatmentStudy (CIGTS) VF scores—were evaluated with linear and non-linear regression models. Coefficient of determination (R2) wascalculated, and regression models were compared using theAkaike information criterion and the F test.
RESULTS. In plotting MD against RNFL thickness, curvilinearregression models demonstrated the best fit, whereas linearregression attained the best associations when VF sensitivitywas expressed in 1/L. However, when healthy subjects wereexcluded from the analyses, the second-order polynomial wasbetter than linear regression in describing the relation between1/L and GDx VCC–measured RNFL thickness. Regression pro-files between AGIS/CIGTS VF scores and RNFL thickness werebest described in the linear and the first-order inverse modelsfor GDx VCC and StratusOCT RNFL measurements, respec-tively. In general, StratusOCT RNFL measurements achievedhigher associations with visual function in all the respectiveregression analyses than did GDx VCC.
CONCLUSIONS. Description of structure/function relationships inglaucoma depends on the choice of perimetry scale, the type
of RNFL measuring device, and the characteristics of the stud-ied groups. The higher association with visual function inStratusOCT RNFL measurements compared with that in GDxVCC suggested optical coherence tomography might be a bet-ter approach for evaluating structure/function relationships.Curvilinear regression profiles found between StratusOCTRNFL thickness and MD/VF scores provide an explanation forthose longitudinal observations, showing that VFs with higherAGIS/CIGTS VF scores or worse MD at baseline are at higherrisk for deterioration. Regression analysis of the structure/function profile could provide important information in theassessment of the trend and pattern of glaucoma progression.(Invest Ophthalmol Vis Sci. 2005;46:3702–3711) DOI:10.1167/iovs.05-0490
The loss of retinal ganglion cells in glaucoma can be re-flected structurally as localized or diffuse thinning of the
retinal nerve fiber layer (RNFL), and its measurement has beencorrelated with the functional damage in visual field (VF).1–4
StratusOCT (Carl Zeiss Meditec, Inc., Dublin, CA) and GDxVCC (Laser Diagnostic Technologies, Inc., San Diego, CA) arethe two latest commercially available imaging modalities de-signed to measure RNFL thickness. A number of recent studieshave reported high correlations between VF sensitivity andRNFL thickness in glaucoma with the use of these nerve fiberanalyzers. In the study by Reus and Lemij,1 the relationshipbetween VF sensitivity (in decibel [dB]) and GDx VCC RNFLmeasurements in patients with glaucoma was found with co-efficients of correlation of 0.77, 0.52, 0.46, 0.51, and 0.38 atthe supratemporal, supranasal, nasal, infranasal, and infratem-poral sectors, respectively. With the use of StratusOCT (CarlZeiss Meditec), Leung et al.4 showed that the coefficient ofcorrelation between VF mean deviation (MD) and averageRNFL thickness was 0.79. Although statistically significant cor-relations were found in these studies, the structure/functionrelationship was primarily investigated with linear regressionanalysis, which may not be an adequate model to describe andfit the nonlinear portion of the relationship. In fact, a curvilin-ear relationship has been reported between GDx VCC (LaserDiagnostic Technologies)–measured RNFL thickness and VFsensitivity.5 Therefore, comparisons with linear and nonlinearregression models are essential to identify and confirm theprecise nature of the structure/function relationship. The re-gression function would then be useful for understanding thetrend and pattern of disease progression and for selecting anappropriate monitoring strategy to detect the changes.
Information regarding the nature of progression in glau-coma has been essentially derived from the longitudinal VFanalyses.6–12 To avoid the confounding effect of variability, anumber of analytical procedures were suggested to determinethe true progression. The Humphrey visual field analyzer(Humphrey Field Analyzer II; Humphrey Instruments, Dublin,CA) has a built-in “change analysis” option that performs linearregression analysis of the VF MD. Major clinical trials such as
From the 1Department of Ophthalmology, Caritas Medical Centre,Hong Kong, People’s Republic of China; the Departments of 2Ophthal-mology and Visual Sciences and 4Physiology, Faculty of Medicine, TheChinese University of Hong Kong, Hong Kong, People’s Republic ofChina; and the 3Department of Industrial and Manufacturing SystemsEngineering, The University of Hong Kong, Hong Kong, People’sRepublic of China.
Submitted for publication April 21, 2005; revised June 8, 2005;accepted August 26, 2005.
Disclosure: C.K. Leung, None; K.K. Chong, None; W. Chan,None; C.K. Yiu, None; M. Tso, None; J. Woo, None; M.-K. Tsang,None; K. Tse, None; W. Yung, None
The publication costs of this article were defrayed in part by pagecharge payment. This article must therefore be marked “advertise-ment” in accordance with 18 U.S.C. §1734 solely to indicate this fact.
Corresponding author: Christopher Kai-shun Leung, Departmentof Ophthalmology, Caritas Medical Centre, 111 Wing Hong Street,Sham Shui Po, Hong Kong, People’s Republic of China;[email protected].
Investigative Ophthalmology & Visual Science, October 2005, Vol. 46, No. 103702 Copyright © Association for Research in Vision and Ophthalmology
the Advanced Glaucoma Intervention Study (AGIS) and theCollaborative Initial Glaucoma Treatment Study (CIGTS) usedefect classification scoring systems to provide a discretescore, between 0 and 20, for each VF result.13,14 The AGIS andthe CIGTS define progression as an increase in VF score of 4and 3, respectively. However, the scoring systems can bearbitrary, and the scale may not be linear. A change in scorefrom 1 to 5 may not be equal to a change from 16 to 20.Analyzing the structure/function profiles in terms of VF scoresmay reveal the nature of the scaling of these scoring systemsand may provide better understanding regarding the trend ofdisease progression observed in these trials. Using differentnonlinear and linear regression models, we investigated andcompared the relationship between VF sensitivity—expressedin terms of decibel unit (MD), unlogged (1/Lambert [1/L]), andAGIS/CIGTS VF scores—and RNFL thickness, measured withStratusOCT and GDx VCC, in subjects with glaucoma.
MATERIALS AND METHODS
Subjects
One eye was selected randomly from each of 27 healthy subjects, 21subjects who were glaucoma suspect, and 41 subjects who had glau-coma. All recruited subjects were examined from August to November2004 in the Department of Ophthalmology, Caritas Medical Centre,Hong Kong. Caritas Medical Centre is the ophthalmic referral center inthe Hong Kong Hospital Authority Kowloon West Cluster and serves apopulation of 1.2 million. The study was conducted in accordancewith the ethical standards stated in the 1964 Declaration of Helsinkiand was approved by the Hong Kong Hospital Authority KowloonWest Cluster Clinical Research Ethics Committee with informed con-sent obtained.
All subjects underwent full ophthalmic examination, including vi-sual acuity, refraction, intraocular pressure measurement with Gold-mann tonometry, dilated fundus examination with stereoscopicbiomicroscopy of optic nerve head under slit-lamp, and indirect oph-thalmoscopy. Inclusion criteria were best-corrected visual acuity of notworse than 20/40 and spherical refractive error within the range of–6.00 diopters (D) to �3.00 D. Subjects were excluded if they hadhistory of retinal disease, surgery, laser procedures, diabetes mellitus,or neurologic disease. Healthy subjects visited the clinic during thesame recruitment period and had no ocular or intraocular diseases. Inparticular, they had no VF defects based on the Humphrey VF results,no structural optic disc abnormalities, and no history of intraocularpressure exceeding 21 mm Hg. Glaucoma-suspect subjects were thosewith ocular hypertension, pre-perimetric glaucoma, or both. Ocularhypertension was defined as intraocular pressure greater than 21 mmHg measured in at least three separate visits. Pre-perimetric glaucomawas diagnosed when subjects had been found to have asymmetric cupdisc ratios of �0.2 and early glaucomatous optic disc changes, includ-ing thinning of the neuroretinal rim and notching. However, all sub-jects in the glaucoma-suspect group had normal VF results, as did thecontrol group with healthy eyes. Glaucoma had been diagnosed insubjects based on the presence of VF defects. Among the 41 patientswith glaucoma, 21 had primary open-angle glaucoma, 13 had normal-tension glaucoma, 6 had primary angle-closure glaucoma, and 1 haduveitic glaucoma.
Visual Sensitivity Measurements
Visual fields were evaluated with the Humphrey visual field analyzer(central 24-2 SITA fast program; Humphrey Instruments). HumphreyVF test results were considered reliable when the fixation loss was�20% and the false-positive and false-negative error rates were �25%.A VF defect was defined as three or more significant (P � 0.05)non–edge-contiguous points, with at least one at the P � 0.01 level onthe same side of the horizontal meridian in the pattern deviation plotand classified outside normal limits in the glaucoma hemifield test. Any
detected field defect had to be confirmed in at least one other attemptto be classified as abnormal. Average visual sensitivity was expressed in3 different forms: MD, unlogged 1/L scale, and AGIS and CIGTS VFscores. MD represents an age-matched average visual sensitivity indexexpressed in decibels. It is calculated based on the total deviation plotin the Humphrey VF analysis. Differential light sensitivity at each testedlocation is measured in decibels, where the differential light sensitivity(dB) � 10 � log10 (Lmax/(Lt –Lb), with Lmax is the maximal stimulusluminance, Lt is the stimulus luminance at threshold, and Lb is thebackground luminance. For simplicity, this relationship can be writtenas 10 � log10 (1/L). The unlogged 1/L at each tested location wascalculated by dividing the decibel unit by 10 and then unlogging it. Theaverage value was then evaluated. Each VF in the glaucoma group wasalso analyzed to determine the AGIS/CIGTS VF scores. Both scoringsystems use 20-interval scales, with 0 representing no defect and 20representing severe damage. The scorings of the VFs were computedaccording to the original descriptions in the respective trials.13,14
Optical Coherence Tomography Measurements
StratusOCT (Carl Zeiss Meditec) with software version 3.0.1 was usedin the study. Detailed descriptions of the optical principles and appli-cations of optical coherence tomography (OCT) have been de-scribed.15 The RNFL (3.4) scan (with 512 scan points) was selected forRNFL measurement. RNFL thickness was measured by averaging theresults of 3 sequential circular scans with 3.4-mm diameters centeredat the optic nerve head. The parameter, average RNFL thickness, isobtained in the analysis printout. A good-quality scan was defined asone with a signal-to-noise ratio of �35, 100% accepted A-scans, andwell-delineated anatomic boundaries. A subject would be excludedfrom the study if the OCT image was not of good quality after 3attempts. All OCT scans were of good quality, and no subject wasexcluded.
Scanning Laser Polarimetry Measurements
Scanning laser polarimetry (SLP) measurements were performed withthe use of GDx VCC (Laser Diagnostic Technologies). Images wereanalyzed with software version 5.5.0. The principles and applicationsof SLP have been described elsewhere.16 The parameter TSINT aver-age, equivalent to the average RNFL thickness, in the analysis printoutwas used in the study. Nine eyes were excluded in this study becauseof suboptimal scanning quality secondary to poor fixation, motionartifacts, or overilluminated images.
All measurements (VF sensitivity and OCT/SLP–measured RNFLthickness) were obtained within the same study period (August–November 2004).
Statistical Analysis
Differences in age, refraction, and VF MD among the diagnostic groupswere evaluated with one-way ANOVA. Bonferroni correction was usedfor multiple comparisons. In all analyses, P � 0.05 was consideredstatistically significant.
Relationships between average RNFL thickness and visual sensitiv-ity were evaluated with linear and nonlinear regression analyses. Thelinear model (y � ax � b) was compared with four common nonlinearmodels, including the second-order polynomial (y � ax2 � bx � c),the third-order polynomial (y � ax3 � bx2 � cx � d), the first-orderinverse (y � a ln(x) � b), and the logarithmic regressions (y � a log(x)� b). In regression analysis, the goodness-of-fit of any particular re-gression model is expressed as the coefficient of determination, R2,which indicates how much of the total variation in the dependentvariable can be accounted for by the regression function. However, itis not possible to determine whether model A is more correct thanmodel B in describing the relationship profile based on the value of R2
because the model with more parameters often has a higher R2 thanthe model with fewer parameters. The extra-sum-of-square F test andthe Akaike information criterion (AIC) are two mathematical ap-proaches that take model complexity (the number of data points and
IOVS, October 2005, Vol. 46, No. 10 Structure/Function Relationship in Glaucoma 3703
the number of parameters) into account in calculating the F ratio andthe AIC difference, respectively, to determine which regression modelto accept.
The F ratio is calculated by comparing the relative difference in thesum-of-square with the relative difference in the degrees of freedom oftwo nested (related) models. When comparing model A (the simplermodel) and model B (the more complicated model),
F ratio ��SSA � SSB�/SSB
�DFA � DFB�/DFB
where SSA and SSB are the sum-of-squares and DFA and DFB are thedegrees of freedom of models A and B, respectively. Probability is thencomputed based on the F ratio. The hypothesis is to test whether the
alternative nonlinear model is better than the linear model. If P � 0.05,one can conclude that the alternative nonlinear model fits better thanthe linear model. If P � 0.05, the null hypothesis would stipulateaccepting the linear model. The major drawback in using the F ratio isthat it only applies to nested models when one model has moreparameters (i.e., is more complex) than the other. In the currentanalysis, the F test was used when comparing the linear, second-order,and third-order polynomials.
The AIC adopts another mathematical approach that can be used tocompare nested and nonnested models. The concepts and applicationsof AIC have been described in detail by Burnham and Anderson.17
Because the logic behind AIC is not hypothesis testing, there is no Pvalue in the calculation. The model with the lowest AIC is more likelyto be correct, and the difference in corrected AIC (AICc) betweenmodel A and model B is defined as:
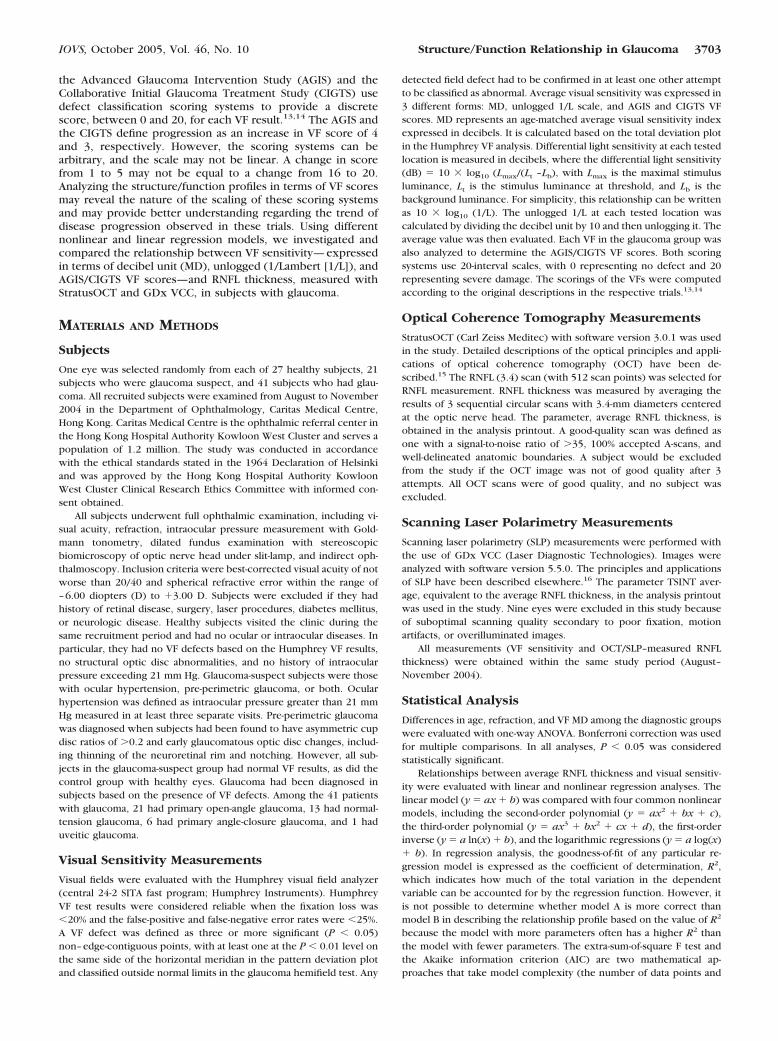
FIGURE 1. Scatter plot of visual field sensitivity, expressed in mean deviation (MD [dB]), against the retinal nerve fiber layer measured with GDxVCC (A) and StratusOCT (B). Linear and nonlinear regression models are compared with the F test and AICc. The best-fit model is highlighted withthe corresponding regression profile, and the equation is indicated in the scatter plot. All subjects were included in the analysis (n � 89).
TABLE 1. Subject Characteristics
Normal Suspect Glaucoma P*
No. of subjects 27 21 41 —Age (yrs) mean � SD 47.9 � 13.8 55.9 � 16.6 59.1 � 11.7 0.005†Refraction (D) mean � SD 0.37 � 2.17 1.35 � 3.34 0.05 � 2.28 0.124Visual field MD (dB) � SD 1.47 � 1.03 1.42 � 1.47 11.1 � 7.74 �0.001‡TSNIT Average (�m) (GDx VCC) 55.26 � 4.32 52.94 � 5.47 38.66 � 7.64 �0.001‡Average RNFLT (�m) (StratusOCT) 101.38 � 7.73 96.91 � 12.16 65.34 � 14.08 �0.001‡
* Analysis of variance with Bonferroni correction.† Significant difference was noted between glaucoma and normal groups (P � 0.004).‡ Significant differences were noted between glaucoma and normal groups (P � 0.001) and glaucoma
and suspect groups (P � 0.001).
3704 Leung et al. IOVS, October 2005, Vol. 46, No. 10
AICcB � AICcA � N � ln (SSB/SSA) � 2KB � 2KA
� 2KB(KB � 1)/�N � KB � 1� � 2KA�KA � 1�/�N � KA 1)
where N is the number of data points, SS is the sum-of-square of thevertical distances of the points from the regression equations, and K isthe number of parameters in the model plus 1. As in the F test, thedifference in AICc is calculated with reference to the sum-of-squaresand the number of parameters of the models compared. The probabil-ity that a particular model is correct in a comparison is given as:
Probability � e0.5(AICcB AICcA)/(1 � e0.5(AICcB AICcA))
The evidence ratio is defined as the probability that model A iscorrect divided by the probability that model B is correct. By conven-tion, it is arranged to give a value greater than 1. Therefore, theevidence ratio should be interpreted with reference to the values ofthe probability of correct fitting. An evidence ratio of 2 describes onemodel as twice as likely to be correct as another. The difference inAICc is linearly correlated with the evidence ratio. In the present study,the linear model was compared with each of the nonlinear regressionmodels. The probability of correct fitting, the difference in AICc, theevidence ratio, and the P value of the F test (in nested models only)were computed. All these parameters, though expressed in differentforms, are in agreement with each other to determine which one is thebest-fit regression model.
RESULTS
Subject Characteristics
Table 1 presents the baseline characteristics of the studiedsubjects. The average VF MD (�SD) of the glaucoma group was–11.1 � 7.74 dB, with a range of VF defect from –2.36 dB to–30.00 dB.
Regression Analyses of the Structure/FunctionRelationships with StratusOCT and GDx VCC
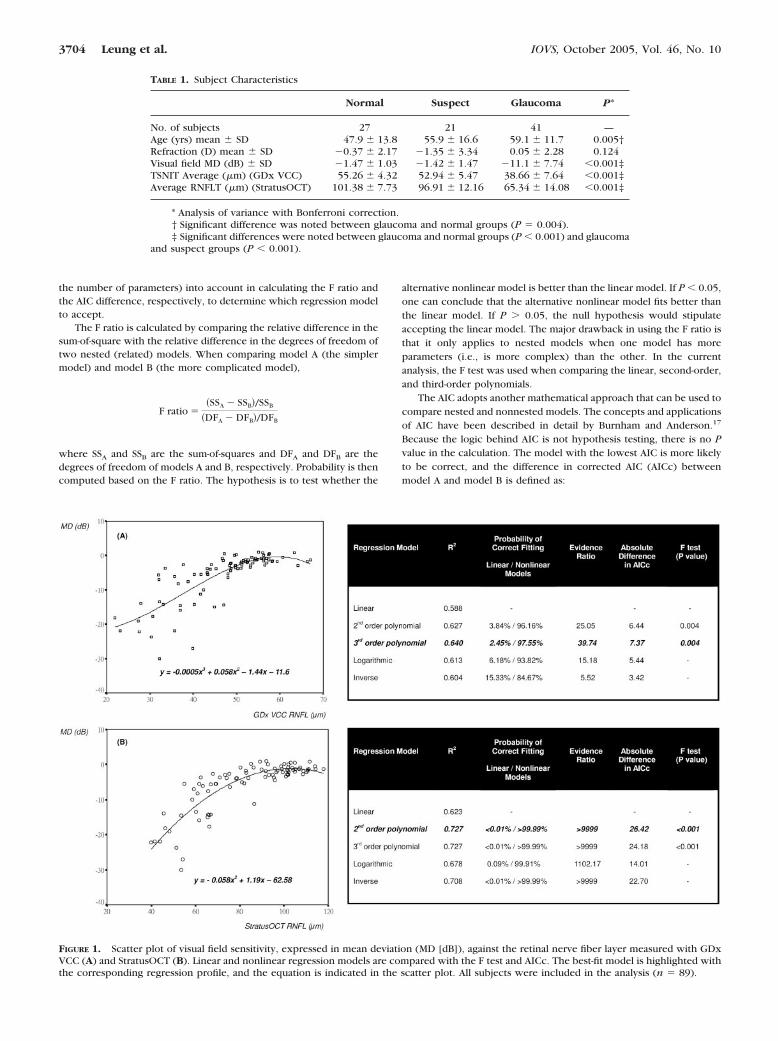
The relationship profiles between RNFL thickness, as mea-sured with StratusOCT and GDx VCC, and VF sensitivity, asexpressed in MD (dB) and the unlogged 1/L, were analyzedusing five different regression models (linear, second-orderpolynomials, third-order polynomials, inverse first-order, andlogarithmic equations). When VF sensitivity MD (dB) was plot-ted against RNFL thickness, the third- and second-order poly-nomial models fit significantly better than the linear model inthe GDx VCC (F test; P � 0.004) and the StratusOCT RNFLmeasurements, respectively (F test; P � 0.001) and demon-strated the largest difference in AICc (7.37 and 26.42 for GDxVCC and StratusOCT RNFL measurements, respectively) withrespect to the linear regression models (Fig. 1). However,when VF sensitivity was expressed in the unlogged 1/L scale,simple linear fit had the best association with GDx VCC andStratusOCT RNFL measurements (Fig. 2).
Regression profiles were then reanalyzed with data ob-tained only from the glaucoma-suspect and glaucoma groups.
FIGURE 2. Scatter plot of visual field sensitivity, expressed in the unlogged 1/L scale, against the retinal nerve fiber layer measured with GDx VCC(A) and StratusOCT (B). Linear and nonlinear regression models are compared with the F test and AICc. The best-fit model is highlighted with thecorresponding regression profile, and the equation is indicated in the scatter plot. All subjects were included in the analysis (n � 89).
IOVS, October 2005, Vol. 46, No. 10 Structure/Function Relationship in Glaucoma 3705
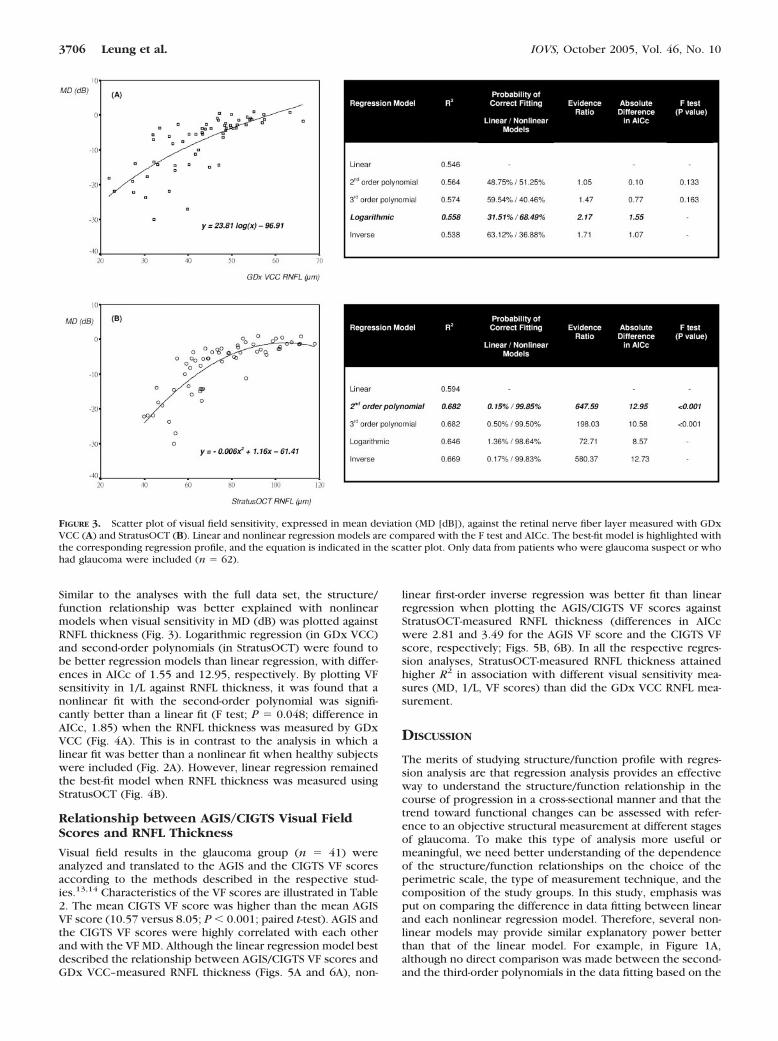
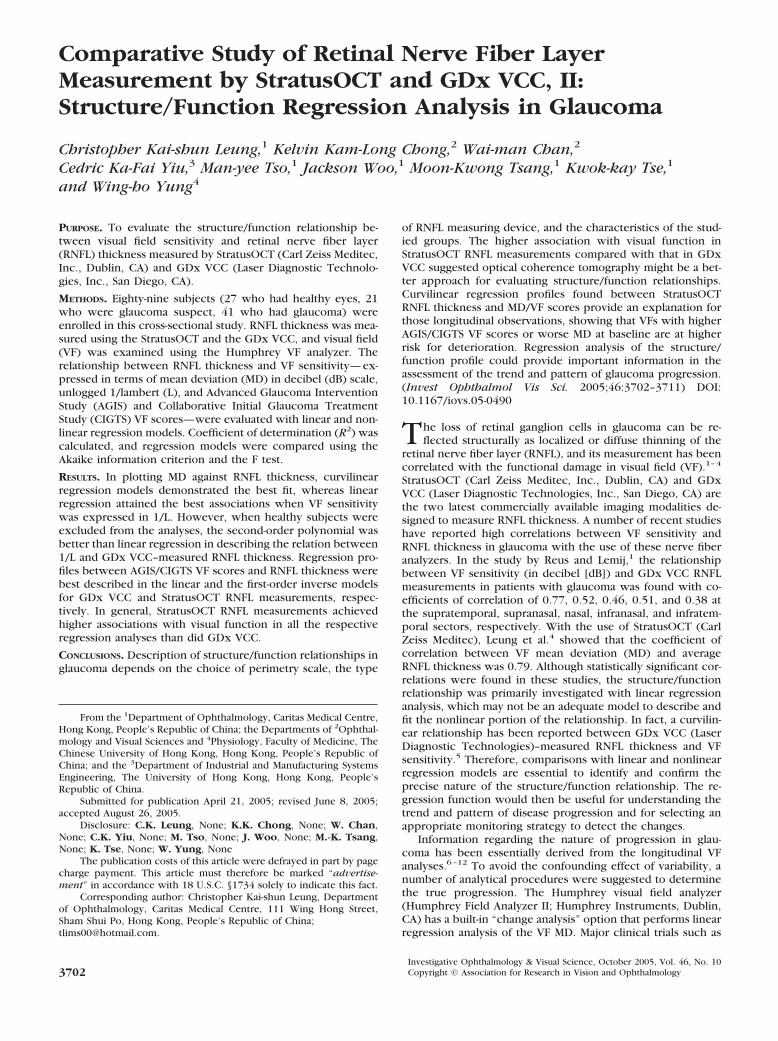
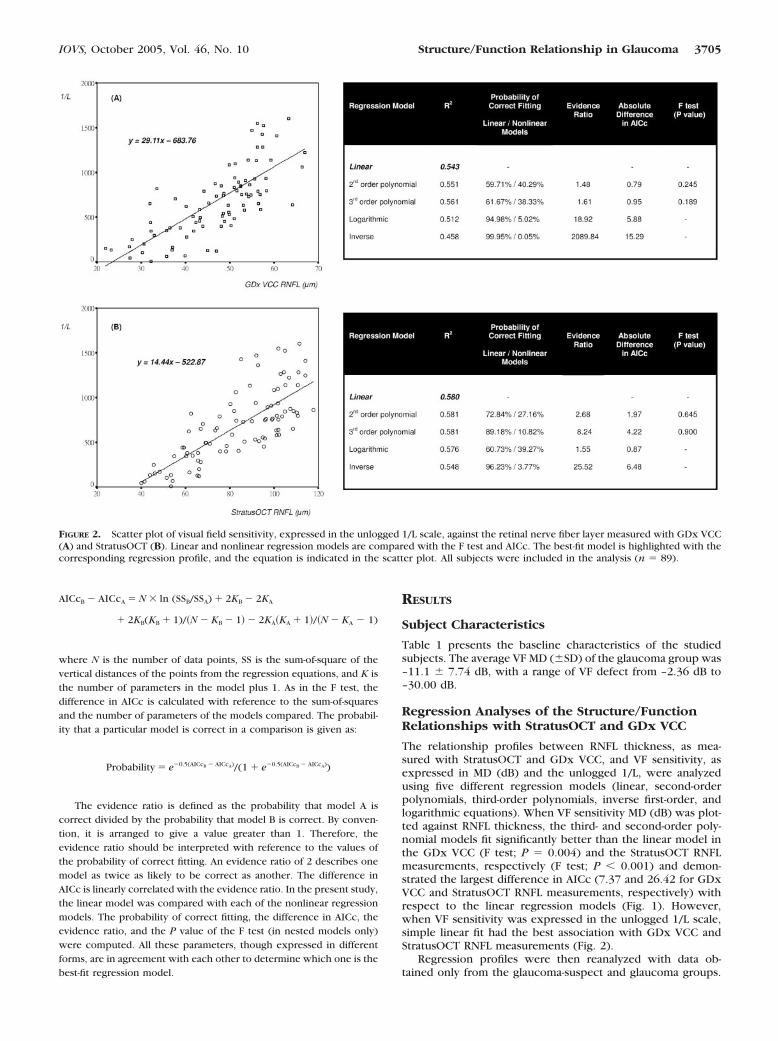
Similar to the analyses with the full data set, the structure/function relationship was better explained with nonlinearmodels when visual sensitivity in MD (dB) was plotted againstRNFL thickness (Fig. 3). Logarithmic regression (in GDx VCC)and second-order polynomials (in StratusOCT) were found tobe better regression models than linear regression, with differ-ences in AICc of 1.55 and 12.95, respectively. By plotting VFsensitivity in 1/L against RNFL thickness, it was found that anonlinear fit with the second-order polynomial was signifi-cantly better than a linear fit (F test; P � 0.048; difference inAICc, 1.85) when the RNFL thickness was measured by GDxVCC (Fig. 4A). This is in contrast to the analysis in which alinear fit was better than a nonlinear fit when healthy subjectswere included (Fig. 2A). However, linear regression remainedthe best-fit model when RNFL thickness was measured usingStratusOCT (Fig. 4B).
Relationship between AGIS/CIGTS Visual FieldScores and RNFL Thickness
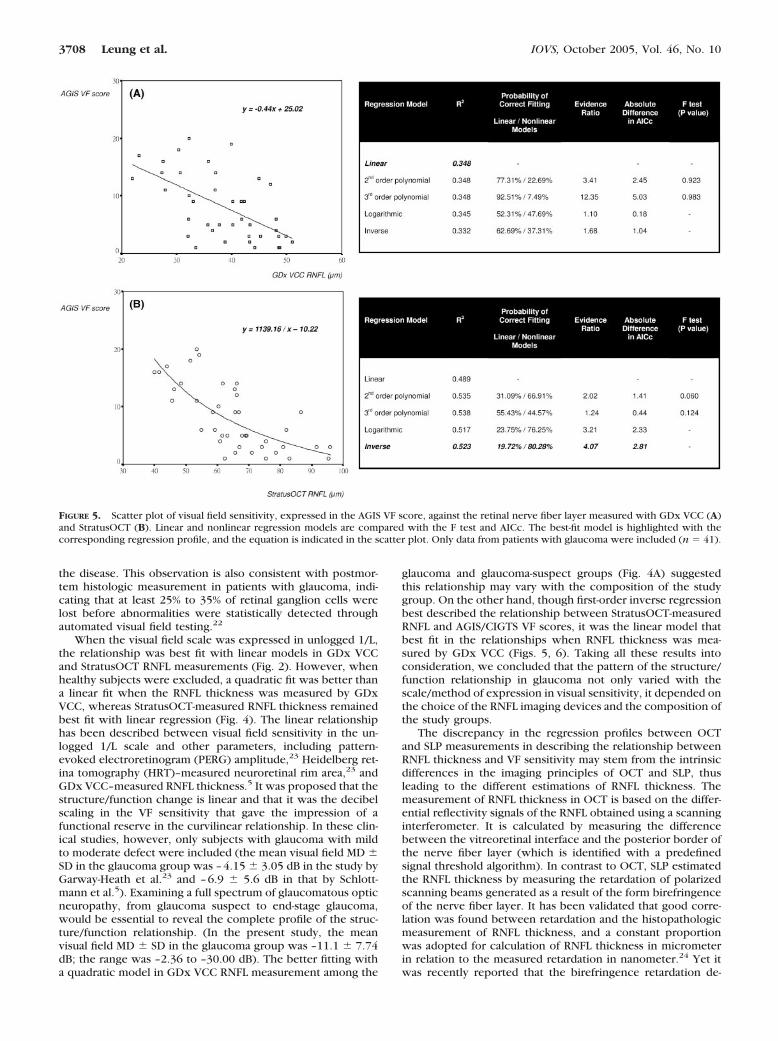
Visual field results in the glaucoma group (n � 41) wereanalyzed and translated to the AGIS and the CIGTS VF scoresaccording to the methods described in the respective stud-ies.13,14 Characteristics of the VF scores are illustrated in Table2. The mean CIGTS VF score was higher than the mean AGISVF score (10.57 versus 8.05; P � 0.001; paired t-test). AGIS andthe CIGTS VF scores were highly correlated with each otherand with the VF MD. Although the linear regression model bestdescribed the relationship between AGIS/CIGTS VF scores andGDx VCC–measured RNFL thickness (Figs. 5A and 6A), non-
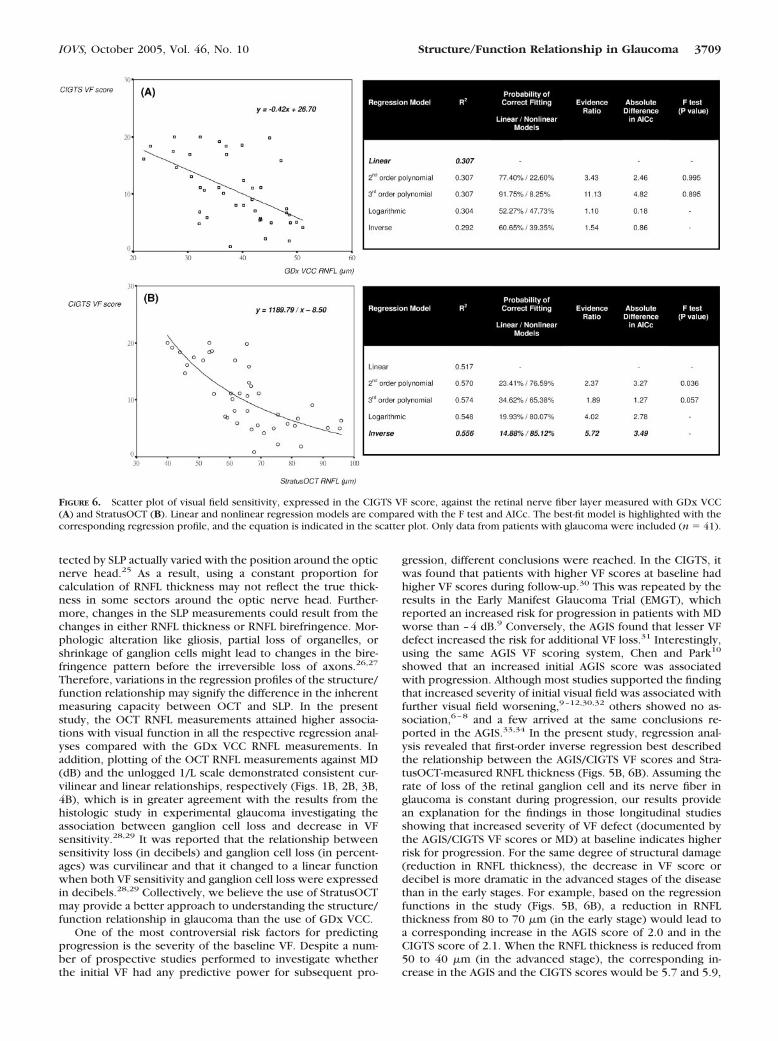
linear first-order inverse regression was better fit than linearregression when plotting the AGIS/CIGTS VF scores againstStratusOCT-measured RNFL thickness (differences in AICcwere 2.81 and 3.49 for the AGIS VF score and the CIGTS VFscore, respectively; Figs. 5B, 6B). In all the respective regres-sion analyses, StratusOCT-measured RNFL thickness attainedhigher R2 in association with different visual sensitivity mea-sures (MD, 1/L, VF scores) than did the GDx VCC RNFL mea-surement.
DISCUSSION
The merits of studying structure/function profile with regres-sion analysis are that regression analysis provides an effectiveway to understand the structure/function relationship in thecourse of progression in a cross-sectional manner and that thetrend toward functional changes can be assessed with refer-ence to an objective structural measurement at different stagesof glaucoma. To make this type of analysis more useful ormeaningful, we need better understanding of the dependenceof the structure/function relationships on the choice of theperimetric scale, the type of measurement technique, and thecomposition of the study groups. In this study, emphasis wasput on comparing the difference in data fitting between linearand each nonlinear regression model. Therefore, several non-linear models may provide similar explanatory power betterthan that of the linear model. For example, in Figure 1A,although no direct comparison was made between the second-and the third-order polynomials in the data fitting based on the
FIGURE 3. Scatter plot of visual field sensitivity, expressed in mean deviation (MD [dB]), against the retinal nerve fiber layer measured with GDxVCC (A) and StratusOCT (B). Linear and nonlinear regression models are compared with the F test and AICc. The best-fit model is highlighted withthe corresponding regression profile, and the equation is indicated in the scatter plot. Only data from patients who were glaucoma suspect or whohad glaucoma were included (n � 62).
3706 Leung et al. IOVS, October 2005, Vol. 46, No. 10
evidence ratio, it is evident that the third-order polynomial is39.74 times more likely to be correct than the linear model,whereas the second-order polynomial is only 25.05 times morelikely to be correct. Although it is true that both the second-and the third-order polynomials fit better than the linear model,highlighting only one model would enable identifying themodel with the highest evidence ratio and the largest differ-ence in AICc. The strength of AIC in comparing linear andnonlinear models is that it selects the best model based on theprobability of correct fitting but not of hypothesis testing. Forthat reason, the concept of power calculation is not applicablein AIC for regression model comparison. The fact that signifi-cant differences were found in the F test given the currentsample size provides evidence that the sample size was ade-quate for detecting some existing differences.
The relationship between RNFL thickness and VF MD wasfound to be better fit with all the nonlinear models examined(best fit with the third- and the second-order polynomials for
GDx VCC and StratusOCT RNFL measurements, respectively)compared with the linear model (Fig. 1). However, becausehealthy subjects and subjects with glaucoma were included inthe analysis, one could argue that the flatter portion of thecurve may represent the wide variations in RNFL thicknessamong healthy persons and may give the false impression of afunctional reserve in the early stage of the disease (using OCTas an example, average RNFL thicknesses have been reportedfrom 80 to 150 �m in various studies18–21). To eliminate thisfactor, therefore, we excluded healthy persons in the secondanalysis (Fig. 3). It was confirmed that the nonlinear modelswere better than the linear model (best fit with the logarithmicand the second-order polynomials for the GDx VCC and theStratusOCT RNFL measurements, respectively) in analyzing therelationship between RNFL thickness and VF MD. These re-gression models describe a curvilinear structure/function rela-tionship, suggesting that the progression of visual field loss,when it is expressed in MD (dB), increases during the course of
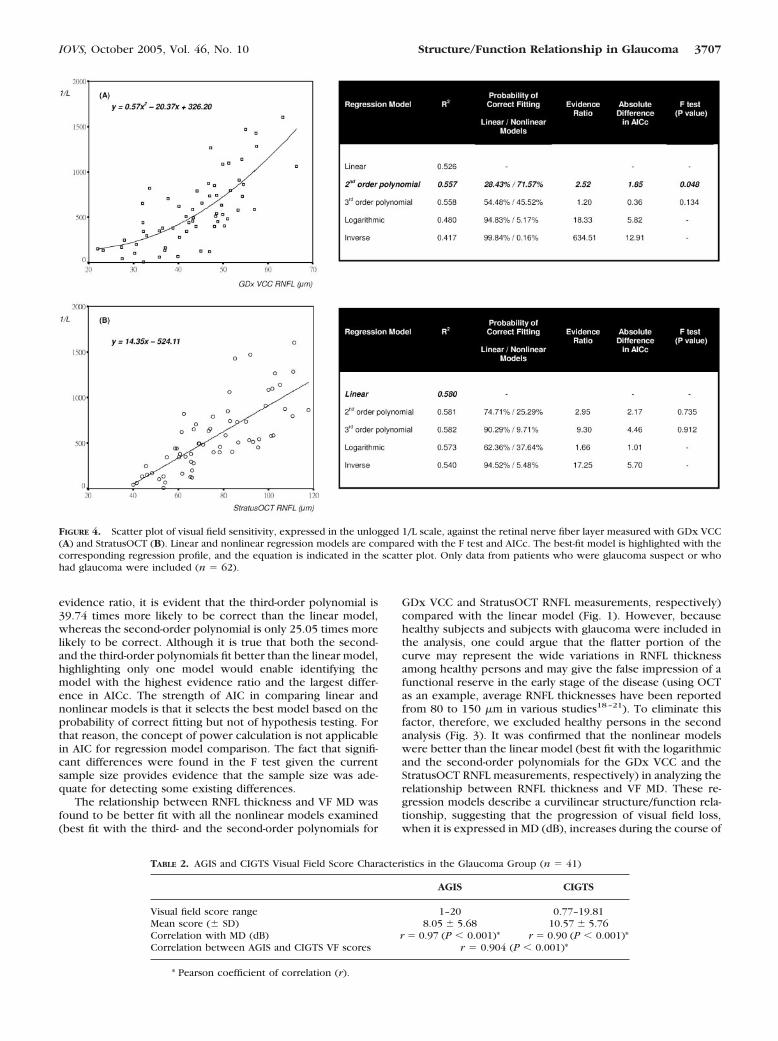
FIGURE 4. Scatter plot of visual field sensitivity, expressed in the unlogged 1/L scale, against the retinal nerve fiber layer measured with GDx VCC(A) and StratusOCT (B). Linear and nonlinear regression models are compared with the F test and AICc. The best-fit model is highlighted with thecorresponding regression profile, and the equation is indicated in the scatter plot. Only data from patients who were glaucoma suspect or whohad glaucoma were included (n � 62).
TABLE 2. AGIS and CIGTS Visual Field Score Characteristics in the Glaucoma Group (n � 41)
AGIS CIGTS
Visual field score range 1–20 0.77–19.81Mean score (� SD) 8.05 � 5.68 10.57 � 5.76Correlation with MD (dB) r � 0.97 (P � 0.001)* r � 0.90 (P � 0.001)*Correlation between AGIS and CIGTS VF scores r � 0.904 (P � 0.001)*
* Pearson coefficient of correlation (r).
IOVS, October 2005, Vol. 46, No. 10 Structure/Function Relationship in Glaucoma 3707
the disease. This observation is also consistent with postmor-tem histologic measurement in patients with glaucoma, indi-cating that at least 25% to 35% of retinal ganglion cells werelost before abnormalities were statistically detected throughautomated visual field testing.22
When the visual field scale was expressed in unlogged 1/L,the relationship was best fit with linear models in GDx VCCand StratusOCT RNFL measurements (Fig. 2). However, whenhealthy subjects were excluded, a quadratic fit was better thana linear fit when the RNFL thickness was measured by GDxVCC, whereas StratusOCT-measured RNFL thickness remainedbest fit with linear regression (Fig. 4). The linear relationshiphas been described between visual field sensitivity in the un-logged 1/L scale and other parameters, including pattern-evoked electroretinogram (PERG) amplitude,23 Heidelberg ret-ina tomography (HRT)–measured neuroretinal rim area,23 andGDx VCC–measured RNFL thickness.5 It was proposed that thestructure/function change is linear and that it was the decibelscaling in the VF sensitivity that gave the impression of afunctional reserve in the curvilinear relationship. In these clin-ical studies, however, only subjects with glaucoma with mildto moderate defect were included (the mean visual field MD �SD in the glaucoma group was –4.15 � 3.05 dB in the study byGarway-Heath et al.23 and –6.9 � 5.6 dB in that by Schlott-mann et al.5). Examining a full spectrum of glaucomatous opticneuropathy, from glaucoma suspect to end-stage glaucoma,would be essential to reveal the complete profile of the struc-ture/function relationship. (In the present study, the meanvisual field MD � SD in the glaucoma group was –11.1 � 7.74dB; the range was –2.36 to –30.00 dB). The better fitting witha quadratic model in GDx VCC RNFL measurement among the
glaucoma and glaucoma-suspect groups (Fig. 4A) suggestedthis relationship may vary with the composition of the studygroup. On the other hand, though first-order inverse regressionbest described the relationship between StratusOCT-measuredRNFL and AGIS/CIGTS VF scores, it was the linear model thatbest fit in the relationships when RNFL thickness was mea-sured by GDx VCC (Figs. 5, 6). Taking all these results intoconsideration, we concluded that the pattern of the structure/function relationship in glaucoma not only varied with thescale/method of expression in visual sensitivity, it depended onthe choice of the RNFL imaging devices and the composition ofthe study groups.
The discrepancy in the regression profiles between OCTand SLP measurements in describing the relationship betweenRNFL thickness and VF sensitivity may stem from the intrinsicdifferences in the imaging principles of OCT and SLP, thusleading to the different estimations of RNFL thickness. Themeasurement of RNFL thickness in OCT is based on the differ-ential reflectivity signals of the RNFL obtained using a scanninginterferometer. It is calculated by measuring the differencebetween the vitreoretinal interface and the posterior border ofthe nerve fiber layer (which is identified with a predefinedsignal threshold algorithm). In contrast to OCT, SLP estimatedthe RNFL thickness by measuring the retardation of polarizedscanning beams generated as a result of the form birefringenceof the nerve fiber layer. It has been validated that good corre-lation was found between retardation and the histopathologicmeasurement of RNFL thickness, and a constant proportionwas adopted for calculation of RNFL thickness in micrometerin relation to the measured retardation in nanometer.24 Yet itwas recently reported that the birefringence retardation de-
FIGURE 5. Scatter plot of visual field sensitivity, expressed in the AGIS VF score, against the retinal nerve fiber layer measured with GDx VCC (A)and StratusOCT (B). Linear and nonlinear regression models are compared with the F test and AICc. The best-fit model is highlighted with thecorresponding regression profile, and the equation is indicated in the scatter plot. Only data from patients with glaucoma were included (n � 41).
3708 Leung et al. IOVS, October 2005, Vol. 46, No. 10
tected by SLP actually varied with the position around the opticnerve head.25 As a result, using a constant proportion forcalculation of RNFL thickness may not reflect the true thick-ness in some sectors around the optic nerve head. Further-more, changes in the SLP measurements could result from thechanges in either RNFL thickness or RNFL birefringence. Mor-phologic alteration like gliosis, partial loss of organelles, orshrinkage of ganglion cells might lead to changes in the bire-fringence pattern before the irreversible loss of axons.26,27
Therefore, variations in the regression profiles of the structure/function relationship may signify the difference in the inherentmeasuring capacity between OCT and SLP. In the presentstudy, the OCT RNFL measurements attained higher associa-tions with visual function in all the respective regression anal-yses compared with the GDx VCC RNFL measurements. Inaddition, plotting of the OCT RNFL measurements against MD(dB) and the unlogged 1/L scale demonstrated consistent cur-vilinear and linear relationships, respectively (Figs. 1B, 2B, 3B,4B), which is in greater agreement with the results from thehistologic study in experimental glaucoma investigating theassociation between ganglion cell loss and decrease in VFsensitivity.28,29 It was reported that the relationship betweensensitivity loss (in decibels) and ganglion cell loss (in percent-ages) was curvilinear and that it changed to a linear functionwhen both VF sensitivity and ganglion cell loss were expressedin decibels.28,29 Collectively, we believe the use of StratusOCTmay provide a better approach to understanding the structure/function relationship in glaucoma than the use of GDx VCC.
One of the most controversial risk factors for predictingprogression is the severity of the baseline VF. Despite a num-ber of prospective studies performed to investigate whetherthe initial VF had any predictive power for subsequent pro-
gression, different conclusions were reached. In the CIGTS, itwas found that patients with higher VF scores at baseline hadhigher VF scores during follow-up.30 This was repeated by theresults in the Early Manifest Glaucoma Trial (EMGT), whichreported an increased risk for progression in patients with MDworse than –4 dB.9 Conversely, the AGIS found that lesser VFdefect increased the risk for additional VF loss.31 Interestingly,using the same AGIS VF scoring system, Chen and Park10
showed that an increased initial AGIS score was associatedwith progression. Although most studies supported the findingthat increased severity of initial visual field was associated withfurther visual field worsening,9–12,30,32 others showed no as-sociation,6–8 and a few arrived at the same conclusions re-ported in the AGIS.33,34 In the present study, regression anal-ysis revealed that first-order inverse regression best describedthe relationship between the AGIS/CIGTS VF scores and Stra-tusOCT-measured RNFL thickness (Figs. 5B, 6B). Assuming therate of loss of the retinal ganglion cell and its nerve fiber inglaucoma is constant during progression, our results providean explanation for the findings in those longitudinal studiesshowing that increased severity of VF defect (documented bythe AGIS/CIGTS VF scores or MD) at baseline indicates higherrisk for progression. For the same degree of structural damage(reduction in RNFL thickness), the decrease in VF score ordecibel is more dramatic in the advanced stages of the diseasethan in the early stages. For example, based on the regressionfunctions in the study (Figs. 5B, 6B), a reduction in RNFLthickness from 80 to 70 �m (in the early stage) would lead toa corresponding increase in the AGIS score of 2.0 and in theCIGTS score of 2.1. When the RNFL thickness is reduced from50 to 40 �m (in the advanced stage), the corresponding in-crease in the AGIS and the CIGTS scores would be 5.7 and 5.9,
FIGURE 6. Scatter plot of visual field sensitivity, expressed in the CIGTS VF score, against the retinal nerve fiber layer measured with GDx VCC(A) and StratusOCT (B). Linear and nonlinear regression models are compared with the F test and AICc. The best-fit model is highlighted with thecorresponding regression profile, and the equation is indicated in the scatter plot. Only data from patients with glaucoma were included (n � 41).
IOVS, October 2005, Vol. 46, No. 10 Structure/Function Relationship in Glaucoma 3709
respectively. Therefore, it is easier to detect the change in VFprogression in VF scores during the moderate/advanced stagesof disease, leaving the impression of increased risk for progres-sion when the baseline VF scores are high. Therefore, thecurrent AGIS and CIGTS scoring systems are considered lesssensitive for detecting progression in the early stages of glau-coma because the steps for progression (an increase in score of4 in the AGIS and 3 in the CIGTS) is defined independently ofthe disease stage. Consistent with earlier investigations, wedemonstrated the CIGTS VF scores were systematically higherthan the AGIS VF scores, and both scorings were highly cor-related with each other and with the VF MD.35,36 Our resultsare also consistent with the findings of longitudinal studiesshowing that the CIGTS scoring method leads to higher rates ofdetection of disease progression than the AGIS scoring sys-tem.35,37
StratusOCT and GDx VCC are the latest versions of com-mercially available nerve fiber analyzers, but longitudinal dataare still lacking regarding the change in RNFL during glaucomaprogression. It is unknown whether the rate of loss of RNFL isconstant at different stages of glaucoma; in addition, the tem-poral relationship in structure/function change is not com-pletely understood. Knowing these factors would have greatimpact on the interpretation on the structure/function regres-sion profile. A prospective follow-up study is essential to cross-validate the structure/function regression models.
CONCLUSIONS
In summary, we found the relationship between RNFL thick-ness and VF sensitivity varied not only with the scales andmethods of VF expression (MD, unlogged 1/L, and VF scores)but with the type of RNFL imaging devices (OCT versus SLP)and the characteristics of the studied groups. Although deter-mining true progression remains a major challenge in themanagement of glaucoma, quantitative nerve fiber layer imag-ing may offer a new paradigm for understanding glaucomaprogression and may serve as an objective standard to correlatewith functional loss.
References
1. Reus NJ, Lemij HG. The relationship between standard automatedperimetry and GDx VCC measurements. Invest Ophthalmol VisSci. 2004;45:840–845.
2. El Beltagi TA, Bowd C, Boden C, et al. Retinal nerve fiber layerthickness measured with optical coherence tomography is relatedto visual function in glaucomatous eyes. Ophthalmology. 2003;110:2185–2191.
3. Lan YW, Henson DB, Kwartz AJ. The correlation between opticnerve head topographic measurements, peripapillary nerve fibrelayer thickness, and visual field indices in glaucoma. Br J Ophthal-mol. 2003;87:1135–1141.
4. Leung CK, Chan WM, YM Hui, et al. Analysis of retinal nerve fiberlayer and optic nerve head in glaucoma with different referenceplane offsets using optical coherence tomography. Invest Ophthal-mol Vis Sci. 2005;46:891–899.
5. Schlottmann PG, De Cilla S, Greenfield DS, et al. Relationshipbetween visual field sensitivity and retinal nerve fiber layer thick-ness as measured by scanning laser polarimetry. Invest Ophthal-mol Vis Sci. 2004;45:1823–1829.
6. Smith SD, Katz J, Quigley HA. Analysis of progressive change inautomated visual fields in glaucoma. Invest Ophthalmol Vis Sci.1996;37:1419–1428.
7. Katz J, Gilbert D, Quigley HA, et al. Estimating progression ofvisual field loss in glaucoma. Ophthalmology. 1997;104:1017–1025.
8. Rasker MT, van den Enden A, Bakker D, et al. Rate of visual fieldloss in progressive glaucoma. Arch Ophthalmol. 2000;118:481–488.
9. Leske MC, Heijl A, Hussein M, et al. Factors for glaucoma progres-sion and the effect of treatment: the early manifest glaucoma trial.Arch Ophthalmol. 2003;121:48–56.
10. Chen PP, Park RJ. Visual field progression in patients with initiallyunilateral visual field loss from chronic open-angle glaucoma. Oph-thalmology. 2000;107:1688–1692.
11. Martinez-Bello C, Chauhan BC, Nicolela MT, et al. Intraocularpressure and progression of glaucomatous visual field loss. Am JOphthalmol. 2000;129:302–308.
12. Ishida K, Yamamoto T, Kitazawa Y. Clinical factors associated withprogression of normal-tension glaucoma. J Glaucoma. 1998;7:372–377.
13. Advanced Glaucoma Intervention Study, 2: Visual field test scoringand reliability. Ophthalmology. 1994;101:1445–1455.
14. Musch DC, Lichter PR, Guire KE, et al. The Collaborative Initial GlaucomaTreatment Study: study design, methods, and baseline characteristics ofenrolled patients. Ophthalmology. 1999;106:653–662.
15. Huang D, Swanson EA, Lin CP, et al. Optical coherence tomogra-phy. Science. 1991;254:1178–1181.
16. Weinreb RN, Shakiba S, Zangwill L. Scanning laser polarimetry tomeasure the nerve fiber layer of normal and glaucomatous eyes.Am J Ophthalmol. 1995;119:627–636.
17. Burnham KP, Anderson DR. Information and likelihood theory: abasis for model selection and inference. In: Model Selection andMultimodal Inference: A Practical Information and TheoreticApproach. 2nd ed. New York: Springer; 2002;49–97.
18. Schuman JS, Pedut-Kloizman T, Hertzmark E, et al. Reproducibilityof nerve fiber layer thickness measurements using optical coher-ence tomography. Ophthalmology. 1996;103:1889–1898.
19. Guedes V, Schuman JS, Hertzmark E, et al. Optical coherencetomography measurement of macular and nerve fiber layer thick-ness in normal and glaucomatous human eyes. Ophthalmology.2003;110:177–189.
20. Varma R, Bazzaz S, Lai M. Optical tomography-measured retinalnerve fiber layer thickness in normal Latinos. Invest OphthalmolVis Sci. 2003;44:3369–3373.
21. Bowd C, Weinreb RN, Williams JM, et al. The retinal nerve fiberlayer thickness in ocular hypertensive, normal, and glaucomatouseyes with optical coherence tomography. Arch Ophthalmol. 2000;118:22–26.
22. Kerrigan-Baumrind LA, Quigley HA, Pease ME, et al. Number ofganglion cells in glaucoma eyes compared with threshold visualfield tests in the same persons. Invest Ophthalmol Vis Sci. 2000;41:741–748.
23. Garway-Heath DF, Holder GE, Fitzke FW, et al. Relationship betweenelectrophysiological, psychophysical, and anatomical measurementsin glaucoma. Invest Ophthalmol Vis Sci. 2002;43:2213–2220.
24. Weinreb RN, Dreher AW, Coleman A, et al. Histopathologic vali-dation of Fourier-ellipsometry measurements of retinal nerve fiberlayer thickness. Arch Ophthalmol. 1990;108:557–560.
25. Huang XR, Bagga H, Greenfield DS, et al. Variation of peripapillaryretinal nerve fiber layer birefringence in normal human subjects.Invest Ophthalmol Vis Sci. 2004;45:3073–3080.
26. Weber AJ, Kaufman PL, Hubbard WC. Morphology of single gan-glion cells in the glaucomatous primate retina. Invest OphthalmolVis Sci. 1998;39:2304–2320.
27. Shou T, Liu J, Wang W, et al. Differential dendritic shrinkage ofalpha and beta retinal ganglion cells in cats with chronic glaucoma.Invest Ophthalmol Vis Sci. 2003;44:3005–3010.
28. Harwerth RS, Carter-Dawson L, Shen F, et al. Ganglion cell lossesunderlying visual field defects from experimental glaucoma. InvestOphthalmol Vis Sci. 1999;40:2242–2250.
29. Harwerth RS, Crawford ML, Frishman LJ, et al. Visual field defectsand neural losses from experimental glaucoma. Prog Retin EyeRes. 2002;21:91–125.
30. Lichter PR, Musch DC, Gillespie BW, et al. Interim clinical out-comes in the Collaborative Initial Glaucoma Treatment Study com-paring initial treatment randomized to medications or surgery.Ophthalmology. 2001;108:1943–1953.
31. Nouri-Mahdavi K, Hoffman D, Coleman AL, et al. Predictivefactors for glaucomatous visual field progression in the Ad-vanced Glaucoma Intervention Study. Ophthalmology. 2004;111:1627–1635.
3710 Leung et al. IOVS, October 2005, Vol. 46, No. 10
32. Wilson R, Walker AM, Dueker DK, et al. Risk factors for rate ofprogression of glaucomatous visual field loss: a computer-basedanalysis. Arch Ophthalmol. 1982;100:737–741.
33. O’Brien C, Schwartz B, Takamoto T, et al. Intraocular pressure andthe rate of visual field loss in chronic open-angle glaucoma. Am JOphthalmol. 1991;111:491–500.
34. Schwartz B, Takamoto T, Martin J. Increased rate of visual fieldloss associated with larger initial visual field threshold values onfollow-up of open-angle glaucoma. J Glaucoma. 2004;13:120 –129.
35. Katz J. Scoring systems for measuring progression of visual fieldloss in clinical trials of glaucoma treatment. Ophthalmology. 1999;106:391–395.
36. Kim J, Dally LG, Ederer F, et al. The Advanced GlaucomaIntervention Study (AGIS), 14: distinguishing progression ofglaucoma from visual field fluctuations. Ophthalmology. 2004;111:2109 –2116.
37. Vesti E, Johnson CA, Chauhan BC. Comparison of different meth-ods for detecting glaucomatous visual field progression. InvestOphthalmol Vis Sci. 2003;44:3873–3879.
IOVS, October 2005, Vol. 46, No. 10 Structure/Function Relationship in Glaucoma 3711
Copyright © 2022 FDOKUMEN