REI - World Bank Documents & Reports
81
RESTR I CTED REI Report No. PA- 18# This report was prepared for use within the Bank and its affiliated organizations. They do not accept responsibility for its accuracy or completeness. The report may not be published nor may it be quoted as representing their views. INTERNATIONAL BANK FOR RECONSTRUCTION AND. DEVELOPMENT INTERNATIONAL DEVELOPMENT ASSOCIATION SECOND LIVESTOCK DEVELOPMENT PROJECT COLOMBIA September 3, 1969 Agriculture Projects Department Public Disclosure Authorized Public Disclosure Authorized Public Disclosure Authorized Public Disclosure Authorized
-
Upload
khangminh22 -
Category
Documents
-
view
1 -
download
0
Transcript of REI - World Bank Documents & Reports
RESTR I CTEDREI Report No. PA- 18#
This report was prepared for use within the Bank and its affiliated organizations.They do not accept responsibility for its accuracy or completeness. The report maynot be published nor may it be quoted as representing their views.
INTERNATIONAL BANK FOR RECONSTRUCTION AND. DEVELOPMENT
INTERNATIONAL DEVELOPMENT ASSOCIATION
SECOND LIVESTOCK DEVELOPMENT PROJECT
COLOMBIA
September 3, 1969
Agriculture Projects Department
Pub
lic D
iscl
osur
e A
utho
rized
Pub
lic D
iscl
osur
e A
utho
rized
Pub
lic D
iscl
osur
e A
utho
rized
Pub
lic D
iscl
osur
e A
utho
rized

CURRENCY EQUIVAIENTS
US$ 1 - Colombian Pesos 17.20Colombian Peso 1 = US$ 0.o58Colombian Peso 1,000,000 0 US$ 58,140
WEIGHTS AND MEASURES
Metric System
1 kilogram (kg) m 2.20 pounds1,000 kg - 1 metric ton a 0.98 long ton1 meter (m) - 1.09 yards1 kilometer (k2) = 0.62 mile1 hectare (ha) G 10,000 m2 = 2.47 acres1 squi9re kilometer = 100 ha = 0.39 square mile
- 247.11 acres1 liter = 0.26 gallon
GLOSSARY OF ABBREVIATIONS
AFF - Agricultural Financing FundCaja - Caja de Credito Agrario, Industrial y MineroCOFIAGRO - Corporation for Promotion of Agriculture and Livestock
ExportsFEDEGAN - Federation of Colombian Livestock ProducersFMD - Foot-and-Mouth-DiseaseGDP l Gross Domestic ProductICA - Agriculture and Livestock Institute of ColombiaIDEMA - Agrarian Marketing InstituteLA?TA - Latin American Free Trade AssociationLDD - Livestock Development DepartmentUSAID - United States Agency for International Development
COLOMBIA
SECOND LIVESTOCK DEVELOPMENT PROJECT
TABLE OF CONTENTS
Page No.
SUMMARY AND CONCLUSIONS . . . . . .
I. INTRODUCTION .1... . . . . . . . . . . . . . . . . . . .
II. BACKGROUND .1... . . . . . . . . . . . . . . . . . . . .
A. General .1... . . . . . . . . . . . . . . . . . . . .B. The Livestock Sub-sector . . . . . . . . . . . . . . . 2C. Animal Health . . . . . . . . . . . . . . . . . . . . . 4D. Government Policies and Agricultural Services . . . . . 5E. The First Livestock Development Project Loan 448-Co . 6
III. THE SECOND PROJECT . . . . . . . . . . . . . 8. . . . . . . 8
A. General Description . . . . . . . . . . . 8. . . . . . . 8B. Detailed Features. 9C. Cost Estimates .11D. Proposed Financing .13E. Procurement . . . . . . . . A . . . . . . . . . . . . . 14F. Disbursements and Auditing . . . . . . . . . . . . . . 15G. Organization and Management . . . . . . . . . . . . . . 15H. Lending Operations . . . . . . . . . . . . . . . . . . 17I. Financial Operating Results . . . . . . . . . . . . . . 17
IV. MARKETS, PRICES AND RANCHERS' BENEFITS . . . . . . . . . . 18
A. Markets and Prices .18B. Ranchers' Benefits . . . . . . . . . . . . . . . . . 18
V. ECONOMIC BENEFITS AND JUSTIFICATION . . . . . . . . . . . . 20
VI. RECOMMENDATIONS . . . . . . . . . . . . . . . . . . . . . . 20
This appraisal report is based on the findings of a mission whichvisited Colombia in January/February 1969. The report was prepared by Messrs.J. C. Gerring, P. G. Nelson, C. M. Bell and J. C. Percival.

ANNEXES
1. Government Policies and Agricultural Services
2. Banking and Credit
3. Loan 448-Co - Details of Investments
4. La Costa - Capital Expenditure and Financing
5. - Model for Beef Cattle Ranch Development
6. - Financial Projections
7. Los Llanos - Capital Expenditure and Financing
8. - Model for Development
9. - Financial Projections
10. Dairy Farms - Capital Expenditure and Financing
11. - Model for Development
12. - Financial Projections
13. Sheep Development Center - Capital Expenditure and Financing
14. - Financial Projections
15. - Flock Projections
16. Sheep Farms - Capital Expenditure and Financing
17. - Model for Development
18. - Financial Projections
19. Phasing of Investment and Financing
20. Cost of Technical Services
21. Project Cash Flow
22. Marketing
23. Economic Rate of Return
24. Organization and Management Organogram
25. The Agrarian Industrial and Mining Credit Bank(Caja de Credito Agrario Industrial y Minero)
MAP

COLOMBIA
SECOND LIVESTOCK DEVELOPMENT PROJECT
SUMMARY AND CONCLUSIONS
i. A livestock project in Colombia is appraised in this report. TheProject is an extension of a development program started in 1966 when BankLoan 448-co of US$ 16.7 million was granted. Although coffee remains themain earner of foreign exchange in the country, livestock accounts for overhalf of agriculture's contribution to the Gross Domestic Product (GDP). TheGovernment recognizes that continued economic growth is to a large degreedependent on modernization of the livestock industry and that livestock pro-ducts could become important export commodities.
ii. Up to September, 1969, loans totalling about US$ 15 million wereapproved under the first project by Caja de Credito Agrario, Industrial yMinero (Caja) - the intermediary credit institution. These were extended toabout 630 operators - 530 beef, 90 dairy and 8 sheep. While the period is tooshort to evaluate a livestock operation, progress has been good and it isevident that the development plans being financed and implemented are soundlybased.
iii. The proposed loan would extend the on-going first projects over afour year period and would be directed at increasing the production of beef,dairy products, and wool, with major emphasis in the North Coast region. Itis estimated that an additional 700 beef ranchers, 250 dairy farmers and 20wool growers would be involved. Incremental investments would be similar tothose in the first project and would be principally for pasture improvement,breeding stock, fencing, buildings, agricultural equipment and machinery.To facilitate the development of a commercial sheep industry, the projectwould establish a Sheep Development Center with breeding and training func-tions.
iv. Loans for farm development would be made by Caja at 14% interestper annum for terms of 12 years, including grace periods of 4 years for beefand dairy producers and 6 years for wool growers. Investments on each ranchwould be phased over three years.
v. Caja - the Administering Agency - would be responsible for projectorganization and management as was the case with the first loan. The Live-stock Development Department within Caja would be responsible for the prepa-ration and implementation of farm development plans. 'The technical staffwould be headed by a technical director, two regional chief technicians, anda technical supervisor of a sheep and wool unit to be established in theLivestock Development Department. Development plans prepared by the technicalstaff and approved by the technical director would be the basis for loan ap-provals by the Project Loan Committee.
vi. Project costs are estimated at about US$ 44.1 million, of whichabout US$ 29.6 million would be for farm development. The remainder would

be for technical services, incremental operating costs, interest paymentsduring development, and short-term finance for feeder steers. Except fornearly one-half, of the cost of technical services, these items would befinanced by Caja and partcipating farmers. Project costs would be financedapproximately as follows:
Amount Percent(USTM)
IBRD 18.3 42
Caja 9.5 21
Ranchers 16.3 37
44.1 100
vii. Project goods that could be ordered in bulk would be procured byCaja through international competitive bidding. This would be fertilizers,pasture seeds, weedicides, and fencing materials. Manufactured inputs forwhich bulk procurement is not practicable and which are available eitherlocally or do not require import licenses, would be obtained through exist-ing commercial channels in Colombia. The Government would enable all othermanufactured items of the type used as Project inputs to be imported byCaja as promptly as needed. All livestock would be locally supplied exceptsheep which would be imported.
viii. Disbursements of the Loan would be made to the Agricultural Financ-ing Fund (AFF), a special fund managed by the Banco de la Republica. Dis-bursements would be made on the following basis:
- 75% of the amount disbursed by Caja for farm loans;
- 60% of disbursements made by Caja for goods and servicesprocured for the development of the Sheep DevelopmentCenter;
- 100% of the foreign exchange cost of technical services.
For goods purchased through international competitive bidding, payments wouldbe made directly from the AFF special fund to such foreign suppliers.
ix. The ratte of return to the economy would be about 22%. Participat-ing livestock producers would earn about 20% to 25% of their incremental in-vestments and would realize substantial increases in their net earnings be-ginning with Years 7-10 when full farm development would be achieved.
x. The second livestock project is suitable for a Bank loan of US$ 18.3million for a term of 18 years including a grace period of 6 years. Abouttwo-thirds of the Loan would cover the estimated foreign exchange component

- iii -
and the other one-third would be for local costs. The Borrower would be theGovernment which would bear the foreign exchange risk. It would on-lend theLoan proceeds through the Agricultural Financing Fund, Banco de la Republica(Central Bank) to Caja at not more than 10.5% interest on the same amortiza-tion as for the, Bank loan.
COLOMBIA
SECOND LIVESTOCK DEVELOPMENT PROJECT
I. INTRODUCTION
1.01 The Government of Colombia has requested a second loan to helpfinance the continuation of its program of livestock development. This wasinitially supported by the Bank with a loan of US$ 16.7 million (448-co),1966. Results of the first project have been satisfactory and commitmentsare more than a year ahead of schedule.
1.02 In connection with the first loan, a joint Bank/FAO mission visitedColoimbia in March/April 1965. This mission assessed the potential of thelivestock industry and, within the framework of an overall development plan,assisted the Colombian authorities to prepare a project suitable for Bankfinancing. The outcome was a three-year development project, administeredby the Caja de Credito Agrario, Industrial y Minero (Caja) embracing threesegments of the livestock industry; namely, beef cattle, dairy cattle andsheep. This first application was appraised by a joint Bank/FAO mission inOctober/November 1965. Because the proposed loan is a continuation of aBank project, a review of the first project is included in this report.
1.03 This appraisal report is based on the findings of a mission whichvisited Colombia in January/February 1969. The mission was composed ofMessrs. J. C. Gerring (leader), P. G. Nelson, C. M. Bell (Bank) and J. C.Percival (Consultant).
II. BACKGROUND
A. General
22.01 Colombia, with an area of 1.14 million km , is the fourth largestcountry in South America. Though situated within the tropics (latitude 130Nto 4OS), its land surface ranges in altitude and contour from low-lying flatplains to open highland savannahs and mountains which rise steeply to morethan 5,000 meters above sea level. In consequence, there are considerablevariations in climate and a wide range of ecological zones. Virtually anykind of crop or pasture can be grown.
2.02 The population, increasing at around 3.2% per annum, is about 20million. Economic growth (GDP) has fluctuated between 3% and 6% per year,in real terms, during the last five years. At the end of 1968, average percapita income was about US$ 287 equivalent.
2.03 Agriculture accounts for about 30% of GDP, 75% of total exports, 95%of the food supply, and over 50% of the supply of industrial raw materials.The sector employs about 50% of the Colombian work force. Coffee currentlyaccounts for 60% of total commodity exports, but because of market limitations
-2-
under the International Coffee Agreement, the Government places high priorityon diversification. Since 1958, growth of non-coffee agriculture has reacheda level of about 4.3% per year, due mainly to an expansion in acreage. Des-pite this, only about a quarter of the land area is now used for agriculture,including livestock production. While there is still much room for furtherexpansion, the real and most immediate need is to intensify productionmethods through improved technology and credit, with the objective to outpacegrowth in domestic demand and thus produce supplies for export. Moderniza-tion, of the livestock sub-sector, and, in particular, the beef cattle sectorwould make an important contribution towards achieving this objective.
2.04 Colombia's foreign exchange gap and the related problem of infla-tion have been the most persistent barriers to sustained growth of the econ-omy. Government policies aim to arrest the past rate of inflation and pro-vide incentives for the development of non-coffee exports within the con-straint of a tight monetary program. Attesting to a measure of success, pricesincreased in 1968 by 6.4%, as compared to 8% in 1967 and 16% in 1966, and minorexports are increasing at the target rate of about 20% per annum. 1/
B. The Livestock Sub-Sector
2.05 Output from the livestock sub-sector, over 80% of which is beef,contributes about 17% of GDP. The cattle industry, in fact, occupies almost90% of the land now used for the whole of the agricultural sector. This im-pressive pasture resource, approximating some 30 million ha, gives someindication of the potential for increasing production. Further vast areas ofboth tropical lowlands and temperate highlands await development.
Beef Cattle
2.o6 The national herd is estimated at around 18 million head. By roughestimate, about 85% is beef and the remainder dairy cattle; combined beef/dairy operations are common. The tropical regions of the North Coast (LaCosta) including the lower Magdalena and Cauca River Valley, contain most ofthe country's beef cattle. In this area, as well as in the middle MagdalenaValley, ranching is more developed than in other parts of the country. Inthe tropical lowlands of the Eastern Plains (Los Llanos), ranching is stillat a more primitive stage and is based on the use of natural unimprovedpastures.
2.07 Since 1963, around 2 million cattle have been slaughtered annually(these official estimates do not include subsistence killings, or illegal ex-ports 2/). This offtake of approximately 12% reflects the present low level
1/ See the Bank's 1968 Economic Report, "Current Economic Position andProspects of Colombia"
2/ Exports for which the foreign exchange iB not surrendered to the CentralBank.
- 3 -
of productivity, as well as the existing potential for a substantial increase.An of'ftake of 20% would be a reasonable target.
2.08 Beef consumption per capita is around 20 kg per year 1/, and atthis level, Colombia has been consuming most of the beef it produces. Highconsumer prices in relation to incomes have limited the growth in domesticdemand; also, producers' prices, averaging US$ 0.30 equivalent per kg live-weight, are higher than most world market prices, which average aroundUS$ C.27. Thus, it is difficult to export under present conditions. Re-cently, a more f'lexible exchange rate and a 15% export tax bonus 2/ haveimproved the prospects for increasing exports. But for these to besignificantly ernlarged and sustained, a major improvement in the presentstandard of ranch and herd management will be essential.
Dairy Cattle
2.09 About 3.5 million cattle contribute to milk production under a widerange of climatic conditions. Methods of production and levels of outputvary considerably. In the temperate zones, dairying is more intensive withEuropean breeds, Holstein and Brown Swiss, predominating. In the tropicalregions, and particularly in the North Coast, Criollo/Zebu crossbred cattleare used as well as beef cows which, in addition to rearing their calves,are commonly milked once daily.
2.10 The more specialized dairy farms tend to be concentrated aroundurban centers. In such areas, land values are high and competition fromcash cropping is considerable. Under these conditions, milk production usingexisting methods is a high-cost, marginal enterprise. Population increaseshave led to a growing consumer demand, and steadily rising prices have broughtabout a considerable extension of the milk producing areas so that processorsare collecting milk from lower-cost producers over gradually increasing dis-tances. The resulting high cost of transport is a critical factor in somezones.
2.11 Milk production is estimated at around 2 million tons per year orbelow 4 litres per day per cow in milk. This is a low average yield. Abouthalf of the milk is consumed directly, largely in the raw state. Most of theremainder is usedi for on-farm production of cottage cheese and butter, witha small percentage (less than 5%) also going into powdered and condensed milk.There is little, if any, control over quality standards.
1/ I'er capita beef consumption in South America ranges from 8 kg (Bolivia)to 80 kg (Argentina).
2/ Exporters of goods, other than coffee and petroleum, are issued taxexemption certificates equivalent in value to 15% of exports. Thesemay be traded at a discount or used after one year of issuance fortax payments.
2.12 While there are no serious technical barriers to considerable in-creases in production, economic factors until recently have imposed severelimitations to expansion. Alternative use of land for high value cash cropsreduced dairying in some areas. In a few areas, the threat of compulsoryacquisition of farms as part of land reform programs acted as a deterrent.Producer price controls in the face of rising costs gave little or no incen-tive to raise output. In consequence of these forces at work, a criticalsupply situation developed in the main consuming centers of Bogota, Medellinand Cali, where population growth has been 6 to 8% per annum.
2.13 In May 1967, price controls were lifted in the larger centers.This action together with a growing regional demand have provided a suitableclimate for introducing modern low-cost production techniques through anextended credit program. Assurances were obtained during negotiations thatthe Government would maintain policies which would encourage the expansionof milk, beef and wool production.
Sheep
2.14 The sheep population is estimated at around 1.3 million. Abouttwo-thirds of the sheep are "Criollo', a native type upgraded to variouslevels by crossing with Suffolk, Romney and Corriedale breeds. They are keptby peasant farmers mostly in small flocks of up to about 20 head. Around1,000 tons of coarse wool are produced annually and used mainly by the cot-tage industries. The remainder is absorbed by the woollen textile industry,which is mostly based on imported fine wools (7,000 to 8,ooo tons are importedannually). Commercial sheep farming in the modern sense is virtually non-existent, yet there are more than 2 million ha of highlands, currently unusedor only of marginal value for other purposes, which could be exploited.
C. Animal Health
2.15 When agricultural services were reorganized in September of lastyear, responsibility for animal health was delegated to the Agriculture andLivestock Institute (ICA). Supervision of vaccine production standards andquality control is a specific responsibility of ICA, but present testingfacilities are inadequate. The manufacture of vaccines has been relinquishedby Government but production on a commercial basis has not been operatinglong enough for performance to be assessed. Measures are being taken to im-prove both the quality and quantity of vaccines produced as well as the over-all facilities for disease control. Assurances were obtained during negotia-tions that the Government would take measures satisfactory to the Bank toimprove the quality and increase the supply of cattle vaccines, and to improvethe overall facilities for disease control.
2.16 The four major animal health problems are: foot-and-mouth disease(FMD), brucellosis, tick infestation, and numerous internal parasites. On-farm preventive measures against FMD vary considerably, from vaccination offattening cattle only to twice yearly vaccination of the herd. The recom-mended practice of vaccinating every four months is seldom practised. For
-5-
this reason, in the proposed Project, assurances were obtained during nego-tiat:Lons that all cattle on Project ranches would be compulsorily vaccinatedagainst FMD. Vaccination of heifer calves against brucellosis, as well asprophylactic measures to control both ticks and internal parasites, are re-ceiving wider acceptance. However, improved nutrition and herd managementpractices are the priority needs to reduce losses and raise production.
D. Government Policies and Agricultural Services
2.17 The Government recognizes that development of the livestock industrycoul(d play a key role in achieving Colombia's objective of a sustained growthin GI)P of 6% per year, in real terms. To this end, the Government has setout to streamline its agricultural services, increase the volume of directedcrediit, and encourage the development of exports (Annex 1).
2.18 General measures to promote exports are a more flexible exchangerate policy and the 15% tax bonus incentive for all exports, except coffeeand petroleum (para 2.08). More specifically, the Government has begun toactivrely promote meat exports through a semi-government lending institution,Corporacion Financiera de Fomento Agropecuario y de Exportaciones (COFIAGRO).This Corporation provides finance for Indugan, a Colombian cattle companyparti.ally financed by IFC, and for exporters of agricultural products; about80% of COFIAGRO's current portfolio is related to beef operations. Domesticmarketing of beef is also being improved; the Government in cooperation withthe USAID has placed special emphasis on the reorganization of slaughteringfacilities. In addition, livestock industry problems in general are underconstant review by the Federacion Colombiaha de Ganaderos (FEDEGAN), an asso-ciation of livestock producers.
2.19 The abolition of milk price controls (para 2.13) has improved theprospects for further development of the dairy industry. Colombia's member-ship in the Latin American Free Trade Association (LAFTA) affects the woolindustry, since trade within this region is subjected to very low importduties; Colombian producers at present receive no special protection orsupport.
2.20 The taxation system, including the level of taxes, has been underreview by a high-level Government Commission and recommendations are nowbeing presented to the Government. Livestock enterprises are taxed in variousways. While the total burden on the producer is substantial, net returnsprovide a reasonable incentive for investments (paras 4.04 and 4.05).
2.21 The entire credit system, which is complex, is also under review bythe Monetary Board. Agricultural credit policy is being studied by the De-partment of Planning. At present, the Caja and Banco Ganadero are the twomost important sources of credit to livestock producers (Annex 2, Table 2).In adldition, conmercial banks are required by law to lend 15% of their de-posits to agriculture including loans for livestock development. Anotherform of credit commonly used in Colombia, known as "cattle-in-partnership",

-6-
is made available in the form of cattle for which the rancher provides pastureand supervision. Profits are shared when the cattle are sold. This systemoperates through both the public (Fondos Ganaderos) 1/ and the private sectors.Although external finance for livestock development is available to supplementdomestic sources there is still an unsatisfied demand for long-term credit.
E. The First Livestock Development Project - Loan 448-Co
General
2.22 The first project, the loan for which became effective on November16, 1966, had the primary objective of increasing the production of beef tomeet a growing domestic demand and to provide a surplus for export. The majorpart of the project, involving 800 farms, was in the North Coast region. Thispart of the country has the highest potential for increasing production aswell as being a logical outlet for beef exports at the port of Barranquilla,which has slaughtering and shipping facilities. A smaller part of the project,involving 90 farms to test certain low-cost techniques for ranch development,was in a designated area of the Eastern Plains, where an extensive type ofranching is still practiced.
2.23 Dairy sector investments were limited to pilot operations in theDepartment of Narino (150 farms), in the Southwest region, and an area aroundBarranquilla in the North (100 farms). The high altitude area of Narino istechnically suited for the development of low-cost dairy manufacturing whicheventually could concentrate on powdered milk. To this end, the project aimedto introduce improved pasture species coupled with modern management techniques,such as those commonly practiced in New Zealand. A successful development alongthese lines would mesh well with the needs of the major consuming centers,which then could supplement their fluid milk supplies with reconstitutedmilk in the off season. In the tropical zone around Barranquilla, wheremixed dairy/beef operations are common, the aim was to stimulate considerableincreases in output of both milk and beef through planned investments onselected farms.
2.24 To determine the feasibility of establishing commercial-size sheepoperations, the project provided for the development of 35 pilot sheep farms.
2.25 To manage the project, a special Livestock Development Department(LDD) was established within the Caja. This Department provides the bank-ing iservices, assesses the creditworthiness of applicant borrowers, assistsranchers in the preparation of farm development plans, and also supervisestheir implementation. The technical services are under a Technical Directorand three Regional Chief Technicians who were internationally recruited.
1/ Specialized livestock credit agencies established in most Departmentsof Colombia and supported by public funds.

-7-
2.26 The total cost of this first project was estimated at US$ 28 mil-lion. Of this, US$ 25 million was allocated for farm development to financesuch items as pasture improvement, fencing, water supplies, stock handlingfacilities, farm buildings.and breeding stock. US$ 1.34 million was setaside for technical services and the remaining US$ 1.66 million for financ-ing machinery for contractors and equipment for dairy cooperatives. TheBank loan of US$ 16.7 million covered 60% of the project cost, including allforeign exchange costs (which amounted to about 33% of the total). The re-maining 40% was shared equally by the Caja and participating ranchers.
2.27 As of September 30, 1969 a total of 630 loans had been approved,committing loan funds equivalent to about US$ 15 million. This representsabout 75% of the US$ 20 million equivalent allocated for this purpose. De-tails of the kind of investments made are set out in Annex 3. All loan fundsare expected to be disbursed by December 1970, one year ahead of the closingdate.
Lending Procedures
2.28 This project has been Colombia's first experience with such alending program for ranch development, based on loans with a term of 12 years,and the loan amounts assessed on the basis of specific investment programsfor each ranch involved. The loan processing procedure includes an estimateof the expected impact of the plan on herd buildup, on the farmer's income,and on his net cash position after payment of interest and principal for theperiod of the loan. Participating ranchers have responded well to the tech-nical service aspects, which combine on-farm inspection of expenditures withadvisory services and periodic review of development plans and problems. Thesystem has proven to be well conceived in terms of the problems at hand andthe project management has made good progress in implementing the project.
lBeef Cattle
2,29 Of the 602 loan applications approved by the end of 1968, 510 werefor beef production, 84 for dairying and eight for sheep operations. In theNiorth Coast zone, where 367 loans for beef development were made, the ranchesvary widely in size, between 100 and 2,000 ha, and average 700 ha; on average,these ranches carry 600 head of cattle. In the Eastern Plains region, where1143 ranch loans were approved, the average size is 5,000 ha carrying 700head, with EL range from 200 to 30,000 ha. The average size of :Loans grantedfor beef operations has been close to the original estimate of IJS$ 25,600.
2.30 The project has been in operation for a little more than two years.From on-ranch observations, it is evident that the development plans beingfinanced and implemented are soundly based. This is particularly true inthe North Coast region. In the Eastern Plains insufficient progress hasbeen made to determine the feasibility of particular pasture establishmenttechniques. To facilitate supervision in this area, the Bank has recentlyfinanced the purchase of a small plane by Caja.

-8-
Dairy Cattle
2.31 In both the Barranquilla and Narino areas, the demand for dairyloans has been less than expected. Demand for credit was initially weak be-cause of low milk prices. Producer incentives have been restored by higherprices in the Barranquilla area, but development in the Narino district isinhibited by the very limited local demand. However, where loans have beenmade, the results are encouraging; higher per cow production has beenachieved together with improvements in carrying capacity. Furthermore,project management has successfully demonstrated that these improvementscan be achieved without the feeding of concentrates, a practice which,because of the ample pasture resources available, cannot now be economicallyjustified.
Sheea
2.32 The introduction of commercial sheep farming to Colombia, even onthe limited scale originally proposed, has met with some difficulties. Thesedifficulties were expected, considering the small amount of local expertisein relation to the investment program (the eight loans issued averageUS$ 53,400 equivalent as against the original estimate of US$ 43,000 equiva-lent). Demand for loan funds has been low and the effort required from projectmanagement has been considerable. In April 1968, a shipment of 5,000 sheep(Romey-Marsh and Corriedales) was imported under the project from New Zealand.These sheep have proved to be highly adaptable to Colombian conditions. Bythe end of the year, 3,000 of these had been distributed to project ranches.
Other Categories
2.33 Under the first project, provision was made for loans to dairy co-operatives and to contractors for the purchase of heavy machinery. The sizeof loans that could be made to cooperatives under Colombian law were, in fact,too small to be attractive, and the anticipated demand from contractors hasnot eventuated. Consequently, no loans have been made for either category.
III. THE SECOND PROJECT
A. General Description
3.01 The Project would be a further stage of the long-range program ofthe Government of Colombia to develop the livestock industry. It would extendthe existing project over a further four years (into 1973) and would continuethe present emphasis on increasing beef production in the North Coast region.About 700 beef ranchers, 250 dairy farmers, and 20 sheep producers would par-ticipate in the Project. On-farm development would generally be spread overa three-year period.
- 9 -
B. Detailed Features
Beef Cattle
3.02 The Project would cover about 500 farms in the North Coast confinedto the Departments of Atlantico, Bolivar, Cesar, Cordoba, Magdalena and Sucre;and 100 farms in the Departments of Meta and Boyaca in the Eastern Plainsregion. A further 100 beef cattle farms in the Magdalena Valley as far Southas Neiva in the Department of Huila would be brought into the Project oncetechnical services are adequate for this purpose. Investments which haveproved to be necessary in the first stage would continue to be financed inthe second. These include fencing, water supply, stock handling facilities,pasture improvement, machinery and equipment, farm buildings and breedingstock.
Cattle Purchases
3.03 Under the first project, breeding cattle purchases were limited toa percentage of the total cost of individual ranch development plans: theycould not exceed 30% in the North Coast and 50% in the Eastern plains.Ranchers have been pressing for an increase in these percentages and, inpractice, most plans have allocated the maximum allowable. The main concernis to ensure that stock purchases are related to a rancher's surplus feedsituation and indicated managerial skill. Thus, it is proposed in the secondProject to base this allowable percentage on the productivity of the appli-cant borrower's existing herd, with a maximum of 50% of individual ranch de-velopment plans. If a ranch had only average production coefficients (wean-ing rates, weight/age ratios, etc.) no further purchases of breeding heiferswould be financed until a significant improvement in productivity had beenachieved. On the other hand, if production coefficients are already wellabove average, then up to 50% of the investment outlay could be used for thepurchase of additional breeding stock. The Project assumes an average of 30%of total investment going for breeding cattle purchases. Assurances as tothe conditions under which breeding stock would be financed were obtainedduring negotiations. In addition provision has been made for short-termfinance for the purchase of feeder steers for fattening.
Pasture Improvement
3.04 In the North Coast and Magdalena Valley areas cattle are grazedmainly on artificial pastures of guinea, puntero, para and pangola grasses,depending upon the environment. In addition to the application of fertiliz-ers, a variety of techniques would be used to improve such pastures rangingfrom surface cultivation and reseeding to complete renewal. In the EasternPlains region, where natural pastures are grazed, it is proposed to try outalternative low-cost methods of introducing improved pasture plants. Ifsuccessful, such methods would be applicable on a wide scale. Trials ofthese different methods are included in the Project.
- 10 -
Dairy Cattle
3.05 The major milk consuming centers in Colombia are Bogota, Medellin,Cali and the urban complex of Barranquilla and Cartagena on the North Coast.The proposed Project would include specialized dairy farms supplying each ofthese centers (see Map). The existing project area in the Department ofNarino, which has already been enlarged to include the Cauca, would be furtherextended to include the Department of Valle to cover a total of 100 dairyfarms. Cali is the chief consuming center in this region. A further 50 dairyfarms would be included in the North Coast to continue the first project inthat region. Two new areas that would be included in the Project are theUbate Valley, north of Bogota and strategically placed to supply the Bogotamarket, and the Ceja Valley, where milk is produced for sale in Medellin.The development of 50 farms in each region would be financed. Since theProject areas selected are reasonably close to consuming centers, no specialproblems of transportation are envisaged. To permit close Project supervision,the 50 farms to be covered in the Ceja Valley would not be brought into theProject before the second year.
3.06 Specialized dairy farming throughout Colombia is characterized bythe feeding of concentrates and by the use of soilage. 1/ In the more temper-ate regions, despite the natural occurrence on much of the land of such valu-able pasture plants as white clover, Yorkshire fog and cocksfoot, there appearsto be little if any appreciation of the part which grazing pastures would playin suibstantially reducing production costs. More intensive use of pastures bygrazing for milk production would eliminate the need for both concentratesand s3oilage at this stage of development. This has been amply demonstratedin the first project. The objective would be to extend this practice and forthis purpose the Project includes pasture improvement, machinery, fencing,water supply, farm roads, buildings, and breeding stock on a total of 250dairy farms.
Sheep
3.07 It is clear that some modifications in the approach of the firstproject will be necessary. Under conditions where neither the farmer norhis men are familiar with the day-to-day operations of a commercial-sizesheep farm, the difficulty of successfully establishing and supervising suchoperELtions has been evident. More emphasis must be given to the provisionof pIofessional services as well as the training of farm workers. It wouldtake a very long time and be expensive to develop a viable sheep industry,based solely on imported sheep. It is, therefore, proposed to use a selectionof the 880,000 native Criollo sheep population. Of these, it is estimatedthat about 30,000 young breeding ewes, with wool of suitable quality, couldbe selected each year for grading-up with purebred Romney or Corriedale rams.Such ewes could be purchased at from a quarter to a third of the price ofimported ewes.
1/ The growing of fodder to be cut green, chopped and fed to stock in shedsor yards.

3.08 The P'roject includes the establishment by the Caja of a Sheep Develop-
ment; Center, covering approximately 1,500 ha. This Center would be used: (i)
as a breeding unit, of approximately 7,000 sheep, to propagate purebred Romney
and Corriedale rams for grading-up purposes; (ii) to train technicians as wellas iarm workers to help with the Project; and (iii) as a demonstration farm forexisting and potential participants in the Project. Investments in this Center
would include the purchase of imported foundation breeding stock, as well as
fencing, pasture improvement, stock handling facilities, buildings and machin-ery. During negotiations, assurances were obtained that the Caja would ac-
quire the use of a suitable area of land for a period and on terms and con-
ditions satisfactory to the Bank.
3.059 Management of the sheep development program, including the Center,
would be vested in a special Sheep and Wool Unit to be established within
the existing L:Lvestock Development Department of the Caja. As with the first
project, assurances were obtained during negotiations that a qualified techni-cal expert, internationally recruited and acceptable to the Bank, would beemployed as the supervisor of the Sheep and Wool Unit for a period and onterms and conditions satisfactory to the Bank.
3.10 Also,, the Project includes the development of 20 more sheep farms
to consist of :Iocally procured sheep, fencing, pasture improvement, machineryand equipment, water supply, stock handling facilities and buildings.
C. Cost Estimates
3.11 Total Project costs are estimated at about US$ 44.1 million. Ofthis amount, about US$ 29.6 million is for actual on-farm investments based
on current prices. A 10% contingency allowance is included to cover unfore-
seerL costs and possible price increases. Incremental operating costs and
retentions during development amount to US$ 2.0 million and cover additionalexpenses arising from the Project as well as the income foregone by the re-tention of breeding stock, which otherwise would be sold for income. These
costs and investments have been assessed over the initial Project period
during which the ranchers' net operating income would be lower than the pre-development levrel. Interest payments during the same period would amountto about uS$ 7.8 million equivalent. Short-term finance for feeder steersis estimated at US$ 3.6 million equivalent and the cost of technical servicesat US$ 1.2 million equivalent. The direct and indirect foreign exchangecomponent of the proposed Project is estimated to be US$ 12.4 million or 28%
of the total cost. The buildup of total cost for major investment categories
is provided in the following table:

- 12 -
(Ps millions) (US$'000 equivalent) TPC-/ FEC-3/Local Foreign Total Local Foreign Total Per Cent
On-Farm Investment
Fencing 30.5 10.2 40.7 1,794 600 2,394 5.4
Water supply 9.3 9.2 18.5 547 541 1,o88 2.5
Corrals and crushes 14.2 - 14.2 836 - 836 1.9
Pasture improvementand weed control 85.7 70.2 155.9 5,042 4,129 9,171 20.8
Equipment 13.5 25.0 38.5 794 1,470 2,264 5.1
Building improvements 31.7 7.9 39.6 1,864 465 2,329 5.3
Access roads and drain-age 3.6 0.4 4.0 212 24 236 0.5
Breeding stock 144.2 2.5 146.7 8,482 147 8,629 19.6
Subtotal 332,7 125.4 458.1 19,571 7,376 26,947 61.1 27.4
Contingencies 30.4 15.1 45.5 1,788 888 2,676 6.1
Subtotal 363.1 140.5 503.6 21,359 8,264 29,623 67.2 27.9
Incremental Operating Costsand Retentions DuringDevelopment 34.0 - 34.0 2,000 - 2,000 4.5 -
Interest During Developmentl/ 70.7 61.2 131.9 4,157 3,602 7,759 17.6 46.4
Short-Term Finance forFeeder Steers 60.9 - 60.9 3,582 - 3,582 8.1 -
Techntical Services
Technical management - 6.4 6.4 - 376 376 o.9
Local staff and training 8.4 1.7 10.1 494 100 594 1.3
Transportation 0.5 1.1 1.6 29 65 94 0.2
Administration 1.6 - 1.6 94 - 94 0.2
Subtotal 10.5 9.2 19.7 617 541 1,158 2.6 46.7
Total Cost 539.2 210.9 750.1 31,715 12,407 44,122 100.0 28.1
1/ Excluding interest on short-term finance.2 Total Project Cost.3/ Foreign Exchange Component.

- 13 -
3.12 Based on experience under the first project, representative modelranches have been constructed to estimate costs of on-farm development (An-nexes 4 - 18). The execution of an individual ranch development plan wouldtake about three years and the total investment period over four years. Thedistribution of costs over this period is shown in Annex 19. Details of theestimated cost of technical services are shown in Annex 20.
D. Proposed Financing
3.13 The total Project cost of US$ 44.1 million would be financed asfollows:
(US$ millions)IBRD _aja Rancher Total
(Amt. F(%) ( (A.(%) mt.) (%) Amount
On-Farm Investment 17.77 60 6.01 20 5.84 20 29.62
Incremental OperatingCosts and Retentionsdur:Lng Development - - - - 2.00 100 2.00
Interest during Development - - - - 7.76 l0o 7.76
Short-Term Finance forFeeder Steers - - 2.86 80 0.72 20 3.58
Technical Services 0.54 47 0.62 53 - - 1.16
Total 18.31 42 9.49 21 16.32 37 44.12
3.14 For on-farm investment, the rancher would on average provide, incash, labor or materials, about 20% of the estimated cost. The Caja wouldadvaLnce the balance of 80% of the cost of farm development as loans to ranchers.About 60% of the total cost of on-farm investment would be met from the pro-ceedls of the proposed Bank loan. (This contribution, together with the foreignexchange cost of technical services, has determined the size of the proposedBank loan.) Caja would contribute the remaining 20% from its own resources.In addition, Caja would undertake to make available 80% of ranchers' short-termcapital requirements, which are associated with cattle fattening operations inthe early development period. It is estimated that these needs would amountto about US$ 3,58 million equivalent. During negotiations, assurances wereobtained that the Caja would provide, promptly as necessary, the local curren-cy finds including the short-term capital required for the Project.
3.15' In addition to their contribution to on-farm investments, rancherswould bear in full the incremental operating costs and interest resultingfrom the Project during the development period as defined in para 3.11. Dur-ing this period, they would also contribute the value of stock retained forbreeding which, without the Project, would be sold for income.

- 14 -
3.16 For the Sheep Development Center, the Caja would provide, in cashor naterials, 40% of the estimated cost. The remaining 60% would be madeavailable to Caja from the Bank loan. Appropriate assurances that Caja wouldprovide the local currency funds including the working capital required wereobtained during negotiations. (Annex 13).
E. Procurement
3.17 With the exception of sheep importations, procurement for the on-going project has taken place through normal commercial channels, includinglocEl representatives of international firms. This has not been wholly sat-isfactory and project execution has suffered because items needed to intro-duce, improved techniques have not been made available. During negotiationsassurances were obtained that procurement for the proposed Project would beaccording to international competitive bidding for items suited to bulkordering; namely, fertilizers, pasture seeds, chemicals for weed control,fencing wire and steel fencing posts. These goods would be procured by Caja,in accordance with the Bank's Guidelines for Procurement and on the basis ofprojected demand for Project inputs. 1/ Where local manufacturers are in aposition to bid for these items, they would be protected by a 15% margin, orthe existing level of customs duties, whichever is less. Manufactured in-puts, including machinery and equipment items for which bulk procurementis less suitable, and which are either available locally or do not requireimport licenses, would be procured through normal commercial channels. TheGove-rnment wouLd enable all other manufactured items of the type used asProject inputs to be imported by the Caja promptly as needed.
3.18 Some of the sheep required for the proposed Project are not avail-able locally and would have to be imported. Since the type and quality ofsheep suitable for Colombian conditions can only be obtained from certainareas, international tendering would not be appropriate for livestock pro-curement. All other livestock requirements would be procured locally. Asfor Loan 448-co, assurances were obtained that livestock purchases, with re-gard to quality, source and animal health standards, would be subject to theapproval of the Technical Director.
1/ The Caja is an established distributor of farm inputs and sells a widerange of agricultural requisites (including imports) at competitiveprices, through more than 400 branches.
- 15 -
F. Disbursements and Auditing
3.19 Disbursements of the proceeds of Loan 448-CO have been linked tosub-loans issued by Caja; 75% of sub-loans have been eligJible for reimburse-ment by the Bank covering 60% of total on-farm investments. It is intendedto make the same contribution to on-farm investments in the proposed Project(para 3.14), but the disbursement arrangements would be changed. Bank dis-bursements of the proposed loan proceeds would be made available to theBorrower through the Agricultural Financing Fund (AFF), a special fund managedby the Banco de la Republica. Such disbursements would be made as follows:(a) against payments under agricultural loans made by CaJa to participatingfarmers (75% of payments made under these loans); (b) in respect of the SheepDevelopment Center, for 60% of payments made by Caja fo,r goods and servicesprociured for its development; and (c) for 100% of the foreign exchange costof technical services including transport equipment and training. In orderto comply with the procurement procedures referred to in para 3.17, part ofthe amounts disbursed against agricultural loans would be used by the Borrowerfor payments made to foreign suppliers for imported goods financed under suchloan,s; these payments would be made directly by the AFF to such foreign sup-pliers out of the proceeds deposited by the Bank in a Special Livestock Ac-count opened in the name of the AFF with the Banco de la Republica. Duringnegotiations, assurances were obtained that the Government of Colombia wouldmake the funds credited to the Special Livestock Account freely convertible.
3.20 Each individual farm development loan would normally be disbursedover three years. With some producers being admitted to the program in thesecond year of operation, disbursement of the Bank loan would involve abouta four-year period. The proposed phasing of investments is contained inAnnex 19.
3.21 Caja accounts as well as those of the Banco de Republica are pre-pared semi-annually and are audited by the Government's Superintendent ofBanks annually. During negotiations, assurances were obtained that the Bankwould regularly receive copies of the Special Livestock Account to be kept byAFF, and that all Project Loan Accounts would be audited annually in a mannersatisfactory to the Bank.
G. Organization and Management
3.22 The organization and management of the Project would be carried outby the Caja. The Livestock Development Department (LDD) of the Caja, estab-lished under Loan 448-CO, would be the Project authority controlling the tech-nical and implementation aspects of the Project. A Technical Supervisor of
- 16 -
the Sheep and Wool Unit would be internationally recruited. During negotia-tions, assurances were obtained that the Caja would continue to employ foursenior technical experts 1/, acceptable to the Bank, during the period of dis-bursement, and under terms and conditions satisfactory to the Bank, to assistin carrying out the Project.
3.23 The Technical Director, with the assistance of the Regional ChiefTechnicians and the Supervisor of the Sheep and Wool Unit, would:
a) be responsible for the execution of the Project;
b) assist in the training of the technicians and outline their(luties and responsibilities;
c) report to the General Manager of the Caja through the AssistantGeneral Manager for Development; and
d) be ultimately responsible for promoting the Project, assistingranchers in the preparation of individual development plans,approving and recommending these plans to the Project Committeeas the basis for lending and for supervising the execution ofplans for which loans are made.
In addition the Technical Director would have the authority to approve theagricultural specialists employed by Caja in the Livestock Development Depart-ment as well as the duties and responsibilities assigned to them. LDD wouldestablish and mnaintain farm records for sample farms as needed for Projectevaluation. No loans under the Project would be made except on the recommen-dation of the Technical Director. The Administrative Director of the LDDwould supervise the banking services necessary to maintain Project Loan Ac-couwts, assess the creditworthiness of applicant borrowers, and collect andrecord repayments. Assurances concerning the management of the Project asset out above were obtained during negotiations.
3.24 The Project Loan Committee, established under Loan 448-co, wouldrat:Lfy ranch development plans and would have the authority to approve allloans recommended by the Technical Director (Annex 24). It would disapproveloan applications only on the basis of the prospective borrower's credit-worthiness, which would be provisionally determined prior to preparation ofthe development plan. Financially and administratively, the Caja would pro-cess the approved loans through its regional offices.
1/ The Technical Director, two Regional Chief Technicians and the TechnicalSupervisor of the Sheep and Wool Unit.

- 17 -
H. Lending Operations
3.25 The proposed loan would be made to the Government. The loan wouldbe for 18 years including a six-year grace period. This term would allow forthe complete repayment of all sub-loans including a possible slippage of upto thtree years. The proceeds of the loan would be channelled through a Spe-cial Livestock Account at the Banco de la Republica, the Agricultural Financ-ing Fund (AFF). The Government would on-lend the loan proceeds to Caja at notmore than 10.5% interest but otherwise on the terms of the Bank loan. Themargin between the Bank lending rate and the Government on-lending rate wouldcontribute toward the foreign exchange risk, which would be carried by Govern-ment. During negotiations, assurances were obtained that the Bank loan wouldbe mELde available to Caja on these terms and that the on-lending operationthrough the AFF would be automatic. All creditworthy applicant farmers inthe project areas would be eligible for sub-loans which Caja would make onthe basis of approved farm development plans at an interest rate of 14% fora term of 12 years. A four year grace period would be granted to beef anddairy producers and, to allow for the slower returns from investments insheep farming, a grace period of six years would be granted to wool producers.Assurances were obtained during negotiations that these terms would be availa-ble to sub-borrowers. (In the ongoing project, sub-loans have been issued at12% interest per annum, from which contributions to the foreign exchange riskwas limited to 2% per annum. Also, in some instances, the repayment periodrequired by Caja has been considerably shorter than 12 years.) Individualfarm development loans above US$ 100,000 equivalent would require prior ap-provel by the Bank as would investments in the Sheep Development Center.
I. Financial Operating Results
3.26 The excpected cash f:low resulting from the Project is in Annex 21.Incoming loan interest would more than cover Caja expenses in the Projectafter an initial period, and repayments and interest together would coverBank loan debt service. The Caja would also be able to recover its own con-tribution of US.$ 9.5 million with interest. Cash surpluses over and abovethat required for debt service would be used for livestock development loans.
- 18 -
IV. MARKETS, PRICES AND RANCHERS' BENEFITS
A. Markets and Prices
4.o1 The additional production of beef, dairy products and wool thatwould result from the Project would be marketed through existing channels(par-as 2.08, 2.18 and 2.19). The marketing system would be capable ofhandling the expected increased levels of output (Annex 22).
4.02 The rate of population growth in Colombia is such that substantialincreases in the levels of domestic demand for beef and dairy products canbe expected. With beef, the influence of this factor could be supplementedby the potential for increasing the existing low level of per capita con-sumption. At existing price levels the additional production of beef anddairy products resulting from the Project would be fully absorbed by pro-jected domestic demand increases. Current beef prices paid to producers ofabout 5.50 pesos per kg liveweight provide adequate incentives to expandproduction but are high by international comparisons. Although this situa-tion should improve, the Project justification does not rely on Colombiaachieving increased export business. A price fall to 4.50 pesos per kgliveweight to producers by Year-4 has been assumed.
4.03 The increased production of wool on project farms would be utilizedby the textile industry which currently imports the bulk of its wool require-ments.
B. Ranchers' Benefits
4.04 The benefits to participating ranchers from investments under theProject are projected in Annexes 4 to 18. The estimates are based on modelsof two representative beef ranches, a dairy farm, and a sheep farm. Expectedresults for each ranch at various stages of development are s=mmarized below:
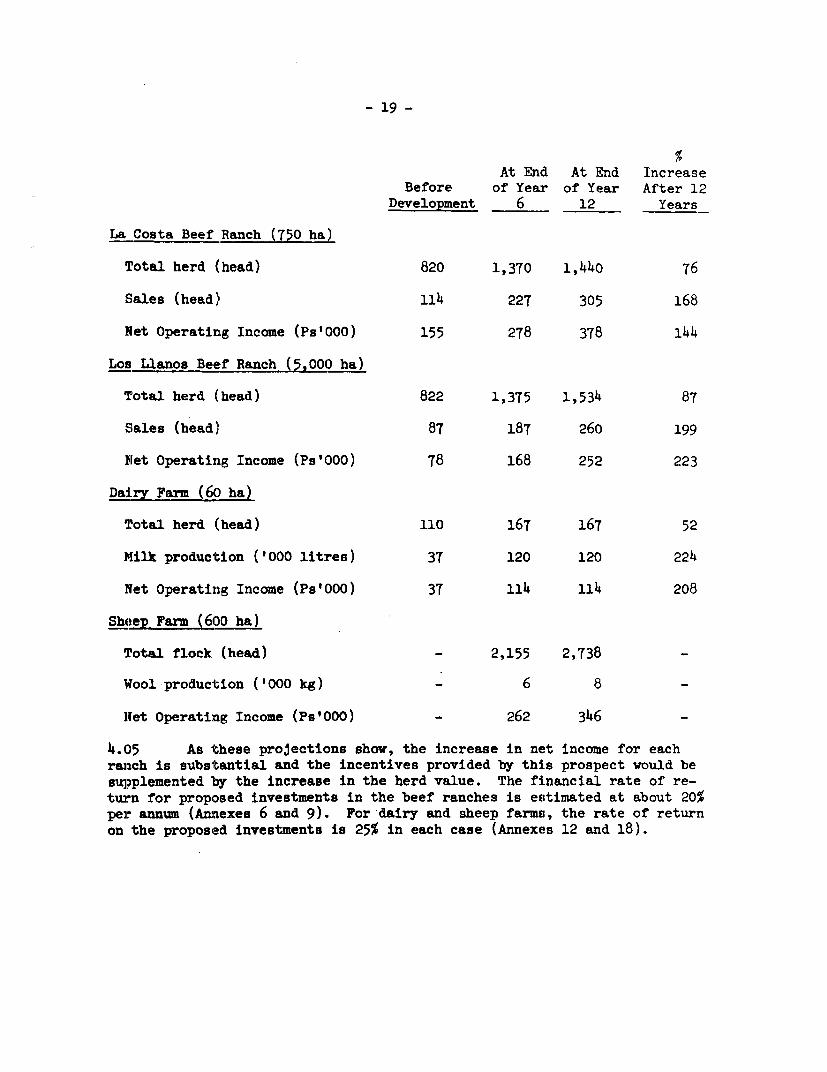
- 19 -
At End At End IncreaseBefore of Year of Year After 12
Development 6 12 Years
La Costa Beef Ranch (750 ha)
Total herd (head) 820 1,370 1,440 76
Sales (head) 114 227 305 168
Bet Operating Income (Ps'000) 155 278 378 144
Los Llanos Beef Ranch (5,000 ha)
Total herd (head) 822 1,375 1,534 87
Sales (head) 87 187 260 199
bNet Operating Income (Ps'000) 78 168 252 223
Dairy Farm (60 ha)
Total herd (head) 110 167 167 52
Milk production ('000 litres) 37 120 120 224
Net Operating Income (Ps'000) 37 114 114 208
Sheep Farm (600 ha)
Total flock (head) - 2,155 2,738 _
Wfool production ('000 kg) 6 8 -
Net Operatinig Income (Ps'000) - 262 346 -
4.05 As these projections show, the increase in net income for eachranch is substantial and the incentives provided by this prospect would be
supplemented by the increase in the herd value. The financial rate of re-
turn for proposed investments in the beef ranches is estimated at about 20%per annum (Annexes 6 and 9). For 'dairy and sheep farms, the rate of returnon the proposed investments is 25% in each case (Annexes 12 and 18).
- 20 -
V. ECONOMIC BENEFITS AND JUSTIFICATION
5.0:L The following table summarizes important direct benefits that wouldresult from the proposed Project:
Before After 8 Full DevelopmentItem Unit Development Years (By Year 12)
(Amt.) (% 1/
Beef production '000 tons 25.3 62.5 69.o 173
Milk production million litres 9.1 30.0 30.0 230
Wool production '000 kg 142.7 184.3 370 2/
Gross Sales Ps'000,000 151.4 325.5 355.5 135
1/ Percentage increase over predevelopment levels.2/ Percentage increase over Year-l.
5.02 The economic rate of return of the overall Project is estimated at22% (Annex 23). This calculation is based on the aggregation of the incre-mental cash flows from which were deducted transfer payments and the cost ofproviding technical services. The rate of return as specified above, wouldbe augmented by a number of nonquantifiable benefits. The Project wouldwiden the introduction of superior livestock production techniques indirectlythrough the demonstration effect. Further, the continued in-service train-ing of local technicians as well as the grants proposed for training abroad,would develop domestic expertise beyond its existing level.
VI. RECOMMENDATIONS
6.01 During negotiations, agreement was reached on the following prin-cipal points:
(a) ProJect inputs suitable for bulk purchasing, i.e.,fertilizers, pasture seeds, chemicals for weedcontrol, fencing wire and steel fencing posts,would be procured on the basis of internationalcompetitive bidding, in keeping with the Bank'sGuidelines for Procurement, (para 3.17);
(b) the Government would enable all manufactured itemsof the type used as Project inputs to be importedby the Caja promptly as needed (para 3.17);

- 21 -
(c) the Government would make funds credited to theSpecial Livestock Account freely convertible andavailable promptly as needed for direct paymentsto foreign suppliers of imported goods financedunder the Project (para 3.19).
6.02 No withdrawals on account of agricultural loans to beef producersin the Magdalena Valley would be made until adequate technical services, sat-isfeLctory to the Bank have been made available by the Caja. The Caja agreedfurthermore that technical services would be made available to the MagdalenaValley area only in so far as this would not adversely affect the adequacyof technical services in the.other Project areas (para 3.02).
6.03 No withdrawals on account of the sheep program would be made until(1) Caja has acquired the use of an area of land satisfactory to the Bank andsuitable for the establishment of the Sheep Development Centre (para 3.08)and (2) Caja has established an adequately staffed Sheep and Wool Unit headedby EL Technical Supervisor acceptable to, and upon terms and conditions satis-factory to the Bank (para 3.09).
6.o4 The proposed Project constitutes a suitable basis for a Bank loanof UIS$ 18.3 million, for a term of 18 years including a 6 year grace period.
AI'iUEX I
COLOMBIA
SECOND LIVESTOCK PROJECT
GOVERNMENT POLICIES AND AGRICULTURAL SERVICES
A. Reorganization of the Public Services to Agriculture
1. In September 1968 the Government of Colombia adopted a plan for thereorganization of the public services to agriculture. Previously there hadbeen some 30 institutions serving the agriculture sector with considerableduplication of effort and fragmented responsibility. With the objective ofproviding a sounder basis for further agricultural development, the Governmentadopted a revised structure involving 10 institutions in a three-tieredarrangement. At the top is the Ministry of Agriculture which directs thework of the operating institutions and other supporting agencies. At themiddle level is the Agriculture and Livestock Development Institute (ICA),the Agrarian Marketing Institute (IDEMA), the Agrarian Reform Institute(INCORA) and the Caja de Credito Agrario Industrial y Minero (Caja). Thethird tier comprises the Coffee Bank, the Livestock Bank (Banco Ganadero),the Institute for the Development of Renewable National Resources (INDERENA),a National MeteLology and Hydrology Institute, a Financial Corporation(COFIAGRO) and an 'mr±te*prise for the production of veterinary products(Empresa Zcoprofilatica).
2. Accompanying this reorganization was the creation of an ExecutiveAgricultural Committee for the purpose of making policy recommendations andcoordinating the work of the different regions. This Committee is chairedby the Minister of Agriculture and consists of the heads of ICA, IDEMA, INCORA,Caja, Banco Ganadero, INDERENA and the Coffee Growers Federation.
ICA
3. This Institute has absorbed all agencies operating in the field of tech-nical research and extension as related to non-coffee agriculture. Inaddition to these functions, ICA is to provide the general services of qualitycontrol of agricultural inputs such as seeds, vaccines) fertilizers andpesticides and has been charged with the responsibility of inspection of allforms of meat and milk for the domestic and export markets and, in addition,is responsible for the regional veterinary diagnostic centers. It is ageneral policy of the Government to encourage private enterprise; this ex-tends to agriculture and the provision of extension services by private con-sultants. With respect to the latter, ICA has assumed responsibility forissuing licences to suitably qualified advisory personnel and providing over-all guidance and supervision. The Government is eager to establish ICA asinter alia, a central repository for extension services, but it would bepremature at this stage to attempt to judge their prospects for success.However, there is little doubt that the organization is now faced with con-siderably increased responsibilities. Although several top-level administra-tors have recently been employed to consolidate this reorganized institute,
ANNEX 1Page 2
at the same time it is proposed to withdraw the Rockefeller personnelbeginning this year. At the field level, although well endowed withagricultural technicians, the staff of ICA is essentially researchorientated and have had little or no experience in the use of credit.For sometime ICA will find it difficult to effectively provide and over-see technical supervision on the scale envisaged by the Government.
IDEMA
4. The IDEMA institute is responsible for orderly domestic pricing anddistribution of farm products as well as the general promotion of non-coffee agricultural exports. Up until now IDEMA has focussed attention oncrop products only but is currently in the process of establishing a live-stock committee which will consider all aspects of the beef industry - livecattle as well as refrigerated, frozen and canned beef. In undertakingthis role, IDEMA will work closely with COFIAGRO (para 5) and will make thepolicy recommendations previously made by the Federation of Colombian Live-stock Producers (FEDEGAi). For the last few years, this organization oflivestock producers has been contracted by the Government to organizeexports of meat and cattle, make studies of the industry and provide re-commendations on general lines for development. As much as FEDEGAN wouldlike to continue in this role and even increase its operational effective-ness, the Government, however, sees FEDEGAN's role somewhat differentlyand appears intent on restricting the Federation to conducting studies ofthe industry. FEDEGAN will be represented on the livestock committee set
up by IDENa and only through this medium will it take part in making policydecisions and exercising marketing control. With respect to dairying andsheep production, IDE11A has done nothing so far. On the dairy side, itintends confining its attention to the marketing of fresh milk only.
COFIAGRO
5. COFIAGRO is a public company, created in 1966 for the purpose offinancing exporters of agricultural products and, in particular, exportersof beef. COFIAGRO presently has a paid-up capital of Ps h0 million withownership in the hands of the Government (Ps 13 million), Banco Ganadero(Ps 15 million) and INCORA (Ps 12 million). A 50% increase in paid-upcapital is expected in the near future.
6. Some 80% of COFIAGRO's portfolio is in enterprises engaged in the ex-
port of beef; it is a major shareholder in INGRAL, S.A., a private companywhich owns an abattoir and freezing plant located in Barranquilla and hasmade a loan of Ps 5 million to INDUGAN, a cattle-in-partnership company par-
tially financed by IFC, for the sole purpose of developing that company'sexport operations. In fact, INGRAL and INDUGAN are about to collaborate inthe formation of a beef export company. On a trial basis, the two companies
recently negotiated an export contract with Spain for 2,000 tons of refrigera-ted beef for which shipments commenced in March 1969. In fulfilling its roleas a beef exporter, COFIAGRO has assigned top priority to ensuring that beef
supplies are available to meet the requirements of export contracts. To this
Ai7E5X IPage 3
end the corporation proposes to finance, by loans and equity participationin cattle-in-partnership companies, a herd of some 150,000 head within thenext 1½ to two years to enable contracts entered into by INGRAL to be met.
B. Fiscal Policy
Taxation on Livestock Production
7. A high level commission has recently completed a study of the overalltax system in Colombia and will soon present its recommendations to theGovernment. There have been no indications as to the nature of the proposedreforms, but it is reasonably certain that they will provide for greaterrevenue in the framework of a more equitable and efficient structure.
8. Taxation on livestock enterprises takes many forms and there is a-wide variety of tax exemptions and deductions from income for people en-gaged in stock raising and agriculture (with the exception of coffee,sugar-cane, and bananas). Important income and wealth tax benefits designed toencourage large and medium-scale investments in agriculture lapsed onDecember 31, 1968, having been in effect since 1958. In view of the im-pending tax reform, this situation is not necessarily significant nor areliable indication of present Government thinking.
9. With respect to general income taxes, an important feature of thedetermination of taxable income concerns the calculation of profits derivedfrom the sale of cattle. This is taken to be the increase in value duringthe year of sale only. By excluding any value added in earlier years, thelaw favors longer-term operations rather than short-term fattening withinany one year. Additional incentives accrue to such enterprises throughthe exemption of livestock kept for breeding and raising from the netwealth tax (in effect until 1970). Without these tax advantages the netprofitabiLity of cattle operations would be seriously reduced.
10. Special taxes levied on the livestock producer are:
a) On the consumption and export of cattle, levied at the pointof slaughter or export at the rate of Ps 50 per head formales and Ps 100 per head for females.
b) Selective inventory tax: equivalent to the value of 4 kgliveweight per head of male cattle over one year. For thispurpose the Minister of Agriculture sets an average priceat the end of each tax year.
At the Government's discretion, up to 50% of the two tax revenues referredto above can be directed toward improving the livestock industry, for example,to organize technical assistance, to promote exports, to regulate prices andto enforce international health regulations. For these purposes up to 45% isallocated to Banco Ganadero and up to 5% to FEDEGAN. A conservative estimateof
ANNEX IPage 4
the yields from these two taxes amounts to about Ps 220 million. In 1968 theamiounts received by Banco Ganadero and FEDEGAN were Ps 30 million (less thanUli%) and Ps 6.5 million (about 3%) respectively. Budget allocations for 1969will leave Banco Ganadero's receipts unchanged and will increase the amountgcing to FEDEGAN to Ps 7 million.
11. In addition, 1% of net investment in livestock, when that investment isin excess of Ps 15,000 (effective through 1970) is levied au livestockproducers as a general inventory tax. There are no exemptions from this taxas there are for the net wealth tax. The livestock producer has the alterna-tive of paying the tax in cash or subscribing to shares of Banco Ganadero orFondos Ganaderos (para 2.21 of the main report). The latter alternative isthe one generally followed and these proceeds represent an important sourceof funds for the two institutions. The securities purchased are marketable,but only at a substantial discount.
Incentives for Export Promotion and Import Substitution
12. Since March 1967, tax credit certificates or bonuses have been grantedtc) exporters of all ccmmodities with the excepticn of coffee and petroleum,equal to 15% of the value of exports. Given the existing prices and exportmarketing facilities, this rebate enables export to take place on a limitedsc:ale. Short of increasing this incentive, lower cost production and/or amore favorable exchange rate would be necessary to enable Colombian meatexports to increase to any appreciable extent. Domestic price support for theexport market has been successfully operated for sugar and cotton, but theexisting marketing situation for beef, characterized by a multitude of pro-ducers, middlemen and slaughterhouses would make control of such supportprices impossible. A fund for the promotion of exports, set up by the samedecree that established the 15% tax credit, is authorized to discount billsand other documents on behalf of exporters.
13. The Government's policy with respect to wool imports gives no preferenceor protection to the local producer and is a reflection on the low prioritycurrently being given to the development of this particular infant industry.Imiports of fine wool from the Latin American Free Trade Association (LAFTA)are subject to an ad valorem duty of 9 - 11% without the normal requirementfor a deposit with the Banco de la Republica. Imports from other countriesattract a duty of 15 - 17% and a peso deposit requirement of 70% of the valueof the imports and, as a result, accounted for only 2.7% of total imports in1967.
C. Credit Policies
14. Apart from the institutional problems, the Government is seriously con-cerned with two aspects of credit to the agricultural sector, the operation ofLaw 26 and the low level of interest rates. Law 26 is an important source offunds for agriculture; inter alia the law requires commercial banks, the Caja
ANNEX IPage 5
and Banco Ganadero to lend 15% of their deposits for agricultural development,in.cluding livestock. It is required that this money be made available toproducers at 8% interest for periods varying up to five years. The law hasbeen quite ineffective, however, as the Government has only been able to ens-arethat the funds are lent to landowners/farmers and has not been able to controltheir use. For security reascns, banks have generally offered their resourcesto their best clients, the one group with the least need for cheap short-termcredit and allegedly with the least predilection toward utilizing the funds foragricultural development. The Colombian entrepreneur has, characteristically,multi-interests and as often as not is reputed to have gocd if not better usesthan agriculture for short-term credit.
15. Reform of Law 26 has been proposed by the Executive Agricultural Committeeand accepted by the 1Minister of Agriculture. It is now in the process ofbeing reviewed by the Attorney General's Department to determine how the re-form can be nade effective. It is proposed that the funds, instead of beinglent directly by the banks, be channelled through the Fondo Financiera Agrarioin. the Banco de la Republica from where they will be available for the re-discount of supervised loans made to farmers for purposes approved by theFondo. Rather than the existing 8% rate of interest, the reform if adopted,would increase this rate and provide for periodic reviews by the MonetaryBoard.
16. In general, the Government is concerned about the low interest rates toagriculture and intends to increase these rates to ensure better utilizationof scarce capital resources. For the on-lending of external loans, it isproposed that interest rates be such that the borrower will bear most, if notall, of the foreign exchange risk.
D. Prices
17. There is no control over the price of livestock or meat. In May 1967,price controls of milk in towns of 70,000 or more inhabitants were lifted fora period of three years. However, the Association of Milk Producers (ANALAC),together with the Department of Economic Regulations, agreed on a maximumprice per bottle of raw milk to distributors. There is control on the marginscharged for the processing, distribution and sale of milk and these are setby the Department of Economic Regulation. The maximum margin for pasteuri-zed milk is Ps 0.25 per 750 cc bottle and this covers all costs from pointof collection to factory sale. The maximum margin for distribution isPs 0.05 per bottle and for retail sales Ps 0.04 per bottle.
ANNEX 2
COLOMBIA
SECOND LIVESTOCK PROJECT
BAIKING AND CREDIT
A. Introduction
1. The Colombian banking system is characterized by governmental directionof credit through a ccmplex of official rediscount facilities and reserverequirements. While this has been successful, to an extent, in channellingcredit towards priority agricultural and industrial development, its rigidityhas hampered monetary control. Government is gradually introducing changes tomake the system more effective, both in directing credit to development sectorsand in controlling the monetary system.
B. The Banking System
2. There are 16 commercial banks in Colombia, h semi-official banks, 6foreign comnercial banks, 13 development finance companies and the privatelyoaned, but naw closely controlled, Central Bank, the Banco de la Republica.The Central Bank also has an 80% interest in the Banco Central Hipotecario(Central Mortgage Bank).
3. A list of banks and their total assets is given in Table I, attached;the Government owned Agrarian Bank (Caja de Credito Agrario Industrial y Minero- Caja) is much the largest, apart from the Central Bank itself.
4. The Central Bank holds the national reserves, is the sole bank of curr-ency issue, and is bancer for Government and for other banks. Its assetsexceed the combined total of the commercial banks. The Central Bank alsoadministers five special Funds, of which the two most important are thePrivate Investment Fund (Fondo Inversiones Privadas), created in 1ebruary 1963as a channel for foreign loans in the private sector (mainly industry andexport promotion); and the Agricultural Financing Fund (Fondo FinancieroAgrario) created in Mkay 1966 to provide supervised short-term credit foragriculture
5. The commercial banks have head offices in principal towns and manybranches; the development finance companies are mostly regional; Caja is basedin Bogota, the capital; and has 638 branches or agencies throughout Colombia.So the country is well provided with banking services and general short-termcredit, though credit may not be easy to get in particular sectors (e.g.cattle fattening) either through deliberate Government policy or the banks'own choosing. Demand for short-term credit is intensified by reluctance ofthose who need short-term financing for their enterprises, to use their own
funds fcr tho purpose. Actual and potential inflation discourages long-termlending, though the development finance companies make long-term loans, mainly
LhNTEX 2Page 2
industrial and sometimes associated with equity participation. Governmenthas slowed inflation somewhat in recent years (see Section F) and hasassisted long-term lending, notably for livestock development, with helpfrom AID, the Inter-American Development Bank and the World Bank. It isgenerally true, however, that long-term money is scarce.
C. Control of the Banking_System
Reserves
6. Since 1963, the Government appointed Monetary Board has had legisla-tive control of the banking system; it has been increasingly effective duringthe last two years. It sets the proportion of bank deposits which must bekept in reserve and not used for lending. This proportion was 33% at thebeginning of 1969, subject to investment of part of a bank's portfolio indevelopment (see para 8(i)) and to certain other requirements. The reserverequirement rose steadily from 24% in 1964 to a peak of 34% between Januaryand May 1968. 1Most banks invest in development, as required for the 33%reserve; without this investment, the reserve proportion is 37%. Of the 33%reserve, 1% of deposits may be invested in Agricultural (and some otherspecified) Bonds, and 3/4% in loans for special purposes (e.g. municipal orreconstruction). All the rest must now be in cash or deposits with theCentral Baxk, in contrast to previous other exceptions. The Central Bankprovides statistical and information services to the M4onetary Board and aGovernment Department, the Superintendency of Banks, ensures compliance andregularly inspects all banks (including Caja).
D. Direction of Credit
Obligatory Investments
7. The commercial banks (certain semi-official banks excepted) must invest5% of their total demand deposits in Caja Bonds and another 5% in NationalDevelopment Bonds. They must also invest 25% of their savings deposits inCentral Mqortgage Bank Bonds, 22% in Housing and Savings Bonds and 10% ineach of three other obligatory investments, including Caja Bonds.
Selective Credit
8. In addition to these specific obligatory investments, Governmentdirects credit to priority sectors, partly by requiring stated proportionsof resources to be invested in a particular way, partly by offering officialcredit for approved purposes through preferential rediscount facilities. Thefollowing is a broad description:
a) Commercial Bank Credit
In order to qualify for the 33% legal reserve requirement(see para 6), a commercial bank must lend 32% of its loanportfolio (of whatever term) for development (certain semi-official banks excepted). A commercial bank may includeas development:

ANNEX 2Page 3
(i) an obligatory 6% of total loan portfolio in subscription tosix-month bills of the Agricultural financing Fund, currentlyissued at 6% per annum interest, togethler with any voluntarysubscription to such bills;
(ii) 35% of all loans made under arrangements with the AgriculturalFinancing Fund and certain other Central Bank Funds (see para4);
(iii) an obligatory 15% of demand deposits in lending for agriculture,in addition to the above obligatory 6% subscription; this 15%may include voluntary subscription to additional Caja Bonds(maximum interest rate 6%) beyond the statutory requirement(see para 7), and must include subscription to Caja Bonds to
make up any shortfall;
(iv) any other short-term lending for agriculture, in addition to theobligatory 15%;
(v) 35% of loans on warehouse bonds;
(vi) industrial development loans and Industrial Finance CorporationBonds.
b) Agricultural and Development Rediscount
(i) 50% of development loans, beyond the 32% in (a) above may berediscounted with the Central Bank;
(ii) 65O of loans made by the commercial banks for agricultureunder the Agricultural Financing Fund Plan may be rediscountedwith the Fund;
(iii) 65c/ of loans made on warehouse bonds for agricultural productsin store, up to 80% of their value, may be rediscounted withthe Central Bank.
c) Special Institution Credit
Certain specialized development lending institutions have exceptionalrediscount facilities with the Central Bank. I4ost significant isthe Ps 1,670 million revolving credit of Caja which may rediscount,up to this limit, 100% of its loans with a term not exceeding fiveyears. Ps 1,200 million is Caja's regular quota and the rest aspecial additional quota. INCORA also has a separate line of credit,through Caja, for 100% of its agreed requirements; and the develop-ment banks may rediscount loans not exceeding 10 years up to theamnount of their paid-up capital. Various other institutions, havinglending policies Government wishes to encourage, also have rediscount
ARNEX 2
facilities, including the Livestock Bank, to a limited extent, andthe regional Livestock Funds (see para 15).
General and Special Credit
9. The Central Bank provides for liquidity of the banking system throughgeneral and special rediscount facilities authorized by the Monetary Board.Rediscount currently provided is:
a) General QuotaUp to 15% of a bank's combined capital and legal reserves (with anadditional quota for certain small banking institutions).
b) Special Quota3T of total current accounb deposits to take care of decreases incurrent account balances; and up to 7% of special deposits in June,10% in December, to take care of seasonal withdrawals.
c) Emergency CreditSuch emergency credit as the Central Bank may, in the circumstances,approve to meet emergencies, e.g. a withdrawal of deposits.
Interest and Rediscount Rates
10. a) Interest Rates
(i) The Monetary Board sets a maximum rate of interest on loansmade by current and deposit account sources. For generallending, this is now 14%; for selective lending, lower ratesapply (see below). There is no maxi-mum on loans made fromother funds (including foreign loans). The development banks,for example, charge 18% on long-term loans made from fundsprovided by the IBRD. The maximum limit may be evaded ifa lending bank feels a higher rate is justified, e.g. byrequiring the deposit of part of a loan until it is repaid;but evasion is not believed i-rdespread.
(ii) On loans made under Law 26 (i.e. the 15% of deposits which mustbe lent for agriculture) the maximum short-term rate is 8%;the rate for loans beyond one year may be up to 9% (loans beyondfive years are exceptional, but some loans under Law 26 havebeen made up to 10 years).
(iii) The major rates for warehouse bonds are between 9 and 145.
(iv) The maximum for Agricultural Financing Fund loans by thecommercial banks (including Caja) is 13%.
(v) The maximum rate payable on savings deposits is 4%. (In spiteof this negative real rate of interest, savings have continuedto rise. For example, deposits with Caja (which receives most

AIMEX 2Page 5
of them) increased from Ps 890 million in 1966 to Ps 1,150mi.llion in 1968).
b) Rediscount Rates
(i) The Central Bank's general rediscount rate is 3% below the rateof the paper being rediscounted. For the Special and EmergencyCredits in para 9, however, the rate is generally 14% (16% forthe third percentage of the Special Credit).
(ii) Caja used to be charged only 2% on drawings from its revolvingcredit fund with the Central Bank; but from January 1, 1969,the rate on all new drawings has been increased to L%. INCORAenjoys the same preferential rate and so does the LivestockBank for a relatively small part of its portfolio.
(iii) The Agricultural Financing Fund rediscount rate to all banksis 7%.
E. Non-banking Credit
11. A source of capital for beef cattle inventories is an arrangement, quitec(mmon in Colombia, known as "cattle-in-partnership", whereby a rancheraccepts cattle for grazing, provides pasture and supervision, and receives ashare of the profits wihen they are sold. The cattle are financed by theprivate sector; and by Livestock Funds, for which finance is provided by de-partmental and national governments and by the Livestock Banlk and Caja.Cattle-in-partnerhiip is, in effect, credit in kind and is very important tothe Colombian cattle industry. vThile no figures are available, probablybetween 20% and 40% of the national herd is owned in this way and a sub-stantial sum, in excess of Ps 1 billion is involved. A usual profit sharingis 60% rancher; h0% financier. IWhile the arrangement has the advantage ofnot impairing the rancher's borrowing capacity, it is probably equivalent toa loan with interest of the order of 15 - 20% (depending on the profit shared).
F. Government Policy
12'. Government has made efforts to bring inflation under control.Wh&ile anxious not unduly to increase the cost of its own borrowing, it hasaimed to stimulate private savings by allowing interest rates to move upwards.Towards the end of 1967, for example, the rate on IIortgage Bonds (issued by theCentral Mortgage Bakc) went up from 7% to 9.5%; and on Government issuedEconomic Development Bonds, from 8.5% to 11%; accrued interest on both issuesis free of tax. The Central Bank was recently authorized to issue Ps 100million of 1L% notes, freely negotiable and redeemable at a discount determinedby the Monetary Board from time to time. Government also issued a special

ANNEX 2Page 6
bond, to the Colombian Social Security Institute, with an indexed interestrate to protect the Institute's income against inflation; the rate is 6% plus70% of the change in the wholesale price index. Government has initiated aplan to make better use of reserves for severance pay now held by publicemployers; the plan puts reserves held by public, and possibly later by private,employers into a National Savings Fund. These measures not only indicateGovernment's attitude towards interest rates but also its continued efforts tocontrol the credit system.
13. To reinforce fiscal and monetary measures Government, in 1967, imposeddrastic emergency import restrictions and granted tax concessions to exporters.
G. Review of the Credit System
14. The credit system is constantly under review by the Monetary Board and,as stated in para 1, changes are gradually being introduced. The Departmentof Planning is specially studying agricultural credit policy. In particular,Law 26 is being redrafted to make compulsory credit to agriculture moreeffective. Law 26 credit now probably goes to favored bank customers whohave agricultural interests, and it is unlikely that :its use for agricultureis too carefully confirmed. Compulsory credit might all be made availablethrough the Agricultural Financing Fund, which has improved agricultural pro-duction by making credit available for better seeds, for fertilizer, pesticides,soil preparation, weed control and other desirable annual inputs. Governmentis also considering an increase in the permitted interest rate for Law 26loans.
H. Effects of Government Policy
1'5. The effects of Government policy, including the import restrictions,may be judged by the following.S
a) Whereas during 1966 (an inflationary year which precipitated a for-eign exchange crisis) Central Bank net credit expanded by about 15%,during 1967 expansion of credit slowed down but started to increaseagain in 1968. The banking system's net foreign reserves recoveredsubstantially by US$85 million over 1967/68.
1/ Source: INiF Consultation Reports of Aipril 1 and 19, 1968.

AI\1NEX 2Page 7
b) Ailthough expansion of Central Bank credit slowed during 1967, totalbanking syster crodit(public and rirntu)incroasod by about 16%. Thisincrease was supported mainly by private deposiTs with the commercialbanks (19% up), reflecting a stronger propensity to channel realsavings through the banking system. This tendency continued evenmore strongly in 1968. Government action thus appears to haveprevented erosion of internal confidence in the peso, which previousexperience of inflation might have justified.
c) Private sector credit growth slowed dom in 1967 with an increase of13p compared with 24% in 1966 (in real terms 5% compared with 9%).
d) Specialized institution credit growth continued at roughly the samerate in 1967 as in 1966 (increase of 18.3% in 1966, 20% in 1967),reflecting Government's effort to stimulate priority development(as described in para 8( c )). There was a notable steady increasein rediscounts granted by the Central Bank to Caja, the largestinstitution.
e) Nlew loans to agriculture have been increasing, in real terms, atthe rate of about 10% per annum since 1963.
f) The following have been the average percentage increases in theNational Cost of Living Index for Workers:
1966 - 16.7%1967 - 7.0%1968 - 6.4%.
g) The exchange rate against the US$ moved rapidly from Ps 13.50 toPs 16.04 in the year to March 1968 (increase of 18.8%); it hassince moved much more slowly to a current (April 15, 1969) Ps 17.20.
G. Conclusion
16. The conclusion is that, despite the complexities of the credit system,which it is seeking to simplify, Government is effectively controlling moneyand credit and successfully channelling credit to sectors it believes deservepriority.
17. The significance for agriculture (including livestock) is that Governmentrecognizes the priority of the sector and will continue to favor direction ofcredit to it. As a consequence, some short-term agricultural credit is likelyto continue to be available at less than market rates, or currently about 8%instead of something over 14%. IThile this is encouraging to the producer whois able to obtain credit on these favorable terms, it leads to some reluctanceto pay higher riarket rates for long-term agricultural credit, includingforeign financed credit that incurs a foreign exchange risk.
ANNEX 2Page 8
18. Attached Table 2 shows the trend of lending in different sectors from1963 to 1967. The proportion of lending to agriculture (including livestock)has risen slightly from 32% in 1963 to close on 34% in 1967 and is expectedtio have risen again in 1968. Lending to industry has increased markedly from30% to 3570. Lending for conmercial and other purposes decreased accordingly.It will be noted that lending for livestock declined sharply in 1965 (i.e.before the first Bank Loan for Livestock became available). Governmentdeliberately encouraged a preference for agricultural crop lending for importsubstitution. Lending for livestock has risen since and is likely to haverepresented about 15TD of all lending in 1968.
ANNEX 2Table 1
COLOMBIAN BANKS AND THEIRTOTAL ASSETS
( September 1968 )
Commercial Banks Col. $ Million US$ Million(@ Col. $17.00 US$ 1)
1. Banco de Bogota 3,989 235
2. Banco de Colombia 2,871 169
3. Banco del Comercio 2,9459 145
4. Banco Commerci.al Antioqueno 2,181 128
5. Banco Industrial Colombiano 972
6. Banco Grancolombiano 401
7. Banco de Occidente 334
8. Banco de Santander 276
9. Banco del Estado 240
10. Banco de Caldas 183
11. Banco de la Costa 165
12. Banco de la Sabana 145
13. Banco de Construccion y Desarrollo 98
IL. Banco de America Latina 68
15. Banco Panamericano 85
16. Caja de Aborros del Circulo de Obreros 6514j&532
Government Assisted Banks
1. Caja de Credito Agrario Industrial y Minero 5,379 316
2. Banco Cafetero 3,279 193
2. Banco Popular 2,266 133
. Banco Ganadero 1,118 66

ANNEX 2Table 1Page 2
Development Finance Companies (Financieras)
1. Instituto de Fomento Industrial (+) 1,789
2. CorporaciorL Financiera Colombiana 905
3. Corporacion Financiera Nacional (*) 467
L. Corporacion Financiera de Caldas (*) 352
5. Corporacion Financiera del Valle (*) 313
6. Corporacion Financiera del Norte (*) 171
7. Corporacion Financiera Grancolombiana (*) 75
8. Corporacion. Financiera del Transporte 61
9. Corporacion Financiera de FomentoAgropecuario y de Exportaciones 40
10. Corporacion Financiera de Occidente 38
11. Corporacion Financiera de Santander 36
12. Corporacion Financiera Popular 31
13. Corporacion Financiera del Caribe 16
+ 0overnment owned
* ]3eing assisted by IBRD (Loans 451-CO and 53h-co)
Central Bank
Banco de la Republica 17,879 1,052
Mortgage Bank
Banco Central Hipotecario(80'X owned by Banco de la Republica) 3,396 200
Source
Fleport of the Superirtendency of Banks No. 330 of November 1968

COLOMBIA
SECOND LIVESTOCK DEVELOPMENT
BANKING AND CREDIT
Lending by Sectors( Col . p Milii ion ) 1/
Sector 1963 1964 1965 1966 1967
Agriculture 1,152 16 1,379 17 1,549 18 2,029-Y 20 2,381 20Livestock 1,199 16 1,335 16 1.o66 12 1,366 14 1,462 13
Sub-total 2,351 32 2,714 33 2,615 30 3,395 34 3,843 33
Of which:Caja Agraria 1,115 1,329 1,226 1,613 1,817Banco Ganadero 78 87 129 185 241Commercial Banks 1,158 1,298 1,260 1,597 1,785
Industry 2,167 30 2,778 34 2,982 35 3,385 34 3,991 35Commerce 2,265 31 2,236 27 2,1450 28 2,553 26 2,777 24Other 471 7 1485 6 627 7 638 6 881 8
Sub-total 4,903 68 5,499 67 6,059 70 6,576 66 7,649 67
TOTAL 7,254 100 8,213 100 8,674 100 9,971 100 11,1492 100
1/ Commercial banks plus Caja Agraria and Banco Ganadero.Source: Monthly Bulletin of Statistics of National Department of Statistics
and information supplied by Caja Agraria.
2/ Agricultural Financing Fund commenced operation. r MN
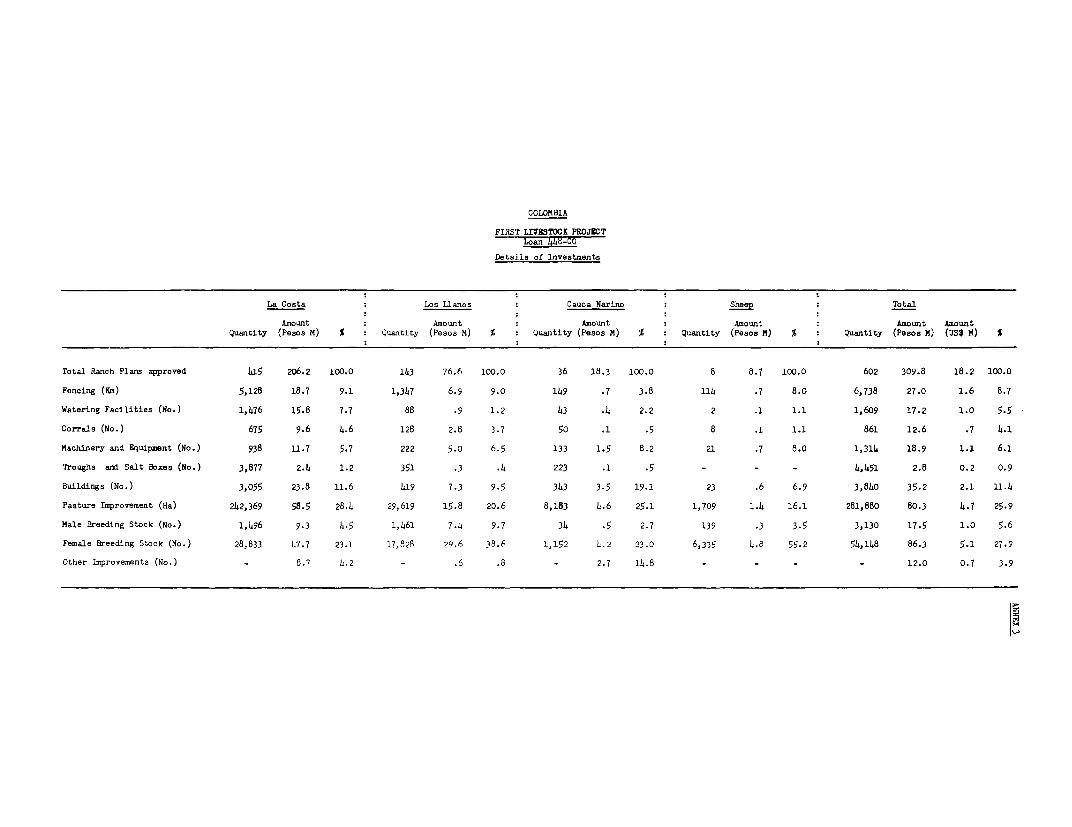
COLO1BIA
FIRST LrTOCK PROJECTLoan 44z-CO
Details of Investments
La Costa Los Llanos Cauca Narino Sheep Total
Amount Amount Amount Amount Amount AmountQuantity (Pesos M) % Quantity (Pesos M) % Quantity (Pesos M) % Quantity (Pesos M) % Quantity (Pesos M) (US$ M) %
Total Ranch Plans approved 415 206.2 100.0 143 76.6 100.0 36 18.3 100.0 8 8.7 100.0 602 309.8 18.2 100.0
Fencing (Kim) 5,128 18.7 9.1 1,347 6.9 9.0 149 .7 3.8 114 .7 8.0 6,738 27.0 1.6 8.7
Watering Facilities (No.) 1,476 15.8 7.7 88 .9 1.2 43 .4 2.2 2 .1 1.1 1,609 17.2 1.0 5.5
Corrals (No.) 675 9.6 4.6 128 2.8 3.7 50 .1 .5 8 .1 1.1 861 12.6 .7 4.1
Machinery and Equipment (No.) 938 U.7 5.7 222 5.0 6.5 133 1.5 8.2 21 .7 8.0 1,314 18.9 1.1 6.1
Troughs and Salt Boxes (No.) 3,877 2.4 1.2 351 .3 .4 223 .1 .5 - - - 4,451 2.8 0.2 0.9
Buildings (No.) 3,055 23.8 11.6 419 7.3 9.5 343 3.5 19.1 23 .6 6.9 3,840 35.2 2.1 11.4
Pasture Improvement (Ha) 242,369 58.5 28.4 29,619 15.8 20.6 8,183 4.6 25.1 1,709 1.4 16.1 281,880 80.3 4.7 25.9
Male Breeding Stock (No.) 1,496 9.3 4.5 1,461 7.4 9.7 34 .5 2.7 139 .3 3.5 3,130 17.5 1.0 5.6
Female Breeding Stock (No.) 28,833 47.7 23.1 17,828 29.6 38.6 1,152 4 .2 23.0 6,335 4.8 55.2 54,148 86.3 5.1 27.9
Other Improvements (No.) - 8.7 4.2 - .6 .8 - 2.7 14.8 - - - - 12.0 0.7 3.9
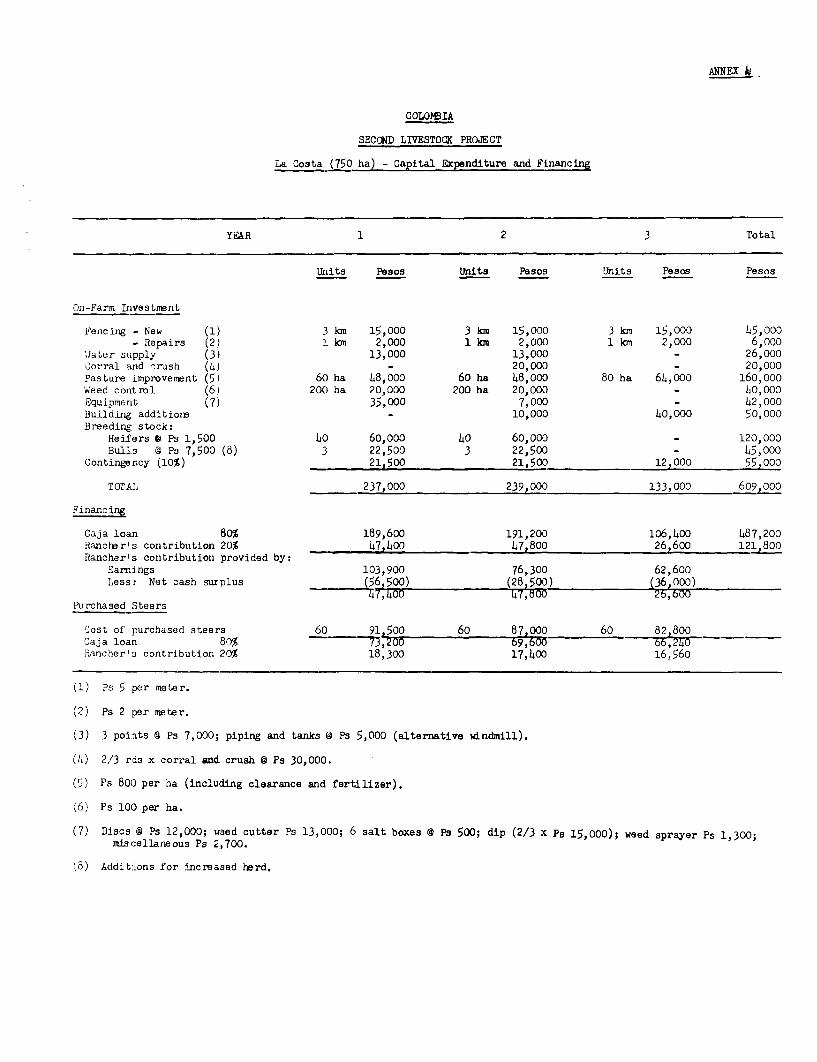
ANNEX X
COLOMBIA
SECCND LIVESTOCK PROJECT
La Gosta (750 ha) - Capital Expenditure and Financing
YEFAR 1 2 3 Total
Units Pesos Units Pesos Units Pesos Pesos
On-Farm Investment
Fencing - New (1) 3 km 15,000 3 km 15,00() 3 km 15,000 L5,000- Repairs (2) ]. km 2,000 1 km 2,00() 1 km 2,000 6,ooo
Water suipply (3) 13,000 13,00() _ 26,000Corral and crush (4) - 20,000 - 20,000Pasture improvement (5) 60 ha 48,000 60 ha 48,ooo 80 ha 64,00o0 160,000Weed control (6) 200 ha 20,000 200 ha 20,000 - 40,000Equipme nt (7) 35,000 7,000 - 42,o00Building additiorB - 10,000 4o,ooo 50,000Breeding stock:
Heif'ers 0 Ps 1,500 LO 60,000 6o,000 - 120,000Bull.s @ Ps 7,500 (8) 3 22,500 3 22,500 - L45,000
Contingency (10%) 21,500 21,500 12,000 55,000
TOrAJ 237,000 239,000 133,000 609,000
Financing
Caja loan 80% 189,600 191,200 106,4oo 487,200Rancher's contribution 20% 47,400 47,800 26,600 121,800Ranchar's contribution provided by:
Earnings 103,900 76,300 62,600Less: Net cash surplus (56,500) (28,500) (36,000)
-Q7,400 4~~~7,oO0 2b,bOOPurchased Steers
Cost of purchased steers 60 91,500 60 87,000 60 82 800Caja loan 80% 736200 900620Rancher's contribution 20% 18,300 17,400 16,560
(1) Ps 5 per meter.
(2) Ps 2 per meter.
(3) 3 points X Ps 7,000; piping and tanks @ Ps 5,000 (alternative windmill).
(4) 2/3 rds x corral and crush @ Ps 30,000.
(5) Ps 800 per ha (including clearance and fertilizer).
(6) Ps 100 per ha.
(7) Discs @ Ps 12,000; weed cutter Ps 13,000; 6 salt boxes @ Ps 500; dip (2/3 X Ps 15,000); weed sprayer Ps 1,300;miscellaneous Ps 2,700.
, a) AdditiLons for increased herd.
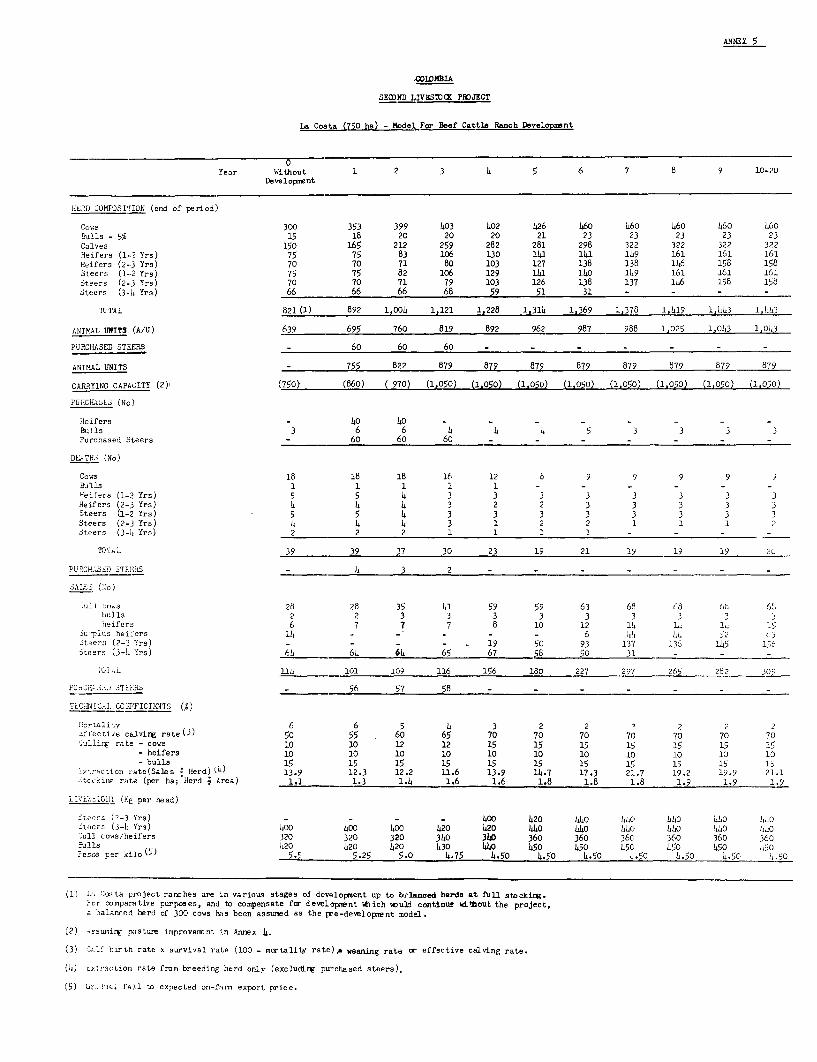
ANNEX 5
COOIINBIA
SEGDND LIVE.S3TCC PROJECT
La Costa (750 ha) - Model For Beef Cattle Ranch Developrent
0
Year Without 1 2 3 4 5 6 7 8 9 10-20Developrsnt
5H5ED IOMPOSITION (end of period)
Cows 300 353 399 403 402 426 460 460 460 460 460Bulls - 5% 15 18 20 20 20 21 23 23 23 23 23Calves 150 165 212 259 282 281 298 322 322 322 322Heifers (1..? Yrs) 75 75 83 106 130 141 141 149 161 161 161Heifers (2-3 Yrs) 70 70 71 80 103 127 138 138 146 158 158Steers (1-2 Yrs) 75 75 82 106 129 141 140 149 161 161 161Steers (2-3 Yrs) 70 70 71 79 103 126 138 137 146 158 158Steers (3-4 Yrs) 66 66 66 68 59 51 31 - - - -
TITAL 821(1) 892 1,004 1,121 1,228 1,314 1,369 1,378 1,419 1,443 1.443
ANIMAL tNITS (A/U) 639 695 760 819 892 962 987 988 1.025 1.043 110
43
PURCHASED STEERS - 60 60 60 - _ - - - - -
ANINAL UNITS - 755 822 879 879 879 879 879 879 879 879
CARRYINC CAPACITY (2)' (750> (860) ( 970) (1,050) (1.050) (1.050) (1.050) (1.050) (1,050) (l.o0o) (1.o50)
iUiCHASI (No)
Heifers - 4O 40Bulls 3 6 6 4 4 4 5 3 3 3 3Purchased Steers - 60 60 60 -
DEaTHS (No)
Cows 18 18 18 16 12 8 9 9 9 9 9Bulls 1 1 1 1 1 - - - - - -Heifers (1-2 Yrs) 5 5 4 3 3 3 3 3 3 3 3Heifers (2-3 Yrs) 4 4 4 3 2 2 3 3 3 3 3Steers (1-2 Yrs) 5 5 4 3 3 3 3 3 3 3 3Steers (2-3 Yrs) 4 4 4 3 1 2 2 1 1 1 2Steers (3-4 Yrs) 2 2 2 1 1 1 1
TO EAL 39 39 37 30 23 19 21 19 19 19 20
FURCHASOD 3TELhS - 4 3 2
SAI..; (Io)
.uil 2-s 28 28 35 41 59 59 63 63 68 6L 6'bulls 2 2 3 3 3 3 3 3 3 3heifers 6 7 7 7 8 10 12 14 14 14 14
3u J-plu heifers 11 - - _ - 6 44 414 52 o3iteers (2-3 Yrs) - - - - 19 50 93 137 136 145 1,6Steers (3-11 Yrs) 65 64 64 65 67 58 50 31 - - _
iG] L 114 101 109 116 156 180 227 297 265 2d2 305_
PUL,3ri: Azji 57Ti _ 56 57 58 _- - -_ _
ThC:-U41[CL C012FICIENTS (t)
r;ortality 6 6 5 4 3 2 2 ' 2 2 2-ftective celvirg rate(3) 50 55 60 65 70 70 70 70 70 70 702ulirJ rate - cows 10 10 12 12 15 15 15 15 15 15 15
- heifers 10 10 10 10 10 10 10 10 10 10 10- bulls 15 15 15 15 15 15 15 15 15 15 15
Yl,--hction rate(Saless H erd) 0'4) 13.9 12.3 12.2 u.6 13.9 14.7 17.3 21.7 19.2 19.9 21.1jcckir rate (Tar ha; Nerd Area) 1.1 1.3 1.4 1.6 1.6 1.8 1.8 1.8 1.9 1.9 1.9
LIi N _SIG (Kg per head)
St-rs ('-3 Yrs) - - - - 400 420 440 44l0 440 550o 14oSteers 3-4 Yrs) 400 400 400 420 420 440 440 440 440 44O I-,G.ull cows/heifers 320 320 320 340 340 360 360 360 360 360 3603slos e k,20 420 420 430 440 450 450 450 450 450 l;50Fesos Fer kiloM (5)5.5 5.25 5.0 4.75 4.50 4.50 4.50 4.50 4.50 5.50 L.50
(l) La Zoata project ranches are in various stages ol development up to belanced herds at full stocking.i lr oomparitive purposes, and to compensate for development which would continue wiLthout the project,a balanred herd of 300 cows has been assumed as the pre-developsent model.
(2) Ass=ning pisture improvenent in Annex 4.
(3) C;.l1 birth rate x survival rate (100 - mortality rate),. weaning rate or effective calving rate.
(4) cxtraction rate from breeding herd only (excludirg purchased steers).
(5) GO, .as fall to expected on-fanm export price.
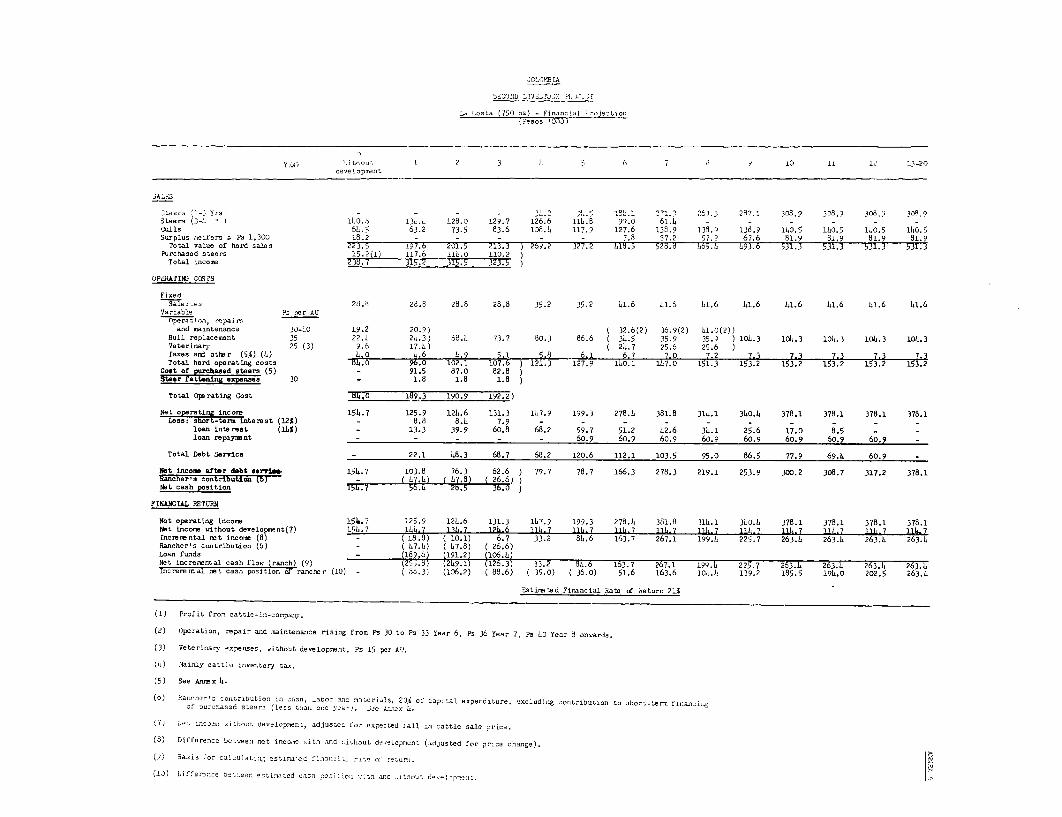
.FLUtI IA
SL, ):;O .l a.: Si. .?
Lu :.ost.: (750 Ia) - Financ ial: r,eittioc/Fssos '0131
YAi. :.icno, 1 t 72 3 4 5 10 11 il 13-20deve I op:rbent
jAL-S
-r ':-, 2 ~6?. 2 R7, n.- - - - , 1 2.R. 9 3 InO 30 8 ' 107.9Steers (30- 4 I 11.0.8 138.4 128.0 129.7 126.6 11L.8 09.0 61.4Culls 64.5 63.2 73.5 83.6 lO8., 117.? 127.6 138.9 138., 136.9 180.5 140.5 1.0.5 L5o.5Surplus helers s Ps 1,300 18.2 - - - - - 7.8 57.2 57.2 67.6 81.9 81.9 81.9 81.9
Total -alue of herd sales 223.5 197.6 201.5 213.3 ) 269.2 327.2 Ll.5 52d.d i65.8 893.6 531.3 531.3 531.3 531.3Purchased steers 15.2(1) 117.6 111.0 110.2
Total income Z3d.7 315.2 315.5 323.5
OPBRAkrl8 IN S.S
FixedSalar; 2s. 26. 28.8 28.8 28.8 35.2 35.2 41.6 41.6 41.6 47.6 ht.6 h 1.6 11.6 41.6
Variable Ps per AUOperation, repairtand maintenance 30-Lo 19.2 20.9) ( 32.6(2) 36.9(2) 41.0(2))
Bull replacement 35 22.L 2L.3) 68.5 73.7 80.3 86.6 ( 34.5 35.9 35.9 ) 104.3 105.3 104.3 104.3 104.3Veterinary 25 (3) 9.6 17.4) ( 24.7 25.6 25.6faxes anl other (5%) (4) 45. o.6 1.9 S.1 5,8 6,1 6.7 3.0 7.2 7.1 7.1 7.3 7.3 7.3Total herd operating costs 81.0 96.0 102.1 107.6 ) 121.3 127.9 140.1 157.0 151.3 153.2 153.2 153.2 153.2 153.3
CoSt. of ed steers (5) _ 91.5 87.0 82.8Steer fate lnexpenaea 30 - 1.8 1.8 1.8
Total Opsrating Cost 14.0 189,3 190.9 192.2)
Net operzating incomre 154.7 125.9 124.6 131.3 147.9 199.3 278.5 381.8 314.1 340.1 378.1 378.1 378.1 378.1Less: shcrrt-tsrm rest (12%) - 8.8 8.5 7.9
loan Interest (15%) _ 13.3 39.9 60.8 68.2 59.7 51.2 42.6 34.1 25.6 17.0 8.5 -loan repaysant - - - - - 60.9 60.9 60.9 60.9 60.9 60.9 60.9 60.9
Total Debt Service - 22.1 48.3 68.7 68.2 120.6 112.1 103.5 95.0 86.5 77.9 69.4 60.9
Net incom after debt aervia. 154.7 103.8 76.3 62.6 ) 79.7 78.7 166.3 278.3 219.1 253.9 300.2 308.7 317.2 378.1Rancher's contribution r7nj - 4 47.54 147.8) ( 26.6)Net cash position 158.7 56.4 28.5 36.0
FI IYAN L RET URN
Net operattng income 154.7 125.9 125.6 131.3 157.9 199.3 278.5 381.8 311.1 350.4 378.1 378.1 378.1 378.1Net income riithout development(7) l S h.7 144.7 131 7 12h.6 111.7 11. 7 114 7 114.7 1ll.7 114. 7 1lL7 11l.7 114.7 1.7Increnental net inconm (8) - ( 18.8) ( 10.1) 6.7 33.2 85.6 163.7 267.1 199.5 225.7 263.5 263.1 263.A 263.5Rancher's contribution (6) - ( 47.4) ( 57.8) ( 26.6)Loan funds _ (189.6) (191,2) (106.4)Not incremental cash flow (ranch) (9) (255.8) (249.1) (126.3) 33.2 84.6 163.7 267.1 199.5 225.7 263.4 263.4 263.5 263.5I-creeental net cash position of rancoler (10) - ( 8d.3) (106.2) ( 88.6) ( 35.0) ( 36.0) 51.6 163.6 104.5 139.2 185.5 194.0 202.5 263.5
Sstimated Financial Rate of netur- 21%
(1) Profit from cattle-in-company.
(2) Operation, repair and iaintenaxce rising from Ps 30 to Ps 33 Year 6, Ps 36 Year 7, Ps Lo Year d onwards.
(3) Veterinar, expenses, without development, Ps 15 per AU.
(c) Nainly cattle inventory tax.
(5) See Annex 4.
(o) .anconer's co-tribution in cas., iabor ac mte riEds, 203 of capital expenditure, -xciading zontributLoo L. short-term f,ra;ncingof p-cnaned steers (less t.ia: one year). i c Aresx h.
(71 hoc iLcoss oicnoat clopmene, adjustec .or vp-ecLed fall in cattle sale price.
(8) Difference beteem net income :.itl and :host deselopm-n. (adjusted for prize change).
( B) 3asis for caluluatll,-, -eit-,ed firn.rnci c rit retumn.
(13) Differzcnce bec-een e3tinated C.us:1 poeiio:1 :IEta ur. bitnoit do-eIr-n:rn.
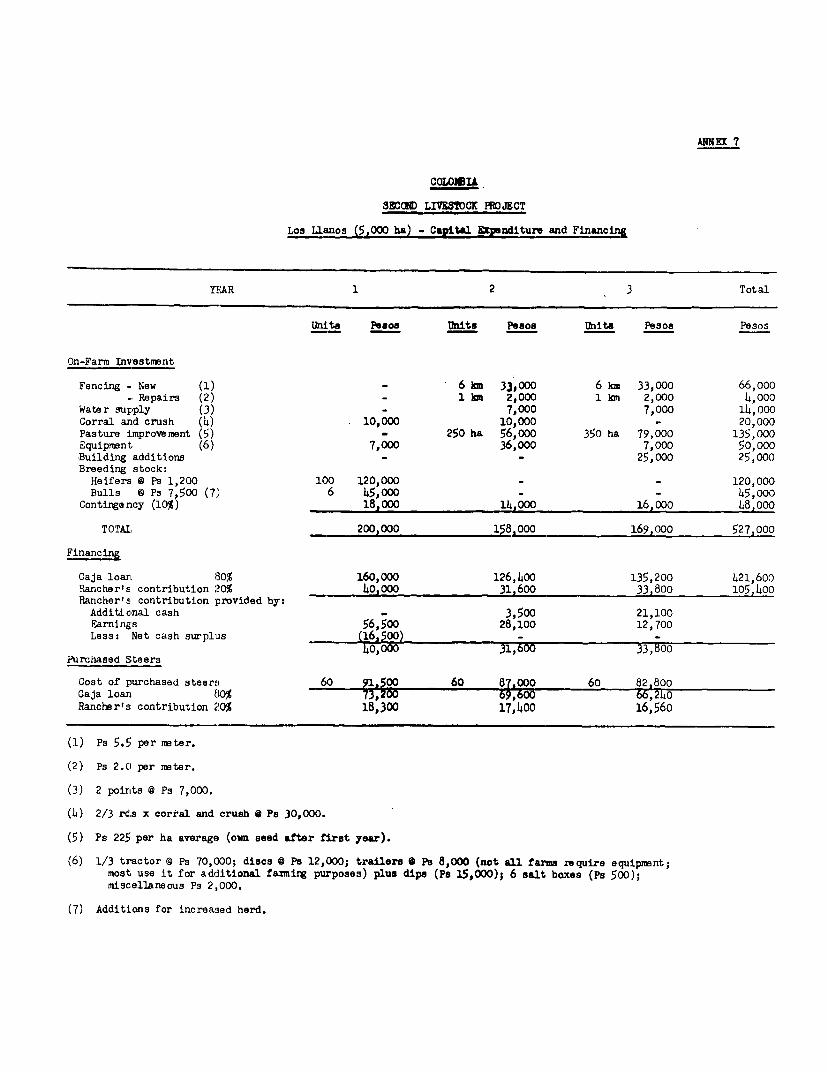
ANNEX 7
COL4OUB&
SEOaND LIVZOCK PROECT
Los Lianos (5,000 ha) - Capital Epsnditure and Financing
YEAR 1 2 3 Total
Units Pesos tlhits Pesos units Pesos Pesos
On-Farm Investment
Fencing - New (1) _ 6 kmn 33,000 6 kmn 33,000 66,000- Repairs (2) _ 1 km 2,000 1 lm 2,000 4,000
Water supply (3) - 7,000 7,000 14,000Corral and crush (4) 10,000 10,000 - 20,000Pasture improvement (5) - 250 ha 56,ooo 350 ha 79,000 135,000Equipment, (6) 7,000 36,000 7,000 50,000Building additions - 25,000 25,000Breeding stock:
Heifers 0 Ps 1,200 100 120,000 - 120,000Bulls 0 Ps 7,500 (7) 6 45,000 - 45,ooo
Contirgency (10%) 18,000 14,000 16,000 48,ooo
TOTAI, 200,000 158 000 169,000 527,000
Financing
Caja loan 80% 160,000 126,400 135,200 421,600Rancher's contribution 20% 40,000 31,600 33,800 105,400Rancher's contribution provided by:
Additional cash - 3,500 21,100Earnings 56,500 28,100 12,700Less: Net cash surplus (16,500)
40,000 31,600 33,800Purchased Steers
Cost of purchased steers 60 91 500 60 87 000 60 82,80Caja loarn 80% 7 66,240Rancher's contribution 20% 18,300 17,400 16,56
(1) Ps 5.5 per meter.
(2) Ps 2.C) per meter.
(3) 2 points @ Ps 7,000.
(4) 2/3 rds x corral and crush @ Ps 30,000.
(5) Ps 225 per ha average (own seed after first year).
(6) 1/3 tractor @ Ps 70,000; discs @ Ps 12,000; trailers 0 Ps 8,000 (not all farmn zequire equipment;most use it for additional fannirg purposes) plus dipa (Ps 15,000); 6 salt boxes (Ps 500);miscellaneous Ps 2,000.
(7) Additions for increased herd.
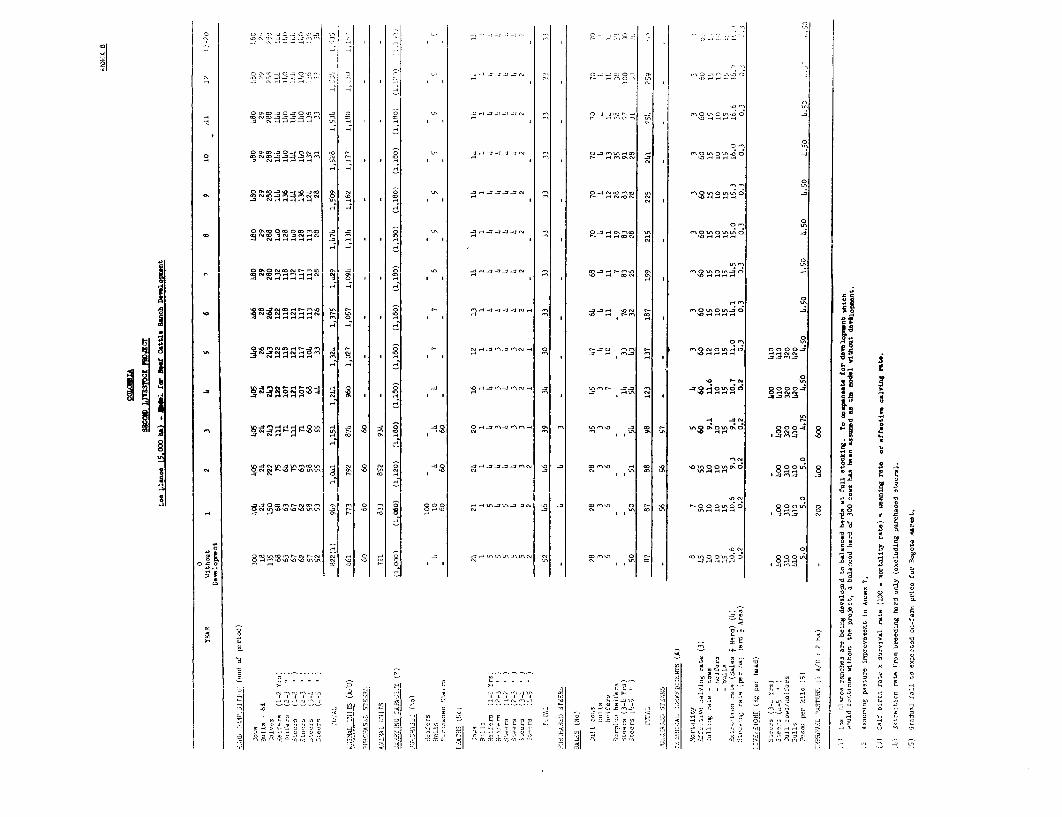
0C-.0..C0�C0HCC. CC C>. -H�CCC. 0�>CC>0C C CCCOC,CCCSC.O0
O&CC-40H0'Ofl .4 0 0 LC -CC�C 4.H�CCHC. CA 0-4.CCCCC �H .4 CAOUCCCA.O0- CCCCCCCCO CA 'C CA CCC, C,CH,A�-C - - CC.
o 00.-C C 0 CCC .4H.4�4.4.4CACA O4CACC),-.CH Cfl0CfC0CC�O0 -S
OC-4C>CC CCCI 0 tIC -4a-4.4-4OCA 0�a0CC.CC CC CCOCJCOCCCUCO -a
C0C -4 ON 0 CC. C - CAI I - I I I 0
00 CA
OCCOCOCO, .4 4 0 -4H-44-4.4OCA 04,-4CCAC CCC 'n0'AOCICCCCCO 4C--CA C - CA C-- -4,-COO H 'OHH.-C.-C
* C I 0
I, CC-C CA CCC00. ONCOC--CA C C .4 0 .rC IJ4SHCCCCA CO-a C--lACe 0. 00.010-40
NC C ,-C 'A '0 CCCI Ot CO.-CHHa -40 - I I C - 0
C(.i CHC--.AC u�, r- 0 C- H4H .00 C.- CAOCIC0CA40 .4Co 0Cc�4 HO..C,-4 0 C.- IC-C C H 0 I0�I C-CA C CCHHHH
HHHH -\ 0 S I - I I I I - I
OCOCISNCHC- CA C-- 0 C-- a 0 r-.aO CACA-� 0 C - CA -4 C-\
200CAH0 0000-4
HHH C C - I C I C -4 HHHH I� jNOHC 4 H 0 , 0 4 '0H4'n-4CACAH-4 -4-4 COHHHH
C H �4 HCA 2000.4�4 N HHH H C I C H * HO c.E
H H IC
H 4N 8 OC4Ifl H CCC H4� � 0 -40 OH.4CA.4CACA H CA CfCCAC .4 CC-CO 010U'COCO 00-4
C CC 0 CC-C CC CCC .0 HH 8
N- C4 NH H H C C H C I I '-40
0 �0 0 '0 0 4 0 'A C 'A CCC.-IHH U S
� 0 .0.4 C. C. �H C C :'AOOCA0.o �oo'A �
-CC,C'ACC'AUC'AOO C'nCCC 0 C'A0O'A00 COCA
Cd C. 'A -C
CC CCC -4CflCC a CC �C CC C.
� CC.-C�CCCCC
C. .0 CC CCCC .047CC. C. CC,C4..�C.C� --C
C. 7CC-C C.C.C�b CC--CC C- -,-. -CC.L C,C, CCCC --7 C.4 'CC. HO C..*.. CC<CCCC A CCHCCC CC CC f�I' C. CCC'HCCC A - C
A -C�C'� �, C. C. CCC�.* CC A-CCCC-rA �IC C�CCC�C, C7CC*�CCC C-.
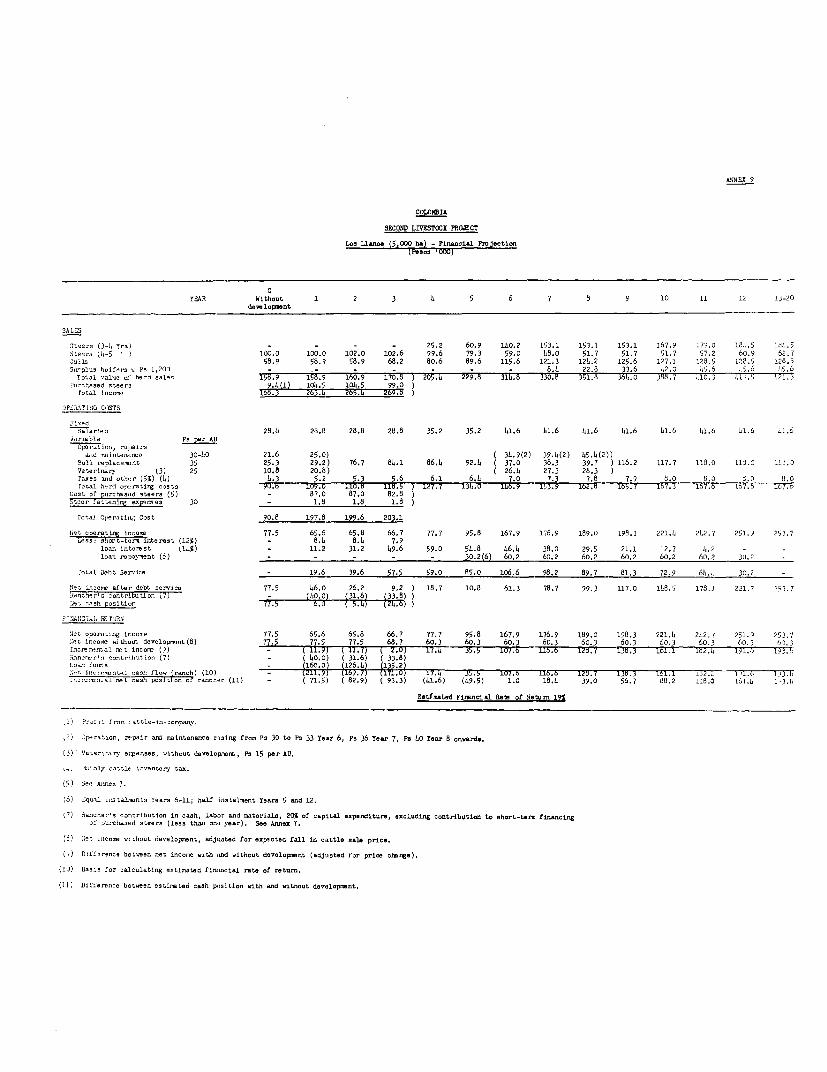
ANIIEX 9
COLOIMIA
ECOaND LIVI'TOCK PRO.ECT
Loa Lianoa (5.020 6) - Financinli Prcjection
YEAR Without 1 2 3 4 5 6 7 8 9 10 11 12 13-20d.s1 opMrent
3teer- (3-L Yrs) - - - - 25.2 60.9 140.2 153.1 153.1 153.1 167.9 17?.0 131.5 ldL.5Steers (1-5 100.0 100.0 102.0 102.6 99.6 79.3 59.0 L8.0 51.7 51.7 51.7 57.2 60.9 62.7|ui11s 58.9 58.9 58.9 68.2 80.6 89.6 115.6 171.3 121.2 125.6 127.1 171.5 128.5 128.57lrplas hoifr a Ps 1,200 - - _ _ _ 8.4 22.8 33.6 12.0 15.6 .5.6 .6.6Total val-e herd ..ales 158." 158.9 160.9 170.8 ) 205.4 229. 314.8 330.8 351.8 361.0 388.7 410.3 i,1 .7
1.cSla 0ised steer. 9.4(1) 104.5 104.5 99.0 )
Total income . .
.3i? i111 COISTS
r'alarlos 28.8 28.8 28.8 28.8 35.2 35.2 41.6 41.6 41.6 L1.6 L1.6 41.6 41.6 11.5t.irIable Ps per Al!
Ocmration,rairs-nd dhIstevenc- 30-40 21.6 25.0) ( 34.9(2) :19.4(2) 45.4(2))
Sull r-placsr- nt 35 25.3 29.2) 76.7 81.1 86.4 92.4 ( 37.0 38.3 39.7 ) 116.2 117.7 118.0 116.7 113.0Veterinary (3) 25 10.8 20.8) ( 26.4 27.3 28.3races -nd othor (5%) (1) 4.3 5.2 5.3 5.6 6.1 6.4 7.0 7.3 7.8 7.9 8.0 0.3 d.2 8.0Total heSd op!rat.rtg costs 90.7 10.0 IO.o 118.5 J Z27. i34.0 146.9 153.9 162.8 165.7 167.3 167.6 157.5 107.1
Cost of psrchsosd ,leers (5) - 87.0 87.0 82.8Stfer 'at'i n3T. enpenroc 30 - 1.8 1.8 1.8
Total O eratvijg Cost 90.8 197.8 199.6 203.1
Dqt (122)tirS lrlcons 77.5 65.6 65.8 66.7 77.7 95.8 167.9 176.9 189.0 198.3 221.1 22.27 251.) 253.7Less: sho.:t-t,i];iTnterest (125)- 8.4. 8.4 7.9lan initrest (1) - 11.2 31.2 69.6 59.0 54.8 46.4 38.0 29.5 21.1 12.7 6.2 - -loan repaI. ent (6) - - - - - 30.2(6) 60.2 60.2 60,2 60.2 60.2 60.2 30.2
,otal 2ebi Se,l,ic - 19.6 39.6 57.5 59.0 85.o 106.6 98.2 89.7 81.3 72.9 61.. 30.2
.1 t icme afte- debt .ereico 77.5 46.o 26.2 9,2 ) 18.7 10.8 61.3 78.7 99.3 117.0 168.5 178.3 221.7 253.7-nchern. contribJtion ;7) - (40.0) (31.6) (33.8)lcash positio 77.5 6.0 (5.6) (24.6)
F1710171AL OSTLIRNS
L0 oper-ating il-Ot 77.5 65.6 65.8 66.7 77.7 95.8 167.9 176.9 189.0 198.3 221.1 242.7 251.0 253.7iet i..nc withoUt develop-ent(8) 77.5 77.5 77.5 68.7 60.3 60.3 60.3 60.3 60.3 60.3 60.3 60.3 60.3 60.3Ina-.3mntal net incore I 7) _ 1 1 ( l1.7) ( 2.0) 17.4 J5.5 107.6 llb.b 12b.7 136.3 Jbl.1 182.1 191.1S 1Y'.-.l.nc,e'n, ronotethution (7) _ ( 10.0) ( 31.6) ( 33.8)Loaf s _ (f60.0) (126.1) (135.2)N-t iso-ee-ntal nh fl hanh) (10) - (211.9) (169.7) (171.0) 17 35.5 JS 6 107.b l 12d.7 136.3 111.1 1Y2., 1 71.6 -T.iTTIoc,e'oooal noeL Dsah 215 Sin of ranorer .(11) - .5( 7.) ( 82.9) ( 93.3) (61.6) (19.5) 1.0 18.1 39.0 56.7 88.2 110.0 151.1 1'3.1
Estfrterd Fim.nciel Rate of Return 12%
.: Pro:atfrens cattle-in_-oopao,y.
Operatioh, repair a- -ain.tenanne ricing froe Ps 30 to Ps 33 Year 6, Ps 36 Year 7, Ps 10 Year 8 onwarda.
(3) Voternsi. y e,p,0sec, aithoat derelop-net, Ps 15 per AU.
... tiaily cattlr --ventory ta.
(5) See Anr.er 7.
(6) 'qual a-talnonts Years 6-11; half instalnent Years S and 12.
i7! Sa -cor's oorltrib.tion in caah, labor and -aterial., 20% of napitr.1 e.penditare, excluding c-otributitn to hort-ter finencigo- purcha-ed steers (las than one year). See Annes 7.
:le- -oo-e , lhot d.eelop,ent, adjusted for e..pected fall iP cattle .aie price.
(.1 Diffsren-- beLceen net inno:e with acd withoat developrept (adjueted for prime nhifge).
(1) Basis for calcalasting esti.ated finuncial rate of return,.
(11) Differeoci betwreen e.tintated nash p:,sitioc with and o.ithost develepcent.

ANNEX 10
COLOMBIA
SECOD LIVESTOCK PROJECT
Dairy Farm (60 ha) - Capital Expenditure and Financing
YEAR 1 2 3 Total
Units Pesos Units Pesos Units Pesos Pesos
On-Farm Investment
Fencing (l) 440 m 2,000 440 m 2,000 4 0 m 2,000 6,ooo
Water supply (2) 2,000 2,000 2,000 6,000
Access roads and drainage (3) 4o,000 6,000 6,000 16,000
Pasture irnprovement (4i) 9 ha 26,100 9 ha 26,100 9 ha 26,100 78,300
Equipment (5) 12,000 16,000 - 28,000
Building :improverents _ 5,000 20,000 25,000
Breeding ;tock: (6)Heifers @ Ps L,500 8 36,000 7 31,500 - ,
Bulls @ Ps 15,000 1 15,000 - 82,500
Contingency (10%) 9,700 8,900 5,600 2J4 ,200
TOrAL 106,800 97,500 61,700 266,ooo
Financing
Caja loan 80% 85,400 78,000 lO,LOO 212,800Farmer's contribution 20% 21,400 19,500 12,300 53,200Farmer's contribution provided by:
Earnings 30,200 35,300 50,600
Less:: Net cash surplus 8,800 15,800 38,300
TOTAL 21,400 19,500 12,300
(1) Ps 4.5 per meter.
(2) Including 1i troughs @ Ps 500.
(3) 0.5 km @ Ps 20/meter; 1 km drainage @ Ps 3/meter; 1 bridge @ Ps 3,000.
(14) Ps 1,20)0 per ha plus fertilizer on remaining pasture to irnprove fertility.
(5) Forage harvester Ps 10,000; Trailer Ps 8,000; Silo Ps 6,000: Electric fence Ps 2,000; Dairy equipment Ps 4,000.
(6) Additions for increased herd.

ANNEX 11
COLOMBIA
SECOND LIVESTOCK PROJECT
Model for 60 ha DaizDr Farm Developrment
0YEAR Without 1 2 3 k 5 6-20
development
HERID CCMPOSITION (end of year)
Cows 50 58 66 69 70 70 70Bulls 2 3 3 3 3 3 3Calves 33 33 41 50 55 56 56Heifers (1-2 Yrs) 12 15 15 18 19 19 19Heifers (2-3 I ) 11 11 14 14 17 17 17Young bulls (1-3 T ) 2 2 2 2 2 2 2
TOTAL 110 122 ill 156 166 167 167
Animal Units (AU' 77 89 100 106 111 111 111Carrying Capacity 75 99 108 117 117 117 117
PURCHASES ( No)
He if e rs - S 7 - - - -
B3ulls - 1 - - _ _ _
D_ATHS (1I'o )
Cows 3 3 2 2 1 1 1Calves 4 4 4 4 6 6 6Heifers 2 2 2 2 2 2 2
TOrAL 9 9 8 8 9 9 9
SALES (No) Ps per, unit
Ciull co .. 1,500 6 6 6 7 10 lh 14bul 1 s 1,800 1 1 1 1 1 1 1heifer., 2,000 1 1 1 1 1 1 1
Bull calves ( L week) 100 13 13 13 17 21 23 24Heifer calves (C,-i Yr) 500 3 - - 1 3 7 7
TOTAL 24 21 21 27 36 66 07
MILE PRODTIIN 1 ' Liters)
Total produ-.ri An (thousands) 36.5 41.1 62.1 8i1.7 106.2 1ll.2 120.1Production 1,200 1,350 1,500 1,700 1,900 2,000 2,100
TECHNICAL COLF' .. ",isS (V
Calf birtn ra e 65 65 70 75 80 U0 80ilortality - calves 10 10 10 10 11O 10 10
- cows 5 5 4 3 2 2 2-heifers 5 5 4 3 3 3 3
Culii-tg - - cows 12 12 12 12 15 20 20- heifers 10 (reduced to 5 when heiCers sold from calf crop) 5- bulls As required
Cows in . k 50 50 58 62 67 67 67Average daily milk production
per co1: - l' 'rs 4.o I.5 5.0 5.67 6.33 6.67 7.0
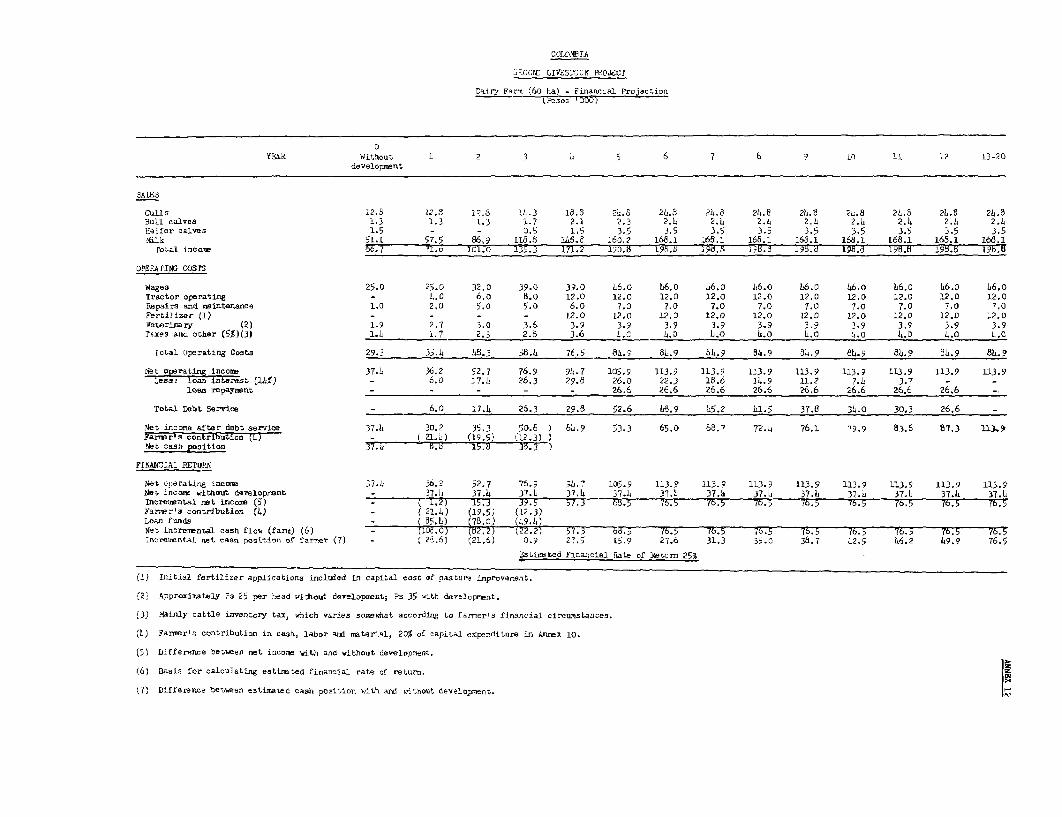
COLDOS BA
a2ECOI IVES1OCK 0 C WoECT
Dairy Farm (60 ha) - Financial Projaction(3'esoo '000)
YFAR Without 1 2 3 5 6 7 8 ? 11 12 13-20developmnnt
aA183
Cull s 12.5 12,8 :p.8 1i.3 128.5 2L.6 2.6 24,a 24.5 21.e 2u.8 2L.5 21,8 2h.8Bull calves 1.3 1.3 1.3 1.7 2.1 2.3 2.L 2.L 2.4 2,4 2.4 2.4 2., 2.4Heifer calves 1.5 - - 3.5 1.5 3.5 3.5 3.5 3.5 3.5 3.5 3.5 3.5 3.5Milk 51.1 57.5 66.9 118.8 13.8 160.2 168.1 165.: 165.1 168.1 166.1 168.1 168.1 166.1
rotal incrae Bc.? PiL 1c1.0 1 35.3 1 7 1.2 132.8 190.- 198.Ol 1B8.. 190.d 198.0 195.5 19B.d
OPERAPINr COSrS
ldages 25.0 25.0 32.0 39.0 39.0 h6.o 46.0 b6.0 16.0 h6.0 h6.o 16.0 46.o 16.0Tractor operating - 1.0 6.o 6.0 12.0 12.0 12.0 12.0 12.0 12.0 12.0 12.0 12.0 12.0Repairs and waintenance 1.0 2,0 5.o 5.o 6.o 7.0 7.0 7.o 7.0 7.0 7.0 7.0 7.0 7.0Fertilizer (1) - - - - 12.0 12.0 12.0 12.0 12.0 12.0 12.0 12.0 12.0 12.0Weteina ry (2) 1.9 2,7 3.0 3.6 3.9 3.9 3.9 3.9 3.9 3.9 3.9 3.9 3.9 3.9Taxes anc other (5$)(3) 1.4 1,' 2.3 2.6 3.6 _1.0 4.3 1.0 h.0 1.0 1.0 4.o 4.0 1.0
Iotal Oprating Costs 29.3 35.4 h15.3 55.1 76.5 84.9 61.9 54.9 8a4.9 1.9 841.9 84.9 81.9 84.9
Net operating intome 37.6 36.2 52.7 76.9 94.7 105.9 113.9 113.9 113.9 113.9 113.9 113.9 113.9 113.9-I,ess: loan interest (413) - 6.0 17.4 26.3 29.8 26.o 22.3 18.6 14.9 21.2 7.3 3.7
loan repaysnt - - - - 26.6 26.6 26.6 26.6 26.6 26.6 26.6 26.6
Total Debt Service - 6.0 17.1 26.3 29.6 52.6 1i.9 15.2 11.5 37.6 31.0 30.3 26.6
Net iTrone after debt servioe 37.1 30.2 35.3 50.6 ) 6h.9 53.3 65.o 68.7 72.2 76.1 79.9 83.6 87.3 13.9Farxwr's contribiution (1) - ( 21.3) (19.5) l12.3))Net rash position 37.1 8.0 25.o 35.3
FINANCLU ETUrRl
Net lyerati,g nce 37.1 36.2 52.7 76.9 34. 7 135.9 113. 113.9 113.9 113.9 123.9 113.9 113.9 113.RNet inco¢ without developant _ 37.1 37.4 37.L 37.b 37.1 37.1 37.1 37.1 37.4 37.1 37.1 37.4 37.1Incremental rnet incor. (5) _ ( 1.2) 15.3 39.5 57.3 65.5 76.5 76.5 76.5 76.5 76.5 76.5 76.5 (6.5Farer's con.ribution (14) - ( 21.4) (19.5) (12.3)Loan funds _ (65.1) (75.2) (19.bNet incremental cash flow (farn) (6) - (100) (52.2) |22.2 57.3 65.5 76.5 76.5 76.5 76.5 76.n 76.5 76.5 76.5tnrrewental net casn position of farver (7% - '2i6j '21.6) 0.9 27.o o.9 27.6 31.3 35.0 3t,7 12.5 16.2 hs.9 76.5
tiv t-e dFinancial Rate of Return 25%
(1) Initial fertilizer applications included in capital cost of pasture inprovement.
:2), Approximately *s 25 per oead izhout developeent; Ps 35 cith derelcprent.
(3) Painly cattle inventory tax, which varies sojewhat according to famer's financial circumstances.
(1) Farmer's contribution in cash, labor and material, 20% of capital experditure in Annex 10.
(5) Difference beoween net income ith and without development.
(6) Basis for calculating estirated financial rate of return.
7) Difference between e5timated cash position with ard vithOtt developrment. ,o
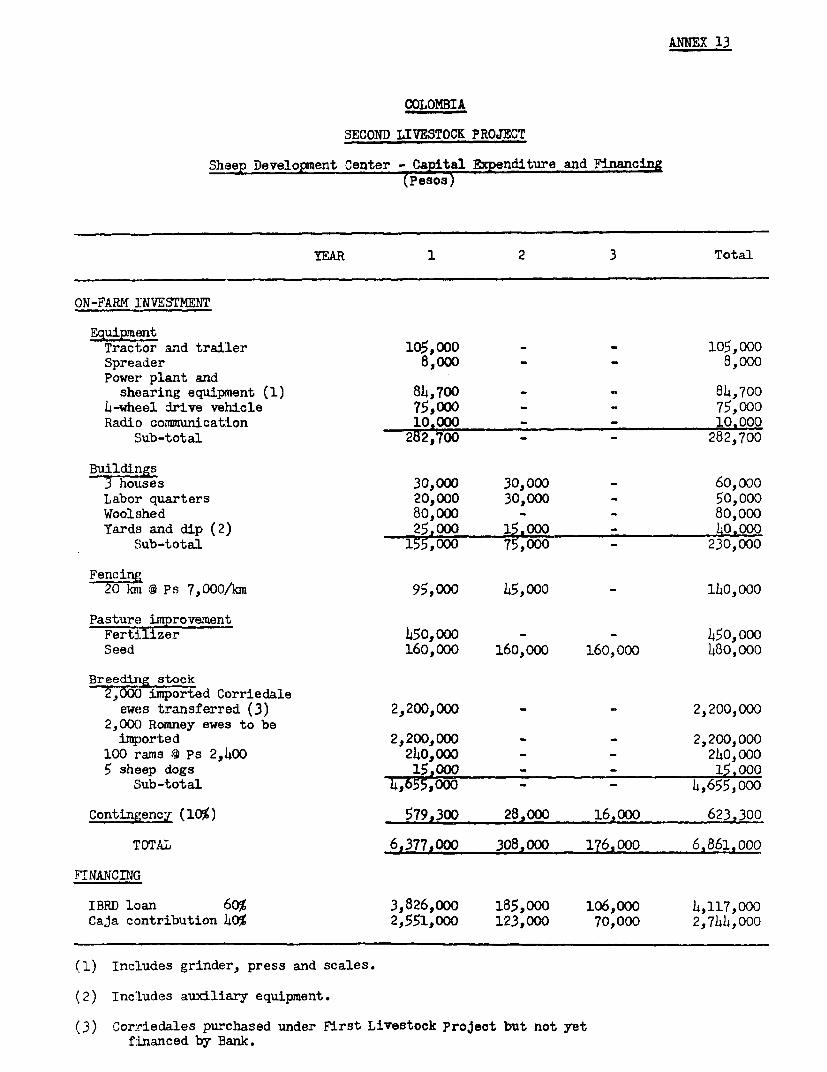
ANNEX 13
COLOMBIA
SECOND LIVESTOCK PROJECT
Sheep Development Center - Capital Expenditure and Financing(Pesos)
YEAR 1 2 3 Total
ON-FARM 3INVESTMENT
EuipmentTractor and trailer 105,000 - - 105,000Spreader 8,ooo - - 8,000Power plant and
shearing equipment (1) 84,700 - - 84,7004-wheel drive vehicle 75,000 - - 75,000Radio communication 10.000 - - 10.000
'Sub-total 282,700 - - 282,700
BuildirM3 'hous es 30,000 30,000 - 60,000Labor quarters 20,000 30,000 - 50,000Woolshed 80,OO - - 80,000Yards and dip (2) 25,000 15.000 - 40.000
'Sub-total 155,000 75,000 - 230,000
Fenci t,2 0 l P s 7,000/km 95,000 45,000 - 140,000
Pasture improvementFertilizer 450,000 - - 450,000Seed 160,000 160,000 160,000 480,000
Bree ig stock2,000 imported Corriedale
ewes transferred (3) 2,200,000 - - 2,200,0002,0a) Romney ewes to beimported 2,200,000 - - 2,200,000
100 rams @ Ps 2,400 240,000 - - 240,0005 sheep dogs 15,000 - - 15,000
Sub-total 47,55,000 - - 4,655;000
Contingency (10%) 579,300 28,000 16,000 623,300
TOTAL 6,377,000 308,000 176.000 6,861.000
FTNANCING
IBRD loan 60% 3,826,000 185,000 106,000 4,117,000Caja contribution 40% 2,551,000 123,000 70,000 2,7)4,000
(1) Includes grinder, press and scales.
(2) Inc Ludes auxlli.ary equipment.
(3) Cor.riedales purchased under First Livestock Project but not yetfinanced by Bank.
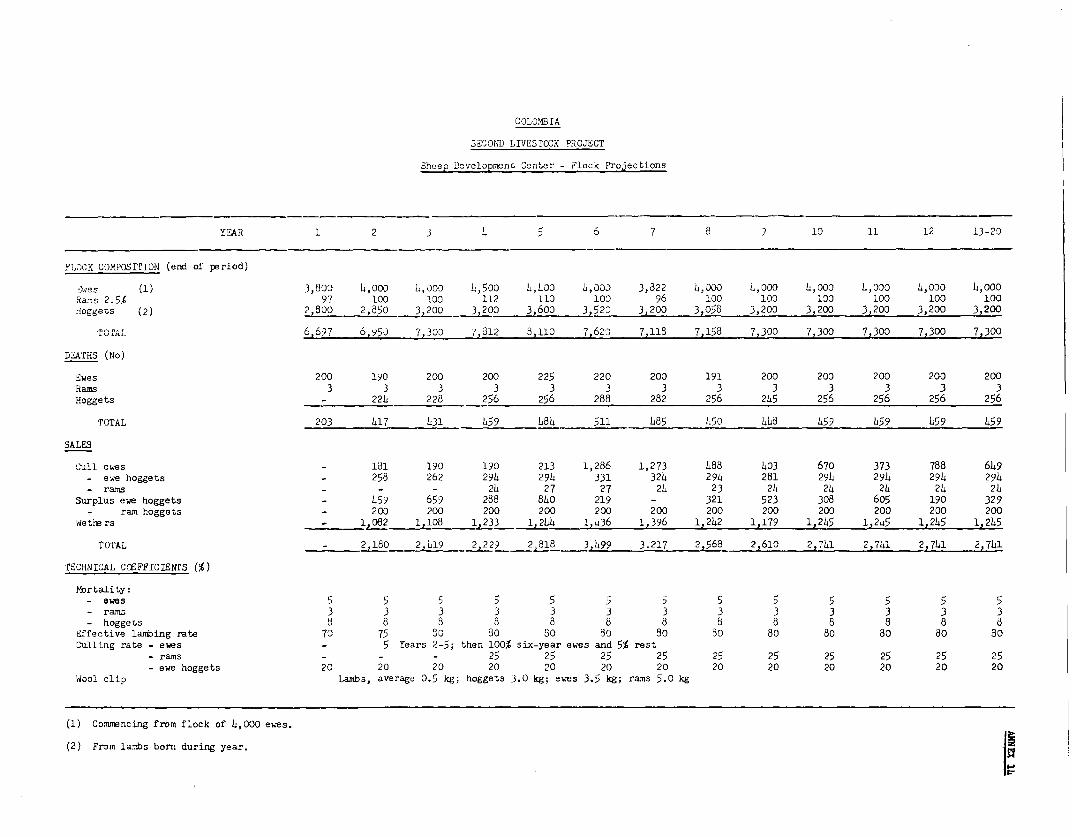
COLO.MIA
S3',ONL LrVESrOCK PROJECT
Sheep, Developmnt Center - Flock Projections
YEAR 1 2 3 4 5 6 7 a 2 10 11 12 13-20
FLIOCK COmPOSITioN (end of period)
S'wes (1) 3,80D 4,000 4,000 4,500 4,400 4,000 3,322 4,000 3,000 h,000 4,090 4,000 4,000Rams 2.5% 97 100 100 112 110 100 96 100 100 100 100 100 100Hoggets (2) 2,800 2,850 3,200 3,2 0o 3,6 0 3,520 3,200 3,o58 3,200 3,200 3,200 3,200 3,200TOIAL 6,697 6,950 7,30D '7,312 8,110 7,623 7,118 7,158 7,300 7,300 7,300 7,300 7,300
DEArHs (No)
,wes 200 19O 200 200 225 220 200 191 200 200 200 200 200Rams 3 3 3 3 3 3 3 3 3 3 3 3 3Hoggets - 224 228 256 256 288 282 256 245 256 256 256 256TOTAL 203 417 431 459 484 511 485 450 44a 459 459 459 459
SALES
Cull ewes - 181 190 190 213 1,286 1,273 488 403 670 373 788 649- ewe hoggets - 258 262 294 294 331 324 294 281 294 294 294 294- rams - - - 24 27 27 24 23 24 24 24 24 24Surplus ewe hoggets - 459 659 288 840 219 - 321 523 308 605 190 329- ram hoggets - 200 200 200 200 200 200 200 200 200 200 200 200Wethers - 1,082 1,108 1,233 1,244 1,436 1,396 1,242 1,179 1,245 1,245 1,245 1,245TorAL - 2,180 2,419 2,229 2,818 3,499 3,217 2,568 2,610 2,741 2,741 2,741 2,741
rECHNICAL CEFFICIENTS (%)
Mortality:- ewes 5 5 5 5 5 5 5 5 5 5 5 5 5- rams 3 3 3 3 3 3 3 3 3 3 3 3 3- hoggets 8 8 8 8 8 8 8 8 8 8 8 8 8Sffective lambing rate 70 75 80 80 s0 80 o0 S0 80 80 80 80 80Culling rate - ewes _ 5 Years 2-5; then 100% six-year ewes and 5% rest
- rams - - - 25 25 25 25 25 25 25 25 25 25- ewe hoggets 20 20 20 20 20 20 20 20 20 20 20 20 20Wool clip Lambs, average 0.5 kg; hoggets 3.0 kg; ewes 3.5 kg; rams 5.0 kg
(1) Comirencing from flock of 4,000 ewes.
(2) From lambs born during year. 1!

COLOMBIA
SECOND LIVESTOCK PROJECT
Sheep Development Center - Financial Projections(Pesos '000)
YEAR 1 2 3 4 5 6 7 8 9 10 11 12 13-20
SALES Uhit Price Ps
Culls 200 - 88 90 101 107 329 321 161 141 198 138 221 --Surplus ewe hoggets 700 - 321 461 202 588 153 - 225 366 215 424 133 -
ram hoggets 800 - 160 160 160 160 160 160 160 160 160 160 160 -Wethers 200 - 216 222 247 249 287 279 2h8 236 249 249 249 -
Sub-total - 765 933 710 1,104 929 763 794 903 o22 971 763 833 (1)Wool 404 388 104 418 454 462 430 406 450 450 450 450 450
Total Income 104 1,173 1,337 1,128 1,558 1,391 1,193 1,200 1,353 1,272 1,421 1,213 1,283
OPERATING COSTS
Wages 138 138 138 91(2) 94 94 94 94 94 91 91 94 94Operation, repairs
and maintenance 16 15 16 10(3) 52 55 60 60 60 60 60 60 60Fertilizer - 225 225 225 225 225 225 225 225 225 225 225 225Veterinary 27 26 27 28 31 31 29 27 28 28 28 28 28Other (5%) 9 20 20 19 20 20 20 20 20 20 20 20 20
Total Operating Costs 190 424 426 406 422 425 428 426 427 427 427 427 427
Net operating income 214 749 911 722 1,136 966 765 771 926 845 994 786 856Less: loan interest/repayment(4) 191 392 106 412 412 412(1) 601 601 601 604 601 604 604
Net income after debt service 23 357 505 310 724 55 161 170 322 241 390 162 252Caja contribution (2,551) (123) (70) - - - - - - - - - -
Net cash position (2,52B) 234 435 310 724 554 161 170 322 241 390 1Y2 252
FINANCIAL RETURN
Net operating income 214 749 911 722 1,136 966 765 771 926 815 991 786 856Capital expenditure (5) 6,377 308 176 - - - - - - - - - -Net cash flow (6) (6,163) 424 735 722 1,136 966 765 774 926 645 994 76b o5b
(1) Income stabilizes at this level with change in composition of sales from balanced flock.
(2) Reduction in labor force and omission of one technician as flock becomes established.
(3) Includes provision for vehicle replacement from Year h.
(h) Six-year grace period; repayment to Government by equated annuity at 10%; total 18 years.
(5) Capital expenditure to be financed 60% by Bank loan, L0% by Caja.
(6) The estimated finaneial rate of return is 12%.
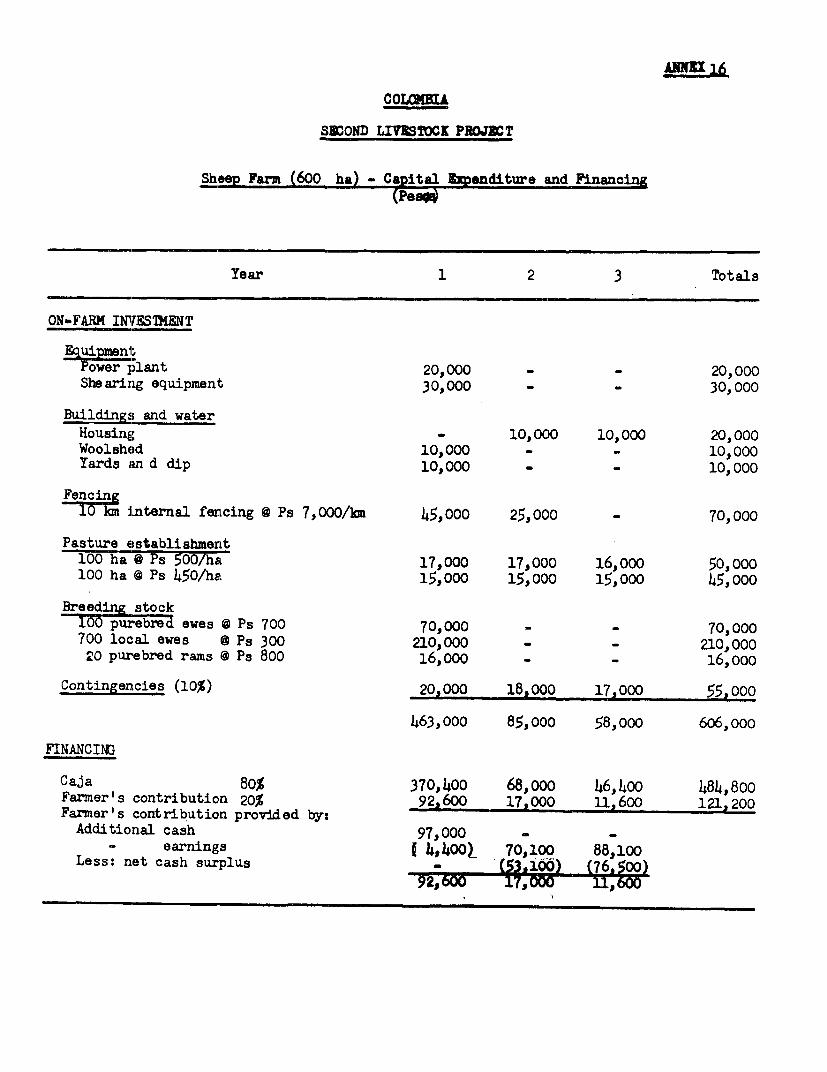
COLCUBIA
SBCOND LIVMTOCK PROJBCT
Sheep Farm (600 ha) - Caital lipenditure and Financing(Pesoq
Year 1 2 3 Totals
ON-FARM IVES2MENT
Equipmentower plant 20,000 _ _ 20,000
She aring equipment 30,000 - _ 30,000
Buildings and waterHousing - 10,000 10:000 20,000Woolshed 10,000 - -10,000Yards an d dip 10,000 - - 10,000
Fencinginternal fencing @ Ps 7,000/km 45,000 25,000 - 70,000
Pasture establishment100 ha @ Ps 500/ha 17,000 17,000 16,000 50,000100 ha @ Ps 450/ha 15,000 15,000 15,000 45,000
Breedi stock-I0Fpurebred ewes @ Ps 700 70,000 - - 70,000700 local ewes @ Ps 300 210,000 - _ 210,000
20 purebred rams @ Ps 800 16,000 - - 16,000
Contingencies (10%) 20,000 18,000 17,000 55,000
463,000 85,OOO 58,000 606,000
FINANCIN3
Caja 80% 370,400 68,ooo 46,400 484,800Farmer's contribution 20% 92,600 17,000 U1,600 121,200Farmer's contribution provided by:
Additional cash 97,000 - -- earnings s 4l4001 70s100 88,100
Less: net cash surplus
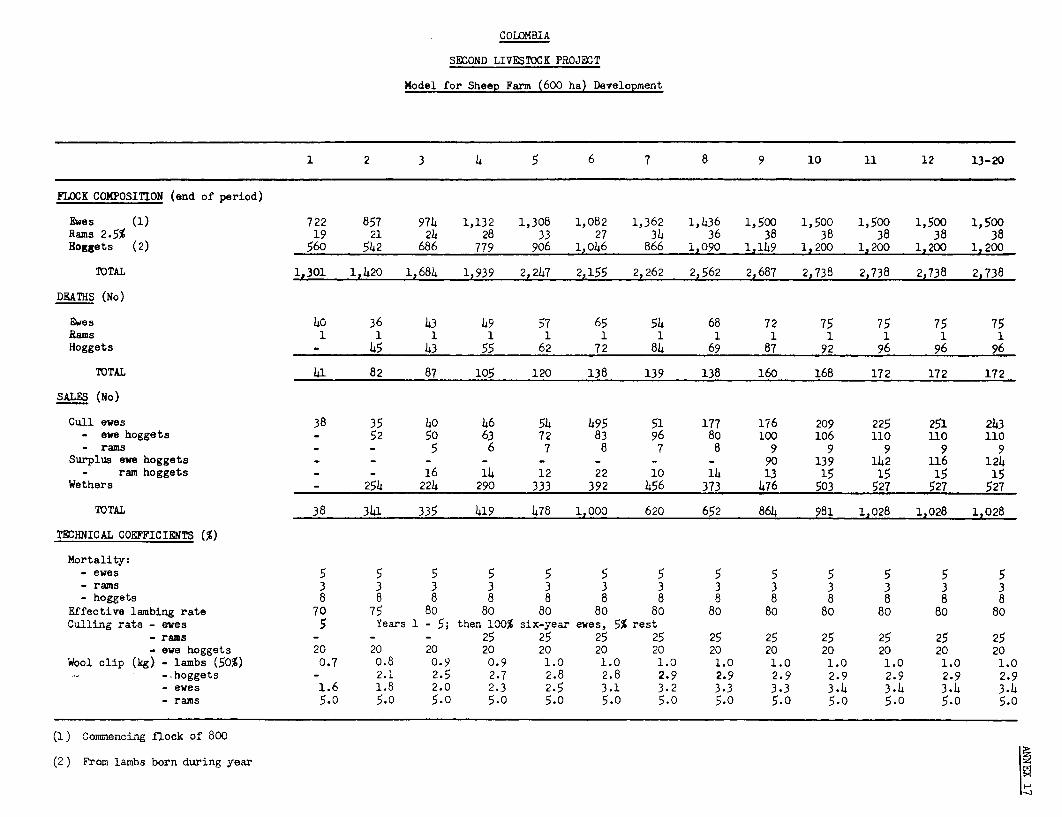
COLOMBIA
SECOND LIVESTOCK PROJECT
Model for Sheep Farm (600 ha) Development
1 2 3 4 5 6 7 8 9 10 11 12 13-20
FLOCK COMPOSITION (end of period)
Ewes (1) 722 857 974 1,132 1,308 1,082 1,362 1,436 1,500 1,500 1,500 1,500 1,500Rams 2.5% 19 21 24 28 33 27 34 36 38 38 38 38 38Hoggets (2) 560 542 686 779 906 1,046 866 1,090 1,149 1,200 1,200 1,200 1,200
TOTAL 1,301 1,420 1,684 1,939 2,247 2,155 2,262 2,562 2,687 2,738 2,738 2,738 2,738
DEATHS (No)
Ewes 40 36 43 49 57 65 54 68 72 75 75 75 75Rams 1 1 1 1 1 1 1 1 1 1 1 1 1Hoggets - 45 43 55 62 72 84 69 87 92 96 96 96
TOTAL 41 82 87 105 120 138 139 138 160 168 172 172 172
SALES (No)
Cull ewes 38 35 40 46 54 495 51 177 176 209 225 251 243- ewe hoggets - 52 50 63 72 83 96 80 100 106 110 110 110- rams - - 5 6 7 8 7 8 9 9 9 9 9
Surplus ewe hoggets - - - - - - - - 90 139 142 116 124- ram hoggets - - 16 14 12 22 10 14 13 15 15 15 15
Wethers - 254 224 290 333 392 456 373 476 503 527 527 527
TOTAL 38 341 335 419 478 1,000 620 652 864 981 1,028 1,028 1,028
TECHNICAL COEFFICIENTS (%)
Mortality:- ewes 5 5 5 5 5 5 5 5 5 5- rams 3 3 3 3 3 3 3 3 3 3 3 3 3- hoggets 8 8 8 8 8 8 8 8 8 8 8 8 8
Effective lambing rate 70 75 80 80 80 80 80 80 80 80 80 80 80Culling rate - ewes 5 Years 1 - 5; then 100% six-year ewes, 5% rest
-rams - - - 25 25 25 25 25 25 25 25 25 25- ewe hoggets 20 20 20 20 20 20 20 20 20 20 20 20 20
Wool clip (kg) - lambs (50%) 0.7 o.8 0.9 0.9 1.0 1.0 1.0 1.0 1.0 1.0 1.0 1.0 1.0--hoggets - 2.1 2.5 2.7 2.8 2.8 2.9 2.9 2.9 2.9 2.9 2.9 2.9- ewes 1.6 1.8 2.0 2.3 2.5 3.1 3.2 3.3 3.3 3.4 3.4 3.4 3.4- rams 5.0 5.0 5.0 5.0 5.0 5.0 5.0 5.0 5.0 5.0 5.0 5.0 5.0
(1) Cormienciag flock of 800
(2) From lambs born during year
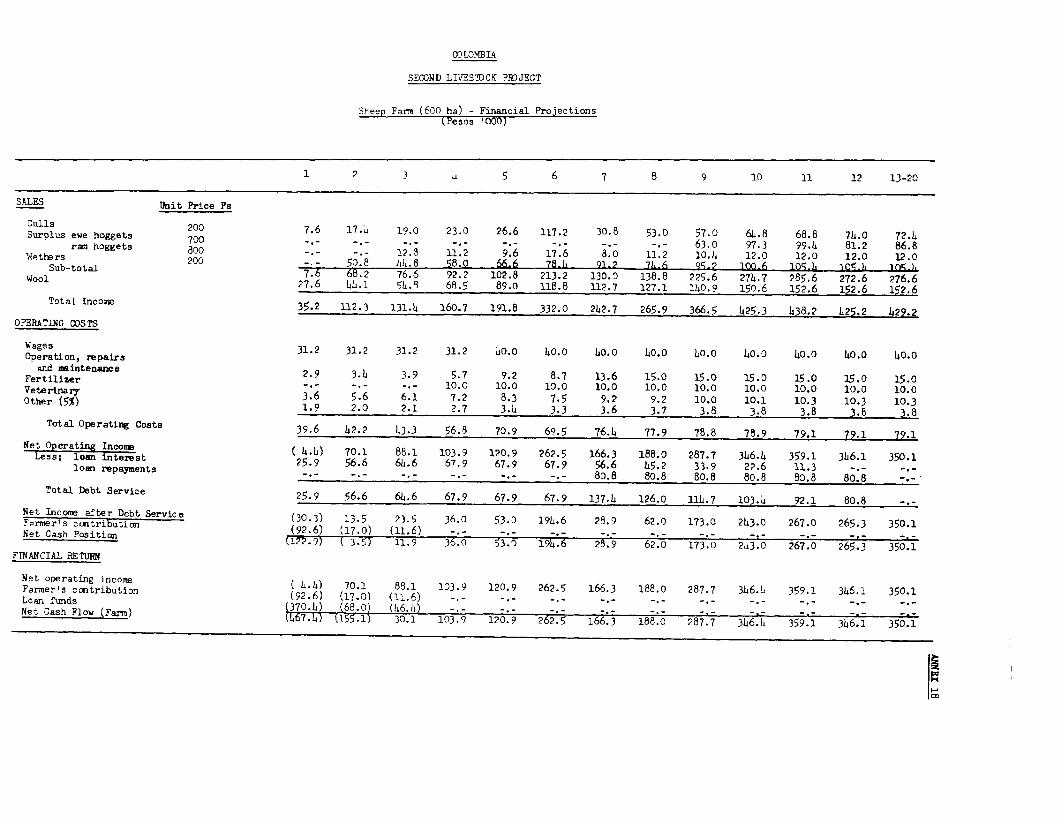
CO)LOMBIA
SECOND LIVESTOCK PROJECT
Sheep Farm (600 ha) - Financial ProjectionskFesos '0
1 2 3 4 5 6 7 8 9 10 11 12 13-20
SALES Unit Price Ps
Culls 200 7.6 17.. 19.0 23.0 26.6 117.2 30.8 53.0 57.0 64.8 68.8 74.0 72.hSurplus ewre hoggets 700 _ _ _ _ _ 63.0 97.3 99.4 81.2 86.8ras hoggets 800 _._ _. 12.8 11.2 9.6 17.6 8.0 11.2 10.4 12.0 12.0 12.0 12.0Sub-total R200 _ 50.8 44.8 58.0 66.6 78.4 01.2 7)46 . 10.6 10 .h 105.h I or, ISub- total 7.6 6c.2 76.6 92.2 102.8 213.2 130.0 138.8 225.6 274.7 285.6 272.6 276.6Wool 27.6 l4.i 54.8 68.5 89.0 118.8 112.7 127.1 140.9 150.6 152.6 152.6 152.6Total Income 35.2 112.3 131.4 160.7 191.8 332.0 242.7 265.9 366.5 425.3 438.2 425.2 429.2
OPERATING COSTS
Wages 31.2 31.2 31.2 31.2 40.0 40.0 40.0 40.0 40.0 40.0 40.0 40.0 40.0Operation, zepairsand maintenance 2.9 3.4 3.9 5.7 9.2 8.7 13.6 15.0 15.0 15.0 15.0 15.0 15.0Fertilizer -. . -.- 10.0 10.0 10.0 10.0 10.0 10.0 10.0 10.0 10.0 10.0Veterinary 3.6 5.6 6.1 7.2 8.3 7.5 9.2 9.2 10.0 10.1 10.3 10.3 10.3Other (5%) 1.9 2.0 2.1 2.7 3.4 3.3 3.6 3.7 3.8 3.8 3.8 3.8 3.8
Total Operating Costs 39.6 42.2 43.3 56.9 70.9 69.5 76.4 77.9 78.8 78.9 79.1 79.1 79.1Net oprating Income
Lets; Oloran Interest 14.4) 70.1 88.1 103.9 120.9 262.5 166.3 188.0 287.7 346.4 359.1 346.1 350.1loan repaynents 25.9 56.6 64.6 67.9 67.9 67.9 56.6 45.2 33.9 22.6 11.3n repayments _._ _._ _.- -. - -. - -. - 80.8 80.8 80.8 80.8 80.8 80.8 --
Total Debt Service 25.9 56.6 64.6 67.9 67.9 67.9 137.4 126.0 1114.7 103.4 92.1 80.8Net Income after Debt Service (30.3) 13.5 23.5 36.o 53.0 194.6 28.9 62.0 173.0 2413.0 267.0 265.3 350.1Nermer s ctribution (92.6) (17.0) (11.6) - - - - - -Net Cash Position (12.9) ( 3.5) 11.9 36.0 53.0 194.6 28.9 62.0 173.0 243.0 267.0 265.3 350 1
FDINANCIAL RETUR!
Net operating int ome ( u.n4) 70.1 88.1 103.9 120.9 262.5 166.3 188.0 287.7 3h6.)4 359.1 346.1 350.1Farmer s contribution (92.6) (17.0) (1I 6) -.- -.- -.- -.- -.- -.- --Net iundsh Flow (Farm) 1 31 1392370. 142 (68.5 166 3 188 0 28 7 34 4 3 3 350.1Net Cash Flow (Farm) 1~~~~~467. L t551 30.1 103.9 120.9 262.5 166.3 188.0 287.7 3)46.14 359.1 3)46.1 350.1
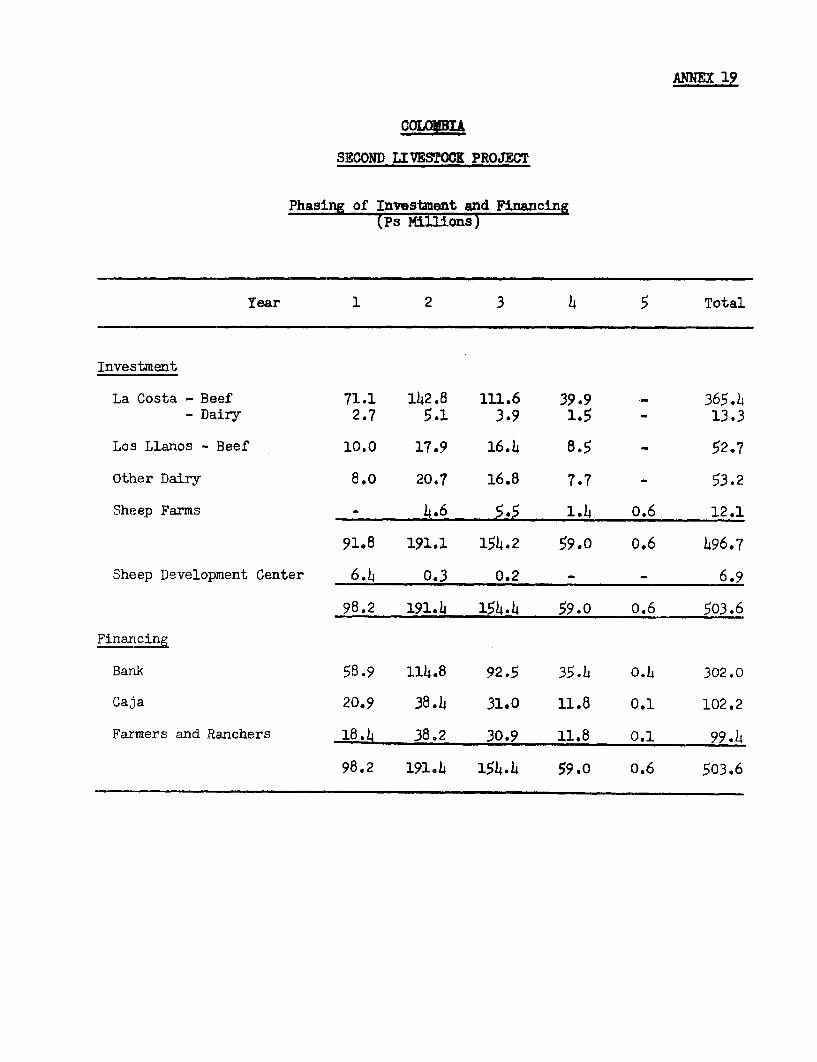
ANNEX 19
GCoLn"R
SECOND LIVESTOCK PROJECT
Phasing of Investment and Financing(Ps Millions)-
Year 1 2 3 4 5 Total
Investment
La Costa - Beef 71.1 142.8 111.6 39.9 - 365.4- Dairy 2.7 5.1 3.9 1.5 - 13.3
Los Llanos - Beef 10.0 17.9 16.4 8.5 - 52.7
Other Dairy 8.o 20.7 16.8 7.7 - 53.2
Sheep Farms - 4.6 5.5 1.4 0.6 12.1
91.8 191.1 154.2 59.0 0.6 496.7
Sheep Development Center 6.4 0.3 0.2 - - 6.9
98.2 191.4 154.4 59.0 0.6 503.6
Financing
Bark 58.9 114.8 92.5 35.h 0.4 302.0
Ca,-la 20.9 38.4 31.0 11.8 0.1 102.2
Farmers and Ranchers 18.4 38.2 30.9 11.8 0.1 99.4
98.2 191.4 154.4 59.0 0.6 503.6

ANNEX 20
S3COND LIVESTOCE PR0JET
Cost of Technical Services
Year 1970 1971 1972 1973 Total 1970 1971 1972 1973 Total
(Ps tOOQ) . (us$ '000)
FORaIUMJ iXCHANGE COST
Proiect management 1,600 1,600 1,600 1,600 6,400[ 94.1 94.1 94.1 94.1 376.4
Training of local staff 570 570 570 - 1,710 33.5 33.5 33.5 - 100.5
Transportation- 275 275 275 275 1,100 16.2 16.2 16.2 16.2 6L1.8
Sub-Tota1 2,445 2,445 2,45 1,875 9,210 143.8 143.8 143.8 110.3 541.7
LOCAl COSTS
Local technioians 2,091 2,091 2,091 2,091 8,364 123.0 123.0 123.0 123.0 492.0
Administration 400 b00 400 400 1,600 23.5 23.5 23.5 23.5 94.0
Tr-ans;ota tion 125 125 125 125 500 7.4 7.4 73 7.3 29.4
5SUD-total 2,616 2,616 2,616 2,616 10,4641± 153.9 153.9 153.8 153.8 615.4
SEriAL 5,061 5,061 5,061 I4,491 19,674 : 297.7 297.7 297.6 264.1 1,157.1
ac1ludeF; prnvi sion for purchase of 15 Jeeps

COLOMBIA
SECOND LIVESTOCK PROJECT
Project C.Jsh Flow(Pesos 1000)
Tear 1 2 3 5 6 7 8 9 10 11 12 13 14 15 16 17 18
Loana 55,065 114,655 92,538 35,426 348 - - - - -- ----- -Technical. assistanoo 2,295 2,295 2,295 2,295 - - - - - --------Sheep Development Center 3.826 185 106 - - - - -- -------Sub-total 61,186 117,135 94,939 37,721 345
CAJA:Loans 18,355 38,219 30,846 1-1,808 116 - - - - - - -------Technical services 1,720 2,860 4,000 4,0o0 2,000 1,000o 1,000 1,000 1,000 1,00 1 1,000 1,000 1,000 1,0 1,0 ,0 ,0Skuep Development Center (Net) 2 574 48 575 310 724 550 160 170 320 240 390 180 250 250 ~ -Sub-total "V;I1I5 3,41 16,115 2,040 1,550 1,160 1,170 1,320 1,240 1,3590 1,180 1,250 1,50 1,50 1,50 1,50 i,Shoot-term loane 25,6260 48,720 46,3170 23,:180F - - - - - - - - - - ----Sub-tot-al 48,ze C0279 0171 e29 ,Bs U4U ,55u 1,160 1, I-t 1,320 1,240 1,390 1,1830 1,250 1,250 1,250 1,250 1,250 1,5
Interest 5,150 20,979 40,315 52,267 52,457 45,820 38,920 31,910 24,810 17,680 10,540 3,650 110 - ---Repayments - - - - 22.840 437.710 9.10 50.02 50,830 50,830 510, 8730 49~,3200 25,39 810 --- SoSub-total 5,150 20,979 40,315 52,267 7487 353 8,3 81,93 75,640 6a,5l0 6,30 290 2550 -1 - --Shrt-term inteamest 3,060 5,880 5,530 2,765 - - - - - - ------
Total Rinda 117,665 234,273 222,575 132,051 78,085 95,080 89,290 83,100 76,960 69,750 62,760 54,16o 26,750 2,060 1,250 1,250 1.250 1,250
AFPLICATION 0F 70NS
Loana granted:Beef cattle 64,880 128,560 102,360 38,680 - - - - - --------Dairy farms 8,54o 20,610 1J6,640 7,410 - - - - - - ------- Sheep farms - 3.704 .38, L&. 6 - -
Sub-total 71420 152,874 123,384 47,234 464 .Short-term loa,u 25,620 48,720 46,370 23,180 7
Sbimp b6im16pamt C6fitei 6,377 308 176 - - - - - - - -- -----Expenaeee
Admini1stration 690 1,030 960 1,000 500 500 500 500 500 500 500 500 500 o 500 500 5oc0o 500Tuhsclassistance 2,295 2,295 2,295 2,295 - - - - - - --- Technical swvicas 1,72 2,860 400 .0 2.00 1.0 ox 1.000 1.000 1.000 1.000 1. O 100 1.000 1,000 1.000 1,000 1.000 1,000Sub-total 4,705 6,105 7~~~~~~~~ ~~~, 255 729 2,500 1,500 1,500 1,500 1,500 1 500 1.500 1,500 1,500 2,500 1,500 1, 500 1,500 1,0
Interest payable& 1/IBRD loan 3,977 11,591 17,762 20,214 20,236 20,240 20,240 19,070 17,830 16,510 15,100 13,600 12,010 10,310 8,500 6,570 4,520 2,330Ecohmitet feek 1,876 998 286 3 - - - - - - - - - - - -- -Subha-eotal 2.14 6.4 .6 084 1,9 090 1,0 020 96 8,890 8,130 730 640 5,550 4,57o 3,540 2.430 1250Sub-total 7,995 10,030 27,612 31,101 31,133 3~~~~~~~~~~~J1,1940U 31,140 2930 2,375,3 320 2,20 60,470 15,060 13,070 10,110 6,950 3500
Loan repayment (annuity) - - - - - - 17,920 19,090 20,330 21,650 23,060 24,560 26,150 27,850 29,660 31.590 33,640 35,830
Tbtal Application 118,117 226,917 204,797 208,810 34,097 32,640o 5o,560 49,930 49,26o 48,55o 47,790 46,980 46.12o 45,210 44,230 43,200 42,090 40.910
Balance (452) 7,356 17,778 23,241 43,988 62,440 38,730 33,170 27,700 21,200 14,970 7,180 (19,370) (43,150) (42,980) (41,950) (4o,840) (39,660)Cumulative Balance (452) 6,904 24,682 41,923 q1,911 154;,351 193,081 226,251 253,951 275,151 290,121 297,301 277,931 234,781 191,801 149,851 109,211 69,351
I/ At an assumeed Bank interest rate of 6.5% leaving 3.5% twards ttie exclange risk. If intereat -it, is inmr .... d t~,n th, amount avail,abieto hlip mect tie exchange risk would be correspordi ogly reduced.
ANNEX 22Page 1
COLOMBIA
SECOND LIVESTOCK PROJECT
MARK ETING
1. The additional production of beef, dairy products and wool whichwould result from the proposed project would be marketed through existingchannels. For the expected increases in beef output current slaughteringcapacity is adequate and the facilities for cattle movement to consumptioncenters are satisfactory. Population growth would ensure a rising domesticdemand for additional beef at existing prices. In addition, Colombia has inprospect the possibility of increased export business.
2. For dairy products, processing capacity and transportationfacilities in the areas to be developed are adequate. Per capita consumptionof milk in Colombia is extremely low and is a reflection more on the existinglow purchasing power than on supply. However, in the major centers wherehigh population growth is the significant factor, there is an unsatisfieddemand for increased milk supplies. The areas proposed have ready accessto these markets so the increased output resulting from the Project wouldbe fully absorbed.
3. Colombia has had no experience with the marketing of locallyproduced fine wool. However, as evidenced by the level and nature of woolimports, there is a substantial demand for fine wool and the productiongenerated by the proposed Project would be readily saleable to the textileTiil I .
A. Beef
The Marketing Chain and Slaughter Facilities
h. The marketing of beef in Colombia is complex. Between producerand consumer there are many intermediaries including cattle dealers,commission merchants, wholesalers and retailers. This framework is aconsequence, largely, of inadequate market knowledge; beef producerscommonly sell their cattle on the farm rather than face the uncertaintiesassociated with transportation and market prices. In return, the inter-mediaries are well rewarded for assuming these risks.
5. The principal cattle market in Colombia is at Medellin, whereprices tend to fix the level of those in most other parts of the country.For this market cattle are drawn from the more western parts of the NorthCoast region, the departments of Antioquia and Caldas and the middleMagdalena Valley. Bogota is also an important market, its supply of cattlecoming from the middle Magdalena Valley as well as from the savannah ofBogota and from the Eastern Plains region (Los Llanos). Barranquillaprovides a rnarketing outlet for cattle from the North Coast and the lowerlMagdalena Valley. This coastal city is situated on the Atlantic sea-board
ANNEX 22Page 2
and its modern slaughtering and shipping facilities make it a logicaloutlet for the export of beef products. Other important markets areCali and Bucaramanga.
6. Cattle are transported to the market either on foot or by road,rail or river barge. Frequently a combination of these methods is used.In Los Llanos, the vastness of the area, the nature of the roads and thedistance to the main market at Bogota create special transportation problems.Apart from contraband exports to Venezuela, cattle are brought toVillavicencio on foot, by truck or river barge and thence by road (truck)to Bogota. In the wet season roads in Los Llanos are virtually impassableso that cattle can only be moved on foot or in some instances by riverbarge. Extensive cattle breeding is the predominant type of operation inthose regions most distant from Villavicencio, from which feeder steers aresold for fattening nearer this center.
7. The number of slaughterhouses in Colombia exceeds 800. Theoperation of most of these is conducted by municipal councils and the taxesand charges levied on cattle slaughtered are an important source of councilrevenue. Consumer preferences are for freshly killed meat. In the absenceof facilities for transporting refrigerated meat, except within the majorcities, the system, though inefficient and difficult to change or modernize,adequately meets the present requirements for fresh meat. With fewexceptions, slaughtering is carried out on a custom fee basis, according toWhich all important by-products remain the property of the cattle Xnmer andmust be kept identified with the carcass throughout processing. This limitsthe level of efficiency which can be achieved, particularly in the larger-scaleabattoirs.
8. Five slaughterhouses are currently involved in the export of meat - twoin Barranquilla and one each in the cities of Bogota, Buenaventura and SantaMaria. A sixth plant at Villavicencio went bankrupt in 1968. These plantshave slaughter and refrigeration capacity well in excess of likely export re-quirements in the foreseeable future. However, apart from these plants andone or two others, most slaughterhouses have little more than the mostrudimentary facilities for refrigeration and by-product processing.
Demand for Beef
9. Consumption of beef in Colombia is in the form of freshly killed leanmeat. Meat retailed by butchers has generally been killed the previous night.Fresh offal is extremely popular, to an extent that little of the originalanimal is left for processing. Domestic demand for processed meat is smallbut growing. Beef accounts for about 85 of per capita demand for red meatwhich has varied between 24 and 28 kilos per annum over the past 10 years or so,a level that is low by comparison with Argentina (80kg), Paraguay (50kg) andUruguay (70 kg). Between 1963 and 1966 per capita and total demand declinedsharply as a result of substantial increases in the retail price of beef towhich the consumer has displayed high sensitivity. MIoney prices have remainedsteady since then and a slight increase in consumption has occurred. Using
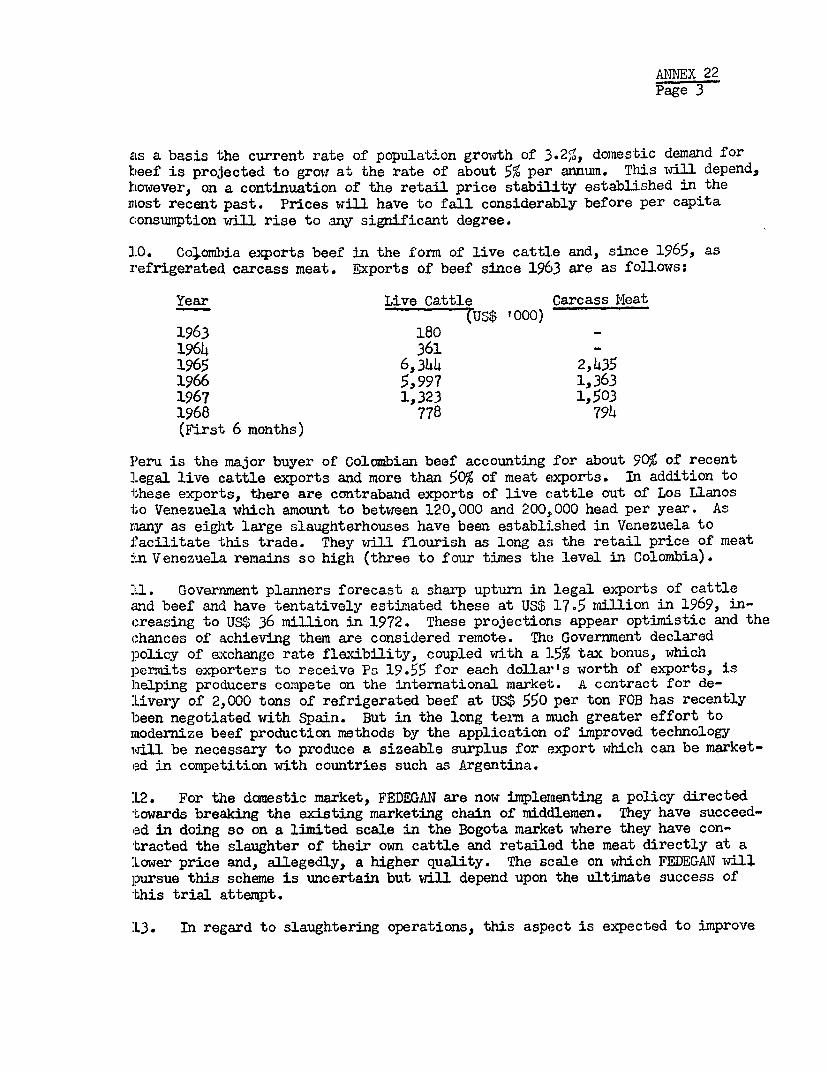
AONTEX 22Page 3
sts a basis the current rate of population growth of 3.2%, domestic demand forbeef is projected to groar at the rate of about 5% per annum. This will depend,however, on a continuation of the retail price stability established in themost recent past. Prices will have to fall considerably before per capitaconsumption will rise to any significant degree.
10. Colombia exports beef in the form of live cattle and, since 1965, asrefrigerated carcass meat. Exports of beef since 1963 are as follows:
Year Live Cattle Carcass Meat(us$ 1000)
1963 1801964 361 -1965 6,344 2,4351966 5,997 1,3631967 1,323 1,5031968 778 794(First 6 months)
Peru is the major buyer of Colambian beef accounting for about 90% of recent]legal live cattle exports and more than 50% of meat exports. In addition tothese exports, there are contraband exports of live cattle out of Los LLanosto Venezuela which amount to between 120,000 and 200,000 head per year. Asraany as eight large slaughterhouses have been established in Venezuela tofacilitate this trade. They will flourish as long as the retail price of meatin Venezuela remains so high (three to four times the level in Colombia).
11. Government planners forecast a sharp upturn in legal exports of cattleand beef and have tentatively estimated these at US$ 17.5 million in 1969, in-creasing to US$ 36 million in 1972. These projections appear optimistic and thechances of achieving them are considered remote. The Government declaredpolicy of exchange rate flexibility, coupled with a 15% tax bonus, whichpermits exporters to receive Ps 19.55 for each dollar's worth of exports, ishelping producers compete on the international market. A contract for de-:Livery of 2,000 tons of refrigerated beef at US$ 550 per ton FOB has recentlybeen negotiated with Spain. But in the long ter-m a much greater effort tomodernize beef production methods by the application of improved technologyilrl be necessary to produce a sizeable surplus for export which can be market-ed in competition with countries such as Argentina.
:L2. For the dawestic market, FEDEGAN are now implementing a policy directedtowards breaking the existing marketing chain of middlemen. They have succeed-ed in doing so on a limited scale in the Bogota market where they have con-tracted the slaughter of their own cattle and retailed the meat directly at a:Lower price and, allegedly, a higher quality. The scale on which FEDEGAN willpursue this scheme is uncertain but ill1 depend upon the ultimate success of-this trial attempt.
13. In regard to slaughtering operations, this aspect is expected to improve

ANNEX 22Page 4
as a result of an AID grant to Colcmbia for the development of the livestockinLdustry. According to this grant, US$ 12 million is to be channeled throughthe livestock Bank for the purpose of creating large-scale slaughter opera-tions. The first installment of the loan for US$ 4 million has recently beenapproved and will be used for the development of nine slaughterhouses. Inaddition, three cattle markets are to be established in locations to be deter-mined by an on-going stucdy concerned with the production and consumption ofbeef. It is proposed to establish regional slaughterhouses of mixed owner-ship to replace the existing municipal operations in order to increase pro-ductivity and introduce some rationale to the processing of by-products.To win acceptability of this program, it is proposed to compensate the
municipalities for lost revenues.
B. Dairy Products
14. In 1967, slightly more than 90% of total milk consumption in Colombia wasmet by domestic production, the balance being accounted for by donations fromthe United States under the PL480 program. Per capita consumption in thatyear in all forms was about 68 liters, though this varied widely between themain population centers and the rural areas. Annual per capita consumptionin Bogota, MAedellin, Cali and Barranquilla was of the order of 95-100 literswhereas in rural areas it was as low as 46 liters. Cn a countrywide per capitabasis, consumption has increased by about 35% since 1954. The low level ofconsumption in Colombia is a reflection of demand factors more so than condi-tions of supply; the majority of the population cannot afford to buy milk atexisting income and price levels.
15. Consumption of raw milk, represents about 60% of the total, with pasteuri-zed and manufactured (condensed, powdered, skimmedi milk accounting forapproximately 26% and 5% respectively. The remaining 9% represents liquidmilk reconstituted from powdered milk supplied by the US. High populationgrowth in the major cities of between 6 and 8% per annum has created, and willcontinue to create, an unsatisfied demand and it is these centers which willprovide the market for any increase in milk production.
16. Considering the high percentage of total milk production that is marketedin the raw form, existing facilities for milk processing are regarded asadequate. There are no processing facilities in the Narino district outside alarge cottage industry producing cheese, and these are not warranted at thepresent stage of dairy development in this area.
17,. The most common channel of milk marketing in Colombia involves a numberof intermediaries: collectors, processors, wholesalers and retailers. Handlingmargins are controlled by Government regulation in cities larger than 70,000inhiabitants.
18. lith the increasing demand in the larger urban centers for milk inColombia, there are transportation problems in some regions associated with theincreasing extension of production areas. With respect to the Project Areasproposed, the system of roads and nearness of markets pose no problems to the

ANNEX 22Page 5
to the producers supplying Barranquilla, Bogota and iledellin. Similarly,production increases in the departments of Cauca and VaUle will be marketedwithout difficulty because of the close proximity of the Cali market. However,onily limited additional finance is proposed for the Narino district as it isremote from the nearest major consuming areas and existing producer pricesdo not favor large production increases. The feasibility of establishinga low-cost industry on a meaningful scale will have to be demonstrated beforeany expenditure on additional processing facilities could be justified.
k Sheep
1'9. The majority of sheep in Colombia are of the native or criollo variety.WIool produced is coarse and generally unsuitable for use by the textile indus-try which has, in the past, had to rely on wool imports. It is estimated thatabout 85% of Colombian wool production is consumed by the cottage industryengaged in spinning/weaving operations. This industry is located in the majorwool producing areas of Boyaca, Cundinamarca, Narino, Santander and Caldas,and produces shawls, rugs, and carpets. It is comprised of local cooperativesand small factories.
20. The primitive nature of domestic wool production in Colombia is wellmatched by its poor marketing system. Prices of wool vary widely wuithin andbetween regions and the resulting uncertainty has had a marked effect uponproducer incentives and the nature of sheep farming. With few exceptions, theindividual production unit is extremely small.
2:L. IJool is generally sold at the local markets of the various producingreagions. The result is that different prices may prevail within a singledistrict since they depend greatly on the negotiating capacity of each pro-ducer. For greasy wool sales to the cottage industry, producers receive aprice of around 20-23 pesos per kilo. Alternatively, they may be unable todispose of their wool in this way and have to accept a price of 14-16 pesosper kilo from the Sheep Breeders' Association. This group is located inDBgota and processes the wool to an extent for resale to the cooperativesat 22-23 pesos per kilo.
22. Marketing of fine grade wool, as it is now produced, poses no problems.Pure breed (imported) animals account for less than 1% of the total sheeppopulation in Colombia and most of these are owned by the textile mills.Virtually, all fine wool production has been from the sheep maintained by themills and, consequently, its disposal has placed little strain on the marketingnetwork. The factories, in effect, buy this wool from themselves at 30 pesosper kilo, a price which it is said is available to any other producer capableof supplying the same quality. This possibility will shortly be tested whenattempts are made to market the first wool clip of the sheep imported underloan 484C0.

ANNEX 22Page 6
Mutton and Lamb
23. Lamb and mutton account for no more than about 1% of the total meatconsumption in Colombia, the greater part of which is consumed directly.Animals are sold on-the-hoof to local butchers at a price of about 5 pesosper kilo.
COLOMBIA
SECOND LIVEST2OCK PROJECT
Sconomic Rate of Return (''(Pesos Millions;
Year 1 2 3 4 5 6 7 8 9 10 11 12-19 20
Aggregated Ranches Increment alCash Flows (216.8) (186.8) (97.0) 38.9 75.2 134.0 195.6 156.3 175.1 201.0 203.7 104.5 1,598.0(2)
bRzes 3.8 4.1 4.4 5.1 5.14 5.8 6.o 6.2 6.3 6.3 6.3 6.3 6.3
Cost of Technical Services ( 5-0) ( 5-0) ( 5-0) ( 4-5) ( 1-2) ( .6) - _ _ _ _ _
Balance (218.0) (187.7) (97.6) 39.4 79.4 139.2 201.6 162.5 181.4 207.3 210.0 210.8 1,604.3
Estimated Economic Rate of Return 22%
(1) Negative figures appear in parenthesis
(2) Includes residual value of livestock
COLOMBIA
SECOND LIVESTOCK DEVELOPMENT PROJECT
ORGANIZATION CHART
GENERAL MANAGERof 'he CAJA
I
Assistant General Manager
for Development
Livestock Development Department Project Loan Committee
2 Directors of the CajaTechnical Director Administrative Director Assistant General Manager
and and for Development
Assistant Staff Auditor Generalfor for Technical Director
Preparation and Supervision Loanof Farm Plans Administration Administrative Director
Divisional Secretary
Narino - Cauca ValleLos Llanos La Costa Sheep and Wool Unit
UJbate and Ceja ValleysTechnical Director Chie T echnician Technical Supervisor
. ~~~~~~~Chief Techn ic ian Assistant Assistants AssistantAssistant
Technicians |ecniiasecniiasesm
Tcncians Technicians TechnicasIITechnician 'FT ~ ~I__I_

Ai.EX 25
CO LOiBIA
SECOND LIVESTOCK PROJECT
THE AGRARIAN INDUSTRIAL AND i'UNfIG CREDIT BANK(CAJA DE CMEDITO AGRARIO IEDUSTRIAL Y aZNERO)
A. Introduction
1. The Agrarian Industrial and Mining Credit Bank (Caja de CreditoAgrario Industrial y TUnero - Caja) was formed in 1931 as a semi-officialjoint stock company. The Ps 511 million share capital is held by:
Ps '000 %
GovernmentL 421,468 82National Federation of Coffee
Growers 61,935 12Agricultural MIortgage Bank 21,003 4Stabilization hund 6,876 1Others 21 1
511,303 100
2. Caja has 638 offices or agencies throughout6 Colombia and employs8,400 people. It is the largest bank in Colombia, apart from the CentralBank itself, and probably the largest agricultural credit institution inDitin America. 1Ninety per cent of Caja's portfolio is in agriculture(including livestock) and the rest in small industry and mining. Morethan 501P of all Colombian agricultural lending was financed by Caja in 1967,thlough this proportion is declining somewThat as lending in the sectorby other institutions increases, e.g., Banco Ganadero (Livestock Bank),with AID and IDB assistance; and the commercial banks, through governmentdirected lending regulations (See Annex 2 on Banking and CreditX). Thegrowth of Caja lending is illustrated by the following totals:
Ps Illion
1965 1966 1967 1968
Total Loan Portfolio 2,038 2,339 2,806 3,584Index (1965 = 100) 100 115 138 176
3. Caja lending is extensive. In 1967, 306,334 loans were made fora total of Ps 2,063 million, an average of Ps 6,734.
ANNEX 25Page 2
4. In the same year, 24% of Caja loans were between Ps 1,000 -5,O00 (US6Q6,300), the largest group, while about 14% were in excess ofPs 150,ooo (uS$ 9,000). There is no official maximum, though loans arerarely made for more than Ps 1.0 million or to borrowers with net worthexceeding Ps 15 million (Us$ 90,000).
5. Rates of interest vary between 8% short-term (for small amounts)anid 12% long-term. For loans longer than five years, a higher rate of 14%will probably be introduced.
6. Security for medium and long-term loans is usually a first mortgageon land and improvements; on short-term loans, a chattel mortgage on cattle,machinery or crops, though personal guarantees are accepted. All loans arejudged by expected repayment capacity generated by the loan, regardless ofsecurity offered.
B. Purpose
7. Cajats objective is to improve agricultural production, mainlyby the smaller farmer, through provision of credit and inputs at reasonablecosts. In addition to lending, mostly on short and medium-term - shorz 66%of portfolio; medium 27'%; long 7% in 1968 - Caja provides technical assistanceto its borrowers and, through i-as numerous branches, sells agriculturalmachinery (much of it imported) and a wide range of agricultural requisites,all at competitive prices. Caja also produces and.distributes improvedseeds and carries out trial plantings to demonstrate their effectiveness.
C. Organization and Management
El. As a semi-autonomous body, Caja makes its own lending decisionswithin the framework of Gkvernment's general agricultural policy. Cajai.s controlled by a 10-man Board of Directors comprising:
The Minister of Agriculture (Chairman)One representative each of:
The President of the RepublicNational Federation of Coffee GrowersColombian Farmers' AssociationThe Central BankThe Small Farmers' Association l/
Manager of the Colombian Agricultural- and. Livestock Institute(ICA) 1/
Manager of the Parm Products Marketing. Institute (IEMIA) l/I4nager of the Institute for Development of Natural Resources I/
The Ydnister of Finance, though not a member, may also speak and vote atBoard meetings.
l/ Added in October 196&.
ANNEX 25Page 3
9. Caja is administered by a General Hlanager (Sr. Jose Elias delHierro) with five General Sub-ilanagers and a Secretary General. A GeneralSub-i-lanager is in charge of each of the following departments: Administration;Banking; Finance and Commerce; and Development.
10. Branches have a large measure of independence and may approveloans up to certain limits (maximum Ps 120,000) according to which one offour categories they are in. Larger branches have local boards thatmay approve loans to larger limits (maximum Ps 250,000 for the highestcategory). Bank livestock Project lending, however, is centralized for thetime being and all project loan decisions are made by a Loan Committee,specially set up for the purpose.
D, Resources
10. Caja's principal sources of funds are deposits (of which two-thirds are on savings account) and discounts with the Central Bank, asshown by the following figures at June 30, 1968:
Deposits 1,710 31Sundry Liabilities 426 7Discounts with Central Bank 1,669 30Bonds 668 12Foreign loans 199 4Capital Account:
Paid Capital 511ireserves and Provisions 351 862 16
5,534 100
Caja is negotiating with Government for an increase in paid-up capital,which has remained virtually unchanged since early 1966. The permittedlimit for discounts with the Central Bank is decided from year to year andit is uncertain whether Caja will be permitted to increase i'ts quota, alreadyconsiderably higher than for other banking institutions. Caja is alsoconsidering other sources of funds, e.g. compulsory share capital sub-scription by borrowers.
lI. Caja has received several foreign loans; in 1949 US$ 5 millionfrom the Bank for imported agricultural machinery; another US$ 5 million forthe same purpose in 1956 (both repaid within seven years); in 1967 US$ 12.2million from the International Development Bank for agricultural machinery;US$ 2.5 million and US$ 3.4 million from the Ixport-Import Bank; and US$ 8million from the Development Loan Fund.
ANiTEa 25Page 4
12. In 1966, the Bank lent US$ 16.7 million to Cajas repayable in18 years, for supervised livestock crediL, and at December 31, 1968 nearly75% had been committed. Tables 1 and 2 gives summarized actual and estimatedprofit and loss accounts and balance sheets for this project. Early short-fall of income over expenditure was due to a slow start as the separateLivestock Development Department was set up and the project explained toLivestock producers. The Bank project is only part of Caja's livestockloan portfolio totalling Ps 954 million (3$ 56 million) or 34% of alllending at December 31, 1967. Other loans totalled Ps 1,853 million(US$ 109 million) or 66d. At June 30, 1968, Bank project loans totalledPs 171 million or about 5% of total lending. If the proposed SecondLivestock Project loan is approved, Bank project loans will rise to about12% of Caja's total lending by 1971. (See Tables 3 and 4; Caja actual andestimated profit and loss accounts for the years ending June 30, 1965to 1971; and actual and estimated balance sheets at June 30, 1965 - 1971.)
E. rinancial Situation
13. Caja aims to make its income exceed expenditure by a small margin,taking one year with another, and reinvests all profits. The percentage ofnet income, before reserves and provisions, over the past four years was:
1965 1966 1967 1968I. * * ( .** * *.. ... X * ... e .... e
7.3 7.7 9.0 13.0
14. Although the ratio between total indebtedness and capital reservesand provisions has been declining during the past three years, due to theavailability of rediscouni facilities wzith the Central Bank, the percentageof capital and reserves to total indebtedness is not expected to fall below15%, which is accepuable. The following are actual and forecast percentages:
Pecentages
1965 1966 1967 1968 1969 1970
Capital and reserves 19.7 19.3 17.0 15.0 15.2 15.6
Total Indebtedness 80.3 80.7 83.0 84.0 84.8 84.4
15. Caja's collection record is good, the average loss over many yearsbeing Ps 1 in 10,000. Delinquent loans over the past four years have averagedabout 12',' of total loans; most are repaid within two months (and are overduebecause of harvesting delays). The figures are:

Page 5
(Ps a000)Year Total Loans Over due 5'x,
1965 2,038 281 13.81966 2,339 285 12.21967 2,806 341 12.21968 3,584 394 lJ.0
The good record is partly because Caja credit is very important to the smallfarmer. If he destroys his credit with Caja, he has no other certain sourceand none at reasonable cost.
G. Audit
16. Caja accounts are subject to the surveillance of the Superintendenceof Banks, a Government department responsible for the control of all bankinginsti utions. The Superintendent of Banks appoints the Caja general auditorand he has two assistant auditors working continually in the Caja office.
Table 1
COLOMBIA
SECOND LIVESTDCK PROJECT
Profit and Loss Account of Stae I of Bank Project(Pesos .
1966 1967 1968 1969 1970 1971
---------Actual ------- ----Estimated----
INCOME
Interest received - 2,606 15,351 28,980 43,410 42,010- due - 6 539 1,010 1,440 1,520
Fees received and due - 81 70 - - -
Total Income - 2,693 15,960 29,990 44,850 43,530
EXPENDITURE
Salaries and travel:Expatriate 437 754 1,339 1,470Local 407 1,388 2,711 3,510 2,540 1,770
Interest to Bank - 1,667 4,509 10,440 15,130 16,660Interest to Government 2% 71 67 1,302 3,480 5,040 5,550
Total Intexe st 71 1,734 5,811 13,920 20,170 22,210
Social charges 1 1,066 1,120 1,400 1,140 770Branch commission - 326 523 900 260 160Other expenses 2 224 252 310 350 350
Total Expenditure 918 5,492 11,756 21,510 24,460 25,260
Profit (Loss) (918) (2,799) 4,204 8,480 20,390 18,270Cumulative (918) (3,717) 487 8,967 29,357 47,627

Table 2
COLOMBIA
SFCOND .IVESMQCK PROJECT
Balance Sheet of Stage I of Bank Project(Pesoa '000)
For Year Ending June 30 1966 1967 1968 1969 1970 1971
-------- Actual --------- ------- Estimated --------
ASSETS
Loans made:Short-term - 424 10,000 20,000 -
Medium-term - _ 13,911 25,000 20,360 12,030Long-term _ 156.648 314.400 I342,400 350,730
Sub-total - 69,094 17O,903 349,400 362,7b0 302,10Interest due - 6 539 1,010 1,440 1,520'Tehicles and stores - 178 2,289 2,500 2,500 2,500
Total Assets - 69,278 173,811 352,910 386,700 366,780
LIABILITIES
Bank Loan portfolio 75% - 51,820 127,919 254,550 272,070 272,070Technicali assistance _ 1,191 2,530 4,000 5,620 -
Less: Amount carried forward (1) - 18,834 9,122 31,970 -Net loan - 34,177 121,327 226,580 277,690 272,070Caja Account:Loan portfolio 25% - 17,274 42,640 84,850 90,690 90,690Short-term - - 424 10,000 20,000 -
Balance - 21,544 8,933 22,513 (31,037) (43,607)Net Account (2) Ylo 30,olo 51,99T 117,363 79,653 47,0t3Profit and Loss Account (918) ( 3.717) 487 8,967 29,357 47,627
- 69,278 173,811 352,910 386,700 366,780
(1) Amount eligible for Bank financing, not yet oentributed by Bank
(2) Caja contribution to project, after taking Profit and Loss balance into account
ANNEX 25Table3
COLOMBIA
SECOND LIVESTOCK PROJECT
Caja Profit and Loss Accounts Years ending June 30, 1965 - 1971(Pesos '000)
1965 1966 1967 1968 1969 1970 1971
--------------- ActuaL ---------------- --------- Estimated --- -
INCOME
Interest;on loans 180,823 210,711 258,026 334,790 418,000 502,000 650,000Commissions and fees 17,798 21,073 26,502 34,239 43,000 53,000 64,300Other interest 34,276 40,292 43,186 45,002 47,000 50,000 53,000Other income:Merchandising 12,313 23,762 26,882 31,035 36,000 41,000 47,000Other 17,623 22,614 23.319 30,058 37.000 40,000 42,000
29,936 46 376 50,201 61i093 73 000 81 000 d90ooo
Total Income 262,833 318,452 377.915 475.124 581,000 686o000 856,000
EXPENDITUR3-
Salaries and travel 79,904 93,304 102,121 124,142 137,000 170,000 200,000Social charges (net) 48,088 65,343 58,840 57,717 80,000 90,000 100,000Other expenses 33.064 38.850 62.701 70,282 84,000 95,000 110,000
Sub-total 161,056 197,497 223,662 252,141 301,000 355,000 410,000Gross Profit before interest
and provisions 101,777 120,955 154,253 222,983 280,000 331,000 446,oooInterest paid:Central Bank 8,005 16,858 25,190 34,123 - - -
Commercial Banks 7,204 16,533 19,750 24,245 - - -World Bank - - 1,667 4,509 - - -Savings Accounts (including
expenses) 24,936 29,722 33,667 4,o008 - - -Other 15,309 2,870 4,993 3,255 - - -
Sub-total 255454 65 98t3 5,267 10710 145,000 168.000 200000
Net Income after interest 46,323 54,972 68,986 115,843 135,000 163,000 246,000Reserves and provisions (net) 41,075 36,596 46,510 88,215 90,000 110,000 180,000Net ProfLt 5,248 18,376 22,476 27,628 45,000 53,000 66,000

ANNEX 25Table
COLGIEBIA
SECOND LIVTOCK PROJECT
Caja Balance Sheets at June 30, 1965 - 1971(Pesos '000)
1965 1966 1967 1968 1969 1970 1971
-------------------- Actual -------------------- ------------ Estimated ------------
ASSETS
Cash or equivalent 152,672 105,577 226,337 193,311 257,000 284,000 300,000Sundry debtors 81,726 101,687 264,407 212,334 220,000 230,000 240,000Loan Portfolio:
World Bank project - - 69,094 170,983 349,400 456,000 589,000IDB project - - - 12,469Others 2,038,109 2.338,745 2.736.749 3.400o488 )3,862.600 4.118.000 4.528,000
Total Loan Portfolio 2,038,109 2,338,745 2,805,843 3,583,940 4,212,000 4,574,000 5,117,000
Investmenats 448,882 482,647 468,107 666,317 667,000 750,000 820,000Merchandising Department 184,624 258,999 302,187 369,315 406,000 447,000 491,000Building.s and land 117,491 148,051 169,214 201,157 231,000 266,000 306,000Other assets 204.220 275,546 270,287 307,786 402.000 449,000 501,000
Total Assets 3,227.724 3,711,252 4.506,382 5,534,160 6,395,000 7,000,000 7.775,000
LIABILITIES
Demand deposits 390,675 401,601 472,474 560,561 674,000 774,000 913,000Savings deposits 737,767 890,316 943,969 1,149,687 1,242,000 1,404,000 1,526,000S-ndry l-abilities 248,545 316,418 391,449 425,743 678,000 736,000 942,000Discounts with Central hanik 860,000 967,755 1,383,605 1,668,818 1,700,000 1,700,000 1,700,0009onds issued 353,652 416,265 510,113 668,124 800,000 850,000 910,000Foreign loans:
World l3ank - 437 34,178 121,137 227,000 339,000 389,000IDB - - - 78,115Other - 1,383 2,247 261 ) 100,000 100,000 100,000
Total Foreigni Loans - 1,820 36,425 199,513 327000 o439,000 489,000
Capital AccountPaid-in capital 480,375 510,643 511,303 511,303 516,000 521,000 526,000Legal reserve 39,454 41,643 45,952 50,595 51,000 52,000 53,o00Other reserves and pro-visions 112,008 146,415 188,616 272,188 362,000 471,000 650,000AnrLual profit 5,248 18.376 22.476 27,628 45,000 53,000 66,ooo
Total Capital Accoumt 637,085 717,077 768.347 861,714 974.ooo 1,095,000 1, 295. 000
Total Liabilities 3,227,724 3,711,252 4,506,382 5,534,160 6,395,ooc 7,000,000 7,775,000
'IO - ; L a I GENERAL LOCATION
OF BEEF, DAIRY CATTLE AND
N -- E > '<v t -F-- X } SHEEP PROJECTS
,NORTE..- ;-..* .SUCRE DE.- --
*t wA U A>- 3 [ PIo,e,o RB, c&_-~-~ 5- ~ -/-~~~ SAN TANDE-
.. 9 C O R D O B A _2t. - E 7Z-TL
. A N T 0 0 'J I A.'
-z_ -; - , / . 1r>. ,E >A R A U C A
< :m.ddle mn5d,- ....*M..de . Mo dolo. . - -** - *.------ Prot.
Q,aibd62 . iC H C 0_'
- -tt FZ Monaiz,zes _." , I Ubote o0.
B\ *llA P ,*'< .CUNDINAMAF - ' H
I -, -~ ~ ~~~~ ICH
60 0 M
V;TAIr$ A A aL' u~ E ~- ;U/
00,1
V' 'i IA J C A L, O
'-..- G u A i I A
.. .. .. ~~~~~~~~~~~~.. . . . . . . . F
N AR N ~~~~ .. *Io,coVA U P ES
ICA Q U E'T -A I
P UT U M A YO
*0,,~~~~~~~~~ .* ~~~~~~~~B R A Z I L
U ~~~~~~ D ~ ~ ~ 1"Coucopo
A M A Z O N A S
BEEF CATTLE
L. Costa.
Los LLanos *
DAIRY CATTLE
CoBrrcanquilela
A SH-EF DEVEL-DF-I:T CE!rPER L
(OCTOBER 1969