Synapsins: From synapse to network hyperexcitability and epilepsy
Upload
independentCategory
view
4download
0
Regulation of Synapse Structure and Function by DistinctMyosin II Motors
Maria D. Rubio1, Richard Johnson2, Courtney A. Miller3,4, Richard L. Huganir2, and GavinRumbaugh1,3,†1Dept of Neurobiology and the Evelyn F. McKnight Brain Institute, University of Alabama atBirmingham, Birmingham, AL 352942Department of Neuroscience and Howard Hughes Medical Institute, The Johns HopkinsUniversity School of Medicine, Baltimore, MD 212053Department of Neuroscience, The Scripps Research Institute, Jupiter, FL 334584Department of Metabolism and Ageing, The Scripps Research Institute, Jupiter, FL 33458
AbstractOngoing synaptic function and rapid, bidirectional plasticity are both controlled by regulatorymechanisms within dendritic spines. Spine actin dynamics maintain synapse structure andfunction, and cytoskeletal rearrangements in these structures trigger structural and functionalplasticity. Therefore, proteins that interact with actin filaments are attractive candidates to regulatesynaptic actin dynamics, and thus, synapse structure and function. Here, we have cloned the ratisoform of class II myosin heavy chain MyH7B in brain. Unexpectedly, this isoform resemblesmuscle-type myosin II, rather than the ubiquitously expressed non-muscle myosin II isoforms,suggesting that a rich functional diversity of myosin II motors may exist in neurons. Indeed,reducing the expression of MyH7B in mature neurons caused profound alterations to dendriticspine structure and excitatory synaptic strength. Structurally, dendritic spines had large, irregularshaped heads that contained many filopodia-like protrusions. Neurons with reduced MyH7Bexpression also had impaired mEPSC amplitudes, accompanied by a decrease in synaptic AMPAreceptors, which was linked to alterations of the actin cytoskeleton. MyH7B-mediated control overspine morphology and synaptic strength was distinct from that of a non-muscle myosin, myosinIIb. Interestingly, when myosin IIb and MyH7B expression were simultaneously knocked-down inneurons, a third, more pronounced phenotype emerged. Taken together, our data provide evidencethat distinct myosin II isoforms work together to regulate synapse structure and function incultured hippocampal neurons. Thus, myosin II motor activity is emerging as a broad regulatorymechanism for control over complex actin networks within dendritic spines.
Keywordsactin; myosin; dendritic spine; synaptic transmission; AMPA receptors; plasticity
IntroductionThe majority of forebrain excitatory synapses are located on dendritic spines and thesestructures house essential molecular processes that trigger circuit plasticity and memoryformation (Segal, 2005; Kasai et al., 2010). Dynamic F-Actin is densely concentrated within
†Correspondence: Gavin Rumbaugh, PhD: [email protected].
NIH Public AccessAuthor ManuscriptJ Neurosci. Author manuscript; available in PMC 2011 July 26.
Published in final edited form as:J Neurosci. 2011 January 26; 31(4): 1448–1460. doi:10.1523/JNEUROSCI.3294-10.2011.
NIH
-PA Author Manuscript
NIH
-PA Author Manuscript
NIH
-PA Author Manuscript

dendritic spines of cultured neuronal preparations (Star et al., 2002; Zito et al., 2004) and inyoung rodents in vivo (Gray et al., 2006), and this process mediates rapid changes to spinesize and shape (Fischer et al., 1998). Depolymerization of actin filaments induces spineshrinkage and a contaminant decrease in AMPA receptor mediated synaptic currents(Allison et al., 1998; Kim and Lisman, 1999), while high-frequency stimulations that elicitsynaptic plasticity induce polymerization of new actin filaments and an enlargement ofspines (Okamoto et al., 2004; Lin et al., 2005; Honkura et al., 2008). Furthermore, actinfilament assembly is necessary for long-term potentiation (LTP), memory formation andextinction of fear (Krucker et al., 2000; Fukazawa et al., 2003; Fischer et al., 2004). Thus,identifying proteins that regulate actin dynamics will facilitate the discovery of novelmechanisms controlling synaptic plasticity and memory formation.
Studies on the regulation of actin dynamics in dendritic spines have focused on actin-binding proteins that regulate treadmilling, branching, and stabilization of individualfilaments (Star et al., 2002; Lynch et al., 2006). However, in nearly all cell types and organsystems, actin dynamics are fundamentally regulated by myosin II motors (Vallee et al.,2009; Vicente-Manzanares et al., 2009). These motors are hexameric protein complexescontaining two heavy chains and four light chains. myosin II isoforms are classified basedon the primary sequence of the motor domain and genes encoding heavy chains aresubdivided into sarcomeric (muscle) (MyH1, 2, 3, 4, 6, 7, 7B, 8, 11, 13, 15, 16) and non-muscle (MyH9, 10, 14) isoforms. In the neuronal growth cone, for example, non-musclemyosin IIb (MyH10 heavy chain) stimulates both depolymerization and polymerization of F-actin promoting the phenomenon of retrograde actin flow (Medeiros et al., 2006), anessential process that mediates growth cone propulsion (Lin and Forscher, 1995).Interestingly, at least three non-muscle myosin II motors, IIa (MyH9), IIb (MyH10) and IIc(MyH14), are present in dendritic spines (Cheng et al., 2000; Miyazaki et al., 2000; Ryu etal., 2006; Ishmael et al., 2007). MyH10 is enriched at synapses and regulates dendritic spinemorphology and synaptic strength (Zhang et al., 2005; Ryu et al., 2006). Recently, wereported that myosin II motors stimulate de novo synthesis of actin filaments in response toLTP induction and that these filaments stabilize synaptic plasticity and memory formation(Rex et al., 2010). Therefore, understanding the role of individual myosin II motors indendritic spines will advance our understanding of how mechanical forces at synapses shapesynaptic plasticity, ensemble circuit function, and memory encoding.
In this study, we report the cloning, expression and characterization of a sarcomeric class IImyosin heavy chain, MyH7B, in neuronal tissue. MyH7B conforms to a sarcomeric motorconsensus, which suggests it has a unique function relative to the non-muscle isoformsexpressed in neurons. Knock-down of MyH7B dramatically disrupted synapse structure,function and surface AMPAR content. Many of the observed effects on synapse structureand function were distinct from that of MyH10, a canonical non-muscle myosin II heavychain. In addition, we show that MyH7B maintains excitatory synaptic function byregulating F-actin filaments associated with AMPA receptors. Our current work indicatesthat multiple myosin II isoforms contribute to the structural integrity of dendritic spines, andeach may functionally mediate distinct pools of F-actin at excitatory synapses.
Materials and MethodsCloning/Analysis of Rat MyH7B
Oligo(dT)-primed and random primed cDNAs were made from a mixed population of maleand female rat brain poly(A)+ RNA using Superscript III Reverse Transcriptase (Invitrogen,Carlsbad, CA). The full-length rat MyH7B coding sequence was constructed by RT-PCRsgenerating a set of 7 overlapping fragments (F1–F7), including a putative start methionine inF1 and stop codon in F7 (Fig.1A). Primers were designed based on either Genbank
Rubio et al. Page 2
J Neurosci. Author manuscript; available in PMC 2011 July 26.
NIH
-PA Author Manuscript
NIH
-PA Author Manuscript
NIH
-PA Author Manuscript
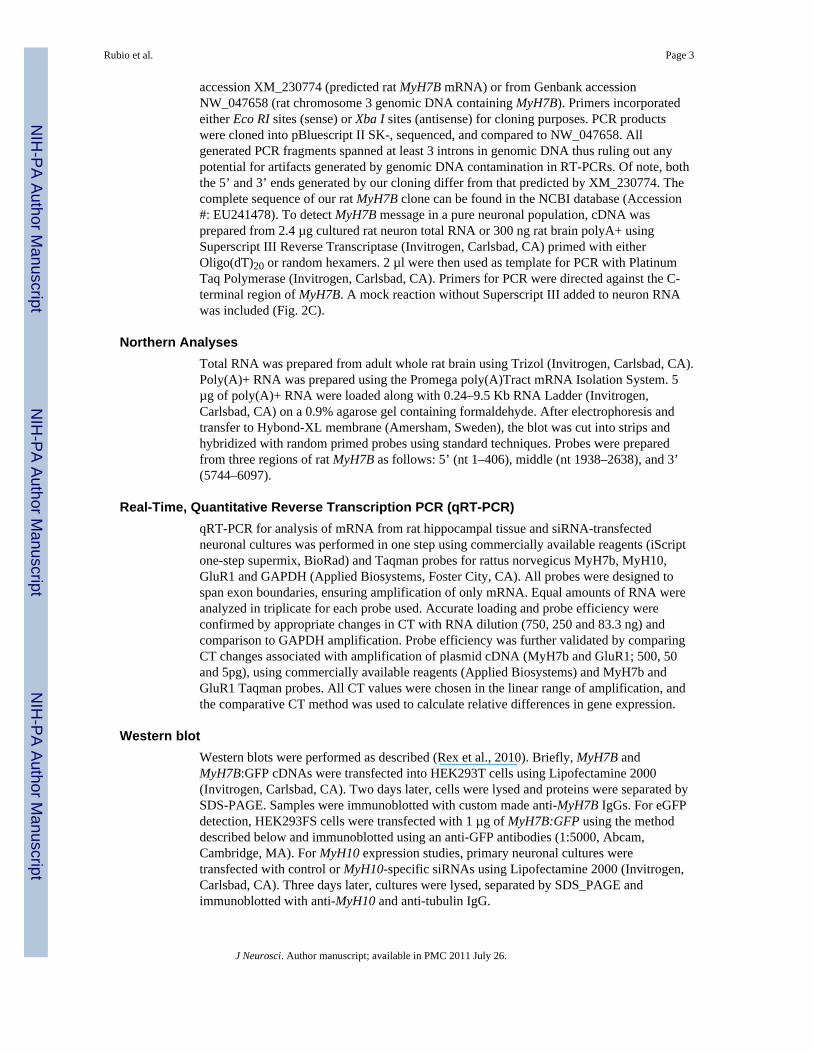
accession XM_230774 (predicted rat MyH7B mRNA) or from Genbank accessionNW_047658 (rat chromosome 3 genomic DNA containing MyH7B). Primers incorporatedeither Eco RI sites (sense) or Xba I sites (antisense) for cloning purposes. PCR productswere cloned into pBluescript II SK-, sequenced, and compared to NW_047658. Allgenerated PCR fragments spanned at least 3 introns in genomic DNA thus ruling out anypotential for artifacts generated by genomic DNA contamination in RT-PCRs. Of note, boththe 5’ and 3’ ends generated by our cloning differ from that predicted by XM_230774. Thecomplete sequence of our rat MyH7B clone can be found in the NCBI database (Accession#: EU241478). To detect MyH7B message in a pure neuronal population, cDNA wasprepared from 2.4 µg cultured rat neuron total RNA or 300 ng rat brain polyA+ usingSuperscript III Reverse Transcriptase (Invitrogen, Carlsbad, CA) primed with eitherOligo(dT)20 or random hexamers. 2 µl were then used as template for PCR with PlatinumTaq Polymerase (Invitrogen, Carlsbad, CA). Primers for PCR were directed against the C-terminal region of MyH7B. A mock reaction without Superscript III added to neuron RNAwas included (Fig. 2C).
Northern AnalysesTotal RNA was prepared from adult whole rat brain using Trizol (Invitrogen, Carlsbad, CA).Poly(A)+ RNA was prepared using the Promega poly(A)Tract mRNA Isolation System. 5µg of poly(A)+ RNA were loaded along with 0.24–9.5 Kb RNA Ladder (Invitrogen,Carlsbad, CA) on a 0.9% agarose gel containing formaldehyde. After electrophoresis andtransfer to Hybond-XL membrane (Amersham, Sweden), the blot was cut into strips andhybridized with random primed probes using standard techniques. Probes were preparedfrom three regions of rat MyH7B as follows: 5’ (nt 1–406), middle (nt 1938–2638), and 3’(5744–6097).
Real-Time, Quantitative Reverse Transcription PCR (qRT-PCR)qRT-PCR for analysis of mRNA from rat hippocampal tissue and siRNA-transfectedneuronal cultures was performed in one step using commercially available reagents (iScriptone-step supermix, BioRad) and Taqman probes for rattus norvegicus MyH7b, MyH10,GluR1 and GAPDH (Applied Biosystems, Foster City, CA). All probes were designed tospan exon boundaries, ensuring amplification of only mRNA. Equal amounts of RNA wereanalyzed in triplicate for each probe used. Accurate loading and probe efficiency wereconfirmed by appropriate changes in CT with RNA dilution (750, 250 and 83.3 ng) andcomparison to GAPDH amplification. Probe efficiency was further validated by comparingCT changes associated with amplification of plasmid cDNA (MyH7b and GluR1; 500, 50and 5pg), using commercially available reagents (Applied Biosystems) and MyH7b andGluR1 Taqman probes. All CT values were chosen in the linear range of amplification, andthe comparative CT method was used to calculate relative differences in gene expression.
Western blotWestern blots were performed as described (Rex et al., 2010). Briefly, MyH7B andMyH7B:GFP cDNAs were transfected into HEK293T cells using Lipofectamine 2000(Invitrogen, Carlsbad, CA). Two days later, cells were lysed and proteins were separated bySDS-PAGE. Samples were immunoblotted with custom made anti-MyH7B IgGs. For eGFPdetection, HEK293FS cells were transfected with 1 µg of MyH7B:GFP using the methoddescribed below and immunoblotted using an anti-GFP antibodies (1:5000, Abcam,Cambridge, MA). For MyH10 expression studies, primary neuronal cultures weretransfected with control or MyH10-specific siRNAs using Lipofectamine 2000 (Invitrogen,Carlsbad, CA). Three days later, cultures were lysed, separated by SDS_PAGE andimmunoblotted with anti-MyH10 and anti-tubulin IgG.
Rubio et al. Page 3
J Neurosci. Author manuscript; available in PMC 2011 July 26.
NIH
-PA Author Manuscript
NIH
-PA Author Manuscript
NIH
-PA Author Manuscript

Cell culture and plasmid transfectionMedium-density hippocampal cultures (1×10⁶ cells/coverslip) from embryonic day 18 (E18)Sprague-Dawley rats were prepared as described (Rumbaugh et al., 2006). At 15 days invitro (DIV), 1 µg of MyH7B:GFP, GFP:β-Actin or GFP:MyH10 were co-transfected with0.5 µg of mCherry as a transfection indicator using CaPO4 (Stratagene, Santa Clara, CA).Imaging was done 3 days later to ensure maximum expression of the plasmids. For siRNA-mediated knockdown experiments, we obtained a pool of four double strandedoligonucleotides (ON-TARGET-PlusTM siRNA, Dharmacon Inc., Lafayette, CO) specificfor either MyH7B (accession number: XM_230774; cat #: L-093061-00) or MyH10(accession number: NM_031520; cat #: L-098035-01-0010). Each pool potently reducedexpression of transfected constructs containing the cDNA for each respective gene inheterologous cells. A pool of control siRNAs were also purchased from this company. Totransfect oligonucleotides into neurons, we co-transfected 1 µg/ml siRNA (75–80 nM) and0.5 µg eGFP or mCherry with Lipofectamine 2000 (Invitrogen, Carlsbad, CA) or CaPO4.For all siRNA experiments, we waited at least 3 days to ensure maximal protein knockdown.Pooled siRNA sequences targeted against MyH7B (Accession #: EU241478) were: #5(4589–4607): 5’-GCACCGAGCUCUUUCGAUU-3’; #6 (5825–5843): 5’-GUACCAACCUGGCUAAGUA-3’; #7 (1899–1917): 5’-CGUGGUACCUUAUAGCAUU-3’; #8 (1458–1476): 5’-GCUGGUAUCUCGAAUCAAU-3’. To construct a siRNA-insensitive form of MyH7B, weengineered five silent mutations within the siRNA #5 complimentary region (C4590T;G4596A; C4597T; C4599A; C4603A).
HEK293FS cell transfectionHEK293FS cells were transfected with 1 µg/ml siRNA (75–80 nM) and 0.5 µg eGFP usinga modified CaPO4 method. Briefly, HEK293FS cells were incubated with serum freeDMEM 30 minutes prior to transfection and then incubated with a solution of CaCl2, HBSand DNA in a 37C and 5% CO2 incubator. 3 hours later media containing the DNA solutionwas removed and replaced with acidified DMEM to dissolve CaPO4 crystals. Cell were thenincubated in a 37C, 5% CO2 incubator for 20 minutes after which the acidified media wasreplaced with warm serum containing DMEM medium. 24 hours later cells were collectedand mRNA was extracted using Trizol.
Electrophysiology and mEPSC analysisWhole-cell patch-clamp recordings were performed essentially as described (Rumbaugh etal., 2006). In all electrophysiological experiments, a similar amount of data was acquiredfrom both control siRNA transfected and gene-specific siRNA expressing neurons on thesame day. Data from each group were then averaged, and statistical significance wasdetermined by Student's t-test, unless noted otherwise.
ImmunocytochemistryIn general, primary neurons were processed for immunocytochemistry as described(Rumbaugh et al., 2006). For GluR1 surface staining, transfected cells were incubated for 20minutes with rabbit anti-GluR1 primary antibody (1:10, EMD Chemicals, Gibbstown, NJ) incomplete media at 24°C in an incubator with an O2/CO2 ratio of 95/5%. After brief washesin artificial cerebrospinal fluid (ACSF) at room temperature cells were fixed in 4%paraformaldehyde in ACSF, washed in phosphate buffer saline (PBS), permeabilized with0.2% triton-X in PBS for 10 minutes, washed in PBS again and blocked for 1 hour inblocking solution (1% bovine serum albumin (BSA) and 5% normal goat serum (NGS) inPBS). Neurons were then washed with PBS and incubated for 1 hour in goat anti-rabbitAlexa 555 (1:1000, Invitrogen, Carlsbad, CA) secondary antibodies diluted in probing
Rubio et al. Page 4
J Neurosci. Author manuscript; available in PMC 2011 July 26.
NIH
-PA Author Manuscript
NIH
-PA Author Manuscript
NIH
-PA Author Manuscript

solution (1% BSA and 1% NGS in PBS) to label GluR1. After washing in PBS, cells wereincubated in normal rabbit IgG (1:500) in probing solution for 1 hour at RT, washed in PBSand labeled with rabbit anti-GFP Alexa 488 (1:1000, Invitrogen, Carlsbad, CA) in probingsolution. Neurons were then washed in PBS and mounted using DAPI mounting solution(Invitrogen, Carlsbad, CA). For total GluR1 experiments, we blotted permeabilized culturedhippocampal cells with primary antibodies against the cytoplasmic domain of GluR1 (1:500,Millipore, Billerica, MA) and GFP (1:300, Abcam, Cambridge, MA) followed by secondaryantibodies anti-rabbit Alexa Fluor 555 and anti-mouse Alexa Fluor 488 (1:1000, Invitrogen,Carlsbad, CA). For GluR1 cluster analysis, all confocal microscope settings were kept thesame to measure fluorescence intensity. To measure cluster intensity each image wasthresholded to 3 standard deviations above average background intensity and the area andintensity values from the thresholded images were obtained. For each neuron, the area andintensity of individual clusters were averaged into a single value, and this value was used toobtain the mean and standard error of the mean (SEM).
MicroscopyAll images were acquired with a LSM 510 META confocal scanning laser microscope (CarlZeiss, Thornwood, NY) except for fixed cells (for sGluR1 experiments), which were imagedon an LSM 710 confocal scanning microscope (Carl Zeiss, Thornwood, NY). Spine analysisand localization studies were performed in live neurons using a 63× Plan-Apochromatwater-dipping objective (N.A 1.0). Images were acquired as multi-channel 8-bit TIFF fileswith a 1024 × 1024 resolution. A stack of images was obtained with an interval of 0.35 µm,except for surface and total GluR1 immunostained neurons where images were taken as asingle plane. ImageJ (Invitrogen, Carlsbad, CA) or MetaMorph® 7.0 (Molecular Devices,Downingtown, PA) was used to convert image stacks to single image Z- projections(maximum intensity) for subsequent analysis.
Spine analysisAll measurements were performed using MetaMorph® 7.0 software except for thecircularity index which was analyzed using ImageJ software. For each neuron we traced 200µm of dendritic segments and analyzed their protrusions. Morphometric measurements wereobtained following the guidelines described in previous studies (Fig. S1A) (Ryu et al.,2006), and spines were classified into thin, stubby or mushroom as previously described(Harris et al., 1992). To analyze dendritic spine head circularity index and area, eachindividual head, including any protrusion arising from it, was manually outlined in ImageJsoftware to obtain the area and perimeter from where the circularity index (4*pi*(area/perimeter2)) was calculated (Fig. S1B). It is important to note that the spine head circularityindex was measured only in dendritic spines bearing heads, namely mushroom and thin. Anyspine head with a circularity index greater than 1 was excluded from the analysis becausethese correspond to small dendritic spine heads which give an erroneous measurement. Thedata collected was then logged into a spreadsheet and plotted as a cumulative frequencycurve and a frequency distribution histogram, the latter normalized to the total number ofspines. For each spine or filopodia, the total length was measured by drawing a line from theproximal insertion in the dendritic shaft to the opposite distal end, excluding any abnormalprotrusion emitted from the spine head (Fig. S1A, red line). Width refers to the maximumdistance perpendicular to the length (Fig. S1A, blue line), also excluding abnormalprotrusions. The enrichment of GFP-actin in spines was performed by first acquiring asingle channel image of the GFP signal. The resulting image was thresholded to 2×background and a circular region of five pixels was outlined on a dendritic spine.Subsequently, a region totaling five pixels was also drawn in the dendritic shaft directlyadjacent from the spine. The integrated intensity of the spine was then normalized to theintegrated intensity of the shaft to give a relative measure that yields a spine targeting value.
Rubio et al. Page 5
J Neurosci. Author manuscript; available in PMC 2011 July 26.
NIH
-PA Author Manuscript
NIH
-PA Author Manuscript
NIH
-PA Author Manuscript

Statistical analysisAll data were analyzed using Microsoft Excel software. Data are presented as mean ± SEM.Student’s t-test or one-way ANOVA followed by Fisher’s LSD (least significant difference)were used as stated. Data parametric distribution was analyzed using GB-STAT 6.5(Dynamic Microsystems). Hartigan’s dip test was performed to test for modality of thecircularity index distribution using the R 2.11.0 software with dip-test package installed(The R Foundation for Statistical Computing).
ResultsIdentification of a novel myosin II isoform expressed in rat brain
We performed a yeast-two-hybrid (YTH) screen, using the C-terminus of SynGAP1 as bait,to discover novel proteins that regulate synaptic function. Once the screen was completed,we focused on clone 11a, which had high homology to a recently discovered humansarcomeric myosin II heavy chain (NM_020884) (Desjardins et al., 2002). Clone 11a alignedperfectly with a region on chromosome 3 of Rattus norvegicus and was predicted to encodethe rat isoform of MyH7B. Using the rat genome as a guide, we performed a series of RT-PCRs on rat brain mRNA to deduce the coding sequence of a putative gene product (Fig.1A). The resulting full-length cDNA was highly homologous to human MyH7B, stronglysuggesting that this was the rat homologue of this myosin II heavy chain. Analysis of the1941-residue open reading frame uncovered a classical myosin II domain structure (Fig 1B).Within the myosin II head domain, MyH7B conformed to the switch I and switch II ATPasemotifs and these regions were highly homologous to other rat myosin II isoforms (Fig. 1Cand D). We next analyzed a region in the ATPase domain that contains consensus residuesfor sarcomeric, or muscle-like, myosin II heavy chains (Fig. 1E). As expected, rat MyH7Bshared no homology with the non-muscle heavy chain, MyH10, in this region, whichsuggested that these two myosin II heavy chains are functionally distinct. MyH7B was,however, highly homologous to rat MyH7 (NM_017240), a sarcomeric myosin II heavychain that is expressed in heart tissue and drives ventricular contraction (Wendel et al.,2000). MyH7B shared no homology with any of these myosin II isoforms in thehypervariable “Loop 1” area, a region which serves as the nucleotide binding domain (Fig.1F), again indicating that this heavy chain isoform may have a distinct function from othermyosin II isoforms.
To confirm MyH7B expression in rat brain, we purified mRNA from brain tissue and probedfor putative transcripts of this myosin II heavy chain. Using three distinct probes targeted tothe 5’, middle and 3’ region of the mRNA, we identified two prevalent bands of 6.5 kb and 9kb (Fig. 2A) corresponding to the canonical sequence and an alternative splicing form ofMyH7B, respectively. Interestingly, the northern blot signal was extremely weak, asdemonstrated by comparison to GluR1 expression (Fig. 2B), suggesting that this mRNA ispresent, but scarce, in rat brain. To confirm that MyH7B message was scarce in brain tissue,we performed quantitative real-time PCR on purified rat hippocampal mRNA. Indeed,MyH7B message was ~863-fold less abundant than GluR1 (Fig 2C). Control experimentsconfirmed that these real-time probes had similar amplification efficiencies (Fig. S2A–B).We then proceeded to determine whether MyH7B was expressed in neurons by performingRT-PCR in 18 DIV hippocampal neuronal cultures lacking astroglia. A band ofapproximately 300bp was obtained using two different sets of primers directed to the C-terminal portion of MyH7B (Fig. 2D), thus confirming the expression of MyH7B mRNA inneurons. We were unable to generate antibodies capable of detecting endogenous MyH7Bprotein in brain tissue or cultured neurons (Fig. S2C). These antibodies were, however, ableto detect recombinant MyH7B, indicating that the antibodies were specific and that cDNAsof MyH7B produce a full-length protein (Fig. 2E). Considering that MyH7B message is
Rubio et al. Page 6
J Neurosci. Author manuscript; available in PMC 2011 July 26.
NIH
-PA Author Manuscript
NIH
-PA Author Manuscript
NIH
-PA Author Manuscript

scarce in brain (Fig. 2C), we were most likely unable to detect endogenous MyH7B proteinbecause it is expressed at very low levels in the brain.
MyH10, together with β-actin, are fundamental regulators of spine morphology, and MyH10is often expressed at locations of high actin content (Ryu et al., 2006). However, becauseMyH7B belongs to a different subclass of myosin II motors (Desjardins et al., 2002), wesought to determine if this isoform was also localized in dendritic spines. We tested thispossibility by co-transfecting DIV15 hippocampal neurons with mCherry (as a cytoplasmicmarker) along with GFP:β-Actin, GFP:MyH10 or MyH7B:GFP for three days. Our resultsshowed that β-actin and MyH10 were both enriched in dendritic spines (Fischer et al., 1998;Ryu et al., 2006) (Fig. 2 F, G), while MyH7B is localized to both dendritic spines anddendritic shafts (Fig. 2H). To ensure that exogenous expression of GFP tagged MyH7B doesnot modify dendritic spine density and/or their morphology, we analyzed these parameters inneurons expressing MyH7B-GFP (Fig. 2H) and compared it to those expressing GFP taggedactin or MyH10. We found, as was previously reported (Johnson and Ouimet, 2006), thatoverexpression of GFP-actin increased protrusion density, while overexpression of eithermyosin II heavy chain had no effect (Fig. 2I). In addition, these three transgenes had noeffect on spine morphology classification (Fig. 2J) or dendritic spine head morphology (Fig.2K).
MyH7B maintains synaptic strength in hippocampal neurons through an actin-dependentmechanism
We initially discovered rat MyH7B through a YTH screen with the synaptically enrichedprotein, SynGAP1, which is a potent regulator of synapse structure (Vazquez et al., 2004)and function (Rumbaugh et al., 2006), and is believed to cause certain forms of non-syndromic mental retardation (Hamdan et al., 2009). This information, together withMyH7B-GFP localization to dendritic spines, led us to hypothesize that MyH7B is involvedin processes that support synaptic function. To test this idea, we recorded mEPSCs fromhippocampal neurons transfected with a pool of siRNAs targeted to four distinct locations ofMyH7B mRNA, along with a fluorescent protein to visualize neurons expressing the siRNApool (Rumbaugh et al., 2006). While the mEPSC frequency was not significantly affected(Fig. 3A, B), the mEPSC amplitude from cells expressing a pool of four MyH7B-specificsiRNAs (pool) was significantly reduced when compared to cells expressing control siRNA(Fig 3A, C, D). The reduction in mEPSC amplitude was robust and easily identifiable in allcells recorded. We also observed a decrease in mEPSC amplitude in cells expressing asingle siRNA targeted against MyH7B (siRNA#5, Fig 3D). We then performed site-directedmutagenesis on our MyH7B cDNA to create a siRNA-insensitive “rescue” construct (Fig.S3, A–C). This rescue construct has five silent mutations in the siRNA#5 targeting region ofthe MyH7B rat cDNA (C4590T; G4596A; C4597T; C4599A; C4603A). Neurons co-expressing siRNA#5 together with the rescue construct had normal mEPSC amplitudes (Fig.3D), indicating that exogenous expression of rescue MyH7B was able to reverse thedisruption caused by our siRNA. Importantly, overexpression of only the rescue form ofMyH7B had no effect on mEPSCs (Fig. 3D, GFP-MyH7B). Using two independent methods,we also confirmed that MyH7B siRNAs do not decrease MyH10 transcripts. First, wetransfected MyH7B siRNAs into neurons and then purified total RNA three days later. Wefound that MyH7B siRNAs decreased its own mRNA, but surprisingly, increased MyH10transcript levels by ~17 fold (Fig. S3D). To more directly test target specificity of thesesiRNAs, we transfected GFP-tagged MyH10 and MyH7B along with the siRNA pool intoHEK cells and then measured expression levels of each fusion protein three days later (Fig.S3E). We found that MyH7B expression was decreased ~5 fold, whereas MyH10 expressionwas again increased, but his time to a much lesser extent, confirming that MyH7B siRNAsdo not decrease MyH10 expression.
Rubio et al. Page 7
J Neurosci. Author manuscript; available in PMC 2011 July 26.
NIH
-PA Author Manuscript
NIH
-PA Author Manuscript
NIH
-PA Author Manuscript

Our data show that lowering the expression of MyH7B causes a significant decrease inmEPSC amplitude with no effect on mEPSC frequency. This, taken together with the factthat MyH7B is localized to dendritic spines, led us to hypothesize that MyH7B controls ageneral process that regulates nearly all functional excitatory synapses. It has been shownpreviously that a multiplicative shift in the cumulative probability fraction of mEPSCsamplitudes is indicative of a cell-wide change in synaptic strength (O'Brien et al., 1998;Turrigiano et al., 1998). Indeed, mEPSC events from cell transfected with MyH7B siRNAswere decreased by a multiplicative factor of 0.62 relative to controls. These data suggest thatloss of MyH7B from neurons causes a reduction in synaptic strength across nearly allexcitatory synapses. We then transfected either control or MyH7B-specific siRNA pool intohippocampal neurons and measured the density of excitatory synapses using vGlut1antibodies. We found that there was no effect of MyH7B siRNA expression on the density ofexcitatory synapses (Fig. S4; control, n=14, 0.64 ± 0.1 puncta/µm; MyH7B siRNA pool,n=14, 0.73 ± 0.11 puncta/µm), supporting the idea that MyH7B has a direct role insupporting synaptic function.
We next sought to understand if MyH7B and MyH10 have similar effects on themaintenance of synaptic strength. Thus, we recorded mEPSCs from cultured hippocampalneurons transfected with either a control pool or a pool of siRNAs directed against fourdifferent regions of the MyH10 mRNA, together with a cytoplasmic marker. Pool siRNAstargeting MyH10 disrupted its expression in cultured neurons (Fig. S5). Reducing expressionof MyH10 did affect synaptic function, though there was a pronounced decrease on mEPSCfrequency and only a mild effect on amplitude (Fig. 3F–G), which was in stark contrast tothe effects seen with MyH7B siRNAs.
MyH7B regulates actin dynamics and AMPAR trafficking in hippocampal neuronsDisrupting actin filaments in pyramidal neurons causes a decrease in synaptic strength (Kimand Lisman, 1999). Therefore, we hypothesized that the observed reduction of AMPAR-mediated mEPSCs resulting from expression of MyH7B siRNAs are mechanistically linkedto disruption of the actin cytoskeleton. To study this possibility, we first examined the effectof MyH7B on actin filaments in dendritic spines. Indeed, when we measured the relativeenrichment of GFP-Actin in dendritic spines of neurons expressing a pool of MyH7BsiRNAs, there was a significant shift of GFP-Actin from dendritic spines to the shaft (Fig4A, B). To further test this idea, we internally perfused latrunculin A into hippocampalneurons and measured the mEPSCs amplitude over time. Latrunculin A is a compound withhigh affinity for monomeric G-actin that depolymerizes the cytoskeleton in a rapid,reversible and specific fashion. In agreement with previous studies (Kim and Lisman, 1999),we observed that in control, non-transfected neurons, mEPSC amplitude decreased rapidlyin the presence of latrunculin A, while vehicle (DMSO) had no effect on mEPSC amplitudes(Fig. 4C). Internal perfusion of latrunculin A into neurons expressing control siRNAsresulted in a significant decrease in mEPSC amplitude, while this drug had no additionaleffect on neurons expressing MyH7B siRNAs (Fig. 4D). mEPSCs frequency remainedunchanged in every condition tested (Fig. 4E).
In addition to reducing synaptic strength, depolymerizing synaptic F-actin also causesremoval of AMPA receptors from dendritic spines (Allison et al., 1998). mEPSC amplitudeis dependent upon the concentration of functional AMPARs apposed to presynaptic vesiclerelease sites, and AMPAR function can be regulated by phosphorylation (Banke et al., 2000)or through dynamic receptor trafficking to and from the synaptic surface (Kessels andMalinow, 2009). In order to understand if altered receptor trafficking could explain reducedsynaptic function seen after MyH7B knockdown, we performed immunostaining of surfaceGluR1 AMPA receptor subunits (sGluR1) in DIV 18 neurons expressing a pool of eithercontrol or MyH7B siRNAs. eGFP was co-transfected to visualize the cytoplasm and to
Rubio et al. Page 8
J Neurosci. Author manuscript; available in PMC 2011 July 26.
NIH
-PA Author Manuscript
NIH
-PA Author Manuscript
NIH
-PA Author Manuscript

identify neurons expressing siRNAs (Fig. 5A). Compared to the control condition, cellslacking MyH7B had smaller and less intense sGluR1 clusters (Fig. 5B, C), which isconsistent with our observation of reduced mEPSC amplitudes in cells containing MyH7BsiRNAs. MyH7B knockdown had no effect on total GluR1 cluster area (Fig. 5D) or intensity(Fig. 5E), indicating that MyH7B siRNAs alter GluR1 trafficking and/or anchoring at thesynapse.
MyH7B regulates dendritic spine morphology in hippocampal neuronsGiven the cell-wide effects of MyH7B siRNAs on mEPSC amplitude, the localization ofMyH7B-GFP in dendritic spines, and the likelihood of an interaction with actin filaments,we hypothesized that this protein would be involved in the regulation of dendritic spinemorphology in hippocampal neurons. Indeed, expression of MyH7B-specific siRNAsresulted in abnormally shaped and unusually large dendritic spines (Fig. 6A). Manydendritic protrusions were positive for postsynaptic proteins (Fig. 5), but lacked traditionalspine morphology. In addition, spine-like protrusions from dendrites expressing MyH7B-specific siRNAs often had long filopodia-like protrusions extending from their head (Fig.6A), which was reversed by co-transfection of the rescue construct (Fig. 6A–B). To furtherquantify spine head distortions in response to reducing MyH7B expression, we measured thespine head’s circularity index (CI) (Amaral and Dent, 1981;Pak et al., 2001), where a valueof 1 corresponds to a perfect circle. We found that neurons that contained MyH7B siRNAshad more irregularly-shaped (less circular) dendritic spine heads relative to control (Fig.6C), a phenomenon that was partially rescued by co-expression of the siRNA#5-insensitiveform of MyH7B:GFP. We next analyzed the cumulative probabilities of the CI for all spinesmeasured (Fig. 6D;Fig. S6). Reducing MyH7B expression dramatically shifted the CIpopulation to the left. Assessment of the inter-quartile area in control neurons uncovered aspread that spanned 0.9–1, indicative of normal, round spine heads. However, there was afar greater spread of the CI inter-quartile area in MyH7B knockdown neurons, whichcovered a range from 0.5–1. Interestingly, CI distribution was unimodal in control neurons(Fig. 6D, Hartigan’s dip test p<0.01), but shifted to a multimodal distribution in cellsexpressing MyH7B siRNAs (Fig. 6D, Hartigan’s dip test p>0.05; Fig. S6). These dataindicate that only a subpopulation of spines were morphologically affected by MyH7Bdisruption, but spines that were affected, had dramatic alterations in their CI. Furthermore,MyH7B knockdown neurons had larger heads (Fig. 6E) and a quantitative morphometricanalysis revealed a switch in the overall characteristics of spine shapes in neuronsexpressing MyH7B siRNAs (Fig. S7A). Dendritic spines head width, neck width, and spinelength were measured and spines were classified into thin, stubby, mushroom or filopodia,as previously described (Harris et al., 1992). Our results revealed that MyH7B siRNAsinduce a significant increase in the ratio of thin spines and filopodia, with a concomitantdecrease in stubby spines (Fig. S7A). The percentage of mushroom spines remainedunchanged, and spine length was unaltered (Fig. 6F). We then wished to determine whetherknocking down MyH7B promoted outgrowth of irregular spines or if these were the result ofa disruption of previously existing “normal” spines. For this, we counted the number ofprotrusions for every micrometer of dendritic shaft (Fig. 6G). Interestingly, we observed areduction in the number of protrusions in neurons expressing MyH7B siRNAs compared tocontrols, suggesting an involution of dendritic spines and supporting the idea that apopulation of pre-existing, morphologically normal dendritic spines undergoes a molecularchange that causes a distorted head shape.
MyH7B and MyH10 have distinct and overlapping effects on spine morphologyMyH10 and MyH7B are structurally distinct motors, and each has a unique impact onsynaptic strength (Fig. 3). Thus, it is reasonable to hypothesize these motors might alsomediate distinct aspects of spine morphology maintenance. To test this idea, we expressed a
Rubio et al. Page 9
J Neurosci. Author manuscript; available in PMC 2011 July 26.
NIH
-PA Author Manuscript
NIH
-PA Author Manuscript
NIH
-PA Author Manuscript

pool of control or MyH10 specific siRNAs in hippocampal neurons and quantified variousparameters relating to spine morphology (Fig. 6H). Spines from these neurons exhibitedirregularly shaped heads as shown by a significant increase in the percentage of dendriticspine heads showing protrusions (Fig 6I) and a difference in the spine head CI (Fig. 6J).Although they exhibited a significant left shift of the cumulative frequency distributioncurve (Fig 6K), the circularity index range in the inter- quartile area was comparable tocontrol (0.85 to 1 compared to 0.9 to 1 for control), and was not nearly as left-shifted asspines from MyH7B siRNA expressing neurons (Fig. 6D; Fig. 6K). In addition, populationanalysis of individual CI’s revealed that spines with reduced MyH10 exhibited a unimodaldistribution (Fig. 6K, Hartigan’s dip test for control and MyH10 siRNA p<0.01), which wasin stark contrast to the multimodal CI distribution of spines with reduced MyH7B. Inaddition, MyH10 siRNA-containing neurons had normal spine head area (Fig. 6L), ameasure that was disrupted in MyH7B siRNA-expressing neurons. The differential effect ofthese two myosin II heavy chains in neurons was also apparent when we performed amorphometrical analysis of spines. Similar to what we found in neurons lacking MyH7B,MyH10 siRNA expressing neurons showed an abundance of thin spines with a reduction ofthe number of stubby shaped ones compared to control (Fig. S7B). However, we observed areduction in mushroom shaped spines while the number of filopodia-like protrusionsremained unaffected (Fig. S7B). We also found that, in accordance to previous studies (Ryuet al., 2006), and opposite to what we saw in MyH7B knockdown neurons (Fig. 6F),dendritic spines were longer than their control counterparts (Fig. 6M). However, they didalso show an overall reduction of the protrusions density, comparable to neurons lackingMyH7B (Fig 6N), demonstrating both distinct and overlapping functions relating to spinemorphology.
Considering that MyH7B and MyH10 have both distinct and overlapping effects on synapsestructure and function, we next wanted to test the idea that simultaneous knockdown of bothisoforms would result in a drastic alteration in spine morphology. We imaged neuronsexpressing siRNAs targeting both MyH7B and MyH10, together with mCherry. Indeed, wefound that when MyH10 and MyH7B were both disrupted in the same cells, dendritic spineswere drastically altered (Fig. 7A). As expected, there was an increase in the number ofdendritic spines with protrusions arising from their heads (Fig.7B), accompanied by asignificant decrease in the CI (Fig. 7C) where the population distribution showed amultimodal pattern similar to that of MyH7B siRNAs expressing neurons together with ashift to the left of the cumulative probability curve (Fig. 7D, Hartigan’s dip test:control=p<0.01, MyH10=p<0.01). Morphologically, disruption of both isoforms resulted inan increase in filopodia and thin spines with a concomitant decrease in mushroom andstubby spines (Fig. S7C). Altogether, thin spines and filopodia composed approximately70% of the protrusions while in control neurons this number descended to approximately45%. Interestingly, spine head area did not change compared to control (Fig. 7E). Becausethe spine head area is calculated as a mean of all spines analyzed, and this experimentshowed a co- existence of narrow filopodia and wide irregular heads, the mean spine headarea was not significantly altered. These neurons presented spines that became longer thancontrols (Fig. 7F) and had fewer protrusions than their control counterparts (Fig. 7G).Because knocking down both MyH7B and MyH10 simultaneously resulted in an additiveeffect on spine structure, these data suggest that these myosin II motors act in concert toregulate dendritic spine structure and function.
DiscussionIn this study, we report that a novel muscle-type myosin II heavy chain regulates synapsestructure and function. Based on its unique motor domain, we hypothesized that MyH7Bwould have a distinct function relative to the known synapse regulator, MyH10. Indeed, we
Rubio et al. Page 10
J Neurosci. Author manuscript; available in PMC 2011 July 26.
NIH
-PA Author Manuscript
NIH
-PA Author Manuscript
NIH
-PA Author Manuscript

found specific structural and physiological differences between these two distinct myosin IImotors expressed in neurons.
MyH7B, synaptic function and the actin cytoskeletonOur data demonstrate that MyH7B is necessary for steady-state synaptic transmission inhippocampal neurons. Reducing the expression of MyH7B caused a selective decrease inmEPSC amplitude, while having no concomitant effect on mEPSC frequency, indicatingthat MyH7B regulates postsynaptic function. This effect observed on synaptic function ispartly explained by a reduction in surface AMPA receptors located at synapses. Ourelectrophysiology results, combined with antibody labeling studies, indicate that MyH7Bacts in the post-synapses to stabilize AMPA receptor clusters apposing neurotransmitterrelease sites. Future studies will determine whether the effects on neurotransmission are dueto MyH7B regulation of traditional modes of AMPAR trafficking, such as endo andexocytosis. Alternatively, MyH7B may have a more nuanced role in trafficking by regulatinglateral diffusion of surface AMPARs that might influence receptor capture at synapses(Kessels and Malinow, 2009).
AMPAR trafficking and synaptic expression of AMPARs are both regulated by dynamicspine F-actin (Zhou et al., 2001; Yang et al., 2008; Renner et al., 2009; Rust et al., 2010).Thus, we hypothesized that MyH7B, which is an actin-based molecular motor, may stabilizesteady-state synaptic transmission by linking the cytoskeleton to AMPARs. Our data supportthis model, as MyH7B knockdown by siRNAs occluded the effect of the actindepolymerizing compound, latrunculin A. How might MyH7B, actin and AMPAR synapticfunction be linked? High levels of latrunculin A completely remove F-actin from spines andthis effect results in dispersion of synaptic AMPARs (Allison et al., 1998). In addition,similar concentrations of this compound result in a rapid rundown of AMPAR currents (Kimand Lisman, 1999), and our data support these previous studies. More recently, Yang et al(2008) demonstrated that the actin cytoskeleton controls transport of AMPARs from peri-synaptic sites to the synapse proper, which is a necessary step in the full expression of LTP.Thus, AMPAR expression at synapses appears dependent on the integrity of multiple poolsof neuronal actin. In our studies, we found that neurons with reduced levels of MyH7B hadan altered spine F-actin distribution. These data, together with the occlusion of latrunculin Aon mEPSC amplitudes, leads us to the conclusion that MyH7B regulates a pool of actin thatstabilizes AMPARs at the post synapse.
MyH7B and dendritic spine morphologyIn addition to regulating AMPAR trafficking, F-actin dynamics also control dendritic spinemorphology (Fisher et al., 1996). Our results show that over-expression of exogenousMyH7B did not modify the dendritic spine density nor their morphological classification,while siRNA knockdown of MyH7B resulted in a reduction of dendritic spine density and ashift in their classification. This effect is consistent with the idea that MyH7B regulates spinemaintenance rather than controlling spinogenesis. Reducing MyH7B expression caused asubpopulation of spines to become large and irregular, with filopodia-like protrusionsemerging from their heads. This abnormal spine phenotype is strikingly similar tomorphological changes described after SPAR over-expression in a similar culture system(Pak et al., 2001). SPAR is a PSD-associated Rap-GAP that reorganizes the actincytoskeleton and acts as a link between PSD-95 and F-actin. Interestingly, SynGAP1, whichhas been linked to mental retardation and autism spectrum disorders (Hamdan et al., 2009;Pinto et al., 2010), has potent Rap-GAP activity (Krapivinsky et al., 2004) arising from aninteraction between its GAP and C2 domains (Pena et al., 2008). Manipulating SynGAPexpression at excitatory synapses bi-directionally regulates AMPA receptor trafficking(Rumbaugh et al., 2006) and spine morphology (Vazquez et al., 2004). Spine defects caused
Rubio et al. Page 11
J Neurosci. Author manuscript; available in PMC 2011 July 26.
NIH
-PA Author Manuscript
NIH
-PA Author Manuscript
NIH
-PA Author Manuscript

by reducing SynGAP expression are likely due to actin dysregulation (Carlisle et al., 2008).Interestingly, we isolated a MyH7B fragment from rat brain using the C-terminus ofSynGAP1. Therefore, it is reasonable to speculate that MyH7B regulates synapse structureand function through a complex interaction with SynGAP1 and small GTPases. PerhapsMyH7B tethers SynGAP1 in close proximity to a critical pool of F-actin, thus enabling localGTPase regulation of the cytoskeleton. Future studies will be aimed at determining whetherMyH7B and SynGAP interact at synapses to regulate dendritic spine structure and AMPARfunction.
Similarity and differences between MyH7B and MyH10 in neuronsmyosin II motors control actin dynamics and growth structure morphology in nearly all celltypes. In neuronal growth cones, for example, actin/myosin II interactions play afundamental role in actin depolymerization. In these structures, myosin II acts as a“molecular scissor”, such that it mechanically shears F-actin bundles, promoting theirdisassembly and subsequent depolymerization into G-actin (Medeiros et al., 2006). F-actinis the major cytoskeletal entity located at excitatory synapses (Fifkova and Delay, 1982).Thus, it is not surprising that reducing expression of MyH10 (Ryu et al., 2006) or MyH7Bhad such profound effects on synapse structure and function. What was unexpected,however, was that reducing expression of MyH7B had a distinct effect on spine morphologyand synaptic function when compared to MyH10 siRNAs. Knocking down expression ofMyH7B caused a large change in spine head area, no effect on spine length, and a selectiveeffect on mEPSC amplitude. In contrast, reducing expression of MyH10 had no effect onspine head area, spine length was significantly increased, while both mEPSC amplitude andfrequency were reduced. Based on these data, we hypothesize that MyH7B controls a pool ofactin dynamics that operates primarily in the spine head, while MyH10 is especiallyimportant for regulating spine neck dynamics. The finding that spine shape and neckdimensions are independent from each other further supports this idea (Fig. S8). Recently,super-resolution microscopy of actin flow in spines revealed a highly branched and weaklypolarized actin cytoskeleton (Tatavarty et al., 2009; Frost et al., 2010), suggesting thatmultiple pools of dynamic actin exist simultaneously in resting spines, in addition to therecently characterized enlargement pool of actin that appears in response to synapticstimulation (Honkura et al., 2008). Furthermore, electron microscopy methods that leavecytoskeletal elements intact revealed that spine necks and spine heads have distinctcytoskeletal organization (Korobova and Svitkina, 2010). Interestingly, this group alsofound a high concentration of myosin II within the neck and spine-head base. Therefore, wepresent the idea that distinct myosin II motors at excitatory synapses enable selective controlover spine sub-domains.
Our data also demonstrate that reducing MyH7B expression in neurons disrupted the positivecorrelation between synapse size and synapse function (Matsuzaki et al., 2001). Knockingdown MyH7B increases spine head area but reduces mEPSC amplitude and synapticAMPAR expression. These data contrast with our results obtained after reducing MyH10expression. In these experiments, spine head area was unchanged, but mEPSC amplitudeand frequency were reduced. These unexpected results highlight the complex morphologiesof spines that result from disturbing myosin II expression in neurons. In the case of MyH7BsiRNAs, spine head area is increased because of the large numbers of filopodia emanatingfrom many of the heads, which also causes extreme changes to the circularity of spines.Thus, it is possible that these filopodia emerging from spine heads may disrupt expression ofsynaptic AMPARs. Alternatively, distinct pools of actin may control spine head morphologyand AMPAR synaptic expression. In support of this alternative, a cumulative probabilitydistribution of individual mEPSC amplitudes revealed that nearly all functional synapseswere affected by MyH7B knockdown. However, a cumulative probability distribution of
Rubio et al. Page 12
J Neurosci. Author manuscript; available in PMC 2011 July 26.
NIH
-PA Author Manuscript
NIH
-PA Author Manuscript
NIH
-PA Author Manuscript

circularity index measurement from individual spines revealed a multimodal distribution,with a discrete population of spines within a normal range of values. Thus, synapse structureand function appear differentially regulated by MyH7B knock-down. Future experimentsthat combine simultaneous structural and functional measurements at individual dendriticspines in neurons with targeted disruptions of myosin II motors will be necessary to resolvethe specific roles of myosin II motors at synapses.
One of the main obstacles of the study of MyH7B is that expression of the endogenousprotein is so low that it escapes detection by antibodies (Fig. 2). To overcome this limitation,we relied on the use of multiple MyH7B specific siRNAs to study the functional role of thislow expressed protein. Indeed, we were able to rescue both functional and structural siRNAphenotypes by co-expression of a MyH7B cDNA. It was surprising that a protein with lowexpression had such profound effects on synapse structure and function. However, a specificDNA methyl-transferase that maintains DNA CpG methylation in neurons escaped detectionby immunblotting (Feng et al., 2010). In that study, the authors were not able to detectDNMT3a protein, though they detected neuronal expression using RT-PCR. In addition,they confirmed that this protein had a function by using conditional knockout mice. Thus,the Feng et al. study (2010), along with our experiments, highlights the fact that low-expressing proteins, which fall below the detection threshold of antibodies, perform criticalcellular functions. Combining modern genetic tools with sensitive structural and functionalneuronal assays allows the systematic study of proteins with unusually low levels ofexpression.
In conclusion, our results demonstrate that divergent myosin II motors control uniqueaspects of synapse structure and function. Thus, understanding myosin II function at neuronswill provide insight into the organization of synaptic actin dynamics, and may contribute tothe discovery of novel mechanisms governing steady-state and plastic neuronal mechanisms.
Supplementary MaterialRefer to Web version on PubMed Central for supplementary material.
AcknowledgmentsWe would like to thank Drs. Courtney Miller, Thomas Creson, and Christopher Rex for their critical evaluation ofthis manuscript and Dr. Noriko Murakami for kindly providing us the eGFP:MyH10 plasmid. This work wassupported by the Evelyn F. McKnight Brain Institute, The Scripps Research Institute and National Institutes ofNeurological Disorders and Stroke grant R01NS064079 (GR).
ReferencesAllison DW, Gelfand VI, Spector I, Craig AM. Role of actin in anchoring postsynaptic receptors in
cultured hippocampal neurons: differential attachment of NMDA versus AMPA receptors. JNeurosci. 1998; 18:2423–2436. [PubMed: 9502803]
Amaral DG, Dent JA. Development of the mossy fibers of the dentate gyrus: I. A light and electronmicroscopic study of the mossy fibers and their expansions. J Comp Neurol. 1981; 195:51–86.[PubMed: 7204652]
Banke TG, Bowie D, Lee H, Huganir RL, Schousboe A, Traynelis SF. Control of GluR1 AMPAreceptor function by cAMP-dependent protein kinase. J Neurosci. 2000; 20:89–102. [PubMed:10627585]
Carlisle HJ, Manzerra P, Marcora E, Kennedy MB. SynGAP regulates steady-state and activity-dependent phosphorylation of cofilin. J Neurosci. 2008; 28:13673–13683. [PubMed: 19074040]
Cheng XT, Hayashi K, Shirao T. Non-muscle myosin IIB-like immunoreactivity is present at thedrebrin-binding cytoskeleton in neurons. Neurosci Res. 2000; 36:167–173. [PubMed: 10711814]
Rubio et al. Page 13
J Neurosci. Author manuscript; available in PMC 2011 July 26.
NIH
-PA Author Manuscript
NIH
-PA Author Manuscript
NIH
-PA Author Manuscript

Desjardins PR, Burkman JM, Shrager JB, Allmond LA, Stedman HH. Evolutionary implications ofthree novel members of the human sarcomeric myosin heavy chain gene family. Mol Biol Evol.2002; 19:375–393. [PubMed: 11919279]
Feng J, Zhou Y, Campbell SL, Le T, Li E, Sweatt JD, Silva AJ, Fan G. Dnmt1 and Dnmt3a maintainDNA methylation and regulate synaptic function in adult forebrain neurons. Nat Neurosci. 2010;13:423–430. [PubMed: 20228804]
Fifkova E, Delay RJ. Cytoplasmic actin in neuronal processes as a possible mediator of synapticplasticity. J Cell Biol. 1982:345–350. [PubMed: 6890558]
Fischer A, Sananbenesi F, Schrick C, Spiess J, Radulovic J. Distinct roles of hippocampal de novoprotein synthesis and actin rearrangement in extinction of contextual fear. J Neurosci. 2004;24:1962–1966. [PubMed: 14985438]
Fischer M, Kaech S, Knutti D, Matus A. Rapid actin-based plasticity in dendritic spines. Neuron.1998; 20:847–854. [PubMed: 9620690]
Frost NA, Shroff H, Kong H, Betzig E, Blanpied TA. Single-molecule discrimination of discreteperisynaptic and distributed sites of actin filament assembly within dendritic spines. Neuron. 2010;67:86–99. [PubMed: 20624594]
Fukazawa Y, Saitoh Y, Ozawa F, Ohta Y, Mizuno K, Inokuchi K. Hippocampal LTP is accompaniedby enhanced F-actin content within the dendritic spine that is essential for late LTP maintenance invivo. Neuron. 2003; 38:447–460. [PubMed: 12741991]
Gray NW, Weimer RM, Bureau I, Svoboda K. Rapid redistribution of synaptic PSD-95 in theneocortex in vivo. PLoS Biol. 2006; 4:e370. [PubMed: 17090216]
Hamdan FF, et al. Mutations in SYNGAP1 in autosomal nonsyndromic mental retardation. N Engl JMed. 2009; 360:599–605. [PubMed: 19196676]
Harris KM, Jensen FE, Tsao B. Three-dimensional structure of dendritic spines and synapses in rathippocampus (CA1) at postnatal day 15 and adult ages: implications for the maturation of synapticphysiology and long-term potentiation. J Neurosci. 1992; 12:2685–2705. [PubMed: 1613552]
Honkura N, Matsuzaki M, Noguchi J, Ellis-Davies GC, Kasai H. The subspine organization of actinfibers regulates the structure and plasticity of dendritic spines. Neuron. 2008; 57:719–729.[PubMed: 18341992]
Ishmael JE, Safic M, Amparan D, Vogel WK, Pham T, Marley K, Filtz TM, Maier CS. Nonmusclemyosins II-B and Va are components of detergent-resistant membrane skeletons derived frommouse forebrain. Brain Res. 2007; 1143:46–59. [PubMed: 17321505]
Johnson OL, Ouimet CC. A regulatory role for actin in dendritic spine proliferation. Brain Res. 2006;1113:1–9. [PubMed: 16934781]
Kasai H, Fukuda M, Watanabe S, Hayashi-Takagi A, Noguchi J. Structural dynamics of dendriticspines in memory and cognition. Trends Neurosci. 2010; 33:121–129. [PubMed: 20138375]
Kessels HW, Malinow R. Synaptic AMPA receptor plasticity and behavior. Neuron. 2009; 61:340–350. [PubMed: 19217372]
Kim CH, Lisman JE. A role of actin filament in synaptic transmission and long-term potentiation. JNeurosci. 1999; 19:4314–4324. [PubMed: 10341235]
Korobova F, Svitkina T. Molecular architecture of synaptic actin cytoskeleton in hippocampal neuronsreveals a mechanism of dendritic spine morphogenesis. Mol Biol Cell. 2010; 21:165–176.[PubMed: 19889835]
Krapivinsky G, Medina I, Krapivinsky L, Gapon S, Clapham DE. SynGAP-MUPP1-CaMKII synapticcomplexes regulate p38 MAP kinase activity and NMDA receptor-dependent synaptic AMPAreceptor potentiation. Neuron. 2004; 43:563–574. [PubMed: 15312654]
Krucker T, Siggins GR, Halpain S. Dynamic actin filaments are required for stable long-termpotentiation (LTP) in area CA1 of the hippocampus. Proc Natl Acad Sci USA. 2000; 97:6856–6861. [PubMed: 10823894]
Lin B, Kramar EA, Bi X, Brucher FA, Gall CM, Lynch G. Theta stimulation polymerizes actin indendritic spines of hippocampus. J Neurosci. 2005; 25:2062–2069. [PubMed: 15728846]
Lin CH, Forscher P. Growth cone advance is inversely proportional to retrograde F-actin flow.Neuron. 1995; 14:763–771. [PubMed: 7536426]
Rubio et al. Page 14
J Neurosci. Author manuscript; available in PMC 2011 July 26.
NIH
-PA Author Manuscript
NIH
-PA Author Manuscript
NIH
-PA Author Manuscript

Lynch G, Rex CS, Gall CM. LTP consolidation: Substrates, explanatory power, and functionalsignificance. Neuropharmacology. 2006
Matsuzaki M, Ellis-Davies GC, Nemoto T, Miyashita Y, Iino M, Kasai H. Dendritic spine geometry iscritical for AMPA receptor expression in hippocampal CA1 pyramidal neurons. Nat Neurosci.2001; 4:1086–1092. [PubMed: 11687814]
Medeiros NA, Burnette DT, Forscher P. myosin II functions in actin-bundle turnover in neuronalgrowth cones. Nat Cell Biol. 2006; 8:215–226. [PubMed: 16501565]
Miyazaki T, Watanabe M, Yamagishi A, Takahashi M. B2 exon splicing of nonmuscle myosin heavychain IIB is differently regulated in developing and adult rat brain. Neurosci Res. 2000; 37:299–306. [PubMed: 10958978]
O'Brien RJ, Kamboj S, Ehlers MD, Rosen KR, Fischbach GD, Huganir RL. Activity-dependentmodulation of synaptic AMPA receptor accumulation. Neuron. 1998; 21:1067–1078. [PubMed:9856462]
Okamoto K, Nagai T, Miyawaki A, Hayashi Y. Rapid and persistent modulation of actin dynamicsregulates postsynaptic reorganization underlying bidirectional plasticity. Nat Neurosci. 2004;7:1104–1112. [PubMed: 15361876]
Pak DT, Yang S, Rudolph-Correia S, Kim E, Sheng M. Regulation of dendritic spine morphology bySPAR, a PSD-95-associated RapGAP. Neuron. 2001; 31:289–303. [PubMed: 11502259]
Pena V, Hothorn M, Eberth A, Kaschau N, Parret A, Gremer L, Bonneau F, Ahmadian MR, ScheffzekK. The C2 domain of SynGAP is essential for stimulation of the Rap GTPase reaction. EMBORep. 2008; 9:350–355. [PubMed: 18323856]
Pinto D, et al. Functional impact of global rare copy number variation in autism spectrum disorders.Nature. 2010
Renner M, Choquet D, Triller A. Control of the postsynaptic membrane viscosity. J Neurosci. 2009;29:2926–2937. [PubMed: 19261888]
Rex CS, Gavin CF, Rubio MD, Kramar EA, Chen LY, Jia Y, Huganir RL, Muzyczka N, Gall CM,Miller CA, Lynch G, Rumbaugh G. myosin IIb regulates actin dynamics during synaptic plasticityand memory formation. Neuron. 2010; 67:603–617. [PubMed: 20797537]
Rumbaugh G, Adams JP, Kim JH, Huganir RL. SynGAP regulates synaptic strength and mitogen-activated protein kinases in cultured neurons. Proc Natl Acad Sci U S A. 2006; 103:4344–4351.[PubMed: 16537406]
Rust MB, Gurniak CB, Renner M, Vara H, Morando L, Gorlich A, Sassoe-Pognetto M,Banchaabouchi MA, Giustetto M, Triller A, Choquet D, Witke W. Learning, AMPA receptormobility and synaptic plasticity depend on n-cofilin-mediated actin dynamics. EMBO J. 2010
Ryu J, Liu L, Wong TP, Wu DC, Burette A, Weinberg R, Wang YT, Sheng M. A critical role formyosin IIb in dendritic spine morphology and synaptic function. Neuron. 2006; 49:175–182.[PubMed: 16423692]
Segal M. Dendritic spines and long-term plasticity. Nat Rev Neurosci. 2005; 6:277–284. [PubMed:15803159]
Star EN, Kwiatkowski DJ, Murthy VN. Rapid turnover of actin in dendritic spines and its regulationby activity. Nat Neurosci. 2002; 5:239–246. [PubMed: 11850630]
Tatavarty V, Kim EJ, Rodionov V, Yu J. Investigating sub-spine actin dynamics in rat hippocampalneurons with super-resolution optical imaging. PLoS One. 2009; 4:e7724. [PubMed: 19898630]
Turrigiano GG, Leslie KR, Desai NS, Rutherford LC, Nelson SB. Activity-dependent scaling ofquantal amplitude in neocortical neurons. Nature. 1998; 391:892–896. [PubMed: 9495341]
Vallee RB, Seale GE, Tsai JW. Emerging roles for myosin II and cytoplasmic dynein in migratingneurons and growth cones. Trends Cell Biol. 2009; 19:347–355. [PubMed: 19524440]
Vazquez LE, Chen HJ, Sokolova I, Knuesel I, Kennedy MB. SynGAP regulates spine formation. JNeurosci. 2004; 24:8862–8872. [PubMed: 15470153]
Vicente-Manzanares M, Ma X, Adelstein RS, Horwitz AR. Non-muscle myosin II takes centre stage incell adhesion and migration. Nat Rev Mol Cell Biol. 2009; 10:778–790. [PubMed: 19851336]
Wendel B, Reinhard R, Wachtendorf U, Zacharzowsky UB, Osterziel KJ, Schulte HD, Haase H,Hoehe MR, Morano I. The human beta-myosin heavy chain gene: sequence diversity andfunctional characteristics of the protein. J Cell Biochem. 2000; 79:566–575. [PubMed: 10996847]
Rubio et al. Page 15
J Neurosci. Author manuscript; available in PMC 2011 July 26.
NIH
-PA Author Manuscript
NIH
-PA Author Manuscript
NIH
-PA Author Manuscript

Yang Y, Wang XB, Frerking M, Zhou Q. Delivery of AMPA receptors to perisynaptic sites precedesthe full expression of long-term potentiation. Proc Natl Acad Sci U S A. 2008; 105:11388–11393.[PubMed: 18682558]
Zhang H, Webb DJ, Asmussen H, Niu S, Horwitz AF. A GIT1/PIX/Rac/PAK signaling moduleregulates spine morphogenesis and synapse formation through MLC. J Neurosci. 2005; 25:3379–3388. [PubMed: 15800193]
Zhou Q, Xiao M, Nicoll RA. Contribution of cytoskeleton to the internalization of AMPA receptors.Proc Natl Acad Sci U S A. 2001; 98:1261–1266. [PubMed: 11158627]
Zito K, Knott G, Shepherd GM, Shenolikar S, Svoboda K. Induction of spine growth and synapseformation by regulation of the spine actin cytoskeleton. Neuron. 2004; 44:321–334. [PubMed:15473970]
Rubio et al. Page 16
J Neurosci. Author manuscript; available in PMC 2011 July 26.
NIH
-PA Author Manuscript
NIH
-PA Author Manuscript
NIH
-PA Author Manuscript

Figure 1. Cloning of a novel myosin II isoform from rat brain tissueA) RT-PCR fragments on brain mRNA to deduce the putative coding sequence of MyH7Bgene product. 7 overlapping fragments were generated (F1–F7), including a start methionineat F1 and a stop codon at F7.B) Domain structure of MyH7B protein.C) Alignment of MyH7B cDNA with a sarcomeric myosin II heavy chain (MyH7) and anon-muscle myosin II heavy chain (MyH10) in the conserved switch I region.D) Alignment of MyH7B with MyH7 and MyH10 cDNAs in the conserved switch II regionE) Alignment of MyH7B with MyH7 and MyH10 cDNAs in a region that is conservedamong sarcomeric, or muscle-type myosin II isoforms.
Rubio et al. Page 17
J Neurosci. Author manuscript; available in PMC 2011 July 26.
NIH
-PA Author Manuscript
NIH
-PA Author Manuscript
NIH
-PA Author Manuscript

F) All myosin isoforms should contain a hyper-variable loop 1 region. MyH7B is nothomologous to other myosin II isoforms in this region, which is suggestive of a distinctfunction.
Rubio et al. Page 18
J Neurosci. Author manuscript; available in PMC 2011 July 26.
NIH
-PA Author Manuscript
NIH
-PA Author Manuscript
NIH
-PA Author Manuscript

Figure 2. MyH7B-GFP is localized to neurons and its exogenous overexpression does not alterdendritic spine density nor their architectureA) Northern blot analysis of rat brain tissue with probes targeting three distinct regions of aputative MyH7B mRNA sequence.B) Northern blot analysis of rat brain tissue with probes targeted against MyH7B and GluR1sequences, showing low expression levels of MyH7B. MyH7B was developed for 8 dayswhile GluR1 was developed for 4 hours.C) left, example traces from 250 ng of purified mRNA from adult rat hippocampus reversetranscribed and then amplified with GAPDH, GluR1 or MyH7B real time PCR probes. right,GluR1 (R1) and MyH7B (7B) relative expression levels in the hippocampus weredetermined by comparisons to the housekeeping gene, GAPDH (see methods). MyH7B(n=3) expression relative to GLuR1 (n=3) was then calculated by normalizing these twogenes to each other.D) RT-PCR using primers directed against the C-terminal region of MyH7B, amplifying a313bp fragment. Lanes 2 and 3 (neuron) correspond to cDNA from pure rat hippocampalneuronal cultures primed with Oligo(dT)20 or random hexameres, respectively. Importantly,neuronal cultures conditions were modified to remove all traces of glia. Lane 4 (mock)contains sample buffer. Lane 5 (brain) contains mRNA purified from adult rat forebrain.E) (Left) MyH7B and MyH7B:GFP cDNAs were transfected into HEK293T cells. Two dayslater, cells were lysed and proteins were separated by SDS-PAGE. Samples wereimmunoblotted with custom made anti-MyH7B IgG. (Right) HEK293FS cells weretransfected with GFP (left lane) and MyH7B:GFP (right lane) to confirm that GFP is fusedto the full length cDNA of MyH7B. Three days later cells were lysed and samples wereimmunoblotted with GFP monoclonal antibodies.F–H) Differential intracellular distribution of actin, MyH10 and MyH7B. Representativeimages of live DIV 18 primary hippocampal neuronal cultures co-transfected with mCherry(n=6), mCherry and GFP:β-Actin (F, n=5), GFP:MyH10 (G, n=6) or MyH7B:GFP (H, n=8).Arrows indicate location of dendritic spines. Arrowheads indicate dendritic localization.Scale bars: 20 µm, left; 2 µm, right.I) Quantification of dendritic spine density, expressed as number of protrusions/µm, of theneurons shown in F–H). Neurons expressing GFP-Actin show an increase in dendritic spinedensity compared to mCherry controls. mCherry: 0.37 ± 0.04; GFP-Actin: 0.53 ± 0.06;GFP-MyH10: 0.3 ± 0.05; MyH7B-GFP: 0.45 ± 0.04. Data expressed as mean ± SEM. Oneway ANOVA followed by Fisher’s LSD. *=p<0.05.J) Quantification of dendritic spine morphology, expressed as a percentage of total spinescounted. One way ANOVA analysis within groups show that overexpression of MyH7B-GFP does not modify dendritic spine morphology. Thin: GFP-Actin: 35.9% ± 4.4%; GFP-MyH10: 34.06% ± 3.6%; MyH7B-GFP: 33.3% ± 4.3%. Stubby: GFP-Actin: 35.1% ± 4.3%;
Rubio et al. Page 19
J Neurosci. Author manuscript; available in PMC 2011 July 26.
NIH
-PA Author Manuscript
NIH
-PA Author Manuscript
NIH
-PA Author Manuscript

GFP-MyH10: 36.5% ± 5.5%; MyH7B-GFP: 36.4% ± 5.2%. Mushroom: GFP-Actin: 27.25%± 4.1%; GFP-MyH10: 27.6% ± 2.8%; MyH7B-GFP: 26.4% ± 3.5%. Filopodia: GFP-Actin:1.7% ± 4.1%; GFP-MyH10: 1.7% ± 2.8%; MyH7B-GFP: 3.9% ± 3.5%. Data expressed asmean ± SEM.K) Quantification of dendritic spines with protrusions arising from their head expressed as apercentage of total spines counted. mCherry: 14.45% ± 1.6%; GFP-MyH10: 11.62% ± 1.5%;MyH7B-GFP: 11.21% ± 1.6%. One way ANOVA analysis did not show significantdifferences among groups. Data expressed as mean ± SEM.
Rubio et al. Page 20
J Neurosci. Author manuscript; available in PMC 2011 July 26.
NIH
-PA Author Manuscript
NIH
-PA Author Manuscript
NIH
-PA Author Manuscript

Figure 3. Distinct regulation of synaptic function by MyH7B and MyH10 siRNAsA) mEPSC traces were selected from whole-cell recordings of primary hippocampal neuronsco-transfected with eGFP and control siRNA (n=18) or a pool of 4 different siRNAsequences targeted to 4 different MyH7B regions (n=19).B) Quantification of mEPSCs frequency for neurons recorded on A). Control siRNA: 6.17Hz ± 0.92 Hz; MyH7B siRNA: 4.39 Hz ± 0.39 Hz. Student’s t-test statistical analysis did notshow a statistical significance between groups. N/S=not significant. Data expressed as mean± SEM.C) Quantification of mEPSCs amplitude for neurons recorded in A). Only mEPSCs withamplitudes greater than 4 pA were considered successful events. Control siRNA: 13.28 pA ±
Rubio et al. Page 21
J Neurosci. Author manuscript; available in PMC 2011 July 26.
NIH
-PA Author Manuscript
NIH
-PA Author Manuscript
NIH
-PA Author Manuscript

0.65 pA, n=18; MyH7B siRNA: 9.8 pA ± 0.3 pA, n=19. Student’s t-test: **=p<0.01. Dataexpressed as mean ± SEM.D) Normalized mEPSC amplitudes from several experiments looking at the effect ofMyH7B on synaptic function. To arrive at the normalized amplitude, events from eachneuron were averaged, and then the mean form all cells in a group was derived. In eachcondition, mean siRNA mEPSCs were normalized to control. (Control) refers to mEPSCamplitudes from neurons (13.8 ± 0.6 pA, n=10) expressing control siRNA pools. (Pool)refers to the MyH7B-specific siRNAs data shown in in Figure 3C. (siRNA #5) refers to asingle siRNA that effectively reduced mEPSC amplitude (11.8 ± 0.4 pA, n=10) whencompared to control siRNAs. (Rescue) refers to neurons co-expressing siRNA#5 togetherwith a rescue construct (13.9 ± 0.5 pA, n=8), which is a siRNA#5-insensitive MyH7BcDNA, normalized to control siRNAs. (GFP-MyH7B) refers to neurons expressing therescue construct by itself (16.2 ± 2.1 pA, n=11) normalized to untransfected neighboringneurons (15.3 ± 1.5 pA, n=11). *p<0.05; **p<0.01. Data expressed as mean ± SEM.E) Cumulative probability distribution plotted from all events acquired from neuronstransfected with control (n=1256) or MyH7B-specific (n=1471) siRNA pools.F–G) Mean mEPSC frequency and amplitude from neurons expressing GFP and controlsiRNA (n=5; frequency: 6.18 Hz ± 0.9 Hz; amplitude: 13.06 pA ± 0.58 pA) or MyH10siRNA pool (n=6; frequency: 2.45 Hz ± 0.34 Hz; amplitude: 11.37 pA ± 0.5 pA). Student’st-test: *=p<0.05, **=p<0.01. Data expressed as mean ± SEM.
Rubio et al. Page 22
J Neurosci. Author manuscript; available in PMC 2011 July 26.
NIH
-PA Author Manuscript
NIH
-PA Author Manuscript
NIH
-PA Author Manuscript

Figure 4. MyH7B maintains synaptic function through an actin-mediated mechanismA) Representative image of a DIV 18 neuron expressing GFP-β-actin and either a pool ofcontrol siRNAs (left) or a pool of siRNAs targeted to MyH7B (right). A line scan through aspine and adjacent dendritic shaft yielded an intensity vs. distance profile allowing theassessment of relative actin density in these structures.B) Quantification of the spine-shaft ratio of GFP-β-actin in neurons expressing control(n=23 spines) or MyH7B-specific (n=23 spines) siRNA pools. Student’s t-test, **= p<0.01.Data expressed as mean ± SEM.C) The effect of latrunculin A on mEPSC amplitude over time. Control, non-transfectedDIV14–17 neurons (n=6) were patch-clamped with 20 µM of latrunculin or vehicle (DMSO)
Rubio et al. Page 23
J Neurosci. Author manuscript; available in PMC 2011 July 26.
NIH
-PA Author Manuscript
NIH
-PA Author Manuscript
NIH
-PA Author Manuscript

in the internal saline. At two minutes after “break-in”, events over next minute were averageto yield a baseline mEPSC amplitude. Events were then averaged 10 and 20 minutes afterbaseline and these averages were normalized to that baseline. Student’s t-test, **= p<0.01D) DIV14–15 neurons were assessed for effects of latrunculin-A in the presence of siRNAs.Comparison between mEPSC average amplitude at baseline (black bars) and after 10minutes (white bars) in neurons transfected with mCherry and control siRNA pool (controlsiRNA, n=6, baseline: 12.23 pA ± 0.59 pA; 10 minutes: 10.11 pA ± 0.57 pA) or MyH7B-specific siRNA pool (MyH7B siRNA, n=7, baseline: 10.56 pA ± 0.47 pA; 10 minutes: 9.78pA ± 0.53 pA) that were patch-clamped with 20 µM latrunculin A in the internal saline.Student’s t-test, **=p<0.01. Data expressed as mean ± SEM.E) Average frequency plot of the cells tested in D). Control baseline: 5.5 Hz ± 1.41 Hz; 10minutes: 5.47 Hz ± 1.74 Hz; MyH7B siRNA baseline: 4.48 Hz ± 0.59 Hz; 10 minutes: 4.21Hz ± 0.71 Hz. Student’s t-test, N/S=not significant. Data expressed as mean ± SEM.
Rubio et al. Page 24
J Neurosci. Author manuscript; available in PMC 2011 July 26.
NIH
-PA Author Manuscript
NIH
-PA Author Manuscript
NIH
-PA Author Manuscript

Figure 5. MyH7B regulates AMPAR surface expression at excitatory synapsesA) DIV 18 primary hippocampal neurons were co-transfected with eGFP and either control(left) or MyH7B siRNA (right) pools. Neurons were then stained for surface GluR1(sGluR1), fixed, permeabilized and stained for eGFP. Figures show eGFP (top), GluR1(center) and colocalization of both (bottom, yellow areas). Scale bar= 5 µm.B) Quantification of surface GluR1 cluster area from neurons co-transfected with eGFP andcontrol (n=5, 0.39 µm2 ± 0.05 µm2) or MyH7B siRNA pools (n=7, 0.24 µm2 ± 0.024 µm2).Student’s t-test, **=p<0.01. Data expressed as mean ± SEM.C) Quantification of surface GluR1 cluster pixel intensity from the same neurons as B).control: 100% ± 10.02%, MyH7B siRNA pool: 71.86% ± 7.92%. Images were averaged andnormalized to control. Data expressed as mean percentage intensity of control neurons ±SEM. Student’s t-test, *=p<0.05.D) Quantification of total GluR1 cluster area from neurons co-transfected with eGFP andcontrol (n=5, 1.62 µm2 ± 0.27 µm2) or MyH7B siRNA pools (n=7, 1.98 µm2 ± 0.45 µm2).Data expressed as mean ± SEM.E) Quantification of total GluR1 cluster pixel intensity from the same neurons as D).Control: 100% ± 6.6%, MyH7B siRNA pool: 86.5% ± 8.7%. Images were averaged andnormalized to control. Data expressed as mean percentage intensity of control neurons ±SEM.
Rubio et al. Page 25
J Neurosci. Author manuscript; available in PMC 2011 July 26.
NIH
-PA Author Manuscript
NIH
-PA Author Manuscript
NIH
-PA Author Manuscript
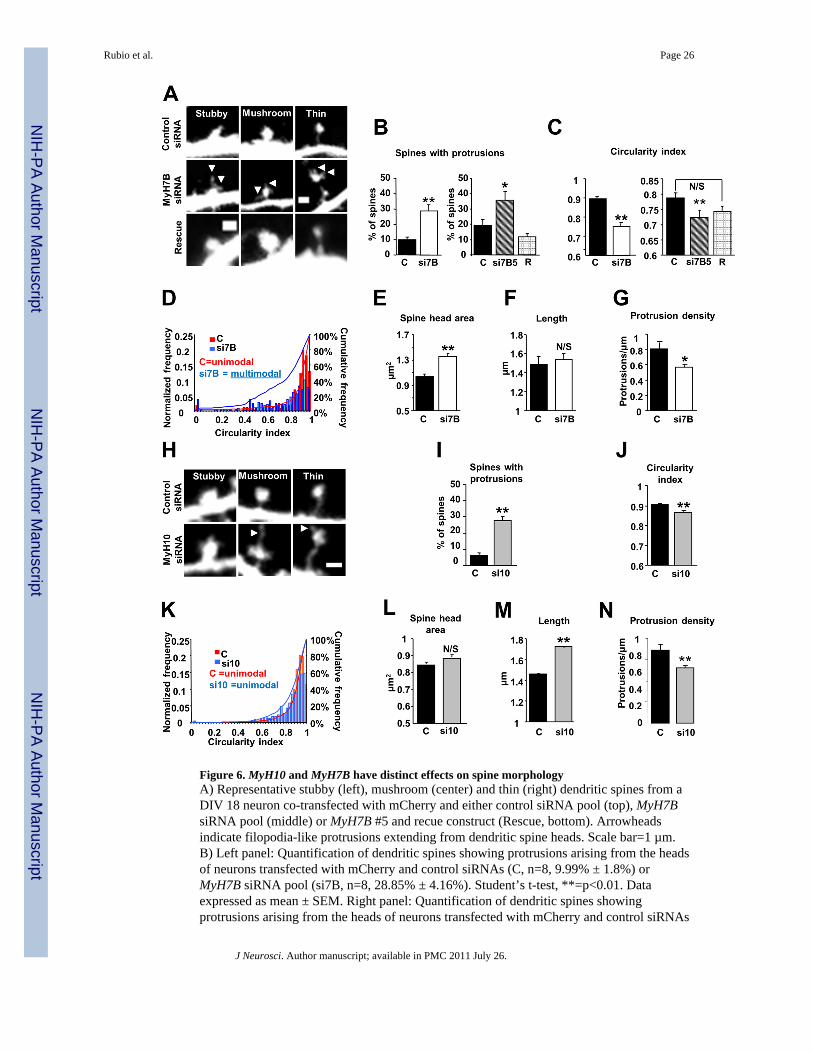
Figure 6. MyH10 and MyH7B have distinct effects on spine morphologyA) Representative stubby (left), mushroom (center) and thin (right) dendritic spines from aDIV 18 neuron co-transfected with mCherry and either control siRNA pool (top), MyH7BsiRNA pool (middle) or MyH7B #5 and recue construct (Rescue, bottom). Arrowheadsindicate filopodia-like protrusions extending from dendritic spine heads. Scale bar=1 µm.B) Left panel: Quantification of dendritic spines showing protrusions arising from the headsof neurons transfected with mCherry and control siRNAs (C, n=8, 9.99% ± 1.8%) orMyH7B siRNA pool (si7B, n=8, 28.85% ± 4.16%). Student’s t-test, **=p<0.01. Dataexpressed as mean ± SEM. Right panel: Quantification of dendritic spines showingprotrusions arising from the heads of neurons transfected with mCherry and control siRNAs
Rubio et al. Page 26
J Neurosci. Author manuscript; available in PMC 2011 July 26.
NIH
-PA Author Manuscript
NIH
-PA Author Manuscript
NIH
-PA Author Manuscript

(C, n=8, 19.24% ± 3.72%), MyH7B siRNA #5 (si7B5, n=8, 35.55% ± 6.09%) or GFP-MyH7B rescue construct (R, n=8, 12.01% ± 1.95%). One-way ANOVA followed byFisher’s LSD test, **=p<0.01. Data expressed as mean ± SEM.C) The dendritic spine head circularity index of the neurons shown in A) was measured todetermine the degree of irregularity of the dendritic spine heads for each group. Circularityindex= 4*pi*(area/perimeter2). Left panel: Circularity index of dendritic spine heads ofneurons expressing mCherry and control (C, n=8, CI: 0.89 ± 0.001) or a pool of MyH7BsiRNAs (si7B, n=7, CI: 0.75 ± 0.015). Student’s t-test, **=p<0.01. Data expressed as mean± SEM. Right panel: To test whether the effect of MyH7B knockdown on dendritic spineheads could be rescued, neurons transfected with mCherry and control siRNA pool (C, n=8,CI: 0.79 ± 0.01), MyH7B siRNA #5 (si7B5, n=8, CI: 0.72 ± 0.017) or MyH7B siRNA #5 andrescue construct (R, n=8, CI: 0.74 ± 0.22) were analyzed for dendritic spine head circularityindex. ANOVA followed by Fisher LSD, **=p<0.01, N/S= not significant. Data expressedas mean ± SEM.D) Frequency distribution, cumulative frequency and circularity index plot for DIV 18neurons co-transfected with mCherry and control siRNA pool (red) or MyH7B siRNA pool(blue). The frequency distribution was normalized to the total number of spines measured(control n=272 dendritic spines, siRNA MyH7B pool n=248 dendritic spines). Hartigan’s diptest: control=p<0.01=unimodal distribution, MyH7B=p>0.05, multimodal distribution.E) Quantification of dendritic spine head area in DIV18 hippocampal neurons co-transfectedwith mCherry and control siRNA pool (n=8, 1.04 µm2 ± 0.04 µm2) or MyH7B siRNA pool(n=8, 1.36 µm2 ± 0.05 µm2). Student’s t-test, **=p<0.01. Data expressed as mean ± SEM.F) Quantification of dendritic spine length from neurons expressing control (n=8, 1.49 µm ±0.08 µm) or MyH7B siRNAs (n=8, 1.54 µm ± 0.07 µm). Student’s t-test. N/S=notsignificant. Data expressed as mean ± SEM.G) Quantification of number of protrusions (dendritic spines + filopodia) per µm of dendriteof neurons co-transfected with mCherry and control siRNA (0.19 ± 0.04) or MyH7B siRNApool (0.24 ± 0.05). Student’s t-test, *=p<0.05. Data expressed as mean ± SEM.H) Representative images of DIV 18 neurons that were transfected with mCherry and eithercontrol siRNAs (top, n=11) or MyH10 siRNAs (bottom, n=12). Dendritic spines wereclassified into stubby, mushroom or thin following the same parameters as in A).Arrowheads indicate filopodia-like protrusions extending from dendritic spine heads. Scalebar=1µm.I) Quantification of dendritic spines showing protrusions arising from the heads of neuronstransfected with mCherry and control siRNAs (C, n=11, 6.5% ± 1.12%) or MyH10 siRNApool (si10, n=12, 27.89% ± 2.38%). Student’s t-test, **=p<0.01. Data expressed as mean ±SEM.J) Circularity index of dendritic spine heads from neurons described in H). Control: CI: 0.9± 0.006, MyH10 siRNA: CI: 0.87 ± 0.01. Student’s t- test, **=p<0.01. Data expressed asmean ± SEM.K) Frequency distribution, cumulative frequency and circularity index plot for of dendriticspine heads of neurons transfected with control or MyH10 siRNAs. The frequencydistribution was normalized to the total number of spines measured (control n=833, siRNAMyH10 n=752). Hartigan’s dip test: control=p<0.01=unimodal distribution,MyH10=p<0.05=unimodal distribution.L) Quantification of dendritic spine head area in neurons described in H) Control: 0.85 µm2
± 0.03 µm2, MyH10 siRNA pool 0.89 µm2 ± 0.04 µm2). Student’s t-test, N/S=notsignificant. Data expressed as mean ± SEM.M) Quantification of dendritic spine length from neurons transfected with control (1.46 µm± 0.005 µm) or MyH10 siRNAs (1.72 µm ± 0.005 µm). Student’s t- test, **=p<0.01. Dataexpressed as mean ± SEM.
Rubio et al. Page 27
J Neurosci. Author manuscript; available in PMC 2011 July 26.
NIH
-PA Author Manuscript
NIH
-PA Author Manuscript
NIH
-PA Author Manuscript

N) Quantification of number of protrusions per µm of dendrite of neurons co-transfectedwith mCherry and control (0.69 ± 0.05) or MyH10 siRNA pool (0.52 ± 0.03). Student’s t-test, **=p<0.01. Data expressed as mean ± SEM.
Rubio et al. Page 28
J Neurosci. Author manuscript; available in PMC 2011 July 26.
NIH
-PA Author Manuscript
NIH
-PA Author Manuscript
NIH
-PA Author Manuscript

Figure 7. MyH10 and MyH7B siRNAs show an additive effect on dendritic spine morphologyA) Representative images of DIV 18 neurons that were transfected with mCherry and eithercontrol siRNAs (top, n=7) or MyH10 + MyH7B siRNAs (bottom, n=7). Dendritic spineswere classified into stubby, mushroom or thin following the same parameters as in figure 7.Scale bar=5µm.B) Quantification of dendritic spines showing protrusions arising from the heads of neuronstransfected with mCherry and control siRNAs (C, 7.68% ± 2.02%) or MyH7B+MyH10siRNAs (si7B + si10, 18.19% ± 3.33%). Student’s t-test, *=p<0.05. Data expressed as mean± SEM.C) Circularity index of dendritic spine heads of neurons transfected with control (0.86 ±0.02) or MyH7B+MyH10 (0.75 ± 0.01) siRNAs. Student’s t- test, **=p<0.01. Dataexpressed as mean ± SEM.D) Frequency distribution, cumulative frequency and circularity index plot for of dendriticspine heads of neurons transfected with control or MyH7B+MyH10 siRNAs. The frequencydistribution was normalized to the total number of spines counted (control n=118, siRNAMyH7B n=75). Hartigan’s dip test: control=p<0.05=unimodal distribution,MyH10=p>0.05=multimodal distribution.
Rubio et al. Page 29
J Neurosci. Author manuscript; available in PMC 2011 July 26.
NIH
-PA Author Manuscript
NIH
-PA Author Manuscript
NIH
-PA Author Manuscript

E) Quantification of dendritic spine head area of neurons transfected with control (0.66 µm2
± 0.04 µm2) or MyH7B+MyH10 siRNAs (0.79 µm2 ± 0.09 µm2) Student’s t- test, N/S= notsignificant. Data expressed as mean ± SEM.F) Quantification of dendritic spine length from neurons transfected with control (1.04 µm ±0.04 µm) or MyH7B+MyH10 siRNAs (2.09 µm ± 0.03 µm). Student’s t- test. **=p<0.01.Data expressed as mean ± SEM.G) Quantification of number of protrusions per µm of dendrite of neurons co-transfectedwith mCherry and control (0.75 ± 0.09) or MyH7B and MyH10 siRNA pools (0.46 ± 0.06).Student’s t-test, *=p<0.05. Data expressed as mean ± SEM.
Rubio et al. Page 30
J Neurosci. Author manuscript; available in PMC 2011 July 26.
NIH
-PA Author Manuscript
NIH
-PA Author Manuscript
NIH
-PA Author Manuscript
Copyright © 2022 FDOKUMEN