Regional Studies Spatial Localization in Manufacturing: A Cross
22
This article was downloaded by: [Princeton University] On: 24 April 2014, At: 14:33 Publisher: Routledge Informa Ltd Registered in England and Wales Registered Number: 1072954 Registered office: Mortimer House, 37-41 Mortimer Street, London W1T 3JH, UK Regional Studies Publication details, including instructions for authors and subscription information: http://www.tandfonline.com/loi/cres20 Spatial Localization in Manufacturing: A Cross- Country Analysis Stefania Vitali ab , Mauro Napoletano cd & Giorgio Fagiolo d a ETH Zurich, Systemgestaltung KPL F 28, Kreuzplatz 5, CH-8032 Zurich, Switzerland b Dipartimento di Economia, Università Politecnica delle Marche, Piazzale Martelli, 8, I-60121 Ancona, Italy. Email: c OFCE and SKEMA Business School, (Batiment 2) 250 rue Albert Einstein, F-06560 Valbonne, France. Email: d Sant'Anna School of Advanced Studies, Piazza Martiri della Libertà, 33, I-56127 Pisa, Italy. Published online: 08 Dec 2011. To cite this article: Stefania Vitali, Mauro Napoletano & Giorgio Fagiolo (2013) Spatial Localization in Manufacturing: A Cross-Country Analysis, Regional Studies, 47:9, 1534-1554, DOI: 10.1080/00343404.2011.625006 To link to this article: http://dx.doi.org/10.1080/00343404.2011.625006 PLEASE SCROLL DOWN FOR ARTICLE Taylor & Francis makes every effort to ensure the accuracy of all the information (the “Content”) contained in the publications on our platform. However, Taylor & Francis, our agents, and our licensors make no representations or warranties whatsoever as to the accuracy, completeness, or suitability for any purpose of the Content. Any opinions and views expressed in this publication are the opinions and views of the authors, and are not the views of or endorsed by Taylor & Francis. The accuracy of the Content should not be relied upon and should be independently verified with primary sources of information. Taylor and Francis shall not be liable for any losses, actions, claims, proceedings, demands, costs, expenses, damages, and other liabilities whatsoever or howsoever caused arising directly or indirectly in connection with, in relation to or arising out of the use of the Content. This article may be used for research, teaching, and private study purposes. Any substantial or systematic reproduction, redistribution, reselling, loan, sub-licensing, systematic supply, or distribution in any form to anyone is expressly forbidden. Terms & Conditions of access and use can be found at http:// www.tandfonline.com/page/terms-and-conditions
-
Upload
khangminh22 -
Category
Documents
-
view
0 -
download
0
Transcript of Regional Studies Spatial Localization in Manufacturing: A Cross
This article was downloaded by: [Princeton University]On: 24 April 2014, At: 14:33Publisher: RoutledgeInforma Ltd Registered in England and Wales Registered Number: 1072954 Registered office: MortimerHouse, 37-41 Mortimer Street, London W1T 3JH, UK
Regional StudiesPublication details, including instructions for authors and subscription information:http://www.tandfonline.com/loi/cres20
Spatial Localization in Manufacturing: A Cross-Country AnalysisStefania Vitaliab, Mauro Napoletanocd & Giorgio Fagiolod
a ETH Zurich, Systemgestaltung KPL F 28, Kreuzplatz 5, CH-8032 Zurich, Switzerlandb Dipartimento di Economia, Università Politecnica delle Marche, Piazzale Martelli, 8,I-60121 Ancona, Italy. Email:c OFCE and SKEMA Business School, (Batiment 2) 250 rue Albert Einstein, F-06560Valbonne, France. Email:d Sant'Anna School of Advanced Studies, Piazza Martiri della Libertà, 33, I-56127 Pisa,Italy.Published online: 08 Dec 2011.
To cite this article: Stefania Vitali, Mauro Napoletano & Giorgio Fagiolo (2013) Spatial Localization in Manufacturing: ACross-Country Analysis, Regional Studies, 47:9, 1534-1554, DOI: 10.1080/00343404.2011.625006
To link to this article: http://dx.doi.org/10.1080/00343404.2011.625006
PLEASE SCROLL DOWN FOR ARTICLE
Taylor & Francis makes every effort to ensure the accuracy of all the information (the “Content”) containedin the publications on our platform. However, Taylor & Francis, our agents, and our licensors make norepresentations or warranties whatsoever as to the accuracy, completeness, or suitability for any purpose ofthe Content. Any opinions and views expressed in this publication are the opinions and views of the authors,and are not the views of or endorsed by Taylor & Francis. The accuracy of the Content should not be reliedupon and should be independently verified with primary sources of information. Taylor and Francis shallnot be liable for any losses, actions, claims, proceedings, demands, costs, expenses, damages, and otherliabilities whatsoever or howsoever caused arising directly or indirectly in connection with, in relation to orarising out of the use of the Content.
This article may be used for research, teaching, and private study purposes. Any substantial or systematicreproduction, redistribution, reselling, loan, sub-licensing, systematic supply, or distribution in anyform to anyone is expressly forbidden. Terms & Conditions of access and use can be found at http://www.tandfonline.com/page/terms-and-conditions
Spatial Localization in Manufacturing:A Cross-Country Analysis
STEFANIA VITALI*†, MAURO NAPOLETANO‡§ and GIORGIO FAGIOLO§*ETH Zurich, Systemgestaltung KPL F 28, Kreuzplatz 5, CH-8032 Zurich, Switzerland
†Dipartimento di Economia, Università Politecnica delle Marche, Piazzale Martelli, 8, I-60121 Ancona, Italy.Email: [email protected]
‡OFCE and SKEMA Business School, (Batiment 2) 250 rue Albert Einstein, F-06560 Valbonne, France.Email: [email protected]
§Sant’Anna School of Advanced Studies, Piazza Martiri della Libertà, 33, I-56127 Pisa, Italy. Email: [email protected]
(Received September 2009: in revised form September 2011)
VITALI S., NAPOLETANO M. and FAGIOLO G. Spatial localization in manufacturing: a cross-country analysis, Regional Studies. Thispaper employs a homogeneous-firm database to investigate industry localization in European countries. More specifically, it com-pares, across industries and countries, the predictions of two of the most popular localization indexes, that is, the Ellison and Glaeserindex of 1997 and the Duranton and Overman index of 2005. Independently from the index used, it is found that localization is apervasive phenomenon in all countries studied; and the degree of localization is very unevenly distributed across industries in eachcountry. Furthermore, it is shown that in all countries localized sectors are mainly ‘traditional’ sectors or, if one controls for countryindustrial structures, science-based sectors. Moreover, it is found that the two indexes significantly diverge in predicting the inten-sity of localization of the same industry both across and within countries. In turn, these differences point to the different role playedby pecuniary versus non-pecuniary externalities in driving firms’ location decisions.
Industry localization Manufacturing industries Localization indexes Spatial concentration Spatial correlationPecuniary externalities Non-pecuniary externalities Cross-country studies
VITALI S., NAPOLETANO M. and FAGIOLO G.制造业的空间定位:跨国分析,区域研究。本文采用同质的公司数据库考察了欧洲国家的产业本地化。更确切地说,本文比较了两大流行的本地化指标对各行业和国家的预测,即 1997 年的Ellison-Glaeser 指数与 2005 年的 Duranton-Overman 指数。在独立于上述指标的基础上研究发现,在所有被研究的国家中本 地化都是一个普遍存在的现象,且各产业的本地化程度不一。研究进一步指出,各国中本地化的多为传统
部门,或者是控制国家产业机构以及科技基础的行业。此外,研究表明,上述两种指标在预测同一产业在国家间以及国内本地化程度中存在显著分歧。这些分歧反映了资金与非资金外部性在企业选址决策中所发挥的不同作用。
工业本地化 制造业 本地化指标 空间集聚 空间相关性 资金外部性 非资金的外部性 跨国研究
VITALI S., NAPOLETANO M. et FAGIOLO G. La localisation géographique de l’industrie: une analyse transnationale, RegionalStudies. A partir d’une base de données auprès des entreprises homogènes, cet article cherche à examiner la localisation de l’industriedans les pays européens. Plus précisément, il fait une comparaison, à travers les industries et les pays, des prédictions de deux desindices de localisation les plus répandues, à savoir, l’indice Ellison–Glaeser qui date de 1997, et l’indice Duranton–Overton de2005. Quelle que soit l’indice employée, il s’avère que la localisation est un phénomène omniprésent dans les pays éudiés; etque l’importance de la localisation varie de façon irrégulière à travers les industries de chaque pays. Qui plus est, on démontreque dans tous les pays les secteurs localisés sont principalement des secteurs ‘traditionnels’, ou bien, si l’on tient compte des struc-tures industrielles d’un pays, les secteurs basés sur les sciences. De plus, il s’avère que les deux indices divergent sensiblement pour cequi est de la prédiction de l’intensité de la localisation de la même industrie, à la fois au-delà et au sein des pays. A leur tour, cesdifférences laissent indiquer le rôle joué par les effets pécuniers et non-pécuniers externes en tant que forces motrices de la prise dedécision des entreprises quant à la localisation.
Localisation de l’industrie Industries Indices de localisation Concentration géographique Corrélation géographiqueEffets externes pécuniers Effets externes non-pécuniers Études transnationales
VITALI S., NAPOLETANO M. und FAGIOLO G. Räumliche Lokalisation in der produzierenden Industrie: eine länderübergreifendeAnalyse, Regional Studies. In diesem Beitrag wird die Branchenlokalisation in europäischen Ländern mit Hilfe einer homogenenFirmendatenbank untersucht. Insbesondere werden die Prognosen von zwei der beliebtesten Lokalisationsindizes für verschiedeneBranchen und Länder miteinander verglichen: dem Ellison–Glaeser-Index von 1997 und dem Duranton–Overman-Index von2005. Unabhängig vom verwendeten Index stellt sich heraus, dass es sich bei der Lokalisation in sämtlichen untersuchten
Regional Studies, 2013
Vol. 47, No. 9, 1534–1554, http://dx.doi.org/10.1080/00343404.2011.625006
© 2013 Regional Studies Associationhttp://www.regionalstudies.org
Dow
nloa
ded
by [
Prin
ceto
n U
nive
rsity
] at
14:
33 2
4 A
pril
2014
Ländern um ein weit verbreitetes Phänomen handelt; das Ausmaß der Lokalisation ist in jedem Land unter den Branchen äußerstungleichmäßig verteilt. Darüber hinaus zeigt sich, dass es sich in allen Ländern bei den lokalisierten Sektoren in erster Linie um‘traditionelle’ Sektoren bzw. bei Berücksichtigung der jeweiligen Branchenstruktur des Landes um wissenschaftsbasierte Sektorenhandelt. Ebenso stellen wir fest, dass die beiden Indizes hinsichtlich der Prognose der Intensität der Lokalisation in derselbenBranche zwischen verschiedenen Ländern und innerhalb eines Landes signifikant divergieren. Diese Unterschiede weisen wie-derum auf die unterschiedliche Rolle der pekuniären und nicht-pekuniären Externalitäten als Faktoren für die Standortentschei-dungen von Firmen hin.
Branchenlokalisation Produzierende Industrie Lokalisationsindizes RäumlicheKonzentration RäumlicheKorrelationPekuniäre Externalitäten Nicht-pekuniäre Externalitäten Länderübergreifende Studien
VITALI S., NAPOLETANO M. y FAGIOLO G. Localización espacial en el sector manufacturero: un análisis entre países, RegionalStudies. En este artículo empleamos una base de datos homogénea para empresas con el objetivo de investigar la localización indus-trial en los países europeos. En concreto, comparamos las predicciones de dos de los índices de localización más conocidos – elíndice Ellison y Glaeser de 1997 y el índice Duranton y Overman de 2005 – para diferentes industrias y países. Independientementedel índice que se utilice, observamos que la localización es un fenómeno extendido en todos los países estudiados, y el grado delocalización está distribuido de modo muy desigual entre las industrias de cada país. Además, demostramos que en todos los paíseslos sectores localizados son principalmente los sectores ‘tradicionales’, o, si se tienen en cuenta las estructuras industriales del país, lossectores basados en la ciencia. Asimismo, observamos que los dos índices differen en gran medida a la hora de predecir la intensidadde la localización de la misma industria tanto entre países como dentro de cada uno de ellos. A su vez, estas diferencias señalan eldiferente papel desempeñado por los factores externos pecuniarios a diferencia de los no pecuniarios en cuanto a decidir la ubica-ción de las empresas.
Localización industrial Industrias manufactureras Índices de localización Concentración espacial Correlaciónespacial Factores externos pecuniarios Factores externos no pecuniarios Estudios entre países
JEL classifications: R3, R12
INTRODUCTION
This paper investigates the empirical location patterns ofmanufacturing industries in six European countries:Belgium, France, Germany, Italy, Spain and the UnitedKingdom.Drawing on a comprehensive source coveringdata on Europeanmanufacturing firms, it simultaneouslyperforms both a cross-country and a cross-sector analysisof industry spatial localization patterns by employing twoof themost popular localizationmeasures: the Ellison andGlaeser (E&G) index (ELLISON andGLAESER, 1997) andthe Duranton andOverman (D&O) index (DURANTON
and OVERMAN, 2005). The main goal is to provide acommon empirical framework where, thanks to the har-monized source of data employed, one might be able tocompare predictions of different indexes across differentEuropean countries in a homogeneous way. Indeed, asargued in more detail below, existing empirical studieson industry localization have almost entirely focused onstudying how different sectors were localized in a givencountry, according mainly to a single index. Results aretherefore hardly comparable, due to the inherent hetero-geneity in data collection and definitions of variables(for example, firm size).
The analysis of firms’ location has attracted the atten-tion of economists for a very long time (for example,MARSHALL, 1920). More recently, a relevant body oftheoretical research in the ‘New Economic Geography’literature (for example, KRUGMAN, 1991; FUJITA et al.,1999) has aimed at explaining what might be considered
the basic stylized fact of economic geography, that is,that firms look more clustered in space than anytheory of comparative advantage would predict. NewEconomic Geography emphasizes the role of increasingreturns, arising from various types of externalities relatedto the number of firms into an area, as a fundamentaldeterminant of industry agglomeration.
Beside these theoretical contributions, a good dealof empirical research has investigated localization inmanufacturing industries (among others, see ELLISON
and GLAESER, 1997; MAUREL and SÉDILLOT, 1999;BARRIOS et al., 2005; LAFOURCADE and MION,2006; and DURANTON and OVERMAN, 2005). Allthese works, mainly focusing on single countries,confirm the expectation that firms are generally clus-tered in space. However, they also find huge variabilityin the degree of localization across industrial sectors. Acommon characteristic of these studies is the use ofsome measures of the degree of firms’ clustering inspace (‘localization indexes’). Despite very similar meth-odological approaches, however, the literature has so farbeen quite heterogeneous in terms of the variety of themeasures employed (for a survey, see, for example,COMBES and OVERMAN, 2004).
To this end, the contributions in ELLISON andGLAESER (1997), DUMAIS et al. (2002), and MAUREL
and SÉDILLOT (1999) provide localization indexes thatsimultaneously: (1) control for the overall concentrationof manufacturing; (2) control for industry concentration,and (3) provide a null hypothesis against which to verify
Spatial Localization in Manufacturing 1535
Dow
nloa
ded
by [
Prin
ceto
n U
nive
rsity
] at
14:
33 2
4 A
pril
2014
the presence of localization. In particular, the index inELLISON and GLAESER (1997) tests the presence of local-ization driven by the combination of sector-specific spil-lovers and natural advantage of specific areas, against thenull hypothesis of localization driven by random firm-specific choices. These indexes represent key advancesin the measuring of localization. Nevertheless, by con-struction, they require an ex-ante partitioning of the geo-graphical space (for example, a country) into smaller units(for example, regions, departments). In other words,points on a map (corresponding to the location ofbusiness units) are transformed into units in ‘boxes’ (cf.DURANTON and OVERMAN, 2005; COMBES andOVERMAN, 2004). The division of the space into sub-units has the advantage of making the computational pro-blems involved in the measurement of localization easier.However, it also introduces possible biases in the analysis(the modifiable area unit problem [MAUP]; ARBIA,2001; and more recently, see LAFOURCADE andMION, 2007; and BRIANT et al., 2010).
First, comparisons among countries are difficult, asthe areas of spatial subunits may significantly varyacross different countries. Second, and relatedly, com-parisons become difficult also within countries acrossdifferent spatial scales (for example, departments versusregions). Finally, clusters of firms located at theborders of neighbouring regions and/or spanning overthe area covered by a single region are treated in thesame way as clusters in two very distant regions.More precisely, as pointed out by ARBIA (2001) andLAFOURCADE and MION (2006), indexes requiringthe division of the space into smaller units can onlycapture the ‘spatial concentration’ of industrial activityinto some areas. They cannot measure instead ‘trueagglomeration’, that is, the degree of spatial correlationin firms’ location choices. Localization indexes thattackle the foregoing problems are those proposed inMORAN (1950) and DURANTON and OVERMAN
(2005). In particular, the D&O index relies on theempirical distribution of distances across firms, com-puted by locating firms on the basis of their postalcodes. Moreover, postal codes are more detailed thanany alternative spatial breakdown, and are very compar-able across countries (for more on that, see the secondand third sections).
This paper is an attempt to improve upon the fore-going literature along two dimensions. First, it simul-taneously performs an investigation of industrylocalization in several European Union countries byexploiting a database of firms that is homogeneousacross European countries. In this respect, countries inthe European Union provide a natural arena to testthe implications of many New Economic Geographytheories. This is because decades of integration acrossEuropean countries have dramatically lowered tradeand transportation costs inside European countries.This should have spurred industry agglomerationprocesses largely independent from the physical
attributes of locations and driven instead by increasingreturns and externalities at the industry level(OTTAVIANO and THISSE, 2001; OTTAVIANO, 1999).On these grounds, one should expect a high numberof localized industries in European countries, despitethe different sizes of countries. Moreover, if localizationprocesses in European Union countries are mainlydriven by industry-specific forces, one should notexpect significant differences in the intensity of localiz-ation of the same industry across countries. So far theanswers to the above questions have been limited bythe availability of harmonized data at the firm level.This work can be therefore be considered a firstattempt to provide a broad analysis of agglomerationin the European Union based on firm-level data.
Second, this paper departs from the standard practiceof analysing localization employing a single index byperforming a comparative study of different localizationindexes (E&G and D&O) to estimate localization pat-terns. In particular, it compares the two indexes withrespect to their predictions about: (1) the number oflocalized sectors; (2) the intensity of industry localiz-ation forces; and (3) the types of localized sectors (ident-ified by using Pavitt taxonomy; PAVITT, 1984). Makingsuch a comparison is important because, as discussedabove, indexes typically differ in their treatment ofthe space. The choice of the index could thus induceserious distortions in the results due to the MAUP.Whether or not this problem significantly affects themeasurement of localization remains, however, anempirical question. One goal of this paper is preciselyto evaluate the biases introduced by the MAUP alongthree dimensions (pervasiveness, intensity of localizationforces and type of localized industries), and across Euro-pean countries having different sizes and spatial units(for similar remarks, see BRIANT et al., 2010). Findingthat some results about empirical localization patternsdo not differ between the two indexes is good newsin this respect because it suggests that differences inlocalization across sectors and/or countries are not spur-iously due to biases related to the MAUP, but theyrather reflect differences in localization forces. Giventhis objective, the choice about which indexes shouldbe compared is rather natural. Indeed, the E&G andD&O indexes lie at opposite extremes in the treatmentof geographical space. It turns out that comparisonacross the results they return is a very good test of thedistortions that the MAUP can introduce in the analysisof localization.1
Furthermore, there is another important dimensionalong which differences between the E&G and D&Oindexes can provide a contribution to empirical agglom-eration patterns. The E&G index is an unbiased estimateof localization resulting of natural advantages and sector-specific spillovers dependent on the number of firms in aparticular area. However, as argued at more length byOTTAVIANO and THISSE (2001) and OTTAVIANO andLAMORGESE (2003), the latter is an aggregate of
1536 Stefania Vitali et al.
Dow
nloa
ded
by [
Prin
ceto
n U
nive
rsity
] at
14:
33 2
4 A
pril
2014
different externalities, whose strength is highly depen-dent on spatial distance. ‘Pecuniary’ externalities, thatis, those that are the by-product of market relationships(for example, related to the existence of a large marketdemand, or the availability of the large labour supply),typically span their effects over large distances withrespect to ‘non-pecuniary’ externalities (for example,related to the existence of infrastructures, or to knowl-edge exchanges). It follows that non-pecuniary extern-alities are likely to introduce much stronger correlationin spatial location choices of firms. Since the latter is cap-tured by the D&O index, one can interpret similaritiesand differences in results across the two indexes forthe same industry as reflecting higher strengths of,respectively, pecuniary and non-pecuniary externalitiesin generating localization patterns.
Previous attempts in the same direction can be foundin the work of BARRIOS et al. (2005); LAFOURCADE
and MION (2006), and FORNAHL and BRENNER
(2009). However, differently from these, the presentpaper considers a larger number of (size-heterogeneous)countries. Furthermore, to account for spatial features ofthe data, it employs the D&O index rather than theMoran index (MORAN, 1950). This choice has beenmade because, as discussed at more length by ARBIA
(2001), the Moran index cannot entirely capture theobserved variability in spatial permutations. Indeed, itrequires an ex-ante partition of space (these points willbe discussed in the third section).
The results do not reject the hypothesis that Euro-pean Union countries are characterized by significantlevels of spatial localization in their manufacturingindustries. Indeed shares of localization sectors are veryhigh in most countries analysed. Moreover, the charac-teristics of industry agglomeration (intensity, type ofindustry) are invariant across countries when one con-siders the overall manufacturing industry and broad cat-egories of industries. In contrast, national specificitiesemerge at more disaggregated levels of analysis (that is,at four-digit industries). Furthermore, the analysissuggests that in all six countries localized industries aremainly ‘traditional’ ones (jewellery, wine, textiles,etc.), as well as those where scale economies are impor-tant. This outcome mainly reflects the composition ofcountries’ industrial structures, generally skewedtoward traditional and scale-intensive sectors. Onceone controls for such a factor, it is found that science-based industries become those where localization ismore pervasive.
How much are the above results dependent on theindex used, and therefore on the treatment of geo-graphical space? First, the analysis shows that spatial dis-aggregation does not matter in making predictionsabout the pervasiveness of industry localization, bothconsidering aggregate manufacturing as well as broadcategories of sectors. In contrast, the treatment ofspace becomes very important when analysing theintensity of agglomeration. In particular, employing
ex-ante space partitions (NUTS-3 in the work) intro-duces spurious cross-country differences in averagelocalization intensity. Indeed, country differences aresignificant when the E&G index is applied but notwhen the D&O index is used.
The paper is organized as follows. The second sectionpresents the database used in the analysis. The thirdsection describes the localization indexes employed. Itbegins with the E&G index and then moves to theD&O index. The fourth section is devoted to the pres-entation and discussion of the results on the empiricalanalysis of localization in European Union countries.The fifth section concludes. Finally, the Appendix con-tains a robustness analysis of the results discussed in thepaper, with particular emphasis on the possible biasesdue to using firms rather than plants as the object ofthe analysis.
DATA
The empirical analysis below is based on three differentdata sources. The data on firms are from the Orbisdataset of the Bureau van Dijk, 2006 release (cf.http://www.bvdep.com/en/ORBIS). From this exten-sive dataset information about location (that is, postalcodes), employment and industrial classification offirms in six European countries for the period 2004–2006 have been extracted. All information is availableat the firm level and is derived from companies’annual reports.
The countries chosen for the analysis are Belgium,France, Germany, Italy, Spain and the UK. Thesecountries were selected partly out of choice and partlyout of necessity. On the one hand, we wanted tofocus on those countries that have already been theobject of single-country studies in the relevant literature.In addition to US-focused research (ELLISON andGLAESER, 1997; ROSENTHAL and STRANGE, 2001;HOLMES and STEVENS, 2002; KIM, 1995), existing con-tributions have been studying industry localization pat-terns in the UK (DEVEREUX et al., 2004; DURANTON
and OVERMAN, 2005), Belgium (BERTINELLI andDECROP, 2005), France (MAUREL and SÉDILLOT,1999), Italy (LAFOURCADE and MION, 2006),Germany (BRENNER, 2006), and Ireland and Portugal(BARRIOS et al., 2005). For a review, see COMBES andOVERMAN (2004). On the other hand, we were con-strained by data availability. Indeed, both the ORBISand the databases used for geographical coordinates(see below) cover more countries than those employedin this analysis. However, for some countries data onfirm size and postal codes were available only for avery small number of sectors. In other countries, dataon firm size and postal codes were available, but dataon geographical coordinates (needed to compute theD&O index) were of poor quality. Only for thecountries in the sample enough data were collected ongeographical coordinates, firm size, and postal codes
Spatial Localization in Manufacturing 1537
Dow
nloa
ded
by [
Prin
ceto
n U
nive
rsity
] at
14:
33 2
4 A
pril
2014
needed to compute both the E&G and D&O indexesfor a sufficiently high number of sectors.
Firm-level data other than localization are availablefor more years. Unfortunately, the last available yeardiffers among countries. More precisely, there are datauntil 2005 for Belgium, France, Italy and the UK;until 2004 for Spain; and until 2006 for Germany.Notice that information on firm localization onlyrefers to the last available year. In order to keep asmany countries as possible in the analysis, and to besure that localization data are synchronized with otherfirm-specific variables, data were employed only forthe last available year in the database. This, of course,prevents a proper cross-section analysis from being per-formed, but this is not expected to be a source of impor-tant bias to the analysis. Indeed, given the relativelyshort time span covered by the database, only a smallfraction of all firms is going to change their locations.Similarly, sectors are not very likely to change theirindustrial structure dramatically.
The analysis is limited to manufacturing industries asdefined by the NACE (Nomenclature générale des acti-vités économiques dans les Communautés Européennes)classification (NACE Rev. 1 section D). More specifi-cally, following DURANTON and OVERMAN (2005),the analysis is restricted to sectors with more than tenfirms. This allows sectors to be excluded where localiz-ation is the result of location choices by a few firms and,therefore, to focus on clustering phenomena where local-ization forces attract a significant bunch of firms.
To identify spatial subunits, the NUTS classificationis applied (cf. http://www.ec.europa.eu/eurostat/ramon/nuts). NUTS (Nomenclature des Unités Terri-toriales Statistiques) is a hierarchical classification atfive levels (three regional and two local), extensivelyused for comparative statistics among Europeancountries. In line with previous studies (for example,MAUREL and SÉDILLOT, 1999; BERTINELLI andDECROP, 2005) NUTS-3 regions are used. Firms arethen assigned to each subunit on the basis of theirpostal codes. The data needed to map NUTS-3 postalcodes come from the European Commission Database(‘Regional Indicator and Geographical InformationUnit’ database).
Since one of the two indexes employed in the analysis(the D&O index, cf. the third section) requires the identi-fication of the longitude–latitude coordinates of firms inspace, data from the ‘TeleAtlas Multinet Europe’ database(cf. http://www.teleatlas.com) are also employed. Moreprecisely, this database provides the spatial coordinates ofthe contour of the areas corresponding to postal codes inthe sample. Each firm is then assigned coordinatescoinciding with the centroid of each postal code area.
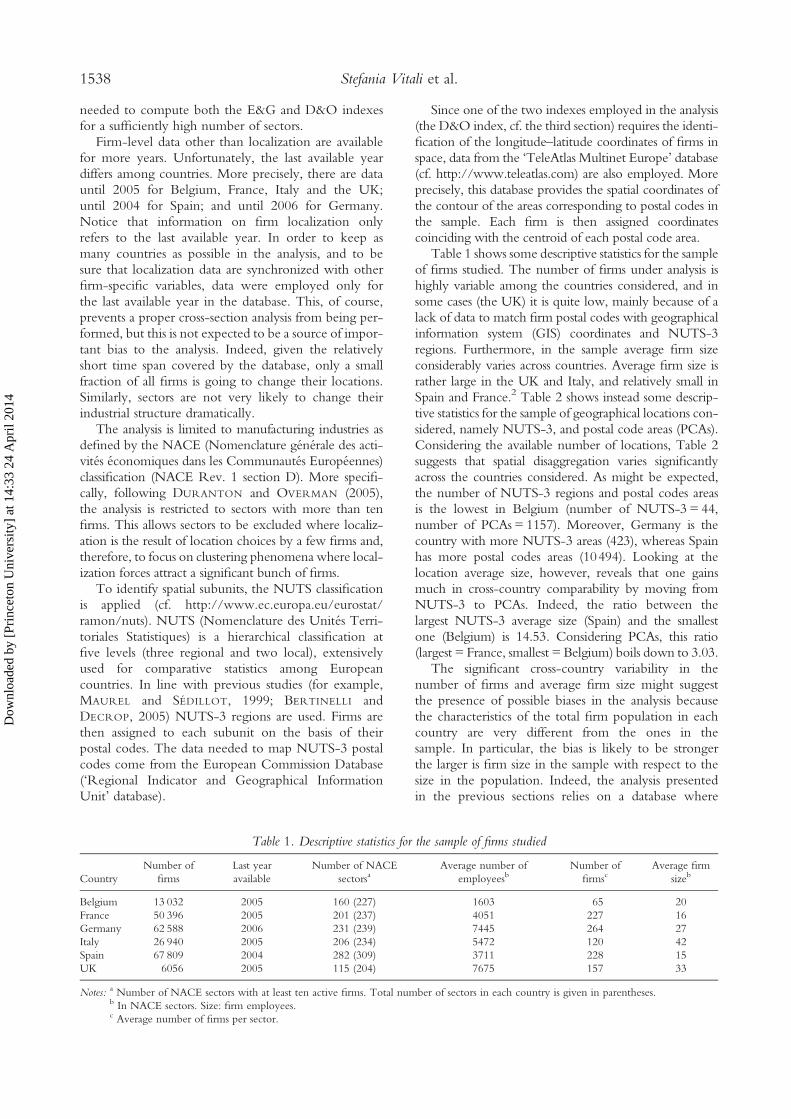
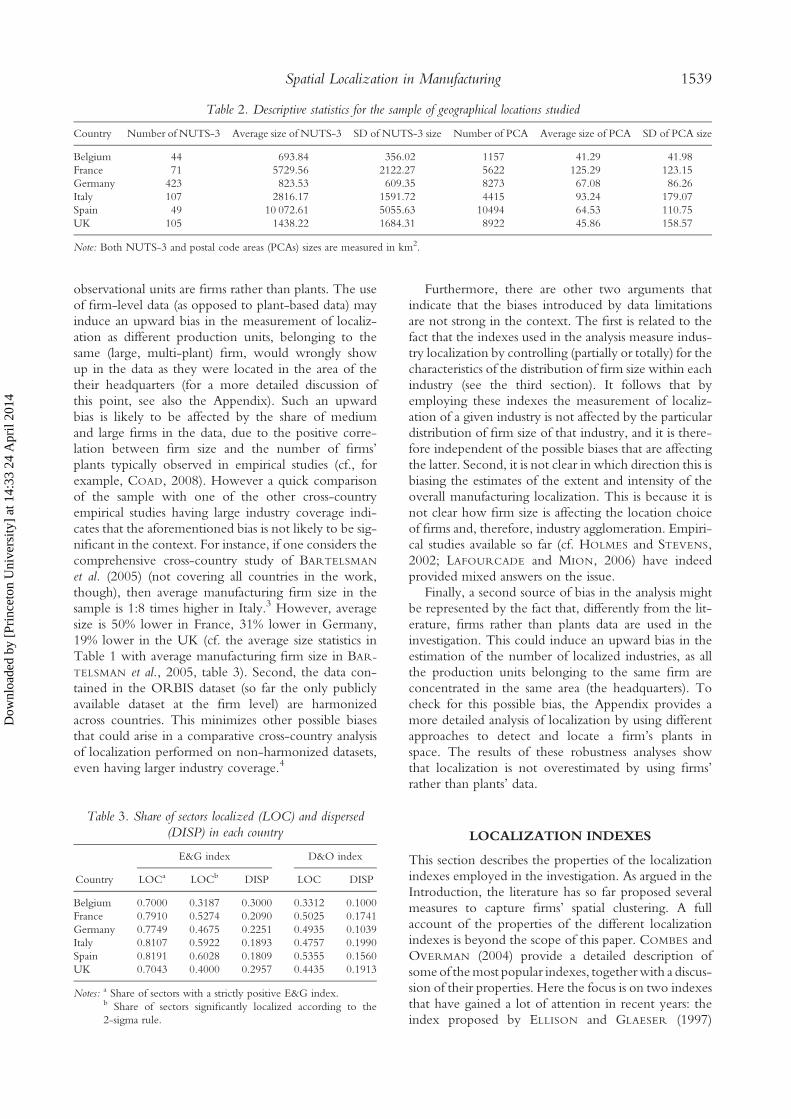
Table 1 shows some descriptive statistics for the sampleof firms studied. The number of firms under analysis ishighly variable among the countries considered, and insome cases (the UK) it is quite low, mainly because of alack of data to match firm postal codes with geographicalinformation system (GIS) coordinates and NUTS-3regions. Furthermore, in the sample average firm sizeconsiderably varies across countries. Average firm size israther large in the UK and Italy, and relatively small inSpain and France.2 Table 2 shows instead some descrip-tive statistics for the sample of geographical locations con-sidered, namely NUTS-3, and postal code areas (PCAs).Considering the available number of locations, Table 2suggests that spatial disaggregation varies significantlyacross the countries considered. As might be expected,the number of NUTS-3 regions and postal codes areasis the lowest in Belgium (number of NUTS-3 = 44,number of PCAs = 1157). Moreover, Germany is thecountry with more NUTS-3 areas (423), whereas Spainhas more postal codes areas (10494). Looking at thelocation average size, however, reveals that one gainsmuch in cross-country comparability by moving fromNUTS-3 to PCAs. Indeed, the ratio between thelargest NUTS-3 average size (Spain) and the smallestone (Belgium) is 14.53. Considering PCAs, this ratio(largest = France, smallest = Belgium) boils down to 3.03.
The significant cross-country variability in thenumber of firms and average firm size might suggestthe presence of possible biases in the analysis becausethe characteristics of the total firm population in eachcountry are very different from the ones in thesample. In particular, the bias is likely to be strongerthe larger is firm size in the sample with respect to thesize in the population. Indeed, the analysis presentedin the previous sections relies on a database where
Table 1. Descriptive statistics for the sample of firms studied
CountryNumber of
firmsLast yearavailable
Number of NACEsectorsa
Average number ofemployeesb
Number offirmsc
Average firmsizeb
Belgium 13 032 2005 160 (227) 1603 65 20France 50 396 2005 201 (237) 4051 227 16Germany 62 588 2006 231 (239) 7445 264 27Italy 26 940 2005 206 (234) 5472 120 42Spain 67 809 2004 282 (309) 3711 228 15UK 6056 2005 115 (204) 7675 157 33
Notes: a Number of NACE sectors with at least ten active firms. Total number of sectors in each country is given in parentheses.b In NACE sectors. Size: firm employees.c Average number of firms per sector.
1538 Stefania Vitali et al.
Dow
nloa
ded
by [
Prin
ceto
n U
nive
rsity
] at
14:
33 2
4 A
pril
2014
observational units are firms rather than plants. The useof firm-level data (as opposed to plant-based data) mayinduce an upward bias in the measurement of localiz-ation as different production units, belonging to thesame (large, multi-plant) firm, would wrongly showup in the data as they were located in the area of thetheir headquarters (for a more detailed discussion ofthis point, see also the Appendix). Such an upwardbias is likely to be affected by the share of mediumand large firms in the data, due to the positive corre-lation between firm size and the number of firms’plants typically observed in empirical studies (cf., forexample, COAD, 2008). However a quick comparisonof the sample with one of the other cross-countryempirical studies having large industry coverage indi-cates that the aforementioned bias is not likely to be sig-nificant in the context. For instance, if one considers thecomprehensive cross-country study of BARTELSMAN
et al. (2005) (not covering all countries in the work,though), then average manufacturing firm size in thesample is 1:8 times higher in Italy.3 However, averagesize is 50% lower in France, 31% lower in Germany,19% lower in the UK (cf. the average size statistics inTable 1 with average manufacturing firm size in BAR-
TELSMAN et al., 2005, table 3). Second, the data con-tained in the ORBIS dataset (so far the only publiclyavailable dataset at the firm level) are harmonizedacross countries. This minimizes other possible biasesthat could arise in a comparative cross-country analysisof localization performed on non-harmonized datasets,even having larger industry coverage.4
Furthermore, there are other two arguments thatindicate that the biases introduced by data limitationsare not strong in the context. The first is related to thefact that the indexes used in the analysis measure indus-try localization by controlling (partially or totally) for thecharacteristics of the distribution of firm size within eachindustry (see the third section). It follows that byemploying these indexes the measurement of localiz-ation of a given industry is not affected by the particulardistribution of firm size of that industry, and it is there-fore independent of the possible biases that are affectingthe latter. Second, it is not clear in which direction this isbiasing the estimates of the extent and intensity of theoverall manufacturing localization. This is because it isnot clear how firm size is affecting the location choiceof firms and, therefore, industry agglomeration. Empiri-cal studies available so far (cf. HOLMES and STEVENS,2002; LAFOURCADE and MION, 2006) have indeedprovided mixed answers on the issue.
Finally, a second source of bias in the analysis mightbe represented by the fact that, differently from the lit-erature, firms rather than plants data are used in theinvestigation. This could induce an upward bias in theestimation of the number of localized industries, as allthe production units belonging to the same firm areconcentrated in the same area (the headquarters). Tocheck for this possible bias, the Appendix provides amore detailed analysis of localization by using differentapproaches to detect and locate a firm’s plants inspace. The results of these robustness analyses showthat localization is not overestimated by using firms’rather than plants’ data.
LOCALIZATION INDEXES
This section describes the properties of the localizationindexes employed in the investigation. As argued in theIntroduction, the literature has so far proposed severalmeasures to capture firms’ spatial clustering. A fullaccount of the properties of the different localizationindexes is beyond the scope of this paper. COMBES andOVERMAN (2004) provide a detailed description ofsome of themost popular indexes, togetherwith a discus-sion of their properties. Here the focus is on two indexesthat have gained a lot of attention in recent years: theindex proposed by ELLISON and GLAESER (1997)
Table 2. Descriptive statistics for the sample of geographical locations studied
Country Number of NUTS-3 Average size of NUTS-3 SD of NUTS-3 size Number of PCA Average size of PCA SD of PCA size
Belgium 44 693.84 356.02 1157 41.29 41.98France 71 5729.56 2122.27 5622 125.29 123.15Germany 423 823.53 609.35 8273 67.08 86.26Italy 107 2816.17 1591.72 4415 93.24 179.07Spain 49 10 072.61 5055.63 10494 64.53 110.75UK 105 1438.22 1684.31 8922 45.86 158.57
Note: Both NUTS-3 and postal code areas (PCAs) sizes are measured in km2.
Table 3. Share of sectors localized (LOC) and dispersed(DISP) in each country
E&G index D&O index
Country LOCa LOCb DISP LOC DISP
Belgium 0.7000 0.3187 0.3000 0.3312 0.1000France 0.7910 0.5274 0.2090 0.5025 0.1741Germany 0.7749 0.4675 0.2251 0.4935 0.1039Italy 0.8107 0.5922 0.1893 0.4757 0.1990Spain 0.8191 0.6028 0.1809 0.5355 0.1560UK 0.7043 0.4000 0.2957 0.4435 0.1913
Notes: a Share of sectors with a strictly positive E&G index.b Share of sectors significantly localized according to the2-sigma rule.
Spatial Localization in Manufacturing 1539
Dow
nloa
ded
by [
Prin
ceto
n U
nive
rsity
] at
14:
33 2
4 A
pril
2014
(E&G index) and that introduced by DURANTON andOVERMAN (2005) (D&O index). Both indexes presentsolutions to problems affecting older measures of localiz-ation. However, they markedly differ in their approachto geographical space and in the type of localizationphenomena they can capture.
The Ellison and Glaeser index
The E&G index proposed by ELLISON and GLAESER
(1997) is based on a probabilistic model of locationchoice, where each business unit (plant or firm)sequentially chooses its location. More precisely, thejth business unit chooses its location in such a way tomaximize its profits pij from locating in area i. Inturn, profits pij are determined by cross-sectoral homo-geneous ‘natural advantages’ attached to area i, bysector-specific spillovers created by business units thathave previously chosen that location and, finally, by arandom factor idiosyncratic to the jth business unit(ELLISON and GLAESER, 1997; MAUREL and SÈDIL-
LOT, 1999).On the basis of this model of location choice,
ELLISON and GLAESER (1997) derive an index γn,measuring the propensity of firms in industry n toco-locate in space:
gn = Gn − 1−∑i x
2i
( )Hn
1−Hn( ) 1− Six2i( ) (1)
where Gn is the ‘raw-concentration index’:
Gn =∑i
si − xi( )2 2)
In equations (1) and (2) si is the share of industry’semployment in area i; and xi is the share of aggregatemanufacturing employment in area i. The term Hn isthe Herfindahl index of industry concentration:
Hn =∑j
z2j
where z is the share of employment of the jth firm in theindustry.
The E&G index has many interesting properties, ascompared with other indexes proposed in the literature.First, similarly to the measure proposed by KRUGMAN
(1991), it controls for the overall tendency of manufac-turing to localize in space (for example, spatial concen-tration due to difference in population across areas), ascaptured by the term:
1 −∑i
x2i
However – differently from earlier statistics – the E&Gindex also measures localization in excess of what is
predicted by industry concentration. Indeed, the Her-findahl index directly enters in equation (1) to re-scalethe raw index Gn. Finally, ELLLISON and GLAESER
(1997) show that if agents take their location decisionsaccording to the model outlined at the beginning ofthe section, then the index in equation (1) is an unbiasedestimate of the following relation:
gn = gna + gs − gna gs (3)
where γna and γs parametrize, respectively, the impor-tance of natural advantages and spillovers in drivinglocation choices of the business units. The aboverelation implies two fundamental properties of theE&G index. First, the value of the index can be directlyinterpreted as reflecting the (non-linear) combination oflocalization forces due to natural advantage and spil-lovers. Second, it provides a null hypothesis againstwhich to evaluate the degree of localization of an indus-try. Indeed, a value of the index equal to zero impliesthat the effect of natural advantage and spillovers onlocation choices is null. This corresponds to the caseof ‘random location’: observed localization is in thiscase entirely due to the effect of the random idiosyn-cratic factors. This in turn implies that industries charac-terized by a positive E&G value display ‘excess’localization, as compared with what would be predictedby the overall localization of manufacturing and byindustry localization. The observed localization is thusdriven by the combined effect of natural advantagesand firm spillovers. Conversely, industries with excessspatial dispersion will exhibit a negative E&G value.The E&G index has received a lot of attention in theliterature, and it is still considered as a sort of benchmarkagainst which other indexes should be compared (for avery recent attempt in the same direction in thepresent paper, see also BRIANT et al., 2010). At thesame time, this index has also some importantweaknesses, some of which may introduce seriousbiases in the measurement of empirical localizationpatterns.
One of the major drawbacks of the E&G index is thelack of a statistical procedure to measure significantly thedegree of excess localization (or dispersion) of an indus-try. To solve such a problem partially ELLISON andGLAESER (1997) proposed some threshold values tointerpret and classify positive values of γn. Accordingto their criterion, an industry is not very localizedwhen γn< 0.02. Moreover, it is very localized ifγn > 0.5. These thresholds were chosen by the authorsvia a heuristic procedure based on their application onUS data and are somewhat arbitrary.
Other contributions using the E&G index haveinstead relied on more rigorous criteria to evaluate thestatistical significance of γn’s values. In particular, a pro-cedure based on a standard ‘2-sigma rule’ has been pro-posed (for example, ROSENTHAL and STRANGE, 2001;
1540 Stefania Vitali et al.
Dow
nloa
ded
by [
Prin
ceto
n U
nive
rsity
] at
14:
33 2
4 A
pril
2014
DEVEREUX et al., 2004; BARRIOS et al., 2005). Sinceunder the null hypothesis of random location γn= 0and:
E(Gn) =(1−
∑i
x2i)Hn
an industry will be significantly localized (dispersed)whenever the difference between the empirical valueof the raw concentration index Gn and its expectedvalue
1−(∑
i
x2i)Hn
is twice larger (smaller) than the standard deviation σGof the raw concentration index (cf. ELLISON andGLAESER, 1997):
sG =
�����������������������������������������2{H2[∑
ix2i − 2
∑ix3i + (∑
ix2i )2]
−∑jz4j [
∑ix2i − 4
∑ix3i + 3(∑
ix2i )2]}
√√√√√√ (4)
Note that country- and industry-specific terms enterthe expression of both the expected value and the stan-dard deviation of the raw index Gn. This makes the‘2-sigma rule’ criterion more suitable to account forcountry and industry specificities in the analysis. Inwhat follows, such a criterion will be used to evaluatethe statistical significance of localization (or dispersion)of an industry.
The Duranton and Overman index
The E&G index is based on an exogenous division of thegeographical space into subunits. Space partitions havethe advantage of alleviating the computational problemsinvolved in the measurement of industry localization.Indeed, measuring the propensity of firms to co-locatein space boils down to calculating the concentration ofindustrial activity into m> 1 areas (for example, regions,departments). Unfortunately, the division of the spaceinto subunits has also several disadvantages (groupedunder the MAUP label). First, it is not a-priori clearwhat is the optimal spatial breakdown at which firm clus-tering should be measured. For example, one coulddecide to compute the index considering counties,regions or different NUTS layers. In addition, thenumber of locations and their average size can display sig-nificant cross-country heterogeneity even at same level ofspatial breakdown (see Table 2 and the discussion at theend of the second section). All this undermines compari-son, both cross-country and across different disaggrega-tion levels (for a discussion of this point see alsoROSENTHAL and STRANGE, 2001; and DEVEREUX
et al., 2004). Second, as argued at more length by
ARBIA (2001), the very computation of cumulativeshares of economic activity concentrated in spatial sub-units implies disregarding the spatial nature of the data.Indeed, indexes based on cumulative shares (such as theE&G index) are generally invariant to any spatial permu-tation of the subunits under investigation. However,having the bulk of industrial economic activity splitamong two distant regions is totally different from split-ting it in two neighbouring areas. Moreover, by focusingon the total activity in one or more regions, one can onlyinvestigate spatial concentration, that is, the uneven distri-bution of industry activities across regions. One cannotinstead evaluate how industry activities are spatially dis-tributed in the region (or across two neighbouringareas). This means disregarding ‘true agglomeration’,that is, the degree of spatial correlation in firms’ locationdecisions (ARBIA, 2001; LAFOURCADE and MION,2006; DURANTON and OVERMAN, 2005; BRIANT
et al., 2010). Accounting for the degree of spatial corre-lation might also be helpful when disentangling theimportance of different types of externalities in the gen-eration of localization patterns. Indeed, the E&G indexis an unbiased estimate of agglomeration, resulting ofnatural advantages and sector-specific spillovers depen-dent on the number of firms in a particular area.However, as argued at more length by OTTAVIANO
and THISSE (2001) and OTTAVIANO and LAMORGESE
(2003), the latter is an aggregate of different externalities,whose strength is highly dependent on spatial distance.‘Pecuniary’ externalities, that is, those that are the by-product of market relationships (for example, related tothe existence of a large market demand, or the availabilityof a large labour supply), typically diffuse over large dis-tances with respect to ‘non-pecuniary’ externalities (forexample, related to the existence of infrastructures or toknowledge exchanges). It follows that technologicalexternalities are likely to introduce much stronger corre-lation in the spatial location choices of firms than pecuni-ary externalities.
Two indexes that account for spatial correlation infirms’ location decisions are those proposed by MORAN
(1950) and DURANTON and OVERMAN (2005). TheMoran index still requires the computation of the levelof economic activity into predetermined areas and doesnot solve all the space-related problems describedabove (ARBIA, 2001).5 In light of these considerations,this paper has preferred to focus on the D&O index asthe only alternative to the E&G index that accounts forthe spatial features of the data. Indeed, the D&O indexinvolves the computation of distances across PCAs,therefore it seems better equipped to deal with thecharacteristics of the spatial distribution of firms intoindustries. Moreover, PCAs are much more detailedthan any other spatial breakdown. In addition, they aremuch more comparable across countries (cf. Table 2and the end of the second section).
To compute the D&O index, Euclidean distancesmust be built between pairs of economic units (plants
Spatial Localization in Manufacturing 1541
Dow
nloa
ded
by [
Prin
ceto
n U
nive
rsity
] at
14:
33 2
4 A
pril
2014
or firms) in each industry by employing their actualposition in geographical space. Geographic positioningis identified by firms’ postal codes. If the number offirms is M, the number of unique bilateral distances isM (M − 1)/2. The density of distances can then be esti-mated by using the (Gaussian) kernel function:
K(d) = 1M (M − 1)b
∑M−1
h=1
∑Mj=h+1
fd − dhj
b
( )(5)
where dhj is the distance between firms h and j; b is thebandwidth; and f is the (Gaussian) kernel function. Alldistances are computed in kilometers.6
Obviously, studying the distribution of kernel den-sities alone does not give information about whetheror not a sector is localized. To solve this problem, theD&O index allows for a rigorous statistical test of indus-try localization to be made. The test involves the com-parison of the empirical density to artificially generateddistributions based on the random location of firms inspace. Note that this procedure also controls for industryconcentration. Indeed, if the industry were only charac-terized by an uneven distribution of market shares, thenits spatial density would not be statistically different fromthe one generated by the random re-location of firms inspace.
In what follows, the section then bootstraps 1000samples generated by randomly allocating the positionof firms in a given sector over the whole populationof locations occupied by firms in manufacturing. Itthen builds global confidence bands. Each confidenceband is built in such a way that no more than the 95%of the random distribution lies outside the intervalbetween the upper and the lower global confidencebands at several target distances.7 For an industry n,the index of (global) localization (A) and (global) dis-persion (Δ) are given by:
An(d) = Kn(d) − Kn (6)
Dn(d) = Kn≈ −Kn(d) if
∑dAn(d) = 0
0 otherwise
{(7)
where Kn is the upper confidence band in industry I;
while Kn≈
is the lower confidence band.The measurement of localization without an ex-ante
partition of geographical space is a key strength of theD&O index, but it can also represent an importantdrawback. Indeed, data to compute geographical coor-dinates are often not easily accessible and barely availableat a very detailed level.
RESULTS
This section presents the results of the analysis on thespatial distribution of firms in manufacturing industries.It begins by investigating the extent of localization in thecountries analysed. In other words, it studies whetherthe number of industries where firms co-locate is signifi-cant in the country under analysis. In addition, it studieswhether the fraction of localized industries displayscross-country variation. Furthermore, it investigateshow strong localization is. Indeed, the value returnedby each localization index captures the strength of local-ization forces into an industry (see the third section). It isthen worthwhile analysing whether the intensity ofthose forces is heterogeneous across countries andsectors. Finally, it carries out a detailed analysis of thesectoral composition of localized industries to checkwhich kinds of industries are more often localized.
In all the investigations below, the results producedby the two localization indexes employed (E&G andD&O) are compared. As discussed in the third section,these indexes markedly differ in their approach to themeasurement of localization. Thus, as suggested byARBIA (2001), the comparison between the results ofthe two indexes may help to detect the biases intro-duced by the MAUP in the analysis. Moreover, as indi-cated by OTTAVIANO and THISSE (2001) andOTTAVIANO and LAMORGESE (2003), different pecuni-ary and technological externalities induce differentdegrees of spatial correlation in firms’ location decision.Since the spatial correlation is captured by the D&Oindex but not by the E&G index, the comparisonbetween the two indexes helps in identifying the differ-ent role of the above-mentioned externalities in gener-ating localization patterns.
How many industries are localized?
This subsection starts by assessing how many industriesare localized in each country considered. Table 3shows the fraction of sectors localized and dispersedusing, respectively, the E&G and D&O indexes. Ingeneral, localization emerges as a widespread phenom-enon in all countries. The share of industries forwhich the value of the E&G index is strictly positiveturns out to be very high in all countries considered(Table 3, column 1). This result is consistent with pre-vious studies in the literature (for example, DEVEREUX
et al., 2004; MAUREL and SÉDILLOT, 1999; LAFOUR-
CADE and MION, 2006). However, the fraction of loca-lized industries reduces considerably when one appliesthe 2-sigma rule to evaluate the statistical significanceof localization. For instance, the fraction is reduced bymore than 50% in Belgium (from 0.70 to 0.32),whereas in Spain and Italy 60% of all sectors stilldisplay localization after the application of the stricterrule. The fraction of sectors displaying excess dispersionis very low in all countries considered. Finally, none of
1542 Stefania Vitali et al.
Dow
nloa
ded
by [
Prin
ceto
n U
nive
rsity
] at
14:
33 2
4 A
pril
2014
the sectors studied was significantly dispersed accordingto the 2-sigma rule criterion. Turning to the D&Oindex, it is found that in all countries except Belgiumthe share of localized sectors is around 50%. Overall,the figures are lower than those obtained by consideringsectors with a positive value of the E&G index. A similarresult for the UK has already been emphasized by DUR-
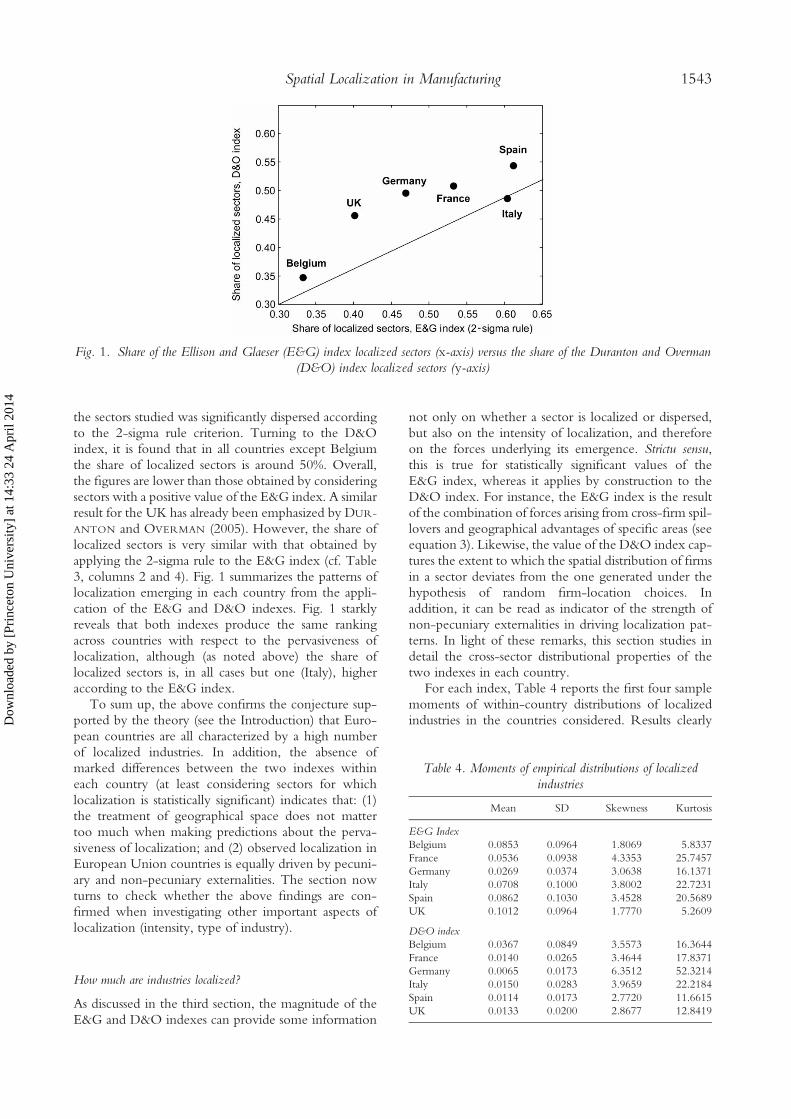
ANTON and OVERMAN (2005). However, the share oflocalized sectors is very similar with that obtained byapplying the 2-sigma rule to the E&G index (cf. Table3, columns 2 and 4). Fig. 1 summarizes the patterns oflocalization emerging in each country from the appli-cation of the E&G and D&O indexes. Fig. 1 starklyreveals that both indexes produce the same rankingacross countries with respect to the pervasiveness oflocalization, although (as noted above) the share oflocalized sectors is, in all cases but one (Italy), higheraccording to the E&G index.
To sum up, the above confirms the conjecture sup-ported by the theory (see the Introduction) that Euro-pean countries are all characterized by a high numberof localized industries. In addition, the absence ofmarked differences between the two indexes withineach country (at least considering sectors for whichlocalization is statistically significant) indicates that: (1)the treatment of geographical space does not mattertoo much when making predictions about the perva-siveness of localization; and (2) observed localization inEuropean Union countries is equally driven by pecuni-ary and non-pecuniary externalities. The section nowturns to check whether the above findings are con-firmed when investigating other important aspects oflocalization (intensity, type of industry).
How much are industries localized?
As discussed in the third section, the magnitude of theE&G and D&O indexes can provide some information
not only on whether a sector is localized or dispersed,but also on the intensity of localization, and thereforeon the forces underlying its emergence. Strictu sensu,this is true for statistically significant values of theE&G index, whereas it applies by construction to theD&O index. For instance, the E&G index is the resultof the combination of forces arising from cross-firm spil-lovers and geographical advantages of specific areas (seeequation 3). Likewise, the value of the D&O index cap-tures the extent to which the spatial distribution of firmsin a sector deviates from the one generated under thehypothesis of random firm-location choices. Inaddition, it can be read as indicator of the strength ofnon-pecuniary externalities in driving localization pat-terns. In light of these remarks, this section studies indetail the cross-sector distributional properties of thetwo indexes in each country.
For each index, Table 4 reports the first four samplemoments of within-country distributions of localizedindustries in the countries considered. Results clearly
Fig. 1. Share of the Ellison and Glaeser (E&G) index localized sectors (x-axis) versus the share of the Duranton and Overman(D&O) index localized sectors (y-axis)
Table 4. Moments of empirical distributions of localizedindustries
Mean SD Skewness Kurtosis
E&G IndexBelgium 0.0853 0.0964 1.8069 5.8337France 0.0536 0.0938 4.3353 25.7457Germany 0.0269 0.0374 3.0638 16.1371Italy 0.0708 0.1000 3.8002 22.7231Spain 0.0862 0.1030 3.4528 20.5689UK 0.1012 0.0964 1.7770 5.2609
D&O indexBelgium 0.0367 0.0849 3.5573 16.3644France 0.0140 0.0265 3.4644 17.8371Germany 0.0065 0.0173 6.3512 52.3214Italy 0.0150 0.0283 3.9659 22.2184Spain 0.0114 0.0173 2.7720 11.6615UK 0.0133 0.0200 2.8677 12.8419
Spatial Localization in Manufacturing 1543
Dow
nloa
ded
by [
Prin
ceto
n U
nive
rsity
] at
14:
33 2
4 A
pril
2014
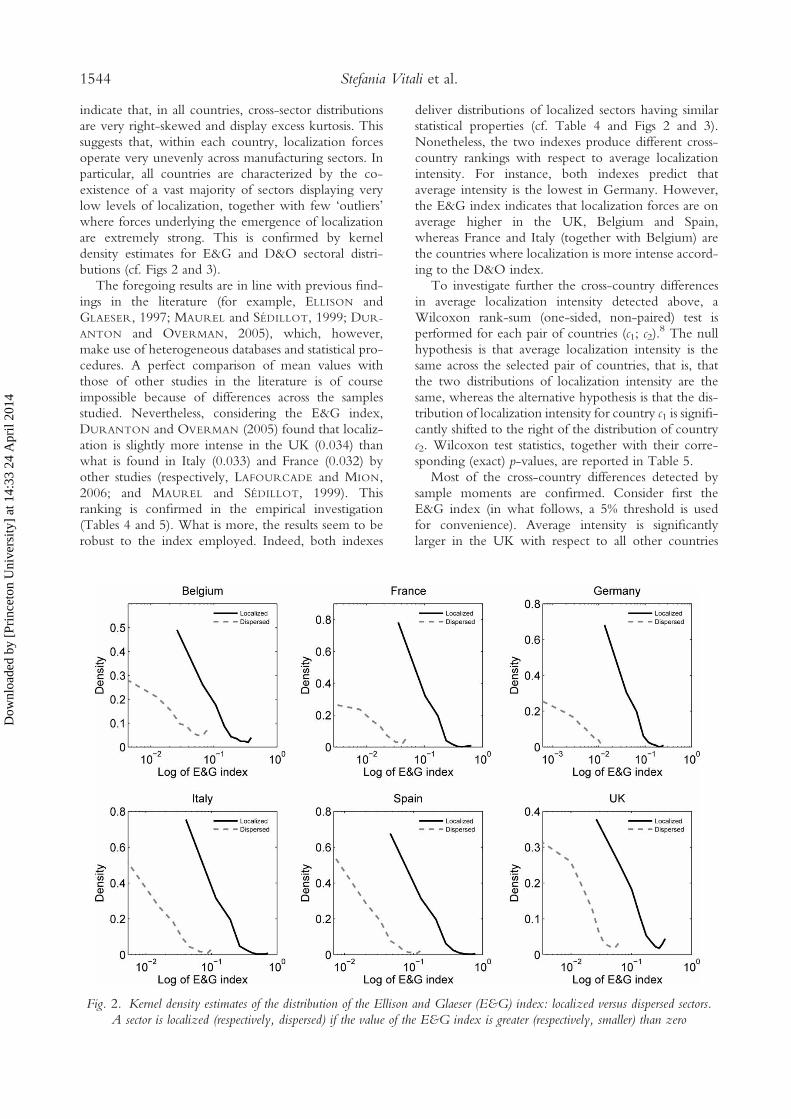
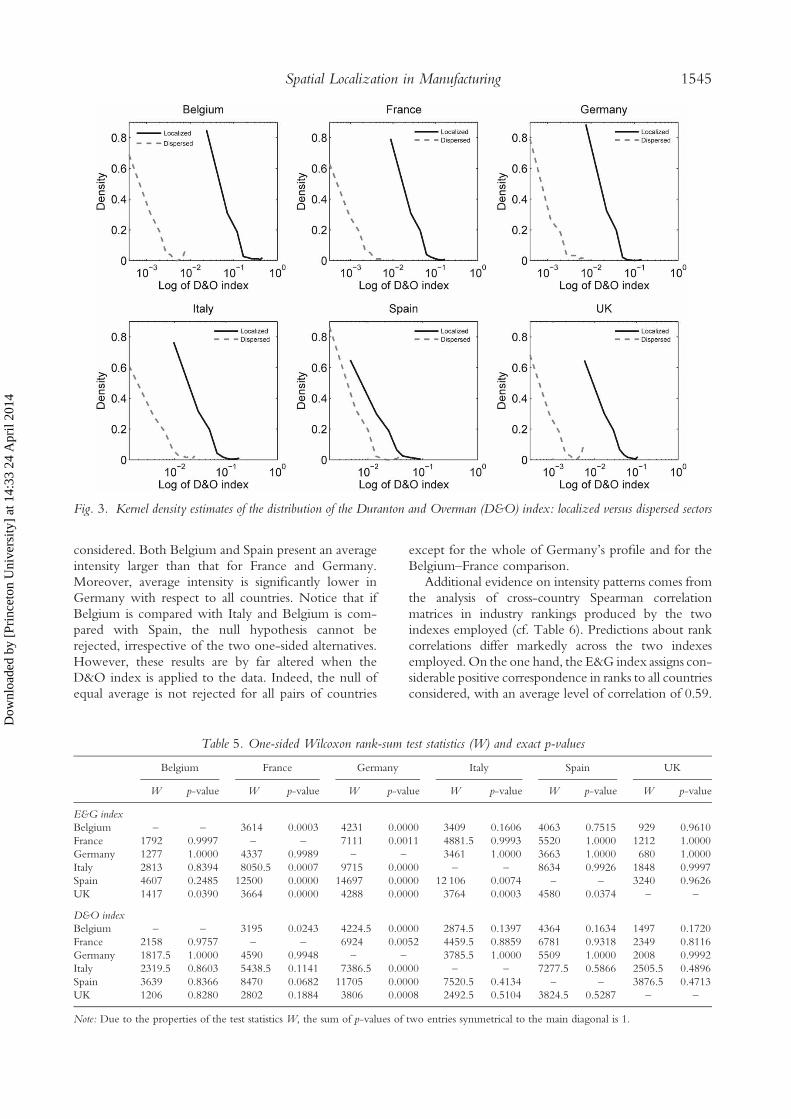
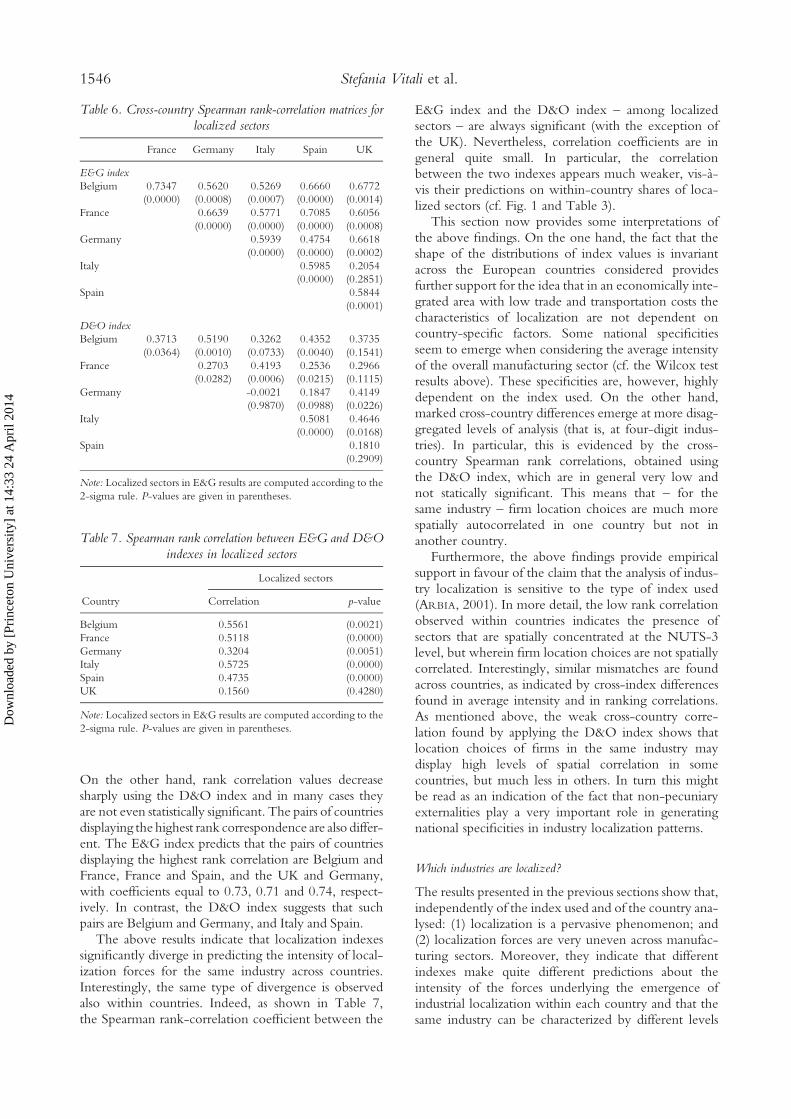
indicate that, in all countries, cross-sector distributionsare very right-skewed and display excess kurtosis. Thissuggests that, within each country, localization forcesoperate very unevenly across manufacturing sectors. Inparticular, all countries are characterized by the co-existence of a vast majority of sectors displaying verylow levels of localization, together with few ‘outliers’where forces underlying the emergence of localizationare extremely strong. This is confirmed by kerneldensity estimates for E&G and D&O sectoral distri-butions (cf. Figs 2 and 3).
The foregoing results are in line with previous find-ings in the literature (for example, ELLISON andGLAESER, 1997; MAUREL and SÉDILLOT, 1999; DUR-
ANTON and OVERMAN, 2005), which, however,make use of heterogeneous databases and statistical pro-cedures. A perfect comparison of mean values withthose of other studies in the literature is of courseimpossible because of differences across the samplesstudied. Nevertheless, considering the E&G index,DURANTON and OVERMAN (2005) found that localiz-ation is slightly more intense in the UK (0.034) thanwhat is found in Italy (0.033) and France (0.032) byother studies (respectively, LAFOURCADE and MION,2006; and MAUREL and SÉDILLOT, 1999). Thisranking is confirmed in the empirical investigation(Tables 4 and 5). What is more, the results seem to berobust to the index employed. Indeed, both indexes
deliver distributions of localized sectors having similarstatistical properties (cf. Table 4 and Figs 2 and 3).Nonetheless, the two indexes produce different cross-country rankings with respect to average localizationintensity. For instance, both indexes predict thataverage intensity is the lowest in Germany. However,the E&G index indicates that localization forces are onaverage higher in the UK, Belgium and Spain,whereas France and Italy (together with Belgium) arethe countries where localization is more intense accord-ing to the D&O index.
To investigate further the cross-country differencesin average localization intensity detected above, aWilcoxon rank-sum (one-sided, non-paired) test isperformed for each pair of countries (c1; c2).
8 The nullhypothesis is that average localization intensity is thesame across the selected pair of countries, that is, thatthe two distributions of localization intensity are thesame, whereas the alternative hypothesis is that the dis-tribution of localization intensity for country c1 is signifi-cantly shifted to the right of the distribution of countryc2. Wilcoxon test statistics, together with their corre-sponding (exact) p-values, are reported in Table 5.
Most of the cross-country differences detected bysample moments are confirmed. Consider first theE&G index (in what follows, a 5% threshold is usedfor convenience). Average intensity is significantlylarger in the UK with respect to all other countries
Fig. 2. Kernel density estimates of the distribution of the Ellison and Glaeser (E&G) index: localized versus dispersed sectors.A sector is localized (respectively, dispersed) if the value of the E&G index is greater (respectively, smaller) than zero
1544 Stefania Vitali et al.
Dow
nloa
ded
by [
Prin
ceto
n U
nive
rsity
] at
14:
33 2
4 A
pril
2014
considered. Both Belgium and Spain present an averageintensity larger than that for France and Germany.Moreover, average intensity is significantly lower inGermany with respect to all countries. Notice that ifBelgium is compared with Italy and Belgium is com-pared with Spain, the null hypothesis cannot berejected, irrespective of the two one-sided alternatives.However, these results are by far altered when theD&O index is applied to the data. Indeed, the null ofequal average is not rejected for all pairs of countries
except for the whole of Germany’s profile and for theBelgium–France comparison.
Additional evidence on intensity patterns comes fromthe analysis of cross-country Spearman correlationmatrices in industry rankings produced by the twoindexes employed (cf. Table 6). Predictions about rankcorrelations differ markedly across the two indexesemployed. On the one hand, the E&G index assigns con-siderable positive correspondence in ranks to all countriesconsidered, with an average level of correlation of 0.59.
Fig. 3. Kernel density estimates of the distribution of the Duranton and Overman (D&O) index: localized versus dispersed sectors
Table 5. One-sided Wilcoxon rank-sum test statistics (W) and exact p-values
Belgium France Germany Italy Spain UK
W p-value W p-value W p-value W p-value W p-value W p-value
E&G indexBelgium – – 3614 0.0003 4231 0.0000 3409 0.1606 4063 0.7515 929 0.9610France 1792 0.9997 – – 7111 0.0011 4881.5 0.9993 5520 1.0000 1212 1.0000Germany 1277 1.0000 4337 0.9989 – – 3461 1.0000 3663 1.0000 680 1.0000Italy 2813 0.8394 8050.5 0.0007 9715 0.0000 – – 8634 0.9926 1848 0.9997Spain 4607 0.2485 12500 0.0000 14697 0.0000 12 106 0.0074 – – 3240 0.9626UK 1417 0.0390 3664 0.0000 4288 0.0000 3764 0.0003 4580 0.0374 – –
D&O indexBelgium – – 3195 0.0243 4224.5 0.0000 2874.5 0.1397 4364 0.1634 1497 0.1720France 2158 0.9757 – – 6924 0.0052 4459.5 0.8859 6781 0.9318 2349 0.8116Germany 1817.5 1.0000 4590 0.9948 – – 3785.5 1.0000 5509 1.0000 2008 0.9992Italy 2319.5 0.8603 5438.5 0.1141 7386.5 0.0000 – – 7277.5 0.5866 2505.5 0.4896Spain 3639 0.8366 8470 0.0682 11705 0.0000 7520.5 0.4134 – – 3876.5 0.4713UK 1206 0.8280 2802 0.1884 3806 0.0008 2492.5 0.5104 3824.5 0.5287 – –
Note: Due to the properties of the test statistics W, the sum of p-values of two entries symmetrical to the main diagonal is 1.
Spatial Localization in Manufacturing 1545
Dow
nloa
ded
by [
Prin
ceto
n U
nive
rsity
] at
14:
33 2
4 A
pril
2014
On the other hand, rank correlation values decreasesharply using the D&O index and in many cases theyare not even statistically significant. The pairs of countriesdisplaying the highest rank correspondence are also differ-ent. The E&G index predicts that the pairs of countriesdisplaying the highest rank correlation are Belgium andFrance, France and Spain, and the UK and Germany,with coefficients equal to 0.73, 0.71 and 0.74, respect-ively. In contrast, the D&O index suggests that suchpairs are Belgium and Germany, and Italy and Spain.
The above results indicate that localization indexessignificantly diverge in predicting the intensity of local-ization forces for the same industry across countries.Interestingly, the same type of divergence is observedalso within countries. Indeed, as shown in Table 7,the Spearman rank-correlation coefficient between the
E&G index and the D&O index – among localizedsectors – are always significant (with the exception ofthe UK). Nevertheless, correlation coefficients are ingeneral quite small. In particular, the correlationbetween the two indexes appears much weaker, vis-à-vis their predictions on within-country shares of loca-lized sectors (cf. Fig. 1 and Table 3).
This section now provides some interpretations ofthe above findings. On the one hand, the fact that theshape of the distributions of index values is invariantacross the European countries considered providesfurther support for the idea that in an economically inte-grated area with low trade and transportation costs thecharacteristics of localization are not dependent oncountry-specific factors. Some national specificitiesseem to emerge when considering the average intensityof the overall manufacturing sector (cf. the Wilcox testresults above). These specificities are, however, highlydependent on the index used. On the other hand,marked cross-country differences emerge at more disag-gregated levels of analysis (that is, at four-digit indus-tries). In particular, this is evidenced by the cross-country Spearman rank correlations, obtained usingthe D&O index, which are in general very low andnot statically significant. This means that – for thesame industry – firm location choices are much morespatially autocorrelated in one country but not inanother country.
Furthermore, the above findings provide empiricalsupport in favour of the claim that the analysis of indus-try localization is sensitive to the type of index used(ARBIA, 2001). In more detail, the low rank correlationobserved within countries indicates the presence ofsectors that are spatially concentrated at the NUTS-3level, but wherein firm location choices are not spatiallycorrelated. Interestingly, similar mismatches are foundacross countries, as indicated by cross-index differencesfound in average intensity and in ranking correlations.As mentioned above, the weak cross-country corre-lation found by applying the D&O index shows thatlocation choices of firms in the same industry maydisplay high levels of spatial correlation in somecountries, but much less in others. In turn this mightbe read as an indication of the fact that non-pecuniaryexternalities play a very important role in generatingnational specificities in industry localization patterns.
Which industries are localized?
The results presented in the previous sections show that,independently of the index used and of the country ana-lysed: (1) localization is a pervasive phenomenon; and(2) localization forces are very uneven across manufac-turing sectors. Moreover, they indicate that differentindexes make quite different predictions about theintensity of the forces underlying the emergence ofindustrial localization within each country and that thesame industry can be characterized by different levels
Table 7. Spearman rank correlation between E&G and D&Oindexes in localized sectors
Localized sectors
Country Correlation p-value
Belgium 0.5561 (0.0021)France 0.5118 (0.0000)Germany 0.3204 (0.0051)Italy 0.5725 (0.0000)Spain 0.4735 (0.0000)UK 0.1560 (0.4280)
Note: Localized sectors in E&G results are computed according to the2-sigma rule. P-values are given in parentheses.
Table 6. Cross-country Spearman rank-correlation matrices forlocalized sectors
France Germany Italy Spain UK
E&G indexBelgium 0.7347 0.5620 0.5269 0.6660 0.6772
(0.0000) (0.0008) (0.0007) (0.0000) (0.0014)France 0.6639 0.5771 0.7085 0.6056
(0.0000) (0.0000) (0.0000) (0.0008)Germany 0.5939 0.4754 0.6618
(0.0000) (0.0000) (0.0002)Italy 0.5985 0.2054
(0.0000) (0.2851)Spain 0.5844
(0.0001)
D&O indexBelgium 0.3713 0.5190 0.3262 0.4352 0.3735
(0.0364) (0.0010) (0.0733) (0.0040) (0.1541)France 0.2703 0.4193 0.2536 0.2966
(0.0282) (0.0006) (0.0215) (0.1115)Germany -0.0021 0.1847 0.4149
(0.9870) (0.0988) (0.0226)Italy 0.5081 0.4646
(0.0000) (0.0168)Spain 0.1810
(0.2909)
Note: Localized sectors in E&G results are computed according to the2-sigma rule. P-values are given in parentheses.
1546 Stefania Vitali et al.
Dow
nloa
ded
by [
Prin
ceto
n U
nive
rsity
] at
14:
33 2
4 A
pril
2014
of spatial correlation in firms’ location decision acrossdifferent countries. This section completes the analysisof the characteristics of industry localization by investi-gating the composition of the type of localized industriesin the countries considered.
It begins by looking at how much groups of localizedindustries are similar across countries. Despite similarshares (cf. Table 3), countries could indeed be verydifferent in terms of the composition of the group oflocalized sectors (for example, due to different industrialstructures). It therefore begins by computing the share ofsectors in common between pairs of countries (Table 8).The fraction of localized sectors across countries is ingeneral large for each index, especially for the E&Gindex. On average, countries share, respectively, 68%and 64% of the localized sectors according to E&Gand D&O indexes. In some cases, ratios go up to 75%.In particular, Spain shares the major number of clusteredsectors with other countries.
But which are the most localized sectors in eachcountry? As shown in Tables 9–14, in each countrythe most localized sectors include, to a great extent, tra-ditional industries such as jewellery, wine and textiles.Moreover, Tables 9–14 reveal the presence of a relevantcross-country variability in localized industries. None-theless, it is possible to detect the presence of a ‘core’of localized sectors that is invariant across countries.More precisely, considering the E&G index, thirteenindustries appear in the list of localized sectors in allcountries considered, while this number reduces toeight if the D&O index is considered. Among thesesectors, four are in common between the two indexesand belong to the publishing and printing sectorgroup (NACE 2211, 2213, 2215 and 2222).9
In order to interpret these results better, a cross-sectoral investigation of all localized industries wasperformed by employing a taxonomy that classifiesindustries in macro-groups composed of sectors with
relatively homogeneous characteristics. More specifi-cally, Pavitt’s taxonomy (PAVITT, 1984) is employedhere. It is one of the first (and most widely used) classi-fication frameworks proposed in the industrial organiz-ation literature. Pavitt’s taxonomy classifies industries incategories by considering different indicators, which
Table 8. Share of localized sectors in common between pairs ofcountries
France Germany Italy Spain UK
E&G indexBelgium 0.6863 0.6275 0.7451 0.8235 0.4130France 0.6226 0.6887 0.7547 0.5870Germany 0.6019 0.7778 0.5870Italy 0.7869 0.6304Spain 0.8696
D&O indexBelgium 0.6038 0.6981 0.5849 0.7925 0.3137France 0.6535 0.6429 0.8119 0.5882Germany 0.6633 0.7168 0.5882Italy 0.7959 0.5098Spain 0.7059
Note: Localized sectors in E&G results are computed according to the2-sigma rule. Shares are computed dividing the number of localizedindustries in common between each pair of countries by the mini-mum number of localized sectors between the two countries.
Table 9. Ten most localized NACE four-digit manufacturingsectors: Belgium
E&G index D&O index
NACE Sector NACE Sector
1724 Silk-type weaving 1724 Silk-type weaving3622 Manufacturing of
jewellery1714 Preparation and
spinning offlax-type fibres
2626 Manufacturing ofrefractoryceramic products
1721 Cotton-type weaving
2954 Manufacturing ofmachineryfor textile
1751 Manufacturing ofcarpets and rugs
1772 Manufacturing ofknitted andcrocheted pullovers
1725 Other textile weaving
3511 Building and repairingof ships
3622 Manufacturing ofjewellery
1751 Manufacturing of car-pets and rugs
2954 Manufacturing ofmachinery fortextile
2913 Manufacturing of tapsand valves
1772 Manufacturing ofknitted andcrocheted pullovers
2462 Manufacturing of gluesand gelatines
2213 Publishing of journalsand periodicals
1725 Other textile weaving 2211 Publishing of books
Table 10. Ten most localized NACE four-digit manufacturingsectors: France
E&G index D&O index
NACE Sector NACE Sector
2861 Manufacturing ofcutlery
1715 Throwing andpreparation of silk
3350 Manufacturing ofwatches and clocks
1724 Silk-type weaving
2211 Publishing of books 2861 Manufacturing ofcutlery
2214 Publishing of soundrecordings
2411 Manufacturing ofindustrial gases
1715 Throwing and prep-aration of silk
2214 Publishing of soundrecordings
2320 Manufacturing of pet-roleum products
1725 Other textile weaving
2213 Publishing of journalsand periodicals
2211 Publishing of books
2461 Manufacturing ofexplosives
1713 Preparation andspinning of fibers
1593 Manufacturing ofwines
2213 Publishing of journalsand periodicals
3661 Manufacturing of imi-tation jewellery
2231 Reproduction ofsound recording
Spatial Localization in Manufacturing 1547
Dow
nloa
ded
by [
Prin
ceto
n U
nive
rsity
] at
14:
33 2
4 A
pril
2014
account for their technological characteristics (forexample, internal versus external sources of the inno-vation process; product/process innovation; degree ofappropriability of innovations, etc.), but also for other
Table 12. Ten most localized NACE four-digit manufacturingsectors: Italy
E&G index D&O index
NACE Sector NACE Sector
1722 Woollen-type weaving 1722 Woollen-typeweaving
1724 Silk-type weaving 1724 Silk-type weaving2213 Publishing of journals
and periodicals1713 Preparation and spin-
ning of fibres2622 Manufacturing of
ceramic sanitaryfixtures
2731 Cold drawing
2630 Manufacturing ofceramic tilesand flags
2955 Manufacturing ofmachineryfor paper
3541 Manufacturing ofmotorcycles
1725 Other textile weaving
1910 Tanning and dressing ofleather
2913 Manufacturing of tapsand valves
2411 Manufacturing ofindustrial gases
1910 Tanning and dressingof leather
3661 Manufacturing of imi-tation jewellery
1721 Cotton-type weaving
1771 Manufacturing ofhosiery
1771 Manufacturing ofhosiery
Table 11. Ten most localized NACE four-digit manufacturingsectors: Germany
E&G index D&O index
NACE Sector NACE Sector
2861 Manufacturing ofcutlery
2861 Manufacturing ofcutlery
3613 Manufacturing ofother kitchenfurniture
2732 Cold rolling ofnarrow strips
2732 Cold rolling ofnarrow strips
1593 Manufacturing ofwines
3622 Manufacturing ofjewelery
2214 Publishing of soundrecordings
2411 Manufacturing ofindustrial gases
2840 Forging, pressing,stamping and rollforming of metal
1543 Manufacture of mar-garine and fats
3622 Manufacturing ofjewellery
1717 Preparation andspinning of othertextile fibres
3350 Manufacturing ofwatches and clocks
3661 Manufacturing of imi-tation jewellery
2215 Other publishing
2511 Manufacturing ofrubber tires andtubes
2225 Ancillary activitiesrelated to printing
2741 Precious metalsproduction
1772 Manufacturing ofknitted and cro-cheted pullovers
Table 13. Ten most localized NACE four-digit manufacturingsectors: Spain
E&G index D&O index
NACE Sector NACE Sector
2630 Manufacturing of cer-amic tiles and flags
1760 Manufacturing ofknitted andcrocheted fabrics
1594 Manufacturing of ciderand other fruitwines
1715 Throwing andpreparation of silk
2624 Manufacturing ofothertechnical ceramicproducts
2954 Manufacturing ofmachineryfor textile
1930 Manufacturing offootwear
1713 Preparation and spin-ning of worsted-type fibres
3630 Manufacturing ofmusical instruments
1723 Worsted-type weaving
1713 Preparation andspinning ofworsted-type fibres
1717 Preparation and spin-ning of other textilefibres
1723 Worsted-type weaving 1721 Cotton-type weaving1717 Preparation and spin-
ning of other textilefibres
1712 Preparation and spin-ning of woollen-type fibres
2052 Manufacturing ofarticles of cork
1722 Woolen-type weaving
3650 Manufacturing ofgames and toys
1711 Preparation and spin-ning of cotton-typefibres
Table 14. Ten most localized NACE four-digit manufacturingsectors: UK
E&G index D&O index
NACE Sector NACE Sector
3511 Building and repair-ing of ships
2221 Printing of newspapers
2625 Manufacturing ofother ceramicproducts
2213 Publishing of journalsand periodicals
2954 Manufacture ofmachinery fortextile etc
2211 Publishing of books
3650 Manufacturing ofgames and toys
2840 Forging, pressing,stamping of metal
1712 Preparation andspinning ofwoollen-typefibres
3622 Manufacturing ofjewellery
2221 Printing of newspa-pers beverages
2415 Manufacturing offertilizers and nitro-gen compounds
1591 Manufacturing ofdistilled potablealcoholic
2320 Manufacturing ofrefined petroleumproducts
1582 Manufacturing ofrusks and biscuits
2513 Manufacturing of otherrubber products
2751 Casting of ironcompounds
2215 Other publishing
2415 Manufacturing offertilizers andnitrogen
2625 Manufacturing of otherceramic products
1548 Stefania Vitali et al.
Dow
nloa
ded
by [
Prin
ceto
n U
nive
rsity
] at
14:
33 2
4 A
pril
2014
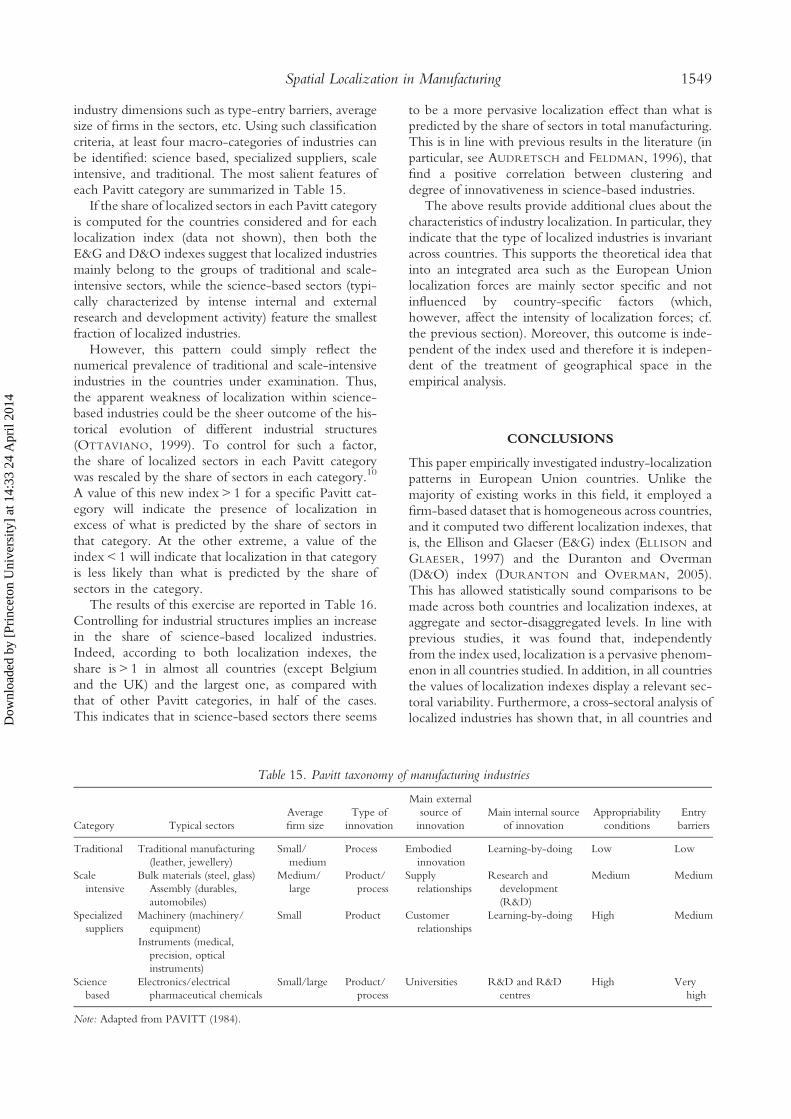
industry dimensions such as type-entry barriers, averagesize of firms in the sectors, etc. Using such classificationcriteria, at least four macro-categories of industries canbe identified: science based, specialized suppliers, scaleintensive, and traditional. The most salient features ofeach Pavitt category are summarized in Table 15.
If the share of localized sectors in each Pavitt categoryis computed for the countries considered and for eachlocalization index (data not shown), then both theE&G and D&O indexes suggest that localized industriesmainly belong to the groups of traditional and scale-intensive sectors, while the science-based sectors (typi-cally characterized by intense internal and externalresearch and development activity) feature the smallestfraction of localized industries.
However, this pattern could simply reflect thenumerical prevalence of traditional and scale-intensiveindustries in the countries under examination. Thus,the apparent weakness of localization within science-based industries could be the sheer outcome of the his-torical evolution of different industrial structures(OTTAVIANO, 1999). To control for such a factor,the share of localized sectors in each Pavitt categorywas rescaled by the share of sectors in each category.10
A value of this new index > 1 for a specific Pavitt cat-egory will indicate the presence of localization inexcess of what is predicted by the share of sectors inthat category. At the other extreme, a value of theindex < 1 will indicate that localization in that categoryis less likely than what is predicted by the share ofsectors in the category.
The results of this exercise are reported in Table 16.Controlling for industrial structures implies an increasein the share of science-based localized industries.Indeed, according to both localization indexes, theshare is > 1 in almost all countries (except Belgiumand the UK) and the largest one, as compared withthat of other Pavitt categories, in half of the cases.This indicates that in science-based sectors there seems
to be a more pervasive localization effect than what ispredicted by the share of sectors in total manufacturing.This is in line with previous results in the literature (inparticular, see AUDRETSCH and FELDMAN, 1996), thatfind a positive correlation between clustering anddegree of innovativeness in science-based industries.
The above results provide additional clues about thecharacteristics of industry localization. In particular, theyindicate that the type of localized industries is invariantacross countries. This supports the theoretical idea thatinto an integrated area such as the European Unionlocalization forces are mainly sector specific and notinfluenced by country-specific factors (which,however, affect the intensity of localization forces; cf.the previous section). Moreover, this outcome is inde-pendent of the index used and therefore it is indepen-dent of the treatment of geographical space in theempirical analysis.
CONCLUSIONS
This paper empirically investigated industry-localizationpatterns in European Union countries. Unlike themajority of existing works in this field, it employed afirm-based dataset that is homogeneous across countries,and it computed two different localization indexes, thatis, the Ellison and Glaeser (E&G) index (ELLISON andGLAESER, 1997) and the Duranton and Overman(D&O) index (DURANTON and OVERMAN, 2005).This has allowed statistically sound comparisons to bemade across both countries and localization indexes, ataggregate and sector-disaggregated levels. In line withprevious studies, it was found that, independentlyfrom the index used, localization is a pervasive phenom-enon in all countries studied. In addition, in all countriesthe values of localization indexes display a relevant sec-toral variability. Furthermore, a cross-sectoral analysis oflocalized industries has shown that, in all countries and
Table 15. Pavitt taxonomy of manufacturing industries
Category Typical sectorsAveragefirm size
Type ofinnovation
Main externalsource ofinnovation
Main internal sourceof innovation
Appropriabilityconditions
Entrybarriers
Traditional Traditional manufacturing(leather, jewellery)
Small/medium
Process Embodiedinnovation
Learning-by-doing Low Low
Scaleintensive
Bulk materials (steel, glass)Assembly (durables,automobiles)
Medium/large
Product/process
Supplyrelationships
Research anddevelopment(R&D)
Medium Medium
Specializedsuppliers
Machinery (machinery/equipment)
Instruments (medical,precision, opticalinstruments)
Small Product Customerrelationships
Learning-by-doing High Medium
Sciencebased
Electronics/electricalpharmaceutical chemicals
Small/large Product/process
Universities R&D and R&Dcentres
High Veryhigh
Note: Adapted from PAVITT (1984).
Spatial Localization in Manufacturing 1549
Dow
nloa
ded
by [
Prin
ceto
n U
nive
rsity
] at
14:
33 2
4 A
pril
2014
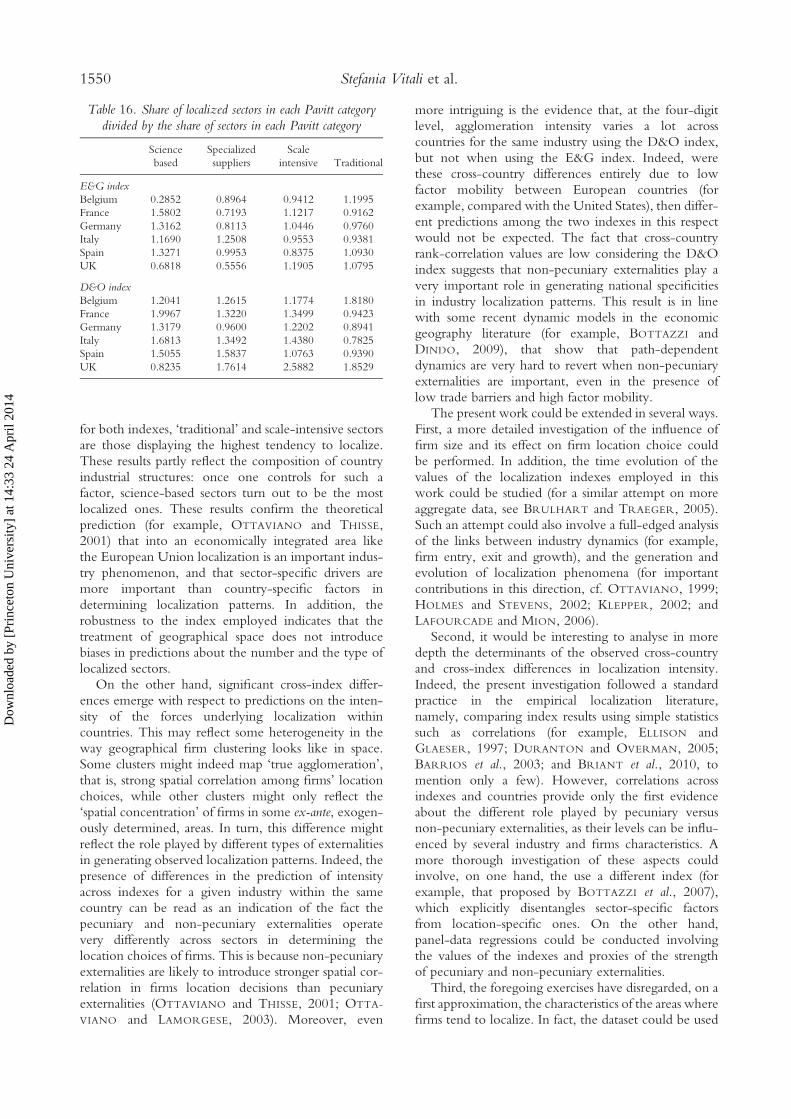
for both indexes, ‘traditional’ and scale-intensive sectorsare those displaying the highest tendency to localize.These results partly reflect the composition of countryindustrial structures: once one controls for such afactor, science-based sectors turn out to be the mostlocalized ones. These results confirm the theoreticalprediction (for example, OTTAVIANO and THISSE,2001) that into an economically integrated area likethe European Union localization is an important indus-try phenomenon, and that sector-specific drivers aremore important than country-specific factors indetermining localization patterns. In addition, therobustness to the index employed indicates that thetreatment of geographical space does not introducebiases in predictions about the number and the type oflocalized sectors.
On the other hand, significant cross-index differ-ences emerge with respect to predictions on the inten-sity of the forces underlying localization withincountries. This may reflect some heterogeneity in theway geographical firm clustering looks like in space.Some clusters might indeed map ‘true agglomeration’,that is, strong spatial correlation among firms’ locationchoices, while other clusters might only reflect the‘spatial concentration’ of firms in some ex-ante, exogen-ously determined, areas. In turn, this difference mightreflect the role played by different types of externalitiesin generating observed localization patterns. Indeed, thepresence of differences in the prediction of intensityacross indexes for a given industry within the samecountry can be read as an indication of the fact thepecuniary and non-pecuniary externalities operatevery differently across sectors in determining thelocation choices of firms. This is because non-pecuniaryexternalities are likely to introduce stronger spatial cor-relation in firms location decisions than pecuniaryexternalities (OTTAVIANO and THISSE, 2001; OTTA-
VIANO and LAMORGESE, 2003). Moreover, even
more intriguing is the evidence that, at the four-digitlevel, agglomeration intensity varies a lot acrosscountries for the same industry using the D&O index,but not when using the E&G index. Indeed, werethese cross-country differences entirely due to lowfactor mobility between European countries (forexample, compared with the United States), then differ-ent predictions among the two indexes in this respectwould not be expected. The fact that cross-countryrank-correlation values are low considering the D&Oindex suggests that non-pecuniary externalities play avery important role in generating national specificitiesin industry localization patterns. This result is in linewith some recent dynamic models in the economicgeography literature (for example, BOTTAZZI andDINDO, 2009), that show that path-dependentdynamics are very hard to revert when non-pecuniaryexternalities are important, even in the presence oflow trade barriers and high factor mobility.
The present work could be extended in several ways.First, a more detailed investigation of the influence offirm size and its effect on firm location choice couldbe performed. In addition, the time evolution of thevalues of the localization indexes employed in thiswork could be studied (for a similar attempt on moreaggregate data, see BRULHART and TRAEGER, 2005).Such an attempt could also involve a full-edged analysisof the links between industry dynamics (for example,firm entry, exit and growth), and the generation andevolution of localization phenomena (for importantcontributions in this direction, cf. OTTAVIANO, 1999;HOLMES and STEVENS, 2002; KLEPPER, 2002; andLAFOURCADE and MION, 2006).
Second, it would be interesting to analyse in moredepth the determinants of the observed cross-countryand cross-index differences in localization intensity.Indeed, the present investigation followed a standardpractice in the empirical localization literature,namely, comparing index results using simple statisticssuch as correlations (for example, ELLISON andGLAESER, 1997; DURANTON and OVERMAN, 2005;BARRIOS et al., 2003; and BRIANT et al., 2010, tomention only a few). However, correlations acrossindexes and countries provide only the first evidenceabout the different role played by pecuniary versusnon-pecuniary externalities, as their levels can be influ-enced by several industry and firms characteristics. Amore thorough investigation of these aspects couldinvolve, on one hand, the use a different index (forexample, that proposed by BOTTAZZI et al., 2007),which explicitly disentangles sector-specific factorsfrom location-specific ones. On the other hand,panel-data regressions could be conducted involvingthe values of the indexes and proxies of the strengthof pecuniary and non-pecuniary externalities.
Third, the foregoing exercises have disregarded, on afirst approximation, the characteristics of the areas wherefirms tend to localize. In fact, the dataset could be used
Table 16. Share of localized sectors in each Pavitt categorydivided by the share of sectors in each Pavitt category
Sciencebased
Specializedsuppliers
Scaleintensive Traditional
E&G indexBelgium 0.2852 0.8964 0.9412 1.1995France 1.5802 0.7193 1.1217 0.9162Germany 1.3162 0.8113 1.0446 0.9760Italy 1.1690 1.2508 0.9553 0.9381Spain 1.3271 0.9953 0.8375 1.0930UK 0.6818 0.5556 1.1905 1.0795
D&O indexBelgium 1.2041 1.2615 1.1774 1.8180France 1.9967 1.3220 1.3499 0.9423Germany 1.3179 0.9600 1.2202 0.8941Italy 1.6813 1.3492 1.4380 0.7825Spain 1.5055 1.5837 1.0763 0.9390UK 0.8235 1.7614 2.5882 1.8529
1550 Stefania Vitali et al.
Dow
nloa
ded
by [
Prin
ceto
n U
nive
rsity
] at
14:
33 2
4 A
pril
2014
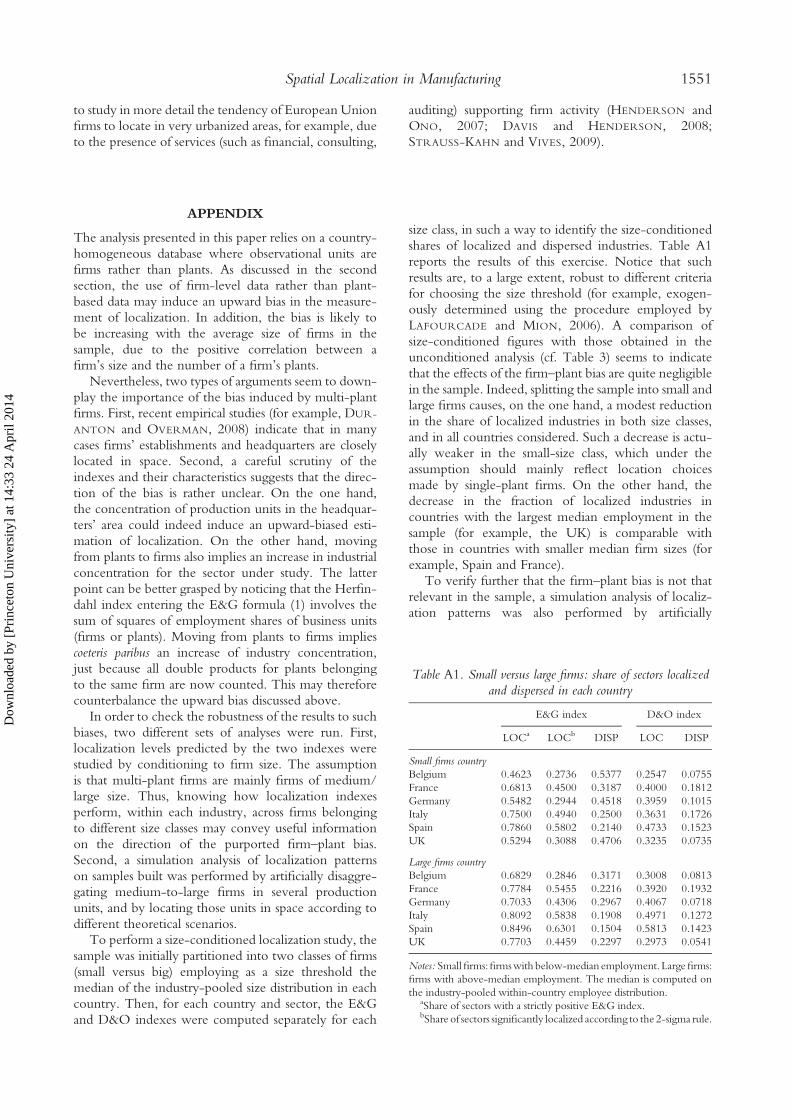
to study in more detail the tendency of European Unionfirms to locate in very urbanized areas, for example, dueto the presence of services (such as financial, consulting,
auditing) supporting firm activity (HENDERSON andONO, 2007; DAVIS and HENDERSON, 2008;STRAUSS-KAHN and VIVES, 2009).
APPENDIX
The analysis presented in this paper relies on a country-homogeneous database where observational units arefirms rather than plants. As discussed in the secondsection, the use of firm-level data rather than plant-based data may induce an upward bias in the measure-ment of localization. In addition, the bias is likely tobe increasing with the average size of firms in thesample, due to the positive correlation between afirm’s size and the number of a firm’s plants.
Nevertheless, two types of arguments seem to down-play the importance of the bias induced by multi-plantfirms. First, recent empirical studies (for example, DUR-
ANTON and OVERMAN, 2008) indicate that in manycases firms’ establishments and headquarters are closelylocated in space. Second, a careful scrutiny of theindexes and their characteristics suggests that the direc-tion of the bias is rather unclear. On the one hand,the concentration of production units in the headquar-ters’ area could indeed induce an upward-biased esti-mation of localization. On the other hand, movingfrom plants to firms also implies an increase in industrialconcentration for the sector under study. The latterpoint can be better grasped by noticing that the Herfin-dahl index entering the E&G formula (1) involves thesum of squares of employment shares of business units(firms or plants). Moving from plants to firms impliescoeteris paribus an increase of industry concentration,just because all double products for plants belongingto the same firm are now counted. This may thereforecounterbalance the upward bias discussed above.
In order to check the robustness of the results to suchbiases, two different sets of analyses were run. First,localization levels predicted by the two indexes werestudied by conditioning to firm size. The assumptionis that multi-plant firms are mainly firms of medium/large size. Thus, knowing how localization indexesperform, within each industry, across firms belongingto different size classes may convey useful informationon the direction of the purported firm–plant bias.Second, a simulation analysis of localization patternson samples built was performed by artificially disaggre-gating medium-to-large firms in several productionunits, and by locating those units in space according todifferent theoretical scenarios.
To perform a size-conditioned localization study, thesample was initially partitioned into two classes of firms(small versus big) employing as a size threshold themedian of the industry-pooled size distribution in eachcountry. Then, for each country and sector, the E&Gand D&O indexes were computed separately for each
size class, in such a way to identify the size-conditionedshares of localized and dispersed industries. Table A1reports the results of this exercise. Notice that suchresults are, to a large extent, robust to different criteriafor choosing the size threshold (for example, exogen-ously determined using the procedure employed byLAFOURCADE and MION, 2006). A comparison ofsize-conditioned figures with those obtained in theunconditioned analysis (cf. Table 3) seems to indicatethat the effects of the firm–plant bias are quite negligiblein the sample. Indeed, splitting the sample into small andlarge firms causes, on the one hand, a modest reductionin the share of localized industries in both size classes,and in all countries considered. Such a decrease is actu-ally weaker in the small-size class, which under theassumption should mainly reflect location choicesmade by single-plant firms. On the other hand, thedecrease in the fraction of localized industries incountries with the largest median employment in thesample (for example, the UK) is comparable withthose in countries with smaller median firm sizes (forexample, Spain and France).
To verify further that the firm–plant bias is not thatrelevant in the sample, a simulation analysis of localiz-ation patterns was also performed by artificially
Table A1. Small versus large firms: share of sectors localizedand dispersed in each country
E&G index D&O index
LOCa LOCb DISP LOC DISP
Small firms countryBelgium 0.4623 0.2736 0.5377 0.2547 0.0755France 0.6813 0.4500 0.3187 0.4000 0.1812Germany 0.5482 0.2944 0.4518 0.3959 0.1015Italy 0.7500 0.4940 0.2500 0.3631 0.1726Spain 0.7860 0.5802 0.2140 0.4733 0.1523UK 0.5294 0.3088 0.4706 0.3235 0.0735
Large firms countryBelgium 0.6829 0.2846 0.3171 0.3008 0.0813France 0.7784 0.5455 0.2216 0.3920 0.1932Germany 0.7033 0.4306 0.2967 0.4067 0.0718Italy 0.8092 0.5838 0.1908 0.4971 0.1272Spain 0.8496 0.6301 0.1504 0.5813 0.1423UK 0.7703 0.4459 0.2297 0.2973 0.0541
Notes: Smallfirms:firmswith below-median employment. Largefirms:firms with above-median employment. The median is computed onthe industry-pooled within-country employee distribution.
aShare of sectors with a strictly positive E&G index.bShare of sectors significantly localized according to the 2-sigma rule.
Spatial Localization in Manufacturing 1551
Dow
nloa
ded
by [
Prin
ceto
n U
nive
rsity
] at
14:
33 2
4 A
pril
2014
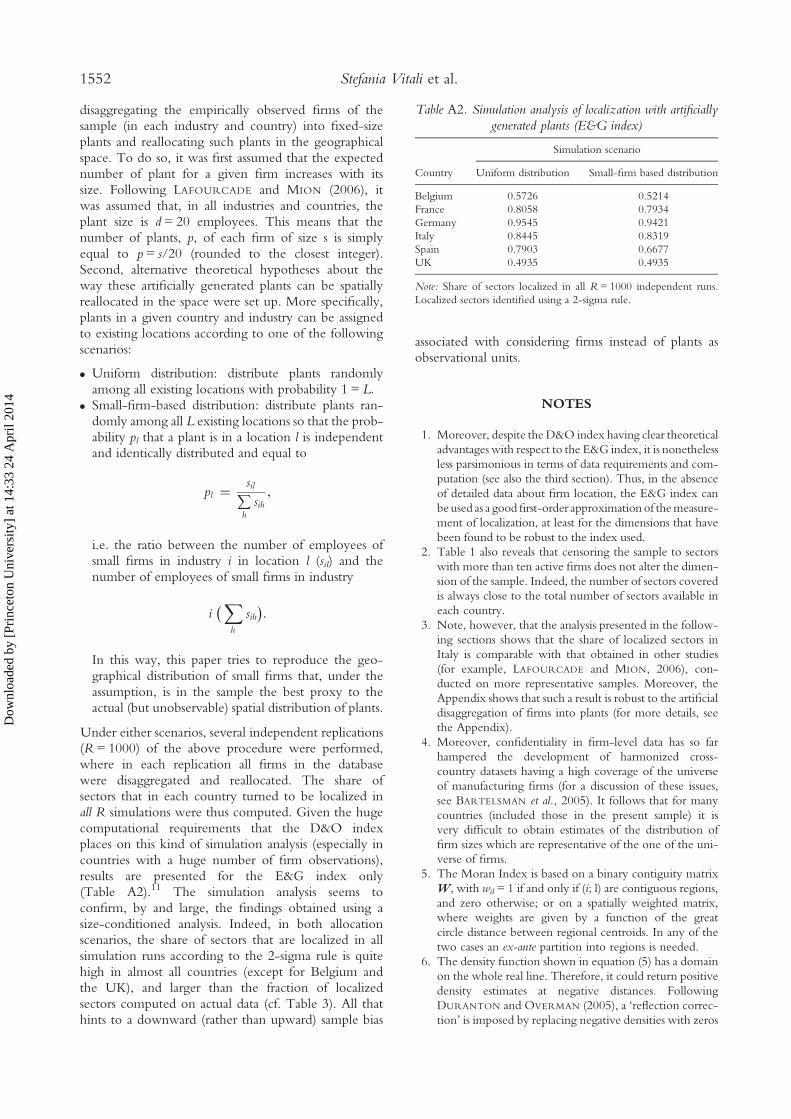
disaggregating the empirically observed firms of thesample (in each industry and country) into fixed-sizeplants and reallocating such plants in the geographicalspace. To do so, it was first assumed that the expectednumber of plant for a given firm increases with itssize. Following LAFOURCADE and MION (2006), itwas assumed that, in all industries and countries, theplant size is d = 20 employees. This means that thenumber of plants, p, of each firm of size s is simplyequal to p = s/20 (rounded to the closest integer).Second, alternative theoretical hypotheses about theway these artificially generated plants can be spatiallyreallocated in the space were set up. More specifically,plants in a given country and industry can be assignedto existing locations according to one of the followingscenarios:
. Uniform distribution: distribute plants randomlyamong all existing locations with probability 1 = L.
. Small-firm-based distribution: distribute plants ran-domly among all L existing locations so that the prob-ability pl that a plant is in a location l is independentand identically distributed and equal to
pl = sil∑hsih,
i.e. the ratio between the number of employees ofsmall firms in industry i in location l (sil) and thenumber of employees of small firms in industry
i(∑
h
sih).
In this way, this paper tries to reproduce the geo-graphical distribution of small firms that, under theassumption, is in the sample the best proxy to theactual (but unobservable) spatial distribution of plants.
Under either scenarios, several independent replications(R= 1000) of the above procedure were performed,where in each replication all firms in the databasewere disaggregated and reallocated. The share ofsectors that in each country turned to be localized inall R simulations were thus computed. Given the hugecomputational requirements that the D&O indexplaces on this kind of simulation analysis (especially incountries with a huge number of firm observations),results are presented for the E&G index only(Table A2).11 The simulation analysis seems toconfirm, by and large, the findings obtained using asize-conditioned analysis. Indeed, in both allocationscenarios, the share of sectors that are localized in allsimulation runs according to the 2-sigma rule is quitehigh in almost all countries (except for Belgium andthe UK), and larger than the fraction of localizedsectors computed on actual data (cf. Table 3). All thathints to a downward (rather than upward) sample bias
associated with considering firms instead of plants asobservational units.
NOTES
1. Moreover, despite the D&O index having clear theoreticaladvantages with respect to the E&G index, it is nonethelessless parsimonious in terms of data requirements and com-putation (see also the third section). Thus, in the absenceof detailed data about firm location, the E&G index canbe used as a goodfirst-order approximation of themeasure-ment of localization, at least for the dimensions that havebeen found to be robust to the index used.
2. Table 1 also reveals that censoring the sample to sectorswith more than ten active firms does not alter the dimen-sion of the sample. Indeed, the number of sectors coveredis always close to the total number of sectors available ineach country.
3. Note, however, that the analysis presented in the follow-ing sections shows that the share of localized sectors inItaly is comparable with that obtained in other studies(for example, LAFOURCADE and MION, 2006), con-ducted on more representative samples. Moreover, theAppendix shows that such a result is robust to the artificialdisaggregation of firms into plants (for more details, seethe Appendix).
4. Moreover, confidentiality in firm-level data has so farhampered the development of harmonized cross-country datasets having a high coverage of the universeof manufacturing firms (for a discussion of these issues,see BARTELSMAN et al., 2005). It follows that for manycountries (included those in the present sample) it isvery difficult to obtain estimates of the distribution offirm sizes which are representative of the one of the uni-verse of firms.
5. The Moran Index is based on a binary contiguity matrixW, with wil = 1 if and only if (i; l) are contiguous regions,and zero otherwise; or on a spatially weighted matrix,where weights are given by a function of the greatcircle distance between regional centroids. In any of thetwo cases an ex-ante partition into regions is needed.
6. The density function shown in equation (5) has a domainon the whole real line. Therefore, it could return positivedensity estimates at negative distances. FollowingDURANTON and OVERMAN (2005), a ‘reflection correc-tion’ is imposed by replacing negative densities with zeros
Table A2. Simulation analysis of localization with artificiallygenerated plants (E&G index)
Country
Simulation scenario
Uniform distribution Small-firm based distribution
Belgium 0.5726 0.5214France 0.8058 0.7934Germany 0.9545 0.9421Italy 0.8445 0.8319Spain 0.7903 0.6677UK 0.4935 0.4935
Note: Share of sectors localized in all R= 1000 independent runs.Localized sectors identified using a 2-sigma rule.
1552 Stefania Vitali et al.
Dow
nloa
ded
by [
Prin
ceto
n U
nive
rsity
] at
14:
33 2
4 A
pril
2014
and rescaling all values so as to obtain a total probabilitymass equal to 1.
7. Following KLIER and MCMILLEN (2008), forty targetdistances were selected. Moreover, for each country alldistances between zero and the median distancebetween all pairs of manufacturing firms were considered.The median distances (kilometres) were, respectively:105 for Belgium, 465 for France, 355 for Germany,275 for Italy, 470 for Spain and 220 for the UK.
8. Being non-parametric, the Wilcoxon test appears a goodcandidate for the analysis at stake. Standard t-tests indeedrely on the assumption of normality of the distribution,which does not seem appropriate in the present case(see Table 4).
9. The other industries which are part of the ‘core’ for theE&G index are: ‘Manufacture of meat’ (1513),‘Manufacture of prepared feeds for farm animals’
(1571), ‘Finishing of textiles’ (1730), ‘Manufacture ofother outwear’ (1822), ‘Manufacture of metal structure’(2811), ‘Forging, pressing, stamping and roll forming ofmetal’ (2840), ‘General mechanical engineering’ (2852),‘Building and repairing of ships’ (3511), and‘Manufacture of chairs and seats’ (3611). The other‘core’ sectors for D&O index are: ‘Manufacture ofperfumes and toilet preparations’ (2452), ‘Manufactureof taps and valves’ (2913), ‘Manufacture of machineryfor textile, apparel and leather production’ (2954), and‘Manufacture of jewellery’ (3622).
10. This procedure is analogous to that underlying theconstruction of the Balassa Index (for example,COMBES and OVERMAN, 2004; LAFOURCADE andMION, 2006).
11. Preliminary results on the D&O index, however, do notseem to contradict E&G simulation findings.
REFERENCES
ARBIA G. (2001) The role of spatial effects in the empirical analysis of regional concentration, Journal of Geographical Systems 3,271–281.
AUDRETSCH D. B. and FELDMAN M. P. (1996) R&D spillovers and the geography of innovation and production, American EconomicReview 86, 630–640.
BARRIOS S., BERTINELLI L., STROBL E. A. and TEIXEIRA A.-C. F. (2003) Agglomeration Economics and the Location of Industries: AComparison of Three Small Countries. Technical Report. CORE Discussion Paper, 2003. Centre for Operations Research andEconometrics (CORE), Université Catholique de Louvain.
BARRIOS S., BERTINELLI L., STROBL E. and TEIXEIRA A.-C. (2005) The dynamics of agglomeration: evidence from Ireland andPortugal, Journal of Urban Economics 57, 170–188.
BARTELSMAN E., SCARPETTA S. and SCHIVARDI F. (2005) Comparative analysis of firm demographics and survival: evidence frommicro-level sources in OECD countries, Industrial and Corporate Change 14, 365–391.
BERTINELLI L. and DECROP J. (2005) Geographical agglomeration: Ellison and Glaeser’s index applied to the case of Belgium,Regional Studies 39(5), 567–583.
BOTTAZZI G. and DINDO P. (2009) An evolutionary model of firms location with technological externality, in BOSCHMA R. andMARTIN R. (Eds) Handbook on Evolutionary Economic Geography, pp. 508–528. Edward Elgar, Cheltenham.
BOTTAZZI G., DOSI G., FAGIOLO G. and SECCHI A. (2007) Modeling industrial evolution in geographical space, Journal of EconomicGeography 7, 651–672.
BRENNER T. (2006) Identification of local industrial clusters in Germany, Regional Studies 40, 991–1004.BRIANT A., COMBES P.-P. and LAFOURCADE M. (2010) Dots to boxes: do the size and shape of spatial units jeopardize economic
geography estimations?, Journal of Urban Economics 67, 287–302.BRULHART M. and TRAEGER R. (2005) An account of geographic concentration patterns in Europe, Regional Science and Urban
Economics 35, 597–624.COAD A. (2008) Firm growth and scaling of growth rate variance in multiplant firms, Economics Bulletin 12(9), 1–15.COMBES P.-P. and OVERMAN H. G. (2004) The spatial distribution of economic activities in the European Union, in HENDERSON
J. V. and THISSE J. F. (Eds) Handbook of Regional and Urban Economics, Vol. 4, pp. 2845–2909. Elsevier-North Holland,Amsterdam.
DAVIS J. and HENDERSON J. (2008) The agglomeration of headquarters, Regional Science and Urban Economics 38, 445–460.DEVEREUX M. P., GRIFFITH R. and SIMPSON H. (2004) The geographic distribution of productivity activity in the UK, Regional
Science and Urban Economics 34, 533–564.DUMAIS G., ELLISON G. and GLAESER E. (2002) Geographic concentration as a dynamic process, Review of Economics and Statistics 84,
193–204.DURANTON G. and OVERMAN H. G. (2005) Testing for localization using micro-geographic data, Review of Economic Studies 72(4),
1077–1106.DURANTON G. and OVERMAN H. G. (2008) Exploring the detailed location patterns of UK manufacturing industries using micro-
geographic data, Journal of Regional Science 48, 213–243.ELLISON G. and GLAESER E. L. (1997) Geographic concentration in US manufacturing industries: a dartboard approach, Journal of
Political Economy 105(5), 889–927.FORNAHL D. and BRENNER T. (2009) Geographic concentration of innovative activities in Germany, Structural Change and Economic
Dynamics 20, 163–182.FUJITA M., KRUGMAN P. and VENABLES A. (1999) The Spatial Economy: Cities, Regions, and International Trade. MIT Press,
Cambridge, MA.HENDERSON J. and ONO Y. (2007) Where do manufacturing firms locate their headquarters?, Journal of Urban Economics 63,
431–450.
Spatial Localization in Manufacturing 1553
Dow
nloa
ded
by [
Prin
ceto
n U
nive
rsity
] at
14:
33 2
4 A
pril
2014
HOLMES T. and STEVENS J. (2002) Geographic concentration and establishment scale, Review of Economics and Statistics 84, 682–690.KIM S. (1995) Expansion of markets and the geographic distribution of economic activities: the trends in US regional manufactur-
ing structure, 1860–1987, Quarterly Journal of Economics 110, 881–908.KLEPPER S. (2002) The capabilities of new firms and the evolution of the US automobile industry, Industrial and Corporate Change
11, 645–666.KLIER T. and MCMILLEN D. (2008) Evolving agglomeration in the US auto supplier industry, Journal of Regional Science 48,
245–267.KRUGMAN P. (1991) Geography and Trade. MIT Press, Cambridge, MA.LAFOURCADE M. and MION G. (2007) Concentration, agglomeration and the size of plants, Regional Science and Urban Economics 37,
46–68.MARSHALL A. (1920) Principles of Economics, 8th Edn. Macmillan, London.MAUREL F. and SÉDILLOT B. (1999) A measure of the geographic concentration in French manufacturing industries, Regional Science
and Urban Economics 29, 575–604.MORAN P. A. P. (1950) Notes on continuous stochastic phenomena, Biometrika 37, 17–23.OTTAVIANO G. (1999) Integration, geography and the burden of history, Regional Science and Urban Economics 29, 245–256.OTTAVIANO G. and LAMORGESE A. (2003) Space, factors and spillovers, in Il commercio con l’estero e la collocazione internazionale
dell’economia italiana: incontro di studio in memoria di Stefano Vona, Atti dell’incontro tenuto a Roma il 14 dicembre 2001.Banca d’Italia, Rome.
OTTAVIANO G. I. and THISSE F. J. (2001) On economic geography in economic theory: increasing returns and pecuniary extern-alities, Journal of Economic Geography 1(2), 153–179.
PAVITT K. (1984) Sectoral patterns of technical change: towards a taxonomy and a theory, Research Policy 13, 343–373.ROSENTHAL S. S. and STRANGE W. C. (2001) The determinants of agglomeration, Journal of Urban Economics 50, 191–229.STRAUSS-KAHN V. and VIVES X. (2009) Why and where do headquarters move?, Regional Science and Urban Economics 39, 168–186.
1554 Stefania Vitali et al.
Dow
nloa
ded
by [
Prin
ceto
n U
nive
rsity
] at
14:
33 2
4 A
pril
2014