REGIONAL FINANCIAL COOPERATION - Repositorio CEPAL
385
JOSE ANTONIO OCAMPO, Editor REGIONAL FINANCIAL COOPERATION
-
Upload
khangminh22 -
Category
Documents
-
view
3 -
download
0
Transcript of REGIONAL FINANCIAL COOPERATION - Repositorio CEPAL

JOSE ANTONIO OCAMPO, Editor
REGIONAL FINANCIALCOOPERATION

REGIONAL FINANCIAL COOPERATION
10101-00_FM.qxd 10/13/06 5:49 PM Page i

10101-00_FM.qxd 10/13/06 5:49 PM Page ii

JOSÉ ANTONIO OCAMPO
Editor
UNITED NATIONS
Economic Commission for Latin America and the Caribbean
BROOKINGS INSTITUTION PRESS
Washington, D.C.
REGIONAL FINANCIAL COOPERATION
10101-00_FM.qxd 10/13/06 5:49 PM Page iii

ABOUT BROOKINGSThe Brookings Institution is a private nonprofit organization devoted to research,
education, and publication on important issues of domestic and foreign policy. Its principal purpose is to bring the highest quality independent research and analysis to bear on current and emerging policy problems. Interpretations or conclusions in
Brookings publications should be understood to be solely those of the authors.
Copyright © 2006
United Nations Economic Commission for Latin America and the Caribbean
Regional Financial Cooperation may be ordered from:
Brookings Institution Pressc/o HFS, P.O. Box 50370, Baltimore, MD 21211-4370Tel.: 800/537-5487; 410/516-6956; Fax: 410/516-6998
Internet: www.brookings.edu
All rights reserved. No part of this publication may be reproduced or transmitted in any form or by any means without permission in writing from the
Brookings Institution Press.
Library of Congress Cataloging-in-Publication data
Regional financial cooperation / José Antonio Ocampo, editor.p. cm.
Summary: “Assesses how regional financial institutions can help developing countries,often at a disadvantage within the global financial framework, finance their investmentneeds, counteract the volatility of private capital flows, and make their voices heard”—Provided by publisher.Includes bibliographical references and index.ISBN-13: 978-0-8157-6419-9 (pbk. : alk. paper)ISBN-10: 0-8157-6419-7 (pbk. : alk. paper)1. Developing countries—Economic integration. 2. Regionalism—Developing countries. 3. Developing countries—Foreign economic relations. 4. International economic relations. I. Ocampo, José Antonio. II. Title.HC59.7.R369 2006332'.042—dc22 2006027658
9 8 7 6 5 4 3 2 1The paper used in this publication meets minimum requirements of the
American National Standard for Information Sciences—Permanence of Paper for Printed Library Materials: ANSI Z39.48-1992.
Typeset in Adobe Garamond
Composition by Circle GraphicsColumbia, Maryland
Printed by R. R. DonnelleyHarrisonburg, Virginia
10101-00_FM.qxd 10/13/06 5:49 PM Page iv

v
Contents
Foreword vii
1 Regional Financial Cooperation: Experiences and Challenges 1José Antonio Ocampo
2 Reforming the Global Financial Architecture: The Potential of Regional Institutions 40Roy Culpeper
3 Regional Development Banks: A Comparative Perspective 68Francisco Sagasti and Fernando Prada
4 Regional Exchange Rate Arrangements: The European Experience 107Charles Wyplosz
10101-00_FM.qxd 10/13/06 5:49 PM Page v

5 European Financial Institutions: A Useful Inspiration for Developing Countries? 136Stephany Griffith-Jones, Alfred Steinherr, and Ana Teresa Fuzzo de Lima
6 Macroeconomic Coordination in Latin America: Does It Have a Future? 164José Luis Machinea and Guillermo Rozenwurcel
7 Subregional Financial Cooperation: The Experiences of Latin America and the Caribbean 200Daniel Titelman
8 Regional Financial Integration in East Asia: Challenges and Prospects 227Yung Chul Park
9 Asian Bond Market Development: Rationale and Strategies 264Yung Chul Park, Jae Ha Park, Julia Leung, and Kanit Sangsubhan
10 The Arab Experience 291Georges Corm
11 An Analysis of Financial and Monetary Cooperation in Africa 329Ernest Aryeetey
Contributors 357
Index 359
vi contents
10101-00_FM.qxd 10/13/06 5:49 PM Page vi

The Monterrey Consensus, adopted by the 2002 International Confer-ence on Financing for Development, highlighted in its paragraph 45
“the vital role that multilateral and regional development banks continue toplay in serving the development needs of developing countries and countrieswith economies in transition.” It went on to note, “They should contributeto providing an adequate supply of finance to countries that are challengedby poverty, follow sound economic policies and may lack adequate access tocapital markets. They should also mitigate the impact of excessive volatilityof financial markets. Strengthened regional development banks and sub-regional financial institutions add flexible financial support to national andregional development efforts, enhancing ownership and overall efficiency.They also serve as a vital source of knowledge and expertise on economicgrowth and development for their developing member countries.” Despitethis call, however, relatively little progress has been made since Monterrey inenhancing the role that regional financial arrangements play in the interna-tional financial system.
The failure to devote attention to this issue is attested to by the absence ofany book or report providing a comparative evaluation of the experience
vii
Foreword
10101-00_FM.qxd 10/13/06 5:49 PM Page vii

with regional financial cooperation in different parts of the world. This bookseeks to fill this serious gap in the existing literature. Experiences in this areacan be clustered into two groups: development financing; and mechanismsfor macroeconomic cooperation and related financial arrangements (liquid-ity financing during balance-of-payments crises). Although our central aim isto explore the ways in which regional cooperation can promote the interestsof developing countries, we will use Western Europe’s experiences withregional financial cooperation as a benchmark for that exploration.
The experiences reviewed in this book indicate that regional cooperationcan be a very effective means of surmounting the difficulties posed by theshortfall in the financial services provided by the current international finan-cial architecture. Nonetheless, the scope of these institutions’ operations isstill limited and they have yet to be recognized as central elements in theinternational financial architecture. We hope that this book will spark abroader interest in initiatives in this area and indeed bring them to the cen-ter of the current discussion on South-South cooperation.
We are deeply grateful to the Ford Foundation for providing the UnitedNations Economic Commission for Latin America and the Caribbean withthe support it needed to undertake this project.
José Luis Machinea José Antonio OcampoExecutive Secretary Under-Secretary-General forEconomic Commission for Economic and Social AffairsLatin America and the Caribbean of the United Nations
viii foreword
10101-00_FM.qxd 10/13/06 5:49 PM Page viii

The period following the 1997 Asian crisis generated an extensive discussionon the international financial architecture. The debate made clear that
there is an undersupply of services by international financial institutions that hasbecome more glaring as a result of the growing economic linkages created by thecurrent globalization process. The associated “global public goods” that arebeing undersupplied include adequate mechanisms for preventing and managingfinancial crises, as well as for guaranteeing global macroeconomic and financialstability. The debate also underscored the fact that private international capitalmarkets provide finance to developing countries in a highly procyclical way,effectively reducing the room for maneuver of developing countries to undertakecountercyclical macroeconomic policies. Finally, the debate emphasized thatinternational capital markets squeeze out many developing countries, particu-larly the poorest among them, from private global capital markets.
The possible role of regional institutions in providing these services wasunderestimated in the debate on how to improve global financial arrangements.
Regional Financial Cooperation: Experiences and Challengesjosé antonio ocampo
1
1
I would like to thank Roy Culpeper, Stephany Griffith-Jones, Jomo K. S., Ann Orr, José LuisMachinea, Ejeviome Otobo, María Angela Parra, Esteban Pérez, Francisco Sagasti, and Lance Taylorfor their comments on a prior version of this chapter.
10101-01_Ch01_Redo.qxd 10/5/06 3:05 PM Page 1

It was, indeed, absent in major northern reports1 and from the views of inter-national financial reform coming from the Bretton Woods institutions (for exam-ple, in the reports on international reform presented by the InternationalMonetary Fund [IMF] to the Interim Committee and its successor, the Inter-national Monetary and Financial Committee). It was also given at best a passingreference in major academic analyses of reforms of the international financialarchitecture.2 There was even open opposition to regional arrangements, par-ticularly to the 1997 Japanese proposal to create an Asian Monetary Fund,although this idea was revived in 2000 in the form of the Chiang Mai Initiativeamong the Association of Southeast Asian Nations (ASEAN) countries, plusChina, Japan, and the Republic of Korea.
There were obviously exceptions to this rule. Among the many reports, that ofthe United Nations stands out for its defense of the potential role of regionalfinancial arrangements in an improved international financial architecture.3
Strong defenses of regional financial arrangements were also made by Percy Mistry,José Antonio Ocampo, and the Emerging Markets Eminent Persons Group con-vened by the Ford Foundation.4 Regional and subregional development bankshave been given greater attention.5 As already pointed out, after the crisis Asiatook the most important steps forward,6 while the Economic Commission forLatin America and the Caribbean (ECLAC) provided a strong defense of the roleof regional financial arrangements in Latin America and the Caribbean.7
The lack of adequate attention to regional financial arrangements was sur-prising in at least three ways. First, it is evident to all observers that the newwave of globalization is also one of “open regionalism.” Second, postwar West-ern Europe is widely recognized as a successful example of regional financialcooperation, which in the financial area encompasses a history that extendsfrom the creation of the European Payments Union and the European Invest-ment Bank (EIB) in the 1950s to a series of arrangements for macroeconomiccoordination and cooperation that eventually led to the current monetary unionamong most members of the European Union. Third, regional developmentbanks have been recognized as an important part of the world institutional land-
2 josé antonio ocampo
1. See, for example, Council on Foreign Relations (1999) and Meltzer and others (2000).2. Eichengreen (1999); Kenen (2001).3. United Nations (1999).4. See Mistry (1999); Ocampo (1999, 2002, 2003); and Ford Foundation (2001).5. See Bezanson and Sagasti (2000); Culpeper (1997); Birdsall (2001); and Sagasti, Bezanson,
and Prada (2005).6. See Park and Wang (2000).7. See United Nations, ECLAC (2002a) and Agosin (2001)
10101-01_Ch01_Redo.qxd 10/5/06 3:05 PM Page 2

experiences and challenges 3
scape since the 1960s. In the developing world, there are also several experienceswith “developing-country-owned” multilateral development banks,8 regionalpayments agreements, at least one successful reserve fund, and a few monetaryunions. These experiences coincide in several ways with those of regional andsubregional trade agreements, with undoubtedly a mixed history in both cases.9
Reflecting the lack of adequate attention to this issue, there is no book orreport that makes a comparative evaluation of experience with regional financialarrangements. This book aims to fill this important gap. The different forms offinancial cooperation are clustered into two groups: (1) development financing,the area where there is more extensive experience, including novel ideas, such asthe Asian initiatives to strengthen regional bond markets, and (2) mechanisms for macroeconomic and related financial cooperation (liquidity financing duringbalance-of-payments crises), which include mechanisms of policy dialogue andpeer review, and more elaborate systems of macroeconomic surveillance and pol-icy consultation or coordination; reserve funds and swap arrangements amongcentral banks; and, in the most developed form, monetary unions. Two additionalforms of cooperation that belong to the second cluster are regional paymentsagreements and cooperation in the area of prudential regulation and supervisionof domestic financial systems. This study makes only passing reference to them. Itshould be emphasized that, although our central aim is to explore the potentialservice that regional financial cooperation can make to developing countries, theexperience with such cooperation in Western Europe is used as a benchmark.
This chapter provides an overview of a set of relevant experiences with bothforms of regional cooperation and links the comparative evaluation of these expe-riences with the broader debate on international financial reform. In this regard, itlooks not only at the advantages of regional financial cooperation in comparisonwith global arrangements, but also at its revealed shortfalls and, equally important,at the possible complementarities between regional and global institutions. Thechapter is organized into six sections, the first of which is this introduction. Thenext two sections provide the case for regional financial arrangements and analyzesome of the challenges they face. The fourth and fifth sections look at major expe-riences with regional cooperation in the areas of development financing andmacroeconomic cooperation respectively. The last draws some conclusions.
8. This chapter uses the term “developing-country-owned” to denote multilateral developmentbanks that do not have any capital from industrialized countries (although they may have capitalfrom relatively rich oil-producing countries).
9. See the analysis of the different experiences of regional cooperation in the series of bookspublished by the Forum on Debt and Development (FONDAD) in the 1990s. See, in particular,Mistry (1996) and Teunissen (1998).
10101-01_Ch01_Redo.qxd 10/5/06 3:05 PM Page 3
The Case for Regional Financial Institutions
Several arguments can be made for a more active use of regional financialarrangements to strengthen the international financial architecture. This chaptergroups them into four major arguments.10 The first relates to the fact that, asalready pointed out, the current globalization process is also one of open region-alism. Intraregional trade and investment flows have deepened as a result ofboth policy and market-driven processes of regional integration.11 This processis, of course, uneven, being clearly stronger in Western Europe, East Asia, andNorth America and much weaker in other parts of the world, particularly SouthAsia. However, even in regions that have lagged behind, a web of regional initia-tives has played an important role in reshaping the world economic system sincethe early 1990s. In addition, since the 1980s the contagion effects of financialcrises have also had important regional dimensions. As a result of all these pro-cesses, macroeconomic linkages among countries and the externalities generatedby national macroeconomic policies on neighbors have increased.
A stronger case can thus be made than in the past for policies and institutionsthat build regional defenses against financial crises and explicitly internalize theeffects of domestic macroeconomic and financial policies on regional partners.In this regard, regional reserve funds and swap arrangements can serve as a firstline of defense against crises. In turn, macroeconomic dialogue or strongerforms of regional surveillance and policy consultation could internalize, at leastpartially, the externalities that national macroeconomic policies have on regionalpartners. Furthermore, the effectiveness of national macroeconomic policiesmay be enhanced (or reduced) by the credibility generated by the willingness (orrefusal) of regional partners to support a specific country.12 A complementaryargument is that, in a world where the room for maneuver of national macro-economic policies has become more limited, the regional arena has become cru-cial for exercising what remains of macroeconomic policy autonomy. On thecontrary, macroeconomic policies that take into account only domestic consid-erations (as has been traditional in IMF programs) may be said to contribute to
4 josé antonio ocampo
10. See complementary arguments in Culpeper’s contribution to this volume. He differentiatesbetween cooperative motives and the need to remedy the incomplete set of international institutions.
11. The first refers to the web of regional, subregional, and bilateral trade agreements that havegenerated the “spaghetti bowl” of current trade agreements. The second is used in the analysis ofEast Asia to refer to a process that was largely driven by investment and trade in intermediategoods for the production of manufactures for the world market—following the “flying geese” pat-tern that has been reshaped in recent decades by the irruption of China into global markets.
12. Mistry (1999).
10101-01_Ch01_Redo.qxd 10/5/06 3:05 PM Page 4

experiences and challenges 5
the contraction of regional trade and to encourage competitive devaluations thateffectively compound contagion.
Growing regional linkages also mean that there is a role for regional develop-ment banks or other mechanisms to support investments in regional infrastructureand other “regional public goods.” Indeed, the limited financing for “regionalpublic goods” in current development cooperation has led Birdsall to claim thatthe underfunding of regionalism is one of the major problems of current inter-national arrangements.13 Classical risk-pooling arguments also enhance thepotential role of regional and subregional development banks. An advantage ofall these mechanisms is that information asymmetries may be smaller at theregional level, and that the mix of peer pressure and the strong sense of owner-ship of regional institutions may reduce the risks that these development banksface, and have positive effects on investment and the financial development ofmembers of a regional club.
Similar arguments can be made for cooperation in developing the financialinfrastructure to support domestic financial development and to expand regio-nal capital markets. Regional mechanisms can also play a role in supportingnational systems for the prudential regulation and supervision of domesticfinancial systems, including the adaptation of international standards to regionalconditions, or even in setting special regional norms (for example, in the devel-oping world, on maturity and currency mismatches in the portfolios of financialinstitutions). In all of these areas, regional cooperation can help to reduce learn-ing costs and help countries share the experience of institutional development.
According to the second argument, the heterogeneity of the internationalcommunity implies that world and regional institutions can play complementaryroles, following the principle of subsidiarity that has been central to Europeanintegration. The need to fill the gaps in the world’s current highly incompleteinternational financial architecture makes this role even more important, as RoyCulpeper argues in this volume.14 Furthermore, some of the services providedby international institutions may be subject to diseconomies of scale, and it isunclear whether others have large enough economies of scale to justify singleinternational institutions in specific areas. In particular, regional and sub-regional institutions may be better placed to capture and respond to specificregional needs and demands. The diverse portfolios of existing multilateraldevelopment banks are tailored to the specific needs of countries in the regions
13. See Birdsall (2006).14. See also Sakakibara (2003).
10101-01_Ch01_Redo.qxd 10/5/06 3:05 PM Page 5
where they operate, and they are also capable of operating successfully on verydifferent scales.
In the same vein, macroeconomic surveillance and consultation at the worldlevel are necessary to guarantee policy coherence among major countries, butthey are inefficient for managing the externalities generated by macroeconomicpolicies on neighbors in the developing world (or even within Western Europe).Thus, while the IMF should play a central role in macroeconomic policy coor-dination at the global level,15 there is plenty of room for regional and sub-regional processes of a similar nature. Also, although regional and internationalcontagion implies that the role of the IMF should be to manage the largestbalance-of-payments crises, regional funds could actually provide full support tosmall and medium-sized countries during crises.16 Indeed, the rising concentra-tion of balance-of-payments support on a few countries indicates that there maybe biases in the response of global financial institutions according to the size ofcountries.17 Thus, an argument can be made for a division of labor in the provi-sion of financing between world and regional organizations, with the latterassuming a greater role in the support of smaller countries.
The third is an argument for competition, particularly in the supply of ser-vices to small and medium-sized countries. Owing to their small size, the powerof these countries to negotiate with large organizations is very limited, and theirmost important defense is therefore competition in the provision of financialservices. For these countries, access to a broader menu of alternatives with whichto finance development or to manage a crisis may be relatively more importantthan the “global public goods” that the largest international organizations pro-vide (such as global macroeconomic stability). Furthermore, since they canassume they have little or no influence on the provision of those “global publicgoods,” they are prone to take the attitude of “free riders” toward them. Thisimplies that, aside from the case for complementarity between global and re-gional financial institutions, competition between the two sets of organizationsin the provision of development bank services, liquidity financing, or technicalsupport is the best arrangement for small and medium-sized countries.
The final argument in favor of regional arrangements is of a political economyorder, and may be called the “federalist” argument. In this regard the essential issueis that regional and subregional institutions enjoy a greater sense of ownershipbecause member states feel that they have a stronger voice in these organizations.
6 josé antonio ocampo
15. See United Nations (2005).16. See, for example, the estimates of Agosin (2001) for Latin America.17. See Griffith-Jones, Ocampo, and Cailloux (1999); and Ocampo (2002).
10101-01_Ch01_Redo.qxd 10/5/06 3:05 PM Page 6

experiences and challenges 7
This creates a special relationship between them and member countries, whichin the case of financial institutions may generate a strong “preferred-creditor sta-tus.” The preferred-creditor status may, in turn, reduce the risks that regional andsubregional development banks and reserve funds face, further encouraging thevirtues of risk pooling.
One element of this argument is that, no matter what arrangements areadopted at the world level, the voice of small and medium-sized countries inglobal institutions is unlikely to be strong. The inadequate representation ofdeveloping countries in existing financial arrangements, an issue that was under-scored at the International Conference on Financing for Development, held inMonterrey, Mexico, in 2002,18 and the even greater informal concentration ofpower in international financial institutions, contributes to this view. Thismeans that, within the global order, the smaller countries will be able to maketheir voice heard (or heard much more clearly) only if it takes the form of aregional voice. In fact, a paradox of the global system is that global rules aremost important for small countries, even though it is precisely they that havethe least influence over the formulation and defense of such rules. This problemcan only be solved if the smaller countries organize themselves and if regionalinstitutions are truly made part of a broader international order.
The foregoing discussion implies that, although there is a strong case forgreater international macroeconomic and financial cooperation, it is unclearwhether the increasing supply of services from the associated institutions shouldcome from a few world organizations. Rather, in some cases the organizationalstructure should be one of networks of institutions providing the required serviceson a complementary basis, and in others it should function as a system of compet-itive organizations. The provision of services required for financial crisis preven-tion and resolution should probably be closer to the first model, whereas in therealm of development finance, competition should be the basic rule (and in factshould include competition with private agents as well). But purity in the model’sstructure is probably not the more desirable characteristic: it may be better forparts of the networks to compete against one another (for example, regionalreserve funds or swap arrangements versus the IMF in the provision of liquidityfinancing) and for rival organizations to cooperate in other cases.
This implies that the International Monetary Fund of the future should bebetter viewed as the apex of a network of regional and subregional reserve fundsand swap arrangements.19 Indeed, such a structure would be more akin to that
18. United Nations (2002).19. See United Nations (1999); and Ocampo (1999, 2002, 2003).
10101-01_Ch01_Redo.qxd 10/5/06 3:05 PM Page 7

of the European Central Bank or the United States Federal Reserve system thanto its current centralized structure. To encourage the development of regionalreserve funds, incentives could be created giving them automatic access to IMFfinancing or a share in the allocation of special drawing rights (SDRs) propor-tional to their paid-in resources, or both—in other words, contributions tocommon reserve funds could be treated as equivalent to IMF quotas. As alreadynoted, regional reserve funds or swap arrangements could provide not only mostof the exceptional financing for smaller countries within a region, but also partof the financing for larger countries, and they could also serve to deter (at leastpartly) would-be speculators from attacking the currencies of individual coun-tries within a region.
This model should be extended to the provision of macroeconomic surveil-lance and consultation, as well as to the surveillance of national systems of pru-dential regulation and supervision, and to developing the infrastructure fordomestic and regional capital markets. This would complement, rather thanreplace, regular IMF surveillance and IMF/World Bank support to financialdevelopment. In the area of development financing, subregional developmentbanks can play a significant role as a mechanism for pooling the risks of groupsof developing countries, also allowing them to make more aggressive use ofopportunities provided by private capital markets.
An institutional framework such as this would have two positive features.First, it would bring more stability to the world economy by providing essentialservices that can hardly be provided by a few international institutions, owingboth to the heterogeneity of the international community and to the dynamicprocesses of open regionalism that are under way. Second, from the point of viewof the equilibrium of world relations, it could be more balanced than a systembased on a few world organizations. It could also increase the commitment ofsmall countries to abide by rules that contribute to world and regional stability.
The Challenges Facing Regional Arrangements
Regional financial cooperation also faces significant challenges, which must notbe underestimated. They relate to the viability and long-term sustainability ofthe arrangements that are created, and involve three major issues: the capacity ofa given group of developing countries to supply the relevant financial services;the need to guarantee that strong regional institutions are developed; and anequitable distribution of the benefits of regional integration.
Culpeper’s contribution to this volume poses the first of these issues as theneed to match the demands from developing countries with their capacity to
8 josé antonio ocampo
10101-01_Ch01_Redo.qxd 10/5/06 3:05 PM Page 8

experiences and challenges 9
supply the associated financial services. In this regard, he argues that the presenceof industrial or emerging-market economies within a region is crucial for success-ful financial cooperation, as they provide a rapidly growing pool of savings andgreater creditworthiness. In this sense, regional cooperation may be unable, byitself, to meet the resource needs of the poorest countries, whether they are of ashort- or long-term nature. This is particularly true when such funds must beprovided with a larger, or even a full, grant component to avoid building anunsustainable debt dynamic, as has been underscored in recent years. However,not all the potential services of regional financial institutions require additionalfunding (some forms of macroeconomic cooperation do not), and some mayactually reduce the need for external funds (reserve pooling) or allow countries toreduce the costs of accessing private capital markets (risk pooling).
In any case, for large-scale funding, partnerships with donor countries seemto be inescapable for low-income countries for the foreseeable future. The termof the partnership must be adequate, however, and could include channelingcooperation through regional institutions in ways that do not undermine devel-oping countries’ “ownership” of the regional arrangement. Indeed, this was theexperience of Western Europe during the years of postwar reconstruction char-acterized by a “dollar shortage.”20 The channeling of Marshall Plan aid throughthe European Payments Union is a successful example of external financial sup-port channeled through a regional institution.
For middle-income or “emerging” countries, the demand for regional finan-cial cooperation will depend, in part, on how deep regional trade and financialintegration are. The constraints on supplying effective services may also beimportant, but will differ in nature from those faced by low-income countries.The main problem lies in providing short-term liquidity financing to cope withcapital account shocks, particularly if external funds are supplied in a procyclicalmanner to all countries in a region and there are significant factors of “regionalcontagion.” However, cooperation from neighbors during crises may actually behighly effective, as evidenced by the successful support of France by Germanyduring the European currency crisis of 1992, or China’s support for Hong KongSAR during the Asian crisis.21 Although of a more limited nature, the successfulexperience of the Latin American Reserve Fund (which, despite its name, contin-ues to be essentially an Andean arrangement, with Costa Rica as the additionalmember) in supporting member countries during the Latin American debt crisisof the 1980s, and during the Asian crisis of the late 1990s, shows that, despite
20. Triffin (1957).21. Mistry (1999).
10101-01_Ch01_Redo.qxd 10/5/06 3:05 PM Page 9

contagion, all members of a region can benefit from the supply of liquidityfinancing by regional institutions (see Daniel Titelman’s contribution to this vol-ume). As the experience of the Latin American Reserve Fund indicates, thedemand for funds by different countries does not coincide exactly in time. Thisfacilitates the functioning of reserve funds and helps them to mitigate contagion.On the contrary, lack of support or, worse still, an explicit attempt by othercountries in a region to differentiate themselves from a regional partner under-going crisis, may reduce the effectiveness of any adjustment policies that thiscountry undertakes and end up increasing contagion.
Although “ownership” provides a strong case for regional arrangements, italso has its downside. The essential problem is that regional and subregionalinstitutions may be weak in the face of pressures from some of their individualmembers, particularly the more powerful among them. Therefore, the virtues ofownership can only be realized when matched by strong institution building,which is ultimately what will determine the effectiveness of regional cooperationarrangements. Political considerations play the dominant role in the process ofinstitution building—and indeed, regional integration is always a politicalprocess and its weakness a sign of a lack of political will to build strong regionalinstitutions.22
The history of European cooperation provides a clue about the long-termnature and complexities of this process. According to Charles Wyplosz (in thisvolume), since regional integration involves continuous erosion of nationalsovereignty—or, put in a more positive way, a transfer of sovereignty from thenation-state to regional institutions—it requires building confidence in regionalinstitutions, which takes place only gradually. Each step in this process impliesan uneasy compromise between integrationist and nationalist forces, and the lat-ter may lead to reversals in the road to integration, implying that it is not a lin-ear process.23 Although it is essential to have clear vision and objectives, amaster plan is neither necessary nor useful. To quote Wyplosz: “Integration hasalways been characterized by a process of muddling through, taking two stepsforward and one step back, with deep and lingering divergences as to what theend objective should be. But each integration step has made the next one morelikely. Success in one area emboldened political leaders to contemplate anothereven bolder project in another area. More crucially perhaps, each important stephas been matched by some additional institutional buildup, which has provided
10 josé antonio ocampo
22. Teunissen (1998).23. The associated complexities have recently manifested themselves, among other areas, in the
Stability and Growth Pact. In this case, however, as recent debates have underscored, the inappro-priateness of the Maastricht rules are a key part of the problem.
10101-01_Ch01_Redo.qxd 10/5/06 3:05 PM Page 10

experiences and challenges 11
the backbone for further moves. It is difficult to overestimate the importance ofthe early creation of institutions to support the integration process, no matterhow imperfect those institutions are.”
Powerful countries may prefer weak regional institutions, to allow them toexercise more influence over them. The struggle for regional influence amongmajor regional powers may also become an obstacle to strong institution building.This seems to have underlain some of the problems facing the design of strongregional macroeconomic arrangements in East Asia in recent years, and is evidentin other processes, such as the Southern Common Market (Mercosur). The way apower struggle among major players is settled, and whether it results in strong orweak regional institutions, will be critical for smaller members of a regional orsubregional club, which clearly benefit from strong regional institutions in theirrelations with large regional players.
Historical and cultural affinity may help institution building, as Culpeperargues in his chapter, but the story is mixed in this regard. European integrationtook place despite diversity, whereas Latin American integration has advancedslowly regardless of affinity. Political motivations are obviously behind the inte-gration efforts in these two regions, and clearly have been stronger in WesternEurope, as well as in building up the network of Arab and Islamic financialinstitutions and in the history of regional development banks. The breakdownof the regional arrangements inherited from the colonial past is quite a commonhistorical phenomenon, as evidenced by both Spanish America in the nine-teenth century and the end of colonialism in Africa and Asia in the second halfof the twentieth century. It can perhaps be argued that national institution-building almost always comes at the cost of regional integration, and in manycases involves confrontation with neighbors. Some arrangements that have sur-vived decolonization have sometimes had a troubled history, even when sup-ported by an industrial country, as macroeconomic cooperation among thefrancophone countries in West Africa indicates.
The distribution of the benefits of integration is one of the crucial issues inthe design of institutions appropriate for a given integration process. Owing toagglomeration economies, the benefits from trade integration may accrue dispro-portionately to larger and higher-income countries. So there is no presumptionthat trade integration will facilitate convergence in real incomes within regions.24
Most integration processes include provisions to facilitate an equitable distri-bution of their benefits. In trade integration, they commonly include preferen-tial rules of varying types: slower liberalization, the possibility of maintaining
24. Mistry (1996).
10101-01_Ch01_Redo.qxd 10/5/06 3:05 PM Page 11

higher levels of protection or subsidies, and exceptions to some rules. This prac-tice has been extended to World Trade Organization (WTO) agreements and,to a lesser extent, to bilateral trade agreements. In more elaborate integrationprocesses, they also include special development financing facilities and, in a fewinstances, fiscal transfers to the weaker countries or regions. Western Europeagain represents the best model in both areas. In the past, some integrationprocesses in Africa and Latin America also included industry-sharing agree-ments, under which weaker partners were allocated certain industries, but thesearrangements usually failed and were abandoned. Freer labor mobility may alsobe seen as an adjustment mechanism that allows weaker countries or regions toadapt to the effects of integration. However, although it is generally seen as anessential element of full integration, it is unlikely to be considered a rule for theequitable sharing of its benefits.
In sum, the development of a dense institutional network of regional andsubregional institutions in development finance and macroeconomic coopera-tion faces three major challenges: matching demand with supply capacities; aclear long-term commitment to institution building; and an equitable distribu-tion of the benefits of integration. These issues are interrelated: supply capacitiesare not exogenously given, as they are largely created through a gradual processof institution building; and strong institutions are unlikely to be accepted byweaker partners unless they perceive that there is an equitable distribution of thebenefits of integration.
Development Financing
Regional development financing arrangements have followed three basic mod-els. The oldest and best-developed model is multilateral development banks andrelated multilateral financial institutions. These institutions are present in allregions, although with different coverage, structures, and priorities. A secondmodel, which is mainly used by the European Union, is fiscal transfers withexplicit redistributive regional objectives. A third and more novel model is thedevelopment of regional bond markets; the most important initiatives in thisregard have come from East Asia.
The regional development banks (discussed by Francisco Sagasti and FernandoPrada in this volume) are the oldest of the first group of institutions: the Inter-American Development Bank (IDB); the Asian Development Bank (AsDB); theAfrican Development Bank (AfDB); and the European Investment Bank (EIB).Strong political motivations led to their creation in the 1950s and 1960s. The firsttwo institutions may be viewed as the result of cold war politics, while the third is
12 josé antonio ocampo
10101-01_Ch01_Redo.qxd 10/5/06 3:05 PM Page 12

experiences and challenges 13
the daughter of decolonization. EIB was born, in turn, out of two basic objectivesof European integration: to support lagging regions and thus an equitable integra-tion process; and to finance the investment in the infrastructure of integration—“regional public goods” in current terminology (see in this regard the chapter byStephany Griffith-Jones, Alfred Steinherr, and Ana Teresa Fuzzo de Lima in thisvolume). To these we should add the European Bank for Reconstruction andDevelopment (EBRD), which was established in 1991 and is the daughter ofpost–cold war politics.
With the exception of the EIB, which is made up entirely of industrial-countrymembers, all of which can borrow from the institution, the regional banksinclude a division between developing country borrowers and nonborrowingindustrial-country members. Borrowing members are a majority in AfDB andslightly over half of the capital of IDB, but are a minority in AsDB and particu-larly in EBRD. This structure was adopted only late (in 1982) by the AfricanDevelopment Bank, which was initially a strictly African institution, but wasforced to converge with the structure of other regional development banksbecause of its financial difficulties.
This capital structure allows developing countries to benefit from the excellentcredit rating of the industrial-country members. It is amplified by the practice ofmaintaining a large ratio of subscribed to paid-in capital, which may be seen as ahuge guarantee fund for the credit operations of these institutions. This may beunderstood as a cross-subsidy from countries with good to weaker credit ratings. Itmay also be seen, however, as a correction of a market failure: the overestimation ofrisk in private capital markets, particularly during periods of bust in private financ-ing. The better lending conditions, as well as the willingness of these institutions tofinance countries under difficult circumstances—that is, during crises—tend toreinforce their preferred-creditor status. This becomes a “self-fulfilling prophecy”in terms of portfolio quality, and in this sense can also be considered a correctionof market failures: low risk margins are justified by the fact that loan losses are min-imal, but this reinforces the willingness of debtors to keep a good credit historywith these institutions. The requirement that first-class guarantees be maintained(from governments or private banks) further reinforces credit quality, whereas thelack of retail services reduces the staff required and thus intermediation costs.25
The most elaborate system of multilateral financial institutions that arestrictly “developing-country-owned” is that of the Arab and Islamic world. AsGeorges Corm describes in this volume, the origin of these institutions lies in
25. For a further analysis of these issues, see the two chapters by Sagasti and Prada andGriffith-Jones, Steinherr, and Fuzzo de Lima in this volume. See also Birdsall (2001).
10101-01_Ch01_Redo.qxd 10/5/06 3:05 PM Page 13

the regional solidarity generated by the Arab-Israeli war of 1967 and, in eco-nomic terms, in the sudden increase in resources of Arab oil-exporting coun-tries in the 1970s. Most of these institutions started to operate in the 1970s,although one of them, the Arab Fund for Economic and Social Development(AFESD), had been created in 1968. With the partial exception of the IslamicDevelopment Bank, which includes some major non-oil-exporting countries asshareholders, these institutions essentially operate as mechanisms for transfer-ring resources from the oil-rich countries of the region to poorer regional mem-bers, as well as to other developing countries, particularly in the Islamic worldand Africa. Thus they complement the specific national cooperation extendedby the oil-rich countries. This feature also implies that lending by these institu-tions is highly dependent on the oil price. This reduces the countercyclical rolethat financing by multilateral development banks should play.26 The sharpupturn in oil prices since 2000 has led, however, to a small increase in funding,relative to the oil boom of the 1970s; thus financing by these institutionsremains today significantly below the levels reached in the second half of the1970s and early 1980s. They have also made suboptimal use of the opportuni-ties to tap global or national capital markets.
The largest of these multilateral institutions in terms of cumulative commit-ments is the Islamic Development Bank, which also has the largest membershipand the largest interregional coverage of its lending operations. It is followed bythe Arab Fund for Economic and Social Development, which provides softlending operations for Arab League countries, largely for infrastructure projects.In turn, the Arab Monetary Fund focuses its activities on financing inter-Arabtrade. Although smaller in size, the Arab Fund for the Development of Africachannels funds to the African continent. Other institutions provide equity capi-tal and insurance coverage for inter-Arab investment. The main beneficiaries ofthis network of institutions are the middle- and low-income Arab countries,which have received on average about three-fifths of the financing that has beenavailable from the institutions since 1970. Indeed, some of these countries, par-ticularly in the Middle East, have received more funds from these institutionsthan from countries in the Development Assistance Committee of the Organi-zation for Economic Cooperation and Development (DAC/OECD).
Integration efforts in sub-Saharan Africa have also led to the design of somedevelopment banks and other financial institutions. These institutions were setup by the Economic Community of West African States (ECOWAS) and thefailed (but now revived) East African Community—although its financial
14 josé antonio ocampo
26. See Ocampo (2002); and United Nations (2005, chap. 5).
10101-01_Ch01_Redo.qxd 10/5/06 3:05 PM Page 14
experiences and challenges 15
branch, the East African Development Bank, survived that process. To thesemust be added the trade financing facilities set up more recently by the CommonMarket for Eastern and Southern Africa (COMESA). However, as Culpeperargues in this volume, their performance has been modest at best. Nonetheless,their existence creates the possibility of using them more actively in the future asinstruments of regional development.27
Latin America and the Caribbean undoubtedly provide the best example of awell-developed network of subregional financial institutions, which includethree major banks: the Andean Development Corporation (CAF, CorporaciónAndina de Fomento), the Central American Bank for Economic Integration(CABEI), and the Caribbean Development Bank (CDB) (see the chapter byTitelman in this volume).28 These institutions were created in the 1960s to sup-port the subregional integration processes and thus service the small andmedium-sized countries of the region, which are the main participants in thoseintegration processes. The Central American and Caribbean banks have thesame structure as the regional development banks, and thus include both bor-rowing and nonborrowing countries; nevertheless, some of the nonborrowingcountries are the larger Latin American countries in the vicinity of CentralAmerica, which are also part of the Caribbean basin.
The Andean Development Corporation is unique in being exclusively ownedby developing countries (Spain joined in recent years, but is also a potential bor-rower). It is the most dynamic of all these institutions, and in recent years itsloans to the Andean countries have actually surpassed joint lending to thesecountries by the IDB and the World Bank. Its membership has also graduallyincreased to near that of a regional development bank. This dynamic institutionis, indeed, the best example of risk pooling in the developing world: it holdsinvestment-grade status, regardless of the fact that none of the Andean countriesdoes. The meager loan losses experienced by the Andean Development Corpo-ration, despite the troubled macroeconomic history of most of its members, alsodemonstrate the strong preferred-creditor status of this institution with itsmembers. The Caribbean Development Bank is a smaller but also very dynamicinstitution in the subregion. The history of the Central American Bank for Eco-nomic Integration is more mixed. It experienced a severe crisis in the 1980s as a
27. See a full inventory of these institutions in United Nations, Economic Commission forAfrica (ECA) (2004, chap. 6). Some of these institutions have cofinancing arrangements with theAfrican and the Islamic development banks.
28. A fourth small institution, FONPLATA (Fondo Financiero para el Desarrollo de la Cuencadel Plata), finances projects for the development of the Plata River basin.
10101-01_Ch01_Redo.qxd 10/5/06 3:05 PM Page 15

result of the arrears of one of its members, Nicaragua, but recovered in the latterpart of that decade and has expanded again since the 1990s.
There are crucial regional differences in the roles played by different types ofmultilateral development banks in the various regions (see table 1-1). As dis-cussed, the expansion of regional development banks has focused primarily onthe middle-income countries, where their combined net flows surpass those ofthe World Bank. In the Middle East and North Africa, the Arab and Islamicinstitutions are also an important financing source. In Latin America and theCaribbean, IDB lending surpasses the World Bank’s by a large margin, and thesubregional banks also play an important role where they operate. Indeed, astable 1-1 indicates, the subregional banks make the largest contribution, relativeto gross domestic product (GDP), in the small and medium-sized countries ofLatin America and the Caribbean, followed by the Middle East and NorthAfrica. Sub-Saharan Africa and South Asia are highly dependent on the WorldBank/IDA (International Development Association). East Asia falls somewherein between, with the World Bank lending slightly more than the AsDB and,as in South Asia, with a relative absence of developing-country-owned financialinstitutions. The EIB is the dominant institution in Europe, even when weleave aside the old members of the European Union (EU-15 in the table). In thetransition economies, however, both the World Bank and the EBRD play animportant role.
The greater weight of poorer borrowing members in different regions, and thesupport provided through different financial institutions by nonborrowing indus-trial countries, is also reflected in the relative share of concessional lending andgrants. Thus concessional lending is particularly important for AfDB (44 percentof total lending), the World Bank/IDA (40 percent), and the AsDB (27 percent);the IDB also has a concessional fund for special operations that amounts to 7 per-cent of total lending.29
Given the fact that only limited concessional lending can be provided by insti-tutions entirely owned by developing countries, poor countries are likely to con-tinue to be dependent on official development assistance (ODA) provided byindustrial countries and to a certain extent intermediated by multilateral develop-ment banks. This coincides with the arguments put forward by Culpeper and theabove analysis of the constraints on regional cooperation in the poorest coun-tries. The strong presence of developing country–owned financial institutions inthe Arab and Islamic countries and in several subregions of sub-Saharan Africa,as well as in Latin America and the Caribbean, reflects a mix of cultural affinity
16 josé antonio ocampo
29. World Bank and IMF (2005, box 6.1).
10101-01_Ch01_Redo.qxd 10/5/06 3:05 PM Page 16

Tab
le 1
-1.
Mul
tilat
eral
Dev
elop
men
t Ban
ks: O
utsta
ndin
g Lo
ans,
2004
a
Mill
ions
of c
urre
nt U
.S. d
olla
rs
Latin
Am
eric
a an
d th
e C
arib
bean
Mid
dle
Rest
of L
atin
Ea
st an
dEa
st A
siaA
rgen
tina,
Am
eric
aO
utsta
ndin
gN
orth
an
d So
uth
Cen
tral
Rest
ofB
razi
l,an
d th
e In
stitu
tion
loan
sA
fric
aA
fric
aPa
cific
Asia
Asia
EU-1
5Eu
rope
Mex
ico
Car
ibbe
an
Wor
ld B
ank
grou
pIn
tern
atio
nal B
ank
for
104,
401
4,48
48,
655
25,9
8110
,354
4,18
315
,117
24,5
2311
,103
Rec
onst
ruct
ion
and
Dev
elop
men
t (IB
RD
)b
Inte
rnat
iona
l Dev
elop
men
t12
0,90
748
,120
3,56
115
,643
43,8
042,
654
2,52
14,
604
Ass
ocia
tion
(ID
A)b
Regi
onal
dev
elop
men
t ban
ksE
urop
ean
Inve
stm
ent B
ankc
656,
578
597,
486
45,9
60In
ter-
Am
eric
an D
evel
opm
ent
49,8
0028
,138
21,6
61B
ank
(ID
B)d
Fund
for
Spec
ial
7,00
01,
131
5,86
9O
pera
tion
sd
Afr
ican
Dev
elop
men
t Ban
k8,
511
6,72
41,
787
Gro
up (
AfD
B +
AfD
F +
NT
F)e
Asi
an D
evel
opm
ent B
ank
24,1
5915
,112
9,04
7(A
sDB
)A
sian
Dev
elop
men
t Fun
d 27
,216
17,0
2510
,192
(AsD
F)E
urop
ean
Ban
k fo
r 18
,434
3,78
17,
961
6,69
3R
econ
stru
ctio
n an
d D
evel
opm
ent (
EB
RD
)f
(con
tinue
d)
Euro
peA
sia
10101-01_Ch01_Redo.qxd 10/5/06 3:05 PM Page 17

Tab
le 1
-1.
(con
tinue
d)M
illio
ns o
f cur
rent
U.S
. dol
lars
Latin
Am
eric
a an
d th
e C
arib
bean
Mid
dle
Rest
of L
atin
Ea
st an
dEa
st A
siaA
rgen
tina,
Am
eric
aO
utsta
ndin
gN
orth
an
d So
uth
Cen
tral
Rest
ofB
razi
l,an
d th
e In
stitu
tion
loan
sA
fric
aA
fric
aPa
cific
Asia
Asia
EU-1
5Eu
rope
Mex
ico
Car
ibbe
an
Subr
egio
nal d
evelo
pmen
t ban
ksN
ordi
c In
vest
men
t Ban
k 14
,125
424h
847i
11,3
0098
956
5j
(NIB
)g
Nor
dic
Dev
elop
men
t Fun
d 52
824
0h18
1i10
8j
(ND
F)k
Cen
tral
Am
eric
an B
ank
for
2,78
92,
789
Eco
nom
ic I
nteg
rati
on
(CA
BE
I)l
Car
ibbe
an D
evel
opm
ent
2,48
42,
484
Ban
k (C
DB
)m
And
ean
Dev
elop
men
t 7,
216
433
6,78
3C
orpo
rati
on (
AD
C)
FON
PLA
TA
n37
894
284
Nor
th A
mer
ican
Dev
elop
men
t43
22B
ank
(NA
DB
)o
Eas
t Afr
ican
Dev
elop
men
t 11
111
1B
ank
(EA
DB
)p
Wes
t Afr
ican
Dev
elop
men
t 54
554
5B
ank
(BO
AD
)Is
lam
ic D
evel
opm
ent B
ank
17,9
291,
793
8,84
51,
076
4,12
423
91,
853
Gro
up (
IsD
B +
ICD
)q
Euro
peA
sia
10101-01_Ch01_Redo.qxd 10/5/06 3:05 PM Page 18

Ara
b B
ank
for
Eco
nom
ic60
660
6D
evel
opm
ent i
n A
fric
a (A
BE
DA
)A
rab
Fund
for
Eco
nom
ic a
nd11
,982
11,9
82So
cial
Dev
elop
men
t (A
FESD
)A
rab
Mon
etar
y Fu
nd1,
297
1,29
7
Tot
al1,
077,
050
63,0
4736
,138
75,8
6577
,519
10,8
5761
6,74
773
,133
54,3
4156
,251
Tot
al w
itho
ut W
orld
Ban
k 85
1,74
210
,442
23,9
2234
,241
23,3
624,
020
616,
747
55,4
9530
,491
39,8
71gr
oup
GD
Pr51
1,81
862
2,39
63,
016,
618
878,
785
645,
548
12,1
67,8
791,
154,
722
1,43
2,85
456
4,51
9
Sour
ces:
Dat
a co
mpi
led
from
the
offic
ial w
eb p
ages
of e
ach
inst
itut
ion.
Whe
re a
vaila
ble,
dat
a w
ere
obta
ined
from
the
annu
al r
epor
ts o
f eac
h in
stit
utio
n fo
r 20
04.
a. R
egio
ns: J
apan
is n
ot in
clud
ed in
the
figur
es fo
r E
ast A
sia.
Gul
f Coo
pera
tion
Cou
ncil
mem
bers
(Sa
udi A
rabi
a, B
ahra
in, K
uwai
t, O
man
, Qat
ar, U
nite
d A
rab
Em
irat
es)
are
not i
nclu
ded
in to
tal G
DP
for
the
Mid
dle
Eas
t and
Nor
th A
fric
a.b.
Cou
ntry
dis
trib
utio
n by
cum
ulat
ive
IBR
D a
nd I
DA
lend
ing.
Dat
a fr
om 2
005.
c. A
lso
repo
rts
cred
its
to A
CP
(1 p
erce
nt) a
nd A
sia
and
Lati
n A
mer
ica
(1 p
erce
nt) w
itho
ut a
ny fu
rthe
r di
sagg
rega
tion
(not
incl
uded
in th
e ta
ble)
. Cou
ntry
dis
trib
utio
n by
2004
loan
app
rova
ls. D
ata
from
200
5.d.
Cou
ntry
dis
trib
utio
n by
app
rove
d lo
ans
(196
1–20
06).
e. C
ount
ry d
istr
ibut
ion
by d
ebt o
utst
andi
ng.
f. C
ount
ry d
istr
ibut
ion
by to
tal p
roje
ct v
alue
of E
BR
D in
vest
men
ts.
g. S
ome
rela
tivel
y sm
all c
redi
ts g
o to
the
Rus
sian
Fed
erat
ion
(Cen
tral
Asi
a), w
ithou
t fur
ther
dis
aggr
egat
ion.
Cou
ntry
dis
trib
utio
n by
200
4 lo
an p
ortf
olio
s. D
ata
from
200
5.h.
Inc
lude
s N
orth
Afr
ica.
i. T
otal
for
all r
egio
ns o
f Asi
a.j.
Tot
al fo
r La
tin
Am
eric
a an
d th
e C
arib
bean
.k.
Cou
ntry
dis
trib
utio
n by
pro
ject
por
tfol
ios.
l. R
epor
ted
as g
ross
loan
por
tfol
io.
m. R
epor
ted
as n
et to
tal f
inan
cing
.n.
As
repo
rted
. Not
spe
cific
whe
ther
figu
res
repr
esen
t cum
ulat
ive
lend
ing,
out
stan
ding
lend
ing,
or
lend
ing
for
a sp
ecifi
c ye
ar.
o. C
ount
ry d
istr
ibut
ion
for
Mex
ico
(50
perc
ent)
and
Uni
ted
Stat
es (
50 p
erce
nt, n
ot in
clud
ed in
the
tabl
e) b
y lo
an p
ortf
olio
s.p.
Dat
a fr
om 2
003.
q. C
ount
ry d
istr
ibut
ion
by I
sDB
net
app
rove
d op
erat
ions
she
et. D
ata
from
142
5H (
2004
–05)
.r.
GD
P da
ta fr
om W
orld
Ban
k, W
orld
Dev
elop
men
t Ind
icat
ors(
onlin
e) d
atab
ase.
10101-01_Ch01_Redo.qxd 10/5/06 3:05 PM Page 19

and political motivation, while their absence in South and East Asia reflects thelack of these factors.30
The difference in the portfolios of the various multilateral developmentbanks reflects not only their specific strategies, but also their adaptation to thediversity of demands and financial needs of the developing world and the transi-tion economies. Thus while the IDB has focused increasingly on social spend-ing, subregional banks in Latin America and the Caribbean give greater weightto infrastructure and production sector lending.31 Both the AfDB and theAsDB give more emphasis to infrastructure than the IDB does. The heavy focuson infrastructure lending is also typical of Arab institutions. Financing intra-regional trade is also a mandate of some institutions, particularly the Arab Mon-etary Fund. Although many institutions have private sector lending facilities,which have tended to grow over time, this is the focus of EBRD activities (seethe contributions of Corm, Sagasti and Prada, and Titelman in this volume).According to Sagasti and Prada, this diversity in the portfolios of these institu-tions is “in line with the general idea behind the creation of regional and sub-regional institutions: they play specific and localized roles, which are not alwayscovered adequately by global or even by regional institutions.”
The combination of collective-action problems in regional processes, in theabsence of supranational institutions, indicates how important the regional andsubregional development banks can be in supporting regional strategies. Theycan provide a coordination mechanism for member countries to plan andfinance the provision of regional infrastructure. This is an incipient activity inmost of the developing world but one that has been receiving increasing atten-tion from some regional and subregional banks.32 These institutions also have theability to provide a regional public good essential for development: the trans-mission and utilization of region-specific knowledge. That ability puts them in aposition to help countries in their respective regions to design specific policies
20 josé antonio ocampo
30. Nonetheless, South Asia set up a modest development fund in 1991. See United NationsEconomic and Social Commission for Asia and the Pacific (United Nations, ESCAP) (2004,chap. 6), which provides a full inventory of regional cooperation mechanisms in South and
East Asia. United Nations, ESCAP (2005) also proposed the creation of an Asian Investment Bank.31. As Sagasti and Prada argue in this volume, the trend in lending by regional development
banks has involved reduced support for the productive sector through state-owned financial insti-tutions, but has been partially offset by operations with private banks and the development ofdomestic capital markets, which are classified as “financial infrastructure.”
32. This is the case with the Initiative for the Integration of Regional Infrastructure in SouthAmerica (Iniciativa para la Integración de la Infraestructura Regional Suramericana, IIRSA) andthe Plan Puebla-Panama (involving Mexico and Central America).
10101-01_Ch01_Redo.qxd 10/5/06 3:05 PM Page 20

experiences and challenges 21
appropriate to the countries’ economic needs and political constraints.33 None-theless, there is still very little financing of “regional public goods” in most ofthe institutions serving developing countries (1 percent or less for the AfDB,AsDB, and IDB), as well as in ODA in general.34 This is in sharp contrast withthe experience of the European Investment Bank, which has had regional infra-structure as one of its major mandates since its creation.
Indeed, as was pointed out at the beginning of this section, the EIB, thelargest multilateral development bank in the world, is probably the best exampleof an institution designed to help compensate for regional disparities and to sup-port the development of regional infrastructure. In recent decades, it has alsobeen increasingly used for major extraregional initiatives of the European Union,such as projects in the African, Caribbean, and Pacific (ACP) countries and theMediterranean region, as well as the liberalization processes of the former social-ist countries of Central and Eastern Europe. Another reason for creating thisinstitution in the 1950s was to correct market failures, since currencies were notfully convertible and international private capital markets had not fully recoveredfrom the collapse of the 1930s, but it has continued to grow in recent decades,despite full capital account convertibility and booming global financial markets.
The chapter by Stephany Griffith-Jones, Alfred Steinherr and Ana TeresaFuzzo de Lima in this volume provides some clues about the strengths of thisinstitution in a region with significant financial development. Some of the rea-sons are: (1) the implicit subsidy and better access to finance by poorer countriesin the region, which fulfills one of its historical mandates; (2) its signaling role toprivate lenders, which helps to correct another type of market failure (informa-tion asymmetries) and may be particularly important for infrastructure invest-ment, one of its major lending activities; (3) the capacity to internalize the risksof offering long-term lending at fixed rates (which, nonetheless, as the authorsargue, can be more costly to a borrower than floating interest rate loans of simi-lar maturity); and (4) its capacity to be very competitive in its pricing, whichmakes it a desirable source of borrowing even by large private banks in the caseof “global loans” for financing small and medium-sized enterprises. On the con-trary, correcting market failures associated with large risks in innovative sectorshas not been one of the main activities of the EIB. In the recent past, this has ledto the creation of the European Investment Fund—of which it is the largestshareholder—to provide guarantees, take equity participation, and support venture
33. See Birdsall and Rojas-Suarez (2004).34. See Birdsall (2006).
10101-01_Ch01_Redo.qxd 10/5/06 3:05 PM Page 21

capital funds. However, on the whole, this institution continues to be risk averse,which is indeed a salient feature of multilateral development banks.
The creation of EIB as an instrument of European integration was matchedfrom the beginning by fiscal transfers to poorer regions and specific sectors (par-ticularly agriculture). This implied an explicit acknowledgment that integrationwould not achieve the aim of helping different parts of an integrating region toconverge in their development levels, in the absence of an explicit policy toachieve this purpose—a policy that came to be labeled “cohesion policy.” Thefocus on lagging regions rather than countries has also provided a source of sup-port from major countries to this policy, because even rich countries may havelagging regions. These fiscal redistributive mechanisms (structural and cohesionfunds) were further reinforced at every major step in the history of Europeanintegration. So they were extended as a result of the northern expansion of theEuropean Community in the 1970s, particularly when the relatively poorerSouthern European countries were incorporated in the 1980s. The 1990s saw,in turn, the design of more generous pre-accession funding for Central Euro-pean countries. Although regional and even global trade integration processeshave generally recognized the asymmetries of its member states, fiscal transfershave rarely been tried outside Europe; in fact, they were only used, rather unsuc-cessfully, in the early postcolonial experience of the East African Community.
The historical dearth of regional financial cooperation in South and East Asiahas been amply compensated for in recent years by a series of initiatives in thearea of development financing, as well as in monetary cooperation. The majorreason was the traumatic experience of the 1997 East Asian financial crisis.These initiatives also reflect a sense of frustration with the slow speed and even,in many areas, the international financial system’s complete lack of reform toenable it to face the problems that became evident during the Asian crisis, aswell as a critical view of the policies implemented by the global financial institu-tions for managing the crisis.35
Although there have been proposals to create an Asian Investment Bankalong the lines of the EIB,36 the major initiatives under implementation relateto support for the development of national and regional bond markets. Thebasic rationale for these initiatives is the sense that over-reliance on short-termforeign currency loans was a major factor in the East Asian crisis. Since the cri-sis, another important factor has been the large current account surpluses andinternational reserves accumulated by economies in the region. International
22 josé antonio ocampo
35. Park and Wang (2000); Sakakibara (2003).36. See United Nations, ESCAP (2005).
10101-01_Ch01_Redo.qxd 10/5/06 3:05 PM Page 22

experiences and challenges 23
reserves, as well as private funds, are to a large extent invested in the deeperbond markets of the industrialized countries, some of which are recycled backinto the region by foreign financial intermediaries. According to this view, thedevelopment of deeper national and regional bond markets would help to short-circuit this intermediation through world financial centers outside Asia. There-fore, the development of bond markets will be both a development and acrisis-prevention instrument, helping in the latter case to reduce the maturityand currency mismatches in the portfolios of private agents that were at theheart of the East Asian crisis.
The various initiatives, reviewed by Yung Chul Park, Jae Ha Park, JuliaLeung, and Kanit Sangsubhan in their contribution to this volume, have takenplace in different regional forums and are of two different types.37 The first are ofan institutional nature and aim to develop appropriate infrastructure for thefunctioning of either national or regional bond markets, particularly for bondsdenominated in the local currencies of the economies of the region. This in-cludes the Asia Pacific Economic Cooperation (APEC) initiative for developingsecuritization and credit-guarantee markets by means of policy dialogue and theprovision of expert advice and panel visits to the economies concerned. In a simi-lar vein, the ASEAN+3 (China, Japan, and the Republic of Korea) initiativefocuses on facilitating market access by several public and private sector agents,and on improving the institutional infrastructure, including regional clearing andsettlement mechanisms, credit-guarantee and hedging facilities, the developmentof national and regional credit rating agencies, and the dissemination of informa-tion on Asian bond markets. In a complementary manner, the various workinggroups convened under this initiative will aim to improve the harmonization offinancial standards, regulatory systems, and tax treatment of financial assetsthroughout the region.
The second type of initiative, launched by the eleven members of the Execu-tives’ Meeting of East Asia–Pacific Central Banks (EMEAP), has focused ondeveloping specific funds, the Asian Bond Funds (ABFs).38 ABF 1, announced inJune 2003, was composed of U.S. dollar-denominated bonds issued by sovereignand quasi-sovereign issuers of the eight emerging economies of EMEAP.Although this first action represented a milestone in central bank cooperation, itwas limited in size (to U.S.$1 billion), and more particularly, it did not supportthe development of local-currency-denominated bonds. So a second fund (ABF 2)
37. See also United Nations, ESCAP (2004, 2005).38. The eleven members of EMEAP are Australia, China, Hong Kong SAR, Indonesia, Japan,
Republic of Korea, Malaysia, New Zealand, the Philippines, Singapore, and Thailand.
10101-01_Ch01_Redo.qxd 10/5/06 3:05 PM Page 23

was launched in December 2004, with an initial amount of U.S.$2 billion, toinvest in local-currency-denominated bonds of the EMEAP emerging economies,and to help create a convenient and cost-effective instrument fund and a newasset class for regional and institutional investors. As argued by Yung Chul Parkand his coauthors, this new initiative has helped to introduce a new asset class(exchange-traded bond funds) and a new family of bond indexes; it has helped toremove some of the barriers to cross-border capital flows; and it has contributedto the adoption of new standards and to greater market transparency. All theseeffects, which largely relate to developing the associated regional financial infra-structure, indicate that this initiative is complementary to the above-mentionedapproach that focuses directly on developing the regional financial infrastructure.
Macroeconomic Cooperation
Contrary to the rich historical experience in the area of development financing,particularly with multilateral development banks, there is a dearth of experi-ences in the area of macroeconomic cooperation in the developing world. How-ever, several initiatives have been launched in this area in recent years. Theysometimes match regional trade initiatives that have resulted from the dynamicprocess of “open regionalism” currently under way, and attempt to replicate insome ways the experience of European monetary integration. Some of the exist-ing arrangements, as well as new initiatives, show the potentialities of this formof cooperation in the developing world, but also their limitations. As theattempts to replicate European trade integration in the past have had mixed suc-cess in the developing world, the more recent attempts to replicate Europeanmacroeconomic cooperation follow a similar mixed pattern. Furthermore,regional trade integration is more limited in the developing world than inEurope—although it has been growing rapidly in some regions, particularly inEast Asia. There are, however, two additional rationales for macroeconomiccooperation in the developing world, particularly in emerging economies: tobuild stronger walls of defense against financial crises; and to avoid distortingcompetition among export-oriented economies.39
The links between trade and macroeconomic cooperation are, of course, atthe heart of the formation of the European Union. As Wyplosz argues in thisvolume, this feature has been accompanied by two other major characteristics.The first is the emphasis on building strong institutions, albeit in a gradual andpragmatic way. The second is the clear subordination of macroeconomic coop-
24 josé antonio ocampo
39. See Sakakibara (2003).
10101-01_Ch01_Redo.qxd 10/5/06 3:05 PM Page 24

experiences and challenges 25
eration to the objective of trade integration. The major objective of macro-economic cooperation has thus been exchange rate stability, which has been seenas the only way to create a level playing field for intraregional trade. In particular,real exchange rate stability has been the implicit target of such cooperation.
Since the breakdown of the Bretton Woods parities, this has implied thenegotiation of regional arrangements (the snake, followed by the European Mon-etary System) to stabilize exchange rate parities, which finally led to EuropeanMonetary Union (EMU). Until the launch of EMU, these arrangements notonly left room for limited flexibility (variable over time), but also involved a largenumber of nominal exchange rate adjustments, which used purchasing powerparity criteria to determine the level of adjustment for achieving a desirable realtarget. These readjustments were fully symmetrical, thus involving both strongand weaker currencies at different moments. The choice of bilateral parities wascollective, and was in fact based on consensus. Although the deutschmark gradu-ally emerged as the anchor/central currency, this feature was not part of thesystem of cooperation to stabilize the exchange rates, and indeed was only con-solidated de facto in the late 1980s. In turn, the defense of agreed paritiesimplied the unprecedented commitment, if necessary, to defend the agreed pari-ties with unlimited interventions by both countries whose bilateral rates werepushed to the declared margin of fluctuation. This rule implied that no explicitreserve pooling was necessary.
The commitment to exchange rate stability implied that capital mobility wasentirely subordinated to that objective. This meant that capital controls were inplace for decades, and were reestablished when necessary. Therefore, whereascurrent account convertibility came early (in 1958, coinciding with the launch ofthe Common Market), capital account liberalization came late, and was part of agradual process that did not culminate in the collective removal of capital con-trols until 1990. This was soon followed by a major crisis in 1992. It thusbecame clear that exchange rate stability required a full-fledged movementtoward monetary union. This was combined with the Stability and Growth Pact,which established explicit fiscal rules and convergence criteria. Although theprinciple that monetary integration must be accompanied by fiscal discipline iswidely accepted, the rationale of the specific rules adopted in the MaastrichtTreaty (which target the current fiscal deficit rather than a structural deficit or,better still, debt sustainability), as well as the mechanisms of enforcement (whichare intrusive into national sovereignty, but for the same reason weak in practice),have become a subject of heated debate in recent years.
Wyplosz’s summary of the sequence followed by the European Union and itsimplications for similar arrangements in the developing world today is sharp
10101-01_Ch01_Redo.qxd 10/5/06 3:05 PM Page 25

and simple: “Regional trade integration, exchange rate stability and institution-building came first, capital mobility and monetary union came later. A keyquestion is whether this sequencing can be modified and whether the pace canbe accelerated. The answer is that both are quite unlikely.” This answer is, ofcourse, critical, and refers both to the potential benefits of macroeconomiccooperation and to current debates on capital account liberalization.
Indeed, the classical case for optimum currency areas assumes not only a simi-larity among participating countries, but also a high level of economic integra-tion among participating countries.40 Accordingly, one of the major benefits ofcurrency union is that it encourages intraregional trade by eliminating one of the“taxes” on trade: the uncertainties associated with exchange rate volatility. Anadditional argument is that it acts as an external disciplining agent on individualmembers and, to the extent that one of the members is a strong economy, itallows others to “borrow credibility.”
Capital account liberalization continues to be a topic of heated debate. Itscosts in terms of macroeconomic volatility are by now widely recognized.41 Onthis basis, many analysts claim that capital account liberalization is undesirablefor the developing world, and that some form of capital account controls or reg-ulations should be the rule rather than the exception.42 In terms of the debateon regional cooperation, this means that capital account liberalization shouldbe, at best, the end rather than the beginning of a process of macroeconomiccooperation. This was, in fact, the route followed by the European Union—a long route indeed, taking more than three decades to complete the transition.It is also the sequence between trade and capital account liberalization recom-mended by McKinnon.43 However, given the pervasiveness of global capitalmarkets and related financial innovations, and the fact that several countrieshave already liberalized their capital accounts, new questions arise about theappropriateness of classical sequencing issues and even about the rationale forcurrency unions. In particular, and following the defense of polar exchange rateregimes, it has been argued that a developing country with full capital accountliberalization that is not willing to adopt a fully flexible exchange rate may find
26 josé antonio ocampo
40. See Mundell (1961); and McKinnon (1963). The classical criteria proposed by Mundelland McKinnon include a large share of intraregional trade and synchronized business cycles, whichassume a substantial degree of economic integration. They also indicate that a common currencyarea is more attractive for smaller countries and when factor markets are more flexible.
41. See, for example, Prasad and others (2003).42. See, for example, Stiglitz and others (2006).43. McKinnon (1979).
10101-01_Ch01_Redo.qxd 10/5/06 3:05 PM Page 26

experiences and challenges 27
it more desirable to dollarize or euroize than to form a currency union withother developing countries.
Although the developing world’s experience with monetary unions has beenneither abundant nor successful, European monetary integration has sparkedsome initiatives for forming monetary unions in the developing world. The ini-tiative taken by the members of the Gulf Cooperation Council stands out inthis regard.44 The members of the Caribbean Community are also formallycommitted to a monetary union but have not made much progress in thatdirection. As with other developing countries where independence was notgained until after World War II, the formation of a monetary union amongthese countries would in a sense be a return to the monetary arrangements ofthe past, where these countries shared a common currency (in the Caribbean,until the early 1960s), although they are now managed by the countries them-selves and perhaps do not have the strict currency-board characteristics of thecolonial arrangements.
Even more than monetary unions, the European experience has encouragedlooser forms of macroeconomic dialogue or more elaborate consultations in thedeveloping countries, including the adoption of Maastricht-type criteria in the con-text of several integration processes.45 However, unless the adoption of these cri-teria leads to regular surveillance, as well as to consultation processes that helpto internalize the effects of macroeconomic policies on regional partners, theircredibility and rationale may be totally lost. In the developing world it is alsonecessary to strike a balance between targets and a certain degree of policy flexi-bility, which is essential for economies subject to large shocks. However, theright balance is difficult to achieve.
As discussed, the 1997 crisis led, in East Asia, to the adoption of the ChiangMai Initiative, aimed at building a strong pillar of regional balance-of-paymentssupport as a crisis-prevention device. Preexisting arrangements in this area werethe Latin American Reserve Fund and the ASEAN Swap Arrangement.
One way to view these different initiatives is that they break up macro-economic cooperation into its basic components: macroeconomic policy dia-logue and eventual policy surveillance and consultation; liquidity support duringcrises; and exchange rate coordination. Furthermore, given the frequency ofshocks faced by developing countries, they generally eliminate (or, at least, signif-icantly postpone in time) the desirability of the third component—which, as we
44. International Monetary Fund (1973).45. See, for example, United Nations, ECA (2004, chap. 6) in relation to sub-Saharan Africa,
and United Nations, ECLAC (2002b, chap. 5) in relation to Latin America and the Caribbean.
10101-01_Ch01_Redo.qxd 10/5/06 3:05 PM Page 27

have seen, was the major objective of European macroeconomic cooperation. Itshould be added that clearinghouses for intraregional trade are a weaker form ofmacroeconomic cooperation, which is closely tied to trade integration. They alsobring specific benefits during crises: by reducing the need for foreign exchange tosettle intraregional transactions they may help to mitigate the effects of crises onintraregional trade and the multiplier effects on macroeconomic activity. Thereare several experiences of this type in the developing world, some of which havebeen functioning for several decades; a few have faced difficulties owing to theaccumulation of arrears by some members during balance-of-payments crises.46
However, we shall not examine their experience here.The history of common currency areas in sub-Saharan Africa shows how dif-
ficult these arrangements can be in the developing world, even when they havethe strong backing of an industrial country.47 The monetary arrangementsamong the former British colonies collapsed soon after independence, but afranc zone survived in Western Africa with strong French backing. It is orga-nized into two currency unions: the West African Economic and MonetaryUnion (WAEMU), and the Central African Economic and Monetary Union.48
The larger Economic Community of West African States, comprising the firstgroup of countries plus some others, set an agenda that adopted a monetarycooperation program, aimed at a single currency, but its achievements havebeen limited to improving intraregional payments.49 In 2000, five of its mem-bers agreed to create a West African Monetary Zone, and to merge this zonewith the West African Economic and Monetary Union.50 However, the conver-gence process has been slow and the deadline for merging this zone with theexisting monetary union (December 2005) was postponed until December2009. In recent decades, initiatives in East and South Africa have focused on
28 josé antonio ocampo
46. In Central America, for example, Nicaraguan arrears led, in the early 1980s, to the accu-mulation of large debts with other countries in the subregion, as well as to the suspension of lend-ing by the Central American Monetary Stabilization Fund of the Central American Bank forEconomic Integration.
47. See the chapters by Ernest Aryeetey and Roy Culpeper in this volume, as well as Honohanand Lane (2000).
48. The first includes Benin, Burkina-Faso, Côte d’Ivoire, Guinea-Bissau, Mali, Niger, Togo,and Senegal. The second encompasses Cameroon, the Central African Republic, Chad, the Repub-lic of Congo, Equatorial Guinea, and Gabon. Guinea dropped out of the franc zone upon inde-pendence, and Mali dropped out for a while. Guinea-Bissau and Equatorial Guinea are newmembers that joined the corresponding arrangement in 1997 and 1985, respectively.
49. The other members are Cape Verde, Gambia, Ghana, Guinea, Liberia, Mauritania, Niger,Nigeria, and Sierra Leone.
50. The members are Gambia, Ghana, Guinea, Nigeria, and Sierra Leone.
10101-01_Ch01_Redo.qxd 10/5/06 3:05 PM Page 28

experiences and challenges 29
trade integration and shied away from establishing major initiatives in the areaof macroeconomic cooperation. To these we should add the Rand MonetaryArea, which dates back to 1910 and was established formally as a monetary areain 1974 and a common monetary area in 1986.51
The former franc (now euro) zone captured for its member states some of theclassical benefits of a monetary union. In particular, price stability has beengreater for these countries than for neighbors in their region. However, themonetary union worked as a weak external mechanism of restraint. Althoughthe central banks were freed by statute from fiscal pressure, they were forced tosupport commercial banks that had lent to fiscal authorities. This factor,together with other domestic and external factors, led to a banking crisis in the1980s. Many of the institutions involved were joint ventures between nationalgovernments and major French-based banks. The recapitalization of these banksled to the eventual collapse of the system, which was formally recognized in the50 percent devaluation of the CFA franc in January 1994.52 The devaluationwas matched by other reforms to strengthen the monetary union and deepenfinancial cooperation. Although the devaluation facilitated the recovery of eco-nomic growth in the following years, the political crisis of the largest member ofWAEMU, Côte d’Ivoire, generated fresh macroeconomic problems in the early2000s; the crisis was compounded by a broader lack of compliance with theagreed fiscal targets by members of the monetary union.53
This story showed the limits not only of monetary union as a mechanism ofrestraint, but also of the benefits of rules-based macroeconomic policy.54 Also,as Culpeper claims in this volume, the hard peg of the CFA franc to the Frenchfranc, and now to the euro, reduces the zone’s capacity to absorb external shocksand effectively externalizes authority for short-term financing to the FrenchTreasury. The fluctuations of the exchange rate of, first, the French franc and,in recent years, the euro, have also been transmitted to these countries and, infact, the strength of the French franc was a factor behind the conditions that ledto the 1994 devaluation.
51. The Rand Monetary Area encompasses South Africa, Lesotho, and Swaziland. Botswanawithdrew in 1974 before the monetary area was formed. There is also the very ambitious (andprobably unrealistic) project of forming a single continental currency area by 2025, which isenshrined in the African Monetary Cooperation Program.
52. The CFA franc is the common currency of fourteen African countries that are members ofthe franc zone.
53. See Boogaerde and Tsangarides (2005).54. See Honohan and Lane (2000).
10101-01_Ch01_Redo.qxd 10/5/06 3:05 PM Page 29

In light of this experience and other problems facing sub-Saharan Africa,Ernest Aryeetey and Honohan and Lane suggest that the focus of cooperationamong these countries should probably shift to the development of financialmarkets, aimed at overcoming the thinness and illiquidity of African capital mar-kets, including possibly the regionalization of banking and capital-market devel-opment.55 Other arrangements, such as liquidity financing to avoid regionalcontagion, seem less important in sub-Saharan Africa, given the absence of sig-nificant contagion in the region during past crises, but may become more impor-tant in the future.
In Latin America and the Caribbean, the Eastern Caribbean Currency Union(ECCU) may be considered one of the few success stories of its kind in the dev-eloping world.56 It involves very small economies with a well-developed domes-tic banking system and an important offshore financial sector. Its history goesback to the British Caribbean Currency Board and operates as a quasi-currencyboard with large effective reserve cover. Its peg to the British pound was shiftedto the U.S. dollar in 1976. However, it has faced some challenges associatedwith the rapid growth of public sector debts during the slowdown of the early2000s, poor compliance with the agreed fiscal rules, and some weakness in itsbanking, regulatory, and supervisory framework.57
As previously mentioned, in 1990 members of the broader Caribbean Com-munity made a commitment to create a monetary union as part of the develop-ment of a single market and economy. However, no concrete steps have beentaken in that direction (and, it should be added, the commitment to build a sin-gle market and economy has also been postponed on several occasions).58 Infact, divergence among the exchange rate regimes and deviation from the agreedconvergence criteria continue to characterize this subregion.
Latin America has shied away from similar efforts but, in the 1990s, adoptedmechanisms for macroeconomic policy dialogue in the context of its three majorintegration processes: Mercosur, the Andean Community, and the CentralAmerican Common Market.59 Maastricht-type criteria for economic conver-
30 josé antonio ocampo
55. See the chapter by Aryeetey in this volume, and Honohan and Lane (2000).56. This currency union includes Antigua and Barbuda, Dominica, Grenada, St. Kitts and
Nevis, St. Lucia, and St. Vincent and the Grenadines, as well as two dependent territories of theUnited Kingdom (Anguilla and Montserrat).
57. IMF (2004).58. It can be argued that, given the very different commodity shocks that these countries face,
the Caribbean Community (Caricom) may not even be an optimal currency area. Worrel (2003)advocates a currency union, but based on arguments that justify fixed exchange rates rather than acommon currency.
59. United Nations, ECLAC (2002b, chap. 5).
10101-01_Ch01_Redo.qxd 10/5/06 3:05 PM Page 30

experiences and challenges 31
gence have been agreed for these processes. In their contribution to this volume,José Luis Machinea and Guillermo Rozenwurcel analyze the rationale for theseefforts. Although intraregional trade is still limited and integration of domesticfinancial markets is virtually nil, macroeconomic linkages associated with globalfinancial shocks have been significant during the past quarter-century. Theyhave been reflected in macroeconomic adjustments that have had major spill-overs onto neighbors, either through the contractionary effects of adjustmentpolicies or through exchange rate variations. This creates a strong case for policydialogue and eventual coordination of macroeconomic policies. A major incen-tive for such coordination is, however, absent: the ability to “borrow credibility”from neighbors. Rather, the attempt of neighbors to differentiate themselvesfrom countries facing a crisis, as was typical of Mercosur in the late 1990s andearly 2000s, contributed to the further loss of credibility by the authorities.
Based on the European and Latin American experience, Machinea andRozenwurcel argue that the exchange of information and periodic technicalmeetings involved in integration processes help to build knowledge and mutualtrust.60 Nonetheless, the transition to more explicit coordination mechanisms,which would help to internalize the effects of macroeconomic policies on neigh-bors, is a difficult task in the Latin American context. These authors argue, fur-thermore, that in developing countries the agreed macroeconomic convergencecriteria should include, in addition to fiscal objectives (the fiscal deficit, prefer-ably set as the structural stance, and the public sector debt ratio), external sectortargets, particularly for the current account deficit and the short-term externaldebt. Striking a balance between compliance with explicit targets and the degreeof policy flexibility that is required in economies subject to large shocks is, how-ever, an important challenge. Some degree of exchange rate stabilization wouldbe desirable, particularly smoothing short-term swings, which may require activeuse of capital account regulations, particularly on short-term capital flows. In thisarea, according to these authors, at least two further objectives should be agreed:the harmonization of the exchange rate regimes, and the principle that countriesshould consult with one another concerning possible courses of action to followin crisis situations.
The existence of regional reserve funds can serve as an important incentivefor macroeconomic coordination. In this regard, the experience of the LatinAmerican Reserve Fund, analyzed by Daniel Titelman in this volume, demon-strates the possibilities of using this type of mechanism, which has been widelyunderutilized in the developing world. It shows that even a modest fund can
60. See also Ghymers (2005).
10101-01_Ch01_Redo.qxd 10/5/06 3:05 PM Page 31

make essential contributions to the balance-of-payments financing of develop-ing countries. Since 1978 this fund has provided such financing to memberstates, equivalent to 60 percent of that of the IMF, benefiting in particular itssmallest members, Bolivia and Ecuador. Its financing was clearly countercycli-cal, and its preferred-creditor status has been reflected in its healthy portfolio,even in the face of two major crises in the region, when some member countriesaccumulated arrears in their public sector obligations. It also shows that the fearthat “soft conditionality” would result in major losses by an institution provid-ing emergency liquidity financing is exaggerated. Such funds can help managetrade shocks and even, to a limited extent, abrupt reversals of capital flows.Indeed, Agosin has estimated that, during recent decades, even a relatively mod-est fund, equivalent to 15 percent of Latin America’s international reserves,could have provided financing to cope with capital outflows equivalent to theentire short-term debts of all the countries except Mexico.61
The most ambitious project of this kind is the Chiang Mai Initiative, agreedin 2000 by the ASEAN countries plus China, Japan, and the Republic of Korea.The agreed mechanism is the negotiation of bilateral swap arrangements amongthe central banks of the member countries. To do this, it built on the modestASEAN Swap Arrangement, which had been created in 1977. Aside from li-quidity financing, the mechanism has provided an instrument of policy dia-logue, and an appropriate surveillance mechanism is currently being designed.Strong regional monitoring and surveillance is deemed essential by net contrib-utors to liquidity financing to guarantee that its lending is protected; this condi-tion is deemed particularly important by Japan.
As Yung Chul Park argues in his contribution to this volume, this arrange-ment builds on two essential lessons from the Asian crisis: that in the face ofcapital account crises, policy coordination, or at least a regional policy dialogue,is essential in preventing contagion, and that the countries need ample access toliquidity to thwart the speculative attacks that characterize contemporary capitalaccount crises. The capacity of regional partners to provide such financing isreflected in the fact that the funds provided by the IMF to Indonesia, theRepublic of Korea, and Thailand during the crisis (U.S.$111.7 billion) wereonly a fraction of the international reserves held by the members of the ChiangMai Initiative at the time (about U.S.$700 billion), and a very small fraction ofthe reserves accumulated by these countries since the Asian crisis (U.S.$2.5 tril-lion at the end of 2005). As noted above, this initiative is also a sign of EastAsia’s frustration with the speed of reform of the international financial system.
32 josé antonio ocampo
61. Agosin (2001).
10101-01_Ch01_Redo.qxd 10/5/06 3:05 PM Page 32

experiences and challenges 33
The mechanism entitles countries to a disbursement of up to 20 percent ofthe maximum amount of drawings from the bilateral swaps without an IMFprogram. This limit, agreed to in May 2005, was an increase over the 10 per-cent originally set. When this limit is reached, the country would thus be placedunder an IMF program. This implies that regional liquidity financing is com-plementary to that of the IMF in a more explicit way than in the case of theLatin American Reserve Fund. These bilateral arrangements, which added up toU.S.$71.5 billion in February 2006, could eventually be multilateralized.Indeed, a step in that direction was also agreed in May 2005, when it wasdecided that the swap activation would be based on a collective decisionmakingprocess, the details of which must be agreed. The mechanism has not yet beenutilized, and indeed, the buoyant conditions of the member countries in recentyears, including the accumulation of record levels of “self-defense” in the formof large international reserves, may have slowed the pace of action. According toPark, the major stumbling blocks in the process seem to be the weak institu-tional arrangements that have been established and the unsettled leadershipamong the two major economic powers in the region.
The recent decision to multilateralize the swap arrangement could lead tosome form of reserve pooling, which could be used to back a common reservecurrency. If a strong surveillance mechanism is put in place, using this mecha-nism of liquidity, financing could be detached from an IMF program. Also, thepolicy dialogue could eventually evolve into a more formal system of policycoordination, including the establishment of mechanisms to stabilize the bilat-eral exchange rates of the member countries, even though the members of theinitiative have not yet expressed their desire to do so. If these steps are taken,and the membership of the initiative is expanded to include other countries thathave requested membership (including India), the system could eventuallyevolve into a full-fledged Asian monetary system.62 It must be added that this ismore likely if the issue of the Asian countries’ voice and participation in theIMF is not solved in an acceptable manner.
As the previous discussion indicates, designing an adequate monitoring andsurveillance process is key to ambitious efforts in macroeconomic cooperation.In this area, four mechanisms have been agreed in Asia since the 1997 crisis. Oneof these was abandoned (the Manila Framework Group, adopted in the contextof APEC), and another is still in its infancy (the South Asian process). TheASEAN Surveillance Process, adopted in 1998, is the most advanced. It has putin place a peer review mechanism for national policies, based on a Surveillance
62. Rana (2005).
10101-01_Ch01_Redo.qxd 10/5/06 3:05 PM Page 33

Report prepared by the ASEAN Secretariat, and the ASEAN Economic Out-look, prepared by the Asian Development Bank. However, neither this mecha-nism nor the less structured ASEAN+3 Economic Review and Policy Dialogue(which is now integrated into the Chiang Mai Initiative) qualifies as an effectivesurveillance process. This has been attributed to the overemphasis on consensusand noninterference in the peer review, at the expense of frank and in-depth pol-icy discussions. So, although there is now an adequate supply of forums for pol-icy dialogue (those mentioned above, plus the dialogues among central banks), afull-fledged monitoring and surveillance process is still not in place.63
Conclusions
This chapter argues that the international financial architecture would bestrengthened if it were to rely not on a few specialized world organizations, butrather on a network of institutions that provide the services expected from suchan architecture (liquidity and development financing, macroeconomic surveil-lance and consultation, peer review of prudential regulation). An institutionalframework such as this would have two positive features. First, it might help tobring more stability to the world economy by providing essential services thatcan hardly be provided by a few international institutions, particularly in theface of a dynamic process of open regionalism. Second, from the point of viewof the equilibrium of world relations, it would be more balanced than a systembased on a few world organizations.
The chapter sets out four arguments in favor of a strong role for regional andsubregional cooperation in the international financial system: the growing link-ages generated by the open regionalism characterizing the current globalizationprocess; the complementary role that world and regional institutions play in aheterogeneous international community, and in a world that still lacks a fullydeveloped international financial architecture; the case for competition in thesupply of services to small and medium-sized countries; and the strong sense ofownership that regional institutions have, and their capacity to serve as channelsfor better articulating the voice of smaller countries. At the same time, it isargued that such arrangements face three major challenges: developing the capac-ity to match the demand for financial support with their supply capacities, whichrestricts the capacity of the poorer developing countries to create viable regionalfinancial institutions; making a strong long-term commitment to institutionbuilding, a basic lesson of European cooperation in this area; and putting
34 josé antonio ocampo
63. See, for example, Kuroda and Kawai (2004).
10101-01_Ch01_Redo.qxd 10/5/06 3:05 PM Page 34

experiences and challenges 35
together arrangements that would guarantee an equitable distribution of thebenefits of integration. These issues are interrelated, since supply capacities andequitable integration are not exogenously given because they are largely createdthrough a gradual process of institution building.
The experiences of regional financial cooperation are clustered in two groups:development financing; and mechanisms for macroeconomic cooperation andrelated financial arrangements (liquidity financing during balance-of-paymentscrises).
The best-developed form of cooperation is that of multilateral developmentbanks. The network of regional and subregional institutions of this type hasshown the advantages of diversity, particularly in their capacity to adapt to thedemands of specific regions. However, they have advanced only marginally out-side Europe, to support the provision of “regional public goods.” Whereas themost developed network is that of the regional development banks, the mostelaborate set of “developing-country-owned” financial institutions is that of theArab and Islamic world, with the network of subregional development banks inthe Latin American and Caribbean region coming next. At least one institution,the Andean Development Corporation, shows that it is possible for a set of non-investment-grade developing countries to build an investment-grade institution.Most institutions of this type have a very strong financial structure, which isassociated, at least partially, with their preferred-creditor status. Only a few havefaced difficulties throughout their history (the African Development Bank andthe Central American Bank for Economic Integration). The history of theAfrican Development Bank shows, however, how hard it is to create dynamicdevelopment financing institutions for the poorest countries without backingfrom industrial nations—and, even with such backing, demonstrates the diffi-culties faced by these institutions in building strong loan portfolios in struc-turally weak development contexts. The Arab institutions have a different sortof problem: excessive dependence of available finance on oil prices, which reducestheir capacity to operate as a countercyclical device.
Two other mechanisms of development financing have been available in afew regional processes. Fiscal transfers to the poorer members of a regionalgroup are used exclusively by the European Union, having been tried unsuccess-fully in only one integration process in the developing world. In recent years,East Asia has launched a third model of cooperation in the area of developmentfinance, which focuses on bond markets. This novel form of cooperation aimsto deepen local and regional financial development through joint actions todesign the appropriate financial infrastructure and by launching specific bondfunds that become investment vehicles for central banks in the region.
10101-01_Ch01_Redo.qxd 10/5/06 3:05 PM Page 35

Contrary to the rich historical experience in the area of development financ-ing, there is a dearth of experiences in the area of macroeconomic cooperationin the developing world. This is, however, an area where several initiatives havebeen launched in recent years, in many cases aiming to replicate Europeanarrangements. The links between trade and macroeconomic cooperation are, ofcourse, at the heart of the formation of the European Union. Certainly tradelinks are weaker in the developing world—although they have been growingrapidly in some regions, particularly in East Asia. However, two additionalrationales for macroeconomic cooperation are present in the developing world:building stronger walls of defense against global financial shocks, and avoidingdistorting competition among export-oriented economies. Aside from the roleof the links between intraregional trade and macroeconomic cooperation, Euro-pean integration brings two additional lessons for the developing world: theemphasis on building strong institutions in a gradual and pragmatic way, andthe subordination of capital mobility to other macroeconomic objectives ofregional cooperation.
The experience with macroeconomic cooperation in the developing world gen-erally breaks up such cooperation into its different components: policy dialogue,monitoring, and surveillance; liquidity support during crises; and exchange ratecoordination. The third objective, which has, of course, been central to Euro-pean cooperation, is generally left aside, except in the few experiences withmonetary unions, which have not usually been very successful. The most com-mon recent initiatives have thus taken the form of macroeconomic dialogue andconsultations based on Maastricht-type convergence criteria; and, even in thebest example of its kind—the ASEAN surveillance arrangement—they have notevolved into effective surveillance processes. However, unless the adoption ofconvergence criteria and dialogue among authorities evolve into regular consul-tations, and eventually into effective coordination processes, their credibilityand rationale may be lost. Furthermore, for the developing world, the balancebetween targets and a certain degree of policy flexibility required in economiessubject to shocks is a difficult one to strike.
In the area of liquidity financing, the experience of the Latin AmericanReserve Fund illustrates the possibilities of using such mechanisms, which havebeen widely underutilized in the developing world. It shows that even a modestfund can make essential contributions to balance-of-payments financing ofdeveloping countries. In turn, the 1997 crisis led in Asia to the adoption of theChiang Mai Initiative, aimed at building a strong pillar of regional balance-of-payments support as a crisis-prevention device. The recent multilateralizationof bilateral swap arrangements could eventually lead to some form of reserve
36 josé antonio ocampo
10101-01_Ch01_Redo.qxd 10/5/06 3:05 PM Page 36

experiences and challenges 37
pooling. The basic weakness of the Chiang Mai Initiative has been its slownessto take strong institutional shape.
All in all, these experiences indicate that regional cooperation can be veryeffective in reducing the inadequate supply of financial services that the currentinternational financial architecture provides. Nonetheless, these institutionsremain limited in scope and are not recognized as central to the internationalfinancial architecture. In this regard, we argue that the International MonetaryFund of the future should be viewed as the apex of a network of regional andsubregional reserve funds and swap arrangements—that is, a structure moreakin to that of the European Central Bank or the United States Federal Reservesystem than to its current centralized structure. In turn, competition amongglobal, regional, and subregional institutions is probably the best arrangementin this area. And above all, in an era when developing countries have made a callfor greater South-South cooperation, financial cooperation should be placed atthe top of the agenda.
References
Agosin, Manuel. 2001. “Strengthening Regional Financial Cooperation.” CEPAL Review 73(April). Santiago, Chile: Economic Commission of Latin America and the Caribbean(ECLAC).
Bezanson, Keith, and Francisco Sagasti. 2000. A Foresight and Policy Study of MultilateralDevelopment Banks. Institute of Development Studies, Sussex University/Ministry of For-eign Affairs, Stockholm.
Birdsall, Nancy. 2001. The Role of the Multilateral Development Banks in Emerging MarketEconomies. Report of the Commission on the Role of the MDBs in the EMEs, José AngelGurría and Paul Volcker, cochairs. Washington: Carnegie Endowment for InternationalPeace.
———. 2006. “Overcoming Coordination and Attribution Problems: Meeting the Chal-lenge of Underfunded Regionalism.” In The New Public Finance, edited by I. Kaul andP. Conceição, pp. 391–410. Oxford University Press.
Birdsall, Nancy, and Liliana Rojas-Suarez, eds. 2004. Financing Development: The Power ofRegionalism. Washington: Center for Global Development.
Boogaerde, Pierre van den, and Charalambos Tsangarides. 2005. “Ten Years after the CFAFranc Devaluation: Toward Regional Integration in the WAEMU.” Working Paper 05/145.Washington: International Monetary Fund (July).
Council on Foreign Relations. 1999. Safeguarding Prosperity in a Global Financial System: TheFuture International Financial Architecture. Task Force Report, C. A. Hills and P. G. Peterson(chairs), M. Goldstein (Project Director). Washington: Institute for International Economics.
Culpeper, Roy. 1997. The Multilateral Development Banks: Titans or Behemoths? Boulder,Colo.: Lynne Rienner and The North-South Institute.
Eichengreen, Barry. 1999. Toward a New International Financial Architecture: A PracticalPost-Asian Agenda. Washington: Institute for International Economics.
10101-01_Ch01_Redo.qxd 10/5/06 3:05 PM Page 37

Ford Foundation. 2001. Rebuilding the International Financial Architecture. Emerging Mar-kets Eminent Persons Group, Final Draft Report, Seoul (September 24).
Ghymers, Christian. 2005. Fomentar la coordinación de las politicas económicas en AméricaLatina: El método REDIMA para salir del dilema del prisionero. Libros de la CEPAL 82.Santiago: ECLAC and European Commission.
Griffith-Jones, Stephany, and José Antonio Ocampo, with Jacques Cailloux. 1999. The Poor-est Countries and the Emerging International Financial Architecture. Stockholm: ExpertGroup on Development Issues (EGDI).
Honohan, Patrick, and Philip R. Lane. 2000. “Will the Euro Trigger More Monetary Unionin Africa?” Policy Research Working Paper 2393. Washington: World Bank (July).
International Monetary Fund (IMF). 2003. “Monetary Union among Member Countries ofthe Gulf Cooperation Council.” Occasional Paper 223. Washington.
———. 2004. “Eastern Caribbean Currency Union: Financial System Stability Assessment.”IMF Country Report 04/293. Washington (September).
Kenen, Peter B. 2001. The International Financial Architecture: What’s New? What’s Missing?Washington: Institute for International Economics.
Kuroda, Haruhiko, and Masahiro Kawai. 2004. “Strengthening Regional Financial Coopera-tion in East Asia.” In Financial Governance in East Asia: Policy Dialogues, Surveillance andCooperation, edited by G. de Brouwer and J. Wang. London: Routledge.
McKinnon, Ronald I. 1963. “Optimum Currency Areas.” American Economic Review 53:717–24.
———. 1979. Money in International Exchange, The Convertible Currency System. OxfordUniversity Press.
Meltzer, Allan H., and others. 2000. Report to the U.S. Congress of the International FinancialAdvisory Commission. Washington (March).
Mistry, Percy S. 1996. Regional Integration Arrangements in Economic Development. TheHague: Forum on Debt and Development (FONDAD).
———. 1999. “Coping with Financial Crises: Are Regional Arrangements the MissingLink?” In International Monetary and Financial Issues for the 1990s. Vol. 10. Geneva:United Nations Conference on Trade and Development (UNCTAD).
Mundell, Robert A. 1961. “A Theory of Optimum Currency Areas.” American EconomicReview 51: 657–64.
Ocampo, José Antonio. 1999. La reforma financiera internacional: un debate en marcha.Santiago, Chile: ECLAC/Fondo de Cultura Económica.
———. 2002. “Recasting the International Financial Agenda.” In International CapitalMarkets: Systems in Transition, edited by John Eatwell and Lance Taylor. Oxford Univer-sity Press.
———. 2003. “International Asymmetries and the Design of the International FinancialSystem.” In Critical Issues in International Financial Reform: A View from the South, editedby A. Berry and G. Indart, pp. 45–73. New Brunswick, N.J.: Transaction.
Park, Yung Chul, and Yunjong Wang. 2000. “Reforming the International Financial Systemand Prospects for Regional Financial Cooperation in East Asia.” In Reforming the Inter-national Financial System, edited by J. J. Teunissen. The Hague: FONDAD.
Prasad, Eswar S., Kenneth Rogoff, Shang-Jin Wei, and M. Ayhan Kose. 2003. “Effects ofFinancial Globalization on Developing Countries: Some Empirical Evidence.” OccasionalPaper 220. Washington: International Monetary Fund.
38 josé antonio ocampo
10101-01_Ch01_Redo.qxd 10/5/06 3:05 PM Page 38

experiences and challenges 39
Rana, Pradumna B. 2005. “Economic Integration in East Asia: Trends, Prospects, and a Pos-sible Roadmap.” Paper presented at the Third High-Level Conference on Building a NewAsia: Towards an Asian Economic Community. Taiyuan, China, September 15–16, 2005.
Sagasti, Francisco, Keith Bezanson, and Fernando Prada. 2005. The Future of DevelopmentFinancing: Challenges, Scenarios and Strategic Choices. Hampshire, United Kingdom: Palgrave/Macmillan.
Sakakibara, Eisuke. 2003. “Asian Cooperation and the End of Pax Americana.” In FinancialStability and Growth in Emerging Economies, edited by J. J. Teunissen and M. Teunissen,pp. 227–40. The Hague: FONDAD.
Stiglitz, Joseph E., José Antonio Ocampo, Shari Spiegel, Ricardo Ffrench-Davis, and DeepakNayyar. 2006. Stability with Growth: Macroeconomics for Development. Oxford UniversityPress.
Teunissen, Jan Joost. 1998. Regional Integration and Multilateral Cooperation in the GlobalEconomy. The Hague: FONDAD.
Triffin, Robert. 1957. Europe and the Money Muddle: From Bilateralism to Near-Convertibility,1947–1956. Yale University Press.
United Nations. 2002. Monterrey Consensus. International Conference on Financing forDevelopment. (www.un.org).
———. 2005. World Economic and Social Survey: Financing for Development. New York.United Nations, Economic and Social Commission for Asia and the Pacific (ESCAP). 2004.
Meeting the Challenges in an Era of Globalization by Strengthening Regional DevelopmentCooperation. New York: United Nations.
———. 2005. Implementing the Monterrey Consensus in the Asian and Pacific Region: Achiev-ing Coherence and Consistency. New York: United Nations.
United Nations, Economic Commission for Africa (ECA). 2004. Assessing Regional Integra-tion in Africa. Addis Ababa, Ethiopia.
United Nations, Economic Commission for Latin America and the Caribbean (ECLAC).2002a. Growth with Stability: Financing for Development in the New International Context.Santiago, Chile.
———. 2002b. Latin America and the Caribbean in the World Economy. Santiago, Chile.United Nations, Executive Committee on Economic and Social Affairs. 1999. Towards a
New International Financial Architecture. Santiago: ECLAC.World Bank and International Monetary Fund. 2005. Global Monitoring Report. Washington.Worrel, DeLisle. 2003. “A Currency Union for the Caribbean.” Working Paper 03/35.
Washington: International Monetary Fund (February).
10101-01_Ch01_Redo.qxd 10/5/06 3:05 PM Page 39

40
The international financial crises of the 1990s and early years of the twenty-first century initiated the beginnings of reform to the global financial sys-
tem. These focused principally on remedying the financial fragility of emergingmarket economies, the principal victims of financial instability. In contrast,there have been no real reforms aimed at preventing or constraining financialinstability at its core, for example by fundamentally restructuring the BrettonWoods institutions, or by rewriting the rules of the game for global financialmarkets. In the meantime, the urge to reform has lost political impetus amongthe G-7, the key players on the reform agenda, with the recovery from the globalfinancial turmoil of 1997–98, which had significantly abated by 1999.
The ensuing financial crises in Turkey and Argentina remained fairly containedto those countries. The absence of contagion seemed to signal that the inter-national financial system, at least for the time being, had become more resilient,vindicating those who advocated a minimalist reform agenda limited to the vul-nerable financial periphery, rather than the center of the global system. This waslittle comfort to Turkey or Argentina, or to other developing countries that, forwhatever reason, might encounter crippling financial shocks in the future.
Reforming the Global Financial Architecture: The Potential of Regional Institutionsroy culpeper
2
I am grateful for comments on an earlier draft by Gerry Helleiner and Rodney Schmidt.
10101-02_Ch02_Redo.qxd 10/5/06 3:05 PM Page 40

reforming the global financial architecture 41
Meanwhile, official development assistance (ODA) continues to be inadequate,although there has been a significant turnaround since the cutbacks of the 1990s.At the time of this writing, projections by the OECD Development AssistanceCommittee (DAC) indicate that ODA from OECD donors will increase from alittle under U.S.$80 billion in 2004 to almost U.S.$130 billion by 2010. Aid toAfrica in this period is forecast to double from U.S.$25 billion to U.S.$50 bil-lion. Moreover, a number of donors outside the DAC are increasing their aidvolumes—for example, the ten new members of the European Union and China(China announced a U.S.$10 billion program for infrastructure, technical coop-eration, and debt relief at the United Nations Summit in 2005). The projectedexpansion in ODA is the largest since the formation of the DAC in 1960,although as a proportion of gross national income the level of 0.36 percent pro-jected for 2010 is only slightly above the 0.33 percent recorded in the early1990s and well below the record levels of 0.5 percent in the 1960s. These figuresneed to be treated with caution, since increasing pressures on public budgets inOECD countries may make rapid increases in aid spending difficult to sustain.Last but not least, in the Paris Declaration on Aid Effectiveness in March 2005,the major donors committed to improving the way aid is delivered.1
If restructuring the global financial architecture has been ruled out for theforeseeable future, it is important to seek alternatives. Some experts, includingthe Emerging Markets Eminent Persons’ Group, recommend building or rein-forcing regional institutions mandated with preventing or mitigating crises forcountries in their regions.2 To this objective could be added the achievement oflonger-term development objectives. That is the focus of this chapter. Drawingon the relevant precedents in both the developed and the developing world, aswell as on the shortcomings of the current system for developing countries, thechapter addresses the following questions:
—What organizational and institutional characteristics contribute to regionalfinancial organizations’ playing an effective role?
—What are the key financial constraints faced by different groups of devel-oping countries with respect to short-term financing and longer-term financing?
—To what extent can regional organizations play a key role in financial crisisprevention and management?
—How can regional financial organizations help bridge the large resourcegap required for longer-term growth and development?
1. Manning (2005).2. Emerging Markets Eminent Persons’ Group (2001).
10101-02_Ch02_Redo.qxd 10/5/06 3:05 PM Page 41

The next section provides some historical context, particularly for developingcountries’ experience with regional financial cooperation. The third section exam-ines the rationale for regional financial cooperation, relating it to the rationale ofbroader or deeper regional economic cooperation and to reforming the globalfinancial architecture. The fourth section undertakes a brief survey of regionalorganizations in two continents—Latin America and the Caribbean, and Africa—to draw some lessons about the extent to which such organizations can help tomeet the financial needs of developing countries. The final section examines thepotential and pitfalls of regional financial cooperation in the broader agenda ofreforming the global financial architecture.
Background
Regional financial cooperation among developing countries is not new. How-ever, until very recently such cooperation was primarily aimed at longer-termeconomic objectives of growth, development, and integration and was bestexemplified by a number of regional and subregional development banks.3 It isworth noting that, in at least one instance, the aspiration to such long-termregional development cooperation predates both Bretton Woods and Europe’spostwar initiatives on regional economic cooperation. The earliest attempt tocreate an inter-American bank took place at the Inter-American Conference inWashington, D.C., in 1890, when Latin American countries attempted, butfailed, to persuade the United States to participate in their project for regionalcooperation. Fifty years later, a convention to establish an inter-American bankwas actually signed by the United Sates but abandoned during World War II.The latter proposal, four years before the Bretton Woods conference, was devel-oped in part by U.S. officials such as economist Harry Dexter White, andhelped shape the subsequent creation of the World Bank.4
The Inter-American Development Bank was ultimately born in 1959. Alongwith the Asian Development Bank (whose operations began in 1966), and themuch later European Bank for Reconstruction and Development (EBRD),which came into being in 1991, the creation of these regional developmentbanks (RDBs) owed much to the cold war. The first two came into being largelybecause the United States saw in them an economic bulwark against the spread
42 roy culpeper
3. Several subregional banks, such as the Caribbean Development Bank and the Central Amer-ican Bank for Economic Integration, are discussed further below. Here the discussion is restrictedto the continental regional banks.
4. Culpeper (1997).
10101-02_Ch02_Redo.qxd 10/5/06 3:05 PM Page 42

reforming the global financial architecture 43
of communism in Latin America and Asia, while the EBRD quickly material-ized after the fall of the Berlin Wall to assist Soviet bloc countries of Europe andCentral Asia in their transition to capitalist democracies. In contrast, the AfricanDevelopment Bank (created at almost the same time as its Asian counterpart)illustrated a fundamentally different history and political dynamic, discussedfurther below.
Here, two aspects of the RDBs as vehicles for regional cooperation areemphasized. First, notwithstanding their strong identification with, and owner-ship by, their developing-country members, until recently the membership ofnonborrowing countries has remained critical to their capacities as financialintermediaries. Second, in practice, regional cooperation has meant cooperat-ing to promote the overall flow of resources to individual regional membercountries, rather than fostering greater economic integration in the region.
Regional Ownership versus Nonregional Control
The fundamental purpose of the RDBs, much like that of the World Bank, wasto foster long-term economic and social development through investment ininfrastructure, the productive sectors, and the social sectors. The United Statesand other leading industrial nations accepted some overlap in the mandates of theRDBs and the World Bank, reflecting an acknowledgment that the overall supplyof long-term development finance was inadequate. But it also reflected theiracceptance that new regional institutions could give their developing-countrymembers what the World Bank would likely never give because of the permanentvoting majority OECD members enjoy at the bank: a greater sense of developing-country ownership and control. This consideration, although never explicit, was akey factor in the Western powers’ political struggle against communism.
Greater ownership of RDBs by regional developing-country members has not,however, led to radically different policies, operational programs, or conditional-ity from those of the World Bank.5 Notwithstanding the voting majority heldcollectively by the Latin American borrowing members of the Inter-AmericanDevelopment Bank (IDB), effective control over major policy issues has beenexercised by its largest minority shareholder, the United States. And at the AsianDevelopment Bank, developing-country members never did have a formal vot-ing majority.6 In any event, effective control by industrial-country members inthe RDBs springs not from their voting position but from the fact that their
5. Kapur and Webb (1994).6. A voting majority was held by regional member countries, which included Japan, Australia,
and New Zealand (Kappagoda, 1996).
10101-02_Ch02_Redo.qxd 10/5/06 3:05 PM Page 43

44 roy culpeper
cooperation is vital to ensure resource mobilization through successive capitalincreases and replenishments, without which the RDBs would enjoy no growthin their lending program.7
The history of the African Development Bank (AfDB) illustrates how criticalindustrial-country membership can be to a regional bank’s ability to mobilizeresources. Unlike the other RDBs, the AfDB was not a by-product of cold-warpower politics. On the contrary, it was the manifestation of African countries,newly independent from colonialism, seeking to be free of alignment with thecold-war superpowers. Without explicit sponsorship by the industrial countries,the AfDB reflected African countries’ aspirations to blaze a specifically Africanpath to development. For almost two decades, maintaining the “African charac-ter” of the bank required that eligibility for membership be restricted to Afri-can countries. By 1980 it became apparent that the bank’s ability to mobilizeresources was highly limited by this formula. Nonconcessional lending by multi-lateral development banks is heavily dependent on their access to key capitalmarkets in the North, which in turn is secured by the capital subscriptions ofhighly creditworthy members—in other words, by the membership of industrialcountries.8 And concessional lending has always been wholly dependent onfunds provided by donor countries.
The AfDB was in fact able to establish a concessional lending affiliate, theAfrican Development Fund (AfDF), in 1973, without any formal donor-countrymembership in the bank per se. Moreover, an attempt was made to preserve thebank’s “African character” in the fund as well, by insisting on voting paritybetween donors and African members. However, the magnitude of the conces-sional resources raised by the AfDF paled in comparison with the concessionalaffiliates of the Inter-American and Asian Development Banks, in which it wasclear from the outset that donor members were in control. After much debate, theAfrican bank’s membership was ultimately “opened” in 1982 to nonregional—that is, developed-country—members in Europe and North America. However,the principle of maintaining an African voting majority in the bank (and parityin the fund) persisted, although in the case of the bank the African majority hassubsequently drifted down through successive capital replenishment negotiations,at the insistence of the nonregional members.9
7. Culpeper (1997).8. By the 1990s this had changed—the Andean Development Corporation (Corporación And-
ina de Fomento, CAF) illustrated that a regional bank whose membership was exclusive to devel-oping-country borrowers could mobilize its resources solely on the strength of its borrowingmembers. The experience of the CAF is elaborated below.
9. English and Mule (1996).
10101-02_Ch02_Redo.qxd 10/5/06 3:05 PM Page 44

reforming the global financial architecture 45
Regional Integration
The RDBs were all created with support for regional integration as an objective,which was reaffirmed over the decade of the 1990s. Despite this fact, they havetended to operationalize this part of their mandate only to a negligible extent ifthe proportion of their lending portfolio allocated to regional integration projectsis taken as the key indicator. For example, at the IDB, loans for regional integra-tion constitute only 2 percent of authorizations, which amount to $8 billionannually, while regional technical cooperation amounts to only $12 million annu-ally.10 However, this indicator may not fully capture the RDBs’ efforts to facilitategreater regional integration and cooperation. The IDB was extremely active in the1990s, along with the Organization of American States (OAS) and the UnitedNations Economic Commission for Latin America and the Caribbean (ECLAC),in the Hemispheric Summit Process, providing technical and financial support forthe Free Trade Area of the Americas (FTAA) negotiations. For its part, the AsDBhas become involved in regional economic and financial surveillance, to comple-ment surveillance at national and global levels. And the AfDB, analogously to itscounterpart in the Americas, is centrally involved with the Organization of AfricanUnity (OAU) and the United Nations Economic Commission for Africa (ECA)in pan-African cooperation initiatives such as the New Partnership for Africa’sDevelopment (NEPAD) and the creation of the African Union.11
To conclude, the RDBs should be viewed as highly successful regional coop-eration initiatives in mobilizing financial resources for their members’ nationaldevelopment efforts. However, this judgment must be qualified by the fact that,until recently, industrial-country membership has been vital to augmenting theirlending capacity, and the fact that, again until recently, they have not been par-ticularly successful at enhancing cooperation among members, either by meansof economic integration initiatives or coordinating development strategies. Inthe latter case, change has been facilitated by a new approach to regionalism.
Put bluntly, the “old regionalism” of the 1950s and 1960s (the RDBs beingexemplars) was characterized by groups of countries looking inward, motivatedby a desire to substitute for the lack of multilateral liberalization or to facilitateholding aloof from what liberalization there was (such as the proposal for aLatin American free-trade area), or both. The “new regionalism,” in contrast, isoutward-looking, motivated by a desire to facilitate entrance into a more glob-ally liberalized multilateral trading and investment system. Such regionalism is
10. The AsDB, however, has allocated a more considerable part of its lending portfolio tomulticountry regional projects such as the Greater Mekong Subregion Initiative.
11. Devlin and Castro (2002).
10101-02_Ch02_Redo.qxd 10/5/06 3:05 PM Page 45

46 roy culpeper
characterized by greater liberalization on the part of smaller than larger coun-tries and by the quest for “deep integration,” whereby participating countries gowell beyond border measures to harmonize or adjust various economic policies(the European Union, the Canada–United States Free Trade Agreement, andthe North American Free Trade Agreement [NAFTA] are examples).12
After the Asian financial crisis of 1997–98, however, the promise of thenew outward-looking regionalism became a little tarnished. Capital accountliberalization—particularly when adopted prematurely, as it was in many coun-tries, as part of a wider package of economic liberalization measures—left manyvulnerable to massive financial shocks. The benefits of greater access to goods andlong-term capital markets were dramatically offset, at least in the short run, bymassive, crisis-induced capital flight and the domestic instability it precipitated.Furthermore, remedial measures implemented by the international financial insti-tutions (IFIs) (and supported by the G-7 countries) came under considerable criti-cism for being procyclical,13 and for making a bad situation significantly worse.14
Asian countries themselves were particularly critical both of the diagnosis andof the prescriptions applied by the G-7 and the IFIs to the region. Accordingly,soon after the outbreak of the Asian financial crisis in 1997 there were proposalsfrom Japan for a regional monetary fund that received a positive response from anumber of East Asian countries. At the time, the idea was opposed by the UnitedStates, European countries, and the International Monetary Fund.15 However,the idea resurfaced in May 2000 at the Asian Development Bank meetings heldin Chiang Mai, Thailand. This gave birth to the Chiang Mai Initiative amongthe ASEAN+3 countries (the ASEAN nations plus China, Japan, and the Repub-lic of Korea). While this initiative began essentially as a network of bilateral swaparrangements, with informal surveillance arrangements, further discussion amongthe participants may lead to a multilateralization of the arrangements and the cre-ation of a regional monetary fund.
The Rationale for Regional Financial Cooperation
Regional financial cooperation can be motivated by larger political objectivesas well as by narrower economic goals. Such political motives range from the
12. Ethier (1998). As Bhagwati (1998) pointed out, however, a regional trade agreement on thelines of NAFTA was not an aspect of the “East Asian miracle,” or necessary to its emphasis of out-ward orientation through export promotion.
13. See Ocampo (2003).14. See, for example, Stiglitz (2002).15. See Park (2001).
10101-02_Ch02_Redo.qxd 10/5/06 3:05 PM Page 46

reforming the global financial architecture 47
need to facilitate conflict resolution or avoidance or mitigation between neigh-boring states, to aspirations for greater political integration or even union. TheEuropean Union, the preeminent example of politically motivated regionalcooperation, has traveled from one end of this spectrum, in the search for adurable peace at the end of World War II, to the other end today, with mone-tary union and closely coordinated economic and social policies. Ever-increasingfinancial cooperation in the European Union project is just a part of a muchlarger agenda of economic and political harmonization and integration and,after half a century, it is still a work in progress. The deeper motives of politicalintegration may be present in other parts of the world to the same degree as inEurope, but if they are, most are at a much earlier stage in the process. How-ever, proposals for a Free Trade Agreement of the Americas, an African Union,and cooperative arrangements such as ASEAN and the South Asian Associationfor Regional Cooperation (SAARC) in Asia are all suggestive of regional proj-ects in which political motivations are indeed present. Conceivably, over time(and bearing in mind the evolution of the European Union over five decades)the political objectives associated with such initiatives could become moreambitious.
Moreover, political and economic motives are often intertwined and difficultto separate. Purely economic motives are no doubt undermined by historicalenmity, mistrust, or political grievances among neighboring countries, simplybecause the transaction costs involved in negotiation and cooperation are likely tobe higher in such circumstances. Put positively, economic motives are likely to bereinforced where political relationships between regional members are alreadystrong and the desire for even closer relationships is growing.
That being said, there are several economic reasons for greater regional finan-cial cooperation. There would seem to be two broad rationales: cooperative orself-help motives, and the need to remedy incomplete international institutions.
The cooperative rationale is straightforward. When countries of a regioncooperate financially, they help to fill gaps caused by incomplete markets;increase external financing for various purposes; meet external developmentfinancing resource gaps generally; and exploit economies of scale. There are anumber of ways they can do this:
—By pooling their risks, they can gain access on better terms to capital mar-kets or donors than if they attempted to approach markets and donors separately.Regional or subregional development banks, in effect, play this role throughfinancial intermediation.
—By forming trade payments settlement systems, they can reduce the trans-action costs of regional trade.
10101-02_Ch02_Redo.qxd 10/5/06 3:05 PM Page 47

48 roy culpeper
—By pooling foreign exchange reserves, they can reduce their individualreserve holdings and associated quasi-fiscal costs.
—By harmonizing policies and institutions in the financial sector and creat-ing regional institutions, and instituting regional monitoring and surveillance toprovide early warnings of countries likely to experience financial trouble, theycan deepen regional capital markets, attract more foreign direct investment orattract it on better terms, and reduce the threat of regional contagion.
The “incomplete institutions” rationale deserves somewhat more explana-tion. As mentioned, global institutions such as the World Bank and the Inter-national Monetary Fund tend to be most responsive to the demands of theirmajor shareholders—the G-7 countries—and also to the needs of the largestdeveloping countries, which have significant voice and voting power in theinstitutions and constitute an important part of their lending portfolio (andhence their balance sheets) and greater systemic importance with respect toglobal financial crises. The global institutions do not serve the world’s smallerand poorer countries particularly well, and this group of countries has a mar-ginal role in the global institutions’ governance.16 Regional arrangements there-fore help to complete the global financial architecture in the following ways:
—By providing an institutional space, complementary to the global institu-tions, in which the voice and voting power of smaller and poorer countries isgreater, along with a greater sense of regional ownership.
—By taking a more efficacious approach to conditionality. Global institu-tions are more inclined to impose conditionality; regional organizations in con-trast are more able to rely on peer pressure to adopt policy reforms.
—At the same time, by providing some competition to the global institutions,generating more attention to the problems of the smaller and poorer countries.
—By focusing on providing international public goods that are regionalrather than global in nature; and consistent with the principle of subsidiarity, bybasing the arrangement in the region concerned with regional members as keyplayers.
—By providing a source of countercyclical financing, to offset the procycli-cality of private financing and official financing from the global institutions.
There is clearly a rationale for greater regional financial cooperation in generalterms. But as a practical matter, different developing countries and regions facevastly differing needs, opportunities, and constraints. Therefore it is useful to dis-tinguish among groups of developing countries in order to discern the potentialbenefits from regional financial cooperation for different groups and regions.
16. Ocampo (2002).
10101-02_Ch02_Redo.qxd 10/5/06 3:05 PM Page 48

reforming the global financial architecture 49
Per capita income provides one basis for differentiating among groups ofdeveloping countries. Another basis is the degree of access to international capitalmarkets. It seems useful to distinguish between two groups at opposite ends of theincome spectrum—the poorest and the emerging market countries. The formercould be identified with the least-developed countries (as defined by the UnitedNations)—countries that are extremely poor and are heavily dependent on for-eign assistance on grant or concessional terms. Hereinafter, this group is referredto as the least developed countries (LDCs). The second group consists of emerg-ing market and transition countries in Asia, Eastern Europe, and Latin America.This group consists predominantly of middle-income countries, but would alsoinclude India (a low-income country with growing access to capital markets), aswell as China. This group is referred to below as emerging market economies(EMEs). Between these two is a group of small low- and middle-income coun-tries (SMCs), which are neither among the poorest nor among the emerging mar-ket countries, since they have limited access to international capital markets.
These groups differ in their financing needs, whether for short-term financingor medium- to long-term financing. Short-term financing is required to meetemergencies and respond to crises; medium- to long-term financing is requiredfor investment, capacity building, and other constituents of sustainable develop-ment. Income levels also determine creditworthiness. Combined with the classi-fication of developing countries by income group, this yields a “financing needsmatrix” (see table 2-1).
Least developed countries’ short-term financing needs reflect their aid andcommodity dependence and their greater vulnerability to natural disasters. Manyof these needs are largely unmet, particularly in failed states. This group is gener-ally not creditworthy for commercial financing on market terms. That is why theytend to be heavily dependent on the grant or concessional ODA from bilateraland multilateral aid agencies. Traditionally, such agencies have rendered projectassistance and technical cooperation to support infrastructure, social investment,and productive sector investment. Recently, some agencies have begun a transi-tion to program-based assistance in the form of sector or budget support.
However, there is considerable evidence that ODA and other official flowsare procyclical, or serve to reinforce rather than dampen external shocks; there-fore LDCs have unmet needs for countercyclical support.17 Debt restructuringis a medium- to long-term need because the underlying problem is debt sustain-ability (that is, reducing debt overhangs to levels compatible with growth anddevelopment) rather than short-term liquidity financing. Finally, while on a
17. UNCTAD (2000, Part II, chap. 5).
10101-02_Ch02_Redo.qxd 10/5/06 3:05 PM Page 49

50 roy culpeper
global basis most private foreign direct investment (FDI) flows to middle-income countries, it is also true that the FDI that has flowed to a number ofleast-developed countries is very significant as a proportion of GDP and in itsdomestic impact. The likelihood is that such FDI will constitute a growing pro-portion of net resource inflows for such countries in the future. The fact is,however, that few LDCs have the monitoring or management capability even tomaintain up-to-date, detailed data on the size and nature of such inflows.18
Table 2-1. Financing Needs of LDCs, SMCs, and EMEsa
LDCs SMCs EMEs
Short-term needs
Medium- and long-term needs
Creditworthiness
a. LDCs: less-developed countries; SMCs: small low- and middle-income countries; EMEs: emergingmarket economies.
Compensatorybalance-of-payments (BOP)financing caused bycommodity, finan-cial, and aid shocks
Relief for naturaldisasters, post-conflict assistance,and humanitarianemergencies (suchas famine)
Financing forinfrastructure andfor social andproductive sectorinvestment
Debt restructuringBudgetary and sector
supportCapacity buildingFinancing for counter-
cyclical macro-economic policy
Grants andconcessionallending
FDI
Compensatory BOPfinancing due tocommodity and aidshocks
Relief for naturaldisasters and post-conflict assistance
Trade finance
Financing for infra-structure and forsocial and produc-tive sectorinvestment
Debt restructuringCapacity buildingFinancing for counter-
cyclical macro-economic policy
Semi-concessionallending
Some forms of privatefinancing
Liquidity financingto prevent/mitigate financialpanics, contagion
Debt restructuringTrade finance
Financing for infra-structure andproductive sectorinvestment
Financing forcountercyclicalmacroeconomicpolicy
Market-basedofficial lending
All forms of privatefinancing
18. See Martin and Rose-Innes (2004).
10101-02_Ch02_Redo.qxd 10/5/06 3:05 PM Page 50

reforming the global financial architecture 51
In contrast, emerging market countries’ short-term needs arise more from theirintegration into, and shocks emanating from, international capital markets. (Somecountries still suffer from commodity price shocks but, given a far lower level ofdependence on commodity exports and greater degree of export diversification,the effects are far less devastating than those felt by the poorest countries.) Sincethe Asian financial crisis, much of the debate about short-term crisis preventionand mitigation, along with the argument that more could be done throughregional cooperation, has been focused on this group. Debt restructuring is gener-ally a short-term liquidity issue rather than a longer-term sustainability issue forthis group. Finally, there is also an unmet need for trade finance to put this groupof countries at less of a disadvantage to their industrial-country competitors.
With regard to longer-term needs, emerging market countries have much incommon with the poorest countries but face more choices in meeting them.There is greater scope for domestic resource mobilization through financialintermediation, taxation, duty collection, and public sector borrowing, and for asignificant portion of investment, particularly for the productive sectors, to takeplace through private markets. However, particularly in those countries wheredomestic savings rates are low, investment needs must be met by accessing inter-national capital markets. In particularly short supply (as in least developedcountries) is medium-term countercyclical financing, since available financing(official as well as private) tends to be procyclical.
Between these two groups are the smaller low- and middle-income countries,which tend to have many of the same financing needs as the poorest countriesand some of the capabilities of emerging market countries. Thus they are able toabsorb some semi-concessional financing and more forms of private foreigninvestment than LDCs. Some countries in this group are eligible for heavilyindebted poor-country (HIPC) debt relief (such as Bolivia, Nicaragua, andHonduras) and require medium-term debt restructuring.
Finally, casual observation suggests that the least developed countries face thegreatest unmet needs, and that short-term needs tend to be more unmet thanlonger-term needs. In table 2-1, the greatest unmet needs are listed in the topleft-hand corner. Moving down and to the right in the table, rising per capitaincome and greater access to capital markets gives middle-income and emergingmarkets more choices, either through official financing or through the markets.
This taxonomy of developing-country categories and their needs must nowbe applied to the geographic, historical, and cultural realities of the developingworld. By definition, the membership of regional organizations is determinedby geography. A large majority of the LDCs are in Africa; and a large majorityof African countries are LDCs. It follows that regional organizations in Africa
10101-02_Ch02_Redo.qxd 10/5/06 3:05 PM Page 51

52 roy culpeper
must inevitably contend with the challenges and demands of LDCs, which areamong the most difficult in the developing world.
There are also important cultural and linguistic differences between the pre-dominantly Arab states of the north and those of sub-Saharan Africa; and insub-Saharan Africa, between those in which French, English, or Portuguese isan official language. There is, in addition, considerable diversity among indige-nous languages both between and within countries. Other sources of culturalheterogeneity are rooted in religion. It is important to note that such diversity isnot an obstacle to regional cooperation, as the case of European integrationdemonstrates. However, it does represent an important challenge to cooperationat a number of levels, from the negotiation of cooperation agreements to thestructure and functioning of regional organizations: where they are located,their working languages, and so on.
In contrast to Africa, LDCs are virtually nonexistent in Latin America (withthe exception of Haiti). Accordingly, in Latin America the demands faced byregional organizations are principally those of the EMEs and SMCs. Withoutminimizing those demands, it is fair to consider them more tractable than thoseof the LDCs, so that the regional organizations in Latin America face less formi-dable challenges than their counterparts in Africa.
Moreover, culturally and linguistically, as the descriptor “Latin” suggests, theregion is less heterogeneous than other parts of the developing world (this mayexplain why some of the earliest attempts at regional cooperation were made inLatin America). Spanish is the official language of most countries and the linguafranca of the region: this undoubtedly facilitates cooperation at a practical level.
In Asia, LDCs are more numerous (they include Afghanistan, Bangladesh,Bhutan, Cambodia, Lao PDR, Myanmar, Nepal, and Yemen, plus several Pacificand Indian Ocean island states) but constitute a small portion of the region’s totalpopulation, which is heavily weighted by China and India. There are as well anumber of SMCs in Asia. At the same time, Asia is also home to Japan, theworld’s second largest developed economy, and other countries or city-states thatare either developed (Singapore and Hong Kong SAR; plus Australia and NewZealand if these are considered part of Asia) or advanced middle-income countries(the Republic of Korea, Taiwan Province of China, and Malaysia). More gener-ally, the Asian continent’s size, huge population, and enormous cultural diversity,not to mention historical frictions going back many centuries, have militatedagainst regional cooperation until very recently.
In contrast to Africa, however, it may be said that Asia’s diversity also offerscrucial strengths. In particular, the presence of industrial and emerging marketcountries provides the region with a rapidly growing pool of savings and greater
10101-02_Ch02_Redo.qxd 10/5/06 3:05 PM Page 52

reforming the global financial architecture 53
creditworthiness. For obvious reasons, this is a significant advantage for regionalfinancial cooperation. In Africa, there are no countries similar to Japan, Australia,the Republic of Korea, or Taiwan Province of China, with capital surpluses, deepfinancial markets, or large foreign exchange reserves.
The last point suggests that the rationale of regional financial cooperationviewed from the demand side, that is, with the needs of ultimate beneficiaries inmind, should be complemented by a “supply-side” perspective. Unless regionalorganizations are viable and sustainable over the long term, it is at best hypo-thetical to argue that there should be more of them, or that the emphasis onimproving the international architecture should be on strengthening existingregional organizations rather than the global institutions.
One way of assessing the potential viability of regional financial organizationsstems from the relationship between their balance sheets and the financial capac-ity of regional member states. For nonconcessional lending, a healthy balancesheet implies, on the liability side, a strong net equity position, and on the assetside, loans that are well-performing (or few nonperforming or doubtful loans). Inturn, a strong net equity position typically means that the organization’s mem-bership includes a number of very creditworthy countries (or creditors with pro-tracted current account surpluses), while a portfolio of well-performing loansusually implies that borrowers service their loans fully and on schedule. For con-cessional lending, there should be some aid donors able to provide low-interestrepayable credits, or grants, to eligible members.
In Africa, “very creditworthy countries” able to provide either a strong equityposition or concessional development resources are conspicuously absent. Asia,in contrast, includes a number of very creditworthy countries, and among these,some significant aid donors. In the first decade of the twenty-first century, LatinAmerica is an intermediate case, in that the region features no significant aiddonors or capital surplus countries. However, notwithstanding Argentina’sdefault and subsequent restructuring of its international obligations, LatinAmerican emerging market countries are increasingly creditworthy as inter-national borrowers, a fact that provides strength to the asset portfolios of lendersto the region.
Table 2-2 summarizes the opportunities and challenges facing the threemajor continental regions of the developing world. It suggests that in Africa thechallenges confronting regional financial cooperation are the greatest, on boththe demand and the supply side. Asia has considerable advantages on the supplyside in its accumulation of a growing share of the world’s savings. Latin Americadoes not face the exigencies of Africa on the demand side, but neither does ithave Asia’s advantages on the supply side. However, cultural affinities in Latin
10101-02_Ch02_Redo.qxd 10/5/06 3:05 PM Page 53

54 roy culpeper
America likely provide more “political glue” to the project of regional financialcooperation than exists on the other two continents.
Regional Financial Cooperation: Lessons from Current Experience
If the above is accepted as a useful conceptual framework, what lessons can bedrawn from the experience of regional financial organizations, going beyond theregional development banks? What role do they play in meeting the needs ofthe three groups of countries? This question is addressed here via a brief surveyof regional institutions on two continents—Africa and Latin America and theCaribbean.
Africa
Thirty-four, or almost three-quarters, of the world’s forty-eight least-developedcountries are in sub-Saharan Africa, which can be thought of as a least-developedregion or a group of such regions. The African Development Bank Group (par-ticularly its concessional affiliate, the African Development Fund) is the princi-pal regional institution providing medium- to long-term development finance.However, the mandate of the African Development Bank Group covers thewhole continent, including the countries of North Africa and the Republic ofSouth Africa. There are a number of subregional organizations, including thefollowing. The Economic Community of West African States (ECOWAS),comprising sixteen members in West Africa, was created in 1975 to promoteintraregional trade.19 The ECOWAS treaty also calls for joint infrastructural
Table 2-2. Financial Opportunities and Challenges by Region
Africa Latin America/Caribbean Asia/Pacific
Regional characteristics
Cultural affinities
Financial capacities
Predominantly LDCs
Considerable diversity
No highly credit-worthy countries or aid donors
Predominantly SMCs and EMEs
Some cultural similarities,including regionalimportance of Spanish
No significant aid donorsor lenders, butincreasingly credit-worthy borrowers
LDCs, SMCs, andEMEs
Considerable diversity
Some significant aid donors, lenders,and creditworthyborrowers
19. Its members are Benin, Burkina Faso, Cape Verde, Côte d’Ivoire, Gambia, Ghana, Guinea,Guinea-Bissau, Liberia, Mali, Mauritania, Togo, Niger, Nigeria, Senegal, and Sierra Leone.
10101-02_Ch02_Redo.qxd 10/5/06 3:05 PM Page 54

reforming the global financial architecture 55
development, harmonized approaches to industrialization, and the improve-ment of regional competitiveness; these are the objectives of its affiliated finan-cial organizations, the ECOWAS Bank for Investment and Development, theECOWAS Regional Investment Bank, and the ECOWAS Fund for Coopera-tion, Compensation and Development. The fund has agreements with theAfrican Development Bank and the Islamic Development Bank to cofinanceprojects. There is also a private regional investment bank, Ecobank Trans-national Inc., based in Togo. Achievements in all these areas have been modest,although there has been some progress in infrastructure.20 In December 2000,five countries (Gambia, Ghana, Guinea, Nigeria, and Sierra Leone) agreed tocreate the West African Monetary Zone with a common currency and centralbank and to merge this zone with the Western African Economic and MonetaryUnion by the year 2005. However, this timetable did not prove feasible. In May2005, heads of state and government of the five countries reaffirmed their com-mitment to a second monetary zone and to full West African monetary union,but agreed to postpone the date of attainment until December 2009. To thatend, they also agreed to an implementation plan that included the formation ofa customs union and a single economic space among the five countries toexpress political commitment to the regional monetary integration process.
The CFA franc zone (CFAF zone) is the longest-standing example of regionalfinancial cooperation among a group of LDCs, dating back to 1948. The CFAfranc is a common currency fixed via a “hard peg” to the euro (before 1999, tothe French franc), which effectively externalizes authority for short-term financ-ing to the French Treasury. Moreover, the hard peg reduces the zone’s capacityto absorb external shocks, which is further complicated by the substantially dif-ferent needs and capacities of its fourteen members in its two zones in West andCentral Africa.21 Therefore because of the nature of its external peg and otherfeatures, the regional common currency per se cannot be said to have resolvedthe zone’s needs for short-term financing to meet commodity price fluctuationsor natural disasters such as drought and desertification, or financing for longer-term development. Indeed, it could even be argued that, rather than leveraging
20. Rwegasira (1996).21. The two zones are the West African Economic and Monetary Union (WAEMU), compris-
ing Benin, Burkina Faso, Guinea-Bissau, Côte d’Ivoire, Mali, Niger, Senegal, and Togo; and theCentral African Economic and Monetary Community (CAEMU), comprising Cameroon, theCentral African Republic, Congo, Chad, Equatorial Guinea, and Gabon. Most observers wouldagree that the CFA franc zone is so large and heterogeneous that it does not constitute an optimalcurrency area in Mundell’s sense. De Macedo, Cohen, and Reisen (2001) argue that regional coop-eration is actually easier between countries with partly flexible, “intermediate” exchange rateregimes rather than “corner regimes” of hard pegs or complete flexibility.
10101-02_Ch02_Redo.qxd 10/5/06 3:05 PM Page 55

56 roy culpeper
additional resources for regional members, the rigidities of the CFAF zone(including the recent adoption of a Convergence, Stability, Growth, and Solidar-ity Pact modeled on that of the Eurozone) hamper its flexibility. However, itsproponents argue that the requirements of an externally backed common cur-rency have resulted in monetary and fiscal discipline, which in turn have servedto strengthen the region’s growth performance. In addition, members haveagreed to a single banking supervisory authority (a “Banking Commission”) ineach of the two subregions, as well as setting up common accounting and pru-dential standards throughout the zone, which may contribute to making theregion more attractive to foreign investment, reducing the problems of informa-tion asymmetry, and with it the threat of financial contagion.22 Members of theWest African Economic and Monetary Union (WAEMU or, in French, UnionÉconomique et Monétaire Ouest Africaine, UEMOA) adopted a customs unionand common external tariff in 2000. Progress toward regional integration in theCentral African Economic and Monetary Union (CAEMU or, in French, Com-munauté Économique et Monétaire de l’Afrique Centrale, CEMAC) has beenslower.23
The Southern African Development Community (SADC) is an association offourteen states of central and southern Africa.24 Before 1992, when South Africajoined what was previously the Southern African Development CoordinationConference (SADCC), its main objective was to promote regional integrationthrough investment and sector coordination driven primarily by donor funding.This group now provides a forum and a framework within which to coordinatepolicies and facilitate greater regional integration (on political issues such as secu-rity and defense, and the strengthening of democracy and human rights, as wellas on the regional economy). SADC is phasing in a free-trade area in 2008.
The Common Market for Eastern and Southern Africa (COMESA, formerlythe Preferential Trading Area, or PTA) comprises seventeen members includingmany members of SADC.25 Its fundamental objective is to promote intra-regional trade through trade liberalization. It established a free-trade area amongnine members in 2000 and is working toward a customs union in 2008. (A sub-group, the East African Community, comprising Kenya, Tanzania, and Uganda,formed a customs union with a common external tariff that came into effect in
22. Strauss-Kahn (2003).23. International Monetary Fund (2002).24. Angola, Botswana, Democratic Republic of the Congo, Lesotho, Malawi, Mauritius,
Mozambique, Namibia, Seychelles, South Africa, Swaziland, Tanzania, Zambia, and Zimbabwe.25. Angola, Burundi, Comoros, the Democratic Republic of the Congo, Eritrea, Ethiopia, Kenya,
Lesotho, Malawi, Mauritius, Rwanda, Sudan, Swaziland, Tanzania, Uganda, Zambia, and Zimbabwe.
10101-02_Ch02_Redo.qxd 10/5/06 3:05 PM Page 56

reforming the global financial architecture 57
2005.) As part of this larger objective, COMESA has established three financialfacilities, the Eastern and Southern African Trade and Development Bank (PTABank), created to establish a trade financing window, unique in sub-SaharanAfrica; the COMESA Clearing House to facilitate the settlement of trade pay-ments among members; and the PTA Reinsurance Company (ZEP-RE), estab-lished to develop the insurance and reinsurance industry in the region.Strengthening macroeconomic coordination is also an objective of the COMESAtreaty, but little has been done in this regard.26
Certain features stand out from this brief survey of African regional organiza-tions. First, apart from the CFA franc zone, regional trade is the principal objectiverather than financial cooperation. To a lesser extent, regional integration throughinvestment has been a motivation. In the case of the CFAF zone, regional tradeand integration, including financial and macroeconomic harmonization, havebeen by-products facilitated by the common currency. Second, achievementshave generally been modest, reflecting the stark challenges facing all membercountries and the difficulties of coordinating policies in such circumstances. Thelevel of intraregional trade is somewhat higher in the CFAF zone than in otherregional blocs, but is still far from dominating the direction of trade as a whole,which continues to be strongly oriented toward Europe. This outcome is not sur-prising, given the low degree of complementarity in the region’s trade and pro-duction structure. Third, notwithstanding some innovative attempts at financialcooperation (such as the PTA Bank in COMESA to facilitate trade financing), itis clear that such initiatives have not gone far in sub-Saharan Africa toward meet-ing the region’s needs for short- and longer-term finance. Finally, criticisms ofthe CFAF zone suggest that regional economic cooperation may be a two-edgedsword. While it may be intended to increase the interest and confidence of out-side investors, an unintended consequence of overly stringent standards of har-monization may be to hamper growth. Such criticisms are important givenvarious proposals for new common currencies (see below).
Perhaps it is the limited success of such regional efforts that led African lead-ers in 2002 to launch the New Partnership for African Development, an initia-tive that explicitly invited donors to support African-led efforts, whether forinfrastructure investment, regional security, or the transition to democracy.27
However, at the same time African leaders also agreed to a timetable for the cre-ation of the African Union (AU) to replace the Organization for African Unity.
26. Rwegasira (1996); IMF (2002).27. Mistry (1996), explaining the failure of structural reforms in Africa, argued for a more
regional approach to investment coordination and cooperation, trade integration, and institutionaldevelopment.
10101-02_Ch02_Redo.qxd 10/5/06 3:05 PM Page 57

58 roy culpeper
The AU, which came into force in 2001, will ultimately have power over eco-nomic, political, social, and judicial issues on the continent. It will eventuallydevelop a common currency, a continental parliament, and a court of justiceand is modeled on the European Union rather than on NAFTA or FTAA.These developments, which have occasioned both optimism and skepticism,reaffirm the importance of political factors underlying regional cooperation.
Latin America and the Caribbean
The Latin America and Caribbean (LAC) region includes groups of both EMEand SMC subregions (the only LDC in the hemisphere being Haiti). Two exam-ples of regional financial cooperation among SMCs and one among a hetero-geneous group of EMEs and SMCs serve to illustrate some potentials and pitfalls.
The Central American Bank for Economic Integration (CABEI), establishedin 1960, is a subregional bank based in Honduras, serving that country and fourothers—Guatemala, El Salvador, Nicaragua, and Costa Rica, which in the frame-work of this paper all constitute SMCs. There are also four nonborrowing“regional” members, Argentina, Colombia, Mexico, and Taiwan Province ofChina, all of which are EMEs. Its mission is to promote the progress and theintegration of the isthmus by fostering equitable, environmentally friendly eco-nomic growth. To that end, it supports public and private programs and projectsthat generate productive employment and contribute to improving productivityand competitiveness, as well as to raising the human development indexes of theregion. Over the four decades of its existence, CABEI has proved itself to be auseful regional nonconcessional financial intermediary for both public sectorinvestment and, increasingly over the past decade, private sector investment,including investment in small and medium-sized enterprises. However, it encoun-tered financial problems because of the accumulation of high external debt andarrears by Nicaragua in the 1980s, part of which were due to its neighbors and toCABEI itself. This issue was compounded by the HIPC debt-relief initiative inthe late 1990s, because two of its borrowing members (Nicaragua and Honduras)became eligible for relief. Without adequate compensation (for example throughdonor trust funds established under HIPC), the prescribed debt relief could haveimpaired one-half of the net worth of CABEI.
The Caribbean Development Bank (CDB) was established in 1970 to promoteeconomic growth and integration among the countries of the CommonwealthCaribbean, particularly the less-developed members. It currently has twenty-fivemembers, including three nonborrowing regional members (Colombia, Mexico,and the Bolivarian Republic of Venezuela) and five nonregionals (Canada, China,Germany, Italy, and the United Kingdom). Like CABEI, it has acted as a finan-
10101-02_Ch02_Redo.qxd 10/5/06 3:05 PM Page 58

reforming the global financial architecture 59
cial intermediary to mobilize nonconcessional financing. Unlike CABEI, it alsohas a concessional window supported by a small group of bilateral donors. Areview of CDB undertaken in 1995 concluded that CDB is a highly effectivelender to smaller countries (many of which are island micro-states), based on itsportfolio of successful project loans and sound management practices. Its success,relative to CABEI, rests in part on its ability to access concessional funds forits lenders, which cannot sustain high levels of debt. An innovative agreementbetween CDB and the World Bank in 1990 resulted in CDB’s “retailing” WorldBank concessional funds to the micro-states of the eastern Caribbean.28
The Andean Development Corporation (Corporación Andina de Fomento,or CAF) began its operations in 1970 in Caracas. Its principal shareholders aremembers of the Andean community: Bolivia, Colombia, Ecuador, Peru, and theBolivarian Republic of Venezuela. It also has seven extraregional shareholders(Brazil, Chile, Jamaica, Mexico, Panama, Paraguay, and Trinidad and Tobago),as well as twenty-two private banks from the Andean region (a unique character-istic of subregional development banks). Thus CAF membership comprisesboth EMEs (Brazil, Chile, Colombia, Mexico, and the Bolivarian Republic ofVenezuela) and SMCs, all exclusively from the LAC region. (Spain also becamea member in recent years, with a small share and the same standing as othermembers, and thus with the ability to borrow from CAF). Its mission is to pro-mote sustainable development and regional integration in both the public andprivate sectors of Latin America and the Caribbean. CAF approvals to its fiveAndean members (U.S.$18.7 billion, 1990–99) considerably exceed those of theIDB ($14.4 billion) and the World Bank ($10.2 billion) and, while its bond rat-ing is lower than those of the IDB and World Bank (S&P: AAA), it is higherthan any other Latin American issuer (for example, Chile’s S&P rating is “A–”while that of CAF is “A”).29 Its lending portfolio is concentrated in its Andeanmembers, and 72 percent consists of infrastructure projects. CAF performanceis all the more remarkable because one of its Andean borrowers, Bolivia, is adebt-distressed HIPC country, while another, Ecuador, experienced severefinancial distress in 2003 and, like CABEI (but in contrast to CDB), it does nothave a concessional lending window.
The experience of CAF proves that it is possible for a subregional financialinstitution to operate very successfully, without any industrial-country shareholders
28. Hardy (1995).29. Financially its return on assets (1.9 percent) and equity (7.0 percent) outperforms the IDB
(1.0 percent and 5.0 percent, respectively) and World Bank (0.7 percent and 5.6 percent). SeeQuintela (2000).
10101-02_Ch02_Redo.qxd 10/5/06 3:05 PM Page 59

60 roy culpeper
and without recourse to concessional funding. Indeed, it has done so on a scalecomparable to that of the world’s principal IFIs, despite the serious economicproblems afflicting some of its key borrowing members—problems that havecaused serious difficulties for CABEI. Factors explaining the comparative successof CAF likely include judicious management and the sectoral composition of theborrowing portfolio, with its heavy emphasis on public sector infrastructure. Allthree organizations include regional integration among their principal objectivesbut, like their IFI peers, this does not seem to translate into a significant portionof their lending portfolios. Finally, while all three meet some their respectiveregions’ needs for long-term capital, none of them are particularly well placed tomeet needs for short-term assistance—for example, in the face of natural disasters.
Other regional organizations worth mentioning briefly include:30 (1) the Reci-procal Payments and Credits Agreement of the Latin American Integration Asso-ciation (ALADI), an arrangement dating back to the 1960 Montevideo Treaty,to settle trade-related payments among Latin American countries. After growingrapidly in the 1980s to the point of processing 90 percent of intraregional importpayments, the proportion processed by ALADI dwindled to 10 percent by 1999,partly because of the development of financial technology, de facto dollarization,and more flexible exchange rates, which reduced the advantages of the ALADIsettlement system;31 and (2) the Latin American Reserve Fund (Fondo Latino-americano de Reservas, FLAR), a reserve-pooling arrangement initiated by theAndean countries in 1978 (Costa Rica has subsequently joined). FLAR currentsubscribed capital is U.S.$2.1 billion; its fundamental objective is to support thebalance of payments of member countries by granting or guaranteeing loans. Theability to play this role effectively may be circumscribed both by relatively limitedFLAR resources and by its (thus far) limited membership (the five Andean coun-tries plus Costa Rica).32 In the event of regional contagion spreading from a par-ticular member’s financial crisis, there would be simultaneous demands forbalance-of-payments support that FLAR could not meet.33
Compared to Africa (and perhaps Asia as well, which is not surveyed here), theLatin American and Caribbean region seems well served by subregional organiza-tions, despite the setbacks suffered by CABEI on account of the Nicaraguanarrears and the HIPC initiative. In large part this is due to the greater economicstrength of countries in LAC, which include several EMEs. The CAF has broken
30. The list could also include FONPLATA, a subregional bank.31. Chang (2000).32. FLAR capital of $2.1 billion is clearly meager in comparison with the bilateral swap
arrangements under the Chiang Mai Initiative of $32.5 billion.33. Chang (2000).
10101-02_Ch02_Redo.qxd 10/5/06 3:05 PM Page 60

reforming the global financial architecture 61
new ground among regional financial institutions by virtue of both the overallvolume of its operations and its success on a number of indicators. And the FLARpredates the Chiang Mai Initiative (CMI) as a regional monetary fund, even if itsresources are still modest. The FLAR and CMI initiatives could well learn fromeach other—for example, FLAR could supplement its resources with bilateralswap agreements,34 and the CMI could learn from the FLAR experience withreserve pooling. Finally, the “retailing” arrangement between the World Bankand CDB could be replicated in a number of other subregional banks as a way ofefficiently channeling resources to the world’s smaller and poorer countries.
Conclusion: Regional Organizations in the Global Financial Architecture
Notwithstanding the important and innovative financial contributions of regionalorganizations such as CAF, the fact remains that a number of key financial needsof their developing-country members likely remain unmet. This is particularly thecase for all the financing requirements of the poorest countries and some smallerand lower-income countries, and for the shorter-term financing requirements ofpoorer and emerging countries alike. These are discussed in turn, with a mind tothe role of regional organizations in filling the gap.
Longer-Term Resource Needs of the Poorest Countries
Following the pledges of the international community made at the 2002 Inter-national Financing for Development Conference in Monterrey and during 2005,the year of the Millennium Review Summit, it seems that there could be significantincreases of about $50 billion in ODA in the years up to 2010. While welcome,this will still fall short of the amount required to help meet the millennium devel-opment goals (MDGs), which would require an ODA/GNI ratio of 0.44 percentin 2006, rather than the 0.30 percent currently projected for that year; even the0.36 percent projected for 2010 falls short.35 Moreover, calculations by the UnitedNations Millennium Project suggest that an ODA/gross national income (GNI)ratio of at least 0.54 percent would be necessary to help meet the MDGs. Giventhat backdrop, what can regional organizations or initiatives do to fill the gap?
34. Economic Commission for Latin America and the Caribbean (2002).35. Report to the Secretary-General of the High-Level Panel on Financing for Development
(United Nations A/55/1000, June 26, 2001); United Nations General Assembly, “Implementationof and follow-up to commitments and agreements made at the International Conference on Finan-cing for Development” (United Nations A/58/216, August 5, 2003), paragraphs 115–21. See alsoManning (2005), and the United Nations Millennium Project, “Why 0.7 percent matters for theMillennium Development Goals” (www.unmillenniumproject.org/involved/action07.htm.
10101-02_Ch02_Redo.qxd 10/5/06 3:05 PM Page 61

62 roy culpeper
There are two possible answers. The first looks outward, principally todonors for resources, by facilitating aid flows through collective regional efforts.The obvious example here is NEPAD, an initiative of African leaders aimed atcatalyzing aid and other resource flows to Africa. Through collective commit-ments to undertake economic and governance reforms, monitored through anAfrican peer-review system, the objective is to increase the confidence of donorsand private foreign investors that the economic and political climate is con-ducive to development, and therefore that aid will be more effective and privateinvestment more productive and profitable.
An offshoot of the NEPAD initiative involves the United Nations EconomicCommission for Africa (ECA) and the OECD Development Assistance Com-mittee’s own peer-review system, through ECA participation in the reviewsscheduled regularly for each donor member of DAC. Indeed, there is a paucityof mechanisms in the aid architecture to ensure that donors meet their pledgesand stated commitments, in contrast to the host of mechanisms to ensure thatdeveloping-country recipients meet theirs.36 While a few recipient countries aredeveloping mechanisms to monitor the commitments and behavior of theirentire family of donors, perhaps regional organizations (for example, the EastAfrican Community) could collectively arrange for independent monitoringand review of donors. The aim would be to identify and build on best practiceas well as to remedy unacceptable practices of those donors.
The second answer to meeting the needs of the poorest countries looksinward, to the possibility of mobilizing more resources domestically. Regionalorganizations can help deepen financial markets; develop the financial sectorthrough capacity building of banking and nonbanking institutions and humanskills; and help create or improve the regulatory and supervisory infrastructure.Regional cooperation may be particularly useful in setting up stock markets on aregional rather than a national basis, since, for poorer countries, local equitymarkets tend to be very thin. There could be cost advantages (by economizingon administrative and supervisory overhead) and benefits for local and foreignportfolio investors in the form of greater choice and market liquidity. In addi-tion, regional public bond markets, combined with integrated financial pay-ments systems, might effectively reduce the risk of contagion of financial crisesby facilitating a coordinated monetary policy response and reducing the possi-bility of temporary failure of trade finance. Some regional institutions arealready engaged in such an agenda, as evidenced by the financial reforms of the
36. Independent Monitoring Group (2002).
10101-02_Ch02_Redo.qxd 10/5/06 3:05 PM Page 62

reforming the global financial architecture 63
WAEMU (Western) subregion of the CFA franc zone and the ECOWAS pro-posal for a second monetary zone. While the objective of mobilizing more re-sources from the savings of the poorest countries is ambitious—and some mayeven regard it as naïve or utopian—the fact remains that the “East Asian miracle”involved, to a large extent, poor countries with high savings rates (considerably inexcess of those common in sub-Saharan Africa) and a reasonably efficient finan-cial sector.37
However, an important caveat must be added. Regional rules and institu-tions should be designed, first and foremost, with regional needs in mind. Tothe extent that such rules and institutions reduce the scope for action on fis-cal, monetary, financial sector, or exchange rate policies, as seems to be thecase at least for some countries in the CFA franc zone and elsewhere in sub-Saharan Africa, they could hinder rather than help domestic investment andgrowth.38
In conclusion, meeting the needs of the poorest countries for resources—whether long-term or short—is the most demanding of all development chal-lenges. It would be unrealistic to expect that regional cooperation, by itself,would help to bridge the enormous gap between availability and needs. None-theless, there may be ways in which regional cooperation can be a catalyst forgreater or more effective aid and private flows or help to deepen local financialmarkets and increase the scope for domestic resource mobilization.
Bridging the Gap for Short-Term Financing
Most of the attention in the aftermath of the Asian financial crisis has dwelt onshort-term measures to prevent or manage crises. While the 1998 proposal foran Asian Monetary Fund met with opposition from the IMF and some G-7members, the 2000 Chiang Mai Initiative has been widely endorsed, despite lin-gering misgivings.
In the meantime, as a result of the 1997–98 crisis, Asian countries (includ-ing China, Hong Kong SAR, the Republic of Korea, India, Singapore, andTaiwan Province of China) have accumulated a large stock of foreign ex-change reserves, estimated to be in excess of $2.5 trillion by June 2005. Theseresources give countries of the region a considerable war chest with which tofight speculative attacks. In that light, CMI bilateral swap and other arrangements
37. It is also true that economies such as the Republic of Korea and Taiwan Province of Chinabenefited from large resource transfers from bilateral donors, particularly the United States.
38. Gottschalk (2003).
10101-02_Ch02_Redo.qxd 10/5/06 3:05 PM Page 63
64 roy culpeper
amounting to $36.5 billion in late 2004 scarcely tap this pool of reserves,although the CMI is viewed as a mechanism that will grow incrementally overtime.39
The promise of the CMI as a regional mechanism for coping with financialinstability (like the success of CAF in Latin America in attracting longer-termfinancing) illustrates an obvious fact about emerging market economies: theirhigher per capita incomes and their aggregate market size endow them with sig-nificant resources and access to capital. Given continued growth among suchcountries, it seems likely that such regional mechanisms, without industrial-country membership in some cases, will play an increasing role in meeting theirshort-term financing needs.
The much more difficult challenge is meeting the short-term financing needsof the poorer countries (including the LDCs and smaller lower-middle-incomecountries) in the face of natural disasters, declining and volatile commodityprices, and postconflict reconstruction.
For most of these needs, international mechanisms and the involvement ofdonors seem imperative. In the specific case of commodity-dependent countries,past approaches to stabilizing prices and protecting against shocks, includinginternational commodity agreements, have experienced, at best, mixed success.There may be scope for subregional initiatives, however, in the areas of researchand development, and quality control and assurance, to enhance supply capabili-ties, particularly to meet the increasingly stringent standards of consumers andbuyers and to facilitate the production and export of higher-value-added prod-ucts. Such activities could be financed through the Common Fund for Com-modities (CFC).40
There may be scope for South-South cooperation as well in this area.41 Forexample, developing countries with national stabilization funds for particularcommodities (for example, Chile’s Copper Stabilization Fund) could provideassistance (again funded through the CFC) to heavily commodity-dependentregions in creating similar funds on a regional basis, pooling revenues from thekey commodities exported by member countries. Diversifying such funds toinclude revenues from more than one commodity would also serve as a stabiliz-
39. The Economist, September 15, 2005 (www.economist.com/displayStory.cfm?story_id=4401162). For CMI bilateral swap arrangements as of November 2004, see www.aric.adb.org/pdf/ProgressReportontheCMI10Nov04.pdf.
40. United Nations Conference on Trade and Development (2002).41. Helleiner (1999).
10101-02_Ch02_Redo.qxd 10/5/06 3:05 PM Page 64

reforming the global financial architecture 65
ing force, assuming that different commodities are subject to somewhat differ-ent supply and demand cycles.
An Overall Balance
Finally, let us return to the questions posed at the outset of this paper with sometentative answers:
—What organizational and institutional characteristics contribute to regionalfinancial organizations’ playing an effective role?
It seems clear that regional groups comprising, or dominated by, emergingmarket countries are more effective because of their economic strength, deepfinancial markets, and readier access to markets. Put otherwise, they have signifi-cant domestic resources and some bargaining power in the global economy.Regional financial organizations in Asia and, to a lesser extent, in Latin America,enjoy these advantages. In addition, Asia is home to some donor countries able toprovide concessional or grant financing to poorer countries in the region. Africa,comprising the poorest and lower-income countries, faces much graver difficultiesin seeking a greater role for regional financial cooperation. To remedy these short-comings, Africa must include nonregional donor or industrial countries in themembership of regional organizations, which can obviously raise other problems.
—What are the key financial constraints faced by different groups of devel-oping countries with respect to short-term financing and longer-term financing?
The poorest and smaller countries face challenges across the entire spectrum—whether for short-term or longer-term purposes. All countries, including emerg-ing market countries, face greater challenges in mobilizing short-term financingthan longer-term financing, although in the case of the latter there seems greaterlikelihood that EMEs will be able to organize regionally along the lines of theChiang Mai Initiative.
—To what extent can regional organizations play a key role in financial crisisprevention and management?
It is too soon to tell whether the Chiang Mai Initiative is up to the task ofpreventing or mitigating crises in East Asia. However, it could be argued that, asthe CMI grows in scope, and the longer the region is spared further financialcrises, the more effective CMI will be in making the region speculation-proof.As for poorer and smaller low-income countries, considerably more thought anddiscussion is needed to develop regional mechanisms to address their acuteneeds, whether for natural or manmade calamities, or for capital account, com-modity, or aid shocks.
—How can regional financial organizations help bridge the large resourcegap required for longer-term growth and development?
10101-02_Ch02_Redo.qxd 10/5/06 3:05 PM Page 65

66 roy culpeper
For the poorest and smaller countries, partnerships with donor countries seeminescapable for the foreseeable future. However, it seems important that theterms of the partnership be right for the developing countries. An excessivelyrestrictive policy framework, ostensibly to appease donors, may constrain growthand development potential. For the emerging market countries, the experience ofthe CAF suggests that regional organizations can be very adept at mobilizinglong-term development financing, provided the membership is appropriate (withprominent EME membership); portfolio composition and astute managementare likely also key factors.
Clearly, more research is needed on the potential of regional financial organi-zations in order to reach a comprehensive assessment of their effectiveness, orprescriptions to improve their performance, including a better division of laborwith the global organizations. However, it also seems clear that they can con-tribute significantly to the global financial architecture in meeting the particularneeds of developing countries from very different parts of the world, facing con-siderably different opportunities and challenges.
References
Bhagwati, J. 1998. “Regionalism and Multilateralism: WTO, Mercosur et al.” Paper presented tothe Argentine Bankers’ Convention, May. www.columbia.edu/∼jb38/papers/Argen98.PDF.
Braga de Macedo, J., D. Cohen, and H. Reisen, eds. 2001. Don’t Fix, Don’t Float. Paris:OECD Development Centre Studies.
Chang, R. 2000. “Regional Monetary Arrangements for Developing Countries.” RutgersUniversity. www.g24.org/chang.pdf.
Culpeper, R. 1997. Titans or Behemoths? The Multilateral Development Banks. Boulder: Colo.:Lynne Rienner.
Devlin, R., and L. Castro. 2002. “Regional Banks and Regionalism: A New Frontier forDevelopment Financing.” Buenos Aires: Inter-American Development Bank.
Economic Commission for Latin America and the Caribbean (ECLAC). 2002. Growthwith Stability: Financing for Development in the New International Context. Santiago:ECLAC Books.
Emerging Markets Eminent Persons’ Group. 2001. “Rebuilding the International FinancialArchitecture.” Seoul: Institute for Global Economics (October).
English, P., and H. Mule. 1996. The African Development Bank. Boulder: Lynne Rienner.Ethier, W. 1998. “The New Regionalism.” Economic Journal 108 (July): 1149–61.Gottschalk, R. 2003. “The Macroeconomic Policy Content of PRSPs: How Much Pro-
Growth, How Much Pro-Poor?” Paper prepared for the North-South Institute Project onPRSPs and Poverty, Ottawa, October.
Hardy, C. 1995. The Caribbean Development Bank. Volume 3 of The Multilateral Develop-ment Banks. Boulder, Colo.: Lynne Rienner and the North-South Institute.
Helleiner, G. 1999. “Small Countries and the New World Financial Architecture.” Capítulos,Latin America in the International Financial Crisis 56 (May/August).
10101-02_Ch02_Redo.qxd 10/5/06 3:05 PM Page 66

reforming the global financial architecture 67
International Monetary Fund (IMF). 2002. Survey: Supplement. September.Independent Monitoring Group. 2002. Enhancing Aid Relationships in Tanzania: Report of the
Independent Monitoring Group. Dar es Salaam: Economic and Social Research Foundation.Kappagoda, N. 1996. The Asian Development Bank. Volume 2 of The Multilateral Develop-
ment Banks. Boulder, Colo.: Lynne Rienner and the North-South Institute.Kapur, D., and R. Webb. 1994. “The Evolution of the Multilateral Development Banks.” In
International Monetary and Financial Issues for the 1990s. Volume 4, Special issue. NewYork: United Nations Conference on Trade and Development (UNCTAD).
Manning, R. 2005. “Statement to the Seventy-Second Meeting of the World Bank-IMFDevelopment Committee.” Washington, September 25, Document DC/S/2005-0064.
Martin, M., with C. Rose-Innes. 2004. “Private Capital Flows to Low-Income Countries:Perception and Reality.” In Canadian Development Report 2004, Chapter 2. Ottawa:North-South Institute.
Mistry, P. 1996. “Regional Dimensions of Structural Adjustment in Southern Africa.” InRegionalism and the Global Economy: The Case of Africa, edited by J. J. Teunissen. TheHague: FONDAD.
Ocampo, J. A. 2002. “The Role of Regional Institutions.” In A Regional Approach to Finan-cial Crisis Prevention: Lessons from Europe and Initiatives in Asia, Latin America and Africa,edited by J. J. Teunissen. The Hague: Forum on Debt and Development (FONDAD).
———. 2003. “Capital-Account and Counter-Cyclical Prudential Regulations in DevelopingCountries.” In From Capital Surges to Drought: Seeking Stability for Emerging Economies,edited by R. Ffrench-Davis and S. Griffith-Jones. London: Palgrave/Macmillan.
Park, Y. C. 2001. “Beyond the Chiang Mai Initiative: Rationale and Need for a RegionalMonetary Arrangement in East Asia.” Korea University. www.g24.org/ychp0904.pdf.
Quintela, C. 2000. “Corporación Andina de Fomento: Thirty Years Financing SustainableDevelopment.” Presentation, Rio de Janeiro, September 25.
Rwegasira, D. 1996. “Economic Cooperation and Integration in Africa: Experiences, Chal-lenges and Opportunities.” In Toward Autonomous Development in Africa, edited by R. Culpeper and C. McAskie. Ottawa: North-South Institute.
Stiglitz, J. 2002. Globalization and Its Discontents. New York: W. W. Norton.Strauss-Kahn, M. O. 2003. “Regional Currency Areas: A Few Lessons from the Eurosystem
and the CFA Franc Zone.” In Regional Currency Areas and the Use of Foreign Currencies,BIS Papers (Basel) 17 (May): 42–58.
Teunissen, J. J., ed. 2002. A Regional Approach to Financial Crisis Prevention: Lessons fromEurope and Initiatives in Asia, Latin America and Africa. The Hague: FONDAD.
United Nations Conference on Trade and Development (UNCTAD). 2000. The LeastDeveloped Countries 2000 Report. Geneva: United Nations.
———. 2002. The Least Developed Countries 2002 Report: Escaping the Poverty Trap. Geneva:United Nations.
10101-02_Ch02_Redo.qxd 10/5/06 3:05 PM Page 67

68
This chapter compares the roles played by regional and subregional multi-lateral development banks (MDBs) in development financing and attempts
to integrate fragmented data and information from a variety of sources.Development financing institutions are situated at the intersection of the
international development system and the international financial system. Whilethere are several entities that straddle both systems, the MDBs occupy a uniqueplace because of their specific characteristics and because they interact withmost of the actors in both systems. Multilateral development banks are inter-national financial intermediaries whose shareholders include both developingcountries that borrow from them and developed countries that do not. Theymobilize resources from private capital markets and from official sources tomake loans on better-than-market terms, provide technical assistance and pol-icy advice for economic and social development, and offer a range of comple-mentary services to developing countries and to the international developmentcommunity.
The MDB “model” is perhaps one of the most useful institutional innovationsin development finance of the past six decades and, on the whole, these institu-tions have a reasonably positive track record. Neither private sources nor bilateralagencies could have leveraged financial resources so efficiently. Moreover, there
Regional Development Banks: A Comparative Perspectivefrancisco sagasti and fernando prada
3
10101-03_Ch03_Redo.qxd 10/5/06 3:06 PM Page 68

regional development banks 69
are no other institutions capable of providing a comparable range of products andservices to their member countries, including financial resource mobilization,capacity building, institutional development, knowledge brokering, and the pro-vision of international public goods.1
MDBs must preserve a delicate balance among the three main functions theyperform: financial resource mobilization with the aim of providing financial re-sources to developing countries through regular and concessional loans; capacitybuilding, institutional development, and knowledge brokering through technicalassistance, grants, policy dialogue, dissemination of best practice and researchsupport; and helping to provide regional and global public goods that cannot befully provided by national institutions. Not all MDBs are involved in thesefunctions to the same extent, but collectively they cover all of them. There is aninherent tension between the financing and development functions of theMDBs, a tension that has been there since these institutions were created. Theyserve, on the one hand, as financial intermediaries, and on the other, as devel-opment agencies. Performing this delicate balancing act has become muchmore difficult in recent years, primarily because of the increasing number ofissues that MDBs are required to address, the criticisms that have been leveledagainst them (especially the World Bank), and the debt service problems facedby many of their low-income borrowers. Moreover, in addition to their financ-ing and development roles, these institutions are being asked to play a servicerole in the provision of regional and global public goods. Although regional andsubregional institutions are not as important as the World Bank in the provi-sion and financing of such goods, there is evidence that they are taking a moreactive role in the provision of regional public goods, and this applies in particu-lar to the Inter-American Development Bank (IDB) and the Asian Develop-ment Bank (AsDB).2
Nevertheless, financial resource mobilization can be considered to be theprimus inter pares of these three functions. Providing loans to borrowing mem-ber countries is an essential condition for the existence of an MDB, and neitherof their other two functions could be performed without preserving their finan-cial integrity and technical capacity to make loans.
1. See, in this regard, Bezanson and Sagasti (2000), Sagasti and Bezanson (2001), and Sagasti(2004).
2. Estevadeordal, Frantz, and Nguyen (2004). In late 2004, the IDB launched a new initiativeto support the provision of regional public goods. It will allocate at least U.S.$10 million annuallyfor this purpose during the next three years. Resources are being allocated through an open compe-tition for proposals.
10101-03_Ch03_Redo.qxd 10/5/06 3:06 PM Page 69

An Overview of the Regional and Subregional Development Banks
There are more than twenty institutions that qualify as MDBs according to thebroad definition of multilateral development banks being used in this chapter.MDBs can be differentiated according to size, number, and characteristics of theirshareholders, type of borrowers (public or private, income levels), geographicscope (global, regional, subregional), and by the sectors or activities they cover.Most studies of MDBs have focused on the World Bank, the oldest and largest ofthe MDBs, and on the regional development banks (Inter-American Devel-opment Bank, Asian Development Bank [AsDB], African Development Bank[AfDB], and European Bank for Reconstruction and Development [EBRD]),which come next in size and membership, and which were established during the1950s and 1960s (with the exception of the EBRD, which was established in1991). However, there are also many smaller MDBs (“subregionals”) and inter-national funds and institutions that can be considered multilateral developmentbanks based on the characteristics of their operations (see table 3-1).3
The level of resources provided by MDBs to developing countries is lowerthan the direct foreign investment (U.S.$137 billion in 2003), remittances(U.S.$93 billion), and bilateral assistance (U.S.$49.5 billion) they receive. Inaddition, the share of MDBs in total net flows from multilateral sources variesacross regions and levels of income. Net flows from regional developmentbanks (RDBs) to developing countries were U.S.$66.7 billion during the period1991–2002, nearly 30 percent of total net flows from multilateral sources(table 3-2). Excluding from this total the flows from the International MonetaryFund (IMF), which are mainly short term, RDBs provide more than 40 percentof total long- and medium-term net flows to developing countries from multi-lateral sources.
70 francisco sagasti and fernando prada
3. The European Investment Bank has been placed in the category of subregional developmentbanks, even though it is very large and might belong in a category of its own. It operates in a widevariety of countries, including some relatively advanced European and transition countries, as wellas in many developing countries. Other institutions, such as the Latin American Reserve Fund andthe Arab Monetary Fund, provide short-term financial assistance to their member countries andtherefore have not been considered here as MDBs; their functions are more like those of the Inter-national Monetary Fund (IMF). The Latin American Export Bank (BLADEX) is another specialcase. It focuses on trade transactions (export credit) and on capital market operations (guarantees).BLADEX has not been classified as an MDB because of its shareholding composition: of its 39.3 mil-lion shares, 16.1 percent are Class A (shares that can only be issued to Latin American CentralBanks or banks in which the state or some government agency is the majority shareholder), 10.4 per-cent are Class B (issued to banks or financial institutions), and 73.5 percent are Class E (issued toany person whether a natural person or a legal entity).
10101-03_Ch03_Redo.qxd 10/5/06 3:06 PM Page 70

regional development banks 71
There are important regional differences in the role that RDBs play in devel-opment financing. In Latin America, net flows from the IDB have steadily andsignificantly expanded, rising from U.S.$5.2 billion in 1991–94 to U.S.$15.9 bil-lion in 1999–2002, and have surpassed by far those from the World Bank(U.S.$1.3 and U.S.$7.3 billion, respectively, in the same periods). RDB net flowsare also higher than those of the World Bank in the region comprising the Mid-dle East and North Africa (U.S.$3 billion from RDBs compared with U.S.$1 bil-lion from the World Bank in the period 1991–2002), although financial flowsfrom multilateral sources are not as large in that region as in Latin America.
The growth in financing from RDBs has occurred primarily in middle-income countries, where their net flows surpassed those of the World Bank:U.S.$42.5 billion compared with U.S.$40 billion for the period 1991–2002. IfIMF flows to these countries are excluded, RDBs account for more than 50 per-cent of net multilateral flows. Lower-middle-income countries have receivedU.S.$7.2 billion from the World Bank and U.S.$12.3 billion from RDBs. Upper-middle-income countries received U.S.$30 billion from RDBs in the sameperiod, although for this group of countries World Bank net flows were higherthan those of RDBs (U.S.$33 billion). In contrast, low-income economies areheavily dependent on the World Bank, which accounted for 53 percent of totalnet multilateral flows (U.S.$41 billion in the period 1991–2002). The situationis similar for highly indebted poor countries (HIPC), where the World Bankcontributed 64 percent of total net multilateral flows.
Evolution and Current Situation of the Regional and Subregional Development Banks
Financial Instruments and Services
The MDBs have product lines that include regular loans at below-market rates ofinterest;4 concessional loans at very low rates of interest with long repaymentperiods; relatively small amounts of grant financing for technical assistance; train-
4. Some borrowing countries with very good credit ratings can obtain financing from inter-national capital markets at lower rates than those offered by the MDBs, but these countries have alsoresorted to MDB financing in exceptional cases of distress. For example, the World Bank providedthe Republic of Korea with a total of U.S.$8.6 billion in IBRD regular loans and U.S.$120 millionin IDA soft credits through the years, with the last loan occurring in December 1994, before theRepublic of Korea “graduated” and became ineligible for World Bank financing. Nevertheless, inthe aftermath of the 1997 Asian crisis, the Republic of Korea returned to borrow from the WorldBank and received a U.S.$3 billion loan as part of a U.S.$57 billion package provided by variousinternational financial institutions and bilateral agencies.
10101-03_Ch03_Redo.qxd 10/5/06 3:06 PM Page 71

Tab
le 3
-1.
The
Fam
ily o
f Mul
tilat
eral
Dev
elop
men
t Ban
ks
Latin
Am
eric
a M
iddl
e Eu
rope
and
the
Sub-
Saha
ran
East
and
Sout
h Ea
st A
siaan
d M
ultil
ater
al d
evel
opm
ent b
anks
Year
Car
ibbe
anA
fric
aN
orth
Afr
ica
Asia
and
Paci
ficC
entr
al A
sia
Wor
ld B
ank
grou
pIn
tern
atio
nal B
ank
for
Rec
onst
ruct
ion
1944
Pr/P
uaPr
/Pu
Pr/P
uPr
/Pu
Pr/P
uPr
/Pu
and
Dev
elop
men
t (IB
RD
)In
tern
atio
nal D
evel
opm
ent A
ssoc
iati
on (
IDA
)19
60Pu
PuPu
PuPu
PuIn
tern
atio
nal F
inan
ce C
orpo
rati
on (
IFC
)19
56Pr
/Pu
Pr/P
uPr
/Pu
Pr/P
uPr
/Pu
Pr/P
uM
ulti
late
ral I
nves
tmen
t Gua
rant
ee A
genc
y (M
IGA
)19
88Pr
/Pu
Pr/P
uPr
/Pu
Pr/P
uPr
/Pu
Pr/P
u
Reg
iona
l dev
elop
men
t ban
ks (
RD
Bs)
Inte
r-A
mer
ican
Dev
elop
men
t Ban
k (I
DB
)19
59Pr
/Pu
Fund
for
Spec
ial O
pera
tion
s (F
SO)
1959
PuIn
ter-
Am
eric
an I
nves
tmen
t Cor
pora
tion
(II
C)
1989
PrM
ulti
late
ral I
nves
tmen
t Fun
d (M
IF)
1992
PrA
fric
an D
evel
opm
ent B
ank
(AfD
B)
1964
Pr/P
uPr
/Pu
Afr
ican
Dev
elop
men
t Fun
d (A
fDF)
1972
Pr/P
uPr
/Pu
Asi
an D
evel
opm
ent B
ank
(AsD
B)
1966
Pr/P
uPr
/Pu
Pr/P
uA
sian
Dev
elop
men
t Fun
d (A
sDF)
1973
PuPu
PuE
urop
ean
Ban
k fo
r R
econ
stru
ctio
n 19
91Pr
/Pu
and
Dev
elop
men
t (E
BR
D)
Subr
egio
nal d
evel
opm
ent b
anks
(SR
DB
s)E
urop
ean
Inve
stm
ent B
ank
(EIB
)19
58Pr
/Pu
Pr/P
uPr
/Pu
Pr/P
uPr
/Pu
Pr/P
uC
entr
al A
mer
ican
Ban
k fo
r E
cono
mic
Int
egra
tion
(CA
BE
I)19
61Pr
/Pu
10101-03_Ch03_Redo.qxd 10/5/06 3:06 PM Page 72

Car
ibbe
an D
evel
opm
ent B
ank
(CD
B)
1969
Pr/P
uA
ndea
n D
evel
opm
ent C
orpo
rati
on (
AD
C)
1971
Pr/P
uN
ordi
c In
vest
men
t Ban
k (N
IB)
1976
Pr/P
uPr
/Pu
Pr/P
uPr
/Pu
Pr/P
uPr
/Pu
Isla
mic
Dev
elop
men
t Ban
k (I
sDB
)19
73Pr
/Pu
Pr/P
uPr
/Pu
Pr/P
uIs
lam
ic C
orpo
rati
on fo
r In
sura
nce
of I
nves
tmen
ts
1994
PrPr
PrPr
and
Exp
ort C
redi
ts (
ICIE
C)
Isla
mic
Cor
pora
tion
for
the
Dev
elop
men
t 19
99Pr
PrPr
Prof
the
Priv
ate
Sect
or (
ICD
)E
ast A
fric
an D
evel
opm
ent B
ank
(EA
DB
)19
67Pr
/Pu
Ara
b B
ank
for
Eco
nom
ic D
evel
opm
ent
1974
PuPu
in A
fric
a (A
BE
DA
)W
est A
fric
an D
evel
opm
ent B
ank
(BO
AD
)19
73Pr
/Pu
Nor
th A
mer
ican
Dev
elop
men
t Ban
k (N
AD
B)
1994
Pr/P
u
Oth
er M
DB
-like
fund
sN
ordi
c D
evel
opm
ent F
und
(ND
F)19
89Pr
/Pu
Pr/P
uPr
/Pu
Pr/P
uIn
tern
atio
nal F
und
for
Agr
icul
tura
l Dev
elop
men
t (IF
AD
)19
77Pr
/Pu
Pr/P
uPr
/Pu
Pr/P
uPr
/Pu
Pr/P
uA
rab
Fund
for
Eco
nom
ic a
nd S
ocia
l Dev
elop
men
t (A
FESD
)19
68Pu
PuO
rgan
izat
ion
of P
etro
leum
Exp
orti
ng C
ount
ries
(O
PEC
) 19
76Pr
/Pu
Pr/P
uPr
/Pu
Pr/P
uFu
nd fo
r In
tern
atio
nal D
evel
opm
ent
FON
PLA
TA
b19
76Pu
a. P
u =
oper
atio
ns w
ith
the
publ
ic s
ecto
r. P
r =
oper
atio
ns w
ith
the
priv
ate
sect
or.
b. F
ondo
Fin
anci
ero
para
el D
esar
rollo
de
la C
uenc
a de
l Pla
ta (
Fund
for
Dev
elop
men
t of t
he P
lata
Riv
er B
asin
).
10101-03_Ch03_Redo.qxd 10/5/06 3:06 PM Page 73

74 francisco sagasti and fernando prada
Table 3-2. Regional Development Banks: Net Flows by Region, 1991–2002Billions of U.S. dollars
Total Relative share, 1999– 1991– 1991–2002
Multilateral financing sources a 1991–94 1995–98 2002 2002 (percent)
All developing countriesWorld Bank 25.42 31.51 23.95 80.87 35.7IMF 7.48 35.36 20.62 63.46 28.0Other 6.62 8.55 0.16 15.33 6.8RDBs 20.53 24.65 21.55 66.73 29.5
RegionsEast Asia and Pacific
World Bank 7.13 8.12 3.46 18.71 46.0IMF −0.61 12.65 −2.11 9.93 24.4Other 0.13 0.30 0.08 0.51 1.3RDBs 3.11 5.30 3.15 11.55 28.4
Europe and Central AsiaWorld Bank 3.17 9.47 7.02 19.66 33.6IMF 9.98 16.57 6.90 33.45 57.2Other 3.50 −1.29 0.12 2.33 4.0RDBs 0.35 1.94 0.71 2.99 5.1
Latin America and the CaribbeanWorld Bank −1.29 3.46 5.10 7.27 11.3IMF −4.79 9.54 15.83 20.58 32.0Other 0.64 6.04 −1.64 5.04 7.8RDBs 5.17 10.24 15.93 31.34 48.8
Middle East and North AfricaWorld Bank 1.15 0.29 −0.37 1.07 10.7IMF 0.09 1.10 −0.60 0.59 5.8Other 1.41 2.94 1.03 5.38 53.5RDBs 2.27 0.99 −0.26 3.01 29.9
South AsiaWorld Bank 8.07 3.94 2.14 14.15 61.3IMF 1.71 −4.33 0.02 −2.61 −11.3Other −0.01 0.24 0.28 0.51 2.2RDBs 5.09 4.43 1.53 11.05 47.8
Sub-Saharan AfricaWorld Bank 7.18 6.23 6.60 20.01 67.0IMF 1.11 −0.17 0.59 1.53 5.1Other 0.94 0.33 0.28 1.55 5.2RDBs 4.55 1.74 0.49 6.79 22.7
10101-03_Ch03_Redo.qxd 10/5/06 3:06 PM Page 74

regional development banks 75
ing and capacity-building activities; risk mitigation and management instru-ments (such as guarantees, equity participation and capital market operationsto enhance private investment); debt management and debt reduction instruments;and additional mechanisms such as the convening of consultative groups tomobilize resources from other financial sources and the issuing of bonds in localcurrencies to strengthen the capital markets of developing countries. Table 3-3presents a list of these financial mechanisms and their subtypes, including someinnovative proposals that have not yet been fully implemented.5
Income levelLow income
World Bank 17.04 12.42 11.46 40.92 52.5IMF 1.88 6.97 0.97 9.82 12.6Other 1.30 1.11 0.62 3.02 3.9RDBs 10.74 8.01 5.47 24.23 31.1
Middle incomeWorld Bank 8.38 19.08 12.49 39.95 26.9IMF 5.60 28.39 19.65 53.64 36.1Other 5.33 7.45 −0.47 12.31 8.3RDBs 9.79 16.63 16.08 42.50 28.6
Heavily indebted poor countriesWorld Bank 7.63 8.30 9.47 25.39 64.0IMF 0.31 1.10 0.98 2.39 6.0Other 0.99 0.95 0.88 2.82 7.1RDBs 3.97 2.82 2.26 9.05 22.8
Source: World Bank (2004).a. Other multilateral sources are export credit and rescheduling operations with the Paris Club.
Table 3-2. (continued)Billions of U.S. dollars
Total Relative share, 1999– 1991– 1991–2002
Multilateral financing sources a 1991–94 1995–98 2002 2002 (percent)
5. The World Bank has been an important source of innovative financial instruments for devel-oping countries, and these instruments have generally been rapidly emulated by RDBs and, to alesser extent, by SRDBs. For example, regional development banks initially offered loans onlythrough their regular windows, but established concessional windows during the 1970s after theInternational Development Association (IDA) was created. Similarly, the surge in private sectoroperations through the Multilateral Investment Guarantee Agency (MIGA) was promptly emu-lated by the RDBs during the 1990s.
10101-03_Ch03_Redo.qxd 10/5/06 3:06 PM Page 75

Table 3-3. MDB Financing Instruments and Their Degree of Use
Financing Degreeinstruments Subtypes of financial instruments of use a
Regular loans
Soft (concessional) loans
Grants (mostly to public institutions)
Risk mitigation and management(mostly for the private sector)
Debt reduction and debt management
Additional financial instruments
a. This column classifies the use of these instruments as follows:* Proposed.+ Being designed and tested.++ In limited use (in some cases on a pilot scale).+++ In moderate use (focus on certain countries and sectors).++++ In extended and widespread use.
Project, program, and sector loans for the public and privatesectors
Structural adjustment loans and balance-of-payments supportEmergency recovery loans (in case of disaster or unexpected
events)Loans to financial intermediaries (for example, development
finance corporations)Prearranged fast-disbursement loans conditional on
previous performance
Project, program, sector, and structural adjustment loans tothe public sector
Temporary funds for countries with special needs (postconflictreconstruction, sudden deterioration of external conditions)
Assistance to public institutions for specific programs andprojects
Technical cooperation, capacity-building, and institutionaldevelopment grants
Emergency operations to deal with natural or manmadedisasters
Total, partial, and rolling guarantees (political, contractual,regulatory, credit, foreign exchange risks)
Financing for currency- and interest-hedging operationsEquity participation and quasi-equity (common shares,
preferred stock, C loans)Other instruments to promote private investment and
trade: export credits, securitization, leasing, syndication,underwriting, trade insurance
Funds for multilateral debt reduction (HIPC Initiative)Debt reduction loans (for example, for buying back existing
debt, debt service reduction)Funds for clearing arrears with multilateral development banksSoft loan buy-down mechanisms
Mobilization of resources from bilateral and othermultilateral sources (consultative groups)
Issuing bonds in developing countries to strengthen localcapital markets
++++
++++++
+++
*
+++
+
+++
+++
+++
+++
++++
++
+++++
++*
+++
++
10101-03_Ch03_Redo.qxd 10/5/06 3:06 PM Page 76

regional development banks 77
Regular loans are medium- or long-term loans, which constitute the mainactivity of the banks. They include: (1) project and program loans for the publicand private sectors, the most frequent type of loans; (2) structural adjustmentloans and balance-of-payments support, usually disbursed in tranches, subject tothe implementation of agreed policy reforms and certain targets; (3) emergencyrecovery loans extended in cases of disaster or unexpected events; (4) loans tofinancial intermediaries, such as development finance corporations, and estab-lishment of apex funds for microfinance; and (5) prearranged fast-disbursementloans conditional on previous performance, available to borrowers deemed credit-worthy. Regional development banks and, to a lesser extent, subregional devel-opment banks (SRDBs) also have soft loan windows available to their poorestmember countries. These include low-interest long-term concessional loans withan extended grace period for public sector investment projects and programs, forsectoral and structural policy reforms, for emergencies and postconflict recon-struction, and for budget support through a common pool of resources.
The World Bank disbursed an annual average of U.S.$17.7 billion during theperiod 2000–03, of which regular International Bank for Reconstruction andDevelopment (IBRD) loans accounted for 66 percent and International Develop-ment Association (IDA) soft credits for 34 percent.6 As shown in table 3-3, RDBsdisbursed almost U.S.$19 billion and SRDBs more than U.S.$12 billion in thesame period. Although the figures may vary because data from some SRDBs andMDB-like funds are reported in different currencies, it seems clear that regionaland subregional institutions have been mobilizing large amounts of resources,surpassing those from the World Bank in several cases. The figures in table 3-3corroborate this in the case of net flows, especially in the Latin American region.7
Table 3-4 indicates the relative importance of various types of financing instru-ments in each institution. The emphasis placed on certain types of operations by
6. During this time, the World Bank committed U.S.$17.3 billion. The level of financing grewin 2004 to U.S.$20.1 billion, mainly as a result of the increase of IDA commitments to nearlyU.S.$10 billion, up from an annual average of U.S.$7.3 billion in the period 2000–03.
7. The data would need to be standardized in order also to compare net flows from SRDBs,which are poorly reflected in most statistical databases. For example, the World Bank’s GlobalDevelopment Finance does not include these flows. On the other hand, the OECD CreditorReporting System includes some information about the CDB and IFAD and aggregate informa-tion on the Arab Funds (AFESD; the Kuwait, Saudi, and Abu Dhabi Funds, ABEDA; the OPECFund, and IsDB). It indicates that the CDB disbursed U.S.$0.55 billion in the period 2000–02and had U.S.$0.42 billion in net flows; that IFAD disbursed U.S.$0.84 billion in the same periodand had U.S.$0.46 billion in net flows; and that the Arab Funds disbursed U.S.$0.89 billion andhad U.S.$0.32 billion in net flows. (For the full names of organizations abbreviated in this note,see table 3-1.)
10101-03_Ch03_Redo.qxd 10/5/06 3:06 PM Page 77

Tab
le 3
-4.
Fina
ncia
l Res
ourc
e M
obili
zatio
n an
d Fi
nanc
ing
Instr
umen
ts, A
nnua
l Ave
rage
, 200
0–03
Estim
ated
per
cent
age
of to
tal p
ortfo
lioO
ther
instr
umen
ts
Priv
ate
sect
orT
otal
(U.S
.$ b
illio
ns)
Reg
ular
Soft
oper
atio
ns a
ndam
ount
Deb
tA
dditi
onal
M
ultil
ater
al d
evel
opm
ent b
anks
loan
slo
ans
Gra
nts
risk
instr
umen
tsa
(U.S
.$ b
illio
ns)
instr
umen
tsb
instr
umen
tsc
Reg
iona
l dev
elop
men
t ban
ksID
B g
roup
83.3
5.0
0.4
11.3
6.71
1.29
1.87
AfD
B, A
fDF
40.4
36.9
20.2
d2.
52.
893.
850.
88A
sDB
, AsD
F70
.125
.40.
24.
35.
680.
002.
19E
BR
D25
.90.
00.
174
.03.
26..
.5.
82T
otal
e18
.54
5.14
Subr
egio
nal d
evel
opm
ent b
anks
EIB
(20
00–0
2)f
14.9
...
...
85.1
4.56
0.69
n.a.
CA
BE
I62
.0..
...
.38
.00.
380.
59..
.C
DB
69.6
28.7
0.8
0.9
0.19
0.02
...
AD
C (
2000
–02)
59.1
0.1
0.5
39.3
2.93
0.11
0.53
NIB
(20
03)g
93.4
...
...
6.4
0.79
0.01
...
IsD
B g
roup
46.2
9.1
4.3
40.4
2.92
0.14
0.05
EA
DB
69.5
...
...
30.5
0.04
0.01
...
AB
ED
Ah
37.8
58.3
1.6
3.3
0.13
0.19
0.37
BO
AD
46.0
...
n.a.
31.0
0.14
0.05
n.a.
NA
DB
(19
96–2
002)
12.0
...
88.0
h..
.0.
06..
...
.T
otal
e12
.14
1.81
10101-03_Ch03_Redo.qxd 10/5/06 3:06 PM Page 78

Oth
er M
DB
-like
fund
sN
DF
(200
3)10
0.0
...
...
...
0.09
0.03
...
IFA
D (
2000
–02)
7.5
86.7
5.8
...
0.28
0.28
...
AFE
SD (
2003
)99
.9..
.0.
1..
.0.
280.
07..
.O
PEC
Fun
d (2
003)
74.9
...
11.0
14.1
0.31
0.16
...
FON
PLA
TA
97.9
...
2.1
...
0.03
0.03
...
Tot
ale
1.10
0.57
n.a.
Not
ava
ilabl
e...
. Neg
ligib
le.
a. P
riva
te s
ecto
r ac
tivi
ties
(no
t in
clud
ed in
the
reg
ular
or
soft
win
dow
s), g
uara
ntee
s, a
nd e
quit
y in
vest
men
t. It
is a
ssum
ed t
hat
all g
uara
ntee
s an
d eq
uity
inst
rum
ents
are
desi
gned
for
the
priv
ate
sect
or, a
lthou
gh t
his
is n
ot e
ntir
ely
true
in t
he c
ase
of g
uara
ntee
s an
d eq
uity
for
publ
ic e
nter
pris
es o
r gu
aran
tees
for
the
publ
ic s
ecto
r. W
hen
poss
ible
,pr
ivat
e se
ctor
loan
s gua
rant
eed
by p
ublic
inst
itutio
ns h
ave
also
bee
n in
clud
ed. I
n th
e ca
se o
f the
IsD
B a
nd C
AB
EI,
trad
e fin
anci
ng o
pera
tions
, whi
ch a
re a
ssum
ed to
be
mai
nly
a pr
ivat
e se
ctor
act
ivity
, acc
ount
for
mos
t of t
he r
esou
rces
.b.
Tot
al c
omm
itm
ents
for
deb
t re
duct
ion
unde
r th
e H
IPC
Ini
tiat
ive
for
thir
ty-s
even
cou
ntri
es. T
wen
ty-t
hree
mul
tila
tera
l cre
dito
rs h
ave
com
mit
ted
to p
rovi
de H
IPC
relie
f am
ount
ing
to U
.S.$
24.3
bill
ion
(200
3 ne
t pre
sent
val
ue te
rms)
—ov
er 9
9 pe
rcen
t of t
he to
tal d
ebt r
elie
f req
uire
d. G
loba
l ins
titu
tion
s, s
uch
as th
e IM
F an
d th
e W
orld
Ban
k, c
ould
pro
vide
ove
r U
.S.$
15.4
bill
ion
of th
is a
mou
nt. O
ther
mul
tila
tera
l ins
titu
tion
s no
t inc
lude
d co
uld
prov
ide
U.S
.$0.
2 bi
llion
.c.
Cof
inan
ced
proj
ects
, inc
lude
d in
tota
l res
ourc
es p
rovi
ded
by b
anks
, exc
ept i
n th
e ca
se o
f EB
RD
and
AB
ED
A, w
here
the
amou
nts
show
n co
nstit
ute
addi
tiona
l fin
anci
ng.
d. F
or A
fDB
, gra
nts
incl
ude
reso
urce
s co
mm
itte
d fo
r de
bt r
educ
tion
.e.
The
tota
l am
ount
is s
how
n fo
r ea
ch ty
pe o
f ins
titu
tion
for
com
para
tive
pur
pose
s on
ly.
f. In
clud
es o
nly
oper
atio
ns w
ith
deve
lopi
ng c
ount
ries
(11
per
cent
of
tota
l) a
nd a
cces
sion
cou
ntri
es (
8 pe
rcen
t of
tot
al),
not
Eur
opea
n U
nion
mem
ber
coun
trie
s (f
iftee
ndu
ring
the
peri
od u
nder
con
side
rati
on).
g. T
otal
am
ount
incl
udes
Eur
opea
n tr
ansi
tion
cou
ntri
es. P
riva
te s
ecto
r op
erat
ions
and
ris
k in
stru
men
ts in
clud
e on
ly g
uara
ntee
s; le
ndin
g to
the
pri
vate
sec
tor
is in
clud
edin
reg
ular
loan
s, m
ost o
f the
m (
82 p
erce
nt)
to N
ordi
c co
mpa
nies
.h.
Sof
t loa
ns a
nd g
rant
s ar
e ca
lcul
ated
taki
ng in
to a
ccou
nt th
e gr
ant e
lem
ent o
f tot
al lo
ans.
Onl
y te
chni
cal a
ssis
tanc
e gr
ants
are
incl
uded
. In
the
case
of N
AD
B, g
rant
s ar
epr
einv
estm
ent g
rant
s.
10101-03_Ch03_Redo.qxd 10/5/06 3:06 PM Page 79

80 francisco sagasti and fernando prada
regional and subregional institutions reflects the diversity of financial needs. Insti-tutions serving the African region are more focused on concessional loans andgrants, for example. The AfDB and ABEDA have a higher proportion of theseinstruments than institutions operating in Central Asia and Europe, which aremore focused on private sector activities. These differences between RDBs alsoapply at the subregional level. For example, the Caribbean Development Bank(CDB) operates in some of the poorest Caribbean countries and has a larger pro-portion of concessional lending than the Central American Bank for EconomicIntegration (CABEI), which has a clear mandate to improve intraregional trade(this is reflected in its higher proportion of trade finance and infrastructure opera-tions). The ADC (Andean Development Corporation) and FONPLATA (FondoFinanciero para el Desarrollo de la Cuenca del Plata; in English, Financial Fundfor Development of the Plata River Basin), operating mainly in middle-incomecountries, have specialized in other types of operations, such as infrastructureprojects for regional integration and for improving competitiveness. These activi-ties are in line with the general idea behind the creation of regional and sub-regional institutions: they play specific and localized roles, which are not alwayscovered adequately by global or even by regional institutions.8
Some characteristics of the RDBs and SRDBs merit highlighting. First, thelevel of resource mobilization does not clearly differentiate RDBs from SRDBs.Some subregional institutions such as the Andean Development Corporationand the European Investment Bank (EIB) have disbursed more resources thanregional institutions, and their close relations with international capital marketsallow them to tap financial markets with relative ease. Although very few of itssovereign shareholders have an investment-grade rating for their debt, the ADChas been a preferred borrower in international markets, raising U.S.$1.3 billionin 2003 and U.S.$3.2 billion in 2002. It has an investment-grade rating ofA/A2 by Standard & Poor’s and Moody’s, and the entrance of Spain as a share-holder, together with the fact that nonaccruing loans were less than 0.2 percentof its loan portfolio, have helped to secure this favorable rating. The EIB pro-vides resources to developing, transition, and developed countries, althoughduring the period 2000–02 its operations in developing countries accounted foronly 19 percent of its total operations, which averaged U.S.$24.5 billion.
8. During the mid-1950s and the 1960s, the World Bank financed mainly infrastructure proj-ects (75 percent of its total portfolio). The creation of the first RDB, the Inter-American Develop-ment Bank, in 1959, can be seen partly as a reaction by Latin American countries to World Banklending policies that gave little attention to the social and agriculture sectors (which representedonly 3 percent of the World Bank’s portfolio). In the first ten years of IDB operations, these sectorsreceived almost 50 percent of total IDB disbursements (Kapur, Lewis, and Webb, 1997).
10101-03_Ch03_Redo.qxd 10/5/06 3:06 PM Page 80

regional development banks 81
Another special feature of some MDBs, closely related to their participation inprivate sector projects, is their capacity to cofinance projects by mobilizing fundsfrom bilateral agencies, other multilateral institutions, or the private sector. Again,the heterogeneity of the available financial information is notable, although thefigures provided by the RDBs are slightly more reliable. For example, the IDBand the AsDB committed U.S.$1.87 and U.S.$2.19 billion per year, respectively,to private sector projects during the period 2000–03, and they have leveragedabout 35 percent and 48 percent, respectively, in additional resources. TheEBRD, with private sector loans averaging U.S.$3.2 billion per year, mobilizedU.S.$5.82 billion from various sources during the period 1999–2003. Theinstruments used to achieve this are quite diverse and include syndicated loans,grants, and concessional loans from other multilateral sources, guarantees, and pri-vate sector contributions. Guarantees appear to be the next step toward enhancingthe capacity of regional institutions to leverage additional financing,9 mainlyfrom private sources and possibly focusing on infrastructure projects. The totalnumber of guarantee operations during the period 2001–03 by the IBRD, theMultilateral Investment Guarantee Agency (MIGA), the Islamic DevelopmentBank (IsDB), the IDB, and the AsDB was 124, of which fifty-two were infra-structure projects. The value of the guarantees was U.S.$4.9 billion, with infra-structure projects accounting for U.S.$2.8 billion.10
Participation in equity is another way to leverage resources and enhance theimpact of regional institutions. In these operations, the MDBs risk a small amountof their own capital and buy shares in specific companies (equity investment) or infinancial institutions. For example, the International Finance Corporation (IFC)generally subscribes to between 5 percent and 20 percent of a project’s equity, butnever more than 35 percent, and it is never the single largest shareholder in a proj-ect. The AsDB will only risk 25 percent of a project’s cost or U.S.$50 million foreach project, whichever is less (equivalent to less than 0.22 percent of AsDB paid-in capital and reserves in 2003); the EBRD only the lesser of 35 percent of thelong-term capital of the obligor or 5 percent of EBRD paid-in capital and reserves(equivalent to about U.S.$225 million for each project); and the IDB only thelesser of 25 percent of project cost (or 40 percent for small countries) or U.S.$75 mil-lion (equivalent to 0.38 percent of IDB paid-in capital and reserves in 2003).When it comes time to withdraw from the project, these institutions divest theirholdings by selling shares in the capital markets through a public offering.
9. These activities mainly involve RDBs, though it is worth noting that the Andean Develop-ment Corporation is one of the most active subregional users of guarantees.
10. Raymond (2004).
10101-03_Ch03_Redo.qxd 10/5/06 3:06 PM Page 81

82 francisco sagasti and fernando prada
Portfolios and Specializations of the Regional Development Banks11
The sectoral composition of the MDBs’ portfolio and its evolution over time is agood indicator of the degree of institutional specialization. As the MDBs havegrown and matured, they have become involved in more complex developmentsectors and projects in which the participation of the private sector or other finan-cial institutions is less probable. The MDBs have better mechanisms for managingrisks, and they have accumulated experience in these relatively more difficult anduncertain operations. This evolution has coincided with a progressively higherinvolvement of the largest banks in the “soft” areas of development—education,health, institutional reform, technical cooperation, microfinance, and others—and with a reduction in the size of their investments in infrastructure and produc-tive sector projects, which are less complex in terms of financial arrangements,risk, and estimation of returns.12
Figure 3-1 shows the evolution of the regional development banks in thisregard. The RDBs have expanded their operations in all sectors over the pastthree decades—with the sole exception of the IDB Fund for Special Operations.The sector involvement of the RDBs has followed two main patterns. First,increasing importance has been accorded to the social sectors, mainly related topublic financial support for social development and governance reforms duringthe 1990s and early 2000s. Second, there has been a progressive reduction oftheir involvement in the productive sectors and a corresponding increase infinancing for other types of activities, including financing for the private sector,regional public goods, debt relief, support to nongovernmental organizations
11. The data in this section come from the OECD Creditor Reporting System, which hascomplete information from 1971 to 2002. Data for “the 2000s” therefore refer to the period from2000 to 2002.
12. For example, the IBRD went from devoting 95 percent of its portfolio to infrastructureduring the 1950s and 1960s to devoting 42 percent to the infrastructure and productive sectorsand 10 percent to the social sectors during the 1970s. During the 1980s, social sector allocationsrose to 18 percent, while the infrastructure and the productive sector remained at 35 percent,and structural adjustment (support for public finances and balance of payments) grew rapidly to9 percent of the total portfolio. During the 1990s and in the period 2000–02, support for theproductive sectors fell to only 5 percent, while funding for infrastructure, social sectors, and sec-tor adjustment reached 35 percent, 30 percent, and 20 percent, respectively. The IDA, too, hasmoved from strong support for the productive sector (more than 45 percent) and infrastructure(25 percent) during the 1970s and 1980s to greater involvement in the social sectors during the1990s and since the start of the new millennium (40 percent), allocating less than 10 percent tothe productive sector, 20 percent to infrastructure, and 10 percent to structural adjustmentoperations.
10101-03_Ch03_Redo.qxd 10/5/06 3:06 PM Page 82

20406080Perc
entb
Oth
er0.
010.
100.
300.
350.
010.
080.
150.
270.
040.
120.
340.
390.
040.
100.
190.
160.
070.
241.
290.
650.
050.
110.
140.
06
Prod
ucti
on0.
050.
400.
360.
180.
030.
250.
120.
150.
240.
640.
480.
310.
180.
560.
280.
140.
301.
210.
680.
690.
190.
170.
040.
05
Infr
astr
uctu
re0.
070.
410.
360.
450.
040.
200.
120.
190.
210.
912.
121.
660.
060.
320.
330.
390.
501.
201.
361.
270.
140.
160.
080.
07
Soci
al0.
060.
120.
210.
100.
030.
200.
190.
350.
070.
280.
600.
690.
040.
120.
290.
410.
250.
361.
913.
410.
160.
240.
170.
22
Tota
l0.
191.
041.
231.
080.
110.
750.
580.
970.
561.
953.
543.
060.
311.
101.
091.
111.
133.
005.
246.
020.
540.
680.
430.
39
1970
s19
80s
1990
s20
00s
1970
s19
80s
1990
s20
00s
1970
s19
80s
1990
s20
00s
1970
s19
80s
1990
s20
00s
1970
s19
80s
1990
s20
00s
1970
s19
80s
1990
s20
00s
AfD
BA
fDF
A
sDB
AsD
FIA
DB
IDB
/FSO
Sour
ce: P
repa
red
by th
e au
thor
s us
ing
data
from
the
OE
CD
Cre
dito
r R
epor
ting
Sys
tem
.a.
The
def
init
ion
of s
ecto
rs is
take
n fr
om O
EC
D d
ata
(Cre
dito
r R
epor
ting
Sys
tem
) fo
r th
e pe
riod
197
1 to
200
2: P
rodu
ctio
n m
eans
loan
s an
d pr
ojec
ts fo
r ag
ricu
lture
, for
estr
y, fi
shin
g, in
dust
ry, m
inin
g, tr
ade
and
tour
ism
; Inf
rastr
uctu
re r
efer
s to
tran
spor
t and
sto
rage
, com
mun
icat
ions
, ene
rgy,
ban
king
and
fina
ncia
l se
rvic
es, a
nd b
usin
ess
and
othe
r se
rvic
es; S
ocia
l ref
ers
to e
duca
tion
, hea
lth, p
opul
atio
n pr
ogra
ms,
wat
er s
uppl
y an
d sa
nita
tion
, gov
ernm
ent a
nd c
ivil
soci
ety,
ho
usin
g, a
nd s
ocia
l ser
vice
s; O
ther
cov
ers
mul
tise
ctor
al p
roje
cts,
str
uctu
ral a
djus
tmen
t, ac
tion
rel
ated
to d
ebt,
nonf
ood
emer
genc
y an
d di
stre
ss r
elie
f, su
ppor
t to
NG
Os,
and
all
unal
loca
ted
or u
nspe
cifie
d pr
ojec
ts o
r lo
ans.
The
latt
er c
ateg
ory
has
been
agg
rega
ted
for
sim
plic
ity.
b. A
nnua
l ave
rage
by
deca
des,
in b
illio
ns o
f 200
2 U
.S. d
olla
rs a
nd p
erce
ntag
es.
Figu
re 3
-1.
Evol
utio
n of
the
Sect
oral
Dist
ribu
tion
of R
DB
Por
tfolio
sa
10101-03_Ch03_Redo.qxd 10/5/06 3:06 PM Page 83

84 francisco sagasti and fernando prada
(NGOs), and the development of capital markets. However, each bank has hada different pattern of expansion, for both the regular and concessional windows.
The share of social sector operations has expanded rapidly in most RDBs,with the sole exception of the African Development Bank.13 Investment in socialsector projects in areas such as health, education, and housing; social invest-ment; and protection and rehabilitation after natural disasters has accounted formost of the social sector portfolio expansion of RDBs. These activities accountedfor U.S.$1.1 billion per year on average during the 1970s and 1980s, but rose toU.S.$3.1 billion during the 1990s and 2000s. However, part of this growth isexplained by the involvement of RDBs in state reform, social policies, and eco-nomic reforms, which also include large programs of public sector adjust-ment, budget support, and pension reforms.14 These activities accounted forU.S.$1.5 billion per year on average during the 1990s and in the early years ofthe 2000s. In contrast, investment in this field was almost nil during the 1970sand the 1980s.15
RDB support for the productive sector as a percentage of the total RDBportfolio diminished during the 1990s and early 2000s from its 1970–80 levels.This took place as the public sector in many developing countries progressivelyreduced its direct participation in these activities through state-owned enter-prises. Figure 3-1 shows that the sharpest reductions occurred at the AsDB(from 35 percent of the total portfolio on average during the 1970s and 1980s to8 percent in the following decades) and at the IDB (from 32 percent to 9 percentin the same period).
However, this reduction of support for the productive sector through state-owned financial intermediaries has been compensated for to a certain extent bythe introduction of new financial instruments that directly support private sec-tor investments. These include operations with private banks and the develop-ment of domestic capital markets, which fall under the category of “financialinfrastructure,” according to the OECD classification scheme. This categorycomprises support for financial restructuring, financial intermediation, apex
13. This is explained mainly by the reduction of AfDB support for major water supply projectsin Algeria, the Democratic Republic of the Congo, Morocco, and Nigeria, which started during the1980s and mid-1990s with the construction of dams, canals, and water facilities. The projects inthese four countries represented 52 percent of total investment in the social sectors (U.S.$1.3 bil-lion) during this period.
14. According to OECD statistics, most of the financial support for institutional reform is clas-sified as social sector investment; “government and civil society,” one of the highest-growth areasduring the 1990s and early 2000s, is included here.
15. The AfDF added U.S.$0.86 billion for these types of programs during the period1990–2002, the AsDB and the AsDF U.S.$3.1 billion each, and the IDB group U.S.$12.1 billion.
10101-03_Ch03_Redo.qxd 10/5/06 3:06 PM Page 84

regional development banks 85
funds for the formal and informal sectors, and capacity building for the man-agement of new financial instruments, among other activities.16
Financial infrastructure operations have rapidly become a major component ofRDB portfolios and are especially important at the AsDB (U.S.$7.2 billion, or13.1 percent of the total portfolio during the period 1990–2002). However, theseactivities have been highly concentrated; for example, the U.S.$3.6 billion com-mitted to the financial sector program in 1997 was largely directed to the Repub-lic of Korea in the wake of the Asian crisis. In the case of the AfDB, financialmarket support represented 4.4 percent of the total portfolio during the period1990–2002 (U.S.$1.4 billion), while at the IDB this figure was 3.3 percent(U.S.$2.3 billion). The AfDB concentrated its operations in Egypt, Morocco,South Africa, and Tunisia (U.S.$1.1 billion), while the IDB focused on Argentinaand Mexico (U.S.$1.6 billion).
Along with financial sector and capital market support, the RDBs entered intonew development financing fields during the 1990s. One of the most importanthas been the provision of regional public goods, especially those related to regionaltransport, energy and communication infrastructure, and environmental pro-grams. Using a methodology devised by Te Velde, Morrissey, and Hewitt, andemploying OECD data, Ferroni has estimated that RDB commitments to inter-national public goods (IPGs) amounted to at least one-third of total multilateralIPG funding during the 1990s in all regions.17 This would mean that the IDBinvested almost U.S.$2.2 billion, or 3.9 percent of its total portfolio, during the1990s; the AsDB about U.S.$3.8 billion, or 8.2 percent; and the AfDB groupnearly U.S.$1.6 billion, or 8.8 percent of its loans in this period. Initiatives such asthe New Partnership for Africa’s Development (NEPAD), the Initiative for theIntegration of Regional Infrastructure in South America, and the Plan Puebla-Panama will certainly increase this proportion, and this will probably be a field forRDB expansion in the future.
Regular and Concessional Windows: Graduation Policies
Because of the nature of the eligibility criteria applied by development banks,over time there has been a high level of correlation between the use of regular or
16. For example, the IsDB played a key role in supporting the banking industry and in devel-oping capital markets in the Islamic countries during the 1990s. This was accomplished throughentities such as the Accounting and Auditing Organization for Islamic Financial Institutions(AAOIFI), the International Islamic Rating Agency (IIRA), the Islamic Financial Services Board(IFSB), the International Islamic Financial Market (IIFM), the Liquidity Management Center(LMC), and the General Council of Islamic Banks and Financial Institutions (GCIBFI).
17. See Ferroni (2002); for the methodology, see Te Velde, Morrissey, and Hewitt (2002).
10101-03_Ch03_Redo.qxd 10/5/06 3:06 PM Page 85

86 francisco sagasti and fernando prada
concessional loans and the per capita income levels of RDB borrowers. As a coun-try increases its income level, it eventually “graduates” from concessional to regu-lar loans. Table 3-5 presents the annual average disbursed to countries accordingtheir income category.18 It can be seen that the AfDB disbursed U.S.$105.5 mil-lion on average to each middle-income country borrower during the early 2000s,but only U.S.$29.9 million to low-income ones, while the African DevelopmentFund (AfDF) disbursed U.S.$30.3 million to low-income countries and had nooperations in middle-income countries. The IDB and its (concessional) Fund forSpecial Operations followed the same pattern. In the case of the AsDB group,both the regular and soft loan windows disbursed more resources to low-incomecountries. This pattern can be explained by the presence of large low-income bor-
Table 3-5. RDB Resource Allocation by Income Level a
Annual average per country in each income category, in millions of U.S. dollars
Donor Income groupb 1970s 1980s 1990s 2000s
AfDB Low 4.8 16.5 18.9 29.9Middle 2.5 50.2 75.4 105.5
AfDF Low 3.5 17.8 14.5 30.3Middle 3.0 5.7 3.4 0
AsDB Low 25.8 181.1 564.3 447.9Middle 24.8 136.9 89.7 46.0
AsDF Low 28.9 76.8 48.0 69.3Middle 10.5 29.9 22.3 27.5
IDB Low 19.8 13.1 30.1 40.5Middle 53.0 138.6 242.6 296.8
IDB Special Fund (FSO) Low 29.7 14.7 48.6 130.6Middle 24.5 31.3 21.5 65.4
a. The amount indicated is the annual average received by countries in each income category. Being anaverage, the figure therefore also reflects the number of countries that received resources from each window.
b. The OECD income classification may differ from the classification criteria applied by each institution.The categories correspond to the OECD classification, where “Low” comprises LDCs (least-developedcountries) and OLICs (other low-income countries); and “Medium” comprises LMICs (lower-middle-income countries) and UMICs (upper-middle-income countries).
18. The number of borrowing members has been variable owing to an increase in membercountries and to their “graduation” or prioritization. For example, the AfDB lent to forty-fivecountries during the 1970s and 1980s, but to only thirteen countries during the 1990s and early2000s, and the IDB Fund for Special Operations reduced the scale of its operations from twenty-one countries in the 1970s to only eight countries during the 1990s. The AsDB introduced newgraduation policies during the 1990s.
10101-03_Ch03_Redo.qxd 10/5/06 3:06 PM Page 86

regional development banks 87
rowers such as China, India, Indonesia, Pakistan, and Vietnam, which receiveloans from both the regular and the concessional windows.
These findings are consistent with the graduation policies established by eachinstitution. The AfDB group has a three-tier classification system to determineeligibility for each window, which is compatible with the World Bank’s classifi-cation system (based on income category and debt sustainability). Under thesecriteria, thirteen African countries were eligible to borrow only from the regular(AfDB) window at the end of 2002, two members were eligible to borrow fromboth the regular and the concessional (AfDF) windows, and thirty-eight mem-bers were eligible to borrow only from the AfDF.
The AsDB changed its graduation policies in 1997 and now applies a two-stage process, classifying the countries first by income category and then assess-ing their debt repayment capacity. This is done using indicators such as debtsustainability, private capital inflows, gross domestic saving rate, country size,categorization as an HIPC, volatility of export growth, main external financingsources, access to IDA credits, and whether sovereign borrowing by the countryis rated by Moody’s and Standard & Poor’s.19
The IDB has a four-tier country classification system (A, B, C, or D) to deter-mine the eligibility of its members for assistance from its three windows: the Fundfor Special Operations (FSO), which provides concessional loans; the IntermediateFinancing Facility (IFF), whose lending terms are between those of the regular andconcessional windows; and ordinary capital (OC), which provides regular loans.20
The poorest borrowing countries (Group D) are the only ones with access to softloans from the FSO, although they may also be eligible for loans from the ordi-nary capital or regular window. The IDB management decides whether to extendregular loans to FSO-eligible countries on a case-by-case basis, taking into accountcreditworthiness considerations. Countries in Groups C and D are eligible to
19. AsDB has a four-tier country classification: Group A receives concessional resources from theAsDF only; Group B1 from the AsDF, with limited amounts of ordinary capital resources (the regu-lar or AsDB window); Group B2 from the AsDB, with limited amounts of AsDF resources; andGroup C from the regular or ordinary capital resources of the AsDB. In 2003, cost-sharing limits forproject loans were 80 percent for Group A, 75 percent for Group B1, 70 percent for Group B2, and65 percent for Group C. Government contributions to technical assistance must be at least 15 percentof total costs for A countries, 20 percent for B1 and B2 countries, and 30 percent for C countries.
20. The four-tier category is based on the size of a nation’s economy. The IDB finances a per-centage of the total costs of a project according to the following classification: For group A countries(Argentina, Brazil, Mexico, and the Bolivarian Republic of Venezuela), the IDB finances only 60 percent of the project; for group B (Chile, Colombia, and Peru), 70 percent; for group C(Bahamas, Barbados, Costa Rica, Jamaica, Panama, Suriname, Trinidad and Tobago, and Uruguay),80 percent; and for group D (Belize, Bolivia, Dominican Republic, Ecuador, El Salvador, Guatemala,Guyana, Haiti, Honduras, Nicaragua, and Paraguay), 90 percent.
10101-03_Ch03_Redo.qxd 10/5/06 3:06 PM Page 87

88 francisco sagasti and fernando prada
borrow from the IFF, with priority given to countries that are not eligible forFSO resources. Groups A and B can borrow only from ordinary capital or regu-lar resources.21
The EBRD has different criteria for graduation and eligibility, since it doesnot have a concessional window. This policy derives from the EBRD’s chartermandate of advancing transition toward market-oriented economies. The EBRDconcept of graduation rests on three principles: (1) transition impact, defined asthe effect of a project on the economy or society; (2) additionality, defined as theeffect of the EBRD’s catalyzing additional resources; and (3) sound banking—that is, assurance that the bank’s investment is secure. These principles are usedto define a phased graduation approach across market segments within a country.As a country advances, it will have fewer and fewer segments in which the princi-ples of transition and additionality are met. Eventually, the country will graduatefrom EBRD operations entirely and secure access to international capital marketsand other private sources of financing.
There are important differences between the RDBs in terms of sector alloca-tions and income categories (see table 3-6). For example, while the regular win-dow of the AfDB allocated 36 percent of its total portfolio to infrastructure inmiddle-income countries during the period 2000–02, the soft loan window allo-cated a similar amount to the social sectors in low-income countries. At the IDB,both the regular and soft loan windows allocated almost 57 percent of their totalportfolios to the social sectors. The AsDB seems to be the most pro-poor of theregional development banks: on average, 87 percent of its total operations,including both regular and concessional windows, are oriented toward low-income countries (primarily China, India, Indonesia, Pakistan, and Vietnam).The AsDB allocates 52 percent of its total portfolio to infrastructure projects inlow-income economies, while the AsDF utilizes 55 percent of its total portfoliofor social sector and infrastructure projects in low-income countries.
Financial Standing of the Regional Development Banks
As indicated earlier, MDBs obtain funds for their regular loan windows from bor-rowings in the international capital markets and for their concessional loans fromcontributions by donors through periodic replenishments, which are comple-mented by resources from their net income. As a result of their preferred-creditor
21. In 1999 the IDB introduced a more rigorous method of determining eligibility. Thegrouping divides countries in Groups I and II, based on their GNP per capita in 1997. On thebasis of their lower per capita income, the bank aims to channel 35 percent of its lending volumeto Group II countries and the rest to Group I countries.
10101-03_Ch03_Redo.qxd 10/5/06 3:06 PM Page 88

Tab
le 3
-6.
Cou
ntry
Cat
egor
ies a
nd S
ecto
ral A
lloca
tion
of P
ortfo
lio, 2
000–
02A
mou
nt a
nd p
erce
ntag
e of
tota
l por
tfol
io
Soci
alIn
fras
truc
ture
Prod
uctiv
eO
ther
Tot
al
Inco
me
U.S
.$
U.S
.$
U.S
.$
U.S
.$
U.S
.$
Don
orgr
oup
Perc
ent
billi
ons
Perc
ent
billi
ons
Perc
ent
billi
ons
Perc
ent
billi
ons
Perc
ent
billi
ons
AfD
BLo
w6.
41.
814
.022
.0M
iddl
e9.
335
.615
.018
.178
.00.
301.
360.
541.
043.
24A
fDF
Low
36.4
19.4
15.8
28.3
100.
01.
060.
570.
460.
822.
91A
sDB
Low
17.8
51.9
6.8
11.5
88.0
Mid
dle
4.9
2.6
3.4
1.1
12.0
2.08
4.99
0.93
1.16
9.17
AsD
FLo
w24
.329
.910
.013
.487
.6M
iddl
e2.
85.
72.
81.
112
.41.
231.
180.
420.
483.
36ID
BLo
w1.
31.
3M
iddl
e56
.619
.811
.510
.898
.710
.22
3.81
2.08
1.93
18.0
5ID
B F
SOLo
w40
.09.
97.
98.
866
.6M
iddl
e16
.67.
53.
65.
633
.40.
670.
210.
130.
171.
18
10101-03_Ch03_Redo.qxd 10/5/06 3:06 PM Page 89

90 francisco sagasti and fernando prada
status in relation to private lenders and their low gearing ratios in comparisonwith those of private financial institutions, the MDBs enjoy a high standing in theeyes of bond rating agencies, and this allows them to raise funds on favorableterms in international capital markets for their regular windows. Donor confi-dence in the effectiveness of MDB operations allows them periodically to raisenonreimbursable contributions from donor countries to continue operating theirconcessional loan windows, which constitute a large grant component.
Providing loans and a variety of financial and nonfinancial services to membercountries requires a combination of market trust, strong donor commitment,and a high degree of institutional credibility. The evolution of MDB flows todeveloping countries, the introduction of more complex financial instruments,and the participation of these institutions in new development activities has onlybeen possible because of their sound financial standing, and preserving the finan-cial integrity of MDBs is an essential condition for their continued existence.
Table 3-7 presents a number of indicators that make it possible to compare thefinancial and administrative situations of the regional banks and the World Bankfor 2002. Three issues are worth highlighting. First is the relationship betweenthe size of the banks and their net income, administrative costs, staff, and thecountries they serve. The AfDB is the smallest of the regional banks in terms ofthese indicators, even though it lends to fifty-three countries. In contrast, theIDB lends to twenty-six countries, but its total disbursements are about five timeshigher than those of the AfDB. The principal reason for this difference is thatthirty-eight African countries, which are among the poorest and most severelyindebted in the world, are eligible for concessional lending provided by the AfDF.
Second, in terms of average project size—calculated by dividing total commit-ments by the total number of projects approved—there is a significant divergencebetween the AfDB and the other banks. While the average project sizes for theAsDB, the World Bank, and the IDB are U.S.$79.94 million, U.S.$77.14 mil-lion, and U.S.$53 million, respectively, the AfDB average project size was onlyU.S.$23.5 million. This may be partly explained by the fact that the World Bank,the IDB, and the AsDB provide rather large loans to countries such as Argentina,Brazil, China, and India.
Third, there are different degrees of decentralization among the MDBs. TheAsDB is the most centralized of the banks, with only fifty-six members of itsstaff (15 percent) in country or regional offices. In contrast, the World Bank, aspart of its Strategic Compact, has undertaken a major expansion of field-basedactivities. As of June 2003, it had approximately 3,000 staff (34 percent of itstotal staff) working in over 100 country offices. The IDB had 543 (28 percent)in its country offices, out of a total staff of 1,912.
10101-03_Ch03_Redo.qxd 10/5/06 3:06 PM Page 90

regional development banks 91
A key aspect in the comparison of MDBs is the relationship between capital,equity, and level of disbursements, which is an important indicator of the finan-cial strength of multilateral development banks. Discussions about MDB capitaladequacy have emphasized the very conservative “one-to-one gearing ratio,”according to which the outstanding loans of MDBs cannot exceed their total capi-tal (which includes paid-in and callable capital, as well as reserves). They have alsofocused on the “risk-bearing capital ratio” (RBCR), which is considered a moreadequate measure of financial strength. All MDBs have a ratio lower than 4,about half the average for the private sector (table 3-8), which indicates that theMDBs are managed quite prudently from a financial point of view. Another
Table 3-7. MDBs: Financial and Administrative Indicators, 2002a
Billions of U.S. dollars unless otherwise indicated
World Bank Af DB IDB AsDB EBRD
Financial indicatorsAuthorized capital 189.57 29.24 100.95 47.29 22.49Callable 178.09 26.34 96.61 43.90 16.58Paid-in 11.48 2.90 4.34 3.25 5.91Total commitments 18.51 2.77 4.55 5.68 4.43
Commitments from concessional window 7.28 1.31 0.41 1.63 . . .
Total disbursements 18.94 1.42 5.84 4.20 2.73Disbursements from
concessional window 2.80 0.74 0.31 1.14 . . .Net income 5.34 0.31 0.71 0.98 0.54
Administrative indicatorsAdministrative expenditure 1.04 0.15 0.33 0.14 0.18Average size of projects 0.08 0.02 0.05 0.08 0.04
Total staff 8,800 1,259 1,912 2,220 907Number of regional/
country offices 100 6 28 25 27Number of staff in
regional offices 3,000 56 543 321 237Number of countries eligible
for borrowing 142 53 26 35 27Number of nonborrowing
member countries 39 24 20 28 33
Source: Data for the World Bank were obtained from the Annual Report 2003; for the rest of theMDBs, data were obtained from 2002 annual reports.
a. Exchange rates for 2002: 1 unit of account = U.S.$1.35952; 1 U.S.$ = 0.88 euro.
10101-03_Ch03_Redo.qxd 10/5/06 3:06 PM Page 91

92 francisco sagasti and fernando prada
Table 3-8. Risk-Bearing Capital Ratio (RBCR) of the MDBs a
Millions of U.S. dollars, except where noted
Loans Multilateral outstanding Retained RBCR RBCRdevelopment banks net of LLP Paid-in earnings 2003 2000
World Bank group 111,762 11,748 27,031 2.88 3.82
Regional development banksInter-American Development 50,471 4,340 9,622 3.61 4.10
Bank GroupAfrican Development 7,642 3,239 2,271 1.39 2.01
Bank GroupAsian Development Bank 25,398 3,657 9,025 2.00 2.38
GroupEuropean Bank for 8,356 5,197 564 1.45 0.92
Reconstruction and Developmentb
Subregional development banksEuropean Investment Bankb 247,600 7,500 13,641 11.74 10.97Central American Bank for 2,483 371 759 2.20 2.36
Economic IntegrationCaribbean Development Bank 512 155 257 1.24 1.09Andean Development 6,387 1,319 887 2.90 2.91
CorporationNordic Investment Bankb 10,552 404 1,235 6.44 n.aIslamic Development Bank 990 3,942 1,685 0.18 n.a
GroupEast African Development 103 37 10 2.20 n.a
BankArab Bank for Economic 560 1,500 131 0.34 n.a
Development in AfricaNorth American 14 405 16 0.03 0.02
Development Bank
Other MDB-like fundsNordic Development Fundb 387 573 42 0.63 n.aArab Fund for Economic and 5,402 2,188 4,884 0.76 0.68
Social DevelopmentFONPLATA 221 46 325 0.60 0.59
Source: Financial statements of the institutions.n.a. Not available.a. Ratio between loans outstanding net of loan loss provisions (LLP) and the sum of paid-in plus
retained earnings at the end of the fiscal year.b. In millions of euros.
10101-03_Ch03_Redo.qxd 10/5/06 3:06 PM Page 92

regional development banks 93
indicator used by rating agencies is the ratio of equity capital plus callable capitalfrom AAA or AA shareholders divided by total risk assets (defined as loans toborrowing countries with ratings below investment grade).22 As a consequence oftheir conservative financial practices, most MDBs, and particularly the WorldBank, have consistently obtained the highest rating for their bond issues.23
A rather low risk-bearing capital ratio could indicate in some cases that theinstitution has not fully used its capacity to lend. Subregional banks such as theNADB (North American Development Bank), which have recently initiatedtheir operations, have done so mainly with preinvestment grants and small pilotprojects. FONPLATA has increased its level of lending for transport infrastruc-ture during the 1990s, though its level of reserves could allow it to play a largerrole in the Initiative for the Integration of Regional Infrastructure in SouthAmerica (Iniciativa para la Integración de la Infraestructura Regional Surameri-cana, IIRSA) during the coming years. However, there are some banks operatingin the Arab region and with Islamic countries that have had large levels of reservesand paid-in capital for some time, but have not significantly increased their lend-ing levels. For example, the IsDB has levels of reserves and paid-in capital compa-rable to those of the AfDB, but its outstanding loans are only one-eighth of thoseof the latter. This could be a consequence of the limited absorptive capacity of itsborrowing members, but also suggests that the IsDB has the potential to signifi-cantly expand operations in the future, possibly introducing new financial mech-anisms or even initiating operations in other countries and regions. This couldalso be the situation of the EBRD, whose high level of paid-in capital allows it tohave a highly favorable risk-bearing capital ratio and, from a purely financial per-spective, would enable it to increase its lending operations significantly.24
22. This ratio should be maintained above 100 percent to be considered adequate. Currentpractice requires that reserves be increased when borrowing by a member might put the institutionat risk of moving into nonaccrual status, which would imply increasing the share of net incomeallocated to reserves.
23. In contrast, the AfDB experienced severe financial difficulties and undertook a major reor-ganization during the second half of the 1990s. Total loan and grant approvals came to a peak in1991, at U.S.$3.45 billion, and after that, the fund ran dry. In August 1995, Standard & Poor’slowered the bank’s credit rating from AAA to AA+, because of the “increasing politicization” of thebank’s corporate governance and management. The downgrade made it more expensive for thebank to borrow money on international markets. After a long period of institutional reforms, dur-ing which it was pledged U.S.$2.6 billion in a seventh replenishment and U.S.$3.4 billion in aneighth replenishment, the AfDB’s credit rating was upgraded by S&P to AAA on July 25, 2003.
24. The EBRD’s president, Jean Lemierre, indicated in its 2003 Annual Report that the bankis in a transition period. During the next few years, the EBRD will take more risks and will enterinto new areas, such as helping to reduce intraregional disparities in borrowing countries, provid-ing more support to small and medium-sized enterprises and making more aggressive use of riskmitigation instruments.
10101-03_Ch03_Redo.qxd 10/5/06 3:06 PM Page 93

94 francisco sagasti and fernando prada
Other MDBs operate more like private sector institutions and are backed up bystrong donors. This is the case of the EIB, which has allocated 85 percent of itsportfolio to the private sector and directs a large proportion of its loans to devel-oped countries. As a result of this special situation, it has the highest risk-bearingcapital ratio of all the MDBs. Similarly, the NIB lends a significant part of its port-folio to private companies from Nordic countries (nearly 80 percent) to promoteforeign direct investment, not only in developing countries, but also in Europe.
Loan Conditions and Costs
The World Bank regularly compares the average costs of RDB operations, usingtheir spreads over LIBOR-based (London interbank offered rate) sovereignloans (see table 3-9). In general, the AsDB offers the most favorable terms fordeveloping countries (around 35 basis points), which is consistent with the factthat it has the lowest institutional administrative costs and the highest averageproject size (see table 3-7). Nevertheless, all MDBs have rather low spreads,with the exception of the EBRD, which charges the highest rate and does notgrant waivers or interest rate reductions as the other MDBs do. Although theAfDB has the least favorable financial indicators among the RDBs, its spread(56 basis points) is on the low side.
RDB concessional loans are provided on quite favorable terms. IDB/FSOloans have a twenty-five- to forty-year maturity and a five- to ten-year graceperiod, with an average annual rate of interest below 2 percent. AsDF loanshave a thirty-two-year maturity (or twenty-four-year maturity in the case of fast-disbursing program loans) and an eight-year grace period, with 1 percent inter-est charge during the grace period and 1.5 percent during the amortizationperiod. The AfDF lends at a zero interest rate, with a service charge of 0.75 per-cent per annum, a commitment fee of 0.50 percent, and a fifty-year repaymentperiod, including a ten-year grace period.
The relatively better conditions granted by the AfDB are explained by chang-ing conditions in the replenishment processes of the last decade, which havetaken place on a three-year basis. Partly encouraged by the better financialresults of the AfDB Group, donor countries are pledging more resources to thepoorest countries in Africa through the bank’s soft loan window. The last threereplenishments—AfDF VII (1996–99), AfDF VIII (1999–2002), and AfDF IX(2002–05)—have spanned the crisis years of the bank and also its years of majorreform and renewal. However, this reform did not quickly translate intolarger replenishments of the AfDF. In fact, the fund experienced a dramaticdecline of over 45 percent during the period 1996–98 and has not yet ret-urned to the level achieved in 1991–93. The real value (in 2002 U.S. dollars)
10101-03_Ch03_Redo.qxd 10/5/06 3:06 PM Page 94

Table 3-9. Comparative Sovereign MDB Loan ChargesLIBOR-based U.S. dollar loans as of June 30, 2004 (basis points)a
IBRD
VSLsb FSLsc IDB Af DB AsDB EBRD
Interest spreadContractual spread 75 75 30d 50 60d 100Risk premium . . . 5 50e . . . . . . . . .Benefit of sub-LIBORf funding cost −31 −30 −34 −15 −35 . . .Waivers −25 −25 . . . . . . −20g . . .Net spread over LIBOR (I) 19 25 46 35 5 100
ChargesCommitment charge 75 85h 25 75 75i 50Waiver −50 −50 . . . −50 . . . . . .Net commitment fee 25 35 25 25 75 50Spread equivalent of 17 22 17 17 30 34
commitment feej (II)
Front-end feeContractual front-end fee 100 100 0 0k 100 100Waiver . . . . . . . . . . . . −100 . . .Net front-end fee 100 100 0 0 0 100Spread equivalent of 20 20 0 0 0 20
front-end feej (III)
Total spread equivalent 56 67 63 52 35 154over LIBOR (I + II + III)
Source: World Bank.. . . Negligible.a. Numbers may not add to totals because of rounding.b. Variable spread loan.c. Fixed spread loan.d. This is a variable spread.e. Represents premium for interest rate cap.f. The IBRD average cost margin (sub-LIBOR spread) shown is for VSL rate settings from January 15,
2004, through July 14, 2004. Sub-LIBOR spreads for IDB and AfDB shown are the current sub-LIBORspreads for the U.S. dollar. The sub-LIBOR spread for ADB represents rebate for the first six months of 2004.
g. ADB will waive 20 basic points on its public sector loans outstanding from July 1, 2004 throughJune 30, 2005.
h. For the first four years, an additional commitment charge risk premium of 10 basis points ischarged on the undisbursed amount over and above the contractual commitment charge.
i. The commitment charge is applicable to the following proportion of the loan amount, less thecumulative disbursements: 15 percent in the first year, 45 percent in the second year, 85 percent in thethird year, and 100 percent in the fourth year and beyond.
j. Spread equivalent computations for commitment charge and front-end fee use an evenly distributed dis-bursement profile of eight years. Repayment terms used are as follows: final maturity: seventeen years; graceperiod: five years; level repayment of principal. Disbursement profiles and payment terms vary across MDBsand hence spread equivalent charges would vary based on the disbursement profile and payment terms used.
k. In February 2001, the AfDB Board passed a resolution authorizing the bank’s management toimpose a front-end fee of up to 50 basis points if the financial condition of the bank warrants it.
regional development banks 95
10101-03_Ch03_Redo.qxd 10/5/06 3:06 PM Page 95

96 francisco sagasti and fernando prada
of AfDF VI (1991–93) is estimated at U.S.$1.95 billion and that of AfDF IXat U.S.$1.91 billion. The AsDF IX replenishment will cover the period 2005to 2008; the twenty-eight members of the AsDB have pledged their contribu-tions and reached agreement on a U.S.$7 billion replenishment.
Following guidelines established in 1995 at the time of the negotiations forthe eighth general capital increase of the IDB, the last replenishment of its con-cessional window, the Fund for Special Operations, was agreed in December1998. Board members managed to strike an elaborate set of compromises thatwere closely related to the negotiations on how to fund IDB participation in theHIPC Initiative. These agreements stipulated, among other things, that nonbor-rowing countries would make additional contributions to cover the cost of IDBparticipation and to fund the U.S.$136 million for the FSO agreed at the time ofthe eighth general capital increase. It was also agreed that resources from thebank’s net income would not be used to pay for its participation in HIPC andthat any shortfall in nonborrowing country contributions to the FSO would becovered by periodic transfers from IDB net income up to the end of 2004. Thereare no plans for future replenishments of the FSO, since only five countries qual-ify for operations from this window.
The Political Economy of Multilateral Development Banks
In general, RDBs and SRDBs are very heterogeneous, not only in the countriesand regions they serve, but in allocations and financial instruments, size andfinancial strength, specialization, selectivity, costs charged to their borrowers, andstrategies for leveraging resources, among other characteristics. The complexityand heterogeneity of these institutions is related to the interaction between theirstakeholders and constituencies and their relative power—what may be called the“political economy” of the RDBs. The arena where, in the final analysis, keypolitical economy issues are settled is the management of net income, in whichthe banks determine how their net income (what would be called profits in pri-vate financial institutions) will be allocated among competing uses: bolsteringreserves, providing grants, and reducing the cost of borrowing, according to theoutcomes of the interaction processes between their diverse stakeholders andconstituencies, especially their sovereign shareholders.
Changing Constituencies and Multiplicity of MDB Stakeholders
At any given time, MDBs are subject to a multiplicity of competing pressuresthat shape their behavior and performance. These institutions are a naturalpoint of convergence for demands from many different actors whose preferences
10101-03_Ch03_Redo.qxd 10/5/06 3:06 PM Page 96

regional development banks 97
and interactions help define the characteristics, orientation, and personality ofeach MDB. Moreover, these actors and their power relations change over time assome old ones fade out and new ones emerge and as their agendas and demandsshift and evolve.
MDBs are owned by their government shareholders and have to respond totheir political agendas and expressed preferences. Shareholder perceptions areinfluenced by a variety of domestic constituencies, particularly in the developedmember countries, where many groups have the capacity to exert pressure ontheir government representatives to the MDB boards and, in some cases, directlyinfluence senior management at these institutions. In regional and subregionalMDBs, relations between shareholders and their constituencies are less complexthan in the World Bank, which must contend with the greater heterogeneity ofthe international community at the global level. Regional and subregional orga-nizations should be able, at least in principle, to do a better job of accommo-dating the interests of smaller countries, give them more participation indecisionmaking, and allow them to enjoy a greater sense of ownership.
Other development financing institutions, including the World Bank, otherMDBs, and bilateral agencies, heavily influence the operations of RDBs. Thistakes place in the field and in specific sectors, where these institutions oftenhave different approaches to development issues and where pressures to improvedevelopment effectiveness and coordination are increasing. Joint projects, co-financing, technical cooperation between MDBs, and cross financing are otherexpressions of the complex relations between these institutions.25
Financial market investors seek an appropriate balance between risk andreturn. Those that purchase MDB bonds accept relatively lower returns becauseof the very low risk of default on these bonds. The financial strength of MDBs,their preferred-creditor status, and the support of nonborrowing shareholdersallow them to enjoy a most favorable treatment from bond rating agencies. Theycompete with private corporations, sovereign borrowers, and other financialinstitutions to attract capital, but in general have a privileged position as bondissuers in international capital markets. At the same time, joint operations withprivate firms and corporations are a growing segment of many MDB portfolios,which allows them to cofinance projects and to leverage and channel additionalresources to their member countries. These complex competition-collaborationinteractions impose new demands on the MDBs and require efforts to harmo-nize the diverse interests of capital market investors and other stakeholders.
25. For example, the IDB often has provided funds to subregional institutions. CABEI, ADC,and FONPLATA are among the institutions eligible for IDB loans.
10101-03_Ch03_Redo.qxd 10/5/06 3:06 PM Page 97

98 francisco sagasti and fernando prada
Other constituencies whose influence over the MDBs has been growinginclude academic institutions, which continuously generate new approaches todevelopment issues and have placed many issues on the agenda of the MDBs,including the provision of global public goods, gender considerations, environ-mental concerns, and human rights, among others; socially and environmentallyconcerned private sector firms, many of which are interested in forging partner-ships with MDBs; and private foundations, trade associations, and professionalbodies that focus on issues such as social capital formation, environmental stew-ardship, community development, and corporate social responsibility.
In a growing number of situations, MDBs are being challenged to accommo-date an increasingly wide variety of diverging and often conflicting interests,particularly those of NGOs and other advocacy groups. MDBs have openednumerous avenues of consultation with these organizations and have attemptedto respond to their views and concerns. However, several single-issue NGOsremain implacably confrontational, escalating demands at the slightest signalthat their initial concerns may be addressed. The absence of clear rules and pro-cedures to ensure the public accountability of NGOs makes it especially difficultto find common ground between such groups and other MDB stakeholders.Nevertheless, a number of MDB-NGO committees set up during the 1990shave collaborated to address some of the shortcomings of the banks’ operations,particularly in areas that have an impact on human rights and environmentalissues. The challenge for the senior management and executive boards of theseinstitutions, which are also important MDB constituencies, is to distinguishlegitimate concerns amidst a cacophony of discordant voices and vociferousdemands.
However, in spite of this growing diversification of constituencies, the “own-ers” and most powerful constituencies of the MDBs are their shareholders. Theyultimately decide what MDBs do, define the maneuvering room for their man-agement, and determine how they will evolve. Table 3-10 lists the main share-holders in twelve of these institutions, differentiating between borrowing andnonborrowing members. In general, borrowing members in subregional devel-opment banks have greater voting power than those in regional developmentbanks. The relatively better position of borrowing countries in the AfDB can beexplained by the fact that nonregional members were not admitted until 1982,which means that the bank was entirely owned by its developing country mem-bers during its first eighteen years. The United States is the largest shareholderin all of the MDBs in which it participates, with the exception of the AfricanDevelopment Bank, where Nigeria has a larger share. For example, the United
10101-03_Ch03_Redo.qxd 10/5/06 3:06 PM Page 98

regional development banks 99
Table 3-10. Voting Power in Selected MDBs, 2003 or Last Year for Which InformationIs Availablea
Percent
Voting power Main shareholders
Nonborrowers Borrowers Nonborrowers Borrowers
RDBsIDB group
AfDB
AsDB
EBRD
SRDBsEIB
CABEI (2001)
CDB (2001)
ADC
IsDB
49.98
39.99
57.14
87.95
37.10
39.98
50.02
60.00
42.86
12.05
100.00
62.90
60.02
100.00
100.00
USA (30), Canada (4)
USA (6.6), Japan (5.4),Germany (4.0)
Japan (12.9), USA (12.9),Australia (4.51)
USA (10.15),France, Italy,Germany, UK,Japan (8.64)
Taiwan Province of China (8.3),Mexico (6.8)
Canada, UK(9.05 each),Germany,TaiwanProvince ofChina, Italy (5.47 each)
Brazil, Argentina (10.8 each),Mexico (5.8)
Nigeria (9.0), Egypt (5.1), Libya (3.7)
China (5.53), India (5.44),Indonesia (4.72), Republic ofKorea (4.39)
Russia (4.06)
Germany, France, Italy, UK (16.28 each)
Costa Rica, El Salvador,Honduras, Guatemala, Nicaragua (10.20 each)
Jamaica, Trinidad and Tobago (17.45 each)
Peru, Colombia, BolivarianRepublic of Venezuela (26 each)
Kuwait (6.86), United ArabEmirates (7.76), Turkey (8.65), Egypt (9.48),Iran (9.59), Libya (10.96),Saudi Arabia (27.33)
(continued)
Multilateraldevelopmentbanks
10101-03_Ch03_Redo.qxd 10/5/06 3:06 PM Page 99

100 francisco sagasti and fernando prada
States has a dominant position in the IDB, where it holds 31 percent of theshares, but in fact has much greater decisionmaking power than this percentagesuggests.26
Net Income Management
The growing and conflicting pressures faced by MDBs find clear expression inthe management of their net income. Achieving an appropriate balance amongthe three main functions of MDBs involves difficult decisions on the size and theallocation of net income. First, there is the need to use net income to increasereserves and strengthen their financial position and risk-bearing capacity. Sec-ond, a shift to more complex operations and engagements with stakeholdersrequires more and better-trained staff, as well as a larger presence in the field,both of which increase administrative expenses and reduce the margin left aftersubtracting these from operating income (less interest paid and related charges)in order to determine net income. Third, a portion of net income is used to
Table 3-10. (continued)Percent
Voting power Main shareholders
Nonborrowers Borrowers Nonborrowers Borrowers
ABEDA
NADB
Other MDB-like fundsFONPLATA
(1999)
Source: Financial statements of the various institutions compiled and elaborated by the authors.a. When information about voting power was not available, it was calculated as a percentage of the share sub-
scriptions of the main shareholders.
100.00
100.00
100.00
Saudi Arabia (20.8), Libya (14.23), Kuwait(13.13), Iraq (12.58), UnitedArab Emirates (10.94)
USA and Mexico (50 each)
Argentina, Brazil (33.3), Bolivia,Paraguay, Uruguay (11.1 each)
26. Strand (2003) argues that even though the United States has 31 percent of the shares andof voting power in the IDB, in effect it has 76 percent of the “effective voting power,” which is cal-culated using “power indices” that consider a variety of voting scenarios by possible voting coali-tions and other ways of influencing the final outcomes of voting processes. This would mean thatthe United States exerts de facto control over this institution.
Multilateraldevelopmentbanks
10101-03_Ch03_Redo.qxd 10/5/06 3:06 PM Page 100

regional development banks 101
fund the banks’ soft loan windows and for grants to cover the cost of providingpublic goods and to finance special operations (such as emergency relief), bothof which increase administrative expenditures. Finally, some MDBs use part oftheir net income to cover the costs of their participation in debt cancellationunder the HIPC Initiative.
The two main sources of income for MDBs are loan portfolios and the man-agement of liquid assets, although some MDBs have also generated small amountsof income from charges for nonlending services to their members and other clients(see table 3-11). Income from loans can be raised in only two ways. First, the vol-ume of lending may be increased, but this may lead to pressures to lend more thanwould be strictly appropriate. Second, loan charges may be increased, but this maymake the MDBs noncompetitive with capital markets for countries with access tothem—especially when transaction costs to borrowers (delays, conditionality) arefactored in. Without adequate safeguards, any of these options may lead to a dete-rioration of the loan portfolio, primarily because loans to less creditworthy bor-rowers may represent a higher proportion of loan assets and because countries thatwould be better credit risks may elect not to borrow from MDBs.
Investment income from the management of liquid assets can be raised byincreasing the resources at the disposal of the MDBs for short-term investment incapital markets, and by assuming higher market risks in the expectation of obtain-ing higher returns. However, this source of income is rather volatile and subjectto capital market swings, which makes it unreliable. It cannot be counted uponat times of international financial crisis, which is presumably when it would bemost needed. The option of increasing loan charges to augment operating and
Table 3-11. MDB Gross Income from Loans and from InvestmentsBillions of U.S. dollars
2002 2003
Institution Loans Investment Loans Investment
World Bank 6.89 0.73 5.72 0.41IDB (OC) 2.63 0.32 2.71 0.30IDB (FSO) 0.12 0.02 0.15 0.02AsDB 1.70 0.33 1.38 0.30AsDF 0.16 0.13 0.18 0.15AfDB 0.39 0.07 0.32 0.10AfDF 0.09 0.02 0.07 0.03
Source: Financial statements of the various institutions, compiled and elaborated by the authors.
10101-03_Ch03_Redo.qxd 10/5/06 3:06 PM Page 101

102 francisco sagasti and fernando prada
net income has been adopted by some MDBs.27 This is closely related to thequestion of “graduation” of borrowing countries and has problematic aspects, notleast of which is that there is a limit to such increases if the MDBs wish to remainrelevant to all their shareholders. For example, governments in high- and middle-income developing countries with access to private sources of finance may preferto borrow in capital markets, thus reducing the demand for MDB loans, whichin turn would have a negative impact on the quality of MDB portfolios.
Each MDB has taken a different approach to the management of net income(see table 3-12). These approaches are influenced by differences in power rela-tions and interests among major shareholders, which have pressed for differentallocations of net income to reserves, transfers to concessional lending windows,the provision of grants, and reductions in loan charges. The World Bank is fac-ing pressures to allocate more resources to the International Development Asso-ciation, its soft loan window, and to increase the proportion of grants providedthrough IDA to its poorest member countries. In addition, in 2004 it also allo-cated U.S.$80 million to the Trust Fund for Gaza and the West Bank andU.S.$25 million for the recently created Low-Income Countries Under Stress(LICUS) Implementation Trust Fund.28
The RDBs have used net income primarily to bolster reserves in order tostrengthen their financial position. The IDB and the EBRD use more than 90 percent of their net income for this purpose, although the former has also usednet income to cover the cost of its participation in the HIPC Initiative and tomake up for any shortfall in member country contributions to the FSO, its conces-sional window (U.S.$27.2 million in 2003). The AfDB and the AsDB have amore complex pattern of net income allocation. The former has used, on average,more than U.S.$70 million in the past three years (25 percent of net income) tofinance a variety of regional initiatives and to contribute to its soft loan window(the AfDF). The AsDB has allocated almost 30 percent of its net income to its softwindow (the AsDF) and to technical assistance programs for member countries.
27. In the case of the IDB, in the first half of 2003 it set its lending spread at 0.5 percent. Theinspection and supervision fee and credit commission were each set at 0.5 percent, reflecting partialwaivers of 0.5 percent and 0.25 percent, respectively. For the second half of 2003 the bank appliedthe new standard ordinary capital loan charges established by the new capital adequacy policy—that is, a lending spread of 0.3 percent, a credit commission of 0.25 percent, and no charge forinspection and supervision. For 2003 the Board of Directors of the AsDB approved a waiver of 50 percent of the front-end fee for loans approved in 2003 to public sector borrowers. The effect ofthis waiver was to reduce net income by U.S.$3 million.
28. The World Bank’s net income increased from U.S.$1.2 billion in 1998 to U.S.$3.4 billionin 2003 owing to increases in investment income, and fell to U.S.$1.2 in 2004 because of a reduc-tion in loan income and because of loss provisions.
10101-03_Ch03_Redo.qxd 10/5/06 3:06 PM Page 102

regional development banks 103
The SRDBs have also emphasized the use of net income to strengthen theirfinancial position. The charters of some organizations, for example CABEI andFONPLATA, specify that net income must be allocated only to the generalreserve. Others, such as the IsDB and ADC, must allocate part or all of their netincome to the general reserve until the amount in that reserve reaches a certainthreshold expressed as a percentage of subscribed capital—25 percent in the caseof the IsDB and 50 percent in the case of the ADC.
Concluding Remarks
This chapter describes the main characteristics of the family of multilateraldevelopment banks, focusing on the regional development banks and, to a lesserextent, on the subregional development banks. It shows that these institutionsplay a key role in development finance and that they fill a niche that has notbeen adequately covered by global institutions such as the World Bank and theInternational Monetary Fund, and certainly not by private sector financingentities. They provide a unique combination of financial resource mobilization,capacity building and institutional development, and provision of regional andsubregional public goods. No other international institution performs thesethree sets of functions as they do.
Because of the relative maturity of the World Bank’s portfolio, at the begin-ning of the twenty-first century RDBs and SRDBs are providing higher netfinancial flows to their borrowers, and subregional institutions are in a betterposition to do so than regional development banks. At the same time, a sort ofde facto division of labor has evolved among these institutions in the financialinstruments they use, the services they provide, the countries they serve, and thesectors and activities they focus on. Yet in spite of their heterogeneity, all MDBsshare a key concern: preserving their financial strength and high standing ininternational capital markets, where they place bonds to fund regular lendingoperations, and in the main donor countries that fund their soft loan windows.
The growing interactions between the various MDBs, and between these insti-tutions and other entities involved in development finance (bilateral agencies,international institutions, foreign investors, private banks, investment funds,foundations, and individuals sending remittances, among others), are creating insome regions (especially Latin America and, to a lesser extent, Africa and the Mid-dle East) multiple networks of financial institutions that are involved in increas-ingly complex operations to support the development efforts of membercountries. This has led to the emergence of a large variety of stakeholders and con-stituencies, a change that is making the governance of multilateral development
10101-03_Ch03_Redo.qxd 10/5/06 3:06 PM Page 103

Tab
le 3
-12.
Use
s of N
et I
ncom
e in
the
MD
Bs U
ses
(per
cent
of 2
003
net i
ncom
e)
Soft
loan
w
indo
w
MD
Bs
2002
2003
Res
erve
san
d gr
ants
Oth
erN
otes
Wor
ld B
ank
RD
Bs
IDB
FSO
AfD
B
AsD
B
EB
RD
2,77
8
728 81 308
979
108
5,34
4
2,43
3
114
160
458
378
36.9
98.1
...
74.9
48.3 9.5
10.1
*
1.1*
100.
0**
25.1
28.8
*
33.0
**
...
...
...
22.9
**
91.5
*ID
A (
U.S
.$30
0 m
illio
n) a
nd H
IPC
Tru
st F
und
(U.S
.$24
0 m
illio
n).
**C
ompl
ianc
e w
ith
Fina
ncia
l Acc
ount
ing
Stan
dard
133
(U
.S.$
854
mill
ion)
, Pen
sion
Res
erve
(U
.S.$
953
mill
ion)
.
*Allo
cati
on to
the
Fund
for
Spec
ial O
pera
tion
s to
cov
er u
npai
dco
ntri
buti
ons
(U.S
.$27
.2 m
illio
n).
**U
.S.$
75.2
mill
ion
to th
e In
term
edia
te F
inan
cing
Fac
ility
and
U.S
.$37
.5m
illio
n fo
r th
e H
IPC
Ini
tiat
ive.
The
per
cent
ages
rel
ate
to 2
002
net i
ncom
e. I
n 20
03 th
e B
oard
of
Gov
erno
rs a
ppro
ved
allo
cati
ons
of U
.S.$
77.3
mill
ion
out o
f 200
2 ne
tin
com
e, 1
5.8
perc
ent t
o th
e H
IPC
Ini
tiat
ive,
43.
8 pe
rcen
t to
the
AfD
F,17
.5 p
erce
nt to
the
Spec
ial R
elie
f Fun
d fo
r A
fric
an C
ount
ries
Aff
ecte
dby
Dro
ught
, and
22.
5 pe
rcen
t to
the
spec
ial f
und
for
post
conf
lict
assi
stan
ce to
the
Dem
ocra
tic
Rep
ublic
of C
ongo
.T
he p
erce
ntag
es r
elat
e to
200
2 ne
t inc
ome.
*U.S
.$20
0 m
illio
n to
the
AsD
F, a
nd U
.S.$
80 m
illio
n to
the
Tec
hnic
alA
ssis
tanc
e Sp
ecia
l Fun
d (T
ASF
).**
U.S
.$22
4.8
mill
ion
to th
e cu
mul
ativ
e re
valu
atio
n ad
just
men
ts a
ccou
nt.
The
am
ount
is in
eur
os. 8
30.2
mill
ion
was
tran
sfer
red
to th
e ge
nera
lre
serv
e an
d th
e re
mai
ning
836
0 w
as p
oste
d as
ret
aine
d ea
rnin
gs.
Net
inco
me
(mill
ions
of
U.S
. dol
lars
)
10101-03_Ch03_Redo.qxd 10/5/06 3:06 PM Page 104

SRD
Bs
CA
BE
I
CD
B
AD
C
IsD
B
Oth
er M
DB
-like
fund
sA
FESD
FON
PLA
TA
Sour
ce: F
inan
cial
sta
tem
ents
of t
he v
ario
us in
stit
utio
ns, c
ompi
led
and
elab
orat
ed b
y th
e au
thor
s.n.
a. N
ot a
vaila
ble.
... N
eglig
ible
.
Acc
ordi
ng to
its
char
ter,
the
net i
ncom
e of
the
bank
mus
t be
tran
sfer
red
to th
e ge
nera
l res
erve
.T
he B
oard
of G
over
nors
dec
ides
eve
ry y
ear
how
to a
lloca
te n
et in
com
e,bu
t it h
as u
sual
ly b
een
allo
cate
d to
the
gene
ral r
eser
ve.
The
per
cent
ages
rel
ate
to 2
002
net i
ncom
e.*U
.S.$
18.5
mill
ion
was
allo
cate
d to
a s
peci
al fu
nd fo
r te
chni
cal
coop
erat
ion
gran
ts.
**10
per
cent
of n
et in
com
e is
allo
cate
d to
a s
peci
al r
eser
ve u
ntil
it e
qual
s 50
per
cent
of s
ubsc
ribe
d ca
pita
l.T
he a
nnua
l net
inco
me
of th
e ba
nk m
ust b
e tr
ansf
erre
d to
the
gene
ral
rese
rve
until
it e
qual
s 25
per
cent
of t
he b
ank’
s su
bscr
ibed
cap
ital.
Any
exce
ss o
f net
inco
me
over
the
abov
e lim
it is
ava
ilabl
e fo
r di
stri
butio
n to
the
mem
ber
coun
trie
s. I
n 20
03 U
.S.$
2.8
mill
ion
was
allo
cate
d to
tech
nica
l ass
ista
nce
gran
ts.
0.2
perc
ent o
f net
inco
me
has
been
allo
cate
d to
Ara
b sc
hola
rs, 5
.0 p
erce
ntto
tech
nica
l ass
ista
nce,
10.
0 pe
rcen
t to
the
gene
ral r
eser
ve, a
nd th
ere
mai
ning
84.
8 pe
rcen
t to
the
addi
tion
al r
eser
ve.
The
ann
ual n
et in
com
e of
the
bank
mus
t be
tran
sfer
red
to th
e ge
nera
lre
serv
e.
...
...
10.0
**
...
...
...
...
...
...
14.6
*
...
5.2
...
100.
0
100.
0
75.4
100.
0
94.8
100.
0
53 21 136
101
404 6
49 18 127 92 259
n.a.
10101-03_Ch03_Redo.qxd 10/5/06 3:06 PM Page 105

106 francisco sagasti and fernando prada
banks a rather difficult proposition, although in the case of SRDBs, the smallernumber of member countries simplifies these problems to a significant extent.
Multilateral development banks in general, and regional and subregionaldevelopment banks in particular, have proved to be a most useful institutionalinnovation for supporting the development efforts of their member countries. Ifthey did not exist, it would be necessary to invent them. Yet much remains tobe done before their emerging complementarity-cooperation-rivalry interactionsevolve toward the creation of a veritable “system” of MDBs at the global leveland in some specific regions.
References
Bezanson, K., and F. Sagasti. 2000. A Foresight and Policy Study of Multilateral DevelopmentBanks. Institute of Development Studies, Sussex University, for the Ministry of ForeignAffairs, Sweden.
Estevadeordal, A., B. Frantz, and T. R. Nguyen, eds. 2004. Regional Public Goods: From The-ory to Practice. Washington: Inter-American Development Bank.
Ferroni, M. 2002. Regional Public Goods: The Comparative Edge of Regional DevelopmentBanks. Prepared for the conference “Financing for Development: Regional Challenges andthe Regional Development Banks” at the Institute for International Economics, Washing-ton, February 19.
Kapur, D., J. Lewis, and R. Webb. 1997. The World Bank: Its First Half Century. Vol. 1: His-tory. Brookings.
Raymond, P. 2004. “Comparative Review of IFI Risk Mitigation Instruments.” Presentationat Water Week: Diving into Implementation, Washington, World Bank, February 25,2004.
Sagasti, F. 2004. “La banca multilateral de desarrollo en América Latina.” In Gobernabilidade Integración Financiera: Ámbito Global y Regional, edited by J. A. Ocampo and A. Uthoff.Santiago: Libros de la CEPAL.
Sagasti, F., and K. Bezanson. 2001. Financing and Providing Global Public Goods Expectationsand Prospects. Development Financing 2000, Study 2001: 2. Institute of DevelopmentStudies, University of Sussex, for the Ministry of Foreign Affairs, Sweden.
Strand, J. 2003. “Measuring Voting Power in an International Institution: The United Statesand the Inter-American Development Bank.” Economic Governance (Springer Verlag) 4:19–36.
Te Velde, D. W., O. Morrissey, and A. Hewitt. 2002. “Allocating Aid to International PublicGoods.” In International Public Goods: Incentives, Measurement, and Financing, M. Ferroniand A. Mody, eds. Amsterdam: Kluwer Academic.
World Bank. 2004. Global Development Finance 2004: Harnessing Cyclical Gains for Develop-ment. Washington.
10101-03_Ch03_Redo.qxd 10/5/06 3:06 PM Page 106

Regional arrangements generally remain controversial. They are sometimesseen as a threat to multilateralism, and multilateralism is, in principle, first
best. The argument for multilateralism and against regionalism is best developedfor trade arrangements: regional agreements have a trade-creating effect withinthe region but also a trade-diverting effect in the rest of the world, and for thatreason could quite possibly reduce overall welfare. Yet the threat is not substanti-ated by historical developments over the past decades. Baldwin develops a con-vincing domino theory according to which regional trade arrangements promptmultilateral arrangements as those left out face additional incentives to reachmultilateral agreements that they were resisting beforehand.1 The domino theoryis dynamic; trade diversion is static.
Applying the general presumption against regionalism in the matter of exchangerate arrangements is even more misleading. The International Monetary Fund(IMF) was created to promote multilateralism in exchange rate arrangements largelyin reaction to the self-destructive wave of beggar-thy-neighbor devaluations duringthe interwar period. This is why the IMF and many countries are unhappy withregional arrangements. Yet a number of factors ought to be taken into account.
Regional Exchange Rate Arrangements: The European Experiencecharles wyplosz
4
107
1. Baldwin (1997).
10101-04_Ch04_Redo.qxd 10/5/06 3:06 PM Page 107

First, there is no international monetary system, not since the end of theBretton Woods system. Every country is free to choose the arrangement that itdeems most desirable, without having to make sure that it fits other countries.True, the Articles of Agreement of the IMF ban exchange market manipulationsof the beggar-thy-neighbor type, but there is no rule that prevents regionalagreements. Regional arrangements do not impair a nonexisting system.
Second, existing regional arrangements do not encourage collectively nega-tive behavior toward nonmembers. The euro floats freely, as does the EastCaribbean dollar. The CFA franc is tied to the euro. It is very unclear how thirdparties can be hurt by such arrangements. Trade blocs have not been found tocreate adverse trade diversion, and currency blocs are even less likely to do so.
Third, a direct impact of regional arrangements is to reduce the risk of cur-rency crises, which often have unpredictable contagious effects. For instance,European currencies used to be regularly buffeted by speculative attacks; this isnow history with the advent of the monetary union, which, so far at least, hasnot led to exchange rate instability elsewhere. Preventing contagious crises isone of the most urgent tasks of the international monetary “system” and re-gional arrangements are arguably the most efficient response.
The recent interest in regional exchange rate arrangements has been stimu-lated by the “hollowing-out view,” sometimes also called the “two-corner solu-tion.” This view holds that there is no workable middle ground betweenfloating and hard pegs (currency boards or the adoption of a foreign currency).It predicts that traditional fixed exchange rate regimes are doomed in a world ofunfettered capital flows. According to this view, countries that wish to limitexchange rate flexibility have to go all the way to hard pegs. The regional coun-terpart to a hard peg is a monetary union.
The creation of the euro has also contributed to the rising popularity ofregional arrangements. Up until its birth in 1999, the euro project was oftengreeted with suspicion and warnings of impending disaster.2 At the time of thiswriting, six years later, predictions that the arrangement is doomed can still beheard, but they sound increasingly hollow. The truth is that the euro has been astunning success. Gone are the days of speculative attacks and wide inflation dif-ferentials in Europe. The debate on whether the European Central Bank (ECB)is performing well is vigorous, as it should be. To be sure, it is imperfect, as hashistorically been the case with almost all new federal institutions. Some populistEuropean politicians blame the euro for every difficulty, and their criticismsoften fall on sympathetic ears, but their arguments are weak and unfounded.
108 charles wyplosz
2. See Feldstein (1997).
10101-04_Ch04_Redo.qxd 10/5/06 3:06 PM Page 108
regional exchange rate arrangements 109
Regional monetary unions can work, as do other regional arrangements, such asEurope’s previous exchange rate mechanism.
Yet it would be equally misleading to believe that the European example canbe easily transferred elsewhere. Over the past fifty years, Europe has achieved aremarkable degree of economic and financial integration. Twenty-five countriesnow share a single market for goods and services, and twelve countries haveadopted a common currency, the euro. Over the next decade, a few more coun-tries will join the single market and ten more countries could adopt the euro.This process is also being matched, to some degree, by political integration, withefforts under way to align foreign policies and internal security. Not all is perfect,though, and formidable challenges remain on the agenda, if only to improve theexisting governance structure initially designed for the first six countries thatformed the European Community in 1958.3 Yet, the depth and breadth of thearrangement is unprecedented, and it brings together countries that were often atwar with each other over the past thousand years. War is unthinkable today, andit is precisely the desire to avoid it that has underpinned the effort and the readi-ness to give up significant elements of national sovereignty.
The thesis of this chapter is that Europe’s story carries a number of impor-tant lessons but also several warnings. For instance, it argues that the commit-ment to fixed exchange rates has always taken precedence over capital mobility.Exchange rate stability has been seen as a precondition for trade integration,the only way of establishing a level playing field for international competi-tion. The decision to adopt a common currency came very late, much as cap-ital mobility was restrained for decades, and it was reached only after a highdegree of trade integration had been achieved, accompanied by the establish-ment of powerful supporting institutions. Put differently, regional trade integra-tion, exchange rate stability, and institution building came first, capital mobilityand monetary union came later. A key question is whether this sequencing canbe modified and whether the pace can be accelerated. The answer is that bothare quite unlikely.
The following section examines the reasons why small open or would-beopen economies care about exchange rate stability and how stability can beachieved. It reviews how Europe has dealt with this issue. It emphasizes thatchoosing an exchange regime must go hand in hand with the choice of a capitalmobility regime. The following sections then describe in detail the gradualhardening of exchange rate arrangements in Europe and examine the lessons ofthat experience.
3. These countries are Belgium, France, Germany, Italy, Luxembourg, and the Netherlands.
10101-04_Ch04_Redo.qxd 10/5/06 3:06 PM Page 109

10
20
30
40
50
60
7020001980
20001980
FloatIntermediateFixed
10
20
30
40
50
60
70
80
FloatIntermediateFixed
IMF classification LYS classification
Source: Levy-Yeyati and Sturzenegger (2002).
Figure 4-1. Official IMF and de Facto Exchange Rate Regimes
Percent of all countries
110 charles wyplosz
The Logic of Soft Pegs
Regime Choice
Despite its appeal, the hollowing-out hypothesis is not proving valid in practice, atleast not yet. A few well-known cases of adoption of hard pegs in the 1990s (cur-rency boards in Argentina, Bulgaria, Estonia, and Lithuania; dollarization inEcuador and El Salvador) do not signal mass migration to hard pegs. Many coun-tries have announced that they will let their currency float freely, but theseannouncements have not always been followed by concrete action. Figure 4-1shows the official exchange rate regime reported to the IMF and the actual regimefound to exist by Levy-Yeyati and Sturzenegger.4 The figure reveals that the pro-portion of pegged exchange rate regimes has declined between 1980 and 2000,with an equal increase in freely floating regimes. Levy-Yeyati and Sturzeneggerconfirm the decreasing popularity of pegged regimes but find that migration hastaken place toward intermediate regimes (crawls, managed floats). Much the samepicture emerges from the classification by Reinhart and Rogoff, who use a verydifferent procedure to identify exchange regimes.5
4. See Levy-Yeyati and Sturzenegger (2002).5. Reinhart and Rogoff (2004).
10101-04_Ch04_Redo.qxd 10/5/06 3:06 PM Page 110

regional exchange rate arrangements 111
The evidence against the hollowing-out hypothesis is of considerable impor-tance. This hypothesis is based on the entirely correct view that when capital isfreely mobile pegged regimes are unstable, unless the use of monetary policy ispurely and simply abandoned and all efforts are directed toward upholding thepeg. But in this case, the peg becomes a hard one; there is no sustainable midway.In fact, the evidence seems to suggest that many countries do not wish to moveto the extremes. They exhibit both “fear of floating”6 and “fear of pegging.”Resistance to adopting formal pegs is explained by the loss of monetary inde-pendence and by the risk of inviting speculative attacks. Resistance to freely float-ing is explained by the high degree of volatility that exchange rates then display.
Central to the hollowing-out hypothesis, therefore, is the view that full capi-tal mobility is the natural evolution. What the evidence shows, however, is thatmost developing countries are reluctant to remove all restrictions on capitalmobility, following the approach of most developed countries. It was not untilthe late 1980s that full capital mobility became the norm among developedcountries. As is argued below, this is what led to the adoption of the euro.
Put differently, the choice of an exchange rate regime cannot be dissociatedfrom the capital mobility regime. The hollowing-out hypothesis, a reincarnationof what used to be called the “impossible trinity,” can be restated as follows: if acountry opts for a regime of full capital mobility, the only sustainable exchangerate regimes are the extreme ones—hard pegs or free floating. If a country optsfor a high degree of exchange stability, it must restrict capital mobility.
Forms of Exchange Rate Stability
Exchange rate stability does not necessarily mean a peg. Bretton Woods–stylefixed-but-adjustable pegs with fluctuation bands represent one way of achievinga degree of stability, but they are not the only way. In the presence of high butmoderate inflation, pegs require recurrent depreciations, which can take theform of crawling pegs with various adjustment frequencies. A close substitute isa managed float, whereby the authorities allow the exchange rate to depreciateover time if need be, but limit the range of fluctuation around the trend.
This view of exchange rate stability focuses on the behavior of the exchangerate—an important policy consideration, but not the only one that matters.Equally important is the commitment aspect. A peg announcement, whether itconcerns a fixed-but-adjustable rate or a crawling band, commits the authoritiesin two ways. First, monetary policy must be constrained. This constraint can berelaxed somewhat by delinking domestic financial markets from international
6. See Calvo and Reinhart (2000).
10101-04_Ch04_Redo.qxd 10/5/06 3:06 PM Page 111

112 charles wyplosz
conditions through limits on capital mobility, but the effectiveness of such capi-tal controls is limited. Second, announcing a band of fluctuation, no matter howwide it is, means that its hedges are open to speculative pressure. When theexchange rate comes close to any hedge, the situation usually becomes untenable.Thus a peg announcement carries with it an implicit invitation to speculation.Capital controls offer some protection; indeed, this is where they are effective, forthey provide some breathing room in the midst of a currency crisis.7
The managed float is the increasingly popular regime. It seems to offer thebest of all worlds, allowing the authorities to limit short-run fluctuations whileaccommodating long-run trends and removing the commitment that invitesspeculative attacks. This view is misleading, however. Markets are good at spot-ting the implicit strategy and they will test the implicit limits of fluctuations. Ifthere are no such limits, or if they are fuzzy, the stabilization effect is lost. If theauthorities do enforce limits, the difference with explicit bands is cosmetic.Much the same applies to the width of the fluctuation bands. Narrow bandsimpose a tight constraint on monetary policy; wide bands produce an effect thatdiffers little from that of a free float, except that they will occasionally be subjectto speculative pressure.
In the end, there is no free lunch: restricting the volatility of the exchangerate can only be achieved by subjecting monetary policy to fairly strict con-straints. There are various ways of achieving this aim; they all require discipline.This is why a peg, of one form or another, is sometimes referred to as an anchor.As such, it is a desirable tool, comparable to other monetary policy rules, such asinflation targeting or money growth rules. For small open economies, this maybe the best rule, as the next section argues.
Why Exchange Rate Stability Matters: The Case of Europe
There are several reasons for wanting to limit exchange rate variability. Themost commonly cited reasons are a quest for stability for trade purposes, a strat-egy of importing monetary discipline, and a lack of sufficiently deep financialand exchange markets. This section argues that, in Europe, the key motivationwas trade.
Financial and exchange markets were shallow in Europe in the 1950s. Afterthe move to current account convertibility in 1958, capital account restrictionsremained widespread, partly motivated by the belief that this would help make
7. This statement relates only to the usefulness of controls during speculative attacks. There is ahuge body of literature on the usefulness of capital controls and on their distortionary impact.Most of it is extremely critical of capital controls because they entail high costs and few benefits.Rogoff (2002) offers one such sober assessment.
10101-04_Ch04_Redo.qxd 10/5/06 3:06 PM Page 112
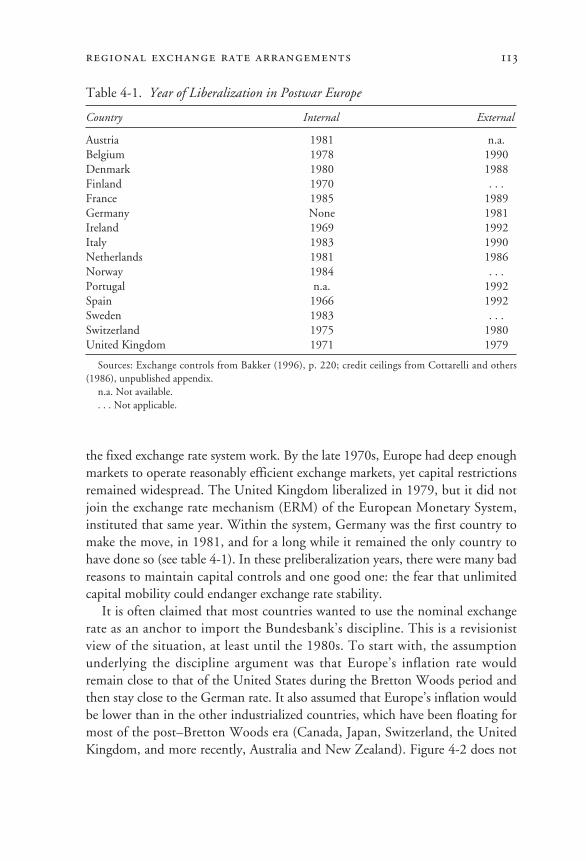
regional exchange rate arrangements 113
Table 4-1. Year of Liberalization in Postwar Europe
Country Internal External
Austria 1981 n.a.Belgium 1978 1990Denmark 1980 1988Finland 1970 . . .France 1985 1989Germany None 1981Ireland 1969 1992Italy 1983 1990Netherlands 1981 1986Norway 1984 . . .Portugal n.a. 1992Spain 1966 1992Sweden 1983 . . .Switzerland 1975 1980United Kingdom 1971 1979
Sources: Exchange controls from Bakker (1996), p. 220; credit ceilings from Cottarelli and others(1986), unpublished appendix.
n.a. Not available.. . . Not applicable.
the fixed exchange rate system work. By the late 1970s, Europe had deep enoughmarkets to operate reasonably efficient exchange markets, yet capital restrictionsremained widespread. The United Kingdom liberalized in 1979, but it did notjoin the exchange rate mechanism (ERM) of the European Monetary System,instituted that same year. Within the system, Germany was the first country tomake the move, in 1981, and for a long while it remained the only country tohave done so (see table 4-1). In these preliberalization years, there were many badreasons to maintain capital controls and one good one: the fear that unlimitedcapital mobility could endanger exchange rate stability.
It is often claimed that most countries wanted to use the nominal exchangerate as an anchor to import the Bundesbank’s discipline. This is a revisionistview of the situation, at least until the 1980s. To start with, the assumptionunderlying the discipline argument was that Europe’s inflation rate wouldremain close to that of the United States during the Bretton Woods period andthen stay close to the German rate. It also assumed that Europe’s inflation wouldbe lower than in the other industrialized countries, which have been floating formost of the post–Bretton Woods era (Canada, Japan, Switzerland, the UnitedKingdom, and more recently, Australia and New Zealand). Figure 4-2 does not
10101-04_Ch04_Redo.qxd 10/5/06 3:06 PM Page 113

114 charles wyplosz
bear out these assumptions. On average, Europe (excluding the floaters, Switzer-land and the United Kingdom) exhibits the worst inflation performance in theOrganization for Economic Cooperation and Development (OECD) area. Ifdiscipline was the motivation, it did not work. Most likely, it was not.
The view that exchange rates can be used as an anchor is fairly recent, atleast in European official thinking. The argument that the inflation anchorserved as the motivation for setting up the European Monetary System (EMS)mixes up the timing. It was only after the wave of currency crises of 1983, afterFrance had adopted the “franc fort” strategy, that the EMS started to functionasymmetrically, with the German mark as its recognized anchor. When theEMS was created, reference was explicitly made to nominal exchange rate sta-bility, not to the desire to anchor inflation to best practice in Germany.Realignments were not only possible but actively practiced and always justifiedas a “correction” of accumulated inflation differentials. In fact, the EMS wasexplicitly set up as a symmetric system, with no central currency. Its rules care-
2
4
6
8
10USAEuropeNon-Europe OECD
1990–981980–891970–791960–691950–59
Source: IMF.a. “Non-Europe” is Australia, Canada, Japan, New Zealand, Switzerland, and the United Kingdom.
Percent
Figure 4-2. Inflation in the OECD Area
10101-04_Ch04_Redo.qxd 10/5/06 3:06 PM Page 114

regional exchange rate arrangements 115
fully avoided adopting the Bretton Woods presumption that countries withhigh inflation and weak currency would bear the burden of adjustment in caseof misalignment and market pressure. Responsibility for exchange marketinterventions was strictly bilateral, with unlimited support from the strong tothe weak currency country. Much to the discomfort of the Bundesbank,8 theEMS was officially aiming at a “regression toward the mean,” not at imposingthe Bundesbank’s rigorous best practice.
The view that exchange rate stability promotes trade has no theoretical sup-port (uncertainty can either encourage or discourage international trade, depend-ing on assumptions) and limited empirical support. See, for example, works byKenen and Rodrik regarding the effects of short-term volatility in real exchangerates in a sample of industrialized countries and by de Grauwe on the impact ofexchange rate volatility in the European Union; stronger evidence has beenadduced by Rose and by Helliwell and Parsley and Wei on the border effect. Atany rate, the quest for exchange rate stability has been crucial. Policymakershappened to believe that nominal exchange rate stability matters for trade, pos-sibly for good reasons.9
Evidence on the stability of intra-European exchange rates is presented in fig-ure 4-3a for the key French franc/German mark exchange rate. The top chart offigure 4-3a displays the real exchange rate between these two currencies over theperiod 1971–98, at the end of which both currencies ceased to exist. The topchart in figure 4-3b shows the real exchange rate between the franc and theUnited States dollar. The contrast is sharp and is confirmed by the two middlecharts in both figures, which depict the behavior of the pound sterling, a non-EMS currency (except for a very short period in 1992). Much the same patternapplies to the other EMS currencies. For comparison purposes, the bottomchart in figure 4-3a shows the real exchange rate between the Argentina pesoand Brazil real over the period 1980–2003. Much as is the case for Britain andits European partners, the bilateral volatility between these two currencies (pesoand real) is of the same order of magnitude as their volatility against the dollar,exemplified in the exchange rate between the Argentine peso and the U.S. dollarin the bottom chart of figure 4-3b. Clearly, the European countries that wantedto stabilize their bilateral exchange rates succeeded.
8. As documented in Eichengreen and Wyplosz (1993), the Bundesbank had arranged for aprivate agreement with the German Treasury that would suspend the intervention clause if itdetermined that it was threatening price stability. This clause was invoked during the lira crisis inSeptember 1992.
9. Kenen and Rodrik (1986); de Grauwe (1988); Rose (2000); Helliwell (1998); Parsley andWei (2001).
10101-04_Ch04_Redo.qxd 10/5/06 3:06 PM Page 115

116 charles wyplosz
40
60
80
100
120
140
160
180
French franc/German mark
1996M11991M11986M11981M11976M1
40
60
80
100
120
140
160
180
40
60
80
100
120
140
160
180
United Kingdom pound/German mark
1996M11991M11986M11981M11976M1
Argentina peso/Brazil real
2000M11995M11990M11985M1
Figure 4-3a. Real Exchange Ratesa
Sample average = 100
10101-04_Ch04_Redo.qxd 10/5/06 3:06 PM Page 116

regional exchange rate arrangements 117
Figure 4-3b.
Source: IMF.a. The index uses the consumer price index.
40
60
80
100
120
140
160
180
French franc/United States dollar
1996M1 1991M1 1986M1 1981M1 1976M1
40
60
80
100
120
140
160
180
40
60
80
100
120
140
160
180
United Kingdom pound/United States dollar
1996M1 1991M1 1986M1 1981M1 1976M1
Argentina peso/United States dollar
2000M1 1995M1 1990M1 1985M1
10101-04_Ch04_Redo.qxd 10/5/06 3:06 PM Page 117

118 charles wyplosz
It is important to note that it is not the nominal exchange rate that was stabi-lized, but the real rate. This remark is important for two reasons. First, while thetarget was the real exchange rate, the instrument was the nominal exchange rate.The procedure was to make frequent use of the ERM provisions for realignmentand to base these realignments explicitly on purchasing power parity (PPP). Sec-ond, the above observation confirms that the goal was not to use the exchangerate as a nominal anchor to achieve uniformly low inflation. Germany wasattached to price stability and achieved it throughout the period. Other coun-tries, notably France and Italy, had more tolerance for inflation, and periodi-cally realigned their exchange rates to reestablish competitiveness.10 But theinflation performance of the United Kingdom was similar to that of France andItaly. If the United Kingdom did not join the ERM it was not because of infla-tion, but because it accorded less importance to exchange rate stability than itspartners. Clearly, inflation differentials were considerably more modest thanthose observed in Latin America, for example. It is likely that the arrangementwould not have been possible in the face of large inflation differentials. In thatsense, exchange stability promoted discipline.
Summarizing, this section argues that the European countries have identifiedreal exchange rate stability as a key policy target. The discipline argument forexchange rate stability focuses on the nominal, not the real, exchange rate: nom-inal rates were anything but stable, and the inflation performance of the Euro-pean countries has been worse than that of most other developed countries. Theview that exchange rates were kept pegged because the markets were too shallowto be efficient is not convincing, either. That may have been true in the 1950sand the 1960s, when the currencies were simply not convertible, but it was nottrue in the 1970s and beyond.
Exchange Rate Arrangements in Europe
This section briefly describes the different arrangements adopted in Europe sincethe end of World War II. It illustrates two key aspects of Europe’s monetary inte-gration: a constant quest for internal exchange rate stability and a succession ofdaring advances and temporary setbacks. Europe’s approach to exchange ratecoordination has been gradual and pragmatic. It has mainly reacted to events,both external (such as the end of the Bretton Woods system) and internal (such asthe removal of capital controls), shunning any grand design. The 1971 WernerPlan to launch a common currency within two years never took off. The project
10. The Netherlands is one country that actively used the exchange rate as an anchor andundertook never to devalue it against the German mark.
10101-04_Ch04_Redo.qxd 10/5/06 3:06 PM Page 118

regional exchange rate arrangements 119
was adopted twenty years later, but only when it had become obvious that theERM could not cope with full capital mobility, even though policymakersmight not have realized this necessity.
Brief Historical Overview
Bretton Woods. The Bretton Woods agreements provided indirectly for fixedexchange rates within Europe, but they were not a joint undertaking, nor werethey intended to further any specific European goals. The agreements matchedEuropean interests, but they also matched those of the United States, which wasequally preoccupied with the restoration of trade links. Faced with an acuteshortage of dollar balances, European countries did not move to establish cur-rency convertibility from the outset. As they concentrated on developing bilat-eral payment agreements, both among themselves and with non-Europeancountries, they started to work out their own arrangements.
The European Payments Union. The European Payments Union (EPU) wasset up in 1950 to simplify the cumbersome web of some two hundred bilateralpayment agreements. It worked as a multilateral clearing system, focusing onthe overall balances of payments of its member countries within the union.Generally considered a success, the EPU is credited with helping to bring aboutthe resumption of intra-European trade. The EPU had some drawbacks, how-ever, notably its tendency to encourage trade among its members to the detri-ment of nonmembers.
Convertibility. The next major move, the restoration of currency convertibil-ity in 1958, was decided collectively, concurrent with the adoption of theTreaty of Rome, which created the European Common Market. Convertibilityinitially only concerned the current account. For many more years the financialaccount remained subject to fairly draconian restrictions in most countries. Thearrangement provided for a high degree of exchange rate stability, with fewrealignments. The first major depreciation, by the United Kingdom, did notoccur until 1967. It was followed by a depreciation of the French franc and arevaluation of the German mark, both in 1969.
The snake. By the time the Bretton Woods system collapsed during the period1971–73, further imbalances had accumulated inside Europe. After a series ofrealignments, most European countries undertook to maintain limited marginsof fluctuation for their bilateral exchange rates, while the other developed coun-tries let their currencies float. The resulting arrangement, known as the European“currency snake,” was a mixed success. Most countries were able to keep up withthe arrangement, but speculative pressure forced others—especially France, Italy,and Sweden—to withdraw from the snake. Outside Britain, there was no seriousquestioning of the wisdom of keeping exchange rates pegged.
10101-04_Ch04_Redo.qxd 10/5/06 3:06 PM Page 119

120 charles wyplosz
The Werner Plan. The main setback for monetary integration during thisperiod was the abandonment of the Werner Plan. Completed in 1970 andendorsed by the Council of Ministers in 1971, the Werner Report had recom-mended the rapid adoption of a common currency. It mapped out threestages, including the pooling of foreign exchange reserves for joint interven-tions. The turmoil surrounding the breakup of the Bretton Woods system ledthe larger countries to aim at more modest steps, partly out of pragmatism,partly as a pretext to escape a move that was clearly ahead of policymakers’thinking. The smaller countries, which were seeing their own policy auto-nomy decline, were frustrated by the failure but unable to shake the domina-tion of the larger countries.
The European Monetary System. Monetary integration soon took anotherdirection, however. The EMS was agreed upon in 1978 and began operating in1979. Eight of the then nine members of the European Community becameactive members of the exchange rate mechanism. When the euro was launchedin January 1999, all members of the European Union were part of the ERM,with the exception of Greece, Sweden, and the United Kingdom. Greece joinedthe ERM later that year.11
The European Monetary Union. During its first ten years of existence, theERM underwent frequent crises. By the early 1980s its survival was very muchin doubt, especially as a series of attacks affected the French franc in the wake ofthe election of President François Mitterrand. The political reaction turned outto be another show of support for fixed exchange rates. The authorities rededi-cated themselves to a new ERM, one in which the German mark would play therole of central currency. This “greater Deutschmark area” gradually asserted itscredibility and came to be seen as such a success that policymakers grew embold-ened and resolved to move to the next logical step, monetary union.12 But thesuccess of the ERM was concealing a buildup of tensions. The combination ofaccumulated imbalances and a major policy mistake—denial of the fact thatGerman unification would require a revaluation of the mark—triggered a roundof violent speculative attacks. Two countries (Italy and the United Kingdom) leftthe ERM, and many were forced to devalue, some of them several times. TheERM was radically changed when its margins of fluctuation were widened to the
11. Among European nonmembers of the European Union, Switzerland has traditionallysteered its own currency alongside the German mark, even though it has always been very carefulnot to declare an official linkup, and has occasionally used the exchange rate as a tool of mone-tary policy.
12. A detailed review of this evolution is provided by Kenen (1995).
10101-04_Ch04_Redo.qxd 10/5/06 3:06 PM Page 120

regional exchange rate arrangements 121
point of irrelevance. Yet, while the ERM currencies were officially quasi-floating,unofficially the monetary authorities endeavored to keep them within narrowmargins, in fact quietly mimicking the defunct ERM.
The Exchange Rate Mechanism: A Sophisticated Arrangement
The ERM, which lasted in its first incarnation for twenty years, is of more thanhistorical interest. To start with, it still plays an important role, as the newEuropean Union members are expected to participate in the mechanism as apreliminary step toward joining the monetary union.13 More important, per-haps, is the fact that it was the success of the ERM that convinced policymakersto go to the next step, monetary union. This is why it is of general interest tocritically review its main features.
When the ERM was launched, two main requirements shaped its design.The first one was to provide a tool for stabilizing the intra-European exchangerates that had been buffeted in the years following the demise of the BrettonWoods system. It had to be sturdier than the currency snake. The secondrequirement was of a political nature. The other countries were unwilling sim-ply to tie their currencies to the German mark, even though it was already themost stable European currency.
The solution to the second issue was to make the ERM fully symmetric. Incontrast with the hub-and-spoke arrangement of Bretton Woods, exchange rateswere fixed bilaterally, producing a matrix of bilateral parities that becameknown as “the grid.” Each bilateral rate could fluctuate by +/−2.25 percentaround its declared parity.14 In addition, the responsibility of maintaining theexchange rate within the agreed upon margin of fluctuation was shared by eachpair of countries, with no presumption that more had to be done by the weakercurrency. Symmetry was the response to political sensitivities.
The solution to the first question was an unprecedented commitment that, ifneed be, the parities would be defended by unlimited interventions, conductedby both countries whose bilateral rate was pushed to its declared margin of fluc-tuation. In addition, other ERM member countries could be asked to providesupport, either through interventions or through short-term loans. Cohesionand mutual support was the answer to economic fragility.
13. The new exchange rate mechanism (ERM II) was established when the euro was launched.Initially, its only member was Denmark. Seven of the ten new European Union members havenow joined Denmark, and the three remaining ones have the obligation to join the mechanism“soon.”
14. The Italian lira was given a temporarily larger margin of +/−6 percent.
10101-04_Ch04_Redo.qxd 10/5/06 3:06 PM Page 121

122 charles wyplosz
Furthermore, both upon entry and subsequently, the choice of every bilateralparity had to be agreed collectively and by consensus of all member countries.This was designed to prevent any beggar-thy-neighbor manipulation by a groupof member countries. It was also seen as a justification for the collective defenseof existing parities.
Thus the ERM was much more than a “European Bretton Woods.” It was anambitious undertaking that removed decisions on exchange rate parity fromnational hands. It sent the signal that any attack on a particular currency wouldbe met by a collective defense. It also envisioned an active management of pari-ties, so that realignments would not come to be seen as a system failure, butrather as an indication of flexibility.
Indeed, the ERM went through a large number of realignments, as shown intable 4-2. From its inception in March 1979 until January 1987, no fewer thantwelve adjustments were deemed necessary, on average one every eight months.Interestingly, these realignments were usually anticipated by the markets andthus preceded by speculative attacks. These attacks, however, were not lethalbecause capital controls limited the volume of required interventions and alsobecause corrective realignments were promptly enacted.
Interventions by both of the central banks concerned were compulsory whenany bilateral margin was reached, but it soon became apparent that waiting forthat to happen was risky. When pressed against its limit, an exchange rate offers
Table 4-2. Exchange Rate Mechanism (ERM) Realignments
Sept. 24, Nov. 30, Mar. 22, Oct. 5, Feb. 22, June 14, Date 1979 1979 1981 1981 1982 1982
Number of 2 1 1 2 2 4currencies involved
Date Mar. 21, May 18, July 22, Apr. 7, Aug. 4, Jan. 12, 1983 1983 1985 1986 1986 1987
Number of 7a 7a 7a 5 1 3currencies involved
Date Jan. 8, Sept. 14, Nov. 23, Feb. 1, May 14, Mar. 6, 1990 1992 1992 1993 1993 1995
Number of 1 3b 2 1 2 2currencies involved
a. All ERM currencies realigned.b. In addition, two currencies (pound sterling and lira) left the ERM.
10101-04_Ch04_Redo.qxd 10/5/06 3:06 PM Page 122

speculators one-way bets—either a realignment occurs and large gains arereaped, or there is no realignment and the cost of speculating is virtually nil—that make attacks irresistible. This is why, gradually, most interventions becameincreasingly intramarginal—that is, aimed at keeping the bilateral rates wellwithin the margins of fluctuation, as table 4-3 shows. The table also indicatesthat dollar interventions, aimed at stabilizing bilateral parities within the ERMvia the stabilization of U.S. dollar parities, became less important, but nevernegligible, as interventions in ERM currencies assumed greater importance.
Table 4-3 also reveals an important asymmetry between the Bundesbank andthe other central banks. While most other central banks increasingly relied onnoncompulsory intramarginal interventions, the Bundesbank limited its owninterventions to fulfilling its obligation of providing bilateral support at themargin. This is one aspect of the process that led to the progressive emergenceof the German mark as the de facto center of the system. Simplifying somewhat,initially the ERM worked in a symmetric way; all central banks stabilized theirbilateral parities mainly by managing their currencies against the dollar, as inthe Bretton Woods system. Eventually, all countries dropped the dollar in favorof the mark, while the Bundesbank steered the evolution of the European cur-rencies against the dollar.
There is another reason for this evolution. All the countries that were run-ning higher inflation than Germany and that had been forced to devalue repeat-edly under speculative pressure gradually accepted the view that they ought toaim at a lower inflation rate. From 1987 onward, they effectively adopted the
regional exchange rate arrangements 123
Table 4-3. Foreign Exchange Market Interventions a
Billions of U.S. dollars
1979–82 1983–85 1987–87 1988–89
All currenciesInside ERM
At margin 20.5 15.4 22.3 0.9Intramarginal 29.2 48.6 113.7 32.4
In U.S. dollars 139.4 78.4 53.7 29.5
BundesbankInside ERM
At margin 3.1 1.7 3.3 0Intramarginal 0 0 0 0
In U.S. dollars 25.4 18.9 5.4 12.4
Source: Gros and Thygesen (1998).a. Algebraic sum of purchases.
10101-04_Ch04_Redo.qxd 10/5/06 3:06 PM Page 123

124 charles wyplosz
German mark as the anchor and committed to holding their exchange rate pari-ties unchanged. In fact, they proceeded to closely follow the Bundesbank’s policy.This approach worked in the sense that inflation gradually declined everywheretoward the German level. With nominal exchange rates stable for several years, theERM was seen as a major success. The idea of irrevocably fixing exchange ratesby adopting a common currency followed almost naturally, leading to theMaastricht Treaty.
Meanwhile, however, the inflation differentials that had accumulated in theeffort to achieve inflation convergence had resulted in the overvaluation ofsome currencies. The collective removal of capital controls in 1990 meant thatthe unavoidable realignments would be a dangerous affair. Indeed, when spec-ulation started, triggered by difficulties in ratifying the Maastricht Treaty, twocurrencies were forced to leave (the Italian lira and the pound sterling, whichhad joined a few months before at an overvalued rate) and the margins of fluc-tuation had to be widened to a huge +/−15 percent. The ERM was in shambles,but the decision to launch the euro had been firmly taken, which provided forcontinuing currency stability.
The late difficulties of the ERM illustrate three general points. First, anysystem of pegged rates has to be flexible. Using the exchange rate as an anchoris a possibility for one country, not for a system. Such a strategy has to shapemonetary policy in the country that adopts it; it is a disciplinary device. Withinthe ERM, with its symmetric nature and promise of mutual support, the disci-pline aspect is weakened and any slippage affects all members. Second, it isimpossible to maintain pegs when capital is fully mobile. Strict monetary policydiscipline is a necessary but not sufficient condition in a world where self-fulfillingcrises are conspicuous. Third, it is quite striking that the system worked well whenit was symmetric but failed when Germany had become the de facto center. Thisdoes not mean that a hub-and-spoke system cannot work, but it does suggest thata regional system can work without a center if all the rest is well thought through.
The Monetary Union
The European Economic and Monetary Union (EMU) is less original than theERM. In a number of respects it mimics arrangements that can be found inmany federal countries. This section therefore does not attempt to provide adetailed description of the EMU; rather, it deals with the originality of theundertaking and points out a few key distinguishing features.
The main challenge is to build adequate institutions. At the technical level,the situation is fairly straightforward: a single currency requires a single mone-tary authority, and there are not many possible monetary strategies. To be sure,
10101-04_Ch04_Redo.qxd 10/5/06 3:06 PM Page 124

regional exchange rate arrangements 125
debates rage on the strategy of the ECB, but these are details. More complex isthe governance issue of turning over the important power of carrying out mone-tary policy to a multinational authority. While the broad design will inevitablybe inspired by arrangements in federal states, the fact that Europe remains aunion of independent nation-states greatly complicates matters.
The solution adopted offers a mix of federal and international arrangements.The decisionmaking power is given to the European System of Central Banks, theEurosystem. Its decisionmaking body is the Governing Council, composed of thesix members of the ECB Executive Board and the governors of the national cen-tral banks (NCBs) of the participating countries. The Executive Board is of a fed-eral type, as its members serve in a personal capacity. Yet, they are appointed bythe member states, which inevitably means that nationality matters a great deal.As could be expected, the emerging pattern is that the large member countries(France, Germany, Italy, and Spain) have managed to appoint one of their nation-als and intend to keep it that way, and the two remaining positions are filled bynationals of the smaller countries. Of course this runs completely counter to thespirit of the principle that board members are appointed solely on the basis oftheir competence and in no way serve as representatives of their countries. Simi-larly, the fact that the NCB governors serve on the Governing Council ex officiois another contradiction to the nonrepresentativeness principle.
More worrisome is that the size of the Governing Council is due to expandas new countries join the EMU. With eighteen voting members, the decision-making process is already highly unlikely to permit deep exchanges of views.The council could grow to thirty-one members if all current European Unionmembers adopt the euro, and with more countries slated to enter the EuropeanUnion, the Governing Council could become even larger. This difficulty is wellrecognized but politically delicate. The Eurosystem has proposed capping thenumber of voting members at twenty-five, resorting to a complex rotation sys-tem that would take account of the size of countries.
Even more worrisome is the widely discussed “democratic deficit.” TheEurosystem is completely independent: the members of its Governing Board areall appointed to long terms and cannot be removed from office. Yet indepen-dence brings with it the question of accountability. The chosen solution hasbeen to make the ECB accountable to the European Parliament. However, theEuropean Parliament has no formal power over the ECB, except for confirmingthe appointments of Executive Board members. It cannot make suggestions onfuture policies; it can only comment on past policies. The result is a weak expost process, with no serious consequences if the Parliament disagrees with theactions of the Eurosystem.
10101-04_Ch04_Redo.qxd 10/5/06 3:06 PM Page 125

126 charles wyplosz
These issues reflect the political and institutional difficulties of a monetaryunion. Although Europe is unique in having a structured governance system(the European Council, which brings together the heads of state and govern-ment, and the Council of Ministers) and an elected Parliament, the currentorganization is not fully satisfactory. It is true that the EMU has functionedquite well so far, and it is hard to foresee major difficulties, which suggests thatthe arrangements are not fundamentally flawed, yet criticism is endemic andmight weaken governance if serious difficulties were to arise.
Fiscal Policy: Coordination and Discipline
The final issue of interest concerns the treatment of fiscal policy. If capital isfreely mobile, the more exchange rates are fixed, the less monetary policy can beused for macroeconomic stabilization purposes. As a result, fiscal policy be-comes the main, if not the only, macroeconomic stabilization tool. Yet in theabsence of fiscal policy discipline, any monetary policy commitment, includingexchange rate stability, is bound to be undermined. In addition, it is oftenasserted that, because they affect exchange rates, fiscal policies must be coordi-nated. Thus the tighter the degree of cooperation on the exchange rate, themore limits have to be put on the implementation of national fiscal policies, ineffect reducing the scope for national macroeconomic stabilization policies. Analternative is to restrict capital mobility, preferably using a version of theChilean encaje.15 Such restrictions do not provide full freedom to carry outlong-lasting divergent policies, especially policies that result in lasting inflationdifferentials, but they make exchange rate realignments manageable.
On the other hand, the closer the exchange rate linkage within the region, themore each country depends on the behavior of the others. It is often claimed thatthe overall policy mix matters for regional interest and exchange rates, especiallyin a monetary union. This is misleading. If the region is closely integrated ininternational financial markets, each country is too small to have an impact onthe regional interest rates. This is true even for the European monetary union.The collective stance matters if the region is large, as Europe is, but this means thatfully coordinated policies might have an impact. Given that, in each country, fiscalpolicy is highly political and hard to design, full coordination is extremely unlikely.
What remains true is that one country’s default, especially if that country islarge relative to the others in the region, could have a serious effect on the wholeregion. This is why fiscal discipline becomes a regional concern, in particular
15. The encaje is a system of capital controls that works by imposing costs on inflows. Thesecosts decline with maturity, mimicking the desirable properties of the Tobin tax.
10101-04_Ch04_Redo.qxd 10/5/06 3:06 PM Page 126

regional exchange rate arrangements 127
within a monetary union. Europe has adopted the Stability and Growth Pact, anagreement to limit budget deficits to 3 percent of GDP. This pact is ill-conceivedfor two reasons. First, what is required is long-run debt sustainability, not limitson annual deficits. Annual deficits are far too constraining, and a rigid ceiling isfar too demanding. Second, the Stability and Growth Pact includes a procedurewhereby the Council of Ministers can tell individual countries what they shoulddo with their budget deficits and fine them if they fail to heed the recommenda-tions. This is an extremely intrusive approach that threatens sovereignty in a sen-sitive domain. These two flaws have become increasingly visible and have led to acomplete breakdown of the pact, which was “suspended” in November 2003when the council should have initiated the fine procedure against the two largestcountries, France and Germany.
The European experience illustrates both the need for some commitment tofiscal discipline and the need for a sensible procedure to ensure compliance. Sug-gestions for improvement have been advanced by Sapir, Wyplosz, and others.16
They suggest shifting the target away from annual deficits and toward the debtlevel and include various proposals for involving the member states more directly.
What Does the European Experience Tell Us?
This section draws on the European experience to explore possible options forother regions that also feel the need to stabilize their exchange rates.
Sequencing: Where to Go and How to Get There
As noted earlier, there are many ways of stabilizing exchange rates within aregion, ranging from soft managed floats to hard monetary unions. Europe hasclimbed the ladder from soft to hard pegs, using each step to develop institu-tions that were then used to prepare for the next step, but without ever commit-ting to taking the next step.
Europe’s sequencing has very much followed the traditional sequencingapproach initially proposed by McKinnon.17 It first liberalized intraregionaltrade with the creation of the Common Market in 1958, and then graduallyintegrated itself into world trade through a succession of accords under the Gen-eral Agreement on Tariffs and Trade (GATT). It also instituted current accountconvertibility upon launching the Common Market and then very graduallyadopted financial account convertibility, achieving full capital liberalization in
16. See, for example, Sapir (2003) and Wyplosz (2002a).17. See McKinnon (1979).
10101-04_Ch04_Redo.qxd 10/5/06 3:06 PM Page 127

128 charles wyplosz
1990 as part of the Single European Act. Retaining capital controls made it pos-sible to operate the ERM for a decade. Exchange rate agreements started withfixed-but-adjustable exchange rates until capital liberalization forced a choicebetween the two extreme corners, and most countries opted for the monetaryunion corner. Thus Europe followed all the textbook prescriptions, and itworked. The exception is the gap of the 1990s, when full capital mobility was inplace but the monetary union had not yet come to be. This forced the de factosuspension of the ERM through the adoption of very large margins of fluctua-tion, which was a way of upholding the mechanism, at least notionally. Yet thisperiod was accompanied by continuing exchange rate stability (see figure 4-3)for one notable reason: by then the decision to launch the euro had been takenand a firm date had been set. While this latter sequencing was entirely fortu-itous, it is rich with lessons. It establishes the crucial role of expectations inunderpinning exchange rate stability. It also demonstrates the importance ofinstitutions; the 1990s were dedicated to fulfilling the EMU entry conditions,and these visible efforts at convergence provided an anchor, underpinned by thegradual buildup of the Eurosystem.
The European process thus provides a roadmap that is feasible, not onlybecause it has already been followed, but also because it accords well with basicprinciples. Does this mean that monetary union is the only destination andgradualism the only way to get there? Probably not. Southeast Asia is one exam-ple of a region where some degree of exchange rate stability has been achievedsince the 1997–99 crisis through unofficial managed floats. The Chiang MaiInitiative offers some support, but it remains a partial and bilateral effort.
At the other end of the spectrum, can regions immediately jump to a monetaryunion without the intermediate step of a system of fixed and adjustable exchangerates, such as the ERM? In theory, such a leapfrogging strategy is possible. TheEuropean approach of gradualism is not based on economic principles. As aregime change, it can be achieved virtually instantaneously—in fact, it must beachieved instantaneously—and this is how it happened in Europe on January 1,1999. True, that moment was preceded by a long period of mandatory conver-gence, but that was a protection requested by Germany to ensure that the “cultureof price stability” would become sufficiently ingrained that the euro could be asgood as the German mark. This does not have to be the case in other instances,provided that inflation differentials are limited, an issue taken up below.
On the other side, the European principle of gradualism is based on politicaland institutional principles. The process has been one of continuous erosion ofnational sovereignty, brought about through confidence-building steps. A mon-etary union also requires institutions, not just a common central bank—which
10101-04_Ch04_Redo.qxd 10/5/06 3:06 PM Page 128

regional exchange rate arrangements 129
can be put in place reasonably quickly—but also all the accompanying appoint-ment and control mechanisms discussed earlier. In addition, it may take years todesign and print banknotes.
Thus while there is no fundamental economic reason to prevent the adop-tion of a common currency without transiting through an ERM-type agree-ment, the lead time needed to get a monetary union up and running spansyears. This constraint raises the question of what happens along the way, bear-ing in mind that excessive turmoil may jeopardize the whole project. One solu-tion is to quietly build up the required institutions while allowing all futuremember currencies to float freely. If this period is characterized by wide fluctua-tions, it may be difficult to pinpoint the rate at which the disappearing curren-cies will be converted into the new collective currency. The risk is that someconversion rates may result in overvaluation. This would seriously threaten theeventual monetary union, for years of painful deflation might be needed toeliminate the overvaluation. Another solution is a managed float designed toerase wide fluctuations, which would make it possible to test possible conver-sion rates. However, managed floats are never a panacea, for markets are likelyto test the intentions of monetary authorities, which may necessitate heavyinterventions. The best that can be done under such circumstances is to conducttightly coordinated interventions, assuming that large reserve stocks have previ-ously been accumulated. While such interventions are unlikely to succeed, theycan do so if they are supported by an agreement to adopt a common currencyby a clearly established date. A necessary condition for this option to work,however, is that national monetary and fiscal policies be conducted with suffi-cient prudence so as not to undermine the project itself.
In the end, we come back full circle. ERM-type arrangements and Maastricht-style convergence programs are not strictly required to move toward a monetaryunion. Yet, given the unavoidable lead time, the transition period is fraught withpotentially lethal dangers. A key concern is that the choice of conversion ratescan only be based on past behavior, which in turn requires sufficient exchangerate stability during the transition period. In addition, once the monetary unionstarts, inflation rates will have to be broadly similar.18 Given that inflation ratestend to be sticky, inflation convergence needs to be fairly complete before themonetary union is launched in order to avoid overvaluation. Hence a high degreeof coordination is required during the transition period.
18. National inflation rates in a monetary union do not have to be equal. There may be tempo-rary fluctuations related to varying macroeconomic conditions. There may also be trends reflectingdifferent productivity gains (the Balassa-Samuelson phenomenon).
10101-04_Ch04_Redo.qxd 10/5/06 3:06 PM Page 129

130 charles wyplosz
Institutions
Exchange rate arrangements cannot operate in a void. “Light” arrangements,such as loosely coordinated managed floats, can be accommodated without ded-icated institutions, as has been the practice in Southeast Asia. More ambitiousagreements do require institutions. Even light arrangements must be supportedby domestic institutions, a view now well recognized in the literature.19
An obvious characteristic of institutions is that they take time to build and toestablish themselves. In a way, therefore, they are needed before they exist. Theearly buildup of institutions may well be a key factor in the success of Europe’sintegration. The European Commission was set up by the Treaty of Rome in1958, when the Common Market was launched. Its powers and ambitions wereinitially quite limited. Over the years, it has become the advocate for integration,binding together two opposing forces. On the one hand, it embodies the collec-tive interest and the gains from cooperation. On the other hand, it derives itspowers from governments, which represent national interests. This explains itsoften arcane decisionmaking process and many of its shortcomings. The com-mission’s inherent internal contradiction is not often appreciated: its role is tomanage those elements of national sovereignty that have been given up by itsmember states, but it needs approval from those same member states, which areinstinctively loath to relinquish politically sensitive decisionmaking powers. Thefact that the commission exists, and that it has seen the range of its responsibili-ties grow considerably since it was created, cannot be overestimated. Not onlydoes the commission act as the lobby for integration, it also undertakes the back-ground work needed to prepare for further steps. When the time is politicallyripe—which can never be anticipated—everything needed to take the projectforward is readily available in the commission’s drawers. Besides the commission,Europe has built up a vast array of institutions as it has gradually expanded thescope for cooperation beyond economics. Each step is usually characterized bythe same uneasy compromise between integrationist and nationalistic forces. Agood example is the European Parliament, which became the handy, if weak,body to which the ECB is accountable.
Because exchange rate arrangements must involve some reduction in nationalsovereignty, entering into them is never an easy decision, and it is likely to needprodding and technical support. Countries contemplating such arrangementsshould have a budding institution that can study the concepts and propose varioussolutions. It should not have any power, but it should be clearly regional in ori-
19. See, for example, Persson and Tabellini (2000) and Drazen (2000).
10101-04_Ch04_Redo.qxd 10/5/06 3:06 PM Page 130

regional exchange rate arrangements 131
entation from the outset. An advantage is that it would need to report regularlyto the ministers of finance, thus encouraging and framing their deliberations.
The Role of Financial Markets
In the matter of exchange rate arrangements, financial markets are both foes andfriends. They are foes because they are prone to challenge policies wheneverthey detect vulnerability. Some vulnerabilities are the consequence of bad poli-cies, in which case an early warning is not unproductive, even if it is painful.But in a world where self-fulfilling crises feed on intrinsic vulnerabilities, mar-kets can impose excessively high standards of good behavior. When policies arewell designed, however, markets can produce powerful support. A good exampleis the run-up to the monetary union in Europe. When it became clear that Italywould join the EMU, its interest rates quickly converged with those of Ger-many and stayed there (see figure 4-4). Not only did this convergence represent
Percent
2
4
6
8
10
12
14
16
18
Germany
Italy
United Kingdom
Source: IMF.
2000M11998M11996M11994M1
Figure 4-4. Treasury Bill Rates in Europe, 1992–2000
10101-04_Ch04_Redo.qxd 10/5/06 3:06 PM Page 131

132 charles wyplosz
a vote of confidence in the undertaking, but it solidified the link between thelira and the mark until the euro was launched. In contrast, the British rate hasretained a life of its own, reflected in euro-pound exchange rate fluctuations.A further lesson is that the European bond markets have become integrated,thus holding up the promise of a deep and efficient market. This has been abonus to the smaller countries and has provided ex post justification of capitalliberalization.
The implication is that markets ought to be called upon when they can pro-vide support and kept at bay when they can be disruptive. If exchange ratearrangements are of the soft peg variety, they are highly vulnerable to specula-tive pressure. This observation provides a solid case for restraining capital flows.If the decision is to go all the way to a monetary union, the markets can supportthe process, but only if it is well crafted and politically guaranteed. Until thishappens, the markets are likely to spot cracks in design and political will andtear up the project, another argument for imposing restraints.
Finally, is regional financial market integration a substitute for an exchangearrangement? To start with, if some of the national markets are already inte-grated with world markets, regional integration means de facto global integra-tion. As argued earlier, financial market integration sharpens the choice of anexchange rate regime—the hollowing-out hypothesis. Consequently, such amove can either provide impetus for a hard exchange arrangement (monetaryunion) or force free floating. Regions that include countries that are conductinga substantial amount of trade among themselves are unlikely to find a high levelof exchange rate volatility.
Conclusions
Europe has provided the two most accomplished examples of regional exchangerate arrangements: first the ERM and now a monetary union. Are these arrange-ments that should and can be emulated elsewhere? This chapter argues thatsmall open economies that have intensive trade links, or that wish to intensifytrade links, are naturally interested in stabilizing their internal exchange rates. Italso argues that the European approach has followed sound, well-recognizedprinciples. For these reasons, it offers a blueprint that could be adopted in otherregions.
Yet it is not an example that will be easy to follow. The strategy of achieving adeep level of economic integration was built upon much wider objectives thanjust a common market. At the heart of the process has been the desire to put torest centuries of war. Fresh memories of mutual destruction have made it easier
10101-04_Ch04_Redo.qxd 10/5/06 3:06 PM Page 132

regional exchange rate arrangements 133
for Europeans to agree to ever wider transfers of sovereignty, in spite of deter-mined opposition and profound national divergences. Indeed, it is not by chancethat the decision to share a common currency closely followed an exceptionalevent, the collapse of the Berlin Wall.
Another important feature of the European process is that there was never anymaster plan. Integration has always been characterized by a process of muddlingthrough, taking two steps forward and one step back, with deep and lingeringdivergences as to what the end objective should be. But each integration stephas made the next one more likely. Success in one area emboldened politicalleaders to contemplate another even bolder project in another area. More cru-cially perhaps, each important step has been matched by some additional insti-tutional buildup, which has provided the backbone for further moves. It isdifficult to overstate the importance of the early creation of institutions to sup-port the integration process, no matter how imperfect those institutions are.
Another important consideration is that for a significant period many Euro-pean countries have kept capital controls in place in a world where full capitalmobility was the exception, not the rule. When the worldwide process of liber-alization picked up speed, Europe had already moved a long way down the roadof regional exchange rate stability. Given its attachment to and success withexchange rate stability, when forced to choose between a free float and a mone-tary union as the result of its own financial liberalization, the choice was rela-tively straightforward.
The European solution of operating soft pegs for an extended period, whilekeeping the ultimate aim of a monetary union unspecified, requires that capitalcontrols be retained or, in some instances, reestablished. This worked in Europe,and it can work elsewhere as well. But if capital controls are ruled out, the menuof available choices shrinks and becomes polarized. Soft pegs are unlikely to lastvery long, leaving two alternatives: regional floating or a reasonably speedymove to a monetary union. A monetary union requires strong political will,especially in regions that have been hesitant to consider transfers of sovereigntyand have not yet put in place the institutions that will be required to prepare andimplement the necessary steps. These include establishing a regional centralbank, providing for some form of democratic accountability, and adoptingmeasures that will guarantee fiscal discipline. But it seems that it will take excep-tional circumstances to effectively move in that direction.
This is why, after all, a slow process may be more realistic, even if its evolutionmust be measured in generations, not years. The first step in such a process is jointmanagement of exchange rates—either fixed and adjustable pegs backed by capitalcontrols as in the ERM, or joint management of floats. This is why the capital
10101-04_Ch04_Redo.qxd 10/5/06 3:06 PM Page 133

134 charles wyplosz
mobility regime is a key preliminary decision. The role of capital controls remainsan open and controversial issue. It is sometimes claimed that capital controls areno longer feasible in today’s globalized world. This claim is unsubstantiated.Nevertheless, countries that have already liberalized their capital movements,and often paid a high price for it,20 are unlikely to reverse course. At any rate, ifcapital flow liberalization is considered desirable, such a step must be accompa-nied by substantial exchange rate flexibility. In either case, regions that wish tolimit bilateral exchange volatility cannot escape setting up a dedicated institu-tion and establishing ERM-type multilateral agreements of mutual support.
References
Bakker, Age F. P. 1996. The Liberalization of Capital Movements in Europe. Amsterdam:Kluwer Academic.
Baldwin, R. 1997. “The Causes of Regionalism.” World Economy 20, no. 7: 865–88.Calvo, G., and C. Reinhart. 2000. “Fear of Floating.” Quarterly Journal of Economics 117, no. 2:
379–408.Cottarelli, C., G. Galli, P. Marullo Reedtz, and G. Pittaluga. 1986. “Monetary Policy
through Ceilings on Bank Lending.” Economic Policy 3: 673–710.de Grauwe, P. 1988. “Exchange Rate Volatility and the Slowdown in Growth in Internatio-
nal Trade.” IMF Staff Papers 35: 63–84.Drazen, A. 2000. Political Economy in Macroeconomics. Princeton University Press.Eichengreen, B., and C. Wyplosz. 1993. “The Unstable EMS.” Brookings Papers on Economic
Activity 1: 51–124.Feldstein, M. 1997. “The Political Economy of European Monetary Union: Political Reasons
for an Economic Liability.” Journal of Economic Perspectives 11, no. 4: 23–42.Gros, D., and N. Thygesen. 1998. European Monetary Integration. 2nd ed. Harlow, United
Kingdom: Longman.Helliwell, J. F. 1998. How Much Do National Borders Matter? Brookings.Kaminsky, G., and C. Reinhart. 1999. “The Twin Crises: The Causes of Banking and Balance-
of-Payments Problems.” American Economic Review 89, no. 3: 473–500.Kenen, P. B. 1995. Economic and Monetary Union in Europe: Moving beyond Maastricht.
Cambridge University Press.Kenen, P. B., and D. Rodrik. 1986. “Measuring and Analyzing the Effects of Short-Term
Volatility in Real Exchange Rates.” Review of Economics and Statistics 68: 311–19.Levy-Yeyati, E., and F. Sturzenegger. 2002. “Classifying Exchange Rate Regimes: Deeds ver-
sus Words.” Universidad Torcuato di Tello.McKinnon, R. 1979. Money in International Exchange: The Convertible Currency System.
Oxford University Press.
20. There is substantial evidence that financial opening is followed by currency crises. See, forexample, Kaminsky and Reinhart (1999) and Wyplosz (2002b).
10101-04_Ch04_Redo.qxd 10/5/06 3:06 PM Page 134

regional exchange rate arrangements 135
Parsley, D., and S.-J. Wei. 2001. “Limiting Currency Volatility to Stimulate Goods MarketIntegration: A Price-Based Approach.” Working Paper 8468. Cambridge, Mass.: NationalBureau of Economic Research.
Persson, T., and G. Tabellini. 2000. Political Economics: Explaining Economic Policy. MIT Press.Reinhart, C., and K. Rogoff. 2004. “The Modern History of Exchange Rate Arrangements:
A Reinterpretation.” Quarterly Journal of Economics 119, no. 1: 1–48.Rogoff, K. 2002. “Rethinking Capital Controls: When Should We Keep an Open Mind?”
Finance and Development 39, no. 4: 55–56.Rose, A. 2000. “One Money, One Market: Estimating the Effect of Common Currencies on
Trade.” Economic Policy 30: 7–46.Sapir, A., P. Aghion, G. Bertola, M. Hellwig, J. Pisani-Ferry, D. Rosati, J. Viñals, and
H. Wallace. 2003. An Agenda for a Growing Europe. European Commission.Wyplosz, C. 2002a. “Fiscal Discipline in EMU: Rules or Institutions?” Paper prepared for
the Group for Economic Analysis of the European Commission.———. 2002b. “How Risky Is Financial Liberalization in the Developing Countries?” Com-
parative Economic Studies 44, nos. 2–3: 1–26.
10101-04_Ch04_Redo.qxd 10/5/06 3:06 PM Page 135

136
Since its beginning, European integration has been accompanied by the creationof major financial mechanisms. Such mechanisms and the resulting financial
transfers have been seen as both an economic and a political condition for makingeconomic integration effective and equitable. These mechanisms have includedgrants (through the Structural Funds), loans (mainly through the European Invest-ment Bank), and most recently, guarantees (European Investment Fund).
These financial mechanisms have had two major aims: (1) reducing incomedifferentials between countries and regions within the European Community(and later the European Union), particularly those resulting from trade liberal-ization, and (2) allocating major financial resources to facilitate the functioningof an increasingly integrated market, for example by financing interconnectionof national networks in transport and telecommunications. While other aimshave later been added, these two remain central.
It is important to stress that very large—and growing—resources have beenallocated in Europe consistently for these aims. To an important extent this
European Financial Institutions: A UsefulInspiration for Developing Countries?stephany griffith-jones, alfred steinherr, and ana teresa fuzzo de lima
5
The authors would like to thank José Antonio Ocampo for very valuable suggestions for thispaper. We are very grateful to Peter Holmes for his insights on the role of structural funds inEuropean convergence.
10101-05_Ch05_Redo.qxd 10/5/06 3:06 PM Page 136

european financial institutions 137
dynamic has been driven by the relatively poorer countries, which during thenegotiations over their joining the European Community have put as a precon-dition the creation, or sharp increase, of grants and loans. The first such casewas when Italy—before joining the European Economic Community in themid-1950s—pressed for the creation of the European Investment Bank, largelyto help fund infrastructure in the poorer southern part of Italy. Similarly, whenother countries joined, the Structural Funds and the Cohesion Fund were cre-ated to address their needs. More recently, pre-accession funds have been put inplace to prepare transition economies for joining.
This chapter focuses mainly on the experience of the European InvestmentBank (EIB), a bank that lends far more than the World Bank. However, wefirst analyze the broader context of fiscal (grants) mechanisms linked to Euro-pean integration. We outline their historical evolution, describe their rationaleand main features, and highlight their scale. As we discuss, fiscal transfers viathe structural funds have represented very high proportions of the GDP ofpoorer countries (between 3 and 4 percent of GDP for Portugal and Greeceduring the 1990s). In the 1990s an interesting innovation was introduced: sig-nificant fiscal transfers were made to Eastern European countries before theyjoined the European Union (EU), via special mechanisms. Thus significantresources (both loans and grants) have been transferred recently even duringpre-accession periods.
The next section is dedicated to the EIB, which was created to help achievethe goal of economic convergence. In the bank’s early stages, capital marketswere incomplete and underdeveloped, so there was a strong case, both theoreti-cally and politically, for dealing with such market imperfections through thecreation of a public bank. Another interesting feature of the evolution of theEIB is its relatively low level of lending in the initial phase (first decade), withvery large increases afterward. This section concludes by outlining key policyissues at the EIB today.
In developing countries, particularly the relatively poorer ones, where marketimperfections still prevail, especially in capital and credit markets for long-termfinance, the role of regional public banks in integration processes is probablymore similar to that of the EIB in its early stages—that is, explicitly supporting,via loans, a regionally integrated infrastructure and providing assistance topoorer regions. Nonetheless, the issue of greater focus on mechanisms such asguarantees and other risk-bearing instruments, rather than on pure loans, alsohas increasing relevance for integration among developing countries. In the finalanalysis, the central lesson from the EIB experience is the importance of a largeand dynamic public bank to support integration and convergence processes.
10101-05_Ch05_Redo.qxd 10/5/06 3:06 PM Page 137

1. See Griffith-Jones, Kimmis, and Fuzzo de Lima (2003).2. See Griffith-Jones, Stevens, and Georgiadis (1992) and Griffith-Jones, Kimmis, and Fuzzo
de Lima (2003).
Fiscal Transfers within the European Union
The original broad European aim was to reduce disparities between regions byproviding large-scale funding. In the late 1980s, a narrower rationale wasadopted.1 The European Community would not take responsibility for address-ing those disparities that predated its existence, but it was necessary to find ameans by which additional disparities that might be created in poorer regions bytrade liberalization would be compensated financially. The political goal was tomaintain support for the integration process in poorer countries.
European regional policy has developed gradually, influenced by successiveperiods of deepening and widening of the European Union. The major stagesand the financing mechanisms created are outlined in table 5-1.
Funds for Equitable Development
In the preamble to the Treaty of Rome, which created the European EconomicCommunity (EEC) in 1957, the member countries explicitly called for ensuring“harmonious development by reducing the differences existing between the var-ious regions and the backwardness of the less favored regions.” In keeping withthis clear objective and with the underlying vision that financial transfers areboth a political and an economic condition for making economic integrationeffective and equitable, from its inception the European Community createdmajor financial mechanisms, including both loans and grants.
These major institutional mechanisms created in the EEC responded towidely accepted studies in economics that have shown that trade liberalizationcontributes, via economies of scale and other mechanisms, to more rapidgrowth overall, but owing to inherent asymmetries also leads to relatively lessrapid growth (or even decline) in relatively poorer areas.2 Besides creating mech-anisms to reduce potentially growing inequalities between regions and countriesas a result of trade liberalization, from the start the EEC allocated major financialresources to interconnect national networks (in transport and telecommunica-tions, in particular) and to facilitate the functioning of an increasingly inte-grated market. Broader aims, such as educational and cultural exchanges andimprovements in the environment, have also been funded.
The European Investment Bank was created at the same time as the EEC tofurther the objectives of harmonious development and compensation of lessfavored regions. It committed a high proportion of its loans to finance infra-
138 s. griffith-jones, a. steinherr, and a. t. fuzzo de lima
10101-05_Ch05_Redo.qxd 10/5/06 3:06 PM Page 138

european financial institutions 139
Table 5-1. Development of European Union Regional Policyand Main Financing Mechanisms
Year Context Main events
1957–75
1975–85
1985–93
1993–2000
The preamble to the Treatyof Rome refers to the need“to strengthen the unity oftheir [the countries of theEuropean Community]economies and to ensuretheir harmoniousdevelopment by reducingthe differences existingbetween the variousregions and thebackwardness of the lessfavored regions.”
The northern enlargement of the European Unionincreases regional imbal-ances. The UnitedKingdom lobbies for anEU regional policy in itsaccession negotiations.
The introduction of theSingle European Act,together with furtherenlargement involvingthree less-developedcountries—Greece in1981, and Spain andPortugal in 1986—provides further impetusfor EU regional policy.
The Treaty on EuropeanUnion, which comes intoforce in 1993, designatescohesion as one of themain objectives of theunion, alongsideeconomic and monetaryunion and the singlemarket.
1958: The European Investment Bank is set upunder the Treaty of Rome to provide long-term loans in support of Europeanintegration. A key objective of the EIB is tostrengthen the economically weakerregions.
1958: The two sector-based Structural Funds,the European Social Fund (ESF) and theEuropean Agricultural Guidance andGuarantee Fund (EAGGF), are established.
1975: The European Regional DevelopmentFund (ERDF) is created to redistribute partof the member states’ budget contributionsto the poorest regions.
1986: The Single European Act lays the basisfor a genuine cohesion policy designed tooffset the burden of the single market forsouthern countries and other less favoredregions.
1989–93: The European Council in Brusselsin February 1988 overhauls the operationof the Structural Funds and doubles theresources allocated to them.
1993: The Cohesion Fund is created to supportprojects in the fields of the environmentand transport in the least prosperousmember states. Alongside the StructuralFunds, a new Financial Instrument forFisheries Guidance (FIFG) is created.
In 1994, the European Investment Fund iscreated to provide guarantees forinfrastructure and investment in small andmedium-sized enterprises (SMEs).
(continued)
10101-05_Ch05_Redo.qxd 10/5/06 3:06 PM Page 139

structure in poorer regions and countries. Italy, where there was much povertyin the south, played a key role in pressing for the bank’s creation.
Several Structural Funds were created to provide grants for poorer regionsand specific sectors (especially agriculture). The three funds created initiallywere the European Social Fund, the European Agriculture Guidance and Guar-antee Fund (the basis for the Common Agricultural Policy), and the EuropeanRegional Development Fund. An additional large fund, the Cohesion Fund,was created when Portugal and Spain joined, as a result of pressure from thenew members, particularly Spain.
In 1989, when the Berlin Wall fell and the transition to the market anddemocracy began in Central and Eastern Europe (CEE), the then EuropeanCommunity quickly created fairly generous mechanisms to support the CEEcountries’ transition to the market. The transfer of know-how was consideredjust as important as the financial assistance provided, if not more so. The previ-ously existing European Investment Bank lent on an important scale to these
140 s. griffith-jones, a. steinherr, and a. t. fuzzo de lima
2000–06
Source: Information compiled by the authors.
Table 5-1. (continued)
Year Context Main events
In 1993, the CopenhagenEuropean Council invitesthe central Europeancountries to apply formembership in theEuropean Union. Thepresent enlargementprocess is launched in1997.
The future enlargement ofthe European Union,with the addition of tencentral Europeancountries, will increase thedemands on the EUbudget for cohesion.
The PHARE Program, set up in 1989 toprovide support to the countries of centralEurope during transition, is reoriented in1993. From 1997, PHARE becomes totallyfocused on pre-accession assistance,becoming the first of three pre-accessioninstruments.
1999: The Structural Funds and theCohesion Fund are reformed.
The Instrument for Structural Policies for Pre-accession (ISPA) and the SpecialAccession Program for Agriculture and RuralDevelopment (SAPARD) complement the PHARE Program to promote theeconomic and social development ofapplicant countries in central Europe.
In 2000, the European Investment Fundbecomes part of the EIB, focusing onventure capital and guarantees forinstitutions financing SMEs.
10101-05_Ch05_Redo.qxd 10/5/06 3:06 PM Page 140

countries, and a new development bank, the European Bank for Reconstructionand Development (EBRD), was established in support of the transition. In spiteof its name, the EBRD does not respond solely to European interests; its boardof directors comprises both European and other members—Japan, the UnitedStates, and others—and in the years after its creation it lent not only to theEuropean region but also to the former Soviet Union. The EBRD is thus differ-ent from the EIB, which was established as, and remains, a European bank.
In 1997 the Council of the European Union officially launched the currentround of European Union enlargement, with ten countries from Central andEastern Europe negotiating accession. To assist the accession process, the finan-cial instruments and mechanisms previously used to support transition to themarket in those countries were transformed fairly easily and seamlessly intomechanisms for preparing them for integration into the European Single Market,which is a significantly more advanced stage of trade integration than a free-tradearea. Moreover, during the 1990s, pre-accession funding became far larger thanin the past, and its aims became more ambitious, focusing particularly on coun-tries preparing to integrate effectively into the single market while also providingresources for poorer regions and people, as well as supporting cross-border com-munications. Post-accession funding will become slightly less generous than inthe past (especially for agriculture), but will still be large.
Since their creation, the Structural Funds and the Cohesion Fund have beenthe main instruments of social and economic cohesion policy in the EuropeanUnion. Through the four Structural Funds, the European Union grants finan-cial assistance to resolve structural, economic, and social problems.3 The Struc-tural Funds underwent major reform in 1988 and again in 1993 when theCohesion Fund was introduced.
Since the 1988 reforms, European Union structural policy has become evenmore significant in financial terms. By 1999 the Structural Funds and the Cohe-sion Fund together accounted for around one-third of the budget for EU policiesand amounted to some 0.5 percent of the EU’s GDP. Such funding representedvery high proportions of the GDP of the poorer countries: almost 4 percent forPortugal and Greece (see table 5-2).
To put this in perspective, the Marshall Plan for the reconstruction of post-war Europe was equivalent to around 1 percent of the annual GDP of theUnited States and contributed an average of 2 percent of the European annualGDP over the period 1948–51. EU structural intervention is lower per year, at
european financial institutions 141
3. The four Structural Funds are the European Regional Development Fund (ERDF), theEuropean Social Fund (ESF), the European Agriculture Guidance and Guarantee Fund (EAGGF),and the Financial Instrument for Fisheries Guidance (FIFG).
10101-05_Ch05_Redo.qxd 10/5/06 3:06 PM Page 141

4. European Commission, Annual Report on the Structural Funds (2000).
around 0.5 percent of GDP, but is far higher in cumulative terms, since it hasrepresented a long-term commitment for a large number of years.
There has been a dramatic increase in the level of funding available throughthe Structural Funds over the past forty years. In 1961, about 78.6 million wasallocated through these funds. This figure had risen to 711.8 million by 1971.Total EU expenditure on the Structural Funds had reached nearly 714 billionby 1991 and some 732 billion by 2001.4
In terms of the distribution of funds, table 5-2 shows that between 1989 and1993 the five recipients of the largest share of Structural Fund financing wereSpain (21 percent), Italy (17 percent), Portugal (13 percent), Greece (12 percent),
142 s. griffith-jones, a. steinherr, and a. t. fuzzo de lima
Table 5-2. European Union Structural Funds, 1989–1993, and Structural Fundsand Cohesion Fund, 1994–1999Millions of ECUsa
1989–93(millions of 1994–99ECUs and (millions of ECUspercent of 1989–93 and percent of 1994–99
Country or region EU-12) (percent of GDP)b EU-15) (percent of GDP)c
Belgium 740 (1.2) 0.11 1,808 (1.3) 0.18Denmark 402 (0.6) 0.08 741 (0.5) 0.11Germany 6,015 (9.5) 0.13 19,519 (14.1) 0.21Greece 7,528 (11.9) 2.65 13,980 (10.1) 3.67Spain 13,100 (20.8) 0.75 31,668 (22.9) 1.74France 5,907 (9.4) 0.14 13,334 (9.6) 0.22Ireland 4,460 (7.1) 2.66 5,620 (4.1) 2.82Italy 10,753 (17.1) 0.27 19,752 (14.3) 0.42Luxembourg 55 (0.1) 0.17 83 (0.1) 0.15Netherlands 725 (1.1) 0.07 2,194 (1.6) 0.15Portugal 8,450 (13.4) 3.07 13,980 (10.1) 3.98United Kingdom 4,816 (7.6) 0.13 11,409 (8.2) 0.25EU-12 62,951 (100) 0.29Austria 1,432 (1.0) 0.19Finland 1,503 (1.1) 0.40Sweden 1,178 (0.8) 0.37EU-15 138,201 (100) 0.51
Source: European Commission.a. ECU: European currency unit.b. Based on annual average Structural Fund totals, and on average GDP in the period 1989–93.c. Based on annual average Structural Fund totals, and on GDP in 1994.
10101-05_Ch05_Redo.qxd 10/5/06 3:06 PM Page 142

5. See Milanovic (2002).6. Ben-David (1996); Ben-David and Kimhi (2000).7. See EU (2004) and, for example, Solanes (2001).
european financial institutions 143
and Germany (9 percent). In the later 1994–99 period, for which the figuresinclude financing from the Cohesion Fund, the major recipients were again Spain(23 percent), Italy (14 percent), Germany (14 percent), Portugal (10 percent),and Greece (10 percent). Table 5-2 also indicates the importance of these funds tothe economies of the recipient countries by showing the annualized fundingreceived as a proportion of their GDP. In both periods, EU structural fundingrepresented a significant proportion of GDP for Portugal, Greece, Ireland, andSpain. In 1994–99 Structural Funds accounted for 4.0 percent of GDP for Portu-gal, 3.7 percent for Greece, 2.8 percent for Ireland, and 1.7 percent for Spain.
In the case of poorer countries such as Portugal and Spain, where time allowsfor more precise measurement of outcomes, the impact of post-accession EUfunds has been broadly positive, especially in contributing to convergence withaverage European income per capita; it can also be seen in physical develop-ments, such as the increase in new road and rail links, particularly those con-necting with other European states. These advances have greatly facilitated boththe integration of trade and integration in the broader sense.
There does remain some debate about the exact contribution made by theStructural Funds as opposed to that of the overall process of integration. Recentstudies have shown a positive trend toward convergence between richer andpoorer states of the European Union (unlike in other regions of the world),5
and there can be little doubt that the integration process has played a significantpart.6 First Italy, then the poorest states in the EU-15 (Spain, Greece, Portugal,and Ireland) all saw a process of catching up. Ireland came from behind to anabove-average position in income per head.
There is a little more debate about the specific contribution made by theStructural Funds themselves. Work by the European Commission and by sev-eral academics on country convergence has supported the view that the Struc-tural Funds have played an important role.7 It is certainly the case that forsmaller poorer countries the receipt of up to 4 percent of GNP in financialtransfers can make a substantial difference. In the Irish case, it is widely believedthat these funds were well used and that they contributed to the emergence ofIreland as a high-tech economy. The convergence that has occurred within theEU has been a convergence of national levels of income per head, while withincountries there has been something of a divergence between richer and poorerregions in relative terms. In Greece, Portugal, and Spain, it is the richer regionsthat have caught up the fastest with the rest of the European Union.
10101-05_Ch05_Redo.qxd 10/5/06 3:06 PM Page 143

144 s. griffith-jones, a. steinherr, and a. t. fuzzo de lima
The broad conclusion of analysts is that while EU funds seem to have had apositive effect at the country level, the results at the regional level have beenmore nuanced.8 The evidence is consistent with the view that EU funds havemade a positive impact on growth where the policy environment is favorable.The extreme example of this, of course, has been Ireland. The Greek experience,in contrast, to some extent indicates the limitations of transfers when absorptivecapacity is insufficient.9
The European Commission, meanwhile, in its latest (2004) Cohesion Report,finds evidence that since 1988 the “Objective 1 regions”—those entitled tomaximum EU regional support—have been growing faster. A simple regressionof growth by region against receipt of EU funds does indeed show a positivecorrelation, but the association is weak, implying that other factors need tointeract with the funds themselves. It can be concluded that there is evidencethat structural funds have had a positive impact on the growth of poorer coun-tries. However, the nature of the link is complex.
Unfortunately, neither the European Commission nor the authorities thathave received such assistance have formally evaluated the effectiveness of differ-ent pre-accession instruments. Our analysis, interviews, and experience suggestthat a structural program such as the pre-accession financing program offered tothe Central and Eastern European countries is far superior to the more ad hoc,substantially lower pre-accession financing provided to Portugal. (Spain had nopre-accession grants, though it had pre-accession EIB loans.) However, theeffort needed to achieve successful integration into Europe was also smaller forSpain and Portugal than it was for the CEE countries. This was because Euro-pean integration had progressed significantly further when the CEE countriesjoined than when Spain and Portugal joined, owing especially to the creation in1992 of the Single European Market. The accession funding for countries suchas Portugal and Spain was focused mainly on the original aims of EU funding:redistribute to facilitate convergence and support investment, especially in infra-structure, to help European integration. However, a fairly dominant additionalaim of pre-accession funding to the CEE countries was linked to the vast effortof harmonization of regulations and standards to meet EU norms (broadlycalled the Acquis Communtaire) so as to join a well-advanced single market.
Given their larger scale and their greater flexibility, EIB loans are an extremelyvaluable part of the pre-accession package in areas such as infrastructure, smalland medium-sized enterprises (SMEs), and others. In both Spain and Portugal, as
8. See Funck and Pizzati (2003).9. See EIB (2000).
10101-05_Ch05_Redo.qxd 10/5/06 3:06 PM Page 144

european financial institutions 145
well as in the Central and Eastern European countries, EIB loans were disbursedmore easily and in a more streamlined way than grants.
Lessons Learned for Other Regional Integration Experiences
Financial mechanisms for accession can contribute to convergence between richand poor countries and regions if they are both adequately funded and effective.The scale and coverage of the financing mechanisms used by the EuropeanUnion to aid countries before and after accession has been extensive. EuropeanUnion grant financing and EIB loans have together represented a meaningfulproportion of each country’s GDP and total investment. Added to this, thebudget figures for EU Structural Funds do not immediately convey their signifi-cance for the economically weaker areas of the EU. As resource transfers are veryheavily concentrated in the poorer areas, where economic activity is relativelylow, they are of considerable size. Also, as Structural Fund allocations are basedon the principle of cofinancing, with individual member states contributingresources to supplement the EU funding, they can act as a catalyst for higherlevels of resource transfers to poorer regions. Naturally, the scale of resourcesmade available through grants in the European case has been linked to the abil-ity and willingness of the richer countries in the EU—particularly Germany inthe initial phases—to make such resources available.
Policies designed to improve economic and social cohesion among memberstates are also very important in political terms. First, they help to unite membercountries around a common goal. In the European context, for example, there hasalways been a strong sense of a European model of society, comprising elementssuch as a social market economy, free trade, democratic systems, and social cohe-sion. The financial mechanisms to support regional integration in the EuropeanUnion are very much rooted in a desire to uphold this model of society. Second,cohesion policies are important in order to maintain the support of poorer andweaker states and regions for trade integration. Indeed, Portugal and Spain havebeen among the most steadfast supporters of the European integration process.Though the level of enthusiasm for integration may be somewhat lower at presentin regional groupings in developing countries, or in the proposed Free Trade Areaof the Americas, even free-trade areas require sustained political support.
A general lesson from early and later entrants seems to be that financial assis-tance works better the more decentralized the decisions are. Decentralized deci-sions (both in countries and in regions) not only are more efficient and makethe best use of local knowledge and experience; they can also play an importantrole in fostering institutional development. Greater effectiveness and agility arealso supported by the EIB, which has opened offices in member countries, and
10101-05_Ch05_Redo.qxd 10/5/06 3:06 PM Page 145

146 s. griffith-jones, a. steinherr, and a. t. fuzzo de lima
by the European Commission country offices, which have been given greaterautonomy to approve programs without involving Brussels.
Though the European experience shows that it is valuable to provide supportin a number of dimensions, the experience in different countries, from Portugalto the Czech Republic, suggests that effectiveness improves with a focus on afairly limited number of programs linked to the priorities defined in the tradeintegration program. As Devlin and colleagues point out, a limited numberof programs—together with other factors such as clear objectives and workprograms—helps make cooperation successful.10 Problems of absorptive capacity,especially in smaller countries, can more easily be overcome if assistance is nar-rowly focused and specific, because this facilitates provision of sufficient financeand technical assistance that can help overcome problems of implementation.
The EU Structural Funds were initially universal, although they were heavilyconcentrated on poorer nations and regions (including poorer regions in richercountries). Later, a targeted fund—the Cohesion Fund—was created to providefinancing for environment and infrastructure projects in the poorer countries only.
Infrastructure integration has received a great deal of priority and funding.However, other areas (such as educational and cultural exchanges, research, integra-tion, and environmental improvements) have also been funded, as European inte-gration is seen as being broader than purely trade or even economic integration.
The European Investment Bank
The 1957 Treaty of Rome, which created the European Economic Community,contained several provisions for the creation of instruments that could con-tribute to “harmonious development” and the reduction of regional disparities.The European Investment Bank, one of the most powerful of those instru-ments, was established by the treaty “to contribute to the balanced and smoothdevelopment of the Common Market in the interest of the Community.” TheEIB was intended as a source of relatively low interest loans and guarantees thatwould facilitate the financing of: “(a) projects for developing less developedregions; (b) projects for modernizing or converting undertakings or for develop-ing fresh activities called for by the progressive establishment of the commonmarket; (c) projects of common interest to several Member States, which are ofsuch size or nature that they cannot be entirely financed by the various meansavailable in the individual Member States.”11
10. Devlin, Estevadeordal, and Krivonos (2002).11. Treaty of Rome, Article 130.
10101-05_Ch05_Redo.qxd 10/5/06 3:06 PM Page 146

european financial institutions 147
The EIB was created, therefore, as a bank to support the European integra-tion process. Its three objectives reflected three major concerns expressed duringthe negotiation of the Treaty of Rome. The first was to help reduce the gulfbetween relatively prosperous and relatively poorer regions. This concern alsoreflected the fear that, if not compensated for, European integration couldincrease imbalances. In the treaty negotiations, the Italian government pressedstrongly for the creation of the EIB, precisely for this purpose; according tosome sources, the creation of the EIB and its concentration on lending to south-ern Italy were a precondition for Italy to join the EEC. The second major con-cern was to help “senile industries,” or areas where such industries were dominant,that were not able to compete on their own and required support to modernize,convert, or develop new activities. The third concern was the need to financeinvestment that would help to integrate the European economies and that wouldapply to several member states or to the EEC as a whole, particularly in thearea of cross-frontier communications (especially transport). This concern wasrelated to the fact that much of the existing infrastructure at the time was gearedtoward meeting domestic needs; the creation of the EEC led to new cross-border needs. It is noteworthy that these three aspects (possibly in somewhatdifferent proportions) could also be central supportive measures in other inte-gration processes.
Because currencies in the mid-1950s were still not fully convertible and capi-tal markets were underdeveloped, there was a strong case, both theoretically andpolitically, for dealing with these market imperfections through the creation of apublic bank. The main mission of this bank would be to assist in channeling sav-ings from the more developed parts of the EEC to the less developed parts(regional development). At the same time it was recognized that a customs unionwas needed to complete and transform an essentially juxtaposed national infra-structure into an integrated European infrastructure (European integration).
The European Commission was given responsibility for making funds avail-able on a grant basis to assist lagging regions. As there was a limited supply ofgrant money, and as it was felt that for many projects the problem was not lackof returns but financial constraints, it made sense to complement grant facilitieswith loans. This was the job given to the EIB.
The Institutional Setup
The EIB is an international nonprofit organization with headquarters in Lux-embourg. Its shareholders are the member countries of the European Union.The bank is designed as the Hausbank of the European Union. As such, itreceives its strategic lending mission (what type of lending, in which parts of the
10101-05_Ch05_Redo.qxd 10/5/06 3:06 PM Page 147

148 s. griffith-jones, a. steinherr, and a. t. fuzzo de lima
outside world) from its Board of Governors after discussion in the EcofinCouncil. It follows the policies set by the European Commission and ensuresthat the projects it finances respect European guidelines (European environ-mental guidelines, for example). The EIB follows a division of labor with thecommission (for example on economic forecasts) and with other internationalorganizations such as the World Bank and the International Monetary Fund(IMF). Its own policy analysis is therefore very limited. The EIB does not sys-tematically make sectoral policy analyses (a World Bank or European Commis-sion job) or macro policy analyses (an IMF or European Commission job), andtherefore abstains from making policy recommendations.
As a result, the EIB has a very lean staff (some 1,200 in 2004) and lowexpenses in relation to loan volume. Its activity is focused on the EuropeanUnion (close to 90 percent of outstanding loans), although over time it hasincreasingly been asked also to operate outside the EU.
The EIB was set up in 1957 with subscribed capital of 71 billion. After its lastcapital increase and before enlargement on May 1, 2004, its subscribed capitalstood at 7150 billion and its paid-in capital at 77.5 billion. Reserves stood at718.5 billion, bringing its funds up to 725.9 billion. After enlargement on May1, 2004, subscriptions of new members increased the total to 7163.6 billion.Each member state’s share in the bank’s capital is calculated in accordance withits economic weight within the EU (expressed in GDP) at the time of accession.
Lending and Pricing Policies
The EIB’s lending has been limited to financing projects. Recent developmentscreate more flexibility. The focus on project lending excludes trade financing orprogram financing, such as balance-of-payments support, poverty reduction,sector reforms, and the like.12 In general, the bank lends up to 50 percent of theproject cost, and often provides as little as one-third of the total fundingrequired. This implies that the multiplier effect on recipient economies isincreased. Sometimes, at the request of political authorities in the country con-cerned, this limit is increased to 75 percent to speed up financial support duringdownturns of the business cycle or to respond to other priorities. This intro-duces an interesting explicit element of countercyclicality in the lending opera-tions of the EIB that should help support economic activity—especiallyinvestment—in periods of economic downturn.
12. Member states have national vehicles to provide and commercial banks to carry out tradefinancing. In less developed areas this may not be the case. For this reason, the main financial mis-sion of the Black Sea Trade and Development Bank (BSTDB), for example, is trade financing.
10101-05_Ch05_Redo.qxd 10/5/06 3:06 PM Page 148

european financial institutions 149
For a project to receive EIB financial support it must first be eligible. Thismeans it must fall into one of the categories of projects to which the banklends. Then it must satisfy the bank’s exacting borrower quality standards. Ifthe borrower is not a government, it must provide adequate guarantees. Inaddition to the quality conditions to be satisfied by the borrower, the projectmust be financially and economically sound. Since the main objective of thebank is to contribute to the European Community’s economic performance(regional development, European infrastructure, high environmental standards,European competitiveness, and energy security), the project must be financiallysound and must have a high social return. This social return (the internal rate ofreturn augmented by externalities such as employment creation) is always diffi-cult to assess, leaving scope for political desiderata. The bank’s Board of Direc-tors is the arbitration court for such matters.
To assess a project’s social return and conformity to EU policies (such as inter-national competitive bidding and environmental standards), it is evaluated by ateam of lending officers, economists, and engineers. For less sophisticated borrow-ers, this evaluation can lead to project modification and improvement. The scopefor such enhancements is obviously limited for projects put forward by sophisti-cated corporations. The technical and economic evaluation of projects of reputedcorporations in the European Union is therefore much more limited.
In its lending activity the bank needs to observe subsidiarity. This means, inprinciple, that the bank lends to projects only when there are no other meansavailable. This is a sound theoretical principle but a difficult one to make opera-tional. At some price other funds tend to become available to solid borrowers,who are the borrowers to whom the bank currently tends to lend. But if sub-sidiarity has to be assessed on the basis of the alternative financing cost, what isthe cutoff spread? In current practice, borrowers make the decision. If thebank’s offer is more favorable in terms of cost than the alternatives, borrowersrequest a bank loan, and the bank’s more favorable offer contributes to the suc-cess of the project. It might be more efficient if the EIB were to define a bench-mark (which would naturally be adjusted over time) that would indicate theminimum cutoff spread over alternative funding for which the EIB would lend.While subsidiarity is a difficult issue to deal with, the EIB attaches great value tocooperating closely with banks and other financial institutions.
The EIB is a not-for-profit institution and therefore prices its loans with theaim only of covering costs. Given its very high degree of financial solidity, itenjoys a triple-A rating. It therefore borrows at the best terms, with only a slightspread over triple-A-rated government debt. A markup is added to this cost offunding to cover administrative costs. Given the high lending volume per
10101-05_Ch05_Redo.qxd 10/5/06 3:06 PM Page 149

150 s. griffith-jones, a. steinherr, and a. t. fuzzo de lima
employee (personnel costs account for 80 percent of total administrative costs),these costs are small. In line with the increase in outstanding loans per employee,the cost-covering markup declined to 15 basis points in the early 1990s.
The markup calculation was then changed to reflect more directly costsincurred per project. A major problem is that the administrative cost is concen-trated on origination and therefore not related to loan maturity. Hence it wouldbe best to compute a single up-front fee. For a variety of reasons, however, amarkup embodied in the interest rate is preferred, and a modulation of themarkup for very long maturities has therefore been introduced. The administra-tive cost of a 71 billion loan is not a hundred times the administrative cost of a710 million loan. Repeat loans also generate lower costs. Modulation now gen-erates markups in the range of 5 to 15 basis points. The combination of a lowfinancial cost with a very low administrative markup means that the bank’slending conditions are extremely attractive for borrowers, even when comparedwith those of other international financial institutions such as the World Bankor the EBRD.
As this description of EIB pricing makes clear, there is no explicit subsidy inEIB lending. Rather, the strong financial backing of the bank minimizes thecost of resources to the bank, an advantage passed on to customers. There is,however, an implicit subsidy. All members of the European Union are treated asequal. Therefore, lending to governments is priced equally, without a risk pre-mium and independent of country ratings. These ratings vary in the EuropeanUnion from triple-B to triple-A. Borrowers outside the European Union benefitfrom an EU guarantee, since the EIB is carrying out lending outside the EU onthe basis of an EU mandate. Accordingly, the EIB does not charge a risk pre-mium, and borrowers receive a de facto subsidy provided by the European Union.
The Rationale
Market imperfections. A public sector bank finds the justification for its existencein market imperfections.13 When the bank was created, the major marketimperfections were capital controls, a little-developed and segmented capitalmarket, and uneven development of the banking sector across the EuropeanCommunity. Indeed, it could be argued that markets were incomplete or evenmissing for longer-term funding in the relatively poorer countries of the EC—first the south of Italy; then new entrants such as Greece, Ireland, and Portugal;and more recently, the new accession countries in Central and Eastern Europe.What are the justifications today?
13. For more discussion, see Stiglitz (1998).
10101-05_Ch05_Redo.qxd 10/5/06 3:06 PM Page 150

european financial institutions 151
Except for rated borrowers, the market is still characterized by pronouncedmarket imperfections arising from information asymmetries. Asymmetric infor-mation arises because one party to the contract (the borrower) has more andbetter information than the other party (the lender or investor). Asymmetricinformation leads to two problems in the financial system: adverse selection andmoral hazard.
The asymmetric information problem illustrates that the provision of reliableinformation is crucial to the ability of financial markets to perform their functionefficiently and to distinguish good from bad credit risks. One solution to theasymmetric information problem is for a lender to collect the necessary informa-tion to screen and monitor investments. This is what banks usually do when theyestablish a long-lasting and, ideally, exclusive (from the banks’ point of view)relationship with a close customer. But in general, there are two barriers to infor-mation collection. The first is its cost, particularly when more than one lender ispotentially or actively involved. The second problem is the free rider problem—that is, the fact that investors who do not spend resources on collecting informa-tion can still take advantage of information that other institutions have collected.If bank A lends to a firm, it gives a signal to other potential lenders that it hascollected information that it finds satisfactory. The value of this signal that dis-seminates information to the market is positively correlated with the reputationof bank A and becomes a “public good.” This provides incentives to free riding.
One solution to the problem of asymmetric information is for a public bank toincur the cost of information collection. The EIB does this and acts as a “delegatedmonitor.”14 It carries out a very detailed evaluation of projects, going beyond thetypical analysis of a commercial bank, and then monitors the loan carefully.Because the bank has established a high reputation as a careful evaluator and as aconservative bank with an excellent track record (very few EIB loans have experi-enced difficulties), the value of the signal sent when it approves a loan is high. Thebank finances only part of a project, but its participation is a signal to free ridingbanks that they may confidently finance the remainder of the capital needs.
The project focus of EIB lending diminishes the moral hazard somewhat.Monitoring in such cases is easier than with a general loan to a company, sincediversion of funds to other uses with higher risk is more limited. Moreover, alarge part of bank lending is carried out with repeat borrowers that value accessto EIB funding.
It could be argued that the role of the EIB could be further strengthened if it lent more to riskier borrowers. In the future, the EIB might be induced by
14. Leland and Pyle (1977).
10101-05_Ch05_Redo.qxd 10/5/06 3:06 PM Page 151

152 s. griffith-jones, a. steinherr, and a. t. fuzzo de lima
market forces to shift a larger part of its operations from providing funds with-out assuming risks (it currently requires guarantees, which means that the guar-antors bear the risks) to operations in which the EIB would assume more of therisks (for example, via guarantees) and private lenders would provide the loans.
In fact, the EIB has already started making this shift through the creation ofthe European Investment Fund (EIF), of which the EIB is the largest share-holder. The EIF provides guarantees, takes equity participation, and supportsventure capital funds, thus taking on this new role of assuming risk. Interestinglessons may exist here for regional banks’ lending to developing economies.
Completing the market: long-term funding and support for national marketdevelopment. The EIB lends to the public and private sectors. During the firstdecades of its operations, its lending was heavily concentrated in the public sec-tor, which at that time was almost exclusively responsible for infrastructure proj-ects in many countries. Such projects are highly capital-intensive and requirelong periods of financing. The bank was designed as a long-term lending insti-tution because market imperfections have been most pronounced in that seg-ment. Since its creation, the bank has made loans with maturities of up to thirtyyears, depending on project needs. Over time, as capital markets have developedand the expertise needed to finance infrastructure has evolved and spread, theprivate sector has gained importance.
The bank lends in any convertible currency requested by customers. It lendsat fixed rates for the life of a loan, at variable rates, or with options for resettingor conversion of lending conditions. EIB loans also benefit from a grace periodfor gradual repayment, which is normally three years, but may be more if theproject profile makes a longer grace period desirable.
Because few banks lend for long maturities at fixed rates, the bank hasacquired a unique reputation for fixed-rate long-term lending.15 The socialvalue of fixed-nominal-rate lending is, however, debatable. Simulations carriedout by bank staff suggest that it would have been cheaper in the long run forborrowers to have borrowed from the EIB at variable interest rates than at fixedrates. Fixed interest rates do have the advantage of providing stable payments.However, this is valid only for nominal interest payments; in contrast, sincevariable interest rates tend to be more closely correlated with inflation, variableinterest rates might actually generate more stable real interest payments.
An interesting and positive side-product of the EIB has been its contributionto the development of bond markets in local currencies of member states. Such
15. Before the introduction of the euro, long-term loans, even at variable interest rates, werenot generally available in many countries of today’s “Euroland.”
10101-05_Ch05_Redo.qxd 10/5/06 3:06 PM Page 152

european financial institutions 153
borrowings by a well-recognized regional bank with a triple-A rating may makesignificant contributions to the development of local bond markets. The EIBplayed a significant role in this respect in the capital markets of Greece, Portu-gal, and Spain during the 1990s and since then has done so in the emergingmarkets of Central Europe.
Financial Strength of the Bank
The authors of the bank’s establishing agreement had a clear vision of its mis-sion and of how to accomplish that mission. However, these views obviouslyreflected the financial knowledge and market conditions of the 1950s, andincreasingly they need to be interpreted flexibly in the current context.
One compelling argument for the bank’s founders was that it should bemade as financially strong as possible. This was rightly seen as having twoadvantages: first, a low likelihood of recourse to shareholder money, and second,a low cost of funding from capital markets for the projects funded by the bank.As less-than-triple-A-rated banks realize benefits from creating triple-A-ratedspecial vehicles, less-than-triple-A-rated governments can do the same. In theterminology of economics, this is a coordination gain.
The first step toward financial solidity is a generous endowment of equity cap-ital. The bank has a gearing ratio between outstanding loans and subscribed capi-tal of 250 percent. The ratio of the World Bank, in comparison, is 100 percent.However, the conservative nature of the EIB’s gearing ratio becomes apparentfrom the second quality feature: 5 percent of the subscribed capital has to be paidin, and the unpaid 95 percent is a contingent capital guarantee of shareholders.Moreover, should a shareholder be unable to pay up, then all others are collec-tively liable. This provides very strong capital backing.
The third qualitative feature is on the assets side. All loans must be ade-quately guaranteed by a first-class third party. For a long time, guarantees wereprovided mainly by governments. This was the case when EIB lending wasmostly concentrated in the public sector. Over time, the share of lending to theprivate sector has increased steadily. Third-party guarantees have mainly beenprovided by first-class banks (meaning banks with at least a single-A rating).
A test of the contribution of asset quality to the bank’s solidity is provided bya computation of the Basel I capital adequacy ratio. Although the bank is notsubject to the Basel framework, such a computation is instructive. Until theearly 1990s, more than half of the outstanding loans enjoyed a governmentguarantee and hence a zero risk weighting. The remainder of the loan book wassupported by bank guarantees with a 20 percent risk weighting. It comes, there-fore, as no surprise that the bank’s capital adequacy ratio exceeded 100 percent,
10101-05_Ch05_Redo.qxd 10/5/06 3:06 PM Page 153
154 s. griffith-jones, a. steinherr, and a. t. fuzzo de lima
far in excess of the minimum requirement of international commercial banks of8 percent. Over time, with a rising share of lending to the private sector, thecapital adequacy ratio has declined gradually, but it was still very comfortable atover 30 percent in 2003.
As a result of the bank’s very prudent and conservative approach to lending,it has not lent to weaker economic actors without strong securities or third-party guarantees. Loan performance therefore has been exceptionally good, andprovisions are large relative to modest past loan losses. Since only a few loanshave been nonperforming over its forty-six-year existence, the bank’s recourse toguarantors has also been modest. The reverse side of this coin is that potentialborrowers with excellent credit standing and high-quality guarantees could alsofind money elsewhere.
The need for third-party guarantees became increasingly recognized as prob-lematic and overly conservative—problematic because the bank sought increas-ingly to lend to the private sector but also to maintain very high quality. Focusingon top borrowers and insisting on third-party guarantees turned out to be bothcontradictory and not market conforming. The commercial cost of a third-partyguarantee, added to the bank’s lending rate, made the package unattractive forborrowers with a top standing and hence access to the capital market.
To make its loans more attractive to prime lenders, the bank introduced“single signature” loans, which are loans without a third-party guarantee. Theyare unlike loans with a third-party guarantee, which are priced on the basis of thebank’s “opportunity” refinancing cost (that is, what the bank would pay if it hadto refinance on capital markets on the day of fixing the lending rate for a loan).16
With the hedging techniques available, this “opportunity” rate corresponds, onaverage, to the bank’s actual cost of refinancing, plus a markup to cover adminis-trative costs. In addition, a risk premium is added to single-signature loans. Thisrisk premium is computed by the bank using advanced financial models, withexternal ratings as input. Additional securities such as mortgages or revenuepledges are accepted by the bank and reflected in the size of the risk premium.
Returns from lending and other investments generate a surplus, because allprojects funded with borrowed resources must be cost-covering. This surplus(technically not a profit because it remunerates only the factor of production) isadded to the bank’s reserves and makes it possible to augment capital by con-verting reserves into paid-in capital without cash payments by existing share-holders. Of course, the gearing ratio of the EIB is defined in terms of subscribed
16. Until the late 1980s lending rates were set on the basis of actual borrowing costs. Thechange to “opportunity” cost was a response to market developments.
10101-05_Ch05_Redo.qxd 10/5/06 3:06 PM Page 154

17. It needs to be recognized, however, that the EIB had always received preferential treatmentfrom national authorities, which provided considerable advantages for reducing funding costs.
european financial institutions 155
capital. But as 5 percent of subscribed capital must be paid-in, there is animplicit relationship with paid-in capital. The bank can satisfy this constraint bytransferring funds from reserves to paid-in capital.
Since 1991 all capital increases of the EIB have been self-financed in thisway. This obviously makes it easier to increase capital. Had the EIB beenobliged to pay out dividends and then call on shareholders for fresh capital, itmight have been more difficult to sustain lending growth with capital increases.
The return to convertibility of member countries in preparation for the Eco-nomic and Monetary Union (EMU) facilitated the bank’s access to national capi-tal markets.17 A big jump was achieved with the EMU, representing for the banka significant improvement in funding through large issues in just one currency,the euro. Moreover, increasing financial sophistication made the management ofthe bank’s asset liability position and its currency risk easier. Today it has becomestandard to borrow in currencies for which the bank has no direct use but forwhich funding costs are interesting and to swap the proceeds into euros. At pres-ent, the bank has virtually no compelling immediate financial need for expansion.
The bank’s choice to minimize the risk on its balance sheet and to transferlending risk to other parties results in very limited risk diversification in its lend-ing portfolio. This, in combination with the setting of lending rates to ensurethat costs are covered, makes it impossible to securitize some parts of the loanportfolio without loss: any investor in an EIB unsecuritized bond would havemore security and the same interest rate. For that reason, in an environment ofgrowing lending volumes, the EIB carries a large historic loan book that needsto be supported by ever more subscribed capital.
Historical Evolution of Lending
Exponential lending growth. The activity of the EIB was fairly slow to develop(see figure 5-1). During its first ten years of operation, total loans amounted toonly 77.983 billion, in comparison with 742.332 billion in 2003 alone, bothexpressed in 2003 euros (see table 5-3).
In terms of growth of lending adjusted for price increases, the highest growthrates were achieved during the period 1965–73, when the average annual realgrowth rate was 20 percent (excluding the setup period, during which growthrates are meaningless). During the period 1974–85 the average annual realgrowth rate declined to 15 percent, and since 1985 it has been around 8 per-cent. Even in recent years, between 1995 and 2003, the average annual real
10101-05_Ch05_Redo.qxd 10/5/06 3:06 PM Page 155

156 s. griffith-jones, a. steinherr, and a. t. fuzzo de lima
Millions of 2003 euros
5,000
10,000
15,000
20,000
25,000
30,000
35,000
40,000
1962 1968 1974 1980 1986 1992 1998 2002Years
Source: Prepared by the authors using EIB data.
Figure 5-1. EIB Lending Growth, 1959–2003
growth rate was 7 percent, which was still much higher than real GDP growthin the European Union.
During the second decade, from 1969 to 1978, the total lending volumeincreased to 735.019 billion (in 2003 euros), which was four times greater thanthe lending volume during the first decade. This increase was due to more lend-ing within the six-member European Community and to an expansion of thecommunity. Italy was the largest borrower, followed by the United Kingdom.Lending outside of Europe amounted to less than 10 percent of the total, but asa result of the first oil shock, lending to the energy sector came close to 30 per-cent of total lending. And global loans became modestly significant, reaching 8 percent of total lending.
During the period 1979–88 the EIB became a bank with a recognized role inEurope. Total lending for the decade increased to 7105.151 billion, in 2003euros (three times as much as the previous decade). Global loans continuedtheir march to greater significance, reaching over 20 percent of total lending.Lending to countries outside of Europe declined to 7 percent of the total.
The total for the next decade, 1989–98, was 7238,349 million, in 2003euros. Unified Germany and the former socialist countries became major bor-rowers. Two sectors dominated: infrastructure accounted for nearly 50 percentof total lending and global loans for 25 percent. Remarkably, global loansaccounted for nearly 50 percent of lending to France and Germany, two coun-
10101-05_Ch05_Redo.qxd 10/5/06 3:06 PM Page 156

18. Global loans are credit lines that the EIB grants to a financial intermediary, which deploysthe proceeds to support SMEs. Although the effectiveness of this instrument is debatable, in theabsence of a retail network, cooperation with retail banks is the only way the EIB can channelresources to SMEs.
19. See Griffith-Jones, Stevens, and Georgiadis (1992).
european financial institutions 157
tries that are not generally considered underrepresented in retail banking andthat have numerous savings banks whose primary function is to lend to SMEs.
During the five years between 1999 and 2004, the lending volume reached7191.396 billion (in 2003 euros), and the bank became a global name. For thefirst time since 1958, Italy was replaced by Germany as the bank’s top borrower,with Spain not far behind. Because accession countries were treated as if theyhad already joined the EC, lending outside the community exceeded 19 percentof the total. As to the sectoral distribution, energy declined strongly, globalloans exceeded 30 percent, and health and education took off.
Among the sectors supported by the EIB, agriculture has never receivedmuch attention, and global loans (given to financial intermediaries to supportSMEs) were modest during the first two decades (see table 5-4).18 The publicsector was the predominant borrower of financing for infrastructure, energy,and capital-intensive state industries (airlines, electricity generation and distri-bution, telephone systems, etc.).
As already pointed out, one of the key aims of the EIB was and is to contributeto convergence of poorer regions and countries by focusing lending on them.Griffith-Jones and colleagues deflated total allocations of EIB lending by country,by years of membership, and by population for the period 1959–90 (see table 5-5)and found that the countries obtaining the largest loans from the EIB duringthat period (per capita and per year of membership) included Ireland, Portugal,Greece, and Spain.19 These were then the poorest countries in the European
Table 5-3. Total EIB LendingMillions of 2003 euros
Decade Amount
1959–68 7,9831969–78 35,0191979–88 105,1511989–98 238,3491999–2003 191,396Total 577,899
Source: Prepared by the authors using EIB data.
10101-05_Ch05_Redo.qxd 10/5/06 3:06 PM Page 157

Tab
le 5
-4.
Tot
al E
IB L
endi
ng, b
y Se
ctor
Mill
ions
of e
uros
, val
ues
adju
sted
for
each
ran
ge o
f yea
rsa
Agr
icul
ture
,G
loba
l loa
ns,
Hea
lth,
Year
sfis
heri
es, f
ores
try
Ener
gygr
oupe
d lo
ans
educ
atio
nIn
dustr
yIn
fras
truc
ture
Serv
ices
Tot
al
1959
–68
117
710
044
050
90
1,13
719
69–7
814
2,91
476
02
2,16
33,
689
269,
568
1979
–88
375
17,1
7314
,493
102
6,20
621
,441
258
60,0
4819
89–9
845
830
,486
48,9
211,
346
20,1
7894
,210
1,91
619
7,51
519
99–2
003
235
16,3
9459
,193
9,54
014
,395
82,1
683,
978
185,
904
Tot
al1,
083
67,1
4412
3,37
710
,990
43,3
8220
2,01
76,
178
454,
172
Sour
ce: P
repa
red
by th
e au
thor
s us
ing
EIB
dat
a.a.
All
the
data
are
in n
omin
al te
rms.
10101-05_Ch05_Redo.qxd 10/5/06 3:06 PM Page 158

european financial institutions 159
Community (with the exception of Denmark, which was not so poor, but alsoobtained high levels per capita and per year of membership). This provides strongindicative evidence that the EIB performed an important redistributive role.
Reasons for sustained growth. This very slow evolution of the bank’s lendingduring the first twenty years, and the continued rather rapid expansion of activityover the past twenty years, are all the more remarkable because the very reasonfor the creation of the EIB—namely, capital controls and an underdevelopedcapital market—disappeared with the reforms undertaken in the late 1980s andearly 1990s in preparation for the EMU. To put it more provocatively, the EIBonly started to flourish when its original raison d’être vanished. Why?
There are no convincing reasons for the slow start. Surely, it was wise to buildup operations slowly, to gain experience in the field and to focus on economicallypromising projects within a narrow range. As a new bank, the EIB first had toestablish a solid reputation. In addition, the underdeveloped, split-up Europeancapital market put constraints on the refinancing capability of the bank, a con-straint that has disappeared with the development of the European capital market.Most of the lending took place in European currencies, since borrowers preferrednot to take an exchange risk. Financial markets in Europe were still national mar-kets and were not yet sufficiently developed to allow the bank to borrow in themore mature U.S. market and then swap the proceeds into European currencies.
The successive enlargements of the European Union automatically expandedthe lending volume. The following example will help to quantify the impact ofEC expansion. Out of the total lending of 7198.325 billion in the period
Table 5-5. EIB Lending, Deflated by Time of Membership and Population, 1959–90
Member country Indicator
Belgium 0.4Denmark 4.2Germany 0.2Greece 2.9Spain 2.9France 0.7Ireland 5.5Italy 1.9Luxembourg 0.5Netherlands 0.2Portugal 5.5United Kingdom 1.4
Source: Griffith-Jones, Stevens, and Georgiadis (2002).
10101-05_Ch05_Redo.qxd 10/5/06 3:06 PM Page 159

160 s. griffith-jones, a. steinherr, and a. t. fuzzo de lima
1999–2003, 786.530 billion went to the six original members of the commu-nity (EU-6). If Germany had maintained its borrowing at the same level asFrance (before unification Germany always borrowed less than France), thenlending to these six countries would have totaled 774.363 billion. It can thusbe concluded that EU expansion accounted for over 60 percent of activity.
Among the most significant recent decisions by the EIB is the decision toincrease lending in the health and education sectors in recognition of the impor-tance of such investments for economic growth. During the period 1999–2003,health and education accounted for 5.14 percent of total lending. Meanwhile,global loans accounted for 31.85 percent, but the share of industry was only7.75 percent. If global loans, services, health, and education were subtracted fromthe adjusted EU-6 lending of 774.363 billion mentioned above, lending in thesix countries would have dropped to some 745 billion, or only 23 percent ofthe total. Hence lending outside the initial EU-6 and to sectors that initiallyplayed little or no role accounted for 78 percent of the expansion in EIB lending.
In addition to these factors, a growing mandate to support the politicalobjectives of the European Union beyond its borders sustained the growth ofEU lending. The first lending mission outside the European Community con-cerned projects in African, Caribbean, and Pacific countries. In the early 1990sLatin America and the poorer countries in Asia became eligible. Of course, thebiggest impact on EIB lending outside the EU came from the opening up of theformer socialist countries of Central and Eastern Europe, where the EIB is byfar the largest lender. In 2003 the EIB lent more than 74 billion to CEE coun-tries, or about the amount of its total lending in 1985. Also, for geopoliticalsymmetry, lending to Mediterranean countries picked up.
Until the turn of the century, the bank limited its lending outside the Euro-pean Union to 10 percent of its overall lending. In 2003, lending outside theEU represented 19.26 percent, of which 10.85 percent went to acceding andaccession countries and 8.41 percent to countries in the rest of the world. Sincethe expansion of the EU on May 1, 2004, a large part of the bank’s lending hasonce again become internal, and lending outside the EU has gone back down toclose to 10 percent of the total.
Given that the capital adequacy ratio of the EIB is so large, and its expertiseso valuable, it may be worthwhile to consider whether it should increase itslending to the developing world.
Lessons for New Regional Development Banks
Analysis of the EIB experience suggests a number of structural and operationalfeatures of interest for other regional development banks (RDBs).
10101-05_Ch05_Redo.qxd 10/5/06 3:06 PM Page 160

european financial institutions 161
—A regional development bank should be endowed with a small, first-classprofessional staff in order to establish a reputation beyond reproach. Managementshould execute its mission as set by the bank’s establishing agreement and by itsboard of governors (the finance ministers of member states). To minimize politi-cal horse trading, maximize social acceptance, and optimize the economic effectsof the bank’s interventions, an advisory board composed of nongovernmentexperts should provide an opinion on all lending projects for which the social rateof return is below a set benchmark. Otherwise, all loans should be required toyield a social rate of return at or above the benchmark.
—The activity of a regional development bank should be focused. For proj-ect lending, a list of eligible projects might prove useful. This list should recog-nize the importance of education and health for human capital formation. Asthe development of regional trade is a key objective, trade financing should beamong the top priorities. Also, transnational investment projects (pipelines,train and road connections, airports, and seaports, for example) should receivepriority status.
—There should be no a priori restrictions on either private or public sectorcounterparts. Particular priority could be attached to private-public partnerships.Financial support for any lending project should be limited to the amountneeded to stimulate cofinancing and increase the multiplying effect.
—Borrowing and lending in local currencies of the regional developmentbank should receive priority, with the double aim of avoiding foreign exchangerisk for the borrower and assisting in the development of regional capital mar-kets. However, this will absorb regional savings. Therefore, borrowing in for-eign currencies should not be excluded. Loans should be made available for longmaturities on a variable-rate basis. This will facilitate shorter-term borrowing bythe RDB for longer-term loans, minimize the risk for the borrower in realterms, and, experience suggests, reduce the long-term cost of borrowing.
—Subsidiarity (that is, the risk that RDB loans will take business away fromprivate banks or capital markets) will most likely not be an issue in emergingmarkets. To gain professional independence in carrying out its tasks as definedby its board of governors, and to ensure maximum economic impact from itsfinancial interventions, the bank could set a minimum social rate of return (thatis, the financial rate of return, plus the positive or negative value of externalities)as an absolute condition for loan acceptance.
—Asymmetric information is a problem everywhere, but even more so in mar-kets with less developed financial markets. An important role of the RDB is there-fore investment in project information and signaling to potential cofinanciers.To perform this role effectively, the RDB first needs to establish an impeccable
10101-05_Ch05_Redo.qxd 10/5/06 3:06 PM Page 161

162 s. griffith-jones, a. steinherr, and a. t. fuzzo de lima
reputation. It must also assume some of the risks. Risk is the greatest stumblingblock in credit markets. It would be difficult to sell off the risk, and the signal-ing power would be diminished.
—The regional development bank should be endowed with a comfortable cap-ital base. Because public coffers are not plentiful in emerging countries, it mightbe useful to complement the paid-in capital with subscribed, but not paid-in, cap-ital for possible contingencies. The RDB should be allowed to retain any surplusesto build up reserves. With strong risk management and a high-quality loan port-folio, the RDB can obtain an international credit rating above those of membercountries. The goal should be triple-A. This is achievable with strong manage-ment, a good loan portfolio, cost- and risk-covering prices, and a solid capitalbase. Weak ratings of member countries are a disadvantage, but not a decisive one(with respect to paid-in capital, pecunia non olet, so that only contingent capitalwould be affected by a discount factor). This will allow the economies in theregion to have access to better borrowing conditions.
—Over time, as the regional development bank’s growing balance sheetrequires additional capital to maintain the bank’s gearing ratio, certain loansmight be securitized. This would avoid capital increases and focus the role ofthe RDB on loan originating.
—Pricing of loans should cover the financial cost, the risks taken, and theadministrative costs. A small profit could be added to strengthen the capitalbase. With a triple-A rating and a lean staff, lending rates can be hundreds ofbasis points lower than the rates of private banks or the financing costs of localgovernments.
References
Ben-David, D. 1996. “Technological Convergence and International Trade.” DiscussionPaper 1359. London: Centre for Economic Policy Research.
Ben-David, D., and A. Kimhi. 2000. “Trade and the Rate of Income Convergence.” Discus-sion Paper 2390. London: Centre for Economic Policy Research.
Commission of the European Communities. 1996. The First Cohesion Report. Brussels.———. 2001. Regular Report on the Czech Republic’s Progress towards Accession. Brussels.———. 2002. The Second Report on Economic and Social Cohesion. Brussels.Devlin, R., A. Estevadeordal, and E. Krivonos. 2002. “The Trade and Cooperation Nexus:
How Does the Mercosur-EU Process Measure Up?” In An Integrated Approach to the Euro-pean Union-Mercosur Association, edited by P. Giordano. Paris: Institut d’Etudes Politiquesde Paris.
European Commission. 1997. “The Single Market Review.” Subseries VI: Aggregate andRegional Impact. Vol. 2: The Cases of Greece, Spain, Ireland and Portugal. Brussels.
10101-05_Ch05_Redo.qxd 10/5/06 3:06 PM Page 162

———. 2004. A New Partnership for Cohesion—Convergence, Competitiveness, Cooperation.Third Report on Economic and Social Cohesion. Luxembourg.
———. Various years. Annual Report on the Structural Funds.European Investment Bank. 1985, 1987, 1988, 1989. EIB Annual Reports. Luxembourg.———. 1997. 40 Years’ Activity. Luxembourg.———. 2000. “Regional Convergence in Europe: Theory and Empirical Evidence.” Eco-
nomic and Financial Studies 5, no. 2. Luxembourg.———. 2001. The Bank’s Operations in the Accession Countries of Central and Eastern Europe:
Review of Current and Future Lending Policy. Luxembourg.———. 2001. EIB Contribution to Regional Development: A Synthesis Report on the Regional
Development Impact of EIB Funding on 17 Projects in Portugal and Italy. Luxembourg.———. 2003. Statute of the European Investment Bank. Luxembourg.———. 2004. The EIB Group Activity Report 2003. Luxembourg.European Investment Bank Group. 2001. The EIB Group Activity Report 2001. Luxembourg.European Union. 2004. Cohesion Report. Brussels.Funck, B., and L. Pizzati, eds. 2003. European Integration Regional Policy and Growth. Wash-
ington: World Bank.Griffith-Jones, S., J. Kimmis, and A. Fuzzo de Lima. 2003. “Financial Mechanisms for
Accession: Lessons from the European Union to a Free Trade Agreement of the Americas.”IDS Research Paper. Brighton: Institute of Development Studies.
Griffith-Jones, S., C. Stevens, and N. Georgiadis. 1992. Regional Trade LiberalisationSchemes: The Experience of the EC. Brighton: Institute of Development Studies.
Leland, H. E., and D. H. Pyle. 1977. “Information Asymmetries, Financial Structure, andFinancial Intermediation.” Journal of Finance 32 (May): 371–87
Milanovic, B. 2002. “Worlds Apart: International and World Inequality 1950–2000.” Wash-ington: World Bank.
Solanes, J. G. 2001. The Impact of European Structural Funds on Economic Convergence inEuropean Countries and Regions. Universidad de Murcia, Spain.
Stiglitz, J. 1998. “IFIs and the Provision of International Public Goods.” EIB Papers 3, no. 2:116–33.
european financial institutions 163
10101-05_Ch05_Redo.qxd 10/5/06 3:06 PM Page 163
164
For most developing countries, open regionalism has emerged as a sensibleresponse to the ongoing turbulent and asymmetric process of economic
globalization: it avoids the huge costs associated with both isolationism and out-right liberalization. Moreover, the successful experience of the countries thatnow form the European Union has made regional integration an increasinglyattractive option for the developing world.
Whenever regional integration is intended to go beyond just a free-tradeagreement, macroeconomic coordination becomes a key issue. From a theoreti-cal standpoint, the underlying idea is simple: when economies are interdepen-dent, the events that take place and the policies implemented in each of themwill, through various transmission channels, affect the performance of all therest. Under these conditions, macro policy coordination appears to be a meansof internalizing the effects of reciprocal interrelationships on decisionmaking ineach economy while improving the results for all concerned.
This idea has spread beyond the borders of the Old World, but for a variety ofreasons, repeated attempts to implement macroeconomic coordination mecha-nisms outside Europe, and in Latin America in particular, have run into numer-ous difficulties. Be that as it may, regional integration agreements are now awell-established reality on the world scene, and Latin America is no exception. In
Macroeconomic Coordination in Latin America:Does It Have a Future?josé luis machinea and guillermo rozenwurcel
6
10101-06_Ch06_Redo.qxd 10/5/06 3:07 PM Page 164

macroeconomic coordination in latin america 165
many cases, moreover, the participants in these agreements are seeking to gobeyond improving trade relations and to set for themselves decidedly more ambi-tious integration goals. The reasons are not solely economic, but involve widerpolitical and cultural motivations as well.
If the movement in this direction grows stronger, then it is natural to expectthat coordination efforts will not be abandoned. Exploring the obstacles thatwill have to be overcome and the circumstances under which these initiativescan be profitable therefore becomes a necessary task. It is clear that this task canbe completed satisfactorily only if the specific nature of the economic inter-dependence and political conditions and factors existing in each case are takeninto account. Contributing to the efforts to achieve this objective in LatinAmerica is the primary motivation for this analysis.
In the following sections we look at the particular characteristics of the eco-nomic interdependence entailed in the integration agreements existing in LatinAmerica, with emphasis on how they differ from those in Europe. We assess theexperience with macroeconomic coordination in the Southern Common Mar-ket (Mercosur), the region’s largest trading bloc. An effort is made here to drawsome lessons applicable to the other integration schemes in the region. Finally,we raise the question of how the demand for coordination can be increased inLatin America and seek to identify the main obstacles, opportunities, and incen-tives in this regard.
Reasons for Macroeconomic Coordination: How Much EconomicInterdependence Is There in Latin America?
A high level of interdependence among countries is one of the main reasons forincreasing the coordination of macroeconomic policies, since interdependenceimplies that each member of the group is affected by what happens in the othercountries. The degree of interdependence among a group of countries is usuallymeasured on the basis of the trade and financial links existing among them.
Trade Interdependence
Intraregional trade has followed quite different trends in the various subregionalintegration schemes in Latin America throughout the 1990s and thus far in thepresent decade. As figure 6-1 shows, Mercosur and the Andean Community(AC) grew steadily up to 1997–98, both in dollar value and in the share of totaltrade activity accounted for by intraregional trade. This trend changed abruptlywhen the international crisis erupted, however, and intraregional trade’s share ofthe total dropped significantly, although the Andean Community managed to
10101-06_Ch06_Redo.qxd 10/5/06 3:07 PM Page 165

166 josé luis machinea and guillermo rozenwurcel
maintain the dollar value of such trade near the highs recorded in 1997–98, whilein Mercosur it fell steeply. In the Central American Common Market (CACM),on the other hand, the dollar value of intraregional trade (without includingmaquila activities) has risen steadily throughout this period, and intraregionaltrade’s share of the total, although it has fluctuated sharply, has also exhibited anoverall increase. Within the Caribbean Community (Caricom), intraregionaltrade expanded considerably, both in dollar value and when measured as a per-centage of total trade until 1998, and it has remained fairly steady since then.
Figures 6-2 and 6-3, in turn, assess the trade interdependence existing in thedifferent Latin American economic blocs and other regional agreements. Thiscomparison is based on two indicators: (a) intraregional trade with respect tototal trade, and (b) intraregional trade in terms of GDP. For Latin America andthe Caribbean, the indicators show that interdependence in subregional integra-tion agreements, although it increased over the past decade, is still substantiallyless tight than in other regions. These findings become particularly evident whenintraregional trade is analyzed in terms of GDP. The differences between the twoindicators are primarily attributable to the openness of the individual countries.
In any event, the expansion of intraregional trade is limited by the size of theblocs. There are enormous differences in this respect: whereas the EuropeanUnion (EU) accounts for 37.2 percent of world trade, no subregional agreementin Latin America accounts for more than 1 percent, with the sole exception ofMercosur, which, though it is the largest bloc in the region, accounts for only1.4 percent of world trade.
Percent of total exports
5
10
15
20
25
1985 1987 1989 1991 1993 1995 1997 1999 2001 2003
Mercosur
Andean Community
CACM
Caricom
Source: ECLAC, Division of International Trade and Integration, on the basis of official data.
Figure 6-1. Share of Intraregional Exports in Total Regional Exports, 1985–2003
10101-06_Ch06_Redo.qxd 10/5/06 3:07 PM Page 166

macroeconomic coordination in latin america 167
Financial Integration
The reciprocal externalities operating among the countries of Latin Americansubregional blocs have not been transmitted solely via trade channels, however.Macroeconomic spillovers from financial markets have also been extremely sig-nificant, even though the integration of financial transactions or related activi-ties within domestic financial markets is virtually nil.1 Financial conditions inthe countries of subregional blocs are connected in two ways. On the one hand,since external vulnerability is a trait shared by all the member countries, changesin international financing conditions tend to have a more or less similar impacton all their economies. On the other hand, the contagion effects deriving fromthe imperfect information prevailing in international financial markets tend tomagnify their financial interdependence. The strong correlation between the
10 20 30 40 50 60
AC
Mercosur
CACM
Caricom
ASEAN
NAFTA
EU
Percent
Source: ECLAC, Division of International Trade and Integration, on the basis of official data.a. The figures given are annual averages. EU: European Union; NAFTA: North American Free Trade
Agreement; ASEAN: Association of Southeast Asian Nations; Caricom: Caribbean Community; CACM: Central American Common Market; Mercosur: Southern Common Market; AC: Andean Community.
2000–20031990–1991
Figure 6-2. Share of Intraregional Exports in Total Regional Exports, 1990–91and 2000–03a
1. Machinea and Rappoport (2004).
10101-06_Ch06_Redo.qxd 10/5/06 3:07 PM Page 167

168 josé luis machinea and guillermo rozenwurcel
5 10 15
AC
Mercosur
CACM
Caricom
ASEAN
NAFTA
EU
Percent
Source: ECLAC, Division of International Trade and Integration, on the basis of official data.a. The figures given are annual averages.
2000–20031990–1991
Figure 6-3. Intraregional Exports as a Percentage of Regional GDP, 1990–91and 2000–03a
2. One exception is the absence of contagion in the final phases of the Argentine crisis. Thiscould be attributed to the “absence of surprise” as events unfolded, which enabled investors to pre-pare themselves by reallocating their assets gradually. During the preceding months, however, therewas an impact on other countries in the region, and during 2002 the crisis severely affectedUruguay. Although there are different definitions of contagion, references here are to a situation inwhich a crisis in another country increases the probability of crisis in the home country, after con-trolling for the economic fundamentals (Eichengreen, Rose, and Wyplosz, 1996).
3. Inter-American Development Bank (2002, chap. 7).4. Fernández-Arias, Panizza, and Stein (2002).
country risk ratings in Mercosur—in particular those of the largest economiesof the bloc—until shortly before Argentina’s default is a good illustration of thispoint (see figure 6-4).2
In fact, empirical studies have shown the existence of strong interconnectionsamong financial markets in emerging countries that are clearly influenced bygeographic proximity, trade links, and economic policy similarities.3 Moreover,there is evidence that a country’s currency crises are more closely associated withexchange rate misalignments with a partner in a trade agreement than with therest of the world.4 However, when contagion is measured through the impact of
10101-06_Ch06_Redo.qxd 10/5/06 3:07 PM Page 168

macroeconomic coordination in latin america 169
a change in one country’s capital flows on the other partners’ flows, the evi-dence is more ambiguous.5
These trade-related and financial externalities notwithstanding, their pres-ence has not generated a reciprocal demand for permanent macroeconomiccooperation. The reason is simple: although the expansion of intraregional tradewas regarded as a long-lasting phenomenon, every time one of the two largestpartners was overtaken by a crisis, the most prevalent reaction was a fear offinancial spillovers. In such situations, the usual response of policymakers in theother countries has been to send out signals that differentiate them from theirdistressed neighbor in an effort to influence the mainstream perception on finan-cial markets.6 Their reason for doing so is that the adverse effects to be expected inthe short run have been of such a magnitude, and the decisionmaking horizon
500
1000
1500
1994 1995 1996 1997 1998 1999 2000 2001 2002 2003
Source: ECLAC, on the basis of data from JP Morgan Securities and the Uruguay Republic Pension Fund (AFAP).
a. Uruguay Bond Index (UBI). Since May 2003, Uruguay has changed the reference bond basket.b. Global Bond 2009 Sovereign Spread over United States Treasury (UST) bond yields.EMBI = Emerging Markets Bond Index.
EMBI Argentina
EMBI Brazil
EMBI Global ChilebUBI Uruguay a
Figure 6-4. Country Risk: December 1993–September 2004
5. This issue is described in more detail in Inter-American Development Bank (2002, chap. 7).6. The extreme case was the Argentine government’s behavior in 1999 after Brazil’s
devaluation.
10101-06_Ch06_Redo.qxd 10/5/06 3:07 PM Page 169

170 josé luis machinea and guillermo rozenwurcel
for governmental and private sector actors has shortened to such a point, thatthe ratio between the perceived costs and benefits of integration has grown dras-tically worse.
Dependence or Interdependence?
Statistics on interdependence for the bloc as a whole often conceal consider-able differences between countries, which are often due to differences in theirsize. Figures 6-5 and 6-6 indicate the level of dependence or interdependencein different regional agreements based on two indicators: (1) distribution ofregional GDP, and (2) intensity of reciprocal trade between the largest partnerin each agreement and the rest of the bloc. The figures show that there are con-siderable differences in country size within the North American Free TradeAgreement (NAFTA) and Mercosur. In such cases, there are fewer coordina-tion incentives for the largest country. In NAFTA, in particular, it is unthink-able that the United States would be prepared to coordinate its fiscal andmonetary policies with Canada and Mexico. Although concern for its neigh-bors may lead the United States to help them in critical situations such asMexico’s “tequila crisis” in 1994, it is extremely unlikely that it would everagree to have Mexican or Canadian representatives sitting on the U.S. FederalReserve Board.
Other Reasons for Coordination
Incentives for cooperation are not only related to size and economic inter-dependence. Beyond trade and financial interdependence, there may be othereconomic or political reasons for coordination among members of an agree-ment. European integration is a clear example of this. But without doubt, largesize differences among the partners reduce the incentives for coordination.Additional motives for coordination may include cyclical synchronism, itsimportance in introducing discipline in the face of domestic pressures, and itsuse as a mechanism to reduce macroeconomic volatility and to build up govern-ment credibility within a country.
Cyclical synchronism. Benefits from macroeconomic coordination increase (orthe costs decrease) to the extent that the countries belonging to the regionalagreement face similar situations. If cycles are synchronous, economic policydecisions will be similar, and therefore the cost of forgoing autonomous policieswill be lower.
Countries in subregional blocs in Latin America have historically registeredlow synchronism in economic cycles, at least when they are compared againstcountries of the European Union and the Association of Southeast Asian Nations
10101-06_Ch06_Redo.qxd 10/5/06 3:07 PM Page 170

Perc
ent
20
40
60
80
NA
FTA
SA
CU
M
erco
sur
EC
OW
AS
AC
A
SEA
N
CA
CM
E
U(1
5)
Car
icom
USA
Trinidad &Tobago
Germany
Indonesia
Venezuela
Nigeria
Brazil
South Africa
Guatemala
Sour
ce: E
CL
AC
, Div
isio
n of
Int
erna
tion
al T
rade
and
Int
egra
tion
, on
the
basi
s of
off
icia
l dat
a fo
r M
erco
sur,
AC
, CA
CM
and
Car
icom
; and
Wor
ld D
evel
opm
ent
Indi
cato
rs 2
004
for N
AFT
A (N
orth
Am
eric
an F
ree
Trad
e A
gree
men
t); S
AC
U (S
outh
ern
Afr
ican
Cus
tom
s Uni
on),
EU
(Eur
opea
n U
nion
), a
nd E
CO
WA
S (E
cono
mic
C
omm
unit
y of
Wes
t Afr
ican
Sta
tes)
. a.
Ann
ual a
vera
ge.
Figu
re 6
-5.
Reg
iona
l GD
P D
istri
butio
n, 1
990–
2003
a
10101-06_Ch06_Redo.qxd 10/5/06 3:07 PM Page 171

172 josé luis machinea and guillermo rozenwurcel
1.0 2.0 3.0 4.0 5.0
.
6.0 7.0 8.0 9.0
TLCAN (USA)
Mercosur (Brazil)
CACM (Guatemala)
AC (Venezuela)
EU (Germany)
ASEAN (Indonesia)
Source: ECLAC, Division of International Trade and Integration, based on IDB (2002) Integration 2002 Report, chap. 7 (box 7.1), p. 48.
a.The indicator was estimated with the following formula:
The formula shows the ratio between the exports of the larger country j to the regional integration agreement B, and the sum of the exports of the rest of the member countries i to the larger country j. In both cases, exports are normalized by the respective total exports. In parentheses, the left axis shows the larger country in terms of its share of regional GDP, considering figure 6-7.
19892002
Figure 6-6. Degree of Interdependence of Core Countries in Some IntegrationSchemes, 1989 and 2002 a
(ASEAN) (see figure 6-7). Within this context, the CACM countries are foundto have a relatively high level of correlation, while Mercosur and the AndeanCommunity evidence the lowest level of synchronism in the region.7 Neverthe-less, some studies suggest that, at least in the case of Mercosur, during the 1990sthe cycles of the member countries, and particularly those of the two largest part-ners, were somewhat more closely synchronized than in the past.8 This hasoccurred mainly as the result of external financial disturbances that have affectedall the countries of the bloc.
Domestic resistance. Similarly, a macroeconomic coordination agreement canserve to implement measures that have met with domestic resistance. However,
7. De la Cuba and Winkelried (2004).8. Lacunza and others (2003); Fanelli and González Rozada (2003); Machinea (2003a).
10101-06_Ch06_Redo.qxd 10/5/06 3:07 PM Page 172

macroeconomic coordination in latin america 173
the importance of the role of regional agreements in imposing some degree ofinternal discipline depends on whether the agreement is perceived by the actorsinvolved as being advantageous for the country. While this has been the case forEurope, it has not necessarily been so for Latin America and the Caribbean.
“Borrowing credibility.” It is not clear whether macroeconomic policy coor-dination is an effective means of building domestic credibility in the region.Unlike in Europe, it is difficult to find in the region countries that havestrong enough reputations to generate credibility for other nations by part-nering with them in the area of macroeconomic policy. Even more important,countries in Latin America do not have strong enough reputations to emergeunharmed from an association with a country that has a history of severeinstability.
Finally, while a country’s volatility affects its partners in different ways,exchange rate volatility typically attracts the most attention because of its effectson trade and on the political economy of the integration process. As can be seenin figure 6-8, although exchange rate volatility is not so intense in CentralAmerica, it is particularly severe in Mercosur and is also quite significant in theAndean Community, the two largest economic blocs in Latin America.
There are several reasons for these large exchange rate volatilities, notableamong them the different domestic macroeconomic policies and the coexistenceof different exchange rate regimes. In particular, the coexistence of dollarization in
Source: Machinea (2003c).
5 10Percent
15 20 25 30 35 40
EU
ASEAN
CACM
AC
Mercosur
NAFTA
Figure 6-7. Cyclical Synchronism: Weighted Average of Correlation Coefficient,1962–2002
10101-06_Ch06_Redo.qxd 10/5/06 3:07 PM Page 173

174 josé luis machinea and guillermo rozenwurcel
Ecuador and convertibility in Argentina with more flexible exchange regimes inthe rest of Latin America explains part of the volatility from 1998 on, the periodin which the countries of the region experienced similar large financial shocks.9
The potential advantages of macroeconomic coordination as a means ofreducing economic volatility, in particular exchange rate volatility, and improv-ing economic performance in the members of a regional agreement are dis-cussed in the following sections.
Macroeconomic Coordination: The Experience of Mercosur from a Latin American Perspective
Regarding the size of the economies involved, Mercosur is Latin America’slargest integration initiative to date. When it was created, the member countriescommitted themselves to structuring a customs union, which, over time, was todevelop into a common market.
The difficulties that Mercosur is currently experiencing, however, raise seriousdoubts about the possibility of achieving significant progress on integration in
5Percent
10 15 20 25 30
Brazil-Argentina
Brazil-Uruguay
Guatemala-Costa Rica
Guatemala-El Salvador
Colombia-Ecuador
Colombia-Peru
Colombia-Venezuela
Source: ECLAC, on the basis of official data.
Jan 1999–May 2004Jan 2002–May 2004
Figure 6-8. Volatility of Bilateral Real Exchange Rates
9. See Machinea (2003a) and Fanelli and González-Rosada (2003) for a detailed discussion ofthe Mercosur case.
10101-06_Ch06_Redo.qxd 10/5/06 3:07 PM Page 174

macroeconomic coordination in latin america 175
the near future. Questions about its functioning, and even its usefulness for theeconomic development of its members, have been raised with particular force inrecent years. To differing degrees and intensities, many of the obstacles facingMercosur are similar to those being encountered in other integration agreementsin the region.
From that vantage point, this section first analyzes how the Mercosur inte-gration process has evolved. It then looks at recent changes in the nature andintensity of the interdependence among the countries of this bloc. Finally, themain lessons to be learned from the failed attempt at macroeconomic coordina-tion made in 2000 are discussed.
Evolution of the Integration Process: From Hope to Disenchantment
Mercosur was established in 1991, and by the middle of that decade the integra-tion process was already having difficulty meeting the commitments it hadmade to eliminate nontariff barriers, adopt a common external tariff, establishspecial import regimes and a common customs code, and harmonize proceduresto deal with unfair trade practices. The virtual absence of any supranationalinstitutional structure was a significant factor in these difficulties.
The difficulties went largely unnoticed while the two largest countries of thebloc were experiencing rapid growth. In 1997, however, there was a significantbreak in the trend toward the elimination of trade restrictions, which occurredwhen Brazil, in order to curb the growth of its current account deficit caused bya sharp appreciation of the exchange rate, decided to impose general importrestrictions, which also applied to its partners under the agreement.10
The negative macroeconomic performance of the past few years has beentransmitted to the countries’ intraregional trade. As a result, intraregional tradeas a share of total trade fell from 25.3 percent in 1998 (before the internationalfinancial crisis began to affect the region) to 12 percent in 2003.
As a result of the deterioration in the macroeconomic situation triggered byevents in the international arena from 1998 on, the weaknesses of the integra-tion process became more apparent as the recession increased the countries’ sen-sitivity to trade problems and caused relations between the member countries toworsen even further, undermining their countries’ already debatable willingnessto create even a minimal institutional framework and significantly weakeningnot only the integration process but also trade relations within the bloc.
10. As a matter of fact, in 1992, again in a context of significant exchange rate appreciation,Argentina had already resorted to the temporary establishment of a 10 percent statistical duty onimports of any origin.
10101-06_Ch06_Redo.qxd 10/5/06 3:07 PM Page 175

176 josé luis machinea and guillermo rozenwurcel
As was discussed in the previous section, the conditions for extending integra-tion and establishing macroeconomic cooperation mechanisms within Mercosur,and in Latin America in general, are comparatively less favorable than those thatprevailed in the process that led to the establishment of the European Union. First,the degree of trade integration that can be attained by Mercosur, and for thatmatter the other integration schemes in Latin America, is unlikely to approachthe levels seen in the European Union or NAFTA for a number of reasons, includ-ing one quite simple factor: the enormous differences in the size of their respectivemarkets. Second, cyclical synchronism is still quite low, and even though the cycleshave become more synchronized in the 1990s, this has mainly been the result ofspillovers arising from external financial disturbances. Third, the extreme volatil-ity of exchange rates, added to the deep economic crises of recent years and thefact that the region has grown more slowly than the rest of the world, have led toa proliferation of intraregional trade restrictions, significantly weakening not onlythe integration process but also trade and political relations within the bloc.
Fourth, in times of crisis, the political horizon is shortened to a minimum andthe authorities’ discount rate soars. It is therefore not surprising that the benefitsof integration, which tend to make themselves felt over the long term, appear tobe outweighed by its costs, which are evident in the short term. There are twoclear manifestations of this effect. On the one hand, whenever sharp macroeco-nomic fluctuations in either of the two largest members of the bloc have signifi-cantly altered intraregional trade flows in ways that have adversely affected theirneighbors, sectoral pressures and the public’s reaction have inevitably given riseto policy responses oriented toward counteracting those effects. These policymeasures have generally been aimed at restraining imports from the country that,either because of the presence of recessionary conditions or because of a devalua-tion of its currency, was in a better competitive position in the regional market.On the other hand, every time a country is in deep trouble, the partners’ foresee-able reaction is to try to distance themselves from the neighbor that is experienc-ing difficulties. As a result, instead of creating demand for coordination, financialinterdependence has repeatedly generated political conflicts within the bloc.
It may be argued that if progress were made in macroeconomic coordination,intraregional trade would be strengthened, the correlation of the countries’cycles would be increased, and favorable conditions would be created for deep-ening their integration.11 It is clear, however, that such cooperation requires aminimum set of political and economic conditions that have thus far not beenseen in Mercosur. Moreover, in view of the scale of economic problems, the
11. Frankel and Rose (1996).
10101-06_Ch06_Redo.qxd 10/5/06 3:07 PM Page 176

macroeconomic coordination in latin america 177
political will of the relevant parties becomes a critical factor. In addition to fac-ing unfavorable economic conditions, Mercosur has also exhibited weaknesseson the political front.12
At this writing in 2006, Mercosur is in trouble. The remaining exceptions tothe common external tariff have prevented consolidation of the customs unionand, what is more, new nontariff barriers have appeared. Although a technicalsecretariat was created in 2002 and, more recently, a Commission of PermanentRepresentatives was established, given these bodies’ small budgets and diffusefunctions, the bloc still has virtually no institutional structure.
The Attempt at Macroeconomic Coordination in 2000: Lessons from a Failed Experiment
Although the need to coordinate macroeconomic policies is explicitly stated in thefirst article of the Treaty of Asunción, which sanctioned the creation of Mercosur,given the relative weakness of the macroeconomic spillovers among the countriesof the bloc, in the beginning the demand for coordination was not significant.
However, in 2000 an attempt to advance in this direction was made that,although overtaken by later events, set a precedent that may be useful to ana-lyze. The ministers of finance and the presidents of the countries’ central banksagreed in their first meeting of that year: (1) to establish common targets onmacroeconomic matters and in financial services; (2) to develop performanceindicators based on a common methodology; (3) to begin regular publication ofa series of harmonized fiscal indicators starting in September 2000; (4) to setjointly agreed goals in relation to the fiscal deficit, the public debt, and inflationin March 2001; (5) to complete and update a survey and comparative analysisof current regulations relating to financial and capital markets, including pay-ment systems, with a view to moving toward the integration of these markets;and (6) to establish a macroeconomic monitoring group made up of high-levelofficials whose first task would be to evaluate the consistency of the jointmethodology to be used to prepare the indicators.
It proved possible to harmonize the statistics on the fiscal deficit, publicdebt, and prices in a relatively short span of time. Then, in December 2000,the ministers of finance and the presidents of the countries’ central banks metin Florianopolis, Brazil, to set targets for the fiscal deficit, public debt, and infla-tion that would enter into force beginning in 2002. The target set for prices was aceiling rate for the annual increase in the consumer price index (CPI) of 5 percent
12. The difficulties of deepening integration in the economic sphere have been an obstacle forstrengthening the political relationships within the bloc.
10101-06_Ch06_Redo.qxd 10/5/06 3:07 PM Page 177

178 josé luis machinea and guillermo rozenwurcel
until 2005 and 4 percent beginning in 2006 (in this case on the basis of the coreinflation rate of the CPI, to be estimated using a harmonized methodology). Asfor fiscal matters, a maximum value of 3 percent was set for the consolidateddeficit, and a downward trend was projected for the debt/GDP ratio starting in2005, with a maximum limit of 40 percent to be reached by 2010 at the latest.The discussion of goals related to the external sector, including targets for thecurrent account and the short-term external debt, was left for the future.
At the meeting in Florianopolis it was not possible, however, to make signifi-cant progress in developing incentives for compliance with these goals. Whatthe authorities did succeed in agreeing upon was that any country that deviatedfrom these goals should inform the macroeconomic monitoring group of thecorrective measures it would take to return to the established limits, and that itwould have to apply those measures within one year from the date of presenta-tion to the group. It was also agreed that the ministers of finance and the presi-dents of the countries’ central banks could make public comments on suchmeasures as they deemed appropriate.
Two lessons can be learned from this experience. First, it was demonstratedthat it is possible to achieve results fairly quickly if people at the highest politicaldecisionmaking levels are involved and if capable technical bodies exist. A sec-ond lesson is of a more negative nature and concerns the rewards and penaltiesrequired to ensure compliance with the goals. In this connection, the resultswere not very significant. This issue may not be a serious drawback in the initialphases of an experiment of this nature, but it brought to light the absence ofeffective mechanisms for securing compliance with the commitments assumed.
The deterioration of the Argentine economy that culminated in its collapsein late 2001 and 2002, coupled with the worsening situation in the other coun-tries of the bloc, led to the introduction of new trade restrictions, exceptions tothe common external tariff, and heated disputes among member countries. As aresult, this first attempt at coordination came to an abrupt end. The conclusionis clear: when there is excessive instability and high exchange rate volatility inone of the countries concerned, especially one of the larger ones, macroeco-nomic cooperation becomes unworkable.
The Future of Macroeconomic Coordination in Latin America and the Caribbean:
Is it possible to increase the demand for coordination? Above all else, individualcountries need to have responsible macroeconomic policies that guarantee aminimum level of stability. It is impossible to coordinate policies without reason-
10101-06_Ch06_Redo.qxd 10/5/06 3:07 PM Page 178

macroeconomic coordination in latin america 179
ably stable economies. Viewed from this standpoint, stability can be considered,to a certain extent, an initial basic condition for the emergence of a demand forpolicy coordination between neighboring countries.
In principle, the strengthening of trade integration tends to generate greaterincentives for coordination. However, regional experience shows that reinforc-ing such integration alone is not sufficient to increase the demand for coordina-tion. It is therefore essential to find other incentives for this coordination, andespecially for ensuring compliance with the agreements reached by the parties.
Bearing this need in mind, this section presents an analysis of the mainobstacles and opportunities for macroeconomic cooperation and coordinationin Latin America. The discussion first looks briefly at the question of where tostart and how to gradually shift from “softer” to “harder” forms of coordination.It then moves on to the issue of rules and incentives for coordination. The diffi-culties raised by exchange rate volatility as well as the type of macroeconomicpolicy mix called for under exchange rate floats, the currently prevailing regimein the region, are then examined. Finally, the feasibility and implications of theintegration of domestic financial markets, as well as the role that subregionalstabilization funds or other financial instruments might play, are explored.
Where to Begin
Given the complexity of the factors involved, macroeconomic coordinationprocesses can only progress gradually. There is consensus about this issue in theliterature, which is also supported by the European experience. Periodic meet-ings, exchange of information, standardization of statistics, and the creation ofsupranational forums for policy debate are necessary procedures for graduallybuilding the mutual trust and knowledge that are critical to avoiding the “pris-oner’s dilemma” and the creation of incentives for opportunistic behavior.13
Seen from this vantage point, the exchange of information can be consideredan initial way of implementing cooperation policies. Although informationexchange is a “soft” form of coordination that has no direct effect on macro-economic performance, it does enable countries to become better acquainted,improve their understanding of each other’s specificities and circumstances, andachieve a common vision, which is far from happening in Latin American inte-gration processes.
13. Ghymers (2001). The Macroeconomic Dialogue Network (REDIMA), an ECLAC initia-tive launched in 2000, has played an important role in promoting this approach, albeit with mixedresults, in Mercosur, the Andean Community, and CACM, the three Latin American subregionalintegration agreements.
10101-06_Ch06_Redo.qxd 10/5/06 3:07 PM Page 179

180 josé luis machinea and guillermo rozenwurcel
The integration process will be strengthened if countries set up and main-tain a supranational technical forum in which they can meet regularly and sys-tematically take on certain tasks (such as the standardization of statistics andharmonization of indicators), assess other experiences, analyze various aspectsof the integration process, and, when the time comes, formulate criteria andoptions for convergence. This forum could function informally, but its institu-tionalization would send a strong signal of the importance attached to the goalof coordination.
Nevertheless, if there is political will to make progress toward integration, along-term approach should be adopted. The establishment of mutual confi-dence should not be taken for granted but should be seen as the first objective tobe achieved through an “institutional investment” that requires the allocation ofresources, concrete action, and continuity over time.
During this initial phase of “soft” coordination, it is crucial to achieve a min-imum level of national macroeconomic stability (exchange rate stability in par-ticular), especially for the larger members of the bloc, which because of their sizebear the responsibility of its leadership. Only if this minimum objective isachieved will more concrete coordination mechanisms appear to be an attractiveway of reinforcing the credibility of the larger countries and of enabling thesmaller countries to “buy credibility” for their own macroeconomic policies.
Toward a “Harder” Form of Coordination
The main objective of the second stage of macroeconomic coordination is to sus-tain stability in the long term. This requires the adoption of more explicit coordi-nation mechanisms. As suggested by the European experience, this impliesestablishing goals for the convergence of a set of macroeconomic variables.
The convergence of certain variables at predetermined values established bycommon agreement does not guarantee that these values will be maintained inthe future. Furthermore, a commitment to hold the fiscal deficit below a certainlevel may limit a country’s capacity to implement countercyclical policies. Sus-taining macroeconomic stability over the long run requires institutions thatencourage fiscal and monetary responsibility, nominal price flexibility, and fac-tor mobility. Some scholars therefore believe that carrying out the institutionalreforms needed to ensure lasting stability in each country is more importantthan setting convergence objectives.14
However, as the experiences of some countries in the region show, institu-tional reforms are not irreversible either. Thus, although such reforms are surely
14. See, for example, Eichengreen (1998).
10101-06_Ch06_Redo.qxd 10/5/06 3:07 PM Page 180

macroeconomic coordination in latin america 181
vital, mutual commitment to the convergence of certain key variables at crediblelevels may enhance the policy consistency and stability of the economiesinvolved. In addition to exchange rate issues, which are discussed later, the ques-tion of macroeconomic convergence raises other matters, such as the fiscal situa-tion, inflation, and, given the region’s external vulnerability, its exposure tochanges in international market conditions.
Fiscal convergence is necessary to prevent any one country’s lack of disciplinefrom damaging its own financial market, increasing its country risk, and, viacontagion effects, impairing the flow of capital to the region as a whole. Givenits intertemporal dimension, the effort to achieve convergence should includethe fiscal deficit and the public debt, measured as proportions of GDP. Toavoid curtailing the possibility of implementing countercyclical policies, thedeficit that should be taken into account for these purposes is the structuraldeficit (adjusted for cyclical variations). In light of the region’s track record insuch matters and its governments’ lesser borrowing capacity, the limit for thestructural deficit should be lower than the level set in Europe. For countries thatare initially above the limit, the adjustment period allowed to align themselveswith the target should be reasonably brief. A low deficit does not, however,guarantee a government’s solvency if its debt is too high—hence the need toplace a ceiling on the public debt. Since satisfying this condition may not befeasible immediately, the adjustment period allowed will have to be longer thanthe period set for convergence on the deficit target.
Because high inflation also tends to contribute to volatility, the first objectiveof setting an inflation target is to reduce uncertainty. In floating exchange rateregimes, inflation targets also help to curb volatility in the nominal exchange rate.
The external vulnerability of the region is precisely what makes it necessaryfor macroeconomic coordination to include targets for the external sector.15
These targets would be the current account deficit and short-term external debt.Fiscal policy may not be sufficient to achieve these objectives in the face of largecapital flows. In the event of massive capital inflows, for instance, it might benecessary to impose restrictions on short-term capital movements.
Rules and Incentives for Coordination
Establishing explicit macroeconomic coordination mechanisms—through, forexample, the adoption of convergence targets—will be useful only if those tar-gets are feasible and if compliance with the relevant agreements can be enforcedto a reasonable extent. The need to ensure that targets are feasible raises the
15. This is suggested by Lavagna and Giambiagi (2000), Zahler (2001), and others.
10101-06_Ch06_Redo.qxd 10/5/06 3:07 PM Page 181

182 josé luis machinea and guillermo rozenwurcel
question of just how strict the rules should be, while the need to enforce com-pliance is linked to the issue of incentives.
Adopting rules that are too strict could make compliance excessively costly orsimply impossible under certain circumstances; knowledge is never complete,and there is no way of predicting all eventualities. Thus a certain degree of pol-icy flexibility has to be maintained in order to deal with unexpected critical situ-ations. Excessive flexibility, however, could undermine the credibility of thecommitments undertaken.
Striking the right balance is not simple in any case, but especially not for thecountries of the region. On the one hand, adopting policies based on strict rulesseems to be the only option for governments whose good reputations are oftenin doubt. On the other hand, many such policies in the region have failed totake account of the intrinsic vulnerability of the economies involved and havetherefore been unsuccessful because policymakers lack enough maneuveringroom to respond to unexpected shocks. The collapse of the convertibility regimein Argentina is the most recent example of this type of situation.
In any event, integration agreements aimed at furthering macroeconomiccoordination in the region can clearly afford to grant little leeway in the estab-lishment of common targets. It therefore becomes vital to determine whichalternatives could be used to stimulate cooperation.
The high costs of irresponsible policies in the current context of economicglobalization already constitute an incentive for macroeconomic discipline,which is also encouraged by the conditionality of agreements with the IMF andother multilateral credit agencies.16 To a certain extent, these factors act implic-itly as exogenous coordination variables.
More explicit use could be made of incentives at the international level inpromoting macroeconomic coordination. For instance, multilateral financialinstitutions could play an important role if program design took into accountthe regional agreements already in place.17 What is more, convergence targetswould be much more influential if the criteria used for setting them wereagreed with those same institutions. Similarly, the rules established by theBank for International Settlements for the prudent regulation of nationalfinancial systems could be adapted and used as a basis for regional financial
16. In Mercosur, for instance, all countries have concluded agreements with the IMF inrecent years.
17. The Brazilian devaluation of 1999, which was supported by the IMF, and its impact onneighboring countries provides a good example of the negative externalities that the IMF couldhelp to mitigate if its recommendations took account of regional interdependence.
10101-06_Ch06_Redo.qxd 10/5/06 3:07 PM Page 182

macroeconomic coordination in latin america 183
integration agreements. It would be a mistake to ignore external incentivesbecause of potential political susceptibilities, especially when internal incen-tives are weak.
Indeed, the European experience shows that the most powerful coordinationincentive, especially for smaller countries, is the enhanced reputation associatedwith achieving convergence targets. Unfortunately, this incentive may not applyin the Latin America and Caribbean region for some time. For economic agents,the main sign that a government is implementing its macroeconomic policyresponsibly is compliance with agreements concluded with the IMF and othermultilateral financial institutions, and this does not seem about to change any-time soon.
The gains afforded by reducing exchange rate volatility with major tradingpartners are another incentive for coordination. Of course, the importance ofthis factor will increase in proportion to the volume of intraregional trade.Although this factor is present in the integration agreements in Latin Americaand the Caribbean, it clearly cannot come to be as important as it has been inthe European experience.18
Another incentive that has also been considered in Europe is the threat ofdirect sanctions (either financial or of other sorts). For this kind of incentive tobe effective, noncompliance must entail possible exclusion from the agreement.When the number of countries involved is too small or their economic size istoo different, it is extremely unlikely that direct sanctions can be enforced. InLatin America this is clearly the case with Mercosur: the exclusion of Uruguayor Paraguay would have enormous costs for the integration project, while thedeparture of Brazil or Argentina would signify the end of the agreement alto-gether. Direct sanctions do not seem easy to impose in the other Latin Ameri-can subregional agreements either.
Although moral sanctions are “softer” than financial penalties, they are alsoan incentive worth considering. In principle, the fact that their cost is tolerablebut not negligible makes moral sanctions viable and capable of making somecontribution to the objective of coordination. One possibility is to set up anindependent assessment committee, made up of regional and internationalexperts, tasked with periodically checking compliance with agreements and
18. See Ghymers (2002). In retrospect, however, it can be seen that direct sanctions have notplayed such an important role in the European Union. In fact, in recent years, instances of non-compliance by some countries of the bloc have gone unpunished. It is quite clear that the reasonfor this is that the countries concerned, Germany and France in particular, are among the mostimportant ones in the union.
10101-06_Ch06_Redo.qxd 10/5/06 3:07 PM Page 183

184 josé luis machinea and guillermo rozenwurcel
making recommendations where appropriate. Logic would dictate that theassessments should be public in order to have some effect.
It does not seem too bold to conclude that the incentives mentioned here arenot enough to make macroeconomic cooperation an attractive option for exist-ing subregional integration agreements in Latin America and the Caribbean.This issue is discussed again later, after a review of the available alternatives forlimiting exchange rate volatility and an analysis of the viability of subregionalfunds in that context.
Options for Limiting Exchange Rate Volatility
It is impossible to deepen an integration process without curtailing variationsin the exchange rates of the countries involved, given their direct influence ontrade and the political economy of integration.19 In a significant sample ofdeveloped and developing countries, Fernández-Arias, Panizza, and Steinobserved that the negative effects of exchange rate mismatches tend to begreater in relation to other countries within the region than with the rest of theworld;20 this is probably attributable to the part played by “regional goods”—that is, goods that, for different reasons, are mainly traded within the regionwhere they are produced.
In principle, it is to be expected that, as a result of increased uncertainty,both the level of the exchange rate and exchange rate fluctuations would haveadverse effects on foreign trade. This is especially true if there is high volatilityand if there are no adequate hedging instruments to cover risk, as is common inless-developed countries.21 In the specific case of Mercosur, many applied studieshave found that variations in the exchange rate do have some effect on intra-regional trade.22
Significant variations in exchange rates also affect the political economy ofthe process. When the exchange rate is devalued in a given country (especiallya large country within the region), the appreciation of the other countries’exchange rates shifts the internal balance of forces in favor of anti-integrationsectors, generates more protectionist pressures, and reduces governments’ capac-ity for cooperation. The negative reactions are much more dramatic during aregional recession than during a period of growth.
19. For a detailed discussion, see Machinea (2003b).20. See Fernández-Arias, Panizza, and Stein (2002).21. This hypothesis is supported by several empirical studies (Devlin and others, 2001; Este-
vadeordal, Frantz, and Saez, 2001; Giordano and Monteagudo, 2002).22. Heymann and Navajas (1991, 1998).
10101-06_Ch06_Redo.qxd 10/5/06 3:07 PM Page 184

macroeconomic coordination in latin america 185
There are various causes of fluctuations in the exchange rate. At the nationallevel, monetary and fiscal excesses are obviously a major determining factor. In acontext of high capital mobility, the effects manifest themselves primarily inpublic and external debt (especially short-term debt). External structural distur-bances affect the real equilibrium exchange rate as well. When such disturbancesare asymmetrical—that is, when they affect the various countries involved in theintegration process in differing ways—then there is a change in the real equilib-rium exchange rates between those countries.
Domestic fundamentals and external disturbances are not the only causes ofexchange rate variability in the short and long terms, however. Under condi-tions of high capital mobility, the exchange market behaves much like any otherfinancial assets market. As pointed out by Frankel and Rose, asymmetrical accessto relevant information, imperfect transmission of information between marketparticipants, and their heterogeneous nature may give rise to herd behavior orbandwagon effects that could trigger sharp appreciations or devaluations in nom-inal and real exchange rates.23
Last, the implications of having coexisting different exchange rate regimesmust also be considered. It is not particularly controversial to state that nomi-nal wages and prices are not completely flexible, that purchasing power paritiescannot be accurately determined, and that nominal devaluations account, inlarge part, for the performance of the real exchange rate.24 The exchange rateregime is therefore a relevant factor in accounting for the real exchange rate,and the coexistence of different systems affects real exchange rate variationsacross countries. This manifests itself when countries from a given region expe-rience a symmetrical external disturbance that changes the equilibriumexchange rate of all the countries in relation to the rest of the world withoutaltering the equilibrium parity among them.
Regardless of its causes, exchange rate volatility is a formidable barrier tomoving forward with integration. The question is how to control it. Monetaryunion is the most expedient means since, by definition, it eliminates exchangerate variations between the countries involved. For economic and political rea-sons, however, this option is not feasible within the subregional integrationgroupings in Latin America and the Caribbean.
With monetary union ruled out, at least for the foreseeable future, it is vitalto consider alternative options. As previously stated, the coexistence of differentexchange rate systems contributes to large exchange rate variations resulting
23. Frankel and Rose (1995).24. See Froot and Rogoff (1995); and Obstfeld (2000).
10101-06_Ch06_Redo.qxd 10/5/06 3:07 PM Page 185

186 josé luis machinea and guillermo rozenwurcel
from common external disturbances. In fact, floating regimes are prevalent inmost Latin American countries at present.
Given the fact that international financial and commodities markets con-tinue to be highly unstable, the currency float prevailing in the region seems tobe the most advisable option. In this respect, Eichengreen and Taylor showedthat the variability of exchange rates is lessened when countries adopt floatingexchange rate systems and steer monetary policy toward a particular inflationrate (inflation targeting).25 The explanation behind this phenomenon is that, inmost cases, countries with fixed exchange rates face rather abrupt exchange rateadjustments when they abandon exchange rate parity.
However, as noted by Calvo and Reinhart, the difficulties associated withflexible exchange rates should not be underestimated.26 On the one hand, it istrue that a float facilitates adjustments in the equilibrium rate when circum-stances call for it. On the other hand, it is equally true that the fluctuations per-mitted by this regime, particularly in the context of heightened capital mobility,are not always due to “fundamental” reasons, at least in the short and mediumterms. In principle, the advantage of adjusting the real equilibrium exchange ratemore quickly comes at the cost of greater uncertainty.
Besides, in countries where dollar-denominated debt is widespread, whetherin the public or private sector, the problems that arise with abrupt fluctuationsin the exchange rate are significant, owing to their effects on financial assets. Ifdollarization is so widespread that it encompasses bank claims and, above all, ifdeposits are dollarized as well, then the situation becomes even more compli-cated: the likelihood that an unforeseen devaluation would trigger a currencyand financial crisis and prompt a drastic slowdown in production levelsincreases dramatically.27
In addition to the challenges posed by a floating regime in reducing the vari-ability of the exchange rate in each country, its implications for the rest of theregion must also be considered. A floating exchange rate system tends to facili-tate exchange rate stability among the countries of a given region when all of thecountries are affected similarly by external shocks. However, exchange rate flexi-bility increases variability when disturbances, whether external or internal, areasymmetrical.
An analysis by Fanelli and González Rozada of the cyclical co-movements ofArgentina, Brazil, and Uruguay offers two important findings in this connec-
25. Eichengreen and Taylor (2002).26. Calvo and Reinhart (2002).27. See Rozenwurcel (2003).
10101-06_Ch06_Redo.qxd 10/5/06 3:07 PM Page 186

macroeconomic coordination in latin america 187
tion.28 Although the authors focus on Mercosur, its applicability in the rest ofthe region is more than plausible. They find that common external shocks aris-ing from volatility in international financial markets are an important factor inexplaining the common component shared by the economic cycles of the threecountries and that the spillovers among them are considerable. They also find,however, that the idiosyncratic component accounts for most of the cycle of eachcountry (approximately 85 percent), leaving only 15 percent to be explained bythe common component.29
The large size of the idiosyncratic component present in the cycles of themembers of the bloc reveals significant differences in their respective productionstructures, in addition to the existence of marked asymmetries in the shocksthey are exposed to, as well as a lack of policy coordination. An immediate con-sequence of this is that, although they have similar exchange rate regimes, signif-icant sources of exchange rate volatility persist among Mercosur partners.
A second conclusion to be drawn is that if countries belonging to a trading blocdecide to coordinate their macroeconomic policies and adopt common macro-economic targets, this could certainly help reduce exchange rate fluctuations, eventhough the exchange rate itself may not be a target. In fact, policy differencesamong the various countries are responsible for much of the lack of synchroniza-tion in their economic cycles. Therefore, coordinating macroeconomic policywould not only deactivate an important source of instability in each country, butwould also eliminate one of the mechanisms that amplifies external shocks.
Coordination under Floating Exchange Rate Regimes
Given that floating regimes are inherently unstable, if exchange rate volatility isto be reduced a managed float is preferable to a free float. Nevertheless, in orderto manage the float, the authorities must intervene in the foreign exchange mar-ket, and in order for them to do this, sufficient reserves must be available andmonetary effects must not put pressure on prices.
In truth, central bank interventions can have different objectives. At present,China and other Asian countries, for example, have aimed their exchange ratepolicies at maintaining a devalued real exchange rate as part of their develop-ment strategy.30 The pros and cons of this approach fall outside the scope of thischapter. Nonetheless, according to Rodrik, one of the few stylized facts that can
28. Fanelli and González Rozada (2003).29. A common external shock could have a different impact on the partners as a result of idio-
syncratic reasons related to the economic and financial structure.30. See Dooley, Fokerts-Landau, and Garber (2003, 2004).
10101-06_Ch06_Redo.qxd 10/5/06 3:07 PM Page 187

188 josé luis machinea and guillermo rozenwurcel
be deduced from a careful analysis of concrete experiences of economic develop-ment is that policy prescriptions “travel” poorly from one country to the next.31
In particular, considering the economic conditions needed to make a policy ofthis nature viable, in terms of both reserve accumulation and inflation, such analternative in most Latin American countries is unlikely to materialize.
Therefore, the main aim of exchange rate policies in the region should be tosmooth out short-term swings, which generate “noise” that engenders uncer-tainty and has a negative effect on expectations and economic performance. Anyintervention on the part of monetary authorities, though, must not hinderadjustments in the real exchange rate to accommodate disturbances that under-mine its long-term equilibrium.
At any rate, a managed float entails a trade-off in terms of the objectives ofmonetary policy, since the monetary effects of exchange rate interventions canlead to inflation. This issue cannot be taken lightly in Latin America, wheremany countries have a long history of inflation.
In particular, as long as financial deepening continues to be very limited anddollarization rather widespread, as is the case in many Latin American countries,managed floats may cease to be feasible when strong external shocks occur.What should be done in such extreme cases? One possibility is to let theexchange rate float freely. If the real parity is at a reasonable level and if fiscaland monetary policies are managed responsibly, regulating short-term capitalmovements seems to be a better option.
Although restrictions on capital flows continue to be a subject of heateddebate, considering the high volatility exhibited by globalized financial markets,there are good theoretical reasons for using them.32 Moreover, empirical evidencesuggests that, although they have costs and do not work perfectly, when imple-mented sensibly such restrictions can be efficient in moderating flows, modify-ing their composition, and smoothing out swings in the exchange rate.33
Until now, the motivation behind regional integration has not explicitly fig-ured in this discussion on monetary and exchange rate policy under a floatingregime. However, it is evident that even if all members of a regional agreementadopt a floating exchange rate, the differences in their monetary and exchangerate policies may seriously hinder any reduction in the volatility of exchangerates in the region.
31. Rodrik (2003).32. See Rodrik (2003); Rogoff (2002); Ffrench-Davis and Larraín (2003); Ocampo and Chi-
appe (2003); and DeLong (2004).33. Ffrench-Davis and Villar (2005).
10101-06_Ch06_Redo.qxd 10/5/06 3:07 PM Page 188

macroeconomic coordination in latin america 189
Therefore, if the objective of furthering integration is to be maintained, it isvery important—in addition to setting common macroeconomic targets, particu-larly inflation targets—for the countries to gradually make progress on the coordi-nation of their exchange rate policies, starting with the definition of commoncriteria for intervention, then moving on to the harmonization of regulations per-taining to capital movements and, possibly, the adoption of a system of currencybands. Of course, in an area as sensitive as this, major advances cannot be expectedto occur quickly. However, in principle the countries could agree on a mechanismfor consulting with one another concerning possible courses of action to follow inextreme situations. This exercise would not imply any concrete commitments foraction, but it would be the starting point for the joint learning process that isneeded in order to propose more ambitious objectives later on.
Integration of Regional Financial Systems and Macroeconomic Stability
The existing subregional agreements in Latin America do not, at present, pro-vide any major incentives for financial integration.34 On the contrary, thus farcontagion effects have been the only source of externalities operating betweenfinancial systems in the region. Under certain conditions, however, the regionalintegration of domestic financial systems can generate positive synergies amongmember countries and can help to reduce macroeconomic volatility.
In fact, the vulnerability of the countries’ financial systems is a main source ofmacroeconomic instability in the region. Raising and harmonizing the regulatorystandards of the members’ financial markets in accordance with internationalbest practices can therefore be seen as a means of complementing macroeconomiccoordination in relation to monetary, fiscal, and exchange rate matters as part ofa concerted effort to reduce volatility and deepen regional integration.35
The harmonization of financial regulations is a good starting point for thefinancial integration process because it does not involve any weakening of theindependence of national policymakers and institutions. Thus it will not be per-ceived as a vehicle for contagion among the financial systems of each country.
The contribution that financial harmonization can make to macroeconomicstability is not, however, the only reason for promoting the integration of finan-cial systems at the regional level. In time, this form of integration can also help
34. This subject is discussed in depth in Machinea and Rappoport (2004).35. The fragility of domestic financial systems in the region and the magnitude of the shocks to
which they are exposed would seem to indicate that the regulations to be adopted should be stricterthan those required to meet the Basel standards. Factors that are not addressed by those standards,such as currency mismatches or public debt risk, should also be taken into account, however. Theregulations to be established should therefore be based on modified “Basel plus” standards.
10101-06_Ch06_Redo.qxd 10/5/06 3:07 PM Page 189

190 josé luis machinea and guillermo rozenwurcel
to reduce transaction costs and further the development of a regional capitalmarket. In order for this to occur, however, the harmonization of prudentialregulations would have to be extended, during a second stage, to include con-vergence among other financial institutions. In particular, consideration shouldbe given to the adoption of similar mechanisms for deposit insurance and thecreation of a regionwide payments system.
This step, unlike the harmonization of regulations, can indeed affect thecountries’ risk of contagion, since it would increase the interdependence of theirfinancial systems. The timing of the announcement of such measures is thereforejust as important as their proper implementation.
Stabilization Funds and Other Subregional Financial Agreements
There are very good reasons why the majority of the countries in the regionhave recently adopted floating exchange rate regimes. But the inherent volatilityof the exchange rate does not disappear even when the fundamentals are kept inorder and monetary policy is managed responsibly. The difficulties that thisposes on the domestic level and for regional integration processes are evengreater because the countries have a very limited capacity to intervene in orderto curb the instability of foreign exchange markets. Macro-level coordinationmay contribute to achieving this objective, but it is not sufficient in itself.
The European experience of the past few decades shows that various mecha-nisms for regional cooperation in the exchange rate and financial sphere haveplayed a very important role in stabilizing parities within the region.36 Ofcourse, in the European case there was another fundamental element that islacking in the region: in Europe some of the countries had convertible curren-cies and could thus intervene in exchange markets with their own currencies.37
The idea of creating supranational funds to contribute to regional stabilityhas begun to gather momentum in Latin America as a result of the severe crisesthat erupted on international financial markets in the 1990s.38 These crisesrevealed shortcomings and delays in the provision of assistance by the Inter-national Monetary Fund to emerging economies, which are attributable only inpart to the fact that resources and capacities were overwhelmed by the scale ofthe events in question. Other reasons include the extensive discussions related toconditionality clauses and, in some cases, to the “wait and see” attitude towardthe results of policies. If this diagnosis is correct, regional and subregional funds
36. See Giovannini and Mayer (1991) and Eichengreen and Ghironi (1996).37. The best-known case is Germany’s intervention to defend the value of the franc in 1992.38. Ocampo (1999); Mistry (1999); Agosin (2001); Machinea (2003a).
10101-06_Ch06_Redo.qxd 10/5/06 3:07 PM Page 190

macroeconomic coordination in latin america 191
that would act as lenders “of first resort” could be an effective complement tothe role of the IMF as a lender of last resort.39
In fact, a subregional stabilization fund has already been operating in LatinAmerica for quite some time. The Latin American Reserve Fund (Fondo Latino-americano de Reservas, FLAR) was created in 1978 by the countries of theAndean Community. More recently, in 1991, Costa Rica also joined the fund.The main purpose of FLAR is to provide short-term financing aimed at crisisprevention and management. Only shareholders are eligible for loans. FLAR’sfinancing played an important countercyclical role in the recent period of highvolatility in the international environment: its loans peaked in 1996 and 1999,helping GDP growth in the Andean countries to recover quite rapidly from twosevere external shocks.
From the point of view of subregional integration processes, having a mecha-nism that could help countries to cushion the effects of external shocks andchange investors’ perceptions before contagion spreads to their neighbors wouldbe very helpful. In addition to facilitating the adjustment of the country or coun-tries concerned, it would minimize the defensive reactions of partner countries intheir attempts to distance themselves from a troubled neighbor. Moreover, sub-regional funds could serve as an incentive for macroeconomic coordination. Thiswould be the case if compliance with the agreed goals for convergence wererequired in order for requesting countries to receive assistance from the fund.
The effectiveness of these subregional funds will of course depend on the vol-ume of resources available. Thus, unless developed countries provided support,it seems improbable that funds of this type could soften the impact of simulta-neous abrupt reversals in capital flows, particularly when their scale is significantand they trigger contagion effects in neighboring countries of the region (seefigure 6-9).
On the other hand, because variations in the terms of trade do not show anysignificant correlation and the magnitude of their impact is much less than thatof financial disturbances, these funds could be quite useful in responding to thistype of shock even if resources come only from the countries of the region (seefigure 6-10).
With regard to Mercosur, during the 1990s the maximum impact of fluctua-tions in the terms of trade was on the order of U.S.$6.3 billion in 1999 and forthe rest of the decade never reached even one-third of that figure.40 In contrast,capital outflows amounted to almost U.S.$16 billion in 1999 and exceeded
39. Mistry (1999).40. These figures are from Machinea (2003a).
10101-06_Ch06_Redo.qxd 10/5/06 3:07 PM Page 191

192 josé luis machinea and guillermo rozenwurcel
10 20 30 40
EU
ASEAN
CACM
Andean Community
Mercosur
Percent
Source: Machinea (2003c). a. Annual changes > 20 percent of total exports.
Figure 6-9. Volatility of Private Capital Flows, 1971–2000 a
0.10
0.20
0.30
0.40
0.50
0.60
0.70
0.80
Terms of trade Export prices
Corr. coefficients simple averagea
EU CACM Caricomb
Andean Community Mercosur ASEAN
Source: Machinea (2003c). a. Correlation coefficients are expressed as the simple average of the correlation coefficients among
the rates of growth of each country member. b. Because not all data were available, only four countries were included for Caricom: Guyana, Haiti,
Jamaica, and Trinidad and Tobago, which represent 63 percent of regional GDP.
Figure 6-10. Real Shocks: Correlation between Terms of Trade and Export Prices
10101-06_Ch06_Redo.qxd 10/5/06 3:07 PM Page 192

macroeconomic coordination in latin america 193
U.S.$10 billion two years previously. Accordingly, a regional fund on the orderof U.S.$5 billion (which in 2000 was just over 10 percent of the total reserves ofthe countries in the region) would be able to offset almost 80 percent of annuallosses resulting from variations in the terms of trade on the scale of the worstfluctuations experienced in the 1990s, but its coverage would be scarcely morethan 30 percent of annual capital outflows, similar to the highest levels recordedin that decade.41
In addition to the level of resources, the creation of subregional funds poses asecond problem: the differences in size of the countries that might be involved.In fact, the creation of a fund exclusively for Mercosur, for example, wouldseem very difficult to implement. Taking into account the fact that Brazil gener-ates approximately 65 percent of the region’s GDP and 60 percent of its foreigntrade, it would be almost impossible for a fund established solely by the currentmembers to help that country to cushion adverse shocks.
The problem of size asymmetries becomes less severe as the number of coun-tries participating in such a fund rises.42 The drawback is that a fund formed bymember countries of different subregional blocs would make its potential role asan incentive for macroeconomic coordination within each bloc much more dif-ficult to implement.
Conclusions
The progress made in the area of macroeconomic cooperation and coordinationin Latin America has so far been rather poor. From an economic viewpoint, thelack of synchronization among cycles weakens demand for coordination. One ofthe main causes of this is the low level of trade interdependence. In fact, the rel-ative scale of intraregional trade in the existing integration schemes is substan-tially lower than in other economic blocs, and there is little reason to expect thatit will increase very much in the future.
Moreover, since financial integration is virtually nil, the reciprocal externali-ties existing on this front are due exclusively to contagion effects generated by thefrequent shocks brought about by the highly volatile nature of globalized finan-cial markets. Adverse macroeconomic spillovers caused by contagion tend to lead
41. Regional funds could therefore contribute to stabilization but would not eliminate the needto review the role of multilateral financial agencies. In particular, the possibility of offsetting at leastpart of the effects of capital flow volatility would require, as a minimum, the reformulation by theIMF of its Compensatory Financing Facility to transform it into an automatic disbursement line.
42. Agosin (2001), for example, proposes that all the countries of South America establish ajoint fund.
10101-06_Ch06_Redo.qxd 10/5/06 3:07 PM Page 193

194 josé luis machinea and guillermo rozenwurcel
countries to try to differentiate themselves from their neighbors in times of crisis.This in turn exacerbates political tensions and weakens integration processes.
The perception that coordination with regional partners can engender morenegative than positive externalities tends to create a vicious cycle. As in theprisoner’s dilemma, each country expects that the other will behave in a non-cooperative way and acts accordingly, thereby further undermining incentivesfor coordination.43
Under these conditions, it is justifiable to wonder whether it is reasonable forsubregional blocs to continue trying to coordinate their macroeconomic poli-cies. The response depends on the objective being pursued. In other words, itdepends on whether or not the aim is to deepen cooperation and further theintegration process.
If the decision is not to advance beyond trade linkages, then a free-trade areawill be sufficient, and macroeconomic coordination will be mostly unnecessary.This choice implies accepting the idea that the importance of subregional blocswill fade as the conclusion of bilateral free-trade agreements with other coun-tries and regions becomes more frequent.
The other option is to deepen the integration process. This implies thatcountries are willing to move forward toward the creation of a common market,which in turn would involve agreeing on common protection levels and hence asimilar development agenda. For example, relatively high levels of protection forcertain production sectors make sense only if the aim is to develop those sectorswithin the agreement. However, if the production strategies of the variouscountries differ, it will be difficult for them to form a customs union.
It is clear, therefore, that this option entails accepting some loss of sover-eignty and calls for a strong political will to back it up. This is true for anycountry, but in particular for the larger partners in the agreement, for which theloss of autonomy is more costly. In other words, when economic interdepen-dence among the members of an integration agreement is highly asymmetrical,the larger partners have the responsibility to provide leadership in order to movethe integration process forward.
Only under these conditions does it make sense to pursue macroeconomiccoordination. However, in this case, the following dilemma arises: in order todeepen integration, macroeconomic policies must be coordinated, but in order fordemand for coordination to emerge, a significant degree of economic interde-pendence is required. While the example of Europe is usually cited to demonstratethat the demand for coordination increases with the level of interdependence, it
43. Ghymers (2002).
10101-06_Ch06_Redo.qxd 10/5/06 3:07 PM Page 194

macroeconomic coordination in latin america 195
is also true that, from an evolutionary perspective, the same example reveals thatcoordination and interdependence can become complementary factors and canbe developed together as part of a recursive process.
Nevertheless, macroeconomic coordination in Latin America entails greaterdifficulties than those that confronted Europe in the early stages of its integra-tion process. In Latin America there is no exogenous exchange rate coordinationmechanism such as prevailed under the Bretton Woods agreements in the initialphase of the European integration process. Moreover, the situation is com-pounded by the governments’ lack of sufficiently strong reputations, thefragility of the countries’ domestic financial systems, and the scale of the exter-nal shocks now affecting the region. In any case, although concrete forms ofcoordination will vary according to the specific characteristics of the differentintegration agreements, there are certain lessons to be drawn from internationalexperience and certain common features of Latin American economic condi-tions that should be taken into account in all cases.
Macroeconomic coordination can only move forward gradually. The com-plexity of the factors involved and the need to generate the necessary confidenceand mutual understanding make this inevitable. In addition, a basic minimumdegree of domestic macroeconomic stability, and above all, exchange rate stabil-ity, must be achieved initially, especially among the principal partners in thebloc. Only if this minimum objective is achieved will the perceived benefits ofcoordination outweigh its costs and the use of more concrete mechanisms havegreater appeal.
These more concrete mechanisms, therefore, must wait for a more advancedstage in which it will be possible to set convergence goals so as to consolidatemacroeconomic stability and its long-term sustainability. Given the region’sexternal vulnerability, in addition to the usual targets (fiscal deficit, public debt,and inflation), coordination in Latin America must include goals for the externalsector relating to such variables as the current account deficit and the short-termexternal debt. In addition, measures designed to harmonize prudent regulationsin financial markets can also contribute to macroeconomic stability.
Obviously, the adoption of convergence goals will contribute to regional sta-bility only if countries strive to fulfill them. Incentives, therefore, are a crucialissue. Apart from the “exogenous” incentives for macroeconomic disciplinederiving from agreements with multilateral financial institutions, endogenousincentives must also be present. In the European experience, the chance to buildstronger reputations proved to be a powerful incentive for the fulfillment of suchgoals. But, for the time being at least, this is clearly not true in Latin America.Supervision of compliance with convergence goals by a committee of experts,
10101-06_Ch06_Redo.qxd 10/5/06 3:07 PM Page 195

196 josé luis machinea and guillermo rozenwurcel
and dissemination of the corrective measures that it recommends in the event ofnoncompliance, may gradually lend greater importance to this incentive, butonly in the long run. The adoption of effective sanctions does not appear to be avery credible alternative either, especially when the countries do not perceive thecosts of being excluded from an integration agreement as being very high.
In sum, for one reason or another, the incentives that were present in theEuropean experience are not strong enough to bring about macroeconomiccoordination in Latin America. That being the case, the creation of stabilizationfunds and other subregional financial mechanisms can become significant addi-tional incentives for macroeconomic coordination. Stabilization funds capableof providing fast-disbursing resources to facilitate the adjustment of membercountries to external shocks could prove to be an efficient complement to therole of the IMF. If, in addition, the fulfillment of commitments with regard toconvergence targets were one of the requirements for receiving disbursements,these funds could also encourage macroeconomic coordination. Subregionaldevelopment banks, besides being an effective complement to multilateral lend-ing institutions in certain areas, can play an important role in easing countries’access to the international financial markets. Moreover, they can be an effectivetool for promoting intraregional trade and furthering financial integration.
Nevertheless, the establishment of such institutions entails several difficulties.In the case of stabilization funds, in particular, sharp asymmetries can renderthe fund useless for the larger countries, such as Brazil in Mercosur. The partici-pation of a larger number of countries in the fund would make this problem lesssevere, but to maintain its role as an incentive for coordination, it would be nec-essary to increase the number of partners in the bloc. Irrespective of the asym-metries that exist, given the positive correlation of capital flows to countries ofthe region, the amount of resources needed to cushion the impact of commonfinancial shocks could be very high. However, these funds could be useful forterms-of-trade shocks and, in small and even medium-sized countries, financialshocks as well. Large-scale funds would require support from developed coun-tries, as is the case with the Chiang Mai Initiative in Asia.
Finally, there is the problem of exchange rate volatility. Addressing this phe-nomenon is crucial in order to achieve deeper integration: the volatility of bilat-eral exchange rates not only undermines intraregional trade, but also exacerbatespolitical tensions within the integration scheme. The adoption of similar ex-change rate regimes helps to alleviate the problem. But the exchange rate floatsthat have tended to prevail in the region—which have been adopted in order tocope with the persistent instability of international financial markets—exhibitdifficulties that should not be underestimated. From the standpoint of regional
10101-06_Ch06_Redo.qxd 10/5/06 3:07 PM Page 196

macroeconomic coordination in latin america 197
integration, in particular, the existence of major asymmetries in the shocks towhich countries of the region are exposed means that important sources ofexchange rate volatility continue to exist. The coordination of macroeconomicpolicies can help to reduce this volatility but will not eliminate the problem.
For this reason, in addition to ensuring that monetary policy is consistent withthe objective of smoothing out exchange rate fluctuations and refraining fromruling out the introduction of restrictions on capital flows, it is very importantfor the countries to move toward some degree of coordination of their exchangerate regimes. Clearly, in an area as sensitive as this, major advances cannot beexpected overnight. Nevertheless, countries could, as a first step, agree on amechanism for consulting with one another concerning possible courses ofaction, without committing themselves to specific measures but with a view tosetting more ambitious objectives later on.
In any event, the volatility inherent in flotation regimes will not disappeareven if the fundamentals are kept in line and appropriate mechanisms for macro-economic policy coordination are in place. These difficulties are compounded bythe magnitude of the external shocks to which the countries of the region areexposed. Thus the creation and strengthening of the subregional stabilizationfunds might serve as a tool for cushioning the impact of these shocks, facilitatingmacroeconomic cooperation, and advancing toward deeper integration.
References
Agosin, M. 2001. “Fortalecimiento de la cooperación financiera internacional.” Revista de laCEPAL (ECLAC) no. 57 (April).
Calvo, G., and C. Reinhart. 2002. “Fear of Floating.” Quarterly Journal of Economics, 117, 2.De la Cuba, M., and D. Winkelried. 2004. “Una moneda común? Nuevas evidencias para
América Latina.” Documento de Trabajo 17. Washington: Institute for the Integration ofLatin America and the Caribbean (INTAL)–ITD (April).
DeLong, J. B. 2004. “Should We Still Support Untrammeled International Capital Mobility?Or Are Capital Controls Less Evil than We Once Believed?” The Economists’ Voice 1, no. 1.Berkeley Electronic Press.
Devlin, R., A. Estevadeordal, P. Giordano, J. Monteagudo, and R. Saez. 2001. “Estabilidadmacroeconómica, comercio e integración.” Integración & Comercio no. 13. Buenos Aires:IDB–INTAL.
Dooley, M., D. Fokerts-Landau, and P. Garber. 2003. “An Essay on the Revived Bretton WoodsSystem.” Working Paper 9971. Cambridge, Mass.: National Bureau of Economic Research.
———. 2004. “The Revived Bretton Woods System: The Effects of Periphery Interventionand Reserve Management on Interest Rates and Exchange Rates in Center Countries.”Working Paper 10332. Cambridge, Mass.: National Bureau of Economic Research.
Eichengreen, B. 1998. “Does Mercosur Need a Single Currency?” Research Paper C98-103.University of California, Berkeley: Center for International and Development Economics.
10101-06_Ch06_Redo.qxd 10/5/06 3:07 PM Page 197

198 josé luis machinea and guillermo rozenwurcel
Eichengreen, B., and F. Ghironi. 1996. “EMU and Enlargement.” Prepared for the Confer-ence on Economic and Monetary Union organized by D. G. EcFin of the European Com-mission, Brussels, March 21–22, 2001. Revised version appears in EMU and EconomicPolicy in Europe, edited by Marco Buti and Andre Sapir. Edward Elgar, 2003.
Eichengreen, B., and A. Taylor. 2002. “The Monetary Consequences of a Free Trade Area ofthe Americas.” Paper prepared for the conference “FTAA and Beyond: Prospects for Inte-gration in the Americas.” BID–INTAL/Harvard University, Uruguay.
Eichengreen, B., A. Rose, and C. Wyplosz. 1996. “Contagion Crises.” Working Paper 6370.Cambridge, Mass.: National Bureau of Economic Research.
Estevadeordal, A., B. Frantz, and R. Saez. 2001. “Exchange Rate Volatility and InternationalTrade in Developing Countries.” Washington: Inter-American Development Bank.
Fanelli, J., and M. González Rozada. 2003. “Business Cycles and Macroeconomic Policy:Coordination in Mercosur.” Documento de Trabajo 16/2003. Buenos Aires: UniversidadTorcuatro Di Tella, Centro de Investigación en finanzas, Escuela de Economía Empressarial.
Fernández-Arias, E., U. Panizza, and E. Stein. 2002. “Trade Agreements, Exchange Rate Dis-agreements.” Washington: Inter-American Development Bank.
Ffrench-Davis, R., and G. Larraín. 2003. “How Optimal Are the Extremes? Latin Ameri-can Exchange Rate Policies during the Asian Crises.” In From Capital Surges to Drought:Seeking Stability for Emerging Economies, edited by R. Ffrench-Davis and S. Griffith-Jones, pp. 245–68. London: Palgrave/Macmillan.
Ffrench-Davis, R., and L. Villar. 2006. “The Capital Account and Real Macroeconomic Sta-bilization: Chile and Colombia.” In Seeking Growth under Financial Volatility, edited byR. Ffrench-Davis. New York: Palgrave/Macmillan.
Frankel, J., and A. Rose. 1995. “Empirical Research on Nominal Exchange Rates.” In Hand-book of International Economics, Vol. 3, edited by G. Grossman and K. Rogoff. Amsterdam:Elsevier.
———. 1996. “The Endogeneity of the Optimum Currency Area Criteria.” Working Paper4805. Cambridge, Mass.: National Bureau of Economic Research.
Froot, K., and K. Rogoff. 1995. “Perspectives on PPP and Long-Run Real Exchange Rates.”In Handbook of International Economics, Vol. 3, edited by G. Grossman and K. Rogoff.Amsterdam: Elsevier.
Ghymers, C. 2000. “La coordinación de las políticas macroeconómicas en la zona euro: orí-genes, desarrollo y retos actuales, con algunas posibles conclusiones para América Latina.”En La política fiscal en América Latina: Una selección de temas y experiencias de fines ycomienzos de siglo. Serie Seminarios y Conferencias, no. 3. Santiago: Economic Commis-sion for Latin America and the Caribbean (ECLAC).
———. 2001. “Economic Policy Coordination: Main Issues and the Redima Approach forLatin America Countries.” Santiago: ECLAC.
———. 2002. “América Latina y la coordinación de políticas económicas.” Estudios Inter-nacionales 35, no. 138: 71–87.
Giordano, P., and J. Monteagudo. 2002. “Exchange Rate Instability, Trade and RegionalIntegration.” Washington: Inter-American Development Bank.
Giovannini, A., and C. Mayer, eds. 1991. European Financial Integration. Cambridge Uni-versity Press.
Heymann, D., and F. Navajas. 1991. “Coordinación de políticas macroeconómicas: Aspectosconceptuales vinculados con el MERCOSUR.” Working Paper 45. Buenos Aires: ComisiónEconómica para América Latina y el Caribe (CEPAL).
10101-06_Ch06_Redo.qxd 10/5/06 3:07 PM Page 198

macroeconomic coordination in latin america 199
———. 1998. “Coordinación de políticas macroeconómicas en MERCOSUR: Algunasreflexiones.” In Ensayos sobre la Inserción Internacional de la Economía Argentina. WorkingPaper 81. Buenos Aires: CEPAL.
Inter-American Development Bank. 2002. Beyond Borders: The New Regionalism in LatinAmerica. Economic and Social Progress in Latin America. Washington.
Lacunza H., J. Carrera, M. Cicowiez, and M. Saavedra. 2003. “Cooperación macroeconómicaen Mercosur: Un análisis de la interdependencia y una propuesta de coordinación.” Pre-sented in Jornadas de Economía Monetaria e Internacional. Universidad Nacional de la Plata.
Lavagna, R., and F. Giambiagi. 2000. “Hacia la creación de una moneda común: Una prop-uesta de convergencia coordinada de políticas macroeconómica en el MERCOSUR.” InCoordinación de Políticas Macroeconómicas en el MERCOSUR, edited by J. Carrera and F. Sturzenegger: Mexico City: Fondo de Cultura Económica.
Machinea, J. 2003a. “La inestabilidad cambiaria en el Mercosur: causas, problemas y posiblessoluciones.” INTAL–ITD Working Paper IECI-06d. Buenos Aires: INTAL.
———. 2003b. “Currency Crises: A Practitioner’s View.” In Brookings Trade Forum 2002,edited by Susan M. Collins and Dani Rodrik. Brookings.
———. Machinea, José Luis. 2003c. Mercosur: en busca de una nueva agenda. La inestabili-dad cambiaria en el Mercosur: Causas, problemas y posibles soluciones. Buenos Aires: BancoInteramericano de Desarrollo (BID).
Machinea, J., and V. Rappoport. 2004. “Financial Safety Nets and Regional Integration.”Integration and Trade 8, no. 20: 7–44.
Mistry, P. 1999. “Coping with Financial Crisis: Are Regional Arrangements the MissingLink?” In International Monetary and Financial Issues for the 1990s, Vol. 10. Geneva:United Nations Conference on Trade and Development (UNCTAD).
Obstfeld, M. 2000. “International Macroeconomics: Beyond the Mundell-Fleming Model.”University of California, Berkeley, Institute of Business and Economic Research.
Ocampo, J. A. 1999. “Reforming the International Financial Architecture: Consensus andDivergences.” Temas de Coyuntura (CEPAL), no. 1.
Ocampo, J. A., and M. L. Chiappe. 2003. Counter-Cyclical Prudential and Capital AccountRegulations in Developing Countries. Expert Group on Development Issues (EGDI). Stock-holm: Swedish Ministry for Foreign Affairs, Almqvist & Wiksell International.
Rodrik, D. 2003. “Growth Strategies.” Working Paper 10050. Cambridge, Mass.: NationalBureau of Economic Research.
Rogoff, K. 2002. “Rethinking Capital Controls: When Should We Keep an Open Mind?”Finance and Development 39, no. 4: 55–56.
Rozenwurcel, G. 2003. “The Collapse of the Currency Board and the Hard Way Back toNormality in Argentina.” www.networkideas.org/featart/featart_Argentina.htm (May).
Zahler, R. 2001. “Estrategias para una cooperación monetaria.” Integración & Comercio(Buenos Aires, BID–INTAL) 5, no. 13 (January–April).
10101-06_Ch06_Redo.qxd 10/5/06 3:07 PM Page 199

200
The countries of Latin America and the Caribbean have made significantprogress in building a system of institutions for financial cooperation and
integration. In addition to promoting productive and social investment financingvia development banks, another aim of financial integration has been to facilitateintraregional trade and help finance the countries’ short-term liquidity needs.
The foreign debt crisis of the 1980s undermined regional financial coopera-tion and integration, except among the institutions covering the countries of theAndean Community, which were more dynamic during the 1980s crisis. Startingin the 1990s, there was a revival in financial integration schemes. Indeed, in thesubset of member countries of the Andean Community, the Central AmericanCommon Market, and the Caribbean Community, the subregional banks nowcontribute approximately 46 percent of the funding from development banks.
To deepen regional and subregional financial integration and cooperation,these institutions must be able to respond to the new challenges and demandsarising from changes in national and international financial systems. However,support for balance-of-payments financing requirements continues to be one of
Subregional Financial Cooperation: The Experiences of Latin America and the Caribbeandaniel titelman
7
The author wishes to thank Andras Uthoff and José Antonio Ocampo for their comments. Heis also grateful to Gabriela Clivio and Cecilia Vera for their efficient work on statistics and con-structing indicators.
10101-07_Ch07_Redo.qxd 10/5/06 3:08 PM Page 200

subregional financial cooperation 201
the weakest areas of financial cooperation in the region. In addition to being animportant source of funding, the development banks should facilitate the coun-tries’ access to international financial markets by taking greater advantage oftheir credit risk rating and of instruments that help the countries to accessfinancial resources in international capital markets.
This chapter examines the financial cooperation dynamic in the countriesof the Andean Community, the Central American Common Market, and theCaribbean Community. In particular, it discusses the development of the AndeanDevelopment Corporation, the Central American Bank for Economic Integra-tion, the Caribbean Development Bank, and the Latin American Reserve Fund.
Old and New Challenges of Regional Financial Cooperation
Latin America and the Caribbean is one of the regions in the developing worldthat has made the most progress on economic integration. The process of finan-cial and monetary cooperation in the region has been closely linked with thecountries’ commercial integration. Growth in intraregional trade led to the cre-ation of institutions for facilitating payments derived from commercial transac-tions among the countries. Clearing systems and agreements were established.In 1960 the Clearing System for the Central American Common Market wascreated; in 1965 the Agreement on Reciprocal Payments and Credits was set upin the framework of the Latin American Free Trade Association (LAFTA), nowthe Latin American Integration Association (LAIA); and in 1977 the Multi-lateral Clearing System for the Caricom member countries was set up.
At the same time that these payment agreements were implemented, financialinstitutions were created to address collectively the problems of low savings andundeveloped financial systems. The Andean Development Corporation (Corpo-ración Andina de Fomento, CAF) was created in 1968 to serve the Andean Com-munity; the Central American Common Market (CACM) created the CentralAmerican Bank for Economic Integration (CABEI) in 1961; and the Caribbeancountries (Caricom) created the Caribbean Development Bank (CDB) in 1969.
A factor common to all these subregional institutions was their developmentbank status. In general, they were created to support the economic and socialdevelopment of their member countries. Therefore their functions focusedmainly on mobilizing medium- and long-term resources for financing produc-tive investment, preferably in areas that would foster economic complementa-tion among the member countries.
The foreign debt crisis that struck the region in 1982 undermined the opera-tion of the financial integration schemes, hitting clearing systems hardest and
10101-07_Ch07_Redo.qxd 10/5/06 3:08 PM Page 201

202 daniel titelman
development banks to a lesser extent. Of course, the crisis did not have the sameimpact on all of the subregional schemes. While systems of multilateral tradeclearing and balance-of-payments support virtually stopped operating in CentralAmerica and the Caribbean, this did not happen with the LAIA Reciprocal Pay-ments and Credit Agreement or with the Andean group’s financial institutions.
In fact, CAF operations increased significantly beginning in 1983. Between1983 and 1990, CAF approved loans worth U.S.$2.727 billion, correspondingto around 85 percent of total loans approved between 1971 and 1990. CABEIapproved loans worth an average of U.S.$91 million per year, whereas for theperiod 1984–89, CDB approved average annual loans of U.S.$51 million, afigure rather higher than the U.S.$30 million per year approved in the period1971–80 (see table 7-1).
In spite of the difficulties financing external accounts, one of the weakest linksin the region’s financial integration has been the inability to get collectivelyorganized to provide support for balance-of-payments financing needs. In theCentral American sphere, the Central American Monetary Stabilization Fund(Fondo Centroamericano de Estabilización Monetaria, FOCEM) was created toprovide financial support for the member countries’ balance of payments. Itsresources came from contributions from the countries, plus any extraregionalresources that FOCEM was able to capture. In practice, FOCEM operationshave been suspended since 1983.
A different fate awaited the Andean Reserve Fund (Fondo Andinas de Reservas,FAR), created in 1978, which became the Latin American Reserve Fund (FondoLatinoamericano de Reservas, FLAR) when Costa Rica joined in 1989. Origi-nally, this institution was created to provide short-term liquidity for financingbalance-of-payments imbalances of members of the Andean Group (now theAndean Community: Bolivia, Colombia, Ecuador, Peru, and the BolivarianRepublic of Venezuela). FLAR now focuses on providing support to the mem-ber countries’ balance of payments, granting credit and securing third-partyloans; improving the liquidity of international reserve investments; and helpingto harmonize the member countries’ monetary, exchange rate, and financialpolicies. FAR/FLAR played an important role in supporting the short-term li-quidity needs of the Andean countries during the 1980s and 1990s. One of theprincipal benefits it confers on its member countries is timely and rapid accessto resources in excess of the countries’ individual contributions.
Challenges of Financial Integration
Attempts to improve and deepen the processes of financial integration in theregion must recognize previous efforts to build regional and subregional financial
10101-07_Ch07_Redo.qxd 10/5/06 3:08 PM Page 202

Tab
le 7
-1.
Latin
Am
eric
a an
d th
e C
arib
bean
: Loa
ns A
ppro
ved
by D
evel
opm
ent B
anks
, 197
1–90
Mill
ions
of c
urre
nt U
.S. d
olla
rs
Ann
ual a
vera
ge,
Ban
k19
71–8
019
8119
8219
8319
8419
8519
8619
8719
8819
8919
90
IDB
1,29
42,
493
2,74
43,
045
3,56
73,
061
3,03
72,
361
1,68
22,
618
3,88
1W
orld
Ban
k1,
462
3,15
32,
988
3,46
03,
028
3,69
84.
771
5,15
25,
264
5,84
25,
965
Subr
egio
nal b
anks
169
200
238
160
180
224
353
475
664
637
1,11
2C
AF
5621
5883
101
160
264
309
524
474
812
CA
BE
Ia83
141
132
4525
2633
126
7711
019
9C
DB
3039
4932
5438
5640
6353
101
Tot
al2,
925
5,84
65,
970
6,66
56,
775
6,98
38,
161
7,98
87,
610
9,09
710
,958
Sour
ce: P
repa
red
by th
e au
thor
, usi
ng o
ffic
ial d
ata
from
the
Inte
r-A
mer
ican
Dev
elop
men
t Ban
k (I
DB
), W
orld
Ban
k, A
ndea
n D
evel
opm
ent C
orpo
rati
on (C
AF)
,C
entr
al A
mer
ican
Ban
k fo
r E
cono
mic
Int
egra
tion
(C
AB
EI)
, and
Car
ibbe
an D
evel
opm
ent B
ank
(CD
B).
a. F
or C
AB
EI,
the
annu
al a
vera
ge is
for
the
peri
od 1
961–
80.
10101-07_Ch07_Redo.qxd 10/5/06 3:08 PM Page 203

204 daniel titelman
institutions and adapt these institutions to meet the demands that arise fromchanges in national and international financial systems. In the financial sphere,closer integration and increasingly volatile capital flows have heightened the finan-cial vulnerability of the region’s economies, which has led to recurrent financialand economic crises that have undermined their capacity for economic growth.
In this context, numerous authors have argued that strengthening regionaland subregional financial institutions is important in order, first, to comple-ment global institutions, and second, to provide instruments and public goodsthat are provided neither by the international financial system nor by globalfinancial institutions.1 (For the purposes of this essay, we shall concentrate onthe functions appropriate to subregional development banks and to mechanismsfor financial balance-of-payments support.
Since the 1990s, the dynamic of the business cycle in the countries of theregion has been closely correlated with inflows and outflows of financial capital.2
This preponderance of financial variables in determining the cycle is not exclu-sive to the region, but is a phenomenon that has accompanied this phase in theglobalization process, stemming from closer financial integration worldwide. Thismeans that the countries of the region are facing international financial problemsthat are common to all developing and emerging economies. Economic criseshave been marked by problems of financial and commercial contagion typical ofwhat may be called “latest-generation” crises. The 1990s have witnessed a num-ber of crises that reflect components of regional and extraregional contagion.The tequila crisis in 1995 was an example of regional contagion, whereas theAsian crisis of 1997 and the Russian crisis of 1998 were examples of extraregionalcontagion.
Since, in addition to terms-of-trade shocks, there have been external shocksof a financial, exchange rate, or monetary nature affecting the countries’ capac-ity to finance their balance of payments, it is more important than in the past tohave regional institutions to facilitate the capture of resources to cover tempo-rary liquidity requirements. Recent experience shows that, individually, theeconomies of the region have not been successful in mitigating financial shocksand have had to make costly economic adjustments to tackle their liquidityproblems. The economies are unable to generate adequate levels of internationalreserves to cope with sudden changes in capital flows; the international financialsystem has not been capable of providing short-term financing during crisis
1. See Culpeper (this volume); Ocampo (2002a and 2002b); Mistry (1999); Economic Com-mission for Latin America and the Caribbean (2002a); and Agosin (2001).
2. Economic Commission for Latin America and the Caribbean (2002b).
10101-07_Ch07_Redo.qxd 10/5/06 3:08 PM Page 204

periods; and last, even though the IMF did step in with exceptional financing, itimposed very onerous economic conditionalities and was not fast or flexibleenough. Furthermore, added to the difficulties specific to each country, there isa component of regional crisis contagion, which makes it more difficult for thecountries to access financial resources in international markets. For this reason,promoting and expanding institutions such as FLAR is seen to be a key elementof regional financial integration.
In addition to helping to cope with balance-of-payments crises, a regionalfund such as FLAR should promote greater coordination of macroeconomicpolicies, which would lessen vulnerability to regional and extraregional shocks.Lack of harmonization in macroeconomic policies and sharp fluctuations inbilateral exchange rates have conspired against more decisive progress towardcommercial and financial integration among the countries of the region.
In spite of closer financial integration with the rest of the world, the countriesof the region still have severely limited domestic and foreign savings to financeproductive and social investment. In this respect, development banks, as well ascatalyst institutions for medium- and long-term financial resources, continue tobe important for promoting and boosting economic growth. Multilateral devel-opment banks, both regional and subregional, have played an important role inproviding external financing to the region. During the 1990s, multilateraldevelopment banks provided three-quarters of the net capital inflows to coun-tries in the region with a per capita income of less than U.S.$2,000. Theseresources helped in part to offset the adverse effects of external shocks. In coun-tries with a per capita income of between U.S.$2,000 and U.S.$4,000, resourcesfrom multilateral banks represented around 14 percent of net capital inflows.However, in the wealthier countries—that is to say, countries with a per capitaincome of more than U.S.$4,000—resources from multilateral developmentbanks accounted for around 11 percent of total net inflows. Also, multilateraldevelopment banks granted more favorable financial conditions for credits thandid private sources of financing, with lower interest rates and a longer term.3
Since the ability to access foreign capital flows continues to be a key factor inthe economic growth dynamic, development banks must support and facilitateaccess to private external financing in order to improve the term and costs.Since lending by these institutions is generally countercyclical, they also play arole in stabilizing financial flows. An issue of vital importance for the region isfinancial risk management. The weak structure of most national financial sys-tems has hampered financing of productive activity and innovation. Regional
3. Titelman (2002).
subregional financial cooperation 205
10101-07_Ch07_Redo.qxd 10/5/06 3:08 PM Page 205

206 daniel titelman
and subregional development banks must therefore support the emergence ofnew national, subregional, and regional financial instruments.
Over and above providing financial resources, regional and subregional dev-elopment banks must take a more prominent role in the financial developmentof the countries in the region, which evidence varying levels of financial deepen-ing. Legal problems, the supervision and regulation of national financial sys-tems, and the capacity to manage financial risk would all be alleviated by thepresence of subregional financial institutions acting in a complementary capac-ity with more global financial institutions.
Subregional or regional financial institutions can enhance the work of globalinstitutions by playing a complementary role. The ability to incorporate specificregional or subregional requirements into the structure and operation of devel-opment finance institutions enables them to provide development banking,emergency financing, and technical support services. Last, recent experienceshows that the countries’ sense of ownership is crucial to institution buildingand increases their willingness to accept the imposition of conditionalities byfinancial institutions, which leads to greater flexibility for lending resources.4
Subregional Development Banks
Regional and subregional development banks have been major sources of fund-ing for all the economies of the region, in particular for relatively less devel-oped countries. During the period 1990–2003, these institutions approvedcredits to the region worth an average of U.S.$15 billion per year. This figureis almost three times the average annual U.S.$5 billion approved in the period1971–89. During the 1990s, subregional development banks contributedaround 20 percent of total resources, in contrast to only around 5 percent inthe period 1971–90 (see table 7-2).
Development banks have been actively involved in the subregional sphere.The Andean Development Corporation (CAF) was created to support the sus-tainable development and integration of the countries of the Andean Commu-nity, and the countries eligible to receive financial resources therefore include allthe Andean countries (Bolivia, Colombia, Ecuador, Peru, and the BolivarianRepublic of Venezuela). However, CAF membership has grown over time toinclude a very large group of Latin American and Caribbean countries, togetherwith Spain. At present, CAF grants loans and extends lines of credit to corpora-tions, lending institutions, and public and private banks financing foreign trade
4. Ocampo (2002a); Agosin (2001).
10101-07_Ch07_Redo.qxd 10/5/06 3:08 PM Page 206

Tab
le 7
-2.
Latin
Am
eric
a an
d th
e C
arib
bean
: Loa
ns A
ppro
ved
by D
evel
opm
ent B
anks
, 197
1–20
03M
illio
ns o
f cur
rent
U.S
. dol
lars
, unl
ess
othe
rwis
e no
ted
Ann
ual
aver
age,
Ban
k19
71–8
919
9019
9119
9219
9319
9419
9519
9619
9719
9819
9920
0020
0120
0220
03
Loan
s app
rove
dID
B1,
976
3,88
15,
419
6,02
35,
963
5,25
57,
304
6,76
66,
017
10,0
639,
486
5,26
77,
854
4,54
96,
810
Wor
ld B
ank
2,73
55,
965
5,23
75,
662
6,16
94,
747
6,06
14,
438
4,56
36,
040
7,73
74,
064
5,30
04,
366
5,82
1Su
breg
iona
l 25
41,
112
1,57
82,
115
2,56
92,
768
2,70
82,
955
3,48
23,
721
2,65
52,
832
3,85
54,
079
4,17
0ba
nks
CA
F13
481
21,
300
1,77
32,
096
2,16
02,
258
2,31
42,
900
2,67
22,
182
2,32
33,
198
3,29
13,
304
CA
BE
Ia82
199
171
272
402
566
358
569
532
932
336
330
572
680
681
CD
B38
101
108
7070
4392
7351
117
137
179
8510
818
5T
otal
4,96
510
,958
12,2
3413
,800
14,7
0112
,770
16,0
7314
,159
14,0
6219
,824
19,8
7812
,163
17,0
0912
,994
16,8
01
As a
per
cent
age
of th
e to
tal a
ppro
ved
IDB
4035
4444
4141
4548
4351
4843
4635
41W
orld
Ban
k55
5443
4142
3738
3132
3039
3331
3435
Subr
egio
nal
510
1315
1722
1721
2519
1323
2331
25ba
nks
Tot
al10
010
010
010
010
010
010
010
010
010
010
010
010
010
010
0
Sour
ce: P
repa
red
by t
he a
utho
r us
ing
offi
cial
dat
a fr
om I
nter
-Am
eric
an D
evel
opm
ent
Ban
k (I
DB
), W
orld
Ban
k, A
ndea
n D
evel
opm
ent
Cor
pora
tion
(C
AF)
, Cen
tral
Am
eric
an B
ank
for
Eco
nom
ic I
nteg
rati
on (
CA
BE
I), a
nd C
arib
bean
Dev
elop
men
t Ban
k (C
DB
).a.
For
CA
BE
I, th
e an
nual
ave
rage
is fo
r th
e pe
riod
196
1–89
.
10101-07_Ch07_Redo.qxd 10/5/06 3:08 PM Page 207

208 daniel titelman
and working capital operations. In addition, it provides the financial sector withglobal credits and lines of credit for channeling resources to a variety of projectsin the productive sector. It also offers governments and government bodiesdevelopment bank services for special financing of physical infrastructure andintegration projects. Added to this, it provides investment bank services, such asshareholding, acquisition, and guarantee for the issue of securities, and structur-ing and financing projects with limited guarantees (limited-recourse financing,cofinancing, syndicated loans, financial guarantees, and others). Furthermore, itoffers financing for projects to promote human development and integrate mar-ginalized groups (such as indigenous peoples).
In the Caribbean subregion, the Caribbean Development Bank was created in1969 to contribute to the growth and economic development of the Caribbeanmember countries (Caricom) and to promote cooperation and economic inte-gration among them, paying special attention to the needs of the region’s less-developed countries. To this end, the bank has applied the Caricom definitionof less-developed country to the following countries: Anguilla, Antigua andBarbuda, Belize, Dominica, Grenada, Montserrat, Saint Kitts and Nevis, SaintLucia, and Saint Vincent and the Grenadines. Added to these are the Britishoverseas territories of the British Virgin Islands, the Cayman Islands, and theTurks and Caicos Islands. In addition, there are the borrower member coun-tries: Bahamas, Barbados, Guyana, Jamaica, and Trinidad and Tobago. TheCDB provides financing to the governments of its borrower member countriesand to public and private sector entities from those countries. Furthermore, itgrants loans to private sector entities without a government guarantee andinvests in shares in those enterprises.
On the Central American isthmus, the Central American Bank for EconomicIntegration (CABEI) gears its activities toward investment financing, givingprecedence to the export, basic services (infrastructure, electricity, communica-tions), and agricultural sectors, and in general to projects in the productive sectorthat foster economic complementation among the member countries. It operatesseveral funds, the most prominent of which are the Central American EconomicIntegration Fund (Fondo Centroamericano de Integración Económica), theHousing Finance Fund (Fondo Financiero de la Vivienda), the Export Promo-tion Fund (Fondo para la Promoción de Exportaciones), the Fund for Promo-ting Central American Exports (Fondo de Fortalecimiento de ExportacionesCentroamericanas), the Technical Cooperation Fund (Fondo de CooperaciónTécnica), and the Regional Debt Conversion Fund (Fondo Regional para laConversión de Deuda). The member countries eligible for financing are CostaRica, El Salvador, Guatemala, Honduras, and Nicaragua.
10101-07_Ch07_Redo.qxd 10/5/06 3:08 PM Page 208

subregional financial cooperation 209
A fourth and smaller institution, FONPLATA (Fondo Financiero para elDesarrollo de la Cuenca del Plata; in English, Financial Fund for the Developmentof the Plata River Basin), was created in 1971 to act as the financial body of theCuenca del Plata treaty.5 Its main objective is to finance studies, projects, programs,and works intended to promote the economic development and the physical inte-gration of the Plata River basin. The fund began operating in 1977 with initial capi-tal of U.S.$160 million contributed by its member states (33 percent by Argentinaand Brazil and 11.11 percent by Bolivia, Paraguay, and Uruguay). As of December2003, the total authorized capital of the fund was U.S.$390 million. From thebeginning of its activities up to December 2003, FONPLATA had approved sixty-two financing operations for a total of approximately U.S.$593.5 million. Thetotal financing of projects carried out by the fund, together with local contributionsand resources from other multilateral as well as national sources, amounts toU.S.$2,482 million. The fund has mainly financed preinvestment and investmentprojects in the transport sector (70 percent of the total).6
Regional and subregional development banks are able to offer a wide range ofinstruments and services (see table 7-3). These are linked largely with the provi-sion of financing, access to financial markets, financial development, technicaltraining, and disaster financing. The only development bank authorized to pro-vide funds for balance-of-payments support is CABEI, via the Central AmericanMonetary Stabilization Fund. However, as mentioned earlier, this fund ceasedto operate in the early 1980s. As illustrated below, the importance and use ofthe instruments also differ significantly from one subregional bank to another.
Relative Importance of Subregional Banks
Beginning in the 1990s, the relative importance of financing from subregionaldevelopment banks increased (see tables 7-4 and 7-5). In the Andean countries,CAF contributed around 56 percent of the total resources approved by the devel-opment banks for the Andean Community countries. From 1995 on, except in1998–99, CAF has been the main source of multilateral financing for theAndean countries, attaining 68 percent of the total approved during 2002.
On the Central American isthmus, CABEI has also increased its loans,albeit to a lesser extent and with more ups and downs. CABEI had significantgrowth between 1995 and 1998 (from U.S.$358 million approved in 1995 to
5. Signatories to that 1969 treaty were Argentina, Bolivia, Brazil, Paraguay, and Uruguay. Theobjective of the treaty is to join efforts to promote economic development and the physical integra-tion of the member countries.
6. See www.fonplata.org.
10101-07_Ch07_Redo.qxd 10/5/06 3:08 PM Page 209

210 daniel titelman
Table 7-3. Products and Services of Multilateral Financial Institutions
Worldwide Regional Subregional
Product or service World Bank IDB CABEI CAF CDB
Investment x x x x xPreinvestment x x x xCofinancing x x x x xTrust funds x x x x xGuarantees x x xAccess to the capital market x x x xTechnical cooperation and counseling x x x x xTraining x x x x xCapacity building x x xSecond-tier banking x x x xDevelopment of the capital market x x xSectoral restructuring x x x x xVenture capital for SMEs x x x
and rural enterprisesBalance-of-payments support xDisasters x x x x x
Source: Maldonado (2003).
Table 7-4. Loans Approved by Development Banks, 1995–2004Millions of current U.S. dollars
1995 1996 1997 1998 1999 2000 2001 2002 2003 2004
Andean Community countriesIDB and 2,133 1,924 1,392 2,996 2,558 2,152 1,917 1,559 4,124 2,329
World BankCAF 2,258 2,314 2,900 2,673 2,182 2,323 3,198 3,290 3,304 3,503
Central American Common Market countriesIDB and 876 626 593 1,233 1,027 513 1,079 1,043 513 760
World BankCABEI 358 569 532 932 336 330 572 680 681 800
Caricom countriesIDB and 345 506 176 189 334 270 310 326 242 221
World BankCDB 92 73 51 117 137 179 85 108 185 94
Source: Prepared by the author using the annual reports of the Inter-American Development Bank (IDB),World Bank, Andean Development Corporation (CAF), Central American Bank for Economic Integration(CABEI), and Caribbean Development Bank (CDB).
10101-07_Ch07_Redo.qxd 10/5/06 3:08 PM Page 210

U.S.$932 million in 1998), before shrinking significantly in 1999 and 2000and recovering in 2001. In comparison with other multilateral sources (theWorld Bank and Inter-American Development Bank [IDB]), CABEI has con-tributed an average of around 40 percent of the total financing approved bythese institutions for the Central American countries, reaching a maximum of57 percent in 2003. Disbursements increased from U.S.$310 million in 1995 toU.S.$864 million in 2002, when they were equivalent to 51 percent of total dis-bursements by the multilateral institutions.
In the Caribbean region, the CDB also increased its loan portfolio, fromU.S.$108 million approved in 1991 to U.S.$179 million approved in 2000, onlyto fall again and recover in 2003, when it approved loans worth U.S.$185 mil-lion. As a source of multilateral financing for the Caribbean subregion, itaccounted for around 30 percent of total loan approvals between 1992 and 2002.Disbursements grew from U.S.$59 million in 1995 to U.S.$119 million in2002, and in the period 1995–2002 they were equivalent to 23 percent of thetotal disbursed by multilateral development banks.
Measured in terms of the gross domestic product (GDP), subregional banks’financing flows are equally significant. For the period 1995–2004, CAF approvedloans equivalent to 1.0 percent of the GDP of the Andean Community countries.During the period 1995–2004, CABEI approved average resources equivalent
Table 7-5. Loans Approved by Development Banks, 1995–2004Percent of GDP
Bank 1995 1996 1997 1998 1999 2000 2001 2002 2003 2004
Andean Community countriesIDB and 0.9 0.8 0.5 1.1 1.0 0.8 0.7 0.6 1.6 0.7
World BankCAF 0.9 0.9 1.0 1.0 0.8 0.8 1.1 1.2 1.3 1.1
Central American Common Market countriesIDB and 2.0 1.4 1.2 2.3 1.8 0.9 1.8 1.6 0.8 1.0
World BankCABEI 0.8 1.3 1.1 1.7 0.6 0.6 0.9 1.0 1.0 1.1
Caricom countriesIDB and 2.0 2.7 0.9 0.9 1.5 1.1 1.3 1.3 0.9 0.8
World BankCDB 0.5 0.4 0.3 0.6 0.6 0.8 0.3 0.4 0.7 0.3
Source: Prepared by the author using annual reports of the Inter-American Development Bank (IDB), WorldBank, Andean Development Corporation (CAF), Central American Bank for Economic Integration (CABEI)and Caribbean Development Bank (CDB).
subregional financial cooperation 211
10101-07_Ch07_Redo.qxd 10/5/06 3:08 PM Page 211

212 daniel titelman
to 1.0 percent of the GDP of the Central American countries. The resourcesapproved by the CDB were on average around 0.5 percent of the Caricom coun-tries’ GDP (see table 7-5).
Term and Sectoral Allocation
Over the past decade, CAF has progressed significantly in its capacity to providemedium- and long-term resources. The proportion of long-term resources hasincreased considerably more than short-term resources. While for the period1991–2000 long-term loans represented around 50 percent of the total approved,between 2001 and 2003 they rose to 80 percent. A significant part of this financ-ing was directed toward infrastructure investment, accounting for 24 percent in1991–2000 and rising to 50 percent in 2001–03. The productive sector alsoreceives major loan allocations, absorbing 15 percent of the total approved in2001–03, followed by the social sector (see table 7-6). This contrasts with theIDB and the World Bank, which in recent years have directed a major part oftheir financing to the social sector.
Between 1970 and 2003, the CDB approved financing for a total of someU.S.$2.7 billion, which went mainly to infrastructure (30 percent), financial
Table 7-6. CAF Loans by Economic Sector, 1971–2003Millions of current U.S. dollars
Cumulative Cumulative 1971–90 1991–2000 2001 2002 2003
Productive sectors 1,379 4,209 985 122 362Infrastructure 628 5,383 1,290 1,872 1,667Social sectors 0 922 353 536 311Economic reforms 0 528 195 0 172Long-term 2,007 11,042 2,823 2,530 2,512Short-term 953 10,934 375 760 792
Total approved 2,960 21,976 3,198 3,290 3,304
As a percentage of the total approvedProductive sectors 47 19 31 4 11Infrastructure 21 24 40 57 50Social sectors 0 4 11 16 9Economic reforms 0 2 6 0 5Long-term 68 50 88 77 76Short-term 32 50 12 23 24
Total 100 100 100 100 100
Source: Prepared by the author using Andean Development Corporation annual reports.
10101-07_Ch07_Redo.qxd 10/5/06 3:08 PM Page 212

Table 7-7. CDB Total Financing by Economic Sector, 1970–2003a
Millions of U.S. dollars, unless otherwise noted
Cumulative Cumulative 1970–89 1990–2000 2001 2002 2003
Productive sector 344 120 0 13 32Infrastructure 604 136 10 24 33Social sector 228 31 29 10 11Natural disasters 81 0 5 41 0Other financing 668 147 75 26 28Total approved 1,925 434 119 114 189
As a percentage of the total approvedProductive sector 18 28 0 12 17Infrastructure 31 31 8 21 17Social sector 12 7 24 9 6Natural disasters 4 0 4 36 0Other financing 35 34 63 23 15
Total 100 100 100 100 100
Source: Prepared by the author using data from the Caribbean Development Bank.a. Total financing includes loans, grants, and equity.
markets, and financing activities (34 percent), and to a lesser extent to theproductive sector (18 percent), the social sector (11 percent), and natural dis-asters (4 percent). In recent years the CDB has mobilized more resources forfinancing social sector projects and tackling the aftereffects of natural disas-ters, which accounted for 36 percent of the resources approved in 2002 (seetable 7-7).
CABEI has traditionally channeled an important part of its resources tofinancing infrastructure, which accounted for 45 percent of approved resourcesbetween 2001 and 2003. Financing for the productive sector increased in relativeimportance from 14 percent of loans approved in the period 1961–90 to 42 per-cent in the period 1991–2003 (see table 7-8).
Credit Risk Rating, Access to Financial Markets, and Countercyclical Financing
One of the main characteristics of the Latin American and Caribbean econo-mies in recent years has been their irregular access to international capital flows.This reflects flaws in the market at the level of both the countries and the inter-national financial system. In this context, subregional development banks can
subregional financial cooperation 213
10101-07_Ch07_Redo.qxd 10/5/06 3:08 PM Page 213

214 daniel titelman
play a significant role in intermediating financing funds from international mar-kets to the countries of the region.
As can be seen in table 7-9, CAF, CDB, and CABEI have a much higherinvestment rating than their member countries (A, AAA, and Baa1, respectively),based, among other things, on the fact that they have exceeded the Basel reserverequirements, to the tune of 30 percent, 43 percent, and 47 percent respectively in2002. These institutions therefore find themselves in a position that allows themto intermediate private financing funds at a lesser cost than their member coun-tries. This can facilitate access to financing for a number of relatively less devel-oped countries, while reducing the cost of these resources.
While the main function of subregional development banks is to generatemedium- and long-term financial resources, they must also play a role in stabi-lizing financial flows and providing countercyclical financing. Experience showsthat these institutions did indeed contribute in this way during the 1980s and1990s. In general, although they have differing dynamics, development bankshave increased their loan approvals during crisis periods and, in addition, theyhave had a countercyclical component (see figure 7-1). The decline in privatefinancial flows toward the Andean Community countries, beginning in 1999,was partially offset by an increase in flows from CAF, which reduced the nega-tive effect of diminished private flows.
Table 7-8. CABEI Loans by Economic Sector, 1961–2003a
Millions of U.S. dollars, unless otherwise noted
Cumulative Cumulative 1961–90 1991–2000 2001 2002 2003
Productive sector 318 1,299 156 203 315Infrastructure 1,382 1,149 180 269 321Social sector 311 448 54 96 93Other 228 152 10 1 0
Total approved 2,239 3,048 400 569 729
As a percentage of the total approvedProductive sector 14 42 39 36 43Infrastructure 62 38 45 47 44Social sector 14 15 14 17 13Other 10 5 2 0 0
Total 100 100 100 100 100
Source: Prepared by the author using data from the Central American Bank for Economic Integration(CABEI).
a. Amounts are as of June of every year.
10101-07_Ch07_Redo.qxd 10/5/06 3:08 PM Page 214

Share Capital and Sense of Ownership
One argument in favor of regional and subregional financial institutions is thatcountries eligible to receive resources have more say and decisionmaking powerto influence the policies and instruments of such institutions than of globalinstitutions. As a result, regional and subregional financial institutions havemore flexibility to disburse resources in a timely manner, with conditionalitiesthat, in many instances, are more in line with the countries’ needs and realities.As the countries feel better represented, it makes them more likely to complywith the financial commitments they acquire with such institutions.
Table 7-9. Long-Term Debt Rating in Foreign Currency, according to Moody’s
Regional group Rating Loan
CACMCosta Rica Ba1El Salvador Baa3 CABEIGuatemala Ba2 Baa1Honduras B2Nicaragua B2
CaricomBarbados Baa2Belize Ba3GuyanaJamaica B1Surinam B1Trinidad and Tobago Baa3 CDBAntigua and Barbuda AAA (S&P)DominicaGrenadaMontserratSaint Kitts and NevisSaint LuciaSaint Vincent and the Grenadines
Andean CommunityBolivia B3Colombia Ba2Ecuador Caa1 CAFPeru Ba3 AVenezuela (Bolivarian Rep. of) B
Source: Prepared by the author using data from the Andean Community, the Central American Bankfor Economic Integration, the Caribbean Development Bank, and Bloomberg.
subregional financial cooperation 215
10101-07_Ch07_Redo.qxd 10/5/06 3:08 PM Page 215

–10,000
–5,000
0
5,000
10,000
1991 1992 1993 1994 1995 1996 1997 1998 1999 2000 2001 2002 2003
–2
0
2
4
6
8
CAF loansFinancial balance plus errors and omissions
CABEI loansFinancial balance plus errors and omissions
CDB loansFinancial balance plus errors and omissions
GDP growth
A. Andean CommunityFinancial flows and loans (millions of U.S. $) Growth rate (percent)
B. Central American Common MarketFinancial flows and loans (millions of U.S. $) Growth rate (percent)
1991 1992 1993 1994 1995 1996 1997 1998 1999 2000 2001 2002 2003
GDP growth
5001,0001,5002,0002,5003,0003,5004,000
1
2
3
4
5
6
C. CaricomFinancial flows and loans (millions of U.S. $) Growth rate (percent)
1991 1992 1993 1994 1995 1996 1997 1998 1999 2000 2001 2002 2003
GDP growth
500
1,000
1,500
2,000
2,500
3,000
1
2
3
4
5
Source: Prepared by the author on the basis of data from the countries and from the Andean Commu-nity, Central American Bank for Economic Integration, and Caribbean Development Bank.
a. Private capital has been estimated from the financial balance (FB) and the errors and omissions(E&O) of the balance of payments.
Figure 7-1. GDP Growth, Loan Approvals, and Inflow of Private Capital,1991–2003a
10101-07_Ch07_Redo.qxd 10/5/06 3:08 PM Page 216

subregional financial cooperation 217
The main shareholders of CAF are the Andean countries, which own around96 percent of its share capital and are the chief recipients of funds, with the re-maining 4 percent of shares distributed among Brazil, Chile, the DominicanRepublic, Jamaica, Mexico, Panama, Paraguay, Spain, Trinidad and Tobago,and Uruguay. The CAF shareholder structure means that the Andean countriestake an active part in defining the corporation’s objectives, ensuring greater har-monization between the institution’s activities and the countries’ requirements.Unlike in CAF, CDB shareholders include countries from other regions of theworld, such as Germany, Italy, the United Kingdom, Canada, and TaiwanProvince of China, together with Colombia, Mexico, and the BolivarianRepublic of Venezuela from the region. Member countries eligible for financingrepresent 57 percent of the share capital. The CACM member countries own72 percent of the share capital of CABEI. The remainder is distributed amongTaiwan Province of China (11 percent), Mexico (9 percent), and Argentina andColombia (4 percent each).
In comparative terms, CAF has a very good recovery rate for its loan port-folio. Between 1999 and 2003, which were economically difficult years for theregion, CAF had almost no delinquency in its loan portfolio (see table 7-10).
Development banks have centered their financial management on grantingcredits, as well as providing supplementary nonfinancial services. Only recentlyhave they started using new instruments for facilitating access to capital mar-kets. The standardization of products and processes has been shown to have asignificant impact on reducing intermediation costs and on facilitating access tonew forms of asset financing, which is a positive area for development banks tobreak into. Trust management, the provision of guarantee funds and insurance,and asset securitization are all promising activities. For instance, acting in asecond-tier capacity, development banks can perform credit securitization. Thisis where subregional development banks buy portfolios of callable loans from
Table 7-10. CAF Loan Portfolio Delinquency, 1999–2003
Loan type 1999 2000 2001 2002 2003
Portfolio of outstanding loans 4,188 4,478 5,455 6,062 6,597(millions of U.S. dollars)
Recovered/mature loans 100 100 100 100 100(percent)
Delinquency as a percentage 0.07 0.12 0.00 0.00 0.00of the loan portfolio
Source: Prepared by the author, using data from the countries, the Andean Development Corporation(CAF), and the Inter-American Development Bank (IDB).
10101-07_Ch07_Redo.qxd 10/5/06 3:08 PM Page 217

218 daniel titelman
first-tier commercial banks or from national development banks, package them,and place them on the securities market. This allows them to transfer the creditrisk to the securities market, giving national banks new lending capacity.
Though not new, loan guarantee and insurance schemes have attracted grow-ing interest in recent years as instruments for facilitating access to financing. Thistype of instrument reduces the financial risk and credit transaction costs, whichshould result in better terms and conditions. Since subregional development bankshave a greater capacity to distribute risk than national banks, they can play animportant role in this type of instrument. Guarantee funds can be used to supportother instruments that improve and facilitate financial intermediation for produc-tive development, such as the venture capital industry. In Latin America and theCaribbean, little use is made of venture capital funds for financing investment.
To promote their role in this type of activity, subregional development banksshould forge closer links with national development banks to create synergiesbetween national financial instruments and subregional instruments. Sub-regional banks could also provide technical assistance to harmonize the variousinstruments and ensure that they have legitimacy in the various national mar-kets, to train investors in using these instruments, and to finance the cost of ini-tiating and implementing the new instruments.
Balance-of-Payments Support and Regional Reserve Funds
One of the weakest links in regional financial integration is support for balance-of-payments financing. The only institution in the region active in this field isthe Latin American Reserve Fund (FLAR), which currently covers Bolivia,Colombia, Costa Rica, Ecuador, Peru, and the Bolivarian Republic of Venezuela.FLAR activities have three objectives: to provide financial support for its membercountries’ balance of payments; to improve the terms for its member countries’reserves investments; and to help to harmonize its member countries’ monetaryand financial policies.
In order to provide balance-of-payments financing, FAR/FLAR operates as acredit cooperative in which the member countries’ central banks are able to takeloans in proportion to their capital contributions. There are different creditfacilities:
—Credits for balance-of-payments support are issued for a three-year term,with a one-year grace period, capped at 2.5 times the paid-up capital (except forEcuador and Bolivia, where it is 3.5 times the paid-up capital), and theirapproval requires the consent of the board of directors.
10101-07_Ch07_Redo.qxd 10/5/06 3:08 PM Page 218

—Credits for restructuring the external national debt are issued for a three-year term, with a one-year grace period, capped at 1.5 times the paid-up capital,and their approval requires the consent of the board of directors.
—Liquidity credits are issued for a term of up to one year, capped at 1.0 timesthe paid-up capital, and their approval requires the authorization of the chiefexecutive officer.
—Standby credits are issued for a term of up to six months, capped at 2.0 timesthe paid-up capital, and their approval requires the authorization of the chief exec-utive officer.
—Treasury credits (repos) are issued for a term of one to thirty days, cappedat 2.0 times the paid-up capital and 50 percent collateralized, and their approvalrequires the authorization of the chief executive officer.
—The Andean peso is an accounting unit created to facilitate paymentbetween the central banks and other authorized holders. However, this currencyhas been little used.
Relative Importance
Between its creation and the end of 2003, FAR/FLAR disbursed credits worth atotal of U.S.$4.9 billion, consisting chiefly of credits for balance-of-paymentssupport and liquidity credits. During the worst years of the debt crisis, 1982–84,FAR/FLAR increased its resource contribution significantly. The same happenedin the 1995 and 1998–99 crises (see table 7-11).
During the period 1978–2003, FAR/FLAR contributed average resourcesequivalent to 60 percent of IMF exceptional financing to the Andean Commu-nity countries. In the 1978–89 period, FAR/FLAR channeled resources of aroundU.S.$3 billion, of which Ecuador received 25 percent; Bolivia and Colombiaaround 23 percent each; Peru, 20 percent; and the Bolivarian Republic ofVenezuela, 9 percent. Of the U.S.$1.9 billion disbursed during the period1990–2004, Ecuador received 46 percent; Peru, 26 percent; Bolivia, 10 percent;Costa Rica, 8 percent; Colombia, 6.5 percent; and the Bolivarian Republic ofVenezuela, 1 percent. For the beneficiary countries, these funds have helped sig-nificantly to relieve liquidity restrictions. Measured in export terms, these flowshave reached major proportions in the different countries. In Bolivia, for exam-ple, flows were equivalent to 30 percent of exports in 1985–86; in Peru they were11 percent in 1991; in Ecuador, 11 percent in 1998; and in Colombia, 12 per-cent in 1984. From the international reserves perspective, the figures are evenhigher, with Bolivia showing flows equivalent to 35 percent of its internationalreserves in 1985–86; Peru, 13 percent in 1991; Ecuador, 28 percent in 1998;and Colombia, 30 percent in 1984.
subregional financial cooperation 219
10101-07_Ch07_Redo.qxd 10/5/06 3:08 PM Page 219

Table 7-11. FAR/FLAR Disbursements and IMF Exceptional Financing, 1978–99 a
Millions of U.S. dollars
1978 1979 1980 1981 1982 1983 1984 1985 1986 1987 1988 1989
FAR/FLAR disbursementsb
Bolivia 39 53 53 53 30 165 190 28 96Colombia 50 529 85Ecuador 105 67 127 34 250 93 54Costa RicaPeru 15 18 195 20 130 240Venezuela 271
(Bolivarian Rep. of )Total 15 18 39 53 158 364 686 284 440 291 251 390
IMF exceptional financing c
Bolivia 38 11 96 27 19 135 91 58Ecuador 218 40 86 89 49 78 20Costa Rica 27 20 62 119 35Peru 107 229 145 331 176 107Venezuela 974
(Bolivarian Rep. of )Total 145 267 261 62 358 532 147 121 224 49 169 1,052
220 daniel titelman
An important aspect of FAR/FLAR funding is its timeliness and speed, and ithas always contributed crisis funding to its member countries with a clear anti-cyclical impact (see figure 7-2). In some cases, FAR/FLAR was the only institu-tion to contribute resources for crisis situations, as was the case for Peru in 1988,when its GDP fell by 8.4 percent and FAR/FLAR disbursed resources worthU.S.$130 million, whereas the IMF contributed no emergency financing.
Bolivia and Ecuador are the two countries to have received the most FAR/FLAR disbursements. These countries are granted privileged access to this fund:they can use 3.5 times their capital for balance-of-payments support credits,whereas other countries can use only 2.5 times their capital. As table 7-12shows, when the debt capacity with FAR/FLAR is added to the member coun-tries’ international reserves, the ratio of short-term debt to international reserves
10101-07_Ch07_Redo.qxd 10/5/06 3:08 PM Page 220

1990 1991 1992 1993 1994 1995 1996 1997 1998 1999 2000 2001 2002 2003
121 48 20125
117 234 34 494156
129 40323
390 451 20 234 34 494 125 156
31 31 51 44 26 49 23 46 23 15 2432 25 142 150 48 98
76 6897 221
1,843 317 508
1,906 449 57 897 186 26 557 244 46 23 165 72 98
subregional financial cooperation 221
drops significantly in Bolivia, Ecuador, and Costa Rica, countries that con-tribute a smaller quota to the IMF.
Financing and Sense of Ownership
FAR/FLAR resources come mainly from paid-up capital from the membercountries, which defines their debt capacity with the fund. In December 2003,of its equity of U.S.$1,554 million, 90 percent came from paid-up capital(U.S.$1,386), 9 percent from reserves, and 1 percent from net profits. The mem-ber countries have always paid off their loans with FAR/FLAR, even in situationsof moratorium on external national debt. For example, during the 1980s and1990s, Peru and Ecuador restructured their international obligations, defaultingin international financial markets. However, these countries continued to comply
Source: Prepared by the author using data from the countries, the Latin American Reserve Fund, and the InternationalMonetary Fund.
a. The FAR/FLAR accounting year is from July to June; for the IMF it is a calendar year.b. FAR/FLAR contingency financing is not detailed by country because it is zero for every year. The same applies to disburse-
ments, because of debt restructuring, except for 1995 and 2003, when funds worth U.S.$200 million and U.S.$156 million weredisbursed to Ecuador and Costa Rica, respectively. Also, not included in FAR/FLAR disbursements by country are countries thatalways had zero disbursements for any reason during the period 1978–2004.
c. IMF disbursements do not include the reserve tranche.
10101-07_Ch07_Redo.qxd 10/5/06 3:08 PM Page 221

222 daniel titelman
with their obligations to FAR/FLAR, an indication that the member countries haveendowed it with preferred-creditor status.
Preferred-creditor status reflects a number of factors. One is a sense of owner-ship, which has been reflected in speedy and timely financing, owing to the factthat loan approvals require the authorization of either the board of directors,which is made up of the member countries’ central banks, or the chief executiveofficer, depending on the type of credit. This has given it an operational advan-tage over the IMF, which is not necessarily reflected in the amounts, but isreflected in the timeliness and relevance of the credits. Another is that the senseof ownership has been reflected in rules stipulated in the central banks’ articlesof agreement and accounting rules. Under these rules, the central banks mustregister any loans granted by FAR/FLAR as liabilities in the international re-serves account, thereby providing an additional guarantee of repayment. Atpresent, FAR/FLAR has a Moody’s rating of Aa2 and a Standard & Poor’s rat-ing of A+. These ratings reflect the preferred-creditor status of FAR/FLAR.FLAR member countries have consistently honored their obligations, even
Figure 7-2. FLAR Member Countries: GDP Growth and FLAR Disbursements,1978–2003
–6
–4
–2
0
2
4
6
8
10
1979 1981 1983 1985 1987 1989 1991 1993 1995 1997 1999 2001
GDP growth rate of membercountries (percent)
–375
–175
25
225
425
625
FLAR disbursements(U.S. $ millions)
GDP growth rate
FLAR disbursements
Source: Prepared by the author, using data from the countries and figures from the Latin American Reserve Fund.
10101-07_Ch07_Redo.qxd 10/5/06 3:08 PM Page 222

while encountering severe economic stress and being in default to their com-mercial creditors, giving it repayment priority over other creditors in the eventof a moratorium, with the result that FLAR has a zero default record in its basicloan operations.7
Feasibility of Expanding FLAR Regional Coverage
In spite of prudent and relatively stable macroeconomic management by manyof the countries of the region, they have proven to be highly sensitive to volatil-ity in international capital movements. This vulnerability reflects flaws in inter-national financial markets, insufficiently developed domestic financial markets,and the countries’ low level of international reserves, which has made themunable to cope with problems of contagion and speculative attacks on their cur-rencies. Therefore it is of paramount importance to boost regional financialcooperation by strengthening a regional reserve fund.
subregional financial cooperation 223
7. Moody’s (www.moodys.com); Standard & Poor’s (www.standardandpoors.com).
Table 7-12. Impact of FAR/FLAR on Financial Vulnerability: Short-Term Debtand International Reserves, March 2003Millions of dollars, except where indicated
Venezuela Costa (Bolivarian
Bolivia Colombia Rica Ecuador Peru Rep. of )
Subscribed capital 234 469 234 234 469 469Paid-up capital 157 313 133 157 313 313IMF quotas 233 1,053 222 414 878 3,721Short-term debt 370 3,800 1,499 2,316 2,335 3,720International reserves 893 10,844 1,497 1,004 9,721 12,107Short-term debt/ 41 35 100 231 24 31
international reserves (percent)
Short-term debt/increased 26 33 82 149 22 29international reserves (percent)a
Source: Prepared by the author using data from the countries, the Latin American Reserve Fund, andthe International Monetary Fund.
a. The quotient of short-term debt over increased international reserves is calculated by adding tointernational reserves the debt capacity in FAR/FLAR, which is equal to 2.5 times the paid-up capital,except for Bolivia and Ecuador, where it is 3.5 times.
10101-07_Ch07_Redo.qxd 10/5/06 3:08 PM Page 223

224 daniel titelman
In an examination of the viability of expanding the FLAR area of coverage,Agosin argued that, despite the significant covariance between the capital flowsto the different countries of the region, it is not so great as to make a regionalreserve fund financially unviable.8 Insofar as crises in the region have a clearsequential component, a regional fund is feasible and, furthermore, could helpto curb mechanisms of crisis transmission between countries. If this fundwere endowed with 15 percent of the reserves of the eleven countries of theregion (including all the large countries, except Mexico), it could provide financ-ing to cope with capital outflows equivalent to the entire short-term foreigndebt of all the countries in question.9 Thus by contributing around 15 percentof their international reserves, the countries could help to resolve short-termfinancial problems.
FLAR should not focus solely on providing support for balance-of-paymentsfinancing and short-term liquidity; it should also support coordination of themacroeconomic and monetary policies of the countries in the region. The factthat the countries feel a greater sense of ownership of this institution facilitatesuse of the fund to promote the coordination of monetary, exchange rate, andfiscal policies. FLAR, together with the member countries’ central banks, couldpromote periodic assessments of the progress of the economies, as well as help toestablish common standards for regulation and financial supervision. Steppingup the regional effort to monitor the countries’ economic performance andhelping to establish early warning systems for crisis risk could alleviate conta-gion problems and reduce financial vulnerability.
Summary and Conclusions
The countries of Latin America and the Caribbean have succeeded in building amajor system of regional and subregional financial institutions, which was under-mined by the foreign debt crisis of the 1980s. The effects of this crisis were notuniform throughout the various subregions and institutions. In general, clearingagreements, and to a lesser extent development banks, were the hardest hit.However, FAR/FLAR discharged its duty of providing balance-of-payments sup-port. Within the subregional sphere, the financial institutions of the AndeanCommunity were the least affected, and during the 1980s they maintained a bet-ter performance than those of the Central American Common Market or theCaribbean Community.
8. See Agosin (2001).9. Agosin (2001).
10101-07_Ch07_Redo.qxd 10/5/06 3:08 PM Page 224

The participation of subregional development banks has increased signifi-cantly since the 1990s, growing at an annual rate of around 10 percent, to thepoint where they now channel roughly 46 percent of this type of financing tothe Andean Community, CACM, and Caricom countries. CAF is the mostdynamic and has mobilized the largest volume of resources. Loans have tendedto favor countries with a lower relative income and have focused mainly onfinancing infrastructure investment. The subregional development banks havedisbursed a significant volume of resources, accounting for an average of around1 percent of GDP of the Andean and Central American subregions and 0.5 per-cent of the Caribbean GDP.
Given the current characteristics of the process of financial integration by thecountries of the region with the world economy, subregional development banksshould not limit their role to acting as a complementary source of funding fortheir member countries. In addition to providing countercyclical financing, theyshould expand their functions to include supporting and facilitating the coun-tries’ access to international financial markets by taking greater advantage of theirbetter credit risk rating; and they should promote the emergence of instrumentsto help these countries capture resources in international markets.
Subregional development banks must also actively support national andregional financial development. Proper management of economic and financialrisk is key to stimulating and facilitating economic growth. Since subregionaldevelopment banks are more able to distribute risk than national banks, theyhave an important role in promoting new financial instruments that reduce therisks and costs of accessing financial flows. A promising area in this respect isthe deepening of domestic and subregional capital markets by means of assetsecuritization, guarantee funds, and insurance mechanisms. This calls for strongerties with development and commercial banks and the countries’ capital markets.
With respect to support for short-term liquidity needs and balance-of-paymentsfinancing, FAR/FLAR has played a major role in providing timely emergencyfinancing to its member countries, in particular relatively less developed coun-tries. In the case of Bolivia and Ecuador, it has loaned resources equivalent to35 percent of Bolivia’s international reserves and 28 percent of Ecuador’s. Further-more, when debt capacity with FAR/FLAR is added to the international reservesof FAR/FLAR member countries, the short-term debt/international reserves ratiodrops significantly in Bolivia, Ecuador, and Costa Rica, which reduces thesecountries’ financial vulnerability. In addition, FAR/FLAR has played a clearcountercyclical role, complementing exceptional financing from the IMF.
However, because FAR/FLAR has such limited geographic coverage, balance-of-payments support via emergency financing continues to be one of the weakest
subregional financial cooperation 225
10101-07_Ch07_Redo.qxd 10/5/06 3:08 PM Page 225

226 daniel titelman
links in regional financial integration. Given the characteristics and dynamics ofthe latest generation of balance-of-payments crises, an essential task in the pro-cess of intra- and extraregional financial integration is to strengthen and expandFAR/FLAR. Since the covariance between capital flows to the different countriesis significant but not excessively high—reflecting a major sequential componentof crises in the region—it is feasible to expand the geographic coverage ofFAR/FLAR. This would help to reduce contagion of crises between countries.
References
Agosin, M. 2001. “Strengthening Regional Financial Cooperation.” CEPAL Review(ECLAC, Santiago, Chile), no. 73 (April): 31–50.
Banco Centroamericano de Integración Económica (BCIE). Various years. Annual Report.Corporación Andina de Fomento (CAF). Various years. Annual Report.Banco de Desarrollo del Caribe (Caribbean Development Bank, CDB). Various years. Annual
Report.Economic Commission for Latin America and the Caribbean (ECLAC). 1990. “La coop-
eración regional en los campos financiero y monetario.” LC/L.603. Santiago.———. 2002a. “Introductory Note on Regional Schemes.” Prepared for the Interregional
Conference on Financing Development, Mexico, January.———. 2002b. Latin America and the Caribbean in the World Economy, 2000–2001. Santiago.Emerging Markets Eminent Persons’ Group Seoul Report. 2001. Rebuilding the International
Financial Architecture. Seoul, October.Ffrench-Davis, R., and A. Di Filippo 2003. “El rol de las instituciones regionales en la global-
ización.” Estudios Internacionales (IEI, University of Chile) 36, no. 141: April–June.Fondo Latinoamericano de Reservas (FLAR). Various years. Annual Report.Inter-American Development Bank (IDB). Various years. Annual Report.Maldonado, R. 2003. “La cooperación financiera en América Latina y el Caribe: las institu-
ciones financieras subregionales en el fomento de las inversiones y del comercio exterior.”Serie de Comercio Exterior. CEPAL.
Mistry, P. S. 1999. “Coping with the Financial Crisis: Are Regional Arrangements the Miss-ing Link?” International and Monetary Financial Issues for the 1990’s. Vol. 10. UNCTAD.
Ocampo, J. A. 2002a. “Recasting the International Financial Agenda.” In International Capi-tal Markets: Systems in Transition, edited by John Eatwell and Lance Taylor. Oxford Uni-versity Press.
———. 2002b. “Reforming the International Financial Architecture: Consensus and Diver-gence.” In Governing Globalization: Issues and Institutions, edited by Deepak Nayyar.Oxford University Press.
Titelman, D. 2002. “Development Financing in the Context of Financial Volatility.” SerieFinanciamiento del Desarrollo 121. CEPAL.
———. 2003. “Banca de desarrollo y financiamiento productivo.” Serie Financiamiento delDesarrollo 137. CEPAL.
World Bank. Various years. Annual Report.
10101-07_Ch07_Redo.qxd 10/5/06 3:08 PM Page 226

227
The large currency crises of the past decade have been regional in nature.1
This feature of financial crises suggests that neighboring countries have astrong incentive to engage in mutual surveillance and to extend financial assis-tance to one another in the face of potentially contagious threats to stability.Regardless of whether the sudden shifts in market expectations and confidencewere the primary source of the Asian financial crisis, foreign lenders were soalarmed by the Thai crisis that they abruptly pulled their investments out of theother countries in the region, making the crisis contagious. The geographicproximity and economic similarities (or similar structural problems) of theseAsian countries prompted a blanket withdrawal of foreign lending and portfolioinvestment, with differences in economic fundamentals often being overlooked.If the channels of contagion cannot be blocked off through multilateral cooper-ation at an early stage in a crisis, countries without their own extensive foreignreserves will not be able to survive independently. Hence, neighbors have aninterest in helping put out a fire (a financial crisis) before it spreads to them.2
Regional Financial Integration in East Asia:Challenges and Prospectsyung chul park
8
The author wishes to acknowledge helpful comments from José Antonio Ocampo on an earlierdraft.
1. See Glick and Rose (1999).2. Ito, Ogawa, and Sasaki (1999).
10101-08_Ch08_Redo.qxd 10/5/06 3:08 PM Page 227

228 yung chul park
3. See Park and Wang (2002).4. See Sakakibara (2003).5. See Henning (2002).
But as long as a crisis remains confined to a specific country or region, there isno urgent political need for unaffected countries to pay the significant costsassociated with playing the role of firefighter.
The formation of a regional financial arrangement in East Asia reflects inpart frustration with the slow reform of the international financial system.3 Thesense of urgency concerning reform of the international financial architecturehas receded considerably in the G-7 countries. The slow progress has been fur-ther complicated by the perception that the current international architecture isdefective. The lack of global governance, including a global lender of last resortand international financial regulation, is not likely to be remedied anytimesoon.4 As long as there continue to be structural problems on the supply side ofinternational capital—such as volatile capital movements and exchange rategyrations of the U.S. dollar, the euro, and the yen—the East Asian countrieswill remain as vulnerable as ever to future crises. It is thus in the interest of EastAsians to work together to create their own self-help arrangements. The ChiangMai Initiative (CMI) of the Association of Southeast Asian Nations plus Japan,China, and the Republic of Korea (ASEAN+3) is one such available option.However, it is equally important that individual East Asian countries continueto undertake financial sector restructuring and development. Without soundfinancial institutions and adequate regulatory regimes, Asian financial marketswill remain vulnerable to external shocks. Regional policy dialogue should alsocontribute to strengthening the efforts to restructure and advance the develop-ment of financial markets in East Asia. The CMI has emerged as a regionalforum for policy dialogue and also for concerted regional efforts at financialreform in the region.
Three pillars—liquidity assistance, monitoring and surveillance, and ex-change rate coordination—are essential for regional financial and monetarycooperation. However, the development of this cooperation and its related insti-tutions will follow an evolutionary path, as was the case with European monetaryintegration. A shallow form of financial cooperation may comprise no more thana common foreign reserve pooling or mutual credit arrangements such as bilat-eral swaps. In other words, some kinds of shallow financial cooperation are con-ceivable without any commitment to exchange rate coordination, under whichthe exchange rates of participating countries would be pegged to each other orwould vanish through the adoption of a common currency. The East Asiancountries presently appear to be pursuing this form of financial cooperation.5
10101-08_Ch08_Redo.qxd 10/5/06 3:08 PM Page 228

Although a full-fledged form of monetary integration is not viable at this stage,East Asia may begin to examine the feasibility and desirability of cooperationand coordination in exchange rate policies.6
Evidently, there is a rising sense of East Asian identity today. After the pro-posal to create an Asian monetary fund was aborted, the leaders of ASEANresponded by inviting China, Japan, and the Republic of Korea to join in aneffort to build a regional mechanism for economic cooperation in East Asia.The ASEAN+3 summit in November 1999 released a Joint Statement on EastAsian Cooperation that covers a wide range of possible areas for regional coop-eration. Recognizing the need to establish regional financial arrangements to supplement the existing international facilities, the finance ministers ofASEAN+3 at their meeting in Chiang Mai, Thailand, in May 2000 then agreedto strengthen the existing cooperative frameworks in the region through theChiang Mai Initiative.
The purpose of this chapter is to examine the current process and futureprospects for regional financial and monetary cooperation in East Asia. Morespecifically, it sketches an institutional design for a regional financial architec-ture encompassing the three major pillars (liquidity assistance arrangements,policy dialogue and surveillance, and exchange rate coordination). Through anevolutionary process of enlargement and consolidation of the CMI, this studyenvisions the creation of an Asian monetary fund that is fully equipped with li-quidity support facilities and a monitoring and surveillance mechanism. Thechapter does not, however, contemplate any manifest collective exchange ratecoordination under the ASEAN+3 framework.
The chapter is organized as follows: The following sections successively dis-cuss the economic rationale for a regional financial arrangement in East Asia;developments in the Chiang Mai Initiative; and major barriers to financialcooperation and integration in East Asia.
Economic Rationale for a Regional Financial Arrangement in East Asia
The 1997–98 Asian financial crisis brought home the need to create a regionalmechanism of defense against future crises in East Asia. However, other eventshave also encouraged the regional integration movement. This section discussessome of these developments as background for an examination of whether they
6. East Asian currency union remains a very remote possibility, but this does not necessarilymean that a currency union could not be envisaged as a long-term objective.
regional financial integration in east asia 229
10101-08_Ch08_Redo.qxd 10/5/06 3:08 PM Page 229

230 yung chul park
can maintain the momentum for enhanced regional cooperation and lead tofinancial market integration and monetary unification in the long run.
Trade Integration and Stability of Bilateral Exchange Rates
Since the early 1990s, many of the East Asian countries have made sustainedefforts to deregulate and open domestic markets, including financial markets, toforeign competition. As a result of market orientation and trade liberalization,East Asia has seen a large increase in intraregional trade and investment. Interms of imports, intraregional trade in East Asia (among the ASEAN+3 coun-tries and Taiwan Province of China) accounted for 46 percent of the region’stotal trade in 2001, when the entire region was still recovering from the crisis(see table 8-1). There is every indication that this trend will continue.
Financial liberalization and market opening has also contributed to bothregional and global integration of financial markets in the East Asian countries.And there is growing awareness that further integration of intraregional tradein goods, services, and financial assets will call for stabilization of the bilateralexchange rates for East Asian currencies. With deepening in regional trade inte-gration, East Asia is bound to lose disproportionately more than other regionsfrom trade disruptions caused by currency crises. Stability of bilateral exchangerates would also facilitate and increase the benefits of capital mobility in theregion.
In the aftermath of the East Asian crisis, the flexible exchange system becamethe accepted norm in the new international financial architecture. The new con-sensus, however, did not last very long. Williamson and Frankel argue that inter-mediate regimes such as the “basket, band, and crawl” system are more likely tobe appropriate than “two-corner solutions” for many emerging market econo-mies (EMEs). In particular, Williamson advocates several intermediate regimeswith soft margins. Fischer suggests that developing countries that are notexposed to capital flows could choose from a wide variety of intermediate regimesand that flexible exchange rate systems suitable for EMEs could include crawl-ing bands with wide ranges.7
If East Asian countries find it desirable to follow some type of intermediateregime, a case can be made for creating regional financial cooperative arrange-ments that could help stabilize bilateral exchange rates in the region. Althoughthe ASEAN+3 authorities have no plans for transforming the CMI into a mone-tary union, the East Asian countries could use the CMI as a framework for devel-oping an East Asian common currency area in the long run, after a transition
7. See Williamson (2000); Frankel (1999); and Fischer (2001).
10101-08_Ch08_Redo.qxd 10/5/06 3:08 PM Page 230

regional financial integration in east asia 231
period during which a mechanism for the coordination of exchange rate policieswould be established.
The IMF and Capital Account Crisis Management
A 2003 International Monetary Fund (IMF) report makes it clear that East Asiasuffered a capital account crisis in 1997 and 1998, which required a managementand resolution strategy different from the traditional IMF recipe for crises origi-nating from current account deficits. A large increase in capital flows into someof the East Asian countries set off an asset market boom and a precipitousincrease in the current account deficit, thereby making these countries vulnerableto speculative attacks. The perception of vulnerability of these countries triggereda sharp and large capital outflow, which was further aggravated by the panic andherding behavior of foreign investors. Once the dollar peg became indefensible,the value of the currencies plummeted. Many banks and corporations with bal-ance sheet mismatches could not service their foreign-currency-denominateddebts and eventually became insolvent. A sharp contraction in the level of out-put then followed.
The crisis resolution strategy of the IMF was twofold. First, it imposed tightmonetary and fiscal policies with the aim of stabilizing the exchange rate andgenerating current account surpluses by contracting domestic demand. Thesepolicies, together with weak currencies, were expected to help lure back foreigninvestors. Second, the IMF required the crisis countries to undertake a widerange of reforms in the corporate, financial, and public sectors to strengthen thestructural foundation of their economies. These reforms were intended to helpthe affected countries return to the pre-crisis path of robust growth; they werealso viewed as critical to restoring international lenders’ confidence in theireconomies.
Once the crisis broke out, output contraction and the turbulence of foreignexchange and other financial markets in one country were rapidly transmitted toother economies in the region through trade and financial market linkages. Pro-nouncements by international financial institutions, including the IMF andpolicymakers from the G-7 countries, that the crisis countries had serious struc-tural problems in their financial, corporate, and public sectors did little toinspire confidence in these economies.8 Indeed, to some extent the IMF crisismanagement program actually helped fuel contagion of the crisis.
At this writing nine years after the crisis, assessments of the success of thestructural reforms are mixed. A 2001 World Bank report continued to argue that
8. Furman and Stiglitz (1998).
10101-08_Ch08_Redo.qxd 10/5/06 3:08 PM Page 231

Tab
le 8
-1.
Tra
de S
hare
s in
East
Asia
n C
ount
ries
Perc
ent
Expo
rts f
rom
East
Asia
Chi
naJa
pan
Rep
ublic
of K
orea
Oth
er N
IEs
ASE
AN
4
Expo
rts t
o19
8019
9020
0119
8019
9020
0119
8019
9020
0119
8019
9020
0119
8019
9020
0119
8019
9020
01
A. E
xpor
t dat
aE
ast A
sia
32.0
36.2
42.2
52.9
66.9
44.9
21.8
24.2
32.6
28.5
33.0
38.9
31.3
39.9
49.5
54.2
50.6
47.4
Chi
na2.
84.
69.
80.
00.
00.
03.
92.
17.
70.
00.
012
.14.
015
.724
.20.
82.
14.
4Ja
pan
10.2
8.2
8.9
22.3
14.8
16.9
0.0
0.0
0.0
17.4
19.4
11.0
6.3
6.9
6.6
34.6
24.4
16.1
Rep
ublic
of K
orea
2.7
3.8
4.0
0.0
0.7
4.7
4.1
6.1
6.3
0.0
0.0
0.0
1.3
2.3
2.6
1.7
3.9
3.7
Oth
er N
IEsa
9.3
12.3
11.5
26.4
47.0
19.6
6.7
8.3
9.4
6.2
8.6
9.0
6.0
4.5
4.7
13.8
16.0
15.9
ASE
AN
4b
7.0
7.1
8.1
4.3
2.9
3.8
7.0
7.7
9.3
5.0
5.0
6.8
13.7
10.6
11.5
3.2
4.2
7.2
Sout
h A
siac
1.7
1.4
1.5
1.1
1.5
1.5
1.6
1.2
0.8
2.0
1.7
1.8
2.8
1.9
2.1
1.1
1.3
1.8
Cen
tral
Asi
ad0.
00.
00.
10.
00.
00.
40.
00.
00.
00.
00.
00.
30.
00.
00.
00.
00.
00.
0C
ER
e2.
82.
22.
01.
40.
81.
53.
12.
82.
21.
51.
71.
64.
32.
22.
01.
81.
82.
5U
SA21
.425
.721
.05.
48.
620
.424
.531
.730
.426
.429
.920
.819
.423
.010
.318
.819
.420
.0E
U14
.617
.714
.913
.110
.115
.414
.020
.416
.015
.515
.413
.117
.917
.214
.013
.616
.715
.0O
ther
s27
.516
.818
.226
.113
.615
.935
.119
.618
.026
.018
.323
.424
.315
.922
.110
.410
.213
.2
Wor
ld10
010
010
010
010
010
010
010
010
010
010
010
010
010
010
010
010
010
0
10101-08_Ch08_Redo.qxd 10/5/06 3:08 PM Page 232

B. I
mpo
rt d
ataf
Eas
t Asi
a30
.438
.745
.833
.349
32.3
20.7
23.4
36.2
33.4
34.4
39.9
47.9
57.1
62.8
41.1
46.2
50.8
Chi
na3.
97.
815
00
03.
15.
116
.60.
10
9.4
10.8
22.6
29.9
2.8
2.6
5.6
Japa
n11
.212
.89
2714
.70.
30
00
26.3
26.6
18.9
20.4
17.8
12.2
24.3
25.6
19.8
Rep
ublic
of K
orea
1.8
3.4
5.4
00.
513
.72.
25
4.9
00
02.
33.
84.
12
3.4
5.1
Oth
er N
IEsa
3.1
6.4
5.1
429
.68.
51.
52.
42
1.2
2.2
34.
33.
63.
88.
310
.610
.9A
SEA
N 4
b10
.48.
211
.22.
44.
29.
814
10.9
12.7
5.9
5.6
8.6
10.2
9.2
12.8
3.8
4.1
9.4
Sout
h A
siac
0.9
1.1
1.4
11.
72.
40.
91
0.8
0.3
0.7
1.1
1.2
11.
50.
71.
51.
6C
entr
al A
siad
00
0.1
00
0.6
00
00
00.
10
00
00
0C
ER
e4.
74.
13.
46.
42.
93.
65.
66
4.7
3.4
4.4
4.4
2.3
1.6
1.4
4.3
3.8
3.1
USA
1717
.814
.520
12.7
15.4
17.4
22.5
18.3
21.9
24.3
15.9
1311
.510
.316
.113
.912
.9E
U8.
814
.912
.914
.717
.620
.95.
916
.112
.87.
213
10.6
11.7
11.8
10.5
13.5
16.4
11.7
Oth
ers
38.3
23.4
2224
.616
.224
.849
.531
27.3
33.6
23.4
2823
.917
.113
.524
.218
.319
.9
Wor
ld10
010
010
010
010
010
010
010
010
010
010
010
010
010
010
010
010
010
0
Sour
ce: I
nter
nati
onal
Mon
etar
y Fu
nd, D
irec
tion
of T
rade
Sta
tistic
s Yea
rboo
k,va
riou
s ye
ars.
a. S
inga
pore
, Hon
g K
ong
SAR
.b.
Ind
ones
ia, M
alay
sia,
Phi
lippi
nes,
Tha
iland
.c.
Ind
ia, S
ri L
anka
, Ban
glad
esh,
Pak
ista
n.d.
Kaz
akhs
tan,
Uzb
ekis
tan.
e. C
lose
r E
cono
mic
Rel
atio
ns (
CE
R)
Tra
de A
gree
men
t bet
wee
n A
ustr
alia
and
New
Zea
land
.f.
Cou
ntry
A’s
expo
rts
to C
ount
ry B
are
est
imat
ed b
y co
untr
y B
’s im
port
s fr
om c
ount
ry A
.
10101-08_Ch08_Redo.qxd 10/5/06 3:08 PM Page 233

234 yung chul park
progress on structural and institutional reforms remained key to retaining confi-dence and resilience to shocks in East Asia.9 One lesson of the Asian situationis that when a crisis in a country originates in the capital account, policy coordi-nation or at least policy dialogue and review among neighboring countries isessential to prevent contagion of the crisis. Another lesson is that an appropriateresponse to a capital account crisis is to serve notice to international financialmarkets that the country in crisis is prepared to supply—either by itself or incooperation with regional or global financial institutions, including the IMF—as much liquidity as it takes to thwart an impending speculative attack.
These lessons clearly suggest that regional financial cooperative arrangementssuch as the CMI could complement the role of the IMF in managing a capitalaccount crisis. In the absence of policy dialogues and exchanges of informationamong neighbors, individual countries may not be able to find the causes oflarge changes in capital flows and exchange rates, or more important, respondto the crisis if it spreads. An efficient regional policy coordination mechanismwill help monitor and make necessary policy adjustments in response tochanges in market expectations. Even smoothing out high-frequency move-ments in the nominal exchange rate in individual countries may have to becoordinated at a regional level in order not to send wrong signals to foreignexchange markets. Unless the countries in the region maintain close workingrelationships in coordinating policies and exchanging information, they willnot be able to make a prompt assessment of the nature of the crisis and mounta quick response.
The IMF could monitor capital flows within and between regions and alsothe behavior of market participants. But given its narrow mandate and its smallstaff, the IMF may not have either the institutional or the professional capacityto keep track of developments in the financial markets of all of its membercountries. Since the Fund obtains most of its macroeconomic and market infor-mation from the authorities of member countries, its ability to prescribe preven-tive measures to countries vulnerable to the crisis may be limited. At best it canserve as a lender and as a crisis manager. However, the Asian experience demon-strates that the crisis management ability of the IMF is severely constrained.
At the time of the crisis, the CMI countries as a whole held about U.S.$700billion in foreign reserves. The total financing required from the IMF, otherinternational financial institutions, and a number of donor countries to restorefinancial stability in Indonesia, the Republic of Korea, and Thailand amountedto U.S.$111.7 billion. If the IMF had been ready to supply a large amount of
9. World Bank (2001).
10101-08_Ch08_Redo.qxd 10/5/06 3:08 PM Page 234

liquidity to the crisis countries, or if the thirteen countries had established acooperative mechanism through which they could pool their reserves to assistother countries in need of financial support, they could have nipped the Thai cri-sis in the bud and minimized its contagion by supplying only a small fraction oftheir total reserves. In view of the large loss of output and the fall in employmentin the region, such a cooperative response would indeed have been desirable.
Inasmuch as East Asia suffered a liquidity crisis, compounded by the panicand herding behavior of foreign investors, a more effective IMF crisis manage-ment strategy—instead of tightening monetary and fiscal policy—would havebeen to supply a large amount of short-term financing to replenish foreignexchange reserves at the first sign of a speculative attack. Such a strategy couldhave stopped the spread of the crisis and the ensuing slump throughout theregion.10 At the time of the crisis, there were neither regional nor global lendersof last resort to deal with the bank-run problems that East Asian countries werefacing. With its limited financial resources, the IMF could not manage the EastAsian crisis by itself; it had to enlist the financial support of the G-7 and othercountries. This situation is testimony that, as a global institution, the IMFwould be more effective in resolving crises if it established cooperative relationswith its regional counterparts and hence encouraged the development ofregional financial mechanisms.
Once established, an East Asian monetary fund could serve as an institutioncomplementary to the IMF by providing additional resources and by workingwith the Fund to prevent and manage financial crises. It could also support thework of the IMF by monitoring economic developments in the region and tak-ing part in IMF global surveillance activities. As Henning notes, it is difficult toassess ex ante whether resources supplied through regional financial arrangementsare really additional to those supplied by the international community.11 The“additionality” problem arises in principle whenever there are multiple sources of
10. Contagion is geographically concentrated, making a regional grouping for support logical.In addition to providing financial assistance in tandem with international support, a regionalfinancial cooperation mechanism may conduct policy reviews and initiate a dialogue process. Pol-icy dialogue, including monitoring and surveillance, is the bedrock on which coherent policy for-mation under regional financial arrangements rests. A monitoring and surveillance process wouldprovide prompt and relevant information for assessing the situation of countries in trouble and thepotential contagious effects of a crisis to neighboring countries. Furthermore, a joint exercise basedon a regionwide early warning system would facilitate closer examination of financial vulnerabili-ties in the region. In addition, the regional policy dialogue process would contribute to ensuringeffective implementation of high-quality banking and financial standards and promoting financialmarket development in East Asia.
11. Henning (2002).
regional financial integration in east asia 235
10101-08_Ch08_Redo.qxd 10/5/06 3:08 PM Page 235

236 yung chul park
finance and conditionality, yet it appears to have been managed successfully innumerous historical cases. Potential conflicts can be avoided through consulta-tion and coordination, which may be provided in part by the United States andthe East Asian governments.
Limited and Slow Progress in International Financial Reform
One of several developments that have reinforced regionalism in East Asia hasbeen slow progress in the reform of the international financial system. The needfor reform is no longer so urgently felt in the G-7 countries, despite the eco-nomic collapse of 2001–02 in Argentina and the growing trade imbalancebetween the United States and East Asia. The slow progress has been furthercompounded by the perception that none of the many proposals for a newarchitecture may be effective in sustaining global financial stability. In particu-lar, as long as the structural problems on the supply side of international capitalmarkets are not addressed, the East Asian countries fear that they will remain asvulnerable to future crises as they are now.12
Griffith-Jones and Ocampo show that there has been no international reformagenda acceptable to both developing and developed countries.13 The 2002Monterrey Consensus produced a new international agenda, but it is not alto-gether clear whether the new agenda will be put into action. Some of theprogress that has been made is asymmetrical in the sense that the reform hasfocused on strengthening the financial and corporate sectors of developing andemerging market economies instead of rectifying imperfections in internationalcapital markets. Some of the advances in the new architecture have also beenjeopardized by the growing reluctance of developing countries to support largeIMF financing. Finally, it should be noted that developing countries have beenlargely excluded from the key institutions and forums involved in internationalfinancial reform.
It is natural that many emerging market economies, faced with the unevenand slow process of the reform, would consider developing their own mecha-nisms of defense against future financial crises. One such defensive measure is theCMI in East Asia. Instead of waiting until the G-7 creates a new architecture—whose effectiveness would be questionable, at best—the East Asian countrieshave taken the initiative of working together to create their own system ofdefense, and have fortified themselves by accumulating large amounts of reservesto deal with sudden and unexpected capital outflows.
12. Park and Wang (2002).13. Griffith-Jones and Ocampo (2001).
10101-08_Ch08_Redo.qxd 10/5/06 3:08 PM Page 236

Accumulating Reserves: A War Chest or Insurance?
Many developing and emerging market economies, in particular those in coun-tries that have fallen victim to financial crises, have taken recourse to amassingforeign reserves as a defense against future crises. Before the onset of capitalaccount liberalization in the early 1990s, foreign currency reserves were heldmainly for transactions purposes. The rule of thumb was to hold reserves in anamount equivalent to imports for three to four months. This implicit ruleappears to be no longer acceptable. In order to meet the increased volume oftheir capital account transactions, but above all in order to build a war chestlarge enough to stave off future speculative attacks, many East Asian emergingmarket economies have accumulated large amounts of reserves.
For example, at the end of 2005, the volume of reserves as a share of GDP inthe Republic of Korea was almost 27 percent, which was more than four timesthe level in 1996. Similar developments have taken place in other crisis-hit partsof East Asia (see table 8-2). In Taiwan Province of China, the ratio of reserves toGDP almost doubled between 1996 and 2005. The ratio climbed to 54 percentat the end of 2005 from about 20 percent in 1997 in Malaysia. Althoughreserve accumulation has been relatively modest in both Thailand and thePhilippines, these countries have added almost 10 percentage points to theirratios since the end of 1997. The thirteen East Asian countries that constituteASEAN+3 held collective foreign currency reserves estimated at more thanU.S.$2.5 trillion at the end of 2005. By any measure, this level is excessive andcostly, and it represents a clear case of misallocation of resources.14 If thesereserves are pooled, a mere 10 percent of the total would be sufficient to providea formidable line of defense against any future crises.
In theory, floating rates and capital account liberalization are supposed toreduce the amounts of reserves to be held for the prevention of crises. Except forChina, Hong Kong SAR, and Malaysia, all the crisis countries have been on aflexible exchange rate system and have deregulated their capital account trans-actions to a considerable degree since the 1997 crisis. However, the shift tofloating rates and participation in international financial markets over the pastfive years has not reduced their reserve holdings relative to their output, largelybecause capital flows have been unstable and capital account liberalization hasnot improved their access to international capital markets.
14. In a speech at a Tokyo conference, Stiglitz argued that the existing dollar-based reserve sys-tem benefits the United States, whereas developing countries bear a disproportionate burden ofholding large amounts of reserves to counter volatility in the currency market. He went on to saythat an Asian monetary fund, which would have given a quicker remedy to the Asian financial crisis,could be an alternative model, providing a good basis for a new global regime (see Stiglitz 2002).
regional financial integration in east asia 237
10101-08_Ch08_Redo.qxd 10/5/06 3:08 PM Page 237

238 yung chul park
Table 8-2. Foreign Exchange Reserves and Current Account Balances, 1996–2005
Country 1996 1997 1998 1999 2000 2001 2002 2003 2004 2005
Foreign exchange reserves (billions of U.S. dollars)Republic of Korea 34.0 20.4 52.0 74.0 96.1 102.8 121.3 155.3 199.1 210.4Chinaa 107.0 142.8 149.2 157.7 168.3 215.6 291.1 408.2 618.6 769.0Hong Kong SAR 63.8 92.8 89.6 96.3 107.6 111.2 111.9 118.4 123.5 122.3Taiwan Province 88.0 83.5 90.3 106.2 106.7 122.2 161.7 206.6 242.0 253.8
of ChinaThailand 37.7 26.2 28.8 34.1 31.9 32.4 38.0 41.1 49.8 52.1Indonesia 24.0 20.6 22.7 23.5 28.5 27.2 31.0 35.0 36.3 34.7Malaysia 27.0 20.8 25.6 30.6 29.1 30.5 34.2 44.5 66.7 70.5Philippines 10.0 7.3 9.2 13.2 13.0 13.4 13.1 13.5 16.2 18.5Singapore 77.0 71.4 75.0 77.2 80.4 75.4 82.0 95.7 112.8 116.6
Current account balance (billions of U.S. dollars)Republic of Korea −23.0 −8.2 40.4 24.5 11.0 8.2 6.1 12.3 28.9 15.5Chinaa 7.2 37.0 31.5 15.7 20.5 17.4 35.4 45.9 68.7 100.3Hong Kong SAR −3.5 −6.2 3.9 10.5 8.8 9.9 12.6 16.2 16.4 24.7Taiwan Province 10.9 7.1 3.4 8.4 9.3 17.9 25.6 29.2 18.6 10.9
of ChinaThailand −14.7 −3.0 14.2 12.4 9.2 6.2 7.0 8.0 7.3 . . .Indonesia −8.5 −5.8 4.1 5.8 8.0 6.9 8.1 7.5 3.1 . . .Malaysia −4.5 −5.9 9.5 12.6 8.9 7.3 7.2 13.4 14.9 . . .Philippines −3.9 −4.4 1.5 7.9 9.3 1.3 4.2 3.3 2.0 . . .Singapore 13.9 16.9 21.0 21.3 21.7 16.1 18.7 28.2 27.9 31.5
Foreign exchange reserves (percent of GDP)Republic of Korea 6.5 4.2 16.2 17.8 21.0 21.3 22.2 25.7 29.3 26.6Chinaa 13.1 15.8 15.8 15.9 15.5 18.3 22.9 28.9 38.7 42.4Hong Kong SAR 41.4 54.3 55.0 60.5 65.8 68.3 69.3 75.0 74.5 69.1Taiwan Province 31.5 32.7 32.6 35.9 36.4 43.5 57.3 72.2 75.0 73.8
of ChinaThailand 20.7 17.3 25.7 27.5 26.0 28.0 29.9 28.7 30.5 29.2Indonesia 10.6 9.6 23.0 16.2 18.9 19.3 17.9 16.8 14.1 12.4Malaysia 26.7 20.8 35.0 37.7 32.6 34.6 36.0 43.2 56.6 53.7Philippines 12.1 8.8 14.9 17.3 27.4 18.6 16.8 16.7 18.8 19.8Singapore 83.7 85.2 99.9 89.3 82.2 88.8 94.3 104.8 105.6 101.0
Current account balance (percent of GDP)Republic of Korea −4.4 −1.7 12.6 5.9 2.4 1.7 1.0 2.0 4.2 2.0Chinaa 0.9 4.1 3.3 1.6 1.9 1.5 2.8 3.3 4.3 5.5Hong Kong SAR −2.3 −3.6 2.4 6.6 5.4 6.1 7.8 10.2 9.9 14.0Taiwan Province 3.9 2.8 1.2 2.8 3.2 6.5 9.1 10.2 5.8 3.2
of China
10101-08_Ch08_Redo.qxd 10/5/06 3:08 PM Page 238

With growing financial integration, the adequacy of reserve holdings inemerging market economies is often gauged by the amount of short-term for-eign borrowings, and a good benchmark is that the ratio of reserves to short-term foreign debts should be equal to or higher than 1.15 Even when thisbenchmark is applied, the reserve holdings of the crisis-hit countries in East Asiaare excessive. In the Republic of Korea and Indonesia, the ratio has been higherthan 2. China and Thailand hold reserves six and four times, respectively, aslarge as their short-term external liabilities (see table 8-3). If emerging marketeconomies in East Asia and elsewhere have to hold more reserves than theirshort-term foreign indebtedness, then questions arise as to whether these coun-tries should borrow at all from the short end of international capital marketsand whether they should open their financial markets.
Commercial banks hold reserves equal to only a small fraction of their short-term deposit liabilities; they can do so because, among other things, they haveaccess to the domestic lender of last resort. In the absence of a global andregional lender of last resort, financial institutions in EMEs cannot engage interm transformation involving foreign currency loans. Could EMEs insteadmake arrangements with international banking institutions to establish privatecontingent lines of credit from which they could draw in case they come underspeculative attack? The Mexican experience is instructive in this regard: theavailability of contingent credit lines does not increase liquidity once a financialcrisis breaks out, because the banks that provide contingent credit lines to thecentral bank withdraw other credits extended to firms and financial institutionsto reduce their country exposure.16
15. The short-term foreign debt benchmark therefore suggests that reserve holdings for other usesmust be secured by long-term foreign borrowing or the accumulation of current account surpluses.
16. Carstens (2001).
Thailand −8.1 −2.0 12.7 10.0 7.5 5.4 5.5 5.6 4.5 . . .Indonesia −3.8 −2.7 4.2 4.1 5.3 4.9 4.7 3.6 1.2 . . .Malaysia −4.4 −5.6 13.1 15.9 9.9 8.3 7.6 12.9 12.6 . . .Philippines −4.8 −5.3 2.4 10.3 19.7 1.8 5.3 4.2 2.3 . . .Singapore 15.1 20.2 23.3 24.0 22.2 19.1 21.5 30.9 26.1 27.2
Sources: International Financial Statistics (IFS) database, the International Monetary Fund, and theAsia Regional Information Center (ARIC).
a. Estimates by the International Institute of Finance.
Table 8-2. (continued)
Country 1996 1997 1998 1999 2000 2001 2002 2003 2004 2005
regional financial integration in east asia 239
10101-08_Ch08_Redo.qxd 10/5/06 3:08 PM Page 239

240 yung chul park
Owing to the limited availability of private contingent lines of credit,together with the absence of a global or regional lender of last resort, EMEs mayhave to hold a larger amount of reserves, and to do so they may have to run asizable surplus on the current account, as the East Asian crisis countries havedone since the crisis in 1997. However, this reserve accumulation in EMEs hasundesirable implications for future trade relations between developing anddeveloped countries and for the growth of the world economy.
As a growing number of EMEs increase their holdings of reserves by runningcurrent account surpluses, trade relations between developing and developedcountries are likely to suffer from tension and unnecessary conflicts. The largeaccumulation of reserves in EMEs may also sap global growth as it reducesglobal aggregate demand. Therefore, both developing and developed countrieswill find it in their interest to search for other schemes that can reduce EMEs’holdings of foreign exchange reserves. For example, a group of countries, notnecessarily from the same region, may decide to pool a certain percentage oftheir reserves to create new credit facilities for short-term liquidity support.Individual countries belonging to the arrangement could then reduce theirholdings by borrowing from these new credit facilities.
Regional Financial Arrangements: Building Blocks?
Any argument supporting regional trade and financial arrangements mustaddress the fundamental question of whether they, whatever form they maytake, are conducive to an orderly global integration of trade and financial mar-kets. Although many misgivings have been expressed about the role of the grow-ing number of recent regional economic arrangements, the experience of the pastdecade—in particular that of the European Union—suggests that such arrange-ments have not interfered with multilateral trade and financial liberalization.
Table 8-3. Ratio of Foreign Reserves to Short-Term Debt, 1998–2004
Year Indonesia Republic of Korea Thailand China
1998 0.90 1.33 1.01 8.601999 1.49 1.74 1.74 10.392000 1.46 1.95 2.18 12.872001 1.08 2.45 2.42 4.262002 2.37 2.42 3.19 5.502003 2.72 2.81 3.77 5.302004 2.25 3.30 4.10 5.90
Source: Asia Regional Information Center (www.aric.adb.org).
10101-08_Ch08_Redo.qxd 10/5/06 3:08 PM Page 240

In other words, they have been building blocks rather than stumbling blocksfor a more integrated world economy. There is no evidence to suggest that anEast Asian financial arrangement would be oriented toward a withdrawal fromthe global economy and that, hence, it would erect barriers to global financialintegration.
Lawrence points out that the forces that were driving the wave of regionalismin the early 1990s differed fundamentally from those driving earlier movestoward regionalization and that the regional initiatives represented efforts tofacilitate their members’ participation in the world economy rather than theirwithdrawal from it.17 Trade and financial developments since then have notbeen at odds with this observation. Many developing countries are motivated tojoin regional groupings as a means of facilitating implementation of a strategy toliberalize and open their economies. Since most of the East Asian EMEs arepursuing outward-looking development strategies geared to promoting exportsand attracting foreign investment, they would have very little to gain by form-ing a regional arrangement designed to thwart globalization.
Ever since the proposal for creating an Asian monetary fund was first made,the opponents of a regional financial arrangement in East Asia have raised twoissues. First, they argue that the ASEAN+3 countries have yet to develop theeconomic, social, and political conditions needed to support such an arrange-ment. When these conditions are not met, there is a danger that a regionalarrangement for financial cooperation such as the CMI could undermine therole of the IMF and other global financial institutions. Specifically, regionalfinancial arrangements may aggravate the moral hazard problems associatedwith excessive borrowing and the application of loose macroeconomic policiesby participating economies. The opponents also contend that there is no needfor regional financial arrangements, because the new information and commu-nication technology, together with capital account liberalization, is drivingfinancial globalization at an unprecedented speed.
Many of the countries participating in the CMI have been embroiled in terri-torial, political, and economic disputes with one another. Scholars have arguedthat East Asia lacks the tradition of integrationist thinking and the web of inter-locking diplomatic agreements that would encourage European-style monetaryand financial cooperation.18 Therefore, “any monetary arrangement that seeks tostabilize exchange rates in the absence of the necessary political preconditions
17. Lawrence (1996).18. See, for example, Eichengreen (2000); Eichengreen and Bayoumi (1999); and Bayoumi,
Eichengreen, and Mauro (1999).
regional financial integration in east asia 241
10101-08_Ch08_Redo.qxd 10/5/06 3:08 PM Page 241

242 yung chul park
will be fragile and crisis-prone.”19 They are also concerned that regional mech-anisms for financial cooperation would not be endowed with the necessary lend-ing discipline and proper surveillance of the sovereign states participating inthe arrangements.
In response to these views, it can be argued that the ASEAN+3 countrieshave participated in various regional groupings and in the process have accumu-lated a great deal of experience in managing cooperative arrangements withother countries. The ASEAN states have more than thirty years’ experience withregional cooperation. Since its inception in 1967, ASEAN has helped to consol-idate unity, promote free trade, and provide mutual financial assistance amongmember states. The ASEAN+3 countries have also been active members of theAsia-Pacific Economic Cooperation (APEC) group. Some of these countriesalso participate in the Manila framework and in other regional cooperativearrangements, such as the Executives’ Meeting of East Asia–Pacific CentralBanks (EMEAP) and the South East Asian and South East Asia, New Zealand,and Australia associations of central banks (SEACEN and SEANZA), whichhave served as informal forums for policy dialogue.
Nevertheless, it may be true that East Asians are not prepared to negotiate aninternational treaty that includes provisions for sanctions and fines for countriesthat do not adjust their domestic policies accordingly. This unwillingness wouldmake it difficult for the regional fund to impose politically unpopular policieson member countries and hence could pose a serious problem concerning policydiscipline.20 However, moral hazard is not a problem that besets only regionalarrangements. The IMF is not immune to this problem. The moral hazard con-cern is so serious that some people even question whether the IMF should con-tinue to play the role of quasi-lender of last resort, and to them creation ofregional monetary funds must be anathema.21
19. Bayoumi, Eichengreen, and Mauro (1999, p. 2).20. Eichengreen finds it useful to distinguish between technical assistance and financial assis-
tance (Eichengreen 2000). It is true that there is no reason to discourage competition in the marketfor technical assistance. Governments should be free to choose the source of technical assistancewith the best track record. However, his concern is that if multiple monetary funds were available,East Asian governments would have an incentive to shop around for the most generous assistanceand the least onerous terms. He seems to believe that Asian monetary fund conditionalities wouldbe much softer than IMF conditionalities. His point should be taken when Asians consider furtherdevelopment beyond the CMI that assumes IMF conditionality as a given.
21. See Meltzer Commission (2000). The task force report of the Council on Foreign Relations(1999) advises the fund to adhere consistently to normal lending limits to redress the moral hazardproblem. The reasons why East Asian financial arrangements would suffer more from the moralhazard problem than the IMF or any other regional institution have not been made clear.
10101-08_Ch08_Redo.qxd 10/5/06 3:08 PM Page 242

The ongoing revolution in information and communication technology willno doubt accelerate financial globalization. However, it should be noted that anorderly globalization requires global governance; at present, the world economyhas no system of global governance, which might include a global central bankand global regulatory authorities, and the prospects for developing one arerather remote. Global governance may appear reasonable, but in reality it ispolitically unacceptable and must be dismissed as quixotic.22 As a second bestalternative to a global governance system, global standards and codes of conducton banking, corporate governance, management of monetary and fiscal policies,and many other matters have been proposed by emerging market economiesand developing countries. However, questions have been raised about whetherone-size-fits-all codes and standards should be imposed on EMEs and develop-ing countries, and if so, whether they could be enforced. If regional differencesmatter in devising standards and codes and harmonizing institutions, it could beargued that some public goods for finance could be produced more efficiently atthe regional level.
The Chiang Mai Initiative (CMI)
The 1997 Asian financial crisis set in motion two interrelated financial develop-ments in East Asia. The first was that most of the East Asian countries, includ-ing the crisis-hit ones, increased the pace and scope of domestic financial reformto liberalize and open their financial markets and also to improve soundness,corporate governance, and risk management at financial institutions. The sec-ond was the regional movement for financial cooperation and integration thatculminated in the Chiang Mai Initiative (CMI) and the Asian Bond Market Ini-tiative (ABMI).
When the financial crisis in Thailand became contagious, spreading to otherEast Asian countries in the second half of 1997, Japan proposed to create anAsian monetary fund (AMF) as a framework for financial cooperation and pol-icy coordination in the region, in particular as a means for creating lendingfacilities, in addition to those of the IMF, as a safeguard against future financialcrises in East Asia. Although the proposal was well received throughout theregion, it was shelved in the face of objections from the United States, the Euro-pean Union, and the IMF.
The AMF idea was revived again when the finance ministers of ASEAN,China, Japan, and the Republic of Korea (ASEAN+3) agreed on May 6, 2000, in
22. Eichengreen (2000).
regional financial integration in east asia 243
10101-08_Ch08_Redo.qxd 10/5/06 3:08 PM Page 243

244 yung chul park
Chiang Mai, Thailand, to establish a system of bilateral currency swap arrange-ments among the ASEAN+3 countries under what has come to be known as theChiang Mai Initiative. The eight countries participating in the CMI have alsoinstitutionalized regular meetings of finance ministers (the ASEAN+3 FinanceMinisters’ Meeting, AFMM+3) and deputy ministers (the ASEAN+3 Financeand Central Bank Deputies’ Meeting, AFDM+3) for policy dialogue and coor-dination, as well as the annual ASEAN+3 summit.23 As a sequel to the CMI forregional financial integration, ASEAN+3 launched the ABMI to develop regionalbond markets in Asia. A regional financial arrangement for economic cooperationand policy coordination in general comprises: (1) a mechanism of short-term li-quidity support, such as the CMI, for members experiencing balance-of-paymentsdeficits; (2) a mechanism of surveillance for monitoring economic and policydevelopments in member countries and for imposing policy conditionality onthose countries receiving financial support; and (3) a regional collective exchangerate system designed to stabilize the bilateral exchange rates of member countries.The ASEAN+3 states are working on a plan to establish a surveillance systemfor the CMI network. So far, there has been no serious discussion on developinga collective exchange rate system for the region as a whole. The ABMI will com-plement the CMI by integrating the bond markets of individual countries inEast Asia.24
The financial cooperation structure conceived by the architects of the CMIcovers only the basic principles and operational procedures for bilateral swaptransactions. For the initiative to serve as a full-fledged regional financial mecha-nism comparable to the European Monetary System, for example, further orga-nizational and operational details on surveillance and exchange rate policycoordination will have to be worked out.
Questions have also been raised as to the significance and viability of regionalfinancial integration in a world economy that has seen financial globalizationadvance at a fast pace. In order to integrate financial markets into a single uni-fied regional market, individual countries will have to open their financial mar-kets. But they will then be integrating their markets into global financialmarkets at the same time unless they discriminate against nonregional marketparticipants. The architects of the CMI may have been primarily interested in
23. Financial market participants have ignored the CMI as a defense mechanism against futurecrises because the amount of liquidity any member may draw from the system is small and, moreover,it is uncertain whether the swap borrowing could be activated in a crisis situation. Despite these criti-cisms and the market’s disregard, ASEAN+3 has managed to close ranks to expand the scope of pol-icy dialogue and move to the second stage of integration.
24. For additional discussion of this topic, see chapter 9 in this volume.
10101-08_Ch08_Redo.qxd 10/5/06 3:08 PM Page 244

creating a regional liquidity support system to prevent the occurrence of finan-cial crises. However, there is no evidence that regional financial arrangements,whatever form they may take, are effective in warding off financial crises. Thereis also lingering doubt about whether the CMI arrangement could avoid moralhazard in managing balance-of-payment problems in East Asia because the par-ticipating countries would not be able to impose tight conditionality on othermembers borrowing from the arrangement. Although these arguments raiselegitimate questions, they do not mean that the creation of a regional financialarrangement in East Asia is not justified. If it were properly structured and man-aged, it could facilitate multilateral trade and financial liberalization, therebycontributing to global financial stability.25
Structure and Status of the CMI
The CMI consists of two regional financial arrangements. One is the network ofbilateral swaps and repurchase agreements among eight members of ASEAN+3.The other is the expanded ASEAN swap system. The latter was created by theoriginal five ASEAN countries, which agreed in 1977 to establish an ASEANswap arrangement (ASA). In May 2000 the ASA was expanded to include theother five new ASEAN members, and the total amount of the facility was raisedto U.S.$1 billion from the initial amount of U.S.$200 million.
The CMI network of bilateral swap arrangements (BSAs) among the eightmembers of ASEAN+3 provides liquidity assistance in the form of swaps ofU.S. dollars for the domestic currencies of the participating countries. For eachBSA, the contracting parties determine the maximum amount that can bedrawn from the arrangement. The bilateral swap agreement allows an automaticdisbursement of up to 10 percent of the agreed maximum amount. A countrydrawing more than 10 percent of the maximum from the facility is placed underan IMF macroeconomic and structural adjustment program. The BSA networkis thus complementary to the IMF lending facilities. The participating countriesare able to draw from their respective BSAs for a period of ninety days. The firstdrawing may be renewed seven times. The interest rate applicable to the draw-ing is the LIBOR (London interbank offered rate) plus a premium of 150 basispoints for the first drawing and the first renewal. Thereafter, the premium risesby an additional 50 basis points for every two renewals, but it is not to exceed300 basis points.
The BSAs include one-way and two-way swaps (see table 8-4). China’s andJapan’s initial contracts with the five Southeast Asian countries were one-way
25. Bergsten and Park (2002).
regional financial integration in east asia 245
10101-08_Ch08_Redo.qxd 10/5/06 3:08 PM Page 245

Tab
le 8
-4.
Prog
ress
on th
e C
hian
g M
ai I
nitia
tive
Am
ount
as o
fb
BSA
aC
urre
ncie
sC
oncl
usio
n da
teM
ay 3
0, 2
004
Feb.
24,
200
6
Japa
n–R
epub
lic o
f Kor
eac
U.S
.$/w
on (
one-
way
)Ju
ly 4
, 200
1U
.S.$
2 bi
llion
d
Japa
n–R
epub
lic o
f Kor
eaU
.S.$
/loc
ale
(tw
o-w
ay)
Feb.
24,
200
6U
.S.$
15 b
illio
nJa
pan–
Rep
ublic
of K
orea
Yen
/won
(tw
o-w
ay)
May
27,
200
5U
.S.$
6 bi
llion
Japa
n–T
haila
ndc
U.S
.$/b
aht (
one-
way
)Ju
ly 3
0, 2
001
U.S
.$3
billi
onJa
pan–
Tha
iland
U.S
.$/l
ocal
(tw
o-w
ay)
Jan.
25,
200
5U
.S.$
6 bi
llion
Japa
n–Ph
ilipp
ines
cU
.S.$
/pes
o (o
ne-w
ay)
Aug
. 27,
200
1U
.S.$
3 bi
llion
Japa
n–Ph
ilipp
ines
U.S
.$/p
eso
(one
-way
)A
ug. 2
8, 2
004
U.S
.$3
billi
onJa
pan–
Mal
aysi
aU
.S.$
/rin
ggit
(on
e-w
ay)
Oct
. 5, 2
001
U.S
.$1
billi
ond
U.S
.$1
billi
ond
Japa
n–C
hina
yen/
renm
inbi
(tw
o-w
ay)
Mar
. 28,
200
2U
.S.$
6 bi
llion
U.S
.$6
billi
onJa
pan–
Indo
nesi
acU
.S.$
/rup
iah
(one
-way
)Fe
b. 1
7, 2
003
U.S
.$3
billi
onJa
pan–
Indo
nesi
aU
.S.$
/rup
iah
(one
-way
)A
ug. 3
1, 2
005
U.S
.$6
billi
onJa
pan–
Sing
apor
ecU
.S.$
/sin
g U
.S.$
(on
e-w
ay)
Nov
. 10,
200
3U
.S.$
1 bi
llion
Japa
n–Si
ngap
ore
U.S
.$/l
ocal
(tw
o-w
ay)
Nov
. 8, 2
005
U.S
.$4
billi
onR
epub
lic o
f Kor
ea–C
hina
cw
on/r
enm
inbi
(tw
o-w
ay)
June
24,
200
2U
.S.$
4 bi
llion
Rep
ublic
of K
orea
–Chi
naw
on/r
enm
inbi
(tw
o-w
ay)
May
27,
200
5U
.S.$
8 bi
llion
Rep
ublic
of K
orea
–Tha
iland
U.S
.$/l
ocal
(tw
o-w
ay)
June
25,
200
2U
.S.$
2 bi
llion
U.S
.$2
billi
on
10101-08_Ch08_Redo.qxd 10/5/06 3:08 PM Page 246

Rep
ublic
of K
orea
–Mal
aysi
acU
.S.$
/loc
al (
two-
way
)Ju
ly 2
6, 2
002
U.S
.$2
billi
onR
epub
lic o
f Kor
ea–M
alay
sia
U.S
.$/l
ocal
(tw
o-w
ay)
Oct
. 14,
200
5U
.S.$
3 bi
llion
Rep
ublic
of K
orea
–Phi
lippi
nesc
U.S
.$/l
ocal
(tw
o-w
ay)
Aug
. 9, 2
002
U.S
.$2
billi
onR
epub
lic o
f Kor
ea–P
hilip
pine
sU
.S.$
/loc
al (
two-
way
)O
ct. 2
7, 2
005
U.S
.$3
billi
onR
epub
lic o
f Kor
ea–I
ndon
esia
U.S
.$/l
ocal
(tw
o-w
ay)
Dec
. 3, 2
003
U.S
.$2
billi
onU
.S.$
2 bi
llion
Chi
na–T
haila
ndU
.S.$
/bah
t (on
e-w
ay)
Dec
. 6, 2
001
U.S
.$2
billi
onU
.S.$
2 bi
llion
Chi
na–M
alay
sia
U.S
.$/r
ingg
it (
one-
way
)O
ct. 9
, 200
2U
.S.$
1.5
billi
onU
.S.$
1.5
billi
onC
hina
–Phi
lippi
nes
U.S
.$/p
eso
(one
-way
)A
ug. 2
9, 2
003
U.S
.$1
billi
onU
.S.$
1 bi
llion
Chi
na–I
ndon
esia
cR
upia
h/re
nmin
bi (
one-
way
)D
ec. 3
0, 2
003
U.S
.$1
billi
onC
hina
–Ind
ones
iaU
.S.$
/rup
iah
(one
-way
)O
ct. 1
7, 2
005
U.S
.$2
billi
on
Sour
ces:
Asi
an D
evel
opm
ent B
ank,
“Pr
ogre
ss R
epor
t on
the
Chi
ang
Mai
Ini
tiat
ive:
Cur
rent
Sta
tus
of th
e B
ilate
ral S
wap
Arr
ange
men
t Net
wor
k as
of 1
0 N
ovem
-be
r 20
04”;
Jap
anes
e M
inis
try
of F
inan
ce, “
Net
wor
k of
Bila
tera
l Sw
ap A
rran
gem
ents
und
er th
e C
hian
g M
ai I
niti
ativ
e (a
s of
Feb
ruar
y 24
, 200
6)”;
Jap
anes
e M
inis
try
of F
inan
ce, “
Japa
n’s
Bila
tera
l Sw
ap A
rran
gem
ents
und
er t
he C
hian
g M
ai I
niti
ativ
e (a
s of
Feb
ruar
y 24
, 200
6)”;
and
var
ious
pre
ss r
elea
ses
from
cen
tral
ban
ks o
fA
SEA
N+3
cou
ntri
es.
a. B
ilate
ral s
wap
arr
ange
men
t. T
he to
tal s
ize
of a
two-
way
BSA
is d
oubl
e th
e fa
ce v
alue
of t
he B
SA.
b. T
he to
tal s
ize
of a
ll B
SAs
amou
nted
to U
.S.$
36.5
bill
ion
as o
f May
200
4 an
d to
$71
.5 b
illio
n as
of F
ebru
ary
2006
.c.
Thi
s co
ntra
ct h
as b
een
repl
aced
.d.
The
U.S
. dol
lar
amou
nts
show
n do
not
incl
ude
the
amou
nts
com
mit
ted
unde
r th
e N
ew M
iyaz
awa
Init
iati
ve: U
.S.$
5 bi
llion
for
the
Rep
ublic
of K
orea
, whi
chex
pire
d on
Feb
ruar
y 24
, 200
6, U
.S.$
2.5
billi
on fo
r M
alay
sia,
and
the
ASE
AN
Sw
ap A
rran
gem
ent (
U.S
.$2
billi
on).
e. U
.S.$
/loc
al (
two-
way
) is
U.S
.$/y
en a
nd U
.S.$
/won
in th
is c
ase
and
anal
ogou
s fo
r ot
her
coun
trie
s.
10101-08_Ch08_Redo.qxd 10/5/06 3:08 PM Page 247

BSAs from which only the ASEAN five could draw. The first round of CMIimplementation was completed in May 2004, with sixteen BSAs totalingU.S.$36.5 billion having been concluded. Japan participated in seven agree-ments, and China and the Republic of Korea took part in six each. Under theseinitial BSAs, the Republic of Korea, which is the largest beneficiary of the CMI,could draw a maximum of $13 billion from the system, including the resourcesavailable under the Miyazawa initiative. In the eyes of participants in the globalfinancial market, however, the liquidity available to the Republic of Korea andother members was not enough to be of any significance in preventing futurecrises, and the ASEAN+3 countries therefore decided to double the total size ofthe CMI in 2005 (see below).
The CMI is comparable to the liquidity support arrangements that had sup-ported the European Monetary System before the monetary union was createdin 1999. However, the CMI had a different motivation from the beginning.The European facilities were created with the aim of limiting bilateral exchangerate fluctuations among regional currencies. The CMI started with high capitalmobility and flexible exchange rates, although some members of ASEAN+3have maintained a relatively fixed exchange rate regime. So far, the ASEAN+3countries have not sought any manifest exchange rate coordination. In theabsence of exchange rate coordination, incentives for mutual surveillance will belimited because a member country facing a speculative currency attack may befree to float its exchange rate against those of neighboring countries.26
As long as the CMI is simply a source of financial resources supplementary tothe IMF, the size of the swaps does not have to be large enough to meet thepotential liquidity need. Although the CMI can be managed without its ownconditionality at this point, it does need to establish its own surveillance mecha-nism to avoid breaches of the swap contracts. Because up to 10 percent of eachswap can be disbursed with only the consent of the swap-providing countries,the latter need to formulate their own assessments of the credibility and thecapacity of the swap-requesting countries to honor their contracts. The currentpractices under the ASEAN+3 process cannot effectively resolve repaymentdefault problems.
Most participating countries agree in principle that the CMI network needsto be supported by an independent monitoring and surveillance system thatwould monitor economic developments in the region, serve as an institutionalframework for policy dialogue and coordination among the members, andimpose structural and policy reform on the countries drawing from the BSAs.
26. Wang and Woo (2004).
248 yung chul park
10101-08_Ch08_Redo.qxd 10/5/06 3:08 PM Page 248

However, the ASEAN+3 countries at the current stage do not seem well pre-pared to establish a policy coordination mechanism in the surveillance process,although collective efforts are being made in this regard.27
At the annual meeting of the Asian Development Bank (AsDB) in Jeju,Republic of Korea, in April 2004, the finance ministers of ASEAN+3 agreed to undertake a further review of the CMI to explore ways in which the scope ofits operations could be further enhanced and consolidated. A working groupcreated to conduct the review presented a report highlighting the major issuesrelated to CMI enlargement and consolidation at the meeting of finance minis-ters held during the AsDB meeting in Istanbul in May 2005.28 In order todevelop the CMI into a more credible and effective liquidity support system,the ASEAN+3 finance ministers approved the proposal made in the report, whichwas intended to double the size of the existing individual bilateral swaps, withthe provision that the actual increase would be decided by bilateral negotiationsamong the members.29 As of February 2006, nine of the initial contracts hadbeen replaced by ten new contracts for a total of U.S.$56 billion, more thandoubling the initial amount of those contracts (U.S.$21 billion). Japan replacedthe one-way contracts with the Republic of Korea, Thailand, and Singaporewith two-way contracts. The maximum withdrawal for the Republic of Korea,still the largest beneficiary of the CMI, increased by U.S.$7 billion, to a total ofU.S.$20 billion. The total amount of all BSAs came to U.S.$71.5 billion, whichwas almost double the initial amount of U.S.$36.5 billion (see table 8-4).
At this stage of development, however, there is no guarantee that the BSAswill be activated, because some of the swap-providing countries may exercisetheir right to opt out. Under the current CMI arrangement, any country wish-ing to obtain short-term liquidity must negotiate the activation with all swap-providing countries individually. If a large number of the members refuse toprovide swaps and different swap providers demand different terms and condi-tions, then the CMI may cease to be an efficient liquidity support system. Thediscussion of swap activation with multiple contractual parties may take time
27. For instance, the ASEAN surveillance process is built on the basis of consensus and infor-mality in keeping with the tradition of noninterference (Manzano, 2001). East Asia, in contrast toEurope, lacks the tradition of integrationist thinking and the web of interlocking agreements thatencourage monetary and financial cooperation (Eichengreen and Bayoumi, 1999). Eichengreenand Bayoumi stress that East Asia does not meet the necessary intellectual preconditions forregional integration. For this reason, they conclude that it is unrealistic to speak of poolingnational sovereignties. While there is no doubt considerable work to be done in promoting policycoordination in the region, it is wrong to say that it cannot be done in East Asia.
28. ASEAN+3 (2005a).29. ASEAN+3 (2005b).
regional financial integration in east asia 249
10101-08_Ch08_Redo.qxd 10/5/06 3:08 PM Page 249

250 yung chul park
and hence may deprive the swap-requesting country of the ability to mount aneffective and prompt defense against a speculative attack. In order to avoid thisinherent bias in the system, it has been proposed to create a secretariat or com-mittee that would determine joint activation of all swap contracts of swap-requesting countries, so that swap disbursements could be made in a concertedand timely manner. At the 2005 Istanbul AsDB meeting, the finance ministersof ASEAN+3 agreed in principle to adopt a collective decisionmaking mecha-nism for the network of BSAs in order to ensure timely availability of liquidityfrom the system through the joint activation of swaps.30 Details of the collectivedecisionmaking mechanism are to be worked out by the ASEAN+3 Finance andCentral Bank Deputies’ Meeting.
As noted earlier, the swap-requesting country can draw up to 10 percent ofthe contract amount without being subject to IMF conditionality with regardto policy adjustments. Several members of the CMI had previously proposedthat the limit should be raised to 20 or 30 percent, and, accepting this pro-posal, the finance ministers of ASEAN+3 agreed to raise the limit to 20 percentat the Istanbul AsDB meeting. However, the CMI members realize that neithermultilateralization of the CMI nor an increase in the drawing limit to more than20 percent will be possible unless a more effective surveillance system is estab-lished. Creating a surveillance mechanism for the CMI has been a controversialissue, and the working group has not been able to produce a surveillance systemacceptable to all members. During the Istanbul meeting, the ASEAN+3 financeministers reaffirmed the need to enhance ASEAN+3 economic surveillance andto integrate it into the CMI, but they were not able to come to any decision onthe structure, role, and location of a surveillance unit.
If the CMI members were to agree on multilateralization and on the creationof a regional surveillance unit, their agreement would be tantamount to estab-lishing an institution similar to a regional monetary fund. Although most of theASEAN+3 members find it premature to set up such an institution, they realizethe need to create an institution that can manage and set terms and conditionsfor bilateral swap transactions, in addition to performing secretariat functionsfor policy dialogue and coordination among members. There have been severalproposals for organizing an ASEAN+3 secretariat, but none has been seriouslyconsidered because the member countries have been divided on the structureand location of the secretariat. This disagreement is not likely to be resolvedanytime soon.
30. ASEAN+3 (2005b).
10101-08_Ch08_Redo.qxd 10/5/06 3:08 PM Page 250

regional financial integration in east asia 251
There are two other issues concerning the enhancement of the CMI as aregional financial institution that remain unresolved. One is the enlargement ofthe CMI membership. Several nonmember Asian countries, including India,have expressed interest in joining the CMI. At present, there is broad consensusthat enlargement should be deferred until some of the operational issues of theCMI are settled. Nevertheless, the inclusion of some of the less developedASEAN members may be raised at future meetings of ASEAN+3.
Another issue is the coordination of exchange rate policy among the mem-bers of ASEAN+3. With the growing need to stabilize bilateral exchange ratesbetween ASEAN+3 states, proposals have been made to strengthen the CMInetwork so that it might serve as an institutional base for monetary integrationin East Asia in the future. Although a formal discussion of monetary integrationhas been put on hold, China’s shift from dollar pegging to an intermediateregime in July 2005 is likely to renew the debate on the need and the modalityfor coordination of exchange rate policy in the region.
Barriers to Financial Cooperation and Integration
The East Asian policymakers who conceived the idea of the CMI would easilyconcede that the BSA system as it is currently structured has a long way to gobefore it can be accepted as an effective mechanism of defense against finan-cial crises. Although at this writing six years have passed since the system wasestablished in May 2000, the leaders of the CMI group have yet to produce anoperational structure for BSAs, in particular a monitoring and surveillancemechanism. And it is highly unlikely that they will do so anytime soon sincethey are hindered by a number of institutional and political constraints to fur-ther expansion of the CMI.
Institutional Constraints
The most serious of these constraints is that the thirteen countries have failedto articulate the ultimate objectives of the CMI arrangement. The participatingcountries themselves are still unclear about whether the CMI is going to remaina regional liquidity support program or serve as a building block for the devel-opment of a full-fledged regional monetary system in East Asia. As noted in thepreceding section, when bilateral swap arrangements are activated collectivelyand supported by a surveillance system, they constitute a de facto regional mon-etary fund. The CMI could thus serve as the foundation on which an elaboratesystem of financial cooperation and policy coordination could be built, following
10101-08_Ch08_Redo.qxd 10/5/06 3:08 PM Page 251

31. From the theoretical standpoint of the neofunctionalists, initial steps toward integrationtrigger self-sustaining economic and political dynamics, leading to further cooperation. Economicinteractions create spillovers or externalities that need to be coordinated by the governmentsinvolved. Such economic policy coordination at the regional level can be seen as an inevitableresponse to increased economic interactions within the region. Once the integration process starts,spillovers deepen and widen integration through interest group pressure, public opinion, elitesocialization, and other domestic actors and processes (George, 1985).
32. Historically, there has been much less movement toward trade regionalism in East Asiathan in Europe. East Asian countries are reliant on markets in the United States and the EuropeanUnion, so there has been less incentive for them to expand trade integration within the region. Thefirst major attempt was made only in 1992, when six ASEAN countries agreed to launch a schemefor ASEAN free trade.
252 yung chul park
in the footsteps of European monetary integration.31 At this stage of develop-ment, however, many countries in East Asia are not prepared to accept the ideaof—or at least feel uneasy about—restructuring the CMI as the forerunner to anAsian monetary fund.
A second institutional constraint is related to the need to coordinate the activ-ities of the CMI with other regional arrangements, such as the Manila frameworksupported by Australia, New Zealand, and the United States. Most of the CMIcountries also participate in the Manila framework and in APEC. At some pointin the future, the leaders of the ASEAN+3 countries may have to decide on amode of cooperation and division of labor between these institutions and theCMI for promoting regional growth and stability. Many of the ASEAN+3 stateshave been engaged in policy reviews and dialogues through the APEC meetingsand the Manila framework. Unless the CMI is developed into a credible financ-ing mechanism by increasing swap amounts, it will take on a role similar to thatof these other regional economic forums. The cohesion of the group will then beweakened as questions are raised about whether the thirteen countries constitutean appropriate grouping for a regional financing arrangement in East Asia.
A third impediment is that the fear of another round of financial crisis hasreceded, thanks to a recovery that has been faster than predicted based on previ-ous crisis episodes. With this false perception of security, the ASEAN+3 coun-tries have become less interested in enlarging and institutionalizing the CMIoperations. Instead, their focus has shifted recently to creating free-trade areas(FTAs) in East Asia (see table 8-5).32 The ASEAN Free Trade Area (AFTA) nowincludes the whole of Southeast Asia, and it continues to expand. On November29, 2004, China and the ASEAN countries agreed to form a free-trade area by2010, allowing for some preferential treatment for less-developed ASEAN coun-tries. Japan has concluded a free-trade agreement with Singapore and has started
10101-08_Ch08_Redo.qxd 10/5/06 3:08 PM Page 252

regional financial integration in east asia 253
Table 8-5. Progress of Major Free-Trade Agreements in East Asia, 2005
Stages of evolution
Participants in Signed Implementation free-trade agreements Discussion Joint study Negotiation (year) (year)
ASEANASEAN Free X (1993)
Trade AgreementASEAN–China CECa X (2005)ASEAN–Japan CEPb XASEAN–India X (2005)ASEAN+3 XASEAN– X X (2005)
Republic of Korea
ASEAN–CERc X
JapanJapan–Singapore X (2003)Japan–Mexico X (2004)Japan–Malaysia X (2005)Japan– X
Republic of Korea
Japan–Philippines X (2005)Japan–Thailand X (2005)Japan–Chile XJapan–India X
Republic of KoreaRepublic of X (2004)
Korea–ChileRepublic of X
Korea–JapanRepublic of X
Korea–MexicoRepublic of X
Korea–ChinaRepublic of X (2005)
Korea–SingaporeRepublic of X
Korea–CanadaRepublic of X
Korea–United States(continued)
10101-08_Ch08_Redo.qxd 10/5/06 3:08 PM Page 253

254 yung chul park
Republic of X (2005)Korea–EFTAd
Republic of XKorea–Mercosure
Republic of XKorea–India
ChinaChina– X (2004)
Hong Kong SARChina–Macao X (2004)China–Australia XChina–Brazil XChina–Chile X (2005)China–GCCf XChina–Thailand X
SingaporeSingapore–Australia X (2003)Singapore–New Zealand X (2002)Singapore–United States Signed TIFAg with United States X (2004)Singapore–EFTAd X (2003)Singapore–Canada X (2004)
ThailandThailand–China XThailand–Australia X (2005)Thailand–United States Signed TIFAg with X
United StatesThailand–Japan XThailand–India X (2004)
Source: Compiled from various sources.a. Comprehensive Economic Cooperation.b. Comprehensive Economic Partnership.c. Closer Economic Relations Trade Agreement between Australia and New Zealand.d. European Free Trade Association.e. Southern Common Market.f. Gulf Cooperation Council.g. Trade and Investment Framework Agreement.
Table 8-5. (continued)
Stages of evolution
Participants in Signed Implementation free-trade agreements Discussion Joint study Negotiation (year) (year)
10101-08_Ch08_Redo.qxd 10/5/06 3:08 PM Page 254

regional financial integration in east asia 255
negotiations on a similar agreement with the Republic of Korea and ASEAN andwith several states of ASEAN on an individual basis.
The free-trade movement is undoubtedly a desirable development, and theCMI could help further it by stabilizing bilateral exchange rates for regional cur-rencies and minimizing the disruptive effects of financial market turbulence.The ASEAN+3 countries may thus have an incentive to broaden the scope ofthe CMI in parallel with negotiations on establishing free-trade areas in theregion. In reality, however, it appears that free-trade discussions have rather dis-tracted many East Asian countries from their CMI negotiations.
A regionwide East Asian FTA covering the ASEAN+3 countries is provingslow to materialize because China and Japan are seeking bilateral trade agree-ments rather than multilateral ones. Indeed, the current pattern of regionaltrade agreements in East Asia is bewildering.33 It consists largely of a web ofbilateral arrangements, many of which are still on the drawing board. There hasapparently been no formal attempt to build a regional multilateral agreementlike the European Common Market agreement, and bilateral agreements areunlikely to foster a collective framework.34
A fourth constraint is that financial deregulation and market opening havedrawn East Asia away from regional financial integration. Over the past decade, anumber of East Asian countries have opened up their financial markets to foreigncapital by reducing restrictions on inward and outward capital flows. Financialliberalization throughout East Asia has led many countries to establish closerlinks with international financial centers.35 In East Asia, there is no sign of thedevelopment of an integrated regional financial market. This relative lack ofprogress in regional financial integration is not surprising. Eichengreen and Parkexplain the various factors involved by comparing the region with Europe.36
According to their analysis, Europe has gone further than East Asia in theintegration of product and factor markets. While the European Union has atrue single market of goods and services, progress toward the creation of anAsian free-trade area remains incomplete. And while Europe has removed essen-tially all barriers to the free movement of capital and most barriers to the move-ment of labor, in East Asia limits on factor mobility remain pervasive. In Europe,regionalism is motivated in no small part by a desire for political integrationthat has no counterpart in East Asia. Whereas Europe has built institutions of
33. See Scollay and Gilbert (2001).34. Wyplosz (2004).35. Lee, Park, and Shin (2004).36. Eichengreen and Park (2003).
10101-08_Ch08_Redo.qxd 10/5/06 3:08 PM Page 255

256 yung chul park
transnational governance (such as the European Commission, the EuropeanParliament, the European Court of Justice, and now the European CentralBank), East Asian integration is “weakly institutionalized.” It is predicated noton transnational institutions but on intergovernmental agreements that defer tothe sovereignty of the participating states. Moreover, integration in East Asia isnot being driven by an alliance of key nations like France and Germany or by asingle hegemonic power (the role played by the United States in the Westernhemisphere); it is a more multipolar process.
As is well known, East Asia is less financially integrated than Europe. In EastAsia, financial claims are all denominated in U.S. dollars and the bulk of foreignlending and borrowing are intermediated through international financial marketsin New York and London. Therefore, regional financial arrangements themselvescannot effectively address the inherent structural balance-sheet problem thatmost East Asian emerging and developing countries are currently facing. Theabsence of regional financial integration is closely linked to the absence of aregional lender of last resort. In Europe, West Germany was prepared to supply avirtually unlimited amount of short-term liquidity under the European Mone-tary System when weak currency countries were under severe pressure from cur-rency devaluation. In East Asia, Japan appears to play only a limited role as aregional lender of last resort.
Leadership Issues
Finally, there is a leadership problem that defies easy solution. If the thirteencountries have the more ambitious goal of developing a collective exchange ratemechanism similar to the exchange rate mechanism (ERM) in Europe, with thelong-term objective of adopting a common currency, they will have to increasethe number and the amounts of BSAs. As the European experience shows, sucha move requires leadership that can foster cohesion among the thirteen coun-tries by mediating the divergent interests of members.
China and Japan are expected to provide leadership in forging regional con-sensus for expanding and consolidating BSAs as a regional institution, but theyhave not been able to agree on a number of operational issues, including a sur-veillance mechanism. Except for Japan, no other potential swap lenders, includ-ing China, are prepared to increase the amounts of their bilateral swaps withother contracting parties. Japan could increase its swap amounts with theASEAN states and the Republic of Korea (under the presumption that Chinawill not borrow from Japan) to make the CMI a more credible financing scheme.However, unless Japanese authorities receive some sort of assurance that their
10101-08_Ch08_Redo.qxd 10/5/06 3:08 PM Page 256

regional financial integration in east asia 257
short-term lending will be repaid, they are not likely to lead an expansion andinstitutionalization of the CMI. As a minimum condition for expansion of theCMI, Japan would demand the creation of an effective surveillance mechanismfor the region in which it could exercise influence commensurate with its finan-cial contribution. However, China would be unlikely to accept any arrangementin which it felt that it was playing second fiddle to Japan in a regional organiza-tion in East Asia. This concern appears to be the most serious roadblock to fur-ther development of the CMI.
China and Japan have different interests and hence different strategies foreconomic integration in East Asia. As far as China is concerned, economic inte-gration with the ten ASEAN members and with the South and Central Asiancountries may be more important both economically and geopolitically thanfinancial cooperation or free trade with either Japan or the Republic of Korea.While China is a military superpower in the world and has been growing rap-idly, it is still a developing economy far behind Japan in technological andindustrial sophistication. These differences in the economic and military statusof the two countries suggest that, even if they manage to resolve their past dif-ferences, China and Japan may find it difficult to work together as equal part-ners for regional integration in East Asia.
Despite slow progress in reconciliation between China and Japan, China seemsto be emerging as an active player in both the international and the regional are-nas. Since the mid-1990s, China has expanded the number and depth of its bilat-eral relationships, joined various trade and security accords, deepened itsparticipation in key multilateral organizations, and helped address global securityissues. The pinnacle of this process was the Treaty of Good-Neighborliness andFriendly Cooperation, signed by China with Russia in 2001.37
China borders Russia and many of the South and Central Asian countries inaddition to several ASEAN members. It is therefore natural for China to seekexpansion and deepening of its trade and financial relations with those neighbor-ing countries. To that end, China has been courting ASEAN with the aim ofestablishing a free-trade agreement, and in November 2001 it joined the Bangkokagreement on a free-trade area that includes the Republic of Korea and the SouthAsian countries (Bangladesh, India, Laos, and Sri Lanka). In Central Asia, Chinahas also taken a leading role in establishing the region’s first multilateral group,the Shanghai Cooperation Organization. Founded to settle long-standing territo-rial disputes and to demilitarize borders, the organization now stresses counter-
37. See Medeiros and Fravel (2003).
10101-08_Ch08_Redo.qxd 10/5/06 3:08 PM Page 257

258 yung chul park
terrorism cooperation and regional trade among Russia, Kazakhstan, Kyrgyzstan,Tajikistan, Uzbekistan, and China.38
In contrast, Japan has not been able to articulate its strategic interests in EastAsia. While it has been at the forefront in supporting greater economic coopera-tion among the East Asian countries, its perspective on the geographic area ofEast Asia has not been altogether clear. Japan has been promoting integrationamong the “ASEAN+5,” but which two economies are to be added to ASEAN+3to make ASEAN+5? At times, the two economies mentioned have been Aus-tralia and New Zealand and at other times Taiwan Province of China and HongKong SAR.
There is also a suspicion that Japan is not interested in free trade and finan-cial arrangements per se in East Asia for purely economic reasons. Instead, Japanis thought to be engaging in discussion of regional arrangements with other EastAsian countries with the aim of maintaining its leadership role as the region’slargest economy by checking and balancing China’s expansion. Many analystsbelieve that Japan’s active involvement in regional economic integration is moti-vated by its desire to maintain its traditional pole position.39 Japan has also beengripped with a decade-long recession and has been unable to restructure itseconomy.40 These developments, combined with its lack of a strategy for EastAsian development, seem to undermine Japan’s ability to pull the East Asiancountries together for regional cooperation and integration.
What, then, are the likely courses of development for the regional financialarchitecture in East Asia? How would financial integration proceed in theregion? One possible scenario is that China and Japan will come to realize that,despite the differences in their strategies, together they are the key to developinga common political will in East Asia. Sakakibara argues that the role of Chinaand Japan in East Asia’s integration process is synonymous with that of Franceand Germany in Europe.41 Similarly, the Kobe Research Project report, submit-ted to the fourth gathering of finance ministers of the Asia-Europe Meeting
38. In June 2001, the presidents of six countries signed the Declaration of the Shanghai Cooper-ation Organization (SCO). The aim of the SCO is to strengthen mutual trust and friendly relationsamong member states, encouraging their further effective cooperation in the political and economicspheres and in science and technology, culture, education, energy, transportation, environmentalprotection, and other fields, with a view to jointly ensuring regional peace, security, and stabilityand creating a new international political and economic order.
39. See D. Wall, “Koizumi Trade Pitch Nests,” Japan Times, April 21, 2002.40. Uncertain economic prospects may make Japan unlikely to be the driver in the region’s
integration movement as it was in the past. China is emerging both as a strong competitor and as apromising market.
41. Sakakibara (2003).
10101-08_Ch08_Redo.qxd 10/5/06 3:08 PM Page 258

regional financial integration in east asia 259
(ASEM) held in Copenhagen in July 2002, affirms that cooperation betweenJapan and China, as core countries in East Asia, will be essential in leading theprocess of economic and financial integration in the region, just as the alliancebetween France and Germany played a central role in the integration and coop-eration process in Europe.42
This realization could soften their positions and lead to compromise on aninstitutional setting and on augmentation of the existing financial architecturein East Asia. For instance, China might accept Japan’s demand for de facto con-trol over monitoring and surveillance in return for Japan’s pledge for a substan-tial increase in financial assistance in the form of one-way swaps and officialdevelopment assistance (ODA) to ASEAN members. China might agree to thisscheme, if it were confident about concluding a free-trade agreement with theASEAN members in the near future. A China–ASEAN free-trade pact couldcircumscribe Japan’s influence on ASEAN affairs even though Japan is a majorprovider of financial resources to the region. In this process, the Republic ofKorea and ASEAN could play a mediating role in the cultivation of a commonpolitical will between China and Japan.43
In another possible scenario, China would assume a more aggressive leader-ship role in regional integration. In view of the uncertain prospects for the Japa-nese economy, China could emerge as the region’s engine of growth over thelonger term if it sustains its own growth. As part of this leadership role, Chinamight choose to negotiate both the expansion of the BSAs and a free-trade pactwith ASEAN. In that case, the original CMI would become “ASEAN+1” in thesense that Japan would play second fiddle. Realizing that financial integration isan integral part of a successful free-trade area, China might indeed seriously
42. France and Germany also had a wartime legacy. Although Charles de Gaulle was a nation-alist and his nationalism was popular within the country, he also appreciated that membership inthe common market would benefit France economically. However, de Gaulle remained implacablyopposed to any increase in the powers of the European Commission or to any other increase insupranationalism. He showed just how opposed in 1965, when he precipitated the most dramaticcrisis in the history of the European Community (George, 1985). It was Chancellor HelmutSchmidt of Germany and President Giscard d’Estaing of France who restarted the stalled integra-tion process at the end of the 1970s. The joint initiative of Chancellor Helmut Kohl and PresidentFrançois Mitterrand resulted in a great leap toward European monetary union in the early 1990s.The Franco-German alliance formed the core for the integration process in Europe because it wasthe political will of these two countries that motivated further integration.
43. Murase (2004) emphasizes the role of the Republic of Korea, pointing out that, as financialcooperation improves, the Republic of Korea will likely play a role similar to that of the Beneluxcountries in Europe. In the formation of a regional monetary system, it could supplement Sino-Japanese leadership while representing the interests of smaller countries in the region. In thefuture, the Republic of Korea, like key members of ASEAN, could be a location for the secretariatand other organizations.
10101-08_Ch08_Redo.qxd 10/5/06 3:08 PM Page 259

260 yung chul park
consider this option. However, without Japan, ASEAN+1 would not be a viablearrangement for a regional financing scheme, simply because China is hardly in aposition to commit itself to financing the balance-of-payments deficits of allASEAN member states. It is also questionable whether ASEAN would join anyregional financial arrangement in which China was the dominant member.
A third scenario is the enlargement of the CMI to include Australia and NewZealand and possibly India in South Asia. This would most likely be the routefavored by Japan, which would find it easier to deal with China if there were morecountries supporting Japan’s strategy. However, many members of ASEAN+3believe that, at this stage, reaching critical mass within the existing CMI shouldprecede any enlargement discussion. Since enlargement is not likely to lead to anysubstantial increase in the availability of short-term financing, most ASEAN+3members would not take the third scenario seriously.
Perhaps the most realistic scenario is that the countries participating in theCMI will simply maintain the status quo, continuing to discuss modalities ofpolicy dialogue and debate the merits of various types of surveillance systems forthe CMI and the feasibility of augmenting swap amounts—but without makingany substantial progress.
Concluding Remarks
The adoption and implementation of the CMI can be counted as a major steptoward strengthening financial cooperation among the thirteen East Asiancountries. However, ASEAN+3 will face much tougher challenges and tasks inexploring developments beyond the CMI. The East Asian countries need toclarify for the international community what their motivations are, how theywill develop an action plan, and how they believe the plan fits in with the exist-ing global financial system.44
Regionalism in East Asia is taking two forms: free-trade arrangements andfinancial arrangements. These arrangements imply that geographically proximatecountries band together to foster trade on the one hand and to promote financialand exchange rate stability on the other. The two processes reinforce each other.
The euro area pursued trade integration first, but from a theoretical point ofview there is no clear reason for this. Even in Europe, trade integration sloweddown whenever there were concerns about exchange rate stability among mem-ber countries, which suggests that some form of monetary integration is animportant condition for trade integration.45 Furthermore, there are many good
44. Park and Wang (2000).45. Shin and Wang (2004).
10101-08_Ch08_Redo.qxd 10/5/06 3:08 PM Page 260

regional financial integration in east asia 261
reasons for forming a monetary union before establishing a free-trade arrange-ment. A monetary union can quite significantly increase trade among membercountries by serving as a means of avoiding the bottlenecks that may occur inthe process of negotiating and implementing a free-trade arrangement. Thisincreased trade is likely to occur mostly within similar industries, so weakeningasymmetric shocks across member countries will also decrease the costs of main-taining a monetary union. In addition, a monetary union can accelerate finan-cial integration in the region, which might not be accomplished otherwise.Hence, a monetary union is a self-validating process.
Few East Asian policymakers would be naive enough to believe that they willbe able to work out an agreement on creating an East Asian monetary fund or acommon currency area in the near future. At best, monetary unification is along-term objective, and the ASEAN+3 countries have just taken the first steptoward regional integration in financial markets. However, East Asia enjoys thelatecomer’s advantage in promoting financial and monetary integration becauseit can learn from the European experience. In the end, the Western countrieswill have to decide whether regional financial arrangements in East Asia willcontribute to global stability and welfare. The European experience suggeststhat they are likely to do so. It would therefore be in the interest of Europe andof the United States to support the expansion and consolidation of the CMIinasmuch as financial deepening in East Asia will support an orderly globaliza-tion of the world economy.
References
ASEAN+3. 2005a. “Report of the Review of the Chiang Mai Initiative: Ways of EnhancingIts Effectiveness.” ASEAN+3 Finance Ministers Meeting, Istanbul, Turkey.
———. 2005b. Joint Ministerial Statement of the 8th ASEAN+3 Finance Ministers’ Meet-ing, Istanbul, Turkey.
Bayoumi, T., B. Eichengreen, and P. Mauro. 1999. “On Regional Monetary Arrangementsfor ASEAN.” Paper prepared for the ADB/CEPH/KIEP Conference on Exchange RateRegimes in Emerging Market Economies, Tokyo, December 17–18.
Bergsten, C. Fred, and Yung Chul Park. 2002. “Toward Creating a Regional Monetary Arrange-ment in East Asia.” ADBI Research Paper. Tokyo: Asian Development Bank Institute.
Carstens, A. 2001. “The Mexican Experience with Managing Foreign Exchange Reserves.”Presentation at a seminar on foreign exchange reserve management at the IMF-WorldBank Annual Meetings. Washington.
Council on Foreign Relations, Task Force Report. 1999. Safeguarding Prosperity in a GlobalFinancial System: The Future International Financial Architecture, Carla A. Hills and PeterG. Peterson, chairs; Morris Goldstein, project director. Washington: Institute for Inter-national Economics.
10101-08_Ch08_Redo.qxd 10/5/06 3:08 PM Page 261

262 yung chul park
Eichengreen, B. 2000. “Strengthening the International Financial Architecture: Where DoWe Stand?” ASEAN Economic Bulletin 17, no 2: 175–92.
Eichengreen, B., and T. Bayoumi. 1999. “Is Asia an Optimum Currency Area? Can ItBecome One? Regional, Global and Historical Perspectives on Asian Monetary Relations.”In Exchange Rate Policies in Emerging Asian Countries, edited by S. Collignon, J. Pisani-Ferry, and Yung Chul Park. London: Routledge.
Eichengreen, B., and Yung Chul Park. 2005. “Why Has There Been Less Regional Integrationin East Asia than in Europe.” In A New Financial Market Structure for East Asia, edited byYung Chul Park, T. Ito, and Y. Wang. Cheltenham, United Kingdom: Edward Elgar.
Fischer, S. 2001. “Exchange Rate Regime: Is the Bipolar View Correct?” Journal of EconomicPerspectives 15 (Spring): 3–24.
Frankel, J. 1999. “No Single Currency Regime Is Right for All Countries or at All Times.”Working Paper 7338. Cambridge, Mass.: National Bureau of Economic Research.
Furman, J., and J. Stiglitz. 1998. “Economic Crises: Evidence and Insights from East Asia.”Brookings Papers on Economic Activity 2.
George, S. 1985. Politics and Policy in the European Community. Oxford: Clarendon Press.Glick, R., and A. Rose. 1999. “Contagion and Trade: Why Are Currency Crises Regional?”
Journal of International Money and Finance 18: 603–17.Griffith-Jones, S., and J. A. Ocampo. 2001. “Facing the Volatility and Concentration of Capi-
tal Flows.” In Reforming the International Financial System: Crisis Prevention and Response,edited by J. J. Teunissen. The Hague: Forum on Debt and Development (FONDAD).
Henning, R. C. 2002. East Asian Financial Cooperation. Policy Analyses in International Eco-nomics. Washington: Institute for International Economics.
International Monetary Fund. 2003. “The IMF and Recent Capital Account Crises: Indone-sia, Korea, Brazil.” Evaluation Report. Washington.
Ito, T., E. Ogawa, and Y. Sasaki. 1999. “Establishment of the East Asian Fund.” In Stabiliza-tion of Currencies and Financial Systems in East Asia and International Financial Cooperation.Tokyo: Institute for International Monetary Affairs.
Lawrence, R. Z. 1996. Regionalism, Multilateralism, and Deeper Integration. Brookings.Lee, J.-W., Yung Chul Park, and K. Shin. 2004. “A Currency Union for East Asia.” In Mon-
etary and Financial Integration in East Asia: The Way Ahead, Vol. 2, edited by the AsianDevelopment Bank. New York: Palgrave/Macmillan.
Manzano, G. 2001. “Is There Any Value-Added in the ASEAN Surveillance Process?” ASEANEconomic Bulletin 18: 94–102.
Medeiros, E. S., and M. T. Fravel. 2003. “China’s New Diplomacy.” Foreign Affairs 82,no. 6: 22–35.
Meltzer Commission. 2000. Report of the International Financial Institution Advisory Commis-sion, Allan H. Meltzer, Chairman. Washington: U.S. Government Printing Office.
Murase, T. 2004. A Zone of Asian Monetary Stability. Canberra: Asia Pacific Press.Park, Yung Chul. 2002. “Toward Creating a Regional Monetary Arrangement in East Asia.”
ADBI Research Paper 50. Tokyo: Asian Development Bank Institute.Park, Yung Chul, and Y. Wang. 2000. “Reforming the International Financial System:
Prospects for Regional Financial Cooperation in East Asia.” In Reforming the InternationalFinancial System: Crisis Prevention and Response, edited by J. J. Teunissen. The Hague:FONDAD.
10101-08_Ch08_Redo.qxd 10/5/06 3:08 PM Page 262

regional financial integration in east asia 263
———. 2002. “What Kind of International Financial Architecture for an Integrated WorldEconomy?” Asian Economic Papers 1, no. 1: 91–128.
Park, Yung Chul, J. H. Park, J. Leung, and K. Sangsubhan. 2004. “Asian Bond MarketDevelopment: Rationale and Strategy.” Paper presented at the Conference on RegionalFinancial Arrangements, United Nations, New York, July 14–15.
Sakakibara, E. 2003. “Asian Cooperation and the End of Pax Americana.” In FinancialStability and Growth in Emerging Economies: The Role of the Financial Sector, edited byJ. J. Teunissen and M. Teunissen. The Hague: FONDAD.
Scollay, R., and J. Gilbert. 2001. New Regional Trading Arrangements in the Asia Pacific.Washington: Institute for International Economics.
Shin, K., and Y. Wang. 2004. “Trade Integration and Business Cycle Co-Movements: TheCase of Korea with Other Asian Countries.” Japan and the World Economy, 2004 (Elsevier)16, no. 2: 213–30.
Stiglitz, J. 2002. Globalization and Its Discontents. New York: W. W. Norton.Wang, Y., and W. T. Woo. 2004. “A Timely Information Exchange Mechanism, an Effec-
tive Surveillance System, and an Improved Financial Architecture for East Asia.” In Mone-tary and Financial Integration in East Asia: The Way Ahead, Vol. 2, edited by the AsianDevelopment Bank. New York: Palgrave/Macmillan.
Williamson, J. 2000. “Exchange-Rate Regimes for East Asia: Reviving the IntermediateOption.” Policy Analyses in International Economics 60. Washington: Institute for Inter-national Economics.
World Bank. 2001. “East Asia Regional Update: Regional Overview.” Washington.Wyplosz, C. 2004. “Regional Exchange Rate Arrangements: Lessons from Europe for East
Asia.” Monetary and Financial Integration in East Asia: The Way Ahead, Vol. 2, edited bythe Asian Development Bank. New York: Palgrave/Macmillan.
10101-08_Ch08_Redo.qxd 10/5/06 3:08 PM Page 263

264
Of all the structural weaknesses that might have caused the 1997–98 EastAsian financial crisis, the absence of vibrant bond markets never fails to
make the list. One year after the crisis, Donald Tsang, the financial secretary ofthe Hong Kong Special Administrative Region (SAR) of China at the time, citedthe failure to establish a strong and robust Asian bond market as one reason forthe financial turmoil in East Asia. Going further, he deploringly asked, “How isit that we in Asia have never been able to replicate the success of the Eurobondmarket in this part of the world?”1 International financial institutions such asthe International Monetary Fund (IMF) and the World Bank have also invari-ably pointed to the absence of efficient domestic bond markets as one of themajor causes of the 1997 financial crisis.2 Even before the crisis, East Asiancountries were being urged to develop a domestic bond market to complementtheir bank-dominated financial systems.3
Since the crisis, the development of local bond markets has been a focus ofattention as one of the major objectives of financial reforms proposed by theIMF, the World Bank, and the Asian Development Bank (AsDB) for the East
Asian Bond Market Development: Rationale and Strategiesyung chul park, jae ha park, julia leung, and kanit sangsubhan
9
1. Donald Tsang, “Asian Bond Market,” Asian Debt Conference, July 6, 1998, p. 1.2. International Monetary Fund (2003).3. See World Bank (1995).
10101-09_Ch09_Redo.qxd 10/5/06 3:09 PM Page 264

asian bond market development 265
Asian economies. In parallel, there have been repeated calls to establish regionalbond markets in East Asia.4 In response to these calls and as part of the regionalefforts being made to promote financial cooperation and integration throughthe Chiang Mai Initiative, the Association of Southeast Asian Nations +3 SMENetwork (ASEAN+3) has explored possibilities and modalities for creating Asianbonds and the necessary components of market infrastructure.
There is a large and growing volume of literature on regional bond markets inEast Asia.5 Several strategies for the creation of new, and the expansion of exist-ing, regional bond markets in East Asia have been put forward. However, someregional policymakers continue to debate the rationale for creating regional bondmarkets, and a full consensus has yet to be reached on the need for them.
The Rationale for Creating Asian Bond Markets
The idea of regional bond markets started with the realization that the under-development of bond markets in the region and the resulting excessive dependenceon bank-intermediated financing and foreign short-term financing were majorcauses of the Asian financial crisis of 1997–98. The development of local currencybond markets is therefore one of the most important policy goals in the region.
The disadvantages of not having a full-fledged bond market were made evidentduring the Asian financial crisis of 1997–98. An efficient and mature bond marketcan play an important role during times when the other channels of financialintermediation—banks and equity markets—falter or fail. Most important, theexistence of an alternative source of funding would reduce the corporate sector’sover-reliance on short-term foreign-currency loans. A sound and healthy corporatesector contributes directly to macroeconomic and financial stability, and improvedfinancial intermediation brings such microeconomic benefits as efficiency gainsand diversification of tools for both borrowers and savers. The absence of a devel-oped bond market in the region was one of the main factors behind the extremevolatility that precipitated the Asian financial crisis. The crisis itself spurred gov-ernments in the region to focus on promoting domestic bond markets.
Although considerable progress has been made in developing bond marketssince the crisis, the breadth and depth of the Asian bond markets still lag behindthose of the developed economies. With a market value of less than 50 percentof gross domestic product (GDP), the many Asian domestic bond markets arestill smaller than those of the United States and Japan, where domestic bondmarkets are equivalent to 100 percent of GDP (see table 9-1). In addition, bond
4. See Yoshitomi and Shirai (2001).5. See, for example, Park and Park (2003) and Oh and Park (2003).
10101-09_Ch09_Redo.qxd 10/5/06 3:09 PM Page 265

Tab
le 9
-1.
Vol
ume
of D
iffer
ent T
ypes
of F
inan
cing
in A
sian
Econ
omie
s and
Sel
ecte
d C
ount
ries
, 200
3
Of w
hich
Stoc
k m
arke
t Pu
blic
-sec
tor
Priv
ate-
sect
or
GD
P B
ank
loan
saca
pita
lizat
ion
Bon
d m
arke
tbbo
ndsc
bond
sd
Cou
ntry
($ B
illio
n)$
Bill
ion
Perc
ent
$ B
illio
nPe
rcen
t$
Bill
ion
Perc
ent
$ B
illio
nPe
rcen
t$
Bill
ion
Perc
ent
Hon
g K
ong
159.
123
9.3
150.
471
4.6
449.
371
.845
.222
.831
.749
.168
.3SA
RIn
done
sia
212.
245
.721
.554
.725
.86.
22.
94.
674
.01.
626
.0R
epub
lic o
f 60
5.1
571.
394
.429
8.2
49.3
380.
062
.820
1.8
53.1
178.
246
.9K
orea
Mal
aysi
a10
3.2
104.
610
1.4
168.
416
3.2
78.9
76.5
36.4
46.1
42.5
53.9
Phili
ppin
es78
.523
.529
.923
.229
.52.
33.
01.
564
.60.
835
.4Si
ngap
ore
93.6
101.
610
8.5
148.
515
8.6
62.6
66.9
39.3
62.7
23.4
37.3
Tai
wan
29
0.0
374.
512
9.2
379.
013
0.7
126.
843
.776
.260
.150
.639
.9Pr
ovin
ce
of C
hina
Tha
iland
149.
911
3.5
75.7
119.
079
.463
.642
.448
.275
.915
.324
.1A
vera
ge21
1.4
196.
893
.123
8.2
112.
799
.046
.853
.854
.445
.245
.6
Uni
ted
Stat
es11
,262
.08,
321.
473
.914
,173
.112
5.8
20,1
37.1
178.
812
,003
.659
.68,
133.
540
.4U
nite
d 1,
965.
22,
792.
014
2.1
2,42
5.8
123.
41,
030.
952
.558
2.6
56.5
448.
343
.5K
ingd
omJa
pan
4,65
0.4
4,53
3.2
97.5
2,95
3.1
63.5
5,98
1.2
128.
64,
988.
883
.499
2.4
16.6
Ave
rage
5,95
9.2
5,21
5.5
87.5
6,51
7.4
109.
49,
049.
715
1.9
5,85
8.3
64.7
3,19
1.4
35.3
Sour
ces:
Int
erna
tion
al M
onet
ary
Fund
Int
erna
tion
al F
inan
cial
Sta
tist
ics,
Int
erna
tion
al F
eder
atio
n of
Sto
ck E
xcha
nges
, Jap
an S
ecur
itie
s D
eale
rs A
ssoc
iati
on,
Inte
rnat
iona
l Fin
anci
al C
orpo
rati
on (
IFC
) bo
nd d
atab
ase,
Tha
i Bon
d D
ealin
g C
entr
e, T
hom
son
Fina
ncia
l, C
EIC
, and
var
ious
cen
tral
ban
ks.
a. T
he t
erm
“ba
nk lo
ans”
ref
ers
to d
omes
tic
cred
it e
xten
ded
to t
he p
riva
te s
ecto
r. E
xcep
t fo
r th
e ca
se o
f Tai
wan
Pro
vinc
e of
Chi
na, a
ll ba
nk lo
an d
ata
are
take
nfr
om li
ne 3
2 of
Int
erna
tion
al F
inan
cial
Sta
tist
ics
(for
tabl
e 9-
1 on
ly, S
epte
mbe
r 20
03).
b. A
ll da
ta o
n ou
tsta
ndin
g bo
nds
are
as o
f Dec
embe
r 31
, 200
3, e
xcep
t as
follo
ws:
dat
a fo
r Ja
pan
and
Sing
apor
e (D
ecem
ber
31, 2
002)
, Ind
ones
ia (
Dec
embe
r 31
,20
00),
and
the
Phi
lippi
nes
(Dec
embe
r 31
, 199
9). F
igur
es a
re e
xpre
ssed
in d
ebt
deno
min
ated
in lo
cal c
urre
ncy.
Bon
d fig
ures
for
Hon
g K
ong
SAR
, Rep
ublic
of
Kor
ea, M
alay
sia,
Tai
wan
Pro
vinc
e of
Chi
na, t
he U
nite
d St
ates
, the
Uni
ted
Kin
gdom
, and
Jap
an a
re fr
om t
heir
res
pect
ive
cent
ral b
anks
. Fig
ures
for
Indo
nesi
a an
dth
e Ph
ilipp
ines
are
fro
m I
FC E
mer
ging
Mar
kets
Inf
orm
atio
n C
entr
e bo
nd d
atab
ase.
Fig
ures
for
Tha
iland
are
fro
m t
he T
hai B
ond
Dea
ling
Cen
tre.
Fig
ures
for
Sing
apor
e ar
e es
tim
ates
bas
ed o
n da
ta fr
om th
e M
onet
ary
Aut
hori
ty o
f Sin
gapo
re (
MA
S) a
nd T
hom
son
Fina
ncia
l.c.
The
term
“pu
blic
-sec
tor”
ref
ers
to g
over
nmen
t and
qua
si-g
over
nmen
t bod
ies.
d. T
he te
rm “
priv
ate-
sect
or”
refe
rs to
the
nonp
ublic
sec
tor
and
incl
udes
fina
ncia
l ins
titu
tion
s, c
orpo
rati
ons,
and
ove
rsea
s in
stit
utio
ns.
10101-09_Ch09_Redo.qxd 10/5/06 3:09 PM Page 266

asian bond market development 267
markets’ share of total financing in Asia is still much smaller than it is in theUnited States and Japan (see table 9-2); and Asian bond markets still lack li-quidity and remain quite fragmented.
In the wake of the financial crisis, other important reasons for a stronger,deeper, and broader debt market in the region have also come to the fore. Thehuge current account surpluses of economies in the region have led to very sizableaccumulations of reserves by the public sector. Total foreign exchange reserves ofthe major Asian economies other than Japan nearly doubled between 2000 and2003, rising from about U.S.$700 billion in 2000 to over U.S.$1.2 trillion in2003.6 This has spurred demand for investment in financial instruments, espe-cially bonds. However, the absence of deep bond markets in the emerging Asianeconomies means that a substantial portion of this higher demand has been satis-fied through investments in bonds denominated in major foreign currencies.
Table 9-2. Financing Structure of Asian Economies and Selected Countries, 1995 and 2003Percentage of total financing (rounded)—total outstanding bank loans, stocks, and bonds
December 31, 1995 December 31, 2003
Bank Stock Bond Bank Stock Bond Country loans a market market loans market market b
Hong Kong SAR 39.6 55.6 4.8 23.3 69.7 7.0Indonesia 60.2 38.0 1.7 42.9 51.3 5.8Republic of Korea 44.6 29.4 26.1 45.7 23.9 30.4Malaysia 22.4 65.3 12.4 29.7 47.9 22.4Philippines 30.1 64.9 4.9 47.9 47.3 4.7Singapore 31.5 60.0 8.4 32.5 47.5 20.0Taiwan 62.9 31.2 5.9 42.5 43.1 14.4
Province of China
Thailand 50.8 43.9 5.3 38.3 40.2 21.5Total 45.0 44.5 10.6 36.8 44.6 18.5
United States 21.1 30.4 48.5 19.5 33.2 47.2United Kingdom 42.5 44.5 13.1* 44.7 38.8 16.5
(*March 31, 1995)Japan 43.4 27.8 28.8 33.7 21.9 44.4
Total 30.2 30.7 39.1 25.1 31.4 43.5
Source: See Table 9-1.Notes: See Table 9-1.
6. Included in this list are China, Hong Kong SAR, India, Indonesia, the Republic of Korea,Malaysia, the Philippines, Singapore, Taiwan Province of China, and Thailand.
10101-09_Ch09_Redo.qxd 10/5/06 3:09 PM Page 267

268 y. c. park, j. h. park, j. leung, and k. sangsubhan
According to U.S. Treasury statistics, Asian investors are leading buyers ofU.S. securities. As shown in table 9-3, net purchases of U.S. Treasury andagency paper by Asian economies amounted to U.S.$270 billion in 2003, morethan 60 percent of the world total. Indeed, net foreign portfolio investment bythe emerging Asian economies increased sharply over the five-year period1998–2003—from U.S.$50 billion to U.S.$225 billion. Emerging Asia as awhole is now a large net exporter of portfolio capital.
However, a closer examination of the patterns of portfolio investment flowsinto and out of the Asian region reveals an inherent instability. Fund flows out ofAsia have mainly consisted of large bond investment funds channeled to industri-alized economies owing to the higher credit ratings and the greater depth of bondmarkets in the United States, Japan, and Europe. Some of these funds are recycled
Table 9-3. Net Purchases of U.S. Bonds and Notes by Asian Economies from U.S. ResidentsBillions of U.S. dollars
Agency All bonds Treasury paper Subtotal Corporate and notes
(A) (B) (A + B) (C) (A + B +C)
Country 2002 2003 2002 2003 2002 2003 2002 2003 2002 2003
China 24.1 30.5 29.3 30.0 53.4 60.5 6.0 4.6 59.4 65.1Hong Kong −9.1 6.0 12.6 12.0 3.5 18.0 3.7 4.3 7.2 22.3
SARIndonesia 0.8 0.6 0.5 0.5 1.3 1.1 0.1 0.0 1.4 1.1Japan 30.5 148.3 37.6 24.4 68.1 172.6 10.9 12.5 79.0 185.1Republic 12.9 5.2 0.7 8.5 13.6 13.7 1.5 0.8 15.1 14.5
of KoreaMalaysia 0.9 −0.3 1.3 −1.2 2.2 −1.5 0.1 0.0 2.3 −1.5Philippines 0.2 0.5 0.3 0.0 0.5 0.5 0.1 0.1 0.6 0.6Singapore −2.6 −8.3 2.2 0.7 −0.4 −7.6 1.3 3.3 0.9 −4.3Thailand −1.9 −6.0 0.1 0.2 −1.8 −5.8 0.2 0.4 −1.6 −5.4Taiwan −0.6 9.0 10.8 9.5 10.2 18.5 1.4 1.6 11.6 20.1
Province of ChinaTotal 55.2 185.5 95.4 84.6 150.6 270.0 25.3 27.6 175.9 297.6Percent of 66.3 68.1 49.8 51.7 54.8 61.9 13.9 10.1 38.5 42.0
world total
World total 83.2 272.4 191.6 163.5 274.8 435.9 182.3 272.3 457.1 708.2
Source: United States Treasury.
10101-09_Ch09_Redo.qxd 10/5/06 3:09 PM Page 268

asian bond market development 269
back into the region’s institutions, managed by foreign financial intermediaries.Such investment is mostly in equities and derivatives, which are more volatileinstruments than bank lending or debt financing. Although the flows of foreignfunds into Asia have certainly helped diversify financial intermediation channels,they are more susceptible to market vagaries. Also, foreign financial intermediariesare usually large international financial institutions with considerable marketpower and influence because of the volumes they can mobilize relative to the sizeof emerging economies’ financial markets. When the market is under duress, theycan push prices in a particular direction. The implications for emerging marketsare market volatility, a strong tendency to overshoot, and consequently dauntingchallenges to maintaining monetary and financial stability.
Major Initiatives
Asian countries have attempted to meet these challenges through greater collab-oration on developing regional bond markets in diverse forums such as AsiaPacific Economic Cooperation (APEC), the Executives’ Meeting of East Asia–Pacific Central Banks (EMEAP), and ASEAN+3.
APEC has been trying to develop regional bond markets, particularly securitiza-tion and credit-guarantee markets, to promote greater openness, diversity, andcompetitiveness in regional financial markets. The need to do so was reiterated inthe APEC Finance Ministers’ Joint Ministerial Statement of September 2002 andin the APEC Leaders’ Declaration of October 2002 in Los Cabos, Mexico. Theobjectives of this effort are to identify impediments to the adoption of securitiza-tion markets and the creation of the credit-guarantee markets within the APECeconomies and to propose appropriate solutions to remove them. It is believed thatsecuritization coupled with credit enhancement, to the extent that it helps recon-cile credit and liquidity mismatches between issuers and investors, offers significantbenefits for developing markets and can also facilitate balance-sheet restructuring.
To promote regional bond markets, the central banks of East Asia and thePacific region also formed the Asian Bond Fund (ABF). EMEAP contributedU.S.$1 billion to the first ABF (ABF1). ABF1 was to channel investment intodollar-denominated sovereign and quasi-sovereign bonds issued by Asian entities.To further the development of regional and domestic bond markets in Asia, thecentral banks committed U.S.$2 billion to another fund, known as ABF2, toinvest in local-currency-denominated Asian bonds.
ABF1 and ABF2 were intended to serve as low-cost mechanisms for investingin Asian bonds and as catalysts for domestic financial reforms in Asia. ABF1 hashad relatively little effect on the market for East Asian sovereign dollar bonds,
10101-09_Ch09_Redo.qxd 10/5/06 3:09 PM Page 269

270 y. c. park, j. h. park, j. leung, and k. sangsubhan
since non-EMEAP investors are precluded from investing in it. Moreover,ABF2, created to encourage investment in local-currency-denominated bonds,is expected to have a more significant development impact, given that the com-ponent funds of ABF2 are to be offered to other investors.
Last, the ASEAN+3 countries have discussed the development of the regionalbond market—both intensively and extensively—through the Asian Bond Mar-ket Initiative (ABMI). At an informal meeting of ASEAN+3 Finance Ministryand Central Bank Deputies (AFDM+3) in Tokyo in November 2002, membercountries proposed discussing the feasibility of creating new Asian bond marketsand improving existing ones, under the ASEAN+3 framework. The proposalreceived broad support from the thirteen members. One month later, Japanintroduced the ABMI, a comprehensive plan for developing regional bond mar-kets in Asia.
On February 28, 2003, AFDM+3 delegates held an informal follow-up ses-sion in Tokyo on fostering bond markets in Asia. The Republic of Korea, Japan,Thailand, and other countries put forth various proposals to facilitate the devel-opment of bond markets in the region. The delegates agreed to study the propos-als in depth so as to expedite achieving tangible results. Echoing the delegates’proposals and reflections, the member countries agreed to establish six workinggroups to study issues related to regional bond markets, including securitization,regional credit-rating agencies, regional clearing and settlement systems, andregional credit-guarantee agencies. Since early 2003, the working groups havediscussed these issues intensively in meetings and seminars.
Progress of Existing Initiatives
APEC: Development of Securitization and Credit-Guarantee Markets
An Initiative on the Development of Securitization and Credit Guarantee Mar-kets, cosponsored by Hong Kong SAR, China, the Republic of Korea, andThailand, was endorsed at the Ninth APEC Finance Ministers’ Meeting in LosCabos, Mexico, in September 2002. The aim of the initiative was to promoteunderstanding and awareness of the importance of securitization and credit guar-antees for regional bond-market development and to help the APEC economiesidentify and take concrete steps to remove obstacles to the development of secu-ritization and credit guarantees in bond markets.
This initiative focuses on taking action through two central components. Thefirst component consists of policy dialogues involving both the public and pri-vate sectors to promote the understanding and sharing of views on securitizationand credit-guarantee markets. The second component calls for expert panels to
10101-09_Ch09_Redo.qxd 10/5/06 3:09 PM Page 270

asian bond market development 271
visit and provide advice to APEC economies committed to developing domesticsecuritization and credit guarantees for bond markets.
Four member economies—China, Thailand, Mexico, and the Philippines—have agreed to receive expert advice. Seven economies—Japan, Australia, theUnited States, Thailand, the Republic of Korea, Hong Kong SAR, and China—and the World Bank have provided experts. Panels of experts were formed for therecipient economies and have visited them twice. After the first and second visits toThailand, China, and Mexico, the panels drafted and submitted action plans andpolicy recommendations for removing impediments to the development of securi-tization and credit-guarantee markets in each economy. An interagency taskforceof the countries reviewed the plans and recommendations and discussed them dur-ing the second panel visits. In addition, the first and second high-level policy dia-logues were held in Seoul in April 2003 and in Hong Kong SAR in March 2004.
ASEAN+3: ABMI
Although the ASEAN+3 ABMI was officially approved at the ASEAN+3Finance Ministers’ Meeting in Manila on August 7, 2003, informal meetingsand seminars had been held on the topic since early that year. One of thosemeetings, organized by AFDM+3, was held in Tokyo on February 28, 2003.Member countries tabled various proposals on how to foster bond markets inthe region. The delegates agreed on the need to study the proposals and ideas ingreater depth to achieve tangible results as soon as possible. The various views,suggestions, and proposals of the delegates were incorporated through the estab-lishment of six working groups of volunteers who were to conduct in-depthstudies on various aspects of bond market development. The six working groupsand chair countries are listed in table 9-4. The working groups examine these
Table 9-4. Asian Bond Market Initiative (ABMI) Volunteer Working Groups
Working group Chair country
Creation of New Securitized Debt Instruments ThailandCredit Guarantee and Investment Mechanisms Republic of Korea, ChinaForeign Exchange Transactions and Settlement Malaysia
IssuesIssuance of Local-Currency-Denominated China
Bonds by Multilateral Development Banks, Foreign-Government Agencies and Asian Multinational Corporations
Rating Systems and Information Dissemination Singapore and JapanTechnical Assistance Coordination Indonesia, the Philippines, and Malaysia
10101-09_Ch09_Redo.qxd 10/5/06 3:09 PM Page 271

272 y. c. park, j. h. park, j. leung, and k. sangsubhan
issues through two perspectives: facilitating market access through a broad varietyof mechanisms; and improving market infrastructure to foster bond markets inAsia. The market-access issues include: (1) sovereign bond issuance by Asiangovernments to establish benchmarks; (2) bond issuance by Asian governmentfinancial institutions to promote domestic private enterprises; (3) the creation of asset-backed securities markets, including collateralized debt obligations; (4) bondissuance in the region by multilateral financial institutions and governmentagencies; (5) bond issuance to fund foreign direct investment in Asian countries;and (6) the issuance of bonds denominated in a broader range of currencies andthe introduction of currency-basket bonds. In turn, the issues related to creatingmarket infrastructure to foster bond markets in Asia are: (1) providing creditguarantees through the active use of existing guarantors and the possible creationof an Asian regional guarantee facility; (2) strengthening the rating system byenhancing the role of domestic rating agencies and possibly establishing an Asiancredit-rating board; (3) establishing a mechanism for disseminating informationon issuers and credit-rating agencies; (4) facilitating foreign-exchange transactionsand addressing settlement issues on cross-border transactions; (5) enhancingcapacity building through market research and technical-assistance programs topromote policy dialogue and human-resource development among membercountries; and (6) examining the components of the legal and institutional infra-structure, such as laws governing companies and corporations, securities trans-actions, and taxes.
Each group has subsequently organized several seminars and symposiums tofacilitate the exchange of views among academics, think tanks, and private sectorrepresentatives. In addition, ASEAN+3 officials regularly hold separate meetings.The working groups’ activities made officials of ASEAN+3 governments aware ofobstacles to efficient coordination. Therefore, at the November 2003 informalmeeting of AFDM+3 in Seoul, the ASEAN+3 countries agreed to establish afocal group to coordinate the working groups. The focal group’s main role is tomonitor the progress of the six ABMI working groups and to coordinate theirfuture action plans. This includes: (1) submitting a summary progress report ofABM1 to the ASEAN+3 Finance Ministry and Central Bank Deputies’ meet-ing; (2) providing a progress update on each working group; (3) coordinatingthe meeting schedules of the six working groups; and (4) reporting each group’splans to the other groups. The focal group meetings are to be held twice a year,before the AFDM+3 meetings. The six working groups were later reorganizedinto four groups; of the two remaining groups, the one chaired by China com-pleted its tasks, and the other was transformed into the Technical AssistanceCoordination Team (TACT).
10101-09_Ch09_Redo.qxd 10/5/06 3:09 PM Page 272

asian bond market development 273
Three years after its December 2002 inauguration, ABMI could point tomany concrete achievements. These accomplishments included issuance by theAsDB of ringgit-denominated bonds in Malaysia and the securing of permissionfor multilateral development banks to issue local-currency-denominated bondsin Thailand and China, the creation of a new scheme of cross-boundary primarycollateralized bond obligations (CBOs) by the Republic of Korea and Japan, theprovision of credit guarantees by the Japan Bank for International Cooperation(JBIC) and Nippon Export and Investment Insurance for bonds issued by Asianmultilateral companies, and the launch of the AsianBondsOnline website.7
Most notably, in December 2004 the governments of Japan and the Repub-lic of Korea announced the finalization of an agreement for the introduction ofcross-boundary, yen-denominated CBOs by the Republic of Korea (“KoreanCBOs”) so as to provide much-needed financing to small and medium-sizedenterprises (SMEs) in the latter country (see figure 9-1). The issue of CBOs in
Dual-guaranteestructure
SBC buys subordinatedbonds (20 percent ofunderlying assets) to provide first-loss protection
SMEsd
inRepublicof Korea
Originators(securities
firm)
SPCe inRepublicof Korea
SPC inSingapore
Investorsin
Asia
SBCa IBKb JBICc
Issuescorporate
bonds
Sellscorporate
bondsSeniorbonds Sales
Yen
Buyssubordinated
bondsCounter credit
guaranteeCredit
guarantee
Yen Yen Yen
IssuesCBO
a. Small Business Corporation.b. Industrial Bank of Korea.c. Japan Bank for International Cooperation.d. Small and medium-sized enterprises.e. Special Purpose Corporation.
Figure 9-1. Yen-Denominated Collateralized Bond Obligation (CBO) Scheme of the Republic of Korea and Japan
7. Asian Bonds Online, published by the Asian Development Bank (www.asianbondsonline.org).
10101-09_Ch09_Redo.qxd 10/5/06 3:09 PM Page 273

274 y. c. park, j. h. park, j. leung, and k. sangsubhan
the Republic of Korea was all the more important in that it was structured forplacement outside of the country. The implementation of an innovative, dual-guarantee structure made Korean CBOs attractive to the Asian investor base,injecting badly needed liquidity into the SME sector in the Republic of Koreathrough lending at an extremely competitive rate.
The size of the issue is 10 billion yen, and the underlying portfolio is com-posed of a pool of forty-six SME bonds. In line with other domestic CBOs in theRepublic of Korea, the issue consists of senior and subordinated bonds issued bythe Small Business Corporation (SBC) of Korea. To ensure that the issue wouldappeal to a broad spectrum of investors in Asia, the Industrial Bank of Korea(IBK) extended a fully backed credit facility to support the timely payment of thesenior obligations under the senior bonds.
In preparation for such initiatives in developing regional bond markets, Japan’sMinistry of Finance had amended the “Ministerial Notification” that governs theJBIC guarantee policies. This allowed the JBIC to justify taking a more proactiverole in guarantee operations for appropriately structured credit-enhanced debtinstruments within the region. Following this amendment, the JBIC began delib-erating proposals to guarantee the initial launch of Korean CBOs.
The efforts by both countries in this pioneering initiative reflect the increasedeconomic collaboration and harmonization between them. It is hoped that theprovision of credit enhancement measures by quasi-sovereign institutions toback appropriately structured transactions within Asia will correct the—at leastperceived—risk-return imbalance in regional markets and at the same time serveas a catalyst of growth in the regional bond markets. At the first Republic ofKorea–Japan Dialogue, on February 4, 2006, the finance ministers of the twocountries agreed to continue their joint efforts in this field, recognizing that thefirst issue of this pan-Asia bond had promoted bond market development in theregion, and specifically in their two countries.
In addition, the Regional Multicurrency Bond (RMCB) project was createdto explore the possibility of issuing regional multicurrency bonds or currency-basket bonds. The final report on this project proposed practical steps for issu-ing RMCBs, in the following order: (1) issuing reverse dual-currency bonds,(2) issuing asset-backed securities or collateralized bond obligations, and (3) issu-ing synthetic currency bonds. The working group members later agreed to launchphase II of RMCB through a research project named “Developing Asian Currency-Basket Bond Markets” that would explore the possibility of developing asset-backed-securities-type Asian currency-basket bond markets in the region.
Many issues related to the creation of infrastructure have also been discussed.Realizing the importance of this, AsDB conducted an in-depth study on the
10101-09_Ch09_Redo.qxd 10/5/06 3:09 PM Page 274

asian bond market development 275
regional settlement and clearing mechanism Asia Link. The findings can be sum-marized as follows: First, although current settlement arrangements do not sig-nificantly impede cross-border transactions, there is an important degree ofcompliance with and convergence among market practices across the region,particularly regarding legal certainty, delivery versus payment, and support forrepo and securities lending (including legal certainty on tax treatment). Sec-ond, although the establishment of a regional central security depository wouldbe useful, there is no private sector support for such a measure, owing to thelow volume of cross-border market transactions. Third, four suggestions forimproving regional settlement systems were put forth: ensuring greater trans-parency, enhancing compliance with international standards, promoting greaterregional cooperation, and reducing risk even further.
In addition, a proposal was recently made in favor of linking East Asia’s cen-tral banks with its national clearing and settlement systems, for them to jointlyserve as the clearing and settlement system for the region’s bond markets.8 At theNovember 7, 2004, working group meeting, it was suggested that future effortsto harmonize standards and procedures related to payment and settlement forcross-border bond transactions should take advantage of relevant studies by otherforums such as ASEAN and EMEAP. This would avoid the duplication of theefforts already being made by other working groups. In this regard, the EMEAPworking group is now evaluating the recommendations of the Committee onPayments and Settlement Systems of the Bank for International Settlement andthe International Organization of Securities Commissions.
The long-term solution for regional credit rating is to strengthen the rule oflaw and enhance the quality of information disclosure by building up social cap-ital and promoting institution building. In the short run, EMEAP could con-sider establishing East Asian rating agencies, either through independent ABFsor in conjunction with ASEAN+3. EMEAP could also promote regionalschemes to encourage cooperation with global rating agencies on devising sepa-rate firm-level ratings based solely on firm-specific risks.
Finally, in-depth research was conducted on the establishment of credit guar-antee mechanisms. Such mechanisms are important for developing regional bondmarkets because they can mitigate the credit quality gap between issuers’ poorratings and investors’ requirements. The final report of the study, presented inOctober 2005, concludes that there is sufficient business for the mechanisms anda market gap to be filled. If the introduction of these mechanisms translates intothe creation of independent institutions, a contractually committed capital base
8. See Oh and Park (2003).
10101-09_Ch09_Redo.qxd 10/5/06 3:09 PM Page 275

276 y. c. park, j. h. park, j. leung, and k. sangsubhan
of at least U.S.$3.5 billion will be required. A mix of business products, includ-ing bond guarantees, warehouse loans, investment in financial infrastructure, andtechnical assistance, is advisable in the initial stages. A number of organizationalchoices could be considered, such as: (1) new independent multilateral develop-ment institution (MDI) structured on a stand-alone basis; (2) an MDI structuredas a subsidiary or affiliate of the AsDB; (3) the expansion of existing AsDB facili-ties; (4) the consolidation of bilateral efforts; or (5) public-private partnerships.In addition, member countries could introduce regulatory improvements.Regarding the findings of the report, member countries agreed that the mostimportant requirement was for a demand study, and that, although demand inthe region is sufficient to warrant exploring new mechanisms, the actual amountof demand for the mechanism remains uncertain.
Once the ASEAN+3 Finance Ministers’ Meeting gives its approval at theannual AsDB meeting to be held in May 2006, a second-stage study will be con-ducted to devise a business model for the mechanism and to examine the viabilityof the preferred organizational option. In the meantime, the cochairs will holdcomprehensive talks with all the member countries to build consensus on a courseof action and on a time frame for deciding on the technical and nontechnical fac-tors that will determine the future direction of the possible mechanisms.
EMEAP: ABF1 and ABF2
The ABF is the first fund of its kind in the region. The first phase of the initiative,ABF1, was launched in June 2003 and has been fully invested in U.S.-dollar-denominated bonds in the EMEAP economies. EMEAP next prepared the secondphase of the project—broadening the ABF to cover local-currency-denominatedbonds. Known as ABF2, this phase was launched in December 2004.9 The aim ofboth phases of the initiative is to foster the bond market by improving domesticand regional bond-market infrastructure.
ABF1: the critical first step. The establishment of ABF1 was announced inJune 2003. All eleven EMEAP central banks invested in ABF1 at its launch, andit had a capitalization of some U.S.$1 billion. The fund is now fully invested inU.S.-dollar-denominated bonds issued by sovereign and quasi-sovereign entitiesin eight EMEAP economies (China, Hong Kong SAR, Indonesia, the Republicof Korea, the Philippines, Malaysia, Singapore, and Thailand). The boon todevelopment provided by ABF1 consists in more than the first-round demand
9. Executives’ Meeting of East Asia–Pacific Central Banks and Monetary Authorities (EMEAP),“EMEAP Central Banks Announce the Asian Bond Fund 2,” press release, December 2004(www.emeap.org); EMEAP, “EMEAP Central Banks to Launch Asian Bond Fund 2,” pressrelease, June 2003 (www.emeap.org).
10101-09_Ch09_Redo.qxd 10/5/06 3:09 PM Page 276

effect of the central banks’ U.S.$1 billion investment. Indeed, the seed moneyinvested by the EMEAP central banks has served to attract additional privatesector funding, thereby deepening and broadening market demand. The pro-motional effect of ABF1 is expected to kindle second-round investor and issuerinterest in Asian bond markets, broadening the investor base and increasingmarket liquidity over time.
Furthermore, the ABF1 initiative is a milestone in cooperation among regionalcentral banks. As noted, it is the first initiative of its kind in Asia, and its successis as symbolic as it is substantive. Not only did the launch of ABF1 send a strongmessage to the financial markets that the regional authorities are committed tostepping up cooperation to promote bond market development; it also paved theway for the development of ABF2. That just one year elapsed from the initial dis-cussions to the actual commitment of funds and the launching of ABF1 testifies tothe rapport and sense of ownership among EMEAP members, which have provenvaluable for the development of ABF2. ABF2 involves many more complex andtechnical issues than did ABF1, and the precedent of ABF1 was very useful forgarnering political support and commitment to face the challenges to ABF2.
ABF2: the bold new second phase. Building on the momentum generated duringthe development of ABF1, EMEAP proceeded to extend the ABF concept tolocal-currency-denominated Asian bonds. Because of the project’s complexity andthe decision that the funds would be opened up to private sector investment in thefuture, EMEAP appointed private sector financial advisers to assist with designingand structuring ABF2 as well as with constructing benchmark indexes for it.
In April 2004, EMEAP announced ABF2’s basic design and the state-of-the-artideas on which that design was based. It proposed that ABF2 should consist oftwo components: the Pan-Asian Bond Index Fund (PAIF) and eight single-market funds (see figure 9-2). Finally, in December of that year, there was an offi-cial announcement that ABF2, initially capitalized with U.S.$2 billion, wouldinvest in domestic-currency bonds issued by sovereign and quasi-sovereign enti-ties in every EMEAP economy except Australia, Japan, and New Zealand. Alleleven EMEAP members were to invest in it.
The PAIF is a single-bond index fund that invests in local-currency-denominated bonds in the eight EMEAP economies. It is expected to serve as aconvenient and cost-effective investment mechanism and to become a new classof asset for regional and international investors seeking to diversify their expo-sure in Asian bond markets.
The eight single-market funds, in turn, invest in local-currency-denominatedbonds issued in the respective EMEAP economies. The single-market funds areintended to provide local investors with low-cost and index-driven options
asian bond market development 277
10101-09_Ch09_Redo.qxd 10/5/06 3:09 PM Page 277

278 y. c. park, j. h. park, j. leung, and k. sangsubhan
while giving regional and international investors the flexibility to invest in theAsian bond markets of their choice.
The ABF2 funds are passively managed against a set of transparent and pre-determined benchmark indexes, covering local-currency bonds issued by sovereignand quasi-sovereign entities in the eight EMEAP economies. They have beendesigned to facilitate investment by other public and private sector parties. In2005, the PAIF and the single-market funds of Hong Kong SAR, Malaysia, andSingapore were listed. The remaining five single-market funds will be offered tothe public in the first half of 2006.
Whereas the aim of ABF1 is to attract additional money into the bond market,the objective of ABF2 goes further, seeking to have a stronger and longer-lastingpositive impact on regional bond-market development. During the launch of
PAIFb
EMEAPa
centralbanks
Single-marketfund
Single-marketfund
Single-marketfund
Underlying bonds
ABF2
Components potentially open to participation byother public and private sector investors.
a. Executives’ Meeting of East Asia–Pacific Central Banks.b. Pan-Asian Bond Index Fund.
Figure 9-2. Asian Bond Fund 2 (ABF2) Framework
10101-09_Ch09_Redo.qxd 10/5/06 3:09 PM Page 278

ABF2, individual EMEAP economies leverage the interest and momentum gen-erated by collective investment in ABF2 to improve market infrastructure byidentifying legal, regulatory, and tax hurdles in their markets and undertakingnecessary reforms. Overall, ABF2 has yielded the following benefits:
—The introduction of a new class of assets: Some ABF2 funds are struc-tured as bond exchange-traded funds (ETFs). Although new to Asia, ETFs areincreasingly used in the United States and Canada. The development of bondETFs should promote product diversification and give both retail and institu-tional investors a low-cost bond product with low entry thresholds.
—The removal of barriers to cross-border capital flows: ABF2 was instru-mental in relaxing cross-border restrictions on participation by foreign investorsin several markets. The registration of the PAIF in Hong Kong SAR, Japan, andSingapore has promoted the cross-border offering of financial products. ThePAIF was also the first foreign entity to obtain permission to invest both inETFs and in interbank traded bonds in mainland China and to enjoy flexibilityin the repatriation of income. Qualified foreign institutional investors (morecommonly known as QFIIs), for example, may only invest in exchange-tradedrenminbi-denominated bonds, in accordance with various limits on investmentand repatriation. In Malaysia, foreign-exchange administration rules have beenliberalized to facilitate cross-border investment, including by the PAIF. In Thai-land and Malaysia, domestic bond markets now allow issues by multilateralagencies, and nonresident investors are now exempt from withholding taxes.
—The adoption of international standards: The observance of internationalstandards would likely encourage greater foreign investment in domestic mar-kets. The PAIF-related documents, such as its trust deed and prospectus, werecarefully drafted in line with international standards and best practices and willserve as a model for other ABF2 funds. This is expected to promote the adop-tion of international standards in the EMEAP markets.
—Increased market transparency: Transparency improves the price discoveryprocess, enhances market efficiency, and fosters investor confidence. Numerousstudies in the United States have shown that increased transparency on tradingprices has narrowed bid-ask spreads on corporate bonds.10 Structuring someABF2 funds as bond ETFs would enhance trading transparency, making orderflows and trade information available to participants, the regulatory authorities,and the public.
—Improvement of market infrastructure: ABF2 has also improved bond-market infrastructure by introducing the iBoxx ABF family of indexes to Asia.
10. See, for example, Edwards, Harris, and Piwowar (2005).
asian bond market development 279
10101-09_Ch09_Redo.qxd 10/5/06 3:09 PM Page 279

280 y. c. park, j. h. park, j. leung, and k. sangsubhan
These are a set of transparent, replicable, and credible bond-market indexes com-piled by an independent index provider, the International Index Company (IIC),for the PAIF and the eight single-market funds. Although the region has severalbond indexes, they are compiled by major market players in the region usingproprietary data, which raises uncertainty about their impartiality. By contrast,the IIC uses multiple sources for bond valuation and adopts transparent index-construction rules to ensure that iBoxx ABF indexes are impartial, transparent,and representative. iBoxx ABF indexes are easily adopted and customized byprivate sector investors for other fixed-income products and derivatives.
Misconceptions regarding the ABF initiative. There has been a certain degree ofconfusion and misunderstanding about the ABF initiative’s objectives and poten-tial consequences. As occurs with any public sector initiative, concerns have beenvoiced about the potential for moral hazard—the possibility, for example, thatsome issuers might expect to be bailed out. Hence it should be stressed that bothABF1 and ABF2 are passively managed against predetermined benchmarkindexes. Bonds are selected for inclusion in the benchmark indexes according toobjective predetermined criteria. Also, the day-to-day management of ABF1 andABF2 is carried out by third parties. These fund-management measures shouldhelp assuage any concerns over real or perceived moral hazard or the possibilitythat troubled bond issuers would expect relief in the event of a market collapse.
Concerns have also been raised that investments in ABF1 might crowd outexisting investments in Asian bonds and that central banks’ buy-and-hold strat-egy might deprive the market of liquidity. However, in perspective, given thelarge market capitalization—about U.S.$40 billion—of the sovereign andquasi-sovereign U.S.-dollar-denominated Asian bond market, the U.S.$1 billionABF1 is unlikely to have a material impact on the smooth functioning of themarkets. Moreover, any concerns about possible crowding out will be far lesswarranted with ABF2, not least because of the much higher total market capi-talization of local currency bonds, estimated at more than U.S.$1.1 trillion,than of the U.S.-dollar-denominated Asian bonds.
Critics have argued that the long-standing health of demand for high-gradeAsian bonds shows that the main reason for the underdevelopment of Asianbond markets lies in supply, not in demand. Therefore, the skeptics say, there islittle to be gained from developing ABF2, which mainly addresses demand-side issues. These arguments miss the point. Note that the bulk of investordemand for local-currency-denominated Asian bonds is for those with short- tomedium-term maturities. There is indeed a lack of demand and liquidity forbond issues with longer-term maturities (beyond five years), as is evidenced bythe fact that the best Asian corporations have issued only a small volume of
10101-09_Ch09_Redo.qxd 10/5/06 3:09 PM Page 280

longer-maturity, local-currency bonds. It appears that Asian companies wantingto borrow longer-term funds by issuing bonds have to turn to the global mar-ket. This, however, entails the risk of a higher cost (because of the lower foreign-currency ratings) and a possible currency mismatch (because it means issuingforeign-currency-denominated bonds). It is hoped that the ABF initiative, bystoking demand for long-term bonds, will encourage issuers to tap local bondmarkets for longer-term funds, thereby allowing the supply-side issue to beaddressed. (On overseas investment by Asian economies, see table 9-5.)
Market-Oriented Strategy: A Road Map for Asian Bond-Market Development
Regardless of the approach ultimately chosen to foster Asian bond markets, a seriesof preparatory steps must also be taken. The most logical and realistic road map fordeveloping Asian bond markets begins with deregulating and opening domestic
Table 9-5. Net Overseas Portfolio Investments of Asian Economies, 1998, 2003,and 2004Billions of U.S. dollars
Net private sector Net public sector portfolio investment portfolio investment a
(A) (B) Total (A+B)
Country 1998 2003 2004 1998 2003 2004 1998 2003 2004
China 3.7 −11.4 −19.7 6.4 117.0 206.3 10.2 105.6 186.7Hong Kong −22.1 34.0 32.3 −3.2 6.5 5.2 −25.2 40.5 37.5
SARIndonesia 1.9 −2.3 −3.2 6.1 4.0 0.0 8.0 1.7 −3.2Republic of 1.2 −18.3 −9.2 31.6 33.9 43.7 32.8 15.6 34.5
KoreaMalaysia −0.3 −1.0 −8.9 4.8 10.3 21.9 4.5 9.3 12.9Philippines 0.9 1.3 1.6 2.0 0.3 −0.5 2.9 1.6 1.1Singapore 8.7 10.5 11.3 3.6 13.7 16.5 12.3 24.2 27.8Thailand −0.4 0.1 −1.5 2.6 3.0 7.6 2.3 3.1 6.1
Total −6.3 12.9 2.7 54.0 188.8 300.6 47.4 201.7 303.4
Japan 39.2 95.1 −22.9 −4.2 202.1 170.6 35.0 297.2 147.7Taiwan 2.4 5.9 6.2 4.8 37.1 35.1 7.2 43.0 41.3
Province of China
Source: IMF International Financial Statistics database and CEIC.a. As reflected in increased reserves.
asian bond market development 281
10101-09_Ch09_Redo.qxd 10/5/06 3:09 PM Page 281

282 y. c. park, j. h. park, j. leung, and k. sangsubhan
financial systems so that more investment-grade, local-currency bonds can beissued, domestic investors can invest in foreign bonds, and foreign borrowers canissue bonds denominated in different currencies in East Asia’s domestic markets.
During the early stage of development of domestic bond markets, when thesemarkets are small and illiquid, domestic borrowers should be allowed to issuelocal currency bonds in regional and global bond markets. However, such liber-alization should be accompanied by efforts to expand and liberalize domesticbond markets and establish a broad base of foreign and domestic investors.
Market liberalization would be the first step toward facilitating cross-borderinvestment in bonds in Asia, which would, in turn, naturally lead to the forma-tion of integrated Asian bond markets. In this evolutionary process, countrieswith a well-developed financial infrastructure and few restrictions on financialmovements would emerge as regional trading centers for Asian bonds.
Market liberalization alone will not, however, lead to greater cross-borderinvestment without a regional financial infrastructure that includes a regionalclearing and settlement system, regional credit-guarantee institutions, hedgingfacilities, and credit-rating agencies. In addition to establishing such infrastruc-ture, East Asian countries should also be able to join forces to harmonize theirlegal and regulatory systems, domestic clearing and settlement systems, marketpractices, and withholding taxes on bond coupon payments.
Harmonization clearly requires close cooperation within ASEAN+3 as well asleadership dedicated to East Asia’s financial development and stability. How-ever, prospects for closer cooperation among ASEAN+3 members are not prom-ising at this stage. Many smaller member countries to which the benefits ofefficient regional bond markets are rather abstract have been indifferent to thepromotion of the ABMI. And it is not clear which country or group of coun-tries has the moral authority, clout, and money to lead the regionwide financialreform and the building of regional financial infrastructure in East Asia.
In devising strategies for regional capital markets, East Asian countries can takeeither a market-led or a government-led approach. The market-led, or evolution-ary, approach relies more on competition among countries attempting to trans-form their domestic capital markets into a regional market. Lack of leadership anddivergent interests among ASEAN+3 members suggest that the market-orientedapproach is preferable. For one thing, the thirteen countries may find it difficultto agree on any one of the several strategies for Asian bond-market developmentproposed by Thailand, Hong Kong SAR, Japan, and the Republic of Korea. Andeven if they do agree on a strategy, the chosen strategy might not see the light ofday as long as some ASEAN+3 states continue to be locked in competition totransform their domestic capital markets into regional and international financial
10101-09_Ch09_Redo.qxd 10/5/06 3:09 PM Page 282

asian bond market development 283
centers. This rivalry is one reason—perhaps the most important reason—themarket-oriented approach would be more realistic than the government-led one.
If the market-oriented strategy were pursued, the most efficient domesticcapital markets would emerge as the dominant regional capital markets. Inthis scenario, East Asian governments would have to work together to developregional financial, legal, and regulatory frameworks to ensure the efficiencyand stability of those regional capital markets. A more direct, government-ledapproach would require the active participation of East Asian governments notonly in building financial and other institutional frameworks but also in offer-ing a wide range of capital-market instruments tailored to investor preferencesthrough, for example, schemes to guarantee principal and interest payments onprivate bonds, securitize bank loans, and expand credit.
Several countries have already taken steps to open their domestic bond marketsto foreign borrowers and investors or to create an offshore market. The ensuingcompetition among these countries will lead both borrowers and investors tomigrate to the markets with the most efficient payment and settlement systems,which will then become regional financial centers.
For an Asian bond market to rapidly develop, Asian currency bonds, whethersovereign or corporate, will have to be tailored to private and institutional investors’preferences in terms of maturity and credit quality. At the early stage of bond-market development, institutional investors, including various types of local cur-rency investment funds, insurance companies, and investment banks, are likely todictate which bonds can be issued and traded. They will also encourage healthycompetition among potential regional financial centers and the building of regionalfinancial infrastructures. Consequently, it would be desirable to bring these marketparticipants into the planning stage of the ABMI. The public sector’s role in thisprocess will be to support the removal of impediments to market development.
If Tokyo, Hong Kong SAR, or Singapore wants to transform domestic bondmarkets into regional ones, or to create offshore international bond markets, theywill have to attract borrowers and investors by offering low-cost lending. Forthese cities to become full-fledged financial centers, their respective governmentswill need to create a variety of market-supporting institutions and encourage theemergence of insurance and financial-derivative markets. They will also have tolead the building of a regional financial infrastructure in East Asia.
Evaluation of Current Approaches
At the current stage of Asia’s development, there is no guarantee that regionalefforts, even if they could be marshaled, would succeed in fostering regional
10101-09_Ch09_Redo.qxd 10/5/06 3:09 PM Page 283

284 y. c. park, j. h. park, j. leung, and k. sangsubhan
capital markets as competitive as the global capital markets in North Americaand Europe. Furthermore, the continuing globalization of financial markets andthe advances in financial technology that allow financial firms in internationalfinancial centers to reach investors and borrowers in remote corners of the worldraise questions as to the need and rationale for creating regional capital markets.
It is also true, however, that given the dynamism of the East Asian economyand its enormous pool of savings, the region could accommodate large and effi-cient regional capital markets as competitive as global capital markets. If thesemarkets were efficient and robust, they might improve the allocation of resourcesand help safeguard the region against financial crises.
ASEAN+3 has been involved primarily in building the regional infrastructurerequired for Asian bond markets. This includes institutions such as regionalcredit agencies, cross-border securities borrowing and lending mechanisms,credit enhancement and guarantee agencies, clearing and settlement systems, acentralized depository system, and exchanges and over-the-counter bond mar-kets. In addition, the six working groups are devising plans to harmonize variousfinancial standards, regulatory systems, and tax regimes throughout the region.
In addition to ASEAN+3, another regional forum, Asian Cooperation Dialogue(ACD), has been promoting Asian bond markets. The twenty-eight-member ACDwas established following Thailand’s initiative for multilateral cooperation ineconomic and social development in Asia.11 While actively participating in theASEAN+3 working groups, Thailand has been seeking the support of otherAsian countries for the expansion of the ACD’s activities. Prime Minister Thaksinof Thailand first proposed the creation of a regional forum for Asia-wide cooper-ation in September 2000, and the first ACD ministerial meeting was held inJune 2002 in Cha-Am, Thailand. It was initially created as an informal non-institutional forum in which Asian foreign ministers could exchange views onissues of mutual interest.
Unlike ASEAN+3, ACD has rather broad objectives that include cooperationin trade, finance, science and technology, information technology, energy, andthe environment. Ultimately, it envisions the formation of an Asian Commu-nity. A number of member countries have volunteered to actively promote coop-eration in eighteen areas in which they have expertise and interest.
At the second ministerial meeting, in June 2003 in Chiang Mai, Prime Minis-ter Thaksin proposed that the ACD’s future actions include the development ofan Asian credit-rating agency, Asian-currency-denominated bonds, and an Asian
11. The member countries are ASEAN+3 and Bahrain, Bangladesh, India, Kazakhstan, Kuwait,Oman, Pakistan, Qatar, and Sri Lanka.
10101-09_Ch09_Redo.qxd 10/5/06 3:09 PM Page 284

fund-management agency. Thailand followed up on this initiative by establish-ing a working group on the development of an Asian bond market in June 2003.The second working group meeting, held on April 29–30, 2004, in Thailand,examined the creation of Asian-currency-denominated bond markets.
However, Asia’s regional bond markets will not become more efficient unlessthese cooperative efforts are accompanied by the opening of capital marketsthrough domestic financial reform in individual member countries. Attempts tobuild capital markets in East Asia have been undermined by numerous institu-tional weaknesses and regulatory controls. The major culprits are a lack of profes-sional expertise in the securities industry; the inadequacy of financial and legalinfrastructure, including regulatory systems; low accounting and auditing stan-dards; and opaque corporate governance. Unfortunately, ASEAN+3’s six work-ing groups are unlikely to take a stand on the urgent need for domestic reformbecause they are not allowed to address issues related to individual members’internal affairs.
In the end, ASEAN+3’s inability to organize a joint program for domesticfinancial reform will likely frustrate its efforts to create robust Asian bond markets:without domestic financial market deregulation and capital account liberaliza-tion, Asian borrowers and investors will be unable to take advantage of regionalbond markets since cross-border lending and investment will be restricted.
Observers of the proposals and debates taking place at the numerous ABMIworkshops and conferences often become so engrossed in the details of compet-ing plans that they lose sight of what ASEAN+3 is collectively trying to accom-plish by supporting the ABI. Moreover, ABMI advocates frequently forget toask several fundamental questions about the need and rationale for creatingAsian bond markets.
One issue ABMI proponents overlook is whether existing regional bond mar-kets are sufficiently large and efficient to meet the bond-financing needs of Asiangovernments and corporations. While there has been a chorus of proposals toconstruct regional capital markets and stock exchanges in East Asia, the fact thatseveral bond markets already exist in the region is often ignored. In theory, EastAsian corporations could also turn to stock markets in other countries of theregion for their equity financing. East Asian corporations and financial institu-tions can also raise funds through Samurai bonds denominated in yen or Shogunbonds denominated in a foreign currency and issued in Japan, though both theSamurai and Shogun bond markets have been moribund.
Singapore has actively sought to develop a corporate bond market to allowforeign entities to issue Singapore-dollar-denominated bonds. Hong Kong SARhas taken the lead in organizing an Asian clearing and settlement network by
asian bond market development 285
10101-09_Ch09_Redo.qxd 10/5/06 3:09 PM Page 285

286 y. c. park, j. h. park, j. leung, and k. sangsubhan
linking its system with those of other countries in the region and therebystrengthening its status as a regional financial center. As East Asian economiescontinue to open their financial markets, some of their domestic bond marketswill become accessible to foreign investors and borrowers and hence may even-tually assume the characteristics of regional or international bond markets.
Any regional capital-market development strategy could therefore benefitfrom a study of why existing capital markets have been unable to serve as alterna-tive sources of local or global financing. In particular, Tokyo was once, and per-haps still is, a logical place to establish a regional bond-trading center. But it hasnever gained any credibility as a regional financial center and has been unable totransform itself into a regional capital market simply because borrowing fromregional markets has been more expensive than borrowing from global markets.
Also unanswered is how the proposed Asian bond markets are to be struc-tured—that is, whether they will be distinct from domestic bond markets on theone hand, and from global bond markets on the other. In an increasingly glob-alized financial system, domestic and regional markets will eventually have to beintegrated into the global bond markets. Therefore, in principle it can be arguedthat East Asian economies may be better off integrating their domestic bondmarkets with global markets from the beginning rather than going the round-about way of creating regional bond markets. However, such integration mightnot be possible, for a number of reasons. Moreover, if direct integration indeedproves unviable, then ABMI advocates should be able to explain why that is soand at the same time whether or not the proposed regional bond markets will bebuilding blocks for a truly integrated global financial system.
There is a general perception that global bond markets such as the Euro andYankee markets have not been and will not be able to meet the bond financingneeds of Asian governments and corporations. Indeed, it is true that global bondmarkets could have done more to discover more creditworthy East Asian borrowersand help them issue local- as well as foreign-currency-denominated global bonds.
Nonetheless, it must be pointed out that domestic restrictions on bondissuance and trading have seriously limited the access of many East Asian bor-rowers to the global bond markets and of global investors to East Asian domes-tic and regional bond markets. And these restrictions are also largely responsiblefor the narrowness, shallowness, and illiquidity of East Asia’s domestic andregional bond markets. More fundamentally, ABMI advocates do not convinc-ingly explain why East Asian borrowers whose low credit ratings preclude themfrom issuing investment-grade bonds denominated in their own currencies inthe global bond markets would be able to do so in regional bond markets,unless they are proposing the construction of high-yield Asian bond markets.
10101-09_Ch09_Redo.qxd 10/5/06 3:09 PM Page 286

asian bond market development 287
These questions about the viability of the ABMI suggest that its objectivesshould be clarified in advance in order to help determine the structure and char-acteristics of the proposed Asian bond markets. One of the most often-heardobjectives for robust Asian bond markets is to keep at least part of Asian savingsin Asia, rather than sending them to other countries, in particular to the UnitedStates, which uses these funds to finance its current account deficits. Anotherobjective is for deep and liquid Asian bond markets to help East Asian economiesguard more effectively against future crises, which should allow them to raisemore funds in their own currencies in regional bond markets and thereby avoidcurrency-mismatch problems.
A third reason for building Asian bond markets stresses the importance ofpressing forward with the financial reforms that began after the 1997 crisis, espe-cially because of recent signs of regression. A number of recent studies show thatreform efforts in the region are stalled, with several countries in fact relapsing intoold practices for managing financial institutions and outmoded financial policies.Many ABMI advocates rightly argue that the initiative will exert peer pressure onand generate incentives for Asian countries to move forward with financial reform.
The second of these objectives appears to be the least important. Though effi-cient bond markets offer a wider range of financing sources and savings instru-ments, and thereby facilitate the diversification of the financial system, they areno substitute for sound macroeconomic policy. Moreover, a review of the eventsthat led up to the 1997 crisis suggests that currency mismatch may have beenoverstated as a cause of the crisis.
As for the first objective, the frequently heard argument that the channelingof practically all official reserves from Asia to developed markets was both a con-sequence and, albeit to a lesser degree, a cause of the underdevelopment of theAsian bond markets is untenable. The ASEAN+3 collectively holds nearlyU.S.$1.5 trillion in reserves, the bulk of which is invested in U.S. short-termTreasury and agency securities. There is no criterion of optimum reserve holdingaccording to which the ASEAN+3 can be claimed to have accumulated morereserves than necessary, even in light of the ASEAN+3 countries’ need to buildup substantial war chests to ward off future speculative attacks.
Many ABMI advocates are quick to point out that at least some reservescould be used to finance additional Asian investment. Moreover, the hugedollar-denominated holdings also entail large losses, since they earn a low returnwhile East Asian borrowers pay a much higher interest rate on their foreignloans. The losses result from the pattern of capital flows between East Asia andthe advanced countries, which is often described as East Asia exporting riskyassets in exchange for importing safe ones.
10101-09_Ch09_Redo.qxd 10/5/06 3:09 PM Page 287

288 y. c. park, j. h. park, j. leung, and k. sangsubhan
Keeping East Asian savings in East Asia is certainly one of the reasons for creat-ing ABF1 and ABF2. However, it is incorrect to claim that East Asian economiesinvest less than they save because of the absence of regional or domestic bondmarkets or the inefficiency of existing ones. Before the 1997 crisis, when they hadsmaller and less liquid bond markets than they do now, East Asian economiesinvested much more than they have in subsequent years.
Suppose East Asian countries were to unload a substantial portion—say 5 percent—of their total holdings of U.S.-dollar reserves to acquire Asianbonds. Such a portfolio substitution would certainly strengthen East Asian cur-rencies against the United States dollar. However, when the consequences ofcurrency appreciation are factored in, the purchase of Asian bonds might notlead to more investment in East Asia. The large holdings of foreign-exchangereserves are the result of the sterilization of surpluses the East Asian economieshave generated in their current and capital accounts since the 1997 crisis. Andthe East Asian countries are not prepared to let their dollar exchange rates appre-ciate by refraining from intervening in foreign-exchange markets.
Concluding Remarks
The promotion of bond markets in Asia has recently emerged as a leading policygoal. Efforts to develop such markets have been made on numerous fronts andthrough many forums, such as APEC, EMEAP, and ASEAN+3. Several con-structive and interesting strategies for and ways of developing regional bondmarkets in East Asia have been put forth.
Although these forums have all endeavored to reach the common goal of fos-tering Asian bond markets, their approaches are different, as are the countries andinstitutions participating in them. Most notably, APEC has followed a country-specific approach, trying to develop domestic bond markets in selected countriesand focusing on securitization and credit guarantees. EMEAP basically relies on ademand-side approach, forming funds to invest in bonds issued by Asian entities.Finally, ASEAN+3 has taken a comprehensive approach, including providingquality bonds in Asia and building infrastructure. In this respect, the initiativescomplement one another, rather than overlapping or competing. Therefore, theestablishment of a mechanism or forum to coordinate and harmonize the activi-ties of these separate initiatives and to foster regional bond markets needs to beconsidered.
This chapter first examined the economic tenets that justify the creation ofregional bond markets in a climate characterized by bank-dominated financialstructures, an overriding need to recycle Asian savings back into industrialized
10101-09_Ch09_Redo.qxd 10/5/06 3:09 PM Page 288

asian bond market development 289
markets in the region, and volatile foreign-capital inflows. Next, diverse efforts andinitiatives to promote regional bond markets through multilateral cooperationwere reviewed in detail. The authors now propose a road map for Asian bondmarket development, taking into account all aspects of this policy issue and thevarying stages of development of the region’s financial markets.
The most expedient way to begin developing Asian bond markets is for eachcountry to develop its own domestic bond market and then open it to foreigninvestors—that is, for Asian countries to open up their domestic bond marketsand enable Asian issuers to sell bonds in any country, while allowing investors tobuy bonds in any country’s domestic market. However, East Asian bond marketsare at greatly different stages of development. Some are much more liberalizedthan others, and the different markets have different types of capital controls.Most Asian countries do not even have the economies of scale to support allthe elements of bond-market infrastructure, such as a settlement and depositorysystem, a primary dealer system, and credit-rating, bond-pricing, and credit-guarantee agencies, all of which are required for the emergence of domestic bondmarkets. Therefore, without substantial political pressure in favor of such an ini-tiative, it is unrealistic to expect each Asian country to develop and open up itsdomestic bond markets in the near future.
The last issue this chapter addresses relates to the building of infrastructurefor the Asian bond markets, such as the establishment of a regional clearing andsettlement system, regional credit-rating agencies, and regional credit-guaranteemechanisms. Relatively little research has been conducted on a clearing and settle-ment institution, although its importance is widely recognized by policymakersand market practitioners. The authors suggest that a regional version of theInternational Central Securities Depository (ICSD) be created, which could benamed “AsiaSettle.” It would link each country’s central bank and national cen-tral securities depository (CSD).
The emergence of Asian bond markets also requires a common credit-ratingsystem or standard among Asian countries. However, unlike a clearing and set-tlement system, the establishment of a regional credit-rating agency should notdepend on government support. Instead, harmonization could be graduallybrought about through the coordination of local and global credit-rating agen-cies, which should encourage a common credit-rating system. The Associationof Credit Rating Agencies in Asia is currently working on such harmonization.
A new and more adequate guarantee institution, able to meet Asian bondmarkets’ current needs, is also needed. None of the many existing guaranteeinstitutions, including multilateral institutions and private guarantee compa-nies, is in a position to satisfy the demand for guarantees in Asia, which is
10101-09_Ch09_Redo.qxd 10/5/06 3:09 PM Page 289

290 y. c. park, j. h. park, j. leung, and k. sangsubhan
already high and expected to grow over time. In the light of lessons from theexperience with the now defunct ASIA Ltd., the new institution would have abetter chance of success if it were heavily capitalized and its expected return oncapital were lower. The creation of a regional credit-guarantee institution wouldalso entail a stronger capital-injection commitment from participating countriesduring periods of uncertainty. Thus the institution should initially be public,although commercially viable.
Arguments for building a regional institution—whether for a credit-rating ora settlement agency—are mistakenly seen as veiled attempts to introduce marketprotection. The building of regional infrastructure should be viewed instead as acatalyst for opening underdeveloped Asian bond markets and easing local regu-lations to promote international bond markets in Asia.
References
Asia-Pacific Economic Cooperation (APEC). 2003. “Summary Record of the 16th APECFinance Ministers’ Technical Working Group Meeting.” Hua Hin, Thailand. www.apec.org[July].
Edwards, A. K., L. S. Harris, and M. S. Piwowar. 2005. “Corporate Bond Market Transparencyand Transaction Costs.” Washington: United States Securities and Exchange Commission.
International Monetary Fund (IMF). 2003. “The IMF and Recent Capital Account Crises:Indonesia, Korea, Brazil.” Independent Evaluation Office Reports, July 28.
Oh, G., and J.-H. Park. 2003. “Developing the Asian Bond Markets Using Securitizationand Credit Guarantee.” KIF Financial Economic Series 2003–04. Seoul: Korean Institute ofFinance.
Park, Y. C., and D. Park. 2003. “Creating Regional Bond Markets in East Asia: Rationaleand Strategy.” Paper presented at the Second Finance Forum of the Pacific EconomicCooperation Council, Hua Hin, Thailand, July 7–10.
World Bank 1995. “The Emerging Asian Bond Market.” Working Paper, June.Yoshitomi, M., and S. Shirai. 2001. “Designing a Financial Market Structure in Post-Crisis
Asia: How to Develop Corporate Bond Markets.” ADB Institute Working Paper andTokyo: Asian Development Bank Institute.
10101-09_Ch09_Redo.qxd 10/5/06 3:09 PM Page 290

The Arab region has a rich and diversified experience of regional economiccooperation, beginning in 1944 with the creation of the League of Arab
States (Arab League). The league was among the first official regional institutionsto be created after World War II. The aim of the league was to develop coopera-tion between Arab countries in all fields, including trade, finance, and defense.
Unfortunately, the league was not very successful in securing a commonArab position in international affairs, owing to various political and economicfactors that are not studied here. It also failed in a number of endeavors todevelop Arab economic integration. Although some Arab subregional economiccooperation and integration agreements were signed, only the Gulf CooperationCouncil (GCC), created in 1981 by the oil-rich Arabian Peninsula countries ofSaudi Arabia, Kuwait, Oman, the United Arab Emirates, Bahrain, and Qatar,was successful. The Union of Arab Maghreb, which was created in 1989 byTunisia, Algeria, Morocco, Libya, and Mauritania, has been weakened by politi-cal tensions between some of its member countries, while the Arab CooperationCouncil, founded the same year by Egypt, Jordan, Iraq, and Yemen, was dis-solved in 1991.
While many inter-Arab agreements on economic and financial arrangementshave been signed by Arab League member countries, the implementation of these
The Arab Experiencegeorges corm
10
291
10101-10_Ch10_Redo.qxd 10/5/06 3:09 PM Page 291

agreements has been very limited. Since the early 1970s, however, substantialprogress has been made in the field of regional financial cooperation throughthe creation of various financial institutions to provide needy Arab countrieswith low-cost official regional lending. This successful experience was quicklyextended to countries outside the region through the creation in 1974 of boththe Islamic Development Bank (IsDB) and the Arab Bank for Economic Devel-opment in Africa (BADEA), together with the Special Arab Aid Fund for Africa(SAAFA).
Low-cost official financing was also made available to Arab and non-Arabcountries in the developing world by national financial institutions created by theArab oil-exporting countries. As this chapter describes, much of the financingoriginating from the region has come from pan-Arab institutions and the IslamicDevelopment Bank, and has been made available primarily to Arab countries,but also to developing countries belonging to the Organization of the IslamicConference and others.
In fact, since the oil-price boom of the 1970s, financial institutions in theArab region have mushroomed, including large commercial banking and financeinstitutions created by Arab governments or Arab government–owned banks(Arab Banking Corporation [ABC]; Gulf Investment Bank [GIB]; Arab Invest-ment Company [AIC]; and Gulf Investment Corporation [GIC]), in addition tonumerous private Islamic banking and financial institutions.
Banking institutions were also created as consortium banks by the mainArab banks (private and government) and large banks in Europe or in othercountries (Union of French and Arab Banks and Banque Arabe et Internationaled’Investissement in Paris; European Arab Bank in Brussels; Arab MalaysianBank in Kuala Lumpur).1 Some of these banks are no longer in existence, likesome other large consortium banks that were created on international capital mar-kets during the 1970s.
This chapter is concerned only with official financial institutions andarrangements in the Arab region that supply concessional financing or facilitiesand grants. Owing to particular regional economic and financial circumstances,most of these institutions provide development finance facilities to countriesoutside the region. Another specific feature of these institutions is that none oftheir shareholders are member countries of the Organization for EconomicCooperation and Development (OECD), and none tap international financialmarkets or domestic Arab capital markets to finance their operations. Their activi-ties are funded exclusively from the contributions of shareholder countries, with
292 georges corm
1. See Mattione (1985).
10101-10_Ch10_Redo.qxd 10/5/06 3:09 PM Page 292

the arab experience 293
the bulk of such contributions coming from the Arab Peninsula oil-exportingcountries.
In fact, Arab regional official funding flourished in the highly specific cir-cumstances of the oil-price boom in the early 1970s. It survived the sharpdownturn in oil prices during the 1980s and 1990s, and operations continued,albeit at lower levels than in the 1970s. Although the sharp upturn in oil pricesbeginning in 2000 led to an increase in funding, funding did not return to thelevels of the second half of the 1970s and early 1980s. Today a large pool ofexpertise in development finance has accumulated in the region, and most insti-tutions have geared their operations to their countries’ emerging needs (equityinvestment, microcredit, aid to small and medium-sized enterprises (SMEs),technical assistance grants, and others). However, available resources are stillbeing used primarily to finance infrastructure.
Available statistical aggregates are not always sufficiently detailed or are notpresented in a way that facilitates proper analysis. However, the annual reportsproduced by some of these institutions are quite detailed. Aggregate figures fromArab sources differ from the statistics in the Development Assistance Committee(DAC) annual report. Although OECD statistics do not seem to adequatelycover all Arab institutions and financial arrangements, both statistical sourcesare used to analyze the different official development assistance (ODA) flowsoriginating from the region, in which Arab countries play a major role.
It is also worth noting that the region’s institutional setup suffers from the factthat, as defined by the United Nations system, the Arab countries, as well as otherMiddle Eastern countries, belong to different regions. The UN system recognizesno Arab region as such. Thus the Economic and Social Commission for WesternAsia (ESCWA) includes only some of the Arab countries (Arabian Peninsulacountries, as well as Iraq, Jordan, Egypt, Lebanon, Syria, and Palestine); otherArab countries in Africa (Morocco, Algeria, Mauritania, Tunisia, Libya, andSudan, in addition to Egypt, which is a member of both commissions) are mem-bers of the United Nations Economic Commission for Africa (ECA). Turkeybelongs to the United Nations Economic Commission for Europe (ECE).
Large multilateral funding institutions, such as the World Bank and theInternational Monetary Fund (IMF), also do not recognize an Arab region, butrather a Middle East and North Africa (MENA) region that includes all theArab countries except Sudan and Mauritania, together with Iran, Afghanistan,and Pakistan. The United Nations and other sister institutions always includeTurkey in European regional groups, even though it is a key Middle Easterncountry. This designation represents an additional complication when one looksat the Arab region.
10101-10_Ch10_Redo.qxd 10/5/06 3:09 PM Page 293

294 georges corm
Economic and Political Background to the Creation and Development of Arab Development Agencies
Since its creation, the Arab League has promoted a number of schemes toinduce member countries to develop regional economic integration.2 The basisof this cooperation was the Treaty of Common Defense and Economic Cooper-ation signed by Arab League member countries in 1950. Two collective bodieswere successively created to promote economic cooperation and integration:first, in 1953, the Economic Council (which became the Economic and SocialCouncil in 1977); then, in 1957, the Council for Arab Economic Unity, whichwas joined by Iraq, Yemen, Kuwait, and Egypt but was not implemented until1964. In 1964 this council decided to create an Arab Common Market, whichagain only a few Arab countries joined. In 1996 the Greater Arab Free TradeArea (GAFTA) was created, which seventeen of the twenty-one Arab countrieshave now joined. Tariff reductions on goods attained 60 percent at the end of2003. The GCC member countries signed a customs union in the same year,setting a common tariff ceiling of 5 percent.
Since 1991, Lebanon and Syria have signed various economic cooperationtreaties, including an agreement to abolish customs duties for trade in goods.More recently, Egypt, Jordan, Morocco, and Tunisia signed an agreementcalled the “Aghadeer Declaration,” launching a free-trade area among the fourcountries, which will be implemented fully by the end of 2012.
Arab League members signed many other specific agreements during the1950s and 1960s in the field of customs harmonization, facilitation of trade andtransit, and facilitation of payments and capital movements.3 In spite of theseefforts, inter-Arab trade has not developed, remaining at a level of between 6 and8 percent of total Arab foreign trade.
Although this chapter does not discuss the problems undermining progressin Arab regional economic integration, it is worth noting that economic cooper-ation between Arab countries has grown substantially over the past twenty yearsin the area of inter-Arab private investment and official development assistance,on both a bilateral and a regional level.
This growth in cooperation can be attributed to the sudden increase in oilreceipts by Arab oil-exporting countries when oil prices exploded during the1970s. At that time, these countries’ domestic economies did not have thecapacity to absorb the new financial flows that were accruing to them. Some of
2. For more details see Al Imam (2004); Arab Thought Forum (2002); and Arab MonetaryFund (2005).
3. See Al Iman (2004).
10101-10_Ch10_Redo.qxd 10/5/06 3:09 PM Page 294

the arab experience 295
these countries with small populations (Kuwait, the United Arab Emirates,Qatar, Oman, and Libya) could not find enough domestic needs to absorb theenormous financial surpluses that began to accumulate from the oil sector. Incontrast, many Arab non-oil-exporting countries had very large populations(Egypt, Yemen, Syria, Sudan, and Morocco) with rather low per capita incomeand pressing needs for more state spending on infrastructure. Other small Arabeconomies, such as Lebanon, Jordan, and Tunisia, also had a major financialneed to increase state investment in infrastructure, health, and education.
Because official efforts by the Arab League to promote economic cooperationand regional integration were unsuccessful, and a small group of Arab countriesbecame very rich financially, a consensus emerged that priority should be givento building regional financial institutions to provide the poorer Arab countrieswith concessional loans and grants. In fact, this had begun at the end of the1960s, when the Arab Fund for Economic and Social Development (AFESD)was created on paper in 1968, although it did not become operational until1972. This effort accelerated when oil prices started to rise in 1971.
Another factor contributing to the building of Arab economic cooperationwas of a more political nature. It is linked with the Arab-Israeli war of 1967,when Arab Gulf countries that did not participate in the war but were begin-ning to become richer as a result of rising oil production, agreed to extendfinancial assistance to the countries that participated in the war and had sufferedheavy economic losses ( Jordan, Egypt, and Syria). Bilateral loans or grants wereprovided to these three countries to rebuild their armies and help to compensatethem for their economic losses.4
The trend was reinforced as the Arab oil-exporting countries became richerin the wake of the fourfold increase in oil prices and the 1973 Arab-Israeli war.During this period, “rich” Arab countries were encouraged to promote Arabregional financial agencies and to supply them with adequate resources to enablethem to reduce the bilateral lending that was now being provided not only toother Arab countries, but also to other developing countries that were sufferingfrom the rise in oil prices. This was also the rationale behind the creation of theIslamic Development Bank in 1974, another big financial institution whosegeographic scope extends beyond the Arab world. The same could be said of theArab Bank for Economic Development in Africa, created in 1972.5
Other pan-Arab institutions were created in the same economic context, suchas the Arab Monetary Fund (AMF), the Arab Petroleum Investments Corporation
4. On this aspect of Arab financial cooperation, see Corm (1988).5. See Shihata (1982).
10101-10_Ch10_Redo.qxd 10/5/06 3:09 PM Page 295

296 georges corm
(APICORP), the Arab Authority for Agricultural Investment and Development(AAAID), and the Inter-Arab Investment Guarantee Corporation (IAIGC).
In 1972, Arab oil-exporting countries created an organization of their own,called the Organization of Arab Petroleum Exporting Countries (OAPEC). Thisorganization was not intended to be a substitute for the Organization ofPetroleum Exporting Countries (OPEC), covering Arab and non-Arab oilexporters, but rather to act as a forum in which Arab oil-exporting countries coulddiscuss and study the development of Arab oil policies and arrive at a commonposition within OPEC or in relations between OPEC and consumer countries.
Another important point is that the Arab oil-exporting countries were strongpromoters and founders, with very sizable financial contributions from otherlending institutions created in the same period as the International Fund forAgricultural Development (IFAD) and the OPEC Development Fund.
The oil-exporting countries also created national lending agencies to providesoft loans and grants to Arab countries and to other developing countries. SaudiArabia, the United Arab Emirates, Kuwait, and Iraq created national agencies(called funds) to grant soft loans to Arab and non-Arab developing countries. Dur-ing the same period, the Bolivarian Republic of Venezuela, then Venezuela, alsocreated the Venezuelan External Fund to supply soft loans to developing countries.
This was at a time when developing countries began to be classified into twocategories: oil-exporting and non-oil-exporting countries. Arab development agen-cies (ADAs) also divided Arab countries into the same categories. As regionalADAs and national external funds became operational, bilateral lending and grantsfrom Arab oil-exporting countries began to decline, although they were again usedmore extensively during the first Gulf War (for Morocco, Egypt, and Syria, whichparticipated in the coalition to liberate Kuwait from Iraqi occupation).
In fact, since the mid-1970s, Arab oil-exporting countries have devoted a sub-stantial percentage of their GDP to foreign aid, and both ADAs and the IsDBhave developed in-depth expertise in development lending and support to thepublic and private sectors. The amounts of ODA provided by Arab oil-exportingcountries, either bilaterally or by funding regional institutions, were dependenton oil prices, with aid increasing when prices rose and decreasing when prices fell.However, the level of aid provided by Arab region oil-exporting countries, insideand outside the region, is still fairly substantial and is higher in relation to GDPthan aid from OECD members of the Development Assistance Committee.
All Arab regional institutions meet each year to review policies and programsand to discuss progress in Arab economic cooperation. Ministers of finance oreconomic affairs sitting on the boards of these institutions regularly attend thisimportant yearly gathering in Kuwait, where the head offices of many of these
10101-10_Ch10_Redo.qxd 10/5/06 3:09 PM Page 296

the arab experience 297
institutions are housed in the same building. In addition, Arab central gover-nors meet annually during the AMF General Assembly.
As noted earlier, the analysis in this chapter is restricted to official Arab insti-tutions or official institutions based in the Arab world (such as the IslamicDevelopment Bank) that are responsible for supplying various forms of develop-ment finance and grants. The chapter also reviews existing official financialfacilities to encourage trade development within the region or between theIslamic countries that these institutions cover.
An Analysis of Regional Financial Institutions and Their Activities: The Global View
It is not easy to analyze available statistics on Arab institutional aid. Althoughthis paper is mainly concerned with regional development lending institutions,it is useful to look at the main channels through which official aid is disbursed.The following four main channels have been identified:
—bilateral official aid to Arab and non-Arab developing countries;—aid from national aid funds to Arab and non-Arab developing countries;—aid from regional Arab lending institutions to Arab countries; and—aid from multilateral lending institutions with geographic specialization,
namely the Islamic Development Bank and the Arab Bank for Economic Devel-opment in Africa.
The main statistical data concerning these channels are gathered by AFESDand published each year in the Arab Unified Economic Report (AUER). Thisreport is prepared by AFESD but published jointly by the General Secretariat ofthe Arab League, AFESD, the Arab Monetary Fund, and OAPEC.
The tables and figures in this section of the chapter are based on data fromeither the latest annual AUER or the OECD online electronic database onODA flows to developing countries.
Aggregated Arab ODA
According to the 2005 annual AUER, global Arab official development assistancetotaled U.S.$123.8 billion for the period 1970–2004, as shown in table 10-1.However, the OECD online database on ODA flows reports a total ofU.S.$96.02 billion for the same period, as shown in table 10-2. The differencemight stem from the fact that AUER coverage is wider than OECD coverage. Asthe table shows, aid is supplied predominantly by the GCC countries (table 10-1,94 percent). Although other Arab oil-exporting countries have also been donors,their contribution ceased after the first Gulf War. Iraq’s contribution stoppedeven earlier, owing to the war with Iran, which depleted its financial resources.
10101-10_Ch10_Redo.qxd 10/5/06 3:09 PM Page 297

Tab
le 1
0-1.
Glo
bal O
ffici
al D
evel
opm
ent A
ssista
nce
from
Ara
b C
ount
ries
, 197
0–20
04M
illio
ns o
f U.S
. dol
lars
, unl
ess
othe
rwis
e no
ted
1970
–19
75–
1980
–19
85–
1990
–19
95–
7479
8489
9499
2000
2001
2002
2003
2004
Tot
alPe
rcen
t
Uni
ted
Ara
b E
mir
ates
923
4,85
72,
768
272
1,95
748
237
639
855
813
09
12,7
3010
.28
Saud
i Ara
bia
4,01
318
,515
21,5
0312
,253
8,69
84,
359
2,50
52,
455
2,67
42,
803
1,90
281
,680
65.9
6O
man
619
818
977
2424
610
954
30.
44Q
atar
279
1,07
669
228
4418
794
129
7323
732,
698
2.18
Kuw
ait
1,39
64,
682
5,48
12,
080
2,30
21,
706
228
259
577
1642
119
,148
15.4
6T
otal
Gul
f6,
611
29,1
3030
,450
14,8
3113
,190
6,81
13,
227
3,26
53,
888
2,98
22,
414
116,
799
94.3
2C
oope
rati
onC
ounc
ilA
lger
ia73
449
354
262
451,
183
0.96
Iraq
453
1,57
71,
091
−76
763,
121
2.52
Liby
a55
971
484
649
811
82,
735
2.21
Tot
al o
ther
1,08
52,
740
2,29
168
423
97,
039
5.68
Ara
b co
untr
ies
Tot
al A
rab
regi
on7,
696
31,8
7032
,741
15,5
1513
,429
6,81
13,
227
3,26
53,
888
2,98
22,
414
123,
838
100
Sour
ce: A
rab
Leag
ue a
nd o
ther
s, A
rab
Uni
fied
Econ
omic
Rep
ort(
2005
).
10101-10_Ch10_Redo.qxd 10/5/06 3:09 PM Page 298

Tab
le 1
0-2.
Am
ount
of O
DA
as a
Per
cent
age
of A
rab
Don
ors’
GD
P, 1
985–
2004
1985
1990
1991
1992
1993
1994
1995
1996
1997
1998
1999
2000
2001
2002
2003
2004
Uni
ted
Ara
b E
mir
ates
0.5
2.7
1.7
0.5
0.7
0.3
0.1
0.1
0.1
0.3
0.3
0.5
0.6
0.3
0.1
0.01
Saud
i Ara
bia
2.9
4.2
1.5
0.7
0.7
0.5
0.5
0.4
0.3
0.7
1.0
1.3
1.3
1.4
1.3
0.8
Kuw
ait
3.0
5.0
2.4
0.8
1.4
0.1
1.6
1.1
0.6
0.8
1.1
0.5
0.7
1.5
0.04
0.8
Tot
al G
ulf C
oope
rati
on C
ounc
il2.
54.
01.
60.
70.
80.
40.
60.
40.
30.
50.
70.
91.
01.
10.
80.
5
Sour
ce: A
rab
Leag
ue a
nd o
ther
s, A
rab
Uni
fied
Econ
omic
Rep
ort(
2005
).
10101-10_Ch10_Redo.qxd 10/5/06 3:09 PM Page 299

300 georges corm
Saudi Arabia is by far the largest donor among the GCC countries (66 per-cent of the total), followed by Kuwait (15.5 percent), and the United Arab Emi-rates (10.3 percent). Other GCC donors are marginal.
Aid soared from U.S.$7.7 billion in the period 1970–74 to a peak ofU.S.$32.7 billion in the 1980–84 period. With the fall in oil prices, it declinedto a low of U.S.$6.8 billion during the 1995–99 period. However, with theupturn in oil prices since 1999, the amounts disbursed increased substantially(2000–04), to reach U.S.$15.8 billion.
Table 10-2 shows the scale of Arab assistance in relation to the GDP of thedonor countries over the past sixteen years. After peaking at a sizable 4 percentin 1990, the percentage of GDP earmarked by the GCC countries for ODAdeclined to 0.3 percent in 1997. Although it rose again to 1.1 percent in 2002,it declined once more to 0.5 percent in 2004 despite the further rise in oilprices.
Trend in the Arab Share of ODA from All Donors
The OECD online database allows us to compare the trend in ODA from DACmember countries and from Arab donors; it also allows us to make the samecomparison between total ODA from multilateral agencies and from Arab agen-cies. ODA from Arab development agencies appears to be underestimated in theOECD statistical system.
According to the OECD database, Arab ODA was 7.3 percent of total ODA(DAC and non-DAC) between 1970 and 2004, but represented 95.9 percent ofnon-DAC ODA. During the oil boom years (1974–81), the share of ArabODA as a percentage of total ODA fluctuated between 22 percent and 26 per-cent. Figure 10-1 shows the yearly trend in the Arab countries’ share of totalODA since 1970. It reveals that the first peak in the share of Arab ODA in the1974–84 period was linked with the oil-price increase, while the second peak in1991–92 was linked with assistance provided in the context of the first GulfWar. The new increase since 2002 was again linked with an oil-price rise.
Arab Donors’ Share of Total Bilateral ODA to Arab Countries
Table 10-3 reports the Arab donor countries’ share as a percentage of total ODAto Arab countries, according to the OECD database. The Arab share of totalODA to Arab beneficiaries reached 26.7 percent in the period from 1970 to2004. For certain Arab countries, this share was as high as 94.8 percent (Bahrain),45.4 percent (Jordan), 36.9 percent (Lebanon), 79.1 percent (Oman), 76.6 per-cent (Syria), and 35.7 percent (Yemen). Thus almost all ODA granted to GCCcountries is of Arab origin, while a very substantial part of ODA to countries suf-
10101-10_Ch10_Redo.qxd 10/5/06 3:09 PM Page 300

the arab experience 301
fering from the Arab-Israeli conflict (Lebanon, Jordan, and Syria) came from Arabdonors (between 40 percent and 80 percent).
Arab agencies provide a 10.6 percent share of the ODA supplied to the Arabregion by all multilateral institutions. However, the OECD database seems torestrict coverage of Arab agencies to the two main exclusively Arab institutions,and probably excludes national funds (which may be included in bilateral aid),as well as the Islamic Development Bank and the Arab Bank for EconomicDevelopment in Africa. ODA to the Arab region has concentrated on a fewcountries (Egypt, Jordan, Morocco, and Syria). Bilateral Arab ODA has beenmore evenly distributed, although Egypt, Syria, Jordan, and Morocco have alsobeen major beneficiaries of Arab aid.
Thus, according to the OECD database on aid flow and the main ODA aggre-gate shown in table 10-4, Arab ODA represents an important share of resourceflows to developing countries. During the period 1970–2004, it disbursed 7 per-cent of total ODA, although during the oil boom years this share rose to almost30 percent. In fact, ODA from Arab countries represented 95 percent of ODAfrom non-DAC countries, while the Arab donors’ share totaled 58 percent of allODA disbursed to Arab countries. According to the same OECD statistics, Arab
Percent
ODA from Arab countries
5
10
15
20
25
1971 1975 1979 1983 1987 1991 1995 1999 2003
Source: Based on OECD online database: www1.oecd.org/scripts/cde/members/DACAuthenticate.asp.
Figure 10-1. Evolution of the Share of Total ODA Provided by Arab Countries to Developing Countries, 1970–2004
10101-10_Ch10_Redo.qxd 10/5/06 3:09 PM Page 301

Tab
le 1
0-3.
Dist
ribu
tion
of A
id to
Ara
b C
ount
ries
by
Diff
eren
t Don
ors,
1970
–200
4M
illio
ns o
f U.S
. dol
lars
Ara
bB
enef
icia
ryN
on-
dono
rs a
s aA
rab
agen
cies
coun
try
as a
DA
Cpe
rcen
tage
as a
per
cent
age
All
perc
enta
geD
AC
bila
tera
lA
rab
of a
ll M
ultil
ater
alA
rab
of m
ultil
ater
alR
ecip
ient
dono
rsof
tota
lco
untr
ies
dono
rsco
untr
ies
dono
rsag
enci
esag
enci
esag
enci
es
Alg
eria
6,73
13.
24,
803
586
544
8.1
1,34
337
2.8
Bah
rain
2,38
81.
139
2,26
72,
262
94.8
8148
58.7
Djib
outi
2,62
11.
21,
698
376
374
14.3
547
305.
6E
gypt
63,5
2130
.245
,045
11,1
2111
,085
17.5
7,35
42,
130
29.0
Iraq
10,0
874.
88,
659
362
114
1.1
1,06
638
3.5
Jord
an19
,300
9.2
7,91
28,
811
8,77
045
.42,
577
113
4.4
Kuw
ait
940.
054
0.0
403
7.3
Leba
non
5,58
52.
71,
956
2,06
22,
059
36.9
1,56
763
4.0
Liby
a27
60.
112
11
00.
015
43
2.0
Mau
rita
nia
6,61
43.
12,
744
969
965
14.6
2,90
021
27.
3M
oroc
co18
,425
8.8
9,89
44,
921
4,89
926
.63,
611
383
10.6
Om
an2,
258
1.1
370
1,78
91,
785
79.1
9935
35.3
Pale
stin
ian
8,64
54.
13,
718
1,38
91,
362
15.8
3,53
844
1.2
adm
inis
tere
d ar
eas
Qat
ar38
0.0
200
0.0
180.
0Sa
udi A
rabi
a81
60.
444
220
50.
635
41
0.3
Som
alia
9,48
64.
55,
333
1,07
01,
064
11.2
3,08
314
14.
6Su
dan
16,7
728.
08,
126
2,91
72,
912
17.4
5,72
929
55.
2Sy
ria
17,5
388.
32,
604
13,4
6813
,433
76.6
1,46
616
611
.3T
unis
ia7,
878
3.7
5,28
046
644
25.
62,
132
233
10.9
Uni
ted
Ara
b E
mir
ates
197
0.1
112
5353
26.9
320
0.5
Yem
en11
,254
5.3
3,68
14,
067
4,01
935
.73,
506
407
11.6
Gra
nd to
tal
210,
523
100
112,
612
56,7
1456
,148
26.7
41,1
974,
382
10.6
Sour
ce: B
ased
on
the
OE
CD
onl
ine
data
base
: ww
w1.
oecd
.org
/scr
ipts
/cde
/mem
bers
/DA
CA
uthe
ntic
ate.
asp.
10101-10_Ch10_Redo.qxd 10/5/06 3:09 PM Page 302

the arab experience 303
agencies disbursed 10.6 percent of the total ODA provided by multilateral institu-tions worldwide. The following section, based on statistics from the main Arabofficial sources, gives a different picture of the size of Arab funding from the vari-ous regional institutions.
ODA from Arab Development Lending Institutions
According to AUER estimates, the amounts disbursed via national, regional,and multilateral lending institutions with a majority Arab shareholding wereU.S.$72.4 billion for the 1970–2004 period, as shown in table 10-5, rather thanthe U.S.$6.7 billion cited in the OECD database shown in appendix table 10A-4.This represents 58.5 percent of total ODA disbursed by Arab donors since 1970,amounting to U.S.$123.8 billion, as shown in table 10-1.
Table 10-5 also illustrates the geographic distribution of aid from these vari-ous institutions. The table shows that the largest loan and aid portfolio is heldby multilateral Arab institutions, or institutions that are not exclusively Arab.This portfolio represents 39 percent of total aid disbursed by all institutions.The Islamic Development Bank is by far the most active institution in thisgroup (28.3 percent of total lending by all institutions); however 49 percent ofits lending goes to the Arab region. The Arab region receives 39 percent of totallending by this group of institutions.
National institutions are the second largest distributors of development assis-tance (33 percent of the total). However, only 55.2 percent of their lending goesto the Arab region, while purely regional Arab institutions provide 27.9 percentof all loans. Their operations focus exclusively on Arab countries.
Table 10-4. Arab Share in the Distribution of ODA, 1970–2004
Amount Share(billions of U.S. dollars) (percent)
DAC countries’ ODA 921 66Multilateral agencies 368 27Non-DAC ODA 101 7Arab donors’ ODA 96 7Arab donors’ share of non-DAC ODA 95
Total aid from all donors to Arab countries 210 15Total aid from all donors 1,390 100
Arab donors’ share of ODA to Arab countries 51 27Arab countries’ share of total Arab ODA 58
Source: Based on the OECD online database: www1.oecd.org/scripts/cde/members/DACAuthenticate.asp.
10101-10_Ch10_Redo.qxd 10/5/06 3:09 PM Page 303

304 georges corm
The table also shows that the Arab region is the largest beneficiary of assis-tance from all these institutions (61.4 percent of the total). However, non-Arab Asia (22.2 percent) and sub-Saharan Africa (14.4 percent) were alsobeneficiaries. The Latin American region is only a marginal beneficiary (1.4 per-cent). Existing AUER statistics do not identify individual beneficiary countriesof total ODA.
Table 10-5. Total Arab-Based National, Regional, and Multilateral ODA,Provided from Creation until December 12, 2004 a
Millions of U.S. dollars, unless otherwise noted
Totalaid
provided Share of eachsince Arab Latin Other institution
Donor creation region Africa Asia America countries (percent)
Regional Arab institutionsArab Fund (AFESD) 15,923 15,923 0 0 0 0 22.0Arab Monetary Fund 4,293 4,293 0 0 0 0 5.9
Subtotal 20,216 20,216 0 0 0 0 27.9
National ODA institutionsAbu Dhabi Fund 3,317 2,596 147 567 0 7 4.6Saudi Fund 7,637 3,675 1,441 2,368 60 94 10.5Kuwait Fund 13,014 6,965 2,281 3,196 303 270 18.0
Subtotal 23,968 13,235 3,868 6,131 362 371 33.1Share of each beneficiary 100 55.2 16.1 25.6 1.5 1.5
region (percent)
Not exclusively Arab institutionsIslamic Bank 20,528 10,049 2,015 8,423 18 24 28.3Arab Bank for Economic 2,348 10 2,338 0 0 0 3.2
Development in AfricaOPEC Fund 5,371 955 2,174 1,547 641 54 7.4
Subtotal 28,247 11,014 6,527 9,970 659 78 39.0Share of each beneficiary 100 39.0 23.1 35.3 2.3 0.3
region (percent)Total Arab and 72,432 44,466 10,395 16,101 1,021 449 100
associated fundsTotal share of each 100 61.4 14.3 22.2 1.4 0.6
beneficiary region
Source: Arab League and others, Arab Unified Economic Report (2005).a. The Kuwait Fund was started 1962, others between 1974 and 1978.
10101-10_Ch10_Redo.qxd 10/5/06 3:09 PM Page 304

the arab experience 305
Distribution of ODA by Economic Sector
Statistics from AUER can be used to analyze the distribution of Arab ODA todifferent economic sectors. Table 10-6 shows the cumulative distribution up to2004. Assistance focuses on two main sectors: power, and transport and com-munication. In the Arab region, more than 47 percent of lending was providedto these two sectors. In Africa the transport and communication sector receivedup to 37.7 percent of all lending. In spite of enormous agriculture and livestockrequirements, this sector has been allocated only 13.5 percent of total assistance.
The same trends are apparent in the annual statistics on the sectoral distribu-tion of assistance for 2004. Energy, transport, and communication still represent 49.3 percent of commitments, while agriculture and livestock has declined to 4.1 percent. However, water and water drainage is on a rising trend (14.1 percent).
Unfortunately, there are no details regarding the item “other.” Support tosocial sectors (such as health and education) is included under this miscella-neous heading. It is to be hoped that, in the future, Arab ODA will concentratemore on key sectors where the problems of the Arab economies appear to belinked increasingly with certain social issues, as described in the recently pub-lished UNDP Arab Human Development Reports.
In fact, substantial financial resources are not yet being allocated to some ofthe key issues identified for economic and social reforms. A major concern is thepersistently large pockets of illiteracy and extreme poverty in some Arab coun-tries and the general lack of competitive production capacity, which contributesto the Arab economies’ marginal position in a globalized world economy despitetheir huge energy resources.6
Main Conclusions
The network of Arab or Arab-based regional financial institutions is complex,and there is a duplication of functions among national, regional (Arab-focused),and multilateral institutions specializing in certain Muslim or African countries.In addition, the amount of funding made available for Arab ODA has variedwidely over the past thirty years. Three main issues need to be tackled in thefuture to increase the efficiency of institutions providing ODA.
The first relates to the heavy reliance of these institutions’ activities on oilprices. The data reviewed in this section show that the amounts disbursed bythese institutions are highly dependent on the price of oil. These institutionsshould try to diversify their funding sources to reduce their exposure to fluctua-tions in the financial wealth of the rich Gulf oil-exporting countries.
6. On this point see Corm (2003) and World Economic Forum (2003).
10101-10_Ch10_Redo.qxd 10/5/06 3:09 PM Page 305

Tab
le 1
0-6.
Dist
ribu
tion
of C
umul
ativ
e O
DA
by
Econ
omic
Sec
tor
and
Reg
ion,
as o
f Dec
embe
r 31
, 200
4M
illio
ns o
f U.S
. dol
lars
, unl
ess
othe
rwis
e no
ted
Sect
orSe
ctor
Sect
or
Sect
orLa
tinSe
ctor
shar
e al
l A
rab
shar
eA
fric
ansh
are
Asia
nsh
are
Am
eric
ansh
are
Oth
erre
gion
sSe
ctor
coun
trie
s(p
erce
nt)
coun
trie
s(p
erce
nt)
coun
trie
s(p
erce
nt)
coun
trie
s(p
erce
nt)
coun
trie
sT
otal
(per
cent
)
Tra
nspo
rt a
nd7,
864.
617
.73,
918.
737
.72,
861.
417
.834
7.2
34.0
157.
915
,149
.820
.9co
mm
unic
atio
nPo
wer
(el
ectr
icit
y,11
,457
.625
.81,
318.
212
.75,
902.
536
.712
1.3
11.9
40.0
18,8
39.6
26.0
oil,
gas)
Wat
er a
nd w
ater
3,97
9.9
9.0
881.
58.
559
9.0
3.7
85.7
8.4
82.6
5,62
8.7
7.8
drai
nage
Agr
icul
ture
and
6,15
4.0
13.8
1,80
4.3
17.4
1,70
5.6
10.6
126.
212
.458
.99,
849.
013
.6liv
esto
ckIn
dust
ry a
nd6,
293.
314
.258
3.3
5.6
3,00
3.4
18.7
0.0
0.0
8.0
9,88
8.0
13.7
met
allu
rgy
Oth
er8,
716.
519
.61,
888.
818
.22,
029.
012
.634
0.5
33.4
101.
913
,076
.718
.1T
otal
44,4
65.9
100
10,3
94.8
100
16,1
00.9
100
1,02
0.9
100
449.
372
,431
.810
0Sh
are
of e
ach
61.4
14.4
22.2
1.4
0.6
100
regi
on (
perc
ent)
Sour
ce: A
rab
Leag
ue a
nd o
ther
s, A
rab
Uni
fied
Econ
omic
Rep
ort(
2005
).
10101-10_Ch10_Redo.qxd 10/5/06 3:09 PM Page 306

the arab experience 307
The second issue concerns the very broad geographic mandate of some of thelargest institutions. Changes in circumstances make it necessary to reshape thenetwork created in the early 1970s. The period when the fourfold increase in oilprices created major hardships for non-oil-producing developing countries isnow well past, although it remains to be seen what impact recent oil-priceincreases will have on the least-developed countries. Unlike in the 1970s, todaythere are no longer the same international pressures on rich Arab oil-exportingcountries to contribute major grant aid to less-developed countries affected bysharp oil-price increases. Some of these exporting countries have themselvesbecome borrowers on their domestic markets or on international markets.
As more resources are made available through other regional and multilateralinstitutions, is there still a need for Arab-based institutions to provide develop-ment funding to non-Arab countries? This is of course a question of inter-national policy by the rich Arab oil-exporting countries, which their governmentscould usefully examine. Policies to gain friends in the international arena couldbe pursued through direct bilateral aid or their national agencies, and not neces-sarily through official regional funding institutions.
The third issue is the need to focus more on strategic bottlenecks affecting theperformance of Arab economies. Although there is an increasing trend to com-mit and disburse more aid to small and medium-sized enterprises or to increasefunding for the health and education sectors, as well as to support various typesof institutional reform for promoting governance and sustainable development,the trend of lending to traditional infrastructure sectors still predominates.
Description of the Main Arab Regional and Multilateral Institutions
The lending conditions of the most relevant regional Arab institutions andArab-based multilateral institutions are similar to those of the United StatesAgency for International Development (USAID) with regard to the loan term.Interest rates charged to borrowers vary from a minimum of 1 percent to a max-imum of 4.5 to 5 percent (except by one institution, which may charge as muchas 6 percent). The appendix tables provide the main lending conditions of theinstitutions described in this chapter.
There have also been several debt relief operations between oil-rich coun-tries and Arab beneficiary states. However, no statistics are available becausesuch operations were bilateral and took place within a specific political context(such as the 1991 Gulf War). World Bank statistics indicate that official debtrelief operations affected only Egypt (for a substantial amount of more thanU.S.$13 billion in 1991) and, very marginally, Jordan, after signing a peacetreaty with Israel in 1994. Other countries, including Yemen, Morocco, Algeria,
10101-10_Ch10_Redo.qxd 10/5/06 3:09 PM Page 307

308 georges corm
and Jordan, benefited from a number of debt rescheduling operations throughthe Paris Club.
Although national funds for assisting Arab and other developing economies(such as the Kuwait Fund, the Saudi Fund, and the Abu-Dhabi Fund) play animportant role in providing financial assistance to the region, this chapter dis-cusses only those institutions for which capital and resources are provided bymore than one state. However, national entities are included in the appendixtables, which give details of the operations of all Arab or Arab-based develop-ment assistance institutions.
Arab Fund for Economic and Social Development (AFESD)7
The AFESD is the oldest institution created by the Arab countries. Although theEconomic and Social Council of the League of Arab States decided to create thefund in 1968, the first meeting of the Board of Governors was not conveneduntil three years later, in February 1972, and the fund came into operation onlyat the beginning of 1974. The fund is located in Kuwait, the country that createdthe first national fund back in 1962. The fund’s basic activities are to providesoft lending to Arab League countries for infrastructure projects.
AFESD members include all twenty-one Arab countries in the League ofArab States: Algeria, Bahrain, Djibouti, Egypt, Iraq, Jordan, Kuwait, Lebanon,Libya, Mauritania, Morocco, Oman, Palestine, Qatar, Saudi Arabia, Somalia,Sudan, Syria, Tunisia, the United Arab Emirates, and Yemen. Many prominentArab economists have been staff members or heads of the fund. Most of theseeconomists also played a role in their own country at a later stage as ministers ofeconomic affairs or prime ministers.
The fund’s total loan commitments from the start of operations until the endof 2004 totaled 4,770 million Kuwaiti dinars (KD) (or U.S.$15.7 billion).8 Thecumulative disbursement amounted to KD2.973 million (or U.S.$9.8 billion)at the end of 2004. The fund’s resources consist of its share capital of KD663million (authorized KD800 million) and reserves of KD1.6 billion at the end of2004.
In recent years, the fund has greatly expanded technical assistance activitiesin the form of grants. Either such grants are used to support inter-Arab activities(Arab research, training, and education centers, support for pan-Arab seminarson economic and social issues, and feasibility studies), or they are specificallyearmarked for assisting member countries. The cumulative amount of grants for
7. www.arabfund.org. All data in this section are taken from this website.8. www.arabfund.org/OPERATNS.htm.
10101-10_Ch10_Redo.qxd 10/5/06 3:09 PM Page 308

the arab experience 309
supporting inter-Arab activities totaled KD37 million at the end of 2004, whilenational grants totaled KD68.2 million.9
The fund places special emphasis on supporting regional projects. Duringthe period 1974–2004, it provided sixty-five pan-Arab loans for a total value ofKD322.1 million to assist in implementing twenty-nine regional infrastructureprojects.10 In particular, it has been successful in promoting the inter-Arab grid toconnect national electricity systems. In recent years, the fund has developed activ-ities to support the private sector through loans or equity holdings. However, pri-vate sector loans represented only 2.6 percent of total loans extended in 2004.
Arab Monetary Fund (AMF) and Arab Trade Financing Program (ATFP)11
The AMF was created in 1976 by the Arab central banks. It began operations in1978. The fund’s capital is denominated in Arab accounting dinars (AAD),12
equivalent to three special drawing rights (SDRs) and different from the Islamicdinar (ID). The paid-up capital in convertible currencies is AAD318.8 million.AMF annual operations are similar to IMF operations. However, the conditionsare much less strict than those of the IMF and are tailored to each beneficiary’sspecific economic status. At the end of 2004 the number of loans extended bythe fund since the start of its activities totaled 131, with a value equivalent toU.S.$4.8 billion (AAD1,037.2 million). The balance of outstanding loanstotaled AAD252.7 million at the end of the same year.
Technical assistance grants disbursed in 2004 were equivalent to AAD994,000;4,080 trainees participated in the 119 training courses and twelve workshopsorganized by the fund in the period 1981–2004.
The fund takes deposits from Arab central banks and monetary agencies.Such deposits amounted to U.S.$1,544 million at the end of 2004. The fundalso supports the development of Arab capital markets via its database and thepublication of a specialized quarterly bulletin. In addition, the fund manages avery successful funding program (ATFP) to stimulate inter-Arab trade. The pro-gram was established in 1989 with paid-up capital of U.S.$500 million con-tributed by forty-four shareholders, including Arab banking and financial
9. www.arabfund.org/TECHASST.htm.10. www.arabfund.org/LOANS.htm.11. Arab Monetary Fund (2004).12. The value of this unit should have been determined not by a fixed parity between it and the
unit of Special Drawing Rights (SDR), but by a basket that included all Arab currencies weightedaccording to the GDP and external trade of the respective Arab countries. However, membercountries never adopted the basket as defined by a special technical committee of which this chap-ter’s author was a member.
10101-10_Ch10_Redo.qxd 10/5/06 3:09 PM Page 309

310 georges corm
institutions, as well as Arab central banks. Between its inception in 1991 and2004, it provided 342 credit lines to banks in member countries, worth a totalof U.S.$3.5 billion. However, the fund does not actively promote an inter-bankArab market for official or banking deposits, and neither does it provide swapfacilities with Arab central banks.
Islamic Development Bank (IsDB)
The IsDB is by far the largest multilateral Arab-Muslim country financialinstitution. Total cumulative approved operations at the end of the 2004–05financial year (from January 1, 1976, to February 9, 2005) were equivalent toU.S.$38.3 billion. Up to 61 percent of this amount was used to finance trade,13
while 37 percent went to project and technical assistance and 2 percent to spe-cial assistance operations.14
The bank’s capital was subscribed in a new account currency, the Islamicdinar (ID).15 Fifty-five countries contributed to it, including twenty-one Arabcountries, representing 69.21 percent of the capital. The largest contributor byfar was Saudi Arabia, with 27.33 percent, followed by Libya (10.96 percent),Egypt (9.48 percent), and the United Arab Emirates (7.76 percent).
The bank’s initial capital was ID2 billion. As of February 9, 2005, it stoodat ID15 billion (authorized) and ID8.1 billion (disbursed). Between the startof its activities in 1976 and February 9, 2005, the IsDB approved 1,397 financ-ing operations (excluding trade financing and special assistance operations),and technical assistance grants totaled U.S.$189 million and trade financingU.S.$23.3 billion. Until February 21, 2004, its ten largest beneficiaries in cumu-lative project financing were the following countries: Turkey (U.S.$756 million);Iran (U.S.$731.2 million); Algeria (U.S.$695.9 million); Egypt (U.S.$601.8million); Lebanon (U.S.$571.6 million); Pakistan (U.S.$559.1 million); Jordan(U.S.$540.3 million); Indonesia (U.S.$526.4 million); Oman (U.S.$515.7 mil-lion); and Malaysia (U.S.$503.8 million).16
The bank has a variety of operations and activities, some of which have beendecentralized to specialized affiliate institutions, namely:
—the IsDB Infrastructure Fund to help to raise private capital for financinginfrastructure development in its member countries. Committed investmentsamount to U.S.$980.5 million;
13. Trade between the bank’s member countries accounted for only 11 percent of total exportsand 14 percent of total imports in 2001. However, the level is higher than between Arab countries(6 to 8 percent, as already mentioned).
14. See Islamic Development Bank (2005).15. One Islamic dinar is equivalent to one SDR.16. See Islamic Development Bank (2004).
10101-10_Ch10_Redo.qxd 10/5/06 3:09 PM Page 310

the arab experience 311
—the World Waqf Foundation17 (and the Awkaf Properties investment fundthat develops and invests Awquaf real estate properties, the beneficiaries ofwhich are the needy, orphans, and others);
—the Islamic Corporation for the Development of the Private Sector, estab-lished in 1999 with capital of U.S.$1 billion; since it started, forty-seven proj-ects valued at U.S.$270.2 million have been approved;
—the Islamic Corporation for Insurance of Investment and Export Credit(ICIEC);
—the Islamic Research and Training Institute.The IsDB is also encouraging the development of other Islamic financial
institutions and the promotion of funding techniques consistent with the prin-ciples of Islamic law. This is why, in 1989, it also created the Unit InvestmentFund to provide private or public Islamic institutions with a vehicle throughwhich to invest resources according to Islamic principles. The bank providesfunding according to Islamic economic principles, which prohibit the chargingof interest but allow various types of profit-sharing schemes or the leasing ofcapital goods and receipt of rent from the borrower.
OPEC Fund
Although not a purely Arab regional institution, the OPEC Fund can be con-sidered a multilateral financial institution that is funded largely by the contribu-tions of the rich Arab oil-exporting OPEC members. The OPEC Fund wasestablished in 1976 as an expression of South-South solidarity. All non-OPECdeveloping countries are eligible for fund assistance. It provides concessionalloans for projects, programs, and balance-of-payments support, as well as grantsfor technical assistance, food aid, and other types of assistance. In addition, inthe past few years it has participated in the financing of private sector activities.
Between its creation and the end of December 2005, 119 countries benefitedfrom the fund. Cumulatively, it has committed U.S.$7,906.5 million in develop-ment assistance and disbursed U.S.$5,187.5 million. Least developed countries(LDCs) receive the biggest share of fund resources (56 percent of the fund’spublic sector lending commitments by the end of 2003).
The fund has extended 1,064 loans to the public sector with a value ofU.S.$6,168.10 million, of which 79 percent went to project financing and 12 per-cent to balance-of-payments support; it has participated in eighty-three financingoperations in favor of the private sector, totaling U.S.$417.9 million,18 and has
17. The term “Waqf ” applies to properties placed in trust for charitable purposes according toIslamic law. In Islamic and Arab countries, waqfs are important economic institutions.
18. www.opecfund.org/about/about.aspx.
10101-10_Ch10_Redo.qxd 10/5/06 3:09 PM Page 311

312 georges corm
provided 773 grants with a value of U.S.$348.6 million, of which 32 percent wasextended to technical assistance, 15 percent to emergency relief, 10 percent to theAIDS Fund special account, 6 percent to the Food Aid Special Account, and soon.19 Funding worth U.S.$861.1 million has been channeled to IFAD andU.S.$110.7 million to the IMF Trust Fund.20 By the end of 2005, contributionspledged by member countries amounted to U.S.$3,435 million and reserves stoodat U.S.$2,249 million.
Arab Bank for Economic Development in Africa
BADEA cumulative disbursements from 1974 to 2003 totaled U.S.$1.4 billion,in addition to Special Arab Aid Fund for Africa commitments of U.S.$214.2 mil-lion.21 There has been an upward trend in annual commitments in recent years,rising from U.S.$95.6 million in 1997 to U.S.$140 million in 2003. Its lendinghas concentrated on infrastructure (51.7 percent), agricultural and rural develop-ment (28.4 percent), and to a lesser extent, energy (6.9 percent) and other sectors.
Arab Authority for Agricultural Investment and Development (AAAID)and Arab Organization for Agricultural Development (AOAD)
The Arab League has created two specialized agricultural institutions. AAAIDwas founded in 1974, with the aim of promoting investment in the agriculturalsector. Its paid-up capital at the end of 2003 is U.S.$340 million. It hasinvested U.S.$383 million in the sector, comprising U.S.$157 million in loansand U.S.$226 million in equity participation.22 AOAD was created in 1972. Itsmission is to provide technical assistance, database information, and scientificknowledge on Arab agricultural sectors.
Inter-Arab Investment Guarantee Corporation (IAIGC)
The decision to create this institution was taken in 1970, but it did not come intooperation until 1975. Its paid-up capital at the end of 2004 was U.S.$122.5 mil-lion, with reserves of U.S.$178.8 million.23 The institution provides insurancecover for inter-Arab investment and export credits. In spite of its limited resources,the institution is quite efficient.
By 2004, the IAIGC had signed forty-seven guarantee contracts with a totalvalue of U.S.$134.6 million. It had a portfolio of current contracts worth
19. For the full breakdown of disbursements, see www.opecfund.org/projects_operations/grant_operations.aspx.
20. www.opecfund.org/about/about.aspx.21. OPEC Fund for International Development (2004).22. www.aaaid.org/english/financial_situations.htm.23. www.iaigc.org/index_e.html.
10101-10_Ch10_Redo.qxd 10/5/06 3:09 PM Page 312

the arab experience 313
U.S.$266.1 million at the end of 2004, 36.3 percent of which was for invest-ment guarantees and 63.7 percent for export credit guarantees.24
It produces several annual publications, including an annual report entitled“Investment Climate in the Arab Countries.” This report contains a detailedreview of investment trends in each Arab country and of any new legal or insti-tutional change beneficial or detrimental to the investment climate. It also mon-itors inter-Arab investments.
Arab Gulf Program for United Nations Development Organizations (AGFUND)
This very special regional institution was created by Prince Talal Bin Abdul AzizAl Saud in 1981, with the support of the leaders of the Arab Gulf states, whoare its members and contribute its budget. AGFUND supports sustainabledevelopment efforts of every type, targeting the neediest groups in all develop-ing countries. Support beneficiaries are NGOs, which receive their fundingthrough projects arranged with UN specialized institutions: the United NationsDevelopment Programme (UNDP), the United Nations Children’s Fund(UNICEF), the United Nations High Commissioner for Refugees (UNHCR),the United Nations Development Fund for Women (UNIFEM), the UnitedNations Population Fund (UNFPA), and others.
Cumulative commitments totaled U.S.$237.8 million at the end of 2003,and cumulative disbursements totaled U.S.$198 million for 925 projects in 131 different countries. Health projects represented 23.5 percent of total assis-tance; capacity building, 36.3 percent; education, 15 percent; and special devel-opment, 25.2 percent.25
Other Pan-Arab Regional Financial Institutions
Three major official financial regional institutions promote private and equityinvestment. The mandates of these institutions differ in their geographic andsectoral focus. The Arab Investment Company is a pan-Arab joint stock com-pany founded in 1974 and owned by seventeen Arab states, and more than 55 per-cent of its U.S.$450 million paid-up capital has been subscribed by the Gulfoil-exporting countries. It has been established to take equity holdings in eco-nomically viable projects in any Arab country.26
The Gulf Investment Corporation was founded in 1983 with authorized capi-tal of U.S.$2.1 billion, subscribed by the six GCC member states. Disbursed
24. Inter-Arab Investment Guarantee Corporation (2005).25. OPEC Fund for International Development (2004).26. www.taic.com/company.htm.
10101-10_Ch10_Redo.qxd 10/5/06 3:09 PM Page 313

314 georges corm
capital and shareholder equity is U.S.$1 billion. GIC has established a diversifiedportfolio of equity holdings in different companies in its member countries.27
In 1975 the Arab Petroleum Investments Corporation (APICORP) was alsocreated as an inter-Arab joint stock company with capital contributed by the Araboil-exporting countries in the Organization of Arab Petroleum Exporting Countries.APICORP has been set up to support hydrocarbon and energy-related industriesin Arab countries by means of equity financing or medium-term loans. Its autho-rized capital is U.S.$1.2 billion, and its disbursed capital is U.S.$550 million.28
In addition, two regional financial institutions play an important technical rolethat should be enhanced in the future to serve as a catalyst for developing Arabfinancial markets. One is the Union of Arab Banks, created in 1977, with its head-quarters in Beirut, Lebanon, and a membership that includes all major Arab banks.The union organizes technical seminars on all banking-related topics (Cooke ratio,combating money laundering, electronic banking, credit cards, and others). Theother is the more recently created Union of Arab Stock Exchanges, with a man-date to promote links between the various Arab stock markets. Its headquarters isalso in Beirut, and it organizes seminars and workshops on technical issues.
Conclusion: Increasing the Efficiency of Regional ArabArrangements and Institutions
There is no lack of arrangements and institutions in the Arab region to promoteregional cooperation and support greater efficiency in the Arab economies withinthe globalization context. Rather, efforts have been scattered among a plethora ofdifferent institutions with overlapping mandates of varying regional scope. Thiswas the result of the highly specific economic and political circumstances thataffected the region. The level of funding provided by the various institutionshas also been heavily dependent on fluctuations in oil prices, and it is crucial tofind additional funding sources to reduce this dependency in the future.
In spite of all the regional financial cooperation efforts in place, it has to beacknowledged that the region’s economic performance has been weak in com-parison with that in other regions in the world, in particular the Southeast Asianeconomies. Until recently, this weak performance stemmed in part from thesteady decline in oil prices and the Arab economies’ overall dependence on oilexports. It is also the result of structural economic problems affecting the regionand, in particular, falling productivity deriving from increasing dependence on
27. www.gulfinvestmentcorp.com/about.htm.28. www.apicorp-arabia.com.
10101-10_Ch10_Redo.qxd 10/5/06 3:09 PM Page 314

the arab experience 315
the oil sector and the concentration of domestic investment on the real estateand energy-related sectors.29
The Arab network of regional development institutions and arrangements isstriving to improve the technical and financial services it provides to the Arab andother regions. However, these institutions should be more aggressive in tackling themain obstacles described in this chapter. The following lines of action could pro-vide a basis for future reforms of regional financial arrangements in the Arab region.
Tapping Resources from Domestic and International Financial Markets toReduce Oil-Price Dependency and Increase Lending and Grant Assistance
The funding capacity of national and regional Arab financial institutions ishighly reliant on contributions from the main rich oil-exporting countries. Thelevel of these contributions, especially for national funds to support other Araband developing countries, is dependent on the highly volatile oil receipts ofdonor countries, particularly as those receipts affect bilateral aid and countrycontributions to the capital of regional institutions.
To lessen this dependence and increase their capacity to fund new types ofactivities and reforms needed for more sustainable growth, Arab institutions shouldbegin to tap domestic and regional financial markets. While regional developmentinstitutions in Latin America and Asia are tapping their domestic and foreign capitalmarkets to increase their lending capacity, no Arab development institution has everattempted to do so in domestic or foreign capital markets. This ought to be a veryfeasible solution, especially in view of the solvency of the main state contributorsto the capital of these institutions. The positive sharp upturn in oil prices in recentyears has consolidated this solvency after it was eroded by the invasion of Kuwaitin 1990 and the successive years of high budget deficit in Saudi Arabia owing todecline and low oil prices during the period 1982 to 1999. The Saudi budget nowhas a surplus and the domestic debt has been reduced, while the state of Kuwaithas been able to reconstitute the foreign assets of its Future Generation Fund.
No matter how willing “rich” Arab governments are to increase their share inthe subscribed capital of these institutions, the time would seem ripe for govern-ments sitting on the institutions’ boards to introduce a legal mechanism toallow the institutions to tap financial markets, as other regional or multilateralinstitutions have been successful in doing.
Domestic capital markets are still in need of deepening, which they couldachieve by issuing high-quality bonds. Although most Arab equity markets,mainly in the Gulf region and in a few other Arab countries, have been booming
29. On this point see Economic and Social Commission for Western Asia (2003 and 2004).
10101-10_Ch10_Redo.qxd 10/5/06 3:09 PM Page 315

316 georges corm
because of higher oil prices, bond markets are still very narrow and not properlyinstitutionalized. If regional institutions were to issue prime quality bonds, itcould give a very welcome boost to these markets.
In fact, Arab domestic capital markets are still very narrow in comparisonwith emerging markets in Asia or Latin America. In spite of the huge financialassets of individuals, private and public banks, and financial institutions, theregion still has no real regional financial market. In the future, the various pan-Arab financial institutions could play a major role in deepening and enlargingcapital markets in the region.
Rationalizing the Institutional Network and Improving Its Operational Efficiency
There is certainly room for merging institutions. Surely BADEA should bemerged with the Islamic Development Bank in order to remove the duplicationof effort between the two institutions with respect to Africa.
Another useful topic of discussion is the need to pool regional resources ear-marked for the Arab region, as these are scattered among national, regional, andmultilateral funds. Should all regional development lending be conductedthrough one institution, for example, the Arab Fund for Economic and SocialDevelopment? In this case, the IsDB could specialize in lending to non-Arabcountries, while the AFESD would become the sole development lender to theArab region. Another alternative might be for the IsDB to entrust “Arabic win-dow” operations to the AFESD, which it would continue to fund.
Of course, these are very thorny issues, because no institution would agreelightly to have its mandate revised or its bureaucracy merged with another.However, it goes without saying that beneficiary entities in Arab countriesshould also become more efficient in order to make more effective and speedieruse of these institutions’ financial resources.
Concentrating Funding on the Most Strategic Bottlenecks
Most Arab economies could be characterized as rent economies, with oil beingthe main determinant of GDP growth for both oil-exporting and non-oil-exporting countries. Non-oil exporters have in fact developed a dependence onfinancial resources from oil exporters, either as grants and aid or as migrantremittances. For this group of countries, the amount of ODA from “rich” Arabcountries and from Arab agencies, in addition to workers’ remittances from oil-exporting countries, constitutes a major growth variable.
Other factors explaining the lack of productivity include the fact that theeducational sector is not linked with the needs of local economies, and the
10101-10_Ch10_Redo.qxd 10/5/06 3:09 PM Page 316

the arab experience 317
unemployment rate is very high in the entire region, affecting mainly the youngergeneration. At the same time, Arabian Peninsula countries import a substantialnumber of foreign workers, while unemployment is growing among their ownnationals; there are very large numbers of immigrants from the Indian subconti-nent and other Arab countries.
The private sector lacks competitiveness because it does not spend on researchand development (R&D) and on quality control of its products; domestic marketscontinue to be controlled by a few large family groups that extend their businesshorizontally, but not vertically. The informal sector, which is a major source ofemployment, is not encouraged to modernize and develop to enable it to be inte-grated into the modern segment of the economy by means of subcontracting, licens-ing, or franchising. This is why the value-added component of GDP is still verylow. All this has led to a continual brain drain that undermines the productivity ofArab economies. In addition, workers’ salaries in the private sector are not compet-itive with salaries in other regions of the world, such as Asia and Central Europe.
There is a general lack of governance and transparency in the public sectorand in relations between the private and public sectors, which encourages cor-ruption and the resultant high transaction costs. An additional stimulus to cor-ruption is very low public sector salaries in low-income Arab countries.
A lack of productivity and innovation in the Arab economies creates moreunemployment or disguised unemployment, fueling the brain drain still further.This creates a vicious circle that is not easy to break without substantial changesin economic policies.
While these interlinked bottlenecks persist, no sharp increase in intraregionaltrade is likely. If the network of Arab and Arab-based official financial institu-tions can be reshaped to make it more efficient, it will be easier to clear the maineconomic bottlenecks. The focus should be on the need for more financial sup-port for R&D, economic innovation, human resource training, linkages betweenthe educational system and the private sector, and other ways to improve produc-tivity in Arab economies and increase private sector competitive capacity on bothdomestic and international markets.
The trend to supply SMEs with sufficient funding and improve the capacityof the informal sector should be given a substantial boost. More collective effortsare needed from the various national, regional, and multilateral institutions basedin the Arab region to curb the severe brain drain that is undermining the region.
The governors of the institutions that meet every year should review currentlending operations to set new priorities and new orientations for the develop-ment assistance provided by the national and pan-Arab development institu-tions within the region.
10101-10_Ch10_Redo.qxd 10/5/06 3:09 PM Page 317

Tab
le 1
0A-1
.A
ctiv
ities
and
Len
ding
Con
ditio
ns o
f Ara
b an
d A
rab-
Bas
ed A
genc
ies
Loan
s
Max
imum
Gra
ceIn
tere
st co
ntri
butio
nFi
nanc
ial d
evel
opm
ent
Mat
urity
peri
odra
te
to th
eFo
rms o
ffu
nds
(yea
rs)
(yea
rs)
(per
cent
)pr
ojec
t cos
tas
sista
nce
Ben
efic
iari
esSe
ctor
s
Abu
Dha
bi F
und
for
Dev
elop
men
t (A
DFD
)
Ara
b A
utho
rity
for
Agr
icul
tura
l Inv
estm
ent
and
Dev
elop
men
t(A
AA
ID)
Ara
b B
ank
for
Eco
nom
icD
evel
opm
ent i
n A
fric
a(B
AD
EA
)
8–20
18–3
0
3–8
4–10
3–6
1–4
50 p
erce
nt o
f tot
alpr
ojec
t cos
t an
d up
to
10 p
erce
nt o
ffu
nd c
apit
al
50 p
erce
nt o
f tot
alpr
ojec
t cos
t
60 p
erce
nt o
f the
proj
ect c
ost a
ndup
to U
.S.$
18m
illio
n (i
nex
cept
iona
lca
ses)
Loan
s, g
rant
s,eq
uity
part
icip
atio
n,is
suin
ggu
aran
tees
,te
chni
cal
assi
stan
ce
Loan
s, e
quit
ypa
rtic
ipat
ion
Con
cess
iona
llo
ans,
line
ofcr
edit,
tech
nica
las
sista
nce
Gov
ernm
ents
,pu
blic
inst
itut
ions
,pr
ivat
een
terp
rise
s
Gov
ernm
ents
,pr
ivat
e se
ctor
Gov
ernm
ents
,pr
ivat
e se
ctor
Soci
al a
ndec
onom
icpr
ojec
ts(i
nfra
stru
ctur
e,ag
ricu
lture
,po
wer
,tr
ansp
ort,
min
ing,
man
ufac
turi
ng)
Agr
icul
ture
(pl
ant
and
anim
alpr
oduc
tion
,ag
ricu
ltura
lre
sear
ch a
ndde
velo
pmen
t)A
gric
ultu
re, r
ural
deve
lopm
ent,
infr
astr
uctu
re,
indu
stry
,en
ergy
, hea
lth,
educ
atio
n,en
viro
nmen
t,tr
ade
appe
nd
ix 1
0a
10101-10_Ch10_Redo.qxd 10/5/06 3:09 PM Page 318

Ara
b Fu
nd fo
r E
cono
mic
and
Soci
alD
evel
opm
ent (
AFE
SD)
Ara
b G
ulf P
rogr
am fo
rU
nite
d N
atio
nsD
evel
opm
ent
(AG
FUN
D)
Ara
b M
onet
ary
Fund
(AM
F)
22–3
0
3–7
(can
be
prov
ided
)
4–7
3–4.
5
4–5
Up
to 2
5 pe
rcen
tof
tota
l cos
t of
a pr
ojec
t
Up
to 4
75pe
rcen
t of p
aid
subs
crip
tion
of
a m
embe
rco
untr
y
Loan
s, g
uara
ntee
s,lo
an s
yndi
-ca
tion
, lin
es o
fcr
edit
, equ
ity
part
icip
atio
n,le
asin
g, u
nder
-w
riti
ng o
fse
curi
ties
, and
othe
rs; g
rant
sfo
r te
chni
cal
assi
stan
ce,
trai
ning
adv
i-so
ry se
rvic
esG
rant
s, tr
aini
ngpe
rson
nel,
and
teac
hers
Con
cess
iona
lsh
ort-
and
med
ium
-ter
mlo
ans,
tech
nica
las
sist
ance
,tr
aini
ng
Gov
ernm
ents
,pu
blic
ent
er-
pris
es a
ndco
rpor
atio
ns,
priv
ate
sect
or
Non
gove
rnm
enta
lor
gani
zati
ons
(NG
Os)
Gov
ernm
ent,
priv
ate
sect
or(b
anki
ng a
ndm
onet
ary
inst
itut
ions
)
Eco
nom
ic a
ndso
cial
pro
ject
s(i
nfra
stru
ctur
e,ag
ricu
lture
,in
dust
ry,
hous
ing,
ener
gy, e
tc.)
Hum
anit
aria
npr
ojec
ts (
edu-
cati
on, h
ealth
,nu
trit
ion,
wat
er, s
ani-
tati
on, e
tc.)
Mon
etar
y(e
cono
mic
refo
rms,
corr
ecti
ngba
lanc
e of
paym
ents
,ex
chan
ge r
ate
stab
ility
,ca
pita
l mar
ket
deve
lopm
ent,
etc.
), tr
ade
(con
tinue
d)
10101-10_Ch10_Redo.qxd 10/5/06 3:09 PM Page 319

Ara
b Pe
trol
eum
Inve
stm
ents
Cor
pora
tion
(A
pico
rp)
Kuw
ait F
und
for
Ara
bE
cono
mic
Dev
elop
men
t(K
FAE
D)
Ara
b T
rade
Fin
anci
ngPr
ogra
m (
AT
FP)
Tab
le 1
0A-1
.(c
ontin
ued)
Loan
s
Max
imum
Gra
ceIn
tere
st co
ntri
butio
nFi
nanc
ial d
evel
opm
ent
Mat
urity
peri
odra
te
to th
eFo
rms o
ffu
nds
(yea
rs)
(yea
rs)
(per
cent
)pr
ojec
t cos
tas
sista
nce
Ben
efic
iari
esSe
ctor
s
22–3
0
6 m
onth
s to
5 y
ears
(dep
ends
on
the
good
s)
2–10
1.5–
4
2.5
poin
tsab
ove
6-m
onth
LIB
OR
50 p
erce
nt o
f tot
alpr
ojec
t cos
t (in
exce
ptio
nal
case
s)
Loan
s, e
quit
ypa
rtic
ipat
ion,
debt
fina
ncin
gD
irec
t loa
ns,
part
icip
atio
n in
the
proj
ect
capi
tal,
guar
ante
es,
gran
ts,
tech
nica
l, an
dot
her
supp
ort
assi
stan
ceC
redi
t lin
es (
pre-
expo
rt c
redi
t,po
stsh
ipm
ent
cred
it, b
uyer
cred
it, i
mpo
rtcr
edit
, etc
.)Pr
ovid
ing
trad
eda
ta a
ndin
form
atio
n
Gov
ernm
ent,
publ
ic a
ndpr
ivat
e se
ctor
Gov
ernm
ents
,de
velo
pmen
tin
stit
utio
ns,
priv
ate
corp
orat
ions
that
hav
e a
deve
lopm
ent
impa
ct
Exp
orte
rs a
ndim
port
ers
ofA
rab-
orig
inco
mm
odit
ies
Petr
oleu
min
dust
ry
Agr
icul
ture
,tr
ansp
ort,
ener
gy,
indu
stry
,w
ater
, sew
age
Prom
otin
g tr
ade
in g
oods
of
Ara
b or
igin
10101-10_Ch10_Redo.qxd 10/5/06 3:09 PM Page 320

Inte
r-A
rab
Inve
stm
ent
Gua
rant
ee C
orpo
rati
on(I
AIG
C)
Isla
mic
Dev
elop
men
tB
ank
(IsD
B)a
Org
aniz
atio
n of
Petr
oleu
m E
xpor
ting
Cou
ntri
es F
und
for
Inte
rnat
iona
lD
evel
opm
ent
(OPE
C F
UN
D)
15–2
53–
70 1–
2.75
Gua
rant
eeco
ntra
cts
Loa
ns, l
easi
ng,
equi
ty p
arti
ci-
pati
on, t
echn
i-ca
l ass
istan
ce,
prof
it sh
arin
g,et
c.
Con
cess
iona
llo
ans,
gra
nts
(for
tech
nica
las
sist
ance
, foo
dai
d, r
esea
rch,
etc.
)
Priv
ate
sect
or(i
nves
tors
,ex
port
ers,
cont
ract
ors,
and
othe
rs)
Gov
ernm
ents
,pr
ivat
ein
stit
utio
ns
Gov
ernm
ents
,pu
blic
and
priv
ate
sect
ors
Insu
ranc
eco
vera
ge fo
rin
ter-
Ara
bin
vest
men
t,ex
port
cre
dits
,pr
omot
ing
inve
stm
ent
oppo
rtun
itie
s,pr
ovid
ing
info
rmat
ion
Soci
al a
ndec
onom
icpr
ojec
ts(a
gric
ultu
re,
infr
astr
uctu
re,
trad
e, e
duca
-ti
on, h
ealth
,an
d ot
hers
)So
cial
and
econ
omic
proj
ects
,pr
ogra
ms,
bala
nce
ofpa
ymen
ts
(con
tinue
d)
10101-10_Ch10_Redo.qxd 10/5/06 3:09 PM Page 321

Saud
i Fun
d fo
rD
evel
opm
ent (
SFD
)
Ara
b O
rgan
izat
ion
for
Agr
icul
tura
lD
evel
opm
ent (
AO
AD
)
Tab
le 1
0A-1
.(c
ontin
ued)
Loan
s
Max
imum
Gra
ceIn
tere
st co
ntri
butio
nFi
nanc
ial d
evel
opm
ent
Mat
urity
peri
odra
te
to th
eFo
rms o
ffu
nds
(yea
rs)
(yea
rs)
(per
cent
)pr
ojec
t cos
tas
sista
nce
Ben
efic
iari
esSe
ctor
s
15–5
05–
101–
2.5
50 p
erce
nt o
f tot
alpr
ojec
t cos
t and
less
than
5pe
rcen
t of t
hefu
nd c
apit
al
Con
cess
iona
llo
ans,
gra
nts,
expo
rt c
redi
t,an
d in
sura
nce
Tec
hnic
al a
ssis-
tanc
e, p
rovi
ding
sect
or’s
data
base
and
info
rmat
ion
Gov
ernm
ents
,or
gani
zati
ons
in L
DC
s,pr
ivat
e se
ctor
Soci
al a
ndec
onom
icw
elfa
re(t
rans
port
,so
cial
, inf
ra-
stru
ctur
e, c
om-
mun
icat
ion,
agri
cultu
re,
indu
stry
pow
er,
min
ing,
etc
.)
Non
-oil
expo
rts
Agr
icul
ture
10101-10_Ch10_Redo.qxd 10/5/06 3:09 PM Page 322

Ara
b In
vest
men
tC
ompa
ny (
AIC
)
Gul
f Inv
estm
ent
Cor
pora
tion
(G
IC)
a. T
he I
sDB
pro
vide
s fin
ance
und
er d
iffer
ent l
egal
sch
emes
in c
onfo
rmit
y w
ith
the
Shar
ia, w
hich
pro
hibi
ts c
harg
ing
inte
rest
.
Equ
ity
part
ici-
pati
on, p
rovi
d-in
g ba
nkin
gse
rvic
esE
quit
y pa
rtic
i-pa
tion
, fin
an-
cial
adv
isor
yse
rvic
es, G
ulf
equi
ty p
rod-
ucts
, mar
ket-
ing
sele
cted
inte
rnat
iona
l eq
uity
, etc
.T
reas
ury
Publ
ic a
nd p
riva
tese
ctor
s
Gov
ernm
ents
,qu
asi-
gove
rnm
enta
lin
stit
utio
ns,
corp
orat
ein
vest
ors
in th
eG
ulf r
egio
n
Agr
icul
ture
,in
dust
ry,
serv
ice
proj
ects
Dev
elop
ing
priv
ate
ente
rpri
ses
and
econ
omic
grow
th
10101-10_Ch10_Redo.qxd 10/5/06 3:09 PM Page 323

324 georges corm
Table 10A-2. Main Activity Indicators of Selected Arab and Arab-Based Agencies, 2003Millions of U.S. dollars
Capital at end of 2003 Cumulative to end of 2003
Agency Subscribed Paid-up Commitments Disbursements
Arab Gulf Program for 251 251 238 198United NationsDevelopment (AGFUND)a
Abu Dhabi Fund for 1,089 580 3,384 2,061Development (ADFD)
Arab Bank for Economic 1,500 1,500 2,197 1,387Development inAfrica (BADEA)
Arab Fund for Economic 2,714 2,280 15,492 9,502and Social Development(AFESD)
Kuwait Fund for Arab 6,600 6,600 12,400 9,836Economic Development(KFAED)
OPEC Fund for International 3,435 2,920 6,896 4,588Development (OPEC Fund)
Arab Trade Financing 500 500 3,984b 3,505b
Program (ATFP)Islamic Development 9,912 4,050 34,244 23,784
Bank (IsDB)Saudi Fund for Development 8,267 8,267 6,473.80 5,276.86
(SFD)
Source: Arab National and Regional Development Institutions 2004, OPEC Fund for InternationalDevelopment. For Arab Trade Financing Program (ATFP), see www.Atfp.Org.Ae/English/Report/Eng2004.Pdf.
a. Paid-in capital + reserves.b. In 2004.
10101-10_Ch10_Redo.qxd 10/5/06 3:09 PM Page 324

Tab
le 1
0A-3
.Ev
olut
ion
of A
rab-
Bas
ed N
atio
nal,
Reg
iona
l, an
d M
ultil
ater
al O
ffici
al D
evel
opm
ent A
ssista
nce
(OD
A),
199
8–20
04M
illio
ns o
f U.S
. dol
lars
, unl
ess
othe
rwis
e no
ted
1998
–99
1999
–200
020
00–0
120
01–0
220
02–0
320
03–0
4A
genc
y19
9819
99(p
erce
nt)
2000
(per
cent
)20
01(p
erce
nt)
2002
(per
cent
)20
03(p
erce
nt)
2004
(per
cent
)
Regi
onal
Ara
bin
stitu
tions
Ara
b Fu
nd
844.
086
9.0
391
3.0
592
6.7
296
3.1
41,
037.
58
1,04
1.6
0.4
(AFE
SD)
Ara
b M
onet
ary
64.0
66.0
315
8.0
139
261.
365
146.
0−4
429
6.9
103
180.
8−3
9Fu
ndSu
btot
al90
8.0
935.
03
1,07
1.0
151,
188.
011
1,10
9.1
−71,
334.
420
1,22
2.4
−8N
atio
nal O
DA
inst
itutio
nsA
bu D
habi
Fun
d16
9.0
218.
029
120.
0−4
538
4.0
220
496.
029
177.
4−6
410
.0−9
4Sa
udi F
und
61.0
83.0
3671
.0−1
429
2.5
312
189.
0−3
522
4.3
1919
1.4
−15
Kuw
ait F
und
459.
049
2.0
735
7.3
−27
386.
58
720.
486
283.
6−6
148
7.4
72Su
btot
al68
9.0
793.
015
548.
3−3
11,
063.
094
1,40
5.4
3268
5.3
−51
688.
80.
5
Not
exc
lusiv
ely
Ara
b in
stitu
tions
Isla
mic
Ban
k65
4.0
703.
07
1,52
8.5
117
1,58
7.2
488
8.6
−44
2,43
7.8
174
913.
8−6
3A
rab
Ban
k fo
r11
0.0
114.
04
130.
014
157.
221
134.
9−1
488
.4−3
418
1.6
105
Eco
nom
icD
evel
opm
ent
in A
fric
aO
PEC
Fun
d19
6.0
197.
01
250.
427
167.
9−3
348
7.0
190
268.
7−4
527
9.8
4Su
btot
al96
0.0
1,01
4.0
61,
908.
988
1,91
2.3
01,
510.
5−2
12,
794.
985
1,37
5.2
−51
Tot
al A
rab
and
2,55
7.0
2,74
2.0
73,
528.
229
4,16
3.3
184,
025.
0−3
4,81
4.6
203,
286.
4−3
2as
soci
ated
fu
nds
Sour
ce: A
rab
Leag
ue a
nd o
ther
s, A
rab
Uni
fied
Econ
omic
Rep
ort(
1999
, 200
0, 2
001,
200
2, 2
003,
200
4, 2
005)
.
10101-10_Ch10_Redo.qxd 10/5/06 3:09 PM Page 325

Tab
le 1
0A-4
.A
rab
Don
ors’
and
Ara
b A
genc
ies’
Shar
e of
Tot
al O
DA
to D
evel
opin
g C
ount
ries
, 197
0–20
04M
illio
ns o
f U.S
. dol
lars
, unl
ess
othe
rwis
e no
ted
Ara
bco
untr
ies
Ara
bA
rab
Ara
bto
non
-N
on-
coun
trie
sco
untr
ies
agen
cies
toD
AC
D
AC
to D
AC
to a
llm
ultil
ater
albi
late
ral
All
Ara
bA
rab
DA
CM
ultil
ater
albi
late
ral
coun
trie
sdo
nors
dono
rsdo
nors
Year
dono
rsag
enci
esco
untr
ies
coun
trie
sdo
nors
dono
rs(p
erce
nt)
(per
cent
)(p
erce
nt)
(per
cent
)
1970
6,86
938
25,
421
1,06
738
27.
05.
610
019
717,
765
436
6,03
41,
295
436
7.2
5.6
100
1972
8,22
460
46,
247
1,37
360
49.
77.
310
019
7310
,686
2,05
86,
675
1,95
32,
058
30.8
19.3
100
1974
14,2
3411
73,
641
7,78
42,
808
3,64
146
.825
.64.
210
019
7517
,908
159
4,90
49,
180
3,79
24,
936
53.4
27.4
4.2
99.3
1976
16,8
8441
24,
231
8,77
93,
842
4,26
348
.225
.110
.799
.319
7718
,099
1,10
13,
978
9,27
64,
824
3,99
942
.922
.022
.899
.519
7824
,756
963
6,50
512
,238
5,98
56,
532
53.2
26.3
16.1
99.6
1979
28,1
3625
66,
572
15,3
056,
229
6,60
242
.923
.44.
199
.519
8033
,594
280
8,80
816
,979
7,76
68,
849
51.9
26.2
3.6
99.5
1981
32,6
7540
07,
576
17,1
987,
895
7,58
244
.123
.25.
199
.919
8229
,850
388
4,65
217
,625
7,57
04,
655
26.4
15.6
5.1
99.9
1983
29,0
8031
33,
863
17,7
807,
435
3,86
521
.713
.34.
210
019
8430
,286
146
3,65
419
,041
7,58
63,
658
19.2
12.1
1.9
99.9
10101-10_Ch10_Redo.qxd 10/5/06 3:09 PM Page 326

1985
32,2
6212
72,
975
21,1
858,
083
2,99
414
.09.
21.
699
.419
8637
,830
143
3,85
525
,210
8,74
93,
872
15.3
10.2
1.6
99.6
1987
41,6
8672
2,93
128
,877
9,86
62,
943
10.2
7.0
0.7
99.6
1988
45,0
0560
1,88
931
,946
11,1
241,
935
5.9
4.2
0.5
97.6
1989
46,8
1413
81,
440
32,9
2312
,401
1,49
04.
43.
11.
196
.719
9057
,629
755,
833
38,4
6213
,292
5,87
615
.210
.10.
699
.319
9161
,529
153
2,40
642
,991
15,9
052,
632
5.6
3.9
1.0
91.4
1992
61,0
7028
377
442
,773
17,2
381,
059
1.8
1.3
1.6
73.1
1993
56,5
6018
491
039
,018
16,2
791,
263
2.3
1.6
1.1
72.0
1994
60,4
9025
776
440
,970
18,5
8393
71.
91.
31.
481
.519
9559
,697
−21
527
40,4
8118
,455
761
1.3
0.9
−0.1
69.3
1996
56,6
36−3
657
339
,088
16,7
0983
91.
51.
0−0
.268
.219
9748
,686
−37
549
32,3
9415
,435
857
1.7
1.1
−0.2
64.0
1998
51,1
06−8
434
35,2
0715
,170
728
1.2
0.8
−0.1
59.6
1999
52,6
7737
238
37,8
3014
,311
535
0.6
0.5
0.3
44.4
2000
50,3
2735
443
36,0
6413
,479
783
1.2
0.9
0.3
56.6
2001
52,1
5314
559
535
,124
16,1
2090
91.
71.
10.
965
.520
0260
,825
139
2,32
140
,752
17,3
622,
712
5.7
3.8
0.8
85.6
2003
70,6
0844
2,64
249
,755
17,7
203,
133
5.3
3.7
0.2
84.3
2004
78,3
0837
92,
057
54,8
3621
,048
2,87
53.
82.
61.
871
.5G
rand
tota
l1,
390,
942
6,70
496
,022
921,
446
368,
748
101,
197
10.4
6.9
1.8
94.9
Sour
ce: O
EC
D o
nlin
e da
taba
se: w
ww
1.oe
cd.o
rg/s
crip
ts/c
de/m
embe
rs/D
AC
Aut
hent
icat
e.as
p.
10101-10_Ch10_Redo.qxd 10/5/06 3:09 PM Page 327

328 georges corm
References
Al Imam, M. M. 2004. International Experiences in Economic Integration and Lessons for ArabIntegration (in Arabic). Beirut: Center for Arab Unity Studies.
Arab League, Arab Fund for Economic and Social Development (AFESD), Arab MonetaryFund, and the Organization of Arab Petroleum Exporting Countries (OAPEC). 1999–2005.Arab Unified Economic Report. Abu Dhabi, United Arab Emirates.
Arab Monetary Fund. 2003 and 2004. Annual Report. Abu Dhabi.———. 2005. Arab Economic Integration: Challenges and Horizons (in Arabic). Abu Dhabi.Arab Thought Forum. 2002. Arab Cooperation Horizons between Regionalism and Globaliza-
tion (in Arabic). Amman.Corm, G. 1988. The Fragmentation of the Middle East. London: Unwin Hyman-Hutchinson.———. 2003a. “Challenges for Human Development in the Arab Region” (in Arabic).
Paper presented at the First Arab Conference on Human Development, held by the ArabLeague in Cairo, February 24–26, 2003.
———. 2003b. Cooperation and Mobilization of Financial Resources for Sustainable Develop-ment in the Mediterranean Region. United Nations Environment Program (UNEP), BluePlan, Regional Activity Center, Sophia Antipolis, France. www.planbleu.org.
———. 2003c. “The Private Sector’s Role in the Development of Mashreq Countries” (inArabic). Paper presented at a seminar on the private sector’s role in the development ofArab economies, held by the Islamic Development Bank in Cairo, May 2003.
Economic and Social Commission for Western Asia (ESCWA). 2003. Analysis of Performancesand Assessment of Growth and Productivity in the ESCWA Region. First Issue. New York.
———. 2004. Analysis of Performances and Assessment of Growth and Productivity in theESCWA Region. Second Issue. New York.
Inter-Arab Investment Guarantee Corporation. 2005. Annual Report 2004. Kuwait.Islamic Development Bank. 2004. Annual Report for Year 1424 H (2003–2004). Jeddah,
Saudi Arabia.———. 2005. Thirty-One Years in the Service of Development. Economic Policy and Strategic
Planning Department, Islamic Fund Report, June.Mattione, R. P. 1985. OPEC’s Investments and the International Financial System. Brookings.OPEC Fund for International Development. 2004. Arab National and Regional Development
Institutions, 2004 (and 2003): A Profile. Vienna.Organization for Economic Cooperation and Development (OECD). Geographical Distribu-
tion of Financial Flows to Developing Countries. www.oecd.org/cad/stats/sdienligne.Shihata, I. F. I. 1982. The Other Face of OPEC: Financial Assistance to the Third World. London:
Longman.World Economic Forum. 2003. The Arab World Competitiveness Report, 2002–2003. Oxford
University Press.
10101-10_Ch10_Redo.qxd 10/5/06 3:09 PM Page 328

329
Since the early 1990s there has been renewed interest among African nations indeveloping financial and monetary cooperation arrangements that help to
strengthen their own financial institutions and complement their efforts to reachout to a rapidly globalizing world. The new arrangements are intended to helpimprove not only the mobilization of resources, both domestic and foreign, butalso the regulation of institutions in order to avert crises in financial and exchangerate systems. The realization that strong financial systems are important in provid-ing access to greater financial resources from more varied sources, particularly ascountries pursue macroeconomic reforms, is certainly now more widespread.
This new interest is not surprising, considering that one of the most signifi-cant developments in global finance has been the growth in capital flowsbetween industrialized and developing economies, although this has eludedAfrica. Africa’s share of the significantly expanded private capital flows to devel-oping countries averaged only 1.6 percent in the period 1992–2002. There arealso indications that private capital flow to Africa slowed down in the wake ofthe East Asian crisis, even though this was considered to be far less significantthan the slowdown in East Asia (see figures 11-1 and 11-2). These developments
An Analysis of Financial and MonetaryCooperation in Africaernest aryeetey
11
I appreciate the valuable research assistance from Edna Kwami and Christian Ahortor.
10101-11_Ch11_Redo.qxd 10/5/06 3:09 PM Page 329

330 ernest aryeetey
Percent of GDP (constant 2000 U.S. dollars)
Source: Generated from World Bank (2005, CD-ROM).
0
1
2
3
4
5
6
7
1971 1974 1977 1980 1983 1986 1989 1992 1995 1998 2001Year
East Asia and Pacific
Middle East and North Africa
South Asia
Sub-SaharanAfrica
Figure 11-1. Net Private Capital Flows, 1970–2003
Billions of U.S. dollars
Source: Generated from World Bank (2005, CD-ROM).
1971 1974 1977 1980 1983 1986 1989 1992 1995 1998 2001Year
East Asia andPacific
Middle East and North Africa
South AsiaSub-Saharan Africa
0
20
40
60
80
Latin America & Caribbean
Figure 11-2. Net Foreign Direct Investment Inflows to Developing Countries,1970–2002
10101-11_Ch11_Redo.qxd 10/5/06 3:09 PM Page 330

have been partially blamed on the fragility of financial markets in the region,despite financial sector reforms in many countries.1
The interest in greater financial and monetary cooperation for the purposeof enhancing resource flows and regulating such flows is partially linked to theturmoil that the world saw in the 1990s, resulting from the financial crises inAsia and other parts of the world. The crises led to discussions on a new inter-national financial architecture, based on strengthening the surveillance offinancial markets through requirements for greater transparency and informa-tion flow; strengthening financial regulation and supervision; assisting coun-tries to overcome difficulties in implementing international standards andregulations through capacity building; improving liability management by bor-rowers; discouraging dogma in exchange rate determination; sharing responsi-bility for crisis resolution among private creditors, the international community,and debtor authorities; and finally a number of measures for dealing with emer-gencies, including the imposition of reserve requirements on short-term capitalflows, withholding taxes on such short-term inflows, and expanding countryreserves. The new architecture also calls for greater transparency in the func-tions of international financial institutions. While the new measures are gener-ally regarded as essential for bringing sanity to the operations of financialmarkets and limiting the occurrence of crises, it is not clear whether such mea-sures necessarily attract and sustain private capital.
The emergence of European Monetary Union (EMU) has raised considerableinterest in the development of similar arrangements in parts of Africa.2 Thus,beyond the issue of finding their proper place in the international financial archi-tecture, subregional integration bodies have considered financial cooperation aspart of a broader framework for achieving greater regional integration, includinggreater monetary cooperation. In West Africa, for example, the medium- tolong-term aim of the monetary cooperation program, adopted in 1987 by theEconomic Community of West African States (ECOWAS), was to achieve con-vertibility of West African currencies and create a single currency by the year2000. What has been achieved so far is much more modest. The West AfricanClearing House (WACH) has been transformed into the West African MonetaryAgency (WAMA); a credit-guarantee fund for the WAMA clearing and pay-ments mechanism has been introduced; and West African travelers’ checks havebeen issued since late 1998. Further progress in achieving a common currencyhas been constrained by the severe macroeconomic conditions in member states.
financial and monetary cooperation in africa 331
1. See Aryeetey and Senbet (1999).2. Honohan and Lane (2000).
10101-11_Ch11_Redo.qxd 10/5/06 3:09 PM Page 331

332 ernest aryeetey
One objective of the newly established East African Cooperation Agreementis to create a common market, subsequently a monetary union, and ultimately apolitical federation. Achieving these goals is predicated on progress in policyharmonization, macroeconomic stability, and infrastructure development. It hasnot moved as fast as the West African nations on the monetary cooperationfront. The treaty steered clear of customs union and common market issues,having only two articles on safeguards.
Financial and monetary cooperation in southern Africa is dominated by therole of South Africa, which drives both the regional currency areas in the Com-mon Monetary Area (CMA) and the Southern African Development Commu-nity (SADC). Indeed, there are various regional integration initiatives involvingthe southern African region, each with its own action program. The declarationand treaty establishing the SADC in 1992 does not specifically refer to a regionalcurrency area. However, monetary integration is generally considered in theregion to be one way in which economic integration could be furthered, culmi-nating in the creation of a regional monetary union. For the moment, however,monetary integration in SADC may be regarded as a long-term objective, andnot as urgent as in West Africa.
While different parts of Africa may be moving at different speeds towardfinancial and monetary cooperation, there have been a number of assessments ofhow such arrangements relate to similar developments in other parts of theworld. Following the introduction of the euro, Honohan and Lane analyzed theprospects for greater monetary integration in Africa in the wake of EuropeanMonetary Union. They argued that, even though the structural characteristicsof African economies are quite different from those of European economies,much could be gained from monetary cooperation, with the European Unionacting as an external agency of restraint and to promote stability in the financialsector. They conceded, however, that one should not expect too much fromsuch arrangements. They observed that there was little evidence of contagiousattacks on African currencies requiring the coordination of exchange rate poli-cies. Also, economies of scale in the prudential regulation of financial systemscould be achieved through international cooperation, without the need for acommon currency. They also suggested that the same was true of enhanced risk-pooling through the financial system. Finally, their study concludes that thoughthe European Monetary Union has only a marginal impact on the net benefitsof monetary cooperation, the euro would be a natural anchor for any Africanmonetary union, especially if the United Kingdom and the pound sterling wereto join the European Monetary Union, strongly promoting the idea that “the
10101-11_Ch11_Redo.qxd 10/5/06 3:09 PM Page 332

financial and monetary cooperation in africa 333
most likely route to new monetary cooperation in Africa is through a commonpeg to the euro.”3
Considering the various pressures and dynamics for financial and monetarycooperation in Africa, this chapter discusses the scope of such moves and theexperiences of different parts of the region. The aim is to draw attention to fac-tors underlying current initiatives in the region and to assess their prospects forachieving set objectives. The next section discusses various expectations ofregional financial cooperation arrangements. The chapter then discusses Africanexperiences of regional financial and monetary cooperation; this review looks atthe different types of cooperation arrangements and how they are linked to thestructure of financial markets. Finally, the chapter assesses the outcomes ofcooperation efforts and looks at the potential for enhanced financial and mone-tary cooperation in parts of Africa.
Expectations of Financial and Monetary Cooperation in Africa
The discussion of financial and monetary cooperation may be linked to the con-cept of optimal currency areas, even though it is possible to achieve considerablecooperation in the absence of such a union. The literature on optimal currencyareas is relevant because African countries’ search for additional financialresources from global sources and the need to protect themselves against anyadverse side effects makes it important to bolster confidence in their currencies.In the past, the search for confidence boosters often led them to align their cur-rencies with one of the major world currencies, usually the U.S. dollar. However,current understanding of the short- and long-term consequences of monetaryand exchange rate policies has grown remarkably, while there has been a trendtoward greater independence among monetary authorities around the world.This has improved confidence in many currencies, to the extent that the decisionon which currency a country should align with is becoming less influenced byconcerns about confidence. In the absence of concerns about confidence, thethinking regarding currency alignments revolves around the fundamental eco-nomic natures of the different economies. The old saying that “birds of a featherflock together” is today reflected in many of the financial and monetary cooper-ation attempts being made throughout Africa. How can countries with similarinterests support one another? What figure 11-3 shows is that the flow of private
3. Honohan and Lane (2002, p. 1).
10101-11_Ch11_Redo.qxd 10/5/06 3:09 PM Page 333

capital to African countries was patchy in the 1990s, hence the search for a morelevel playing field.
In light of the above expectations, cooperation within a currency union canbe considered from four main angles, depending on the extent to which:
—the cooperation arrangement fosters the development of an agency ofrestraint to the government;
—the arrangement deepens the financial system;—the arrangement reduces the probability of speculative pressures;—the arrangement leads to the international integration of economies.The issue of developing an agency of restraint for African countries first
gained prominence following the work of Collier and Gunning, who suggestedthat many of the past ills of African economies were caused by bad policiesresulting from unrestrained fiscal programs in many countries, and by the factthat no internal agencies existed to restrain governments. They then argued thatan integration arrangement with Northern partners would generate broad gainsfrom global liberalization. Such a union is also expected to enhance the credibil-ity of African economic liberalization and generate the desired investmentinflows. They further argued that integration with the North has incorporatedeffective sanctions, which current African regional arrangements have not. This
Millions of U.S. dollars
Source: Generated from World Bank (2003, CD-ROM).
0
1000
2000
3000
4000
5000
6000
7000
8000 South Africa
Nigeria
KenyaGhana
Côte d'Ivoire
20012000199819901980
Figure 11-3. Net Private Capital Flows, 1980–2001
334 ernest aryeetey
10101-11_Ch11_Redo.qxd 10/5/06 3:09 PM Page 334

4. See Collier and Gunning (1995).
is because they guard against policy reversals.4 In this arrangement, the Euro-pean Union acts as the agency of restraint for African economies. Thus, the dis-cussion has focused largely on external agencies of restraint that may not havesimilar structural characteristics but may have a common interest. This is cer-tainly quite different from an external agency of restraint built around a collec-tive of similar economies.
Regarding the deepening of financial systems, Senbet points to the increasingneed for and interest in linking financial institutions on a regional basis. Thelack of depth in financial systems is shown in table 11-1. Senbet has argued thatone way to address the thinness and illiquidity of African capital markets is forthe various countries to pool resources for regional cooperation in banking andcapital market development. Properly functioning markets can position a coun-try competitively in markets for global capital. This promotes the inflow ofinternational capital and subjects a country to international discipline. Further-more, accessing global markets for capital reduces reliance on foreign aid. Theregionalization of African stock markets is expected to enhance mobilization ofboth domestic and global financial resources to fund regional companies, while
financial and monetary cooperation in africa 335
Table 11-1. Money and Quasi Money (M2) as a Percentage of Gross DomesticProduct, 1980–2001
Country 1980 1990 2000 2001
Benin 17 24 29.9 31.0Botswana 26 26 26.8 31.7Cameroon 21 23 17.3 18.3Côte d’Ivoire 27 29 21.8 24.1Ethiopia n.a. 37 41.3 45.2Ghana 16 13 26.8 17.4Kenya 30 27 43.1 39.3Malawi 18 18 16.8 15.5Mozambique n.a. 40 30.4 30.7Nigeria 24 19 24.8 28.6Senegal 27 23 25.4 26.5South Africa 50 54 56.2 59.7Tanzania n.a. 19 19.2 20.0Uganda 13 6 16.9 16.5Zambia 28 20 24.1 21.0Zimbabwe 31 28 24.8 36.4
Source: World Bank (1998, 2003).n.a. Not available.
10101-11_Ch11_Redo.qxd 10/5/06 3:09 PM Page 335

336 ernest aryeetey
injecting more liquidity into the markets.5 For this to work, the tax treatment ofinvestments must be harmonized, since tax policy is an important incentive ordisincentive for both issuers and investors. Ultimately, regulations and account-ing reporting systems, along with clearance, settlement, and depository systems,should conform to international standards. The establishment of regional secu-rities and exchange commissions, regional self-regulatory organizations, regionalcommittees to promote the harmonization of legal and regulatory schemes, andcoordinated monetary arrangements (for example, via currency zones) are someof the mechanisms for such financial integration.
Honohan and Lane suggest that the regionalization of banking could offersome potential for risk reduction through “better international diversification ofloan portfolios.”6 The internationalization of the banking sector is seen as aneffective way of minimizing vulnerability to financial crises, as multicountrybanks are perceived to be more diversified and less vulnerable to a downturn inany one country.
With respect to containing speculative pressures, it is the view of Honohanand Lane that, as African economies are not on the radar of the world’s holders ofprivate capital, they are not in much danger of being swamped by speculativeattacks. They point out that one reason why African countries may suffer fromcontagion is that the financial system is largely dependent on European banks, afact that ensures that the banks are likely to view different countries in the sameway and that may lead to countries’ being treated similarly even when this isunnecessary. Nevertheless, there is little evidence of exchange rates’ being the sub-ject of contagion. Were the likelihood of contagion to be high, a monetary coop-eration arrangement could be expected to have both negative and positive effects.
There is also little evidence that the creation of monetary cooperation arrange-ments will eventually lead to greater economic and political integration. While anumber of African countries appear to be pursuing greater degrees of financialand monetary cooperation, particularly in West Africa, with a view to accelerat-ing the process of regional integration, the experience of other areas tends to bethe reverse, as in the European Union.
While expectations differ on how much cooperation arrangements mayachieve, there have been only a few technical analyses of the likely outcomes ofsuch arrangements. In analyzing the cost and benefit of the common monetaryarea in South Africa, Grandes applied a two-step econometric approach based onthe theory of generalized purchasing power parity (G-PPP).7 This study empha-
5. Senbet (1998).6. Honohan and Lane (2000, p. 14).7. See Grandes (2003).
10101-11_Ch11_Redo.qxd 10/5/06 3:09 PM Page 336

financial and monetary cooperation in africa 337
sized two aspects of the monetary integration process in southern Africa in thelight of G-PPP theory and determined whether the monetary area, includingBotswana, constituted an optimal currency area in the classic sense. He con-cluded that the area formed an optimal currency area, given the existence ofcommon long-term trends in their bilateral real exchange rates. He also observedthat further macro efficiency gains could be made if the countries went all theway and developed a full monetary union. This was because there was evidenceof similar production structures, higher output correlation, and risk-hedging pos-sibilities, and peripheral countries were able to resort to South Africa’s capitalmarkets and overdraft facilities at the reserve bank. However, the difficulties thathad to be overcome were: a degree of divergence in terms-of-trade shocks, lack ofexport diversification, and the predominance of interindustrial trade patterns.
Other relevant works on optimal currency areas for Africa include a paper byAnyanwu.8 He estimated the macroeconomic effect of monetary unions ontrade and output and suggested that a monetary union is beneficial to bilateraltrade and economic growth. In his study, he used panel economic indicators forindividual West Africa Economic and Monetary Union (WAEMU) members,as well as non-WAEMU ECOWAS counterparts, to determine whether mone-tary union brought price, output, fiscal, and trade stabilization during theperiod 1990–2001. The panel data contained both a time component and across-sectional component, in a bid to determine the magnitude of expectedchange in one country as a result of a unit change in any variable. The resultssuggested that economic growth stability was greater in WAEMU countriesthan in non-WAEMU countries during the analysis period, but the same was notobserved for inflation. Inflation instability in the WAEMU region was greaterthan in the non-WAEMU region. He suggested that more work needed to bedone in the areas of price stability, fiscal discipline, and intraregional trade tomake union meaningful. He also suggested that important benefits from mone-tary union could come through central bank credibility.
African Financial and Monetary Cooperation Experiences
In view of continuing difficulty with financial management in a number ofcountries, despite reform, it is not surprising that countries should seek refugein supranational arrangements. Indeed, arrangements for achieving financialand monetary cooperation among different countries in Africa date back as faras colonial days. These cooperation arrangements were widespread in both the
8. Anyanwu (2003).
10101-11_Ch11_Redo.qxd 10/5/06 3:09 PM Page 337

338 ernest aryeetey
French and British colonies, and much of what we see today is derived fromthose early experiences.
Financial and Monetary Cooperation in West Africa
Financial and monetary cooperation among many ECOWAS countries startedlong before postindependence economic integration efforts began in the sub-region.9 Because the arrangements were originally driven by administrative con-venience and seigniorage considerations,10 exchange rate policy and fiscal restraintwere not an issue. An essential component of colonial economic arrangements wasthe institution of an orderly financial and monetary system. In British WestAfrica, following legislation that effectively established a common currency,11
the monetary policy of the four colonies was administered by the West AfricanCurrency Board (WACB), which was established in 1912 and had its headquartersin London. The currency board was established among others to provide forand to control the supply of currency in the British West African Colonies, Pro-tectorates and Trust Territories. In practice, however, WACB was no more thanan automatic money-exchange organization issuing as much local currency asthe banks wanted to buy for sterling, and vice versa. It definitely did not functionas a monetary authority, and its effectiveness as a currency board has been ques-tioned.12 Uche also argued that the prime motivation for its creation was to facil-itate greater efficiency in the management of the financial affairs of the colonies:“It made economic sense to administer these geographically proximate coloniesthrough one currency board which was headquartered in London. Inter colonyintegration therefore could only have been an incidental benefit of the currencyboard system and not its objective.”13
Commercial banking in British West Africa was also developed along regionalcooperative lines, cutting across country borders. This led to the establishmentof the Bank of British West Africa as the first bank in the region. The bank
9. ECOWAS embraces over 200 million people in all fifteen states of West Africa, ten of whichhave parallel allegiances to other groupings, and (until 1999) Mauritania. Thus the now dormantMano River Union (MRU) embraced Guinea, Liberia, and Sierra Leone; the erstwhile West AfricanEconomic Community (WAEC) comprised Benin, Burkina Faso, Côte d’Ivoire, Mali, Mauritania,Niger, and Senegal; and the remaining six ECOWAS states (Cape Verde, Gambia, Ghana, Guinea-Bissau, Nigeria, and Togo) belonged to no other grouping until Guinea-Bissau and Togo joinedother French-speaking countries and the members of the Mano River Union to establish WAEMUin 1994.
10. Honohan and Lane (2000, p. 6).11. The British colonial currency was pegged to, and fully backed by, the pound sterling, and
the currency board was modeled on the currency arrangements in the British Bank Act of 1844.12. Honohan and Lane (2000).13. Uche (2001, p. 6).
10101-11_Ch11_Redo.qxd 10/5/06 3:09 PM Page 338

financial and monetary cooperation in africa 339
maintained offices in all four colonies, where it adopted similar administrativeand operational policies. Uche argues that the fact that only modest economicexchanges occurred in these colonies is an indicator that the subregional institu-tions were not designed for this purpose.
With political independence in the 1950s and 1960s, the role of the WACBsystem began to change. Governments adopted a more interventionist andnationalistic ideology, and having a national currency became a symbol of sov-ereignty. This led most participants to abandon the currency board arrange-ment. Various countries began to establish their own central banks. The first topull out was Ghana in 1957, followed by Nigeria in 1959. Sierra Leone andGambia, however, operated their own currency board–type arrangement for afew more years, and in 1971 Gambia was the last African country to abandonthe sterling peg. Honohan and Lane have documented the extensive use ofnational central banks to finance government budgets in the early postindepen-dence years, completely unrestrained by the usual regulations of central banks.14
More recent integration efforts in the English-speaking part of the subregionhave been driven by the ECOWAS agenda. Thus, as in other parts of Africa,West Africa’s experience with formal regional integration has been largelydriven by the desire to overcome the constraint of small economic size, whichwas hampering their ability to industrialize efficiently, by extending the logic ofprotected and state-led economic development to a larger number of countries.Indeed, the preamble to the 1975 ECOWAS Treaty noted that the communitywas being created in view of the overriding need to accelerate, foster, andencourage the economic and social development of member states in order toimprove the living standards of their peoples.15 ECOWAS saw regional integra-tion as a multistep process eventually leading to a customs union and later to acommon market integrating states in the West African subregion politically andculturally. Both the original treaty and the subsequently revised 1992 version(complemented by more than thirty protocols and supplementary protocols)include initiatives to promote cooperation and development in industry, trans-port, telecommunications and energy, agriculture, natural resources, commerce,and monetary and financial matters, as well as social and cultural affairs. Theprincipal areas of operation have been:
—expanding the regional market;—harmonizing agricultural and industrial policies through production
integration;
14. Honohan and Lane (2000).15. ECOWAS (1975).
10101-11_Ch11_Redo.qxd 10/5/06 3:09 PM Page 339

340 ernest aryeetey
—ensuring the harmonious integration of physical infrastructure;—promoting monetary and financial integration to facilitate trade;—maintaining regional peace, stability, and security; and—ensuring free movement of persons, including rights of residence and
establishment.Although the creation of a West African Monetary Union has been high on
the ECOWAS agenda since its inception in 1975, owing to the length of timerequired to achieve that objective, some West African countries have consideredforming a second monetary zone, the West African Monetary Zone (WAMZ)under the umbrella of ECOWAS. The creation of WAMZ is seen as a possiblemeans of accelerating the formation of a unified West African Monetary Union.Monetary cooperation is very important to ECOWAS members that are not inthe CFA franc (le franc des Colonies Françaises d’Afrique) zone because theirFrench-speaking counterparts with a common currency are perceived to be rela-tively stable and intraregional trade in that region is also seen to be more exten-sive than in the rest of the ECOWAS region.
A timetable was set for a group of countries—Gambia, Ghana, Nigeria,Guinea, and Sierra Leone—to meet the policy convergence criteria set for theunion. These conditions are economic stability, budgetary discipline, an infla-tion rate of no more than 5 percent, and a healthy foreign exchange reserve;once these were met, it was anticipated that monetary union would be intro-duced by July 2005. There are also ongoing efforts to set up institutions, such asthe convergence council, technical committees, and the West African MonetaryInstitute.
While some believed that the varying socioeconomic conditions that exist inthe different countries will make it difficult for the member countries to attainan inflation level of under 5 percent and also to build enough foreign exchangereserves, others thought that these could be achieved by the end of 2004, thuspaving the way for a common currency (the eco) to be introduced. Table 11-2shows the status of the convergence criteria at the start of the endeavor. All ofthe countries in the second monetary zone satisfied the criterion of central bankfinancing of the budget deficit at the end of 2000, and all of the countries exceptGhana met the inflation conditions. For many, the budget deficit/GDP ratioand the gross foreign currency reserve conditions were difficult to meet. OnlyNigeria succeeded. The countries also found it more difficult to meet the morestringent secondary convergence criteria. By 2004, the countries’ ability toachieve the convergence criteria had worsened significantly. Ogunkola suggestedthat, even if all the convergence criteria were met, it was still doubtful that a sta-
10101-11_Ch11_Redo.qxd 10/5/06 3:09 PM Page 340

16. Ogunkola (2002).17. Collier and Gunning (1995).18. See, for example, Lavergne and Daddieh (1997).
financial and monetary cooperation in africa 341
ble regional currency area would be achieved, given that economic restructuringwas a long-term endeavor.16
Interestingly, even though the planned single currency for the zone is to servethe interests of local people and the business community, there is little publiceducation on the subject. The current flurry of activity to speed up implementa-tion of a common currency for West Africa suggests that this may be an area inwhich policymakers are prepared to relax their opposition to the “variable geom-etry” approach suggested by Collier and Gunning.17 Opposition to the approachwas based on the belief that it ran counter to the principles and ideals of theAfrican Economic Community, namely equality of nations and shared purposein integration. The fear was that variable geometry could lead to the exclusion ofsome countries and to the division of the continent into subregions dominatedby external influences. The creation of WAEMU was seen as one such example.While supporters have referred to it as an attempt to quicken the pace of mone-tary union, opponents consider it more as a tool to serve sectional interests.18
Trends in the CFA franc zone. The early experience of French-speaking WestAfrican countries was not too different from that of their English-speakingcounterparts. Under French colonial rule, the colonies were organized underone colonial administration into a federation. France issued currencies in eachcolony, and these were firmly pegged to the French franc. The currencies werelater consolidated into the CFA franc, issued by the Central Bank for Overseas
Table 11-2. The State of Primary Convergence Criteria, 2000
Budget deficit/ Central bank financing Gross reserves/ GDP ratio, Inflation of budget deficit/ annual Number
excluding grants rate year-1 tax revenue imports of criteriaCountry (percent) (percent) (percent) in months satisfied
Benchmark ≤5 percent <10 percent ≤10 percent ≥3 months
Gambia 3.84 0.80 0.00 2.94 3Ghana 10.74 40.50 8.20 0.53 1Guinea 5.99 7.20 6.20 1.15 2Nigeria 1.88 6.90 0.00 4.30 4Sierra Leone 17.30 −2.75 1.87 1.26 2
Source: West African Monetary Institute.
10101-11_Ch11_Redo.qxd 10/5/06 3:09 PM Page 341

342 ernest aryeetey
France (Caisse Centrale de la France d’Outre Mer). In setting up the franc zonein western Africa, the objectives of the monetary authorities included achieving:convertibility into French francs at a fixed parity; free capital mobility through-out the zone; pooling of most foreign exchange reserves at the French Treasury;the establishment of a common trade and financial policy toward the rest of theworld; and guaranteed convertibility by France through the establishment of“operations accounts” for each colonial central bank with the French Treasury.19
For most of the pre-independence period, many of these colonies remainedonly marginally autonomous within a French West African federation. Thedegree of economic integration among them remained somewhat higher thanamong English-speaking countries in the same region. With political indepen-dence in 1960, however, some barriers to trade and to the movement of factorsof production began to emerge. Manu has argued that several attempts to form apan-francophone body in the region failed largely because France opposed theformation of a strong federation in the region over which it had little influence.20
In the view of Uche, it was “not surprising that all the regional bodies thatemerged in the post-independence francophone zone of the 1960s were eitherloose affiliations or simply non-functional.”21 These included the political asso-ciation called Union Africaine et Malgache (UAM), which was established in1961, and later became the Organisation Commune Africaine et Malgache(OCAM). Membership was open to all French-speaking African countries thathad signed cooperation agreements with France. Uche also describes the UnionDouaniere des Etats de l’Afrique Occidentale (UDAO) as ineffective.22 Thiscustoms union comprised Côte d’Ivoire, Benin, Burkina Faso, Niger, Senegal,Mali, and Mauritania. Their objective was to redistribute the customs dutiesthat the coastal states collected on transit trade with landlocked members.23
Uche, and also Honohan and Lane, have argued that France was not particu-larly interested in promoting intraregional trade among French-speaking WestAfrican countries, and therefore did nothing to facilitate it: “It was more inter-ested in promoting its own trade with the various francophone countries in theregion.”24 And this is seen as having motivated France to support the establish-ment of the Central Bank of West African States (Banque Central des Etats de
19. Boughton (1991, pp. 1–2).20. See Manu (1989).21. Uche (2001, p. 10).22. Uche (1999).23. See Bach (1983).24. Uche (2001, p. 10); see also Honohan and Lane (2000).
10101-11_Ch11_Redo.qxd 10/5/06 3:09 PM Page 342

financial and monetary cooperation in africa 343
l’Afrique de l’Ouest, BCEAO) in 1962. The creation of BCEAO eliminatedcurrency restrictions in the trade of French-speaking countries with France.
The regional central bank for the Central African Zone is the Bank for CentralAfrican States (Banque des Etats de l’Afrique Centrale, BEAC). It was establishedin 1972 with the sole purpose of issuing currency. Like BCEAO (the central bankfor the eight West African countries), BEAC was to maintain a fixed exchangerate with the French franc and manage monetary policy, consisting of creditcontrols, while currency convertibility was, and still is, guaranteed through an“operations account” with the French Treasury.
Strikingly, all three integration organizations in West Africa (English- andFrench-speaking) have promoted quite similar projects to advance their objec-tives, including the establishment of institutions for human development, agri-cultural and industrial development, and monetary cooperation. Despite acertain commonality of purpose—liberalizing intra-area trade and achievingother forms of cooperation—there has been very little effective coordinationamong them. Considering the significant overlap in both goals and activities, it issurprising that member countries found it necessary to maintain a multiplicity ofinstitutions. Explanations include the “French factor” (that is, the desire of suc-cessive Paris governments to support organizations that grouped their formercolonies in the region), as well as a lack of confidence by individual countries inthe capacity of such institutions to protect their interests.25 In a sense, it hasbeen a case of seeking double assurance without paying a higher premium.
In fact, recent developments in financial and monetary cooperation are an out-come of recent trade integration experiences. In the 1980s, the survival of CEAOas a regional trade body had come under serious threat, largely as a consequenceof the malfunctioning of existing trade arrangements. The institution of a prefer-ential regional cooperation tax on manufactured exports from member countriesworked largely to the advantage of Côte d’Ivoire and Senegal. Since the compen-sation mechanism did not work properly, the loss of revenue from member stateswas considered to be a serious setback to the integration effort. The absence ofcomplementary industrial structures ensured that the number of industrial prod-ucts registered under the regional cooperation tax hardly changed. The poorfunctioning of the system of preferences and the inherent loss of revenue to sev-eral members led to difficult fiscal situations in those states. By 1991, arrears tothe secretariat and to the compensation fund amounted to 45.5 billion CFAfrancs, which was four times as much as the institutions’ combined budgets.26
25. Bundu (1997).26. Bach (1997, p. 87).
10101-11_Ch11_Redo.qxd 10/5/06 3:09 PM Page 343

344 ernest aryeetey
Governments used the banking system to finance these deficits. By the mid-1980s, the banking system had almost ground to a halt owing to the nature ofits institutional mechanisms. Most of the banks were joint ventures betweennational governments and one of four major banks based in France. Key seniormanagement was provided by French nationals seconded from the parent banksin France. Although deposit mobilization has been low in the franc zone, fundswere secured from the two central banks, the Central Bank of West AfricanStates and the Bank for Central African States. For years, governments in severalmember states directly or indirectly pushed the banks into lending to state-owned enterprises, or to regional and political groupings, or to some of the gov-ernments’ own suppliers, who never paid. Although the central banks were freedby statute from any fiscal pressure, they were forced to lend through commercialbanks to relieve fiscal needs. The two central banks acted as though they wereagents of the fiscal authorities and refinanced politically directed or govern-ment-inspired bank lending that was never paid back. The majority of commer-cial banks failed because they issued bad loans, although some were rescuedlater. These and other problems contributed to the banking crises in the CFAzone in the 1980s. Thus, by 1993 almost all of the countries in the zone were indeep recession. Capital movements were blocked, and it became difficult toeffect current international payments.
The fiscal problems of member states continued, alongside growing pressurefrom international financial institutions to carry out macroeconomic reforms inthe early 1990s and forge a joint program of activities to address the economiccrises without necessarily having to devalue the CFA franc. The resulting pro-grams for budgetary and fiscal policy harmonization led to the institution ofseveral arrangements for regional banking commissions and the harmonizationof legislative and regulatory frameworks to govern economic and social activi-ties, including social insurance and business law. The plan was to go further anddevelop a single financial market, a regional stock exchange, and a free-tradezone. Thus the preparatory work for launching WAEMU took place between1991 and 1994. By 1994 a number of the institutions that had been agreed toin Ouagadougou in 1991 had been established and had become operational, butthe idea of avoiding devaluation had to be abandoned in view of continuingeconomic crises and increasing pressure from multilateral development agencies.Thus, the 50 percent devaluation announcement was made on the eve of themember states’ meeting, in Dakar in January 1994, to formalize into a treatyinstitutional developments over the previous three years.
A regional financial market was created under the auspices of WAEMU tocomply with two main objectives: all actors in the regional financial market must
10101-11_Ch11_Redo.qxd 10/5/06 3:09 PM Page 344

27. Zafar and Kubota (2003).
financial and monetary cooperation in africa 345
have equal opportunities where they are located; and international standardswith respect to the settlement/delivery schedule, simultaneity of securities/cashexchanges, and the distinction between operational, regulatory, and supervisoryfunctions must be complied with. To address these needs, the regional stockexchange (Bourse Régionale des Valeurs Mobilières, BRVM) was established inSeptember 1998, and its eight regional branches were interconnected to theheadquarters and other institutions. Also, the Regional Savings and Capital Mar-ket Board (Conseil Regional de l’Epargne Publique et des Marché Financiers)was established and put in charge of supervising the regional stock exchange.
The regional stock exchange has two main components: a primary market thatdeals with financial securities and a secondary market that deals with the liquidityand mobility of securities already issued. The main products traded in the marketare bonds, debts, and negotiable debt instruments. The exchange is a private lim-ited company with a capital base of U.S.$4.84 million, 87 percent of which isowned by private businesspeople in the region and 13 percent by the memberstates. The regional exchange has thirty-eight listed companies transferred fromthe Abidjan stock exchange, with Ivorian companies dominating. The financialmarket project was made possible in the WAEMU region because there wasalready a highly integrated monetary and financial union built on harmonizedmonetary and banking regulations, successful restructuring of the union’s finan-cial sector, and a sustained effort to restructure the macroeconomic framework.
The formation of EMU was a significant factor in encouraging the CFA zonecountries to maintain their arrangement at the time of the 1994 devaluation.The legacy of the French colonial system appears to have survived much longerafter independence than the British colonial system, and two franc-based mone-tary unions in West Africa are still functioning, with most of the original mem-bers remaining participants. Both BEAC and BCEAO are still in existence andcontinue to develop their programs and instruments of monetary policy, finan-cial sector integration, and capital market institutions. After the devaluation,monetary policy moved from direct controls to market-based instruments, tak-ing account of all relevant domestic and macroeconomic indicators. DirectBEAC advances to governments were phased out in 2004, when the first Trea-sury bills by governments were issued.27 So far, monetary policy has been effec-tive in pushing inflation down in the subregion and interest rates are set by thecentral bank.
10101-11_Ch11_Redo.qxd 10/5/06 3:09 PM Page 345

346 ernest aryeetey
Financial and Monetary Cooperation in Eastern and Southern Africa
East Africa had a currency board very similar to the one in English-speakingWest Africa. In East Africa, the three core members retained the currency boardarrangement, with a common currency, until five years after independence. Theold monetary cooperation group (the East Africa Community, which existedfrom 1960 to 1977) was made up of Kenya, Tanzania, and Uganda. In the oldcurrency area, there was free circulation of the national currencies at par andcommon external capital controls, as well as free movement of capital within theunion. However, the new East Africa Community was inaugurated in January2001 to replace the one that collapsed in 1977, with the long-term objective offorming a monetary union. Articles 94 and 97 of the treaty establishing the newunion relate to monetary cooperation and financial matters and maintaining theconvertibility of the various currencies. The new EAC is made up of the samemembers as the old one, with the main objective being to establish a monetaryunion and a unit of account for the community, known as the East AfricanCurrency Unit.28
The Rand Monetary Area (RMA) dates back to 1910, when the SouthAfrican Customs Union (SACU) came into being. It was not established for-mally until 1974, with South Africa, Lesotho, and Swaziland signing an agree-ment on clearing arrangements, bank supervision, and the development of aforward exchange market. Botswana withdrew from the rand zone in 1974before the agreement was signed. The RMA was transformed into a commonmonetary area in 1986.
Another cooperation arrangement worthy of note is the Southern AfricanDevelopment Community (SADC). This regional cooperation group was formedin the 1980s by nine countries in southern Africa, with the main objective ofmaking their economies less dependent on South Africa. Following indepen-dence, Namibia joined the union in 1990, together with South Africa, after thedemocratic election that led to the formation of a government of national unityin 1994. SADC objectives include poverty alleviation and the maximum utiliza-tion of regional resources.
The SADC financial and investment sector was formally established in 1995.This common currency area includes South Africa, Lesotho, Namibia, andSwaziland. South Africa was given responsibility for the management and devel-opment of financial and investment protocol. There is a council of finance min-isters under the chairmanship of the South African minister of finance, whichmeets from time to time to give guidance to any program that will ensure closer
28. Ogunkola (2002).
10101-11_Ch11_Redo.qxd 10/5/06 3:09 PM Page 346

financial and monetary cooperation in africa 347
financial cooperation among the participating countries. There is also a com-mittee of treasury officials and a committee of governors of central banks andtheir officials with specific duties. A number of technical subcommittees andworking groups are also drawn from among the officials of SADC central banksto work on specific projects. The committee of governors is required to encour-age the establishment of sound and well-managed privately owned bankinginstitutions to provide financial services in a competitive environment.
The central banks’ responsibility has been restricted to the creation andmaintenance of a stable financial environment conducive to sustainable eco-nomic growth and, in addition, they must protect the value of the currency.The central bank governors are required to work jointly to develop interlinkablenational payments and clearing settlements systems for financial transactionscompatible with national systems, so as to provide more effective cross-bordersettlement of interregional financial transactions. There is also a focus on capitalmarket development in the subregion.
A statistical database for essential economic time series from the twelve SADCcountries is now available at the South African Reserve Bank to help the gover-nors gain a better understanding of the regional economic environment andlearn from one another’s experiences. A data bank has also been established toprovide information on issues relating to legislation, relationships with gover-nors, functions and responsibilities of management, policy objectives, monetarypolicy procedures and instruments, and administrative structures for each centralbank. To standardize bank regulation and supervision in the region, the centralbanks have formed an eastern and southern African banking supervisors’ groupfor this purpose.
Of the twelve SADC members, South Africa is the most advanced in theregion. In the rand zone, Lesotho, Namibia, and Swaziland hold their curren-cies at par with the South African rand, and the central banks in these countriesfunction as a currency board by issuing currencies that are backed by 100 percentforeign assets. The rand circulates alongside local currencies, thus generatingseigniorage opportunities for South Africa.
The SADC cooperation system is judged to have benefited its member coun-tries.29 There is relative macroeconomic stability in the region, reflected by lowinflation rates. In many countries, there is also clear evidence of convergence offiscal and monetary policies.
29. Uche (1999).
10101-11_Ch11_Redo.qxd 10/5/06 3:09 PM Page 347

30. Honohan and Lane (2000, p. 6).
348 ernest aryeetey
An Assessment of Current Financial and Monetary Cooperation Arrangements
This section focuses on the experiences of the CFA zone and draws on thoseexperiences for lessons for the rest of the region.
The CFA Zone Experience and Its Relevance for the Rest of Africa
Honohan and Lane suggest that, even though the underlying structure estab-lished for the franc zone in West and Central Africa appeared to be solid, it hadproblems:
The underlying economic philosophy of the franc zone arrangements wasalways that of an open and competitive market. . . . The institutionalarrangements are strikingly modern in appearance. In particular there havebeen multinational central banks (which are thus independent of any onenational government), rules constraining monetary financing of fiscaldeficits, an open capital account, widespread presence of foreign-ownedbanks and the lowest inflation rates in Africa. From some points of view theregime has looked like a precursor to EMU with its single currency, its free-dom of capital movements and its multinational central bank. However,any attempt to draw conclusions for the prospects of wider African mone-tary unions must pause to consider the 1980s crisis of the CFA zone.30
It is clear that, until the mid-1980s, the economic performance of the franczone countries was acceptable, and the fixed exchange rate with France appearedto remove macroeconomic uncertainty and encourage external investment. Therelatively high growth rates that were achieved and stable CFA franc notesensured that the subregion outshone such unstable countries as Ghana andNigeria with inconvertible local currencies. And because some parts of the franczone banking system appeared to function properly, the zone received substan-tial deposits of flight capital from its neighbors.
Honohan and Lane wrote that the inflexibility and brittle character of thesystem’s institutional mechanisms proved to be its downfall, bringing the func-tioning of the banking system almost to a halt in several of the countries fromthe mid-1980s. This led to the deep recession that they experienced all the waythrough 1993. A parallel market in the CFA franc developed, and capital move-ments were blocked, while it became difficult to effect current internationalpayments. As we saw earlier, a large number of the banks failed, even though
10101-11_Ch11_Redo.qxd 10/5/06 3:09 PM Page 348

31. Honohan and Lane (2000, p. 7).32. Honohan and Lane (2000, p. 8).
financial and monetary cooperation in africa 349
some were recapitalized: “Depositors in some banks had gone without access totheir funds for years. The banks that continued to function now tended to behighly selective in their clientele, both on the deposit and on the lending side.Interbank markets were operating on a very limited basis. Having lost heavilyfrom the collapse of debtor banks, the central banks were close to being unableto cover their operating expenses.”31
It was these problems that eventually led to devaluation in 1994. However,much of the blame for the situation is placed on the behavior of governments,which used the banking system to finance projects in which they had an inter-est, albeit indirectly. It is believed that the banks agreed to make the kinds ofloans that led to their collapse because of an unusual relationship that had devel-oped between the governments and the French ownership of many of the banks:
Most were joint ventures between the national Governments and one offour major French-based banks; sometimes the Government was the major-ity shareholder, sometimes not. In either case, the key senior managementwas provided by French nationals seconded from the parent banks inFrance. However, the objective of the French shareholders is unlikely tohave been solely profit maximization. They had other interests, includingthe commercial interests in Africa of their French customers. They willnot have been unaware of the wider political agenda of the French Gov-ernment, which was owner of the French banks for at least part of theperiod, and a strong influence at all times.32
In the end, even though the central banks were apparently freed by statute fromany fiscal pressure, they bowed to indirect pressure to lend through banks torelieve fiscal needs. Recapitalizing them through the central bank led to theeventual collapse of the system.
Honohan and Lane have argued that this particular rules-based system didnot guarantee sound policy since it encouraged a false sense of security. Therules did not guarantee the correct incentives, and their rigidity induced a bank-ing practice that subordinated both commercial and central banking to fiscalpressures. The three rules that they judged to be problematic were:
—the exchange rate rule, which “could not cope with the procyclical publicsector wage policy and the optimistic policy of ratcheting official purchasingprices for the all-important cash crops (especially coffee and cocoa) to the high-est figures attained to date”;
10101-11_Ch11_Redo.qxd 10/5/06 3:09 PM Page 349

33. Honohan and Lane (2000, p. 9).34. Honohan and Lane (2000, p. 10).
350 ernest aryeetey
—the rule that the banking sector could not lend the government more thana fraction of its annual revenue needs because it “merely diverted the pressuresinto indirect borrowing through public enterprises and other associated bodiesand through government payments arrears”;
—The rule that each national government was responsible to the centralbank for the debts of any insolvent bank because it encouraged “insouciantlending by the central bank to unsound banks.”33
It is apparent that the rules could not operate within a political environmentthat was not being adapted quickly enough for the rigid arrangements. Theneed to ensure consistency of macroeconomic and financial fundamentals witha fixed exchange rate system was not given the appropriate importance: “Thissorry story of implosion of the CFA zone financial system, culminating in themajor devaluation of January 1994, serves as a cautionary tale for fans of mone-tary unions and, indeed, of rules-based monetary systems in general. The limita-tions of such rules must be recognized whether they be the specific rules adoptedin the CFA zone, or those of a currency board.”34
The CFA zone is reckoned to have recovered substantially from the troubles ofthe 1980s, following the devaluation and a restructuring of the zone’s regulatoryarrangements. Following the banking crisis in the zone, some of the new institu-tional arrangements adopted include the centralization of responsibility forbank supervision in two regional banking control commissions. This provides anew multinational “agency of restraint” that fills a gap in the previous institu-tional arrangements, in contrast to European Monetary Union, where nationalcentral banks are still responsible for regulating commercial banks.
The CFA is now pegged to the euro, and this is seen as providing greaternominal and real exchange rate stability. Honohan and Lane are not certain thatthere are obvious lessons to be drawn from the current arrangements for otherAfrican countries. They query whether EMU, together with the new focus onthe use of a common currency as an insulator against contagious or correlatedcapital movements and on the use of regional financial authorities as a quasi-external discipline on national financial policy, points to any increased likeli-hood of additional cooperative arrangements.
Scope for Developing African Monetary Unions
There is no doubt that EMU has inspired a lot of discussion concerning the cre-ation of monetary unions among groups of African countries. What is not yet
10101-11_Ch11_Redo.qxd 10/5/06 3:09 PM Page 350
financial and monetary cooperation in africa 351
clear is the extent to which they will seek to develop external agencies of restraint,as the current CFA franc zone has done. Honohan and Lane suggest that mone-tary union may be viewed in a number of ways: as an agency of restraint on gov-ernments; as a bulwark against contagious speculation; as a way of achievingeconomies of scale in the financial sector; and, finally, in a traditional role as anoptimum currency area (OCA), involving arguments relating to the pattern oftrade and to the degree of factor mobility.
Monetary union as an external agency of restraint. There are two elements tothis issue: political considerations and seigniorage. While, for many years, therehas been little interest in delegating the conduct of monetary policy to an exter-nal agency, there is a clear indication from West Africa that countries are nowmore willing to entrust that role to a supranational body.
The creation of the second monetary zone and the agreement on convergencecriteria both point to renewed interest in developing an external agency ofrestraint. However, Ogunkola does not consider the various elements for success-ful optimal currency areas to be present, particularly in view of wide divergencesin production outcomes and potential. There is presumed to be little inter-dependence among the nations, and they face large common and idiosyncraticshocks. And it is this that will make it difficult for individual countries to entrustthe preparation of monetary and exchange rate policies to external agencies, par-ticularly in the face of mounting adverse shocks to their economies. Ogunkolasees the fact that countries are struggling to attain the convergence criteria asevidence of that difficulty.35
However, Honohan and Lane suggest that “the record of macroeconomicmismanagement in many African countries means that there is a strong case fordelegation of monetary policy, if a suitable supranational monetary authorityexists. Put differently, since policymaking resources are scarce in Africa, it maymake sense to ‘outsource’ monetary policy as one possible resolution to thesearch for ‘agencies of restraint.’ ”36
The major problem remains that a supranational monetary authority mayrequire some degree of political integration if it is to be accepted as democrati-cally accountable. Political integration may also be desirable to minimize the“hold-up” problem in setting monetary policy. And that is missing in the regionat present, making it difficult to be very optimistic about the outcomes. Thecurrent initiative is to use monetary union to spearhead regional economic coop-eration within a region where economic cooperation has so far been limited.
35. Ogunkola (2002).36. Honohan and Lane (2000, p. 11).
10101-11_Ch11_Redo.qxd 10/5/06 3:09 PM Page 351

352 ernest aryeetey
Honohan and Lane suggest that, if there were enough resources to supportmonetary union, it might lead slowly to greater political integration: “Thispolitical and administrative process would likely be a more potent force for eco-nomic integration than the direct effect of achieving exchange rate stabilityacross African borders.”37
On the question of seigniorage, it is the fear of loss of seigniorage revenuethat might deter countries from abdicating responsibility for monetary policy.And many African countries rely extensively on seigniorage, amounting to anaverage of around 1.5 percent of the region’s GDP. It is obvious that the coun-tries will have to work out appropriate alternatives to high seigniorage and findways of distributing these equitably.
Deepening financial sectors and fighting contagion. There are opportunities forimproving the poorly developed banking and financial sectors. A fundamentalconcern for countries contemplating membership of a monetary union or a cur-rency area is whether it leads to greater financial resources for development. Thisis linked to the extent to which it makes available the rest of the world’s resources,namely the benefits of globalization. As seen earlier, Africa has been left out of themassive international capital that flowed to developing economies when the worldeconomy opened up in the 1980s. The good news is that it was also bypassed bythe global financial crisis associated with such massive capital flows. In its globalmarginalization, Africa stands to lose out on the potential benefits of globaliza-tion, although it is presumed to escape the risks of globalization.
Successful globalization is characterized by mutual gains for both globalinvestors and emerging economies in Africa. While benefiting from globalization,Africa should also contribute to improving the global risk-reward ratio faced byglobal investors. Those international investors must evaluate their investmentportfolios on the basis of the global risk-reward ratio. In this regard, the benefitsfrom globalization include the following:
—Diversification benefits: Africa’s competitiveness in attracting internationalcapital depends on its role in improving the global risk-reward ratio faced byinternational investors. The potential benefits from international portfoliodiversification stem fundamentally from diversity in countries’ economic cycles.For instance, a combined strategy of investment in both non–United Statesequities and the U.S. market generally dominates investment in the U.S. marketalone. Can Africa contribute to the emerging markets portfolio, and ultimatelyto the global portfolio? To the extent that Africa’s economies do not move intandem with those of the advanced economies, there are opportunities for inter-
37. Honohan and Lane (2000, p. 12).
10101-11_Ch11_Redo.qxd 10/5/06 3:09 PM Page 352

financial and monetary cooperation in africa 353
national investors to benefit from the inclusion of African financial markets inthe global portfolio.
—Bargains in Africa and stock return potential: Indicators point to grossundercapitalization of Africa, suggesting potential bargains. Very low price-earnings multiples are currently observed in African stock markets, suggestingthat there is significant undervaluation, given an acceptable range of emergingmarket risks. Also, the recent performance of African stock markets is encourag-ing and indicative of the potential for high returns.38
There are considerable benefits to Africa as a recipient of global capital, withintegration into the global economy, or both and these include the following:
—Access to a diversified source of external finance: Access to a diversifiedsource of external capital lessens heavy reliance on sovereign debt and its atten-dant crisis, and on official flows, which are already shrinking.
—Reduction in the cost of capital: Globalization allows for local securitiesmarket risks to be shared internationally. Global risk sharing leads to a reduc-tion in the local cost of capital.39 In other words, greater risk sharing by inter-national investors leads to a reduction in the cost of capital for local firms, sincerisks of local shares are shared globally.
—Discipline and exposure to best practices: Globalization enhances the cred-ibility of domestic capital market institutions, as foreign investors demandworld-class services. Governments will be under greater pressure to strengthenthe rule of law, enforce contracts, and increase the growth of available informa-tion in response to international investor demands.
—Reversal of flight capital: Evidence from other regions, such as LatinAmerica and East Asia, suggests that globalization of local markets leads tolarge reversals of flight capital. Given that Africa stands within the top tier ofregions in terms of flight capital stock per GDP, there is potential for a signifi-cant reversal of flight capital if the region is sufficiently integrated into theglobal economy.
The other side of the coin is that globalization engenders considerable risks,with the associated crisis, as witnessed in East Asia. The global risks stemmingfrom volatility in global financial markets, the large unfavorable fluctuations ininternational exchange rates, and large unfavorable swings in international inter-est rates manifest themselves in large unfavorable swings in international capitalflows. For instance, countries that experienced large capital flows suffered com-mensurately large and sudden outflows. The sudden and massive collapse of
38. Senbet (1998).39. Errunza, Senbet, and Hogan (1998).
10101-11_Ch11_Redo.qxd 10/5/06 3:09 PM Page 353

40. See Jefferis and Mbekewani (2001).
354 ernest aryeetey
capital inflows can be enormously costly. Not only will there be sudden with-drawals of deposits, leading to a credit crunch in the economy; in addition,creditors will be unwilling to supply short-term credit even for a liquidity crisis,and there will be default and contagion of the type experienced in East Asia (andearlier in Mexico). The damage associated with the financial crisis was evidentin the dramatic declines in the asset and currency values of East Asia.
Capital markets are relatively new to most of Africa. In West Africa, forexample, with the exception of Nigeria and Côte d’Ivoire, other stock marketswere set up only in the past few years. They may be seen as a natural outgrowthof the financial reforms that have taken place in these countries.40 Internationalinvestors have begun paying attention to Africa, and a total of eighteen special-ized investment funds have been established since 1993, which are now tradingin New York and Europe. Regionalization is emerging as a way of addressingthe thinness and scarce liquidity problem of African capital markets. In particu-lar, the Abidjan stock market has emerged as an anchor for the CFA countries,with an increased potential to serve other countries in West Africa. This efforthas encouraged discussion between Ghana and Nigeria on setting up anothersubregional exchange for English-speaking West Africa. The Nigerian StockExchange and the Ghana Stock Exchange signed a memorandum of under-standing in 1999 to ascertain the feasibility of a regionalized exchange. Ironi-cally, however, while this discussion is taking place, a new effort is under way tostart a second Nigerian exchange in Abuja. The establishment of regional securi-ties and exchange commissions, self-regulatory organizations, and committeesto promote harmonization of legal and regulatory schemes are among the mech-anisms under discussion. The tax treatment of investments has to be harmo-nized, since tax policy is an important incentive or disincentive for both issuersand investors. Ultimately, regulations and accounting reporting systems, alongwith clearance, settlement, and depository systems, should conform to inter-national standards.
Summary and Concluding Remarks
There is no doubt that there is still a long way to go before financial and mone-tary cooperation can be firmly established in Africa. Since the introduction of theeuro, the perceived pressure on African governments to set up similar arrange-ments has increased, despite the fact that institutional and other structural con-ditions are quite different. In parts of Africa, there is certainly a tendency to
10101-11_Ch11_Redo.qxd 10/5/06 3:09 PM Page 354

financial and monetary cooperation in africa 355
view financial and monetary integration as the best possibility for bringingabout faster political integration
The current struggles of the West African Monetary Zone to achieve conver-gence give ample indication of the difficulties facing the region as it seeks toachieve financial and monetary cooperation. On the other hand, the fact thatthe CFA franc appears to have achieved some stability since the implementationof reforms and pegging to the euro suggests that having an external anchormight help. In any case, this experience raises question as to the prospects forusing an externally based peg to achieve financial cooperation among any groupof African countries.
References
Anyanwu, J. C. 2003. “Estimating the Macroeconomic Effects of Monetary Unions: TheCase of Trade and Output.” African Development Review 15, nos. 2–3: 126–45.
Aryeetey, E., and L. Senbet. 1999. “Essential Financial Market Reforms in Africa.” Back-ground Paper for “Can Africa Claim the 21st Century?” Washington: World Bank.
Bach, D. C. 1983. “The Politics of West African Economic Co-Operation: C.E.A.O. andE.C.O.W.A.S.” Journal of Modern African Studies 21, no. 4: 605–23.
———. 1997. “Institutional Crisis and the Search for New Models.” In Regional Integrationand Cooperation in West Africa, A Multidimensional Perspective, edited by R. Lavergne.Ottawa: Africa World Press and International Development Research Centre.
Badiane, O. 1997. “National Policies as Impediments to Regional Economic Integration.”In Regional Integration and Cooperation in West Africa, A Multidimensional Perspective,edited by R. Lavergne. Ottawa: Africa World Press and International DevelopmentResearch Centre.
Boughton, J. M. 1991. “The CFA Franc Zone: Currency Union and Monetary Standard.”Working Paper WP/91/133. Washington: International Monetary Fund.
Bundu, A. 1997. “ECOWAS and the Future of Regional Integration in West Africa.” InRegional Integration and Cooperation in West Africa, A Multidimensional Perspective, editedby R. Lavergne. Ottawa: Africa World Press and International Development ResearchCentre.
Collier, P., and J. W. Gunning. 1995. “Trade Policy and Regional Integration: Implicationsfor the Relations between Europe and Africa.” World Economy 18, no. 3: 387–409.
Economic Community of West African States (ECOWAS). 1975. Treaty of the EconomicCommunity of West African States. Lagos.
Errunza, V., L. W. Senbet, and K. Hogan. 1998. “The Pricing of Country Funds fromEmerging Markets: Theory and Evidence.” International Journal of Theoretical and AppliedFinance 1, no.1: 111–43.
Grandes, M. 2003. “South Africa’s Monetary Area: An Optimum Currency Area: WhatCosts, Which Benefits?” DELTA Working Paper. Paris: Ecole des Hautes Etudes en Sci-ences Sociales/Ecole Normale Supérieure.
Honohan, P., and P. R. Lane. 2000. “Will the Euro Trigger More Monetary Union inAfrica?” UNU WIDER Working Paper 176. Helsinki.
10101-11_Ch11_Redo.qxd 10/5/06 3:09 PM Page 355

356 ernest aryeetey
Jefferis, K., and K. Mbekewani. 2001. “Laws, Institutions and Capital Markets Integration inSub-Saharan Africa.” Technical Paper. Paris: OECD Development Centre.
Lavergne, R., and C. K. Daddieh. 1997. “Donor Perspectives.” In Regional Integration andCooperation in West Africa, A Multidimensional Perspective, edited by R. Lavergne. Ottawa:Africa World Press and International Development Research Centre.
Manu, M. 1989. “The Future of ECOWAS.” Nigerian Institute of International Affairs Lec-ture Series 49. Lagos.
Ogunkola, E. O. 2002. “The Second Monetary Zone in West Africa and the Future of aSingle Monetary Zone in Sub-Saharan Africa.” Department of Economics, University ofLesotho.
Senbet, L. W. 1998. “Globalization of African Financial Markets.” Paper prepared for theUnited Nations University and AERC conference “Africa and Asia in the Global Econ-omy.” Tokyo, August.
Uche, C. U. 1999. “Foreign Banks, Africans and Credit in Colonial Nigeria, c.1890–1912.”Economic History Review 52, no. 4: 669–91.
———. 2001. “The Politics of Monetary Sector Cooperation among the Economic Com-munity of West African States’ Members.” Department of Banking and Finance, Univer-sity of Nigeria, Enugu.
World Bank, 1998, 2003, 2005. World Development Indicators. Washington.Zafar, A., and K. Kubota. 2003. “Regional Integration in Central Africa: Key Issues.” Africa
Region Working Paper Series 52. World Bank.
10101-11_Ch11_Redo.qxd 10/5/06 3:09 PM Page 356

Ernest AryeeteyUniversity of Ghana
Georges CormSaint Joseph University, Beirut
Roy CulpeperNorth-South Institute, Ottawa
Ana Teresa Fuzzo de LimaInstitute of Development Studies,University of Sussex
Stephany Griffith-JonesInstitute of Development Studies,University of Sussex
Julia LeungHong Kong Monetary Authority
José Luis MachineaECLAC
José Antonio Ocampo, Department of Economic and Social Affairs, United Nations
Jae Ha ParkKorea Institute of Finance
Yung Chul ParkKorea University
Fernando PradaFORO Nacional/Internacional, Lima
Guillermo RozenwurcelNational University of San Martín,Argentina
Contributors
357
10101-12_Contributors.qxd 10/6/06 1:31 PM Page 357

358 contributors
Francisco SagastiFORO Nacional/Internacional, Programa Agenda: Peru
Kanit SangsubhanFiscal Policy Research Institute of Thailand
Alfred SteinherrEuropean Investment Bank, Luxembourg and Free University of Bozen-Bolzano
Daniel TitelmanECLAC
Charles WyploszGraduate Institute of InternationalStudies, Geneva, and Center for Economic Policy Research
10101-12_Contributors.qxd 10/6/06 1:31 PM Page 358

359
Index
AAAID. See Arab Authority for AgriculturalInvestment and Development
ABEDA. See Arab Bank for EconomicDevelopment in Africa
ABF. See Asian Bond FundABMI. See Asian Bond Market InitiativeAC. See Andean CommunityACD (Asian Cooperative Dialogue), 284ADC. See Andean Development
CorporationAfDB. See African Development BankAfDF. See African Development FundAFDM+3. See ASEAN+3AFESD. See Arab Fund for Economic and
Social DevelopmentAfrica: aid projections for, 41; Arab develop-
ment financing for, 14, 80, 292, 295,304, 305, 312; and colonialism, 11,338–39, 341–43, 345; cooperationarrangements in, 348–54; creditworthycountries, lack of, 53–54; EIB lendingto, 160; expectations of cooperation in,333–37; external agencies of restraint
on, 335; financial and monetary cooper-ation in, 329–56; globalization’s effecton, 352–54; least developed countries,prevalence of, 51–52; lessons from,54–58, 337–47; monetary union, de-velopment of, 350–54; political integra-tion in, 351–52; regional cooperation,challenges confronting, 53–54; riskreduction from regionalized banking,336; tax policy, need to harmonize, 336;trade integration, 12. See also specificcountries, regions, and institutions
African Development Bank (AfDB): alloca-tion of resources by, 102; concessionallending of, 16, 80; financial standing of,90, 93; graduation policies of, 86–88;history of, 12–13, 35, 44; industrialcountry membership in, 44; influence ofNigeria, 98; infrastructure operations of,20, 85; loan conditions and costs, 94;social sector operations, 84; transport,energy, and environment programs, 85
African Development Bank Group, 54
10101-13_Index.qxd 10/13/06 5:48 PM Page 359

African Development Fund (AfDF), 44, 86,94, 96
African Union (AU), 45, 57–58AFTA (ASEAN Free Trade Area), 252–55AGFUND (Arab Gulf Program for United
Nations Development Organizations),313
Aghadeer Declaration, 294Agreement on Reciprocal Payments and
Credits (1965), 201Agricultural funding from Arab League, 296,
312ALADI (Reciprocal Payments and Credits
Agreement of the Latin American Inte-gration Association), 60
Algeria: AFESD membership, 308; debtrescheduling of, 307–08; project financ-ing from Islamic Development Bank to,310; Union of Arab Maghreb member-ship, 291
AMF. See Arab Monetary FundAndean Community (AC): borrowing credi-
bility of, 173–74; and cyclical synchro-nism, 172; and exchange rate volatility,173; and FLAR financing in 1996 and1999, 191; and foreign debt crisis of1980s, 200; rationale for, 30–31; sharecapital and sense of ownership in, 217;and trade interdependence, 165
Andean Development Corporation (CAF):allocation of resources by, 103; creationand experience of, 59–61, 201, 206;financing provided by, 206, 208; infra-structure projects of, 80; investment rat-ing of, 214; loan approvals (1983–1990),202; as multilateral development bank,35; relative importance of, 15, 209; termand sectoral allocation of, 212
Andean Reserve Fund (FAR), 202Anguilla, 208Antigua, 208Anyanwu, J. C., 337AOAD (Arab Organization for Agricultural
Development), 312APEC. See Asia Pacific Economic
Cooperation
APICORP. See Arab Petroleum InvestmentsCorporation
Arab Authority for Agricultural Investmentand Development (AAAID), 296, 312
Arab Bank for Economic Development inAfrica (BADEA), 80, 292, 295, 312, 316
Arab Cooperation Council, 291Arab financial institutions, 291–328; aggre-
gated ODA of, 297–300; concentratingfunding on most strategic economicareas, 316–17; data and statistical aggre-gates on, 293, 307; developing coun-try–owned, 16, 20; economic andpolitical background to developmentagencies, 294–97; features of, 307–08;improving efficiency of, 316; oilresource, relation to, 13–14, 292, 293,294–95, 315–16; political motivationsof, 11; World Bank, comparison with,16. See also specific institutions
Arab Fund for Economic and Social Devel-opment (AFESD), 14, 174, 295, 297;improving efficiency of, 316; overviewof, 308–09
Arab Fund for the Development of Africa,14
Arab Gulf Program for United NationsDevelopment Organizations(AGFUND), 313
Arab Investment Company, 313Arab-Israeli war of 1967, 14, 295Arab League: agricultural funding from,
296, 312; creation of, 291; funding for,14; promotion of regional integration by,294–95
Arab Monetary Fund (AMF), 14, 20, 295,309–10
Arab Organization for Agricultural Develop-ment (AOAD), 312
Arab Petroleum Investments Corporation(APICORP), 295, 314
Arab Trade Financing Program (ATFP),309–10
Arab Unified Economic Report (AUER), 297Argentina: as CABEI nonborrowing mem-
ber, 58; and cyclical synchronism,
360 index
10101-13_Index.qxd 10/13/06 5:48 PM Page 360

186–87; financial crisis of, 40, 168, 178,236; infrastructure loans to, 85; largeloans to, 90; regional exchange ratearrangements of, 115, 174; share capitaland sense of ownership in, 217; smallercountries, coordination incentives, 183
AsDB. See Asian Development BankAsDF. See Asian Development FundASEAN. See Association of Southeast Asian
NationsASEAN+3 (China, Japan, and Republic of
Korea), 271–76; agreement to reviewCMI, 249; and Asian monetary fundproposal, 241–42, 244; bilateral swaparrangements, 245–48, 250; and bondmarket development initiative, 269–72;economic review and policy dialogue, 34,265; Finance Ministry and Central BankDeputies, 270, 271; foreign reserves,excessive, 237; institutional nature andinfrastructure goals of, 23; Joint State-ment on East Asian Cooperation (1999),228. See also Chiang Mai Initiative
ASEM (Asia-Europe Meeting), 259Asia: colonialism, end of, 11; communism,
spread of, 43; developing country–ownedinstitutions, 16, 20; exchange rate poli-cies, 187; exchange-traded funds, 279;investments in U.S. bonds, 268–69; asrecipient of Arab ODA, 304; and short-term financing, 63; small, low- andmiddle-income countries, 52–53; “verycreditworthy countries” in, 53; WorldBank/IDA lending to, 16. See also EastAsia; specific countries and institutions
Asia-Europe Meeting (ASEM), 259Asia Link, 275ASIA Ltd., 290Asian Bond Fund (ABF): ABF1 and ABF2,
269–70, 276–80, 288; development of,269–70; misconceptions about, 280–81;nature and goals of, 23–24
Asian bond market development, 264–88;current approaches, evaluation of,283–88; major initiatives of, 269–81;market-oriented strategy for, 281–83;rationale for, 265–69
Asian Bond Market Initiative (ABMI):achievements of, 273; and Chiang MaiInitiative, 243, 244; development of,270, 271; purpose of, 270; viability of,286–88
AsianBondsOnline, 273Asian Cooperative Dialogue (ACD), 284Asian Development Bank (AsDB): allocation
of resources by, 102; Asian financialcrisis, resolution strategy, 264–65; cofi-nancing and equity participation of, 81;concessional lending of, 16; creation of,12–13, 42–43; financial standing of, 90;graduation policies of, 86–88; infrastruc-ture operations of, 20, 85; and Malaysia,issuance of ringgit-denominated bonds,273; productive sector support for, 84;regional public goods, provision of, 69;shareholder control over, 43–44; studyon Asia Link, 274–75; transport, energy,and environment programs, 85; workinggroup report on CMI, 249
Asian Development Fund (AsDF): gradua-tion policies of, 88; loan conditions andcosts of, 94, 96
Asian financial crisis. See East Asian financialcrisis (1997–1998)
Asian Investment Bank proposal, 22Asian Monetary Fund proposal, 2, 243–44Asia Pacific Economic Cooperation (APEC):
and ASEAN+3 countries, 242; and bondmarket development initiative, 269–71;and Chiang Mai Initiative countries,252; Initiative on the Development ofSecuritization and Credit GuaranteeMarkets, 23, 270
AsiaSettle, proposal for, 289Association of Credit Rating Agencies in
Asia, 289Association of Southeast Asian Nations
(ASEAN): and Chiang Mai Initiative, 2;and cyclical synchronism, 170–71; freetrade area of, 252–55; and surveillanceprocess, 33–34; swap arrangement of, 27,32
AU. See African Union
index 361
10101-13_Index.qxd 10/13/06 5:48 PM Page 361

Australia: Initiative on the Development ofSecuritization and Credit GuaranteeMarkets, 271; Manila framework, sup-port for, 252
BADEA. See Arab Bank for EconomicDevelopment in Africa
Bahamas, 208Bahrain: AFESD membership, 308; Gulf
Cooperation Council membership, 291Balance-of-payments financing in Latin
America, 218–24Bank for Central African States, 343, 344Bank of British West Africa, 338–39Barbados, 208Barbuda, 208Belize, 208Berlin Wall, collapse of: common currency
after, 133; transition to market anddemocracy after, 140
Bolivarian Republic of Venezuela. SeeVenezuela
Bolivia: and balance-of-payments financing,218; as CAF shareholder, 59; FAR/FLARresources channeled to, 202, 219–21;financial vulnerability, reduction in, 225;and Latin American Reserve Fund, 32
Bond market development in Asia. See Asianbond market development
Brazil: and coordination incentives, 183; andcyclical synchronism, 186–87; large loansto, 90; Mercosur, uselessness to largercountries, 193, 196; regional exchangerate arrangements of, 115; share capitaland sense of ownership in, 217
Bretton Woods: and exchange rate coordina-tion, 195; and fixed-but-adjustable pegs,111; historical overview, 42, 119, 121,123; and inflation rates, 113, 115; insti-tutions, reform views of, 2, 40; parities,breakdown, 25; and regional exchangerate arrangements, 108; and Wernerplan, 120
Britain. See United KingdomBritish Caribbean Currency Board, 30British Virgin Islands, 208
Budget deficits, 127Bundesbank, and regional exchange rate
arrangements, 113, 115, 123–24
CABEI. See Central American Bank for Eco-nomic Integration
CACM. See Central American CommonMarket
CAF. See Andean Development CorporationCalvo, G., 186Canada: exchange-traded funds, 279; share
capital and sense of ownership in, 217;trade interdependence, 170
Canada–United States Free Trade Agree-ment, 46
Caribbean. See Latin America and CaribbeanCaribbean Community (Caricom): and
development bank funding, 200; andmonetary union commitment, 27, 30;Multilateral Clearing System for, 201;and trade interdependence, 166
Caribbean Development Bank (CDB): con-cessional lending of, 80; creation of, 15,58–59, 201; financing provided by, 208;investment rating of, 214; relative impor-tance of, 211–12; share capital and senseof ownership in, 217; term and sectoralallocation of, 212–13
Caricom. See Caribbean CommunityCayman Islands, 208CBOs (Collateralized bond obligations),
273–74CDB. See Caribbean Development BankCEE. See Central and Eastern EuropeCentral African Economic and Monetary
Union, 28, 56Central American Bank for Economic Inte-
gration (CABEI): allocation of resourcesby, 103; balance-of-payments supportfrom, 209; concessional lending of, 80;creation of, 201; financing provided by,208; history of, 15–16; investment ratingof, 214; lessons learned from, 58; loanapprovals 1983–1990, 202; relativeimportance of, 209–12; share capital andsense of ownership in, 217; term and sec-toral allocation of, 213
362 index
10101-13_Index.qxd 10/13/06 5:48 PM Page 362

Central American Common Market(CACM): creating CABEI, 201; andcyclical synchronism, 172; developmentbank funding, 200; members’ share capi-tal and sense of ownership in, 217;rationale for, 30–31; trade interdepend-ence, 166
Central American Monetary StabilizationFund (FOCEM) and balance of pay-ments, 202, 209
Central and Eastern Europe (CEE): bondmarket development, 153; EIB lendingto, 160; and market imperfections, 150;pre-accession financing to, 144–45;transfer of knowledge to, 140–41
Central Bank for Overseas France, 341–42Central Bank of West African States,
342–43, 344CFA franc zone (CFAF zone), 55–56, 57,
341–45, 348–50CFC (Common Fund for Commodities), 64Chiang Mai Initiative (CMI): and bilateral
swap arrangements, 32–34; commoncurrency under, 230–31; and exchangerate stability, 128; FLAR, lessons from,61; issues surrounding, 36–37, 241,243–45; leadership issues of, 256–60;lessons learned from, 61; opposition topredecessor, 2; origin of (May 2000meetings), 46; as reform tool, 27, 228,265; short-term financing from, 63–65;structure and status of, 245–51; supportfrom developed countries for, 196
China: and Asian financial crisis, 9; andbilateral swap arrangements, 245–48;Chiang Mai Initiative leadership issues,256–60; exchange rate policies, 187, 237,251; foreign reserves, 239; free-tradeagreements, 252, 257; Hong KongSpecial Administrative Region, 264;Initiative on the Development of Securi-tization and Credit Guarantee Markets,270–71; large loans to, 90; loans fromregular and concessional windows, 87;and Pan-Asian Bond Index Fund, 279
Clearing System for the Central AmericanCommon Market, 201
CMI. See Chiang Mai InitiativeCohesion Report (European Commission,
2004), 144Collateralized bond obligations (CBOs),
273–74Collier, P., 334, 341Colombia: and balance-of-payments financ-
ing, 218; CABEI membership of, 58;CAF membership of, 59; FAR/FLARresources channeled to, 202, 219–20;share capital and sense of ownership in,217
COMESA. See Common Market for Easternand Southern Africa
Commercial banks: failure in West Africa,344; reserves of, 239
Common Fund for Commodities (CFC), 64Common Market, 127Common Market for Eastern and Southern
Africa (COMESA): Clearing House, 57;trade financing facilities of, 15; trade lib-eralization objectives of, 56–57
Concessional lending of regional develop-ment banks, 16, 80, 85–88
Convertibility of currency, 119, 155, 174,331
Coordination gain, 153Costa Rica: and balance-of-payments financ-
ing, 218; CABEI funding eligibility of,58, 208; FAR/FLAR resources channeledto, 219–21; FAR membership of, 191,202; financial vulnerability, reduction in,225
Côte d’Ivoire: customs union membership,342; political crisis and macroeconomicproblems in, 29; and regional coopera-tion tax, 343
Council for Arab Economic Unity, 294Countercyclical financing, 14; in Latin
America, 213–15Credit risk rating in Latin America, 213–15Currency convertibility, 119“Currency snake,” 119Cyclical synchronism, 170–71Czech Republic, 146
index 363
10101-13_Index.qxd 10/13/06 5:48 PM Page 363

DAC (Development Assistance Committee).See Organization for Economic Coopera-tion and Development
Decentralization of subregional multilateraldevelopment banks, 90
de Grauwe, P., 115Development Assistance Committee. See
Organization for Economic Cooperationand Development
Devlin, R., 146Dollarization, 110, 173, 186, 188Domestic resistance and coordination agree-
ments, 172–73Dominica, 208Dominican Republic, 217
East Africa Community, 14, 346East African Cooperation Agreement, 332East African Currency Unit, 346East African Development Bank, 15East African financial and monetary cooper-
ation, 346–47East Asia: barriers to financial cooperation
in, 251–61; development financing in,12–13, 22; foreign reserves, accumula-tion of, 237–40; institutional constraintsto financial cooperation in, 251–56; andinternational financial reforms, 236;leadership issues in, 256–60; regionalfinancial arrangements of, 227–61; tradeimbalance with United States, 236. Seealso Chiang Mai Initiative; East Asianfinancial crisis (1997–1998); specificcountries
East Asian financial crisis (1997–1998):China support for Hong Kong during, 9;effects of, 22–23, 27; extraregional conta-gion, example of, 204; foreign exchangereserves after, 63; international financialreform after, 1–2; loans to Korea after,85; and regional financial integration,231–36; stalled reform after, 287
Eastern and Southern African Trade andDevelopment Bank (PTA Bank), 57
Eastern Caribbean Currency Union(ECCU), 30
EBRD. See European Bank for Reconstruc-tion and Development
ECA. See United NationsECE. See United NationsEconomic and Social Commission for West-
ern Asia (ESCWA), 293Economic Commission for Latin America
and the Caribbean (ECLAC), 2Economic Community of West African
States (ECOWAS), 14, 54–55, 331,339–40
Ecuador: and balance-of-payments financ-ing, 218; as CAF shareholder, 59;exchange rate volatility of, 174; FAR/FLAR resources channeled to, 202,219–21; financial vulnerability, reduc-tion in, 225; Latin American ReserveFund, 32; restructuring of internationalobligations, 221–22
EEC. See European Economic CommunityEgypt: AFESD membership, 308; Arab
Cooperation Council membership, 291;contribution to Islamic DevelopmentBank from, 310; Council for Arab Eco-nomic Unity membership, 294; andinfrastructure loans, 85; project financingfrom Islamic Development Bank to, 310;as recipient of Arab ODA, 301, 307; andregional development agencies, 294; andtrade agreements, 294
EIB (European Investment Bank), 94Eichengreen, B., 186, 255EIF. See European Investment FundEl Salvador, 58, 208EMEAP. See Executives’ Meeting of East
Asia-Pacific Central BanksEmerging market economies (EMEs), 49,
51; in Latin America, 52; and reserves,239–40; and trade liberalization, 230
Emerging Markets Eminent Persons Group,2, 41
EMS (European Monetary System), 114–15EMU. See European Economic and Mone-
tary UnionEPU. See European Payments Union
364 index
10101-13_Index.qxd 10/13/06 5:48 PM Page 364

Equitable development in European Union,138–45
Equity participation and regional develop-ment banks, 81
ERM (exchange rate mechanism). See Euro-pean Monetary System (EMS)
ESCWA (Economic and Social Commissionfor Western Asia), 293
Euro. See Convertibility of currency;Exchange rates
Europe: and Arab financial institutions, 292;and borrowing credibility, 173; comparedto Latin America, 164; currency crisis of1992, 9; and domestic resistance, 173;financial markets of, 268; income differ-entials within, 136, 138; inflation ratesof, 113–14, 118; regional exchange ratearrangements of, 107–34; smaller coun-tries, coordination incentives, 183; Stabil-ity and Growth Pact, adoption of, 127;trade integration, best model of, 12. Seealso European Union; specific countriesand institutions
European Bank for Reconstruction andDevelopment (EBRD): allocation ofresources by, 102; central and easternEurope, lending to, 141; cofinancing andequity participation of, 81; financialstanding of, 93; lending conditions,attractiveness of, 150; loan conditionsand costs, 94; origin of, 13, 42–43;private sector lending, 20; role of, 16
European Central Bank (ECB), 8, 108European Commission: Cohesion Report
(2004), 144; evolution of, 130; grants,responsibility for, 147
European Common Market: currency con-vertibility, 119; institutions, characteris-tics of, 130; trade liberalization, 127
European Economic and Monetary Union(EMU): features of, 124–26; historicaloverview, 120–21; importance of, 128,155; origin of, 25
European Economic Community (EEC)institutions and financial mechanisms,138–40
European financial institutions, 136–63;equitable development, funds for,138–45; exponential lending growth,155–59; financial strength of, 153–55;fiscal transfers among, 138–46; lendingand pricing policies of, 148–50; lessonsfrom, 145–46, 160–62; and marketimperfections, 150–53; sustainedgrowth, reasons for, 159–60. See alsoEuropean Investment Bank
European Investment Bank (EIB): centraland eastern Europe, lending to, 140–41;creation of, 2, 12–13, 22, 138, 146–47;decentralization, lessons learned, 145;dominance in Europe, 16; equitabledevelopment funds, 21, 138–41; finan-cial strength of, 153–55; institutionalsetup of, 147–48; lending and pricingpolicies of, 80, 148–50; lending, histori-cal evolution of, 155–60; lessons for newregional development banks, 160–62;rationale for, 150–53; World Bank, lend-ing comparison, 137, 150
European Investment Fund (EIF): centraland eastern Europe, lending to, 140–41;innovative sector lending, 21–22; pur-pose of, 152
European Monetary System (EMS):exchange rate mechanism (ERM) of,113, 121–24; historical overview, 120;origins of, 114–15
European Monetary Union. See EuropeanEconomic and Monetary Union (EMU)
European Parliament, powers of, 125–26, 130European Payments Union (EPU): creation
of, 2; historical overview, 119; and Mar-shall Plan aid, 9
European Single Market, 141European System of Central Banks (Eurosys-
tem), 125European Union: accession process of, 141;
and cyclical synchronism, 170–71; devel-opment financing by, 12–13; EuropeanInvestment Bank, shareholders, 147; fis-cal transfers within, 138–46; macroeco-nomic emphasis of, 24–25; monetary
index 365
10101-13_Index.qxd 10/13/06 5:48 PM Page 365

union of, 2; objections to Asian Mone-tary Fund, 243; political motivations of,47; regional financial integration, successof, 46, 164, 240; sequence followed by,25–26; stages of development, 138;Structural Funds and Cohesion Fundallocations, 141–43; trade integration,176
Eurosystem (European System of CentralBanks), 125
Exchange rate agreements. See Regionalexchange rate arrangements
Exchange rates: European experience with,107–35; exchange rate mechanism,120–24; floating regimes, coordinationunder, 187–89; options for limitingvolatility of, 184–87; sequencing,127–29; stabilization of, 111–18,230–31; volatility of, 173–74
Executives’ Meeting of East Asia-PacificCentral Banks (EMEAP): ASEAN+3participation in, 242; and bond marketdevelopment, 23–24, 269, 276–81; cur-rent and future role of, 275
Fanelli, J., 186–87FAR. See Andean Reserve FundFAR/FLAR. See Latin American Reserve
FundFernández-Arias, 184Ferroni, M., 85Financial markets: crises, contagion of, 204;
exchange rate arrangements, role of,131–32. See also specific countries
Fiscal policy and exchange rate arrange-ments, 126–27
FLAR. See Latin American Reserve FundFloating exchange rate regimes, coordination
under, 187–89FOCEM. See Central American Monetary
Stabilization FundFONPLATA (Financial Fund for the Devel-
opment of the Plata River Basin): allo-cation of resources by, 103; financialstanding of, 93; financing provided by,208; infrastructure projects of, 80
Ford Foundation, 2Foreign direct investment (FDI), proportion
of net resource inflows of, 50, 70France: colonial approach to West Africa’s
financial and monetary institutions,341–43, 345; “currency snake,” 119; EIBlending to, 156, 160; European currencycrisis of 1992, 9; exchange rate of, 118,119; and Stability and Growth Pact, 127
Frankel, J., 230Free-trade agreements. See specific countries
and agreementsFrench-speaking Africa. See CFA franc zone
(CFAF zone)
G-7. See Group of SevenGAFTA (Greater Arab Free Trade Area), 294Gambia: and creation of West African Mon-
etary Union, 340; and establishment ofcentral bank, 339
GCC. See Gulf Cooperation CouncilGeneral Agreement on Tariffs and Trade
(GATT), 127Geography as determinant of regional organ-
ization membership, 51–52Germany: Bundesbank, 113, 115, 123–24;
EIB lending to, 156–57, 160; and Euro-pean currency crisis of 1992, 9; EuropeanMonetary Union, role in, 120; interestrates of, 131–32; regional exchange ratearrangements of, 113, 118, 119, 128; asregional lender of last resort, 256; sharecapital and sense of ownership in, 217;and Stability and Growth Pact, 127
Ghana: and creation of West African Mone-tary Union, 340; and establishment ofcentral bank, 339; and inflation condi-tions, 340; stock exchange in, 354
Global financial architecture, reforming,40–66; background, 42–46; lessonsfrom, 54–61; poor countries, long-termresource needs, 61–63; rationale forregional cooperation, 46–54; regionalintegration, 45–46, 61–66; regionalownership vs. nonregional control,43–44; short-term financing, bridgingthe gap, 63–65
366 index
10101-13_Index.qxd 10/13/06 5:48 PM Page 366

Globalization, benefits and negatives toAfrica from, 352–54
González Rozada, M., 186–87Graduation policies of regional development
banks, 85–88Grandes, M., 336–37Greater Arab Free Trade Area (GAFTA), 294Greece: and bond market development, 153;
EIB lending to, 157; and EuropeanMonetary System, 120; infrastructurelending to, 143; and market imperfec-tions, 150
Grenada, 208Grenadines, 208Griffith-Jones, S., 157, 236Group of Seven (G-7): and East Asian finan-
cial crisis, 235; and global financial sys-tem reform, 40, 46, 48, 236
Guarantees: European financial institutions,153–54; Initiative on the Developmentof Securitization and Credit GuaranteeMarkets, 23, 270–71; Inter-Arab Invest-ment Guarantee Corporation (IAIGC),296, 312–13; International Bank forReconstruction and Development(IBRD), 81; Japan Bank for InternationalCooperation (JBIC), 273
Guatemala, 58, 208Guinea and creation of West African Mone-
tary Union, 340Gulf Cooperation Council (GCC), 27, 291,
294Gulf Investment Corporation, 313–14Gunning, J. W., 334, 341Guyana, 208
Helliwell, J. F., 115Henning, R. C., 235HIPC Initiative: cost of participation in,
101, 102; IDB participation in, 96Honduras, 58, 208Hong Kong Special Administrative Region
(SAR): and Asian financial crisis, 9; andbond market development, 282, 283,285–86; exchange rate policies, 237; Ini-tiative on the Development of Securitiza-tion and Credit Guarantee Markets,
270–71; PAIF registration, effect of, 279; single-market funds, listing of, 278
Honohan, P., 332, 336, 339, 342, 348, 349,351–52
IAIGC. See Inter-Arab Investment Guaran-tee Corporation
iBoxx ABF bond-market indexes, 279–80IBRD. See International Bank for Recon-
struction and DevelopmentICSD (International Central Securities
Depository), 289IDA. See International Development
AssociationIDB. See Inter-American Development BankIFA. See International Finance CorporationIIC (International Index Company), 280IMF. See International Monetary FundIndia and loan practices, 87, 90Indonesia: and Asian financial crisis, 32,
234; and foreign reserves, 239; loansfrom regular and concessional windows,87; project financing from Islamic Devel-opment Bank to, 310
Inflation rates: in Africa, 340; in Europe,113–14, 118
Initiative for the Integration of RegionalInfrastructure in South America, 85
Initiative on the Development of Securitiza-tion and Credit Guarantee Markets, 23,270–71
Inter-American Conference (1890), 42Inter-American Development Bank (IDB):
allocation of resources by, 102; Andeancountries, lending to, 15; cofinancingand equity participation of, 81; conces-sional lending of, 16; financial standingof, 90; Fund for Special Operations, 82,94, 96; graduation policies of, 86–88;infrastructure operations of, 85; originof, 12–13, 42–43; productive sector sup-port for, 84; regional integration of, 45;shareholder influence on, 43–44, 100;social spending of, 20; transport, energy,and environment programs of, 85; WorldBank, comparison with, 16, 69
index 367
10101-13_Index.qxd 10/13/06 5:48 PM Page 367

Inter-Arab Investment Guarantee Corpora-tion (IAIGC), 296, 312–13
Interest rates. See specific countriesInternational Bank for Reconstruction and
Development (IBRD): regular loans, 77;total guarantee operations (2001–2003),81
International Central Securities Depository(ICSD), 289
International Conference on Financing forDevelopment (2002), 7
International Development Association(IDA): funding for, 102; soft credits, 77
International Finance Corporation (IFA)and equity participation, 81
International Index Company (IIC), 280International Monetary Fund (IMF): Arab
region not recognized by, 293; Asianfinancial crisis, resolution strategy, 32,231–36, 264–65; and bilateral swaparrangements, 33, 245; central role of, 6;and crisis period financing, 205; andEuropean Investment Bank, 148; andmoral hazard, 242; objections to AsianMonetary Fund, 243; and political issues,242; and regional exchange rate arrange-ments, 107–08, 110; role of, 7–8, 37,191; shareholder control over, 48; andshort-term flows, 70; smaller countries,coordination incentives, 183
“Investment Climate in the Arab Countries”(IAIGC annual report), 313
Iraq: AFESD membership, 308; Arab Co-operation Council membership, 291;Council for Arab Economic Unity mem-bership, 294; loans to other Arab andother developing countries from, 296
Ireland: EIB lending to, 157; infrastructurelending to, 143; and market imperfec-tions, 150
Islamic Development Bank (IsDB): alloca-tion of resources by, 103, 303; cofinanc-ing and equity participation of, 81;creation of, 292, 295; financial standingof, 93; improving efficiency of, 316;overview of, 310–11
Italy: calling for European Investment Bank,137, 140, 147; “currency snake,” 119;EIB lending to, 157; exchange rate of,118; interest rates of, 131–32; share capi-tal and sense of ownership in, 217
Jamaica, 208, 217Japan: and Asian bond market proposal,
270, 282, 283; and Asian MonetaryFund proposal, 2, 46, 243–44; and bilat-eral swap arrangements, 245–48, 249;and Chiang Mai Initiative leadershipissues, 256–60; and collateralized bondobligations, 273–74; European Bank forReconstruction and Development, mem-bership in, 141; financial markets in,265–67, 268; and free-trade agreements,252–55; Initiative on the Developmentof Securitization and Credit GuaranteeMarkets, 271; PAIF registration, effectof, 279; as regional lender of last resort,256; Samurai and Shogun bond markets,285
Japan Bank for International Cooperation(JBIC) credit guarantees, 273
Joint Statement on East Asian Cooperation(1999), 228
Jordan: AFESD membership, 308; ArabCooperation Council membership, 291;debt rescheduling of, 308; project financ-ing from Islamic Development Bank to,310; as recipient of Arab ODA, 301,307; and trade agreements, 294
Kenen, P. B., 115Kenya as member of East Africa Commu-
nity, 56, 346Kobe Research Project report (2002),
258–59Korea. See Republic of KoreaKuwait: AFESD membership, 308; budget
of, 315; Council for Arab EconomicUnity membership, 294; Gulf Coopera-tion Council membership, 291; loans toother Arab and other developing coun-tries from, 296, 300
368 index
10101-13_Index.qxd 10/13/06 5:48 PM Page 368

LAFTA (Latin American Free Trade Associa-tion), 201
LAIA (Latin American Integration Associa-tion) balance-of-payment agreements,201–02
Lane, P. R., 332, 336, 339, 342, 348, 349,351–52
Latin America and Caribbean: and balance-of-payments financing, 218–24; colonial-ism, end of, 11; communism, spread of,43; credit risk rating in, 213–15; devel-oping country–owned institutions, 16,20; and domestic resistance, 173; EIBlending to, 160; emerging marketeconomies in, 52; and exchange ratevolatility, 185; experience, lessons from,58–61; and financial crisis of 1990s,9–10, 190; financial integration of,167–70; and foreign debt crisis of 1982,9–10, 202; importance of subregionalbanks in, 209–12; infrastructure spend-ing of, 20; Inter-American DevelopmentBank lending to, 16; lessons learnedfrom, 58–61; macroeconomic coordina-tion in, 30–32, 164–97; as recipient ofArab ODA, 304; regional developmentbanks, role of, 71; and regional exchangerate arrangements, 118; share capital andsense of ownership in, 215–18; smallercountries, coordination incentives,183–84; small, low- and middle-incomecountries, 52; subregional financial insti-tutions in, 15, 200–26; trade integrationof, 12, 165–67; “very creditworthy coun-tries” in, 53. See also specific countries
Latin American Free Trade Association(LAFTA), 201
Latin American Integration Association(LAIA) balance-of-payment agreements,201–02
Latin American Reserve Fund (FAR/FLAR):and Asian financial crisis, 9–10, 27; andbalance of payments, 202, 218–23; cre-ation and purpose of, 191, 205; expan-sion, feasibility of, 223–24; financingand ownership in, 221–23; and Latin
American debt crisis, 9–10; lessonslearned from, 60–61; and liquidity fi-nancing, 31–32, 36; relative importanceof, 219–21
Lawrence, R. Z., 241Least developed countries (LDCs): African
countries as, 51–52; Asian countries as,52; as OPEC Fund recipients, 311; andshort-term financing, 49–50, 51
Lebanon: AFESD membership, 308; projectfinancing from Islamic DevelopmentBank to, 310; and trade agreements, 294
Lesotho, currency of, 346, 347Levy-Yeyati, E., 110Libya: AFESD membership, 308; contribu-
tion to Islamic Development Bank from,310; Union of Arab Maghreb member-ship, 291
LICUS (Low-Income Countries UnderStress Implementation Fund), 102
Light arrangements of exchange rates, 130Loans from regional development banks: con-
ditions and costs of, 94–96; types of, 77London, financial markets, 256Longer-term resource needs of poorest coun-
tries, 61–63Low-Income Countries Under Stress
(LICUS) Implementation Fund, 102
Maastricht Treaty (1992), 25, 124Macroeconomic coordination in Latin
America, 30–32, 164–97; and financialintegration, 167–70; future of, 178–93;Mercosur, experience of, 174–78; reasonsfor, 165–74; stabilization funds andother subregional financial agreementsfor, 190–93; and trade interdependence,165–67
Malaysia: Asian Development Bank (AsDB)issuance of ringgit-denominated bonds,273; and exchange rate policies, 237; for-eign reserves, ratio to GDP, 237; projectfinancing from Islamic Development Bankto, 310; single-market funds, listing of,278
Management of liquid assets, 100–03
index 369
10101-13_Index.qxd 10/13/06 5:48 PM Page 369

Manila framework: ASEAN+3 participationin, 242; countries supporting, 252
Manu, M., 342Marshall Plan, 9, 141Mauritania: AFESD membership, 308; cus-
toms union membership, 342; Union ofArab Maghreb membership, 291
McKinnon, R., 127MDBs. See Multilateral development banksMercosur (Southern Common Market):
country risk ratings in, 168; and cyclicalsynchronism, 172; and exchange ratevolatility, 173; historical problems of, 11,175–77; lessons from, 177–78; macro-economic coordination of, 174–93; andNAFTA, differences in country size, 170;rationale for, 30–31; and trade interde-pendence, 165–67
Mexico: as CABEI nonborrowing member,58; contingent credit lines for, 239; infra-structure loans to, 85; Initiative on theDevelopment of Securitization andCredit Guarantee Markets (Los Cabos,2002), 270–71; share capital and sense ofownership in, 217; trade interdepend-ence of, 170
Middle East: Arab/Islamic lending to, 16;regional development banks, role of, 71.See also specific countries and institutions
MIGA. See Multilateral Investment Guaran-tee Agency
Millennium Review Summit, 61Mistry, P., 2Mitterrand, François, 120Monterrey Consensus of 2002, 236Montserrat, 208Moody’s, 80, 87, 222Morocco: AFESD membership, 308; debt
rescheduling of, 307–08; infrastructureloans to, 85; as recipient of Arab ODA,301; and trade agreements, 294; Unionof Arab Maghreb membership, 291
Multilateral Clearing System for CARICOMcountries, 201
Multilateral development banks (MDBs):characteristics and resources, 70; con-
stituencies and stakeholders of, 96–100;defined, 68–69; financial standing of,88–96; net income management by,100–03; political economy of, 96–103.See also Regional development banks(RDBs); Subregional development banks(SRDBs)
Multilateral Investment Guarantee Agency(MIGA) cofinancing projects, 81
NADB (North American DevelopmentBank), financial standing of, 93
NAFTA. See North American Free TradeAgreement
Namibia: currency of, 346, 347; SADCmembership, 346
Net income management by multilateraldevelopment banks, 100–03
New Partnership for Africa’s Development(NEPAD): background to formation of,57; lessons learned from, 62; regionalintegration, 45; transport, energy, andenvironment programs of, 85
New York, financial markets, 256New Zealand, support for Manila frame-
work, 252NIB (Nordic Investment Bank), financial
standing of, 94Nicaragua: arrears of, 16, 60; CABEI service
to, 58, 208Nigeria: and budget deficit/GDP ratio, 340;
and creation of West African MonetaryUnion, 340; and establishment of cen-tral bank, 339; and gross foreign cur-rency reserve conditions in, 340;shareholder influence of, 98; stockexchange in, 354
Nippon Export and Investment Insurance,273
Nordic Investment Bank (NIB), financialstanding of, 94
North Africa: Arab/Islamic lending to, 16;regional development banks, role of, 71.See also specific countries
North American Development Bank(NADB), financial standing of, 93
370 index
10101-13_Index.qxd 10/13/06 5:48 PM Page 370

North American Free Trade Agreement(NAFTA): and Mercosur, differences incountry size, 170; regional integration asgoal of, 46; trade integration, 176
OAS (Organization for American States), 45OAU. See Organization for African UnityOcampo, José Antonio, on regional financial
arrangements, 2, 236OECD. See Organization for Economic
Cooperation and DevelopmentOfficial development assistance (ODA), 41,
49, 61; from Arab institutions to Araband other countries, 296, 297–305
Ogunkola, E. O., 340, 351Oman: AFESD membership, 308; Gulf
Cooperation Council membership, 291;project financing from Islamic Develop-ment Bank to, 310
OPEC Fund, 296, 311–12Organisation Commune Africaine et
Malgache, 342Organization for African Unity (OAU), 45,
57Organization for American States (OAS), 45Organization for Economic Cooperation
and Development (OECD): Develop-ment Assistance Committee (DAC), 14,41, 293; and inflation rates, 114
Organization of the Arab Petroleum Export-ing Countries (OPEC), 296; OPECFund, 311–12
Pacific countries, EIB lending to, 160PAIF (Pan-Asian Bond Index Fund),
277–80Pakistan: low-income borrowing of, 87, 88;
project financing from Islamic Develop-ment Bank to, 310
Panama, 217Pan-Asian Bond Index Fund (PAIF),
277–80Paraguay, 183, 217Paris Club, 308Paris Declaration on Aid Effectiveness
(March 2005), 41
Parsley, D., 115Peru: and balance-of-payments financing,
218; as CAF shareholder, 59; FAR/FLARresources channeled to, 202, 219–20;restructuring of international obligations,221–22
Philippines: foreign reserves, ratio to GDP,237; Initiative on the Development ofSecuritization and Credit GuaranteeMarkets, 271
Plan Puebla-Panama, and regional infra-structure financing, 85
Portfolios: Caribbean Development Bank’s,211; as income source for multilateraldevelopment banks, 101; of regionaldevelopment banks, 82–85; relativematurity of World Bank’s, 103
Portugal: and bond market development,153; EIB lending to, 157; European inte-gration, support for, 145; infrastructurelending to, 143; lessons learned from,146; and market imperfections, 150; pre-accession financing to, 144
Preferential Trading Area. See now CommonMarket for Eastern and Southern Africa(COMESA)
PTA Bank. See Eastern and Southern AfricanTrade and Development Bank
PTA Reinsurance Company (ZEP-RE), 57
Qatar: AFESD membership, 308; GulfCooperation Council membership, 291
Rand Monetary Area, 29, 346RDBs. See Regional development banksReciprocal Payments and Credits Agreement
of the Latin American Integration Associ-ation (ALADI), 60
Regional development banks (RDBs),68–106; compared to World Bank’sdevelopment financing, 16, 69–71, 77,90, 93–94; constituencies and stakehold-ers of, 96–100; European InvestmentBank, lessons from, 160–62; evolutionand current situation of, 71–88; financialinstruments and services of, 71–82;
index 371
10101-13_Index.qxd 10/13/06 5:48 PM Page 371

financial standing of, 88–96; graduationpolicies of, 85–88; integration as objec-tive of, 45–46; loan conditions and costs,94–96; net income management,100–03; overview, 70–71; political econ-omy of, 96–103; portfolios and special-izations of, 82–85; World Bank, overlapwith, 43. See also Subregional develop-ment banks (SRDBs)
Regional exchange rate arrangements: andEuropean Economic and MonetaryUnion (EMU), 124–26; European expe-rience with, 107–34; and exchange ratestability, 111–18; financial markets, roleof, 131–32; and fiscal policy, 126–27;institutions, role of, 130–31; lightarrangements, 130; post–World War II,118–27; and regime choices, 110–11;sequencing, 127–29; soft pegs, logic of,110–18; and volatility of rates, 173–74
Regional financial cooperation, 1–37; argu-ments for, 4–8, 46–54; challenges facing,8–12, 201–06; and cultural and linguis-tic differences, 52; development financ-ing, 12–24; in East Asia, 227–61; globalfinancial architecture, reforming, 46–54;in Latin America, 167–70; lessons from,54–61, 145–46; and macroeconomicintegration, 24–34, 189–90; in postwarWestern Europe, 2–3
Regional Multicurrency Bond (RMCB)project, 274
Regular loans from regional developmentbanks, 77
Reinhard, C., 110, 186Republic of Korea: and Asian bond market
proposal, 270, 282; and Asian financialcrisis, 32, 234; and bilateral swaparrangements, 245–48, 249, 256; andcollateralized bond obligations, 273–74;and foreign reserves, 237, 239; and free-trade agreements, 252–55; infrastructureloans to, 85; Initiative on the Develop-ment of Securitization and Credit Guar-antee Markets, 270–71
RMCB (Regional Multicurrency Bond)project, 274
Rodrik, D., 115, 187Rogoff, K., 110Rose, A., 115Russian crisis of 1998, as example of extra-
regional contagion, 204
SAAFA. See Special Arab Aid Fund for AfricaSAARC. See South Asian Association for
Regional CooperationSADC. See Southern African Development
CommunitySADCC. See Southern African Development
Coordination ConferenceSaint Kitts, 208Saint Lucia, 208Saint Vincent, 208Sakakibara, E., 258Sanctions, threat of, 183Sapir, A. P., 127SAR. See Hong Kong Special Administrative
RegionSaudi Arabia: AFESD membership, 308;
budget of, 315; contribution to IslamicDevelopment Bank from, 310; GulfCooperation Council membership, 291;loans to other Arab and other developingcountries from, 296, 300
Seigniorage revenue in Africa, 352Senegal: customs union membership, 342;
and regional cooperation tax, 343Short-term financing: bridging the gap for,
63–65; and least developed countries(LDCs), 49–50, 51
Sierra Leone: and creation of West AfricanMonetary Union, 340; and establishmentof central bank, 339
Singapore: and bilateral swap arrangements,249; and bond market development,283, 285; and free-trade agreements,252; PAIF registration, effect of, 279;single-market funds, listing of, 278
Single European Act (1990), 128Single signature loans, 154Small Business Corporation of Korea, 274
372 index
10101-13_Index.qxd 10/13/06 5:48 PM Page 372

Social sector projects, investment in, 84Soft loan windows of regional development
banks, 77South Africa: currency of, 346; as dominant
force in southern Africa, 332; infrastruc-ture loans to, 85; SADC membership,346, 347
South Asia, development financing in, 22South Asian Association for Regional Coop-
eration (SAARC), 47Southern African Development Community
(SADC), 56, 332, 346–47Southern African Development Coordina-
tion Conference (SADCC), 56Southern African financial and monetary
cooperation, 347Southern Common Market. See MercosurSouth-South cooperation, 64, 311Soviet bloc’s transition to capitalism, 43Spain: and bond market development, 153;
CAF membership of, 206; EIB lendingto, 157; European financial integration,support for, 145; infrastructure lendingto, 143; pre-accession financing of, 144;share capital and sense of ownership in,217
Special Arab Aid Fund for Africa (SAAFA),292
SRDBs. See Subregional development banksStability and Growth Pact (Europe), 25, 127Stabilization funds, 190–93Standard & Poor’s, 80, 87, 222Stock exchanges: Union of Arab Stock
Exchanges, 314; West African regionalstock exchange, 345, 354
Sturzenegger, F., 110Subregional development banks (SRDBs):
evolution and current situation, 71–88;financial instruments and services,71–82; financial standing of, 88–96; inLatin America and Caribbean, 206–18;overview, 70–71; political economy of,96–103. See also Regional developmentbanks (RDBs)
Subregional financial cooperation: and balance-of-payments support, 218–24;
challenges, old and new, 201–06; LatinAmerica and Caribbean, 190–93,200–26; regional reserve funds, 218–24
Sub-Saharan Africa: common currency in,28; developing country–owned institu-tions, 16, 20; financial market develop-ment, 30; as recipient of Arab ODA,304; and World Bank, 16
Swap arrangements, 27, 32–34, 245–48,250, 256
Swaziland, currency of, 346, 347Sweden, 119, 120Syria: AFESD membership, 308; as recipient
of Arab ODA, 301; and trade agree-ments, 294
Taiwan Province of China: as CABEI non-borrowing member, 58; foreign reserves,ratio to GDP, 237; share capital andsense of ownership in, 217
Tanzania as member of East Africa Commu-nity, 56, 346
Tax policy, need to harmonize in Africa, 336Thailand: and Asian bond market proposal,
270, 282; and Asian financial crisis, 32,234–35; and bilateral swap arrange-ments, 249; and foreign reserves, 237,239; Initiative on the Development ofSecuritization and Credit GuaranteeMarkets, 270–71
Thaksin, Shinawatra, 284–85Tokyo, Japan, as financial center, 283, 286Trade agreements. See specific countries,
regions, and treatiesTransport, energy, and environment pro-
grams, funding of, 85, 305Treaty of Asunción (1991), 177Treaty of Common Defense and Economic
Cooperation (1950), 294Treaty of Good-Neighborliness and Friendly
Cooperation (2001), 257Treaty of Rome (1958): and currency con-
vertibility, 119; equitable development,funds for, 138, 146–47; European Com-mission, creation of, 130
Trinidad and Tobago, 208, 217
index 373
10101-13_Index.qxd 10/13/06 5:48 PM Page 373

Trust Fund for Gaza and the West Bank, 102Tsang, D., 264Tunisia: AFESD membership, 308; infra-
structure loans to, 85; and trade agree-ments, 294; Union of Arab Maghrebmembership, 291
Turkey: European vs. Arab regional place-ment of, 293; financial crisis in, 40; proj-ect financing from Islamic DevelopmentBank to, 310; UN Economic Commis-sion for Europe membership of, 293
Turks and Caicos Islands, 208
Uche, C. U., 338, 339, 342Uganda as member of East Africa Commu-
nity, 56, 346Union Africaine et Malgache, 342Union Douaniere des Etats de l’Afrique
Occidentale, 342Union of Arab Banks, 314Union of Arab Maghreb, 291Union of Arab Stock Exchanges, 314United Arab Emirates: AFESD membership,
308; contribution to Islamic Develop-ment Bank from, 310; Gulf CooperationCouncil membership, 291; loans to otherArab and developing countries from,296, 300
United Kingdom: depreciation of currencyin, 119; EIB lending to, 156; and Euro-pean Monetary System, 120; exchangerates of, 115, 132; financial markets of,256; regional exchange rate arrangementsof, 113, 118; share capital and sense ofownership in, 217
United Nations: Arab Gulf Program forUnited Nations Development Organiza-tions (AGFUND), 313; Arab region notrecognized by, 293; Economic Commis-sion for Africa (ECA), 45, 62, 293; Eco-nomic Commission for Europe (ECE),293; Millennium Project calculations,61; regional financial arrangements,defense of, 2
United States: bonds, Asian investments in,268–69; European Bank for Reconstruc-
tion and Development, membership in,141; and exchange-traded funds, 279;Federal Reserve, 8, 170; financial marketsof, 159, 256, 265–67; and inflation rate,113; Initiative on the Development ofSecuritization and Credit Guarantee Mar-kets, 271; Manila framework, support for,252; and market transparency, 279; objec-tions to Asian Monetary Fund, 243; share-holder influence of, 98–100; tradeimbalance with East Asia, 236; and tradeinterdependence, 170
Uruguay: and cyclical synchronism, 186–87;share capital and sense of ownership in,217; smaller countries, coordinationincentives for, 183
Venezuela: and balance-of-payments financ-ing, 218; as CAF shareholder, 59;FAR/FLAR resources channeled to, 202,219; loans to developing countries from,296; share capital and sense of ownershipin, 217
WACB (West Africa Currency Board), 338WAEMU. See West African Economic and
Monetary UnionWAMZ. See West African Monetary ZoneWei, S.-J., 115Werner Plan (1971): historical overview,
120; and regional exchange rate arrange-ments, 118–19
West Africa: British colonial history offinance in, 338–39; common currencyin, 28, 338, 341; financial and monetarycooperation in, 338–45; macroeconomiccooperation in, 11; regional stock ex-change in, 345. See also CFA franc zone(CFAF zone); specific countries andinstitutions
West Africa Currency Board (WACB), 338West African Economic and Monetary
Union (WAEMU): financial reforms of,63; history of, 28, 340, 344–45; lessonslearned from, 55, 56, 337, 341
374 index
10101-13_Index.qxd 10/13/06 5:48 PM Page 374

West African Monetary Agency (WAMA),331
West African Monetary Institute, 340West African Monetary Zone (WAMZ), 28,
55, 340, 355White, H. D., 42Williamson, J., 230World Bank: allocation of resources by, 102;
Andean countries, lending to, 15; Arabregion not recognized by, 293; on Asianfinancial crisis, causes, 264; Asian finan-cial crisis, resolution strategy, 264–65;and Caribbean Development Bank, 59;compared to RDBs’ development financ-ing, 16, 69–71, 77, 90, 93–94; conces-sional lending of, 16; creation of, 42;East Asian financial crisis, 2001 reporton, 231, 234; and European InvestmentBank, 137, 148; financial strength of, 90,
93, 153; graduation policies of, 87; influ-ence on RDBs, 97; lending conditions,attractiveness of, 150; loan conditionsand costs, 94; overlap with RDBs, 43;portfolio, relative maturity of, 103; share-holder control of, 48; South Asia, lend-ing to, 16; sub-Saharan Africa, lendingto, 16
World Trade Organization (WTO), 12Wyplosz, C., 127
Yemen: AFESD membership, 308; ArabCooperation Council membership, 291;Council for Arab Economic Unity mem-bership, 294; debt rescheduling of,307–08
ZEP-RE (PTA Reinsurance Company), 57
index 375
10101-13_Index.qxd 10/13/06 5:48 PM Page 375

10101-13_Index.qxd 10/13/06 5:48 PM Page 376