Regional aquifer mapping using combined VES-TEM-AMT/EMAP methods in the semiarid eastern margin of...
20
GEOPHYSICS, VOL. 64, NO. 2 (MARCH-APRIL 1999); P. 337–356, 21 FIGS., 2 TABLES. Case History Regional aquifer mapping using combined VES-TEM-AMT/EMAP methods in the semiarid eastern margin of Parnaiba Basin, Brazil M. A. Meju * , S. L. Fontes ‡ , M. F. B. Oliveira ‡ , J. P. R. Lima ‡ , E. U. Ulugergerli ** , and A. A. Carrasquilla § ABSTRACT As part of a program to evaluate the utility of in- tegrated geoelectrical methods for subsurface struc- tural mapping and groundwater resource investigation in the semiarid eastern margin of the Parnaiba basin in Brazil, several vertical electrical soundings (VES) and transient electromagnetic (TEM) and tensorial audio- magnetotelluric (AMT) measurements were carried out along a 250-km-long east–west transect (passing through major towns and cities) and a 127-km-long north–south profile (passing through small farm settlements). The various data sets have been jointly processed using a novel integration scheme and a constrained 1-D in- version technique to yield the resistivity structure un- derneath each observation station. Regularized 2-D in- version of static-shift-corrected, dual-mode AMT data provided additional deep structural information and, together with the joint 1-D results, enabled an assess- ment of the distribution of aquifers and major structural controls in the region. The east–west regional geoelectri- cal model evokes a picture of a gently dipping succession of conductive and resistive units in good agreement with the alternating shaly and sandy formations evinced from preexisting borehole data and previous geological stud- ies. The geoelectric models also show the presence of the large-scale Transbrazilian lineament and other graben- like structures, previously inferred from aeromagnetic data, which may have some control on groundwater dis- tribution. The agreement with geology and aeromag- netic interpretation emphasizes the importance of in- tegrated geoelectrical surveying as a complementary or independent means of obtaining useful stratigraphic and structural information for hydrogeological studies in this region. INTRODUCTION Groundwater is a most valuable natural resource, and it is vi- tally important to be able to detect its occurrence and evaluate the available resources to sustain our domestic and industrial supplies. The groundwater resources of the eastern margin of the Parnaiba basin in northeast Brazil (Figure 1) are relatively poorly understood, and droughts are frequent events in this semiarid region. The main structural features inferred from the Manuscript received by the Editor March 11, 1997; revised manuscript received September 30, 1998. * University of Leicester, Environmental & Industrial Geophysics Research Group, Department of Geology, Leicester LE1 7RH, United Kingdom. E-mail: [email protected]. ‡Observatorio Nacional-CNPq, Rua General Jose Cristino 77, 20921-400 Rio de Janeiro, Brazil. E-mail: [email protected]; [email protected]; [email protected]. ** Formerly at University of Leicester, Environmental & Industrial Geophysics Research Group, Department of Geology, Leicester LE1 7RH, United Kingdom; currently Department of Geophysics, Ankara University, Besevler, Ankara, Turkey. E-mail: [email protected]. §LENEP/UENF, Imboassica, Macae-RJ, CEP 27973-030, Brazil. E-mail: [email protected]. c 1999 Society of Exploration Geophysicists. All rights reserved. aeromagnetic map of the region (Cordani et al., 1984; Nunes, 1993) are shown in Figure 1. These trend northeast–southwest in the eastern margin of the basin and include the continental- scale Transbrazilian lineament. The influence of these linear structures on groundwater occurrence in the region is not known. Routine hydrogeological studies in this region em- ploy geological information and exploratory drilling. A large number of water development boreholes have been drilled in the key towns and villages, but not all are successful. Shallow 337
Transcript of Regional aquifer mapping using combined VES-TEM-AMT/EMAP methods in the semiarid eastern margin of...

GEOPHYSICS, VOL. 64, NO. 2 (MARCH-APRIL 1999); P. 337–356, 21 FIGS., 2 TABLES.
Case History
Regional aquifer mapping using combinedVES-TEM-AMT/EMAP methods in the semiarideastern margin of Parnaiba Basin, Brazil
M. A. Meju∗, S. L. Fontes‡, M. F. B. Oliveira‡, J. P. R. Lima‡,E. U. Ulugergerli∗∗, and A. A. Carrasquilla§
ABSTRACT
As part of a program to evaluate the utility of in-tegrated geoelectrical methods for subsurface struc-tural mapping and groundwater resource investigationin the semiarid eastern margin of the Parnaiba basin inBrazil, several vertical electrical soundings (VES) andtransient electromagnetic (TEM) and tensorial audio-magnetotelluric (AMT) measurements were carried outalong a 250-km-long east–west transect (passing throughmajor towns and cities) and a 127-km-long north–southprofile (passing through small farm settlements). Thevarious data sets have been jointly processed using anovel integration scheme and a constrained 1-D in-version technique to yield the resistivity structure un-derneath each observation station. Regularized 2-D in-version of static-shift-corrected, dual-mode AMT dataprovided additional deep structural information and,
together with the joint 1-D results, enabled an assess-ment of the distribution of aquifers and major structuralcontrols in the region. The east–west regional geoelectri-cal model evokes a picture of a gently dipping successionof conductive and resistive units in good agreement withthe alternating shaly and sandy formations evinced frompreexisting borehole data and previous geological stud-ies. The geoelectric models also show the presence of thelarge-scale Transbrazilian lineament and other graben-like structures, previously inferred from aeromagneticdata, which may have some control on groundwater dis-tribution. The agreement with geology and aeromag-netic interpretation emphasizes the importance of in-tegrated geoelectrical surveying as a complementary orindependent means of obtaining useful stratigraphic andstructural information for hydrogeological studies in thisregion.
INTRODUCTION
Groundwater is a most valuable natural resource, and it is vi-tally important to be able to detect its occurrence and evaluatethe available resources to sustain our domestic and industrialsupplies. The groundwater resources of the eastern margin ofthe Parnaiba basin in northeast Brazil (Figure 1) are relativelypoorly understood, and droughts are frequent events in thissemiarid region. The main structural features inferred from the
Manuscript received by the Editor March 11, 1997; revised manuscript received September 30, 1998.∗University of Leicester, Environmental & Industrial Geophysics Research Group, Department of Geology, Leicester LE1 7RH, United Kingdom.E-mail: [email protected].‡Observatorio Nacional-CNPq, Rua General Jose Cristino 77, 20921-400 Rio de Janeiro, Brazil. E-mail: [email protected]; [email protected]; [email protected].∗∗Formerly at University of Leicester, Environmental & Industrial Geophysics Research Group, Department of Geology, Leicester LE1 7RH,United Kingdom; currently Department of Geophysics, Ankara University, Besevler, Ankara, Turkey. E-mail: [email protected].§LENEP/UENF, Imboassica, Macae-RJ, CEP 27973-030, Brazil. E-mail: [email protected]© 1999 Society of Exploration Geophysicists. All rights reserved.
aeromagnetic map of the region (Cordani et al., 1984; Nunes,1993) are shown in Figure 1. These trend northeast–southwestin the eastern margin of the basin and include the continental-scale Transbrazilian lineament. The influence of these linearstructures on groundwater occurrence in the region is notknown. Routine hydrogeological studies in this region em-ploy geological information and exploratory drilling. A largenumber of water development boreholes have been drilled inthe key towns and villages, but not all are successful. Shallow
337

338 Meju et al.
wells in the upper-level sedimentary aquifers and fracture-zoneaquifers in crystalline rocks are important sources of water formany small rural communities in the region, but most of thesewells experience significant seasonal fluctuations in groundwa-ter yield; dry river channels are a common feature during thedry season. Interestingly, limited isotopic hydrological studiesappear to suggest that the groundwater in the deep regionalaquifers accumulated slowly in Pleistocene times under morefavorable climatic conditions than during the present time andmay therefore be considered a nonrenewable resource, re-quiring careful assessment or monitoring to avoid depletion(Frischkorn and Santiago, 1992). Thus, a major concern of thegovernmental groundwater agency is how to effectively evalu-ate and manage the groundwater resources in the region.
Effective management of water usage in the region wouldrequire an evaluation of the shallow- as well as the deep-waterresources (that can be cost-effectively developed to sustainsome of the rural populations) and a good understanding of thestructural controls on groundwater occurrence as well as therecharge potential of the aquifers. A major research programwas initiated in 1993 to improve the general understanding ofthe hydrogeology of the region. The three main phases of thislong-term program are (1) evaluate geophysical methods foreffective mapping of stratigraphic and structural features thatmight be potential groundwater resources; (2) understand the
FIG. 1. Simplified structural framework of the basement in theParnaiba basin from qualitative aeromagnetic interpretation(after Goes et al., 1993). The present area of study and theprincipal ground survey lines are also shown. Inset map showsthe location of Parnaiba basin in Brazil.
relationship between geophysical information and hydraulicproperties of the main aquifers in the region; and (3) integrate3-D geophysical, hydrogeological, and hydrochemical data toyield a regional model that may be useful for groundwater re-source investigations. This paper deals with the first stage ofthe program.
The inductive and galvanic resistivity depth sounding meth-ods are popular tools in groundwater investigations (Palackyet al., 1981; Stewart, 1982; Fitterman and Stewart, 1986;McNeill, 1987; Meekes and Van Will, 1991; Sandberg, 1993;Meju and Fontes, 1996) and have been adopted in this study.Previous geoelectrical studies in the region have involved verylimited dc resistivity mapping of potential shallow aquifers bygovernment and commercial agencies and scalar AMT sub-surface resistivity mapping (Vitorello and Padilha, 1993); theirsimplistic 1-D interpretation of the band-limited data from in-dividual geoelectrical methods suffered from lack of model res-olution. Recent developments in field instrumentation, surveytechniques (e.g., Torres-Verdin and Bostick, 1992), and joint in-terpretation of complementary electrical and electromagneticdata sets (e.g., Raiche et al., 1985; Meju, 1995, 1996a) have led toimproved capabilities for high-quality field measurements andmodel identification. In this study, we therefore preferred anintegrated approach involving coincidentally located electricaland electromagnetic (EM) measurements and more sophisti-cated data interpretation.
Several geophysical surveys were conducted from 1993 to1997 using dc resistivity, transient electromagnetic (TEM),and audio-magnetotelluric (AMT) depth sounding methods.Two orthogonal traverses and a number of localized electro-magnetic array profiles (EMAP) (Torres-Verdin and Bostick,1992) were conducted solely to determine the usefulness ofintegrated electrical and electromagnetic methods in mappingthe hydrologically important stratigraphic units and any majorstructural controls on aquifer distribution in the region. Inte-grated 1-D inversion of the various types of data and 2-D inver-sion of the AMT data were undertaken. The results from thetwo transects and the plausible hydrogeological implicationsare discussed in this paper.
REGIONAL GEOLOGY
The Parnaiba basin is located in the northeastern part ofBrazil (Figure 1) and extends for about 1000 km northeast–southwest and 800 km northwest–southeast, giving it an el-liptical outline. The gross structural framework of the re-gion is three dimensional, but there is a dominant geologicalstratification that is interrupted by faulting and occasionalsmall-size igneous intrusions. The basement architecture isdominated by large-scale lineaments and more localizedgraben-like features (Figure 1). The basement (composed ofschists, phyllites, granites, and gneisses) is directly overlain byan alternating sequence of commonly coarse-grained areniticformations (conglomerates, sandstones, and quartz pebbles offluvial, deltaic, glacial, or fluvioglacial origin) and fine clas-tics (marine/lacustrine shales and siltstones or fine aeoliandeposits). The lithological architecture is thus favorable forthe occurrence of several potential aquifers and confining ma-terials. Mesozoic and Cenozoic clastics occur in subordinateamounts, their thickness not exceeding 500 m (Schobbenhauset al., 1984). Paleozoic clastic sediments of continental origin

Integrated VES-TEM-AMT Aquifer Mapping 339
dominate the lithology and may reach a thickness of 2700 m(Cunha, 1986). The Paleozoic rocks were deposited duringthree major cycles, separated by regional discordances, andthe typical stratigraphic sequence is shown in Figure 2a. Therather thin sedimentary cover is in contrast with the large hor-izontal dimension of the basin, indicating a very slow subsi-dence during the Paleozoic (Cunha, 1986). A resistivity logfrom a deep hydrocarbon exploration well southwest of thearea of study (about 400 km west of Sao Raimundo Nonato,Figure 1) is shown in Figure 2b. In this electric well log, theLonga, Pimenteiras, Tiangua, and Ipu Formations are conduc-tive while the Poti, Cabecas, Itaim (lower part), and Jaicos aremoderately resistive. The conductive formations are mostlyshaly and/or silty in composition, while the resistive ones are
FIG. 2. (a) Lithostratigraphic column of the Paleozoic sedi-ments of the Parnaiba basin (after Cunha, 1986). (b) Resistivitywell log and schematic geological profile from a deep boreholeoutside the area of study in the southwestern part of the basin(after Masero et al., 1995).
dominantly sandy (Figure 2). Since the alternating sandy andshaly lithostratigraphic units may be distinguished on the basisof their resistivity characteristics, surface geoelectrical depthsounding methods may be used successfully to map their vol-umetric distribution in this basin.
GEOPHYSICAL FIELD SURVEYS
In January and February 1993, a regional joint TEM-AMTsurvey was conducted across the southeastern segment of theParnaiba basin. The survey profile extends 250 km from thecrystalline basement area east of Sao Juliao in Piaui Stateinto Maranhao State of Brazil, passing through major townsand small cities. The TEM-AMT transect is marked AA′ inFigure 3. The strike of the major basement structures in thearea of current interest (see Figure 1) is approximately N62◦E,and the magnetic declination is 21◦ west of geographic north.The stations were distributed in such a manner as to allow themain geological units expected in the region to be sampled.Tensorial AMT data were collected using 100 m electric dipolelengths in the magnetic east–west and north–south directions(respectively dubbed yx and xy polarizations) at each station.Central-loop and single-loop TEM data were also acquired atthese sites using a 100-m-sided transmitter loop. AdditionalTEM soundings were made outside the main TEM-AMT sta-tions at the eastern end of the line (stations A3 and A4) forbetter tracking of the basement-sediment contact.
During July and August 1995, dc resistivity, TEM, and MTsoundings were made along line BB′ in Figure 3, running fromAmarante to Itaueira. Mostly sparsely populated farm settle-ments lie along this line, and measurements were somewhatlimited to accessible sites near the main roads running north–south through the area. The coordinates of each survey sta-tion were determined using a portable Global Positioning Sys-tem (GPS). The horizontal resolution of the hand-held GPSreceivers used is about 100 to 150 m—adequate for the re-gional surveys but with a vertical resolution not satisfactoryfor our task. The station elevations were therefore estimatedfrom existing topographic maps. The VES measurements usedthe Schlumberger configuration. The TEM data were recordedusing the central-loop method, with transmitter loops of 50 mside length and a small dipole receiver. The TEM equipment,with the first recording time window at 6.9 µs, has good ca-pability for accurate mapping of shallow-depth structures. Fulltensorial AMT recordings were made at all the main sites alongthe line; continuous electric field recordings (EMAP) were alsomade at selected sites (e.g., B3) for additional structural con-trol. The EMAP adaptation consisted of a conventional five-component (i.e., three magnetic and two electric fields) basestation and five contiguous electric field dipoles, each 50 m (orsometimes 100 m) long, oriented across strike (orthogonal lineswere also recorded at specific sites). TEM/VES measurementswere centered at all the grounding points of the EMAP elec-tric dipoles. Owing to the difficulty in obtaining good groundcontact for the galvanic methods in this dry (hard ground) ter-rain, reliable VES data were only obtained for limited currentelectrode separations (AB < 200 m). However, a maximumseparation of 100 m (i.e., AB/2 of 50 m) was sufficient to obtaingood overlap with the TEM data, which in turn overlappedwith the deeper probing AMT data as shown later (see Mejuand Fontes, 1996). The main thrust of the 1995 field campaign

340 Meju et al.
was the determination of north–south variations in structurethat might improve our understanding of the hydrogeophysicalframework of the basin and any structural controls on ground-water distribution.
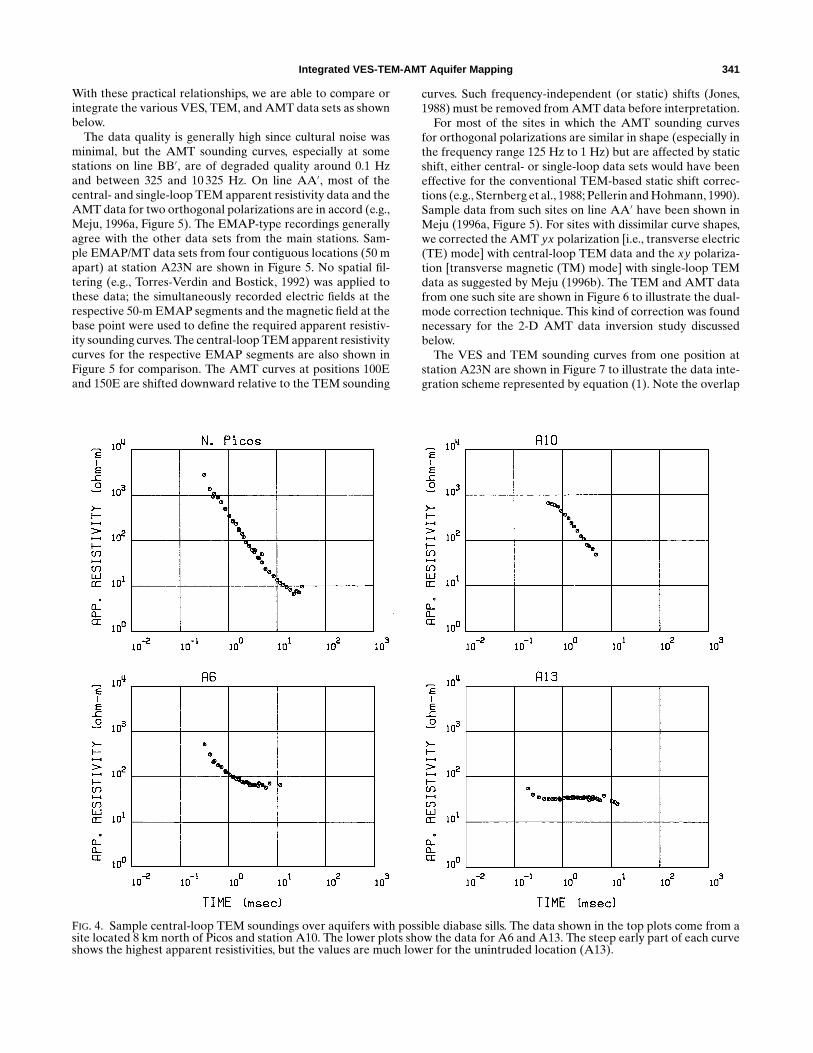
Also during the 1995 field season, VES-TEM soundings wereperformed at some sites of interest on line AA′. Station A23N(offset 5 km northeast from A23) was occupied in the westernpart of the line since shallow-depth (<15 m) TEM soundingswere found necessary for mapping the shallow aquifers withinthe Piaui Formation. Some soundings were also made off-linenear Picos and Gaturiano (Figure 3) for improved stratigraphicmapping and to trace the lateral subcrop extent of a diabasebody westward from the outcrop point, about 8 km north ofPicos. Figure 4 shows that the locations with outcropping orsubcropping diabase sills have highly resistive early time TEMresponses that can be distinguished easily from those obtainedover unintruded sediments. Where a relatively resistive earlytime TEM response is observed over an exposed sandy forma-tion (see station A13, Figure 4), it indicated the presence ofan unsaturated zone in an unconfined aquifer and suggestedthat TEM soundings could be used to map the water table atsuch locations (supporting test cases from line CC′ are shownby Meju et al., 1997).
FIG. 3. Site map of the VES-TEM-AMT surveys. The station numbering is from the east to west for line AA′ and north to southfor line BB′. For clarity, the station numbers are shown only for locations for which there are AMT soundings. An AMT stationmay in turn consist of a group of 5 to 6 (EMAP) sounding positions 50 or 100 m apart. Lines CC′ and DD′ are recently completedTEM-AMT survey lines.
More recently, several other surveys were made to improvethe areal coverage with geophysics (which may have implica-tions for future recharge studies). In August and September1996, line BB′ was extended southward across the basin intothe exposed crystalline basement complex (see Figure 1) and toinvestigate a small-scale graben at the basin margin that servesas the source of groundwater for the city of Sao RaimundoNonato (Fontes et al., 1997). Two 70-km-long lines (CC′ andDD′ in Figure 3) were surveyed during August and September1997; four sites (three in the Picos area) were also occupiedalong line AA′ for improved structural mapping.
DATA PROCESSING AND INTEGRATION
For comparative analysis of TEM and AMT data, we usedthe scaling relation between TEM time (t) and MT wave pe-riod (T) in seconds given by Meju [1998a; equation (3)], i.e.,T = 3.9t . In the case of vertical electrical soundings (VES) andTEM, we used the approximate scaling relation (Meju, 1996b)
log10 t ∼= 2 log10(AB/2)− 5, (1)
where AB is the Schlumberger current electrode separation inmeters and t in this case is the transient time in milliseconds.
Integrated VES-TEM-AMT Aquifer Mapping 341
With these practical relationships, we are able to compare orintegrate the various VES, TEM, and AMT data sets as shownbelow.
The data quality is generally high since cultural noise wasminimal, but the AMT sounding curves, especially at somestations on line BB′, are of degraded quality around 0.1 Hzand between 325 and 10 325 Hz. On line AA′, most of thecentral- and single-loop TEM apparent resistivity data and theAMT data for two orthogonal polarizations are in accord (e.g.,Meju, 1996a, Figure 5). The EMAP-type recordings generallyagree with the other data sets from the main stations. Sam-ple EMAP/MT data sets from four contiguous locations (50 mapart) at station A23N are shown in Figure 5. No spatial fil-tering (e.g., Torres-Verdin and Bostick, 1992) was applied tothese data; the simultaneously recorded electric fields at therespective 50-m EMAP segments and the magnetic field at thebase point were used to define the required apparent resistiv-ity sounding curves. The central-loop TEM apparent resistivitycurves for the respective EMAP segments are also shown inFigure 5 for comparison. The AMT curves at positions 100Eand 150E are shifted downward relative to the TEM sounding
FIG. 4. Sample central-loop TEM soundings over aquifers with possible diabase sills. The data shown in the top plots come from asite located 8 km north of Picos and station A10. The lower plots show the data for A6 and A13. The steep early part of each curveshows the highest apparent resistivities, but the values are much lower for the unintruded location (A13).
curves. Such frequency-independent (or static) shifts (Jones,1988) must be removed from AMT data before interpretation.
For most of the sites in which the AMT sounding curvesfor orthogonal polarizations are similar in shape (especially inthe frequency range 125 Hz to 1 Hz) but are affected by staticshift, either central- or single-loop data sets would have beeneffective for the conventional TEM-based static shift correc-tions (e.g., Sternberg et al., 1988; Pellerin and Hohmann, 1990).Sample data from such sites on line AA′ have been shown inMeju (1996a, Figure 5). For sites with dissimilar curve shapes,we corrected the AMT yx polarization [i.e., transverse electric(TE) mode] with central-loop TEM data and the xy polariza-tion [transverse magnetic (TM) mode] with single-loop TEMdata as suggested by Meju (1996b). The TEM and AMT datafrom one such site are shown in Figure 6 to illustrate the dual-mode correction technique. This kind of correction was foundnecessary for the 2-D AMT data inversion study discussedbelow.
The VES and TEM sounding curves from one position atstation A23N are shown in Figure 7 to illustrate the data inte-gration scheme represented by equation (1). Note the overlap

342 Meju et al.
between the VES (maximum AB/2 of 50 m) and central-loopTEM data (with the first time window of 6.9µs), which suggeststhere will be no loss in subsurface coverage in this hard-groundterrain if a short-spreadlength VES configuration is used judi-ciously with shallow-probing TEM equipment. On the rightpanel of Figure 7 are the known geological formation bound-aries at a nearby shallow groundwater well (see Meju, 1998),the result of simple resistivity-versus-depth conversions of theVES and TEM soundings (Meju, 1995, 1998), and an interpre-tive 1-D model for the joint data set. The agreement betweenthe various observed and computed VES-TEM responses inthe left panels of Figure 7 was taken as an empirical validationof the data integration scheme. There is also good agreementbetween geological information and the subsurface resistivityvariations at this location. This latter feature and the fact thatthe VES, TEM, and AMT curves are similar in shape at theoverlap regions at most of the sites (see Figure 8 for represen-tative data sets for line BB′) suggests that joint 1-D inversiontechniques may be useful for retrieving the resistivity structureof the sedimentary sequence in the study area.
FIG. 5. Sample central-loop TEM and EMAP/AMT apparent-resistivity sounding curves from four contiguous 50-m samplingsegments at station A23N. The TEM data are shown by the round symbols, while the AMT data are represented by the triangularsymbols. The AMT curves from positions 100E and 150E show a downward static shift relative to the overlapping TEM curvesegments.
INVERSION APPROACH AND PRACTICALCONSIDERATIONS
Our approach in 1-D joint inversion is to bias our re-sult toward any available borehole geological information. Toachieve this goal, we adopted the nonlinear biased estimationalgorithm (Meju, 1994):
mest =[AT∗EA∗+DT BD
]−1[(WA∗)T {dc}+DT Bh], (2)
where E=WT W,W is the diagonal weighting matrix contain-ing the reciprocals of the observed data errors, {dc}= {Wy∗ +WA∗m0} are a kind of data, D is a derivative regulariza-tion matrix, B=βTβ is a matrix of undetermined multipliers,y∗ = [d∗ − f∗ (m0)] is the joint discrepancy vector for VES-TEM-AMT, and A∗ = ∂ f∗(m0)/∂m0 is the joint matrix of partialderivatives evaluated at an initial model, m0. The combinedfield responses (apparent resistivities, AMT phases, TEM-induced voltages, and VES resistances) are contained in d∗ andthose predicted by forward modeling are contained in f∗(m0).

Integrated VES-TEM-AMT Aquifer Mapping 343
FIG. 6. Correction of static shift in 2-D AMT data using TEM data. The AMT TE and TM mode apparent-resistivity curveswere respectively corrected using central- and single-loop TEM data (Meju, 1996b). The top plots show the TEM and AMTapparent-resistivity data; the bottom plots show the TEM voltage decay and AMT phase curves. The symbols are as in Figure 5. Thecentral-loop and TE mode data are shown in the left panels; the single-loop and TM mode data are presented in the right panels.
FIG.7. Example of integrated VES-TEM data analysis. The field apparent-resistivity data (circles for VES, rectangles for central-loopTEM) are shown in the top left-hand panel, while the TEM voltage decay data (upper curve) and VES resistance data in ohms (lowercurve) are shown in the lower panel. The right-hand plot shows an interpretive 1-D model (solid lines), simple resistivity-depthtransformations of the data (squares for VES, crosses for TEM), and the observed lithological boundaries at a nearby waterwell (horizontal dashed lines: 1=boundary between upper sandstone and clay/silt deposit at 12.45 m depth, 2= boundary betweenclay/silt and basal sandstone at 20 m depth, EOH= end of hole). The computed response curves for the 1-D model are superimposedon the field data in the left-hand plots (solid lines for VES, dashed lines for TEM).

344 Meju et al.
The vector h contains the a priori parameter estimates (e.g.,formation boundaries) toward which we wish to bias our solu-tion. The above algorithm is applied iteratively. With the ex-ception of AMT phase data, the logarithms of the earth’s re-sponse functions are considered in the inversion scheme, i.e.,y∗ = {`n d∗ − `n f∗(m0)} and A∗ = ∂{`n f∗(m0)}/∂m0 as in stan-dard practice (e.g., Meju, 1996a). The components of m arealso taken to be the logarithms of the resistivities and interfacedepths of the sought subsurface model.
Selection of effective geological constraints
Our strategy is to derive a starting model from the simpleresistivity transformations (Bostick, 1977; Meju, 1995, 1998)for each station, since they map out geologically significantlithological units (Meju, 1998). However, some thin beds ofpossible hydrogeological significance may be missed if we relyonly on these data transformations for model construction.Prior to routine 1-D inversion, we first assessed the approx-imate resolving power of the joint data sets acquired at a con-trolled site in the region to understand what the geoelectricsignatures for the various survey stations might represent and
FIG. 8. Unconventional integration of electrical and electromagnetic field data using approximate scaling relations. Sample VES(circles), central-loop TEM (triangles), and AMT yx polarization (crosses) data sets from line BB′ are presented. The maximumAB/2 for VES is 100 m at station B1 and 50 m at the others. Note the overlap between VES and early time (≥6.9 µs) TEM dataand also between TEM and AMT sounding curves.
the additional geological constraints needed in the inversionprocess for improved stratigraphic definition. Station B3 isnear a deep hydrocarbon exploration well; the available strati-graphic data and resistivity log for the deep section of the bore-hole are summarized in Figure 9. In the electric well log (Fig-ure 9), the Longa, Pimenteiras, Tiangua, and Ipu Formationsare conductive (except where intruded by diabase sills), whilethe Poti, Cabecas, Itaim, and Jaicos are moderately resistive(see Figure 2b). Using surface measurements alone, it canbe expected that the thickness of the Cabecas Formation willbe overestimated at locations where the upper part of the Pi-menteiras Formation is intruded by resistive diabase sills. Weexperimented with the idea of mapping conductive markerhorizons (shaly formations) for better regional correlations.The Pimenteiras Formation is quite thick and is confined be-tween resistive formations at B3. It may thus be an easily de-tectable marker horizon. However, its thickness will be over-estimated at locations where the upper part of the underlyingItaim Formation is similarly conductive (Figure 2b). For im-proved model identification and to gauge the resolving powerof AMT measurements, we selected the thinner Longa Forma-tion as a second marker horizon for the western half of thesurvey area, where it is known to occur.

Integrated VES-TEM-AMT Aquifer Mapping 345
Using a simple blocked version of the original resistivitywell log (Figure 9) and supplemented by near-surface resis-tivity information from surface VES and TEM measurements(see also, Meju, 1998, Figure 3), we computed the TEM andMT responses for the resulting resistivity structure shown inthe right panel of Figure 10. Note the similarity between thecomputed model responses and the field sounding curves. Theresponses of another model in which only the resistivity ofthe upper 50 m of the Longa Formation is different (i.e., has avalue of 40 ohm·m instead of 10 ohm·m as in the electric log) arealso shown in this figure for comparison. There is a significantdifference between the observed and computed AMT phasedata around 50 to 120 Hz without the Longa conductor. Alsoshown for comparison in the right panel of this figure are someof the formation boundaries of Figure 9 and the result of sim-ple resistivity-versus-depth transformations of the VES-TEM-AMT data. The overburden is 4.6 m thick at the sounding lo-cation. There is good agreement between the resistivity-depthtransformations and the main features of the borehole resis-tivity and lithologic logs (see Figure 9). We may thus use thisagreement with borehole data and the potential AMT phasesignature to search for the Longa marker horizon and the Pi-menteiras conductor away from the main borehole site.
1-D inversion results
All the depth soundings for lines AA′ and BB′ were invertedwith the above-mentioned constraints to an rms error of 1.0
FIG.9. Geological formation boundaries and electrical resistiv-ity well log from station B3. The symbol d represents diabasesill. About 4.5-m-thick superficial deposits overlie the PiauiFormation at this site.
to yield the resistivity structure underneath each survey loca-tion. The AMT yx polarization (i.e., TE mode), central-loopTEM, and the available VES data were selected for the jointinversion process. The TEM data were adjusted for transmitterturn-off effects (Raiche, 1984) before inversion. An exampleof a joint VES-TEM-AMT inversion result for one station isgiven in Figure 11. The VES data helped constrain the resis-tivity structure in the top 20 m. The TEM data provided over-lapping information from about 12 to 250 m in this case, whilethe AMT data helped image the depth range 23 m to morethan 10 km. Although Figure 10 suggests that AMT data of upto 10 KHz would overlap with the adopted short-spreadlengthVES data, we found the high-frequency (325 to 10 325 Hz)AMT data of poor quality in comparison with TEM data andonly included them in the joint inversion at a few stations. Asummary of the joint inversion results for all the VES-TEM-AMT stations on line BB′ is given in Figure 12; the near-surfacestructure mapped by VES data has been conveniently omit-ted in this figure but was useful in constraining the joint in-version process. It was only necessary to maintain the samenumber of geoelectrically significant units as B3 during the in-version of the data from the stations north of B8. Stations B8 toB12 have comparable subsurface resistivity distributions, andthe geoelectrical basement appears to be deepest within thiszone. Station B14 shows a marked shallowing of the geoelectricbasement.
2-D inversion approach
Since the basement structure would have influenced the ar-chitecture of the overlying sediments, 2-D AMT inversion wasundertaken to map any such structural features along line AA′
using three different regularized inversion codes:
a) the rapid relaxation inverse program (RRI2D) of Smithand Booker (1991),
b) the finite-difference transmission network program ofR. L. Mackie (Mackie et al., 1988, 1997a, 1997b) us-ing a nonlinear conjugate gradient inversion technique(RUND2INV NLCG), and
c) the finite-element-based ridge regression program ofUlugergerli and Meju (1997) using complex singular-value decomposition (2DRR CSVD).
The AMT phase and static-shift-corrected apparent resistiv-ity data for the TE and TM modes were jointly inverted. Weused 17 frequencies (logarithmically equispaced from 125 Hzto 0.014 Hz). The inversion process was initiated first with a100-ohm·m half-space model and then with a structured modelconstructed using the integrated 1-D result at each site (thustaking advantage of the information provided by the comple-mentary shallow probing methods). The desired misfit was setat an rms value of 1.0, but a threshold rms error of about 1.1 wasalso deemed acceptable (see Meju and Hutton, 1992). Exceptfor RRI2D applications, the surface topography was taken intoaccount in the computations. In the case of RRI2D, the lowesttopographic height along the given profile was taken as the da-tum plane. Any common features found in the models resultingfrom these three schemes and two different initial models aredeemed geologically important. We present the 2-D results forthe upper 5 km of the subsurface.

346 Meju et al.
FIG. 10. Simple assessment of resolving power of depth soundings at station B3. In the left-hand plots, the top panel shows theobserved VES (triangles), central-loop TEM (squares), and AMT yx (crosses with associated standard errors) apparent-resistivitydata. The AMT phase data and the logarithms of the VES resistances (in ohms) and TEM voltage decay curves are shown inthe bottom panels. The Bostick (1977) type transformations of the data are shown in the right-hand plot together with the topsof some formation boundaries from Figure 9 (shown as horizontal dashed lines with shortened formation names). The computedTEM-AMT responses of a simplified VES/borehole resistivity model (solid lines) and a similar model in which the resistivity of theupper part of Longa Formation is changed from 10 Äm to 40 Äm (dashed lines) are superimposed on the field measurements forcomparison.
FIG. 11. Sample result of joint VES-TEM-AMT inversion. The symbols have the same meaning as for Figure 10.

Integrated VES-TEM-AMT Aquifer Mapping 347
Line BB′ was originally intended to map the along-strikevariations in structure and lithology and so requires 3-Dmodeling for any realistic interpretation of basement archi-tecture. This is outside the scope of the present study; instead,we have attempted to model the lateral variations within thesedimentary section using a 2-D approximation with attentionbeing paid to the TM mode. For each station, we selected 24frequencies (125–0.014 Hz) for the xy polarization and jointlyinverted the apparent resistivity and phase data. For the 2-Dinversion of line BB′ data, the AMT data from station A25 andan extra sounding position about 14 km southeast of B14 (notshown in Figure 3) were incorporated. We also projected thesites onto a straight line such that the actual site spacings usedin the 2-D inversion are different from those in Figure 3.
REGIONAL GEOELECTROSTRATIGRAPHICINTERPRETATION
North–south variations
The main geoelectric units in the joint 1-D VES-TEM-AMTmodels for line BB′ (Figure 12) have been correlated to formthe geoelectric section shown in Figure 13. A good deal oflateral continuity of geoelectric layers is suggested betweenstations B2 and B7 in this model since we biased our inter-pretation toward the known geology at station B3. The base-
FIG. 12. A summary of 1-D joint inversion results for all the AMT sites along line BB′. The numerical values in the section representapparent resistivities in ohm-meters.
ment appears to be severely faulted, especially between sta-tions B7 and B14. Some of the inferred faults transect the entiresedimentary thickness (e.g., between B7 and B8 and betweenB9 and B10). The zone of deep faulting between B7 and B14may be related to the Transbrazilian lineament (TBL) and ap-pears to contain anomalously thickened sedimentary deposits.North of this zone, the main sedimentary formations appear tohave been successfully mapped using the integrated geoelectri-cal methods. The uppermost resistive units correspond to themember units of the Piaui Formation (based on comparisonswith the detailed stratigraphic log from B3). The underlyingPoti Formation is thickest around B8 and B9 and thinnest southof B10. The Longa, Cabecas, and Pimenteiras Formations canbe identified separately in the inversion models, but we foundit difficult to resolve the Itaim, Jaicos, Ipu and Tiangua Forma-tions individually using the present field data sets. We insteadattempted to map combinations of formations as depicted inthe interpretive section (Figure 13). We inferred two other ma-jor basement faults north of the TBL zone, and it appears thatstation B3 is located on a structurally high part of a folded orfaulted feature.
A 2DRR CSVD inversion model for line BB′ is shown inFigure 14. The xy apparent resistivity field data and the in-version model (TM mode) responses for line BB′ are shownin Figure 15. There is a good match between the observed

348 Meju et al.
and computed data for the chosen AMT polarization at highfrequencies (125–0.1 Hz). The lower frequencies are poorlymatched at many sites (e.g., B8 and B14), so there is poor modelresolution at basement depths. However, we are mostly inter-ested in structural variations in the sedimentary section in thisapproximate 2-D interpretation. As a qualitative gauge of thevalidity of the 2-D model, we computed the corresponding ap-parent resistivity and phase data for the TE mode and foundthey look similar to the actual field data recorded in the yxdirection (see Figures A-1 and A-2). The sedimentary sectionthus appears not to have a very complicated structure and wemay therefore compare the present 2-D model with the inter-pretive joint 1-D model (Figure 13).
There are structural similarities between the 2-D model andthe geoelectric section derived from joint 1-D models. The up-per 1 km in the 2-D model is moderately resistive, but the baseof this resistor appears to be shallower at B3 where a structuralhigh is suggested in accord with our 1-D interpretation. Thelaterally persistent conductive unit below this resistor iscorrelated with the Pimenteiras Formation and is thickest inthe southern section of the profile. The depth to the basementis about 2.2 km in the northern half of the line, and there is amajor discontinuity in the resistivity structure at the inferred
FIG. 13. Interpretive geoelectric structure for line BB′. The numbers in the section represent resistivity estimates in ohm-meters.The inferred correlations with geological formations and faults are also shown. Sea level is the datum level.
FIG. 14. Sample 2-D model for line BB′. The 2DRR CSVDprogram was used for reconstructing this model. Over 30 it-erations were performed, and emphasis was on fitting thehigh-frequency data. The AMT station locations are denotedby asterisks.

FIG. 15. Comparison of TM mode apparent-resistivity field and model data for line BB′. The observed apparent-resistivity data areshown by the triangles; the computed model data are represented by the circles. (a) Results for stations B1, B3, B5, and B7. (b)Results for stations B8, B10, B12, and B14.

350 Meju et al.
position of the TBL zone. Within that zone, the upper part ishighly resistive and dyke-like in form while the bottom partis of low resistivity. There are also horizontal sheet-like resis-tive bodies in the near surface around Floriano. These resistivegeoelectric units may be diabase bodies since extrusive igneousbodies are known to occur east of Floriano.
East–west variations
Figure 16 shows the result of collating all the joint 1-D in-version models for line AA′ and correlating between similargeoelectrical units. This geoelectric section may be comparedwith a borehole-constrained geological cross-section (Goeset al., 1993) shown in Figure 17. There is some semblancebetween both sections. The integrated electrical and electro-magnetic approach thus appears to be an effective mappingstrategy in this basin, and one may speculate on the possi-ble spatial resistivity characteristics of the various geologicalformations. Examining the geoelectric section, the two up-per geoelectric horizons mapped westward from station A21correlate with the Piaui Formation. The underlying resistive(50–100 ohm·m) layer outcropping between A21 and A17 cor-relates with the Poti Formation. These upper units are immedi-ately underlain by a downward sequence of layers of low resis-tivity (6–20 ohm·m), moderate resistivity (50–100 ohm·m), andlow resistivity (4–20 ohm·m) in that order, which respectively
FIG. 16. Interpretive geoelectric section for survey line AA′. The numbers in the section represent resistivity values in ohm-meters.The inferred correlations with geological formations and faults are also shown. Sea level is the datum level. The surficial layer atstations A 23 to A 26 is very resistive (>60 ohm·m).
correlate with the Longa, Cabecas, and Pimenteiras Forma-tions. The basal parts of the stratified sequence in this resistivitysection may correspond to the Itaim–Jaicos system—whichappears to be of moderate resistivity (≥100 ohm·m)—and
FIG. 17. A geological cross-section of Parnaiba basin (afterGoes et al., 1993). The section incorporates geological con-straints from some boreholes in the region (e.g., SI1, FV1, andFL1). Although depicted as a linear section, it runs along lineAA′ from the eastern end to the Oeiras area (see Figure 3) andthen continues in a northwest direction, passing through theborehole at station B3. Sea level is the datum level.

Integrated VES-TEM-AMT Aquifer Mapping 351
the Tiangua–Ipu system of lower resistivity (15–40 ohm·m).This conductive basal unit appears to thicken considerablyin the Picos area where basement-deep block faulting is in-ferred. The anomalous zone in the Picos area coincides geo-graphically with the location of a possible major graben in-ferred from regional aeromagnetic data (see Figure 1) butis not indicated in the geological section of Figure 17. Also,the current geological model of the region (Figure 17) sug-gests that the Jaicos, Tiangua, and Ipu Formations are undif-ferentiated in the Picos area. The deep conductor may thusbe indicative of the presence of pre-Silurian sediments atdepth in the inferred graben. The geoelectric basement is veryresistive.
Between stations A12 and A14 in Figure 16, we have inter-preted the contact between the uppermost resistive zone andthe underlying zone of moderate resistivity as the water ta-ble in the unconfined part of the Cabecas Formation. Betweenstations A10 and A11, the upper part of the Cabecas Forma-tion appears to contain an anomalous resistive (>1000 ohm·m)body (interpreted as a diabase sill). A comparable resistive(>500 ohm·m) feature is suggested around station A6 in thelower part of Pimenteiras Formation and may be a diabaseintrusion or the resistive Itaim Formation. The choice of dia-base in our model is biased by the geological interpretation ofFigure 17 and the known presence of diabase outcrops westof Picos. The zone of deep basement faults suggested betweenstations A20 and A23 coincides geographically with the posi-tion of the TBL zone inferred from regional aeromagnetic dataanalysis (Cordani et al., 1984) (see Figure 1). There appears tobe an approximately 45-km-wide zone of possibly folded strataimmediately to the east of the major lineament, which agreeswith the current geological model for the region (Goes et al.,1993). Comparable folded or faulted structures are also sug-gested at the western flank of the proposed lineament zone inFigure 16.
The deep-reaching fault interpretation of Figure 16 can betested using the results from 2-D AMT inversion. Interestingly,all the 2-D inversion models for line AA′ showed comparabledeep structures irrespective of the starting models and fittedthe field data over the full range of frequencies inverted, unlikeline BB′. Two of the models derived from an initial structuredmodel are presented here. The RUND2INV NLCG model isshown in Figure 18. Although not presented here, there is agood match between the field data and computed responses ofthe 2-D model. The gross features seen in Figure 16 are retainedin this 2-D model. The RRI2D model is shown in Figure 19 forcomparison. The main deep features of the 2-D models are theirregular topography of the resistive basement and the pres-ence of steep, trough-like zones in the Picos and Floriano areas,corresponding to zones of inferred deep faulting in Figure 16.The Floriano anomalous zone is about 20 km wide and appearsto extend to about 3 km depth in the RRI2D model. In all the2-D models, this zone is characterized by the presence of thick-ened conductive materials (thicker sedimentary sequence ?),and there is a highly resistive, stratigraphically discordant body(diabase intrusion ?) in the upper 1 km. The thickened conduc-tive zone is possibly indicative of the presence of pre-Siluriansediments in the TBL zone (cf. Figure 17). Highly resistive con-cordant bodies are also found in the near surface east of theFloriano area in these models; this feature is consistent with
the authors’ field observation of basaltic extrusions east of thecity of Floriano and with the 2-D model for line BB′ (see Fig-ure 14). The thick, conductive zone in the Picos area occursin the top 1.5 km of the subsurface and is also associated withhighly resistive near-surface materials that spatially correlatewith diabase intrusions. As suggested earlier, there may be rem-nants of pre-Silurian sediments in fault-bounded structures atdepth in this area. The Picos anomalous zone is also well delin-eated in a separate 2-D inversion study of line CC′ (Ulugergerli,1988). It is of exploration interest that the locations of these ma-jor geoelectric features coincide geographically with the aero-magnetically inferred positions of deep, graben-like structuresshown in Figure 1. It thus appears that TEM and AMT methodsare potential structural and stratigraphic mapping tools in thisbasin.
FIG. 18. A 2-D inversion model for line AA′. The model wasconstructed using the RUND2INV NLCG program. The start-ing model has an rms error of 6.0 (i.e., chi-square misfit of68122) and required 30 iterations to retrieve the model shownhere. The final rms error is 1.26. The locations of the AMTstations are denoted by asterisks.
FIG.19. Optimal RRI2D model for line AA′. The symbols havethe same meaning as Figure 18.

352 Meju et al.
DISCUSSION
One technical difficulty faced by the authors during dataacquisition was the hard ground condition in the dry season,which limited VES data acquisition to a large extent. It wouldperhaps be more productive if the VES soundings were under-taken during the rainy season (about 90% of the total rainfallin the region occurs from November to April, 56% of whichoccurs between January and March). A minor but nonethe-less noteworthy problem experienced in the field with TEM isthe so-called IP effect, which causes a persistent sign reversalof the induced voltage (e.g., Lee, 1975, 1981; Weidelt, 1982;Smith and West, 1988) in the soundings at a few sites wherewe found abundant surficial ferrugineous materials. This wasfirst noticed on late-time coincident loop data in 1993; onlythe central loop data were selected for interpretation at suchstations. Paradoxically, comparable effects were also observedon early time central loop soundings (e.g., Table 1) at threecontiguous loop positions at both stations B8 and B9 in 1995.In these cases, only a segment of the TEM sounding curve wasinterpreted. Nevertheless, the existence of such undesirableTEM anomalies underlines the importance of using more thanone technique in such environments for adequate subsurfacecharacterization.
A number of shallow hand-dug wells and deep machine-drilled boreholes were found in the vicinity of the geophysi-cal stations in various parts of the region, but geological logswere available for only one of these wells (there is some use-ful depth information for station B1a). The depths at whichgroundwater was first encountered in some of the wells, as gath-ered from the proprietors, are summarized in Table 2. Theyrange from 15 m to over 150 m. A comparison of the inter-pretive regional models (Figures 13, 16, and 18) with thesedepths of occurrence of groundwater suggests that the zonesof moderate resistivities (50–200 ohm·m) sandwiched betweenlow-resistivity (5–20 ohm·m) horizons are potential aquifers.
Table 1. Early time central-loop TEM data for station B8 showing IP-type effect. The first column shows the delay times; whilethe second and third columns are the decay curves at two contiguous transmitter loop positions. A square transmitter loop of50 m side length with a turn-off time of 1.3 µs and a small dipole receiver with an effective area of 31.4 m2 were used for the depthsoundings.
Delay time (ms) Tx loop position 1 (nV/Am2) Tx loop position 2 (nV/Am2)
6.900000E-03 78911.470000 175016.6000009.000000E-03 49634.710000 92743.9500001.200000E-02 24586.620000 48236.9400001.600000E-02 12200.640000 24191.0800002.020000E-02 5727.707000 11258.6000002.630000E-02 2325.717000 4408.2800003.380000E-02 863.216600 1513.3760004.250000E-02 304.060500 462.4204005.470000E-02 69.267520 43.9490406.930000E-02 −10.031850 −63.0573208.600000E-02 −13.853500 −56.5605101.070000E-01 −16.242040 −45.0955401.380000E-01 −13.089170 −26.7515901.750000E-01 −8.121019 −16.8152902.190000E-01 −5.254777 −10.7006402.800000E-01 −2.890127 −5.3503183.540000E-01 −1.719745 −3.2484084.410000E-01 −1.074841 −2.2929945.610000E-01 −4.538217E-01 −7.643312E-017.070000E-01 −2.149682E-01 −5.732484E-01
The low-resistivity horizons are relatively impermeable strata(aquitards), and the lateral extent of some of the stratifiedstructures in the geoelectric models imply they are regionalaquifers. So far, two groups of aquifers have been tapped inthe region: (1) shallow aquifers in which groundwater is en-countered at depths of 10 to 15 m within the Piaui and PotiFormations and (2) moderately deep aquifers in Piaui, Poti,Cabecas, and Jaicos Formations (with groundwater encoun-tered at depths ranging from 45 m to over 150 m). The yields ofthe confined shallow and deep regional aquifers may be suffi-cient to sustain the various local populations and can be devel-oped, depending on the size of each community, by machine-drilled boreholes. From this limited study, it appears that theCabecas and Jaicos aquifers are relatively untapped in the west-ern part of the study area (probably because of their great depthof occurrence). In the Floriano area, for instance, deep bore-holes (>1200 m deep) would be required to develop the Itaim-Jaicos aquifer based on the geophysical models presented inthis paper.
The main geo-economic problems noted during the 1996field campaigns are the existence of nonproducing or dry wells(e.g., near station B10 and A23N) and saline water in some pro-duction wells such as at B13 (see Table 2). Drilling for ground-water is routinely carried out by traditional drilling companies,and decisions are usually based on experience with geology andpast operations in the basin. In sedimentary environments, theoptimal drilling sites are located in zones of thickest saturatedsection. However, the presence of concealed major structuresmay render such simplistic working guides ineffective and leadto diminished success in drilling or increased borehole devel-opment costs. For instance, near station B10 a borehole wasdrilled to 100 m depth and abandoned since it was found tobe dry. In the light of the evinced structure at this locality (seeFigure 13), this terminal depth is within the Poti Formationand the formation resistivity (about 250 ohm·m in both the1-D and 2-D inversion results) is higher than that found over

Integrated VES-TEM-AMT Aquifer Mapping 353
the prolific aquiferous parts of the formation in the study area.This locality is within the TBL zone. The 2-D inversion re-sults (Figures 14, 18, and 19) suggest the possible presence ofdyke-like (diabase?) intrusions in the upper section or the pres-ence of major faulting that may have juxtaposed permeableand relatively impervious sedimentary blocks, thus disruptingthe hydraulic continuity across the structure. It is possible thatsaline groundwater is channelled along sections of the TBLfault zone, which may explain the occurrence of saline water atstation B13.
CONCLUDING REMARKS
The combined VES-TEM-AMT approach is a powerfultechnology for mapping aquifers in the eastern margin of theParnaiba basin. The AMT method is effective for mappingdeep regional aquifers, while the VES and TEM methods areeffective tools for detecting shallower aquifers. This study hasalso shown that a judicious combination of shallow-depth TEMinstrumentation with AMT and short-spreadlength VES meth-ods offers more flexibility in this region, especially during thedry season when galvanic measurements are difficult and some-times unreliable. The importance of incorporating geologicalcriteria in integrated geoelectrical data analysis is emphasisedin this study. This permitted plausible regional geoelectrical(and stratigraphic) correlations. In terms of aquifer distribu-tion, the resources are of regional scale, and the electricallyconductive Pimenteiras and Longa Formations can be taken
Table 2. Hydrogeological data for different well types in the vicinity of the geophysical traverses. Borehole B1a is near theVES/TEM/AMT station B1. B1b and B1c are, respectively, located about 150 m north and 250 m south of B1a. (Source: boreholeproprietors).
Survey Rock Depth to saturated Aquiferstation formation Well type§ aquifer (m) characteristics
A1 migmatite MDW 1.29 Very low yield,seasonal
A2a mica schist MDW 8 Very low yieldA2b migmatite MDW 20 Medium yield, freshA5 Jaicos MDW 100 High yieldA8 Jaicos MDW 130 High yieldA13 Cabecas MDW 110 High yieldA14 Cabecas MDW 72 Medium yieldA17 Poti MDW 45 Medium yieldA17 Cabecas MDW 110 Artesian, high yieldA18 Poti HDW 12 Low yieldA19 Poti HDW 10 Low yieldA20 Poti HDW 12 Low yieldA23 Piaui HDW 10 High yieldA23N Piaui HDW 8 Very poor yieldB1a Piaui MDW 1.29∗ 8–16 m3/h, pollutedB1a Piaui 8† 80–100 m3/h, freshB1a Piaui 130 60 m3/h, freshB1b Piaui MDW 110 60 m3/h, freshB1c Piaui MDW 111 60 m3/h, freshB8a Poti MDW 70 SalineB8b Poti MDW 100 SalineB13 Poti HDW 15 SalineB13 Poti MDW 150 Saline∗1.71 m thick†40 m thick§MDW = machine-drilled well; HDW = hand-drilled well.
as the key marker horizons in deep geoelectrostratigraphicmapping in the region. The Transbrazilian lineament appearsto have a significant signature on the geoelectrical structureacross the region and may have implications for groundwaterdistribution. The inferred vertical displacements may be morethan 100 m, but it is still unclear whether these displacementsrestrict lateral hydraulic continuity between adjacent sedimen-tary blocks. A more rigorous modeling of this lineament anda study of the relationship between geophysical parametersand hydraulic properties of the main aquifers in the region arecurrently underway.
ACKNOWLEDGMENTS
The authors are grateful to CAPES, FINEP, ODA (theBritish Council in Rio de Janeiro), and Leicester Universityfor sponsoring the Parnaiba basin project. We thank CarlosGermano, E. La Terra, and Ronaldo M. Carvalho for theirvaluable technical assistance in all the field campaigns. We alsothank Petrobras, the Brazilian national oil company, for pro-viding the borehole data for one of the survey sites and Pe-ter Fenning of Earth Science Systems (UK) Ltd. for loaningthe Protem 47 equipment. J. P. R. Lima acknowledges a post-graduate scholarship award from CNPq and CAPES (Brazil-ian research councils); E. U. Ulugergerli is grateful to AnkaraUniversity (Turkey) for a postgraduate scholarship award. Theexcellent reviews and suggestions by R. L. Newmark and twoother anonymous reviewers greatly improved this paper.

354 Meju et al.
REFERENCES
Bostick, Jr., F. X., 1977, A simple almost exact method of magnetotel-luric data analysis: Proc. workshop on electrical methods in geother-mal exploration, U.S. Geol. Surv., 174–183.
Cordani, U. G., Neves, B. B. B., Fuck, R. A., Porto, R., Thomas Filho,A., and Cunha, F. M. B., 1984, Estudo preliminar de integracao doPre-Cambriano com os eventos tectonicos das bacias sedimenta-res brasileiras: Petrobras/Cenpes/Sintep, Cienc. Tecn. Petroleo Sec.,Explor. de Petroleo, Publ. 15.
Cunha, F. M. B., 1986, Evolucao paleozoica da Bacia do Parnaiba e seuarcabouco tectonico: MS thesis, Univ. Federal Rio de Janeiro.
Fitterman, D. V., and Stewart, M. T., 1986, Transient electromagneticsounding for groundwater: Geophysics, 51, 995–1005.
Fontes, S. L., Meju, M. A., Lima, J. P. R., Carvalho, R. M., La Terra, E.F., Germano, C. R., and Metelo, M., 1997, Geophysical investigationof major structural controls on groundwater distribution, north ofSao Raimundo Nonato, Piaui State: 5th Internat. Congress, Brazil.Geophys. Soc., Expanded Abstracts, 2, 766–769.
Frischkorn, H., and Santiago, M. M. F., 1992, O paleoclima do nordestede acordo com a hidrologia isotopica: Presented at the Meetingon Impacts of Climatic Variations and Sustainable Development inSemi-Arid Regions, UNCED.
Goes, A. M. O., Travassos, W. A. S., and Nunes, K. C., 1993, Pro-jeto Parnaiba: Reavaliacao e perspectivas exploratorias: RelatorioPetrobras, DEXNOR-DINTER.
Jones, A. G., 1988, Static shift of magnetotelluric data and its removalin a sedimentary basin environment: Geophysics, 53, 967–978.
Lee, T., 1975, Sign reversals in the transient method of electricalprospecting (one loop version): Geophys. Prosp., 23, 653–662.
——— 1981, Transient electromagnetic response of a polarizableground: Geophysics, 46, 1037–1041.
Mackie, R. L., Bennett, B. R., and Madden, T. R., 1988, Long-periodmagnetotelluric measurements near the central California coast:A land-locked view of the conductivity structure under the PacificOcean: Geophys. J., 95, 181–194.
Mackie, R. L., Livelybrooks, D. W., Madden, T. R., and Larsen,J. C., 1997a, A magnetotelluric investigation of the San Andreasfault at Carrizo Plain, California: Geophys. Res. Lett., 24, 1847–1850.
Mackie, R. L., Rieven, S., and Rodi, W., 1997b, Users manual andsoftware documentation for two-dimensional inversion of magne-totelluric data: M. I. T. Earth Resources Lab. Report.
Masero, W., Fontes, S. L., and Schnegg, P.-A., 1995, Magnetotelluricinvestigation of the Serra da Cangalha impact structure, Brazil: 1stConf. Latin Amer. Geophys. Union & 4th Internat. Congress, Brazil.Geophys. Soc., Expanded Abstracts, 664–667.
McNeill, J. D., 1987, Advances in electromagnetic methods for ground-water studies: Proceedings of Exploration ’87–Applications of Geo-physics and Geochemistry, 678–702.
Meekes, J. A. C., and van Will, M. F. P., 1991, Comparison of seismicreflection and combined TEM/VES methods for hydrogeologicalmapping: First Break, 9, 543–551.
Meju, M. A., 1994, Biased estimation: A simple framework for inver-sion and uncertainty analysis with prior information: Geophys. J.Internat., 119, 521–528.
——— 1995, Simple resistivity-depth transformations for infield orreal-time data processing: Computers & Geosciences, 21, 985–992.
——— 1996a, Joint inversion of TEM and distorted MT soundings:Some effective practical considerations: Geophysics, 61, 56–65.
——— 1996b, Geoelectromagnetics, geology and the environment:Understanding electrical images of the subsurface: Presented at the
20th Ann. United Kingdom Geophysical Assembly.——— 1998, A simple method of transient electromagnetic data anal-
ysis: Geophysics, 63, 405–410.Meju, M. A., and Fontes, S. L., 1996, An investigation of a dry water-
well near Floriano in northeast Brazil using combined VES-TEM-EMAP techniques: Proc. 8th EEGS Symp. on Application of Geo-physics to Engineering and Environmental Problems, 353–362.
Meju, M. A., Fontes, S. L. F., Ulugergerli, E. U., and Filho, A. R. S.,1997, Integration of 3-D hydrogeophysical and hydrogeochemicaldata from Picos area in Piaui State, northeast Brazil: Progress report:5th Internat. Congress, Brazil. Geophys. Soc., Expanded Abstracts,2, 761–765.
Meju, M. A., and Hutton, V. R. S., 1992, Iterative most-squares inver-sion: Application to magnetotelluric data: Geophys. J. Internat., 108,758–766.
Nunes, K. C., 1993, Interpretacao integrada da Bacia do Parnaiba comenfase nos dados aeromagneticos: 3rd Internat. Congr., Brazil. Geo-phys. Soc., Expanded Abstracts, 152–157.
Palacky, G. J., Ritsema, I. L., and De Jong, S. J., 1981, Electromagneticprospecting for groundwater in Precambrian terrains in the Republicof Upper Volta: Geophys. Prosp., 29, 932–955.
Pellerin, L., and Hohmann, G. W., 1990, Transient electromagneticinversion: A remedy for magnetotelluric static shifts: Geophysics,55, 1242–1250.
Raiche, A. P., 1984, The effect of ramp function turn-off on the TEMresponse of a layered ground: Explor. Geophys., 15, 37–41.
Raiche, A. P., Jupp, D. L. B., Rutter, H., and Vozoff, K., 1985, The jointuse of coincident loop transient electromagnetic and Schlumbergersounding to resolve layered structures: Geophysics, 50, 1618–1627.
Sandberg, S. K., 1993, Examples of resolution improvement in geoelec-trical soundings applied to groundwater investigations: Geophys.Prosp., 41, 207–227.
Schobbenhaus, F. C., Campus, D. A., Derze, G. R., and Asmus,H. E., 1984, Texto explicativo do mapa geologico do Brasil e daarea adjacente incluindo depositos minerais, escala 1:250000: De-partamento Nacional da Producao Mineral.
Smith, J. T., and Booker, J. R., 1991, Rapid inversion of two- and three-dimensional magnetotelluric data: J. Geophys. Res., 96, 3905–3922.
Smith, R. S., and West, G. F., 1988, Inductive interaction between po-larizable conductors: An explanation of a negative coincident-looptransient electromagnetic responses: Geophysics, 53, 677–690.
Sternberg, B. K., Washburne, J. C., and Pellerin, L., 1988, Correction forthe static shift in magnetotellurics using transient electromagneticsoundings: Geophysics, 53, 1459–1468.
Stewart, M. T., 1982, Evaluation of electromagnetic methods for rapidmapping of salt-water interfaces in coastal aquifers: Ground Water,20, 538–545.
Torres-Verdin, C., and Bostick, F. X., Jr., 1992, Principles of spatialsurface electric field filtering in magnetotellurics: Electromagneticarray profiling (EMAP): Geophysics, 57, 603–622.
Ulugergerli, E. U., 1998, Development and application of 2-D magne-totelluric inversion in complex domain: Ph.D. thesis, Univ. of Leices-ter.
Ulugergerli, E. U., and Meju, M. A., 1997, Inversion of 2D magnetotel-luric data using the complex singular value decomposition method:5th Internat. Congress, Brazil. Geophys. Soc., Expanded Abstracts,2, 642–645.
Vitorello, I., and Padilha, A. L., 1993, Perfis de resistividade AMT: Con-tribuicao ao reconhecimento estrutural da borda sudeste da Baciado Parnaiba: Revista Brasileira de Geociencias, 23, 81–91.
Weidelt, P., 1982, Response characteristics of coincident loop transientelectromagnetic systems: Geophysics, 47, 1325–1330.

Integrated VES-TEM-AMT Aquifer Mapping 355
APPENDIX
COMPARISON OF YX POLARIZATION FIELD DATA AND CALCULATED TE MODE RESPONSE FOR A 2-D MODEL FOR LINE BB′
The AMT field data recorded in the yx direction on lineBB′ and the theoretical responses of the 2 DRR CSVD model(Figure 14) derived by iterative inversion of the field data for
FIG. A-1. Observed yx apparent-resistivity (a) and phase (b) pseudosections for line BB′. The apparent resistivities are inohm-meters; the phases are in degrees.
an orthogonal (xy) polarization are shown here. The apparent-resistivity and phase data for eight stations are presented aspseudosections for comparison.

356 Meju et al.
FIG. A-2. Calculated TE mode apparent-resistivity (a) and phase (b) pseudosections for the 2-D model of Figure 14. The apparentresistivities are in ohm-meters; the phases are in degrees.