Reexamining the Pooled Sampling Approach for Estimating Prevalence of Infected Insect Vectors

1
1
The following document is the final draft submitted to Weather, Climate 2
and Society. Please find the final published version below: 3
Ramírez, I.J., S. Grady, and M.H. Glantz, 2013: Reexamining El Niño 4
and cholera in Peru: a climate affairs approach. Weather, Climate and 5
Society, 5, 148–161. doi: http://dx.doi.org/10.1175/WCAS-D-12-00032.1. 6
7
8
Reexamining El Niño and Cholera in Peru: A 9
Climate Affairs Approach 10
11
12
Iván J. Ramírez 13
Division of Social Sciences, New College of Florida 14
(now at the Interdisciplinary Science Program, The New School, NYC) 15
16
17
Sue C. Grady 18
Department of Geography, Michigan State University 19
20
21
Michael H. Glantz 22
Consortium for Capacity Building, University of Colorado - Boulder 23
24
25
26
____________________ 27
28 Corresponding author address: Iván J. Ramírez, Interdisciplinary Science Program, Eugene Lang College, 29 The New School. 30 E-mail: [email protected]; For more information: https://newschool.academia.edu/IvanJRamirez 31 32
2
Abstract 33
34
In the 1990s Peru experienced the first cholera epidemic after almost a century. The 35
source of emergence was initially attributed to a cargo ship, but later there was evidence 36
of an El Niño association. It was hypothesized that marine ecosystem changes associated 37
with El Niño led to the propagation of V. cholerae along the coast of Peru, which in turn 38
initiated the onset of the epidemic in 1991. Earlier studies supported this explanation by 39
demonstrating a relationship between elevated temperatures and increased cholera 40
incidence in Peru; however, other aspects of El Niño-Southern Oscillation (ENSO) and 41
their potential impacts on cholera were not investigated. Therefore, this study examines 42
the relationship between El Niño and cholera in Peru from a holistic view of the ENSO 43
cycle. A “Climate Affairs” approach is employed as a conceptual framework to 44
incorporate ENSO’s multidimensional nature and to generate new hypotheses about the 45
ENSO and cholera association in Peru. The findings reveal that ENSO may have been 46
linked to the cholera epidemic through multiple pathways, including rainfall extremes, La 47
Niña, and social vulnerability with impacts depending on the geography of 48
teleconnections within Peru. When the definition of an ENSO event is examined, cholera 49
appears to have emerged either during ENSO neutral or La Niña conditions. Furthermore, 50
the analysis herein suggests that the impact of El Ni~no arrived much later, possibly 51
resulting in heightened transmission in the austral summer of 1992. In conclusion, a 52
modified hypothesis with these new insights on cholera emergence and transmission in 53
Peru is presented. 54
55
3
1. Introduction 56
It has been almost twenty years since Peru experienced the first cholera epidemic 57
after almost a century. The outbreak, associated with the El Tor strain of V. cholerae, 58
began in January 1991 along several coastal cities in Peru and then spread rapidly to 59
neighboring South and Central American countries, infecting approximately 400 000 60
people in the first year of the onset (Pan American Health Organization [PAHO] 1991; 61
Ministry of Health, Peru [MINSA] 1994). Over the next decade, an estimated 1.2 million 62
cases of cholera were documented in the region. Approximately 52.0% (703 000) of all 63
cholera cases occurred in Peru (PAHO 2008). 64
65
While previous studies have shown that the diffusion of cholera in Peru was due 66
to poor water and sanitation system capacities (PAHO 1991; MINSA 1994, 44; Tauxe et 67
al. 1995; Seas and Gotuzzo 1996), the cause of the initial outbreak is still unknown. The 68
source of emergence was initially attributed to infected persons or contaminated waste 69
water dispelled from a cargo ship (Gangarosa and Tauxe 1992: 353). However, these 70
explanations were later challenged by another hypothesis which linked the cholera 71
epidemic to El Niño-Southern Oscillation (ENSO) (Epstein et al. 1993; Colwell 1996; 72
Mourino-Perez 1998). ENSO which includes El Niño (warm phase) and La Niña (cold 73
phase) is an important source of climate variability in the Latin American region, well 74
known for ecosystem and societal impacts, particularly in Peru (Lagos and Buizer 1992; 75
Glantz 2001a; Caviedes 2001). Therefore, it was proposed that marine ecosystem 76
changes associated with El Niño led to the propagation of V. cholerae along the coast of 77
Peru, which in turn initiated the onset of the epidemic in 1991 (Colwell 1996). 78
4
In earlier studies, some evidence in Peru suggested that air and water temperature 79
changes contributed to cholera incidence via its ecological impacts on vibrios. For 80
example, it was shown that elevated temperatures were positively correlated with 81
diarrheal disease (Salazar-Lindo et al. 1997; Checkley et al. 2000; Lama et al. 2004) and 82
the presence of V. cholerae in water sources in Peru (Franco et al. 1997; Speelmon et al. 83
2000; Lipp et al. 2003). It was also reported that cholera incidence was strongly 84
associated with air and seawater temperatures during the 1997/98 El Niño (Speelmon et 85
al. 2000; Gil et al. 2004). More recently, researchers demonstrated how ocean-86
atmosphere interactions influenced the transport of vibrios along the coast of Peru 87
(Martinez-Urtaza et al. 2008). 88
89
Still, despite these advances in potential evidence, El Niño’s link with cholera in 90
Peru remains unclear. This is largely due to previous studies, which were limited in their 91
examination of the ENSO cycle. For example, the empirical evidence so far is mainly 92
based on temporal investigations in coastal Lima. Given the variability of ENSO’s 93
influence within Peru, the temperature-cholera association may have differed by 94
geography (e.g., coast versus jungle). Moreover, the strongest evidence is based on one 95
El Niño event in 1997/98. El Niño’s impact on the initial outbreak has yet to be examined 96
(Salazar-Lindo et al. 2008). Furthermore, the El Niño-cholera hypothesis is based upon a 97
period when there was disagreement about the timing of El Niño (World Meteorological 98
Organization [WMO] 1999; Glantz 2001, 21). Conceivably, this raises questions about 99
the definition of an ENSO event (Trenberth 1997), and the coincidence between the 100
physical impacts of ENSO and the emergence of cholera in Peru. In addition, the 101
5
potential impacts of rainfall extremes and La Niña have not been explored in relation to 102
cholera, even though the former is an important teleconnection, and the latter is also 103
associated with health effects in Peru (MINSA 1999a). Finally, how social factors of 104
vulnerability, especially at the time of emergence, may have contributed to the impact of 105
ENSO on cholera is not yet known. 106
107
Therefore, the purpose of this study is to explore these gaps of knowledge in the 108
literature by examining the relationship between El Niño and cholera in Peru from a 109
holistic view of ENSO. Our goal is to better understand this association by considering 110
the many ways in which ENSO may have been linked to cholera emergence and 111
transmission in Peru. Another goal is to provide new insights on the hypothesis in order 112
to stimulate new avenues for potential research. As a conceptual framework, we employ a 113
“Climate Affairs” approach to widen the scope of analysis in relation to previous studies. 114
Climate affairs is a multidisciplinary concept used to understand climate-society 115
interactions worldwide (Glantz and Adeel 2001; Glantz 2003; Consortium for Capacity 116
Building [CCB] 2011), and in particular, societal impacts associated with ENSO (Glantz 117
2001a; 2001b). From a Climate Affairs orientation, we incorporate ENSO’s 118
multidimensional nature to generate new hypotheses about the ENSO and cholera 119
association in Peru. In addition to a literature review we also describe data about the 120
epidemic and ENSO collected during fieldwork in Peru in 2008 and 2009. These data 121
were obtained from documents, including health data and bulletins, newspaper archives, 122
and reports from Peruvian non-governmental and governmental institutions. 123
124
6
Following this introduction is a description of the Climate Affairs approach and 125
its application in this study. The second section is a review of the El Niño-cholera 126
hypothesis in Peru. The third section recounts the current evidence in support of the 127
hypothesis and a link. Here, our focus is the literature in Peru. The fourth section 128
reexamines the relationship between El Niño and cholera in Peru using a Climate Affairs 129
approach. We begin by revisiting the temperature association and then explore: the 130
definition of an ENSO event, which includes an assessment of El Niño’s timing and 131
impacts in Peru; rainfall extremes; the La Niña factor; and social vulnerability. In the 132
final section, we summarize our findings and conclude by presenting a modified 133
hypothesis with new insights on cholera emergence and transmission in Peru. 134
135
2. A Climate Affairs approach 136
Climate Affairs is a holistic approach to understanding the many facets of climate 137
(e.g., averages, extremes, variability and change) and how societies interact with climate 138
phenomena (Glantz and Adeel 2001; Glantz 2003; CCB 2011). Its basic components 139
encompass, but are not limited to: a) climate science; b) climate impacts; c) climate 140
economics; d) climate politics and policy; e) and climate ethics. Thus, it emphasizes the 141
importance of multidisciplinary efforts across physical and social sciences and 142
humanities. It also recognizes local and regional knowledge to understanding climate-143
society interactions (Glantz 2003). The concept evolved from the collaborative research 144
and program activities of Dr. Michael H. Glantz, which began in 1974 at the 145
Environmental and Societal Impacts Group (ESIG) at the National Center for 146
Atmospheric Research (NCAR). It later came to fruition as a research, training and 147

7
education initiative in 2003. Currently, it continues to be implemented through the 148
Consortium for Capacity Building and its partners at the University of Colorado, Boulder. 149
150
Until now, the application of climate affairs has generally focused on capacity 151
building efforts with universities, research institutes, multilateral organizations, and 152
governments around the world. Among these activities, the transfer of knowledge on 153
ENSO, including forecasting, sectoral impacts, and societal responses, has been a central 154
theme (Glantz 1997; Glantz 2001b; Glantz 2002). In this study, Climate Affairs is 155
utilized as a research lens to highlight and integrate various aspects of ENSO that may 156
have been important for cholera emergence and transmission in Peru. Specifically, we 157
draw upon the following elements of ENSO knowledge: ENSO science, impacts, 158
economics, politics, and ethics. 159
160
a. ENSO science 161
ENSO is a quasi-periodic phenomenon, composed of warm (El Niño), cold (La 162
Niña) and neutral phases, and ocean-atmosphere interactions that are basin-wide (i.e., 163
equatorial Pacific Ocean) and local (e.g., Peru). ENSO neutral refers to “average” sea 164
surface temperature (SST) conditions in the equatorial Pacific that do not qualify as warm 165
or cold phases (NOAA 2005). ENSO is monitored across the equatorial Pacific Ocean 166
basin in 4 delimited Niño regions known as: Niño 1+2, Niño 3, Niño 3.4, and Niño 4 167
(Figure 1). Interpreting the characteristics of phases can vary depending on the definition 168
of an event, the variables chosen to measure ENSO, and the Niño region of analysis 169
(Trenberth 1997; International Research Institute for Climate and Society 2008). 170

8
Therefore, careful attention should be paid to how events are characterized because they 171
may affect the interpretation of quantitative associations between ENSO and health 172
outcomes (Kovats et al. 2003). 173
174
b. ENSO impacts 175
ENSO’s influence on local climate (e.g., temperature and rainfall teleconnections) 176
can vary within different regions of Peru and by season. Geographically, the most notable 177
effects are storms and rains along the northern coast, an area which is typically arid; or 178
below average rains in the Southern and Central Andes (Lagos et al. 2008; National 179
Meteorology and Hydrology Services, Peru [SENAMHI] 2009). Although probable, 180
teleconnections are not deterministic because each event is unique and can vary in how it 181
develops from one period to another (Wyrtki 1975). However, it is possible to foresee 182
some potential effects on ecosystems and societies based on direct and indirect 183
observations of the environment, statistical assessments, computer modeling, and 184
historical reports of past events (Glantz 2001a, 163-173; McPhaden et al. 2006). In Peru, 185
they may include: marine ecosystem changes due to the disruption of upwelling 186
processes, terrestrial ecosystem changes (e.g., vegetation, insects and animals), impacts 187
on fisheries and agriculture, and damaged built environment due to flooding (e.g., energy, 188
water and sanitation systems) (Glantz 2001a). When ecosystem change co-occurs with 189
collapse of infrastructure, human exposure to infectious diseases can increase during 190
ENSO events (Gueri 1984; Valverde 1998; PAHO 1998a; Kovats et al. 2003). 191
192
c. ENSO economics, politics, and ethics 193
9
ENSO impacts on society are not only contingent on geographic location of 194
teleconnections, but also social, economic, and political factors of vulnerability that 195
contribute to climate-related disasters (Glantz 2003, 253; Cutter et al. 2009). In Peru, the 196
government and its population faced a number of challenges when cholera emerged that 197
included humanitarian emergencies (UN Office for the Coordination of Humanitarian 198
Affairs [UNDRO] 1990a ), economic restructuring, and an energy crisis (El Tiempo 199
1991; Youngers 2000); not to mention the high rates of population deprivation that 200
existed at the time (PAHO 1991). Assuming El Niño’s impacts were felt in Peru in 1991, 201
in addition to triggering the epidemic as has been suggested, climate may also have 202
exacerbated the severity of cholera transmission. It is important to highlight this context 203
in the explanation of the El Niño and cholera association because it places the cholera 204
epidemic at the intersection of ENSO and society interactions, which cross-sect 205
disciplinary boundaries (McPhaden et al. 2006). Tangentially, it also alludes to potential 206
issues of ‘climate’ justice (e.g., equity of impacts and differential vulnerabilities) that 207
may arise from these interrelationships (Glantz and Jamieson 2000; Ramírez 2012). 208
209
3. The El Niño-cholera hypothesis 210
Since the emergence of cholera in Peru, El Niño and climate have been associated 211
with cholera transmission. The link was first proposed by Epstein (1992) in a letter to the 212
editor at The Lancet. According to Epstein, once V. cholerae was introduced to the 213
coastal waters of Peru, it harbored among algae and plankton blooms and proliferated 214
because of “warming,” possibly due to El Niño or global climate change. Furthermore, it 215
was thought that human activities (e.g., eutrophication due to untreated sewage waste and 216
10
agricultural activities) had also contributed to “enhanced” blooms. Thus, it was suggested 217
initially that cholera emerged as a result of climate and human-related processes (Epstein 218
1993; Epstein et al. 1993; 1994). As the mode of transmission, Epstein proposed that 219
human consumption of shellfish that feed on blooms was the initial pathway (1992; 220
1993). While El Niño seemed a likely reason for the epidemic, it was also thought that 221
further investigations were needed before causation could be deduced (Wilson et al. 222
1994,103).1 223
224
In 1996 El Niño was hypothesized, with greater confidence and explanation, as 225
the most important driving factor in the epidemic (Colwell 1996). Motivating this 226
postulation were three ideas. First, the passing ship hypothesis was dismissed on the 227
grounds that a “single ship” could not explain multiple entry points along the Peruvian 228
coast. Second, there was growing evidence of positive relationships among plankton, V. 229
cholerae and cholera outbreaks in Bangladesh (Colwell 1996); furthermore, V.cholerae 230
was shown to survive freely in estuarine environments, lying dormant when 231
environmental conditions are less favorable, and increasing in concentrations when 232
conditions are optimal (Colwell and Spria 1992; Colwell 1996). Third, there were reports 233
of an ‘extraordinary’ El Niño, which lasted from 1990 to 1995 (Trenberth and Hoar 234
1995), which was believed to coincide with the cholera epidemic. Therefore, it was 235
proposed that an El Niño influenced sea surface temperature anomalies in the equatorial 236
1 At a workshop in 1994, Dr. Rita R. Colwell, while supportive of the potentiality of a
climate mechanism, expressed her concerns about assuming causation without further
quantitative studies.
11
Pacific Ocean, which in turn promoted the abundance of plankton blooms (harboring 237
bacteria) that led to cholera transmission at multiple locations on the coast (Epstein 1992; 238
Colwell 1996; Seas et al. 2000). It was also suggested that nutrient-runoff (due to heavy 239
rains) may have contributed to the rise in blooms. The mechanism by which blooms 240
invaded the inland coast was intrusion of warm waters (Colwell 1996), either by rising 241
sea levels and/or storm surges with the arrival of El Niño. Furthermore, it was suggested 242
that the original source of V. cholerae was contaminated plankton from Asia, which may 243
have been transported via eastward-flowing ocean currents induced by El Niño (Colwell 244
1996; Mourino-Perez 1998). 245
246
In 2000, the hypothesis offered by Colwell (1996) was sustained in two important 247
studies. The first study (Seas et al. 2000) identified several clinical cases of cholera 248
preceding the onset of the epidemic in several coastal cities. The finding was instrumental 249
because it suggested that the introduction of cholera occurred prior to the arrival of the 250
passing ship, dismissing that explanation and embracing the El Niño hypothesis (Epstein 251
1992; Colwell 1996; Mourino-Perez 1998). Furthermore, there was laboratory 252
confirmation of V. cholerae in water sources, including sewage, rivers, lagoons, and 253
irrigation (Gomez Pando and Pineda 1991; Madico et al. 1996) preceding cholera 254
outbreaks in Lima, Peru (Franco et al. 1997; Speelmon et al. 2000). According to Franco 255
et al. (1997), elevated temperatures precipitated a rise in bacteria, which then amplified 256
once human fecal contamination began to increase. Importantly, a second study 257
demonstrated a quantitative relationship between ENSO and cholera from 1980 to 1998 258
in Bangladesh. Cholera transmission was explained by ENSO’s teleconnected influence 259
12
on local air-water temperatures and subsequently, the intrusion of plankton blooms onto 260
the coastal shore (Pascual et al. 2000). 261
262
4. Recounting the evidence in Peru 263
a. Air temperature 264
Following the initial outbreak in 1991, several studies found temperature-related 265
associations that supported an El Niño and cholera link in Peru. It was shown that 266
diarrheal diseases including cholera correlated with the warmest months (e.g., austral 267
summer, Dec to Mar) in the 1990s. Specifically when temperatures increased greater than 268
19.5°C there was also an increase in cholera incidence (Madico et al. 1996; Speelmon et 269
al. 2000). Furthermore, it was estimated that an increase of 1°C in mean air temperature 270
led to increased risk (~ 8.0%) of diarrhea in children and adults (Checkley et al. 2000; 271
Lama et al. 2004). 272
273
El Niño-related risk was not observed until the onset of the 1997/98 El Niño, 274
which began rapidly developing in April 1997 (WMO 1999, 29-38). Subsequently, record 275
air temperatures were observed in Peru from May to December, which meant that 276
Peruvians would not experience winter (Bell and Halpert 1998). The impacts on diarrhea 277
and cholera risk were severe. In north Lima, diarrhea rose by 35.0% in children and 47.5 278
% in adults during the winter of 1997 (Salazar-Lindo 1997; Lama et al. 2004). In terms of 279
cholera, after a decline in 1996, cases began to noticeably rise in July 1997. The first 280
outbreaks were reported in southern Peru, where a cholera emergency was declared by 281
September (MINSA 1998a). 282
13
283
According to MINSA, the greatest burden of diarrheal disease was observed 284
during the austral summer in 1998 (MINSA 1998d; Huanca 2004). Speelmon et al. 285
(2000) reported that 88.0% of cholera cases in Lima occurred from January to May. It 286
was also estimated that El Niño conditions contributed to an excess of 6225 daily 287
admissions of children with diarrhea (Checkely et al. 2000). Overall in 1998, the number 288
of cholera cases in Peru rose by 112.0% from the previous year (MINSA 2008). MINSA 289
attributed the rise in cholera and diarrheal disease to El Niño (1998a; 1998c; 2000). 290
291
b. Sea surface conditions 292
Other studies in Peru focused on the effects of sea surface conditions on V. 293
cholerae and cholera incidence along the coast of Peru. In one study, Lipp et al. (2003) 294
found that V. cholerae was significantly correlated with air temperature increases every 295
January to March from November 1998 to March 2000. Furthermore, V. cholerae was 296
detected in plankton samples at 3 coastal sites (Trujillo – North, Lima – Central, and 297
Arequipa – South). Interestingly, coastal seawater temperature was not a significant 298
factor. In a later study, Gil et al. (2004) revisited the same study areas as Lipp et al. 299
(2003), but included one additional site at Callao (considered part of the greater Lima). 300
They also measured environmental variables in relation to cholera incidence and 301
extended the time period to begin in October 1997. In this study, monthly cholera 302
incidence was strongly associated with elevated seawater temperature during the austral 303
summer of 1998. Like the previous study, V. cholerae was detected in the seawater; it 304
14
supported the existence of a coastal environmental reservoir linked to seawater changes 305
(Gil et. al 2004). 306
307
More recently, the hypothesis has gained further support in a study that modeled 308
equatorial waves during the 1997/98 El Niño with the occurrence of a proxy vibrio strain 309
called Vibrio parahaemolyticus (Martinez-Urtaza et al. 2008). Using sea height anomaly 310
and upper ocean heat content to represent El Niño, the authors showed that the 311
distribution of index cases of cholera followed a pattern along the west coast of South 312
America, similar to the oceanic parameters. Coincidently, this pattern also resembled 313
locations where cholera was first identified in 1990/91, according to Seas et al. (2000). 314
This was the first study to demonstrate how vibrios and their reservoirs may have 315
traveled via ocean waves and upon arrival (i.e., against the continental boundary) 316
dispersed along the coastal environment of Peru (Martinez-Urtaza et al. 2008). 317
318
c. Summary 319
In sum, descriptive and statistical studies have shown a climate link, both direct 320
and indirect, with cholera, V. cholerae, and environmental reservoirs in Peru. The 321
associations were based on inland and coastal water temperatures during the austral 322
summer and climate thresholds which suggested that elevated temperatures led to a 323
greater number of diarrheal disease in the 1990s. With respect to El Niño, there was an 324
apparent association with the 1997/98 event. While these studies provided some evidence 325
for a climate-cholera connection in Peru, there are still many unanswered questions. In 326
15
the following section, we explore several factors which we argue are critical to 327
understanding El Niño’s link to cholera emergence and transmission in Peru. 328
329
5. Reexamining El Niño and cholera in Peru 330
331
Here, we use a Climate Affairs approach to reexamine the association between El 332
Niño and cholera in Peru using a broader conception of ENSO. Our discussion begins by 333
revisiting the temperature-related association followed by an exploratory investigation 334
that highlights the following ENSO characteristics: the definition of an ENSO event; 335
rainfall extremes; the La Niña factor; and social vulnerability. 336
337
a. Revisiting the temperature association 338
While a temperature-related association is plausible because of its potential 339
impact on the reproduction of vibrios, its generalization in Peru is limited by its 340
geographic scope. This is due to the fact that previous findings in Peru were generally 341
based on temporal observations in Lima, which is located on the central coast. Given the 342
country’s diverse physical regions, which range from a low-lying coast to highlands and 343
jungle in the east (Figure 2), it is possible that there may have been regional variations of 344
the temperature association within Peru. For instance, in Loreto, a jungle region located 345
in northeast Peru, seasonal patterns of cholera were indeed different from the Lima time 346
series (Figure 3 [a]). In Lima, peaks in cholera cases were observed from February to 347
April from 1993 to 1998. In contrast, cholera increased in Loreto from mid-summer to 348
early autumn (Jul to Oct) in 1993, 1995, and 1998; there were also peaks in May of 1993 349
and 1998 (Figure 3 [b]). In general, the temporal pattern of cholera in Loreto was less-350
16
well defined and lagged in time compared to Lima. This difference may reflect, 351
particularly in the case of 1998, the geography of El Niño-related teleconnections by 352
region. For example, on the central coast El Niño may contribute to warmer and wetter 353
than average conditions from June to August (SENAMHI 2004); in the Amazon, it may 354
contribute to rainfall deficit in November and December (Marengo 1999; Marengo et al. 355
2008). These differences highlight the importance of region, which suggest not only that 356
different temporal pathways might exist, but also that different climate pathways may 357
have impacted cholera transmission. 358
359
The temperature-related association is also limited because El Niño’s link to 360
cholera is based on one event in 1997/98. For example, even though Lama et al. (2004) 361
found a strong association between El Niño and diarrheal disease in 1998, it was also 362
shown that prior El Niños were not statistically significant.2 One reason for this outcome 363
may have been the short length of time series (i.e., 1991 to 1998), which seems to limit 364
studies in Peru because they have generally been cross-sectional and do not include the 365
initial outbreak time segment. 366
367
b. Definition of an ENSO event 368
One important assumption of the El Niño-cholera hypothesis is that El Niño 369
conditions were present in order to impact the transport and reproduction of contaminated 370
2 It is important to note that it is unclear how Lama et al. (2004) identified El Niños.
According to their study which cited data from NOAA, the onset dates were: 1)
September 1991; 2) April 1993; and 3) September 1994.

17
plankton off the coast of Peru, potentially from October 1990 to January 1991(i.e., based 371
on Seas et al. [2000]). Although an El Niño was suspected during that time, there were 372
also varying reports about the timing of El Niño(s) in the early 1990s. For example, for 373
some researchers it was the longest El Niño of the century, lasting five years from 1990 374
to 1995 (Trenberth and Hoar 1996). For others, it endured from September 1991 to July 375
1993 (McPhaden 1994; Kessler and McPhaden 1995). It was also estimated that 3 events 376
took place from: (1) March 1991 to June 1992; (2) 1993 (Feb/Mar to Oct); and (3) 1994 377
(Jun to Nov) (Goddard and Graham 1997). Importantly, Peruvians questioned the view of 378
an El Niño in 1991 because they noticed they were catching near-record-setting anchovy 379
landings, highly unlikely during a warm episode (Flores 1998; Glantz 2001, 21). 380
Therefore, two fundamental questions about the hypothesis are raised. The first is 381
whether an El Niño was in development at the time of emergence. The second is whether 382
El Niño’s effects were observed in Peru. The latter question is important because it may 383
explain the transport and coastal intrusion component of the hypothesis. 384
385
To address the question about El Niño’s timing, we explored the definition of an 386
ENSO event, which determines the characteristics of an episode including its beginning 387
and end dates (Trenberth 1997). The definition is important because it may affect how 388
one characterizes the relationship between El Niño and cholera emergence, which is 389
dependent on whether the two events coincided in time. To illustrate this point, we 390
compared sea surface temperature anomalies (SSTA) in 3 Niño regions with monthly 391
cholera cases in Peru from 1990 to 1992. As a definition, we chose the operational one 392
used by NOAA, which is commonly employed to identify an event (See NOAA 2012). 393
18
Figure 4 shows the SSTA and cholera time series and Table 1 lists El Niño and La Niña 394
events, respectively. According to the Niño 4 region, the first possible cases of cholera 395
(identified by Seas et al. [2000]) and the onset of the epidemic occurred in the midst of a 396
prolonged El Niño (26 months) that developed in July 1990 (event [a]). The timing in the 397
Niño 4 region, which represents the western equatorial Pacific, sustains the El Niño-398
cholera hypothesis and suggests a time delay of several months between El Niño and 399
cholera emergence. On the other hand, regions Niño 3.4 and Niño 1+2, which represent 400
the central and eastern equatorial Pacific, indicate that El Niño conditions followed the 401
initiation of the epidemic, beginning in May (event [c]) or November (event [d]) of 1991. 402
Using Pearson’s correlation analysis, we explored these associations further and found 403
the strongest link between cholera and SSTA in the Niño 1+2 region (r = 0.42, p-value = 404
0.010). This finding is important because the Niño 1+2 region includes coastal and 405
equatorial upwelling near Peru and Ecuador (Glantz 2001, 60), which exhibited non-El 406
Niño conditions preceding and during the initial outbreak in January 1991 (see Figure 4 407
and Table 1 [d]). In other words, it may have been La Niña and ENSO neutral rather than 408
El Niño that contributed to cholera emergence in Peru. 409
410
EL NIÑO’S EFFECTS IN 1991? 411
To explore the timing of El Niño further, we examined the literature to 412
identify El Niño-related impacts on ecosystems and climate in Peru. One potential effect 413
we looked for is the impact on anchovy, pelagic fish whose habitat and food supply are 414
altered when upwelling weakens during El Niños (Chavez et al. 2008). According to the 415
Peruvian Marine Institute, 1991 was described as a year with cold coastal waters and 416

19
good for anchovy catch (Pizarro 1999), which implied that average SST conditions were 417
present off the coast of Peru and that upwelling and marine biological productivity was 418
normal too. We also looked for ecosystem impacts in other areas of the eastern Pacific 419
Ocean. For example, biological impacts (associated with El Niño) were reported off the 420
coast of Costa Rica (e.g., coral bleaching and mortality) in March to April 1992 (Jimenez 421
and Cortes 2001), in the Galapagos (e.g., penguin populations declined associated with 422
lower food supply) from 1991 to 1993 (Hernan Vargas et al. 2006), and off the coast of 423
Chile (e.g., changes in planktic fauna species) from November 1991 to March 1992 424
(Marchant et al. 1998). With regard to impacts on local climate (teleconnections), 425
NOAA reported intense rains on the north coast of Peru during the austral summer of 426
1992. Apparently, an El Niño which began developing in mid-1991 was in a mature 427
phase (NOAA 1992; 1993). Supporting the NOAA observations were local newspaper 428
accounts that documented storms, inundations and disasters (El Tiempo 1992a,b). As 429
mentioned previously, the north coast of Peru is strongly associated with El Niño and 430
rains (Lagos et al. 2008) and is therefore a good indicator of a warm event in Peru. 431
Although speculative, biological changes in marine ecosystems along with physical 432
impacts in mid-to-late 1991/early 1992 support the idea that El Niño may have followed 433
rather than led the onset of the cholera epidemic in 1991. 434
435
c. Rainfall extremes 436
In addition to temperature, rainfall extremes are important El Niño 437
teleconnections. In Peru they may have been a pathway for cholera transmission. Rainfall 438
extremes can influence the concentration and transport of bacteria and environmental 439
20
hosts (Ruiz-Moreno et al. 2007; Hashizume et al. 2008; Mendelsohn and Dawson 2008; 440
Reiner Jr. et al. 2011; Bertuzzo et al. 2012; Rinaldo et al. 2012). In particular, heavy rains 441
can contribute to nutrient run-off, which in turn, may positively affect plankton blooms in 442
coastal areas (Constantin de Magny et al. 2008; Jutla et al. 2010); furthermore, wind-443
driven rain can drive coastal waters with plankton inland, thereby increasing human 444
interactions with V. cholerae (Constantin de Magny et al. 2008). Heavy rains can also 445
increase cholera risk through flooding and overflow of rivers, and subsequent 446
contamination of the water supply (Kovats et al. 2003; Ruiz-Moreno et al. 2007; Reiner 447
Jr. et al. 2011). For example, during the recent cholera epidemic in Haiti, intense rains 448
increased incidence in 2010-2011 by enhancing surface run-off and transport of fecal 449
matter from open latrines to inland water sources (Rinaldo et al. 2012). In Peru, cholera 450
may have spread via rains in low-lying areas in the department of Piura (see Figure 2), 451
which reported index cases in 1991 (Ries et al. 1992). Figure 5 compares cholera cases 452
with rainfall (mm) in January to April from 1991 to 2000 in a subregion of Piura (located 453
860 km north of Lima). Cholera and rainfall increases in Piura were clearly evident in 454
1992 and 1998. Furthermore, during the onset of cholera and the first quarter of 1991 455
(i.e., Oct 1990 to Apr 1991), total rainfall in Piura was 7 mm compared to 329 mm in 456
1992 and 1842 mm in 1998. Together, these observations along with local reports suggest 457
that flooding, possibly via the breakdown of water and sanitation infrastructures, led to 458
enhanced cholera transmission in Piura (El Tiempo 1992a; 1992b; PAHO 1998b; MINSA 459
1998b; 1998d). Although elevated temperatures may have contributed to cholera 460
incidence in Lima, heavy rains may have been a more important factor in northern Peru. 461
Alternatively, rainfall deficit may have contributed to cholera transmission as well 462
21
(Codeco 2001; Pascual et al. 2002; Hashizume et al. 2008; Akanda 2009). For example, 463
in the jungle region of Loreto, which we discussed earlier, low river levels were 464
associated with cholera risk in places of poor water and sanitation infrastructures 465
(MINSA 1995; 1998b). A dry season along with elevated air temperatures can impact 466
bacteria and increase cholera risk due to limited availability of potable water (Codeco 467
2001; Huq et al. 2005). 468
469
d. The La Niña factor 470
La Niña, the cold phase of ENSO, is another pathway that may have impacted 471
cholera transmission in Peru. La Niña enhances average SST conditions (e.g., cold) in the 472
eastern equatorial Pacific Ocean. Therefore, via its positive influence on upwelling, 473
which brings nutrients to the surface waters, La Niña may have contributed to cholera 474
emergence (we discuss this pathway within a broader context of the El Niño-cholera 475
hypothesis in the final section). As well, La Niña may have increased cholera risk 476
through its own set of teleconnections (Ropelewski and Halpert 1987; Ordinola 2002; 477
NOAA 2005). During La Niña, climate in Peru is drier than average on the northern coast 478
(Ordinola 2002) and wetter than average in the Southern and Central Andes, particularly 479
in the Altiplano, which borders Bolivia and Chile (Sperling et al. 2008). Following the 480
1997/98 El Niño, rain-related disasters were reported in the highlands in February 1999. 481
Subsequently, populations were affected by floods and many were in need of assistance 482
with food, water and sanitation (MINSA 1999a). La Niña conditions along with those in 483
the tropical Atlantic were blamed (MINSA 1999b). 484
485
22
e. Social vulnerability 486
When cholera emerged in 1990/91, the Peruvian government was already 487
addressing complex emergencies, which began earlier that year in late summer/early 488
winter. The first was an earthquake in northeast Peru, which affected 70 000 and injured 489
1500 people in May 1990 (UNDRO 1990a). The second was an agricultural state of 490
emergency declared across highland regions in June 1990. It was reported that over 2 491
million subsistence farmers were gravely affected by an ongoing drought and cold 492
extremes experienced in 1989, reportedly a La Niña year; consequently, food and water 493
supplies were in decline (UNDRO 1990b). That austral winter was also the beginning of 494
“Fuji Shock,” a set of economic reforms, implemented by the then elected President 495
Alberto Fujimori (Brooke 1990). As a result of these policies, public infrastructure and 496
services were reduced including those in the health sector, where resources were already 497
limited (Cueto 2001, 107-137). Furthermore, the country was contending with an energy 498
crisis (El Tiempo 1991; Nash 1991; Youngers 2000). Power outages affecting water and 499
sanitation plants and residents were reported (El Tiempo 1991). Ultimately, these events 500
which included public policies may have aggravated the pre-existing living conditions of 501
the population, who lacked immunity to cholera, and lacked adequate water and 502
sanitation infrastructure.3 If ENSO and its influence on climate and society had an impact 503
on cholera in Peru, it could not have occurred apart from social vulnerability. 504
3 In 1991 approximately 45.0% of Peru’s population did not have access to clean water
and 59.0% were without sanitation services. In rural areas, conditions were much worse;
there, less than one-third of the population had access to clean water and other basic
services (PAHO 1991).
23
6. Summary and conclusions 505
Although cholera was eradicated in Peru in 2002, it remains a potential threat to 506
the country and region because of the recent emergence in Haiti, which was also 507
associated with ENSO (Enserink 2011). Therefore, this research is timely, and supports 508
other studies which seek to understand how climate variability affects cholera epidemics 509
(Pascual et al. 2000; Koelle et al. 2005; Constantin de Magny et al. 2007; Reiner et al. 510
2011; Reyburn et al. 2011). In sum, this study examined the relationship between El Niño 511
and cholera in Peru using a climate affairs approach. From this holistic view, we 512
explained cholera incidence from a broader conception of ENSO, one which includes not 513
only temperature, but also geographic variability, how we define ENSO, the impacts of 514
rainfall and La Niña, and underlying social dimensions. In doing so, we linked ENSO to 515
cholera in Peru through multiple pathways. 516
517
Specifically, our study showed that a temperature-cholera association may have 518
differed temporally between regions because of geography and the variability of El Niño 519
teleconnections within Peru (e.g., varying cholera peaks between coast and jungle). It was 520
also shown that another pathway may have been rainfall extremes (e.g., torrential rains on 521
the north coast), which impacted infrastructure, river levels and water supply, leading to 522
increased exposure to cholera. Heavy rains were likely a critical factor in 1992 and 1998 523
during El Niños. Importantly, when we explored the definition of an ENSO event, our 524
analysis revealed that cholera may have emerged in Peru during ENSO neutral or La 525
Niña rather than El Niño conditions. Our interpretation which disputes the presence of El 526
Niño in the prior and onset months of the cholera epidemic was supported by a 527
24
significant correlation between cholera and sea surface temperatures in the Niño 1+2 528
region, an area proximate to the Peruvian coast. Our study also highlighted that biological 529
and physical evidence of El Niño was not observed until the end of 1991, which supports 530
further that El Niño did not coincide with the initial epidemic. In light of these findings, 531
our study overall suggests that the cholera epidemic in Peru was likely already underway 532
by the time El Niño developed in 1991. Therefore, the warm phase of ENSO could not 533
have impacted the onset or initiation of the cholera outbreak in Peru. 534
535
However, our findings do not preclude an ENSO or climate contribution. Instead our 536
study suggests that non-El Niño conditions may have played a contributive role during 537
cholera emergence. Non-El Niño conditions are indicative of rich biological productivity 538
due to upwelling processes which may have positively influenced plankton reservoirs in 539
late 1990/early 1991. Concurrently, multiplication of plankton and vibrios in the coastal 540
zone may have occurred because of eutrophication due to human activities (e.g., 541
agriculture run-off and sewage dumping) (Epstein 1992; 1993). Vibrios may have also 542
increased in population due to seasonal warming of SST and air temperatures due to the 543
onset of summer in December. This association is plausible given that cholera and 544
diarrheal disease were correlated with warmer months following the initial outbreak in 545
January 1991 (Salazar-Lindo 1997; Checkley et al. 2000; Speelmon et al. 2000). Human 546
transmission may have taken place by consumption of contaminated seafood (e.g., 547
shellfish), which was an initial vehicle of infection in Peru (MINSA 1994), and suggested 548
originally by Epstein (1993). Once cholera was introduced to the coastal inland, local 549
transmission was amplified by human-fecal contamination (Franco et al. 1997), and then 550
25
propagated under the social vulnerability context which we described earlier and was 551
reported widely (PAHO 1991; MINSA 1994; Cueto 2001, 107-137). 552
553
It was more likely that El Niño’s impact arrived much later than the initial outbreak in 554
1991, contributing to cholera transmission in the austral summer of 1992 via the 555
mechanism proposed by Colwell (1996). More specifically, this multi-pathway is as 556
follows: with the arrival of Kelvin waves which carry warm waters from the western 557
Pacific, SST increased and sea level rose along the coast of Peru. The pool of anomalous 558
warm waters positively affected the reproduction of vibrios living in the coastal zone. 559
With respect to plankton reservoirs, their proliferation was potentially influenced by three 560
factors associated with nutrient enrichment. The first factor is related to human activities 561
(Epstein 1993; Epstein et al. 1993), which we mentioned previously. The second factor is 562
nutrient enrichment by run-off due to high river discharge (Jutla et al. 2011), which may 563
occur during strong El Niños (Lavado Casimiro et al. 2012). Jutla et al. (2011) report that 564
this is the main driver of plankton blooms rather than rising SST in coastal Bangladesh, 565
and therefore, this may have been an important pathway in 1992. The third factor is 566
upwelling, which may appear counterintuitive at first. However, while it is likely that 567
equatorial upwelling (near Ecuador) is negatively affected during El Niños (NOAA 568
2005), it is not always true for coastal upwelling near Peru. There, upwelling diminishes 569
by geographic extent (shifting closer to the coast), but continues to persist and even 570
intensify during warm episodes as winds blowing towards the coast increase (Enfield 571
1981). It explains why plankton species could remain high under warm anomalous SST 572
conditions during past El Niño events (Barber and Chavez 1983; Chavez 1996). Once 573
26
vibrios and reservoirs multiplied on the coast, rising sea-level heights and storm surges 574
led to coastal intrusion transporting organisms to the inland, where teleconnections (e.g., 575
warmer air and water temperatures and heavy rains) affected their reproduction and 576
distribution. Impacts on cholera, however, varied by geographic region, depending on the 577
hydrology (Akanda 2009; Bertuzzo et al. 2012; Rinaldo et al. 2012), infrastructure and 578
immunity levels of the population (Mari et al. 2011; Rinaldo et al. 2012). Within a poor 579
infrastructure context, rainfall impacts led to collapse of water and sanitation systems 580
along the coast, more likely in the north where El Niño impacts are strongest, resulting in 581
heightened transmission in the summer months of 1992. 582
583
Although we cannot explain the initial source of cholera emergence in Peru, we can 584
assume that if El Niño conditions were not present in the eastern equatorial Pacific during 585
the initial outbreak, it is unlikely that distant vibrios travelled via El Niño-related ocean 586
waves in 1990/91. The answer to the origins of cholera in Peru is more likely to be found 587
in an explanation that combines information from existing hypotheses (both human 588
importation and climate) with current advancements in the microbiology and genetics of 589
V. cholerae. Most recently, the latter has helped confirm the source of cholera emergence 590
in Haiti (Chin et al. 2011), which attributed the introduction to foreign importation by 591
asymptomatic individuals (Piarroux et al. 2011; Cravioto et al. 2011). In Peru, the idea of 592
human importation remains a viable pathway to investigate given a recent genetic study 593
that suggests the Latin American strain of V. cholerae came from Africa; possibly by 594
human migration (during some undefined time period) following the arrival of the 595
seventh-pandemic in that continent in the 1970s (Lam et al. 2010). It may help explain 596
27
how V. cholerae may have become indigenous to the coast of Peru prior to the emergence 597
in 1990/91, and then “evolved independently” through genetic transfer between V. 598
cholerae strains (Blokesch and Schoolnik 2007; Nusrin et al. 2009). 599
600
In conclusion, it is hoped that this research will stimulate new points of investigations 601
in Peru and in other areas where cholera is emergent or reemerging. To begin, future 602
work should consider each dimension of ENSO because each can serve as a potential 603
pathway that links ENSO to disease incidence. Moreover, quantitative studies are 604
necessary to estimate the relationship between each pathway (described in this study) and 605
cholera. For example, in order to better understand the temporal patterns of cholera by 606
region, it may be useful to utilize time series methods, such as wavelet, to identify 607
changes in the climate-cholera relationship across time frequency space (Cazelles et al. 608
2007), including lag effects. Such a task will require researchers to examine the entire 609
record during which cholera was present in Peru (1990/91 to 2002) in order to capture 610
ENSO’s quasi-periodicity. Furthermore, the characteristics of various ENSO events 611
should be explored to understand how an event’s evolution and magnitude (e.g., degree 612
of impact on SST), which is unique to each event, can impact transmission. It may 613
explain why cholera did not emerge during the second strongest event of the century 614
which occurred in 1982/83 or a moderate event in 1986/87, where health impacts were 615
reported in Peru (Gueri 1984). Equally important is the necessity to consider the 616
modifying effects of non-climatic factors, which may also address cholera emergence and 617
transmission questions in Peru. These factors include social variables, such as 618
socioeconomic status and infrastructure (Sasaki et al. 2009; Emch et al. 2010; Mariet al. 619
28
2012), immunity, which influences biological susceptibility (Koelle et al. 2005; Rinaldo 620
et al. 2012), and human migration, which enables connectivity between infected and 621
susceptible populations (Koelle et al. 2005; Mari et al. 2012). 622
623
Acknowledgments. 624
This study was supported through grants at the following institutions at Michigan State 625
University: Department of Geography, Department of Philosophy (Ethics and 626
Development Specialization), Center for Latin American and Caribbean Studies, and the 627
Graduate School. Support was also provided by CCB in Boulder, CO. Special thanks to 628
Ing. Norma Ordinola, University of Piura (Private), Ing. Grover Otero, Proyecto Chira-629
Piura, Dr. Elsa Galarza, University of Pacifico, Joanna Noelia Kamiche Zegarra, 630
University of Pacífico, and Dr. Luis Miguel Castrov V. for facilitating fieldwork in Lima 631
and Piura. We also thank all the institutions who provided data and documents in Peru 632
including MINSA in Lima and Piura, INEI in Piura, and Dr. Ana I. Gil (National Institute 633
of Nutrition Research). We also thank New College of Florida for providing the space to 634
complete this article. Lastly, we acknowledge Dr. Lino Naranjo Díaz (MeteoGalicia) and 635
Dr. Kim Knowlton (NRDC) for their comments and expertise on the first drafts. 636
637
638
639
640
641
642

29
References 643
Akanda, A. S., A. S. Jutla, and S. Islam, 2009: Dual peak cholera transmission in Bengal 644
Delta: A hydroclimatological explanation. Geophys. Res. Lett., 36, L19401, 645
doi:10.1029/2009GL039312. 646
647
Barber, R.T., and F.P. Chavez, 1983: Biological consequences of El Niño. Science, 22, 648
1203-1210. 649
650
Bell, G. D., and M. S. Halpert, 1998: Climate assessment for 1997. Bull. Amer. Meteor. 651
Soc., 79, S1–S50. 652
653
Bertuzzo, E., L. Mari, L. Righetto, M. Gatto, R. Casagrandi, and I. Rodriguez-Iturbe, 654
2012: Hyrdoclimatology of dual-peak annual cholera incidence: insights from a spatially 655
explicit model. Geophysical Res. Lett., 39, doi: 10.1029/2011GL050723. 656
657
Blokesch, M., and G.K. Schoolnik GK, 2007: Serogroup conversion of Vibrio cholerae in 658
aquatic reservoirs. PLoS Pathogens, 3, e81. [Available online at 659
http://www.plospathogens.org/article/info%3Adoi%2F10.1371%2Fjournal.ppat.0030081660
] 661
662
Brooke, J., 1991: Peru's Poor Feel Hardship of 'Fuji Shock' Austerity. NY Times, August 663
12. [Available online at http://www.nytimes.com/1990/08/12/world/peru-s-poor-feel-664
hardship-of-fuji-shock-austerity.html] 665
30
666
Caviedes, C.N., 2001: El Niño in History: Storming through the Ages. University Press of 667
Florida. 668
669
Cazelles, B., M. Chavez, G. Constantin de Magny, J. Guegan and S. Hales, 2007: Time-670
dependent spectral analysis of epidemiological time-series with wavelets. The Journal of 671
the Royal Society Interface, 4, 625-636. 672
673
Chavez, F.P., 1996: Forcing and biological impact of onset of the 1992 El Niño in central 674
California. Geophysical Research Letters, 23, 265-268. 675
676
Chavez, F.P., A. Bertrand, R. Guevarro-Carrasco, P. Soler and J. Csirke, 2008: The 677
northern Humboldt Current system: ocean dynamics, ecosystem processes, and fisheries. 678
Progress in Oceanography, 79, 1-15. [Available online at 679
http://www.imarpe.gob.pe/paita/documentos/Editorial_Conf_Humboldt.pdf] 680
681
Checkley, W., L.D. Epstein, R.H. Gilman, D. Figueroa, R.I. Cama, J.A. Patz, and R.E. 682
Black, 2000: Effect of El Niño and ambient temperature on hospital admissions for 683
diarrhoeal diseases in Peruvian children. The Lancet, 355, 442–450. 684
685
Chin, C.C., and Coauthors, 2011: The origin of the Haitian cholera outbreak strain. New 686
England Journal of Medicine, 364, 33-42. 687
688

31
Codeco, C.T., 2001: Endemic and epidemic dynamics of cholera: the role of the aquatic 689
reservoir. BMC Infectious Diseases, 1. [Available online at 690
http://www.biomedcentral.com/1471-2334/1/1] 691
692
Consortium for Capacity Building (CCB), 2011: Climate Affairs: What do we mean and 693
why? [Available online at http://ccb.colorado.edu/climate.php] 694
695
Colwell, R.R., 1996: Global climate and infectious disease: The cholera paradigm. 696
Science, 274, 2025-2031. 697
698
Colwell, R.R., and W.M. Spira, 1992: The ecology of Vibrio cholerae. Cholera, D. Barua 699
and W.B. Greenough III, Eds., Plenum Medical, 107-127. 700
701
Constantin de Magny, G., and Coauthors, 2008: Environmental signatures associated 702
with cholera epidemics. Proceedings of the National Academy of Sciences of the United 703
States of America, 105, 17676-17681. 704
705
Cravioto, A., C.F. Lanata, D.S. Lantagne, and G.B. Nair, 2011: Final report of the 706
independent panel of experts on the cholera outbreak in Haiti. United Nations. [Available 707
online at http://www.un.org/News/dh/infocus/haiti/UN-cholera-report-final.pdf] 708
709
Cueto, M., 2001: The Return of Epidemics: Health and Society in Peru during the 710
Twentieth Century. Ashgate, 107-137. 711
32
712
Cutter, S.L., C.T. Emrich, J.J. Webb, and D. Morath, 2009: Social vulnerability to 713
climate variability hazards: a review of the literature. Final report to Oxfam America. 714
Hazards and Vulnerability Research Institute. [Available online at 715
http://adapt.oxfamamerica.org/resources/Literature_Review.pdf] 716
717
El Tiempo (The Times), 1991: Se agudiza deficiencia energética y de agua (Energy and 718
water deficiencies worsen). 28 January, Piura. (in Spanish) 719
720
El Tiempo (The Times), 1992: Critica situación afrontan los distritos por lluvias 721
(Districts face a critical situation caused by rains). 18 March, Piura. (in Spanish) 722
723
El Tiempo (The Times), 1992: 60 familias afectadas por las lluvias en El Indio (60 724
families are affected by rains in El Indio). 19 March, Piura. (in Spanish) 725
726
Emch, M., C. Feldacker, M. Yunus, P.K. Streafield, V.D. Thiem, D.G. Canh, and M. Ali, 727
2008: Local environmental predictors of cholera in Bangladesh and Vietnam. American 728
Journal of Tropical Medicine and Hygiene, 78, 823-832. 729
730
Emch, M., M. Yunus, V. Escamilla, C. Feldacker, and M. Ali, 2010: Local population 731
and regional environmental drivers of cholera in Bangladesh. Environmental Health, 9. 732
[Available online at http://www.ehjournal.net/content/9/1/2] 733
734

33
Enfield, D.B., 1981: Annual and nonseasonal variability of monthly low-level wind fields 735
over the southeastern Tropical Pacific. Monthly Weather Review, 109, 2177-2190. 736
737
Enserink, M., 2011: Despite sensitivities, scientists seek to solve Haiti’s cholera riddle. 738
Science, 331, 388-389. 739
740
Epstein, P.R., 1992: Cholera and the environment. The Lancet, 339, 1167-1168. 741
742
Epstein, P.R., 1993: Algal blooms in the spread and persistence of cholera. Biosystems, 743
31, 209-221. 744
745
Epstein, P.R., T.E. Ford, C. Puccia, and C.D. Possas, 1994: Marine ecosystem health: 746
implications for public health. Disease and Evolution: Global Changes and Emergence of 747
Infectious Diseases, M.E. Wilson, R. Levins, and A. Spielman, Eds., Annals of the New 748
York Academy of Sciences, 13-23. 749
750
Epstein, P. R., T.E. Ford, and R.R. Colwell, 1993: Health and climate change: Marine 751
ecosystems. The Lancet, 342, 1216-19. 752
753
Flores, M., 1998: Fisheries. Assessment of the use of remote sensing and other 754
information related to ENSO: the use of ENSO information in Peru, M.H. Glantz, Ed., 755
NASA/NCAR/Peru Project Final Report. Boulder, CO. Environmental and Societal 756
Impacts Group, National Center for Atmospheric Research, 37-42. 757
34
758
Franco, A.A., and Coauthors, 1997: Cholera in Lima, Peru, correlates with prior isolation 759
of Vibrio Cholerae from the Environment. American Journal of Epidemiology, 146, 760
1067-1075. 761
762
Gangarosa, E.J., and R.V. Tauxe, 1992: Epilogue: the Latin American cholera epidemic. 763
Cholera, D. Barua and W.B. Greenough III, Eds., Plenum Medical, 351-357. 764
765
Gil, A.I., and Coauthors, 2004: Occurrence and distribution of Vibrio cholerae in the 766
coastal environment of Peru. Environmental Microbiology, 6, 699-706. 767
768
Glantz, M.H., 2001a: Currents of Change: Impacts of El Niño and La Niña on Climate 769
and Society. Cambridge University Press. 770
771
Glantz, M.H., Ed., 2001b: Once Burned, Twice Shy: Lessons Learned from the 1997-98 772
El Niño. United Nations University Press. 773
774
Glantz, M.H., Ed., 2002. La Niña and Its Impacts: Facts and Speculation. United Nations 775
University Press. 776
777
Glantz, M.H., 2003: Climate Affairs: A Primer. Island Press. 778
779
35
Glantz, M.H., and D. Jamieson, 2000: Societal response to Hurricane Mitch and intra- 780
versus intergenerational equity issues: whose norms should apply? Risk Analysis, 6, 869-781
882. 782
783
Glantz, M.H., and Z. Adeel, 2000: Climate Affairs as a next-generation environmental 784
science. Global Environmental Change, 10, 81-85. 785
786
Glass, R.I., M. Claeson, P.A. Blake, R.J. Waldman, and N.F. Pierce, 1991: Cholera in 787
Africa: Lessons on transmission and control for Latin America. The Lancet, 338, 791-788
795. 789
790
Goddard, L., and N.E. Graham, 1997: El Niño in the 1990s. J. Geophys. Res., 102, 791
10423-10436. 792
793
Gomez Pando, V., and S.R. Pineda, 1991: Endemicidad del Vibrio Cholerae en Lima 794
(Endemicity of Vibrio cholerae in Lima). Salud Publica y Medicina Preventiva en el 795
Desarollo (Public Health and Preventive Medicine in Development), V. Gomez Pando, 796
Ed., 345-350. 797
798
Gueri, A., 1984: Lessons learned: health effects of El Niño in Peru. Disasters: 799
Preparedness and Mitigation, 19. PAHO. [Available online at 800
http://helid.digicollection.org/en/d/Jdi019e/2.html] 801
36
Halpert, M.S., and G.D. Bell, 1997: Climate assessment for 1996. Bull. Amer. Meteor. 802
Soc., 78, S1-49. 803
804
Hashizume, M, A.S. Faruque, Y. Wagatsuma, T. Hayashi, and B. Armstrong, 2010: 805
Cholera in Bangladesh: Climatic Components of Seasonal Variation. Epidemiology, 21, 806
706-710. 807
808
Hernan Vargas, F., S. Harrison, S. Rea, and D.W. Macdonald, 2006: Biological effects of 809
El Niño on the Galapagos penguins. Biological Conservation, 127, 107-114. 810
811
Huanca, R.I., 2004: El fenómeno El Niño y su influencia en el desarollo de algunos 812
brotes epidémicos: Cono norte-Lima (The El Niño phenomenon and its influence on the 813
emergence of epidemics: North Lima). Revista de Viernes Medico, 29, 38-43. (in 814
Spanish) 815
816
Huq, A., and Coauthors, 2005: Critical factors influencing the occurrence of vibrio 817
cholerae in the environment of Bangladesh. Applied and Environmental Microbiology, 818
71, 4645-4654. 819
820
Instituto Nacional de Salud (National Institute of Health), 2006: Fortalecimiento de la 821
vigilancia de Laboratorio: Vibrio cholerae, Fenómeno El Niño Peru 2006-2007 822
(Strengthening laboratory surveillance: Vibrio cholerae, the El Niño phenomenon Peru). 823
Boletín del Instituto Nacional de Salud, 50. (in Spanish) 824

37
825
International Research Institute for Climate and Society (IRI), 2008: The ENSO system. 826
[Available online at http://iri.columbia.edu/climate/ENSO/enso.html] 827
Jimenez, C. and J. Cortes, 2001: Effects of the 1991-92 El Niño on scleractinian corals of 828
the Costa Rican central Pacific coast. Revista de Biologia Tropical, 49, 239-250. 829
830
Jutla, A.S., A.S. Akanda, J.K. Griffiths, R.R. Colwell, and S. Islam, 2011: Warming 831
oceans, phytoplankton, and river discharge: implications for cholera outbreaks. American 832
Journal of Tropical Medicine and Hygiene, 85, 303-308. 833
834
Kessler, W.S., and M.J. McPhaden, 1995: Oceanic equatorial waves and the 1991-93 El 835
Niño. J. Climate, 8, 1757-1774. 836
837
Koelle, K., X. Rodo, M. Pascual, M. Yunus, and G. Mostafa, 2005: Refractory periods 838
and climate forcing in cholera dynamics. Nature, 436, 696–700. 839
840
Kovats, R.S., M.J. Bouma, S. Hajat, E. Worrall, and A. Haines, 2003: El Niño and health. 841
The Lancet, 362, 1481 – 1489. 842
843
Lagos, P., and J. Buizer, 1992: El Niño and Peru: a nation’s response to interannual 844
climate variability. Natural and Technological Disasters: Causes, Effects and Preventive 845
Measures, Majumdar et al., Eds., The Pennsylvania Academy of Science, 223-238. 846
847
38
Lagos, P., Y. Silva, E. Nickl, and K. Mosquera, 2008: El Niño-related precipitation 848
variability in Peru. Advances in Geosciences, 14, 231-237. [Available online at 849
http://www.adv-geosci.net/14/231/2008/] 850
851
Lam C., S. Octavia, P. Reeves, L. Wang, and R. Lan, 2010: Evolution of seventh cholera 852
pandemic and origin of 1991 epidemic, Latin America. Emerging Infectious Diseases, 16, 853
1130-1132. [Available online at http://wwwnc.cdc.gov/eid/article/16/7/pdfs/10-0131.pdf] 854
855
Lama, J.R., C.R. Seas, R. Leon-Barua, E. Gotuzzo, and R.B. Sack, 2004: Environmental 856
temperature, cholera, and acute diarrhea in adults in Lima, Peru. Journal of Health and 857
Population Nutrition, 22, 399-403. 858
859
Lavado Casimiro, W.S., J. Ronchail, D. Labat, J.C. Espinoza, and J.L. Guyot, 2012: 860
Basin-scale analysis of rainfall and run-off in Peru (1969-2004): Pacific, Titicaca and 861
Amazonas drainages. Hydrological Sciences Journal. [Available online at 862
http://www.igp.gob.pe/igp/images/documents/comunicaciones/publicaciones/2012/perutr863
ends_iahs_2012.pdf] 864
865
Lipp, E.K., and Coauthors, 2003: Direct detection of Vibrio cholerae and ctxA in 866
Peruvian coastal water and plankton by PCR. Applied and Environmental Microbiology, 867
69, 3676-3680. 868
869

39
Madico, G.W., Checkley, R.H. Gilman, N. Bravo, L. Cabrera, M. Calderon, and A. 870
Ceballos, 1996: Active surveillance for Vibrio cholerae 01 and vibriophages in sewage 871
water as a potential tool to predict cholera outbreaks. Journal of Clinical Microbiology, 872
34, 2968-2972. 873
874
Mata, L., 1994: Cholera El Tor in Latin America. Disease and Evolution: Global 875
Changes and Emergence of Infectious Diseases, M.E. Wilson, R. Levins, and A. 876
Spielman, Eds., Annals of the New York Academy of Sciences, 55-68. 877
878
Marchant, M., D. Hebbeln, and G. Wefer, 1998: Seasonal flux patterns of planktic 879
foraminifera in the Peru-Chile Current. Deep-Sea Research I, 45, 1161-1185. 880
881
Marengo, J.A., and Coauthors, 2008: The drought of Amazonia in 2005. J. Climate, 21, 882
495-516. 883
884
Marengo, J.A., 1999: Estudios sobre tendencias y variabilidad climatica en el tropico 885
sudamericano: Peru y Brasil (A study of climate influences and variability in the South 886
American tropics: Peru and Brazil). Peru: Vulnerabilidad Frente al Cambio Climático: 887
Aproximaciones a la Experiencia con El Fenómeno El Niño (Peru: Vulnerability to 888
Climate Change: The Experience of the El Niño Phenomenon as an Analogue), B. 889
Marticorena, Ed., Consejo Nacional de Ambiente, 185-204. (in Spanish) 890
891
40
Mari, L., E. Bertuzzo, L. Righetto, R. Casagrandi, M. Gatto, I. Rodriguez-Iturbe, and A. 892
Rinaldo, 2012: Modelling cholera epidemics: the role of waterways, human mobility and 893
sanitation. Journal of the Royal Society Interface, 9, 376-388. 894
895
Martinez-Urtaza, J., B. Huapaya, R.G. Gavilan, V. Blanco-Abad, J. Ansede-Bermejo, C. 896
Cadarso-Suarez, A. Figueiras, and J. Trinanes, 2008: Emergence of Asiatic vibrio 897
diseases in South America in phase with El Niño. Epidemiology, 19, 829-837. 898
899
McPhaden, M., 1994: TOGA-TAO and the 1991-93 El Niño-Southern Oscillation Event. 900
National Oceanic and Atmospheric Administration. [Available online at 901
http://www.pmel.noaa.gov/pubs/docs/mcph1401.html] 902
903
McPhaden, M.J., S.E. Zebiak, and M.H. Glantz, 2006: ENSO as an integrating concept in 904
earth science. Science, 314, 1740-1745. 905
906
Mendelsohn, J., and T. Dawson, 2008: Climate and cholera in KwaZulu-Natal, South 907
Africa: the role of environmental factors and implications for epidemic preparedness. 908
International Journal of Hygiene and Environmental Health, 211, 156-162. 909
910
Ministerio de Salud (MINSA) (Ministry of Health), Lima, Peru, 1994: Recopilación y 911
sistematizacion de las condiciones ambientales y actividades desarrolladas en el control 912
de la epidemia del cólera (A summary of environmental conditions and activities to 913
control the cholera epidemic). MINSA. (in Spanish) 914
41
915
MINSA, 1995: Reporte Epidemiológico(Epidemiology Report), Week 39. (in Spanish) 916
917
MINSA, 1998a: Reporte Epidemiológico (Epidemiology Report), Week 17. (in Spanish) 918
919
MINSA, 1998b: Reporte Epidemiológico (Epidemiology Report), Week 21. (in Spanish) 920
921
MINSA, 1998c: Reporte Epidemiológico (Epidemiology Report), Week 26. (in Spanish) 922
923
MINSA, 1998d: Reporte Epidemiológico (Epidemiology Report), Week 52. (in Spanish) 924
925
MINSA, 1999a: Las últimas consecuencias del fenómeno “La Niña” en el Peru (The 926
phenomenon “La Niña” and recent impacts in Peru). Reporte Epidemiológico 927
(Epidemiology Report), Week 7. (in Spanish) 928
929
MINSA, 1999b: Reporte Epidemiológico (Epidemiology Report), Week 5. (in Spanish) 930
931
MINSA, 2000: Reporte Epidemiológico (Epidemiology Report), Week 10. (in Spanish) 932
933
MINSA, 2005: Reporte Epidemiológico (Epidemiology Report), Week 1. (in Spanish) 934
935
MINSA, 2008: Suspected and clinically confirmed cholera cases in Peru from 1991 to 936
2002. The Department of Epidemiology, Lima, Peru. 937
42
938
Mourino-Perez, R.R, 1998: Océanography and the seventh cholera pandemic. 939
Epidemiology, 9, 355-357. 940
941
Nash, N.C., 1991: Fujimori in the time of cholera. NY Times, 24 February. [Available 942
online at http://www.nytimes.com/1991/02/24/weekinreview/the-world-fujimori-in-the-943
time-of-cholera.html] 944
945
NOAA, 1992: ENSO Advisory, May. Climate Analysis Center. 946
947
NOAA, 1993: ENSO Advisory, May. Climate Analysis Center. 948
949
NOAA, 2005: El Niño Regions. Climate Prediction Center. [Available online at 950
http://www.cpc.ncep.noaa.gov/products/analysis_monitoring/ensostuff/Niño_regions.sht951
ml] 952
953
NOAA, 2011: Frequently asked questions about El Niño and La Niña. Climate Prediction 954
Center. [Available online at 955
http://www.cpc.ncep.noaa.gov/products/analysis_monitoring/ensostuff/ensofaq.shtml] 956
957
NOAA, 2012: Cold and warm episodes by season. Climate Prediction Center. [Available 958
online at 959
http://www.cpc.ncep.noaa.gov/products/analysis_monitoring/ensostuff/ensoyears.shtml] 960
961
43
Nusrin, S., and Coauthors, 2009: Peruvian Vibrio cholerae O1 El Tor strains possess a 962
distinct region in the Vibrio seventh pandemic island-II that differentiates them from the 963
prototype seventh pandemic El Tor strains. Journal of Medical Microbiology, 58, 342-964
354. 965
966
Ordinola, N., 2002: The consequences of cold events for Peru. La Niña and Its Impacts: 967
Facts and Speculation, M.H. Glantz, Ed., United Nations University Press, 146-150. 968
969
Pan American Health Organization (PAHO), 1991. Cholera situation in the Americas: An 970
update. 1991. Epidemiological Bulletin, 2, 1-16. 971
972
PAHO, 1998a: Peru: Fenómeno “El Niño”. Informe estratégico #2, OPS-Peru, Week 10. 973
(in Spanish) 974
975
PAHO, 1998b: El Niño and its impact on health. 122nd
Meeting, Washington, D.C. June 976
1998, Provisional agenda item 4.4.[Available online at 977
http://www.bvsde.paho.org/bvsacd/cd68/ElNiño.pdf] 978
979
PAHO, 2008: The number of cholera cases in the Americas, 1990-2008. [Available 980
online at http://www.paho.org/English/AD/DPC/CD/cholera-1990-2008.pdf] 981
982
Pascual, M., X. Rodo, S.P. Ellner, R.R. Colwell, and M.J. Bouma, 2000: Cholera 983
Dynamics and El Niño-Southern Oscillation. Science, 289, 1766-1769. 984
44
985
Piarroux, R., R. Barrais, B. Faucher, R. Haus, M. Piarroux, J. Gaudart, R. Magloire, and 986
D. Raoult, 2011: Understanding the cholera epidemic, Haiti. Emerging Infectious 987
Diseases, 17, 1161-1167. [Available online at http://wwwnc.cdc.gov/eid/article/17/7/11-988
0059_article.htm] 989
990
Pizarro, L., 1999: El Niño phenomenon and natural disasters in Peru. Internacional 991
Workshop on Natural Disaster Management, 10-12 June, 1999, Beijing, China. 992
[Available online at www.crid.or.cr/digitalizacion/pdf/eng/doc15155/doc15155-993
contenido.pdf] 994
995
Ramírez, I.J., 2012. Cholera in a Time of El Niño and Vulnerability in Piura, Peru: A 996
Climate Affairs Approach. (doctoral dissertation). Proquest Dissertations and 997
Theses 2012. Michigan State University. Publication Number, AAT 3490977. 998
999
Reiner, Jr., R.C., A.A. King, M. Emch, M. Yunusd, A.S.G. Faruqued, and M. Pascual, 1000
2011: Highly localized sensitivity to climate forcing drives endemic cholera in a 1001
megacity. Proceedings of the National Academy of Sciences of the United States of 1002
America, 109, doi: 10.1073/pnas.1108438109. 1003
1004
Ries, A.A., and Coauthors, 1992: Cholera in Piura, Peru: A modern urban epidemic. The 1005
Journal of Infectious Diseases, 166, 1429-1433. 1006
1007
45
Rinaldo, A., and Coauthors, 2012: Reassessment of the 2010-2011 Haiti cholera outbreak 1008
and rainfall-driven multiseason projections. Proceedings of the National Academy of 1009
Sciences of the United States of America, 109, doi: 10.1073/pnas.1203333109. 1010
1011
Ropelewski, C., and M. Halpert, 1987: Global and regional scale precipitation patterns 1012
associated with the El Niño/Southern Oscillation. Mon. Wea. Rev., 115, 1606-1626. 1013
1014
Ruiz-Moreno, D., M. Pascual, M. Bouma, A. Dobson, and B. Cash, 2007: Cholera 1015
seasonality in Madras (1901-1940): dual role for rainfall in endemic and epidemic 1016
regions. EcoHealth, 4, 52-62. 1017
1018
Salazar-Lindo, E., C. Seas, and D. Gutiérrez, 2008: ENSO and cholera in South America: 1019
what can we learn about it from the 1991 cholera outbreak? International Journal of 1020
Environment and Health, 2, 30-36. 1021
1022
Salazar-Lindo, E., P. Pinell-Salles, A. Maruy, and E. Chea-Woo, 1997: El Niño and 1023
diarrheoa and dehydration in Lima, Peru. The Lancet, 350, 1597-1598. 1024
1025
Seas, C., and E. Gotuzzo, 1996: Cholera: overview of epidemiologic, therapeutic, and 1026
preventive issues learned from recent epidemics. International Journal of Infectious 1027
Diseases, 1, 37-46. 1028
1029

46
Seas, C., J. Miranda, A.I. Gil, R. Leon-Barua, J. Patz, A. Huq, R.R. Colwell, and R.B. 1030
Sack, 2000: New insights on the emergence of cholera in Latin America during 1991: the 1031
Peruvian experience. The American Journal of Tropical Medicine and Hygiene, 62, 513 –1032
517. 1033
1034
Servicio Nacional de Meteorologia e Hidrologia (SENAMHI) (National Meteorology and 1035
Hydrology Services, Peru), Lambayeque, 2004: El evento El Niño Oscilacion Sur 1997-1036
1998: su impacto en el departamento de Lambayeque (The 1997/98 ENSO event: impacts 1037
in the Department of Lambayeque). Chiclayo, Peru. [Available online at 1038
http://www.senamhi.gob.pe/?p=0702] (in Spanish) 1039
1040
SENAMHI, 2009: Escanarios de cambio climatico en la cuenca del Rio Urubamba para 1041
el ano 2100: resumen técnico (Climate change scenarios for the Urubamba River Basin in 1042
2100: a technical summary). Lima, Peru. (in Spanish) 1043
1044
Speelmon, E.C., W. Checkley, R.H. Gilman, J. Patz, M. Calderon, and S. Manga, 2000: 1045
Cholera incidence and El Niño-related higher ambient temperature. Journal of the 1046
American Medical Association, 283, 3072-3074. 1047
1048
Sperling, F., C. Valdivia, R. Quiroz, R. Valdivia, L. Angulo, A. Seimon, and I. Noble, 1049
2008: Transitioning to climate resilient development: perspectives from communities in 1050
Peru. Environment Department Papers, Climate Change Series, #115. The World Bank. 1051

47
[Available online at http://sanrem.missouri.edu/WB-EDP%20115-1052
%20Transitioning%20to%20Climate%20Resilient%20Development-Peru.pdf] 1053
1054
Tauxe, R., E.D. Mintz, and R.E. Quick, 1995: Epidemic cholera in the New World: 1055
translating field epidemiology into new strategies. Emerging Infectious Diseases, 1, 4. 1056
[Available online at http://www.cdc.gov/ncidod/EID/vol1no4/tauxe.htm] 1057
1058
Trenberth, K.E., 1997: The definition of El Niño. Bull. Amer. Meteor. Soc, 78, 2771-1059
2777. [Available online at http://www.cgd.ucar.edu/cas/papers/clivar97/en.dfn.html] 1060
1061
Trenberth, K.E. and T.J. Hoar, 1996: The 1990-1995 El Niño-Southern Oscillation event: 1062
longest on record. Geophysical Res. Lett., 23, 57-60. 1063
1064
United Nations Office for the Coordination of Humanitarian Affairs (UNDRO), 1990b: 1065
Peru Earthquake May 1990 UNDRO Situation Reports, 1-7. [Available online at 1066
http://www.reliefweb.int/rw/rwb.nsf/db900SID/OCHA-64C3R8?OpenDocument] 1067
1068
UNDRO, 1990a: Peru Drought June 1990 UNDRO Situation Reports, 1-5. [Available 1069
online at http://www.reliefweb.int/rw/rwb.nsf/db900sid/OCHA-1070
64BQQC?OpenDocument] 1071
1072
UNDRO, 1998: Peru El Niño floods OCHA Situation Report, 11. [Available online at 1073
http://www.reliefweb.int/rw/rwb.nsf/db900SID/ACOS-64D2FY?OpenDocument] 1074
48
1075
Valverde, A., 1998: Influence of El Niño in the systems of hydroelectric generation. 1076
Assessment of the use of remote sensing and other information related to ENSO: the use 1077
of ENSO information in Peru, M.H. Glantz, Ed., NASA/NCAR/Peru Project Final 1078
Report. Boulder, CO. Environmental and Societal Impacts Group, National Center for 1079
Atmospheric Research, 45-48. 1080
1081
World Meteorological Organization (WMO), 1999: The 1997-1998 El Niño Event: A 1082
Scientific and Technical Retrospective. WMO-No. 905. World Meteorological 1083
Organization. 1084
1085
Wyrtki, K., 1975: Teleconnections in the equatorial Pacific Ocean. Science, 180, 66-68. 1086
1087
Youngers, C.A., 2000: Deconstructing democracy: Peru under President Alberto 1088
Fujimori. Washington Office on Latin America. 1089
1090
1091
1092
1093
1094
1095
1096
1097
49
List of Figures 1098
FIG. 1. Map of Niño Regions. Source: NOAA 1099
(http://www1.ncdc.noaa.gov/pub/data/cmb/enso/Niño-regions.gif ). 1100
1101
FIG. 2. Physical map of Peru highlighting 3 departments: Lima (central coast), Loreto 1102
(north jungle) and Piura (north coast, discussed in Section 5c). Sources: University of 1103
Piura (Private), Peru and Nature Earth (http://www.naturalearthdata.com/). 1104
1105
FIG. 3. Cholera cases (suspected and confirmed) by month for each year from 1993 to 1106
1998 in the Departments of Lima (a) and Loreto (b). Source: General Office of 1107
Epidemiology, MINSA, Lima, Peru. 1108
1109
FIG. 4. Monthly SST anomalies (°C) in 3 Niño regions (1+2, 3.4 and 4) are plotted in 1110
relation to monthly cholera cases (suspected and confirmed) in Peru from 1990 to 1992. 1111
SST anomalies are based on the period 1971-2000. See Table 1 for ENSO events (a) to 1112
(d). Sources: General Office of Epidemiology, MINSA, Lima, Peru and NOAA 1113
(http://www.cpc.noaa.gov/data/indices/). 1114
1115
FIG. 5. Cholera cases (in hundreds) and rainfall (mm in hundreds) for January to April 1116
for 1991 to 2000 at the Miraflores meteorological station (5.17°S, 80.6°W; 30 msnm) in 1117
the subregion of Piura, Peru. Sources: MINSA, Piura and University of Piura (Private), 1118
Peru. 1119
1120

50
1121
Table 1. Listings of El Niño and La Niña events from 1990 to 1992 as defined by SSTA 1122
exceeding ±0.5°C threshold. Each qualifying event is given along with the Niño region, 1123
phase and start and end dates. 1124
1125
Event Region Phase Begin End Duration
(a) Niño 4 El Niño Jul-90 Aug-92 26
(b) Niño 1+2 La Niña Jul-90 Dec-90 6
(c) Niño 3.4 El Niño May-91 Jul-92 15
(d) Niño 1+2 El Niño Nov-91 Jun-92 8
1126
1127
1128
1129
1130
1131
1132
1133
1134
1135
1136
1137
1138
1139
1140
1141
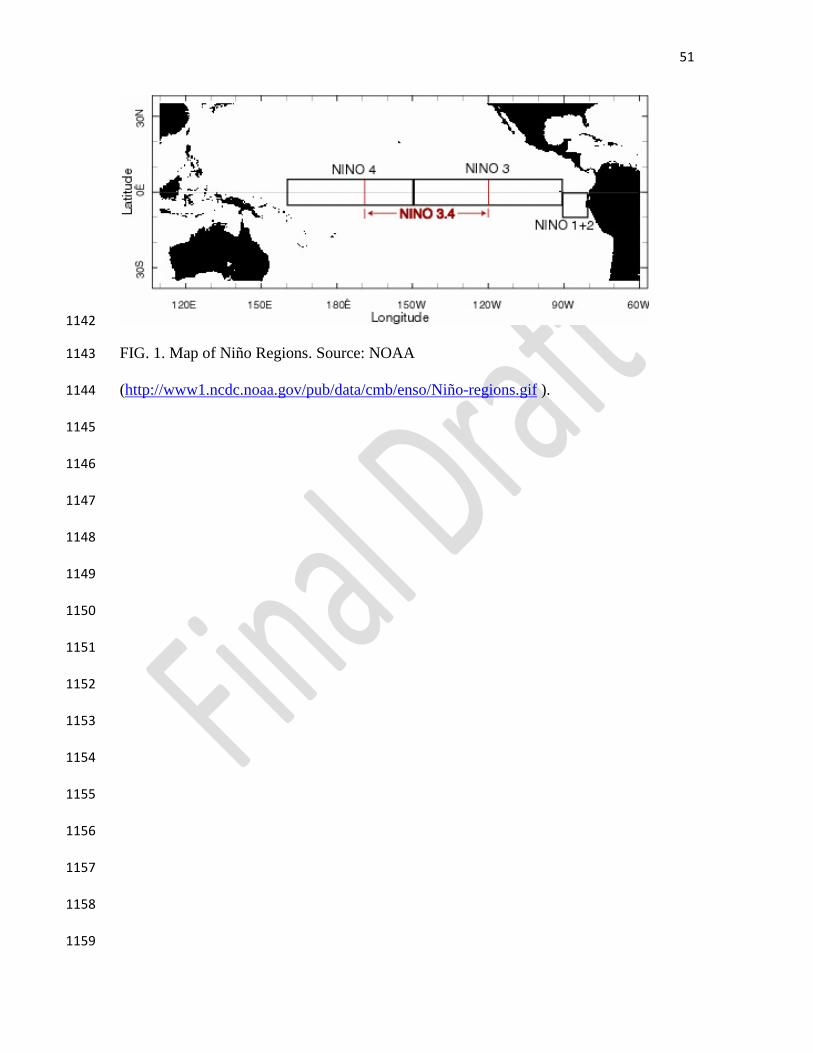
51
1142
FIG. 1. Map of Niño Regions. Source: NOAA 1143
(http://www1.ncdc.noaa.gov/pub/data/cmb/enso/Niño-regions.gif ). 1144
1145
1146
1147
1148
1149
1150
1151
1152
1153
1154
1155
1156
1157
1158
1159
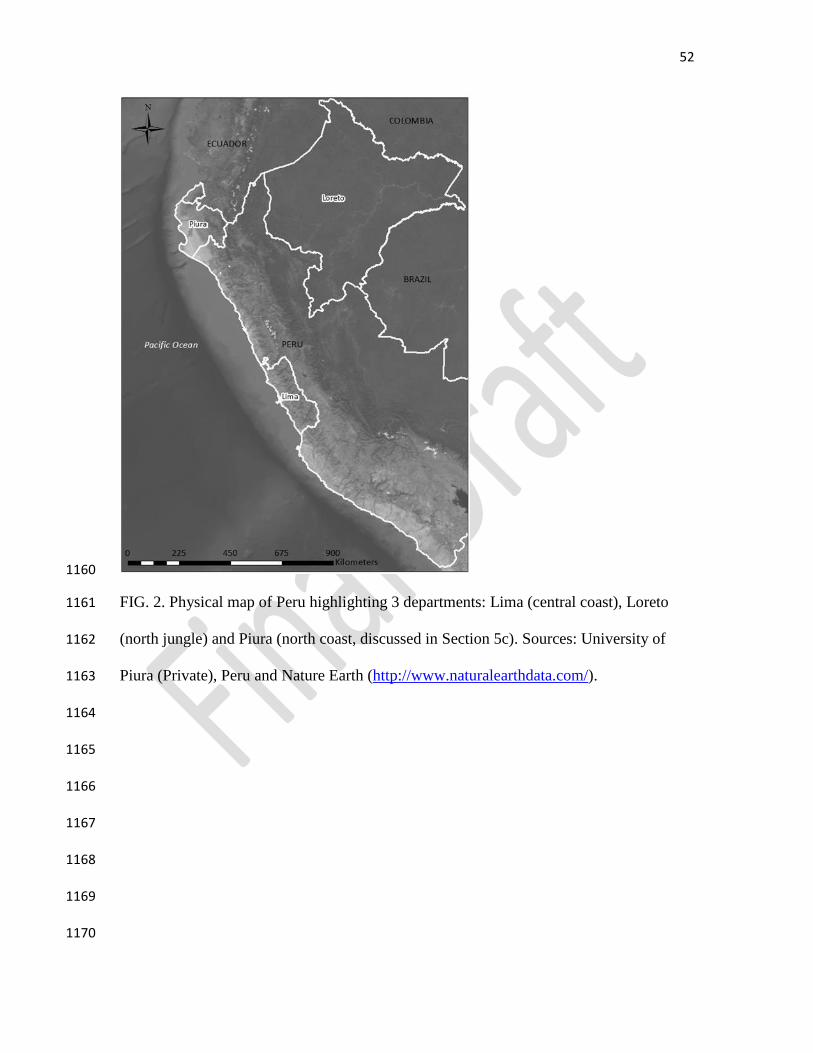
52
1160
FIG. 2. Physical map of Peru highlighting 3 departments: Lima (central coast), Loreto 1161
(north jungle) and Piura (north coast, discussed in Section 5c). Sources: University of 1162
Piura (Private), Peru and Nature Earth (http://www.naturalearthdata.com/). 1163
1164
1165
1166
1167
1168
1169
1170

53
1171
FIG. 3. Cholera cases (suspected and confirmed) by month for each year from 1993 to 1172
1998 in the Departments of Lima (a) and Loreto (b). Source: General Office of 1173
Epidemiology, MINSA, Lima, Peru. 1174
(a)
(b)
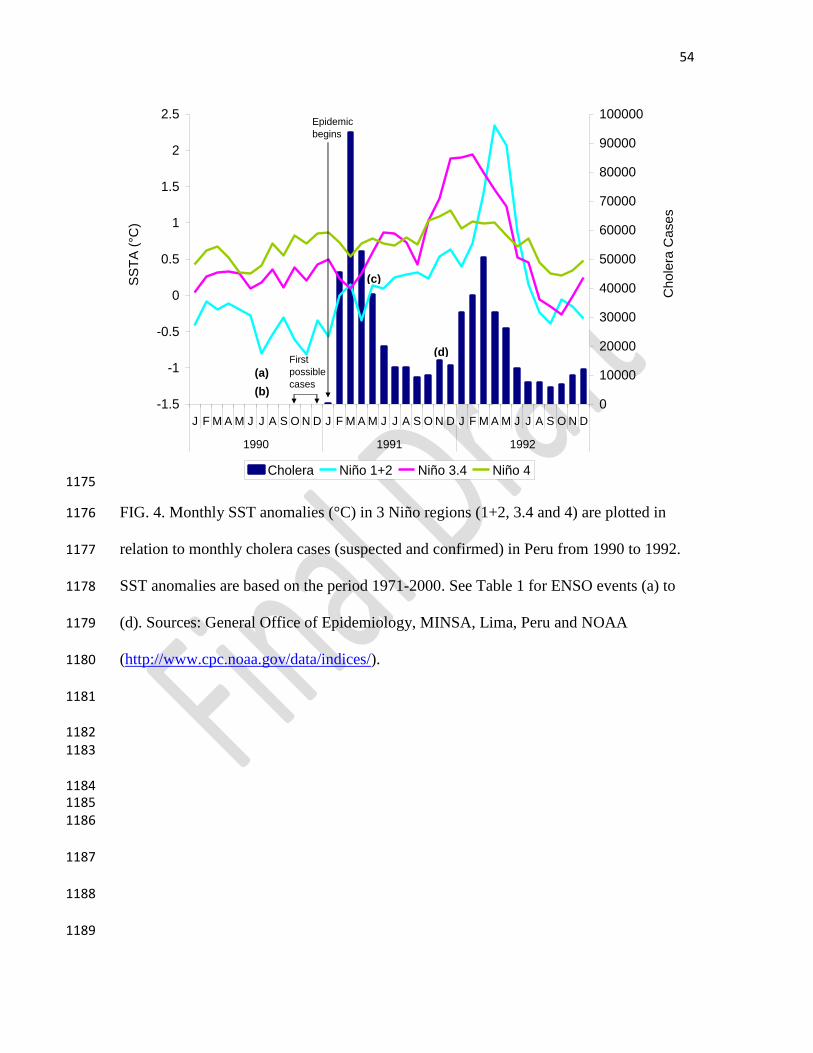
54
1175
FIG. 4. Monthly SST anomalies (°C) in 3 Niño regions (1+2, 3.4 and 4) are plotted in 1176
relation to monthly cholera cases (suspected and confirmed) in Peru from 1990 to 1992. 1177
SST anomalies are based on the period 1971-2000. See Table 1 for ENSO events (a) to 1178
(d). Sources: General Office of Epidemiology, MINSA, Lima, Peru and NOAA 1179
(http://www.cpc.noaa.gov/data/indices/). 1180
1181
1182 1183
1184 1185 1186
1187
1188
1189
-1.5
-1
-0.5
0
0.5
1
1.5
2
2.5
J F M A M J J A S O N D J F M A M J J A S O N D J F M A M J J A S O N D
1990 1991 1992
SS
TA
(°C
)
0
10000
20000
30000
40000
50000
60000
70000
80000
90000
100000
Cho
lera
Case
s
Cholera Niño 1+2 Niño 3.4 Niño 4
Epidemic
begins
First
possible
cases(a)
(b)
(d)
(c)

55
1190
FIG. 5. Cholera cases (in hundreds) and rainfall (mm in hundreds) for January to April 1191
for 1991 to 2000 at the Miraflores meteorological station (5.17°S, 80.6°W; 30 msnm) in 1192
the subregion of Piura, Peru. Sources: MINSA, Piura and University of Piura (Private), 1193
Peru. 1194
1195
1196
1197
1198
1199
1200
0
1
2
3
4
5
6
7
8
9
0
20
40
60
80
100
120
J FMA J FMA J FMA J FMA J FMA J FMA J FMA J FMA J FMA J FMA
1991 1992 1993 1994 1995 1996 1997 1998 1999 2000
Rain
fall
(mm
in h
undre
ds)
in P
iura
(Jan
-Apr)
Chole
ra c
ases (
in h
undre
ds)
in P
iura
(Jan
-Apr)
Cholera Rainfall
Copyright © 2022 FDOKUMEN