A Differential Effect of Indian Ocean Dipole and El Niño on Cholera Dynamics in Bangladesh
11
A Differential Effect of Indian Ocean Dipole and El Nin ˜o on Cholera Dynamics in Bangladesh Masahiro Hashizume 1 *, Luis Fernando Chaves 1,2 , A. S. G. Faruque 3 , Md Yunus 3 , Kim Streatfield 3 , Kazuhiko Moji 4 1 Institute of Tropical Medicine (NEKKEN) and the Global Center of Excellence program, Nagasaki University, Nagasaki, Japan, 2 Programa de Investigacio ´n en Enfermedades Tropicales, Escuela de Medicina Veterinaria, Universidad Nacional, Heredia, Costa Rica, 3 International Centre for Diarrhoeal Disease Research, Bangladesh, Dhaka, Bangladesh, 4 Research Institute for Humanity and Nature, Kyoto, Japan Abstract Background: A stationary (i.e., constant through time) association between El Nin ˜ o Southern Oscillation (ENSO), the Indian Ocean Dipole (IOD) and epidemics of cholera in Bangladesh has been widely assumed. However, whether or not elements of the local climate that are relevant for cholera transmission have stationary signatures of the IOD on their dynamics over different time scales is still not clear. Here we report results on the time-varying relationships between the various remote and local environmental drivers and cholera incidence in Bangladesh. Methodology/Principal Findings: We performed a cross wavelet coherency analysis to examine patterns of association between monthly cholera cases in the hospitals in Dhaka and Matlab (1983–2008) and indices for both IOD and ENSO. Our results showed that the strength of both the IOD and ENSO associations with cholera hospitalizations changed across time scales during the study period. In Dhaka, 4-year long coherent cycles were observed between cholera and the index of IOD in 1988–1997. In Matlab, the effect of ENSO was more dominant while there was no evidence for an IOD effect on cholera hospitalizations. Conclusions/Significance: Our results call for the consideration of non-stationary, possibly non-linear, patterns of association between cholera hospitalizations and climatic factors in cholera epidemic early warning systems. Citation: Hashizume M, Chaves LF, Faruque ASG, Yunus M, Streatfield K, et al (2013) A Differential Effect of Indian Ocean Dipole and El Nin ˜ o on Cholera Dynamics in Bangladesh. PLoS ONE 8(3): e60001. doi:10.1371/journal.pone.0060001 Editor: Dongsheng Zhou, Beijing Institute of Microbiology and Epidemiology, China Received November 20, 2012; Accepted February 20, 2013; Published March 29, 2013 Copyright: ß 2013 Hashizume et al. This is an open-access article distributed under the terms of the Creative Commons Attribution License, which permits unrestricted use, distribution, and reproduction in any medium, provided the original author and source are credited. Funding: This work was supported by the EcoHealth Project, Research Institute for Humanity and Nature, Kyoto, Japan and by Grants-in-Aid for Scientific Research (20790441) from the Ministry of Education, Culture, Sports, Science and Technology of Japan. LFC is funded by a Nagasaki University Cooperative grant and Japan Society for the Promotion of Science. The International Centre for Diarrhoeal Disease Research, Bangladesh acknowledges with gratitude the commitment of the Research Institute for Humanity and Nature, Japan to its research efforts. The funders had no role in study design, data collection and analysis, decision to publish, or preparation of the manuscript. Competing Interests: The authors have declared that no competing interests exist. * E-mail: [email protected] Introduction Cholera remains a major public health problem in many places, including Bangladesh, India, and a number of countries in Africa and South America [1]. Vibrio cholerae, the bacterium that causes the disease, is known to inhabit riverine, estuarine and coastal ecosystems with specific abiotic (e.g., temperature, sunlight, pH, salinity) and biotic components (e.g., phytoplankton, aquatic plants, and copepod zooplankton) [2–4]. V. cholerae has an increased growth rate in aquatic environments with warmer temperatures, particularly when combined with a high pH and blooms of phytoplankton, aquatic plants or algae [5–7]. It has been reported that the El Nin ˜ o-Southern Oscillation (ENSO) plays a role in the interannual variation of endemic cholera in Bangladesh [6,8–10]. Sea surface temperature (SST) and sea surface height (SSH) in the Bay of Bengal have been proposed to influence the incidence of cholera in Dhaka [6,11– 13]. The strong correlation between SST in the Bay of Bengal and outbreaks of cholera may occur because the warm waters along the coast, coupled with phytoplankton blooms driven by warm ocean temperatures, are favorable for V. cholerae multiplication [12,14]. SSTs over the entire basin of the Indian Ocean are uniformly modulated by the ENSO after a few months lag [15]. The Indian Ocean Dipole (IOD) is another climate mode that arises from ocean-atmosphere interactions that cause interannual climate variability in the tropical Indian Ocean [16,17]. A positive IOD indicates SST anomalies, with warmer than normal SSTs over the western basin and cooler than usual SSTs in the eastern basin near Sumatra. Conversely, a negative IOD indicates warmer than normal SSTs over the eastern basin and cooler than usual SSTs in the western tropical Indian Ocean. Although the extent to which the IOD is independent of ENSO has been debated [18], there is growing evidence that this air-sea interaction is specific to the Indian Ocean [19–21]. The IOD has been reported to affect regional ocean climate [22]. IOD events strongly influence sea level variations in the Bay of Bengal and sea level anomalies in the northern Bay may influence flooding and outbreaks of cholera in Bangladesh [23]. The IOD also plays an important role as a modulator of the Indian monsoon rainfall [24–27]. Rainfall and associated river levels have also been reported to influence cholera PLOS ONE | www.plosone.org 1 March 2013 | Volume 8 | Issue 3 | e60001
Transcript of A Differential Effect of Indian Ocean Dipole and El Niño on Cholera Dynamics in Bangladesh

A Differential Effect of Indian Ocean Dipole and El Ninoon Cholera Dynamics in BangladeshMasahiro Hashizume1*, Luis Fernando Chaves1,2, A. S. G. Faruque3, Md Yunus3, Kim Streatfield3,
Kazuhiko Moji4
1 Institute of Tropical Medicine (NEKKEN) and the Global Center of Excellence program, Nagasaki University, Nagasaki, Japan, 2 Programa de Investigacion en
Enfermedades Tropicales, Escuela de Medicina Veterinaria, Universidad Nacional, Heredia, Costa Rica, 3 International Centre for Diarrhoeal Disease Research, Bangladesh,
Dhaka, Bangladesh, 4 Research Institute for Humanity and Nature, Kyoto, Japan
Abstract
Background: A stationary (i.e., constant through time) association between El Nino Southern Oscillation (ENSO), the IndianOcean Dipole (IOD) and epidemics of cholera in Bangladesh has been widely assumed. However, whether or not elementsof the local climate that are relevant for cholera transmission have stationary signatures of the IOD on their dynamics overdifferent time scales is still not clear. Here we report results on the time-varying relationships between the various remoteand local environmental drivers and cholera incidence in Bangladesh.
Methodology/Principal Findings: We performed a cross wavelet coherency analysis to examine patterns of associationbetween monthly cholera cases in the hospitals in Dhaka and Matlab (1983–2008) and indices for both IOD and ENSO. Ourresults showed that the strength of both the IOD and ENSO associations with cholera hospitalizations changed across timescales during the study period. In Dhaka, 4-year long coherent cycles were observed between cholera and the index of IODin 1988–1997. In Matlab, the effect of ENSO was more dominant while there was no evidence for an IOD effect on cholerahospitalizations.
Conclusions/Significance: Our results call for the consideration of non-stationary, possibly non-linear, patterns ofassociation between cholera hospitalizations and climatic factors in cholera epidemic early warning systems.
Citation: Hashizume M, Chaves LF, Faruque ASG, Yunus M, Streatfield K, et al (2013) A Differential Effect of Indian Ocean Dipole and El Nino on Cholera Dynamicsin Bangladesh. PLoS ONE 8(3): e60001. doi:10.1371/journal.pone.0060001
Editor: Dongsheng Zhou, Beijing Institute of Microbiology and Epidemiology, China
Received November 20, 2012; Accepted February 20, 2013; Published March 29, 2013
Copyright: � 2013 Hashizume et al. This is an open-access article distributed under the terms of the Creative Commons Attribution License, which permitsunrestricted use, distribution, and reproduction in any medium, provided the original author and source are credited.
Funding: This work was supported by the EcoHealth Project, Research Institute for Humanity and Nature, Kyoto, Japan and by Grants-in-Aid for ScientificResearch (20790441) from the Ministry of Education, Culture, Sports, Science and Technology of Japan. LFC is funded by a Nagasaki University Cooperative grantand Japan Society for the Promotion of Science. The International Centre for Diarrhoeal Disease Research, Bangladesh acknowledges with gratitude thecommitment of the Research Institute for Humanity and Nature, Japan to its research efforts. The funders had no role in study design, data collection and analysis,decision to publish, or preparation of the manuscript.
Competing Interests: The authors have declared that no competing interests exist.
* E-mail: [email protected]
Introduction
Cholera remains a major public health problem in many places,
including Bangladesh, India, and a number of countries in Africa
and South America [1]. Vibrio cholerae, the bacterium that causes
the disease, is known to inhabit riverine, estuarine and coastal
ecosystems with specific abiotic (e.g., temperature, sunlight, pH,
salinity) and biotic components (e.g., phytoplankton, aquatic
plants, and copepod zooplankton) [2–4]. V. cholerae has an
increased growth rate in aquatic environments with warmer
temperatures, particularly when combined with a high pH and
blooms of phytoplankton, aquatic plants or algae [5–7].
It has been reported that the El Nino-Southern Oscillation
(ENSO) plays a role in the interannual variation of endemic
cholera in Bangladesh [6,8–10]. Sea surface temperature (SST)
and sea surface height (SSH) in the Bay of Bengal have been
proposed to influence the incidence of cholera in Dhaka [6,11–
13]. The strong correlation between SST in the Bay of Bengal and
outbreaks of cholera may occur because the warm waters along
the coast, coupled with phytoplankton blooms driven by warm
ocean temperatures, are favorable for V. cholerae multiplication
[12,14]. SSTs over the entire basin of the Indian Ocean are
uniformly modulated by the ENSO after a few months lag [15].
The Indian Ocean Dipole (IOD) is another climate mode that
arises from ocean-atmosphere interactions that cause interannual
climate variability in the tropical Indian Ocean [16,17]. A positive
IOD indicates SST anomalies, with warmer than normal SSTs
over the western basin and cooler than usual SSTs in the eastern
basin near Sumatra. Conversely, a negative IOD indicates warmer
than normal SSTs over the eastern basin and cooler than usual
SSTs in the western tropical Indian Ocean. Although the extent to
which the IOD is independent of ENSO has been debated [18],
there is growing evidence that this air-sea interaction is specific to
the Indian Ocean [19–21]. The IOD has been reported to affect
regional ocean climate [22]. IOD events strongly influence sea
level variations in the Bay of Bengal and sea level anomalies in the
northern Bay may influence flooding and outbreaks of cholera in
Bangladesh [23]. The IOD also plays an important role as a
modulator of the Indian monsoon rainfall [24–27]. Rainfall and
associated river levels have also been reported to influence cholera
PLOS ONE | www.plosone.org 1 March 2013 | Volume 8 | Issue 3 | e60001

patterns in Bangladesh [28,29] and a short-term temporal
association between IOD and cholera incidence in Bangladesh
has been reported [30]. These studies assumed that the association
between cholera incidence and ENSO and IOD was consistent
over the study period. However, whether elements of the local
climate that are relevant for cholera transmission have stationary
(i.e., constant through time) associations with the ENSO and IOD
over time is still not clear, and previous findings based on this
assumption can be improved by assuming a non-stationary (not
consistent overtime) association. This is of special interest because
the association between the IOD, ENSO and Indian summer
monsoon rainfall has been reported to vary over time [27].
Cholera is still a major health risk in many areas of the world and a
better understanding of its sensitivity to climate may contribute to
the development of a reliable climate-based prediction system of
cholera epidemics that could potentially lead to an improvement
in the currently existing disease control programme in Bangladesh
and other countries where cholera is endemic. The objective of the
present study is to explore the time-varying relationships between
global (i.e., IOD, ENSO) and local (i.e., temperature, rainfall, river
level and SST in the Bay of Bengal) environmental drivers and
cholera hospitalizations in Bangladesh, using cross wavelet
analysis.
Wavelet analysis is useful for epidemiological time series
analyses mainly because of the non-stationarity of associations
between the disease dynamics and exposure covariates [31].
Wavelet analysis is a method that has been used to determine
whether the presence of a particular periodic cycle at a given time
in a disease incidence corresponds to the presence of the same
periodical cycle at the same time in an exposure covariate [31].
Wavelet analysis has increasingly been used in epidemiology to
explore the spatial and temporal dynamics of diseases [32–36].
Methods
DataHospital surveillance. The primary outcome for this study
was the monthly number of patients with cholera who attended
the International Centre for Diarrhoeal Disease Research,
Bangladesh (ICDDR,B) hospitals in Dhaka and Matlab
(Figure 1). Dhaka: The ICDDR,B hospital serves a large urban
population within the city of Dhaka and provides free treatment
for more than 100,000 cases of diarrhea each year. A surveillance
system was established at the ICDDR,B in 1979 to systematically
sample children and adults with diarrheal illnesses [37]. Up to
1995, every 25th patient was enrolled in the surveillance system,
and since 1996 every 50th patient has been enrolled. Matlab.
Matlab is a rural and riverine delta area situated approximately
57 km southeast of Dhaka. Every hospital visit of patients residing
within the area covered by the Health and Demographic
Surveillance System (HDSS), which consists of 142 villages with
populations over 220,000, was registered in the hospital surveil-
lance system [38].
For each diarrhea patient of the ICDDR,B hospitals in Dhaka
and Matlab, the stool was microbiologically examined to identify
common enteric pathogens including V. cholerae. The details of the
laboratory procedures were described in a previous study [37]. A
patient was enrolled in the study when V. cholerae of the serogroups
O1 or O139 was identified in the stool specimen, regardless of the
presence of other pathogens. From the surveillance data that had
been collected over a 26-year period (January 1983 to December
2008) for Dhaka and 28-year period (January 1981 to December
2008) for Matlab, we retrieved the date of the hospital visit and the
pathogens identified in each stool specimen. From these data, the
monthly cholera cases in Dhaka and Matlab were counted
separately and used for analysis.
Figure 1. Map of the study sites. The left panel shows the location of Bangladesh in South Asia (the Indian subcontinent) and the right panelhighlights the location of Dhaka and Matlab, the study sites in Bangladesh.doi:10.1371/journal.pone.0060001.g001
Indian Ocean Dipole and Cholera in Bangladesh
PLOS ONE | www.plosone.org 2 March 2013 | Volume 8 | Issue 3 | e60001

Ocean climate data. The strength of the IOD was measured
by the dipole mode index (DMI), defined as the difference in SST
between the western (10uS–10uN, 50–70uE) and eastern (10uS–0u,90–110uE) tropical Indian Ocean [16]. The monthly average DMI
values were obtained from the Japan Agency for Marine-Earth
Science and Technology (www.jamstec.go.jp/frcgc/research/d1/
iod/). The DMI values were calculated using the SST data from
the HadISST dataset (http://www.metoffice.gov.uk/hadobs/
hadisst/). The base period for calculating anomalies was 1958–
2008. These values were standardized to zero mean and unit
standard deviation. The strength of the ENSO was measured by
monthly average SSTs in the Nino 3 region (5uS–5uN, 150–90uW)
(Nino3) in the Pacific Ocean that we derived from the National
Oceanic and Atmospheric Administration (NOAA) Climate
Prediction Center data (http://www.cpc.ncep.noaa.gov). We
examined the association between DMI and monthly average
SST in the northern Bay of Bengal to gain some insight into the
causal pathways linking the IOD to the number of cholera cases.
Mean monthly SSTs in the Bay of Bengal (20–21uN, 90–91uE)
were derived from the NOAA Optimum Interpolation Sea Surface
Temperature dataset [39,40].
Meteorological and hydrological dataThe daily rainfall and maximum and minimum temperature
data for Dhaka and Matlab were obtained from the Bangladesh
Meteorological Department. The data for the daily river levels of
the Brigonga (Millbarrak in Dhaka) and Danagoda (Matlab
Bazaar) rivers were obtained from the records maintained by the
Bangladesh Water Development Board. The monthly means for
the maximum temperature (uC) and maximum river level (m), and
the total monthly rainfall (mm) were calculated from the daily
records. Missing values (17 [5.4%] in Dhaka and 6 [1.9%] in
Matlab) for river levels were imputed using the average values of
the same month in the other years over the whole time series.
Statistical analysisTemporal patterns of association in the time-frequency
domain. Temporal patterns of association in the time series
were studied using the continuous wavelet transform [33] [31].
Specifically, cross wavelet coherency analysis was used to
determine whether the presence of a particular frequency at a
given time in cholera corresponded to the presence of the same
frequency at the same time in a climate covariate. A coherence
analysis is similar to a correlation analysis in the sense that it is
normalized between 0 and 1, where 0 corresponds to the total
Figure 2. Monthly time series data for Dhaka (January 1983–December 2008). (a) Total cholera cases; (b) Monthly rainfall (mm); (c) Monthlyaverage of daily maximum temperature (uC); (d) Monthly average of daily mean river level (m) of Brigonga river (the data for 2008 for Millbarrak inDhaka was missing).doi:10.1371/journal.pone.0060001.g002
Indian Ocean Dipole and Cholera in Bangladesh
PLOS ONE | www.plosone.org 3 March 2013 | Volume 8 | Issue 3 | e60001

absence of cycles with the same period in the analyzed time series,
and 1 corresponds to the presence of cycles with exactly the same
periods in the analyzed time series [41]. Briefly, for the two time
series whose association is under study, the cross wavelet spectrum
(CWS) is estimated through time for a series of frequencies (or
period, i.e., 1/frequency). The CWS is then normalized by the
product of each time series square root transformed wavelet power
spectra. Thus, to make an analogy between coherency and
correlation, the CWS can be seen as equivalent to covariance
which is normalized by the power spectra of two variables in the
same way that covariance is normalized by the product of the
standard deviation of two variables when their correlation is
estimated. When the magnitude of the CWS is similar to the
normalized product of the time series spectra the ratio is equal to
1, indicating that the two studied time series have cycles with the
same period.
We also estimated the cone of influence, where inferences from
the wavelet analysis outside the cone of influence are not valid
because of the manipulations that were performed to generate the
wavelet spectrum in the absence of data for larger period
frequencies [31]. Cross wavelet coherence significance was
estimated using the method described by Maraun and Kurths
[42] for a minimum time scale, S0 = 6 months (i.e., the minimum
period of interest in the cycles studied with the cross wavelet
analysis was 6 months), a total smoothing window of 31 (i.e.,
W = 15) and parameter W0 = 6 (dimensionless parameter of the
Morlet Wavelet). Further details about cross wavelets and software
are described in Maraun and Kurths [42] and Chaves and Pascual
[33]. To analyze the association between cholera hospitalizations
and environmental factors, we classified the data into two groups,
one for the V. cholerae El Tor O1 biotype strain and one for the
O139 Bengal strain.
We did not stratify the analysis by age, because the seasonal
patterns were the same and there was no likely reason to expect
different cholera-climate associations between the age groups at
interannual time scales.
The associations between DMI, Nino3 and monthly average
temperature, rainfall and SST in the northern Bay of Bengal were
also examined by wavelet coherence analysis. All the analyses were
performed with R software (version 2.0).
Results
The time series for the number of cholera patients per month,
by serogroup and biotype, ambient temperature, rainfall and river
level during the study period are shown for Dhaka (Figure 2) and
Matlab (Figure 3).
The time series for Dipole Mode Index (DMI), Nino3 and sea
surface temperature (SST) during the same period are shown in
Figure 3. Monthly time series data for Matlab (November 1981–December 2008). (a) Total cholera cases; (b) Monthly rainfall (mm); (c)Monthly average of daily maximum temperature (uC); (d) Monthly average of daily mean river level (m) of Danagoda river (the data for 2008 andbefore January 1983 for Matlab Bazar was missing).doi:10.1371/journal.pone.0060001.g003
Indian Ocean Dipole and Cholera in Bangladesh
PLOS ONE | www.plosone.org 4 March 2013 | Volume 8 | Issue 3 | e60001

Figure 4. Strong positive IOD events (indicated by large DMI
values) occurred in 1994 and 1997 and, in these years, the DMI
peaked in August and October, respectively. Strong ENSO events
(indicated by large Nino3 index values) were observed in 1982–
1983 and again in 1997–1998. In 1998, exceptionally high SSTs
were observed and this preceded a sharp increase in the number of
cholera hospitalizations in Dhaka.
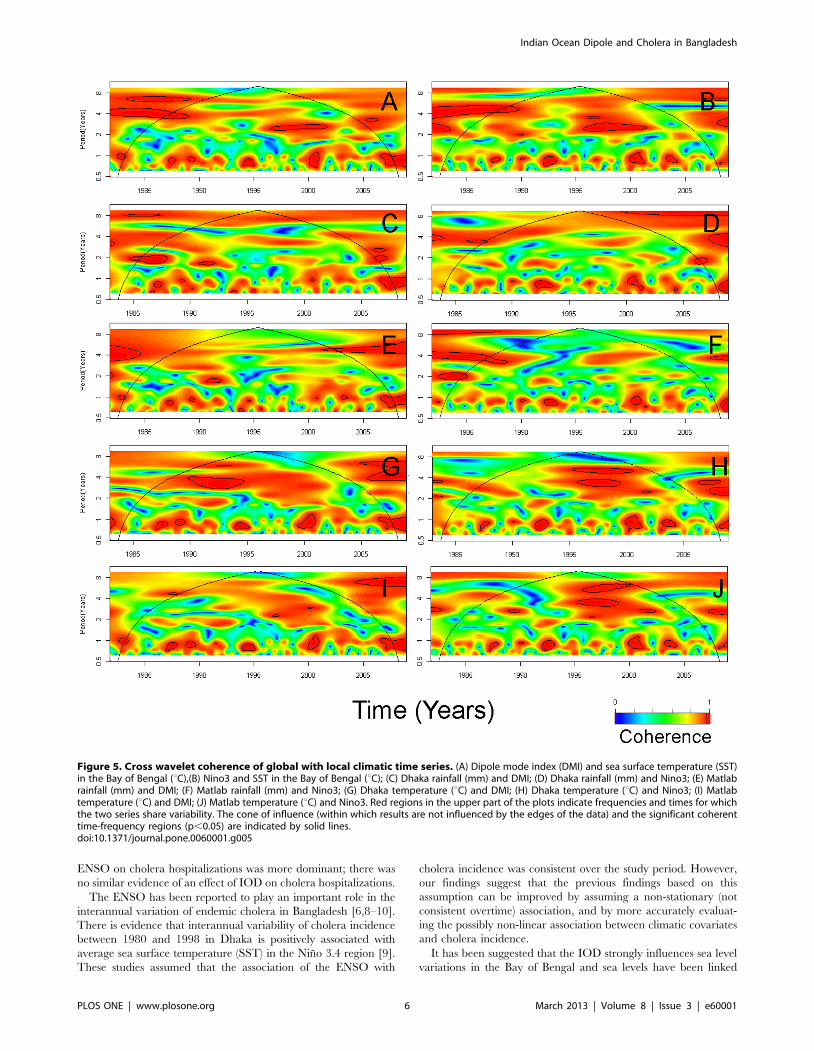
Figure 5 shows cross wavelet coherence of the global climatic
time series (DMI and Nino3) with the local climatic time series
(SST, rainfall and temperature). Red regions in the upper part of
the plots in Figure 5 indicate frequencies and times for which the
two series share variability. Biannual cycles of SSTs were
associated with DMI and Nino3 between 1997 and 2000. In
Dhaka, 3-year temperature cycles were associated with DMI in
1990–1995 and, in Dhaka and Matlab, the temperature cycles
were associated with Nino3 in 1995–2000.
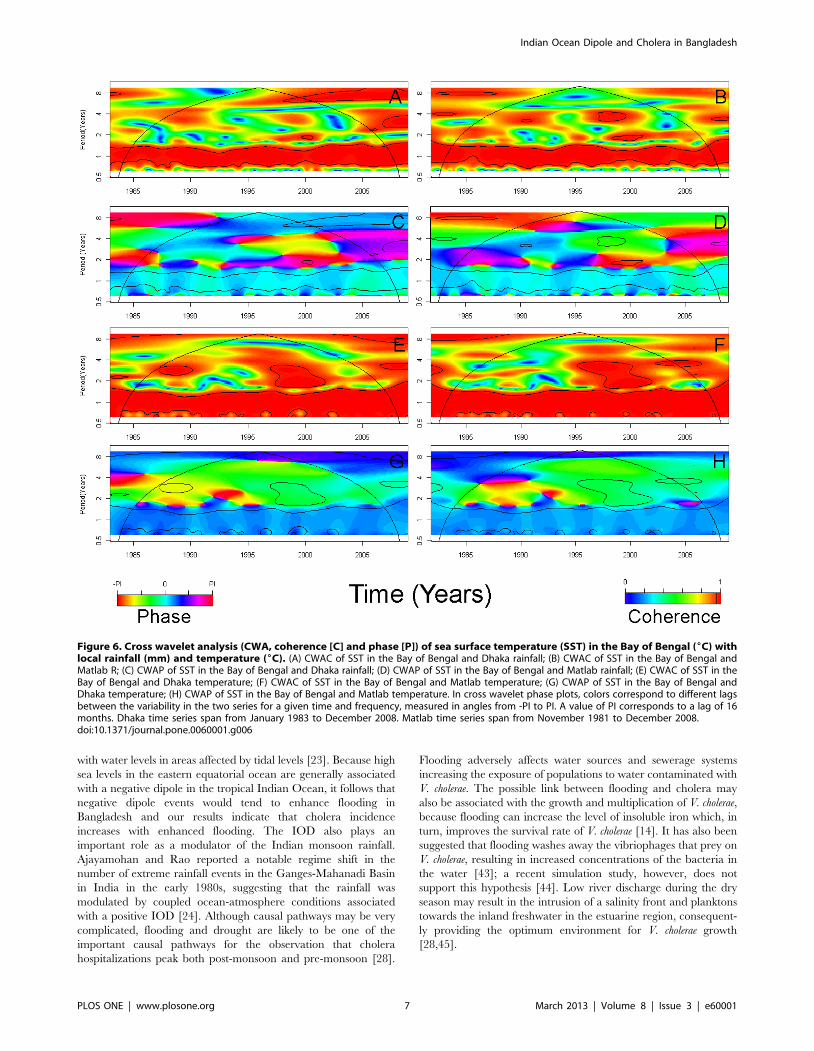
Figure 6 shows the results of cross wavelet coherence and cross
wavelet phase analysis of the SST in the Bay of Bengal with local
rainfall and temperature. At the seasonal scale, rainfall and
temperature in Dhaka and Matlab were strongly associated with
SSTs and nearly synchronous as revealed by phase plots.
Four-year long coherent cycles between O1 cholera and DMI
were seen in 1988–1997 in Dhaka (Figure 7A) while the
association with Nino3 was not consistent over time (3–4 year-
cycles in 1998–2001 and 1–2 year-cycles in 1991–2000)
(Figure 7C). Four- to 8-year long coherent cycles were observed
between O1 cholera and SSTs in 1988–1997 (Figure 7E). Three-
to five-year long coherent cycles were seen between O1 cholera
and temperature in 1988–2002 (Figure 7I). Some non-stationary
(non-consistent over time) seasonal cycles were seen between O1
cholera and rainfall and river level in Dhaka (Figure 7G and 7K).
In Matlab, wavelet coherency between O1 cholera and DMI was
less obvious (Figure 8A); however, 5–6-year long coherent cycles
between O1 cholera and Nino3 were seen (Figure 8C). Some non-
stationary (non-consistent over time) seasonal cycles were seen
between O1 cholera and SSTs, rainfall, temperature and river
levels in Matlab (Figure 8E, 8G, 7I and 7K). In general, the
association of O139 cholera with all the environmental parameters
was weaker than the association of O1 cholera with the same
parameters.
Overall, the results of the analysis for cholera hospitalizations
for all El Tor strains and for a classical biotype of V. cholerae were
similar to the result for the El Tor O1 biotype strain alone because
the frequency of the O1 biotype was dominant during the study
period (see Supplementary online material, Figures S1–S5).
Discussion
Our analyses indicated that the links between cholera hospital-
izations and both IOD and the ENSO were not consistent
overtime and that the timing of the associations was different
between urban Dhaka and rural Matlab. In Matlab, the effect of
Figure 4. Monthly time series data for global climatic indices (November 1981–December 2008). (a) Sea surface temperature (SST) in theBay of Bengal (uC); (b) Nino3; (c) Dipole mode index (DMI).doi:10.1371/journal.pone.0060001.g004
Indian Ocean Dipole and Cholera in Bangladesh
PLOS ONE | www.plosone.org 5 March 2013 | Volume 8 | Issue 3 | e60001
ENSO on cholera hospitalizations was more dominant; there was
no similar evidence of an effect of IOD on cholera hospitalizations.
The ENSO has been reported to play an important role in the
interannual variation of endemic cholera in Bangladesh [6,8–10].
There is evidence that interannual variability of cholera incidence
between 1980 and 1998 in Dhaka is positively associated with
average sea surface temperature (SST) in the Nino 3.4 region [9].
These studies assumed that the association of the ENSO with
cholera incidence was consistent over the study period. However,
our findings suggest that the previous findings based on this
assumption can be improved by assuming a non-stationary (not
consistent overtime) association, and by more accurately evaluat-
ing the possibly non-linear association between climatic covariates
and cholera incidence.
It has been suggested that the IOD strongly influences sea level
variations in the Bay of Bengal and sea levels have been linked
Figure 5. Cross wavelet coherence of global with local climatic time series. (A) Dipole mode index (DMI) and sea surface temperature (SST)in the Bay of Bengal (uC),(B) Nino3 and SST in the Bay of Bengal (uC); (C) Dhaka rainfall (mm) and DMI; (D) Dhaka rainfall (mm) and Nino3; (E) Matlabrainfall (mm) and DMI; (F) Matlab rainfall (mm) and Nino3; (G) Dhaka temperature (uC) and DMI; (H) Dhaka temperature (uC) and Nino3; (I) Matlabtemperature (uC) and DMI; (J) Matlab temperature (uC) and Nino3. Red regions in the upper part of the plots indicate frequencies and times for whichthe two series share variability. The cone of influence (within which results are not influenced by the edges of the data) and the significant coherenttime-frequency regions (p,0.05) are indicated by solid lines.doi:10.1371/journal.pone.0060001.g005
Indian Ocean Dipole and Cholera in Bangladesh
PLOS ONE | www.plosone.org 6 March 2013 | Volume 8 | Issue 3 | e60001
with water levels in areas affected by tidal levels [23]. Because high
sea levels in the eastern equatorial ocean are generally associated
with a negative dipole in the tropical Indian Ocean, it follows that
negative dipole events would tend to enhance flooding in
Bangladesh and our results indicate that cholera incidence
increases with enhanced flooding. The IOD also plays an
important role as a modulator of the Indian monsoon rainfall.
Ajayamohan and Rao reported a notable regime shift in the
number of extreme rainfall events in the Ganges-Mahanadi Basin
in India in the early 1980s, suggesting that the rainfall was
modulated by coupled ocean-atmosphere conditions associated
with a positive IOD [24]. Although causal pathways may be very
complicated, flooding and drought are likely to be one of the
important causal pathways for the observation that cholera
hospitalizations peak both post-monsoon and pre-monsoon [28].
Flooding adversely affects water sources and sewerage systems
increasing the exposure of populations to water contaminated with
V. cholerae. The possible link between flooding and cholera may
also be associated with the growth and multiplication of V. cholerae,
because flooding can increase the level of insoluble iron which, in
turn, improves the survival rate of V. cholerae [14]. It has also been
suggested that flooding washes away the vibriophages that prey on
V. cholerae, resulting in increased concentrations of the bacteria in
the water [43]; a recent simulation study, however, does not
support this hypothesis [44]. Low river discharge during the dry
season may result in the intrusion of a salinity front and planktons
towards the inland freshwater in the estuarine region, consequent-
ly providing the optimum environment for V. cholerae growth
[28,45].
Figure 6. Cross wavelet analysis (CWA, coherence [C] and phase [P]) of sea surface temperature (SST) in the Bay of Bengal (6C) withlocal rainfall (mm) and temperature (6C). (A) CWAC of SST in the Bay of Bengal and Dhaka rainfall; (B) CWAC of SST in the Bay of Bengal andMatlab R; (C) CWAP of SST in the Bay of Bengal and Dhaka rainfall; (D) CWAP of SST in the Bay of Bengal and Matlab rainfall; (E) CWAC of SST in theBay of Bengal and Dhaka temperature; (F) CWAC of SST in the Bay of Bengal and Matlab temperature; (G) CWAP of SST in the Bay of Bengal andDhaka temperature; (H) CWAP of SST in the Bay of Bengal and Matlab temperature. In cross wavelet phase plots, colors correspond to different lagsbetween the variability in the two series for a given time and frequency, measured in angles from -PI to PI. A value of PI corresponds to a lag of 16months. Dhaka time series span from January 1983 to December 2008. Matlab time series span from November 1981 to December 2008.doi:10.1371/journal.pone.0060001.g006
Indian Ocean Dipole and Cholera in Bangladesh
PLOS ONE | www.plosone.org 7 March 2013 | Volume 8 | Issue 3 | e60001

Figure 7. Cross wavelet coherence of global and local climatic time series with cholera in Dhaka by serotype O1 and O139. (A) Dipolemode index (DMI) and cholera O1; (B) DMI and cholera O139; (C) Nino3 and cholera O1; (D) Nino3 and cholera O139; (E) Sea surface temperature (SST)in the Bay of Bengal (uC) and cholera O1; (F) SST in the Bay of Bengal (uC) and cholera O139; (G) Rainfall (mm) and cholera O1; (H) Rainfall (mm) andcholera O139; (I) Temperature (uC) and cholera O1; (J) Temperature (uC) and cholera O139; (K) River level (m) and cholera O1; (L) River level (m) andcholera O139. Time series span from January 1983 to December 2008.doi:10.1371/journal.pone.0060001.g007
Indian Ocean Dipole and Cholera in Bangladesh
PLOS ONE | www.plosone.org 8 March 2013 | Volume 8 | Issue 3 | e60001
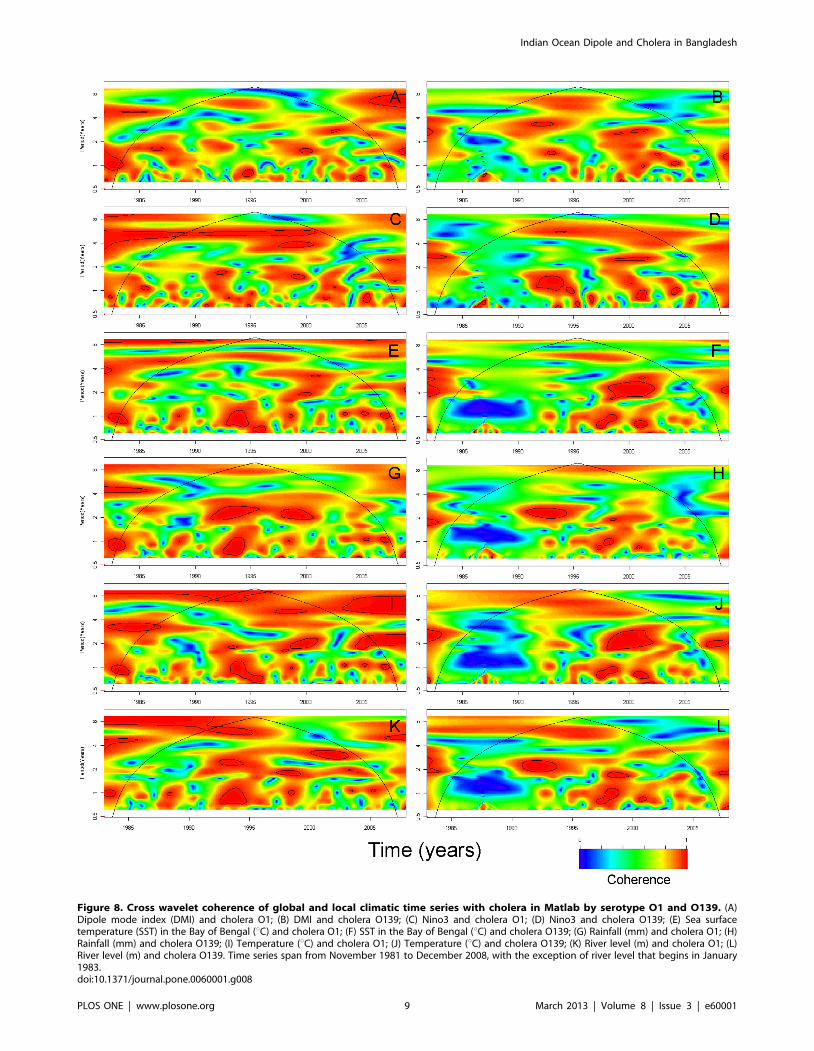
Figure 8. Cross wavelet coherence of global and local climatic time series with cholera in Matlab by serotype O1 and O139. (A)Dipole mode index (DMI) and cholera O1; (B) DMI and cholera O139; (C) Nino3 and cholera O1; (D) Nino3 and cholera O139; (E) Sea surfacetemperature (SST) in the Bay of Bengal (uC) and cholera O1; (F) SST in the Bay of Bengal (uC) and cholera O139; (G) Rainfall (mm) and cholera O1; (H)Rainfall (mm) and cholera O139; (I) Temperature (uC) and cholera O1; (J) Temperature (uC) and cholera O139; (K) River level (m) and cholera O1; (L)River level (m) and cholera O139. Time series span from November 1981 to December 2008, with the exception of river level that begins in January1983.doi:10.1371/journal.pone.0060001.g008
Indian Ocean Dipole and Cholera in Bangladesh
PLOS ONE | www.plosone.org 9 March 2013 | Volume 8 | Issue 3 | e60001

It has been suggested that the effect of IOD on cholera
incidence may be partially explained by the effect of IOD on SST
and sea surface height (SSH) in the Bay of Bengal [30] and we
found that, in 1998, high SSTs preceded a sharp increase in the
number of cholera hospitalizations in Dhaka. In the Bay of Bengal,
rising SSTs have been linked to higher concentrations of
chlorophyll, a proxy for phytoplankton abundance [12]. High
concentrations of phytoplankton may lead to high numbers of
cholera-containing copepods, increasing the likelihood of cholera
epidemics in coastal human populations [3]. However, a recent
study reported that high river discharge in which large amounts of
terrestrial nutrients are carried could be the main mechanism for a
positive SST-phytoplankton relationship in the Bay of Bengal [46].
Investigations into the detailed pathways of the IOD-cholera
relationship, particularly the role of SSTs and river discharges, are
thus warranted.
The association between Dipole Mode Index (DMI) and cholera
hospitalizations that we found in Dhaka was not observed in
Matlab, while a consistent association between Nino3 and cholera
hospitalizations was observed only in Matlab. The associations
that we found between DMI and Nino3 with cholera are broadly
consistent with previous finding [30]. A difference in the
population density between Dhaka and Matlab may result in
different transmission dynamics, hygiene and sanitation condi-
tions, and behavioral patterns, some or all of which may explain
the contradictory findings in these two areas [47]. Further work to
clarify the role of oceanographic and local hydroclimatological
phenomena in both these areas would be of interest.
There are some limitations in this study. First, less severe cases
of cholera are less likely to have been included in the surveillance
data; however, this should not pose a threat to the validity of the
comparison over time, which was the subject of this study. Second,
some cases could have been missed because of limitations in the
capacity of the hospitals to receive the patients; particularly,
during epidemics of cholera. However, in principle, the hospitals
accept all patients who visit the hospital. Thus, the capacity of the
hospitals should not be an important limitation of this study.
Third, the wavelet analysis explores a periodical synchronicity
between two time series, and so has no bearing on mechanisms.
Further environmental and microbiological studies are necessary
to elucidate the causal pathways of the associations.
Because of the serious global consequences of cholera and its
sensitivity to climate, the World Health Organization has
proposed that an early warning system for cholera epidemics
using climatic parameters could be developed [48]. However, no
highly accurate climate-based prediction system of cholera
epidemics is currently available [49,50]. A system for forecasting
IOD has been developed, and IOD events are predictable up to 4
months in advance [51]. The results of our study call for the
appropriate modeling of associations between cholera incidence
and climatic factors, as has been done for other neglected tropical
diseases, where non-stationary associations have been carefully
handled [52] by incorporating non-linear functions to capture the
non-stationary associations between climatic factors and popula-
tion dynamics [53,54]. All these efforts will provide the basis for
accurately predicting cholera epidemics in Bangladesh, potentially
improving the outcome for disease control efforts.
Supporting Information
Figure S1 Monthly time series of cholera hospitaliza-tions by (a) serotype O1 & O139 and (b) bio-type El Tor& Classical for Dhaka (January 1983–December 2008).(TIF)
Figure S2 Monthly time series of cholera hospitaliza-tions by (a) serotype O1 & O139 and (b) bio-type El Tor& Classical for Matlab (November 1981–December2008).(TIF)
Figure S3 Cross wavelet coherence of global and localclimatic time series with cholera in Dhaka and Matlab.(A) Dipole mode index (DMI) and cholera in Dhaka; (B) DMI and
cholera in Matlab; (C) Nino3 and cholera in Dhaka; (D) Nino3
and cholera in Matlab; (E) Sea surface temperature (SST) in the
Bay of Bengal (uC) and cholera in Dhaka; (F) SST in the Bay of
Bengal (uC) and cholera in Matlab; (G) Rainfall (mm) and cholera
in Dhaka; (H) Rainfall (mm) and cholera in Matlab; (I)
Temperature (uC) and cholera in Dhaka; (J) Temperature (uC)
and cholera in Matlab; (K) River level (m) and cholera in Dhaka;
(L) River level (m) and cholera in Matlab. Time series span from
January 1983 to December 2008.
(TIF)
Figure S4 Cross wavelet coherence of global and localclimatic time series with classical biotype and El Torcholera in Dhaka. (A) Dipole mode index (DMI) and classical
cholera; (B) DMI and El Tor cholera; (C) Nino3 and classical
cholera; (D) Nino3 and El Tor cholera; (E) Sea surface
temperature (SST) in the Bay of Bengal (uC) and classical cholera;
(F) SST in the Bay of Bengal (uC) and El Tor cholera; (G) Rainfall
(mm) and classical cholera; (H) Rainfall (mm) and El Tor cholera;
(I) Temperature (uC) and classical cholera; (J) Temperature (uC)
and El Tor cholera; (K) River level (m) and classical cholera; (L)
River level (m) and El Tor cholera. Time series span from January
1983 to December 2008.
(TIF)
Figure S5 Cross wavelet coherence of global and localclimatic time series with classical biotype and El Torcholera in Matlab. (A) Dipole mode index (DMI) and classical
cholera; (B) DMI and El Tor cholera; (C) Nino3 and classical
cholera; (D) Nino3 and El Tor cholera; (E) Sea surface
temperature (SST) in the Bay of Bengal (uC) and classical cholera;
(F) SST in the Bay of Bengal (uC) and El Tor cholera; (G) Rainfall
(mm) and classical cholera; (H) Rainfall (mm) and El Tor cholera;
(I) Temperature (uC) and classical cholera; (J) Temperature (uC)
and El Tor cholera; (K) River level (m) and classical cholera; (L)
River level (m) and El Tor cholera. Time series span from
November 1981 to December 2008, with the exception of river
level which begins in January 1983.
(TIF)
Author Contributions
Gave critical comments and revised the draft: ASGF MY KS KM.
Conceived and designed the experiments: MH. Analyzed the data: LFC.
Wrote the paper: MH LFC.
References
1. Sack DA, Sack RB, Chaignat CL (2006) Getting serious about cholera.
N Engl J Med 355: 649–651.
2. Colwell RR, Kaper J, Joseph SW (1977) Vibrio cholerae, Vibrio parahaemo-
lyticus, and other vibrios: occurrence and distribution in Chesapeake Bay.
Science 198: 394–396.
3. Huq A, Small EB, West PA, Huq MI, Rahman R, et al. (1983) Ecological
relationships between Vibrio cholerae and planktonic crustacean copepods. Appl
Environ Microbiol 45: 275–283.
4. Islam MS, Drasar BS, Sack RB (1994) The aquatic flora and fauna as reservoirs
of Vibrio cholerae: a review. J Diarrhoeal Dis Res 12: 87–96.
Indian Ocean Dipole and Cholera in Bangladesh
PLOS ONE | www.plosone.org 10 March 2013 | Volume 8 | Issue 3 | e60001

5. Cockburn TA, Cassanos JG (1960) Epidemiology of endemic cholera. Public
Health Rep 75: 791–803.6. Colwell RR (1996) Global climate and infectious disease: the cholera paradigm.
Science 274: 2025–2031.
7. Islam MS, Drasar BS, Bradley DJ (1989) Attachment of toxigenic Vibriocholerae 01 to various freshwater plants and survival with a filamentous green
alga, Rhizoclonium fontanum. J Trop Med Hyg 92: 396–401.8. Bouma M, Pascual M (2001) Seasonal and interannual cycles of endemic cholera
in Bengal 1891–1940 in relation to climate and geography. Hydrobiologia 460:
147–156.9. Pascual M, Rodo X, Ellner SP, Colwell R, Bouma MJ (2000) Cholera dynamics
and El Nino-Southern Oscillation. Science 289: 1766–1769.10. Rodo X, Pascual M, Fuchs G, Faruque AS (2002) ENSO and cholera: a
nonstationary link related to climate change? Proc Natl Acad Sci U S A 99:12901–12906.
11. Koelle K, Rodo X, Pascual M, Yunus M, Mostafa G (2005) Refractory periods
and climate forcing in cholera dynamics. Nature 436: 696–700.12. Lobitz B, Beck L, Huq A, Wood B, Fuchs G, et al. (2000) Climate and infectious
disease: use of remote sensing for detection of Vibrio cholerae by indirectmeasurement. Proc Natl Acad Sci U S A 97: 1438–1443.
13. Constantin de Magny G, Murtugudde R, Sapiano MR, Nizam A, Brown CW,
et al. (2008) Environmental signatures associated with cholera epidemics. ProcNatl Acad Sci U S A 105: 17676–17681.
14. Lipp EK, Huq A, Colwell RR (2002) Effects of global climate on infectiousdisease: the cholera model. Clin Microbiol Rev 15: 757–770.
15. Klein SA, Soden BJ, Lau N-C (1999) Remote sea surface temperature variationsduring ENSO: Evidence for a tropical atmospheric bridge. J Climate 12: 917–
932.
16. Saji NH, Goswami BN, Vinayachandran PN, Yamagata T (1999) A dipolemode in the tropical Indian Ocean. Nature 401: 360–363.
17. Webster PJ, Moore AM, Loschnigg JP, Leben RR (1999) Coupled ocean-atmosphere dynamics in the Indian Ocean during 1997–98. Nature 401: 356–
360.
18. Jensen TG (2007) INTRODUCTION: Special Issue on Indian Ocean Climate.J Climate 20: 2869–2871.
19. Fischer AS, Terray P, Guilyardi E, Gualdi S, Delecluse P (2005) Twoindependent triggers for the Indian Ocean Dipole/Zonal Mode in a coupled
GCM. J Climate 18: 3428–3449.20. Behera SK, Luo JJ, Masson S, Rao SA, Sakuma H, et al. (2006) A CGCM study
on the interactions between IOD and ENSO. J Climate 19: 1688–1705.
21. Hong C.-C, Lu M.-M, Kanamitsu M (2008) Temporal and spatial character-istics of positive and negative Indian Ocean dipole with and without ENSO.
J Geophys Res 113: D08107, doi:08110.01029/02007JD009151. .22. Yamagata T, Behera SK, Luo J-J, Masson S, Jury MR, et al. (2004) Coupled
Ocean-Atmosphere Variability in the Tropical Indian Ocean. In: Wang C, Xie
S-P, Carton JA, editors. Earth Climate : The Ocean-Atmosphere Interaction:American Geophysical Union.
23. Han W, Webster P (2002) Forcing Mechanisms of Sea Level InterannualVariability in the Bay of Bengal. J Phys Oceanogr 32: 216–239.
24. Ajayamohan RS, Rao SA (2008) Indian Ocean Dipole modulates the number ofextreme rainfall events over India in a warming environment. J Meteor Soc
Japan 86: 245–252.
25. Annamalai H, Murtugudde R, Potemra J, Xie SP, Liu P, et al. (2003) Coupleddynamics over the Indian Ocean: spring initiation of the Zonal Mode. Deep-Sea
Research II 50: 2305–2330.26. Ashok K, Guan Z, Saji NH, Yamagata T (2004) Individual and combined
influences of ENSO and the Indian Ocean Dipole on the Indian summer
monsoon. J Climate 17: 3141–3155.27. Ashok K, Guan Z, Yamagata T (2001) Influence of the Indian Ocean Dipole on
the relationship between the Indian monsoon rainfall and ENSO. Geophys ResLett 28: 4499–4502
28. Akanda AS, Jutla AS, Islam S (2009) Dual peak cholera transmission in Bengal
Delta: A hydroclimatological explanation. Geophys Res Lett 36: L19401doi:19410.11029/12009GL039312. .
29. Hashizume M, Armstrong B, Hajat S, Wagatsuma Y, Faruque AS, et al. (2008)The effect of rainfall on the incidence of cholera in Bangladesh. Epidemiology
19: 103–110.
30. Hashizume M, Faruque AS, Terao T, Yunus M, Streatfield K, et al. (2011) The
Indian Ocean dipole and cholera incidence in Bangladesh: a time-series analysis.
Environ Health Perspect 119: 239–244.
31. Torrence C, Compo GP (1998) A practical guide to wavelet analysis. Bulletin of
the American Meteorological Society 79: 61–78.
32. Cazelles B, Chavez M, McMichael AJ, Hales S (2005) Nonstationary influence
of El Nino on the synchronous dengue epidemics in Thailand. PLoS Med 2:
e106.
33. Chaves LF, Pascual M (2006) Climate cycles and forecasts of cutaneous
leishmaniasis, a nonstationary vector-borne disease. PLoS Med 3: e295.
34. Thai KT, Cazelles B, Nguyen NV, Vo LT, Boni MF, et al. (2010) Dengue
dynamics in Binh Thuan province, southern Vietnam: periodicity, synchronicity
and climate variability. PLoS Negl Trop Dis 4: e747.
35. Constantin de Magny G, Guegan JF, Petit M, Cazelles B (2007) Regional-scale
climate-variability synchrony of cholera epidemics in West Africa. BMC Infect
Dis 7: 20.
36. Hashizume M, Chaves LF, Minakawa N (2012) Indian Ocean Dipole drives
malaria resurgence in East African highlands. Sci Rep 2: 269.
37. Stoll BJ, Glass RI, Huq MI, Khan MU, Holt JE, et al. (1982) Surveillance of
patients attending a diarrhoeal disease hospital in Bangladesh. Br Med J (Clin
Res Ed) 285: 1185–1188.
38. ICDDRB: Centre for Health and Population Research (2006) Health and
Demographic Surveillance System-Matlab: Volume 35. Registration of health
and demographic events 2002. Dhaka: ICDDR,B: Centre for Health and
Population Research.
39. Reynolds RW, Rayner NA, Smith TM, Stokes DC, Wang W (2002) An
Improved In Situ and Satellite SST Analysis for Climate. J Climate 15: 1609–
1625.
40. Reynolds RW, Smith TM (1994) Improved global sea surface temperature
analyses using optimum interpolation. J Climate 7: 929–948.
41. Shumway RH, Stoffer DS (2000) Time series analysis and its applications. New
York: Springer.
42. Maraun D, Kurths J (2004) Cross wavelet analysis: significance testing and
pitfalls. Nonlinear Processes in Geophysics 11: 505–514.
43. Faruque SM, Naser IB, Islam MJ, Faruque AS, Ghosh AN, et al. (2005)
Seasonal epidemics of cholera inversely correlate with the prevalence of
environmental cholera phages. Proc Natl Acad Sci U S A 102: 1702–1707.
44. King AA, Ionides EL, Pascual M, Bouma MJ (2008) Inapparent infections and
cholera dynamics. Nature 454: 877–880.
45. Akanda AS, Jutla AS, Alam M, de Magny GC, Siddique AK, et al. (2011)
Hydroclimatic influences on seasonal and spatial cholera transmission cycles:
Implications for public health intervention in the Bengal Delta. Water Resour
Res, 47: W00H07.
46. Jutla AS, Akanda AS, Griffiths JK, Colwell R, Islam S (2011) Warming oceans,
phytoplankton, and river discharge: implications for cholera outbreaks.
Am J Trop Med Hyg 85: 303–308.
47. Hashizume M, Faruque AS, Wagatsuma Y, Hayashi T, Armstrong B (2010)
Cholera in Bangladesh: climatic components of seasonal variation. Epidemiol-
ogy 21: 706–710.
48. World Health Organization (2005) Using climate to predict infectious disease
epidemics. Geneva: World Health Organization.
49. Abeku TA (2007) Response to malaria epidemics in Africa. Emerg Infect Dis 13:
681–686.
50. Hay SI, Were EC, Renshaw M, Noor AM, Ochola SA, et al. (2003) Forecasting,
warning, and detection of malaria epidemics: a case study. Lancet 361: 1705–
1706.
51. Luo J-J, Masson S, Behera S, Yamagata T (2007) Experimental forecasts of the
Indian Ocean Dipole using a coupled OAGCM. J Climate 20: 2178–2190.
52. Chaves LF, Pascual M (2007) Comparing models for early warning systems of
neglected tropical diseases. PLoS Negl Trop Dis 1: e33.
53. Bolker BM (2008) Ecological models and data in R. Princeton: Princeton
University Press.
54. Chaves LF, Morrison AC, Kitron UD, Scott TW (2012) Nonlinear impacts of
climatic variability on the density-dependent regulation of an insect vector of
disease. Global Change Biology 18: 457–468.
Indian Ocean Dipole and Cholera in Bangladesh
PLOS ONE | www.plosone.org 11 March 2013 | Volume 8 | Issue 3 | e60001