El Niño Effects on Society in Latin America
37
El Niño and Society in Latin America By Ivan J. Ramirez GEO 490 December 14, 2006
Transcript of El Niño Effects on Society in Latin America

El Niño and Society in Latin America
By Ivan J. Ramirez
GEO 490
December 14, 2006

2
Table of Contents
1 Introduction
2 ENSO Science
2.1 Description of ENSO
2.2 Teleconnections
2.2 How We Know What We Know
3 Geography of Latin America
3.1 Socioeconomic and Population Characteristics
3.2 Shifting Politics
3.3 Physical Geography
4 Societal and Ecological Impacts
4.1 Economy and Politics
4.2 Agriculture
4.3 Fisheries
4.4 Gender
4.5 Human and Ecosystem Health
5 Conclusions
6 References

3
I. Introduction El Niño-Southern Oscillation (ENSO) is a climatic phenomenon considered to be a hazard-
spawner in many countries with adverse implications for human health and ecosystems. Among
the most severely affected and vulnerable are populations in Latin America, a region that is at
the proverbial ground zero of the ENSO influence. The teleconnections can be felt from the
coast of Ecuador to Northeast Brazil and the Yucatan Peninsula in Mexico. Some places are
expected to become drier and others wetter during ENSO Events. The impacts can range from
fires and floods to drought, disease, and famine. During the 1982-83 El Niño, Cuba experienced
severe coastal flooding which resulted in damages to urban infrastructure and the agricultural
sector. In the 1997-98 El Niño event, which some consider to be the “El Niño of the century”,
outbreaks of cholera, leptospirosis, dengue and malaria were associated with heavy rains in
Ecuador. However, the re are some positive aspects that society can take advantage of. In
some regions such as the Argentine Pampas, the increased rains can be favorable for
agricultural production. In Northern Chile, opportunities for fisheries are abound as anchovies
from the Peruvian coast migrate south during El Niño (Glantz, 2001).
This paper reviews the teleconnections of ENSO events and presents the climate-societal
interactions related to the phenomenon in Latin America. The importance of this review is two-
fold. First, most ENSO reports focus on global impacts or a compilation of country case studies
from different regions in the context of a specific El Niño /La Niña year. Latin America is at the
geographic center of the ENSO range of influence and therefore warrants a study that examines
how the region is affected on the state and local levels, the interconnections between social and
physical dimensions of extreme weather or environmental changes related to ENSO, and
possibly consider how the impact on multiple states in the same region may affect the region’s
overall resilience. Furthermore it is important to draw increasing attention to the sociopolitical
conditions in Latin America states that exist when ENSO or any extreme weather event takes

4
place in the region. Can we just blame El Niño or are the institutions, which are supposed to
protect the people, responsible? Or do a set of multiple factors occurring simultaneously
contribute to the overall outcomes? Secondly, it is increasingly important to gain an overall
understanding of effects in the region as reports from the IPCC (2001) and other institutions
project that global climate change may lead to more El Niño-like conditions. That being said,
ENSO events, which are predictable to some extent, provide opportunities to learn and test
coping strategies to current and future climate-related events in real world situations.
Various aspects of ENSO teleconnections will be discussed as well as the region’s
socioeconomic and political conditions for vulnerability context. The more vulnerable a
population and state are, the less likely that society and state can respond appropriately to
ENSO. I will be synthesizing El Niño knowledge from a wide variety of sources including
academic journal papers, grey literature pieces from various international organizations,
newspaper articles, and several books from El Niño experts like Michael H. Glantz (NCAR) and
S. Kovats (London School of Hygiene and Tropical Medicine, London). I also refer to scholarly
literature from Latin America. I think it is important to draw attention to this knowledge (from the
people who are most affected), which exists and is less cited in the El Niño discourse among
scholars in developed countries.
Following this introduction, I describe ENSO, its physical dynamics, the global and local
teleconnections, and briefly discuss how we know what we know about ENSO. A description of
each phase (El Niño, La Niña, and neutral), and their respective connections are given. The
next section describes the political and socioeconomic conditions of the region and its
populations and a brief description of the physical geography. It is important to consider existing
conditions of the peoples and governments in order to evaluate the vulnerability of the
populations and their governments. Latin America according to this study excludes the Lesser

5
Antilles and includes Jamaica and Haiti. In the next section, the societal and ecological impacts
of ENSO are discussed. Although many sectors or aspects of impacts could be described, I
chose to focus on agriculture, economy, fisheries, gender, and human and ecosystems health.
Gender is often excluded or not even considered in ENSO reports. The final section is
conclusions.
2. ENSO Science 2.1 Description El Niño-Southern Oscillation is a natural climate phenomenon that results from air-sea
interactions in the tropical Pacific Ocean and those interactions influence the local to global
variability and extremes of weather and climate. It is the globe’s second most predictable
climatic fluctuation, after the natural flow of the seasons (Glantz, 2006). It occurs interannually,
approximately every 2 to 7 years, and typically lasts 12 to 18 months (Goddard et al., 2001). In
the last 20 years ENSO events have occurred more frequently (Trenberth, 1996).
ENSO consists of three events or phases: El Niño (warm event), La Niña (cold event), and
neutral (also referred to as normal or average). El Niño was first coined by Peruvian sailors in
the late 19th century, but was formally presented as the El Niño “current” at the Geographical
Society Congress in Lima ion 1892. It was named as such because the warming of the waters
off the coast of Peru coincided with the date of birth of the Christ child (as quoted in Glantz,
2001: 15).
Fig. 1A. In a neutral state, the southeast trade winds blow across the Tropical Pacific Ocean, dragging water towards the western end of the Pacific. A low pressure with wet conditions is developed at this western end while the eastern end is typically dry with high-pressure conditions. Off the coast of Peru and Ecuador, water that is being dragged west is being replaced by cold water from the deep ocean (known as upwelling) and water coming from the south via the Humboldt Current (Goddard et al., 2001).

6
Fig. 1B. El Niño conditions in the Central Tropical Pacific Fig. 1C. La Niña conditions in the Central Tropical Pacific
Source: http://www.ccb.ucar.edu/enos/
During El Niño conditions (see Figure 1B), the equatorial sea surface temperature gradient
decreases, easterly winds weaken, and atmospheric surface pressure decreases in the eastern
Pacific Ocean. As a result, a positive feedback occurs; warm water from the western Tropical
Pacific shifts, and convective activity and rainfall move eastward to the western coast of South
America. In La Niña conditions (See Figure 1C), the opposite occurs; there is a strengthening of
easterly winds in the Tropical Pacific and opposite anomalies take place that are basin-wide
(Ahrens, 2000: 294 -297; Goddard et al., 2001). You can also think of La Niña as the
enhancement of neutral conditions (Glantz, 2001: 10). For both events anomalies are defined
as departures from the climatological average for the base period 1971 to 2000 (CPC, 2004).
The descriptions and illustrations above do not imply that these three events occur in a
sequence or that each event must occur during ENSO years. For example, La Niña may form
after El Niño dissipates and even remain as was evident in from 1998 to 2000. Furthermore,
each El Niño /La Niña events are never the same and will vary in magnitude and duration from
event to event (Glantz, 2001).

7
2.2 Teleconnections Teleconnections are statistically and physically proven linkages between climate anomalies in
distance places (Glantz, 2001). They refer to changes in rainfall patterns and temperatures in
given places. During El Niño events, particularly in strong ones like those experienced in 1982-
83 and 1997-98, the teleconnections were more pronounced. And as such, many compare the
two and both were considered the El Niño of the century. The figures below developed by
Ropelewski & Halpert (1987) are highly cited and widely used by policymakers and researchers
to describe “typical” ENSO-related climate anomalies (Glantz, 2001). The relationships
displayed in the figures are based on 1700+ meteorological stations and data time series from
1875 to 1983 (Ropelewski & Halpert, 1987). Some have argued that a recalibration is in order
since recent events in some locations, specifically in Southeast Asia, have deviated from or not
complied with these descriptions (Glantz, 2001). Other limitations include appropriate
descriptions of influence on the coasts of Ecuador, Peru, and the interior of the Amazon Basin
(Ropelewski and Halpert, 1987). For the purpose of this paper, these charts will suffice to
describe the climatic influence on Latin America. Moreover, some descriptions of the ENSO
influence on the Amazon as reported by researchers will be provided.
Figure 2. El Niño (a) June to August and (b) December to February
(A)

8
(B)
El Niño (La Niña) events typically begin developing in spring to summer (N. Hemisphere) lasting
until the winter (N. Hemisphere) and peaking around Christmas time. Fig. 2 (a) shows the
spring (N. Hemisphere) to summer tendencies during Niño. They are warmer conditions off the
coasts of Peru and Ecuador and Northeast and Southeast Brazil with drier and warmer
conditions over lower Central America and the Caribbean (especially in Hispaniola). In the
Galapagos Islands, extreme precipitation amounts were received during the 1982-83 El Niño,
which resulted in seven times the normal rainfall; there were also higher than usual sea surface
temperatures, creating extreme conditions for marine life (Glantz, 2001: 147). In contrast,
drought prone areas of Costa Rica receive less rainfall, exacerbating already existent water
stressed conditions in the areas. In southeastern Brazil, Uruguay, and northern Argentina, the
conditions are warmer and wetter and depending on where you live and how you earn a living
will determine how you are affected. The Caribbean seems to benefit by El Niño’s suppression
of hurricane formations. However, this is also dependent on what is happening in the Tropical
Atlantic Ocean (Glantz, 2001: 147). Fig. 2 (b) shows the winter (N. Hemisphere) tendencies
during El Niño. The northern coasts and southern coasts of Ecuador and Peru experience
torrential rains resulting in lake formation in some areas, which are typically semi-arid (Glantz,

9
2001). Northeast Brazil’s, seasonal rainfall is disrupted when El Niño conditions alter the
behavior of the International Convergence Zone and the South American Monsoon, and inhibit
rainfall (). The Amazon rainforest, which is less talked about in ENSO’s teleconnections, is also
affected by this disruption. The seasonal December rains are reduced and occur irregularly and
this along with anthropogenic land-use changes in the area contributes to natural (unnatural)
forest fires. During the 1982-83 and 1997-98 El Niño, rainfall in the Amazon fell by 70% and ~
50% below normal rainfall amounts (Moran et al., 2006).
Figure 3. La Nina (a) June to August and (b) December to February
(A) (B)

10
Fig. 3A shows the spring (N. Hemisphere) to summer tendencies during La Niña. Northeast
Brazil experiences increased rainfall amounts (which is favorable to some extent) while parts of
Northern Mexico are drier and southeastern Brazil, Uruguay, and Northern Argentina have dry
and cool conditions. Again it is important to point out that La Niña’s teleconnections peak in
December and are strongest during this time. Fig. 3B shows the winter (N. Hemisphere)
tendencies during La Niña. Panama, Venezuela, and Colombia experience increased rainfall
and Northern Argentina, Paraguay and Uruguay experience drought. This is evident in the
Pampas region of Argentina, where La Niña has strong influence and decreases rainfall
markedly (Glantz, 2001: 126). Another example is Cuba, where drier conditions are prevalent
during La Niña. However the influence varies according to the interaction of ENSO with
“modulating factors”, referring to another climate variability pattern called the Quasi-Biennial
Oscillation (Cardenas & Naranjo, 2001). Another tendency (argued by some) in Cuba and the
Caribbean region during La Niñas is favorable conditions for hurricanes (as quoted in Glantz,
2001: 143).
2.3 How We Know What We Know? ENSO interest and research has increased markedly in the last 30 years. This can be attributed
to two major events (1982-83 and 1997-98) and several other events that were considered to be
moderate to weak events. Together they have drawn the attention of science, government, and
the public to the ENSO phenomenon (Glantz, 2001; McPhaden et al, 2006). In recent years,
La Nina and its effects are increasingly being studied as well as neutral events. It’s not as if
anomalies or disasters do not occur during non-El Niño (La Niña) years (Goddard & Dilley,
2004). There have also been breakthroughs in El Niño knowledge such as the oscillator
feedback theory (Cane et al., 1986), which helped to explain the feedback mechanisms that
occur before, during, and after ENSO events. This was believed to help predict El Niño, but in
the last few El Niño it has not been consistently applicable; some believe it is now obsolete

11
(Glantz, 2001). There have also been advances in technology such as computer memory and
speed, and better measurement capabilities via satellites and oceanic devices. These have
improved our ability to forecast and model past and to some extent future events (Glantz, 2001;
McPhaden et al, 2006).
Through research by the physical and social sciences, observations, paleoclimate studies, and
climate modeling along with statistical methods, the scientific community has gained a better
understanding of ENSO dynamics, its relationship to regional and the global climate system,
and its relationship to people and ecosystems (McPhaden et al, 2006). Environmental
monitoring by satellite (remote sensing), buoys, and weather balloons enable the tracking of the
development of ENSO events. We can observe when sea surface temperatures in the Tropical
Pacific Ocean are warming and spreading across the basin. Or when winds are enhancing and
sea level pressure drops. Indices have been developed to measure the statistical significance of
these observations. For example, the Southern Oscillation Index is a commonly used measure
that helps indicate when atmospheric pressure seesaws across the Tropical Pacific Ocean
(from Tahiti to Galapagos). Another important measure is the Niño 3.4 index, which indicates
anomalies on the sea surface temperatures in the Tropical Pacific Ocean. These indices are
used along with ground measurements of precipitation to estimate the relationship between El
Niño and local rainfall in a particular place, for example (El Nino Affairs, 2006).
We can understand past ENSO events by observing tree rings and inferring whether it was a
dry period or wet period, and by analyzing ice cores for indications of certain isotopes. Social
scientists and those in the humanities are also active in uncovering past El Niño information and
also in assessing societal responses or lack there of in relation to ENSO events. Historians use
anecdotes from shipping records and diaries, and compare these data with climatological
records or studies (CIESAS, 2006; Glantz, 2001). Anthropologists study human adaptation to

12
ENSO events and how we interpret or perceive ENSO (El Nino Affairs, 2006; CIESAS, 2006)..
Public health scientists and geographers examine disease rates and their spatial distribution
and assess the role of ENSO events if any.
Monitoring, Modeling, Forecasting Tree Rings Agricultural Disasters in Mexico
3. Geography of Latin America 3.1 Socioeconomics and Population Population Latin America (LA) is comprised of more than 20 countries with a total population of more than
550 million people (Goode’s Atlas of Latin America, 2005). Since the 1980s, the population
increased by ~ 200 million people (UN report on World Population Prospects, 2005).
Urbanization has been occurring at a rapid rate since the last century. This trend has been
attributed to the population growth (medical advances and public health improvements) and
shifts in labor due to structural changes-some by choice and others by international pressures--
in their economic systems (Kent, 2006: 269). Fig. 4 illustrates an 85% growth from 1971 to
2001. However, annual growth rates declined in most countries from 2.5 to 1.5 due to
urbanization, social development and family planning initiatives (UNEP, 2003).

13
Figure 4. Growth in Latin America by region
Mestizos (mixed European with indigenous ancestry) make up 70% of the population followed
by white Europeans (~20%), Africans or mixed African descent (less than 5%), and indigenous
(~2%). However these numbers vary by country. For example, Bolivia’s population is dominantly
of indigenous background. In Brazil, those of African heritage represent almost 50% of the
population and almost 90% in the Dominican Republic (Kent, 2006: 169 – 170).
LA cities are mainly found near the coast as Figure 5 illustrates but others like those in
Colombia and Mexico are found inland. Quito, which is the capital of Ecuador, is also found in
inland in the Andes amidst several active volcanoes. Knowing whether communities reside on
the coast, valley, or in the mountains near volcanoes can help assess what possible risks may
exist. It is also important to understand who lives there. The middle class have the mobility to
reside in decent housing or at least better housing than the poor and working class and in better
locations. The poor are often found living in worst of or marginal locations in the centers of cities
and outer edges of cities in what are referred to as “shantytowns” (Kent, 2006).

14
Figure 5. Map of Latin American Cities. Several major cities such as Rio de Janeiro and Lima are located near the coasts and others such as Quito and Mexico City are located inland near volcanoes. They already may face hydrometeorological and geological hazards. Source: XXX

15
Economy Total GDP for the region was 3.8 trillion dollars (U.S.) in 2004. Many LA countries experienced
positive economic growth (UNEP, 2003; Kent, 2006) and double digit inflation (World Bank,
2006) during the 1990s but differences varied within the region. Mexico and Central America
exhibited steady gains throughout the decade while growth in the Caribbean islands declined in
the mid-1990s and South America grew stagnantly. If we observe GDP per capita from 1980 to
2000, we see a different picture, one in which many countries experienced negative economic
growth. They include Ecuador, Peru, Haiti, Guatemala, Honduras and Venezuela (Sachs, 2004:
67). According to Sachs, these countries are victims of the poverty trap and share some similar
characteristics such as geographic (their location) difficulties, sharp ethnic or class differences
(unrest), and vulnerability to the global market and natural hazards (2004: 71).
At turn the of 21st century until 2003, economic performance in the region in terms of GDP per
capita was either stagnant or diminishing--that is except for Chile and Mexico, whose
economies were positive. Figure 6 illustrates the market fluctuations and how LA regions
responded (UNEP, 2003). Figure 7 shows a few select countries and their GDP per Capita for
selected years (Singh et al., 2005). Within the last few years, economic growth seems to be
promising with a GDP growth rate of 4.6% last year and 6.0% in 2004, reportedly the highest in
25 years. However, GDP and GDP per capita as indicators only give a partial truth or rather a
skewed view of LA’s socioeconomic realities. If we delve further, we can see that income
disparity has also been growing. In fact, the region compared to other regions and the global
average suffers the greatest income inequalities and much has not changed in the last 15 years
(United Nations Population Fund, 2006). Furthermore, approximately 42.9% of the people are
living in poverty (living on less than $2.00 U.S. a day) and ~ 18.9% of the population lives in
extreme poverty (living on less than $1.00 U.S. a day) (United Nations Population Fund,
2006). Within the extreme poverty figures, indigenous populations, which are traditionally
16
marginalized, represent ~ 25.0% of the total (Singh et al., 2005). These populations are
typically the most affected during and after extreme weather-related events or natural disasters
(Glantz, 2001).
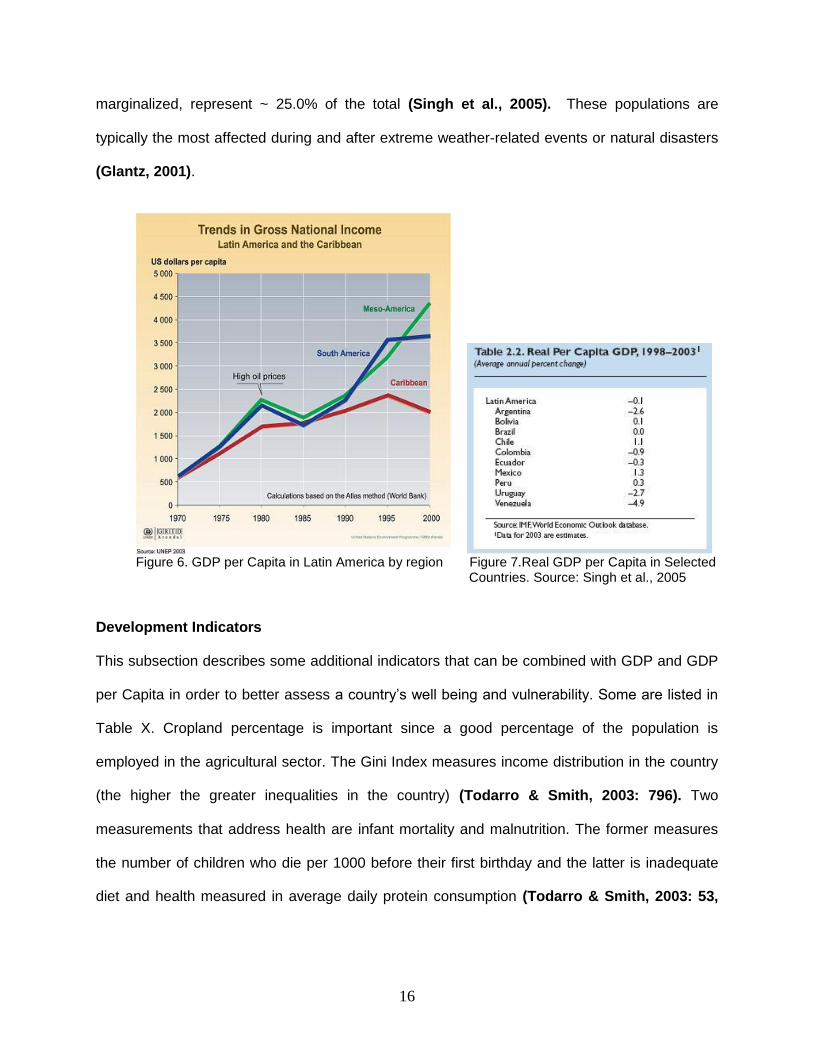
Figure 6. GDP per Capita in Latin America by region Figure 7.Real GDP per Capita in Selected Countries. Source: Singh et al., 2005 Development Indicators This subsection describes some additional indicators that can be combined with GDP and GDP
per Capita in order to better assess a country’s well being and vulnerability. Some are listed in
Table X. Cropland percentage is important since a good percentage of the population is
employed in the agricultural sector. The Gini Index measures income distribution in the country
(the higher the greater inequalities in the country) (Todarro & Smith, 2003: 796). Two
measurements that address health are infant mortality and malnutrition. The former measures
the number of children who die per 1000 before their first birthday and the latter is inadequate
diet and health measured in average daily protein consumption (Todarro & Smith, 2003: 53,

17
801). See Figures for maps of infant mortality and malnutrition in LA. Other indicators that can
indicate basic needs in development are sanitation and safe water supply.
Table 1. Selected Country Indicators that characterize development and vulnerability
Country Population Urban Cropland GDP GDP per capita Gini Index
Belize 270,000 48.1 4.5 1,280,000,000 4,900
Costa Rica 3,925,000 59.5 10.3 32,000,000,000 8,500 46.5
El Salvador 6,530,000 61.5 43.2 29,410,000,000 4,700 53.2
Guatemala 14,095,000 39.9 17.5 53,200,000,000 3,700 59.9
Honduras 6,745,000 53.7 12.7 16,290,000,000 2,600 55.0
Nicaragua 5,180,000 56.5 16.7 11,160,000,000 2,500 43.1
Panama 2,980,000 56.5 9.2 18,060,000,000 6,000 56.4
Central America 39,725,000 161,400,000,000
Mexico 104,340,000 74.6 13.9 924,400,000,000 9,000 54.6
Cuba 11,290,000 75.5 40.3 30,690,000,000 2,300
Dominican Republic 8,775,000 66.0 32.9 53,780,000,000 6,100 47.4
Haiti 7,590,000 36.3 39.6 10,600,000,000 1,700
Puerto Rico* 3,900,000 5.6 73,270,000,000 18,700
Caribbean 31,555,000 168,340,000,000
Argentina 38,945,000 88.3 12.6 403,800,000,000 10,200 52.2
Bolivia 8,655,000 62.9 2.8 21,150,000,000 2,500 44.7
Brazil 183,080,000 81.7 7.8 1,376,000,000,000 7,600 59.3
Chile 15,745,000 86.1 3.0 156,100,000,000 10,000 57.1
Colombia 41,985,000 75.5 3.7 251,600,000,000 6,500 57.6
Ecuador 13,840,000 63.4 10.5 42,650,000,000 3,100 43.7
Guyana 705,000 36.7 2.4 2,628,000,000 4,000
Paraguay 6,115,000 56.7 7.6 25,190,000,000 4,200 57.8
Peru 28,640,000 73.1 3.3 138,800,000,000 4,800 49.8
Suriname 435,000 74.8 0.4 1,469,000,000 3,500
Uruguay 3,425,000 92.1 7.7 26,820,000,000 7,800 44.6
Venezuela 24,835,000 87.2 3.7 131,700,000,000 5,500 49.1
South America
Latin America
Source: Data was retrieved from Goode’s
LA is fairing better in most development goals than regions like Subs-Saharan Africa and South
Asia (UNDP, 2006), but malnutrition and infant mortality continues to persist in the region. (See
Figures 8 and 9).

18
Figure 8. Map of Malnutrition in Latin America
Source: CIESIN, 2005
Figure 9. Map of Infant Mortality in Latin America
Source: CIESIN, 2005

19
Safe drinking water and sanitation facilities are crucial needs that enable health in communities.
When these services are inadequate in a population, diseases such as cholera and diarrheal
disease can thrive. According to the Joint Monitoring Programme of the WHO and UNICEF, in
the last 20 years, ~ 112 million people in urban areas and ~16 million people in rural areas have
been connected to “adequate” sanitation, however that is defined, in the last 15 years (2006). ~
119 million people have been served in urban areas and ~ 15 million people in rural areas with
improved water supply. The figures below show that although progress has been made, there
remain a large number of people underserved and a discrepancy between rural and urban. The
former as expected have a larger percentage that lack proper water and sanitation services.
Figure 10. Latin America: (A) Access to Sanitation (B) Access to Safe Drinking Water
Source: http://www.wsp.org/

20
Shifting Politics in Latin America and Governance In 2005, Bolivia saw its first and the region’s first indigenous president. In 2006, Chile elected its
first female president. Latin America’s politics in the last decade have been shifting in the “right”
direction--meaning a direction that appears to be more freely chosen by the people and leaders.
Recent elections in Nicaragua could break the stronghold of the right-leaning governments in
the Central American region. South America has slowly been shifting and current elections in
Ecuador may sway another country in that direction (Economist, 2006). Some attribute the shift
to structural economic reforms of the 1980s and 1990s and its impacts on LA societies; while
growth on some level has been evident, so has increasing inequitable distribution of income
(Weisbrot, 2006). These changes may hopefully lead overtime to greater autonomy, increased
resilience to global market fluctuations (and natural disasters), and finally a chance for stability
in governance. Ecuador has seen several presidents in the last decade; Haiti’s president was
“removed” from office with the help of U.S. troops in 2004; Insurgencies in Colombia along with
the drug trade maintains instability in the country. These are just a few of the problems that LA
countries face while contending with nature-related challenges such as ENSO weather.
3.2 Weather and Climate Latin America is a vast territory in the western hemisphere that ranges from the Subtropics to
the Tropics and Mid-latitudes in the southern hemisphere. Its biogeography is diverse and
includes many mountain ranges, plateaus, river basins, rainforests, grasslands, and even
deserts (Kent, 2006). Both the Pacific and Atlantic Oceans surround Central America, Mexico,
and South America and the Caribbean Islands are encircled by the Atlantic Ocean. The Pacific
and Atlantic Oceans strongly influence their regional and local climates as well as global
climate. The main dominating climate patterns and systems in the region are ENSO, the Pacific
Decadal Oscillation ( larger scale variability pattern that simulates ENSO and interacts with it),
South American Monsoon, the International Tropical Convergence Zone (high convection

21
Areas), and seasonal fluctuations (Kent, 2006; Podesta et al, .). A disruption of the expected
seasonal rainfall due to ENSO or other climate dynamics has serious implications for areas
where water is stressed and agricultural activity is dependent.
In the last year, several reports (Moreno, 2006; DFID, 2006; Simms et al., 2006) addressing
the issue of climate change in the region have been published. They report that Latin American
countries are not excluded from the global warming phenomenon. Studies have shown that
temperatures and precipitation patterns in the region have followed global trends (IPCC, 2001;
Hulme & Sheard, 1998; Simms et al., 2006). In Peru and Colombia, glaciers have been
receding. In the Caribbean, although warming has not been conclusively linked to hurricanes,
the intensity and frequency of hurricanes have increased in the last 10 years (Emanuel, 2005;
UNEP, 2003).The IPCC has projected that more El Nino-like weather (meaning extreme) is
expected in a warmer world, a scenario that Latin American countries face every few years
when the pattern develops.
Figure 11. Hurricane Trends in the Caribbean since 1945

22
4. Ecological and Societal impacts
This section describes the effects of ENSO-related weather and climate on society, institutions,
and ecosystems. It is important to note that ENSO combined with the existing conditions will
determine the results, positive or negative. In other words, El Niño is only partly to blame.
Examples will be given from recent ENSO events and from country case studies examining the
1997-98 El Niño. The map below presents a closer look at the ENSO teleconnections in the
Latin American region.
Figure 12. Regional Impacts of El Nino in Latin America

23
4.1 Economy and Politics ENSO-related weather and climate can affect all the sectors of a state, its industries, and
directly and indirectly affect the society within the state. In Latin America, the disruption of
livelihoods can be detrimental considering that many in the population are vulnerable to
economic and climate shocks (DFID, 2006). In many cases, the states as well are vulnerable
and lack the resources, organization, capacity or even political relationships to respond
appropriately even with an El Niño Forecast. This was evident in Peru and Costa Rica during
and after the 1997-98 El Niño. In Peru, Fujimori “took on” El Niño and mobilized its own
resources as well as funds from the World Bank for mitigation. Peru encountered jurisdictional
constraints between sectors, but overall was successful in minimizing damage. Costa Rica on
the other hand had better scientific capabilities and regional organizational capacity, but was
limited by resources (Glantz et al. manuscript). According to Glantz et al. (manuscript), Costa
Rica was denied financial assistance even though their contingency planning was well
structured.
The political and economic infrastructure of the Latin American states (affected by ENSO)
suffered damage through impacts on the population’s health, a shock to the state’s capacity,
state infrastructure, and loss or enhancement of its natural resources, and biodiversity. The
impacts can be seen prior to, during, and after ENSO events. For example, an assessment from
CEPAL (Comision Economica para America Latina y el Caribe) found that the socioeconomic
impacts from the 97/98 El Niño in Ecuador were as follows:

24
Source: Cornejo-Grunauer, 2001: 80
The aftermath of the 1997-98 El Niño proved that coast and island populations in Ecuador were
affected the most. Cities and highways were flooded, which in some places are only available
during certain seasons. (Cornejo-Grunauer, 2001: 80-81). Although Ecuador was able to
respond quickly, it lacked the resources and organization to appropriately address impacts that
were based on impacts from previous ENSO events such as the 1982-83 event. Remember
ENSO events are never the same and population demographics change overtime. Ecuador at
the time was enduring a long period of political instability having gone through four presidents in
three years (96 to 98). Its private sector became alarmed. Not only were products lost, but also
transportation for products to markets became disrupted. In Ecuador transportation costs on the
coast increased based on El Niño forecasts. When harvests were lost, market prices rose
(Cornejo-Grunauer, 2001: 81). As the chart illustrates, millions of dollars were lost and limited
resources had to be reallocated to address the situation.
At the local-level, the population can be affected through health effects (direct and indirect),
prices changes of food and other basic needs, changes in product availability, disruption of
work, and a breakdown or worsening of infrastructure and social services. In Peru like Ecuador,
the rural communities disproportionately felt the effects of ENSO. According to Reyes (2002),
this consisted of almost 400,000 people. Their homes were either damaged or lost due to
floods. Furthermore in rural uplands, the people, mainly small-scale farmers were more
1997-98 El Niño Impacts on Ecuador
Sector and subsector Direct damages Indirect Damages External effects Total
Social (a) 63.1 129.1 29.2 192.2
Infrastructure (b) 123.3 707 80.2 830.3
Economic (c) 582.9 709 545.4 1291.9
Expenses and mitigation 333.1 333.1
Total 769.3 1878.2 654.8 2647.5
In millions U.S.
a. housing, health, education
b. water and sewage, energy, transportation, telecommunications, urban infrastructure
c. agriculture, livestock, fisheries, industry, commerce, tourism

25
vulnerable due to geographic location and political marginalization (Reyes, 2002). It’s likely that
these communities are not insured and therefore the losses can become permanent and worsen
their living conditions. These changes in social conditions affect migration patterns within the
country as a disrupted labor force is shifting to look for work. In the Northeast Brazil, the shift is
to the metropolitan areas of the south like Rio de Janeiro and Sao Paolo (Taddei et al., 2003).
4.2 Agriculture Climate variability is an important variable that farmers must contend with seasonally and every
few years when ENSO arrives. It can affect their livelihood and food security for both their
families and their animals. Insufficient rainfall or changes in the frost can severely hurt harvest.
In places the Argentine Pampas, El Niño typically brings more rainfall to the region and is
looked on favorably by farmers. Maize and soybean crops in this region and in Uruguay have
been found to coincide with ENSO events, particularly in the last 18 years (Baethgen &
Gimenez, 2004). For example, maize in the Argentine Pampas is associated with higher yields
during El Niño and lower yields during La Niña (Podesta et al., 1999). In Uruguay, this is clearly
illustrated in their maize yields since the 1950s (See Fig. 13 found in Baethgen & Gimenez,
2004).

26
Figure 13. National Uruguayan maize yield distribution (1950-1999) and ENSO phases
Source: http://iri.columbia.edu/climate/ENSO/societal/example/BaethgenPlot.html#Fig1
In water stressed areas like Northeast Brazil, El Niño can exacerbate social conditions because
it disrupts their seasonal rainfall. The results are poor rain fed farmers have less water available,
crops fail, and farmers exhaust their grain reserves and even eat their livestock. Some farmers
can become indebted and sell their land to larger agricultural companies (Taddei et al., 2003).
During the 1997-98 El Niño, Cuba experienced the worst drought conditions in their April to
June season since 1941. In addition to a drier weather, they were also hit with hailstorms, high
winds, and unusual amount of pest infestations. Sugar cane production was down by 700,000
metric tons; potato crops yield decreased by approximately 18,000 metric tons, and 6,710 ha of
banana fields were lost. In the Eastern province of Cuba, milk production fell dramatically and
13,000 animals died from malnutrition (Naranjo-Diaz, 2001: 73).

27
4.3 Fisheries The anomalous warming of the Tropical Pacific Ocean during El Niño events can produce
severe environmental changes for marine life off the coast of Peru, Ecuador, and Chile.
Biological productivity is altered due to changes in sea surface temperatures and upwelling
processes, which normally bring nutrients to the surface for various aquatic biota. Many fish die
and others migrate south towards Chile, and are replaced by opportunist warm water species
(Glantz, 2001). The damage on the fishing industry and related industries (fishmeal) has been
evident in the last 30 years. As Figure 14 shows, the anchoveta and sardine industries have
marked declines in the El Niño years of 1972-73, 1982-83, and 1997-98. In Ecuador, during El
Niño, the anchoveta population is replaced with yellowfin tuna (Cornejo-Grunauer, 2001: 81),
which can be deemed a loss or gain depending on which fleet you participate in. However, while
the northwestern coast of South America may experience losses in fishing, the northern coast of
Chile experiences gains when migrating fish are caught near Peru’s border (Glantz, 2001: 267).
In Cuba, the lobster fishing industry lost almost $9 million (U.S.) due to the extreme weather in
1997-98 (Naranjo-Diaz, 2001: 73). El Niño and La Niña weather coupled with impacts from
overfishing practices in Hispaniola contributed to the overall outcome.
Figure 14. Fishing Industry in Peru from 1970 – 2001.
The red circle indicate El Nino years where fishing declined.

28
4.4 Gender Most El Niño studies do not address gender differentiations, and therefore lessons learned
assessments are actually lessons missed. As gender studies in Latin America have shown,
women face discrimination and many inequities as citizens of their states and within their own
communities and family structures (Reyes, 2002; Hays-Mitchell, 2002; Rico, 1998). They are a
subgroup within vulnerable populations and deserve inclusion and examination in weather-
related assessments. Furthermore, women are likely responsible for water distribution in their
households in rural communities. And as we know, El Niño can strongly affect the water supply
in many places. Rico states, “it is poor women who have to cope on a day-to-day basis with
shortages of water and problems of access” (1998). Therefore, shouldn’t women be included in
the overall contingency plans for El Niño and other weather-related events? Reyes (2002) found
that in the rural community of Piura in Peru, women faced inequality in food distribution,
education, and healthcare. This area is typically arid, but when El Niño strikes, it becomes
flooded and lakes form (Glantz, 2001: 75). During the 1997-98 El Niño, women who were
already facing malnutrition were further exposed to cholera and malaria. As mentioned earlier,
El Niño-related climate and economic shocks can trigger migrations of the labor force, which in
rural areas are likely to be men. This creates further stress on women who must take on
additional responsibilities as heads of households while grappling with existing stress from
discrimination in their respective communities (Reyes, 2002).
4.5 Human and Ecosystems Health
Human Populations ENSO events, particularly its warm phase El Niño, are considered spawners of disasters in
Latin American countries (Glantz, 2001). Again, ENSO does not work alone and many times,
the existing conditions of the population and state can determine the impacts and the degree of
impacts. El Niño can affect health directly through physical injuries created by El- Niño induced

29
floods or by floods that contribute that enable contamination of the water supply (Few et al.,
2004). But in many cases, the impacts are indirect. For example, drought conditions can affect
food supply through its effect on agriculture. Therefore El Niño has been blamed for many
famines in the Northeast. More commonly is its association with disease epidemics. During the
1991 to 1995 El Niño, the longest recorded ENSO event (Trenberth & Hoar, 1996), several
significant outbreaks took place and certainly El Niño was blamed. Environmental changes
affect the ecology of certain disease parasites and their vectors in both favorable and
unfavorable ways (Kovats et al., 2003).
Mosquito-borne diseases like dengue and malaria and their weather relations have been well
documented. Epidemics typically occur in places where the population is not immune and where
climate or other environmental factors may play a role in limiting the disease. It cannot be
generalized because the disease ecology and human exposure will depend on the place and
maybe time of year. In some places, outbreaks may follow heavy rainfall, where in others they
may follow drought conditions. In parts of Colombia, malaria has been found to occur in post
drought conditions related to El Niño. (See Figure 15). According to Kovats et al. (2003),
predator populations of the mosquito are affected adversely in drier conditions; this in turn
enables mosquitoes to increase in populations. However, changes in human activities like
deforestation and migration patterns areas also contribute to human exposure.

30
Figure 15. Dengue and Malaria in Colombia
Cholera is water-borne disease that reemerged in 1990 in Latin America. A major outbreak
began in 1991 in the northern coast of Peru (Barua & Greenough III, 1992). (See Figure 16).
Since then it has been documented in almost all the countries in the region. It is believed that
the waste of infected passengers aboard a ship off the coast of Peru was responsible. The
waste was dumped into the waters and contaminated the water supplies on the coast. Many
believe that El Niño-induced rains created flooding conditions that helped to overwhelm the
water and sanitation systems in Peru. It is also believed that the warming of the sea during El
Niño, enhanced the population of vibrios and their reservoirs (phytoplankton), which then
increased exposure to human populations (Seas et al., 2000; Huq et al., 2001).

31
Figure 16. Cholera & El Nino from 1991 - 2002
Ecosystems ENSO events can also affect ecosystems. As described earlier, the changes in sea
temperatures affect the migration patterns and mortality of various fish, crustaceans (shrimp,
lobster), and phytoplankton. These changes in populations affect the food chain and can
indirectly affect other populations. A good example was presented in a study of the 1982-83 El
Niño effects on the Galapagos Islands off the coast of Ecuador. During that time, the region
experienced anomalously warm sea surface temperatures and air temperatures. According to
Glantz (2001), both marine life and life on land were impacted for better or worse. Vegetation
exploded on land and the Galapagos finch population grew dramatically. However many
species did not farewell. The flightless cormorant suffered a 45% decrease and penguins
suffered a 78% decrease in population. Whales and porpoises were not seen and likely
migrated to places with food. Corals, “considered the rainforests of the sea”, reportedly suffered
greatly (Glantz, 2001: 149-151). Corals are sensitive to small changes in the environment.

32
During the 1997-98 El Niño Panama reported losses of almost 50-90% of their corals in several
sites after experiencing a degree and a half in sea surface temperature increase (NOAA, 1998).
Figure 15. Coral Bleaching
Source: NOAA
5. Conclusions In conclusion, I sum up some of the challenges that Latin American states and their populations
face when ENSO strikes.
Challenges at time of ENSO in Latin American States
State-level
civil unrest
geographic position of country in ENSO line of fire
growing income disparities
limited resources
major cities geographically located at places of risk
multiple emergencies
political instability
rural areas lack social services
vulnerable to global market forces
lack organization between different government sectors (i.e. Peru during 1997-98)
may lack technical expertise
loss of resources (loss of glaciers can result in loss of run-off water)
uncertainty that comes with climate forecasts
Population-level
armed conflict in some areas
lack of adequate water, sanitation, and health services, particularly those in rural areas
live in locations of hazard (on slopes, near coasts)
many are living in poverty and lack resources
marginalization of indigenous groups, poor, women
suffer multiple health problems (malnutrition, infant mortality, vector-borne diseases, diarrheal diseases)
Other factors that may be considered but that were not included in this study because of time
constraints are environmental degradation and loss of biodiversity. How might these factors

33
affect El Niño outcomes in a place or region? One way may be to investigate the relationships
between different types of ‘hotspots’ for environmental problems and El Niño ‘hotspots’ (Glantz,
2002). Hot spots in this context can refer to places or regions where environmental degradation
and loss of biodiversity are reaching a threshold. Do El Niño ‘hotspots’ overlap?
Considering all the variables in ENSO disaster management can potentially better prepare the
state, its population, and the international community. As I have illustrated, the variables are not
isolated but indeed are interconnected. Public education programs administered during a crisis
such as a cholera outbreak may promote hygienic practices (i.e. washing your hands, boiling
water) and discourage certain foods (i.e. from vendors, seafood). However, if the population at
risk has limited water supply or relies on certain foods for subsistence without substitutes
available (at a lower cost), then how can that population cope? In other words, disaster
strategists in Latin America and abroad must recognize that their plans are implemented in the
context of a vulnerable population and a multiple crisis environment.
During ENSO events multiple states may face similar types of emergencies such as floods or
disease outbreaks. It is possible that a geographic hub of emergency is created during El Niños
and that as whole (this hub or ‘hotspot’) the region may be weakened. Can Ecuador rely on its
neighbors for assistance, for example? This is unlikely since their neighbors are also facing EL
Nino crises. Can Ecuador seek assistance from the international community? Possibly, but so
are its neighbors; there will be a competition for funding as was evident in Peru and Costa Rica.
Can an alliance of states form that pools resources to address ENSO? CIIFEN in Ecuador is an
international organization hoping to address this problem (CIIFEN, 2006), but what I am
suggesting is an international body like PAHO, for example, may possibly be formed. CIIFEN
although it has the best intentions may compete with neighboring organizations as well as those
abroad. This could prove fruitful for rich countries in the north that seek to examine disaster

34
management strategies. Can the UN create an agency that addresses effectively ENSO type
and similar events in that region? ENSO is the second most predictable climate phenomenon
besides the season (McPhaden et al., 2006) and Latin America with its highly urbanized cities
may provide an excellent setting for strategy testing particularly in the context of multiple
emergencies. Is such a plan possible and can it be achieved in an ethical and equitable way
that is sustainable?
References Ahrens, C.D. (2000). Meteorology Today. Boston, Thompson Brooks/Cole. Baethgen, W., A. Gimenez (2004). Seasonal climate forecasts and the agricultural sector of Uruguay. International Research Institute for Climate and Society website. 5 October 2004. http://iri.columbia.edu./climate/ENSO/societal/example/Baethgen.html#fig1 (accessed 12 December 2006). Barua, D., W.B. Greenough III (1992). Cholera. New York, Plenum Medical.
Cane, M. A., S. E. Zebiak, S. C. Dolan (1986). ”Experimental Forecasts of El-Niño.” Nature. 321(6073): 827-832. Center for International Earth Science Information Network (2006). “Where the poor are? An atlas of poverty.” CIESIN website. http://www.ciesin.org/povmap/ (accessed 10 October 2006). Centro de Investigaciones y Estudios Superiores en Antropología Social. http://www.ciesas.edu.mx/ (accessed 10 October 2006). Centro Internacional Para La Investigacione de Fenomeno El Niño. http://www.ciifen-int.org/ (accessed 14 December 2006). Cornejo-Grunauer et. al. (2001). “Ecuador summary.” Once burned, twice shy: Lessons learned from the 1997-98 El Niño. Ed. M.H. Glantz. Tokyo, United Nations University Press. 78 – 87. Department for International Development (2006). "Climate change in Latin America." http://www.dfid.gov.uk/pubs/files/climatechange/12LatinAmerica.pdf (accessed 29 June 2006) ENSO. Climate Glossary. Climate Prediction Center. National Oceanic and Atmospheric Association. http://www.cpc.ncep.noaa.gov/products/outreach/glossary.shtml#E (accessed 21 October 2006). El Nino Affairs (2006). Center for Capacity Building, National Center for Atmospheric Research. http://www.ccb.ucar.edu/enos/ (accessed 10 October 2006).

35
Emanuel, K.A. (2005). “Increasing destructiveness of tropical cyclones over the past 30 years.” Nature. 436: 686 – 688. Few, R., M. Ahern, et al. (2004). Floods, health, and climate change: a strategic review. Norwich, Tyndall Centre for Climate Change Research. Glantz, M. H. (2001). Currents of change: Impacts of El Niño and La Niña on climate and society. Cambridge, UK, Cambridge University Press. Glantz, M. H., Ed. (2001). La Niña and its impact: Facts and speculation. Tokyo, United Nations University Press. ---(2001). Once burned, twice shy? Lessons learned from 1997-98 El Niño. Tokyo, United Nations University Press. Glantz, M.H., I.J. Ramirez, et al. (2006). Goddard, L. and M. Dilley (2005). "El Niño: Catastrophe or opportunity." Journal of Climate: 651 - 665. Goddard, L., S. J. Mason, et al. (2001). "Current approaches to seasonal-to-interannual climate predictions." International Journal of Climatology 21: 1111 - 1152. Huq, A., R.B. Sack, R.R. Colwell (2001). “Cholera and global ecosystems.” Ecosystem Change and Public Health: A Global Perspective. Eds. Aron, J.L., J. Patz. Baltimore, London, Johns Hopkins University. 327 – 352. Hulme, M., N. Sheard (1999). “Climate change scenarios for Argentina.” Climatic research Unit, Norwich, UK. Intergovernmental Panel on Climate Change (2001). “Latin America”. Climate Change 2001: Impacts, Adaptation, and Vulnerability. http://www.ipcc.ch/ (accessed October 2005). Kent, R. B. (2006). Latin America: Regions and people. New York, The Guildford Press. Kent, R.B. (2006). Latin America: Regions and People. New York, The Guildford Press. Kovats, R.S., M.J. Bouma, S. Hajat, E. Worrall, A. Haines (2003). “El Niño and health.” The Lancet. 362: 1481 – 1489. Latin America and the Caribbean. United Nations Population Fund. http://www.unfpa.org/latinamerica/ (accessed 26 October 2006). McPhaden, M. J., S. E. Zebiak, M. H. Glantz (2006). “ENSO and an integrating concept in Earth Science.” Science, 314: 1710-1715. Moran, E. F., R. Adams, et al. (2006). "Human strategies for coping with El Niño-related drought in Amazonia." Climate Change 77: 343 - 361. Moreno, A.R. (2006). “Climate change and human health in Latin America: drivers, effects, and policies.” Regional Environmental Change. 6: 157 – 164.

36
Naranjo-Diaz et al. (2001). “Cuba summary.” Once burned, twice shy: Lessons learned from the 1997-98 El Niño. Ed. M.H. Glantz. Tokyo, United Nations University Press. 73 - 77. Podesta, G.P., C.D., Messina, M.O., Grondona, M.O. Magrin (1999). “Associations between crop yields in central-eastern Argentina and El Niño -Southern Oscillation.” Journal of Applied Meteorology. 38: 1488 – 1498. Reyes, R. R. (2002). "Gendering responses to El Niño in rural Peru." Gender and Development 10(2): 60 - 69. Rico, M. N. (1998). "Women in water-related processes in Latin America: Current situation and research and policy proposals." Water Resources Development 14(4): 461 - 471. Ropelewski, C. F., M. S. Halpert (1987). “Global and regional scale precipitation patterns associated with the El Niño / Southern Oscillation.” Mon. Wea. Rev. 115: 1606-1626. Seas, C., J. Miranda, A.I. Gil, R. Leon-Barua, J. Patz, A. Huq, R.R. Colwell, R.B. Sack (2000). “New insights on the emergence of cholera in Latin America during 1991: the Peruvian experience.” The American Journal of Tropical Medicine and Hygiene. 62 (4): 513 – 517. Simms, A., H. Reid (2006). “Up in smoke? Latin America and the Caribbean: The threat from climate change to the environment and human development.” The third report from the working group on climate change and development. New Economics Foundation. 29 August 2006. http://www.foeeurope.org/climate/download/Up_in_Smoke_embargo.pdf (accessed 10 August 2006). Sachs, J. (2005). The End of Poverty. New York, Penguin Press. Singh, A., A. Belaisch, C. Collyns, P. De Masi, R. Krieger, G. Meredith, R. Rennhack (2005). “Stabilization and reform in Latin America: A macroeconomic perspective on the experience since the early 1990s.” International Monetary Fund. http://www.imf.org/external/pubs/ft/op/238/index.htm (accessed 10 October 2006). Taddei, R., K. Broad, A. Pfaff (2003). “Integrating climate and water management in Ceara: Historical background, social, and legal structures, and implications.” Paper presented at the 3rd Annual Meeting of the International Science and Technical Advisory Committee of the International Research Institute for Climate and Society, on May 22, 2003, Palisades, NY. Todarro, M.P., S.C. Smith (2003). Economic Development, 8th edition. London, Pearson. Trenberth, K. E., T. J. Hoar (1996). “The 1990-1995 El Niño-Southern Oscillation Event: Longest on record.” Geophys. Res. Lttrs.. 23: 57-60. “An enigmatic leftist rides into town” (2006). Economist. 14-20 October. 381 (8499): 39. United Nations Development Program. Human Development Report, 2006. UNDP website. http://hdr.undp.org/reports/ (accessed 1 November 2006). United Nations Environment Program (2003). Maps and grids. http://maps.grida.no/go/searchRegion/regionid/geolameric (accessed 10 October 2006).

37
United Nations Population Fund. “Report on World Population Prospects, 2005.” http://www.unfpa.org/ (accessed 10 October 2006). Weisbrot, M. (2006). “Latin America: The end of an era.” Post-autistic Economics Review online. 1 October 2006 http://www.paecon.net/PAEReview/issue39/Weisbrot39.htm (accessed 1 October 2006). WinklerPrins, A. Department of Geography. Michigan State University. 26 October 2006. .