Material Flows in Latin America
17
RESEARCH AND ANALYSIS Material Flows in Latin America A Comparative Analysis of Chile, Ecuador, Mexico, and Peru, 1980–2000 Daniela Russi, Ana C. Gonzalez-Martinez, Jos´ e Carlos Silva-Macher, Stefan Giljum, Joan Mart´ ınez-Alier, and Maria Cristina Vallejo Keywords: extractive economies industrial ecology liberalization Latin America material flow analysis (MFA) physical trade balance Summary In this article we compare the resource flows of Chile, Ecuador, Mexico, and Peru between 1980 and 2000. Our objective is to analyze the structure of social metabolism of extractive countries and the consequences of the neoliberal economic structural reforms on the use of natural resources. In two decades, the domestic extraction of materials increased con- siderably in the four countries, mainly due to the mining sector in Chile and Peru, biomass and oil in Ecuador, and construc- tion minerals in Mexico. Imports and exports also increased, because of the increasingly deeper integration in international markets, prompted by liberalization policies implemented in the four countries between the late 1970s and the late 1990s. All four countries had a negative physical trade balance for most of the period analyzed, with exports exceeding imports in terms of weight. However, parallel growth of imports re- duced the physical deficit in Chile, Mexico, and Peru. Ecuador’s physical deficit was the highest and did not decrease during the last two decades. A diversification of exports away from bulk commodities could be observed in Chile and Mexico and to a lesser extent in Peru, whereas in Ecuador the expor t sec- tor remained mainly based on oil and biomass. More research is needed to explore the environmental and social impacts of the neoliberal economic reforms. Also, the indirect flows associated with direct physical imports and exports deserve to be subjected to further analysis. Address correspondence to: Daniela Russi Department of Economics and Economic History Universitat Aut` onoma de Barcelona 08193 Bellaterra – Barcelona, Spain [email protected] c 2008 by Yale University DOI: 10.1111/j.1530-9290.2008.00074.x Volume 12, Numbers 5/6 704 Journal of Industrial Ecology www.blackwellpublishing.com/jie
-
Upload
independent -
Category
Documents
-
view
5 -
download
0
Transcript of Material Flows in Latin America

R E S E A R C H A N D A N A LYS I S
Material Flows inLatin AmericaA Comparative Analysis of Chile, Ecuador,Mexico, and Peru, 1980–2000
Daniela Russi, Ana C. Gonzalez-Martinez,Jose Carlos Silva-Macher, Stefan Giljum, Joan Martınez-Alier,and Maria Cristina Vallejo
Keywords:
extractive economiesindustrial ecologyliberalizationLatin Americamaterial flow analysis (MFA)physical trade balance
Summary
In this article we compare the resource flows of Chile, Ecuador,Mexico, and Peru between 1980 and 2000. Our objective isto analyze the structure of social metabolism of extractivecountries and the consequences of the neoliberal economicstructural reforms on the use of natural resources. In twodecades, the domestic extraction of materials increased con-siderably in the four countries, mainly due to the mining sectorin Chile and Peru, biomass and oil in Ecuador, and construc-tion minerals in Mexico. Imports and exports also increased,because of the increasingly deeper integration in internationalmarkets, prompted by liberalization policies implemented inthe four countries between the late 1970s and the late 1990s.All four countries had a negative physical trade balance formost of the period analyzed, with exports exceeding importsin terms of weight. However, parallel growth of imports re-duced the physical deficit in Chile, Mexico, and Peru. Ecuador’sphysical deficit was the highest and did not decrease duringthe last two decades. A diversification of exports away frombulk commodities could be observed in Chile and Mexico andto a lesser extent in Peru, whereas in Ecuador the export sec-tor remained mainly based on oil and biomass. More researchis needed to explore the environmental and social impactsof the neoliberal economic reforms. Also, the indirect flowsassociated with direct physical imports and exports deserveto be subjected to further analysis.
Address correspondence to:Daniela RussiDepartment of Economics and Economic
HistoryUniversitat Autonoma de Barcelona08193 Bellaterra – Barcelona, [email protected]
c© 2008 by Yale UniversityDOI: 10.1111/j.1530-9290.2008.00074.x
Volume 12, Numbers 5/6
704 Journal of Industrial Ecology www.blackwellpublishing.com/jie

R E S E A R C H A N D A N A LYS I S
Introduction
Between the late 1970s and the early 1990s,a set of neoliberal reforms was implementedin the majority of Latin American countries.The main cornerstones of these reforms wereprivatization of public enterprises, reduction ofpublic expenditure, and progressive opening ofthe economy to foreign investment and inter-national trade. These policies and their con-sequences have already been extensively ana-lyzed via economic and social indicators (see,e.g., Herzer and Nowak-Lehnmann 2006; Dussel2002; Pasco-Font 2000). The effects on the bio-physical dimension have mostly been neglectedby economists, however.
A particularly helpful methodology for inves-tigating patterns of biophysical change is mate-rial flow analysis (MFA), which assesses flows ofmaterials through socio-economic systems. Thismethodology is based on the concept of so-cial metabolism (Fischer-Kowalski 1998; Fischer-Kowalski and Huttler 1998). According to thisapproach, an economy in a biophysical sense isseen in analogy to an organism, which extractshigh-quality materials and energy from the envi-ronment, processes them, and then returns themto the environment as low-quality residues.
Material flow indicators have been regarded aspressure indicators and express a potential for en-vironmental impact. In fact, economies must ex-tract and process materials to produce goods thatare then transported, exchanged, used, and, fi-nally, discharged. Environmental impacts are as-sociated with all these activities.
The practice of accounting for physical flowsalready has a long intellectual history (Fischer-Kowalski 1998; Fischer-Kowalski and Huttler1998) and has been applied to most industrial-ized countries (Adriaanse et al. 1997; Matthewset al. 2000; Weisz et al. 2006). More recently,researchers used material flow accounting to ex-amine the social metabolism of some Latin Amer-ican countries (Fischer-Kowalski and Amann2001; Amann et al. 2002; Giljum 2004; Perez-Rincon 2006; Vallejo 2006; Gonzalez-Martınezand Schandl 2008).
This article provides the first comparison ofmaterial flows in four selected Latin Americancountries for which MFA data are available. On
the one hand, we look at Chile and Mexico, twoof the largest economies in the subcontinent andpart of the group of upper middle-income de-veloping economies; on the other hand, we ex-amine Ecuador and Peru, two countries that areconsidered to be of lower middle-income level(WB 2007). Historically, the four countries haveshared a common pattern: Their economies havebeen based on an intensive extraction of naturalresources.
Therefore, our objective is to analyze thestructure of social metabolism of extractiveeconomies, a term introduced by Bunker (1985).According to Bunker, capitalism produces a po-larization between extractive economies—basedon the extraction of resources for trade—andproductive economies—based on production ofgoods. The increasing flow of raw materials andenergy from extractive to productive economies(from the periphery to the core of power), sogoes Bunker’s argument, is responsible for thedeterioration of natural resources and negativesocial impacts in extractive economies togetherwith an increasing vulnerability to world mar-ket price fluctuations. Similarly, Eisenmengerand Giljum (2006, 299) argue that extractiveeconomies should be defined as those specializedin extracting resources for export rather than fordomestic use.
We focus on the period 1980–2000 becauseof the availability of statistics. This period coin-cides with the implementation of the neoliberalstructural reforms (early 1980s), enabling easy ac-cess to natural resources. By focusing on this timeframe, we answer two related questions:
1. How did the development strategy of thesefour countries change toward increasingintegration into world markets throughinternational trade, and what were theconsequences for material flows in thesecountries?
2. Are the four analyzed countries movingalong a path toward dematerialization asa result of the economic reforms imple-mented? According to the dematerial-ization hypothesis (Cleveland and Ruth1998) countries tend to use less material inabsolute terms (absolute dematerialization)or at least per unit of economic product
Russi et al., Material Flows in Latin America 705

R E S E A R C H A N D A N A LYS I S
(relative dematerialization) due to techno-logical progress, which is enabled by eco-nomic growth.
Furthermore, we aim to empirically evaluatedifferent theories that link natural resource ex-traction and export to economic growth and de-velopment prospects, such as the staple theoryof economic growth (Innis 1930, 1949; Altman2003) and the theory of the “deterioration ofterms of trade” (Prebisch 1952).
Chilean, Ecuadorian, Mexican, and Peruviansocial metabolisms were analyzed thoroughlyby Giljum (2004), Vallejo (2006), Gonzalez-Martınez and Schandl (2008), and Silva-Macher(2007). MFA indicators for the first three coun-tries were mainly built with information fromnational institutions and statistics. Where nec-essary, data sets were complemented with statis-tics from international organizations. The MFAdata set for Peru is solely based on internationalsources.
Nevertheless, the data sets are highly compa-rable, because all four country studies applied thestandard methodology for economy-wide MFApublished by the European Statistical Office (EU-ROSTAT 2001). The main material indicatorsused are as follows:
• Domestic material extraction (DE): rawmaterials extracted within national borders.
• Direct material input (DMI):DMI = DE + imports. DMI com-prises all materials that enter the economyfor further use, in either production orconsumption processes.
• Domestic material consumption (DMC):DMC = DMI − exports. DMC provides in-formation on the quantity of the materialsthat remain within the national territory.
• Physical trade balance (PTB): Im-ports − exports. The PTB reveals whethera country is a net importer or a net exporterin physical terms.
It is important to emphasize that only in-flows that are used in the economy—namely, usedflows—are taken into account, so the unused ex-traction—that is, materials that are moved with-out the intention of using them in the economy(e.g., overburden from mining)—is left out.
The main material categories considered inthis analytical framework are biomass, fossil fu-els, and minerals. A fourth category, other in-dustrial products, comprises final goods that havenot been included in one of the other materialcategories.
The present article is structured as follows.First, we provide an overview of the main phys-ical, social, and economic features of the fourLatin American countries. In the following sec-tion, we analyze material use in these foureconomies, putting special emphasis on physicaltrade balances. Next we illustrate the differingmaterial intensities of imports and exports. Inthe final section, we provide a discussion of theresults and draw our conclusions.
Country Overview
Table 1 provides an overview of the mainstructural indicators for the four Latin Ameri-can countries. To compare the data with thoseof an industrialized region, we additionally listdata for the EU-15.1 This region was selectedas it is the only one for which material flow ac-counts for the period of 1980 to 2000 exist.2 Totalarea and population vary greatly among the fourcountries. Mexico is the largest and most pop-ulated country, and Ecuador is the smallest andleast populated. All four Latin American coun-tries are by far less densely populated than Eu-rope, as their geography includes large deserts,mountain ranges, and tropical forests, and theydeveloped through a much shorter agriculturalhistory than Europe. Final energy use per capitais also significantly lower in these Latin Americancountries than in the EU-15. The European pop-ulation, on the average, uses more than twice theenergy per capita as Chile, which has the highestenergy use per capita among the four countries(IEA 2008).
With regard to economic indicators, Mexicohas the largest volume of economic activity, inboth absolute and per capita terms. Still, theper capita income in the EU-15 is much higher.When gross domestic product (GDP) per capitais expressed through purchasing power parity(PPP), the Chilean economy increased markedlyin the period under analysis and surpassed averageMexican income in 1995 (see figure 1). By 2000,
706 Journal of Industrial Ecology

R E S E A R C H A N D A N A LYS I S
Table 1 Structural parameters of the countries studied, 2000
Population Energy use GDP per Income sharedensity per capita GDP capita held by
Population (inhabitants/ Area (TOE per (US$ (US$/ highestCountry (1,000s) km2) (km2) capita) 1 million) inhabitant) 10% (%)
Chile 15,412 20.4 756,630 1.68 75,775 4,917 47.0Ecuador 12,306 43.4 283,560 0.68 15,942 1,295 41.6Mexico 97,966 50.0 1,958,200 1.53 581,426 5,935 41.7Peru 25,952 20.2 1,285,220 0.48 53,086 2,046 35.4EU-15 376,462 116.1 3,242,601 3.90 7,965,639 21,159 25.2
Note: One square kilometer (km2, SI) = 100 hectares (ha) ≈ 0.386 square miles ≈ 247 acres. GDP = gross domesticproduct; TOE = tonnes of oil equivalent; EU-15 = the 15 European countries that constituted the European Unionbefore the enlargement in 2004.Source: World Bank (2007), Eurostat (2002) for EU-15 data.
the Chilean GDP per capita in PPP was the high-est (US$9,115), followed by Mexico (US$9,046).
Another relevant feature of the four countriesis the high income inequality: The richest 10%of the population hold between one third andone half of the total income, while in EU-15 thewealthiest 10% hold only one fourth of the totalincome.
As a result of a regional economic crisis inthe 1980s, characterized by economic stagnation,high rates of inflation, net capital outflows, anda huge external debt, important structural re-forms were applied in Latin America. These re-
Figure 1 Evolution of gross domestic product (GDP) per capita in purchasing power parity (PPP) for Chile,Ecuador, Mexico, and Peru, 1980–2000 (PPP is presented in constant U.S. dollars as of 2000).
forms were imposed by the International Mon-etary Fund (IMF) and mainly consisted of aprogressive opening of the economies to foreigncapital and international trade and an increasingprivatization of crucial sectors, such as infrastruc-tures, energy, and education.
Chile was the first country in Latin Americato adopt a market-oriented set of policy mea-sures, in 1974. The reforms deeply modified aneconomy that had been mainly based on importsubstitution and protectionism (the average tariffrate was almost 100%). One of the main objec-tives of the military regime then in power was
Russi et al., Material Flows in Latin America 707

R E S E A R C H A N D A N A LYS I S
to fuel economic growth through an increase inexports, stimulated by a strong devaluation anda drastic reduction of trade tariffs. Earnings fromexports rose, and a diversification of exports alsotook place: The relative importance of copperas the main export product decreased from 80%to 40% (in monetary terms) between 1973 and2000. In the 1990s, Chile signed several free tradeagreements with Canada, the United States, andCentral American and Mercosur countries.
After Chile’s reforms started to bear fruit interms of economic growth, other Latin Amer-ica countries also fully embraced neoliberal poli-cies. Mexico, after a period of devaluation, hyper-inflation, and economic collapse (−0.6% GDPgrowth rate in 1982 and an additional −4.2%in 1983), implemented a neoliberal economicprogram in 1988. In 1986, Mexico also inaugu-rated a set of policies aimed at stimulating freetrade by joining the General Agreement on Tar-iffs and Trade (GATT). Since then, it has signed12 trade agreements with 43 nations, putting 90%of its trade under free trade regulations. The mostimportant trade agreement was established withthe United States and Canada (North AmericanFree Trade Agreement [NAFTA]); it has allowedtrade to triple in monetary terms since NAFTAwas ratified in 1994. Today, almost 85% of Mex-ico’s exports are delivered to the United States,which makes the Mexican economy highly de-pendent on U.S. economic cycles.
In Peru, President Fujimori introduced a neo-liberal reform package to alleviate the economiccrisis of 1988–1990 (GDP decreased by 20%,and the cumulative inflation rate was 4,778%in 1990), partly caused by internal armed un-rest (Dıaz et al. 2000). Beginning in 1990, tradereform gradually reduced import tariffs. Also, theexport sector was promoted through eliminationof export tariff duties. As a result, exports grew inmonetary terms by 80% between 1990 and 1997.
Ecuador implemented market-oriented re-forms later than other countries in the region,in 1992. The Stabilization Plan restructured theeconomy toward liberalization of trade and cap-ital flows. During the 1980s, adjustment policieswere focused on short-term stabilization ratherthan structural change (Taylor and Vos 2000). Asa result, inflation reached historical rates (75%)in 1989, and fiscal and current accounts regis-
tered high deficits, which the government triedto reduce by means of stabilization reforms.
The results of these reforms were not homoge-neous. Clearly, Chile saw its economy and stan-dard of living boosted (see figure 1), whereasMexico, Peru, and Ecuador were not able to sus-tain a similarly dynamic growth. Nevertheless, inLatin America, economic growth did not trans-late into a more equitable income distribution.
One main reason for this is that growth inLatin American became more technology- andskill-intensive in 2000 than it was in the past(Morley 2000). Therefore, the positive effectsof market opening were concentrated in capital-intensive industries with high productivity, suchas those processing natural resources and the au-tomotive and electronic industries. By compar-ison, labor-intensive industries producing final-consumption products were negatively affected(Katz 2000).
Resource Use in Chile, Ecuador,Mexico, and Peru
The economic development of Latin Ameri-can countries and their specialization patterns oninternational markets have clear consequencesfor social metabolism. Chile’s material input ofmore than 46 tonnes3 per capita in 2000 wasamong the highest in the world (see Behrens et al.2007). For instance, in the same year in Finland,the country with the highest per capita materialinput in Europe, DMI was 42 tonnes per capita(EUROSTAT 2002). Ecuador shows the lowestindicators, whereas Peru and Mexico are situatedin between (see table 2).
Direct Material Input (DMI)
Figure 2 shows the DMI of the four selectedcountries, with breakdowns by type of materialflow. DMI includes all materials entering theeconomy for use and is the sum of tonnes ofdomestic extraction and tonnes of imports. TheDMI of the four countries increased between1980 and 2000, although at very different rates.Most of the increase was due to intensified domes-tic extraction, whereas imports provided a grow-ing but still small share. Only in Ecuador did theimport share fail to increase in the last 20 years.
708 Journal of Industrial Ecology
R E S E A R C H A N D A N A LYS I S
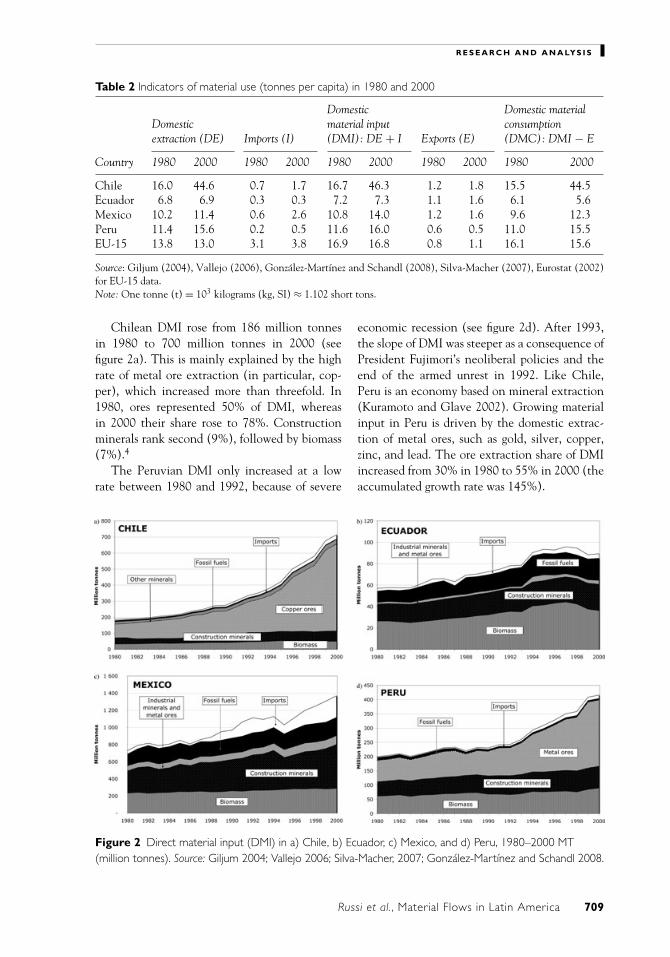
Table 2 Indicators of material use (tonnes per capita) in 1980 and 2000
Domestic Domestic materialDomestic material input consumptionextraction (DE) Imports (I) (DMI): DE + I Exports (E) (DMC): DMI − E
Country 1980 2000 1980 2000 1980 2000 1980 2000 1980 2000
Chile 16.0 44.6 0.7 1.7 16.7 46.3 1.2 1.8 15.5 44.5Ecuador 6.8 6.9 0.3 0.3 7.2 7.3 1.1 1.6 6.1 5.6Mexico 10.2 11.4 0.6 2.6 10.8 14.0 1.2 1.6 9.6 12.3Peru 11.4 15.6 0.2 0.5 11.6 16.0 0.6 0.5 11.0 15.5EU-15 13.8 13.0 3.1 3.8 16.9 16.8 0.8 1.1 16.1 15.6
Source: Giljum (2004), Vallejo (2006), Gonzalez-Martınez and Schandl (2008), Silva-Macher (2007), Eurostat (2002)for EU-15 data.Note: One tonne (t) = 103 kilograms (kg, SI) ≈ 1.102 short tons.
Chilean DMI rose from 186 million tonnesin 1980 to 700 million tonnes in 2000 (seefigure 2a). This is mainly explained by the highrate of metal ore extraction (in particular, cop-per), which increased more than threefold. In1980, ores represented 50% of DMI, whereasin 2000 their share rose to 78%. Constructionminerals rank second (9%), followed by biomass(7%).4
The Peruvian DMI only increased at a lowrate between 1980 and 1992, because of severe
Figure 2 Direct material input (DMI) in a) Chile, b) Ecuador, c) Mexico, and d) Peru, 1980–2000 MT(million tonnes). Source: Giljum 2004; Vallejo 2006; Silva-Macher, 2007; Gonzalez-Martınez and Schandl 2008.
economic recession (see figure 2d). After 1993,the slope of DMI was steeper as a consequence ofPresident Fujimori’s neoliberal policies and theend of the armed unrest in 1992. Like Chile,Peru is an economy based on mineral extraction(Kuramoto and Glave 2002). Growing materialinput in Peru is driven by the domestic extrac-tion of metal ores, such as gold, silver, copper,zinc, and lead. The ore extraction share of DMIincreased from 30% in 1980 to 55% in 2000 (theaccumulated growth rate was 145%).
Russi et al., Material Flows in Latin America 709

R E S E A R C H A N D A N A LYS I S
Ecuador has negligible metal ore production,but it is a substantial exporter of crude oil (23%of DMI in 2000; see figure 2b). In terms ofweight, the Ecuadorian economy is mainly basedon biomass (bananas and sugar cane), which ac-counted for 43% of DMI in 2000 (cumulativegrowth rate was 37%). The second main flow wasconstruction minerals (28%), followed by fossilfuels (23%). The share of imports in Ecuador’sDMI is very small.
Among the four countries, Mexico is the econ-omy with the highest absolute DMI, due to itslarge territory and population. Between 1980 and2000, DMI increased unevenly, although the gen-eral trend was upward (see figure 2c). We observea different DMI composition if we compare it tothe other three countries: As a result of buildingup infrastructure and related construction activi-ties, construction minerals are the main materialflow (42% share of DMI in 2000), followed bybiomass (24%), mainly animal fodder. Fossil fu-els rank third (18%). In addition, Mexico showsthe highest imports share in DMI, which con-siderably increased during the last two decadesbecause of trade liberalization.
The increase in material extraction hasboth environmental and social consequences. InChile, copper mining takes place in largely un-inhabited regions, and thus social conflicts rarelyoccur. In Peru, however, mining conflicts ariseregularly due to the proximity to populated ar-eas, as pollution and the intensive use of thescarce water resources directly affect the localpopulation. In Ecuador, there are complaints be-cause of the environmental liabilities of oil and
Table 3 Physical and monetary trade per capita, 1980
Trade balancesImports Exports
PTB (imports− MTB (exports−Country (tonnes) ($a) (tonnes) ($a) exports; tonnes) imports; US$)
Ecuador 0.3 283 1.1 312 −0.8 29Peru 0.2 149 0.6 191 −0.4 42Chile 0.7 458 1.2 410 −0.5 −48Mexico 0.6 290 1.2 229 −0.6 −61EU-15 3.1b 1,060 0.8b 868 2.3 192
Note: PTB = physical trade balance; MTB = monetary trade balance.aSource was UN 2007.bSource was Eurostat 2002.
gas extraction in the Amazon. The distinctionbetween preciosities (high economic value perunit of weight) and bulk commodities (Waller-stein 1974, 1980, 1989; Hornborg 2007) is rel-evant here. Opposition might arise against goldmining, as was the case with the successful resis-tance movement in Tambogrande (Piura, Peru),because of the threats of local pollution. For theimporting countries’ metabolism, however, im-ports of refined gold matter little when compared,for instance, to crude oil or copper.
Trade Balances
In the MFA method, the PTB is the mostwidely used indicator to analyze biophysical as-pects of international trade. One calculates thePTB as the inverse of the monetary trade balance(MTB)—that is, by subtracting exports from im-ports. In the PTB, we only included direct flows(i.e., direct weight of imports and exports). Asummary of the data referring to internationaltrade is presented in tables 3 and 4.
The PTB of the four countries was in deficitin 1980, and more goods were exported than im-ported. As a consequence of the liberalizationpolicies and the opening of the domestic econ-omy, the four countries became increasingly in-tegrated in international trade between 1980 and2000. In particular, imports per capita increasedmore than exports in Peru, Chile, and Mexico,whereas in Ecuador an opposite trend could beobserved.
In the EU-15, imports per capita are almostthree times higher than exports in terms ofweight. European imports per capita were already
710 Journal of Industrial Ecology

R E S E A R C H A N D A N A LYS I S
Table 4 Physical and monetary trade per capita, 2000
Trade balancesImports Exports
PTB (imports− MTB (exports−Country (tonnes) ($a) (tonnes) ($a) exports; tonnes) imports; US$)
Ecuador 0.3 280 1.6 392 −1.3 112Peru 0.5 286 0.5 265 0 −21Chile 1.7 1,078 1.8 1,182 −0.1 104Mexico 2.6 1,780 1.6 1,696 1 −84EU-15 3.8b 2,514c 1.1b 2,297c 2.7 −218
Note: PTB = physical trade balance; MTB = monetary trade balance.aSource was UN 2007.bSource was Eurostat 2002.cSource was Eurostat 2007.
4 to 16 times higher than those of the fouranalyzed countries in 1980, and the gap becamemore pronounced in the following years, leadingto an increasingly positive PTB in the EU-15.In other words, the EU is a net importer and re-lies on resources from other parts of the world.
Figure 3 shows a detailed picture of PTB in ab-solute terms, disaggregated in the four macrocat-
Figure 3 Physical trade balance (PTB) in a) Chile, b) Ecuador, c) Mexico, and d) Peru, 1980–2000 MT(million tonnes). Bars below the x-axis indicate a physical deficit (physical imports < physical exports); thoseabove indicate a physical surplus (physical imports > physical exports). Source: Authors’ own calculations,with data from Giljum 2004; Vallejo 2006; Silva-Macher, 2007; Gonzalez-Martınez and Schandl 2008.
egories: biomass, minerals, fossil fuels, and otherindustrial products. The PTBs of Chile, Peru, andEcuador were negative for most of the analyzedyears. In Chile and Peru, however, imports grewfaster than exports, and the PTB became morebalanced from 1994 on, although it remainednegative for most of the period. In contrast, inEcuador, exports grew faster than imports, leading
Russi et al., Material Flows in Latin America 711

R E S E A R C H A N D A N A LYS I S
to an increasingly negative PTB. The increasein imports was particularly dramatic in Mexico,resulting in a positive PTB in the last decade(with the exception of the years between 1994and 1996, when a severe economic crisis abruptlyreduced the imports).
Chile was a significant net exporter of miner-als and biomass at the beginning of the analyzedperiod. Even though the government carried outa policy of export diversification, in 2000 exportswere still largely dominated by copper and othermining products (52% in terms of weight). An-other 37% of Chilean trade in terms of weightwas made up of biomass and biomass products (seefigure 3a). In addition, a dramatic increase in netfossil fuel imports could be observed in particularin the 1990s, driven by rapid economic growth.As a consequence, fossil fuels were the most im-portant import category in terms of weight (70%in 2000). Consequently, a reduction of the phys-ical deficit could be observed from 1994 on, evenleading to a positive PTB in 1998 and 1999. Thispicture, however, changes if the indirect mate-rial flows associated with imports and exports arealso considered. Some studies of Chile’s externaltrade (Giljum 2004; Munoz and Hubacek 2008)illustrate that, in particular, the production ofconcentrated metals requires huge amounts ofprimary materials and processing energy. As aresult, waste and emissions related to the pro-duction of exports remain in Chile, whereas therefined products are exported.
Peru was a net exporter of minerals and a netimporter of biomass during the whole analyzedperiod (see figure 3d). At the beginning of the1990s, Peru turned from a net oil exporter intoa net oil importer. In 2000, in terms of weight,exports consisted of 55% minerals and ores (27%of which were iron ores and concentrates), 18%fossil fuels, and 27% biomass (mainly feedstuff).In the same year, imports were mainly composedof fossil fuels (49%) and biomass (33%; mainlywheat and flour). Like in Chile, a reduction ofthe physical deficit could be observed from 1994on. In fact, between 1980 and 2000 Peruvian im-ports dramatically increased, from 3.0 to 12.2 mil-lion tonnes, but exports grew modestly, from 10.0to 13.5 million tonnes. The physical deficit ofPeru will increase again, however, as soon asthe Camisea gas project (with reserves of about
390 million tonnes of oil equivalent [TOE]) iscompleted.
Ecuador showed a high and increasing mate-rial deficit due to the booming export of crude oil(see figure 3b). The country was also a net biomassexporter for the entire period. In 2000, fossil fuelproducts accounted for 60% of total exports interms of weight. Agricultural and fishery prod-ucts accounted for 24%, whereas imports weredominated by industrial products (64%). Ecuadoris by far the smallest among the four analyzedcountries, in terms of both territory and popu-lation (see table 1), but its physical deficit wasthe highest. The reason for this can be foundin the country’s low economic growth, which isconnected to low imports, whereas exports in-creased considerably in terms of weight due to thespecialization in raw materials (oil and biomassproducts).
Mexico was a net exporter of fossil fuels and anet importer of biomass and metallic final prod-ucts (see figure 3c). In 2000, 58% of its exportsin weight were represented by crude oil; 16%by non-metallic materials, including construc-tion materials; and 10% by biomass. Regardingimports, 12% were fossil fuels, mainly refined oiland basic petrochemical products. Imports weredominated by finished products (56% of totalimports), including the assembly parts for themaquila industry.5
Although the maquila industry started at theend of the 1960s, it did not become a mass phe-nomenon until the 1990s, gaining relevance inthe Mexican economy (Carrillo and De la O2003). The components that cross Mexican bor-ders to be assembled in the maquila industries areaccounted for as inputs and were decisive in theremarkable increase in Mexican imports. The as-sembly industry, however, has not had a spillovereffect on the rest of the economy, as it uses acheap labor force and there is a delinking fromthe domestic suppliers, as most of the assemblyinputs are imported (Moreno-Brid et al. 2005).
The Mexican economy is different from thatof the other three countries insofar as the depen-dence on exports of raw materials in the MTBdecreased in the analyzed period (even thoughexports of raw materials increased in absolutevalues). Consequently, from 1992 to 2000, theMexican PTB was positive. This can be explained
712 Journal of Industrial Ecology

R E S E A R C H A N D A N A LYS I S
by the “hybrid” nature of Mexico, whose patternof development places it between that of a typicalLatin American economy (characterized by lowGDP and an abundance of natural resources)6
and that of industrialized countries (based onstrong industrial and service sectors and a highdependence on imports for mineral ores, fossilfuels, and other primary materials).
There has been a long discussion in LatinAmerica about the negative consequences ofexports of raw materials for economic growth.This discussion is very much present in popularawareness (Galeano 1971). Sachs and Warner(2001) introduced the idea of the “curse of nat-ural resources”—that is, the fact that abundanceof natural resources is often negatively correlatedwith economic growth.
Much before the proposal of the resourcecurse, there had been debates on the relation-ship between natural resource exports and eco-nomic development. At one extreme, along thelines of Sachs and Warner’s (2001) theory, therewas the “enclave economy” view, of which Peruof the “guano age” (1840–1880) provided an ex-ample, according to Levin (1960). The idea wasthat there were no linkages between the exportsector and the national economy: The countrycame out of the period of guano exports with amuch depleted resource, having lost a war withChile over the nitrates of Tarapaca, and moreindebted than ever (Martinez-Alier 2002). Atthe other extreme, the optimistic conclusionsdrawn from Harold Innis’s (1930, 1949; Alt-man 2003) analysis of exports from Canada havegiven rise to a so-called “staple theory of growth.”In this view, exports of resource-rich economiescould lead to growth and economic develop-ment. Examples of this type of developmentare Canada, Australia, and Argentina (until themid-1920s).
Sachs and Warner’s (2001) thesis holds truefor Ecuador for the whole period analyzed andfor Peru in the 1980s, but it does not providean appropriate analysis for Chile and Mexico.The economy of Chile could instead be regardedas a successful example of Innis’s (1930, 1949)staple theory of growth, at least as long as cop-per reserves of good quality can be exploited andcopper prices on world markets remain high.
Domestic Material Consumption (DMC)and Resource Intensity
DMC provides information about the quan-tity of materials that remain within the nationalterritory. One calculates DMC by subtracting di-rect physical exports from DMI. Given that thematerials accumulated will turn into emissionsand waste at some point in the future, DMC hasrecently been proposed as an indicator of poten-tial waste (Weisz et al. 2006). DMC reflects thesize of the industrial production (intermediaryconsumption) and final domestic consumption.
DMC per capita in the four countries in-creased between 1980 and 2000 (see table 2). Inparticular, Chile had the highest DMC per capitain 1980 (15.5 tonnes), close to the EU-15 averageby then. By 2000, the DMC of Chile increased bya factor of 3. By contrast, Ecuador had the low-est DMC in 1980 (6.1 tonnes), and by 2000 theDMC had even decreased to 5.6 tonnes, whichmight be related to a decrease in material stan-dards of living. When the four countries are com-pared to a global average of resource consump-tion in 1999 of 8.5 tonnes per capita (Schandland Eisenmenger 2006), only Ecuador is belowthe average, because of a low level of economicdevelopment, whereas the other Latin Americaneconomies show much higher levels.
DMC per capita can give a misleading indi-cation of an average material standard of living,particularly in economies based on mineral ex-traction, such as those of Chile and Peru. Infact, in these economies an important share ofDMC ends up as waste in the mineral industry.For instance, in Chile, where copper representsa large share of domestic extraction, copper ismined at a very low extraction grade, around 1%,whereas the highly concentrated copper metal isexported. Therefore, large quantities of ancillarycopper mineral (gangue), the part of the used ex-traction that ends up as waste along the concen-tration process, remains within Chile’s borders.By definition, it is part of Chile’s DMC, but isonly “consumed” by the Chilean mineral indus-try. Giljum (2004) showed that if the quantityof ancillary copper minerals is subtracted fromDMC, the remaining material consumption ac-tually grew at a very slow rate.
Russi et al., Material Flows in Latin America 713

R E S E A R C H A N D A N A LYS I S
Figure 4 Resource intensity in Chile, Ecuador, Mexico, and Peru, 1980–2000 (kilograms domestic materialconsumption per U.S. dollar gross domestic product as of 2000). Source: Authors’ own calculations, with datafrom Giljum 2004; Vallejo 2006; Silva-Macher 2007; WB 2007; Gonzalez-Martınez and Schandl 2008.
We relate DMC to GDP to assess thematerial intensity of an economy. In LatinAmerica, two different trends can be observed(see figure 4). Economies based on mineral ex-traction use a great amount of material per unit ofGDP. For instance, Chile in 2000 required 9 kilo-grams domestic material consumption (kg)7 ofmatter to produce $1 of GDP, and Peru requirednearly 8 kg. By contrast, the material intensi-ties of Ecuador and Mexico were lower, althoughat different levels. Mexico shows the most fa-vorable resource intensity of the four countries,with 2 kg of materials used per U.S. dollar pro-duced. Ecuador used twice as much material perU.S. dollar. The Mexican economy is the mostmaterial-efficient among the four analyzed coun-tries. Nevertheless, the four countries are by farabove the EU-15 material-intensity level, whichwas 1.2 kg per dollar in 1980 and improved to0.8 kg per dollar in 2000.
Although resource intensity has been stable inMexico and Ecuador, Chile and Peru were char-acterized by a re-materialization process, and bothcountries showed an upward trend in their ma-terial intensity curves, indicating an undesirabledevelopment whereby less GDP is generated butmore materials are used. Peru, in particular, in-creased its material intensity significantly and was
catching up with Chile in the 1990s. This trend isexplained by the extension of material-intensivemining activities. Also in the case of Peru, oncethe metal ores are excluded from DMC, per capitafigures remain almost constant over the period(3 tonnes in 1980, and 3.2 tonnes in 2000).
In Mexico, despite structural change and theincreasing importance of industrial products, ma-terial intensity did not decrease in the period from1980 to 2000. This may be due to the fact thatonly some specific sectors, such as the electronicand the automotive industries, went through aprocess of technological change, whereas therest of the economy did not reduce its materialintensity.8
Material Intensities of Importsand Exports
A physical trade analysis reveals that the fourcountries were net exporters of materials duringmost of the period. This is not directly reflected inthe monetary terms of trade. Chilean MTB (ex-ports minus imports) was positive until 1992 andfluctuated thereafter, mainly due to price changeson raw material markets and increasing expendi-tures on fossil fuel imports. Ecuadorian MTB waspositive during most of the analyzed period due
714 Journal of Industrial Ecology
R E S E A R C H A N D A N A LYS I S
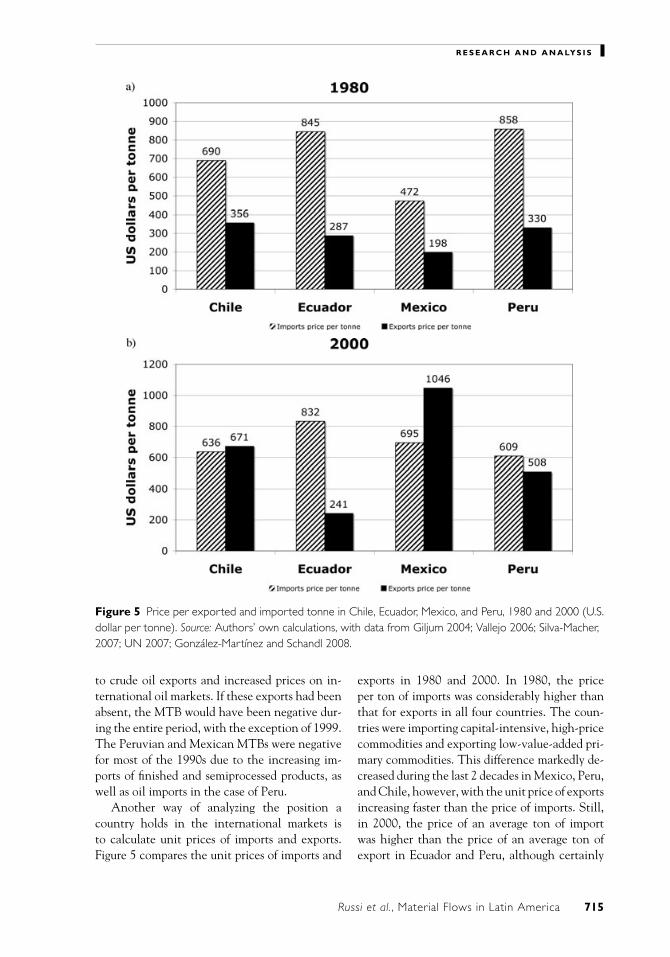
Figure 5 Price per exported and imported tonne in Chile, Ecuador, Mexico, and Peru, 1980 and 2000 (U.S.dollar per tonne). Source: Authors’ own calculations, with data from Giljum 2004; Vallejo 2006; Silva-Macher,2007; UN 2007; Gonzalez-Martınez and Schandl 2008.
to crude oil exports and increased prices on in-ternational oil markets. If these exports had beenabsent, the MTB would have been negative dur-ing the entire period, with the exception of 1999.The Peruvian and Mexican MTBs were negativefor most of the 1990s due to the increasing im-ports of finished and semiprocessed products, aswell as oil imports in the case of Peru.
Another way of analyzing the position acountry holds in the international markets isto calculate unit prices of imports and exports.Figure 5 compares the unit prices of imports and
exports in 1980 and 2000. In 1980, the priceper ton of imports was considerably higher thanthat for exports in all four countries. The coun-tries were importing capital-intensive, high-pricecommodities and exporting low-value-added pri-mary commodities. This difference markedly de-creased during the last 2 decades in Mexico, Peru,and Chile, however, with the unit price of exportsincreasing faster than the price of imports. Still,in 2000, the price of an average ton of importwas higher than the price of an average ton ofexport in Ecuador and Peru, although certainly
Russi et al., Material Flows in Latin America 715

R E S E A R C H A N D A N A LYS I S
not in Mexico. The case of Mexico is particularlyremarkable, with the unit price of exports increas-ing from $198/tonne to $1,046/tonne. The mainreasons for such a tremendous increase are struc-tural changes and the diversification of exports,which significantly increased the share of indus-trial products in total exports (from 4% to 59% inmonetary terms). The assembly industry played akey role in this process. In fact, in 2000, accordingto foreign trade statistics (Bancomext 2002), themaquila share of exports was 47.7% of the totalMexican exports and 35.3% of the total Mexicanimports in monetary terms, the latter includingraw materials and semimanufactured products forfurther processing and assembly.
It is interesting to compare these Latin Ameri-can data with European trends, wherein a reversesituation can be observed. In 2000, the EU-15imported 3.4 times more materials than it ex-ported, whereas the MTB was approximately bal-anced (Eurostat 2002). Also, the average price(US$1,559) for an imported tonne in 2000 wasabout one third of the price (US$5,306) for anexported tonne, both numbers being significantlyhigher than those for Latin America. This reflectsthe position of this industrialized region in theupper value-added segment of the world market.
For Latin American countries, the relativeprices of the commodities exchanged on interna-tional markets determine that the contribution ofraw materials to the generation of added value isremarkably lower than their share in weight. Thecommon pattern is that primary activities, suchas agriculture, forestry, and mining, extract largeamounts of materials to obtain little added value.The mining sector’s share of GDP in Chile is 8%(Banco Central de Chile 2007), and in Peru it wasonly 4.5% in 2000 (Ministry of Economics and Fi-nance of Peru 2007.) In Mexico, the importanceof resource-extraction-based activities in the pro-duction of added value is very small: The share ofthe whole oil sector (comprising oil extraction,refining, and basic petrochemical) of the nationalGDP was only 1.3% in 2000 (INEGI 2007). InEcuador, the biomass-related activities (agricul-ture, fishing, forestry) accounted for 10% of GDPon average. Banana production alone accountedfor a comparatively large 2% of GDP. Fossil fu-els, a strategic material flow in the Ecuadorianeconomy, provided only 13% of added value.
Discussion and Conclusions
We have compared trends in natural resourceuse in four Latin American countries—Chile,Ecuador, Mexico, and Peru—between 1980 and2000 to explore whether these economies fol-low a uniform pattern in natural resource extrac-tion, trade, and consumption. By comparing theeconomies in terms of material flows, we havebeen able to identify characteristic structures andtrends. In the analyzed period, domestic materialextraction increased constantly in the four coun-tries. The important role of the mining sector inthe economies of Chile and Peru and the role ofagriculture and crude oil extraction in Ecuadorappears very clearly in the physical accounts.Similarly, although Mexico is an important oilexporter, MFA reveals the very relevant role ofconstruction materials caused by infrastructureprojects and an increase in material standards ofliving reflected in construction activities.
MFA indicators shed light on the discus-sion of the “deterioration of terms of trade,”a phrase coined by the Argentinean economistRaul Prebisch (1952). His idea was that a unitof exports allows peripheral (extractive) coun-tries to purchase lower and lower amounts of im-ports, which leads to a vicious circle requiringincreased amounts of commodity exports. Thisphenomenon may apply to some Latin Ameri-can countries (see, e.g., Perez-Rincon 2006 for arecent study on Colombia). Many Latin Ameri-can countries, with their comparably low popula-tion densities and rich natural resources, seem tobe among the regions that provide resources buteconomically gain comparably little by doing so(Bunker 1985; Eisenmenger et al. 2007).
These theories hold for Ecuador, with its mainfocus on crude oil and agricultural products. InChile, Mexico, and Peru, they only held in the1980s, when the price per imported tonne wasmuch higher than the price per exported tonne.In 2000, however, this pattern changed in thesecountries due to a diversification of exports anda subsequent reduction of the difference betweenthe price per tonne of imports and exports.
The increase in material flows has an effect notonly on the environment but also on the socialsituation, as a cause of environmental conflicts, asexplained above. Also, the increase in extraction
716 Journal of Industrial Ecology

R E S E A R C H A N D A N A LYS I S
and exports of raw materials does not necessarilycreate economic growth. This may sometimes bethe case, as in Chile, but in some other instancesthis equation does not apply. As a matter of fact,the economy of Ecuador did not grow between1980 and 2000, despite the high and increasingexports of oil and biomass.
In the case of Chile, Mexico, and even Peru,there was a diversification of exports away frombulk commodities, which increased the addedvalue (and the price) per ton of exported prod-uct. This change can be regarded as positive froma development point of view, as more addedvalue is created within the domestic economy,which should create employment opportunitiesand contribute to local household income. Theenvironmental implications, however, largely de-pend on the applied production technologies andthe environmental regulations in place. If prod-ucts are produced with high environmental stan-dards, then such a development path could beboth economically and environmentally reward-ing. Diversification of exports can also be prob-lematic, however, when one considers, for ex-ample, the pollution and health hazards derivingfrom the maquila industry in Mexico (Stromberg2005).
One main and obvious conclusion of our anal-ysis is that relative dematerialization (decreaseof the relation between use of materials andGDP) certainly did not occur during the periodof study. Further research is needed to investi-gate to what extent the relocation of resource-intensive production outside the borders of in-dustrialized countries is at the root of the relativedematerialization process taking place in manyEuropean countries (Adriaanse et al. 1997; Weiszet al. 2006), as claimed, for example, by Roth-man (1998). From this point of view, a carefuland comprehensive analysis of the indirect flowsassociated with imports and exports is required ifwe are to attribute to the final consumers all nat-ural resources required in the entire productionchain (Weisz 2007).
Acknowledgments
This research was partly financed by thefollowing projects: Metabolismo Social: Ten-dencias, Conflictos y Respuestas (Grant SEJ2006-15219/ECON) and UHE: Institucions
Economiques, Nivells de Vida i Medi Ambi-ent (Grant 2005SGR-00571). We are grateful toHelga Weisz and Heinz Schandl for their usefulsuggestions and comments.
Notes
1. EU-15 refers to the 15 European countries thatconstituted the European Union before the enlarge-ment in 2004: Austria, Belgium, Denmark, Finland,France, Germany, Greece, Ireland, Italy, Luxem-bourg, the Netherlands, Portugal, Spain, Sweden,and the United Kingdom.
2. Schematically, the EU-15 is a sample of northerncountries, whereas Chile, Ecuador, Mexico, andPeru belong to the southern group of countries.
3. One tonne (t) = 103 kilograms (kg, SI) ≈ 1.102short tons.
4. The high share of minerals in DMI can be explainedby the very low extraction ore grades for copper, aswe discuss later.
5. Maquila is a medieval Spanish word that indicatesthe practice of bringing grain to a miller and payinghim with part of the obtained flour (the “miller’sportion,” or maquila). Nowadays, this term is used torefer to the practice of subcontracting to produceor put together parts that will be used in otherproduction processes.
6. Mexico, despite its economic fluctuations, hasreached a certain level of industrialization and iscurrently considered an advanced middle-incomedeveloping country.
7. One kilogram (kg, SI) ≈ 2.204 pounds (lb).8. For a complete picture of the overall material in-
tensity of an economy, however, the unused mate-rial flows should be measured and included in theanalysis.
References
Adriaanse, A., S. Brigenzu, A. Hammond, Y.Moriguchi, E. Rodenburg, D. Rogich, and H.Schutz. 1997. Resource flows: The material basisof industrial economies. Washington, DC: WorldResource Institute.
Altman, M. 2003. Staple theory and export-led growth:Constructing differential growth. Australian Eco-nomic History Review 43(3): 230–255.
Amann, C., W. Bruckner, M. Fischer-Kowalski, andC. Grunbuhel. 2002. Material flow accounting inAmazonia: A tool for sustainable development. So-cial Ecology Working Paper 63, IFF. Vienna,Austria.
Russi et al., Material Flows in Latin America 717

R E S E A R C H A N D A N A LYS I S
Banco Central de Chile [Central Bank of Chile].2007. Statistical database. http://si2.bcentral.cl/Basededatoseconomicos/951_portada.asp?idioma=I. Accessed April 2007.
BANCOMEXT (Banco Mexicano de Comercio Exte-rior [Mexican Bank for Foreign Trade]). 2002.World trade atlas. Tlalpan, Mexico: Banco deComercio Exterior.
Behrens, A., S. Giljum, J. Kovanda, and S. Niza. 2007.The material basis of the global economy: World-wide patterns in natural resource extraction andtheir implications for sustainable resource usepolicies. Ecological Economics 64(2): 444–453.
Bunker, S. 1985. Underdeveloping the Amazon: Extrac-tion, unequal exchange, and the failure of the modernstate. Urbana: University of Illinois Press.
Carrillo, J. and M. De la O. 2003. Las dimensionesdel trabajo en la industria maquiladora de ex-portacion en Mexico [The dimensions of laborin the maquila export industry in Mexico]. InSituacion del trabajo en Mexico [The state of la-bor in Mexico], edited by E. De la Garza and C.Salas. Mexico City, Mexico: Plaza y Valdes-IET.
Cleveland, C. J. and M. Ruth. 1998. Indicators of de-materialization and the materials intensity of use.Journal of Industrial Ecology 2(3): 15–50.
Dıaz, J., J. Saavedra, and M. Torero. 2000. Liberal-izacion de la balanza de pagos: Efectos sobre elcrecimiento, la desigualdad y la pobreza: El casode Peru [Liberalization of the payments balance:Effects on growth, inequality and poverty: Thecase of Peru]. In Liberalizacion, desigualdad y po-breza: America Latina y el Caribe en los 90 [Liber-alization, inequality and poverty: Latin Americaand the Caribbean in the 90s], edited by E. Ganuzaet al. Buenos Aires, Argentina: PNUD—EditorialUniversitaria de Buenos Aires.
Dussel, E. 2002. Mexico en la globalizacion y la aper-tura comercial [Mexico in globalization and theopening of trade]. In Polıtica economica para el de-sarrollo sostenido con equidad: Tomo II [Economicpolicy for sustainable development with equity: Vol-ume II], edited by J. L. Calva. Mexico City, Mex-ico: Casa Juan Pablos/Universidad Autonoma deMexico.
Eisenmenger, N. and S. Giljum. 2006. Evidence fromsocietal metabolism studies for ecologically un-equal trade. In The world system and the earth sys-tem. Global socio-environmental change and sustain-ability since the neolithic, edited by A. Hornbergand C.L. Crumley. Walnut Creek, CA: Left CoastPress Inc.
Eisenmenger, N., J. Ramos Martin, and H. Schandl.2007. Transition in a contemporary context: Pat-
terns of development in a globalizing world. InSocioecological transitions and global change: Tra-jectories of social metabolism and land use, edited byM. Fischer-Kowalski and H. Haberl. Cheltenham,UK: Edward Elgar.
EUROSTAT. 2001. Economy-wide material flow ac-counts and derived indicators: A methodological guide.Luxembourg: Office for Official Publications ofthe European Communities.
EUROSTAT. 2002. Material use in the European Union1980–2000: Indicators and analysis. Luxembourg:Office for Official Publication of the EuropeanCommunities.
EUROSTAT. 2007. COMEXT. http://epp.eurostat.ec.europa.eu/portal/page?_pageid=2413,1,2413_47732056&_dad=portal&_schema=PORTAL.Accessed May 2007.
Fischer-Kowalski, M. 1998. Society’s metabolism: Theintellectual history of material flow analysis, PartI, 1860–1970. Journal of Industrial Ecology 2(1):61–78.
Fischer-Kowalski, M. and C. Amann. 2001. BeyondIPAT and Kuznets curves: Globalization as a vitalfactor in analyzing the environmental impact ofsocio-economic metabolism. Population and Envi-ronment 23(1): 7–47.
Fischer-Kowalski, M. and W. Huttler. 1998. Society’smetabolism: The intellectual history of materialflow analysis, Part II, 1970–1998. Journal of Indus-trial Ecology 2(4): 107–136.
Galeano, E. 1971. The open veins of Latin America: Fivecenturies of the pillage of a continent. London: LatinAmerica Bureau.
Giljum, S. 2004. Trade, material flows and economicdevelopment in the South: The example of Chile.Journal of Industrial Ecology 8(1–2): 241–261.
Gonzalez-Martınez, A. C. and H. Schandl. 2008.The biophysical perspective of a middle incomeeconomy: Material flows in Mexico. EcologicalEconomics, doi:10.1016/j.ecolecon.2008.03.013.
Herzer, D. and F. Nowak-Lehnmann. 2006. What doesexport diversification do for growth? An econo-metric analysis. Applied Economics 38(15): 1825–1838.
Hornborg, A. 2007. Introduction: Environmental his-tory as political ecology. In Rethinking environ-mental history: World system history and global en-vironmental change, edited by A. Hornborg et al.Lanham, MD: Alta Mira Press.
IEA (International Energy Agency). 2008. Energy in-dicators by country/region. www.iea.org/Textbase/stats/index.asp. Accessed July 2008.
INEGI (Instituto Nacional de Estadıstica, Geografıae Informatica [National Institute of Statistics,
718 Journal of Industrial Ecology

R E S E A R C H A N D A N A LYS I S
Geography and Information Technology). 2007.Sistema de cuentas nacionales de Mexico: Cuentasde bienes y servicios [System of national accountsof Mexico: Goods and services accounts.] http://dgcnesyp.inegi.org.mx/cgi-win/bdieintsi.exe/NIVM10#ARBOL. Accessed January 2007.
Innis, H. A. 1930. The fur trade in Canada: An intro-duction to Canadian economic history. New Haven,CT: Yale University Press
Innis, H. A. 1949. The cod fisheries: The history of aninternational economy. New Haven, CT: Yale Uni-versity Press.
Katz, J. 2000. Cambios estructurales y productividad enla industria latinoamericana, 1970–1996 [Struc-tural changes and productivity in Latin Amer-ican industry]. Revista de la CEPAL 71: 65–84.
Kuramoto, J. and M. Glave. 2002. Mineria mineralesy desarrollo sustentable en Peru [Mining, miner-als and sustainable development in Peru]. Lima,Peru: Iniciativa de Investigacion sobre PoliticasMineras (IIPM).
Levin, J. 1960. The export economies: Their pattern of de-velopment in historical perspective. Cambridge, MA:Harvard University Press.
Martinez-Alier, J. 2002. The environmentalism of thepoor: A study of ecological conflicts and valuation.Northampton, UK: Edward Elgar.
Matthews, E., C. Amann, S. Brigenzu, M. Fischer-Kowalski, W. Huttler, R. Kleijn, Y. Moriguchi,et al. 2000. The weight of nations: Material outflowsfrom industrial economies. Washington, DC: WorldResource Institute.
Ministry of Economics and Finance of Peru. 2007.Estadısticas nacionales [National statistics]www.mef.gob.pe/OFINE/estadistica_economica.php. Accessed April 2007.
Moreno-Brid, J. C., J. Santamaria, and J. C. Rivas.2005. Industrialization and economic growth inMexico after NAFTA: The road traveled.Development and Change 36(6): 1095–1119.
Morley, S. 2000. La distribucion del ingreso en AmericaLatina y el Caribe [Income distribution in LatinAmerica and the Caribbean]. Santiago, Chile:CEPAL-Fondo de Cultura Economica.
Munoz, P. and K. Hubacek. 2008. Material implicationof Chile’s economic growth: Combining materialflow accounting (MFA) and structural decompo-sition analysis (SDA). Ecological Economics 65:136–144.
Pasco-Font, A. 2000. El impacto del programa de esta-bilizacion y las reformas estructurales sobre el de-sempeno ambiental de la minerıa de cobre en el
Peru 1990–1997. [Stabilization plan and struc-tural reforms: Impacts on the environmental per-formance of the copper industry in Peru 1990–1997.] Santiago, Chile: CEPAL.
Perez-Rincon, M. 2006. Colombian international tradefrom a physical perspective: Towards an ecolog-ical “Prebisch thesis.” Ecological Economics 59:519–529.
Prebisch, R. 1952. Theoretical and practical prob-lems of economic growth. Mexico City, Mexico:CEPAL.
Rothman, D. S. 1998. Environmental Kuznets curves—Real progress or passing the buck? A case forconsumption-based approaches. Ecological Eco-nomics 25(2): 177–194.
Sachs, J. and A. Warner. 2001. The curse of natu-ral resources. European Economic Review 45(4-6):827–838.
Silva-Macher, J. C. 2007. El peso de la economıa peruana:Contabilidad de flujos de materiales en Peru 1980–2004 [The weight of the Peruvian economy: Ma-terial flow accounting in Peru 1980–2004]. Mas-ter’s thesis, Autonomous University of Barcelona,Barcelona, Spain.
Schandl, E. and N. Eisenmenger. 2006. Regional pat-terns in global resource extraction. Journal of In-dustrial Ecology 10(4): 133–147.
Stromberg, P. 2005. La industria maquiladora mexicanay el medio ambiente: Una revision de los proble-mas [The Mexican maquila industry and the en-vironment: A review of the problems]. In El medioambiente y la maquila en Mexico: Un problema ine-ludible [The environment and the maquila indus-try in Mexico: An unavoidable problem], editedby J. Carrillo and C. Schatan. Coleccion Libros dela CEPAL, No. 83. Tegucigalpa, Mexico: UnitedNations.
Taylor, L. and R. Vos, eds. 2000. Liberalizacion dela balanza de pagos en America Latina: Efec-tos sobre el crecimiento, la distribucion y la po-breza [Liberalization of payment balances in LatinAmerica: Effects on growth, distribution andpoverty]. Tegucigalpa, Honduras: UNDP.
UN (United Nations). 2007. Comtrade database.http://comtrade.un.org/db/default.aspx. AccessedApril 2007.
Vallejo, M. C. 2006. La estructura biofısica de laeconomıa ecuatoriana: El comercio exterior y losflujos ocultos del banano [The biophysical struc-ture of the Ecuadorian economy: Foreign tradeand hidden flows of the banana industry]. Quito,Ecuador: FLACSO/Abya-Yala.
Wallerstein, I. 1974. The modern world-system, Vol. 1.San Diego, CA: Academic Press.
Russi et al., Material Flows in Latin America 719

R E S E A R C H A N D A N A LYS I S
Wallerstein, I. 1980. The modern world-system, Vol.2. San Diego, CA: Academic Press.
Wallerstein, I. 1989. The modern world-system, Vol.3. San Diego, CA: Academic Press.
Weisz, H. 2007. Combining social metabolism andinput-output analyses to account for ecologicallyunequal trade. In Rethinking environmental his-tory: World system history and global environmen-tal change, edited by A. Hornborg et al. Lanham,MD: Alta Mira Press.
Weisz, H., F. Krausmann, C. Amann, N. Eisenmenger,K. H. Erb, K. Hubacek, and M. Fischer Kowal-ski. 2006. The physical economy of the EuropeanUnion: Cross-country comparison and determi-nants of material consumption. Ecological Eco-nomics 58: 676–698.
WB (World Bank). 2007. World development indi-cators. www.worldbank.org/data. Accessed April2007.
About the Authors
Daniela Russi received her Ph.D. in 2007 atthe Autonomous University of Barcelona, Spain,and is now working as an environmental con-sultant at Amphos 21, Valldoreix (Barcelona),Spain. Ana Citlalic Gonzalez-Martinez obtainedher Ph.D. in Environmental Sciences in 2008 atthe Autonomous University of Barcelona, Spain.Jose Carlos Silva-Macher is a doctoral candidateat the Autonomous University of Barcelona. Ste-fan Giljum is a researcher at the Sustainable Eu-rope Research Institute, Vienna, Austria. JoanMartınez-Alier is a senior professor at the Au-tonomous University of Barcelona, and MariaCristina Vallejo is an associated researcher atthe Latin American Faculty of Social Sciences(FLACSO), Quito, Ecuador.
720 Journal of Industrial Ecology