Privatization in Latin America - Open Knowledge Repository
530
Privatization in Latin America MYTHS AND REALITY Edited by Alberto Chong Florencio López-de-Silanes STANFORD UNIVERSITY PRESS INTER-AMERICAN DEVELOPMENT BANK 34428 Public Disclosure Authorized Public Disclosure Authorized Public Disclosure Authorized ublic Disclosure Authorized
-
Upload
khangminh22 -
Category
Documents
-
view
0 -
download
0
Transcript of Privatization in Latin America - Open Knowledge Repository

Privatization
in Latin AmericaMYTHS AND REALITY
Edited by
Alberto Chong
Florencio López-de-Silanes
STANFORD UNIVERSITY PRESS
INTER-AMERICAN
DEVELOPMENT BANK
34428
Pub
lic D
iscl
osur
e A
utho
rized
Pub
lic D
iscl
osur
e A
utho
rized
Pub
lic D
iscl
osur
e A
utho
rized
Pub
lic D
iscl
osur
e A
utho
rized


Privatizationin Latin America


Privatizationin Latin AmericaMYTHS AND REALITY
Edited by
Alberto ChongFlorencio López-de-Silanes
A COPUBLICATION OF STANFORD ECONOMICS AND FINANCE,
AN IMPRINT OF STANFORD UNIVERSITY PRESS, AND THE WORLD BANK

© 2005 The International Bank for Reconstruction and Development / The World Bank1818 H Street, NWWashington, DC 20433Telephone: 202-473-1000Internet: www.worldbank.orgE-mail: [email protected]
All rights reserved.1 2 3 4 08 07 06 05
A copublication of Stanford Economics and Finance, an imprint of Stanford UniversityPress, and the World Bank.
Stanford University Press The World Bank1450 Page Mill Road 1818 H Street, NWPalo Alto, CA 94304 Washington, DC 20433
The findings, interpretations, and conclusions expressed herein are those of theauthor(s) and do not necessarily reflect the views of the Board of Executive Directors ofthe World Bank or the governments they represent.
The World Bank does not guarantee the accuracy of the data included in this work.The boundaries, colors, denominations, and other information shown on any map inthis work do not imply any judgment on the part of the World Bank concerning the le-gal status of any territory or the endorsement or acceptance of such boundaries.
Rights and PermissionsThe material in this work is copyrighted. Copying and/or transmitting portions or all
of this work without permission may be a violation of applicable law. The World Bankencourages dissemination of its work and will normally grant permission promptly.
For permission to photocopy or reprint any part of this work, please send a requestwith complete information to the Copyright Clearance Center, Inc., 222 RosewoodDrive, Danvers, MA 01923, USA, telephone 978-750-8400, fax 978-750-4470,www.copyright.com.
All other queries on rights and licenses, including subsidiary rights, should beaddressed to the Office of the Publisher, World Bank, 1818 H Street, NW, Washington,DC 20433, USA, fax 202-522-2422, e-mail [email protected].
ISBN 0-8213-5882-0 (World Rights except North America)ISBN (soft cover) 0-8047-5242-7 (North America)ISBN (hard cover) 0-8047-5241-9 (North America)
Library of Congress Cataloging-in-Publication Data
Privatization in Latin America : myths and reality / Alberto Chong, Florencio López-de-Silanes [editors].
p. cm.—(Latin American development forum)Includes bibliographical references and index.ISBN 0-8213-5882-0
1. Privatization—Latin America. I. Chong, Alberto. II. López-de-Silanes,Florencio. III. Latin American development forum.
HD4010.5.P754 2005338.98’05—dc22
2004062831

Latin American Development Forum Series
This series was created in 2003 to promote debate, disseminate informa-tion and analysis, and convey the excitement and complexity of the mosttopical issues in economic and social development in Latin America andthe Caribbean. It is sponsored by the Inter-American Development Bank,the United Nations Economic Commission for Latin America and theCaribbean, and the World Bank. The manuscripts chosen for publicationrepresent the highest quality in each institution’s research and activity out-put and have been selected for their relevance to the academic community,policymakers, researchers, and interested readers.
Advisory Committee Members
Inés Bustillo, Director, Washington Office, Economic Commission forLatin America and the Caribbean, United Nations
Guillermo Calvo, Chief Economist, Inter-American Development BankJosé Luis Guasch, Regional Adviser, Latin America and the Caribbean
Region, World BankStephen Haber, A. A. and Jeanne Welch Milligan Professor, Department
of Political Science, Stanford University; Peter and Helen Bing SeniorFellow, the Hoover Institution
Eduardo Lora, Principal Adviser, Research Department, Inter-AmericanDevelopment Bank
José Luis Machinea, Executive Secretary, Economic Commission for LatinAmerica and the Caribbean, United Nations
Guillermo E. Perry, Chief Economist, Latin America and the CaribbeanRegion, World Bank
Luis Servén, Lead Economist, Latin America and the Caribbean Region,World Bank


About the Contributors
Francisco Anuatti-Neto is a professor in the Department of Economics atthe Universidade de São Paulo and FIPE (Fundação Instituto de PesquisasEconômicas), Brazil.
Milton Barossi-Filho is a professor in the Department of Economics at theUniversidade de São Paulo and FIPE (Fundação Instituto de PesquisasEconômicas), Brazil.
Katherina Capra is a researcher at the Unidad de Análisis de PolíticasSociales y Económicas (UDAPE), La Paz, Bolivia.
Alberto Chong is a senior research economist in the Research Departmentat the Inter-American Development Bank, Washington, D.C.
Ronald Fischer is a professor in the Department of Economics at theUniversidad de Chile, Santiago.
Sebastián Galiani is a professor in the Department of Economics at theUniversidad de San Andrés, Buenos Aires, Argentina.
Mauricio Garrón is a coordinator at the Organización Latinoamericanade Energía, Quito, Ecuador.
Paul Gertler is a professor at the Haas School of Management, Universityof California at Berkeley.
Antonio Gledson de Carvalho is a professor in the Department of Eco-nomics at the Universidade de São Paulo and FIPE (Fundação Instituto dePesquisas Econômicas), Brazil.
Rodrigo Gutiérrez is a professor in the Department of Economics at theUniversidad de Chile, Santiago.
Florencio López-de-Silanes is a professor in the School of Management atYale University and an associate with the National Bureau of EconomicResearch, Cambridge, Mass.
vii

Roberto Macedo is a professor in the Department of Economics at theUniversidade de São Paulo and FIPE (Fundação Instituto de PesquisasEconômicas), Brazil.
Carlos Machicado is a researcher and PhD student in the Latin AmericanProgram of the Universidad de Chile (Santiago)/Instituto TecnológicoAutónomo de México (Distrito Federal)/Universidad Torcuato di Tella(Buenos Aires, Argentina).
Carlos Pombo is a professor in the Department of Economics, Universidaddel Rosario, Bogotá, Colombia.
Manuel Ramírez is a professor in the Department of Economics at theUniversidad del Rosario, Bogotá, Colombia.
Ernesto Schargrodsky is a professor in the Business School at the Univer-sidad Torcuato Di Tella, Buenos Aires, Argentina.
Pablo Serra is a professor in the Department of Economics at the Univer-sidad de Chile, Santiago.
Federico Sturzenegger is dean of the Business School at the UniversidadTorcuato Di Tella, Buenos Aires, Argentina.
Máximo Torero is a senior researcher at Grupo de Análisis para el Desar-rollo (GRADE), Lima, Peru, and International Food Policy Research In-stitute, Washington, D.C.
viii ABOUT THE CONTRIBUTORS

Contents
Foreword xvii
Acknowledgments xix
1. THE TRUTH ABOUT PRIVATIZATION IN LATIN AMERICA 1Alberto Chong and Florencio López-de-Silanes
2. THE BENEFITS AND COSTS OF PRIVATIZATION IN
ARGENTINA: A MICROECONOMIC ANALYSIS 67Sebastián Galiani, Paul Gertler, Ernesto Schargrodsky,and Federico Sturzenegger
3. PRIVATIZATION AND FIRM PERFORMANCE IN BOLIVIA 117Katherina Capra, Alberto Chong, Mauricio Garrón, Florencio López-de-Silanes, and Carlos Machicado
4. COSTS AND BENEFITS OF PRIVATIZATION: EVIDENCE
FROM BRAZIL 145Francisco Anuatti-Neto, Milton Barossi-Filho,Antonio Gledson de Carvalho, and Roberto Macedo
5. THE EFFECTS OF PRIVATIZATION ON FIRMS:THE CHILEAN CASE 197
Ronald Fischer, Rodrigo Gutiérrez, and Pablo Serra
6. PRIVATIZATION IN COLOMBIA: A PLANT
PERFORMANCE ANALYSIS 275Carlos Pombo and Manuel Ramírez
ix

7. PRIVATIZATION IN MEXICO 349Alberto Chong and Florencio López-de-Silanes
8. PERUVIAN PRIVATIZATION: IMPACTS ON FIRM PERFORMANCE 407Máximo Torero
Acronyms and Abbreviations 479
Index 483
FIGURES
1.1 Economic Activity of State-Owned Enterprises, 1978–97 4
1.2 Revenues from Privatization in Latin America, 1990–2000 7
1.3 Availability of Privatization Data on Latin America 161.4 Profitability Changes after Privatization in
Latin America 201.5 Operating Efficiency Changes after Privatization in
Latin America 211.6 Percentage Changes in Employment after Privatization
in Latin America 221.7 Median Changes in Output after Privatization in
Latin America 241.8 Net-Income-to-Sales Gap between Privatized and
Private Firms before and after Privatization 251.9 Cost-per-Unit Gap between Privatized and
Private Firms before and after Privatization 261.10 Median Real and Industry-Adjusted Changes in
Wages after Privatization 301.11 Transfers from Workers as a Percentage of Increased
Profitability after Privatization 311.12 Median Changes in Profitability of Privatized Firms in
Competitive and Noncompetitive Industries in Latin America 33
1.13 Changes in Employment and Output of Privatized Firms in Competitive and Noncompetitive Industries in Latin America 35
1.14 Rehiring after Privatization, by Region 482.1 Percentage of Accumulated Income from
Privatizations, 1990–98 732.2 Logarithm of Population Connected to the Water
Network and Fitted Values, Aguas Argentinas, 1980–99 93
x CONTENTS

2.3 Displaced Workers’ Earnings Rents: 1991 and 2001 1024.1 Formal Employment before and after Privatization,
1995–99 1665A.1 Cost per Unit before and after Privatization,
Adjusted and Unadjusted 2515A.2 Investment as a Fraction of Physical Assets (PPE)
before and after Privatization, Adjusted and Unadjusted 254
5A.3 Investment as a Fraction of Sales before and after Privatization, Adjusted and Unadjusted 257
5A.4 Net Income as a Fraction of Physical Assets before and after Privatization, Adjusted and Unadjusted 260
5A.5 Operating Income as a Fraction of Physical Assets before and after Privatization, Adjusted and Unadjusted 262
5A.6 Operating Income as a Fraction of Sales before and after Privatization, Adjusted and Unadjusted 264
6.1 Markup Rates for IFI Sample and Total Manufacturing, 1970–98 298
6.2 Total Factor Productivity Indexes for IFI Sample and Total Manufacturing, 1970–98 300
6.3 Investment Rates for IFI Sample and Total Manufacturing, 1970–98 301
6.4 Labor Productivity Indexes, IFI Sample and TotalManufacturing, 1970–98 303
6.5 Thermal Capacity versus Thermal Generation, 1991–99 312
7.1 Gap between Privatized Firms and Private Firms 3587.2 The Overall Fiscal Impact of Privatization 3697.3 Total Net Debt of the Public Sector 3717.4 Deregulation Actions Taken before Privatization 3817.5 Mexican Banks’ Profitability Indicators before and
after Privatization 3837.6 Mexican Banks’ Performance Indicators before and
after Privatization 3847.7 Terms of Related and Unrelated Loans 3877.8 Default and Recovery Rates: Related and
Unrelated Loans 3887.9 Market Capitalization as Percentage of GDP
and Number of Companies Listed in the Mexican Stock Exchange 390
8.1 Evolution of the Privatization Process, 1991–2000 4148.2 Privatization Revenues by Sector, 1991–99 415
CONTENTS xi

8.3 Privatization Process Progress, 1991–2000 4168.4 Public Approval of Privatization, 1991–2000 4178.5 Evolution of Performance Indicators 428
TABLES
1.1 Proceeds from Privatization in Developing Countries,1990–99 5
1.2 Recent Studies on Firm Performance after Privatizationin Latin America 9
1.3 Reasons for Firm Exclusion from the Privatization Sample 18
1.4 Labor Restructuring before Privatization, by Region 441.5 Labor Restructuring and Privatization Prices in
Latin America 451.6 New Hires and Rehires in Privatized Firms in
Latin America 502.1 Privatization Revenues in Argentina, by Sector 722.2 Nonfinancial Companies Included in the Database 752.3 Nonfinancial Privatizations in Argentina Not
Included in the Database 772.4 Privatized Banks in Argentina Included in
the Database 792.5 Changes in Profitability for the Sample of
Nonfinancial Privatized Firms 822.6 Changes in Performance for the Sample of
Nonfinancial Privatized Firms 832.7 Changes in Profitability for the Sample of
Privatized Banks 882.8 Changes in Performance for Privatized Public Banks 892.9 Access to Water and Sewerage Services, 1991 922.10 Difference in Difference of the Proportion of
Households with Access to Water Connection, 1991–97 94
2.11 The Effect of Privatization on Child Mortality Rates,1990–99 96
2.12 The Effect of Privatization on Displaced Workers’ Earnings Flows 101
2B.1 Description of the Variables Used to Evaluate the Impact of Privatization on the Performanceof Nonfinancial Firms 109
2B.2 Description of the Variables Used to Evaluate the Impact of Privatization on the Performance of Financial Firms 111
xii CONTENTS

3.1 Common Objectives for Privatizations 1193.2 Reasons for Excluding Firms from the Sample 1293.3 Changes in Performance of the Sample of Privatized
Firms on Bolivia 1313.4 Industry-Adjusted Changes in Performance for the
Sample of Privatized Firms 1353A.1 List of Privatized Firms, 1992–2001 1373A.2 Description of the Variables Used in Tables 3.3
and 3.4 1394.1 Description of the Privatization Program and
Coverage of the Sample, 1991–2000 1504.2 Privatized Brazilian Companies by Industry
Classification 1524.3 Summary of Results 1534.4 Changes in Performance: GMM-IV Panel Data
Analysis 1594.5 Employment in Selected Industries, by Public
or Private Ownership, 1995–99 1644A.1 Federal State Enterprises Privatized, 1991–2000 1754A.2 Companies Privatized by BNDES on Behalf of
Brazilian States, Minority Shares Privatized by Federal Government, and São Paulo State Privatization Program 180
4A.3 Remaining State-Owned Enterprises 1824B.1 Description of the Variables 1844C.1 Change in Performance: Tests of Means and
Medians (Two Years before Privatization versus Two Years after, without Adjustment) 186
4C.2 Change in Performance: Tests of Means and Medians (Two Years before Privatization versus Two Years after, with Adjustment) 188
4C.3 Change in Performance: Tests of Means and Medians (All Years before and after Privatization, without Adjustment) 189
4C.4 Change in Performance: Tests of Means and Medians (All Years before and after Privatization, with Adjustment) 191
4D.1 Definition of the Control Variables Included in the Vector of the Econometric Model 192
5.1 Nationalization and Privatization of Firms in Chile,1970–2001 199
5.2 State-Owned and State-Seized Firms, 1970–2001 2045.3 Number of State-Owned Firms, by Year, 1973–2001 205
CONTENTS xiii

5.4 Privatized State-Owned Enterprises, 1972–2001 2075.5 Revenues from Privatization of Chilean Public
Enterprises, 1985–89 2105.6 Net Income to Equity for Privatized Firms before
Privatization, 1970–86 2165.7 Employment Changes in Privatized Firms, 1970–92 2205.8 Privatization of Chilean Telecommunications Firms,
1984–89 2215.9 Privatization of Electric Power Firms, 1984–89 2225.10 ENDESA: Investment, Power Generation, and
Labor Productivity 2285.11 Chilectra: Sales, Employees, Labor Productivity,
and Energy Loss 2295.12 Change in Node Prices and Residential Rates 2295.13 Profits of the Main Electric Sector Companies:
1987–2000 2315.14 Telecommunications Statistics, 1987–2000 2325.15 Telefónica-CTC: Basic Fixed Phone Statistics 2335.16 Cost of Local Monthly Telephone Service for the
Average Family 2345.17 Profits of Telecommunications Enterprises,
1987–2000 2355.18 Concessions in Operation 2395.19 Valparaíso: Time Spent Loading and Unloading
and Transfer Speed 2465A.1 Changes in Profitability of Privatized Firms 2495A.2 Changes in Operating Efficiency of Privatized Firms 2525A.3 Changes in Investment and Assets in Privatized Firms 2555A.4 Changes in Profitability of Privatized Firms, Adjusted 2585A.5 Changes in Operating Efficiency of Privatized Firms,
Adjusted 2615A.6 Changes in Investment and Assets in Privatized Firms,
Adjusted 2635A.7 Employment in Privatized Firms 2655A.8 Physical Productivity before and after Privatization 2665A.9 Concession Projects under Construction 2685A.10 Projects in Concession Process 2696.1 Privatization Program in the Real Sector in Colombia,
1986–98 2796.2 IFI Privatization Program, 1986–97 2816.3 ECOPETROL Privatization Program, 1993–99 2856.4 Privatization in the Power Sector, 1995–98 289
xiv CONTENTS

6.5 Average Changes in Manufacturing Basic Variables after Privatization for IFI Sample and Total Manufacturing 292
6.6 Changes in Performance for the Sample of Privatized IFI Firms 294
6.7 Industry-Adjusted Changes in Performance for the Sample of Privatized IFI Firms 296
6.8 IFI Firms: Role of Transfers from Workers 3056.9 Changes in Performance in the Sample of
Privatized Power Utilities and Public Enterprises of Medellín 307
6.10 Industry-Adjusted Changes in the Performance of Privatized Power Utilities 309
6.11 Annual Averages for Wholesale Electricty Market Efficiency Variables, 1996–2000 314
6.12 Markup Determinants for IFI Firms 3176.13 Total Factor Productivity Determinants for
IFI Firms 3216.14 Determinants of Thermal Plants’ Efficiency Scores 3256A.1 Infrastructure Concession Projects with Ongoing
Private Investment by 1998 3296B.1 List of IFI Enterprises in the Sample 3306C.1 The Indicators for IFI Firms in the Sample 3306D.1 Colombia: Power Sector Statistics and Description
of the Data Sets 3376D.2 Thermal Plants: Input and Output Variables 3396E.1 DEA Efficiency Scores in Thermal Generation
before and after the Regulatory Reform 3407.1 State-Owned Enterprises in Mexico, 1917–2003 3517.2 State-Owned Enterprises, 1982–2003 3537.3 The Privatization Program in Perspective 3547.4 Changes in Performance for the Sample of
Privatized Firms 3567.5 Industry-Adjusted Changes in Performance
for the Sample of Privatized Firms 3607.6 Median Performance Changes in Privatized Firms
in Competitive versus Noncompetitive Industries 3617.7 The Role of Transfers from Workers 3657.8 Other Benefits of Privatization Programs 3667.9 The Fiscal Impact of Privatization: 1983–2003 3687.10 Foreign Direct Investment in Privatization 3707.11 Restructuring Actions before Privatization 3737.12 Prior Restructuring: Dos and Don’ts 375
CONTENTS xv

7A.1 Definition of Variables 3948.1 Privatization Revenues and Investment, 1991–2001 4128.2 Firm Performance Measures 4198.3 Nonfinancial Companies Included in the Study 4258.4 Nonfinancial Companies Not Included in the Study 4278.5 Privatized Banks Included in the Study 4308.6 Changes in Performance for the Privatized Firms 4338.7 Performance Indicators of Privatized Utilities,
Difference in Difference 4358.8 Changes in Performance in the Financial Sector
after Privatization 4398.9 Performance Indicators of Privatized Banks,
Difference in Difference 4428.10 Changes in Employment after Privatization 4448.11 Impact of Layoffs on Performance Indicators
for Major Privatized Firms 4468B.1 Description of Variables 4518C.1 Evolution of Privatization in the Electricity Sector 4588C.2 Evolution of Privatization in the Financial Sector 4608D.1 Basic Statistics of Privatized Firms 4638E.1 Changes in Performance after Privatization
for Telefónica del Perú 4688E.2 Changes in Performance after Privatization
for Electrolima 4708E.3 Changes in Performance after Privatization
for Electroperú 472
xvi CONTENTS

Foreword
In the 1980s, a number of Latin American countries launched significantprivatization programs. Following decades of statist economic policies,trade protection, heavy-handed regulation, and even nationalization, priva-tizations were introduced as the linchpin of Washington consensus policies.Indeed, not only countries in Latin America, but many transition economiesand other developing economies expected privatization to ignite economicgrowth.
A decade later, many privatizations in Latin America were completed,but the process reached a standstill. The initial hope and optimism gaveway to doubt, disappointment, and a widely shared belief that privatiza-tion had failed. Indeed, the alleged failures of privatization became centralto the denunciations of Washington consensus policies. So what happened?Has privatization delivered benefits or not? Were the critics scholars ordemagogues?
This volume discusses a number of criticisms of privatization and thenpainstakingly assembles empirical data designed to evaluate them. Abroad range of evidence, collected from a variety of countries, points toincreased productivity and profitability, accelerating restructuring andoutput growth, mounting tax revenues, and improving product qualityfollowing privatization. In the cases where privatizations failed, the prob-lems appear to be linked to continued state involvement and regulation, aswell as a weak corporate governance framework. Indeed, the volume pro-vides substantial evidence that improved corporate governance and regula-tory environment are complementary to privatization. In general, privateownership delivers the same significant benefits in Latin America as it doesin other parts of the world.
But do the increased shareholder profits of privatized firms come atthe expense of other stakeholders? The evidence provides no supportfor the view that increased profitability comes from monopoly pricing,exploitation of workers, or reductions in tax payments. To the con-trary, increased profitability comes from productivity growth ratherthan redistribution.
The studies in this volume also show that the manner in which privati-zation is carried out matters. Transparency and homogeneity of procedures,
xvii

speed, and moderation in preprivatization restructuring lead to betteroutcomes and allow less room for corruption.
The evidence presented in this volume amounts to a compelling casethat privatization in Latin America has been a success. To the extent thatthey pay attention to the evidence, critics of privatization in Latin Amer-ica must recognize the basic fact that benefits have been substantial. It ishoped that these studies advance the course of privatization and capitalismin other parts of the world as well.
Andrei ShleiferWhipple V.N. Jones Professor of Economics, Harvard UniversityJanuary 2005
xviii FOREWORD

Acknowledgments
THIS BOOK WAS WRITTEN WITH THE SUPPORT of the Latin American ResearchNetwork at the Inter-American Development Bank (IDB). Created in 1991,this network aims to leverage the IDB’s research department’s capabilities,improve the quality of research performed in the region, and contribute tothe development policy agenda in Latin America and the Caribbean.Through a competitive bidding process, it provides grant funding to lead-ing Latin American research centers to conduct studies on the economicand social issues of greatest concern to the region today. The network cur-rently comprises nearly 300 research institutes all over the region and hasproven to be an effective vehicle for financing quality research to enrich thepublic policy debate in Latin America and the Caribbean.
Many individuals provided comments and suggestions: CésarCalderón, Guillermo Calvo, Virgilio Galdo, Arturo Galindo, MagdalenaLópez-Morton, Eduardo Lora, William Megginson, Alejandro Micco,Ugo Panizza, Andrei Shleifer, and Luisa Zanforlin. The authors also thankBank and Yale University colleagues who participated in formal and in-formal discussions and workshops on background papers, and who pro-vided comments during revisions. Valuable input was also provided in theproduction of this book by Norelis Betancourt, Madison Boeker, AdrianaCabrera, Rita Funaro, Raquel Gómez, Martha Grotton, Maria HelenaMelasecca, Mariela Semidey, and John Dunn Smith. Book design, editing,and print production were coordinated by Santiago Pombo, Janet Sasser,and Monika Lynde in the World Bank’s Office of the Publisher.
The views and opinions expressed in this book are those of the authorsand do not necessarily reflect the official position of the IDB, its Board ofDirectors, or the Advisory Committee.
xix


1
The Truth about Privatization in Latin America
Alberto Chong and Florencio López-de-Silanes
AFTER DECADES OF POOR PERFORMANCE and inefficient operations by state-owned enterprises, governments all over the world have earnestly embracedprivatization. Beginning in the 1980s, thousands of state-owned enterpriseshave been turned over to the private sector in Africa, Asia, Latin America,and eastern and western Europe. This trend was spurred by the well-documented poor performance and failures of state-owned enterprises andthe efficiency improvements after privatization around the world.1 Privatiza-tion efforts have greatly stalled in recent years, however, despite worldwideevidence that points to improved performance, firm restructuring, fiscal ben-efits, increased output, and quality improvements following privatization.
Academia, politicians, and the media have recently attacked privatiza-tion, voicing concerns about its record, the sources of the gains, and itsimpact on social welfare and the poor.2 The negative reaction to privati-zation is reflected in opinion polls and some governments’ reluctance tofurther their privatization programs.3 Popular support for privatization,as for other structural policies, generally follows a J curve, declining atfirst and recovering when the policy matures (Przeworski 1991). If politi-cians retreat from the now-unpopular effort to restructure the role of thestate in the economy, the window of opportunity for deepening privatiza-tion efforts may close.4 Many countries have implemented large privatiza-tion programs, but in many others the state retains a large presence, oftenacross many sectors of the economy (La Porta, López-de-Silanes, andShleifer 2002). In these circumstances, it is imperative to analyze the realrecord of privatization and draw lessons from it.
This chapter evaluates the privatization experience and assesses the em-pirical validity of the main concerns voiced against it. We focus on LatinAmerica because after the transition economies of eastern Europe, Latin
1

America is the region with the largest decline in the state’s share ofproduction in the past 20 years. The extent of privatization in LatinAmerica and the quality of the data allow researchers to produce compre-hensive analyses that provide appropriate academic responses to some ofthe main criticisms raised.
Overall, the empirical record shows that privatization leads not onlyto higher profitability but also to large output and productivity growth,fiscal benefits, and even quality improvements and better access for thepoor. Instances of failure exist, but in light of the overwhelming evidence,these failures should not be turned into an argument to stop privatization.The analysis in this chapter suggests that privatization failures can be un-derstood in a political economy framework. Their roots can be traced tosubstantial state participation in opaque processes, poor contract design,inadequate reregulation, and insufficient deregulation and corporate gov-ernance reform that increase the cost of capital and limit firm restructur-ing in a competitive environment.
The chapter is organized as follows. The next section gives a briefoverview of the rationale and extent of privatization around the world. Therest of the sections are structured around what we consider the four main ar-eas of concern about privatization. The first hurdle is to confirm that theprofitability increases recorded by the literature are robust, unbiased, and notsolely explained by sample selection of the best firms. The first generation ofprivatization papers suffered from this problem. A recent series of LatinAmerican studies analyzed here, however, uses comprehensive firm-leveldata that provide robust evidence on performance changes after privatiza-tion. The second hurdle is to address criticisms of privatization concerningthe welfare of workers, consumers, and the state, which we do by exploringwho pays for the profitability gains. The evidence suggests that although la-bor cost reductions and price increases account for part of the gains, the bulkof the profitability improvement lies in deep firm restructuring and produc-tivity growth. The third hurdle is to examine concerns about the proper roleof the state in firm restructuring before privatization and about the opacityof procedures, which may lead to collusion and corruption. Our final hurdleis to assess the role of complementary policies such as deregulation, reregu-lation, and corporate governance reform. We place particular attention onsectors with market power and inefficient regulation following privatization.The final section concludes, providing some policy implications from the pri-vatization record thus far.
A Brief Look at the Privatization Experience around the World
In the mid-1900s many famous economists and politicians favored stateownership of firms in several industries, where monopoly power andexternalities often produced market failures. In the 1990s, however, the
2 CHONG AND LÓPEZ-DE-SILANES

evidence on the failures of state-owned enterprises around the world anddevelopments in contract and ownership theory led to a reassessment ofthe benefits of state ownership in production (Shleifer 1998). The litera-ture emphasizes two reasons for the poor record of state ownership. Onestrand of the literature focuses on managerial shortcomings; it reflects theidea that imperfect monitoring and poor incentives for managers of state-owned enterprises translate into inferior performance. There are manyreasons to believe this would be so. The average state-owned firm is nottraded on the stock market; the threat of a takeover does not exist sincecontrol rests in the hands of the state. Discipline from creditors does notplay much of a role either, because most loans to state-owned enterprisesare public debt, and losses are typically covered by subsidies from thetreasury. Additionally, the boards of directors rarely implement good cor-porate governance practices, and management turnover obeys politicalrather than market forces (Vickers and Yarrow 1988).
The other strand of the literature emphasizes the political economyaspects of state production. The political view highlights the inherentconflict of interest in running state-owned enterprises, as managers seekto maximize their political capital and thus pursue inefficient decisions.Political interference in the firm’s production results in excessiveemployment, poor choices of products and location, and inefficient in-vestment (Shleifer and Vishny 1996; La Porta and López-de-Silanes1999). State-owned enterprises face soft budget constraints that allowthem to implement such practices, since governments may not want torisk the political cost of firms going bust (Sheshinski and López-Calva2003). The basic claims of the two strands of the literature have beenvalidated by empirical research on state-owned enterprises and firm per-formance after privatization around the world (see Boardman andVining 1989; Megginson, Nash, and van Randenborgh 1994; Ehrlichand others 1994; La Porta and López-de-Silanes 1999; Frydman andothers 1999; Dewenter and Malatesta 2001; and Chong and López-de-Silanes 2004, among others).
Motivated by the evidence on the failures of state-owned enterprises,governments in more than 100 countries have undertaken privatizationprograms since the mid-1980s (Megginson and Netter 2001). Through-out the world annual revenues from privatization soared during the late1990s, peaking in 1998 at over $100 billion (OECD 2001).5 Industrialcountries have pursued privatization less vigorously than have developingnations. Between 1984 and 1996 the participation of state-owned enter-prises in industrial countries declined from a peak of 8.5 percent to about5.0 percent of gross domestic product (GDP), while production fromstate-owned companies declined more steeply in developing countries(figure 1.1). According to Sheshinski and López-Calva (2003), the activ-ities of state-owned enterprises as a percentage of GDP decreased fromabout 11 percent in 1980 to 5 percent in 1997 in middle-income coun-tries and from 15 to 3 percent in low-income economies. Developing
THE TRUTH ABOUT PRIVATIZATION IN LATIN AMERICA 3

Figure 1.1 Economic Activity of State-Owned Enterprises,1978–97
Note: Weighted average by country GDP. Source: World Bank 2001.
countries also saw large reductions in employment among state-ownedenterprises during the same period. In middle-income countries such em-ployment fell from a peak of 13 percent of total employment to about 2percent, and in low-income countries it dropped from more than 20 per-cent to about 9 percent.
These averages mask great regional variation in the size and economicimportance of the remaining state-owned production. In Sub-SaharanAfrica only a few governments have openly adopted an explicit divestmentstrategy for state-owned enterprises. The African privatization effort hasbeen significant in only a handful of countries, and state production stillaccounts for more than 15 percent of GDP in the region.6 Asia also fea-tures large variation, in that several Asian countries have not consistentlypursued a privatization strategy. China, for example, only recently com-mitted to privatizing all but the largest state enterprises. In India, whereprivatization has thus far not figured prominently in the agenda, the statestill owns 43 percent of the country’s capital stock. Many governments in
4 CHONG AND LÓPEZ-DE-SILANES
0
5
10
15
20
25
1978
1979
1980
1981
1982
1983
1984
1985
1986
1987
1988
1989
1990
1991
1992
1993
1994
1995
1996
1997
Percent of GDP
Africa
Latin America
Asia
Industrial countries

the region continue to hang on to their assets in sectors such as energy,telecommunications, transportation, and banking, although private equityfunds and multinationals were expecting large state-owned fire sales afterthe Asian crisis of 1997.7
In contrast, transition economies and Latin American countries havebeen very active in privatization. Transition economies in eastern Europeand central Asia accounted for 21 percent of total privatization revenuesin developing countries during the 1990s, second only to Latin America(table 1.1). To facilitate their shift to a market economy, most transitioncountries launched mass privatization programs that resulted in dramaticreductions of state ownership. These programs, however, have sometimesbeen unpopular, accused of corruption and foot-dragging on implement-ing corporate governance reforms, and thus affording poor protection fornew minority investors.
Even against the backdrop of massive economic transformations intransition economies, the privatization record of Latin America seemsremarkable. Latin America accounted for 55 percent of total privatiza-tion revenues in the developing world in the 1990s. The decline in theeconomic activity of state-owned enterprises has been more substantialin Latin America than in Asia and Africa, bringing levels close to thoseof industrialized countries. In recent years, however, Latin America hasvirtually halted its privatization process.
THE TRUTH ABOUT PRIVATIZATION IN LATIN AMERICA 5
Table 1.1 Proceeds from Privatization in Developing Countries,1990–99(US$ billions)
Eastern MiddleEast Europe EastAsia and and Sub-and Latin Central North South Saharan
Year Pacific America Asia Africa Asia Africa
1990 376 10,915 1,262 2 29 741991 834 18,723 2,551 17 996 1,1211992 5,161 15,560 3,626 69 1,557 2071993 7,155 10,488 3,988 417 974 6411994 5,508 8,199 3,957 782 2,666 6051995 5,410 4,616 9,742 746 916 4731996 2,680 14,142 5,466 1,478 889 7451997 10,385 33,897 16,537 1,612 1,794 2,3481998 1,091 37,685 8,002 1,000 174 1,3561999 5,500 23,614 10,335 2,074 1,859 6941990–1999 44,100 177,839 65,466 8,197 11,854 8,264
Source: World Bank 2001.

The privatization impetus has also faded in other regions, leaving thebureaucrats very much in business. State-owned enterprises still accountfor more than 20 percent of investment worldwide and about 5 percent offormal employment (Kikeri 1999). Governments may own or controlmuch more than is apparent at first sight. A clear example is the case ofgovernment ownership of banks. Data for the late 1990s indicate that af-ter bank privatization programs had been completed in many countries,the world mean of government ownership of the top 10 banks was still 42percent, 39 percent if former or current socialist countries were excluded(La Porta, López-de-Silanes, and Shleifer 2002). Thus, while governmentownership has decreased with privatization, it has not fallen to negligiblelevels.
Dramatic differences in the extent of privatization are also evidentwithin regions. In Latin America, for example, countries with large state-owned sectors, such as Ecuador, Nicaragua, and Uruguay, barely priva-tized at all in the 1990s, while others, such as Argentina, Bolivia, Guyana,Panama, and Peru, raised revenues from comprehensive privatizationprograms that exceeded 10 percent of GDP (figure 1.2). The difference inthe extent of privatization across countries and the large amount of assetsin the hands of the state heighten the importance of understanding theprivatization record so far and of developing lessons for future privatiza-tion programs.8
Which Firms Are Up for Sale? Concerns about What Is Privatized
Privatization studies typically analyze the impact on firm performanceby comparing firm-level data before and after privatization. This litera-ture has established worldwide evidence on the benefits of privatizationfrom increased firm profitability driven primarily by increased effi-ciency (Megginson, Nash, and van Randenborgh 1994; Boubakri andCosset 1998, 1999; Dewenter and Malatesta 2001). Critics suggest,however, that these results may reflect sample selection bias or resultfrom the use of noncomparable data.
Sample Selection Bias
Sample selection bias can arise from five basic sources. First, politicianswho conduct privatization have the incentive to sell only the healthiestfirms—what critics refer to as the crown jewels. According to thishypothesis, politicians sell only viable assets and keep poor performers,allowing investors to engage in cherry-picking (Bayliss 2002). Second,several studies are based on information about firms privatized throughpublic offerings on the stock exchange. Such samples are thus biased
6 CHONG AND LÓPEZ-DE-SILANES

THE TRUTH ABOUT PRIVATIZATION IN LATIN AMERICA 7
Figure 1.2 Revenues from Privatization in Latin America,1990–2000
Source: Lora 2001.
0 2 4 6 8 10 12 14 16 18
Uruguay
Costa Rica
Bahamas
Ecuador
Barbados
Colombia
Honduras
Nicaragua
Chile
Trinidad andTobago
Jamaica
Mexico
DominicanRepublic
Venezuela
Belize
Guatemala
Brazil
El Salvador
Argentina
Guyana
Panama
Bolivia
Peru
Paraguay
Percent of 1999 GDP
Country

toward the largest, and probably the best-performing, firms. A thirdsource of sample selection comes from the greater availability of datafrom industrialized countries, which may have relatively better-performingfirms. Cross-country firm-level analyses are therefore biased because theirsamples include a disproportionate share of well-performing firms.9 Thefourth source emerges from the intense focus of the studies on oligopolisticor heavily regulated industries, where the gains from privatization maycome from market power. Finally, survivorship bias is introduced whenfirms that went bankrupt after privatization are excluded from the samplethat compares performance before and after privatization.
Several early studies on firm performance after privatizations in LatinAmerica suffer from these biases (table 1.2). Some of these papers are spe-cific case studies of a limited number of large firms (see, for example, Galaland others 1994 and Chong and Sánchez 2003). Others do not includeeconometric or statistical analysis (Sánchez and Corona 1993; Hachetteand Lüders 1994; Birch and Haar 2000). Still others are econometric stud-ies of one or two heavily regulated sectors (Ramamurti and Vernon 1991;López-de-Silanes and Zamarripa 1995; Pinheiro 1996; Ramamurti 1996,1997). Finally, some provide evidence from cross-country analysis ofoligopolistic sectors such as telecommunications (Petrazzini and Clark1996; Ramamurti 1996; Ros 1999; Wallsten 2000).
Overcoming sample selection bias is empirically difficult and requireslarge amounts of pre- and postprivatization information for nearly com-plete cross-industry samples of privatized firms of all sizes. La Porta andLópez-de-Silanes (1999) deal with these issues by collecting informationfrom 95 percent of nonfinancial firms privatized in Mexico in the period1983–92.10 Mexico undertook a comprehensive privatization program inwhich the goal was to eliminate state ownership across the board, with theexceptions of electricity and oil. As a result, the sample contains large,medium-size, and small firms that span more than 40 sectors coveringmining, manufacturing, agricultural products, and services as varied asnight clubs and soccer teams. These characteristics make it a good samplefor testing the validity of the concerns raised above. The study concludesthat sample selection bias does not explain the positive results reached byprivatization, as profitability of privatized firms increases across sectorsand firm sizes, even considering bankrupt firms. The median firm experi-enced an increase in operating profitability of 24 percentage points. More-over, the Mexican government did not sell the crown jewels, given thatthis oil-rich nation retained petroleum and some petrochemicals as stateassets.11
A recent research effort across Latin America expands the detailed pri-vatization analysis for the region, using comprehensive data and amethodology similar to that described above for Mexico to examine theprograms of Argentina, Bolivia, Brazil, Chile, Colombia, and Peru and toupdate the data and findings for Mexico These studies, gathered together
8 CHONG AND LÓPEZ-DE-SILANES

9
Birch and Haar2000
Chisari, Estache,and Romero1999
Chong andSánchez 2003
Clarke and Cull1999
Galal and others1994
Uses a descriptive study of the privatizationexperience in the last two decades in Argentina,Brazil, Chile, Colombia, Mexico, Peru, Venezuela,and some Caribbean countries.
Assesses macroeconomic and distributional effectsof privatization in Argentina’s gas, electricity,telecommunications, and water sectors using acomputable general equilibrium model.
Uses a detailed analysis of the contractualarrangements of privatizations and concessions ininfrastructure in Brazil, Chile, Colombia, and Peru.
Tests econometrically how political constraintsaffect transactions during bank privatization,based on evidence from the privatization programof provincial banks in Argentina during the1990s.
Compares postprivatization performance of 12large firms (mostly airlines and regulated utilities)from Chile and Mexico.
Finds sizable effects of privatization on short- andlong-run macroeconomic conditions; shows apositive effect of privatization on productivity anda negative effect on employment.
Concludes that privatization of utilities accounts fortotal gains of about $3.3 billion (at 1993 prices)or the equivalent of 1.25 percent of GDP.Privatization cannot be blamed for increasedunemployment, which may be caused byineffective regulation.
Concludes that clear, homogeneous, transparent,and credible institutional processes duringprivatization yield positive outcomes.
Finds that provinces with high fiscal deficits werewilling to accept layoffs and guarantee a largerpart of the privatized bank’s portfolio in returnfor a higher sale price.
Finds net welfare gains in 11 of 12 cases covered,with average gains equal to 26 percent of thefirms’ predivestiture sales; uncovers no case inwhich workers were made worse off and threecases in which workers’ conditions improved.
Table 1.2 Recent Studies on Firm Performance after Privatization in Latin America
Study Sample, period, and methodology Summary of findings and conclusions
(Table continues on the following page.)

10 Table 1.2 (continued)
Study Sample, period, and methodology Summary of findings and conclusions
Hachette andLüders 1994
Petrazzini andClark 1996
Pinheiro 1996
Ramamurti 1996
Ramamurti 1997
Analyzes the difference in 10 performanceindicators of 144 private, public, and privatizedfirms in Chile in 1974–87.
Uses International Telecommunications Union datathrough 1994 to test whether deregulation andprivatization affect the level and growth oftelephone density, prices, service quality, andemployment; sample covers 26 developingcountries, including some Latin Americannations.
Analyzes the performance of 50 Brazilian firmsbefore and after privatization, using data through1994; variables used are net sales, net profits, netassets, investment, employment, and indebtedness.
Surveys four telecommunications, two airlines, andone toll-road privatization program in 1987–91;discusses political and economic issues andmethods used to overcome bureaucratic andideological opposition to divestiture.
Examines the restructuring and privatization ofFerrocarriles Argentinos in 1990, testing whether
Finds no significant differences in behavior amongpublic, private, and privatized firms that operateunder similar sets of rules and regulations.
Deregulation and privatization are both associatedwith significant improvements in the level andgrowth of telephone density but have noconsistent impact on the quality of service.Deregulation is associated with lower prices andincreased employment; privatization has theopposite effect.
Concludes that privatization has improved theperformance of the firms; shows that the nullhypothesis of no change in behavior is rejected forthe production, efficiency, profitability, andinvestment variables; and finds a significantnegative impact on employment.
Concludes that privatization had positive results fortelecommunications, partly owing to the scope forimprovement of technology, capital investment,and attractiveness of offer terms; observes littleimprovement in airlines and toll road, which hadless room for productivity enhancement.
Documents a 370 percent improvement in laborproductivity and a 78.7 percent decline in

11
Ros 1999
Sánchez andCorona 1993
Trujillo andothers 2002
productivity, employment, and the need foroperating subsidies changed after divestiture.
Uses International Telecommunications Union dataand panel data regressions to examine the effectsof privatization and competition on networkexpansion and efficiency in 110 countries in1986–95.
Uses a descriptive case-study approach to analyzethe privatization experiences of Argentina, Chile,Colombia, and Mexico, focusing on thepreparatory measures taken prior to privatization;valuation, sale mechanisms, regulation, andsupervision; and the fiscal and macroeconomicimpact of privatization.
Uses pooled and panel data with fixed and randomeffects to examine the macroeconomic effects ofprivate sector participation in infrastructure,based on a sample of 21 Latin American countriesin 1985–98.
employment; an improvement and expansion inservices, combined with a reduction in the cost toconsumers; and the elimination of the need foroperating subsidies.
Countries with at least 50 percent privateownership in the main telecommunications firmhave significantly higher telephone density levelsand growth rates. Both privatization andcompetition increase efficiency, but onlyprivatization is positively associated withnetwork expansion.
Finds great differences in the effects of privatizationin the countries covered; concludes that firms,institutions, and regulations need sufficient timeto prepare for the privatization process to besuccessful.
Finds that private sector involvement in utilities andtransport has minimal positive effects on GDP.Private investment is crowded out, and privateparticipation reduces recurrent expenditures—except in transport, where it has the oppositeeffect. The net effect on the public sector accountis uncertain.
(Table continues on the following page.)

12
Comprehensive sample country studies in Latin America
Study Country sample, period, and methodology Summary of findings and conclusions
Wallsten 2001 Explores the impact of privatization, competition,and regulation on telecommunications firms’performance in 30 African and Latin Americancountries in 1984–97.
Indicates that competition is significantly associatedwith increases in per capita access to telecom-munications services and with decreases in itscosts, while privatization is helpful only if coupledwith effective, independent regulation. Concludesthat competition combined with privatization isbest and that privatizing a monopoly withoutregulatory reforms should be avoided.
Galiani andothers 2005
Capra and others 2005
Argentina. Covers 21 federal nonfinancial state-owned firms plus all privatized banks inArgentina, which account for 74 percent of totalprivatization revenues; tests whether performanceindicators of state-owned firms improved afterprivatization. Period: 1991–2000.
Bolivia. Covers 32 firms, which account for 60percent of total transactions in Bolivia; testswhether performance indicators of state-ownedfirms improved after privatization. Period:1992–99.
Profitability of nonfinancial firms increased 188percent after privatization. Investment increasedat least 350 percent while employment decreasedapproximately 40 percent; there was no impact onprices.
Privatization had a significant impact in operatingefficiency as profitability increased by over 100percent and costs per unit dropped by a third.Employment fell by 15 percent, but wages forremaining blue- and white-collar workersdoubled.
Table 1.2 (continued)
Study Sample, period, and methodology Summary of findings and conclusions

13
Anuatti-Netoand others2005
Fischer,Gutiérrez andSerra, 2005
Pombo andRamírez 2005
La Porta andLópez-de-Silanes 1999;Chong andLópez-de-Silanes 2005
Brazil. Includes 102 publicly traded firms(equivalent to 94 percent of total value oftransactions in the country); tests whetherperformance indicators improved afterprivatization. Period: 1987–2000.
Chile. Covers only 37 nonfinancial firms, owing topolitical and economic turbulence in the 1970sand changes in accounting standards; testswhether performance indicators improved afterprivatization. Period: 1979–2001.
Colombia. Analyzes 30 former firms in the Institutefor Industrial Promotion program, which accountfor 95 percent of the total accumulatedprivatization sales; tests whether performanceindicators improved after privatization. Period:1974–98.
Mexico. Assesses whether the performance of 218privatized firms improved after divestment;compares performance with industry-matchedfirms; splits improvements documented betweenindustry- and firm-specific results. Period:1983–1991.
Privatization improved the firms’ profitability (14percent) and reduced their unit costs (33 percent)and investment-to-sales ratio (41 percent).
Profitability did not increase significantly afterprivatization, and productivity did not vary amongregulated and unregulated sectors. Study finds noevidence that firms fired workers after privatization,although layoffs occurred prior to privatization.
Firms were profitable before privatization. Laborproductivity grew 13 percent and investment fellfrom 5.9 to 2.5 percent per year owing toprevious overinvestment; employment wasreduced by 23 percent.
The output of privatized firms increased 54.3percent, while employment declined by half(though wages for remaining workers increased).Firms achieved a 24 percentage point increase inoperating profitability, eliminating the need forsubsidies that amounted to 12.7 percent of GDP.Higher product prices explain 5 percent ofimprovements; transfers from laid-off workers, 31percent; and incentive-related productivity gains,64 percent.
(Table continues on the following page.)

14
Source: Megginson and Netter 2001; Chong and López-de-Silanes 2004.
Torero 2005 Peru. This study covers 36 nonfinancial firms,which account for 90 percent of privatizationcases and 86 percent of total transactions. Inaddition, it includes a separate analysis for thefinancial sector. It tests whether performanceindicators improved after privatization. Period:1986–2000.
Profitability, operational efficiency, and outputincreased after privatization. The ratio of sales toemployees increased by 50 percent intelecommunications, 69 percent in electricity, and25 percent in the financial sector. Afterprivatization, 36 percent of employees retainedtheir jobs.
Table 1.2 (continued)
Study Country sample, period, and methodology Summary of findings and conclusions

THE TRUTH ABOUT PRIVATIZATION IN LATIN AMERICA 15
in this volume, compare firm performance before and after privatization,and they adjust for macroeconomic and industry effects with matchingfirms. Figure 1.3 summarizes the data collection efforts of this series of pa-pers. With the exception of Brazil, where access to preprivatization datafor firms that are not publicly traded was denied, the coverage across firmsizes for all countries is enough to put to rest the main concerns regardingsample selection. The samples used for Bolivia and Chile are the smallest,around 66 percent in terms of value, while the samples for the rest of thecountries cover 80, 90, and even 95 percent of transaction values andnumber of privatization contracts.
Extensive groundwork and creative ways of accessing nonpublic infor-mation allowed researchers to collect comprehensive pre- and postprivati-zation data. In Peru, for example, Torero obtained preprivatizationinformation from so-called White Books, or original privatization docu-ments that were available to prospective bidders when state-owned enter-prises were being privatized. He was able to collect comprehensive post-privatization data from privatization dossiers, as well as from the NationalSupervisory Commission of Firms and Securities and other regulatoryagencies. All in all, Torero collected information for nearly 90 percent ofprivatized firms in Peru. For Argentina, Galiani, Gertler, Schargrodsky,and Sturzennegger drew a comprehensive sample based on informationfrom individual companies, the Ministry of Economic Affairs, and regula-tory agencies. In Colombia, which has smaller privatization programsthan those of Argentina and Peru, Pombo and Ramírez collected compre-hensive information on the privatization from the Institute for IndustrialPromotion.12 They constructed an unbalanced panel data set with recordsfrom the Annual Manufacturing Survey starting in 1974 and ending in1998. Their panel features over 140 variables covering 94 specific groupsbased on the International Standard Industrial Classification, togetherwith survey information on about 6,000 establishments. For Mexico,Chong and López-de-Silanes use the same database as did La Porta andLópez-de-Silanes (1999), which combines information from the originalprivatization White Books with information collected from surveys sent toprivatized firms and data from the various census bureaus. The informa-tion for Mexico basically covers the whole program, with 218 nonfinan-cial, state-owned enterprises privatized between 1983 and 1992.
In Bolivia, information on privatized state-owned enterprises is par-ticularly difficult to gather owing to the relatively small size of firms andthe lackadaisical record-keeping efforts in the country.13 Capra, Chong,Garrón, López-de-Silanes, and Machicado complement original infor-mation from government institutions with information collectedthrough a survey sent to privatized firms. For Chile, Fischer, Serra, andGutiérrez faced significant complications in collecting data owing to thelong privatization period (1979–2001) and the change in accountingstandards in 1982. Despite these problems, their data provide systematic

16 CHONG AND LÓPEZ-DE-SILANES
Figure 1.3 Availability of Privatization Data on Latin America
Note: On the pie charts, the gray area indicates sample coverage; the valueof transactions is given as a percentage of the total value of privatizationtransactions in each country; the number of privatization contracts is given asa percentage of the total number of privatization contracts in the country.
Source: Chapters 2–8.
a. Value of transactions
Bolivia:1992–2000
Brazil:1991–2000
Colombia:1974–98
Chile:1983–2000
Mexico:1983–92
Peru:1986–2000
Argentina:1990–2000
b. Privatization contracts
Argentina:1990–2000
Bolivia:1992–2000
Brazil:1991–2000
Colombia:1974–98
Chile:1983–2000
Mexico:1983–92
Peru:1986–2000
Sample

evidence that complements more descriptive work by others such asLüders (1991) and Sáez (1992). Finally, Brazil proved to be the most dif-ficult case, since Anuatti-Neto, Barossi-Filho, Gledson de Carvalho, andMacedo were denied access to all preprivatization information for firmsthat are not publicly traded and were thus restricted to using informa-tion on firms traded on the stock exchange. Although their results maysuffer from some sample selection bias, their study represents one of themost comprehensive data sets in Brazil, covering close to 95 percent ofthe total value of privatization transactions (chapter 4).
Overall, the coverage and industry-matching techniques of this recent se-ries of privatization studies in Latin America demonstrate that the increasedprofitability of privatized firms is not the result of sample selection bias.
Noncomparable Data
There are two additional problems with data collection procedures relat-ing to the comparability of firms before and after the sale. In several coun-tries governments either split existing state-owned enterprises to sell themas independent units or grouped separate firms together to form packagesto be sold as a unit. In both cases large amounts of data are needed to con-duct a firm-by-firm analysis of the pre- and postprivatization period. Hav-ing information disaggregated at the plant level and gaining access tofinancial statements prepared before the sale are essential for keeping unitscomparable across time. A second set of problems with the data emergesfrom changes in the sample after privatization, since the state-owned firmmay be merged with the acquiring firm or with one of its subsidiaries. Sucha merger creates a new entity and thus makes it difficult, if not impossible,to make meaningful comparisons.
Table 1.3 summarizes the different problems faced by the researcherswho recently undertook the comprehensive privatization analyses inseven Latin American countries. All countries presented the issues raisedabove to different degrees. In most cases, the problem was solved usingdetailed firm- or plant-level accounting information provided by audit-ing companies before privatization. That was the case for Argentina,Colombia, Mexico, and Peru. In Peru, the author also took advantage ofprivatization agreements that required firms to keep separate books fordifferent units, thereby allowing data aggregation. Other methods in-cluded estimating proxy financial information or disassembling firmsinto their original constituents.14
When none of these efforts could be undertaken, firms were discardedfrom the sample to ensure clean estimates. The resulting samples typicallyexcluded the following:
• Cases of state-owned enterprises for which data from the preprivati-zation period were missing, often as a result of mergers or spinoffs
THE TRUTH ABOUT PRIVATIZATION IN LATIN AMERICA 17

• A few instances of very small state ownership shares being sold(Argentina and Chile), firms that underwent changes in accounting (Bo-livia and Chile), and some very recent privatization cases (Bolivia andBrazil)
• Firms that were liquidated after privatization, although robustnesschecks were applied to ensure results would not be significantly changedwith their inclusion.
To summarize, several early privatization studies suffered from biasesintroduced by incomplete samples and the use of poor data when the na-ture of the firm changed with privatization. Today these concerns havelargely been put to rest thanks to the recent Latin American studies out-lined in this chapter and other efforts, mainly for eastern European coun-tries, that use comprehensive firm-level data across sectors and companysizes.15
Evidence from Comprehensive Data Samples on Privatization in Latin America
This section outlines the evidence on performance changes after privati-zation emerging from the Latin American countries included in ourcompilation. As previously explained, the data are some of the mostcomprehensive and up-to-date for the region, allowing us to address
18 CHONG AND LÓPEZ-DE-SILANES
Table 1.3 Reasons for Firm Exclusion from the PrivatizationSample
Sale ofMerger small Firm Change
with minority was Missing in private partici- liqui- informa- Recent accounting
Country firm pation dated tion sale standards
Argentina Yes Yes Yes Yes — —Bolivia Yes — — Yes Yes YesBrazil Yes Yes — Yes Yes —Chile Yes — Yes Yes — YesColombia Yes — — Yes — —Mexico Yes — Yes Yes — —Peru Yes — Yes Yes — —
Note: This table shows the main reasons for excluding some firms from the finalsample in each country. “Yes” means some firms were excluded for that particularreason. — means that the study does not suffer from the potential loss.
Source: Chapters 2–8 of this volume.
many of the concerns raised about privatization. We analyze profitabil-ity, operating efficiency, the behavior of inputs, output, and taxes. LatinAmerican studies find improvements in firms’ profitability, which is inline with earlier worldwide evidence (Megginson, Nash, and van Ran-denborgh 1994; Boubakri and Cosset 1998, 1999; D’Souza and Meg-ginson 1999). These increases are typically accompanied by reductionsin unit costs, boosts in output, and reduced or constant levels of em-ployment and investment. The evidence suggests that higher efficiency,achieved through firm restructuring and productivity improvements,underpins profitability gains. The raw results on firm performance arefollowed by industry-adjusted information to verify their robustness.Whenever possible, we show the data for median firms, as they are lessaffected by outliers.
Raw Data
The evidence from Latin America shows substantial gains in profitabilityafter privatization, measured by ratios of net income to sales and operat-ing income to sales (figure 1.4). For the countries in the sample, the me-dian net-income-to-sales ratio increased 14 percentage points, while theoperating-income-to-sales ratio increased 12 percentage points. Thelargest gains are in Argentina and Peru, where median changes in the ra-tio of net income to sales reached about 20 percentage points, and inBolivia, where the ratio of operating income to sales increased more than15 percentage points. Brazil shows the second smallest gains, between 2 and3 percentage points depending on the ratio. Colombian state-owned enter-prises, unlike their counterparts in other countries, were highly profitablebefore privatization, which is largely explained by the protective industrialpolicy implemented by the Colombian government during the 1980s.There is some evidence that profitability in Colombia dropped becausefirms were already efficient, and privatization was coupled with marketliberalization, which brought increased competition.
The data for Latin America suggest that the main reason behind theprofitability gains is the improved operating efficiency brought aboutby privatization. In figure 1.5 we explore this issue using costs per unit,the ratio of sales to assets, and the ratio of sales to employment. Costsper unit plummet, with the median decline equivalent to about 16 per-cent for the countries with available data. The results are statisticallysignificant at 1 percent for all countries except Chile. State-ownedenterprises were highly unprofitable before privatization in five of theseven countries, with losses above 10 percent of sales in terms of netincome over sales. The exceptions are Chile, whose state-owned enter-prises exhibited slightly positive profitability ratios, and Colombia,where the state-owned sector was very profitable compared with privatecompetitors.
THE TRUTH ABOUT PRIVATIZATION IN LATIN AMERICA 19

The sales-to-asset ratios similarly show a rising trend in four out offive countries. The median country increase in this ratio is 16 percent.Colombia and Peru are the only countries with a fall in sales to assets(about 30 and 20 percent, respectively); in both countries privatized en-terprises engaged in large investments that overtook output increases. Fi-nally, the impact on the sales-to-employment ratio is dramatic, with amedian gain of 65 percent. Chile and Mexico show the most impressiveresults, in that sales per employee doubled. Information for Colombiasuggests that state-owned enterprises also underwent restructuring withsignificant efficiency gains. The mean (median) manufacturing firm inColombia experienced a 48 (65) percent gain in its sales-to-employmentratio and a 2.4 percent per year increase in its total factor productivityindex.
20 CHONG AND LÓPEZ-DE-SILANES
Figure 1.4 Profitability Changes after Privatization in Latin America
Note: The components of the variables are defined as follows: net incomeis equal to operating income minus interest expenses and net taxes paid, aswell as the cost of any extraordinary items; operating income is equal tosales minus operating expenses, minus cost of sales, and minus depreciation;and sales are equal to the total value of products and services sold,nationally and internationally, minus sales returns and discounts. For Bolivia,the net-income-to-sales ratio is not available.
Source: Chapters 2–8.
−1
4
9
14
19
24
Argentina Bolivia Brazil Chile Colombia Mexico Peru
Percentage points
Net-income-to-sales ratio Operating-income-to-sales ratio

THE TRUTH ABOUT PRIVATIZATION IN LATIN AMERICA 21
Figure 1.5 Operating Efficiency Changes after Privatization inLatin America
Note: Cost per unit is defined as the ratio of cost of sales to sales. Thecomponents of the variables are defined as follows: cost of sales is equal tothe direct expense involved in the production of a good (or provision of aservice), including raw material expenditure plus total compensation paid toblue-collar workers; sales are equal to the total value of products and servicessold nationally and internationally minus sales returns and discounts;employees corresponds to the total number of workers (paid and unpaid) whodepend directly on the company; and assets are defined as property, plant, andequipment (PPE), which is equal to the value of a company’s fixed assetsadjusted for inflation. For Brazil, the sales-per-employees ratio is not available.
Source: Chapters 3–8.
As figure 1.6 shows, labor retrenchment is a significant component ofthe privatization experience in Latin America. Privatized firms reduced asubstantial percentage of their work force in almost all countries. Theexception to this trend is Chile, where the mean number of workers in pri-vatized firms increased by 15 percent and the median fell by 5 percent. Ingeneral, the median country reduced 24 percent of its work force. Priva-tized state-owned enterprises in Bolivia, Colombia, Mexico, and Peru showsignificant reductions: the median firm fired 13 percent, 24 percent, 57 per-cent, and 56 percent of the work force, respectively. The magnitude of em-ployment reductions in these countries speaks of state-owned firms withbloated work forces, providing evidence in line with the political economyview of the benefits of privatization. The evidence on labor cuts suggests
−60−40−20
020406080
100120
Bolivia Brazil Chile Colombia Mexico Peru
Percentage change
Cost per unit Sales to assets Sales per employees

22 CHONG AND LÓPEZ-DE-SILANES
Figure 1.6 Percentage Changes in Employment afterPrivatization in Latin America
Note: The number of employees corresponds to the total number ofworkers (paid and unpaid) who depend directly on the company. Theindustry-adjusted number of employees is computed by augmenting thepreprivatization number by the difference between the cumulativegrowth rate of the number of employees of the firm and the cumulativegrowth rate of the number of employees of the control group in thepostprivatization period relative to the average number of employeesbefore privatization. For Argentina, the mean number of employees isnot available; for Chile and Peru, the median industry-adjustedinformation is not available; for Bolivia, the industry-adjustedinformation is not available.
Source: Chapters 2, 3, 5, 6, 7, and 8.
a. Mean values
−70−60−50−40−30−20−10
01020 Argentina Bolivia Chile Colombia Mexico Peru
Percentagechange
Percentagechange
Number of employees Industry-adjusted number of employees
b. Median values
−60
−50
−40
−30
−20
−10
0Bolivia Chile Colombia Mexico Peru
Number of employees Industry-adjusted number of employees

that transfers from workers to shareholders may be a significant componentof the success of privatization. We explore this issue later in the chapter.
A priori, the impact of privatization on investment is not clear. Onecould expect privatized firms to avoid new investments since state-ownedenterprises usually had ample idle capacity. At the same time, if the pro-duction process used by the state-owned firm is outdated, one could ex-pect a large increase in investment. The data for Latin America confirm theinitial hypothesis, since investment exhibits modest gains or statisticallyinsignificant changes. The exception is Argentina, where investment in-creased by more than 350 percent.
Our analysis so far suggests that the profitability gains of privatizedfirms stem mostly from efficiency gains. Most countries show drastic cutsin employment and fairly consistent capital stocks. Perhaps the most strik-ing finding is that the output of privatized state-owned enterprisesincreased dramatically, despite dwindling employment and modest invest-ment (figure 1.7). The median firm in our sample increased output by over40 percent, with the largest gains achieved by Mexico and Colombia,where median output increased 68 percent and 59 percent, respectively.The country with the lowest, albeit significant, increase in output is Brazil,where real sales went up 17 percent.
Adjusted Ratios
Latin America underwent major economic transformations in the 1990sas countries embraced liberal policies and opened up their borders. Mostof these countries expanded and contracted at various points, leading toconcerns about the interpretation of the evidence just discussed. In partic-ular, one might argue that the large profitability and output increases andthe rapid growth in productivity can only be the result of macroeconomicand industry changes in the region. To isolate the role of privatization, theseries of studies in our compilation present industry-adjusted measures,which support the patterns discussed so far.
The data displayed in figure 1.7, for example, allow us to rule outmacroeconomic factors as the driving force behind postprivatization out-put growth: median industry-adjusted sales grew 27.5 percent in the re-gion. In Brazil and Peru, matching private firms basically stagnated, whilethe median industry-adjusted output of privatized firms in those countriesincreased at about the same rate as the raw numbers. Meanwhile, theimproved economic conditions and industry factors in Mexico andColombia accounted for about one-fifth and three-fifths of output growth,respectively.
Relative to industry benchmarks, the median (mean) employment ofprivatized firms fell roughly 20 (35) percent in the region (see figure 1.6).In contrast, relative investment behavior differs across countries. Ratios ofmedian industry-adjusted investment to sales and investment to assets fell
THE TRUTH ABOUT PRIVATIZATION IN LATIN AMERICA 23

24 CHONG AND LÓPEZ-DE-SILANES
Figure 1.7 Median Changes in Output after Privatization inLatin America
Note: Output is defined as the monetary value of sales. The industry-adjusted output is computed by augmenting the preprivatization value bythe difference between the cumulative growth rate of output of the firmand the cumulative growth rate of output of the control group in thepostprivatization period relative to the average level of output beforeprivatization. For Colombia, the information corresponds to mean values;for Peru, industry-adjusted output information is expressed in mean values;for Argentina and Chile, output information is not available; for Bolivia,industry-adjusted output information is not available.
Source: Chapters 2–8.
considerably in Brazil and Mexico but showed a marked increase inArgentina, Chile, and Colombia.
The second most important finding of this section involves the closingperformance gap between privatized and comparable private firms afterprivatization (figure 1.8). Mexico offers the most dramatic example of con-vergence: the net-income-to-sales gap between state-owned and privatefirms disappeared with privatization and even turned slightly in favor of theprivatized enterprises. The Argentine data, although not in a comparableformat, also show a similar pattern of catching up. The industry-adjustednet-income-to-sales ratio increased 188 percent after privatization, whilethe operating-income-to-sales ratio rose 129 percent. The profitability gap
0
10
20
30
40
50
60
70
80
Argentina Bolivia Brazil Chile Colombia Mexico Peru
Percentage change
Output Industry-adjusted output

between Colombian privatized and private firms also closed, albeit from adifferent starting point.16 Before privatization, the median firm in manu-facturing was almost 4 percent more profitable than its private counter-parts, while in the state-owned energy sector, this difference was about 20percent. Substantially lower levels of protection of these firms explain thenarrowing gap with the private sector after privatization. Finally, theBrazilian and Chilean privatized samples also improved their relative prof-itability with respect to their industry competitors. In the case of Brazil,privatized state-owned enterprises became slightly more profitable thantheir private competitors, while the gap between Chilean privatized andprivate firms narrowed by about 20 percent.
The gap between privatized and private firms also closed in terms ofunit costs (figure 1.9). Brazilian privatized firms quickly reduced a gap of
THE TRUTH ABOUT PRIVATIZATION IN LATIN AMERICA 25
Figure 1.8 Net-Income-to-Sales Gap between Privatized andPrivate Firms before and after Privatization
Note: Net income is equal to operating income minus interest expensesand net taxes paid, as well as the cost of any extraordinary items; sales areequal to the total value of products and services sold nationally andinternationally, minus sales returns and discounts. For Colombia, informationis from the energy sector.
Source: Chapters 4, 5, 6, and 7.
−20
−15
−10
−5
0
5
10
15
20
25
Brazil Chile Colombia Mexico
Percentage points
Before privatization After privatization

9 percentage points to about 2 percentage points. In Chile, this gap was2–3 percentage points both before and after privatization. In Argentina,industry-adjusted unit costs for privatized firms declined 10 percent.Meanwhile, Mexico’s privatized state-owned enterprises substantially cutcosts to eliminate a large 14 percentage point gap with private competi-tors. The catching-up effect of privatization is explained by the large gainsin operating efficiency that more than survive industry adjustments. Rela-tive to industry benchmarks, median sales per employee went up 9 percentin Argentina, 30 percent in Bolivia, and a massive 88 percent in Mexico.Similarly, median industry-adjusted sales-to-asset ratios increased 20 per-cent in Mexico, 34 percent in Brazil, and 49 percent in Chile. All of thesenumbers suggest that a large component of the higher profitability comesfrom improved efficiency, lining up with the rest of the evidence presentedin the following section.
26 CHONG AND LÓPEZ-DE-SILANES
Figure 1.9 Cost-per-Unit Gap between Privatized and Private Firms before and after Privatization
Note: Cost per unit is defined as the ratio of costs of sales to netsales. Cost of sales is equal to the direct expense involved in theproduction of a good (or provision of a service), including raw materialexpenditure plus total compensation paid to blue-collar workers. Salesare equal to the total value of products and services sold, nationally andinternationally, minus sales returns and discounts.
Source: Chapters 4, 5, and 7.
−2
0
2
4
6
8
10
12
14
16
Brazil Chile Mexico
Percentage points
Before privatization After privatization

Who Wins and Loses from Privatization? Concernsabout Exploitation of Market Power, Workers, and
the Government
Some of the main criticisms of privatization are based on the belief that thegains in firm profitability are achieved at the expense of society. Thesegains are claimed to be extracted from consumers through the use of mar-ket power, from workers by means of lower salaries, and from the gov-ernment (Campbell-White and Bhatia 1998; Bayliss 2002). In this sectionwe use the recent empirical evidence from Latin America and elsewhere toassess the sources of profitability gains of privatized state-ownedenterprises.
Government Revenues
Critics of privatization often argue that the government, and thus soci-ety at large, loses from privatization because it gives up a positivestream of cash flows and puts it in the hands of private buyers. The ar-gument is extended to claim that the sale of state-owned enterprises isequivalent to a privatization of gains and a socialization of losses. Inother words, well-connected groups are able to reap the profits of pri-vatized firms and receive government-sponsored bailouts when thingsgo wrong. The evidence used to support these claims comes mostly fromcase studies of profitable state-owned enterprises that were privatized,unprofitable state-owned enterprises that turned out to be great mon-eymakers after privatization, and state-owned enterprises that becamemoney losers and went into financial distress. This perception hasswayed public opinion because of the excessive costs levied on societyin some cases of botched privatizations. In Mexico, for example, thebailouts granted to keep banks and highways from going bankrupt in-creased public debt from less than 25 percent of GDP to over 50 percent(López-Calva 2004).
The underlying logic of these arguments is similar to that undergirdingthe arguments for the economic benefits of state production, which in the1950s and 1960s justified the existence of state-owned enterprises on thegrounds that they help solve market failures by taking into account the so-cial costs of their actions. Today, academic evidence of the oppositeabounds in at least three areas. First, systematic evidence shows that state-owned enterprises are less efficient than private firms in industrial anddeveloping countries (Shleifer and Vishny 1994; Shleifer 1998). Second, theinefficiency of state-owned enterprises may be the natural result of politi-cal meddling when governments use them to achieve political objectives.This political use of state production leads to excessive employment, inef-ficient investments, and inadequate location of production sites, among
THE TRUTH ABOUT PRIVATIZATION IN LATIN AMERICA 27

other things (López-de-Silanes, Shleifer, and Vishny 1997). Finally, thelarge body of empirical work generated since the mid-1990s (reviewed inprevious sections) shows that by and large privatization leads to substan-tial increases in the profitability of firms.
Criticisms of privatization that center on what the government gives updisregard the fact that state-owned enterprises are typically money-losingentities before privatization. Moreover, the visible losses may underesti-mate the real bottom line, because their precise magnitude is obscured bylarge cross-subsidies from other state-owned enterprises and soft loansfrom the government. In fact, tax collection from state-owned enterprisesimproved after privatization in most Latin American countries analyzedhere. Brazil, the country with the smallest gains in profitability, experi-enced a 1 percentage point decrease in its net-taxes-to-sales ratio, althoughthat ratio was still positive after privatization (the difference is not statis-tically significant). In Mexico, the same ratio increased 7.6 percentagepoints. We do not have direct information for Argentina, Chile, and Peru,but given that net income over sales increased between 12 and 20 per-centage points, it is safe to assume that net taxes over sales also increasedby a few percentage points. Increased fiscal revenues mean more resourcesthat can be channeled to address pressing social needs, thereby benefitingsociety at large.
Higher tax revenues, if managed appropriately, should allow govern-ments an increased capability for welfare-improving activities to benefitthe poorest segments of society. Argentina, Mexico, and Peru are exam-ples of countries where privatization revenues and the increased taxreceipts from firms that formerly did not make profits were probably largeenough to offset the costs of job losses (Rama 1999; Chong and López-de-Silanes 2003). Privatization revenues need not be a blessing, however, ifthey are misused. Anuatti-Neto and his coauthors point out that in Brazilprivatization brought about high macroeconomic costs because the rev-enues it produced may have delayed fiscal adjustment and helped prop upan overvalued currency. This is obviously not an argument against priva-tization but rather an argument against the political misuse of the resourcesit generates.
Overall, the empirical literature on privatization shows that it affectsthe government’s budget by reducing previous subsidies to state-ownedenterprises, raising substantial revenue from the sale, and generatingtaxes on the increased profits. The benefits of a well-managed privatiza-tion program could be substantial not only for the privatized firm butalso for society.
Worker Exploitation
The second potential source of gains after privatization is transfers fromworkers to shareholders, because cuts in labor costs may account for a
28 CHONG AND LÓPEZ-DE-SILANES

large fraction of reduced total costs. Labor cost reductions can come fromtwo sources: fewer workers, or lower wages and benefits. As explainedabove, the set of papers presented here finds that direct employment by themedian state-owned firm falls between 5 and 57 percent after privatizationdepending on the country (see figure 1.6). Layoffs explain part of the costreduction and thus higher profits after privatization. The other potentialcomponent is cuts in wages and benefits. The hypothesis that privatizationleads to redistribution of income from workers to the new owners predictsa reduction in real wages and benefits for those workers who remain in thefirm. Data on wages at the firm level are scarce, but for those countrieswith available information (Argentina, Bolivia, Colombia, Mexico, andPeru), the evidence shows the exact opposite: an increase in the real andindustry-adjusted wages of workers in privatized firms (figure 1.10). Bothreal and industry-adjusted wages for the median firm increased by about100 percent in Mexico and Peru. Bolivia enjoyed real wage increases ofalmost 110 percent, while in Argentina the industry-adjusted increase wasabout 70 percent. Colombia shows the smallest increase, but even hereworkers in privatized firms increased their wages more than others in theprivate sector.
The two components of the transfers from workers to profits movein opposite directions. The fraction of profitability changes that maybe attributed to labor cost savings thus encompasses the lower costsstemming from layoffs and the higher costs from wage increases forthe remaining workers. Following the methodology in La Porta andLópez-de-Silanes (1999), the studies on Argentina, Bolivia, Mexico,and Peru compute the impact on profits from lower labor costs afterprivatization. The evidence from these four countries shows that evenwith the extreme assumption that laid-off workers had zero productiv-ity, the median savings from labor costs is equivalent to 16 percent ofthe gains in net income to sales after privatization or 20 percent of thegains in operating income to sales. The range of calculations extendsfrom close to 5 percent in Peru to 45 percent in Mexico (figure 1.11).If we assume that these workers are half as productive as those re-tained by the firm, the median savings from reduced labor costs for thecountries with data falls to 8 percent of the gains in net income to salesand 10 percent of the gains in operating income to sales. Overall, theevidence indicates that labor cost reductions are a source of the gainsafter privatization, but these savings do not explain the bulk of thehigher observed profitability.
The welfare of displaced workers after privatization is another issue forconsideration. The calculations above overstate the losses to workers tothe extent that some of those laid off found alternative employment orattach some value to leisure. There is evidence that this is in fact thecase; Galiani and his coauthors, for example, carried out a surveyamong displaced workers in Argentina. They found that the labor force
THE TRUTH ABOUT PRIVATIZATION IN LATIN AMERICA 29

participation rate was high among such workers and that although unem-ployment rates were above those of the rest of the population, many dis-placed workers found alternative jobs in which they felt their situation wasstable. Taking all factors into account, these authors estimate the welfareloss to displaced workers was equivalent to 39–51 percent of their earn-ings before privatization and that 40 percent thought they were not worseoff after privatization. This is surprising, since most theories and evidencesuggest that workers in state-owned enterprises are overpaid and havevery low productivity. Further work is needed in this area to provide clearer
30 CHONG AND LÓPEZ-DE-SILANES
Figure 1.10 Median Real and Industry-Adjusted Changes inWages after Privatization
Note: Real average wages are defined as the inflation-adjusted totalcompensation paid to the average worker. The Consumer Price Index wasused as a deflator to calculate real wages. Industry-adjusted wages arecomputed by augmenting the preprivatization value by the difference betweenthe cumulative growth rate of real wages per worker of the firm and thecumulative growth rate of real wages per worker of the control group in thepostprivatization period relative to the average real wage per worker beforeprivatization. For Bolivia, Mexico, and Peru, information is for a subsampleof firms that have available wage evidence.
Source: Chapters 2, 3, 6, 7, and 8.
0
20
40
60
80
100
120
140
160
180
200
Argentina Bolivia Colombia Mexico Peru
Percentage change
Real wage increase Industry-adjusted wage increase

THE TRUTH ABOUT PRIVATIZATION IN LATIN AMERICA 31
Figure 1.11 Transfers from Workers as a Percentage ofIncreased Profitability after Privatization
Note: The figure shows the median gain in net income to sales andoperating income to sales explained by savings in labor costs stemmingfrom layoffs after privatization. Savings from layoffs are calculated asfollows:
where WAGEbp is the average wage of employees in state-owned enterprisesbefore privatization; Lbp is the number of workers employed beforeprivatization; Lap is the number of workers employed after privatization; andSALESap is the monetary value of sales after privatization. The resultingnumber is thus expressed as a fraction of sales. We then divide by thepercentage point increase in the operating-income-to-sales ratio to determinethe percentage of the increase that results from transfers from workers. ForBolivia, Mexico, and Peru, information is for a subsample of firms that haveavailable wage evidence. For Bolivia, net-income-to-sales data are notavailable. For Peru, data on savings in labor costs as a percentage of operatingincome to sales are not available.
Source: Chapters 2, 3, 7, and 8.
WAGEbp(Lbp � Lap)
SALESap
05
101520253035404550
Argentina Bolivia Mexico Peru
Proportion of the gain (percent)
Net-income-to-sales ratio Operating-income-to-sales ratio
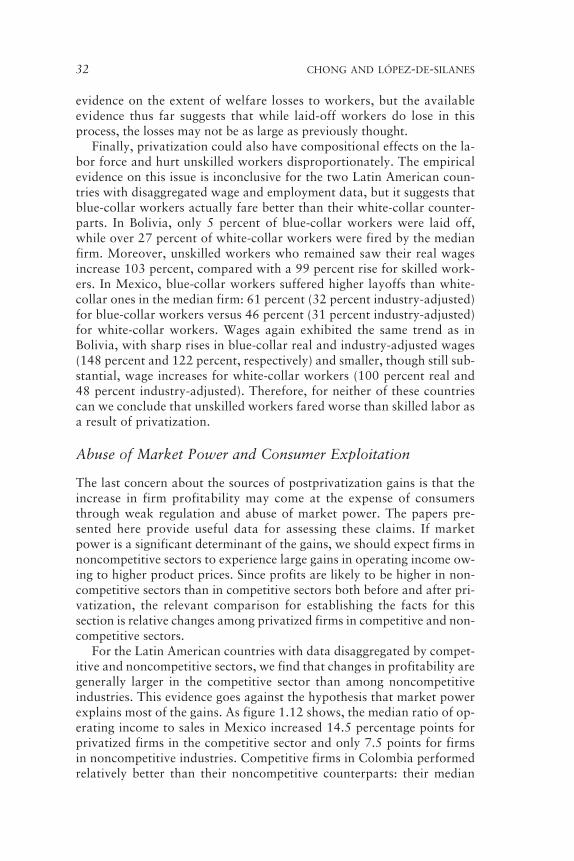
evidence on the extent of welfare losses to workers, but the availableevidence thus far suggests that while laid-off workers do lose in thisprocess, the losses may not be as large as previously thought.
Finally, privatization could also have compositional effects on the la-bor force and hurt unskilled workers disproportionately. The empiricalevidence on this issue is inconclusive for the two Latin American coun-tries with disaggregated wage and employment data, but it suggests thatblue-collar workers actually fare better than their white-collar counter-parts. In Bolivia, only 5 percent of blue-collar workers were laid off,while over 27 percent of white-collar workers were fired by the medianfirm. Moreover, unskilled workers who remained saw their real wagesincrease 103 percent, compared with a 99 percent rise for skilled work-ers. In Mexico, blue-collar workers suffered higher layoffs than white-collar ones in the median firm: 61 percent (32 percent industry-adjusted)for blue-collar workers versus 46 percent (31 percent industry-adjusted)for white-collar workers. Wages again exhibited the same trend as inBolivia, with sharp rises in blue-collar real and industry-adjusted wages(148 percent and 122 percent, respectively) and smaller, though still sub-stantial, wage increases for white-collar workers (100 percent real and48 percent industry-adjusted). Therefore, for neither of these countriescan we conclude that unskilled workers fared worse than skilled labor asa result of privatization.
Abuse of Market Power and Consumer Exploitation
The last concern about the sources of postprivatization gains is that theincrease in firm profitability may come at the expense of consumersthrough weak regulation and abuse of market power. The papers pre-sented here provide useful data for assessing these claims. If marketpower is a significant determinant of the gains, we should expect firms innoncompetitive sectors to experience large gains in operating income ow-ing to higher product prices. Since profits are likely to be higher in non-competitive sectors than in competitive sectors both before and after pri-vatization, the relevant comparison for establishing the facts for thissection is relative changes among privatized firms in competitive and non-competitive sectors.
For the Latin American countries with data disaggregated by compet-itive and noncompetitive sectors, we find that changes in profitability aregenerally larger in the competitive sector than among noncompetitiveindustries. This evidence goes against the hypothesis that market powerexplains most of the gains. As figure 1.12 shows, the median ratio of op-erating income to sales in Mexico increased 14.5 percentage points forprivatized firms in the competitive sector and only 7.5 points for firmsin noncompetitive industries. Competitive firms in Colombia performedrelatively better than their noncompetitive counterparts: their median
32 CHONG AND LÓPEZ-DE-SILANES

profitability decreased by only 2 percentage points, compared with the13 point drop for noncompetitive sectors, which underwent severederegulation. Data for Peru reinforce this trend. Firms in noncompetitivesectors increased their profitability by an average of 27 percentagepoints, while the mean increase in the whole sample was 32 percentagepoints. In Chile, although the noncompetitive sectors’ profitability in-creased more (8.5 percentage points), the increase is not statistically dif-ferent from the 5.5 percentage point increase in competitive sectors.
THE TRUTH ABOUT PRIVATIZATION IN LATIN AMERICA 33
Figure 1.12 Median Changes in Profitability of PrivatizedFirms in Competitive and Noncompetitive Industries in Latin America
Note: Profitability is defined as the median ratio of operating income tosales, except for Peru where it is the mean net-income-to-sales ratio. ForChile, firms are classified as noncompetitive if they are intelecommunications, electricity, or social services sectors; and as competitive ifthey are not. For Colombia, noncompetitive firms are those in the energysector; all other sectors are considered competitive. For Mexico, firms areclassified into competitive and noncompetitive based on the description of theindustry provided by the privatization prospectus of the firm. For Peru, thenoncompetitive sectors are electricity, financial, and telecommunications, andthe data for the competitive industries show aggregate information for thewhole sample. For Peru, the information is expressed in mean values.
Source: Chapters 5–8.
−20
−15
−10
−5
0
5
10
15
20
25
30
35
Chile Colombia Mexico Peru
Percentage points
Competitive industries Noncompetitive industries

Regression analysis for Peru using concentration proxies also con-tributes to assessing the role of market power. Confirming the trendabove, market concentration in Peru was found not to be a significant de-terminant of profits. Finally, information on firms’ product prices beforeand after privatization in Mexico also suggests that market power is not alarge source of gains. Cumulative price increases in the noncompetitivesector in Mexico were only 6 percent higher than the growth of the in-dustry-matched producer price index over the postprivatization period. LaPorta and López-de-Silanes (1999) use these product price data to draw aquick calculation of the contribution of changes in prices to the observedchange in profitability of the whole sample of privatized firms. Their datashow that price increases accounted for only 5 (7) percent of the change inmean (median) operating income to sales after privatization.17
If market power were an important source of profits for privatizedfirms, those in noncompetitive sectors would show lower growth in em-ployment, investment, and output than firms in competitive sectors (LaPorta and López-de-Silanes 1999). Available evidence for Latin Americadoes not support these claims (figure 1.13). In Mexico and Colombia, em-ployment dropped 46 percent and 24 percent, respectively, for firms in thecompetitive sector, and it decreased only 19 percent and 10 percent fornoncompetitive firms. In Chile, the pattern is even more striking: employ-ment increased in both sectors, rising 16 percent in competitive industriesand 32 percent in noncompetitive sectors. For Peru, employment datashow no divergence in results between competitive and noncompetitivesectors, as employment fell 50 percent in noncompetitive sectors and 51percent for the whole sample. Output growth data for Mexico and Perureinforce this trend. In Peru, output growth for both sectors was very sim-ilar, with noncompetitive firms increasing sales 47 percent and the sales ofthe whole sample going up 50 percent. Similarly, in Mexico, output ofcompetitive firms increased 56 percent, while sales in the noncompetitivesector went up 78 percent.
Additional evidence comes from investment patterns. Investment peremployee grew 49 percent and 154 percent in the noncompetitive sectorsof Mexico and Colombia, respectively. Meanwhile, the same ratio grewonly 29 percent in competitive sectors of Mexico and stagnated in Colom-bia’s competitive industries. The evidence for Chile here runs in the oppo-site direction, but it is hardly conclusive of market power abuse. Althoughinvestment per employee grew 74 percent in Chile’s competitive sectors, italso grew almost 50 percent in noncompetitive industries.
Overall, the Latin American evidence presented in this section does notsupport the claim that consumer exploitation is a significant source of pri-vatization gains. These studies suggest that a large source of the gains maylie in deep firm restructuring that leads to lower costs and higher effi-ciency. Evidence from Chile and Mexico is suggestive of this pattern. Unitcosts in the competitive sector fell 3 percent in Chile and 13 percent in
34 CHONG AND LÓPEZ-DE-SILANES
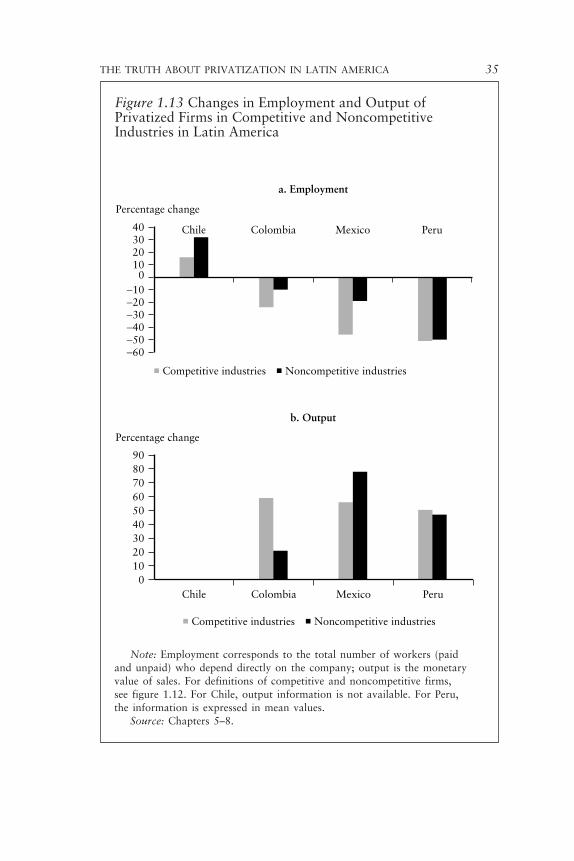
THE TRUTH ABOUT PRIVATIZATION IN LATIN AMERICA 35
Figure 1.13 Changes in Employment and Output ofPrivatized Firms in Competitive and NoncompetitiveIndustries in Latin America
Note: Employment corresponds to the total number of workers (paidand unpaid) who depend directly on the company; output is the monetaryvalue of sales. For definitions of competitive and noncompetitive firms, see figure 1.12. For Chile, output information is not available. For Peru,the information is expressed in mean values.
Source: Chapters 5–8.
−60−50−40−30−20−10
010203040 MexicoChile Colombia Peru
Percentage change
Competitive industries Noncompetitive industries
MexicoChile Colombia Peru
Percentage change
Competitive industries Noncompetitive industries
0102030405060708090
a. Employment
b. Output

Mexico, while those of noncompetitive industries decreased 8 percent and24 percent, respectively. Abuse of market power may be an issue for somefirms, but the bulk of the evidence suggests it is not the main explanationof privatization gains across the board.
Dimensions of Consumer Welfare beyond the Effect on Prices
Beyond its effect on prices, privatization may affect consumer welfarethrough decreased access, worsened distribution, and reduced quality ofgoods and services (Akram 2000; Bayliss and Hall 2000; Bayliss 2001;Birdsall and Nellis 2002; Freije and Rivas 2002). These concerns aresignificant because the poorest segments of society are generally themain consumers of goods and services previously produced by state-owned enterprises. The evidence presented earlier on increased output,firm restructuring, and prices should alleviate some of these concerns,particularly for the case of standardized goods and products. Output andprice are suitable proxies for measuring the availability of most of thesegoods. In the area of public utilities and services, however, access anddistribution may still be a concern, since some segments of the popula-tion may lack access to the network and may thus be unable to purchasethese services regardless of their price. Similarly, the quality of servicessuch as water, electricity, telecommunications, or transportation may bereduced to try to meet price regulations. In all of these circumstances,consumer welfare may suffer as a result of privatization.
Some reviews of privatization cases are pessimistic about its success inthe utilities sector. Bayliss (2002) points to examples of botched privati-zations in Puerto Rico and Trinidad and Tobago, where water privatiza-tion led to price hikes and no apparent improvement in provision. Simi-larly, the privatization of the electricity sector in the Dominican Republicis claimed to have led to frequent blackouts and increases in utility prices,culminating in civil unrest and the deaths of several demonstrators(Bayliss 2002). One can always find cases of failure and cases of success.Therefore, the only way to address this question fully is to gather datathat allow a systematic and economically robust analysis.
A first generation of privatization studies sheds light on this subject byanalyzing case studies in several countries. Galal and others (1994), for ex-ample, analyze 12 privatization cases in Chile, Malaysia, Mexico, and theUnited Kingdom, including firms in sectors such as airlines and telecom-munications. Their results indicate that privatization led to welfare gainsof about 25 percent of preprivatization sales in 11 of the 12 cases. Earlywork on the privatization experience in Argentina also shows significantgains in access to services such as water, power, and port infrastructure(Carbajo and Estache 1996; Crampes and Estache 1996; Estache and Ro-dríguez 1996). Ramamurti (1996, 1997) concludes that privatization had
36 CHONG AND LÓPEZ-DE-SILANES

a positive effect on Latin American telecommunications and railroad in-frastructure because it led to a technological overhaul of the sectors andincreased both access and the quality of service. Similarly, Ros (1999) ex-amines the effect of privatization on the telecommunications sector in 110countries and finds that the transfer of control from the public to the pri-vate sector led to significantly higher telephone density levels. Althoughthe level of competition had a positive effect on industry efficiency, onlyprivatization was related to network expansions.
A new generation of studies based on more detailed data and neweconometric approaches corroborates the early results in terms of accessand quality. For instance, Torero and Pasco-Font (2001) show that thenumber of telephone lines in Peru increased from 2.9 to 7.8 per 100 in-habitants and that the electrification coefficient jumped from 48 to 70percent between 1993 and 1998. A study by Torero, Schroth, and Pasco-Font (2003) tests the impact of the privatization of telecommunicationson the welfare of urban consumers in Peru; the authors find significantwelfare gains and dramatic improvements in terms of efficiency, access,and quality of service. Similarly, Fischer, Gutiérrez, and Serra, in chapter5, find improvements in access and service quality in the telecommunica-tions sector in Chile, where the number of phone lines in operation in-creased sixfold, bringing density levels from 4.7 lines per 100 inhabitantsin 1987 to 23.1 lines in 2001. The average length of the waiting periodfor a new phone line dropped from 416 days in 1993 to only 6 days in2001, while the waiting list for a phone dropped from a peak of 314,000households in 1992 to only 32,000 by 2001.18
The region offers a number of similar examples of improvements in ac-cess to water, electricity, telecommunications, and other services that havecreated benefits beyond lower prices. Nonetheless, one may still be con-cerned about the distributional impacts of the increased coverage, as itmay not be reaching the poorest sectors of society. Bayliss (2002) recog-nizes that privatization has the potential for welfare-enhancing outcomesif it allows low-income households to gain access to the service network.However, her review of cases suggests that the drive to seek higher profitsin the private provision of services will almost invariably lead to a loss forthe poor. Birdsall and Nellis (2002) also argue that privatization may leadto improvements in efficiency and profitability while worsening incomedistribution and wealth.19 They conclude that the gains in profitability areprobably not worth the distributive effects they create.
Recent detailed econometric analyses with better samples provide someanswers to these concerns. In chapter 2 Galiani and his coauthors offersome of the best data available for the municipal level in Argentina, whereabout 30 percent of localities privatized water delivery services. Their re-sults show a significant increase in the proportion of households con-nected to water services in municipalities that privatized compared withthose that did not. Their regression estimates suggest that the number of
THE TRUTH ABOUT PRIVATIZATION IN LATIN AMERICA 37

households connected to the water network increased by 11.6 percent asa result of privatization (with the exception of Buenos Aires, where 98 per-cent of households were already connected). Using less comprehensivedata from Bolivia, Barja, McKenzie, and Urquiola (2002) find that priva-tization increased access to water relative to both the existing trend andnonprivatized areas. They further report that the relative benefits of waterprivatization are greatest for the poorest segments of the population, whogained from the largest increases in access.
For Argentina, Galiani and his coauthors cleverly design tests thatmap water delivery to infant mortality in an effort to directly addressthe concerns about quality after privatization. Their regressions showthat, controlling for other factors, child mortality fell by 5 to 7 percentmore in areas of Argentina that privatized water services than in thosethat did not. The effect was largest in the poorest municipalities thatprivatized, where child mortality fell 24 percent. Privatization translatedinto 375 child deaths prevented per year. McKenzie and Mookherjee(2003) provide an overview of four studies from Argentina, Bolivia,Mexico, and Nicaragua that use household surveys to measure the im-pact of privatization on welfare. They conclude that the sale of state-owned enterprises brought positive welfare effects and that the poorestsegments of the population appear to be relatively better off. In Ar-gentina, for example, they report falling electricity prices that improvedthe welfare of all income deciles. For Bolivia, they report welfare gainsfrom increased electricity access for all but the top income deciles; thegains exceeded 100 percent for the lowest deciles despite real price in-creases. The price of electricity increased in Nicaragua, but the welfareloss to households that already had access was less than 1 percent oftheir per capita expenditure, because the budget share allocated to elec-tricity is typically low. At the same time, the value of gaining access toelectricity was positive and of a larger magnitude for lower-incomedeciles that had relatively less access before privatization. The net posi-tive impact of electricity privatization for these low-income groupsreached nearly 16 percent of per capita expenditure.
So far, we have provided evidence that counters most of the criticismsof privatization. What remains unaddressed, however, is how to makesense of the cases of privatization failures pointed out by several authors(see Bayliss 2002 and Birdsall and Nellis 2002 for reviews). It will alwaysbe possible to find instances of failed privatizations, but analysts shouldnot distort this information and turn it into an argument against privati-zation itself. The overwhelming evidence showing that it can be doneright suggests that we should look for the reasons why it failed in certaininstances. In the next two sections, we argue that many of these failureshave two roots: the role of politicians in the privatization process, whichmay lead to corruption, renegotiation, and opportunistic behavior; andthe lack of an appropriate postprivatization regulatory and corporate
38 CHONG AND LÓPEZ-DE-SILANES

governance framework that sets the boundaries for nonabusive corporatebehavior and facilitates investment.
What Is the Best Approach for Selling? Concernsabout the Privatization Process
Privatization requires heavy government involvement because the politi-cians involved are frequently setting up the method and running the saleprocess. This may lead to favoritism and nepotism (Perotti 1995; Bor-tolotti, Fantini, and Scarpa 2001; Biais and Perotti 2002; Earle andGehlbach 2003). Looking at the privatization process in this light showsthe relevance of understanding the impact of the process’s characteristicsand the opportunities for corruption they may provide. Privatizationmay be the last chance for politicians to appropriate cash flows or de-liver favors that further their political objectives. The role of politiciansin privatization is central in three areas: the method of privatization cho-sen, the restructuring of firms before they are sold off, and the types ofcontracts written.
The Method of Privatization
The way the privatization process is carried out is of utmost impor-tance. A successful program can increase social welfare and bring aboutefficiency gains across the board, while a botched process may createopportunities for inefficiency and corruption. In Argentina, as in othercountries, an obscure bidding process raised suspicions of corruptionand political favoritism. When governments fail to ensure a crystal clearprocess, the perception of corruption can breed unease among the pub-lic and may lead to a backlash against privatization. In principle, a clearand homogeneous privatization process should be established from thestart, and special emphasis should be placed on making the auction re-sults as transparent as possible. In reality, however, only a handful ofcountries have followed this path. Many fail to establish clear guidelinesbecause their privatization programs were originally planned as smallaffairs or because they lack the necessary skills to do so. Alternatively,politicians may have strong incentives to create obscure and arbitraryprivatization mechanisms that allow them to extract high rents forthemselves or their constituencies. To analyze the validity of such claimsempirically, one could use systematic evidence of the impact of the pri-vatization process on sale prices and on subsequent firm performance.This is difficult although not impossible.
The existing empirical literature has taken two approaches to addressthese issues. The first approach uses cross-country comparisons. Chongand Riaño (2003), for example, analyze 285 privatizations in industrial
THE TRUTH ABOUT PRIVATIZATION IN LATIN AMERICA 39

and developing countries and find that bureaucratic quality, lack of cor-ruption, and privatization prices are positively related. Their results showthat when they control for macroeconomic conditions and firm character-istics, a 1 point increase in their 10 point index of bureaucratic quality isassociated with a 10.2 percent increase in the price paid per dollar of assetsin privatizations, while a similar increase in the 10 point lack-of-corrup-tion index results in a 9.6 percent rise in the price paid per dollar of assets.Bortolotti, Fantini, and Scarpa (2001), who analyze data for 49 countries,conclude that strong legal institutions and adequately developed capitalmarkets substantially contribute to successful privatizations. Finally,Chong and Sánchez (2003) provide data for infrastructure privatizationcontracts in Brazil, Chile, Colombia, and Peru to show that establishing aclear and transparent contractual arrangement helped achieve the privati-zation objectives set out by these governments. These results together sug-gest that the success or failure of privatization programs is influenced bythe honesty and efficiency of the government and by the simplicity andtransparency of contractual agreements.
The second approach to analyzing the impact of the method of privati-zation is to use within-country data. López-de-Silanes (1997) for Mexicoand Arin and Okten (2002) for Turkey are able to control for potentiallyomitted variables and therefore provide a full analysis of the impact of sev-eral restructuring measures and privatization mechanisms on the net priceof state-owned enterprises.20 The case of Mexico is a good illustration ofthe impact of specific differences in the privatization process, since theprogram lasted for more than a decade and was executed by differentadministrations. An additional benefit of this sample is that although thegeneral method of a first-price sealed-bid auction was the rule throughoutthe period, certain firms were privatized with specific requirements thatprovide useful variations to analyze. Between 1982 and 1988 privatizationwas not conducted as a centralized program, but rather each ministry wasallowed to sell enterprises in its realm of operations. This resulted in aplethora of requirements for bidders and methods of payment. Theadministration that took power in 1988 established a centralized privati-zation office and developed a homogeneous process, which improvedtransparency by mandating public disclosure of the bidding stages throughthe press. Econometric estimations show that once the analyst controls formacroeconomic and firm-level characteristics, firms privatized during thesecond period sold at a premium of about 15 percent (López-de-Silanes1997). The gains in efficiency owing to improved coordination and thepresumably reduced room for corruption and political meddling have aclear mapping in the price received for enterprises sold.
Econometric work with firm-level data from Mexico also shows thatdifferent auction requirements make a substantial difference in the netprice received by the government for state-owned enterprises. Firms soldunder restrictions banning foreign bidders, requiring a prequalification
40 CHONG AND LÓPEZ-DE-SILANES

stage, or asking for cash-only payments brought significantly lower pricesper dollar of assets sold. Such requirements thus have an effect that is in-dependent of the fact that they reduce competition in the auction; this evidence suggests that idiosyncratic and arbitrary privatization processescome at a direct cost to the government in terms of the price paid for state-owned enterprises.
The speed at which each privatization takes place may also have an im-pact on net prices raised. The theoretical literature is split between the ben-efits and costs of a short process. While rushing a sale carries potentialcosts such as not attracting enough bidders or not having enough time toset up an appropriate regulatory framework, the advocates of a speedyprocess point to the benefits of quickly disposing of money-losing firmsand avoiding costly restructuring (Coes 1998). The recent literatureaddresses this issue by measuring the impact of the length of the privati-zation process on the price paid for the specific state-owned enterprise.Some believe that a lengthy privatization process should come at no cost,either because managers’ concern for their reputation will lead them to runthe firm efficiently or because the announcement of privatization may im-prove stakeholders’ incentives and thus boost company performance(Caves 1990; Bolton and Roland 1992). Conversely, to the extent that theprivatization process is similar to the situation of a firm in financial dis-tress, the privatization announcement may be followed by a deteriorationof incentives and performance (Altman 1984; Wruck 1990).
Within-country firm-level panel data are ideally set up for resolvingthis dispute. Evidence from Mexico and Turkey shows that after onecontrols for firm and industry characteristics, lengthy privatizationprocesses come at a substantial cost to the government. The announce-ment of privatization in these countries brought a considerable deterio-ration in performance, which is probably attributable to the collapse ofmanagers’ incentives and to the performance of disgruntled workers whosee their futures as highly uncertain.21
Restructuring Firms before Privatization
Government restructuring of state-owned enterprises before their sale isan issue likely to be fraught with political difficulties given that this isprobably the last chance for government officials to extract benefits. Aswith other policies, restructuring programs can be defended rationally ongrounds that they may increase revenues from the sale or ensure that firmsare sent out to the market in the best condition to minimize layoffs andsecure their survival (Nellis and Kikeri 1989; Kikeri, Nellis, and Shirley1992; Kikeri 1999). As a result, there is great ambivalence about the opti-mal policy approach toward restructuring before privatization.
López-de-Silanes (1997) summarizes the theoretical arguments for andagainst various measures of prior restructuring and suggests that the issue
THE TRUTH ABOUT PRIVATIZATION IN LATIN AMERICA 41

should be resolved empirically. This is not a straightforward proposition,however, even with firm-level data. Restructuring measures are not un-dertaken randomly but are selectively targeted to firms that need themmost. We would expect the government to absorb the debt of highly indebtedstate-owned enterprises, to fire workers when firms face serious overem-ployment, and to invest in new machinery when production processes areoutdated. If the endogenous nature of these measures is not considered, werun the risk of reaching the wrong conclusions because regression coeffi-cients would capture not only the effect of the restructuring measure, butalso the negative effects of being in distress or having a bloated work force.
Available empirical evidence strongly suggests that restructuringpolicies do not lead to better net prices per dollar of assets sold. For thecase of Mexico, López-de-Silanes (1997) shows that, after he controlsfor endogeneity, the optimal policy seems to be to refrain as much aspossible from engaging in the restructuring of state-owned enterprises.Some of the most popular measures, such as debt absorption, do not in-crease net prices, while measures such as the establishment of invest-ment and efficiency programs actually reduce net prices. These factsmay be the result of politicians themselves carrying out the restructur-ing programs and emphasizing their political preferences when decidingwhat to invest in and what to do with existing infrastructure. It is disin-genuous to think that the government can satisfy the desires of the newowners better than they could themselves. In Mexico’s case, a fewchanges to the privatization mechanism could have yielded large bene-fits: emphasizing speed, firing the chief executive officer before privati-zation, and refraining from costly restructuring measures would haveincreased net prices by 135 percent. A similar study by Chong andGaldo (2004) analyzes a cross-country sample of telecommunicationsfirms that were privatized between 1985 and 2000; the authors’ ordinaryleast squares (OLS) and instrumental variables (IV) regressions yield noevidence that streamlining before privatization is linked to higher netprices. Finally, evidence from Turkey also supports the conclusion thatrestructuring measures are either useless or counterproductive in raisingnet prices (Arin and Okten 2002).
One of the most sensitive topics in the area of firm restructuring be-fore privatization is that of labor force retrenchment. To analyze the im-pact of such retrenchment policies beyond their effects on privatizationprices, we construct (in an earlier paper, Chong and López-de-Silanes2003) a worldwide privatization database containing detailed prepriva-tization firm and labor force characteristics, labor restructuring meas-ures undertaken by the government, and information on postprivatiza-tion labor rehiring policies, among other things. Table 1.4 shows thatdespite heavy unionization rates, most governments around the worlddownsize the labor force of state-owned enterprises before privatiza-tion. Labor retrenchment occurred in 78 percent of the sample, while
42 CHONG AND LÓPEZ-DE-SILANES

only 33 percent of all firms experienced voluntary downsizing pro-grams. Employment guarantees were established as part of privatizationin 28 percent of the cases, while pay cuts before privatization were in-frequent (7.5 percent). Asia is the only region of the world with a sig-nificantly lower frequency of labor downsizing before privatization.Governments in Latin America deviated little from the general pattern;the only notable exception is the low frequency of employment guaran-tees, which was used in only 8 percent of all firms privatized in the re-gion. Table 1.4 also shows that state-owned enterprises in Latin Amer-ica were heavily unionized and active: two-thirds of state-ownedenterprises privatized in the region experienced labor strikes in the threeyears before privatization.
Following our earlier methodology, we ran OLS and instrumental vari-ables regressions for the 94 state-owned enterprises privatized in LatinAmerica to test whether labor restructuring policies in this region trans-lated into higher net prices per dollar of firm sales. The first column oftable 1.5 shows the OLS results, which suggest that labor downsizing be-fore privatization has a significant negative impact, equivalent to 28 per-cent of the average net price per dollar of sales. The instrumental variablesresults in column 2 show that once we control for endogeneity, the coeffi-cient drops essentially to zero and loses all significance.22 The results forLatin America reflect those for other regions: labor downsizing before pri-vatization is not priced by the buyers. From the point of view of increasedgovernment revenues, if a state-owned enterprise is overstaffed, it is prob-ably best for governments to wait and let the new owners make the deci-sions after they buy the firm.
The other two regressions in table 1.5 focus on the effect of laborretrenchment in the form of voluntary downsizing programs in whichgovernments offer monetary incentives for workers to quit. Even aftercontrolling for endogeneity, voluntary downsizing leads to a marginallysignificant discount in the net price paid by private buyers. This negativeeffect might be explained by adverse selection, in that workers with thehighest productivity or the best chances of finding alternative work aremore likely to leave. Voluntary downsizing may therefore hurt firms,since it tends to result in the termination of valuable workers and the re-tention of less productive ones (Fallick 1996; Rama 1999). Despite thefact that voluntary separation programs are politically palatable, thefindings here show that these programs may weaken firms and distortthe composition of the work force, as predicted by theoretical models(Kahn 1985; Diwan 1994; Jeon and Laffont 1999).
To shed further light on the “quality of firing” carried out by gov-ernments before privatization, we collected data on the hiring policies ofstate-owned enterprises after privatization (Chong and López-de-Silanes2003). While hiring new workers probably responds to the legitimatebusiness needs of privatized firms, rehiring previously fired workers
THE TRUTH ABOUT PRIVATIZATION IN LATIN AMERICA 43

44
Table 1.4 Labor Restructuring before Privatization, by Region
Latin Africa and Developed TransitionIndicator America Asia Middle East countries economies All
Sample size, unionization, and strikes before privatization
Number of firms 101 24 64 77 42 308Firms with unions before privatization 92.1 58.3 81.2 83.1 88.1 84.4Firms with strikes before privatization 66.3 29.2 45.3 29.8 47.6 47.4
Type of restructuring measure before privatization
Downsizing 82.2 58.3 79.7 79.2 76.2 78.2Voluntary downsizing 32.5 12.5 45.3 28.6 14.3 32.5Employment guarantee 8.4 20.1 51.6 13 52.4 28.2Pay cut 8.9 0 1.6 13 7.1 7.5
Note: The table shows the number of firms included for each region, the regularity of unions and strikes, and the frequency of restructuringmeasures undertaken before privatization. The variables are defined as follows: (1) firms with unions before privatization is the percentage ofprivatized state-owned enterprises that had a union up to three years before privatization; (2) firms with strikes before privatization is of state-owned enterprises that suffered any kind of protest such as picketing or strikes during the three years before privatization; (3) downsizing is adummy variable equal to 1 if the firm undertook any downsizing of the labor force up to three years before privatization, and 0 otherwise;downsizing may be classified as voluntary or compulsory, and may be neutral (no particular group targeted) or targeted according to age (age-biased downsizing), skills (skill-biased downsizing), or gender (female-biased downsizing); (4) voluntary downsizing is a dummy variable equal to1 if the state-owned enterprise reduced its labor force in an exclusively noncoercive manner during the three years before privatization, and 0otherwise; the most common methods of voluntary downsizing are incentive-based measures such as severance packages and pensionenhancements; (5) employment guarantee is a dummy variable equal to 1 if the state-owned enterprise made any promise regarding theemployment status of workers during the three years before privatization, and 0 otherwise; (6) pay cut is a dummy variable equal to 1 if therewere any reductions in the salary or wage of workers during the three years before privatization, and 0 otherwise.
Source: Chong and López-de-Silanes (2003).
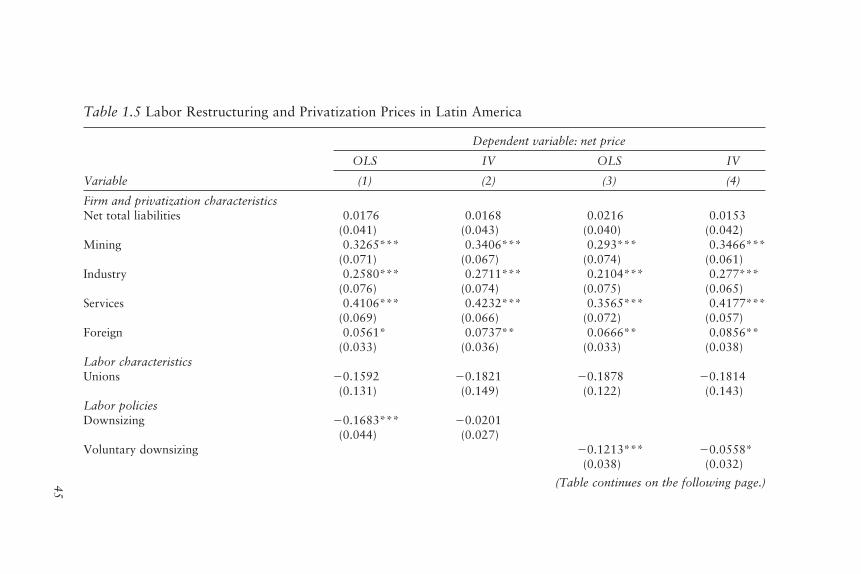
45
Table 1.5 Labor Restructuring and Privatization Prices in Latin America
Dependent variable: net price
OLS IV OLS IV
Variable (1) (2) (3) (4)
Firm and privatization characteristicsNet total liabilities 0.0176 0.0168 0.0216 0.0153
(0.041) (0.043) (0.040) (0.042)Mining 0.3265*** 0.3406*** 0.293*** 0.3466***
(0.071) (0.067) (0.074) (0.061)Industry 0.2580*** 0.2711*** 0.2104*** 0.277***
(0.076) (0.074) (0.075) (0.065)Services 0.4106*** 0.4232*** 0.3565*** 0.4177***
(0.069) (0.066) (0.072) (0.057)Foreign 0.0561* 0.0737** 0.0666** 0.0856**
(0.033) (0.036) (0.033) (0.038)Labor characteristicsUnions �0.1592 �0.1821 �0.1878 �0.1814
(0.131) (0.149) (0.122) (0.143)Labor policiesDownsizing �0.1683*** �0.0201
(0.044) (0.027)Voluntary downsizing �0.1213*** �0.0558*
(0.038) (0.032)
(Table continues on the following page.)

46
Table 1.5 (continued)
Dependent variable: net price
OLS IV OLS IV
Variable (1) (2) (3) (4)
Macroeconomic variableGross domestic product 0.0673*** 0.0681* 0.0687*** 0.0713***
(0.010) (0.010) (0.010) (0.011)Constant �1.2120*** �1.3512* �1.2715*** �1.4746***
0.334 0.341 0.311 0.350***
Observations 94 94 94 94R2 0.47 0.38 0.53 0.41F 11.36 10.32 11.59 12.35Prob � F 0.000 0.000 0.000 0.000
* Significant at the 10 percent level.** Significant at the 5 percent level.*** Significant at the 1 percent level.Note: IV � instrumental variables and OLS � ordinary least square. The dependent variable is the net privatization price/sales, which is
defined as the amount that accrues to the government from the sale of the state-owned enterprise after all privatization and restructuringcosts are taken into account, adjusted by the percentage of company shares sold and divided by the average net sales of the state-owned

47
enterprise during the three years before its privatization. The present value of the resulting number as of 2000 is used. The independentvariables are defined as follows: (1) net total liabilities is a dummy variable equal to 1 if net total liabilities of the firm were greater than 0up to three years before privatization, and 0 otherwise; (2) dummy variables for sectors (mining, industry, and services) are equal to 1 if thestate-owned enterprise is part of that sector, and 0 otherwise; (3) foreign is a dummy variable equal to 1 if foreign firms were allowed to bidon the sale of the state-owned enterprise, and 0 otherwise; (4) unions is a dummy variable equal to 1 if the state-owned enterprise had aunion up to three years before privatization, and 0 otherwise; (5) downsizing is a dummy variable equal to 1 if the firm undertook anydownsizing of the labor force up to three years before privatization, and 0 otherwise; downsizing may be classified as voluntary orcompulsory, and may be targeted according to age (age-biased downsizing), skills (skill-biased downsizing), or gender (female-biaseddownsizing) or may be neutral (no particular group targeted); (6) voluntary downsizing is a dummy variable equal to 1 if the state-ownedenterprise reduced its labor force in an exclusively noncoercive manner during the three years before privatization, and 0 otherwise; the mostcommon methods of voluntary downsizing are incentive-based measures such as severance packages and pension enhancements; (7) grossdomestic product is the log of the average GDP in the country (in U.S. dollars at purchasing power parity) during the three years beforeprivatization. All regressions include firm size controls. Columns 1 and 3 provide estimates from OLS regressions, while columns 2 and 4show the second stage of the two-step instrumental variables procedure used in order to account for the endogenous nature of the labordownsizing variables. The instrumental variables approach is carried out according to the procedure outlined in Chong and López-de-Silanes(2004). Robust standard errors are given in parentheses.
Source: Chong and López-de-Silanes 2003.

could mean that the downsizing programs before privatization went toofar. After all, why else would a firm rehire a worker who was deemedexpendable a relatively short time before? Figure 1.14 shows that closeto 45 percent of all firms that underwent labor retrenchment programsin the three years before privatization hired back some of the fired work-ers after privatization. Across countries, only 10 percent of firms withgovernment-run retrenchment programs ended up hiring back some ofthose workers to their previous positions within 18 months after priva-tization. Latin America is the region with the highest percentage of firmsrehiring workers (53 percent) and rehiring to the same jobs that they hadpreviously held (20 percent).
48 CHONG AND LÓPEZ-DE-SILANES
Figure 1.14 Rehiring after Privatization, by Region
Note: Variables are defined as follows: rehired is a dummy variableequal to 1 if the privatized firm rehired previously fired workers up to 18 months after privatization, and 0 otherwise; rehired same is a dummyvariable equal to 1 if the privatized firm rehired previously fired workersand placed them in the same department from which they were fired upto 18 months after privatization, and 0 otherwise. Previously firedworkers are those who were terminated during the three years beforeprivatization.
Source: Chong and López-de-Silanes 2003.
0
10
20
30
40
50
60
Latin America Asia Africa andMiddle East
Industrialcountries
Transitioneconomies
All
Percentage
Rehired Rehired same

THE TRUTH ABOUT PRIVATIZATION IN LATIN AMERICA 49
Table 1.6 analyzes the determinants of the probability that the privatizedstate-owned firm with labor retrenchment programs before privatizationwould hire new workers (new hires) or former workers previously fired bythe government (rehires). Results show that the existence of a voluntarydownsizing program before privatization does not predict a higher proba-bility of firms hiring new workers after privatization (column 1), but it in-creases by 34 percentage points the probability that the private buyer willrehire some of the workers who were previously fired by the government(column 2).23
The hiring behavior of firms in the postprivatization period says agreat deal about the quality of the firing process and provides furtherevidence against the wisdom of government restructuring before privati-zation. Based on the evidence in this section, governments should thinkhard before restructuring the work force of state-owned enterprises in-tended for privatization. The political costs are high, the impact on netprices is low, and the firm could end up losing some of its most valuableemployees.
Type of Privatization Contract
The type of privatization contract written is another potential area thatmay leave room for opportunistic behavior from politicians and privatebuyers. The simplest contracts are straightforward, outright sales of assetsin which the government disconnects itself completely from the opera-tional future of the privatized firm. Other types of contracts may actuallylead to a perverse relationship between the privatized firm and the state asmanagers and bureaucrats collude to serve their own interests at theexpense of consumers and taxpayers. These contracts could take the formof the provision of services, the construction of infrastructure projects, orthe establishment of joint ventures between private companies and thegovernment. The common element in all of these cases is that the umbili-cal cord between the government and the firm has not been severed, leav-ing ample room for a complex set of problems. Shleifer and Vishny (1994)develop a theoretical model to help understand the incentives faced byfirms in instances of partial privatization. When privatized firms dependsignificantly on the state, they may not restructure as expected because itis easier for them to extract rents from the government than to undergopainful reforms. At the same time, politicians have incentives to keep themafloat by subsidizing them and shielding them from competition. Thesearrangements persist because they are beneficial for both parties, althoughthey reduce social welfare. As Bayliss (2002) points out, water privatiza-tion programs in Guinea and Côte d’Ivoire are examples of poor deals inwhich the private sector was able to make substantial profits controllingthe distribution and fee collection of the service, while the governmentspent resources maintaining the infrastructure.

50 CHONG AND LÓPEZ-DE-SILANES
Table 1.6 New Hires and Rehires in Privatized Firms in Latin America
Dependent variable: Dependent variable: new hires rehires
Probit ProbitIndicator (1) dF/dX (2) dF/dX
Voluntary 0.6035 [0.1600] 0.9004** [0.3370]downsizing (0.3835) (0.3826)
Strikes 0.6026 [0.1408] 1.0382** [0.3961](0.431) (0.423)
Foreign �0.3092 [�0.0852] �0.2469 [�0.0943]participation (0.4074) (0.3879)
Collective �0.2898 [�0.0767] �0.8634* [�0.3340]relations (0.4835) (0.5221)laws
Constant 0.1453 �10.1961**(4.2973) (4.3490)
Observations 76 76Log likelihood �29.49 �33.99Wald chi2 6.58 13.60
* Significant at the 10 percent level.** Significant at the 5 percent level.*** Significant at the 1 percent level.Note: The dependent variable in the first regression is new hires, which is a
dummy variable equal to 1 if the privatized firm hired new workers up to 18months after privatization, and 0 otherwise; in the second regression, it is rehires,which is a dummy variable equal to 1 if the privatized firm rehired previously firedworkers up to 18 months after privatization, and 0 otherwise. The independentvariables are defined as follows: (1) voluntary downsizing is a dummy variableequal to 1 if the state-owned enterprise cut its labor force in an exclusivelynoncoercive manner during the three years before privatization, and 0 otherwise;the most common methods of voluntary downsizing are incentive-based measuressuch as severance packages and pension enhancements; (2) strikes is a dummyvariable equal to 1 if there were any protests, picketing, or strikes up to three yearsbefore privatization, and 0 otherwise; (3) foreign participation is a dummy variableequal to 1 if foreign firms were allowed to bid for the state-owned enterprise, and0 otherwise; (4) the collective relations laws index ranges from 0 to 3 and measuresthe level of protection granted to workers by labor and employment laws (highervalues of the index represent more stringent laws regarding worker protection); itmeasures the areas of collective bargaining, worker participation in management,and collective disputes. All regressions include a partial privatization dummy,sectoral dummies, and country macroeconomic controls. Standard errors andmarginal effects are given in parentheses and brackets, respectively.
Source: Data collected by the authors; Chong and López-de-Silanes 2003; Botero andothers 2005.

To find a solution to the complications that these relationships gener-ate, Engel, Fischer, and Galetovic (1999, 2001) analyze the Chilean infra-structure concessions of the 1990s and note that franchising programs canprovide a better alternative to the traditional approach of full state fi-nancing for infrastructure projects, particularly for governments that arefinancially and politically constrained. The regulatory framework, how-ever, must be effective if governments are to reap the potential benefits offranchising and avoid falling into hold-up problems in which firms under-bid to get the contracts but then threaten bankruptcy if a renegotiation isnot granted.
Guasch (2001) provides empirical evidence that renegotiations in con-cessions are fairly common. He analyzes more than 1,000 concessionsgranted in Latin American countries during the 1990s and finds that morethan 60 percent of them were substantially renegotiated within threeyears. Infrastructure projects are usually very risky because of the diffi-culty inherent in forecasting demand. Firms therefore press for incomeguarantees and other explicit or implicit insurance mechanisms that endup costing the government too much. It may occasionally be in a country’sbest interest to give out these guarantees, but they should be explicit andtransparent, and they should ideally be made in exchange for a fee (Engel,Fischer, and Galetovic 2003).
In all of these situations, the solution should also include very clear dis-closure and monitoring mechanisms to avoid related-party transactions atunfair terms. Such transactions may end up bankrupting the joint ventureor the asset that the government has an interest in keeping afloat to thebenefit of the private corporation, as happened in the case of highwaysand commercial banks in Chile and Mexico (Ramírez 1998; Johnson andothers 2000; La Porta, López-de-Silanes, and Zamarripa 2003). These arenot easy issues to solve, and many of the failures of privatization can belinked to perverse incentives provided by misguided privatization conces-sion contracts.
The evidence in this section can be understood from a political econ-omy perspective. Privatization involves politicians with incentives andobjectives. Therefore, the design of the privatization process, the contractsultimately written, the restrictions attached to the sale of state-owned en-terprises, and the restructuring measures adopted before privatizationshould be understood as opportunities for politicians to extract rents andhand out favors. This perspective helps rationalize instances in which cor-ruption in privatization leads to disastrous results. The policy lesson isclear: a transparent and expeditious privatization process leaves less roomfor corruption and collusion among politicians and businessmen who maytry to benefit from opaqueness. One must also consider the time needed toset up an effective privatizing agency and build the regulatory frameworkthat should be in place before state-owned enterprises with market powerare sold. We turn to this topic in the next section.
THE TRUTH ABOUT PRIVATIZATION IN LATIN AMERICA 51

Complementary Policies: Reregulation and Corporate Governance
The previous section analyzed some of the main privatization failuresemerging from policies or decisions taken before or at the time of privati-zation. In this section, we turn to the impact of the regulatory and institu-tional framework after privatization. Privatization should not be looked atin isolation. Its success is likely to depend on at least two sets of comple-mentary policies. The first is deregulation and reregulation of sectors withmarket power or in which government ownership represented a substan-tial percentage of total assets before privatization. The second is theestablishment of a set of institutions that promote good corporate gover-nance, which facilitates access to capital and allows recently privatizedfirms to finance their growth without dependence on the state. Many pri-vatization failures can be explained by a lack of careful consideration ofthese two complementary sets of policies.
Privatization, Reregulation, and Deregulation
An appropriate regulatory framework after privatization is a key compo-nent of the success or failure of the program, particularly in utilities andservices. A common element across many failed examples of privatizationis inadequate regulation leading to suboptimal levels of competition or sit-uations in which producers are allowed to keep the gains from privatiza-tion without sharing them with consumers (Boubakri and Cosset 1999;Megginson and Netter 2001). The classic position of critics is to turn thisinto an argument against further privatization. However, the ample em-pirical evidence surveyed here shows that privatization can be done cor-rectly and can lead to social gains. This evidence should be enough to dis-card a simplistic interpretation of cases of failures.
Regulation should be carefully revised in conjunction with privatiza-tion in two prominent situations: industries characterized as naturalmonopolies or by the presence of oligopolistic markets, and industries inwhich the government owns most of the assets in the industry even if noindividual firm has substantial market power. Sectors with heavy statepresence tend to be protected by a web of regulations originally institutedto cut the losses of state-owned firms and reduce fiscal deficits. In some ofthese cases, the necessary regulatory effort can be best understood asderegulation to eliminate protective structures that shield companies fromcompetition and allow privatized firms to make extraordinary gains at thecost of consumers. As explained in both the early and more recent litera-ture, competition and deregulation should be carefully considered in pri-vatization (Yarrow 1986; Allen and Gale 2000). Winston (1993) arguesthat deregulation has the power to produce efficiency improvements,
52 CHONG AND LÓPEZ-DE-SILANES

which can benefit consumers and producers. There is no reason to believethat deregulation should lead to different outcomes in the case of privati-zation of overprotected industries.24 In sectors with oligopolistic power,the deregulation effort needs to be complemented by a reregulation thatclearly establishes a new package of rules and disclosures that will enhancesupervision and reduce abuse of market power.
Reregulation of oligopolistic sectors is complicated because of weak-nesses in regulatory governance. As Fischer and Serra (2002) explain,regulators are often subject to pressures from populist politicians and in-dustry lobbyists, and their low salaries make them susceptible to cap-ture. Moreover, regulatory systems often operate within the context ofan inefficient and perhaps even corrupt judicial system.
Deregulation complements privatization in two ways (La Porta andLópez-de-Silanes 1999). First, product market competition provides atool for weeding out the least efficient firms. This process may take toolong—or not work at all—if regulation inhibits new entry or makes exitcostly. Wallsten (2001) undertakes an econometric analysis of the effectsof telecommunications privatization and regulation in a panel of 30countries in Latin America and Africa. His results show that competitionfrom mobile operators and privatization combined with the existence ofa separate regulator are significantly associated with increases in laborefficiency, mainlines per capita, and connection capacity. A casual inter-pretation of his results suggests that privatization of oligopolistic indus-tries without concurrent reforms may not necessarily improve welfare.
Second, deregulation may also complement privatization by raisingthe cost of political intervention. Whereas an inefficient monopoly cansquander its rents without endangering its existence, an inefficient firm ina competitive industry would have to receive a subsidy to stay afloat. Theintroduction of competition forces politicians to pay firms directly to en-gage in politically motivated actions, whereas previously the costs ofthese measures were absorbed by a state-owned firm that did not have toworry about market performance. In fact, competition is often restrictedprecisely because it raises the costs of political influence. Colombia andMexico provide good examples of deregulatory policy actions that, whencoupled with privatization, can be used as a lever to transform the eco-nomic landscape and reduce political interference in the economy. In theearly 1990s Colombia began an economic openness program through thepromotion of market competition and deregulation. As Pombo andRamírez describe in chapter 6, privatization was perceived as an instru-ment for economic deregulation and the promotion of market competi-tion. A decade earlier Mexico started to transform its previously closedeconomy characterized by capital controls, price regulation, restrictionson foreign direct investment, high tariffs, import quotas, and a largestate-owned public sector. As in the case of Colombia, privatization cou-pled with deregulation played a key role in the drive to restructure the
THE TRUTH ABOUT PRIVATIZATION IN LATIN AMERICA 53

economy and help privatized state-owned enterprises catch up to theirprivate peers (La Porta and López-de-Silanes 1999).
Generally speaking, reregulation or deregulation can take place at threedifferent moments: before privatization, at the time of privatization, or af-ter the state-owned enterprise has been sold. The literature emphasizes theimportance of having efficient regulation at an early stage. Reregulation orderegulation before privatization of the industry may increase the pace ofdivestiture and help sell companies at a higher price if it reduces regulatoryrisk.25 Wallsten (2002) finds that countries that established a separate reg-ulatory authority in telecommunications before privatization not onlybenefited from increased telecommunications investment and telephonepenetration but also gained from investors’ willingness to pay more for thetelecommunications firms.26 Establishing effective preprivatization regu-lation is not easy, however, for at least three reasons. First, changes to theregulatory regime before privatization are likely to lower the profits ofstate-owned enterprises, which translates into higher financial needs forthe government at a very difficult time. Second, the political will for a trueregulatory reform might not materialize without the pressure of imminentprivatization. Finally, governments with little experience in privatizationoften find it difficult to carry out an effective preprivatization regulatoryreform.
Deregulation and reregulation at the time of privatization solve thefirst two problems and reduce regulatory risk discounts. As long as a suit-able regulatory framework is in place at or before the time of privatiza-tion, consumers and the government should benefit from the process.Chisari, Estache, and Romero (1999) use a computable general equilib-rium model for Argentina to show that the gains from efficient regulationare nontrivial. Their model estimates the gains from the private operationof utilities at about 0.9 percent of GDP and those of effective regulation atan additional 0.35 percent of GDP. Moreover, the distribution of the gainsacross income classes is driven by the effectiveness of the regulators. Inshort, they claim that clear reregulation is good for the poor.
Lack of regulatory capabilities at the time of privatization, coupledwith a desire to maximize price at the time of the sale, has led several gov-ernments to postpone full and clear reregulation. Establishing an ade-quate regulatory scheme after privatization, however, may be problem-atic from a political economy perspective. Since the agency in charge ofenforcing and regulating the contracts is often the same as or subordi-nated to the agency that carried out the privatization, the people involvedhave an incentive to implement lax enforcement to avoid exposing pastmistakes. Chong and Sánchez (2003) document that for a broad numberof concessions in infrastructure projects, the private sector was able tobargain and keep protective regulation after privatization because of thethreat of bankruptcy, withdrawal, or desertion of future investment com-mitments. All of these affect the reputation and credibility of privatizing
54 CHONG AND LÓPEZ-DE-SILANES

politicians. According to Guasch (2001), concession contracts in devel-oping countries often led to renegotiations over the last 15 years. In LatinAmerica and the Caribbean, 40 percent of all concession contracts wererenegotiated just over 2.2 years after they were signed. Engel, Fischer, andGaletovic (2003) argue that opportunistic renegotiations of concessionsare common because of a “privatize now, regulate later” approach. Costoverruns in concessions and unclear rules governing contingencies pro-vide private owners with the opportunity to extract economic rents fromthe government. Finally, attempting to substantially alter the regulatoryframework after the sale is further complicated by the fact that new con-stituencies against reregulation are created at the time of privatization.Shareholders and managers of privatized state-owned enterprises arejoined by workers and even consumers who could benefit from the pro-tective regulatory status of firms.
The political economy approach explains why it is hard to bringabout changes in regulation after privatization and why privatized firmsare frequently able to renegotiate their contracts on more favorableterms. It is therefore advisable to push for changes in the regulatoryframework at the time of privatization or earlier, if possible. Perfectingthe new regulatory framework may take a lot of time, however, and thisshould not be used as an excuse for postponing the privatization ofmoney-losing entities.
Privatization and Corporate Governance
The last issue we address in this paper is the connection between the suc-cess of privatization and the establishment of an institutional frameworkthat promotes good corporate governance. The absence of this frameworkincreases the cost of capital and thus prevents privatized firms from un-dertaking the investments needed to operate in a more competitive envi-ronment. Access to alternative sources of finance at a low cost allows firmsto survive and grow without state help.
The development and appropriate functioning of stock and credit mar-kets need a solid regulatory framework that promotes investor protectionand disclosure. Recent research shows a strong link between a firm’saccess to capital and efficiently enforced laws (La Porta and others 1997,1998, 2000b, 2002; La Porta, López-de-Silanes, and Shleifer 2003). Incountries where large numbers of firms have been sent out to the privatemarket and deregulation has increased competition and lowered tradebarriers, there is an urgent need for institutions that can efficiently chan-nel resources to the new private sector. The old laws and institutions mighthave been efficient in covering the needs of state-owned enterprises, butprivate enterprises and privatized firms require different services and standto benefit from the development of deep stock and credit markets. Ariyoand Jerome (1999) argue that the absence of developed capital markets
THE TRUTH ABOUT PRIVATIZATION IN LATIN AMERICA 55

and the lack of appropriate legal and judicial structures have hindered thesuccess of privatization in Africa.
Before privatization, government banks are typically used as a source offinancing. Yet in most privatization programs, the banking sector is one ofthose turned over to private hands. If financing for privatized state-ownedenterprises is expected to come from privatized banks—or from any otherprivate credit institution—then creditor rights, embedded in bankruptcylaws, and the efficiency of courts must be strengthened and streamlined.Without proper bankruptcy procedures that allow for the expedient recov-ery of assets, financial institutions will be reluctant to lend for fear of po-tential losses, and they may end up failing to satisfy the financial needs ofthe private sector. The banking system itself is rendered more vulnerable tocrises without effective creditor rights, since it loses its ability to repossesscollateral expediently (La Porta, López-de-Silanes, and Zamarripa 2003).
The development of large stock markets where firms can access long-term funds is also an important complementary measure to privatization.In some cases governments have provided a boost to stock markets by pri-vatizing state-owned enterprises through initial public offerings. This isnot enough, however, to ensure the development of the market and itsusefulness as a source of future financing for these firms. Privatizationwithout a commitment to improve shareholder rights in corporate and se-curities laws will probably lead to widespread abuse and appropriation ofbenefits by managers or those in control, with only small gains for mi-nority investors in the form of dividends, for example (La Porta and oth-ers 2000a; López-de-Silanes 2002; La Porta, López-de-Silanes, andShleifer 2003). The failure to institute appropriate securities laws and ef-fective enforcement may be responsible for many of the scandals that arenow blamed on privatization in countries such as the Czech Republic(Dyck 2001; Glaeser, Johnson, and Shleifer 2001). An additional benefitof corporate governance reform is that the improvement in disclosuresand accounting standards facilitates the work of regulators. As Carey andothers (1994) and Campos-Méndez, Trujillo, and Estache (2001) argue,postprivatization regulators end up relying on standard accounting datainstead of imposing specific regulatory accounting needs. If this is thecase, enhanced accounting standards should be of great benefit to regula-tors of privatized firms, particularly in the area of disclosure of related-party transactions and conflicts of interest.
The reform of corporate governance institutions through the establish-ment and enforcement of effective securities, corporate, and bankruptcylaws should become an essential complementary policy to prevent expro-priation by controlling investors and to promote the development of sta-ble sources of funds to which privatized firms can turn to finance theirgrowth. Bear in mind that many financially troubled private firms becamestate owned in the last 50 years when limited access to capital pushed themto seek government financing (López-de-Silanes 1994).
56 CHONG AND LÓPEZ-DE-SILANES

Conclusions
The push for privatization and the drive to restructure the role of the statein production have lost their appeal. A large political backlash to privatiza-tion has been brewing for some time, and public opinion and policymakersin Latin America and other regions of the world have now turned againstprivatization. The goal of this chapter is to help set the privatization recordstraight by analyzing systematic evidence emerging from comprehensivestudies around the world. In this quest, we benefit from a recent series of ac-ademic papers focusing on the Latin American experience. Given their ex-tensive coverage and systematic econometric approach, these papers areable to address the series of concerns voiced against privatization.
The evidence lines up: countries that privatize benefit, and the gainsnot only are kept by firm owners—they are also distributed to society.These findings do not mean that failures do not occur, but rather thatthey are not the norm. Most instances of failure can be explained by threefactors. First, opaque processes with heavy state involvement open thedoor to corruption and opportunistic behavior. Second, poor contract de-sign and regulatory capture are linked to a lack of deregulation and in-adequate reregulation. Third, deficient corporate governance institutionsraise the cost of capital, hamper restructuring efforts, and may throwfirms back into the hands of the state. The understanding of the politicaleconomy mechanisms behind the causes of failure should be used to im-prove privatization, not to stop it.
Notes
The authors gratefully acknowledge comments from Eduardo Bitrán, EduardoEngel, Luis Felipe López-Calva, John Nellis, Máximo Torero, and Andrés Velasco.They would also like to thank Patricio Amador, José Caballero, Cecilia Calderón,Virgilio Galdo, Magdalena S. López-Morton, Alejandro Ponce, and Alejandro Riañofor outstanding research assistance.
1. On the poor performance of state-owned enterprises, see Boardman andVining (1989) and Mueller (1989); on improvements after privatization, see Meg-ginson, Nash, and van Randenborgh (1994); Ehrlich and others (1994); Frydmanand others (1999); La Porta and López-de-Silanes (1999); Dewenter and Malatesta(2001); Megginson and Netter (2001); Sheshinski and López-Calva (2003); andChong and López-de-Silanes (2004).
2. See Bayliss (2002) and Birdsall and Nellis (2002) for recent cross-countryreviews of privatization failures. Criticism about specific countries or industriesincludes Coes (1998), Nellis (1999), Harper (2000), Wallsten (2001), and Stiglitz(2002).
3. Polls show that privatization is becoming less popular even in the UnitedKingdom, which led the privatization effort in the 1980s. In 1983 around 43percent of people wanted more privatization, but that number was down to 24
THE TRUTH ABOUT PRIVATIZATION IN LATIN AMERICA 57

percent by 1992, and it barely reached 19 percent in 2002 (“The End of Priva-tization,” The Economist, June 13, 1998, 53–54).
4. Earle and Gehlbach (2003) provide a framework that rationalizes why pol-icymakers may pay too much attention to public sentiment and thus refrain frompotentially welfare-improving actions.
5. All dollar amounts are in U.S. dollars unless otherwise specified.6. Recent research shows that the privatization effort in Africa may have been
highly underestimated. Bennell (1997) argues that most papers studying privatizationin Africa are based on low-quality or outdated samples. Based on a comprehensivesurvey of privatization transactions that spans 16 years (1980–95) and includes over2,000 privatizations, he concludes that African privatization programs are largerthan previously thought and that they increased substantially in the 1990s.
7. “State-Owned Stockpiles,” The Economist, March 31, 2001, 58–59.8. The analysis in this paper covers only the privatization experience at the
country or federal level—that is, assets sold by the central or federal government—which accounts for the majority of assets sold around the world so far. A differentsample and experience is that of the privatization of services at the local, municipal,or county level, where local governments “privatize” the public provision of services.These programs have taken place in only a few nations, such as the United States(López-de-Silanes, Shleifer, and Vishny 1997) and England, where public service pro-vision by the private sector has become a central issue.
9. Differences in accounting procedures may also be problematic in determin-ing adequate measures of operating performance (Megginson and Netter 2001).
10. Financial firms privatized in Mexico are analyzed in a separate paper (López-de-Silanes and Zamarripa 1995).
11. Sheshinski and López-Calva (2003) make similar claims after they analyzeprivatization programs and remaining state-owned assets around the world.
12. The role of the Institute for Industrial Promotion in creating new manufac-turing enterprises was central during the 1950s and 1960s. The largest private capi-tal enterprises in the steel, chemical, paper, fertilizer, metalworking, and automobilesectors today were companies formerly associated with the institute.
13. Not surprisingly, chapter 3 represents the first formal empirical study of theimpact of privatization on firm performance in Bolivia.
14. For example, Pombo and Ramírez used the first method in Colombia,whereas Anuatti-Neto and and his coauthors (Brazil) and Fischer, Serra, and Gutiér-rez (Chile) employed both methods.
15. Comprehensive privatization studies for eastern European countries also findhigher profitability results, although the accounting data for such countries are moreproblematic. Some examples are Claessens, Djankov, and Pohl (1997) for the CzechRepublic; Dyck (1997) for East Germany; and Frydman and others (1999) for theCzech Republic, Hungary, and Poland. For most of these cases, accounting differencesbefore and after privatization are of greater concern than in Latin America, where thestate-owned enterprises filed and collected information similar to that of private firms.
16. Data for Colombia are from the energy sector. 17. To isolate the contribution of changes in relative prices as a factor behind the
observed profitability gains, the calculation compares the observed percentage pointincrease in operating income to sales with what would have taken place if privatizedfirms had increased output but left real prices unchanged at preprivatization levels.Specifically, the formula used for the price contribution is
PRICECONTRIB �SALESap � COSTap
SALESap�S [SALESap^ Q1 � � R T � COSTap
SALESap^ (1 � �),
58 CHONG AND LÓPEZ-DE-SILANES

where SALESap represents sales in the postprivatization period, COSTap repre-sents operating costs in the postprivatization period, and π is the increase in realprices.
18. Trujillo and others (2002) provide evidence for 21 Latin American countriesbetween 1985 and 1998 and find that private sector involvement in utilities andtransportation yielded marginally positive results on per capita GDP.
19. Birdsall and Nellis (2002) indicate that these results are less valid for LatinAmerica than for transition economies and less relevant for utilities than for banksor oil.
20. The net price in these studies is defined as the net privatization price (afterthe costs of privatization and restructuring are deducted) divided by the dollarvalue of the firms’ assets. The benefit of focusing on this measure is that it providesa useful framework for comparing across firms and gives a benchmark againstwhich to think about the relative price of other privatization goals pursued by thegovernment. Privatization programs are typically designed with the aim of pursu-ing revenue generation, to get out of a fiscal crisis, or to serve redistributive pur-poses. For Brazil, Colombia, Mexico, and Peru, the price paid was a crucial moti-vation in selecting winners for almost all privatized state-owned enterprises (seeLópez-de-Silanes 1997, Torero 2002, and the chapters in this volume on Brazil andColombia). Furthermore, economists generally endorse the goal of maximizing rev-enues. Bolton and Roland (1992) show that a policy of maximizing net sales rev-enue is likely to be consistent with a policy of maximizing social welfare since theproceeds from the sale can be used to subsidize employment, investment, a socialsafety net, and other public goods.
21. López-de-Silanes 1997; Arin and Okten 2002. The evidence for the case ofTurkey should be regarded as tentative since the lack of data has thus far preventeda robust instrumental variables analysis for this country.
22. We apply a two-step instrumental variables approach by estimating a non-linear reduced-form equation that describes the probability that a particular labor re-structuring policy will be implemented. The instruments used are classified in twogroups: firm-level and macroeconomic-level determinants. The firm-level variablesincluded the presence of a leading agent bank, involvement of a ministry before pri-vatization, the political affiliation of unions, and sectoral dummies. The macroeco-nomic variables include the average GDP growth rate and the degree of openness inthe three years before privatization, as well as the legal origin of the country. Noneof these variables are statistically significant when included in the price equation. TheF statistic for the excluded instruments is statistically significant at 1 percent in allcases.
23. Regressions control for labor rigidities coming from the collective relationslaws from each country, as the incidence of rehires after privatization could also re-flect the firing costs and rigidities of the labor market.
24. For the case of Mexico, La Porta and López-de-Silanes (1999) find thatderegulation—particularly the removal of price or quantity controls and trade barri-ers—is linked to faster convergence of privatized firms to industry benchmarks.
25. See Bortolotti, Fantini, and Siniscalco (2001) for the case of the electricitysector.
26. Chong and Galdo (2004) find similar results.
References
Akram, Tanweer. 2000. “Publicly Subsidized Privatization: A Simple Model ofDysfunctional Privatization.” Applied Economics 32 (13): 1689–99.
THE TRUTH ABOUT PRIVATIZATION IN LATIN AMERICA 59

Allen, Franklin, and Douglas Gale. 2000. “Corporate Governance and Competi-tion.” In Xavier Vives, ed., Corporate Governance: Theoretical and EmpiricalPerspectives. Cambridge, U.K.: Cambridge University Press.
Altman, Edward. 1984. “A Further Empirical Investigation of the Bankruptcy CostQuestion.” Journal of Finance 39 (4): 1067–89.
Arin, Kermin, and Cagla Okten. 2002 “The Determinants of Privatization Prices:Evidence from Turkey.” Working Paper. Louisiana State University, BatonRouge, La.
Ariyo, Ademola, and Afeikhena Jerome. 1999. “Privatization in Africa: An Ap-praisal.” World Development 27 (1): 201–13.
Barja, Gover, David McKenzie, and Miguel Urquiola. 2002. “Capitalization andPrivatization in Bolivia.” Cornell University, Ithaca, N.Y.
Bayliss, Kate. 2001. “Privatization of Electricity Distribution: Some Economic, So-cial and Political Perspectives.” Report 2001-04-E-Distrib. University of Green-wich, Public Services International Research Unit, Greenwich, U.K.
———. 2002. “Privatization and Poverty: The Distributional Impact of Utility Pri-vatization.” Annals of Public and Cooperative Economics 73 (4): 603–25.
Bayliss, Kate, and David Hall. 2000. “Privatization of Water and Energy inAfrica.” Report 2000-09-U-Afr. University of Greenwich, Public Services Inter-national Research Unit, Greenwich, U.K.
Bennell, Paul. 1997. “Privatization in Sub-Saharan Africa: Progress and Prospectsduring the 1990s.” World Development 25 (11): 1785–803.
Biais, Bruno, and Enrico Perotti. 2002. “Machiavellian Privatization.” AmericanEconomic Review 92 (1): 240–58.
Birch, Melissa, and Jerry Haar, eds. 2000. The Impact of Privatization in the Amer-icas. Boulder, Colo.: North-South Center Press.
Birdsall, Nancy, and John Nellis. 2002. “Winners and Losers: Assessing the Dis-tributional Impact of Privatization.” Working Paper 6. Center for Global De-velopment, Washington, D.C.
Boardman, Anthony, and Aidan R. Vining. 1989. “Ownership and Performance inCompetitive Environments: A Comparison of the Performance of Private,Mixed, and State-Owned Enterprises.” Journal of Law and Economics 32 (1):1–33.
Bolton, Patrick, and Gerald Roland. 1992. “Privatization Policies in Central andEastern Europe.” Economic Policy 6 (15): 275–303.
Bortolotti, Bernardo, Marcella Fantini, and Carlo Scarpa. 2001. “Privatization:Politics, Institutions and Financial Markets.” Emerging Markets Review 2 (2):109–36.
Bortolotti, Bernardo, Marcella Fantini, and Domenico Siniscalco. 2001. “Regula-tion and Privatization: The Case of Electricity.” In Giuliano Amato and LaraineL. Laudati, eds., The Anti-Competitive Impact of Regulation. Northampton,U.K.: Elgar Press.
Botero, Juan, and others. 2005. “The Regulation of Labor.” Quarterly Journal ofEconomics, forthcoming.
Boubakri, Narjess, and Jean Claude Cosset. 1998. “The Financial and OperatingPerformance of Newly Privatized Firms: Evidence from Developing Countries.”Journal of Finance 53 (3): 1081–110.
———. 1999. “Does Privatization Meet the Expectations? Evidence from AfricanCountries.” Working Paper. École des Hautes Etudes Commerciales, Montreal.
60 CHONG AND LÓPEZ-DE-SILANES

Campbell-White, Oliver, and Anita Bhatia. 1998. “Privatization in Africa.” Direc-tions in Development Report 17972. World Bank, Washington, D.C.
Campos-Méndez, Javier, Lourdes Trujillo, and Antonio Estache. 2001. “Processes,Information and Accounting Gaps in the Regulation of Argentina’s PrivateRailways.” Working Paper 2636. World Bank, Washington, D.C.
Carbajo, José, and Antonio Estache. 1996. “Competing Private Ports: Lessonsfrom Argentina.” Viewpoint Note 100. World Bank, Washington, D.C.
Carey, Alan, and others. 1994. “Accounting for Regulation in U.K. Utilities.” Lon-don: Institute of Chartered Accountants of England and Wales.
Caves, Richard. 1990. “The Concentration-Margins Relationship Reconsidered:Comments.” Brookings Papers on Economic Activity: Microeconomics322–24.
Chisari, Omar, Antonio Estache, and Carlos Romero. 1999. “Winners andLosers from the Privatization and Regulation of Utilities: Lessons from a Gen-eral Equilibrium Model of Argentina.” World Bank Economic Review 13 (2):357–78.
Chong, Alberto, and Virgilio Galdo. 2004. “Streamlining and Privatization Pricesin the Telecommunications Industry.” Economica.
Chong, Alberto, and Florencio López-de-Silanes. 2003. “Privatization and LaborRestructuring around the World.” Yale University, School of Management,New Haven, Conn.
———. 2004. “Privatization in Latin America: What Does the Evidence Say?”Economía 4(2): 37–94.
Chong, Alberto, and Alejandro Riaño. 2003. “Institutions and PrivatizationPrices.” Inter-American Development Bank, Washington, D.C.
Chong, Alberto, and Jose Miguel Sánchez, eds. 2003. Medios privados parafines publicos: arreglos contractuales y participacion privada en infraestruc-tura en America Latina. Washington, D.C.: Inter-American DevelopmentBank.
Claessens, Stjin, Simeon Djankov, and Gerhard Pohl. 1997. “Ownership and Cor-porate Governance: Evidence from the Czech Republic.” Policy Research Paper1737. World Bank, Washington, D.C.
Clarke, George, and Robert Cull. 1999. “Bank Privatization in Argentina: A Modelof Political Constraints and Differential Outcomes.” Working Paper 2636.World Bank, Washington, D.C.
Coes, Donald. 1998. “Beyond Privatization: Getting the Rules Right in LatinAmerica’s Regulatory Environment.” Quarterly Review of Economics and Finance 38 (3): 525–32.
Crampes, Claude, and Antonio Estache. 1996. “Regulating Water Concessions:Lessons from the Buenos Aires Concession.” Viewpoint Note 91. World Bank,Washington, D.C.
D’Souza, Juliet, and William L. Megginson. 1999. “The Financial and OperatingPerformance of Newly Privatized Firms in the 1990s.” Journal of Finance 54(4): 1397–438.
Dewenter, Kathryn L., and Paul H. Malatesta. 2001. “State-Owned and Privately-Owned Firms: An Empirical Analysis of Profitability, Leverage and Labor In-tensity.” American Economic Review 91 (1): 320–34.
Diwan, Ishac. 1994. “Public Sector Retrenchment and Severance Pay: Nine Propo-sitions.” In Shahid Chaudhry, Gary Reid, and Waleed Malik, eds., Civil Service
THE TRUTH ABOUT PRIVATIZATION IN LATIN AMERICA 61

Reform in Latin America and the Caribbean: Proceedings of a Conference.Technical Paper 259. Washington, D.C.: World Bank.
Dyck, Alexander. 1997. “Privatization in Eastern Germany: Management Selec-tion and Economic Transition.” American Economic Review 87 (4): 565–97.
———. 2001. “Privatization and Corporate Governance: Principles, Evidence andFuture Challenges.” World Bank Research Observer 16 (1): 59–84.
Earle, John, and Scott Gehlbach. 2003. “A Spoonful of Sugar: Privatization andPopular Support for Reform in the Czech Republic.” Economics and Politics 15(1): 1–32.
Ehrlich, Isaac, and others. 1994. “Productivity Growth and Firm Ownership: AnEmpirical Investigation.” Journal of Political Economy 102 (5): 1006–38.
Engel, Eduardo, Ronald Fischer, and Alexander Galetovic. 1999. “The ChileanInfrastructure Concessions Program: Evaluation, Lessons, and Prospects forthe Future.” Working Paper 60. Centro de Economía Aplicada, Santiago,Chile.
———. 2001. “Least-Present-Value-of-Revenue Auctions and Highway Franchis-ing.” Journal of Political Economy 109 (5): 993–1020.
———. 2003. “Privatizing Highways in Latin America: Fixing What WentWrong.” Economía 4 (1): 129–64.
Estache, Antonio, and Martín Rodríguez. 1996. “Regulatory Lessons from Ar-gentina’s Power Concessions.” Viewpoint Note 99. World Bank, Washington,D.C.
Fallick, Bruce. 1996. “A Review of the Recent Empirical Literature on DisplacedWorkers,” Industrial and Labor Relations Review 50 (1): 5–16.
Fischer, Ronald, and Pablo Serra. 2002. “Regulating the Electricity Sector in LatinAmerica.” Economía 1 (1): 155–98.
Freije, Samuel, and Luis Rivas. 2002. “Privatization, Inequality and Welfare: Evi-dence from Nicaragua.” Instituto de Estudios Superiores de Administración,Centro de Desarrollo Humano y Organizaciones, Caracas, Venezuela.
Frydman, Roman, and others. 1999. “When Does Privatization Work? The Impactof Private Ownership on Corporate Performance in Transition Economies.”Quarterly Journal of Economics 114 (4): 1153–91.
Galal, Ahmed, Leroy Jones, Pankay Tandon, and Ongo Vogelsang. 1994. WelfareConsequences of Selling Public Enterprises. Oxford, U.K.: Oxford UniversityPress.
Glaeser, Edward, Simon Johnson, and Andrei Shleifer. 2001. “Coase versus theCoasians.” Quarterly Journal of Economics 116 (3): 853–99.
Guasch, José Luis. 2001. “Concessions and Regulatory Design: Determinants ofPerformance—Fifteen Years of Evidence.” Policy Research Paper. World Bank,Washington, D.C.
Hachette, Dominique, and Rolf J. Lüders. 1994. Privatization in Chile: An Eco-nomic Appraisal. San Francisco, Calif.: ICS (International Center for EconomicGrowth) Press.
Harper, Joel T. 2000. “The Performance of Privatized Firms in the Czech Repub-lic.” Working Paper. Florida Atlantic University, Boca Raton, Fla.
Jeon, Doh-Shin, and Jean-Jacques Laffont. 1999. “The Efficient Mechanism forDownsizing the Public Sector.” World Bank Economic Review 13 (1):67–88.
62 CHONG AND LÓPEZ-DE-SILANES

Johnson, Simon, and others. 2000. “Tunneling.” American Economic Review 90(May, Papers and Proceedings, 1999): 22–27. Reprinted in Klaus J. Hopt, ed.,Capital Markets and Company Law. Oxford, U.K.: Oxford University Press,2002.
Kahn, Charles. 1985. “Optimal Severance Pay with Incomplete Information.”Journal of Political Economy 93 (3): 435–51.
Kikeri, Sunita. 1999. “Privatization and Labor: What Happens to Workers WhenGovernments Divest?” Technical Paper 396. World Bank, Washington, D.C.
Kikeri, Sunita, John Nellis, and Mary Shirley. 1992. “Privatization: The Lessons ofExperience.” Policy Views. World Bank, Country Economics Department,Washington, D.C.
La Porta, Rafael, and Florencio López-de-Silanes. 1999. “The Benefits of Privati-zation: Evidence from Mexico.” Quarterly Journal of Economics 114 (4):1193–242.
La Porta, Rafael, Florencio López-de-Silanes, and Andrei Shleifer. 2002. “Govern-ment Ownership of Banks.” Journal of Finance 57 (1): 265–302.
———. 2003. “What Works in Securities Laws?” Working Paper 9882. NationalBureau of Economic Research, Cambridge, Mass.
La Porta, Rafael, Florencio López-de-Silanes, and Guillermo Zamarripa. 2003.“Related Lending.” Quarterly Journal of Economics 118 (1): 231–68.
La Porta, Rafael, Florencio López-de-Silanes, Andrei Shleifer, and Robert Vishny.1997. “Legal Determinants of External Finance.” Journal of Finance 52 (3):1131–50.
———. 1998. “Law and Finance.” Journal of Political Economy 106 (6): 1113–55.———. 2000a. “Agency Problems and Dividend Policies around the World.” Journal
of Finance 55 (1): 1–33.———. 2000b. “Investor Protection and Corporate Governance.” Journal of
Financial Economics 58 (1): 3–27.———. 2002. “Investor Protection and Corporate Valuation.” Journal of Finance
57 (3): 1147–70.López-Calva, Luis F. 2004 “Comments to Privatization in Latin America: What
Does the Evidence Say?” Economía 4(2): 95–111.López-de-Silanes, Florencio. 1994. “A Macro Perspective on Privatization: The
Mexican Program.” In Santiago Levy and Lars E. O. Svensson, eds., Macro-economic Aspects of Privatization. Washington, D.C.: World Bank.
———. 1997. “Determinants of Privatization Prices.” Quarterly Journal of Eco-nomics 107 (4): 965–1025.
———. 2002. “The Politics of Legal Reform.” Economía 2 (2): 91–152.López-de-Silanes, Florencio, and Guillermo Zamarripa. 1995. “Deregulation and
Privatization of Commercial Banking.” Revista de Análisis Económico 10 (2):113–64.
López-de-Silanes, Florencio, Andrei Shleifer, and Robert W. Vishny. 1997. “Priva-tization in the United States.” Rand Journal of Economics 28 (3): 447–71.
Lora, Eduardo. 2001. “Structural Reforms in Latin America: What Has Been Re-formed and How to Measure It.” Working Paper W-466, Inter-American De-velopment Bank, Research Department, Washington, D.C.
Lüders, Rolf J. 1991. “Chile’s Massive SOE Divestiture Program, 1975–1990: Fail-ures and Successes.” Contemporary Policy Issues 9 (4): 1–19.
THE TRUTH ABOUT PRIVATIZATION IN LATIN AMERICA 63

McKenzie, David, and Dilip Mookherjee. 2003. “The Distributive Impact of Pri-vatization in Latin America: Evidence from Four Countries.” Economía 3 (2):161–218.
Megginson, William, and Jeffry Netter. 2001. “From State to Market: A Survey ofEmpirical Studies on Privatization.” Journal of Economic Literature 39 (2):321–89.
Megginson, William, Robert Nash, and Matthias van Randenborgh. 1994. “TheFinancial and Operating Performance of Newly Privatized Firms: An Interna-tional Empirical Analysis.” Journal of Finance 49 (2): 403–52.
Mueller, Denis G. 1989. Public Choice. Cambridge, U.K.: Cambridge University Press.
Nellis, John. 1999. “Time to Rethink Privatization in Transition Economies?” Dis-cussion Paper 38 International Finance Corporation, Washington, D.C.
Nellis, John, and Sunita Kikeri. 1989. “Public Enterprise Reform: Privatization andthe World Bank.” World Development 17 (5): 659–72.
OECD (Organisation for Economic Cooperation and Development). 2001. “Re-cent Privatization Trends in OECD Countries.” Paris.
Perotti, Enrico. 1995. “Credible Privatization.” American Economic Review 85(4): 847–59.
Petrazzini, Ben, and Theodore H. Clark. 1996. “Costs and Benefits of Telecom-munications Liberalization in Developing Countries.” Working Paper. HongKong University of Science and Technology, Hong Kong, China.
Pinheiro, Armando C. 1996. “Impactos microeconômicos da privatização noBrasil.” Pesquisa e Planejamento Econômico 26 (3): 357–97.
Przeworski, Adam. 1991. Democracy and the Market: Political and Economic Re-forms in Eastern Europe and Latin America. Cambridge, U.K.: Cambridge Uni-versity Press.
Rama, Martin. 1999. “Efficient Public Sector Downsizing.” World Bank Eco-nomic Review 13 (1): 1–22.
Ramamurti, Ravi. 1996. Privatizing Monopolies: Lessons from the Telecommuni-cations and Transport Sectors in Latin America. Baltimore: Johns Hopkins Uni-versity Press.
———. 1997. “Testing the Limits of Privatization: Argentine Railroads.” WorldDevelopment 25 (12): 1973–93.
Ramamurti, Ravi, and Raymond Vernon. 1991. “Privatization and Control ofState-Owned Enterprises.” EDI (Economic Development Institute) Develop-ment Studies. World Bank, Washington, D.C.
Ramírez, Miguel D. 1998. “Privatization and Regulatory Reform in Mexico andChile: A Critical Overview.” Quarterly Review of Economics and Finance 38(3): 421–39.
Ros, Agustin. 1999. “Does Ownership or Competition Matter? The Effects ofTelecommunications Reform on Network Expansion and Efficiency.” Journalof Regulatory Economics 15 (1): 65–92.
Sáez, Raul. 1992. “An Overview of Privatization in Chile: The Episodes, the Re-sults, and the Lessons.” Consultancy report, CIEPLAN (Corporación de Inves-tigaciones Económicas para América Latina), Santiago, Chile.
Sánchez, Manuel, and Rossana Corona. 1993. “Privatization in Latin America.”Inter-American Development Bank, Centers for Research in Applied Econom-ics, Washington, D.C.
64 CHONG AND LÓPEZ-DE-SILANES
Sheshinski, Eytan, and Luis F. López-Calva. 2003. “Privatization and Its Benefits:Theory and Evidence.” In K. Basu, P. Nayak, and R. Ray, eds., Markets andGovernments. Oxford, U.K.: Oxford University Press.
Shleifer, Andrei. 1998. “State versus Private Ownership.” Journal of EconomicPerspectives 12 (4): 133–50.
Shleifer, Andrei, and Robert W. Vishny. 1994. “Politicians and Firms.” QuarterlyJournal of Economics 109 (4): 995–1025.
———. 1996. “A Survey of Corporate Governance.” Working Paper 5554. Cam-bridge, Mass.: National Bureau of Economic Research.
Stiglitz, Joseph. 2002. Globalization and Its Discontents. New York: Norton.
Torero, Máximo. 2002. “Impacto de la privatización sobre el desempeño de lasempresas en el perú.” Documento de Trabajo 41. Grupo de Analisis para el De-sarrollo, Lima, Perú.
Torero, Máximo, and Alberto Pasco-Font. 2001. “El impacto social de la privati-zación y de la regulación de los servicios públicos en el Perú.” Working Paper35. Grupo de Análisis para el Desarrollo, Lima, Perú.
Torero, Máximo, Enrique Schroth, and Alberto Pasco-Font. 2003. “The Impact ofTelecommunications Privatization in Peru on the Welfare of Urban Con-sumers.” Economía 4 (1): 99–128.
Trujillo, Lourdes, Noelia Martin, Antonio Estache, and Javier Campos. 2002.“Macroeconomic Effects of Private Sector Participation in Latin America’s Infra-structure.” Policy Research Working Paper 2906. World Bank, Washington, D.C.
Vickers, John, and George Yarrow. 1988. Privatization: An Economic Analysis.Cambridge, Mass.: MIT Press.
Wallsten, Scott. 2000. “Telecommunications Privatization in Developing Coun-tries: The Real Effect of Exclusivity Periods.” SIEPR Policy Paper 99-21, Stan-ford, Calif.
———. 2001. “An Empirical Analysis of Competition, Privatization, and Regula-tion in Africa and Latin America.” Journal of Industrial Economics 49 (1): 1–19.
———. 2002. “Does Sequencing Matter? Regulation and Privatization inTelecommunications Reforms.” Policy Research Working Paper 2817. WorldBank, Washington, D.C.
Winston, Clifford. 1993. “Deregulation: Days of Reckoning for Microecono-mists.” Journal of Economic Literature 31 (3): 1263–89.
World Bank. 2001. World Bank Privatization Database. Washington, D.C.
Wruck, Karen. 1990. “Financial Distress, Reorganization, and Organizational Ef-ficiency.” Journal of Financial Economics 27 (2): 419–44.
Yarrow, George. 1986. “Privatization in Theory and Practice.” Economic Policy 2(4): 324–64.
THE TRUTH ABOUT PRIVATIZATION IN LATIN AMERICA 65


2
The Benefits and Costs ofPrivatization in Argentina: A Microeconomic Analysis
Sebastián Galiani, Paul Gertler, ErnestoSchargrodsky, and Federico Sturzenegger
SINCE THE BEGINNING OF THE 1980S, THE world has undergone a major shiftin thinking about the appropriate economic role of the state. Privatizationof state-owned enterprises (SOEs) has been at the core of this change eversince Britain and France initiated privatization planning. In the last twodecades, several countries have launched ambitious privatization pro-grams. Although the extent, form, and pace of change have varied fromcountry to country, the general trend has been similar: the state has grad-ually withdrawn from directly producing goods and services. Despite theimportance of this experience, we still have little empirical knowledgeabout how well privatization works in practice.
Few studies have analyzed the impact of privatizations. Early empiri-cal research found mixed results about the relative performance of privateversus public firms (Caves 1990; Vining and Boardman 1992). More re-cent research finds private ownership to be generally more efficient thanpublic ownership (see, for example, Megginson, Nash, and van Randen-borgh 1994). These studies focus only on the question of productive effi-ciency. Recently, however, La Porta and López-de-Silanes (1999) studiedMexico’s experience with privatization in the 1980s and early 1990s. Theyanalyzed how privatization changed the performance of SOEs over a broadset of outcomes. Additionally, these authors considered the possibility thatthe increased profitability of privatized companies came at the expense ofsociety through higher prices or layoffs.
In this chapter, we follow La Porta and López-de-Silanes (1999) toevaluate the Argentine privatization program. Thus, we study the effects
67

of privatization on profitability, operating efficiency, productivity, out-put, investment, employment, wages, and prices. The structure of theArgentine public firms, however, was very different from the privatizedMexican public sector. In Argentina the state primarily owned a fewlarge natural monopolies. In Mexico the state ran a large number offirms across several productive sectors. Thus, although both privatiza-tion programs were massive, the Mexican experience was richer in thenumber of cases compared with the Argentine experience, while theArgentine privatization program was enormous relative to the size ofthe economy. Mexico privatized around 1,000 firms of various sizes insectors throughout the economy, but some of the largest public compa-nies such as PEMEX, the oil monopoly, or the electricity companieswere not privatized. In contrast, Argentina privatized a smaller numberof firms of much larger average size (Lustig 1992; Galiani and Petrec-olla 1996, 2000).
The particular features of the Argentine privatization process allow usto study the direct impact of privatization in sectors in which, because thestate was a monopolist, the whole industry was transferred to the privatesector. In such cases, laid-off workers may not be able to use their sector-specific human capital in other sectors of the economy, or consumers mayhave no choice in their suppliers. We go beyond the impact of privatiza-tion on firms to measure the direct impact of privatization on consumers’and workers’ welfare.
We propose two direct measures of the welfare impact of privatiza-tions. First, the Argentine program involved the privatization of localwater and sewerage firms. Changes in the health of the population associ-ated with these privatizations would provide a measure of the impact ofprivatization that goes beyond transfers of consumer surplus. We evaluatehow the privatization of local water and sewerage firms affected both ac-cess to these services and child mortality. Second, the Argentine programinvolved massive layoffs. Profitability gains in privatized firms may havebeen obtained at the expense of workers (Shleifer and Summers 1988).We measure the effect of privatizations on workers’ wages by comparingthe wages of a random sample of workers before and after they were laidoff from the former state oil company (Yacimientos Petrolíferos Fiscales,or YPF) with a matched counterfactual group built up using data gatheredfrom an ongoing household survey.
In short, in this chapter we address three questions:
• How did privatization affect the performance of firms and throughwhich channels—market power or productivity gains?
• Are there direct welfare impacts of privatization that can be rigor-ously identified in an econometric sense? In particular, has the privatiza-tion of water and sewerage services improved or worsened the health ofthe population?
68 GALIANI, GERTLER, SCHARGRODSKY, AND STURZENEGGER

• Part of the efficiency gains of privatized firms may have come fromthe breach of explicit and implicit contracts between workers and firms.What is the evidence of this for Argentina? What has been the effect of theprivatization of YPF on the earnings of laid-off workers?
This chapter assesses both the efficiency and some significant distribu-tional impacts of the Argentine privatization program. This is done byconsidering privatization as a policy instrument and by exploiting the factthat the group of economic units (that is, SOEs, public banks, households,and workers) exposed to privatization varied both by unit and by year.That enables us to use a similar statistical identification strategy to docu-ment some of the benefits and costs of privatization. Although we are notable to identify all the efficiency and distributional impacts of privatiza-tion by applying this treatment-and-control-group approach, our maincontribution to the literature is to document causal effects of privatizationon measures of efficiency and distribution.1
Our results show that the profitability of the nonfinancial firms increasedafter their privatization. Both the ratio of operating income to sales and theratio of net income to sales increased significantly as a result of privatiza-tion. Large increases in operating efficiency underpin these gains in prof-itability. Thus, we find a huge overall increase in the operating efficiency ofthe privatized firms in Argentina. Employment cuts are a big part of thestory, however. Employment decreased approximately 40 percent as a resultof privatization. Labor productivity increased not only because employmentdecreased, but also because privatized firms increased production. Privati-zation also had a big impact on investment; all the measures of investmentanalyzed were positively and significantly affected by privatization. Invest-ment itself increased at least 350 percent as a result of privatization. Finally,we do not find any statistically significant effect of privatization on prices.Nevertheless, after the privatization, prices did not decrease. The efficiencygains we documented imply that prices should have fallen if the quality im-provements were not large enough.
Contrary to the case of nonfinancial firms, we do not find large over-all increases in operating efficiency after the privatization of public banks.However, some indicators of efficiency performed well because of privati-zation. Output per employee increased 20 percent, while the averagenumber of employees per branch decreased 37 percent as a result of pri-vatization. As in the case of nonfinancial firms, employment cuts are a bigpart of the story. Employment decreased approximately 36 percent be-cause of privatization. Thus, on several indicators, the privatized banksseem to be more efficient after the privatization than they were before.Finally, the average capitalization ratio (the ratio of net worth to assets)increased 5 percent because of privatization. The higher capitalizationrate of the privatized banks means a more solvent system, which is quiteimportant in countries as vulnerable to external shocks as Argentina.
THE BENEFITS AND COSTS OF PRIVATIZATION IN ARGENTINA 69

On the direct measures of welfare analyzed, we find a negative and sta-tistically significant effect of the privatization of water services on childmortality. The estimated coefficient implies a decrease of approximately5 percent in child mortality rates induced by the privatization of waterprovision. Our estimates of earnings losses of displaced workers indicatethat a huge redistribution cost is associated with the privatizations ofSOEs: displaced workers incur substantial earnings losses. We estimatethat after taking unemployment into account, the earnings losses becauseof privatization were approximately 50 percent of the real earnings of theworkers before privatization.
In this chapter, we limit ourselves to analyzing the effects of privatiza-tion on several measures of firm performance, and on consumers’ and em-ployees’ welfare in a partial equilibrium analysis. An important caveat isthat we do not evaluate general equilibrium effects of the massive privati-zation program implemented in Argentina.2 Indeed, it would be possible toargue that the deep macroeconomic crisis that the country is suffering is tosome extent related to the previous privatization policies. For example, ifthe privatization package distorted the equilibrium path of the exchangerate, it could have induced a severe and unsustainable misallocation of re-sources in the economy. Moreover, the debt financing associated with ac-quisition of the privatized firms contributed to the large increase in thecountry indebtedness. In addition, the massive layoffs that accompaniedprivatization may have contributed to the severe increase in unemploy-ment. Rather than a macroeconomic study, however, we conduct an ex-clusively microeconomic analysis in the industries and markets in whichprivatization took place.
The chapter is organized as follows. In the next section, we documentthe Argentine privatization program, followed by a sample of privatizedfirms. The next two sections present the results of the effect of privatiza-tion on the performance of both financial and nonfinancial firms. We thenstudy the impact of the privatization of water and sewerage companies onboth access to these services and child mortality, followed by an analysisof the impact of privatization on the earnings of long-term displacedworkers. The last section presents our conclusions.
The Argentine Privatization Program
In 1989 Argentina was in the midst of an acute hyperinflation driven bythe monetization of large fiscal deficits. The administration of recentlyelected president Carlos Menem launched an ambitious privatizationprogram. A remarkable characteristic of the Argentine privatizationprogram was its extent and speed. The program included most SOEs aswell as other state assets that had not previously been operated as inde-pendent firms (Galiani and Petrecolla 1996, 2000; Heymann and
70 GALIANI, GERTLER, SCHARGRODSKY, AND STURZENEGGER

Kosacoff 2000). The privatization program was launched together withother structural reforms, such as financial and trade liberalization, theimplementation of a monetary currency board in 1991 (Plan de Con-vertibilidad), the independence of the central bank (Banco Central de laRepublica Argentina, or BCRA), the decentralization of health and ed-ucation services, and other pro-market actions such as a general dereg-ulation of economic activities.
The fiscal revenues from the privatization of the SOEs constituted acrucial instrument of the stabilization programs launched by the Menemgovernment. According to Gerchunoff (1992), the main objective of theprivatization program, at least at the beginning, was to solve Argentina’s(intertemporal) fiscal problems. Company-specific reasons also drove theprivatization process. After a long period of negative net investments, theSOEs needed high levels of capital investment to improve both the qualityof and access to their services. The public sector had no means to fundthose investments. In addition to its direct effects, the privatization pro-gram signaled a clear change in the direction of the economic developmentof the country.
For the most part, SOEs in Argentina were large, vertically integrated,natural monopolies. These characteristics implied that Argentina priva-tized a small number of very large firms and that the Argentine privati-zation program was huge relative to the size of the economy. Under thepriority of raising privatization revenues, in many sectors the authoritiesdecided to maintain a monopolistic structure in order to make the newprivate companies more attractive to the new buyers. With the same ob-jective, prices for the services or products were raised in the immediatepreprivatization period. The tax structure to which the new companieswere going to be exposed was simplified. Moreover, the state absorbedthe companies’ liabilities before transferring the companies to privatehands. Finally, the new companies enjoyed considerable regulatory free-dom at the beginning of the program. The creation of regulatory agen-cies was delayed or neglected during the early years of the privatizationprogram.
The transfer of companies and assets to private control took severalforms, such as total sale through open international auctions, conces-sions, public offer of shares, licensing, leases with or without purchaseoptions, management contracts, and the issue of exploration permits.The government obtained revenues in the form of cash and externaldebt bonds. A positive fiscal impact also resulted from a reduction incurrent losses, which were previously financed by the public budget,and a positive flow of taxes from the privatized companies. Table 2.1presents the revenues from privatizations by sector in federal andprovincial transfers according to the Ministerio de Economía (2000).The table shows the income for every sale (annual fees paid for conces-sions are not included).
THE BENEFITS AND COSTS OF PRIVATIZATION IN ARGENTINA 71

72 GALIANI, GERTLER, SCHARGRODSKY, AND STURZENEGGER
Table 2.1 Privatization Revenues in Argentina, by Sector(US$ millions, unless otherwise indicated)
Percent Bonds, Bonds,Total of market nominal Other
Sector income total Cash value value revenues
Federal privatizationsPetroleum 7,594 39.1 6,716 878 1,271 n.a.
and gasElectricity 3,908 20.1 1,989 1,451 2,586 468Communications 2,982 15.4 2,279 703 5,150 n.a.Gas 2,950 15.2 1,553 1,397 3,116 n.a.Transportation 756 3.9 284 183 1,314 290Petrochemical 438 2.3 418 20 132 n.a.Banks and 394 2.0 394 n.a. n.a. n.a.
financialservices
Steel 158 0.8 143 14 30 n.a.Derivatives from 116 0.6 116 n.a. n.a. n.a.
petroleum and gas
Pipelines 77 0.4 77 n.a. n.a. n.a.Construction 20 0.1 20 n.a. n.a. n.a.Other 11 0.1 11 n.a. n.a. n.a.
manufacturingindustries
Hotels and 8 0.0 3 5 13 n.a.restaurants
Chemical 5 0.0 3 2 3 n.a.Electronics 2 0.0 1 n.a. 1 1Agriculture 2 0.0 2 n.a. n.a. n.a.Total federal 19,422 100.0 14,009 4,653 13,615 759Provincial privatizationsElectricity 2,085 47.1 2,068 n.a. n.a. 18Petroleum and 1,703 38.5 1,703 n.a. n.a. n.a.
gasWater and 589 13.3 589 n.a. n.a. n.a.
seweragePaper 50 1.1 50 n.a. n.a. n.a.Total provincial 4,427 100.0 4,410 n.a. n.a. 18
n.a. Not applicable.Note: Income from every privatization sale is included, but annual concession
fees are not. Other revenues includes the use of trusts and liabilities assumed by thecompanies.
Source: Ministerio de Economía 2000.

Figure 2.1 shows the accumulation of privatization revenues during the1990s. Nearly 81 percent of total revenues from privatizations was ob-tained between 1990 and 1994. Mostly small companies and some resid-ual shares of large companies were sold in the second half of the decade.
The Sample
According to official statistics (CEP 1998 and the Central Bank), 154 pri-vatization contracts were signed during the 1990s. However, the sampleof privatized SOEs analyzed in our study is smaller than the number ofsigned contracts for several reasons:
• Several SOEs were split vertically and horizontally into smaller unitsor assets and privatized separately. In the majority of these cases, it is notpossible to obtain preprivatization financial statements and performanceindicators reported separately according to the criteria used to break upthe SOEs.3 This reduces the number of observations, since our unit ofanalysis has to be the SOE and not the private companies that emerged outof the process.
THE BENEFITS AND COSTS OF PRIVATIZATION IN ARGENTINA 73
Figure 2.1 Percentage of Accumulated Income fromPrivatizations, 1990–98
Note: Four-fifths (80.9 percent) of total privatization revenue was obtainedbetween 1990 and 1994.
Source: Ministerio de Economía 2000.
0
20
40
60
80
100
Percent
1990 1991 1992 1993 1994 1995 1996 1997 1998
• Concessions of roads, freeways, and docks cannot be analyzed becauseno financial statements are available for the preprivatization period. Roads,freeways, and docks were not organized as companies under public owner-ship.
• The sale of state minority participation in private companies is notconsidered in our study since the privatization itself did not imply a changein the management objectives of those firms.
• Within the oil sector, some contracts involved exploration permits ofareas where the state oil company had not previously operated (áreaspetroleras marginales).
• Several SOEs were liquidated or ceased operation.• In a few cases, data for the SOEs are not available.
Given these constraints, we have been able to collect data for 21 federalnonfinancial SOEs and for all the privatized banks. Our database for non-financial SOEs accounts for 81.7 percent of the revenues from the sale ofcompanies that continued operating as separate companies after beingprivatized and for 72.4 percent of the total privatization revenues.4 Ap-pendix 2A describes the industrial structure and data sources for the sec-tors included in our study.
As stated above, our units of analysis are the SOEs. Therefore, we ag-gregate the information from all the companies that resulted from the pri-vatization of each SOE, with the exception of Ferrocarriles Argentinos, theone company where it was possible to find data by business unit for thepreprivatization period. Table 2.2 presents the set of nonfinancial compa-nies included in our study. The smaller nonfinancial privatized firms notconsidered in our study are listed in table 2.3, along with the reason theywere excluded.
Finally, we construct a separate database for the banking sector, wherefor regulatory reasons we have monthly data for an extended number ofvariables, and for which we have a control group comprised of nonpriva-tized public banks and private banks. The privatized provincial banks arelisted in table 2.4
Results for Nonfinancial Firms
With the objective of analyzing the benefits and costs of privatization, inthis section we report the effects of privatization of nonfinancial firms onprofitability, operating efficiency, productivity, output, investment, em-ployment, wages, and prices. In doing so, we document the effects of pri-vatization on several measures of firm performance.
Suppose one is interested in estimating the influence of a policy in-strument on an outcome for a group—in our case, for example, the effectof privatization on productivity. Thus, the group consists of state-owned
74 GALIANI, GERTLER, SCHARGRODSKY, AND STURZENEGGER
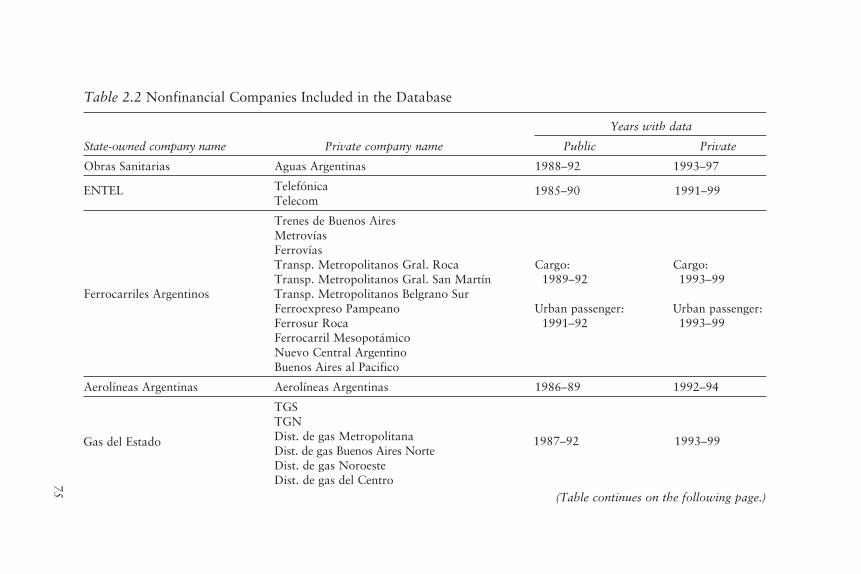
75
Table 2.2 Nonfinancial Companies Included in the Database
Years with data
State-owned company name Private company name Public Private
Obras Sanitarias Aguas Argentinas 1988–92 1993–97
TelefónicaTelecom
Trenes de Buenos AiresMetrovíasFerrovíasTransp. Metropolitanos Gral. Roca Cargo: Cargo:Transp. Metropolitanos Gral. San Martín 1989–92 1993–99
Ferrocarriles Argentinos Transp. Metropolitanos Belgrano SurFerroexpreso Pampeano Urban passenger: Urban passenger: Ferrosur Roca 1991–92 1993–99Ferrocarril MesopotámicoNuevo Central ArgentinoBuenos Aires al Pacifico
Aerolíneas Argentinas Aerolíneas Argentinas 1986–89 1992–94
TGSTGNDist. de gas MetropolitanaDist. de gas Buenos Aires NorteDist. de gas NoroesteDist. de gas del Centro
(Table continues on the following page.)
ENTEL
Gas del Estado 1987–92 1993–99
1985–90 1991–99

76
Dist. de gas del LitoralDist. de gas CuyanaDist. de gas PampeanaDist. de gas del Sur
YPF YPF 1987–90 1991–99
TransenerHidroeléctrica Piedra del Aguila
Hidronor Hidroeléctrica Cerros Colorados 1986–91 1993–99Hidroeléctrica AlicuraHidroeléctrica El Chocón
EdenorEdesur
SEGBA Edelap 1986–91 1992–95Central CostaneraCentral Puerto
SOMISA SIDERAR 1987–91 1995–98
Encotel Correo Argentino 1989–96 1997–2000
Tandanor Tandanor 1988–91 1994–99
Note: For full names of companies and other information about the database, see appendix 2A.Source: Authors’ data.
Table 2.2 (continued)
Years with data
State-owned company name Private company name Public Private
Gas del Estado 1987–92 1993–99

77
86 oil marginal areas
Area Petrolera Aguaragüe
Area Petrolera El Huemul–Koluel Kaike
Area Petrolera Palmar Largo
Area Petrolera PuestoHernández
Area Petrolera Santa Cruz I
Area Petrolera Santa Cruz IIArea Petrolera Tierra del
FuegoArea Petrolera Tordillo Area Petrolera VizcacherasBuques Tanque (YPF)Destilería Dock Sud (YPF)Destilería San Lorenzo (YPF)Oleoductos del Valle (YPF—
70 percent)
Astillero Domecq Garcia
Carboquímica Argentina
Fabricaciones Militares(Acido Sulfúrico, de armasMatheu, Pilar, Río TerceroCargas, San Francisco)
ELMA
Empresa de DesarrollosEspeciales
EntesaForja Argentina
HipasamInduclorIntesaRadio ExcelsiorSateenaSidinox
Administración General dePuertos (AGP) � 6 Docks
Elevador Terminal delPuerto de Quequen
Elevadores Puerto de BuenosAires
Elevadores Puerto Diamante
Elevadores Terminales deRosario
Highways
Hotel Llao LlaoNavigation waterways
Unidad Portuaria San Pedro
Altos Hornos Zapla
Canal 11
Canal 13
Fabricaciones Militares(San Martin, ECA,Tolueno Sintético, ÁreaMilitar Córdoba)
Hipódromo Argentino
InterbáiresPetroquímica Bahía Blanca
Radio Belgrano
Table 2.3 Nonfinancial Privatizations in Argentina Not Included in the Database
Divested assets Ceased to operate Not operating as Informationfrom YPF or liquidated companies in public period not found
(Table continues on the following page.)

78
Planta de Aerosoles DockSud (YPF)
Puerto Rosales (YPF—70percent)
Refinería Campo Durán
Sisteval
Sitea
Tanque Argentino MedianoTecnología Aeroespacial
Table 2.3 (continued)
Divested assets Ceased to operate Not operating as Informationfrom YPF or liquidated companies in public period not found
Note: Divested assets from YPF are assets that were part of YPF (Yacimientos Petrolíferos Fiscales) before the privatization but not afterward.Includes areas that were not operated before their concession. No data were available for companies that ceased to operate or were liquidated afterthe privatization process or for privatized companies that were not operated as independent organizations before privatization. Records for the com-panies in the last column could not be found.
Source: Authors’ data.

enterprises i � 1 . . . N observed over a sample horizon t � 1 . . . T. Sup-pose further that the policy instrument (that is, the privatization of afirm) changes in a particular period t for a segment of the group (or, asin our case, that it changes for all the SOEs but at different points intime). Let dPit be a 0–1 indicator that equals unity if the privatizationwas operative for firm i in period t. Firms of the group that experienceprivatization react according to a parameter �. The standard statisticalmodel to estimate � is the following two-way fixed effect error compo-nent model:5
yit � � dPit � �t � �i � εit (2.1)
where �i is a time-invariant effect unique to firm i that also captures in-dustry differences, �t is a time effect common to all firms in period t, andεit is an individual time-varying error distributed independently across
THE BENEFITS AND COSTS OF PRIVATIZATION IN ARGENTINA 79
Table 2.4 Privatized Banks in Argentina Included in the Database
Number of availablemonthly observations
Before After Bank Privatization date privatization privatization
Caja de Ahorro March 1994 8 62Chaco November 1994 14 58Entre Ríos January 1995 17 57Formosa December 1995 29 45Misiones January 1996 23 23Río Negro March 1996 30 41Salta March 1996 31 43Tucumán July 1996 35 39San Luis August 1996 37 25Santiago del Estero September 1996 38 36San Juan November 1996 34 34Previsión Social November 1996 41 18
de MendozaMendoza November 1996 41 27Jujuy February 1998 47 20Municipal de August 1998 60 14
TucumánSanta Cruz December 1998 53 10Santa Fe January 1999 50 9
Note: Privatized provincial banks are included in the sample. In May 1998 theBank of Mendoza acquired the privatized Banco de Previsión Social de Mendoza.
Source: Authors’ data.

individuals and time and independently of all �i and �t (Chamberlain1984; Heckman and Robb 1985).
The difference-in-difference estimator of � answers the question we areinterested in: how the expected value of a specific variable y (that is, thedependent variable in equation 2.1) changes in any period if the SOE isprivatized. Thus, � � E(yit | dPit � 1) � E(yit | dPit � 0) for all i and t. Thisestimator assumes that, in the absence of privatization, the mean changein the privatized and nonprivatized firms would have been the same. Thus,the change in the outcome measured in the comparison group serves tobenchmark common period effects among SOEs.6
As explained in the previous section, the privatizations in our data setoccurred at different points in time.7 The Argentine privatization programinduced some exogenous variation in the transfer of enterprises acrossSOEs and time. Thus, our identification strategy exploits the fact that ex-posure to privatization varied both by firm and by year.8
As we do not have information for the whole period for every com-pany, our 21 nonfinancial firms compose an unbalanced panel:
80 GALIANI, GERTLER, SCHARGRODSKY, AND STURZENEGGER
Year 1985 1986 1987 1988 1989 1990 1991 1992
Public 1 4 7 10 15 14 18 14Private 0 0 0 0 0 0 2 4
Year 1993 1994 1995 1996 1997 1998 1999 2000
Public 1 1 1 1 0 0 0 0Private 18 19 19 18 19 18 16 1
We are interested in analyzing the change in performance of our sam-ple of firms following privatization. We rely on six broad indicators ofperformance: profitability, operating efficiency, employment and wages,capital investment, total output, and prices. Appendix tables 2B.1 and2B.2 describe our variables. We express nominal variables in 1999 pesos,deflating them by the aggregate consumer price index (CPI).9
Following La Porta and López-de-Silanes (1999), we calculate twoprofitability ratios: operating income to sales and net income to sales.Evaluating changes in operating income offers a superior measure of effi-ciency gains, whereas evaluating changes in net income provides a usefulsummary statistic of the full impact of privatization on the performance ofthe SOEs. We could also have evaluated the impact of privatization on theratio of operating (net) income to fixed assets, but our measure of fixed as-sets (property, plant, and equipment, or PPE) is not reliable because of thedifficulties in consistently measuring PPE in periods of extreme price in-stability. We observed that PPE adjusts dramatically downward afterprivatizations. Moreover, it is likely that PPE could have been overstated

in the SOEs’ balance sheets because the cost of public investment projectsused to be extremely high.
We also examine three indicators of operating efficiency to capturechanges in the ability of firms to produce output from any given level ofinputs (compare La Porta and López-de-Silanes 1999). We compute thelogarithm of unit costs (defined as the ratio of the cost of labor and inter-mediate inputs to sales), the logarithm of sales per employee, and the log-arithm of output per employee.
We also analyze the impact of privatization on labor variables: the log-arithm of total employment and the logarithm of real average wages. Toassess the impact of privatization on capital formation, we examine thelevel of investment.10 Here, we consider the logarithm of investment, thelogarithm of investment to sales, the logarithm of investment to total em-ployment, and the logarithm of investment to fixed assets (PPE). Finally,we examine the behavior of output and prices.
Before analyzing the impact of privatization on these indicators, weneed to discuss some econometric issues. Although it is customary to studythe influence of a policy instrument on a (conditional) mean outcome, it isadvisable in our case to also study the influence of privatization on the(conditional) median of the distribution of the firm performance indica-tors studied.
Let:
yit � � dPit � �t � �i � εit (2.2)
with Q(yit | dPit, �t) � � dPit � �t � �i, where Q(yit | dPit, �t) denotesthe th conditional quantile of y given dP for a given unit i and periodt. This is the quantile regression model of Koenker and Basset (1978).The quantile regression model is concerned with the distribution of ascalar random variable y conditional on a vector of covariates x whenthe -quantile of y conditional on x is a linear function in x. For exam-ple, consider the case where equals 0.5. This is the median regression.This estimator is obtained by minimizing the sum of absolute errors andis referred to as the least absolute deviation (LAD) estimator.
The LAD estimator is a robust alternative to the ordinary least squares(OLS) estimator for estimating the parameters of a linear regression func-tion.11 A potentially serious problem in our data set is the presence of se-vere outliers in many of the measures of firm performance that we analyze.The LAD estimator protects us against outliers in the dependent randomvariable y and is preferable over the OLS estimator in this respect.
Moreover, the impact of privatizations on any outcome considered inour study is likely to be heterogeneous across SOEs, and this heterogene-ity is unlikely to be successfully parameterized. Thus, the OLS estimate of� in equation 2.1 is likely to estimate a mixture of different populationparameters (different privatization impacts across industries) with a
THE BENEFITS AND COSTS OF PRIVATIZATION IN ARGENTINA 81

severely skewed distribution. The median impact of privatization on anyoutcome will be less influenced by extreme observations (impacts) than themean impact of privatization on any outcome. Thus, the impacts of pri-vatization on any performance indicator are likely to be better representedby its median than by its mean. In that case, equation 2.2 could instead beestimated with equal to 0.5 and the consequent redefinition of the pa-rameter of interest.
The heterogeneity of impacts of privatization across SOEs also leads usto study the percentage change of any variable y with respect to privatiza-tion instead of the level impact of privatization on these variables wheneverthat is practical.12 It is reasonable to assume that the former parameter ismuch less heterogeneous across industries than the latter one.
Turning now to the results, note first that the profitability of privatizedfirms increased dramatically after the privatization period. The SOEs inour sample were highly unprofitable during the preprivatization period.La Porta and López-de-Silanes (1999) find similar results for Mexico.Table 2.5 shows simple comparisons before and after privatization for themean and median operating-income-to-sales and net-income-to-salesratios. Both profitability performances show statistically significant in-creases after privatization. The huge differences that exist between themean and median statistics, especially in the preprivatization period, sug-gest that the parameter of interest in equation 2.2 is more appealing thanthe one in equation 2.1.
In table 2.6 we report the estimate of the impacts of privatization onboth the conditional mean and the conditional median of the set of indi-cators we propose to analyze. Thus, we report the difference-in-differenceestimates of the impact of privatization on the set of indicators proposed.
82 GALIANI, GERTLER, SCHARGRODSKY, AND STURZENEGGER
Table 2.5 Changes in Profitability for the Sample of NonfinancialPrivatized Firms
Mean Mean Median Medianbefore after t-statistic before after Z-statisticprivati- privati- for change privati- privati- for change
Variable zation zation in mean zation zation in median
Operating �0.579 �0.158 2.59*** �0.100 0.055 4.32***incometo sales
Net �0.479 0.030 3.49*** �0.157 0.040 15.90***incometo sales
*** Significant at the 1 percent level.Note: See appendix table 2B.1 for definitions of variable. The number of (firm-year)
observations is 170.Source: Authors’ calculations.

THE BENEFITS AND COSTS OF PRIVATIZATION IN ARGENTINA 83
Table 2.6 Changes in Performance for the Sample of NonfinancialPrivatized Firms
Number of Mean Median Variable observations regressions regressions
ProfitabilityOperating income/sales 168 0.75* 0.83***
(0.41) (0.01)Net income/sales 168 1.03** 1.06***
(0.45) (0.01)
Operating efficiencyLog(unit cost) 126 �5.63*** �0.1***
(1.46) (0.06)Log(sales/employment) 145 1.02 0.09***
(0.69) (0.02)Log(production/employment) 111 4.53*** 0.38***
(1.33) (0.07)
LaborLog(employment) 148 �0.65** �0.50***
(0.31) (0.04)Log(average real wage per 72 0.096 �0.34***
employee) (0.35) (0.07)
InvestmentLog(investment) 88 1.7* 1.51***
(1.03) (0.22)Log(investment/sales) 88 1.3 0.29***
(0.87) (0.09)Log(investment/employment) 71 4.25*** 2.21***
(1.5) (0.07)Log(investment/noncurrent 86 2.07*** 1.8***assets) (0.79) (0.06)
OutputLog(production) 150 6.4*** 0.22***
(0.96) (0.03)
PricesLog(prices) 155 �0.11 �0.02
(0.19) (0.03)
* Significant at the 10 percent level. ** Significant at the 5 percent level. *** Significant at the 1 percent level.Note: See appendix table 2B.1 for definitions of variables. All regressions include year and
firm fixed effects. Standard errors are in parentheses. Obviously, the observations for 1985and 2000 are excluded from the estimated regression functions since the models include yeareffects. The number of observations varies across regressions because information is notavailable for all variables for every firm during the sample period. For each firm, we excludefrom the sample the observation for the year in which the company was privatized due to thelack of reliable data during the transition period. Results are similar if we also exclude thetwo years before privatization. None of the results changes qualitatively if we exclude thedata for 1989 from the analysis. In that case the estimates become more precise.
Source: Authors’ calculations.

The distinction between these estimates and the before-and-after esti-mates reported in table 2.5 is that the difference-in-difference estimatesalso control for the common aggregate effects (year effects) on the de-pendent variables. We confirm the significant increase in profitability af-ter privatization. Both operating income to sales and net income to salesincreased significantly as a result of privatization. This result and, indeed,all the results reported in table 2.6 are qualitatively robust to the param-eter analyzed (mean or median).
Large increases in operating efficiency underpin these gains in prof-itability. The impact of privatization on the (conditional) median unitcosts shows a reduction in the latter of 10 percent. This effect is close tothe effect found by La Porta and López-de-Silanes (1999) for Mexico.The impact of privatization on (conditional) mean unit costs, however,is implausibly large. Most likely, it shows the pervasive upshot of ex-treme effects in some SOEs. Because this occurs with other variables aswell, we emphasize the report of the impacts of privatization on the con-ditional median of the performance measures studied, although none ofthe reported results changes qualitatively if we concentrate on the impactof privatization on the conditional mean of the performance measures.The ratio of median sales to employment also increases 10 percentbecause of the privatization of the SOEs. Finally, the impact of privati-zation on labor productivity, measured by the ratio of production tototal employment, is dramatic. The impact of privatization on the me-dian level of productivity shows an increase of 46 percent. Thus, we finda huge overall increase in the operating efficiency of the privatized firmsin Argentina.
As in the Mexican case, employment cuts explain a large part of the in-crease in profitability. Employment decreased approximately 40 percentas a result of privatization. It is likely that this figure underestimates thelayoffs experienced by privatized firms because in some SOEs, employ-ment was already falling during the immediate preprivatization period.For example, a significant proportion of the layoffs at YPF occurred twoyears before the privatization of the big oil company. Nevertheless, our re-sults show that a substantial proportion of the layoffs occurred after thefirms were privatized.
Labor productivity increased not only because employment decreasedbut also because privatized firms increased production. The median levelof production increased 25 percent because of privatization.
The impact of privatization on the real average wage for a pool of work-ers is unlikely to be identified because the composition of workers’ humancapital probably changed with the layoffs accompanying the privatizations.On the one hand, many workers were laid off in early retirement plans andhence, on average, SOE workers had more tenure than the average re-maining worker in the privatized firms.13 Additionally, positions createdthrough nepotism and cronyism disappeared because of privatization, and
84 GALIANI, GERTLER, SCHARGRODSKY, AND STURZENEGGER

these positions had likely been rewarded above the average wage. On theother hand, casual evidence shows that managers’ real wages increasedsubstantially because the privatized firms had to pay competitive wages toattract skilled executives to replace the previous, politically appointed SOEdirectors. Thus, when we consider the impact of privatization on averagewages at the firm level, the fixed effect assumption of the difference-in-difference estimator breaks down because the composition of the workers’human capital likely changed with the privatization of the SOEs. Never-theless, the estimated impact of privatization on average real wages seemsto be negative or null.14 This impact appears to vary greatly across firms,reaffirming our suspicion that the identified effect of privatization onwages is mainly driven by composition effects instead of productivityeffects (see also La Porta and López-de-Silanes 1999).
Following La Porta and López-de-Silanes (1999), we evaluate the con-tribution of layoffs to the changes in profitability. We compute operatingincome for the postprivatization period for each SOE maintaining the em-ployment at the preprivatization level. Then, we estimate equation 2.2 forthe operating-income-to-sales ratio. The coefficient of the privatizationdummy variable drops to 0.67.15 Only 20 percent of the estimated increasein the ratio of median operating income to sales seems to be attributable toworkers’ layoffs, a figure considerably lower than the one estimated by LaPorta and López-de-Silanes (1999) for Mexico.16
Regarding the impact of privatization on investment, all the measuresanalyzed are positively and significantly affected by privatization. Invest-ment itself increased at least 350 percent as a result of privatization. Thiseffect is enormous and well above the one found in Mexico by La Portaand López-de-Silanes. This result is consistent with the view that one ofthe main motives for privatizing the SOEs in Argentina was to reestablishinvestment.
Finally, we consider the behavior of prices. The main difficulty in iden-tifying the impact of privatization on prices is that prices were usually in-creased before the firms were privatized, substantially so in some cases, tomake the companies attractive to private investors. Moreover, prices werenot increased immediately before every privatization but rather when theprivatization package was launched at the beginning of the 1990s. Thus,there is not enough variability across both firms and time in the changesin prices as a result of privatization to identify the effect of the latter onthe former. Furthermore, we lack enough data in the immediate prepriva-tization period to document this effect. Additionally, the quality of severalproducts supplied by the privatized firms increased significantly after pri-vatization. These changes in quality are difficult to measure but wellknown in several sectors such as telecommunications and electricity.17
Under these restrictions, we do not find any statistically significant ef-fect of privatization on prices. Nevertheless, prices did not decrease in thepostprivatization period, when the efficiency gains we documented imply
THE BENEFITS AND COSTS OF PRIVATIZATION IN ARGENTINA 85

that prices should have fallen if the improvements in quality were not largeenough. These results thus suggest that there is an important pending reg-ulatory mission to accomplish in Argentina.18
Results for Banks
The Argentine banking sector went through an important transformationafter the Tequila financial crisis of 1995 following the devaluation of theMexican peso in December of 1994. Under the currency board, the centralbank, BCRA, faced severe limits on its ability to act as a lender of last re-sort. Thus, it could not bail out banks that were having solvency problems.Instead, BCRA helped these banks to be acquired, merged, or, in the caseof public banks, privatized. This process led to a significant reduction in thetotal number of banks operating in the country, from 168 in December1994 to 122 two years later (Burdisso, D’Amato, and Molinari 1998).
The data set used in this study was compiled by BCRA and containsmonthly financial information for all the entities that participated in theArgentine Financial System from June 1993 to September 1999. It in-cludes the basic balance sheet accounts, the net income structure, andsome physical data such as the number of employees and branches foreach bank. Although the data set covers the period during which almostall privatizations took place, not all the information is available for everybank variable at every moment. In particular, more disaggregated dataare available for the more recent periods.
These data have the advantage of being perfectly comparable across in-stitutions, as well as before and after the privatizations, as BCRA, actingas regulator of the financial system, requires the entities to present theirbalance sheets with the same accounts and criteria.
In 1991 there were 35 public banks in Argentina, 27 owned by theprovinces and 8 owned by national and municipal governments. Between1992 and 1999, 19 of these public banks were privatized and 2 otherswere merged with privatized banks, leaving only 14 banks under publicownership by September 1999. We include 17 of the 19 privatized banksin our study, since no preprivatization information was available for twobanks in the data set. These were the Banco de La Rioja (privatized in July1994) and Banco de Corrientes (May 1993). The privatization of theBanco Hipotecario Nacional is also not covered here because it was doneafter September 1999. The variables used in our study are detailed in ap-pendix table 2B.2.
When an SOE is privatized, the government usually tries to make thefirm more attractive to buyers and ends up selling it—after a restructur-ing process—without the “undesired” assets and liabilities. In the caseof the Argentine public banks, most of the provincial governmentsformed a residual entity with the low-quality assets and liabilities. To be
86 GALIANI, GERTLER, SCHARGRODSKY, AND STURZENEGGER

able to cope with the short-term liabilities, the Argentine government,the Inter-American Development Bank, and the World Bank created theFondo Fiduciario para el Desarrollo Provincial (FFDP) to lend moneyand give technical assistance to the provinces for privatizing their banks.In short, the privatization of provincial banks involved the creation ofresidual entities with the purpose of keeping the low-quality assets andliabilities that would not be attractive to potential buyers. Because ofthese ownership changes, stock variables such as total assets and de-posits are worthless for detecting changes in performance. Instead, weconsider performance ratios.
We rely on five broad indicators of performance: profitability, oper-ating efficiency, employment, capitalization, and loan growth. We ex-press nominal variables in 1999 pesos, deflating them by the aggregateCPI index.
The results show, first, that most profitability indicators of privatizedbanks increased dramatically in the postprivatization period. Table 2.7shows simple before-and-after comparisons for the mean and medianprofitability indicators. Looking at the profitability ratios, almost everyindicator is negative before the privatization period and turns positive af-ter it. The median increase in the profit margin, operating margin, interestmargin, return on equity (ROE), and return on assets (ROA) are all sta-tistically significant.19 However, the median operating income per branchdecreased after privatization.
We now analyze the influence of the privatization of banks on the setof selected performance indicators estimating the model described inequation 2.1. In contrast with the case of nonfinancial firms, not all thepublic banks were privatized during the 1990s. Following our definitionof the parameter � in the previous section, we include only public banksin the control group. In table 2.8, we present two different estimates ofthe impact of the privatization of banks on their performance. The dataone year before and one year after the privatizations are not included inthe analysis shown in the first column, whereas they are in the secondcolumn. The data just before privatization could be misleading since thegovernment could be trying to restructure the banks before privatizationto increase their attractiveness or, in case of corruption, could have mod-ified the financial records to favor its friends in the auctions (the“cooked-books” hypothesis). The year after privatization could be con-sidered as one dedicated to the restructuring process (see La Porta andLópez-de-Silanes 1999).
We report the difference-in-difference estimates of the impact of priva-tization on the set of indicators proposed. Most results are similar acrosssamples. Thus, we find no evidence to support the claim that results are at-tributable to misleading accounting conducted before privatization.
The overall positive impact of privatization on profitability is not con-firmed. Even though we find a statistically significant increase on ROA
THE BENEFITS AND COSTS OF PRIVATIZATION IN ARGENTINA 87

88
Table 2.7 Changes in Profitability for the Sample of Privatized Banks
t-statistic Median Median Z-statisticMean before Mean after for change before after for change
Variable privatization privatization in mean privatization privatization in median
Profit margin (percent) �27.07 22.32 1.09 �15.51 7.53 100.62***Operating margin (percent) �37.56 �15.52 0.56 �22.67 5.96 109.99***Interest margin (percent) �0.83 0.79 3.41*** 0.20 0.55 101.71***Operating income per branch 142 123 �0.61 145 107 11.47***ROA (percent) �0.007 0.002 4.93*** �0.002 0.001 167.20***ROE (percent) �2.305 1.224 0.66 �1.141 1.149 98.91***
*** Significant at the 1 percent level.Note: ROA � return on assets and ROE � return on equity. See appendix table 2B.2 for definitions of variables. Number of (firm-month)
observations: profit margin � 987; operating margin � 985; interest margin � 955; operating income per branch � 723; ROA � 1,148;ROE � 1,148.
Source: Authors’ calculations.

THE BENEFITS AND COSTS OF PRIVATIZATION IN ARGENTINA 89
Table 2.8 Changes in Performance for Privatized Public Banks
Column 1 Column 2
Number of Number of observa- observa-
Variable tions Coefficient tions Coefficient
ProfitabilityROA 2,007 0.01*** 2,246 0.01***
(0.002) (0.001)ROE 2,007 0.031 2,246 0.04
(0.03) (0.05)Profit margin 1,724 1.22 1,923 1.24*
(0.94) (0.77)Operating margin 1,666 0.30 1,864 �0.06
(1.08) (0.84)Interest margin 1,675 0.02*** 1,874 0.03***
(0.004) (0.01)Operating income/ 1,311 �227.67*** 1,462 �199.45***branch (73.73) (59.90)
Operating efficiencyLog(average cost) 1,859 0.01 2,089 �0.02
(0.03) (0.03)Log(administrative 1,996 0.31*** 2,226 0.44***expenses) (0.02) (0.02)
Log(output/ 1,392 0.19*** 1,581 0.14***employee) (0.03) (0.03)
Log(employees/ 1,507 �0.46*** 1,694 �0.55***branch) (0.02) (0.02)
EmploymentLog(employees) 1,513 �0.45*** 1,702 �0.59***
(0.02) (0.02)OtherCapitalization 2,010 0.07*** 2,249 0.08***
(0.01) (0.01)Loan growth 1,922 0.03*** 1,462 0.07***(percent) (0.01) (0.01)
* Significant at the 10 percent level. *** Significant at the 1 percent level.Note: ROA � return on assets and ROE � return on equity. See appendix table
2B.2 for definitions of variables. Column 1 does not include data for one year beforeand one year after privatization. Column 2 includes all observations.
Source: Authors’ calculations.

upon privatization, we do not find any statistically significant impact onROE, and the impact on operating income per branch is negative and sta-tistically significant. The interest margin has also increased in associationwith the privatization of banks. The evidence suggests, however, that theprivatization impact on both the profit and operating margins is not sta-tistically significant.
Contrary to the case of nonfinancial firms, we do not find large in-creases in operating efficiency after the privatization of public banks. Theimpact of privatization on the (conditional) mean average costs is null. Inaddition, the impact of privatization on the mean administrative expensesis positive and statistically significant. They have increased 36 percent asa result of privatization. However, other indicators of efficiency per-formed better because of privatization. Output per employee increased20 percent, while the average number of employees per branch decreased37 percent. As in the case of the nonfinancial firms, employment cuts area big part of the story. Thus, on several indicators, the privatized banksseem to be more efficient after the privatization than before. This resultis in line with the results found in Burdisso, D’Amato, and Molinari(1998).
The privatization process also implied a supply increase in the creditmarket. Finally, solvency improved in privatized banks. The average cap-italization ratio (net worth to assets) increased 5 percent because of priva-tization. This increase in capitalization is statistically significant. Theaverage capitalization of the banks in the year before privatization was�10 percent, a fact that helps explain the reasons for undertaking priva-tization. The higher capitalization rate of the privatized banks means amore solvent system, which is quite important in countries as vulnerableto external shocks as Argentina. This is in line with the consensus that thereforms taken by the BCRA after the Tequila crisis regarding the approvalof mergers, liquidation of bankruptcy banks, and privatizations helped tostrengthen the financial system.
Privatization of Water and Sewerage Companies:Access to Services and Welfare
In this section, we study the impact of the privatization of water and sew-erage companies on both access to service and child mortality. There arethree reasons to focus our analysis on the privatization of water and san-itation services.
First, access to water supply and sanitation is a fundamental need. Thesignificance of water, as distinct from other infrastructure industries, de-rives from the fact that human survival depends on access to water thatis free of pollutants. The health and economic benefits of water and san-itation supply to households and individuals (and especially to children)
90 GALIANI, GERTLER, SCHARGRODSKY, AND STURZENEGGER

are well documented. The lack of improved domestic water supply leadsto disease through two principal transmission routes: waterborne diseasethat occurs from drinking contaminated water, and water-washed diseasethat occurs from a lack of water. Diarrhea, which can be both waterborneand water-washed, is the most important public health problem affectedby the quality of and access to water and sanitation. Approximately 4 bil-lion cases of diarrhea each year cause 2.2 million deaths throughout theworld, mostly among children under the age of five. These deaths repre-sent approximately 15 percent of all deaths of children under the age offive in developing countries (WHO 2000). Water, sanitation, and hygieneinterventions can reduce diarrheal disease, on average, by between one-fourth and one-third (Esrey and others 1991). Thus, of all privatizations,the transfers of the provision of water and sanitation services are theones that potentially could have the highest impact on a direct measureof welfare like health.
Second, the proportion of people in the world with access to water andsanitation facilities remained constant during the 1990s despite all the ef-forts and programs to increase the access of the poor to these services(WHO 2000). Thus, it is of special interest to test whether the privatiza-tion of water and sanitation services increased access to those services.
Third, water and sanitation services are a natural monopoly, wheredeclining long-run average costs mean that it is most efficient for only asingle firm to serve the market. Moreover, water differs from other nat-ural monopolies in the importance of the externalities present. Both thenatural monopoly feature and the health effects of water and sanitationforce high public interest in the sector (Shirley 2000).
Between 1991 and 2000, several provincial privatizations in the watersector occurred, in addition to the privatization of the federal Obras Sani-tarias de la Nación (OSN), which transferred the responsibility for waterand sanitation service in the Buenos Aires metropolitan area to a privatecompany, Aguas Argentinas, in May 1993.20 The provision of water hasbeen privatized in localities covering approximately 60 percent of the pop-ulation of the country (as of the 1991 census). Water and sanitation priva-tizations were dispersed throughout the decade. Thus, there are localities inArgentina where privatization has not taken place. In those localities whereprivatization occurred, there is variability across both localities and time.This exogenous variation in the provision of water and sanitation servicesacross time and space can be exploited to identify the causal effect of waterand sanitation privatization on both access to water and child mortality.
Table 2.9 shows the access to connection to both water and sanitationservices in urban areas in 1991. Connection to the water network is high(approximately 70 percent of the population) but certainly far from fullcoverage like the one achieved in the Argentine capital, Capital Federal(Ciudad de Buenos Aires). Connection to the sewerage network is muchlower (approximately 37 percent of the population). Localities do not
THE BENEFITS AND COSTS OF PRIVATIZATION IN ARGENTINA 91

show substantial differences in the proportion of the population (house-holds) with access to connection to the water network, whether it is pub-lic or private.
Artana, Navajas, and Urbiztondo (1999) analyze the first two privati-zations of water and sewerage services in Argentina: Aguas Argentinasand Aguas de Corrientes. Using official data for the period 1991 to 1995,they report that the number of water connections in the area covered byAguas de Corrientes rose by 22 percent and the number of sewerage con-nections by 50 percent. That translates into an additional 7 percentagepoints of the population covered with water services and 12 percentagepoints of the population covered with sewerage services. These increasesin coverage are outstanding by any standard. For Aguas Argentinas, weobtained similar data from the regulator for the period 1980 to 1999, andwe estimated the following regression function (where the notation is self-explanatory, and t equals 1, 2, 3, . . . , 20):
Log (Population served) � const. � 0.0064 t � 0.042 (t � 14) I(t�14)
(0.001)a (0.006)a
R2 � 0.94
The results of the estimation are shown in figure 2.2.
92 GALIANI, GERTLER, SCHARGRODSKY, AND STURZENEGGER
Table 2.9 Access to Water and Sewerage Services, 1991(percent)
Water service Sewerage service
Urban Urban Urban Urban population households population households
with with with with Sample connection connection connection connection
Total 70 73 37 41Localities privatized 71 74 40 45
between 1990 and 1999
Localities not 69 70 29 32privatized between 1990 and 1999
Capital Federal 98 98 94 94(privatized in 1993)
Note: The data are obtained from the 1991 Census of Households and Popula-tion. Urban population is the population living in all localities with more than 5,000inhabitants in 1991. A locality is in the privatized group if the privatization of waterservices occurred between 1990 and 1999.
Source: 1991 Census of Households and Population.

The increase in the access to water services in the area covered by AguasArgentinas after privatization also seems to be exceptional. After 1993 thepopulation with access to water services increased by approximately 3 per-cent annually.21
These figures are not estimates of the causal effect of privatization ofwater on access to service, however. First, there is a measurement errorproblem since the firms know exactly where connections were expanded,but this knowledge translates noisily into population served. We have onlyhousehold data on access to service from the 1991 census and from a ran-dom survey conducted in 1996–97 (by Encuesta de Desarrollo Social, orEDS) that covered all urban localities with more than 5,000 habitants andthat asked the same questions about access to water connections as the
THE BENEFITS AND COSTS OF PRIVATIZATION IN ARGENTINA 93
Figure 2.2 Logarithm of Population Connected to the Water Network and Fitted Values, Aguas Argentinas,1980–99
Note: The fitted values come from a simple regression including a constant,a linear time trend, and an indicator variable for the postprivatization period,beginning in 1993, as explained in the text. Fitted values closely follow theactual data.
Source: Authors’ calculations.
year
Logp observed Fitted values
1980 1985 1990 1993 1995 1999
15.4
15.5
15.6
15.7
15.8
15.9
Logarithm

1991 census did. Second, and more important, connections could havealso expanded without privatization. Thus, to identify the causal effect ofprivatization on access to water, we exploit the fact that between 1991and 1997, the two dates for which we possess household access informa-tion, some privatizations affecting several localities had already occurred.Thus, for the localities that were randomly chosen in the EDS survey, weperform a test of the difference in difference of the proportion of house-holds with access to the water network in 1991 and 1997 between urbanlocalities where water provision had been privatized and those where ithad not. The results are reported in table 2.10.
Thus, we find a statistically significant increase in the access to waterservices caused by the privatization of firms. Similar results are found in
94 GALIANI, GERTLER, SCHARGRODSKY, AND STURZENEGGER
Table 2.10 Difference in Difference of the Proportion ofHouseholds with Access to Water Connection, 1991–97(percent)
Water
All localities Excluding Localities with access Capital Federal
Localities not privatized: 1991 86.6 86.6census data
Localities not privatized: 1997 89.8 89.8EDS, survey data
Localities not privatized: 3.2 3.2Difference 1997 � 1991
Localities privatized: 1991 73.0 64.0census data
Localities privatized: 78.0 71.41997 EDS, survey data
Localities privatized: 5.0 7.4Difference 1997 � 1991
Difference-in-difference 1.8 4.2estimate
Z-test for difference in the 2.83*** 5.78***changes in proportions
*** Significant at the 1 percent level.Note: Difference in difference of the proportion of households with access to water
between 1991 and 1997, between the localities where water services were privatizedand those where it was not. Only the localities randomly chosen in the EDS (Encuestade Desarrollo Social) survey are included in the 1991 estimates. Sampling weights areused to estimate the proportions reported in the table. A locality is in the privatizedgroup if the privatization of water services occurred between 1990 and 1996.
Source: Authors’ calculations.

terms of population. Note that the increase is higher when we excludeCapital Federal where access was already full before the privatization.Also, note that the increase in the access to water services in the privatizedregions is approximately 11 percent (from 64.0 percent to 71.4 percent,excluding Capital Federal). This increase is consistent with the increase inaccess to water services that we estimated for OSN for 1993–97. Becausethe network expansion induced by privatization is phased over a longerperiod (1991–97) than the one covered by the test we conduct, it is rea-sonable to conclude that the causal impact of privatizations on access towater services is greater than our estimate.
Finally, we evaluate the impact of the privatization of water serviceson child mortality. Mortality data, compiled in Argentina by the Minis-terio de Salud, are constructed at the local level disaggregated by age. Al-though the data are not publicly available, we have been able to accessthe data for the 66 localities in the country with 100,000 or more in-habitants. These localities account for 58.6 percent of the total popula-tion and for 64.4 percent of the urban population. We focus on childmortality (mortality of children below five years of age) because childrenare more vulnerable to water-related diseases such as diarrhea (WHO2000). We divide the number of deaths by the number of children of thatage to obtain mortality rates, the dependent variable of the followinganalysis.
Consider the evaluation of the impact of the privatization of water pro-vision on child mortality.22 The difference-in-difference estimator of theimpact of privatization on mortality, �, is obtained by estimating the fol-lowing regression function:
Mortality Ratesit � � dPrivit � xit � �t � �i + εit (2.3)
where Mortality Ratesit are the mortality rates of children below five yearsof age in locality i and year t, xit is a set of control variables—income andinequality23—that vary across both localities and time, and dPrivit is a 0–1indicator that equals unity if in locality i and period t the main provider ofwater services is a private firm. When dPrivit is 0, the main provider of wa-ter services in locality i and period t may be a public firm or a cooperative.Finally, �i is a time-invariant effect unique to locality i, �t is a time effectcommon to all localities in period t, and εit is a locality time-varying errordistributed independently across locality and time, and independently ofall �i and �t.
We report the results of this exercise in table 2.11. We find that priva-tization of water services has a negative and statistically significant effecton child mortality. The estimated coefficient implies that privatization in-duces a decrease of approximately 5 percent in child mortality rates. Thus,we find that the privatization of water services both increased access towater services and reduced child mortality.
THE BENEFITS AND COSTS OF PRIVATIZATION IN ARGENTINA 95

Privatization and Worker Displacement: Wages andthe Distribution of Welfare
A great deal of attention in recent years has been devoted to the conse-quences of worker displacement for individual labor market perfor-mance (see, among others, Hamermesh 1989 and Hall 1995). Displacedworkers are generally defined as those workers who were permanentlylaid off without cause. This type of involuntary rupture in employmentrelationships is usually associated with structural change, sectoral real-location, or technological innovation. Displacement is usually followedby a period of slow rebuilding of employment relationships, as workersdisplaced from long-term jobs require time to find new acceptable jobs(Hall 1995). Therefore, the emphasis of our study is on long-term wel-fare losses after displacement. The workers displaced by the privatiza-tion of SOEs constitute a valuable alternative source for studying theconsequences of worker displacement for individual labor market per-formance.
One good reason to study worker displacement is that its consequencescan yield insights into the wage determination process. Human capital the-ory predicts that to the extent that experience and skills acquired on thejob are general, displaced workers should not suffer large wage lossesupon reemployment. In contrast, workers with accumulated industry orfirm-specific capital or workers extracting industry or firm-specific rentsare likely to sustain large pay cuts when changing firms or sectors.24 Thus,even if the privatization of SOEs results in a socially efficient reduction inthe level of employment in the privatized firms, the laid-off workers maystill be badly harmed. If that is the case, then part of the efficiency gains of
96 GALIANI, GERTLER, SCHARGRODSKY, AND STURZENEGGER
Table 2.11 The Effect of Privatization on Child Mortality Rates,1990–99
Impact Dependent variable: mortality rates
dPrivit �0.21*(0.12)
Number of observations 658Number of localities 66
* Significant at the 10 percent level.Note: Standard errors are in parentheses. dPrivit is a 0–1 indicator that equals
unity if in locality i and period t the main provider of water services is a private firm.When dPrivit is 0, the main provider of water services in locality i and period t may be apublic firm or a cooperative. The regression includes year and province fixed effects. Italso includes local income and inequality as control variables.
Source: Authors’ calculations.

privatized firms may have come from the breach of implicit and explicitcontracts between workers and firms. In this section, we explore to whatextent workers displaced by privatization suffered long-term earningslosses. We rely on a survey of a random sample of displaced workers fromthe former state oil company YPF.
Privatization and Worker Displacement
One of the salient characteristics of the Argentine privatization programis the huge reduction in employment associated with it. Employment fellapproximately 40 percent as a result of privatization. A very importantquestion in itself but also as part of a broader study of the microeconomicbenefits and costs of privatization, is the following: What has been the ef-fect of the privatizations on the earnings of laid-off workers? To assessthis question, we use a survey of a random sample of workers displacedfrom YPF in 1991 as part of the restructuring process of the firm beforeits privatization. The frame of the survey was a list of all displaced work-ers from YPF during 1991. The survey was conducted during the firstweek of August of 2001. The sample size is 504 observations.
It is likely that workers in state-owned enterprises were extractingrents and that their wages therefore did not reflect their productivity. Insuch a case, a long-term earnings loss because of privatization estimatesa dimension of the distributive cost of privatization and is not necessarilya destruction of workers’ specific human capital. Thus, our concern iswith the distribution of the costs of what otherwise appears to be an effi-cient reform. Nonetheless, the impact of privatization on long-term earn-ings is not a minor point in society’s perceptions of the benefits and costsof privatization.
Certainly, the welfare of workers depends not only on their earningsbut also, among other things, on their fringe benefits, health insurance,and the stability of their jobs. Thus, we think it is informative to considerthe overall subjective impact of privatization on the displaced workers’welfare. We find that approximately 60 percent of the displaced workersin our sample consider that they were adversely affected by displace-ment.25 Nevertheless, even if revealing, this is only a subjective appraisalof the overall costs of displacement.
In addition to the earnings losses, the jobless rate for laid-off workersin the United States is higher than it is for unemployed workers who werenot laid off (Ruhm 1991). In our sample, even in the long term, we alsofind that this is the case.
The primary factor to consider is the age distribution of the displacedworkers in our sample. Displacement because of privatization was con-centrated among workers older than 40 years; 30 percent of the surveyedindividuals were older than 59 years at the time of the survey. Indeed,60 percent of the sampled individuals were between 39 and 59 years, and
THE BENEFITS AND COSTS OF PRIVATIZATION IN ARGENTINA 97

none of the displaced workers was younger than 28 years at the time ofthe survey.
To draw inferences about this sample of displaced workers, we con-struct comparison groups from the ongoing household survey. The house-hold survey is conducted twice a year, in May and October, in the main28 urban agglomerates of the country.
The male labor force participation rate among the individuals displacedfrom YPF younger than 60 years is 90 percent.26 Preferably, we shall com-pare the statistics obtained from the survey of YPF displaced workers withthe same statistics estimated from the May 2001 wave of the householdsurvey in all urban agglomerates.27 Unfortunately, at the time of writing,only the data tapes of Greater Buenos Aires were available for May 2001.It is preferable to contrast estimates of 2001 with statistics obtained usingdata from the same year since the recession deepened during 2001. Thus,we compare the statistics obtained from the sample of displaced workerswith the same statistics estimated using the data of Greater Buenos Airesfor May 2001.28 The labor force participation rate among males between28 and 59 years in Greater Buenos is 96.3 percent. The participation ratein this control group and in the displaced workers’ sample differs at the1 percent level of significance. Similarly, we find that the unemploymentrate among males displaced from YPF is 26.4 percent, while unemploymentin the control group is 13.9 percent. Thus, we find that even though thelabor force participation rate of the displaced workers, 10 years after dis-placement, is slightly below the labor force participation rate of a compa-rable group in the population, their unemployment rate is twice as high asthe population unemployment rate.29
The Long-Term Impact of Job Displacement on Earnings
The bulk of the evidence on worker displacement comes from the UnitedStates; there is no evidence at all from Latin America. Even using differentmethods and data sets, the evidence from the United States is unambiguous:in addition to the direct income loss associated with unemployment, work-ers face large and persistent earnings losses after displacement (see, for ex-ample, Jacobson, LaLonde, and Sullivan 1993).
Most of the U.S. research on the impact of job displacement on earn-ings assumes that workers’ earnings at a given date depend on the timesince displacement through a set of dummy variables for the number ofquarters after (and possible before) displacement (see, for example,Jacobson, LaLonde, and Sullivan 1993).
Consider the simplest case where we observe earnings at time t0 beforedisplacement and at time th. At time tj, where h � j � 0, a group of work-ers was displaced from their jobs. If a longitudinal data set were available,we would estimate the displaced workers’ earning losses as the differencebetween their actual and expected earnings had the events that led to their
98 GALIANI, GERTLER, SCHARGRODSKY, AND STURZENEGGER

job losses not occurred. Thus, we would estimate a two-way fixed-effecterror component model like the following:
yit � � dDPit � t xit � �t � �i � εit (2.4)
where t � 0 or h; yit is the logarithm of earnings of worker i in period t,xit is a set of control variables—the standard human capital variables in-cluded in a earnings equation—that vary across both individuals and time,and dDPit is a 0–1 indicator that equals unity in period h if individual i inperiod j was displaced from his or her job. Finally, �i is a time-invarianteffect unique to individual i, �t is a time effect common to all individualsin period t, and εit is an individual time-varying error distributed inde-pendently across individuals and time, and independently of all �i and �t.Note that, in general, is not allowed to be a time-varying parameter.Indeed, by default, the regression equation 2.4 models the “returns to ed-ucation” as time-invariant. This assumption is not free of problems sinceit assumes that the growth rate of earnings is not affected by the change inrelative prices.
The control group would be the workers not displaced. Thus, it is crit-ical that displacement represents an event exogenous to the wage profileof the displaced individuals and hence, the expected wages of the controlgroup are the same as the expected wages of the displaced workers hadthey instead stayed in their jobs. Although, in principle, displacementcaused by privatization seems to be an event exogenous to workers’ deci-sions, in practice, it is not. Displaced workers are older than workers whoare not displaced, and displacement is dominated by selection based on in-dividual characteristics. The main problem with the counterfactual group,however, is that their wages are not the same as the expected wages of thedisplaced workers if privatization had not taken place; that is because pri-vatization affects the functioning of the entire firm including productivityand real wages. Furthermore, since our parameter of interest measureslong-term earnings losses because of displacement from privatization, thecontrol group would be made up of individuals who have remained intheir jobs since privatization occurred; the control group would thus com-prise an unusual group of workers that is not likely to be comparable tothe group of workers displaced by privatization.
In this study, therefore, we focus on a family of alternative parame-ters—namely, the parameters of interest in a study of the benefits and costsof privatization. First, we define displaced workers’ earnings losses(DWEL) to be the difference between the actual and expected earnings ofa displaced worker where the expected earnings are assumed to be thosetaken from the population of similar individuals in terms of observablesocioeconomic variables (DWEL I) instead of from the workers not dis-placed from a privatized firm. We argue that, in general, this parameter isthe appropriate evaluation of the earnings costs of displacement caused by
THE BENEFITS AND COSTS OF PRIVATIZATION IN ARGENTINA 99

privatization. Argentina, however, has a relatively generous system of sev-erance pay (Galiani and Nickell 1999). Thus, when displaced, workersreceived a nontrivial severance payment that they could invest and fromwhich they could obtain a flow of income. Naturally, workers may investtheir severance differently and have different returns as a result. Nonethe-less, they could invest the severance in secure coupon bonds with a fixedinterest rate and constant, regular repayment of interest (U.S. Treasurybonds, for example). Thus, an alternative estimate of the displaced work-ers’ earnings losses is the difference between their actual and expectedearnings where their actual earnings also incorporate the potential flow ofinterest on a coupon bond over the severance payment received at the timeof displacement and where the expected earnings are defined in the sameway as before (DWEL II).
To estimate our parameters of interest, consider the data-generatingprocess of the earnings of a typical displaced worker. In period 0, they aregiven by:
yi0 � c0 � 0 xi0 � �i � εi0 (2.5)
while in period h they are given by:
yih � ch � h xih � � � �i � εih (2.6)
Thus, if we knew the parameter vector {ct,�t}t�0,h, a consistent estimateof � would be given by the following before-and-after estimator: �� � it,where it � yit � ct � t xit. Thus, � � � it � � � �εit. However, we donot know {ct,�t}t�0,h. To circumvent this lack of knowledge, we estimatean earning equation in a sample representative of the population in peri-ods 0 and h. Thus, we estimate the parameter vector {ct,�t}t�0,h using acontrol group. Note that our estimator of � is the simplest version of theconditional difference-in-difference matching estimator (see Heckman,Ichimura, and Todd 1997).
In our sample, t � 1991 and 2001. We estimate the parameter vec-tor {ct,�t}t�1991,2001 by estimating earnings equations using householdsurvey data from the Greater Buenos Aires agglomerate for the waves ofOctober 1991 and May 2001. We sample males between 18 and 59years old who have a job at the time these household surveys were con-ducted. The dependent variable is the logarithm of the monthly earningsof the workers in their main occupations. We exclude unpaid workersfrom the sample. The conditioning variables are a set of schooling dum-mies and the age and the age squared of the sampled individuals. Theschooling dummy variables measure the maximum level of the educa-tional system attended by an individual and whether or not it was com-pleted. The base category in the regression function is the complete pri-mary school.
100 GALIANI, GERTLER, SCHARGRODSKY, AND STURZENEGGER

Since the household survey obtains data only on earnings in the monthprevious to the survey, we consider only the earnings of the displacedworkers that were occupied at the time they were surveyed in 2001. To es-timate DWEL II, we assume a monthly interest rate of 0.5 percent on theseverance payment. In table 2.12 we present our best estimates of DWEL Iand DWEL II.
The results are unambiguous: displaced workers face long-term substan-tial earnings losses. Our estimate of our statistic DWEL I is 51.8 percent ofthe earnings before privatization.30 This estimate is substantially higher thanthe one obtained by applying the before-and-after estimator to the displacedworkers’ data set, which is 39.4 percent. However, there are two reasonswhy this latter measure does not capture the full effect of displacement onworkers’ earnings. First, it does not control for macroeconomic factors thatcause changes in workers’ earnings regardless of whether they are displaced.Second, this measure does not account for the earnings growth that wouldhave occurred in the absence of job loss; in the long term, workers’ earningsmay return to their levels before displacement, but not to the levels expectedbefore their job losses (see Jacobson, LaLonde, and Sullivan 1993).
As expected, our statistic DWEL II is somewhat lower than DWEL I.It is 41.7 percent; still, we estimate quite a substantial earnings loss afterdisplacement, well above the earnings losses because of displacement
THE BENEFITS AND COSTS OF PRIVATIZATION IN ARGENTINA 101
Table 2.12 The Effect of Privatization on Displaced Workers’Earnings Flows
DWEL I DWEL II(�) (�)
�0.73*** �0.54***(0.055) (0.052)Number of displaced workers’ Number of displaced workers’
observations: 150 observations: 139
*** Significant at 1 percent level.Note: DWEL refers to the change in the excess workers earn over their estimated
market wages. Market wages are estimated from an earnings regression on thehousehold survey. Only displaced workers currently working in 2001 are considered.DWEL I considers only current earnings. DWEL II adds the potential interest incomeon the severance payment (estimated at a monthly rate of 0.5 percent). The logarithmof earnings is used for the estimation. The estimate of DWEL II does not change atall if we do not impute the potential monthly flow of interests because of investingthe severance payment in a secure coupon bond to a few observations that reportthey actually obtain monetary profits from the investment they did with the sever-ance payment they received after displacement. Standard errors, in parentheses, arecomputed by assuming that our estimate of {ct,t}t�1991,2001 coincides with the trueparameter values.
Source: Authors’ calculations.

estimated in the United States. Thus, it appears that there is a huge re-distribution cost associated with the privatizations of SOEs: displacedworkers incur substantial earnings losses. What is more, since unem-ployment is higher among displaced workers than among a comparisongroup in the population, the earnings losses because of displacement arehigher than the ones estimated by our statistic DWEL II. Indeed, we es-timate that after taking into account unemployment, the earnings lossesbecause of privatization are approximately 50 percent of the real earningsof the workers before privatization.
Finally, it is worth considering where the earnings losses of the displacedworkers come from. Figure 2.3 shows the correlation of our estimates of
102 GALIANI, GERTLER, SCHARGRODSKY, AND STURZENEGGER
Figure 2.3 Displaced Workers’ Earnings Rents: 1991 and2001
Note: Figure shows a correlation between displaced workers’ rents in 1991and 2001 (before and after their displacement). Rents are measured as thedifference between their earnings and the expected earnings from an earningsregression for all workers in the household survey. Most workers enjoyedpositive rents before their displacement, but roughly half of them did in 2001.(Earnings of 2001 do not include interest flow.)
Source: Authors’ calculations.
1991
2001−1.8 −1 0 1 2
−.5
0
1
2

1991 and 2001. Notice that t measures the rent of a worker (that is, thedifference between what an employed worker gets from his/her employ-ment relationship and his/her outside option). As can be observed, almostall workers extracted (positive) rents in 1991, while only half of them werestill obtaining (positive) rents in 2001.
Conclusions
In this chapter, we evaluated both the efficiency and some significant dis-tributional impacts of the Argentine privatization program. This was doneby considering privatization as a policy instrument and by exploiting thefact that exposure to privatization of a group of economic units (SOEs,public banks, households, and workers) varied both by unit and by year.We then used a similar statistical identification strategy to document someof the benefits and costs of privatization. Although we were not able toidentify all the efficiency and distributional impacts of privatization byapplying this treatment and control group approach, we contributed tothe literature by documenting a wide set of causal effects of privatizationon measures of efficiency and distribution.
Following La Porta and López-de-Silanes (1999), we studied theeffects of privatization on profitability, operating efficiency, productiv-ity, output, investment, employment, wages, and prices for both financialand nonfinancial privatized firms in Argentina during the 1990s. We alsostudied two direct measures of the welfare impact of privatizations. First,the Argentine program involved the privatization of local water and sew-erage firms. Changes in the health of the population associated with theseprivatizations would provide a measure of the impact of privatizationthat goes beyond transfers of consumer surplus. We evaluated how theprivatization of local water and sewerage firms affected both access toservice and child mortality. Second, the Argentine program involvedmassive layoffs. Profitability gains in privatized firms may have beenobtained at the expense of workers. We measured the effect of privatiza-tions on workers’ earnings by comparing the before-and-after wages of arandom sample of laid-off workers from YPF with a matched counter-factual group build up using data gathered from the ongoing householdsurvey.
Before discussing our results, a caveat is in order. We perform here apartial equilibrium analysis. This chapter analyzes the effects of privatiza-tion on several measures of firm performance and on the welfare of con-sumers and employees in the markets affected by the privatizations. We donot evaluate the potential macroeconomic effects of a privatization pro-gram as massive as the one implemented in Argentina.
We found that profitability of nonfinancial firms increased after privati-zation. Both operating income to sales and net income to sales increased sig-nificantly as a result of privatization. Large increases in operating efficiency
THE BENEFITS AND COSTS OF PRIVATIZATION IN ARGENTINA 103

underpin these gains in profitability. The impact of privatization on (con-ditional) median unit costs shows a reduction in median costs of 10 per-cent. The median sales-to-employment ratio also increased 10 percentbecause of the privatization of the SOEs. Finally, the impact of privatiza-tion on the median level of productivity shows an increase of 46 percent.Thus, we find a huge overall increase in the operating efficiency of priva-tized firms in Argentina. However, employment cuts are a big part of thestory. Employment decreased approximately 40 percent as a result of pri-vatization. Labor productivity increased not only because employmentdecreased but also because privatized firms increased production. Themedian level of production increased 25 percent because of privatization.Regarding the impact of privatization on investment, all the measuresanalyzed are positively and significantly affected by privatization. Invest-ment itself increased at least 350 percent as a result of privatization.Finally, we do not find any statistically significant effect of privatizationon prices. Nevertheless, after the privatization period, prices did not de-crease, when the efficiency gains we documented indicate that theyshould have fallen if quality improvements were not large enough. Thissuggests that there is a pending important regulatory mission to accom-plish in Argentina.
Contrary to the case of nonfinancial firms, we do not find large in-creases in operating efficiency after the privatization of public banks.The impact of privatization on (conditional) mean average costs is null.In addition, the impact of privatization on mean administrativeexpenses is positive and statistically significant. They have increased 36percent as a result of privatization. However, other indicators of effi-ciency performed better because of privatization. Output per employeeincreased 20 percent, while the average number of employees per branchdecreased 37 percent as a result of privatization. As in the case of thenonfinancial firms, employment cuts are a big part of the story. Thus,on several indicators, privatized banks seem to be more efficient afterthe privatization than before. The privatization of public banks has alsoimplied an increase in credit supply. Finally, the average capitalizationratio (net worth to assets) increased 5 percent because of privatization.The higher capitalization rate of the privatized banks means a moresolvent system, which is quite important in countries as vulnerable toexternal shocks as Argentina.
On the direct measures of welfare analyzed, we find that the privati-zation of water services had a negative and statistically significant effecton child mortality. The estimated coefficient implies a decrease ofapproximately 5 percent in child mortality rates induced by the privati-zation of water provision. Turning to our estimate of displaced workers’earnings losses, it appears that there is a huge redistributive cost associ-ated with the privatization of SOEs: displaced workers incur substantialearnings losses. The earnings losses due to displacement, after taking into
104 GALIANI, GERTLER, SCHARGRODSKY, AND STURZENEGGER

account unemployment, are approximately 50 percent of the real earn-ings of workers before privatization.
We have identified extraordinary increases in the efficiency of the pri-vatized firms. We have also found that privatization has succeeded insatisfying other important objectives such as restoring investment andenhancing the solvency of the financial system. Finally, we consideredsome direct impacts of privatization on welfare and found mixed results.Thus, although we found important benefits of privatization, we alsofound direct costs associated with them. Overall, however, our resultsare much in favor of privatization.
Appendix 2A: Sector Structure and Data Sources
Gas
Gas del Estado, a vertically integrated monopoly, was privatized inDecember 1992 and vertically divided into several production companies,two transport companies, and eight distribution companies. The trans-port and distribution companies operate as local monopolies. ENARGAS(Ente Nacional Regulador del Gas) is the national regulatory authority.Competition is allowed only in the market for large users, who can buygas directly from producers.
Financial statements of Gas del Estado were obtained from ENARGAS;financial statements for the private companies were obtained from theBuenos Aires Stock Exchange (if the firms were publicly traded) and fromInspección General de Justicia.
Telecommunications
ENTEL (Empresa Nacional de Telecomunicaciones), which was trans-ferred to private hands in November 1990, was divided into two newcompanies, Telecom and Telefónica de Argentina, to provide telecommu-nications services in the northern and southern parts of the country, re-spectively. The companies operated as regional monopolies until 1999,when entry into the long-distance market was deregulated. Entry in localmarkets was deregulated in 2000. The regulatory authority is theComisión Nacional de Comunicaciones (CNC).
The sources of information were the financial statements of ENTELobtained from SIGEN (Sindicatura General de la Nacion), the financialstatements of Telecom and Telefónica de Argentina, Heymann andKosacoff (2000), and statistical information from the InternationalTelecommunications Union for 1991 and 2001. No official financialstatements were produced for ENTEL for the years 1989 and 1990. Theprice structure changed several times during the 1990s, making price
THE BENEFITS AND COSTS OF PRIVATIZATION IN ARGENTINA 105
comparisons difficult. We use the telecommunications index of the CPIas our price variable.
Electricity
In the electricity sector, the largest SOEs were SEGBA (Servicios Eléctri-cos del Gran Buenos Aires), Agua y Energía Eléctrica, and Hidronor(Hidroeléctrica Norpatagónica). SEGBA was the distributor in theBuenos Aires metropolitan area, but it also generated part of the energyit distributed. Agua y Energía Eléctrica and Hidronor were basicallygenerators of electricity. With the privatization, the electrical sector wasvertically divided into generation, transport, and distribution. SEGBAwas divided into three distributors (Edenor, Edesur, and Edelap) and fivegenerators (Central Puerto, Central Costanera, Central Dock Sud, CentralDique, and Central Pedro de Mendoza). Hidronor and Agua y EnergíaEléctrica were divided into 6 transport companies and 22 generators.Competition occurs, mainly, in the generation activities. The sector isnow subject to regulation by the secretary of energy, ENRE (Ente Na-cional Regulador de la Electricidad), and CAMMESA (CompañíaAdministradora del Mercado Mayorista Eléctrico SA). The secretary ofenergy is responsible for the norms in the sector, ENRE is responsible forthe application of these norms, and CAMMESA is responsible for the co-ordination among the different participants in the market (generators,transporters, and distributors).
We obtained SEGBA financial statements for the period 1986–91from SIGEN and Ministerio de Economía, and the financial statementsof Edenor, Edesur, Edelap, Central Puerto and Central Costanera (thefirms that resulted from SEGBA divestiture) for the period 1992–94 fromENRE. For Hidronor, we obtained two audit statements for 1987 and1988 and the final financial statement for 1991. We also obtained datafor 99.92 percent (in terms of privatization revenues) of the generatorcompanies that emerged from the privatization of Hidronor. We wereable to find information for three of the six transportation companies;the three account for 91.7 percent of the privatization revenues of theelectricity transportation companies. Our sources of information wereMinisterio de Economía, SIGEN, ENRE, Buenos Aires Stock Exchange,and the companies that were willing to collaborate.
Water and Sewerage
Obras Sanitarias de la Nación was the provider of water and sewerageservices in the Buenos Aires metropolitan area and was transferred toprivate hands in 1992. Aguas Argentinas is the private company thatprovides these services under a 35-year concession. The regulatory au-thority for the Buenos Aires metropolitan area is Ente Tripartito de
106 GALIANI, GERTLER, SCHARGRODSKY, AND STURZENEGGER

Obras y Servicios Sanitarios. In other parts of the country water andsewerage services are provided by a large and heterogeneous group ofcompanies (cooperatives, and municipal and provincial companies), sev-eral of which were also privatized.
We focus on Obras Sanitarias de la Nación and Aguas Argentinas. Thedata for these companies were obtained from official financial statementsfrom Ministerio de Economía and SIGEN. Most of the local providers thatare or were (before privatization) cooperatives or local companies do nothave financial statements.
Airlines
Aerolíneas Argentinas was privatized in 1990. It operates as an unregu-lated oligopoly in the domestic market and competes in the internationalmarket. Information on Aerolíneas Argentinas was obtained from Minis-terio de Economía (before privatization) and the official financial state-ments of the company (after privatization).
Railroads
Ferrocarriles Argentinos was the SOE that managed the railroad system forthe entire country. In a first stage toward privatization, the company wasdivided into three segments: cargo, urban passengers, and long-distancepassengers. The cargo segment was finally divided into five private compa-nies, which obtained 30-year concessions for the payment of an annualcanon and a preset investment schedule. These companies are Buenos Airesal Pacífico San Martín SA, Nuevo Central Argentino SA, FerrocarrilMesopotámico, Ferrosur Roca, and Ferroexpreso Pampeano.
In the urban passenger sector, a new company, Ferrocarriles Metro-politanos SA, was created in April 1991 and then divided into sevenlines according to the old Ferrocarriles Argentinos lines. One company,Trenes de Buenos Aires SA, operates two lines (Mitre and Sarmiento).Thus, in this segment six companies operate seven railway lines. Theprivate companies have an investment schedule, and they receive anannual subsidy, because it was thought that they would not be able tomake profits.
The long-distance passenger segment was unprofitable and deemed un-likely to be attractive to the private sector. The federal government insteadoffered the operation to the provinces interested in maintaining the serv-ice. Only seven provinces accepted this offer, and the rest of the serviceswere discontinued. The regulatory authority is the Comisión NacionalReguladora del Transporte.
The data for the railways companies were obtained from SIGEN (be-fore privatization) and from the official financial statements of the com-panies and Ministerio de Economía (after privatization).
THE BENEFITS AND COSTS OF PRIVATIZATION IN ARGENTINA 107

Postal Services
The SOE was Empresa Nacional de Correos y Telégrafos, which was trans-formed into Empresa Nacional de Correos y Telégrafos SA in December1992 and privatized in September 1997. Since December 1997 it has beencontrolled and operated privately as Correo Argentino SA. This privategroup has a 30-year concession in return for an annual fee. The regulatoryauthority is the CNC.
The data for postal services were obtained from SIGEN (before priva-tization) and from the official financial statements of the company (afterprivatization).
Oil
YPF (Yacimientos Petrolíferos Fiscales) was the SOE sold to the privatesector in 1992. Many of YPF’s assets, such as tankers, fleet, two refiner-ies, and most of the primary and secondary drilling areas, were sold sepa-rately. The company has operated in an unregulated market since 1991.Repsol of Spain acquired it in 1999.
Because so many of YPF’s assets were sold separately, any comprehen-sive comparison between the performance of YPF as a public entity andYPF as a private entity is impossible. Bearing this in mind, we were able toprovide some comparisons of the public YPF to what remained of YPF inprivate hands. The data for both the public and private YPF were obtainedfrom official financial statements from Ministerio de Economía and thefirm’s Web site.
Other
Two SOEs that were privatized were under the control of Ministerio deDefensa. SOMISA (Sociedad Mixta Siderurgica Argentina) was themain steel manufacturer in Argentina. Between 1991 and 1995, a “tran-sition company,” Aceros Paraná, was formed, which was privatized asSIDERAR in 1995. Tandanor (Talleres Navales Dársena Norte), a ship-yard, was transferred to private ownership in December 1991. BothSOMISA and Tandanor operate in unregulated markets.
The data found for SOMISA are incomplete, since the only source ofinformation is an audit report. No data were available for the transitioncompany Aceros Paraná. The data for Tandanor were obtained fromSIGEN (before privatization) and from Inspección General de Justicia (afterprivatization).
Banks
Even though the major economic reforms in Argentina took place duringthe first half of the 1990s, the banking sector went through an important
108 GALIANI, GERTLER, SCHARGRODSKY, AND STURZENEGGER

THE BENEFITS AND COSTS OF PRIVATIZATION IN ARGENTINA 109
Appendix Table 2B.1 Description of the Variables Used toEvaluate the Impact of Privatization on the Performance ofNonfinancial Firms
Variable Description
Fixed assets(property, plant,and equipment,or PPE)
Sales
Operating income
Operatingincome/sales
Net income
Net income/sales
Unit costs
Employment
Wages per worker
Sales/employment
Operating income/employment
Value of the company’s fixed assets adjusted forinflation. PPE is measured by noncurrent assets.
Total value of products and services sold, minussales returns and discounts.
Sales minus operating expenses, cost of sales, anddepreciation.
Ratio of operating income to sales. Operatingincome is equal to sales minus operating expenses,cost of sales, and depreciation. Sales equal thetotal value of products and services sold, minussales returns and discounts.
Operating income plus other normal income minusother normal expenses. Note that extraordinaryresults and income taxes are excluded.
Ratio of net income to sales. Net income equalsoperating income plus other normal income minusother normal expenses. (Note that extraordinaryresults and income taxes are excluded.) Sales equalthe total value of products and services sold, minussales returns and discounts.
Ratio of total cost of sales to sales. Cost of salesequals the direct expense involved in theproduction of a good (or provision of a service).Sales equal the total value of products and servicessold, minus sales returns and discounts.
Total number of employees. Employees are takento be all workers who depend directly on thecompany.
Ratio of the total wage schedule paid by the firm tothe total number of workers who depend directlyon the company.
Ratio of sales to total employment. Sales equal thetotal value of products and services sold, minussales returns and discounts. Employment takes intoaccount all workers who depend directly on thecompany.
Ratio of operating income to total employment.Operating income is equal to sales minus
(Table continues on the following page.)

110 GALIANI, GERTLER, SCHARGRODSKY, AND STURZENEGGER
Prices
Production
Production/employment
Investment
Investment/sales
Investment/employment
operating expenses, minus cost of sales, and minusdepreciation. Employment takes into account allworkers who depend directly on the company.
In most cases, ratio of sales to physical output. Formultiproduct firms or firms where prices are two-or three-part tariffs, the variable equals the priceindex of the product constructed by INDEC(Instituto Nacional de Estadísticas y Censos).This latter definition applies only to ObrasSanitarias de la Nación, Entel, Encotel, SOMISA,and YPF.
Total output of the firm. For some multiproductfirms, this variable is the ratio of total sales toprices, where prices are constructed by INDEC(Instituto Nacional de Estadísticas y Censos).This latter definition applies only to ObrasSanitarias de la Nación, Entel, Encotel, SOMISA,and YPF.
Ratio of production to total employment.Production equals total output of the firm. Forsome multiproduct firms, this variable is the ratioof total sales to prices, where prices areconstructed by INDEC (Instituto Nacional deEstadísticas y Censos). This latter definitionapplies only to Obras Sanitarias de la Nación,Entel, Encotel, SOMISA, and YPF. Employmenttakes into account all workers who depend directlyon the company.
Value of expenditure to acquire property,equipment, and other capital assets that producerevenue (gross investment).
Ratio of investment to sales. Investment equals thevalue of expenditure to acquire property,equipment, and other capital assets that producerevenue. Sales equal the total value of productsand services sold, minus sales returns anddiscounts.
Ratio of investment to total employment.Investment equals the value of expenditure toacquire property, equipment, and other capitalassets that produce revenue. Employment takesinto account all workers who depend directly onthe company.
Appendix Table 2B.1 (continued)
Variable Description

THE BENEFITS AND COSTS OF PRIVATIZATION IN ARGENTINA 111
Appendix Table 2B.2 Description of the Variables Used toEvaluate the Impact of Privatization on the Performance ofFinancial Firms
Variable Description
ROA
ROE
Profit margin
Operatingmargin
Interestmargin
BranchesEmployeesOutput
Average cost
Capitalization
Operatingincome
Loan growth
Return on assets. Ratio of net income to assets. Netincome equals operating income plus other normalincome minus other normal expenses. (Note thatextraordinary results and income taxes are excluded.)Assets equal the sum of cash holdings ($ � US$), publictitles, loans, participation in other societies, fixed assets,other assets, intangible assets, and foreign subsidiaries.
Return on equity. Ratio of net income to net worth. Netincome equals operating income plus other normalincome minus other normal expenses. (Note thatextraordinary results and income taxes are excluded.)Net worth equals total assets minus total liabilities.
Ratio of net income to total revenue. Net income equalsoperating income plus other normal income minusother normal expenses. (Note that extraordinary resultsand income taxes are excluded.) Total revenue is equalto financial income plus service income plusirrecoverable charges.
Ratio of financial income plus irrecoverable charges plusservices income plus financial expenditures plus servicesexpenditures plus administrative expenses to financialincome plus irrecoverable charges plus other income.
Ratio of financial incomes plus financial expendituresplus irrecoverable charges to loans plus public titles.
Number of branches per institution.Number of employees per institution.Cash holdings ($ � US$) plus public titles plus loans plus
deposits.Ratio of administrative expenses to output.
Administrative expenses include wages, tax payments,and asset depreciation. Output equals the sum of cashholdings ($ � US$), public titles, loans, and deposits.
Ratio of capital to assets. Assets equal the sum of cashholdings ($ � US$), public titles, loans, participation inother societies, fixed assets, other assets, intangibleassets, and foreign subsidiaries.
Operating income equals the sum of financial incomes,irrecoverable charges, and service income.
Growth in total loans, calculated as the logarithm ofloans in year t minus the logarithm of loans in year t � 1.

transformation after the Tequila crisis of December 1994. From the 35public banks that started the decade, 19 were privatized between 1992 and1999, 2 were merged with privatized banks, and 14 banks continued to beowned by the public sector. We analyze the privatization of 17 banks. Thedata set we used was provided by BCRA (the central bank) and containsmonthly financial information of all the entities that operated in theArgentine Financial System for the period June 1993 through September1999. It includes the basic balance sheet accounts, income structure, andsome physical data such as the number of employees and branches.Although the data set covers the period in which almost all the bank pri-vatizations took place, not all the information is available for every mo-ment. Particularly, more disaggregated and better quality data are availableonly for more recent periods.
Notes
The authors are grateful for the comments of Alberto Chong, FlorencioLópez-de-Silanes, and Máximo Torero. Matias Cattaneo, María Eugenia Gari-botti, Hernán Moscosco, Mariano Tappata, and German Sturzenegger providedexcellent research assistance.
1. Although several studies describe the privatization process in Argentina,none of them attempts to identify the causal effects of privatization on broad meas-ures of performance (see, for example, Gerchunoff 1992; FIEL 1999; and Galianiand Petrecolla 2000).
2. The effects of the numerous accusations of corruption associated with theprivatization of the Argentine public firms are also excluded from our analysis.
3. The only exception was Ferrocarriles Argentinos, the railway public enter-prise. The company was divided into 11 units (operating lines or corridors) givenin concession, and it was possible to find data by business unit for the preprivati-zation period.
4. Income from concessions is not considered in these calculations. AguasArgentinas and the railway companies were privatized under this legal form.Information on total revenues from concessions is not available.
5. Possibly including a set of control regressors that vary across both unitsand time.
6. La Porta and López-de-Silanes (1999) use a difference-in-difference estima-tor to isolate the contribution of privatization to firm performance. As a controlgroup, they form industry control groups (three-digit Standard Industrial Classifi-cation, or SIC, code level) using all private firms trading in the Mexican Stock Mar-ket (they used economywide aggregates where no matching firms were found). Inour case, since most of the privatizations are the only firm in the sector, we have torely on the nonprivatized firms to assess the counterfactual scenario of the priva-tized ones. Thus, our estimates of equations 2.1 and 2.2 are the closest we can getto their mean and median sector-adjusted estimates.
7. As explained before, some small privatized firms are not included in ourdata set. However, even if we had information on those small privatizations, theappropriateness of pooling small and large firms in our econometric analysis wouldbe arguable.
8. Naturally, the number of observations included in the control group eachyear decreases every time a firm is privatized. Nevertheless, it is worth noting that
112 GALIANI, GERTLER, SCHARGRODSKY, AND STURZENEGGER

if the statistical model specified to identify the impact of privatization on therandom variable y is correct, this is not a nuisance.
9. For several variables, however, the data are not that reliable because of thesevere difficulties of producing consistent balance sheet accounts in periods ofextreme price instability. We have detected some outliers in 1989. In addition,other outliers are dispersed across the data set. We do not exclude them from theregressions. Instead, as we explain later in the chapter, we present the results froma median regression, which are robust to outliers in the dependent variable.
10. We do not attempt to measure directly the impact of privatization on thestock of fixed assets because of the severe measurement errors in this variablealready discussed.
11. In this context, robust connotes a certain flexibility of the statistical proce-dures to deviations from the distributional assumptions of the hypothesized mod-els (see Koenker and Bassett 1978).
12. The percentage change of any variable y with respect to privatization isgiven by 100 [Exp(�) � 1], where � is the estimated coefficient in the regressionequation 2.1 or 2.2 when the dependent variable is the natural logarithm of y.
13. For example, in the case of YPF, a random sample of laid-off workersshows that in 1991, just before the privatization of the firm in 1993, the mean (me-dian) age of these workers was 43 (43) years while the mean (median) age of theemployees in the manufacturing sector was 34 (33) years (household survey, all ur-ban agglomerates). Only 10 percent of the laid-off workers from YPF were youngerthan 30 years, while 43 percent of the employees in the manufacturing sector wereyounger than 30 years in 1991.
14. At least 60 percent of the estimated (conditional) median impact of the pri-vatizations on real wages may be explained by the change in the average age of theworkers if the data from YPF are representative of all privatizations. We estimatedan earnings function using wage data from the random sample of displaced work-ers from YPF for the year 1991 and computed the implied decrease in average realwages as the result of the estimated change in the average age of the workers of YPFafter privatization.
15. It is still statistically different from 0 at the 1 percent level of significance. 16. This statistic may overestimate the contribution of layoffs to profits be-
cause it assumes that the laid-off workers were completely unproductive. 17. For example, our results on the effect of privatization on child mortality,
discussed later in the chapter, may come from a mix of better access and improvedwater quality.
18. FIEL (1999) also finds that most of the real prices of the goods and servicesprovided by the former SOEs did not increase during the 1990s even though mostof them were increased at the beginning of the 1990s. Nevertheless, the prices ofthe goods and services of most privatized firms are indexed by the U.S. consumerprice index. This implies that the prices of the privatized firms could have increased18.5 percent since 1995 with respect to the domestic CPI. However, these changesin prices are not identified as a result of the privatization even though they arecaused by the regulatory framework. Clearly, this regulatory pricing policy is in-consistent with a fixed exchange rate policy like the one adopted by Argentina dur-ing the 1990s.
19. The changes in the interest margins are mainly caused by the reduction inthe share of nonperforming loans after the privatization. When we perform a testof mean differences on the interest margin without netting the nonperformingloans, we reject the hypothesis of equal means only at the 10 percent significancelevel. This improvement in the loan performance after privatization could result be-cause the private banks managed credit decisions better or because the “bad loans”were placed in the residual entity. In the latter case, again, the bank fixed-effect as-sumption in the before-and-after estimator breaks down.
THE BENEFITS AND COSTS OF PRIVATIZATION IN ARGENTINA 113

20. The first potable water service of Argentina was provided by Obras Sani-tarias de la Nación in 1870. It initially served 30,000 people, and coverage contin-ued to expand until 1960. In the 1980s coverage as a share of population actuallycontracted. OSN’s jurisdiction was nationwide until 1980. At that point, it was re-stricted to Capital Federal and 13 localities of Greater Buenos Aires. Responsibil-ity for service in the rest of the country was transferred to provincial governments(Artana, Navajas, and Urbiztondo 1999).
21. According to our estimates, the served population increased 4.8 percent ayear, while population itself increased approximately 1.7 percent a year.
22. Most privatizations also included the provision of sanitation services. 23. Data on household income and inequality (the ratio of the top 10 percent
to the bottom 10 percent of the distribution of per capita family income) are ob-tained from the Permanent Household Survey.
24. By rent, we mean the difference between what an employed worker can getfrom his/her employment relationship and his/her outside option.
25. Individuals were asked to consider the overall impact of displacement fromYPF on their welfare, taking into account that they received a severance paymentat the time of displacement. Approximately 80 percent of the sample reported thatthe major benefit lost was the health insurance package. Of the displaced workerswho were employed at the time of the survey, half considered that they were in apermanent (stable) job, while 37 percent thought their job was transitory. Theremaining 13 percent were unsure how to characterize the stability of their currentemployment.
26. The female labor force participation rate is 70 percent, although the sam-ple included only 33 females younger than 60 years.
27. Alternatively, we could compare the statistics obtained from the surveyconducted to the displaced workers from YPF with the same statistics estimatedfrom the May 2001 wave of the household survey using data from the urban ag-glomerates of Chubut, Greater Buenos Aires, La Plata, Mendoza, Neuquen, andSalta. These regions match geographically the places where our sample of displacedworkers resides.
28. The data gathered at the beginning of May 2001 and at the beginning ofAugust 2001 are perfectly comparable. It was only after October 2001 that thelevel of economic activity in Argentina imploded.
29. These differences are even greater for skilled workers (those with at leastsome college or a tertiary degree). The unemployment rate among male unskilled(at most high school) workers displaced from YPF is 28 percent, while the maleskilled unemployment rate in the same sample is 20 percent. The same statistics inthe control group are, respectively, 15.8 and 6.4 percent.
30. Remember that the percentage change of y with respect to privatization isgiven by 100 [Exp(�) � 1].
References
Artana, D., F. Navajas, and S. Urbiztondo. 1999. “Governance and Regulation inArgentina.” In W. Savedoff and P. Spiller, eds., Spilled Water. Washington,D.C.: Inter-American Development Bank.
Burdisso, T., L. D’Amato, and A. Molinari. 1998. “Privatización de Bancos en laArgentina: ¿Un Camino hacia una Banca más Eficiente?” Documento de Tra-bajo 4. Banco Central de la República Argentina, Buenos Aires.
Caves, Richard. 1990. “Lessons from Privatization in Britain: State EnterpriseBehavior, Public Choice, and Corporate Governance.” Journal of EconomicBehavior and Organization 13: 145–69.
114 GALIANI, GERTLER, SCHARGRODSKY, AND STURZENEGGER

CEP (Centro de Estudios Públicos). 1998. “Privatizaciones: Un Balance Cuantita-tivo.” Ministerio de Economía, Buenos Aires (www.minproduccion.gov.ar).
Chamberlain, G. 1984. “Panel Data.” In Zvi Griliches and M. Intriligator, eds.,Handbook of Econometrics. Amsterdam: North-Holland.
Esrey, S. A., J. B. Potash, L. Roberts, and C. Shiff. 1991. “Effects of Improved Wa-ter Supply and Sanitation on Ascariasis, Diarrhoea, Dracunculiasis, HookwormInfection, Schistosomiasis and Trachoma.” Bulletin of the World Health Orga-nization 69: 609–21.
FIEL (Fundación de Investigaciones Económicas Latinoamericanas). 1999. La Reg-ulación de la Competencia y de los Servicios Públicos. Buenos Aires.
Galiani, Sebastián, and S. Nickell. 1999. “Unemployment in Argentina in the1990s.” Working Paper DTE 219. Instituto Torcuato Di Tella, Buenos Aires.
Galiani, Sebastián, and D. Petrecolla. 1996. “The Changing Role of the Public Sec-tor: An Ex-post View of the Privatization Process in Argentina.” Quarterly Re-view of Economics and Finance 36: 131–52.
———. 2000. “The Argentine Privatization Process and Its Aftermath: Some Pre-liminary Conclusions.” In Melissa Birch and Jerry Haar, eds., The Impact ofPrivatization in the Americas. Boulder, Colo.: North-South Center Press.
Gerchunoff P., ed. 1992. Las Privatizaciones en Argentina—Primera etapa. BuenosAires: Instituto Torcuato Di Tella.
Hall, B. 1995. “Lost Jobs.” Brookings Papers on Economic Activity, pp. 221–73.Washington, D.C.: Brookings Institution.
Hamermesh, D. 1989. “What Do We Know about Worker Displacement in theUnited States.” Industrial Relations 28: 51–59.
Heckman, J., and R. Robb. 1985. “Alternative Methods for Evaluating the Impactof Interventions: An Overview.” Journal of Econometrics 30: 239–67.
Heckman, J., H. Ichimura, and P. Todd. 1997. “Matching as an EconometricEvaluation Estimator: Evidence from Evaluating a Job Training Programme.”Review of Economic Studies 64: 605–54.
Heymann D., and B. Kosacoff. 2000. La Argentina de los Noventa–Tomo II–Desempeño Económico en un Entorno de Reformas. Buenos Aires: EditorialUniversitaria de Buenos Aires.
Jacobson, L., R. LaLonde, and D. Sullivan. 1993. “Earnings Losses of DisplacedWorkers.” American Economic Review 83: 685–709.
Koenker, R., and G. Basset. 1978. “Regression Quantiles.” Econometrica 46: 33–50.
La Porta, Rafael, and Florencio López-de-Silanes. 1999. “The Benefits of Privati-zation: Evidence from Mexico.” Quarterly Journal of Economics 114:1193–242.
Lustig, Nora. 1992. Mexico: The Remaking of an Economy. Washington, D.C.:Brookings Institution.
Megginson, William, Robert Nash, and Matthias van Randenborgh. 1994. “TheFinancial and Operating Performance of Newly Privatized Firms: An Interna-tional Empirical Analysis.” Journal of Finance 49: 403–52.
Ministerio de Economía, Government of Argentina. 2000. “El Proceso de Privatiza-ciones en la Argentina desde una Perspectiva del Balance de Pagos.” Buenos Aires.
Ruhm, C. 1991. “Are Workers Permanently Scared by Job Displacement?” Amer-ican Economic Review 81: 319–24.
Shirley, M. 2000. “Reforming Urban Water Systems: A Tale of Four Cities.” InL. Manzetti, ed., Regulatory Policy in Latin America: Post-Privatization Reali-ties. Miami: North-South Center Press.
THE BENEFITS AND COSTS OF PRIVATIZATION IN ARGENTINA 115

Shleifer, Andrei, and Lawrence Summers. 1988. “Breach of Trust in HostileTakeovers.” In Alan Auerbach, ed., Corporate Takeovers: Causes and Conse-quences. Chicago: University of Chicago Press.
Vining, Aidan R., and Anthony Boardman. 1992. “Ownership vs. Competition:Efficiency in Public Enterprises.” Public Choice 73: 205–39.
WHO (World Health Organization). 2000. Global Water Supply and SanitationAssessment 2000 Report. Geneva.
116 GALIANI, GERTLER, SCHARGRODSKY, AND STURZENEGGER

3
Privatization and FirmPerformance in BoliviaKatherina Capra, Alberto Chong,
Mauricio Garrón, Florencio López-de-Silanes,and Carlos Machicado
FOLLOWING THE EXAMPLE SET BY THE Thatcher government in Britain in theearly 1980s, the transfer of state-owned enterprises (SOEs) to the privatesector has become widespread. By the end of the 1990s, more than 100countries had adopted some kind of privatization program (Megginsonand Netter 2001). The wide acceptance of this policy in Latin America re-sulted from a recognition that the state failed to deliver on its promisesmore often than not and that more efficient alternatives were available. Inparticular, the acceptance of market mechanisms meant the abandonmentof the import substitution paradigm that had been the region’s definingpolicy during the previous decades.
In recent years, however, privatization has come under severe criticism,as the benefits of the program have often gone unnoticed, while its failureshave been prominently publicized. Critics argue that the benefits of priva-tization are exaggerated; that when they do arise, they result from ex-ploitation of workers and consumers by the private sector; and that it isalways the poor or the government that foots the bill for misconceived pri-vatization schemes. Given the rising backlash against privatization inBolivia, as well as most of the rest of Latin America, a systematic analysisof the evidence is in order to ensure that the right conclusions are reachedand that appropriate decisions are made regarding whether privatizationshould be rolled back, as the critics propose, or instead be expanded anddeepened.
Bolivia, like many other Latin American countries, undertook privati-zation with enthusiasm. Measured by both the number of firms sold andtheir average size, Bolivia’s privatization program is small by international
117
standards but important relative to its economy. During the 1990s Boliviareceived privatization revenues equivalent to approximately 12 percent ofits 1999 gross domestic product (GDP)—a greater share than Argentina,Brazil, or Mexico (see chapter 1).
Our sample of Bolivian firms reflects the mostly small and mediumstate-owned enterprises that were sold to the private sector and that maybe thought to react differently to privatization than the typically largefirms privatized in other countries. In addition to shedding light on theBolivian privatization program, our study may serve as a guide for othercountries seeking to privatize small- or medium-size firms.
The remainder of this chapter is structured as follows. The next sec-tion presents a review of the privatization conceptual framework, as wellas the different arguments for and against privatization. We also reviewsome of the recent literature and survey the existing studies for privatiza-tion in Bolivia. We then describe the Bolivian privatization program andclassify it into three waves, which coincide with three different adminis-trations under which the programs were undertaken. Next, we describeour data sample and the efforts conducted to collect information. We dis-cuss the firms considered in the study, as well as the reasons for theexclusion of the remaining observations. We then present our mainresults regarding the raw and industry-adjusted performance effects ofprivatization. Finally, we conclude with the policy implications that arisefrom our main findings.
Privatization: Conceptual Framework
This section provides a brief overview of the most common goals pursuedthrough privatization, a description of the theoretical framework thatunderpins most of the recent research, and an overview of the existingstudies analyzing the effects of privatization with a special emphasis onBolivia.
The Objectives Pursued with Privatization
Privatization can be undertaken for many reasons. As shown in table 3.1, itcan result from economic considerations (with a micro- or macroeconomicemphasis), political reasons, firm-related considerations, or a desire toimprove consumer welfare.1 Although many of the goals listed in table 3.1are interrelated, in some cases tradeoffs have to be made.
In a first attempt to evaluate the Bolivian privatization program, wechose to follow the footsteps of other recent studies and assume that themain objective behind the program was to improve the efficient use ofresources by privatized firms (see, among many others, Wiltshire 1987,Moore 1990, and Nellis 1991).
118 CAPRA, CHONG, GARRÓN, LÓPEZ-DE-SILANES, AND MACHICADO

The Arguments for and against Privatization
In recent years developments in the field of contract property theory havebrought researchers’ attention to the debate regarding public versus pri-vate provision of goods and services (Shleifer and Vishny 1996; Shleifer1998). According to contract theory, the government could draw up anagreement, which includes all possible contingencies, so that the contrac-tor would always deliver the expected results. Under these assumptions, itis completely irrelevant whether a good or service is provided by a publicor a private entity. However, once we consider the costs in both time andmoney involved in drawing up a contract that tries to foresee all possiblecontingencies and once we acknowledge that enforcement of contracts iscostly, the applicability of the predictions of this model seems unlikely.
In response to the incompleteness of contracts, property theory arguesthat asset ownership is the foundation for control and thus determines theincentive structure that can explain the performance of firms and man-agers.2 Within this framework, two lines of argument, the social view andthe agency view, emerge to explain why a change in ownership can lead toshifts in the performance of privatized firms. The social view argues thatSOEs play an important role in counteracting market failures by imple-menting pricing policies that take social marginal costs into account. Thus,the increased profitability of privatized firms may reflect not only effi-ciency gains but also consumer exploitation through the use of marketpower (Shapiro and Willig 1990).
The agency view, in contrast, argues that the benefits of privatizationstem from an ownership structure that provides adequate incentives. It
PRIVATIZATION AND FIRM PERFORMANCE IN BOLIVIA 119
Table 3.1 Common Objectives for Privatizations
Economic GoalsAchieve higher productivity and efficiencyStrengthen the role of the private sector in the economy Improve the public sector’s financial healthProvide autonomy to satisfy financing requirements
Political GoalsRelease the enterprise from political interferenceFree resources for allocation in other priority areasMake it possible for employees to participate as shareholders
Firm-Oriented GoalsImprove performance of specific firms
Consumer-Oriented GoalsImprove services and goodsLower prices and improve quality
Source: Authors.

begins by acknowledging that firms under state control pursue political,social, and economic objectives simultaneously and are thus almost guar-anteed to perform at a lower level than firms in the private sector(Sheshinski and López-Calva 1999).
Within this second view, there are two complementary explanationsabout the inadequate incentive structure for SOEs, depending on whothe critical agency conflict lies with—the manager or the politician. Themanagerial view argues that managers of SOEs may lack high-poweredincentives or the necessary monitoring authority to ensure that the firmis run effectively (Vickers and Yarrow 1988). The political perspectivestresses that when politicians have control over a firm, they are likely topursue a multitude of objectives and relegate efficiency considerationsto a secondary role (Shleifer and Vishny 1994; López-de-Silanes,Shleifer, and Vishny 1997). The inclusion of political and social goals islikely to diminish the pursuit of economic ones. Also, the frequentchanging of the relative importance of these priorities is likely to affectnegatively the long-term performance of SOEs. In this sense, privatiza-tion can promote efficiency by allowing the objectives of the enterpriseto be more focused and thus reducing the ambiguity attached to theseobjectives, and by facilitating long-term planning (Commander andKillick 1988).
Empirical Studies on Privatization
Most empirical studies can be classified into three broad groups: case stud-ies, intercountry studies, and cross-section studies. The first group in-cludes studies such as Ramamurti (1997) and D`Souza (1998), who findthat privatization increased productivity and reduced the work force inspecific sectors (railroads and telecommunications, respectively); Eckel,Eckel, and Singal (1997), who document significant price decreases in theairline sector following the privatization of British Airways; and New-berry and Pollitt (1997), who find that the producers and shareholdersbenefit the most from privatization, while consumers and the governmentbenefit only marginally.
Among the most prominent cross-section studies are those by Galal andothers (1994), Megginson, Nash, and van Randenborgh (1994), Frydmanand others (1998), and Boubakri and Cosset (1998). All these studies findthat the performance of privatized companies significantly improved.However, another study by Pohl, Claessens, and Djankov (1997), using asample of 6,300 firms, shows that privatization’s positive effects on cor-porate performance are not uniform among different types of firms andperformance measures.
Finally, among the most prominent examples of intercountry studiesare Martín and Parker (1995); Barberis and others (1996); Claessens andDjankov (1998); and La Porta and López-de-Silanes (1999). The major
120 CAPRA, CHONG, GARRÓN, LÓPEZ-DE-SILANES, AND MACHICADO

findings of these studies are that privatized firms improved their perfor-mance, that the change in management contributed to an increase in thevalue of the firms, and that the greater business profitability was largelyexplained by improvements in productivity and not by higher sale pricesor reductions in labor costs.
Relatively little has been written on Bolivia’s privatization program,especially regarding the first privatization phase from 1992 to 1994.Some recent studies provide valuable information for understanding theprivatization program in Bolivia; among these are Montero (1994), Re-ordenamiento de las Empresas Públicas (1994), and Requena (1996).Their contributions, however, are limited to a descriptive analysis of theprivatization process or a useful, albeit partial, analysis of the financialperformance of former SOEs. Another important study is that of Barjaand Urquiola (2001), who analyze the impact of capitalizations and theregulatory reforms implemented in conjunction with privatization in or-der to assess their impact on access and availability of services to low-income households.
Deeper studies of Bolivia’s privatization usually stall because of thescarcity of information, mainly financial data, regarding firms’ situationbefore and after the process. This is precisely the gap this chapter tries tofill by collecting comparable information from a wide sample of privatizedfirms during the period 1992–2000.
The Bolivian Privatization Program
The privatization program was very successful in attracting foreign in-vestment, which reached levels heretofore unseen in Bolivia. The increasein foreign investment came primarily from capital investments in gas, elec-tricity, and telecommunications. These increases, together with reforms inthe financial sector, caused second-round increases in private domestic in-vestment and consumption. This boom in investment drove economicgrowth throughout the mid-1990s to the late 1990s.
The increased social investment can be understood only in the contextof the state reform in which it was implemented. The method of invest-ment delivery changed from an overwhelmingly centralized provision ofservices to a provision based on municipalities. This reform was imple-mented by a wide-ranging decentralization reform, enacted as part of theLey de Participación Popular and the Ley de Decentralizacion. Themotivation behind this reform was to make expenditures in social in-vestment more efficient by better matching expenditures to local needs.The underlying hypothesis was that communities are better able than thecentral government to assess their needs and select how best to makeinvestments that address those needs. From its inception the decentral-ization was supported by the Inter-American Development Bank and the
PRIVATIZATION AND FIRM PERFORMANCE IN BOLIVIA 121

World Bank, both through credit and lending activities and, more gen-erally, in the context of the Heavily Indebted Poor Countries Initiativeand the corresponding Bolivian Poverty Reduction Strategy Paper. TheInter-American Development Bank in particular focused on loans tostrengthen municipalities and their ability to plan and execute invest-ment projects.
Before 1992 the government sought, through the use of shared risk con-tracts, an increased private involvement in certain sectors (such as miningand hydrocarbons) that had traditionally been reserved for the public sec-tor. These contracts typically transferred assets of SOEs to private admin-istrators, who would then have to undertake the necessary investments tomodernize the business or complete the project. Within this framework,the state received a flat fee for the leased assets, and the private firm couldclaim any residual profits. The first contracts of this nature were signedduring the 1980s and are still used today. Although the size of many ofthese agreements makes them an important object of study, they reflect aqualitatively different phenomenon than the privatizations that wouldlater take place.
In 1994 the Bolivian government decided to privatize its state-ownedenterprises, which controlled seven industries: oil and gas, petroleumrefining, tin mines, railways, electrical power, telephones, and airlines. Insome instances, the government used traditional privatization; under thismethod, the government transfers majority ownership of an SOE to theprivate sector and has freedom over how to spend the proceeds. Moreoften, however, the Bolivian government relied on capitalization. Undercapitalization, the state transfers 50 percent of a company’s shares to theinvestor with the winning bid. It transfers an additional 45 percent of theshares to a private pension fund for the accrued benefit of the public ingeneral, with the remaining 5 percent going to the company employees.The investor takes over the management of the firm and commits to investthe amount it offered to acquire its 50 percent share, in the developmentof the firm. It must carry out this investment within a specific time period(typically 6–8 years). In addition, the investor agrees to fulfill obligationsthat encompass expansion and quality goals, to operate under tariff regu-lation, and to fulfill other clauses specified in a long-term contract (typi-cally 40 years).
This method of privatization was selected by the center-right politicalfaction led by Gonzalo Sanchez de Lozada because previous privatizationshad been strongly criticized. This plan attempted to elicit popular supportby distributing shares to the electorate; however, not everyone was happywith the plan. Some said it was unfair to those younger than 21 years ofage, who were left out of the distribution. Others objected that their shareswent into a pension fund that they would benefit from only in the futureor maybe not at all if they died before retirement. Others objected to thesale of strategic industries to foreigners.
122 CAPRA, CHONG, GARRÓN, LÓPEZ-DE-SILANES, AND MACHICADO

The period analyzed here starts in1992 and ends in the early 2000s. Itcan be broken into three privatization waves, which are associated withdifferent governments and reflect the major pushes given to privatizationin Bolivia.3 The first wave started in 1992 with the enactment of the Pri-vatization Law.4 The second wave began in 1994 and introduced the cap-italization schemes. And the third wave started in 1998 and constituted areturn to the straight sales seen during the first wave.
First Wave
With the enactment of the Privatization Law in April 1992, Bolivia beganits privatization process. The process was characterized by the completetransfer of companies, which operated in competitive markets and wereconsidered “small” businesses. Under this wave, 34 SOEs were privatized.All were considered to be nonperforming before their sale, they had ampleexcess capacity and bloated work forces, and most received subsidies fromthe government (Ministerio de Capitalización 1994). A list of these 34SOEs can be found in appendix table 3A.1 and includes, for the most part,hotels, bus terminals, milk-processing plants, flour-collection businesses,and similar enterprises.
Enterprises transferred to the private sector in this first wave weresold through public auctions and public bidding processes. In a fewcases workers were offered the option of purchasing shares in the busi-ness, but this was the exception rather than the rule. Outside consultantswere used to help assess the value of the largest enterprises; however,several firms were so small that no proper valuation was carried out.The objectives were to reduce the public deficit by cutting subsidies;increase the efficient use of assets by transferring them to the privatesector; and increase social investment in health, education, and basicinfrastructure by directing the proceeds of the privatization to theseends. Most firms were sold without any prior restructuring and with thegovernment paying, in advance, for any social benefits owed to existingworkers.5
Second Wave
The second privatization wave began in 1994, when capitalization wasadopted as the method of privatization.6 Capitalization contracts differedfrom the way in which SOEs had been privatized previously in two im-portant ways. First, the private investor acquired complete managerialcontrol but only 50 percent of the equity. Second, in contrast to a tradi-tional privatization, which involves the sale of the enterprise, no sale wasinvolved and, hence, the national treasury did not receive any proceedsfrom the transfer. What capitalization called for was an injection of capi-tal to the enterprises under consideration. Thus, through this process, the
PRIVATIZATION AND FIRM PERFORMANCE IN BOLIVIA 123

equity of the enterprise doubled, the private investor held 50 percent of theequity in the capitalized enterprise, and the state transferred the other 50percent to company employees and as nontransferable shares to two newlyestablished private pension funds.
Capitalizations were used for the largest SOEs, which had traditionallybeen considered strategic, and often resulted in the breakdown of statemonopolies. For example, the state hydrocarbon enterprise, YacimientosPetrolíferos Fiscales Bolivianos (YPFB), was capitalized as several differ-ent units. Similarly, the generating units of the national power companyEmpresa Nacional de Electricidad (ENDE) and two units (Andina andOriental) of the railroad enterprise Empresa Nacional de Ferrocarriles(ENFE), were capitalized independently. At the same time, other state mo-nopolies were capitalized as a single entity, such as the telecommunica-tions enterprise, Empresa Nacional de Telecomunicaciones (ENTEL), andthe national airline, Lloyd Aéreo Boliviano (LAB). Appendix table 3A.1lists the 10 capitalizations carried out during the second wave, as well as35 traditional privatizations.
The idea behind the capitalizations was to encourage private firms toinvest in and run what had been key SOEs. The government’s main objec-tives were to attract private investment on a large scale; accelerate job cre-ation; improve managerial and technological efficiency by transferringcontrol to the private sector; and create a long-term saving mechanism todirectly redistribute the gains from the privatization into pensions insteadof using the gains for public spending. To make the enterprises more at-tractive for bidders, the commercial debts of capitalized firms were oftentransferred to the national treasury.
As evident from the list above, capitalizations were used mainly forfirms in noncompetitive markets and especially for those involved in theprovision of public services. These firms also employed the largest num-ber of workers and consequently were home to the most active laborunions. According to a study undertaken by the Ministerio de Capital-ización (1994), before the capitalization of SOEs, all of these enterpriseshad productivity and efficiency indicators below international bench-marks.
Third Wave
The third wave saw an end to the capitalization program and a return tothe classical approach to privatization. From 1998 to 2003, the thirdwave included the sale of 14 SOEs including a petroleum refinery, sev-eral mining firms, a cement factory, and other assorted enterprises (seeappendix table 3A.1). Because of the nature of the firms sold, the thirdwave also included significant regulation and deregulation of relevantsectors to ensure that consumers would not be exploited by firms withmarket power.
124 CAPRA, CHONG, GARRÓN, LÓPEZ-DE-SILANES, AND MACHICADO

Reforms in Specific Sectors
Capitalization was introduced relatively late in Bolivia’s road to liberal-ization and was seen not as a means to cover deficits but rather as anoption for attracting foreign investment and improving management inkey areas of the economy. Indeed, this process raised significant amountsof capital. Total commitments were about $2 billion, roughly equivalentto 30 percent of GDP, thus contributing to a significant increase in in-vestment.7 This process was complemented with changes to some sec-tors’ industrial organization and with the implementation of a regulatoryframework seeking to promote competition and efficiency. The maintool in this regard was the Sistema de Regulación Sectorial (SIRESE) Lawin 1994, which created a regulatory system for the entire infrastructuresector. In essence, this legislation defined the regulatory institutionalstructure, including the role of five regulatory agencies (superintenden-cias) for the electricity, telecommunications, hydrocarbons, potablewater, and transportation sectors. It also established an oversight agencyresponsible for systemwide coordination and evaluation, and introducedmarket competition as one of the foundations of the infrastructure sec-tor. Last, the law formulated the procedures for appeals, hearings, andconflict resolution.
This framework is supplemented by four specific laws—covering elec-tricity (1994), telecommunications (1995), hydrocarbons (1996), andpotable water (2000)—that introduced changes in the organization ofeach sector. These laws govern issues related to tariff regulation, entry,service quality, and sanctions and are administered by the sectoral regula-tory agencies of SIRESE.
Electricity. The reform of Bolivia’s electricity sector is considered one of themost successful to date. Bolivia opted for both vertical and horizontal sep-arations. ENDE, the largest power company, was divided into three gener-ation units and a transmission grid. The generation units were capitalized,and the transmission grid was privatized as a common carrier. In distribu-tion, the Empresa de Luz y Fuerza Electrica de Cochabamba (ELFEC, theCochabamba electricity distribution company) was also privatized, whilethe Compania Boliviana de Energia Electrica (COBEE, the second largestgenerator and distribution company in La Paz) was already private. Amongthe other major cities, the Cooperativa Rural de Electrificacion (CRE, theSanta Cruz distribution company) remains a cooperative and is consideredto be well run along commercial lines. Many of the smaller electric systems,which are cooperatively owned, have yet to be corporatized (that is, to be-come sociedades anonimas).
In reforming its electricity industry, Bolivia broke away from some ofthe accepted models for reform prevailing at that time and became the firstcountry to restructure and privatize the power sector using the capitaliza-tion method. This decision was prompted not by a desire to flout current
PRIVATIZATION AND FIRM PERFORMANCE IN BOLIVIA 125
fashionable practice, but rather because it suited the country that way andbecause the resulting reform program constituted an appropriate andtimely response to the situation in Bolivia at that time. Instead of copyingother countries’ models, Bolivia wisely adopted some of the principles un-derlying current reform trends all over the world and applied them in thedegree and form that best suited its own position.
By adopting the capitalization approach, Bolivia not only privatizedelectricity supply but also transferred one-half of the industry’s ownershipto Bolivian citizens. The shares allocated to Bolivians were entrusted tospecial pension funds, which were responsible for managing the shareswithin certain trading parameters. This process developed both the pen-sion funds and the local capital markets. It also ensured that capitalizationtook place through timely investments that were equal in size to the con-tributions made by private investors. This approach differs from the pre-vious attempts at privatization in the United Kingdom (England andWales) and Chile. In fact, the Bolivian case might be labeled as a “reverseChilean” process because the pension funds were used to manage theshares rather than to buy them.
Hydrocarbons. Before the reforms, the hydrocarbons industry (oil andnatural gas) was dominated by Yacimientos Petrolíferos Fiscales Boli-vianos, a vertically integrated monopoly involved in all activities of theindustry. Limited private participation was possible through joint ventureswith YPFB. Since the reform, the governmental priority has been to re-move YPFB from production activities and to promote foreign investmentto foster a natural gas export industry directed mainly to southern Brazil.The state intends this industry to become the engine of development forother sectors of the national economy. With this goal in mind, reforms andforeign investment were targeted to exploration and the creation of newinfrastructure. The opening of a pipeline to Brazil in 1999 made this visiona reality. A general policy promoting private control of all phases ofhydrocarbons, including retail commercialization, was adopted for the do-mestic market.
To implement these objectives, the Hydrocarbons Law places fewrestrictions on the export and import of petroleum products and stipu-lates that exploration, production, and commercialization be executedthrough joint ventures with YPFB. The administration of gas and oilpipelines was transferred, without exclusive rights, to the capitalizedTransredes. The administration of other pipelines was entrusted to theprivate Oil Tanking. Most of YPFB’s refining units were transferred tothe private Empresa Boliviana de Refinación, while YPFB continues torun the wholesale operations for petroleum products.
Telecommunications. In the preprivatization era, the telecommunicationsindustry was divided among the state monopoly, Empresa Nacional de Tele-comunicaciones, which provided national and international long-distance
126 CAPRA, CHONG, GARRÓN, LÓPEZ-DE-SILANES, AND MACHICADO

communication services, 15 cooperatives with monopolies in fixed localtelephone services, and Telecel, a private monopoly in the cellular market.The Telecommunications Law maintained this division until the end of2001, when entry was liberalized. Until then, ENTEL and the cooperativeshad exclusive rights, but the cellular market was opened to competition withthe entry of ENTELMovil (a division of capitalized ENTEL). The Telecom-munications Law also encompassed incentives for the exploitation ofeconomies of scope by the most efficient firms. This objective is pursuedthrough two mechanisms: cooperatives failing to achieve improvementgoals lose a percentage of their market to ENTEL; and authorization formergers, acquisitions, and stock swaps.
The entry of Nuevatel, a joint venture between COMTECO (theCochabamba cooperative) and Western Wireless International, has beenthe only modification to this industrial structure. Nuevatel was created forthe purpose of acquiring a PCS (personal communications services) licenseand began operations in December 2000, intensifying competition in themobile phone market.
Water. While other sectors underwent capitalization and the introduc-tion of regulation, the water industry experienced limited changes andencountered several difficulties. The intention of the reform in this sec-tor was the creation of several concessions (as opposed to actual privati-zation) for the administration of state assets. In practice, however, onlyone municipal firm, SAMAPA (La Paz-El Alto), was transferred to theprivate sector in 1997 for administration by Aguas del Illimani, a privatefirm. It was expected that within a prudent period of time, the necessarylegislation would be in place to conform the remaining public waterfirms to a similar model. However, the long delay in formulating thePotable Water and Sewerage Law (finally approved in 2000), togetherwith a significant failure to create a second concession through the trans-fer of a municipal firm to a consortium, Aguas del Tunari, inCochabamba, has deferred reforms and somewhat redirected change inthis sector. Nevertheless, during 1998 and 1999, the water regulatoryagency was able to incorporate the new regulatory regime and sign con-cessions with the existing municipal water firms in Santa Cruz, Oruro,Sucre, and other smaller cities.
Under the new model, the concession approach seeks to improve inter-nal efficiency and achieve expansion and quality goals. The new PotableWater and Sewerage Law has four important elements:
• Responsibility for the provision of these services is assigned to themunicipal governments but can be transferred to water and sewerageproviders (WSPs) that are private, municipal, or mixed firms, coopera-tives, or other civil associations recognized by law.
• The territory is divided into concession and nonconcession areas: theconcession areas are financially sustainable, and services are provided only
PRIVATIZATION AND FIRM PERFORMANCE IN BOLIVIA 127

by WSPs, while nonconcession areas are not financially sustainable, andthe service can be provided by a local government.
• Regulation of WSPs includes tariff regulation using the rate-of-returncriteria, investment and efficiency targets, and a five-year regulatory lag.
• Universal access in nonconcession areas is to be supported by publicinvestment.
The contract signed with Aguas del Illimani reflects these aims. Objec-tives for the 1997–2001 period include 100 percent access to potable wa-ter or sewerage (public fountains excluded) in the areas of Achachicalaand Pampahasi, which cover the city of La Paz; 82 percent access topotable water in the city of El Alto by 2001, of which 50 percent was toconsist of expansion connections, and 41 percent access to sewerage; andcompliance with the goal of expanding, over time, the percentage ofhouseholds with potable water coverage and sanitation services.
Quality control includes norms related to the source of water; its qual-ity, abundance, and pressure; continuity of service; infrastructure effi-ciency; consumer service; and emergencies. Regulated prices are calculatedto assist the company to meet its contractual obligations and expansiongoals. Although the five-year lag promotes internal efficiency, no produc-tivity factors were incorporated. Furthermore, tariffs were set in dollarterms, payable in bolivianos.
Data Sample
The task of collecting information for this chapter required the collab-oration of various public and private institutions. Several sources of in-formation were used. From the National Statistical Institute and theNational Tax Service, we obtained financial information for the periodin which the companies were part of the public sector. The statisticalagency provided information on approximately 30 percent of the com-panies in the study. The National Service of Commerce Registry and theGeneral Superintendency helped with postprivatization information.The former provided information on owners of the businesses, while thelatter provided annual reports of the capitalized companies. We alsocarried out a survey to complete the financial information needed forthis study. Other information came from the Reorganization Unit, theVice Ministry of Budget and Accounting, and the National Chamber ofHotels.
Data were not always strictly compatible across sources, and an extraeffort to confirm sources had to be made. When differences were encoun-tered, data and sources were selected based on the series that matchedexisting trends most closely.8 The sample’s small size also implies that fewresults are statistically significant. Nonetheless, the data set we constructed
128 CAPRA, CHONG, GARRÓN, LÓPEZ-DE-SILANES, AND MACHICADO

constitutes, to our knowledge, the most serious and comprehensive data onthe transfer of SOEs to the private sector in Bolivia.
Because of the small size of many privatized firms (more than 90 per-cent were small or medium-size enterprises), financial and performanceinformation was not always collected or kept up-to-date either before orafter privatization. Unlike other countries, very few privatized firms werelisted on the stock exchange either before or after their transfer to privatehands. This explains the lack of a single source of comprehensive dataand the multiplicity of sources needed to construct our database.
According to the Reorganization Unit, 94 public enterprises were trans-ferred to the private sector between 1992 and 2003.9 Of these, 83 were pri-vatized under the traditional method, 10 through capitalizations, and 1 asa concession.10 While the number of privatized firms seems large, only 31firms had sufficient information to include in the final sample. Table 3.2summarizes the number of firms in the sample and the reason for exclud-ing those that were not analyzed in the study.
Four firms were excluded because they were too small and did nothave proper accounting records. We were unable to confirm if thesefirms had effectively been privatized, much less to capture their finan-cial and employment information. Another 9 firms, all from the firstwave, were sold as stripped assets, making a comparison impossible.Twenty-nine firms had no financial statements from the period in whichthey were in public hands, and we were unable to obtain the informa-tion from our surveys. Eleven firms were created from disintegratedmonopolies from which we were unable to construct separate financialbooks to measure performance of the relevant units before privatiza-tion. We were therefore forced to exclude them from the sample.Finally, 10 firms from the third wave were left out of the sample becausethe sale was too recent for any meaningful postprivatization compari-son to be made.
PRIVATIZATION AND FIRM PERFORMANCE IN BOLIVIA 129
Table 3.2 Reasons for Excluding Firms from the Sample
Reason Number of firms
Firms too small 4Firms sold as stripped assets 9No financial statements from the period when firms 29
were publicFirms created from disintegrated monopolies 11Sale too recent 10Enterprises not included in the study 63Enterprises included in the study 31Total 94
Source: Authors’ data.

Results
Following the methodology of La Porta and López-de-Silanes (1999), thissection seeks to measure the change in performance of the privatized firmsby comparing performance indicators before and after privatization. Wedivide our indicators into the following five groups: profitability, operat-ing efficiency, labor, assets and investment, and output.
To calculate estimates that take into account the sometimes large dif-ferences among industries, a difference-in-difference analysis was carriedout using information from firms that had been private all along. As a con-trol group, we used data from the Manufacturing Industry Survey (CIIU),using the corresponding industrial classification for each firm; for firmsthat could not be classified within a corresponding CIIU code, we used anaggregate measure of the whole manufacturing industry as an economy-wide control. Before privatization refers to the average for the four yearsbefore privatization, or for the years with available data, while the termafter privatization corresponds to the average value for 1999 and 2000, orfor the last two years for which information is available.11
Raw Data
Table 3.3 presents the results from our unadjusted ratios. Several interest-ing results can be appreciated. The first is that both mean and medianprofitability increased by 15 percentage points. Privatized firms’ ratio ofoperating income to sales increased from a mean (median) of slightly over20.1 (12.8) percentage points before privatization to 35.1 (27.9) percent-age points after privatization. Moreover, this increase is statistically sig-nificant at the 10 percent level.
The next set of indicators suggests that the increase in profitability wasprimarily driven by improvements in efficiency. Our cost-per-unit indica-tor suggests that privatized firms underwent significant restructuring andstreamlining following privatization. The mean (median) firm reduced itscosts by 18.3 (20.8) percentage points, with the difference being signifi-cant at the 5 percent level. Moreover, the magnitude of this increase inefficiency suggests that efficiency gains by themselves can account for theincreased profitability of privatized firms. Other indicators of operatingefficiency provide additional circumstantial evidence to suggest thattransfers from workers and market power are not a source of improvedprofitability of privatized firms. The mean (median) firm increased itsratio of sales to property, plant, and equipment (PPE) by 36.5 (8.1) per-cent and its ratio of sales to employees by 48.2 (30.4) percent. The mostremarkable results, however, are those for the subsample of firms forwhich we can calculate the ratio of operating income to employees. In thiscase, the interaction of greater labor efficiency and reduced costs allowed
130 CAPRA, CHONG, GARRÓN, LÓPEZ-DE-SILANES, AND MACHICADO

Table 3.3 Changes in Performance of the Sample of Privatized Firms on Bolivia
Before privatization After privatizationMean Mean
Variable N Median Median t-statistic Z-statistic
ProfitabilityOperating income/sales 28 0.2010 0.3511 1.71* 1.64
0.1281 0.2793Operating income/PPE 20 0.2063 0.2858 0.42 �0.37
0.1048 0.1074Operating efficiencyCost per unit 28 0.8217 0.6386 �2.40** �2.26**
0.9110 0.7032Log(sales/PPE) 23 �0.4628 �0.0981 1.26 1.09
�0.4735 �0.3925Log(sales/employees) 23 11.6759 12.1581 1.59 1.52
11.8141 12.1181Operating income/employees (thousands) 19 12.6049 73.6712 1.89* 1.76*
10.1750 39.7259LaborLog(employees) 24 4.6709 4.5811 �0.19 �0.46
4.7405 4.6094Log(blue-collar workers) 20 4.1466 4.0935 �0.12 �0.28
4.2853 4.2377Log(white-collar workers) 20 1.4807 1.3572 �0.25 �0.61
1.1705 0.8959Average wage per worker (thousands) 16 10.8515 19.9102 2.49** 2.26**
9.0361 18.8589
131
(Table continues on the following page.)

132
Average wage per blue-collar worker (thousands) 16 9.5054 16.0569 2.24** 2.04**7.7061 15.6106
Average wage per white-collar worker (thousands) 16 26.1511 59.9427 2.38** 2.33**22.4439 44.5518
Assets and investmentLog(PPE) 23 17.1634 16.8574 �0.43 �0.25
16.6764 16.9574Investment/sales 18 0.0499 0.0560 0.18 �1.27
0.0177 0.0110Investment/employees (thousands) 15 10.8727 10.1345 �0.09 �1.763*
2.5556 1.0845Investment/PPE 17 0.0288 0.0232 �0.34 �0.95
0.0137 0.0073Log(PPE/employees) 18 12.4286 12.2558 �0.47 �0.35
12.1583 12.1274OutputLog(sales) 31 15.9962 16.1039 0.16 0.12
15.5094 15.8996
* Significant at the 1 percent level.** Significant at the 5 percent level.*** Significant at the 10 percent level.Note: N � number and PPE � property, plant, and equipment. This table presents raw results for the sample of 31 privatized firms. For each
empirical proxy, the table presents the number of usable observations and the mean and the median values before and after privatization. Beforeprivatization refers to the average value for the four years before privatization; after privatization refers to the average value for 1999 and 2000, orfor the last two years for which information is available. We report t-statistics and Z-statistics (Wilcoxon rank sum) as the test for significance forthe change in mean and median values, respectively. Definitions for each variable can be found in appendix 3A.2.
Source: Authors’ calculations.
Table 3.3 (continued)
Before privatization After privatizationMean Mean
Variable N Median Median t-statistic Z-statistic

the median firm to increase its operating income per worker by a stag-gering 290 percent.
Privatization usually leads to employment cuts across the board,which encourages critics to argue that the gains in profitability aremerely transfers from workers to the new owners. In the case of Bolivia,the mean (median) firm reduced its work force by 9.0 (13.1) percent, sig-nificantly less than the labor reduction experienced in other countries.For example, La Porta and López-de-Silanes (1999) found that the mean(median) firm in Mexico fired 64.9 (56.8) percent of its work force,while Torero (chapter 8) documents employment cuts of 51.0 (56.1) per-cent for Peru. Moreover, once we consider that the average wage perworker increased by a mean (median) of 83.5 (108.7) percent, it is clearthat firms did not increase profits by exploiting workers. Even thoughthe fall in employment is not statistically significant, the increase inwages is significant at the 5 percent level.
An additional criticism of privatization is that even if firms do restruc-ture and become more efficient, it is the poorest workers who bear thebrunt of the restructuring burden. Privatization is thus opposed not be-cause of concerns regarding its aggregate effect but because it is thoughtto have a negative redistributive effect. By breaking up employment cutsand wage increases into white-collar and blue-collar workers, we can shedsome light on this issue. Regarding employment, the evidence conclusivelyshows that blue-collar workers fare better than their white-collar col-leagues. While the mean (median) firm fired 12.3 (27.5) percent of itswhite-collar workers, it fired only 5.3 (4.8) percent of its blue-collar ones.This evidence suggests that it is false to assume, at least in the case ofBolivia, that privatization hurt unskilled workers disproportionately. Re-garding wages, the evidence is mixed but still does not support the viewthat unskilled workers were exploited. Average wages of white-collarworkers increased 129.2 percent, significantly more than the 68.9 percentincrease observed for blue-collar workers. However, the median change inwages, arguably a better gauge as it is less susceptible to outlier observa-tions, shows virtually identical increases of about 100 percent for bothtypes of workers. Moreover, even if wages for white-collar workersincreased more than those of blue-collar ones, an average real increase of70 to 100 percent in wages and greater job stability can hardly be consid-ered a disproportionate burden for unskilled workers.
Regarding investment, there seems to be no clear-cut trend—the meanand median values of our investment ratios move in opposite directions. It isdifficult to know a priori what to expect from investment following privati-zation. On the one hand, firms usually have ample spare capacity and thusroom to increase production by using assets more efficiently. On the otherhand, production processes may be outdated and require significant invest-ments to bring them up-to-date. Bolivia presents a good example of this am-bivalence, as many of its privatized firms clearly suffered from overcapacity.
PRIVATIZATION AND FIRM PERFORMANCE IN BOLIVIA 133

However, some of the larger firms were privatized under capitalizationschemes, the precise purpose of which was to increase investment. In anycase, the only statistically significant result is the median for the ratio of in-vestment to employees, which shows a decrease of almost 60 percent.
Finally, our results corroborate other studies of privatization showingthat notwithstanding a reduced work force and no general increases in in-vestment, the mean (median) firm was able to increase output—in the caseof Bolivia, by 10.8 (39.0) percent.12 This growth in real sales is the finalpiece in the puzzle, demonstrating that the main effect of privatization isa substantial improvement in efficiency, which permeates through ashigher profits for firms, higher wages for workers, and increased outputfor consumers.
Industry-Adjusted Data
Toward the end of the 1990s, the Bolivian economy experienced impor-tant fluctuations in its growth rate and underwent great sectoral trans-formations. For example, its average growth rate ranged from a high of4.8 percent in 1995–98 to just 0.44 percent in 1999.13 One may, there-fore, wonder whether the strong increases in output, profitability, andwages observed in our sample can be explained by general macroeco-nomic trends or sector-specific events. To isolate the role of privatiza-tion, we present industry-adjusted ratios in table 3.4. In short, we findthat the performance improvements observed in the previous section arenot explained by industrywide or macroeconomic changes and that infact some of our industry-adjusted indicators show a more favorable pic-ture of performance by privatized firms than that suggested by the rawindicators described in the previous section.
The first result is that industry-adjusted indicators show that output atthe median privatized firm increased by 26.7 percent. This would implythat about 70 percent of the raw increase in output results from privatiza-tion, while only 30 percent can be explained by industry or macroeco-nomic changes. Focusing on the mean firm yields an even more favorableinterpretation, with industry-adjusted output in privatized firms increas-ing 32.4 percent.
Regarding profitability, the results show that privatized firms first con-verged to the levels of their industry peers and then surpassed them. Themean (median) ratio of operating income to sales shows that SOEs under-performed their industry groups by 14.4 (18.3) percentage points and thatafter privatization they overperformed the same control group by 13.7(5.9) percentage points. As expected, these gains in profitability stem fromlarger cost savings and efficiency gains than those experienced by otherfirms. Industry-adjusted costs per unit dropped by a mean (median) of 6.4(5.0) percentage points, while the ratio of sales to employees increased 51(9.6) percent.
134 CAPRA, CHONG, GARRÓN, LÓPEZ-DE-SILANES, AND MACHICADO

135
Table 3.4 Industry-Adjusted Changes in Performance for the Sample of Privatized Firms
Before privatization After privatizationMean Mean
Variable N Median Median t-statistic Z-statistic
ProfitabilityOperating income/sales 28 �0.1442 0.1373 3.52*** 3.15***
�0.1830 0.0594Operating efficiencyCost per unit 28 0.2216 0.1573 �0.72 �0.23
0.2399 0.1905Log(sales/employees) 22 7.8357 8.3456 0.74 0.96
8.5944 8.6909LaborIndex of total employees 24 100.00 70.33 �3.01*** �5.29***
100.00 58.98Index of industry-adjusted real 16 100.00 238.02 1.76* �0.65
wages per worker 100.00 131.86OutputLog(sales) 31 �5.6182 �5.2942 0.53 0.67
�6.3877 �6.1206
* Significant at the 10 percent level.** Significant at the 5 percent level.*** Significant at the 1 percent level.Note: N � number. This table presents industry-adjusted results for the sample of 31 privatized firms. See text for an explanation of the way these
results were computed. For each empirical proxy, the table presents the number of usable observations and the mean and median values before andafter privatization. Before privatization refers to the average value for the four years before privatization; after privatization refers to the averagevalue for 1999 and 2000, or for the last two years for which information is available. We report t-statistics and Z-statistics (Wilcoxon rank sum) asthe test for significance for the change in mean and median values, respectively. Definitions for each variable can be found in appendix table 3A.2.
Source: Authors’ calculations.

Finally, our industry-adjusted indicators show that employment cutsafter privatization are more significant than the raw data suggested, butthe wage increases observed are robust. The mean (median) index of totalemployees dropped 29.7 (41.0) percent following privatization, signifi-cantly above the 9.0 (13.1) percent decrease observed in the raw data. Thisimplies that firms in the control group hired a substantial number of work-ers over the period analyzed. Meanwhile, the industry-adjusted real wagesper worker show a robust increase for the mean (median) firm of 138.0(31.9) percent following privatization.
All in all, our industry-adjusted indicators show that macroeconomicconditions and industry-specific changes cannot explain the large per-formance gains documented for privatized firms. Although in some casesa part of the gains can be explained by industry changes, the bulk of theimprovement in firm performance is due to restructuring and efficiencygains. In fact, the raw indicators may be underestimating the true impactof privatization as industry-adjusted improvements are larger than theones shown by the raw indicators.
Conclusions
This study assembled a comprehensive database for firm characteristicsbefore and after privatization. Despite severe information limitations,we were able to collect sufficient data for one-third of the firms priva-tized between 1992 and 2003. Our sample contains firms of all sizes,with an emphasis on medium and small ones; this sample reflects thestructure of privatization in Bolivia.
Our results broadly mirror those found for other countries: privatiza-tion leads to a significant increase in efficiency and a corresponding rise infirm profitability. Although privatization results in a decrease in employ-ment, the Bolivian experience shows only mild changes relative to thosefound for other countries. Notably, real wages increase by almost 100 per-cent, suggesting that SOEs employed too many workers and used them in-effectually but did not overpay them. In this sense it is likely that these jobswere sought after not because they paid well but because they did not re-quire much effort. Investment shows no clear trend; the mean and medianvalues move in opposite directions. This is probably a reflection ofBolivia’s esoteric two-tiered structure of privatization in which most firmssold were suffering from overcapacity, but a few of the largest were soldunder capitalization schemes, which by definition were aimed at increas-ing investment. Finally, we also find that despite a reduced work force andthe ambivalent behavior of investment, firms were able to increase outputsubstantially. These results carry through when we look at industry-adjusted indicators, and in fact, in some cases, shed a more favorable lighton the performance of privatized firms.
136 CAPRA, CHONG, GARRÓN, LÓPEZ-DE-SILANES, AND MACHICADO

This study provides a valuable contribution for two reasons. First, itrepresents the first systematic study of the change in performance ofBolivian SOEs following privatization. Although previous authors haveanalyzed specific privatizations and others have written descriptiveanalyses of the program, this chapter represents, to our knowledge, themost comprehensive effort to collect employment and financial informa-tion for privatized firms in Bolivia. Second, the sample of firms priva-tized in Bolivia, unlike most other countries, is composed mostly ofmedium and small firms. In this sense, the results obtained from thisanalysis shed some light as to what other countries with similar charac-teristics may expect from privatization. Our results imply that there seemto be no significant differences in the benefits of privatization to smalland medium-size firms than those observed for larger SOEs in othercountries.
PRIVATIZATION AND FIRM PERFORMANCE IN BOLIVIA 137
1 Fondo Ganadero del Beni yPando
2 Fábrica de Objetos de Peltre3 Empresa Forestal Pecuaria
Tariquia4 Planta Industrializadora de
Quinua5 Planta de Alimentos
Balanceados Portachuelo6 Empresa Nacional de La Castana7 Industrias Metálicas (Inmetal)8 Línea Aérea Imperial9 Pait - Pl Procesadora de
Caranavi10 Cadenas Andinas sam11 Criadero de Truchas Piuisilla12 Pollos Bb13 Taller de Cerámica Artesanal
Chuquisaca14 Fábrica Nal. de Fósforos15 Hotel La Paz (Ex-Sheraton)16 Hotel Crillon17 Fábrica de Cerámica Roja de
Trinidad
18 Fábrica de Cerámica Roja deCobija
19 Hotel Prefectural Liriuni20 Centro de Acopio Yamparaez21 Centro de Acopio Redención
Pampa22 Centro de Acopio Tomina23 Hacienda Ganadera Santa
Martha24 Hotel Prefectural de Caranavi25 Cabana Lechera Todos Santos
Paz26 Hotel Prefectural de Pando27 Centro de Acopio Totora28 Centro de Acopio Lourdes29 Centro de Acopio Betanzos30 Fabrica de Aceites Comestibles
Villamontes31 Fábrica Boliviana de Cerámica32 Fábrica de Cerámica Roja de
Oruro33 Hotel Prefectural de Tarija34 Ingenio Azucarero Guabira
Appendix Table 3A.1 List of Privatized Firms, 1992–2001
First wave
(Table continues on the following page.)

138 CAPRA, CHONG, GARRÓN, LÓPEZ-DE-SILANES, AND MACHICADO
Second wave (capitalization)
35 Empresa Transportadora deElectricidad (TDE)
36 Empresa de generación eléctricaLuz y Fuerza de Cochabamba(ELFEC)
37 Hilandería Santa Cruz Sam38 Planta Laminadora de Goma
Sam39 Bien Inmueble40 Planta de Hilandería Viacha
(Phv)41 Hotel Balneario Asahi42 Hotel Prefectural Caranavi43 Hotel Prefectural de
Copacabana44 Hotel Prefectural de Coroico45 Hotel Prefectural de Sorata46 Hotel Prefectural Viscachani47 Hotel Prefectural de Urmiri48 Hotel Prefectural de Chulumani49 Hotel Terminal de Oruro50 Terminal de Buses Oruro51 Terminal de Buses Sucre52 Terminal de Buses Cochabamba53 Producción de Alimentos de
Maiz Mairana54 Planta de Alimentos
Balanceados de Chuquisaca
55 Planta de AlimentosBalanceados Tarija
56 Planta Industrializadora deLeche – Scz
57 Planta Industrializadora deLeche Pil – La Paz
58 Planta Industrializadora deLeche Pil – Cbba
59 Planta Industrializadora deLeche Pil – Tarija
60 Planta Industrializadora deLeche Pil – Sucre
61 Ingenio Azucarero Guabira62 Fabrica de Aceites Comestibles
Villamontes63 Planta Elaboradora de Quesos
San Javier64 Planta de Alimentos
Balanceados Tarija65 Producción de Harinas
Compuestas – Tarhui66 Cabana de Porcinos “El
Zapallar”67 Hilandería Pulacayo68 Multipropósito Gran Chaco69 Fábrica Boliviana de Cerámica70 Fábrica de Cerámica Roja de
Oruro
71 Empresa Generadora deElectricidad (CORANI)
72 Empresa Nacional deTelecomunicaciones (ENTEL)
73 Empresa Ferroviaria Andina74 Empresa Ferroviaria Oriental75 Empresa Generadora de
Electricidad (GUARACACHI)
76 Lloyd Aéreo Boliviano77 Empresa Petrolera Andina78 Empresa Petrolera Chaco79 Transportadora de
hidrocarburos (TRANSREDES)80 Empresa Generadora de
Electricidad (Valle Hermoso)
Third wave
81 Refinería de Petróleo (EBR)82 Planta de almacenaje de
carburantes y Poliductos
83 Estaciones de servicio deaeropuertos
84 Gasolineras
Appendix Table 3A.1 (continued)
Second wave (sale)

PRIVATIZATION AND FIRM PERFORMANCE IN BOLIVIA 139
85 Empresa Minera Vinto –Antimonio
86 Financiera de Desarrollo S.A.87 Campo Geotérmico Laguna
Colorada88 Fábrica Nacional de Explosivos
Sam89 Fábrica Nacional de Cemento
90 Empresa Metalúrgica Vinto –Estano
91 Empresa Minera Huanuni92 Planta Industrial Oruro93 Empresa Minera Colquiri94 Planta de Productos Lácteos
Milka
Appendix Table 3A.2 Description of the Variables Used inTables 3.3 and 3.4
Variable Description
Operatingincome/sales
Operatingincome/PPE
Cost per unit
Log(sales/PPE)
The ratio of operating income to sales. Operatingincome is equal to sales minus operating costs andminus depreciation. Sales are equal to the total valueof products and services sold, nationally and interna-tionally. Operating costs is equal to the direct expenseinvolved in the production of a good (or provision ofa service). This includes the day-to-day expensesincurred in running a business, such as sales andadministration. It is also called operating expenses.
The ratio of operating income to property, plant, andequipment. Operating income is equal to sales minusoperating costs and minus depreciation. Operatingcosts is equal to the direct expense involved in theproduction of a good (or provision of a service). Prop-erty, plant, and equipment is equal to the value of acompany’s fixed assets adjusted for inflation.
The ratio of operating costs to sales. Operating costs isequal to the direct expense involved in the productionof a good (or provision of a service). This includes theday-to-day expenses incurred in running a business,such as sales and administration. Sales are equal tothe total value of products and services sold, nation-ally and internationally.
Natural logarithm of the ratio of sales to property,plant, and equipment. Sales are equal to the totalvalue of products and services sold, nationally and
(Table continues on the following page.)
Appendix Table 3A.1 (continued)
Third wave
Source: Authors.

140 CAPRA, CHONG, GARRÓN, LÓPEZ-DE-SILANES, AND MACHICADO
Appendix Table 3A.2 (continued)
Variable Description
Log(sales/employees)
Operatingincome/employees
Log(employees)
Log(blue-collarworkers)
Log(white-collarworkers)
Average wageper worker
Log(PPE)
Investment/sales
internationally. Property, plant, and equipment isequal to the value of a company’s fixed assets adjustedfor inflation.
Natural logarithm of the ratio of sales to total number ofemployees. Sales are equal to the total value of prod-ucts and services sold, nationally and internationally.Employees corresponds to the total number of workerswho depend directly on the company.
The ratio of operating income to total number ofemployees. Operating income is equal to sales minusoperating costs and minus depreciation. Employeescorresponds to the total number of workers whodepend directly on the company.
Natural logarithm of the total number of employees.Employees corresponds to the total number of fulltime workers who depend directly on the company.It does not include individuals who are retired orworking on commission.
Natural logarithm of the total number of blue-collarworkers. Blue-collar workers perform un- or semi-skilled labor for modest to low wages. They performtasks directly related to the (mass) production processor menial services. Typically, they are factory-line ormaintenance workers.
Natural logarithm of the total number of white-collarworkers. White-collar workers perform skilled laborand administrative tasks for modest to high salaries.They are individuals involved in sales, administration,and management.
The average wage paid per worker in each firm. Theconsumer price index was used as a deflator tocalculate real wages. A similar procedure is used forthe calculation of real wages per blue-collar andwhite-collar workers.
Natural logarithm of property, plant, and equipment.Property, plant, and equipment is equal to the value of a company’s fixed assets adjusted forinflation.
The ratio of investment to sales. Investment is equal tothe value of expenditure to acquire property, equip-ment, and other capital assets that produce revenue.Sales are equal to the total value of products andservices sold, nationally and internationally.

PRIVATIZATION AND FIRM PERFORMANCE IN BOLIVIA 141
Appendix Table 3A.2 (continued)
Variable Description
Investment/employees
Investment/PPE
Log(PPE/employees)
Log(sales)
Index of totalemployees
Index of industry-adjusted realwages perworker
The ratio of investment to employees. Investment isequal to the value of expenditure to acquire property,equipment, and other capital assets that producerevenue. Employees corresponds to the total number ofworkers (paid) who depend directly on the company.
The ratio of investment to property, plant, and equip-ment. Investment is equal to the value of expenditureto acquire property, equipment, and other capitalassets that produce revenue. Property, plant, andequipment is equal to the value of a company’s fixedassets adjusted for inflation.
Natural logarithm of the ratio of property, plant, andequipment to total number of employees. Property,plant, and equipment is equal to the value of a com-pany’s fixed assets adjusted for inflation. Employeescorresponds to the total number of workers whodepend directly on the company.
Natural logarithm of sales. Sales are equal to the totalvalue of products and services sold, nationally andinternationally.
For each firm, the index takes value of 100 for thepreprivatization period. The average of the last twoyears after privatization value is computed by aug-menting the preprivatization value by the differencebetween the cumulative growth rate of employment ofthe firm and the cumulative growth rate of employ-ment of the control group in the postprivatizationperiod relative to the average employment in the fouryears that preceded privatization. Industry controlgroups are given by an index of economywide totalemployment.
For each firm, the index takes value of 100 for thepreprivatization period. The average of the last twoyears after privatization value is computed by aug-menting the preprivatization value by the differencebetween the cumulative growth rate of real wages perworker of the firm and the cumulative growth rate ofreal wages per worker of the control group in thepostprivatization period relative to the average realwage per worker in the four years that preceded pri-vatization. Industry control groups are given by anindex of economywide real wages per worker.
Source: Authors.

Notes
The authors are indebted to Patricio Amador, Jose Caballero, Cecilia Calderon,Gabriela Enrique, Paola Espinoza, Jesús Mogrovejo, and Monica Yanez for pro-viding skillful research assistance.
1. For a detailed discussion of privatization effects on these objectives as wellas their interrelation, see Sheshinski and López-Calva (1999).
2. Some extensions to these two initial arguments analyze more deeply therelationship between property, efficiency, and contracts. These include agencytheory, public choice theory, property rights theory, and transactions costs analy-sis; see Commander and Killick (1988) and Hodge (1999), among others.
3. From 1989 to 1993, the government of Jaime Paz Zamora; from 1993 to1997, the government of Gonzalo Sanchez de Lozada; and from 1997 to 2001, thegovernment of Hugo Banzer Suarez.
4. Privatization Law 1330, April 24, 1992.5. See López-de-Silanes (1997) for a discussion of prior restructuring meas-
ures and their effect on the price paid for privatized SOEs. 6. The Capitalization Law that made this type of privatization possible was
enacted on March 21, 1994. 7. All dollar values are U.S. dollars unless otherwise indicated.8. Many of the differences resulted from the application of distinct ac-
counting systems, as many of the balance sheets and income statements were notaudited.
9. This number includes one concession. The Reorganization Unit is a unitwithin the Ministry of Investment and Privatization and serves as the government’sagency responsible for privatization. As such, it maintains records of the privatiza-tions undertaken in Bolivia.
10. The number of capitalized enterprises can be counted in two different ways:as the number of enterprises before capitalization (5), or as the number of enter-prises resulting from the capitalization process (10). For this chapter we haveadopted the second measure.
11. For the purpose of calculating the average of the last two years, we considerthe year of privatization as a postprivatization year.
12. For example, the median increase in output of privatized firms was 17.4percent in Brazil, 69.0 percent increase in Colombia, 68.2 percent in Mexico, and40.8 percent in Peru; see chapters 4, 6, and 8, and La Porta and López-de-Silanes1999.
13. During the 1990s increased openness brought a greater influx of foreigncapital. This, in turn, favored the growth of the economy, raised employment lev-els, and increased mean labor productivity (Jiménez, Pereira, and Hernany 2002).
References
Barberis, Nicholas, Maxim Boycko, Andrei Shleifer, and Natalia Tsukanova.1996. “How Does Privatization Work? Evidence from the Russian Shops.”Journal of Political Economy 104: 764–90.
Barja, Gover, and Miguel Urquiola. 2001. “Capitalization, Regulation, and thePoor: Access to Basic Services in Bolivia.” Working Paper, funded by the UnitedNations University/World Institute for Development Economics Research.Helsinki.
142 CAPRA, CHONG, GARRÓN, LÓPEZ-DE-SILANES, AND MACHICADO

Boubakri, Narjess, and Jean-Claude Cosset. 1998. “The Financial and OperatingPerformance of Newly Privatized Firms: Evidence from Developing Countries.”Journal of Finance 53: 1081–110.
Claessens, Stijn, and Simeon Djankov. 1998. “Politicians and Firms in Seven Cen-tral and Eastern European Countries.” Policy Research Working Paper 1954.World Bank, Washington, D.C.
Claessens, Stijn, Simeon Djankov, and Gerhard Pohl. 1997. “Ownership and Cor-porate Governance: Evidence from the Czech Republic.” Policy Research Paper1737. World Bank, Washington, D.C.
Commander, Simon, and Tony Killick. 1988. “Privatisation in DevelopingCoutries: a Survey of the Issues.” In Paul Cook and Colin Kirkpatrick, eds., Pri-vatisation in Less Developed Countries. New York: St. Martin’s Press.
D’Souza, Juliet. 1998. “Privatization of Telecommunication Companies: An Em-pirical Analysis.” Working Paper, Mercer University, Macon, Ga.
Eckel, Catherine, Doug Eckel, and Vijay Singal. 1997. “Privatization and Effi-ciency: Industry Effects of the Sale of British Airways.” Journal of FinancialEconomics 43: 275–98.
Frydman, Roman, Cherryl W. Gray, Marek Hessel, and Andrzej Rapaczynski.1998. “Private Ownership and Corporate Performance: Some Lessons fromTransition Economies.” Working Paper. New York University, C.V. Starr Cen-ter for Applied Economics, New York.
Galal, Ahmed, Leroy Jones, Pankay Tandon, and Ongo Vogelsang. 1994. WelfareConsequences of Selling Public Enterprises. Oxford, U.K.: Oxford UniversityPress.
Hodge, Graeme A. 1999. Privatization: An International Review of Performance.Boulder, Colo.: Westview Press.
Jiménez Wilson, Rodney Pereira, and Werner Hernany. 2002. “Bolivia: Efecto dela Liberalización Sobre el Crecimiento, Empleo, Distribución y Pobreza.” InLiberalizacion, Desigualdad y Pobreza: America Latina y el Caribe en los 90,Capitulo 5. Programa de las Naciones Unidas para el Desarrollo (PNUD),Comision Economica para America Latina y el Caribe (CEPAL).
La Porta, Rafael, and Florencio López-de-Silanes. 1999. “The Benefits of Privati-zation: Evidence from Mexico.” Quarterly Journal of Economics 114 (4):1193–242.
López-de-Silanes, Florencio. 1997. “Determinants of Privatization Prices.” Quar-terly Journal of Economics 107 (4): 965–1025.
López-de-Silanes, Florencio, Andrei Shleifer, and Robert Vishny. 1997. “Privatiza-tion in the United States.” Rand Journal of Economics 28 (3): 447–71.
Martín, Stephen, and David Parker. 1995. “Privatization and Economic Perfor-mance Throughout the UK Business Cycle.” Managerial and Decision Eco-nomics 16: 225–37.
Megginson, William L., and Jeffry M. Netter. 2001. “From State to Market: A Sur-vey of Empirical Studies on Privatization.” Journal of Economic Literature 39:321–89.
Megginson, William L., Robert C. Nash, and Matthias van Randenborgh. 1994.“The Financial and Operating Performance of Newly Privatized Firms: An In-ternational Empirical Analysis.” Journal of Finance 49 (2): 403–52.
Ministerio de Capitalización. 1994. “Monitor de la Capitalización, números espe-ciales.” La Paz, Bolivia.
PRIVATIZATION AND FIRM PERFORMANCE IN BOLIVIA 143

Montero, Marcelo. 1994. “Análisis Financiero Nacional, Regional e Individual delas Empresas Privatizadas.” Ley N° 1178 SAFCO (Sistema de AdministraciónFinanciera y Control Gubernamental). La Paz.
Moore, Jacqueline. 1990. “Privatization: The Liberals View to Improving Effi-ciency and Performance of Industry.” I. I. Pty, Ltd., Sydney.
Nellis, John. 1991. “Privatization in Reforming Socialist Economies.” In J. Bohnand V. Kreacic, eds., Privatization in Eastern Europe: Current ImplementationIssues. Yugoslavia: International Centre for Public Enterprises in DevelopingCountries.
Newberry, David, and Michael G. Pollitt. 1997. “The Restructuring and Privati-zation of Britain´s CEGN – Was It Worth It?” Journal of Industrial Economics45: 269–303.
Pohl, Gerhard, Stijn Claessens, and Simeon Djankov. 1997. “Privatization and Re-structuring in Central and Eastern Europe: Evidence and Policy Options.”Technical Paper 368. World Bank, Washington, D.C.
Ramamurti, Ravi. 1997. “Testing the Limits of Privatization: Argentine Rail-roads.” World Development 25: 1973–93.
Reordenamiento de las empresas públicas. 1994. Government of Bolivia, La Paz.
Requena, Mario. 1996. “La Experiencia de Privatización y Capitalización en Bolivia.”Serie de Reformas de Política Pública 38, Comisión Económica para AméricaLatina y El Caribe, Santiago, Chile.
Shapiro, Carl, and Robert Willig. 1990. ‘’Economic Rationales for the Scope of Pri-vatization.” In B. N. Suleiman and J. Waterbury, eds., The Political Economyof Public Sector Reform and Privatization, 55–87. London: Westview Press.
Sheshinski, Eytan, and Luis F. Lopez-Calva. 1999. “Privatization and Its Bene-fits: Theory and Evidence.” HDII Discussion Paper 698. Harvard University,Cambridge, Mass.
Shleifer, Andrei. 1998. “State Versus Private Ownership.” Journal of EconomicPerspectives 12(4): 133–50.
Shleifer, Andrei, and Robert Vishny. 1994. “Politicians and Firms.” QuarterlyJournal of Economics 109 (4): 995–1025.
———. 1996. “A Theory of Privatization.” Economic Journal 106: 309–19.
SIRESE (Sistema de Regulación Sectorial). 2000. “La Regulación Sectorial enBolivia.” Annual Report, Superintendencia General, La Paz.
Vickers, John, and George Yarrow. 1988. “Privatization: An Economic Analysis.”Cambridge, Mass.: MIT Press.
Wiltshire, Kenneth. 1987. “Privatization: The British Experience: An AustralianPerspective.” Committee for Economic Development of Australia and LongmanCheshire, Melbourne.
144 CAPRA, CHONG, GARRÓN, LÓPEZ-DE-SILANES, AND MACHICADO

4
Costs and Benefits of Privatization:Evidence from Brazil
Francisco Anuatti-Neto, Milton Barossi-Filho,Antonio Gledson de Carvalho, and
Roberto Macedo
THE BRAZILIAN PRIVATIZATION PROGRAM has been a major undertaking byinternational standards. Between 1991 and July 2001, the state transferredits control of 119 firms and minority stakes in a number of companies tothe private sector. The auctions produced $67.9 billion in revenues, plusthe transfer of $18.1 billion in debt. The government also sold $6 billion inshares of firms that remained under state control, obtained $10 billionfrom new concessions of public services to the private sector, and sold $1.1billion in scattered, noncontrolling stakes in various private companiesowned by BNDES, the National Social and Economic Development Bank.The magnitude of the Brazilian privatization program is among the largestin the world, making it worthy of closer analysis.
The Brazilian program has also been large in relative terms. Lora andPanizza (2002) compared the cumulative value of the privatization effortsbetween 1988 and 1999 as a proportion of gross domestic product (GDP)in 10 South and Central American countries (Argentina, Bolivia, Brazil,Costa Rica, Ecuador, El Salvador, Honduras, Paraguay, Peru, andUruguay). Brazil came in third with a rate of 5 percent of GDP, above theaverage of 2.7 percent, and was surpassed only by Peru (6 percent) andBolivia (9 percent).1 The value of privatizations in 5 of the other countriesdid not exceed 1 percent of GDP.
Despite its magnitude, the Brazilian program has been largely ignored inthe international literature. For instance, a survey by Megginson and Net-ter (2001, p. 326) recognized the Brazilian program as “likely to remainvery influential,” because of its scale and the size of the country. Their sur-vey did not include any specific analysis of the Brazilian program, however,
145

largely because of the paucity of studies and because most of the literaturethat does exist has been published only in Brazil and in Portuguese. Fur-thermore, the existing studies have their shortcomings, as their review inthis chapter makes clear. Therefore, there is room for adding to both theBrazilian and the international literature.
It is also important to disseminate findings among the Brazilian publicat large. The economy’s performance was very disappointing in the 1990s.Some groups, among them politicians and journalists, have often ex-pressed their frustration with privatization and other reform and adjust-ment policies, blaming them for the sluggish growth of the economy. Inpart because of this, the program all but stalled after 1998. Thus, it is cru-cial to show the results of the privatization program to shed light on a dis-cussion largely based on unwarranted conclusions.
With regard to theoretical aspects, privatization is the subject of a widerand continuing debate on the role of the government in the economy. Theanalysis in this chapter is primarily focused on the relative effectiveness ofprivate versus public ownership of companies that underwent privatizationin Brazil. As a working hypothesis, the chapter tests the proposition thatprivate ownership is more effective, but it also looks at the ways in whichprivatization results in increased profits, such as higher prices and reducedemployment. Moreover, it discusses the management of the privatizationprocess in terms of its macroeconomic implications and its objective of de-mocratizing capital ownership, among other issues. In this fashion, thechapter provides empirical evidence important to understanding the role ofpublic ownership in the country, as well as the process by which the statehas been stepping back from an entrepreneurial role.
The next section describes the Brazilian privatization program and sur-veys the literature on it. The chapter then presents the variables and thedata set used in the empirical analysis. The methodology and the empiri-cal results are summarized and other benefits and costs are discussed. Thechapter then examines public opinion on the privatization program inBrazil and compares these views with those in other countries in the sameregion. It also evaluates the perspectives for new privatization efforts inthe country, before summarizing the major conclusions.
The Brazilian Privatization Program and the Literature
The Brazilian privatization program has three components: the federalNational Program of “Destatization” (NPD), which started in 1991; sim-ilar programs at the state level, which began in 1996; and the privatiza-tion program of the telecommunications industry.2 This last componentwas launched in 1997 as a program at the federal level, separate from theNPD but running parallel to it. We refer to it here as the telecom program.Its auctions, mostly taking place in 1997 and 1998, produced a total of
146 ANUATTI-NETO, BAROSSI-FILHO, CARVALHO, AND MACEDO

$28.8 billion in revenues plus $2.1 billion in debt transfers. The NPDyielded a total of $28.2 billion in revenues plus $9.2 billion in debt trans-fers, while the state-level program produced a total of $27.9 billion inrevenues plus $6.8 billion in debt transfers.3
Altogether, electricity accounted for 31 percent of the total value of theauctions; telecommunications, 31 percent; steel, 8 percent; mining, 8 per-cent; oil and gas, 7 percent; petrochemicals, 7 percent; financial, 6 percent;and others, 2 percent. Largely because of the telecom program, the valueof privatizations reached a peak in 1997–98, a period that accounted for69 percent of the total value as of July 2001. This statistic has importantimplications for our later analysis of the effect the privatization programhad on Brazil’s fiscal crises and external imbalances.4
In any discussion of privatization, it is important to know what enter-prises the government owned before the privatization, which enterpriseswere privatized, and which remained under government control. We havelittle information on the initial situation in the various Brazilian state gov-ernments and on what remains to be privatized there. We therefore focuson the federal level only, the most important part of the program, whereour information covers the whole program, except for the concession ofpublic services.
An Overview of Privatization at the Federal Level
In 1980 the federal government undertook a survey of all its “entities,” in-cluding companies, foundations, port authorities, research institutes, andcouncils in charge of professional registration. There were 560 such insti-tutions, of which 250 were organized as firms (mainly in the form of cor-porations). In the 1980s some minor privatizations occurred, and a fewfirms were also closed. At the start of the program in 1991, other entitieshad also ceased to exist. As a result, the program was launched with 186firms still under government control. At the end of 2000, mainly becauseof the privatization program, this number was reduced to 102.
Appendix table 4A.1 lists the companies privatized by the federal gov-ernment since 1990. Appendix table 4A.2 lists the firms privatized on be-half of some states by BNDES, some minority controlling stakes formerlyheld by the federal government, and firms privatized by the state of SãoPaulo. In both tables, we list the firms included in our sample and the rev-enue obtained from their privatization. Note is also made of the compa-nies that were listed on the São Paulo stock exchange before privatization.
Appendix table 4A.3 lists the enterprises owned by the federal govern-ment that were not privatized. The group includes, among others, hospi-tals, port authorities, the postal service, an agricultural research firm, andBNDES. Among the industries where companies remain to be privatizedare the electricity industry, where privatization of several major companieshas been postponed; the oil industry; and the financial sector, in which a
COSTS AND BENEFITS OF PRIVATIZATION: EVIDENCE FROM BRAZIL 147

few federal banks and most state banks have already been privatized (thelatter group having been federalized for this purpose). The table also lists agroup of entities organized as corporations over which the government ex-ercises 100 percent control. Some of these entities are government agenciesdisguised as corporations. These firms are directly linked to the federalbudget, from which they receive practically all the resources they use.
The privatization program has made little progress since 1998. Amongother reasons, privatization and other liberalization measures coincidedwith sluggish growth, which weakened support for the program. More-over, some accusations that the government had used excessive methodsto bring interested groups to the telecom auctions caused a furor in thepress and led the minister of telecommunications to resign in 1998. Fur-thermore, if continued, the program would extend into politically sensitiveareas such as electricity, where the states are very strong; oil, where the gi-gantic Petrobrás still arouses strong nationalistic feelings; and the almost200-year-old Banco do Brasil, which plays an important role in financingfarmers and therefore enjoys strong political support.
The Brazilian Literature on Privatization
In reviewing this literature, we concentrate on the studies that have ad-dressed the status of the state-owned enterprises (SOEs) before and afterprivatization, as that is the major focus of this chapter. At a later point werefer to the literature on other issues as well.
Three studies are worth reviewing. Pinheiro and Giambiagi (1997) ofBNDES presented an overall evaluation of the preprivatization perfor-mance of federal SOEs in the 1981–94 period. They showed disappointingfigures for the SOEs, in terms of both profitability and dividends receivedby the national treasury. Over that entire period, the ratio of profits to netassets was �2.5 percent, on average. Moreover, from 1988 to 1994, yearsfor which data on dividends were available, the ratio of profits to assetsaccounted for only 0.4 percent of the equity capital owned by the federalgovernment in the SOEs.
One of the causes of this disappointing performance was the SOEs’wage policies. Macedo (1985) undertook a comprehensive analysis of wagedifferentials between private firms and SOEs. His data consisted of wagesand other characteristics of individual workers, obtained from forms filledout by firms every year, as required by the Ministry of Labor.5 He com-pared the wages of the workers in private firms and SOEs of approximatelythe same size in 10 industries. After controlling for differences in education,age, gender, and experience, he found sizable wage differentials in favor ofthe workers at the SOEs.6
The third study is Pinheiro (1996). He analyzed the performance of 50former SOEs before and after privatization, using data up to 1994. His datacovered one to four years before and after privatization for each company
148 ANUATTI-NETO, BAROSSI-FILHO, CARVALHO, AND MACEDO

and came from data sets similar to those used in this study but that werecomplemented by questionnaires filled out by the firms and delivered toBNDES for that purpose. Unfortunately, the bank’s policy prevents the useof the data by outsiders. The study covered eight variables: net sales, netprofit, net assets, investment, fixed investment, number of employees, debt,and an index of liquidity. From these variables, another six were derived tomeasure efficiency: sales and profit by employee, the rate of return meas-ured by the ratios of profit to sales and profit to net assets, and the propen-sity to invest, with respect to both sales and assets. No comparison wasmade with the performance of the private sector as a control group, norwas a distinction made between companies listed on the stock exchangeand those that were unlisted.
Pinheiro (1996) concluded that “in general, the obtained results confirmthat privatization brings a significant improvement . . . [in] the performanceof the firms. Thus, for most of the variables, the null hypothesis of nochange in behavior is rejected in favor of the alternative hypotheses thatprivatization increases the production, the efficiency, the profitability andthe propensity to invest, reduces employment and improves the financialindicators of the firms.”7
In the current study, we add to this literature in various respects. Thestudy was carried out by an independent team, whereas most of the previ-ous major studies were produced by staff members of BNDES. The studycovers a larger number of firms, looks at privatization up to the year 2000,and uses data that can be disclosed. We took explicit care to avoid a se-lection bias by including both large and small privatized firms, SOEs, andfirms in which the state held minority control, as well as firms listed on thestock exchange and firms that were unlisted. In addition to tests of means,the empirical work also employs panel data analysis. Moreover, the analy-sis of performance before and after privatization is also compared with theindicators observed in the private sector during the same periods.
The importance of this last feature must be underscored, as the Brazil-ian economy underwent various cycles in the pre- and postprivatizationperiods. In summary, after strong growth in 1994 and 1995, when a mod-est number of companies were privatized, the economy’s performance wassluggish until a strong recovery took hold in 2000, after the privatizationprogram had passed its peak. Thus, economic cycles might have affectedthe performance of former SOEs. The absence of control for this effectcould have blurred the results of the impact of privatization.
The Data Set and the Variables
Our data set is based on the annual financial statements (balance sheets, in-come statements, and cash flows) of the former SOEs and of a number ofprivate companies used as a control group. Brazilian accounting standards
COSTS AND BENEFITS OF PRIVATIZATION: EVIDENCE FROM BRAZIL 149

and procedures, as established by law and regulatory agencies, have re-mained the same for the whole period, thus facilitating our analysis.8 Thedata range from 1987 to 2000. The financial statements were obtainedfrom two consulting firms (Economática and Austin Assis) and a non-governmental organization (the Getúlio Vargas Foundation). All three col-lect financial statements from several sources, including newspapers. Weexcluded from our analysis the privatizations in the financial sector, as thatsector has a unique structure, involves specific issues, and would have re-quired specialized analysis. We also excluded the cases in which BNDESsold minor, noncontrolling participations in scattered companies as part ofits portfolio as a development bank. Thus, we focused only on sales of con-trol packages, both of a majority and of a minority nature. Table 4.1 ex-plains the coverage of the sample.
To proceed, it is necessary to distinguish privatization contracts (orauctions) from privatized enterprises. A number of former SOEs were soldas a block, and the successful bidder for an operational holding companywas also given access to the control of its subsidiaries. In the case of thetelecommunications sector, for instance, five amalgamated blocks of pri-vatization auctions covered the entire local, cellular, long-distance, and in-ternational restructured segments.
As a result, the data set of the sampled companies covers 66 privatizationcontracts, corresponding to 102 firms. From the figures given in table 4.1,
150 ANUATTI-NETO, BAROSSI-FILHO, CARVALHO, AND MACEDO
Table 4.1 Description of the Privatization Program and Coverageof the Sample, 1991–2000
Number of Number of Auction results Type of privatization contracts companies (US$ millions)a
Privatization programFinancial sector 9 9 5,112.30Minority sales in SOEs 6 6 6,164.10BNDES participations — — 1,146.00Control package sales 103 147 76,878.20Total 118 162 89,439.20
Companies included in sampleState minority control 16 16 1,299.20State majority control 50 86 70,709.80Total 66 102 72,009.00
Note: SOEs � state-owned companies and BNDES � National Social andEconomic Development Bank.
a. These values include transferred debt ($17.8 billion) and offers to employees inthe telecommunications industry ($0.3 billion) but exclude concessions of newservices ($7.7 billion).
Source: Authors’ calculations.

it can be inferred that the sample covers 64 percent of the control pack-ages, 69 percent of the firms they include, and 94 percent of the total valueof the auctions. The smaller number of companies in the mean and mediantests is explained by the methodology adopted and described in the nextsection.
No information was available from the sources listed above for the 37contracts not included, which correspond to 45 companies and yieldedproceeds of $4.9 billion, as listed in appendix table 4A.1. Attempts to gatherinformation from BNDES White Books were frustrated by nondisclosureand confidentiality rules governing data held by the bank.9 Table 4.2 sum-marizes the number of Brazilian companies privatized according to industryclassification, along with their value at the auctions and the percentage theyrepresented of the total value of each industry.
All but three of the electricity companies were included in the sample.The sample includes one of the three gas distribution companies that wereprivatized at the state level. More petrochemical, fertilizer, and chemicalplants are included in the sample than are excluded. The excluded groupincludes various limited liability companies, which are not required tomake their balance sheets and income statements public.
Although they are not important in economic size, the release of informa-tion on the privatized railways and ports could yield interesting case studies,as privatization accompanied the restructuring of these industries even as thegovernment retained an active role in them. The railways were operated un-der regional branches of the federal railway network and were split into re-gional companies for privatization purposes only. The regional port facilitieshad been separate companies, operating under a federal holding company. Inthis case, privatization led to the creation of specialized terminals to be leasedto private operators, with part of the infrastructure facilities remaining in thehands of SOEs. Thus, if data were available, one could compare the per-formance of both private firms and SOEs working side by side.
The companies under the heading “others” include miscellaneous ac-tivities such as bus terminals, data processing, and ferryboats or smallfirms that are not organized as corporations and are also not required tomake their balance sheets and income statements public.
Thus, what was left outside of our sample represents only a minor partof the program, but not an uninteresting group for industry- and firm-specific studies. Their absence, due to insurmountable difficulties, doesnot jeopardize the relevance of our sample as representative of the com-panies that underwent privatization in Brazil. When the information wasavailable, as it was for most of the companies and the most importantones, it was included in the sample.
Our data set involves essentially the same variables used by La Portaand López-de-Silanes (1999) in their study of the Mexican case. Fifteenfinancial indicators, according to seven criteria, make up this set of vari-ables, as described in table 4.3.
COSTS AND BENEFITS OF PRIVATIZATION: EVIDENCE FROM BRAZIL 151

152
Table 4.2 Privatized Brazilian Companies by Industry Classification
Companies included Auction value Percent Companies excluded Auction value PercentIndustry classification in sample (US$ millions) included from sample (US$ millions) excluded
Aviation 1 455.0 100.0 0 0.0 0.0Bank and financial 0 0.0 0.0 8 5,107.0 100.0
industrya
Electricity and power 23 29,959.1 96.35 3 1,134.0 3.65plants
Fertilizers 2 452.0 91.50 3 42.0 8.50Mining 2 6,864.0 100.0 0 0.0 0.0Oil and gas 3 5,538.0 97.44 1 146.0 2.56Others 0 0.0 0.0 7 809.0 100.0Petrochemicals 17 2,156.0 75.86 7 686.0 24.14Ports and container 0 0.0 0.0 9 461.0 100.0
terminalsRailways 2 1,076.0 62.50 6 646.0 37.50Steel 6 8,187.0 100.0 0 0.0 0.0Telecommunications 44 23,858.0 100.0 0 0.0 0.0Water and sewage 2 592.0 100.0 0 0.0 0.0Total 102 79,137.1 89.75 44 9,031.0 10.25
a. All information about this industry is excluded from the sample as in La Porta and López-de-Silanes (1999).Source: Authors’ calculations.

Empirical Analysis
Two different approaches were adopted to examine changes in per-formance after privatization: mean and median tests, and panel dataanalysis.
COSTS AND BENEFITS OF PRIVATIZATION: EVIDENCE FROM BRAZIL 153
Table 4.3 Summary of Results
Appendix tables
Indicator 4C.1 4C.2 4C.3 4C.4
ProfitabilityOperating income/sales � � � �Operating income/PPE � � � �Net income/sales � � � �Return on assets � � � �Return on equity � � � �
Operating efficiencyLog(sales/PPE) � � � �Operating cost/sales � � � �
AssetsLog(PPE) � � � �Investment/sales � � � �Investment/PPE � � � �
OutputLog(sales) � � � �
ShareholdersPayout � � � �
FinanceCurrent � � � �Long-term debt/equity � � � �
Net taxesNet taxes/sales � � � �
Note: PPE � property, plant, and equipment. See appendix 4B for definitions of thevariables. See appendix 4C for full results of the mean tests. Appendix tables 4C.1 and4C.2 refer to the results obtained upon the calculation of mean and median values fortwo years before and two years after privatization (Method 1). The adjustments onthese calculated values are made for comparisons with the private sector and producethe results in appendix table 4C.2. The results in appendix tables 4C.3 and 4C.4 arebased on the same procedure, but the mean and median values are calculated for allyears before and after privatization (Method 2). The shading means the indicator meandifference is significant at least at the 10 percent level. The sample size of companiestaken for the mean and median tests is 73. Auction results amount to $68.1 billion.

Mean and Median Tests
For the mean and median tests, two different methods were used. Underthe first method, for each indicator a comparison is made between themean and median values of the two years following privatization and theirvalues in the two years before privatization.10 The second method fullyutilizes the information in the data set by comparing the mean and medi-ans of all years after privatization with their values in the years before.
The Brazilian economy experienced cycles over the course of the pe-riod during which privatization took place. Thus, changes in perfor-mance could reflect cyclical movements of the economy, rather than theimpact of privatization. To circumvent this problem, in each method wealso used, as an alternative procedure, a control group of private compa-nies. The performance of the privatized companies was adjusted by tak-ing the difference between the indicator for the privatized enterprise andthe average of the indicator for the control group. Thus, we followed aprocedure close to the one used by La Porta and López-de-Silanes (1999,p. 1211), who adopted, in their words, “industry-adjusted changes inperformance for the sample of privatized firms.”11
Table 4.3 summarizes the results in terms of their signs and statisticalsignificance. The complete results are presented in appendix 4C.
Profitability. In general, the results indicate an improvement in the prof-itability of the privatized companies. Considering the ratio of operatingincome to property, plant, and equipment (PPE), return on assets (ROA),and return on equity (ROE), performance after privatization improves re-gardless of the comparison method we used. The increase of operating in-come to PPE is evident once the change in the mean or median is alwayspositive and significant, at least at the 10 percent level. The statistics forROE and ROA are also always positive. In the case of ROE, three of thefour statistics are significant, while for ROA only two reveal significance.
A slightly different picture appears when we consider the ratio of oper-ating income to sales. Looking at the sign of the change, this indicator im-proves after privatization under the second method but not under the firstand not in comparison with the private sector, when the change becomesnegative and significant at the 10 percent level (appendix table 4C.2). Lit-tle can be said about the ratio of net income to sales. The sign of the coef-ficients varies across methods and fails to present statistical significance.
At the firm level, various reasons could account for results of this kind.At this point, the method’s weakness in investigating in detail the sourcesof variance becomes apparent, underscoring the importance of using a dif-ferent approach to test explanatory variables other than privatization, asis done shortly by using panel data analysis.
Operating Efficiency. The results strongly suggest an improvement in effi-ciency. In all tables we observe an increase in the ratio of sales to PPE and
154 ANUATTI-NETO, BAROSSI-FILHO, CARVALHO, AND MACEDO

a reduction in the ratio of operating costs to sales. In the case of sales toPPE, all the statistics are positive and significant, strongly suggesting thatprivatized firms became more efficient in the use of their assets. Regardingoperating costs to sales, all the statistics present a negative sign, while onlyone of them lacks significance at the 10 percent level. As illustrated in ap-pendix table 4C.1, operating costs dropped by one-third in the two yearsafter privatization, compared with the two years before privatization, thusproviding evidence of improved efficiency at the operational level.
Assets and Output. Apparently, privatization had a negative impact on in-vestment. In all the tables, the Log (PPE) and investment-to-sales statisticspresent a negative sign. These results seem consistent with the increase inefficiency we found. When considering the ratio of investment to PPE,which reflects the rate of investment, there is no clear picture: the signchanges across the two methods and the private sector adjustment, butnone of the statistics is significant.
The effect of privatization on sales is a small but significant increase,observed in all tables. The statistics that test for difference in average aresignificant at the 1 percent level (appendix tables 4C.1 and 4C.3). There isa small increase in sales even after the adjustment to the performance ofthe private sector is made (appendix tables 4C.2 and 4C.4).
Finance and Shareholders. With respect to the payout ratio—that is, theratio of total dividends paid to net operating income—no conclusive evi-dence was obtained. The sign of the coefficient is consistently negative al-though never significant. A lack of information could be responsible forthis finding, since this variable could be calculated only for a reduced num-ber of firms (45).12
A clearer picture emerges with the financial management indicators. Weobserve an increase in the ratio of current assets to current liabilities, bothin absolute terms and in comparison with the private firms in our controlgroup. The statistics for the difference in average are consistently positiveand significant. Moreover, the adjusted mean and median are negative (ap-pendix tables 4C.2 and 4C.4), meaning that former SOEs, when comparedwith the control group, continued to present lower short-term solvency.The overall improvement indicates that SOEs, having government backing,are less concerned with achieving sound financial performance.
With respect to the ratio of long-term debt to equity, we observe thatwhen privatized firms are seen in isolation, privatization has a positiveimpact, as the coefficients are significant and show an increase (appendixtables 4C.1 and 4C.3). When compared with the performance of the pri-vate firms, however, the change in coefficients becomes negative, and adifferent picture emerges (appendix tables 4C.2 and 4C.4). In any case, inthe same tables the mean values after privatization (0.108 and �0.002,respectively) indicate that the leverage of former SOEs converged to val-ues observed in the private sector.
COSTS AND BENEFITS OF PRIVATIZATION: EVIDENCE FROM BRAZIL 155

The results regarding financial structure are similar to those reportedby La Porta and López-de-Silanes (1999) and can be explained by the al-most null probability of insolvency of state-owned enterprises, since theircredit status is guaranteed by the government. Having lost governmentbacking, these firms were forced to adjust by decreasing their long-term-debt-to-equity ratio and increasing their current-assets-to current-liabilitiesratios.
Net Taxes. Our results indicate a clear decrease in the ratio of net taxes tosales. All the coefficients are negative and significant at the 1 percent level.There are two reasons for finding a clear and significant decrease in nettaxes after privatization in Brazil. This variable is defined as the differencebetween calculated taxes and allowed deductions. Because the allowed de-ductions do not come in the form of explicit subsidies, it is worthwhile todescribe them in detail to interpret the results more accurately.
Three general categories of deductions apply: fiscal incentives, com-pensation for previous losses, and tax credits. Losses incurred in one par-ticular year may be deducted from income tax over several years. This, inparticular, affected companies that were highly dollar-indebted when thedevaluation of the Brazilian real occurred in early 1999. In fact, losses ofthis sort were also responsible for a decrease in net taxes even for the con-trol group in 2000.
With respect to tax credits, an important dimension is the legal treat-ment of the premium paid on asset value in mergers and acquisitions.Brazilian corporate law recognizes the premium, and it was regulated inthe mid-1990s. The acquiring company is allowed to set up a reserve ac-count for the premium and amortize it over a period of 5 to 10 years.When the reason for the premium paid over assets is based on expected fu-ture profits, the rebate is allowed for a period of up to 5 years. This bene-fit applies to mergers and acquisitions in general. Thus, both the overallprivate sector under restructuring and the privatized companies have beenbeneficiaries of these rebates. The existence of an explicit provision settingout the premium paid for concessions as expected future profits facilitatesthe use of this sort of tax credit in privatization. Therefore, reasonableexplanations exist for our finding that net tax payments have decreasedafter privatization.
In particular, evidence provided by individual data in the iron and steelindustry supports this argument. On average, most of the firms in that in-dustry were subjected to Brazilian government rules concerning incometax before the privatization, which established the amount of tax that wasdue. After privatization, the pattern of this indicator changes a great deal.This result is readily observable since the individual data for this industrystretch over more years than any other in our sample, which allows usto state that Companhia Siderúrgica de Tubarão (CST) and Usiminasstarted paying more income tax after their privatization in 1993 and 1992,
156 ANUATTI-NETO, BAROSSI-FILHO, CARVALHO, AND MACEDO

respectively. Clearly, four out of six firms in this industry did the same asCST and Usiminas: Acesita, Aço Minas Gerais, COSIPA, and CSN, sug-gesting that the tax credit for premiums paid on assets would explain thisunexpected decrease in taxes.
Taken as a whole, these results support the view that privatizationbrought improvements in the performance of the firms. However, aspointed out, the mean and median tests leave room for a more compre-hensive analysis that fully utilizes the variance of the data set and allowsfor examining other aspects of the privatization process. This is the focusof the next section.
Panel Data Analysis
We start with a brief description of the technique used in this subsection.It is a dynamic version of panel data analysis and focuses on individualheterogeneities over time, in particular the discontinuous effect of pri-vatization. This approach is an alternative to generalizations of con-stant-intercept-and-slope models for panel data, which introducedummy variables to account for effects of variables that are specific toindividual cross-sectional units, but stay constant over time, togetherwith the effects that are specific to each time period, but the same for allcross-sectional units. The analysis is dynamic because the lagged valueof the independent variable is included in the model, and the panel is un-balanced as the data set is missing some observations for some firms.
Many economic relationships are dynamic in nature, and another advan-tage of the panel data approach is that it allows for a better understand-ing of the dynamics of adjustment of a particular variable. However, theinclusion of a lagged dependent variable in the model causes problems,which are well known in the literature.13 Following it, we opted to applythe Arellano and Bond (1991) GMM-IV (generalized method of momentsinstrumental variables) method to estimate the parameters of the paneldata model used in the empirical analysis.14
The Model and Variables. To assess the effect of privatization on eachperformance indicator listed in appendix table 4B.1, we relied on the fol-lowing econometric model:
Iit � �i � � Iit�1 �� Pit � Xit � � Mpt � eit,
where:Iit represents the performance indicator for firm i in year t;Iit�1 represents the performance indicator for firm i in year t � 1;Pit, referred to as PRIVATIZATION, is a dummy variable that as-
sumes a value of 1 if company i had already been privatized in year t, and0 otherwise;
COSTS AND BENEFITS OF PRIVATIZATION: EVIDENCE FROM BRAZIL 157

Xit is a set of control variables that are also firm specific (see appendix4D for definitions of control variables); and
Mpt, referred to as PRIVATE MEAN, is the mean value of the per-formance indicator for the group of privatized firms listed in appendix 4A,defined only over time, that is, assuming for every year the same valueacross the cross-sections of privatized firms.
Empirical Results. The panel results are shown in table 4.4. Before dis-cussing them, it should be noted that it is possible to decompose the Xit
vector of the model into two groups. The first group comprises the dummyvariables that are associated with the environment confronted by the firmsand that are effective for all companies in the sample (TRADABLE, REG-ULATED, and LISTED). The other contains firm-specific variables thataffect only the companies that are the focus of the study (PRIVATIZA-TION, SPLIT/MERGER, and MINORITY CONTROL).
In the case of firms operating in TRADABLE industries, one observes thepredominance of an inferior performance compared with those in nontrad-able industries. This is found in the indicators of profitability, operationalefficiency, output, sales, and indebtedness. Firms also seem to pay higher nettaxes to sales. The reason for an underperforming tradable sector is that, formost of that period, the country was promoting trade liberalization, aprocess aggravated from 1995 to 1998 by an exchange rate overvaluation.
Because the effects of REGULATION are likely to be different in thevarious industries, a more detailed analysis would be required to inves-tigate them. In any case, the comparative analysis of regulated industriesversus unregulated ones shows a slightly better performance among reg-ulated industries in terms of profitability, investment, sales, and indebt-edness. A possible explanation for this is that regulation encouragedcompanies to improve their performance, in particular, by setting morerealistic prices for the regulated activities.
For the privatized companies that underwent restructuring in the formof SPLIT/MERGERS, no discernible effect was found on profitabilityindicators. Moreover, the same companies present evidence of inferiorresults in terms of operational efficiency, assets and outputs, indebtedness,and net taxes. Notice that this dummy variable is in effect only for theperiod in which the intervention occurred and it is associated with the pri-vatization intervention. So the inferior results would have to be interpretedwith respect to the performance of firms that were privatized withoutrestructuring. There is an open debate on the virtue of government-ledadjustments in debt, labor force, and firm activities before privatization(Megginson and Netter 2001).
The MINORITY CONTROL dummy shows two significant coeffi-cients for profitability performance indicators, but it also shows mixed re-sults for operational efficiency, with a relatively large ratio of sales to PPEand a somewhat high ratio of operational costs to sales. Firms privatized
158 ANUATTI-NETO, BAROSSI-FILHO, CARVALHO, AND MACEDO

Table 4.4 Changes in Performance: GMM-IV Panel Data Analysis
Performance indicators
Log Log Log LTD/Variable OI/S OI/PPE NI/S ROA ROE (S/PPE) OC/S (PPE) I/S I/PPE (S) Current E NT/S
Privatization 0.056*** 0.033 0.003 0.016*** 0.062*** 0.070*** �0.015*** �0.012*** �0.032*** 0.057*** 0.008 0.140*** �0.029* �0.006***0.008 0.055 0.005 0.003 0.005 0.009 0.003 0.004 0.009 0.010 0.004 0.015 0.020 0.001
Tradable �0.001 0.030*** �0.006*** �0.007*** �0.030*** �0.026*** �0.005*** �0.005** 0.003 �0.034*** �0.010*** 0.019 0.028*** 0.006***0.003 0.007 0.002 0.002 0.004 0.005 0.002 0.002 0.005 0.007 0.003 0.017 0.010 0.0005
Regulation 0.032*** 0.013 0.003 �0.0006 0.011*** �0.030*** �0.035*** 0.027*** 0.003 0.015 0.024*** �0.056 0.130*** �0.004***0.005 0.016 0.003 0.003 0.005 0.007 0.002 0.003 0.007 0.009 0.003 0.019 0.017 0.001
Split/mergers 0.028 �0.070 0.010 0.0007 0.005 �0.041*** 0.032*** 0.018*** 0.055*** �0.066*** 0.004 �0.102*** �0.235*** �0.004**0.039 0.105 0.010 0.004 0.004 0.010 0.006 0.005 0.020 0.012 0.004 0.022 0.022 0.001
Minority 0.016 �0.066 0.040*** 0.007 0.026** 0.065*** 0.008* �0.011 �0.021 0.065*** �0.016*** 0.348*** �0.137*** 0.023***control 0.018 0.097 0.011 0.007 0.011 0.012 0.005 0.009 0.022 0.022 0.005 0.062 0.041 0.005
Listed 0.057* �0.063 0.067*** 0.018*** 0.029*** 0.035*** �0.016*** 0.008* 0.122*** 0.115*** 0.007** 0.016 0.085*** �0.004***0.034 0.065 0.014 0.003 0.005 0.013 0.006 0.004 0.020 0.011 0.003 0.016 0.024 0.001
Private 1.287*** 1.070*** 0.425*** 0.751*** 0.710*** 0.520*** 0.770*** 0.101*** 0.954*** 0.970*** 0.115*** 0.635*** 0.887*** 1.070***mean 0.053 0.041 0.040 0.040 0.037 0.037 0.061 0.008 0.032 0.024 0.008 0.055 0.030 0.067
Lagged 0.195*** 0.080*** 0.556*** 0.035*** 0.172*** 0.831*** 0.555*** 0.912*** 0.304*** 0.075*** 0.926*** 0.458*** 0.186*** 0.040***variable 0.019 0.020 0.015 0.005 0.016 0.007 0.017 0.004 0.012 0.013 0.006 0.013 0.041 0.011
Exchange �0.020*** �0.012***ratea 0.003 0.004
Constant �0.137*** �0.015 �0.062*** �0.022*** �0.070*** �0.210*** �0.022*** 0.029 �0.120*** �0.164*** �0.220*** �0.299*** �0.122 0.0040.034 0.052 0.015 0.004 0.008 0.019 0.014 0.043 0.024 0.0187 0.050 0.080 0.032 0.003
N 1798 2158 1960 2257 1903 2044 1580 2561 1702 2185 2073 2120 2256 1598Pseudo R2 0.332 0.352 0.441 0.397 0.468 0.554 0.561 0.373 0.491 0.538 0.725 0.584 0.610 0.447
159
(Table continues on the following page.)

160
Table 4.4 (continued)
Performance indicators
Log Log Log LTD/Variable OI/S OI/PPE NI/S ROA ROE (S/PPE) OC/S (PPE) I/S I/PPE (S) Current E NT/S
Sargan Testb 0.000 0.000 0.001 0.002 0.000 0.000 0.005 0.000 0.010 0.004 0.000 0.000 0.000 0.012(Prob � �2)
* Significant at the 10 percent level.** Significant at the 5 percent level.*** Significant at the 1 percent level.Note: GMM-IV � generalized method of moments instrumental variables. For definitions of the performance indicators, see appendix 4B. The table shows the estimated
coefficients for unbalanced panel data regressions, corresponding to each performance indicator. See text for explanation. Error terms are shown in parentheses.a. Dummy variable introduced in order to overcome a devaluation bias in those variables that are defined in absolute terms after 1999. Though this effect has caused
impacts in all of the performance indicators, they can be overcome for those which are defined as a ratio of two variables.b. Sargan Test for Over-Identifying Restrictions. All the null hypotheses were rejected, validating the use of the instruments chosen.

with these characteristics pay the highest net taxes relative to sales of allprivatized firms and have lower indebtedness, indicating that they did notbenefit as much from the corporate tax credits that came with privatiza-tion and that they had inferior access to credit compared with other pri-vatized companies.
The dummy LISTED reveals a clearer positive effect for all criteria ofperformance. In particular, coefficients for four of the five profitabilityindicators presented positive and significant signs. Listed companies alsoshowed better indicators for operational efficiency, output, and assets, aswell as the largest indicator for long-term debt to equity. The net-tax-to-sales indicator has a negative sign again, indicating corporate tax benefitsfor listed companies. Thus, the results presented by this dummy cautionagainst the bias in selecting only firms listed on the stock exchange forprivatization studies.
It is possible now to assess the net effects of PRIVATIZATION as achange in the intercept of each indicator. In general, its impact comes ashypothesized and stronger than the one revealed by the mean and mediantests. As it is the key variable under investigation, the results for the vari-ous indicators of performance are discussed in more detail.
Profitability. Three out of the five indicators of profitability presented intable 4.4 clearly reveal the improvement that comes with privatization, asits estimated parameters are positive and significant at the 1 percent level.Privatization coefficients for the ratio of operating income to sales (OI/S),return on assets (ROA), and return on equity (ROE) show an increase of5.6 percent, 1.6 percent, and 6.2 percent, respectively.
Operational Efficiency. Significant at the 1 percent level, the coefficientsof the privatization dummy show the expected sign, that is, an increase of7 percent in the ratio of sales to PPE, or Log(S/PPE), and a reduction of1.5 percent in the ratio of operating costs to sales (OC/S).
Assets and Output. Significant PPE and sales are the only indicatorsmeasured by their absolute values, which are measured in dollars. TheBrazilian currency suffered a major devaluation early in 1999 that wasnot reversed in 2000. To capture the negative effect on these indicators,we introduced a dummy variable taking the value of 1 in those years, and0 otherwise. For both Log(PPE) and Log(S) the estimated coefficientswere negative and significant at 1 percent. In the Log(S) equation ad-justed in this fashion, the impact of privatization on sales is smaller (0.8percent) than in the Log(PPE) equation.
Even after taking devaluation into account, the privatization coeffi-cient for the property, plant, and equipment indicator, or Log(PPE), isnegative, indicating a reduction of 1.2 percent in the productive assets ofthe firms. This result is consistent with the coefficients for privatizationwith respect to other asset indicators. An increase in the ratio of sales to
COSTS AND BENEFITS OF PRIVATIZATION: EVIDENCE FROM BRAZIL 161
PPE, or Log(S/PPE), intensifies the use of productive assets, so a reduc-tion of 3.2 percent in the investment-to-sales (I/S) ratio is likely. As theratio of investment to PPE (I /PPE) shows a positive coefficient of 5.7 per-cent for privatization, the indication is that investments after privatiza-tion are moving into working capital.
The indication of an increase in investments in the form of working cap-ital is confirmed by a strong impact of privatization on the ratio of currentassets to current liability: a 14 percent increase, significant at the 1 percentlevel. With respect to the ratio of long-term debt to equity (LTD/E), a likelyoutcome is that the privatized companies will seek to reduce the cost of cap-ital, combining equity and debt in an efficient way. Conversely, state-ownedenterprises are likely to increase debt, saving the national treasury from in-vesting in their equity as their credit status, guaranteed by the government,has a small probability of default. This situation may lead to large LTD/Eratios. After privatization and the loss of government backing, privatizedfirms are forced to adjust by decreasing this ratio and increasing the ratio ofcurrent assets to current liabilities. Accordingly, the privatization coefficientfor LTD/E shows a reduction in indebtedness of 2.9 percent, significant atthe 10 percent level. It is interesting to observe the LTD/E coefficients esti-mated for SPLIT/MERGERS (�23.5 percent) and MINORITY CONTROL(�13.7 percent), which magnify the impact of losing government backing.
With respect to net taxes, the coefficient of privatization is negative andsignificant at the 1 percent level. The reasons are those presented in themean and median tests, now confirmed by a panel data analysis.
Other Variables in the Model. The coefficient of the private mean is pos-itive and significant for all indicators, reflecting the impact of overallbusiness and macroeconomic conditions. It also cautions against anotherdistortion of some studies on privatization in which the impact of priva-tization from the changes in these conditions over time is not isolated.
The coefficients of the lagged variable, instrumented by its two-periodversion, are all positive and significant, revealing that the past behavior offirms’ indicators has a strong influence on their current performance. On topof this effect, other variables exert influence, such as those encountered above.
Finally, we emphasize once more that the obtained evidence on de-creasing tax revenue, mainly after privatization, is a special phenomenondue to tax credits. It therefore does not reflect a permanent reduction inincome for the Brazilian government.
Other Benefits and Costs of the Program
The improvement in the performance of privatized firms shown in the pre-vious section can be viewed as a benefit, as it contributes to the efficiencyof the economy as a whole. This section addresses other benefits, as well
162 ANUATTI-NETO, BAROSSI-FILHO, CARVALHO, AND MACEDO
as some costs, of the privatization program. It also seeks to identify somesources of the gains made by privatized firms in the form of reductions inemployment and increases in prices.
Employment
One of the weaknesses of the Brazilian data is that no comprehensive, reli-able, and unified record of the number of employees exists for the priva-tized companies either before or after their sale. Financial statements andannual reports, including those of listed firms, are not required to includeinformation on employment, and companies provide it at their own dis-cretion. There are also no uniform requirements for including payroll in-formation in these reports and statements, which bundle wage and salarycosts together with other operational costs.
Even when employment and payroll data are available, their analysis ishandicapped for other reasons. In Brazil, there are strong incentives for theadoption of outsourced services, such as security, cleaning, maintenance,and accounting. Outsourcing has become a widespread means of reducinglabor costs, as service providers are usually smaller firms and pay lowerwages. In addition, one often finds workers disguised as business ownersto avoid heavy taxation of wages and salaries.15 Most workers prefer for-mal contracts with employers; firms and unions also press for this and aremore successful with SOEs. It is therefore very likely that privatization hasled to an extension of outsourcing. Thus, a reduction of employment in acompany would not necessarily mean a reduction in the jobs generated byits activities along its chain of suppliers.16
Given this picture, we first examine the employment effects at the in-dustry level, where there are aggregate data. Then, for a limited numberof former SOEs, we focus on employment data from the files of Exame,a business magazine that collects financial statements and reports ofBrazilian firms, as well as scattered employment data from the magazineand other sources.
In Brazil the most important source of data on formal employment isthe Annual Survey of Social Data (RAIS) from the Ministry of Labor andEmployment. All firms and the government are required annually to listworkers and their characteristics such as year of entrance, white-collarversus blue-collar, unionized, level of education, and so forth. Individualfirms cannot be identified in the samples. This source has consistent datafor the period 1995 to 1999.
Table 4.5 shows data on employment for the industries in which themost important privatizations have occurred. One can see that until 1997the private sector was responsible for less than one-twentieth of employ-ment in electricity, about one-third in water and sewage, a quarter intelecommunications, and a fifth in piped gas distribution. By 1999, in boththe telecommunications and the gas distribution sectors, the larger part of
COSTS AND BENEFITS OF PRIVATIZATION: EVIDENCE FROM BRAZIL 163

164
Table 4.5 Employment in Selected Industries, by Public or Private Ownership, 1995–99
1995 1996 1997 1998 1999
Public Private Public Private Public Private Public Private Public PrivateIndustry (%) (%) Total (%) (%) Total (%) (%) Total (%) (%) Total (%) (%) Total
Mining 18 82 39,131 18 82 38,060 1 99 31,447 1 99 39,955 1 99 35,763Petroleum 76 24 14,442 82 18 21,546 72 28 16,963 62 38 13,923 39 61 10,590Fertilizers 18 82 6,460 9 91 7,145 11 89 8,395 1 99 12,563 1 99 11,907Petro- 5 95 15,739 2 98 14,947 0 100 19,018 1 99 26,263 1 99 28,935
chemicalsIron and 5 95 376,220 5 95 369,234 2 98 385,064 2 98 429,965 2 98 446,949
steelElectricity 97 3 149,100 97 3 128,545 95 5 99,871 64 36 111,225 55 45 95,870Gas 92 8 3,257 89 11 2,640 83 17 1,551 60 40 1,763 31 69 1,437
distributionWater and 68 32 135,313 72 28 146,791 66 34 159,588 66 34 145,375 62 38 149,822
sewageTelecom- 80 20 107,689 77 23 113,126 75 25 117,740 19 81 105,284 26 74 109,478
munications
Note: Number of employees as of December 31.Source: Ministry of Labor and Employment, 1995 Survey of Social Data.

COSTS AND BENEFITS OF PRIVATIZATION: EVIDENCE FROM BRAZIL 165
employment moved to private companies. In the electricity and water andsewage sectors, employment is still largely in SOEs and public enterprisesbut now with a significant mix of private firms.
The table shows a clear reduction in employment following privatiza-tion in the electricity and piped gas distribution industries. In telecommu-nications, the effect of privatization on reducing employment is less clear,in part because the provision of services expanded very rapidly after priva-tization. Worth mentioning is the case of the water and sewage industry:still largely in the hands of the government and not expanding as quicklyas telecommunications, its employment ranks high in stability among theindustries shown in the table. Note also the recovery of employment inpetrochemicals and in iron and steel, showing that after employment ad-justs following privatization, the growth of investment and productionleads to new jobs.
The employment data from Exame’s files cover companies privatized inthe period 1995–2000; some data are missing, but enough are available toallow a comparison between the pre- and postprivatization years. Figure4.1 shows data for 49 companies in the form of a box-plot diagram. Theimpact of privatization on employment emerges clearly from the plotteddata, with 43 companies showing a reduction in employment after priva-tization and only 6 revealing an increase. Tests were performed by takingthe average number of employees in at least two years before and after pri-vatization. The Wilcoxon signed rank test, calculated for the difference inmeans, is equal to –5.217 and significant at the 1 percent level. A para-metric t-test is also calculated and equals 3.906, which is significant at the5 percent level.
Our conclusion is that a share of the costs of privatization has beenborne by some of the workers directly employed by the former SOEs wholost their jobs either in the process of adjustment for the sale or thereafter.This is an inevitable outcome of privatization as new owners seek higherefficiency. Thus, this reduction in employment was one of the sources ofgains from privatization. However, as privatized firms invest and expandtheir activities, at some point employment begins to increase, although thesame workers are not necessarily rehired, and some of them might con-tinue to suffer the costs of displacement and reallocation. In the Braziliancase, the widespread use of outsourced services often blurs the picture, aspositive impacts are not necessarily captured by the direct employmentdata of privatized firms, particularly in the telecommunications industry.
Prices
Following privatization, newly established regulatory agencies moved to en-courage more realistic prices, particularly in the areas of electricity andtelecommunications. The government had to announce this policy duringthe privatization process to guarantee the success of the auctions. Moreover,

the overvaluation of the Brazilian real and the trade liberalization reformsundertaken since the early 1990s meant that the tradable industries were ex-posed to increased competition.
To show some of the relevant changes in relative prices, we made acomparison of various price indexes at the industry level with an overallprice index, the CPI-A calculated by the Brazilian census bureau. We took
166 ANUATTI-NETO, BAROSSI-FILHO, CARVALHO, AND MACEDO
Figure 4.1 Formal Employment before and after Privatization,1995–99
Note: The figure shows a box plot for the lower and upper bounds of thenumber of employees in our sample before and after privatization. The shadedregion represents the percentile while the black line inside represents themedian. The two lines at the extremes are the percentiles, and the stars standfor outlier observations beyond two standard deviations. See the text and table4.5 for a more detailed explanation.
Source: Authors’ calculations.
16
15
14
13
12
11
10
9
8
7
6
5
4
3
2
1
0N= 49 49
Employment before Employment after
Number of employees (thousands)

August 1994 prices as a reference for the other indexes. In the tradable in-dustries, such as iron and steel, nonferrous metals, nonmetallic minerals,fertilizers, and plastics, which are greatly affected by the overvaluation ofthe real, domestic prices lagged behind CPI-A variations for the years 1994to 1998. After devaluation, prices in these industries clearly caught up tothe CPI-A. This sheds light on one of the results of the previous section,where it was found that firms in these industries had shown a shakier per-formance than firms in other industries, in part because of the restraint im-posed by the overvalued real.
For telephone rates, the price effects started when the telecommunica-tions industry was being prepared for privatization, as early as 1996. Inparticular, the minimum monthly fee for access to a line increased sharply.This has been a source of gains to the telephone companies, but no one inBrazil would dispute that it was followed by a massive expansion of serv-ices to the point of destroying the market that previously existed for trad-ing telephone lines, at prices sometimes reaching $2,000–$3,000, or evenmore when the dollar was overvalued.
In electricity, the rate restructuring began in 1995. Privatization itselfstarted in 1997, and the concessionaries signed an incentive contract witha clause allowing a pass-through of noncontrollable costs. Thus, with thedevaluation in 1999, they were allowed to adjust prices for the dollar-denominated contracts they had, for instance, with suppliers from Paraguay.
Our conclusion is that prices have been a source of gains to privatizedfirms in the telecommunications and electricity industries. Regulationcombined with privatization made prices follow contracts and other rules,thus reducing the scope for political manipulation that existed when thegovernment played a larger entrepreneurial role in these industries. In thetelecommunications industry, this government role practically ceased toexist, but it is still strong in electricity, particularly in power generation.
A Social Cost: No Democratization of Capital Ownership
Macedo (2000) points out that some groups in Brazilian society wereexcluded from the privatization auctions and therefore from the oppor-tunities to gain from them. As a rule, the privatization program did notresort to public offers to any significant degree. Moreover, some publicsector liabilities could have been exchanged for shares of the SOEs beingprivatized. Among these liabilities are the unfunded ones of the presentand future pensioners of the social security system and the deposits thatformal workers hold in their accounts of the Workers’ Tenure Guaran-tee Fund. This fund, known as FGTS (Fundo de Garantia de Tempo deServiço), accumulates on a monthly basis a percentage of wages andsalaries, to be used in case of termination or dismissal of the workers.Macedo’s conclusion was that because of this discrimination, the privati-zation process failed in one of its stated objectives: democratizing capital
COSTS AND BENEFITS OF PRIVATIZATION: EVIDENCE FROM BRAZIL 167

ownership in Brazil. Only recently were workers allowed to use theirFGTS deposits in successful public offers for a block of Petrobrás sharesand another block of remaining state-owned shares of the Vale do RioDoce mining company.
Effects on the Development of Capital Markets
A goal of the program was to maximize the revenue from sales. Many ofthe former SOEs were structured as public companies and therefore sub-ject to laws governing the stock market. Before 1996 minority investorsin Brazil were protected with features such as “tag-along” (giving mi-nority investors the right to sell their shares at the same price as the man-aging block in case of change in control) and oppressed minority rights(having their shares bought back at book value in cases of restructuring,such as mergers or divestitures). Because some companies had to be re-structured for privatization (for instance, Telebrás, the state holdingcompany for telecommunications, was split into 12 different firms),there was a fear that lawsuits from minority shareholders might hamperthe privatization process or reduce the revenues from auctions, or both.This concern led the government to reform the legislation in such a waythat the amendments to the corporate law revoked the tag-along and theoppressed minority rights clauses. To mitigate the impact, the legislationentitled nonvoting shares to an additional 10 percent in dividends overthose paid to voting shares. In any case, as the postprivatization experi-ence has shown, without the protective clauses, minority shareholdershave in several cases been victims of controlling groups’ opportunisticbehavior.
At the end of the 1990s, influential works such as those of La Portaand others (1997), Levine (1997), and Levine and Zervos (1998) helpedto confirm the view that the development of capital markets is importantto promote economic growth, and that protecting minority investors’rights is the best way to promote capital markets. In 2000 and 2001 theBrazilian Congress discussed a bill to increase minority shareholders’rights, including restoring the tag-along and oppressed minority rights.Unfortunately, the new law that emerged establishes tag-along for only80 percent of the minority shares, and the new oppressed minority rightshave been extensively criticized as inadequate. Thus, the adverse effect ofprivatization on stock markets is likely to last.
A Macroeconomic Cost: No Effective Debt Reduction andDelayed Devaluation
Macedo (2000) also claims that privatization had a macroeconomic costbecause the generated revenues to the government budget, and to the ex-ternal accounts through foreign direct investment, delayed a genuine fiscal
168 ANUATTI-NETO, BAROSSI-FILHO, CARVALHO, AND MACEDO
adjustment and the necessary devaluation of the real. It is important to un-derstand the details of this argument because it warns of the risks of mis-using privatization resources in conditions of fiscal and external imbal-ances and in the presence of soft budget constraints.
Privatization was intended to help the fiscal crisis and the external im-balance, but this intended benefit was lost because in its first term(1995–98), the administration of Fernando Henrique Cardoso increasedthe fiscal deficit. Moreover, the new currency, the real, had clearly be-come overvalued immediately after its release in 1994. With its politicalcapital linked to price stabilization, the government opted for defendingthe real, afraid of the impact of devaluation on prices. Very high interestrates were the main policy instrument. These developments had the ef-fect of seriously aggravating the budget deficit and debt, the payment ofdebt interest, and the external imbalance. Thus, public debt increasedfrom 29.2 percent of gross domestic product (GDP) in 1994 to 52.5 per-cent in 2001; debt interest grew from 5.8 percent of GDP in 1996 to 11.8percent in 2001; and the current account deficit went from less than 0.5percent of GDP in 1994 to around 4 percent in 1997 and has remainedat that level.17
Thus, the privatization program did not accomplish the objective ofreducing public debt. On the contrary, public expenses increased, morethan offsetting the inflow of resources from the privatization auctions.18
Macedo (2000) also argues that privatization allowed the financing ofhigher current account deficits, particularly in 1997 and 1998 when theprivatization program peaked and attracted substantial foreign invest-ment. Although this inflow is usually considered a positive consequenceof the process, it also contributed to the postponement of a badly neededdevaluation of the Brazilian currency.19
Privatization as a Tool for Imposing Fiscal Discipline: The Case of the States
The fiscal policies of Brazilian states also contributed to the ballooning fis-cal deficits and debt from 1994 to 1997. Tight public-sector budgets as awhole came only after 1998, when the size of the debt started to cause dis-comfort in the financial markets, and the external imbalance continued todeteriorate. The federal government then started to generate huge primarysurpluses and was also increasingly able to impose fiscal discipline on thestates. Privatization of the states’ assets played an important role in thisprocess. The states had their debt transferred to the federal government,to which they became indebted themselves, but at more favorable interestrates. To obtain this benefit, the states had to make commitments to re-strain further indebtedness on their part and also to privatize. Thus, thefederal government was able to impose a tight fiscal constraint on thestates that it had not adopted itself.
COSTS AND BENEFITS OF PRIVATIZATION: EVIDENCE FROM BRAZIL 169

Public Opinion
Privatization has not been popular in Brazil. A 2001 Latinbarómeteropublic opinion survey conducted in 16 Latin American countries reportedthat 53 percent of the respondents in Brazil believed that privatization hadnot been beneficial to the country (Lora and Panizza 2002). Nonetheless,Brazilian public opinion about privatization was found to be more favor-able than that of its neighbors: on average 63 percent of the respondentsin all the surveyed countries believed that privatization had not been ben-eficial to their nations. The countries in which the public appeared to beless discontented with privatization were Chile (47 percent expressed dis-satisfaction) and Venezuela (46 percent). For all the other countries, ap-proval ratings were lower than in Brazil.20
Several factors contributed to the unpopularity. In most cases the av-erage citizen is not able to identify fully the benefits of privatization suchas those analyzed in this chapter. The creation of nonbanking SOEs inBrazil, such as steel and mining, followed the Second World War, whenthe main motivation was the belief that the state had to play a major rolein “strategic” industries, the products of which tend to be remote fromthe pressing concerns of the population. Thus, one cannot expect the pub-lic to be concerned with the outcome of privatization in these industriesor to be inclined to evaluate its technicalities.
The total privatization of the telecommunications industry and thepartial privatization of the electricity SOEs produced mixed outcomesfor consumers. Both were followed by higher rates, which have blurredthe favorable impact of a major expansion of telecommunications serv-ices. In electricity, a further negative impact emerged in 2001, when thecountry had to face rationing due to the low levels of the reservoirs ofthe hydroelectric plants, which constitute the basis of power generationin the country. Opponents of privatization were eager to blame it for thecrisis.
It is also important to highlight that privatization coincided with slug-gish growth, particularly after the program peaked in 1997–98. Therefore,dissatisfaction with lower economic gains or even losses, such as thoseemerging from the higher rates of unemployment, are likely to have de-veloped into criticisms of government policies in general and privatizationin particular.
Moreover, as already pointed out, the government failed in its objectiveof using the program to democratize capital ownership. Only recently hasit resorted to successful public offerings in which workers were entitled toparticipate by using their FGTS deposits. Thus, as a rule the common cit-izen was left out of the process and its benefits in the form of rewards tothe controllers and shareholders.
170 ANUATTI-NETO, BAROSSI-FILHO, CARVALHO, AND MACEDO

Opposition to the program also resulted from its unfavorable treat-ment in the media, court battles to impede the auctions, attempts todisrupt the auctions themselves, sometimes followed by police inter-vention, and so forth. The news coverage of the privatization of thetelecommunications industry was particularly negative, as there wereaccusations that some government authorities had been involved inarm-twisting to attract and assemble groups to participate in the auc-tions. Recorded tapes of conversations held by government authoritiesamong themselves and with interested parties reached the press. Eventhough the legal battles were decided in favor of privatization, the up-roar was serious enough to cause the minister of communications to re-sign in November 1998.
News of this sort has inevitably aroused suspicions that the process hasbeen tainted by wrongdoings. Lora and Panizza (2002) found that oppo-sition to privatization, again measured by the percentage of those who donot consider it beneficial, was lower in Brazil than in its neighbors. Gen-erally approval ratings are higher in those countries with extensive priva-tization and limited corruption. In this respect, Brazil ranks second only toChile in an evaluation involving the above-mentioned group of 16 coun-tries. In any case, although privatization is faring better in relative terms,clearly it is not popular in the country, a finding that is not surprisinggiven the reasons discussed here.
Although the privatization program has not been popular in general, adifferent picture emerges from a study by Lamounier and De Souza(2002), which focused only on the opinion of a group called the “Brazil-ian elites,” composed of 500 businessmen (including leaders of associationsof small and medium firms), union leaders, congressmen, high-rankingmembers of the executive and judiciary branches of government, journal-ists, religious leaders, directors of nongovernmental organizations, andintellectuals. On average, 62 percent responded that they approved ortended to approve of privatization. The rates ranged between 87 percentfor members of the executive branch of government to 13 percent forunion leaders, whose rate was the only one below 45 percent. Anotherquestion was directed at the performance of the companies after privati-zation. In this case, the approval rate (percentage of good or above)showed large variations by industries.21
Perspectives
The overall unpopularity and its causes are among the reasons for theprivatization program’s having come to a virtual standstill since 1998.According to BNDES, the proceeds from the auctions, including new
COSTS AND BENEFITS OF PRIVATIZATION: EVIDENCE FROM BRAZIL 171

concessions of public services, fell from $26.3 billion in 1997 and $35.7billion in 1998 to $4.2 billion in 1999, $10.2 billion in 2000 (this figureincludes the privatization of a state bank, Banespa, which totaled $3.6billion and had been in the pipeline for a long time), $2.8 billion in 2001,and $2.2 billion in 2002.22
Other factors also explain the current status of the program. First, mov-ing ahead would mean including those SOEs that have stronger politicalpatronage than those privatized thus far. For example, on the list of re-maining SOEs is the almost two-century-old Banco do Brasil, a commer-cial bank of which the federal government is the controlling shareholder.It holds the government’s accounts and is the key player in providing agri-cultural credit, which is subsidized by the federal budget. As a result, it hasbuilt a major constituency, as private banks have refrained from beingmore active in agricultural credit. Its staff, traditionally selected by publicexaminations, is a breeding ground for government officers. Some of themhave reached the ministerial level or have become members of Congressand are very influential. Moreover, the bank is not wholly state-owned butalso has private shareholders who act as a group to maintain its currentstatus.
Another example is the giant oil company Petrobrás. The companywas established in 1954, following a strong nationalist stance againstforeign oil companies. Petrobrás proved effective in finding oil in Brazil.It moved into offshore drilling in the 1980s and has set worldwiderecords in deep-water exploitation. Domestic production that currentlyaccounts for 90 percent of the country’s needs is seen as a sign of suc-cess. It had a monopoly in prospecting, production, and importing inthe upstream market until 1995. Since then, it continues to have a vir-tual monopoly in these activities, as well as in refining. Because oil is as-sociated with national security issues, the military sees continuing gov-ernment control of Petrobrás as crucial. Moreover, the company alsohas private shareholders who support its current and very profitablestatus.
In the electricity industry, the privatization process occurred mainly inthe distribution sector. A few important companies in this sector were keptby state governments unwilling to move in the direction of privatization.With respect to the generation segment, the state of São Paulo privatizeda large part of its assets. At the federal level, only one subsidiary of a fed-eral holding company, Eletrobrás, was privatized. The three remainingsubsidiaries control around 60 percent of the country’s generation. Afterthe 2001 drought, which led to rationing, the process of sector restruc-turing stalled. The rationing stimulated industry and households to adoptenergy-saving measures, and in the aftermath demand has not recoveredits previous levels. Both rationing and demand reduction brought losses tothe industry, exacerbating the dollar indebtedness of some privatized com-panies since 1999. With distribution and generation companies currently
172 ANUATTI-NETO, BAROSSI-FILHO, CARVALHO, AND MACEDO

suffering huge losses, the federal government, which regulates the entireindustry, is preparing a new sector arrangement. At the same time, BNDEShas to find a way to manage huge debts by companies on the verge ofdefault. Thus, it is an industry in disarray, not attractive to private in-vestors, and in need of reorganization before any discussion of a newround of privatizations.
Despite these shortcomings, there are no plans to reverse the privatiza-tion that has occurred in Brazil, either at the moment or in the foreseeablefuture. The new federal government, inaugurated in 2003, is for the firsttime led by the Worker’s Party, which won the presidential election as anopposition party. It fought privatization in Congress and in the courts inthe 1990s, but since taking power it has adopted conservative fiscal andmonetary policies and avoided condemning privatization. In this context,there is no room for privatization reversal, nor has the government evenbeen suggesting it in discourse. Apparently, the government is likely tokeep the program stalled, that is, no privatization reversal but no furtheradvances.
Even in light of these new political developments, the possibility of re-suming the privatization effort should not be ignored: a serious fiscalproblem remains in the form of large and difficult-to-manage publicdeficits and debt. They have been kept under control at the cost of hugeincreases in the tax burden, which moved from 25.7 percent of GDP in1993 to a record level of 35.9 percent in 2002, an exceptionally high ratefor a developing country.23 Under such conditions, a new start of the pri-vatization program could help to alleviate the fiscal accounts. Moreover,since the new government has been willing to reconsider many of the cher-ished dogmas it subscribed to when in opposition, there is a chance thateven its current stance against new privatization efforts might be recon-sidered as well. Thus, to give new life to privatization, it is important tocontinue monitoring the process and publicizing the results of the programand the inefficiencies of the remaining SOEs. In addition, the objective ofdemocratizing capital ownership by means of public offers should bebrought to the front line, both for its own merits and to attract wider po-litical support, in particular by making privatization more appealing toPresident Lula da Silva’s government.
Summary and Conclusions
This chapter has focused mainly on the changes in the performance ofcompanies that have been privatized in Brazil since 1991. It confirmed pre-vious findings that the firms became more efficient after privatization. Ithas contributed to the literature, first by bringing to a wider audience stud-ies available only in Brazil and in Portuguese. It is also more up-to-datethan previous studies, since it covers data up until 2000. In terms of the
COSTS AND BENEFITS OF PRIVATIZATION: EVIDENCE FROM BRAZIL 173

companies covered, it is the most comprehensive study thus far. In thesample, a selection bias was avoided by including both large and smallfirms, as well as those listed and unlisted on the stock exchange. All com-panies for which information was available have been included in theanalysis. In addition to tests of means and medians, the research also re-sorted to panel data analysis in an attempt to utilize fully the informationprovided by the data. Moreover, the analysis of performance before andafter privatization was also compared with that of the private sector, takenas a control group over time. Finally, this study was undertaken by an in-dependent team, whereas most of the previous ones were done by staffmembers of BNDES.
In addition to the findings of improved efficiency, the chapter has iden-tified some sources of gains made by privatized firms in the form of re-duced direct employment and increased prices. The chapter has alsoshown costs in the sense that the benefits of privatization could have beenhigher had the government not used the revenues to sustain its misguidedpolicy of enlarging fiscal deficits and adopting high interest rates to defendthe real. Moreover, foreign investment attracted by privatization and thehigh interest rates also contributed to the postponement of devaluation. Inany case, what is to blame are the fiscal, interest rate, and exchange ratepolicies, not privatization itself.
The benefits could also have been greater had the government not neg-lected the opportunity privatization offered for democratizing capitalownership. In the capital markets, privatization also brought costs in theform of reducing the rights of minority shareholders, thereby hamperingthe development of these markets.
The study has also shown that although there is evidence that a ma-jority of the Brazilian elite approve of privatization, the majority of thegeneral population does not view privatization as beneficial, as revealedby public opinion surveys. After pointing out some of the reasons behindthis unpopularity and looking at the current status of the program, thechapter concludes that the door to new privatization efforts remainsopen. One suggestion is to give the program popular appeal in the formof public offers in which workers would be entitled to participate withtheir own financial assets, including the deposits they hold in the FGTS.
With respect to future research, it is particularly necessary to furtherclarify costs, to look at the impact of privatization at the industry level,and to examine the role of the regulatory agencies that have emerged inthe wake of the state’s backing away from its role as an entrepreneur.
To conclude, we return to Megginson and Netter (2001), quoted at thestart of this chapter. The Brazilian privatization program is indeed likelyto remain influential because of its scale and the size of the country. Wehope that privatization will continue to have an impact because of the suc-cesses and benefits of the program, not for the mistakes that have beenmade.
174 ANUATTI-NETO, BAROSSI-FILHO, CARVALHO, AND MACEDO

175
Table 4A.1 Federal State Enterprises Privatized, 1991–2000
ListedDate of Auction result Included in before
Auction Company name auction (US$ million)a sampleb privatizationb
USIMINAS Usinas Siderúrgicas de Minas Gerais 10/24/91 2,310 1 1(Usiminas)
Usiminas Mecânica (Usimec)c 0 0CELMA Cia. Eletromecânica 11/01/91 96 0 0MAFERSA Mafersa S.A. 11/11/91 50 0 0COSINOR Cia. Siderúrgica do Nordeste 11/14/91 15 0 0
(Cosinor)Cosinor Distribuidora (Cosinor Dist.)c 0 0
SNBP Serviço de Navegação da Bacia do 1/14/92 12 0 0Prata
INDAG Indag Fertilizantes 1/23/92 7 0 0AFP Aços Finos Piratini 2/14/92 109 1 0PETROFLEX Petroflex Indústria e Comércio S.A. 4/10/92 255 1 1COPESUL Cia. Petroquímica do Sul 5/15/92 871 1 1CAN Cia. Nacional de Álcalis 7/15/92 87 0 0
Álcalis Rio Grande do Norte 0 0(Alcanorte)c
CST Cia. Siderúrgica de Tubarão 7/16/92 to 837 1 17/23/92
NITRIFLEX Nitriflex 8/6/92 35 1 0FOSFÉRTIL Fertilizantes Fosfatados S.A. 8/12/92 226 1 1
(Table continues on the following page.)
Appendix 4A

176
POLISUL Polisul 9/11/92 188 0 0PPH PPH 9/29/92 94 0 0GOIASFÉRTIL Goiás Fertilizantes S.A. 10/8/92 22 0 0ACESITA Cia. Aços Especiais Itabira 10/23/92 697 1 1
Acesita Energética (Energética)c 0 0Forjas Acesita (Fasa)c 0 0
CBE Cia Brasileira de Estireno 12/3/92 11 1 0Poliolefinasc 3/19/93 87 0 0
CSN Cia. Siderúrgica Nacional 4/2/93 2,028 1 1Fábrica de Estruturas Metálicas S.A.c 0 0
ULTRAFÉRTIL Ultrafértil S.A. Indústria e Comércio 6/24/93 226 1 0de Fertilizantes
COSIPA Cia. Siderúrgica Paulista 8/20/93 1,470 1 1AÇOMINAS Aço Minas Gerais S.A. 9/10/93 721 1 0OXITENO Oxiteno 9/15/93 56 1 1PQU Petroquímica União S.A. 1/25/94 328 1 1ARAFERTIL Arafértil Fertilizantes – ARAFÉRTIL 4/15/94 13 0 0CARAÍBA Mineração Caraíba LTDA 7/28/94 6 1 0ACRINOR Acrinor 8/12/94 13 0 0COPERBO Coperbo 8/16/94 32 0 0CIQUINE Ciquine 8/17/94 30 1 1POLIALDEN Polialden 8/17/94 19 1 1
Table 4A.1 (continued)
ListedDate of Auction result Included in before
Auction Company name auction (US$ million)a sampleb privatizationb

177
POLITERO Politeno 8/18/94 73 1 1EMBRAER Empresa Brasileira de Aeronáutica 12/7/94 455 1 1
(Embraer)Embraer Aircraft Corporation (EAC)c 0 0Embraer Aviation International (EAI)c 0 0Indústria Aeronáutica Neiva (Neiva)c 0 0
ESCELSA Espírito Santo Centrais Elétricas S.A. 7/11/95 522 1 1COPENE Cia. Petroquímica do Nordeste 8/15/95 745 1 1CPC CPC 9/29/95 161 0 0CQR CQR 10/5/95 2 1 0SALGEMA SALGEMA 10/5/95 183 0 0NITROCARBONO Nitrocarbono 12/5/95 37 1 1PRONOR Pronor 12/5/95 99 1 1POLIPROPILENO Polipropileno 2/1/96 86 1 1KOPPOL Koppol 2/1/96 70 0 0LIGHT Light Serviços de Eletricidade S.A. 5/21/96 3,094 1 1DETEN Deten 5/22/96 12 1 0POLIBRASIL Polibrasilc 8/27/96 111 0 0EDN Estireno do Nordeste- EDN 9/26/96 16 1 1CVRD Cia. Vale do Rio Doce 5/6/97 6,858 1 1CODESP Terminal de Contêiners Tecon 1 9/17/97 251 0 0
(Codesp)CDRJ CDRJ – Porto de Angra do Reis 11/5/98 8 0 0CDRJ CDRJ-Terminal de Conteineres 1 – 9/3/98 79 0 0
Porto de SepetibaCDRJ CDRJ-Terminal Roll-on Roll-off do 11/3/98 26 0 0
Porto do Rio(Table continues on the following page.)

178
CDES Cia. Docas do Espírito Santo- Casi 5/6/98 26 0 0de Capuaba
CDES Cia. Docas do Espírito Santo –Casi 5/13/98 9 0 0de Paul
CODEBA Cia. Docas da Bahia 12/21/99 21 0 0RFF Rede Ferroviária Federal S.A. 7/18/97 15 0 0
(Nordeste)RFF Rede Ferroviária Federal S.A. (Oeste) 3/5/96 63 0 0RFF Rede Ferroviária Federal S.A. (SP) 11/10/98 206 1 0RFF Rede Ferroviária Federal S.A. (Sudeste) 9/20/96 870 1 0RFF Rede Ferroviária Federal S.A. (Sul) 12/13/96 209 0 0RFF Rede Ferroviária Federal S.A. 11/22/96 18 0 0
(Tereza Crisitina)RFF Rede Ferroviária Federal S.A. 6/14/96 316 0 0
(Centro-Leste)MERIDIONAL Banco Meridional do Brasil S.A. 12/4/97 240 0 0EMBRATEL Embratel 7/29/98 2,276 1 1TELESP Telesp Operacional, Borda do Campo 7/29/98 4,967 2 1CENTRO Telepar, Telebrasília, Telegoiás, and 7/29/98 1,778 3 3SUL other four closed companies: CTMR,
Telemat, Teleron, Teleacre
Table 4A.1 (continued)
ListedDate of Auction result Included in before
Auction Company name auction (US$ million)a sampleb privatizationb

179
NORTE LESTE Telerj, Telebahia, Telemig, Telpe, 7/29/98 2,949 16 8Telma, Telest, Teleceará, Teleamazon,and other nine closed companies
Aggregate transferred debt of these 2,125companies
Telecom offers to employees 293TELESP CEL. Telesp Celular 7/29/98 3,082 1 0SUDESTE CEL. 7/29/98 1,168 1 0TELEMIG CEL. 7/29/98 649 1 0CELULAR SUL 7/29/98 601 4 0NORDESTE CEL. 7/29/98 567 7 0LESTE CEL. 7/29/98 368 2 0CENT. OESTE CEL. Telegoiás Celular and other five closed 7/29/98 378 3 1
companiesTELE NORTE C 7/29/98 161 2 0GERASUL Centrais Geradoras do Sul do Brasil 9/15/98 1,962 1 0
S.A.GUARARAPES GUARARAPES 12/7/98 0.1 1 1DATAMEC Datamec S.A. 6/23/99 49 0 0BANESPA Banco do Estado de São Paulo 11/20/00 3,604 0 0Petrobrás Petrobrásd 8/9/00 4,032 1 1Total 56,841.20 75 38
a. Includes transferred debt; values are current U.S. dollars.b. These two columns show the number of companies included in the sample and the number of representative companies with shares traded at
BOVESPA, respectively.c. Sold with mother company.d. Minority shares privatization in remaining state-owned enterprise.Source: BNDES.

180 Table 4A.2 Companies Privatized by BNDES on Behalf of Brazilian States, Minority Shares Privatized byFederal Government, and São Paulo State Privatization Program
Date of Auction result Included in Listed before Company name auction (US$ million)a sample privatization
Banco Banerj S.A. – BANERJ 6/26/97 289 0 0Banco de Crédito de Minas Gerais S.A – Credireal 8/7/97 112 0 0Banco do Estado da Bahia – BANEB 7/22/99 147 0 0Banco do Estado de Minas Gerais – BEMGE 9/14/98 494 0 0Banco do Estado de Pernambuco S.A. 11/17/98 153 0 0Banco do Estado de Santa Catarina – BESC 9/30/97 28 0 0Centrais Elétricas Cachoeira Dourada 9/5/97 854 1 1Centrais Elétricas do Pará S.A. – CELPA 7/9/98 504 0 0CELPE 2000 1,135 1 1Centrais Elétricas Matogrossenses S.A. – CEMAT 11/27/97 814 1 1CESP Paranapanema 7/28/99 1,164 1 1CESP TIETÊ 11/1/99 1,140 1 1Cia de Gás de São Paulo – COMGÁS 4/14/99 1,076 1 1Cia União de Seguros Gerais 11/20/97 45 0 0Cia. Centro Oeste de Dist. de Energia Elétrica – (AES-SUL) 10/21/97 1,436 1 1Cia. De Eletricidade de Minas Gerais – CEMIGb 5/28/97 1,053 1 1Cia. De Eletricidade do Estado da Bahia – COELBA 7/31/97 1,965 1 1Cia. De Eletricidade do Rio de Janeiro – CERJ 11/20/96 951 1 1Cia. De Navegação do Rio de Janeiro – CONERJ 2/5/98 29 0 0Cia. De Saneamento Básico de São Paulo – SABESPb 7/31/97 375 1 1Cia. De Saneamento Básico do Paraná – SANEPARb 6/8/98 217 1 1Cia. Energética de Brasília – CEBb 4/30/97 74 1 1

181
Cia. Energética do Ceará – COELCE 4/2/98 1,338 1 1Cia. Estadual de Gás do Rio de Janeiro – CEG 7/14/97 430 1 0Cia. Fluminense de Trens Urbanos 7/15/98 240 0 0Cia. Metropolitano do Rio de Janeirob 12/19/97 262 0 0Cia. N. NE de Dist. de Energia Elétrica – CEEE – (RGE) 10/21/97 1,635 1 1Cia. Paranaense de Energia – COPELb 9/20/96 413 1 1Cia. Paulista de Força e Luz – CPFL 11/5/97 2,833 1 1Cia. Riograndense de Telecomunicações – CRT 6/19/98 2,496 1 1COSERN 12/12/97 718 1 0EBE – BANDEIRANTE DE ENERGIA 9/17/98 1,235 1 0Elektro Eletricidade e Serviços S.A. – ELEKTRO 7/16/98 1,917 1 0Eletricidade de São Paulo S.A. – Metropolitana 4/15/98 3,445 1 0Empresa Energética de Mato Grosso do Sul – ENERSUL 11/19/97 783.0 1 0Empresa Energética de Sergipe – ENERGIPE 12/3/97 560 0 0Estrada de Ferro Paraná Oeste S.A. – Ferroeste 12/10/96 25 0 0Riogás S.A. 7/14/97 146 0 0Terminal Garagem Menezes Côrtes 10/28/98 67 0 0Total 32,598 24 18
Note: BNDES � National Social and Economic Development Bank.a. Includes transferred debt; values are current U.S. dollars.b. Minority shares in remaining state-owned enterprises.Source: BNDES.

182 ANUATTI-NETO, BAROSSI-FILHO, CARVALHO, AND MACEDO
Table 4A.3 Remaining State-Owned Enterprises
Productive sectorsEletrobrás group (Electricity)• Centrais Elétricas Brasileiras S.A. – ELETROBRÁS
Boa Vista Energia S.A. – BOVESACentrais Elétricas de Rondônia S.A. – CERONCentrais Elétricas do Norte do Brasil S.A. – ELETRONORTECentro de Pesquisas de Energia Elétrica – CEPELCompanhia de Eletricidade do Acre – ELETROACRECompanhia de Geração Térmica de Energia Elétrica – CGTEECompanhia Energética de Alagoas – CEALCompanhia Energética do Amazonas – CEAMCompanhia Energética do Piauí – CEPISACompanhia Hidro Elétrica do São Francisco – CHESFEletrobrás Termonuclear S.A. – ELETRONUCLEAREmpresa Transmissora de Energia Elétrica do Sul do Brasil S.A. –
ELETROSULFURNAS Centrais Elétricas S.A.LIGHTPAR – Light Participações S.A.Manaus Energia S.A. – MANAUS ENERGIA
Petrobrás group (Oil)• Petróleo Brasileiro S.A. – PETROBRÁS
Braspetro Oil Services Company – BRASOILPetrobrás Distribuidora S.A. – BRPetrobrás Gás S.A. – GASPETROPetrobrás Internacional S.A. – BRASPETROPetrobras International Finance Company – PIFCOPetrobrás Química S.A. – PETROQUISATransportadora Brasileira Gasoduto Bolívia-Brasil S.A. – TBGIndústria Carboquímica Catarinense S.A. – ICC (Em Liquidação)Petrobrás Transporte S.A. – TRANSPETROFronape International Company – FIC
PortsCompanhia Docas do Ceará – CDCCompanhia Docas do Espírito Santo – CODESACompanhia das Docas do Estado da Bahia – CODEBACompanhia Docas do Estado de São Paulo – CODESPCompanhia Docas do Maranhão – CODOMARCompanhia Docas do Pará – CDPCompanhia Docas do Rio de Janeiro – CDRJCompanhia Docas do Rio Grande do Norte – CODERNTransportationRede Ferroviária Federal S.A. – RFFSA (In process of liquidation)Rede Federal de Armazéns Gerais Ferroviários S.A. – AGEF (In process of
liquidation)

COSTS AND BENEFITS OF PRIVATIZATION: EVIDENCE FROM BRAZIL 183
Table 4A.3 (continued)
OtherBB-Administradora de Cartões de Crédito S.A. – BB-CARBB-Corretora de Seguros e Administradora de Bens S.A. – BB-CORBB-TUR Viagens e Turismo Ltda.BEM Serviços Gerais Ltda. – BEM SG
BEM Vigilância e Transporte de Valores S.A. – BEM VTVCasa da Moeda do Brasil – CMBCentrais de Abastecimento de Minas Gerais S.A. – CEASA/MGCompanhia de Armazéns e Silos do Estado de Minas Gerais – CASEMGCompanhia de Entrepostos e Armazéns Gerais de São Paulo – CEAGESPCOBRA – Computadores e Sistemas Brasileiros S.A.Empresa Brasileira de Correios e Telégrafos – ECTEmpresa Brasileira de Infra-Estrutura Aeroportuária – INFRAEROEmpresa de Processamento de Dados da Prev. Social – DATAPREVEmpresa Gerencial de Projetos Navais – EMGEPRONHospital Cristo Redentor S.A. – REDENTORHospital Fêmina S.A. – FÊMINAHospital Nossa Senhora da Conceição S.A. – CONCEIÇÃOIndústria de Material Bélico do Brasil – IMBELSistema de Processamento de Dados, Planej. e Adm. de Cartões de Crédito
Ltda. – SISPLANTelecomunicações Brasileiras S.A. – TELEBRÁS
Financial sector• Banco do Brasil S.A. – BB
BB-Banco de Investimento S.A. – BB-BIBB-Distribuidora de Títulos e Valores Mobiliários S.A. – BB-DTVMBB-Financeira S.A., Crédito, Financ. e Investimento – BB-FINBB-Leasing Company Ltd. – BB-LEASING BB-Leasing S.A. Arrendamento Mercantil – BB-LAMBrasilian American Merchant Bank – BAMB
• Banco Nacional de Desenvolvimento Econômico e Social – BNDESAgência Especial de Financiamento Industrial – FINAMEBNDES Participações S.A. – BNDESPAR
• Banco do Estado de Goiás S.A. – BEGBEG Distribuidora de Títulos e Valores Mobiliários S.A. – BEG DTVM
• Banco do Estado de Santa Catarina S.A. – BESCBESC Distribuidora de Títulos e Valores Mobiliários S.A. – BESCVALBESC Financeira S.A. Crédito, Financiamento e Investimento –
BESCREDIBESC S.A. Arrendamento Mercantil – BESC LEASING
• Banco do Estado do Ceará S.A. – BECBEC Distribuidora de Títulos e Valores Mobiliários S.A. – BEC DTVM
(Table continues on the following page.)

184 ANUATTI-NETO, BAROSSI-FILHO, CARVALHO, AND MACEDO
• Banco do Estado do Maranhão S.A. – BEMBEM Distribuidora de Títulos e Valores Mobiliários Ltda. – BEM DTVM
Banco da Amazônia S.A. – BASABanco do Estado do Amazonas S.A. – BEABanco do Estado do Piauí S.A. – BEPBanco do Nordeste do Brasil S.A. – BNBCaixa Econômica Federal – CEFIRB-Brasil Resseguros S.A. – IRB-BRASIL REFinanciadora de Estudos e Projetos – FINEP
Enterprises included in the fiscal budgetCompanhia Brasileira de Trens Urbanos – CBTUCompanhia de Desenvolvimento de Barcarena – CODEBARCompanhia de Desenvolvimento dos Vales do São Francisco e do Parnaíba –
CODEVASFCompanhia de Navegação do São Francisco – FRANAVECompanhia de Pesquisa de Recursos Minerais – CPRMCompanhia Nacional de Abastecimento – CONABEmpresa Brasileira de Comunicação S.A. – RADIOBRÁSEmpresa Brasileira de Pesquisa Agropecuária – EMBRAPAEmpresa Brasileira de Planejamento de Transportes – GEIPOTEmpresa de Trens Urbanos de Porto Alegre S.A. – TRENSURBHospital de Clínicas de Porto Alegre – HCPAIndústrias Nucleares do Brasil S.A. – INBNuclebrás Equipamentos Pesados S.A. – NUCLEPServiço Federal de Processamento de Dados – SERPROVALEC - Engenharia, Construções e Ferrovias S.A.
OtherCentrais de Abastecimento do Amazonas S.A. – CEASA/AMPetrobrás America Inc. – AMERICAPetrobrás U.K. Limited – BUK
Source: Ministry of Planning, Budget and Administration, Department ofCoordination and Control of State Enterprises, Executive Secretary.
Table 4A.3 (continued)
Table 4B.1 Description of the Variables
Variable Definition
ProfitabilityOperating
income/sales(OI/S)
Ratio of operating income to sales. Operatingincome is equal to sales minus operatingexpenses, cost of sales, and depreciation. Salesare equal to total value of products and servicessold minus sales returns and discounts.
Appendix 4B

COSTS AND BENEFITS OF PRIVATIZATION: EVIDENCE FROM BRAZIL 185
Table 4B.1 (continued)
Variable Definition
Operating income/property, plantand equipment(OI/PPE)
Net income/sales(NI/S)
Return on assets(ROA)
Return on equity(ROE)
Operating efficiencyLog(sales/PPE)
Operatingcosts/sales (OC/S)
AssetsLog(PPE)
Investment/sales(I/S)
Investment/PPE(I/PPE)
OutputLog(sales)
Ratio of operating income to property, plant, andequipment, which is the value of a company’sfixed assets adjusted for inflation. Operatingincome is equal to sales minus operatingexpenses, cost of sales, and depreciation.
Ratio of net income to sales. Net income is equalto operating income minus interest expensesand net taxes paid. Sales are equal to totalvalue of products and services sold minus salesreturns and discounts.
Ratio of operating income, which is equal tosales operating expenses, cost of sales, anddepreciation minus interest expenses and nettaxes paid, to total assets.
Ratio of operating income, which is equal tosales minus operating expenses, cost of sales,and depreciation minus interest expenses andnet taxes paid, to equity.
Log of the ratio of total value of products andservices sold minus sales returns and discountsto property, plant, and equipment, which is thevalue of a company’s fixed assets adjusted forinflation.
Ratio of operating expenses to sales, defined asthe total value of products and services soldminus sales returns and discounts.
Log of property, plant, and equipment, which isthe value of a company’s fixed assets adjustedfor inflation.
Ratio of investment to sales, defined as the totalvalue of products and services sold minus salesreturns and discounts. Investment is calculatedas the difference of property, plant, andequipment along time.
Ratio of investment to property, plant, andequipment, which is the value of a company’sfixed assets adjusted for inflation.
Log of sales, the total value of products andservices sold minus sales returns and discounts.
(Table continues on the following page.)

186 ANUATTI-NETO, BAROSSI-FILHO, CARVALHO, AND MACEDO
Table 4B.1 (continued)
Variable Definition
ShareholdersPayout ratio
FinanceCurrentLong-term
debt/equity(LTD/E)
Net taxesNet taxes/sales
(NT/S)
Ratio of total dividends to operating incomeminus interest expenses and net taxes paid.
Ratio of current assets to current liabilities.Ratio of long-term debt to equity
Ratio of net taxes to sales. Net taxes are equal tocorporate income taxes paid net of directsubsidies or tax credits received during thefiscal year.
Source: Authors’ calculations.
Table 4C.1 Change in Performance: Tests of Means and Medians(Two Years before Privatization versus Two Years after, withoutAdjustment)
Mean and Mean andmedian median
Variable N before after Z-test
ProfitabilityOperating income/sales 66 0.037 0.042 0.536
0.072 0.108 0.523Operating income/PPE 67 0.092 0.141 3.556***
0.035 0.107 3.566***Net income/sales 66 0.000 �0.008 �0.595
0.034 0.039 0.677Return on assets 70 �0.860 0.008 0.291
0.014 0.011 �1.287Return on equity 70 �1.152 0.046 0.662
0.019 0.039 0.862
Appendix 4C

COSTS AND BENEFITS OF PRIVATIZATION: EVIDENCE FROM BRAZIL 187
Table 4C.1 (continued)
Mean and Mean andmedian median
Variable N before after Z-test
Operating efficiencyLog(sales/PPE) 63 �0.273 �0.006 5.520***
�0.201 0.009 5.492***Operating costs/sales 58 0.375 0.251 �2.631***
0.200 0.196 �2.917***
AssetsLog(PPE) 67 6.001 5.946 �1.981*
5.891 5.813 �1.983*Investment/sales 57 0.295 �0.032 �2.550**
0.158 0.093 �2.476**Investment/PPE 57 0.115 0.094 �1.202
0.101 0.104 0.202
OutputLog(sales) 66 5.644 5.876 4.335**
5.403 5.643 4.301**
ShareholdersPayout ratio 45 71.40 55.99 �0.089
30.78 48.66 0.166
FinanceCurrent 70 0.847 1.009 2.755***
0.745 0.866 3.089***Long-term debt/equity 63 0.636 0.701 2.506**
0.181 0.269 2.506**
Net taxesNet taxes/sales 65 0.024 �0.010 �3.834***
0.017 0.007 �3.343***
* Significant at the 10 percent level.** Significant at the 5 percent level. *** Significant at the 1 percent level. Note: N � number; PPE � property, plant, and equipment. The table presents,
for each empirical proxy, the number of usable observations and the mean andmedian values before and after privatization. The full sample contains 102 privatizedcompanies. Before privatization refers to the average of the two years before the sale;after privatization refers to the average of the two years following privatization. Wereport Z-statistics for signed rank tests and Wilcoxon rank sum tests for change inmean and median values, respectively. Definitions for each variable can be found inappendix table 4B.1.
Source: Authors’ calculations.

Table 4C.2 Change in Performance: Tests of Means and Medians(Two Years before Privatization versus Two Years after, withAdjustment)
Mean and Mean andmedian median Z-test
Variable N before after (1)
ProfitabilityOperating income/sales 66 0.097 �0.430 �2.944***
0.084 0.019 �2.944***Operating income/PPE 67 �0.092 0.141 3.556***
0.005 0.222 5.713***Net income/sales 66 �0.004 �0.105 �1.476
0.020 0.012 �1.534ROA 70 �0.870 �0.014 0.824
0.003 �0.012 �1.369ROE 70 �1.194 0.025 1.768*
�0.030 0.021 1.698*
Operating efficiencyLog(sales/PPE) 63 �0.548 �0.298 3.980**
�0.522 �0.218 3.876**Operating costs/sales 58 0.174 0.065 �1.837
0.014 0.021 �0.809
AssetsLog(PPE) 67 1.445 1.002 �1.286
0.955 0.871 �1.370Investment/sales 57 0.223 �0.058 �1.887**
0.117 0.066 �1.795*Investment/PPE 57 0.038 0.024 �0.774
0.026 0.039 0.264
OutputLog(sales) 66 0.774 0.901 3.306***
0.274 0.457 3.598***
ShareholdersPayout ratio 45 0.309 –0.263 �0.229
�28.62 –5.805 0.299
FinanceCurrent 70 �0.510 �0.250 3.238***
�0.605 �0.250 3.768**LTD/equity 63 0.254 0.108 �0.210
�0.142 �0.325 �0.021
188 ANUATTI-NETO, BAROSSI-FILHO, CARVALHO, AND MACEDO
(Table continues on the following page.)

Net taxesNet taxes/sales 65 0.018 �0.014 �3.578***
0.005 0.003 �3.575***
* Significant at the 10 percent level.** Significant at the 5 percent level.*** Significant at the 1 percent level. Note: N � number; PPE � property, plant, and equipment; ROA � return on
assets; ROE � return on equity; and LTD � long-term debt. The table presents, foreach empirical proxy, the number of usable observations and the mean and medianvalues before and after privatization, adjusted to take into account unstablemacroeconomic policies. See text for full explanation. The full sample contains 102privatized companies. Before privatization refers to the average of the two yearsbefore the sale; after privatization refers to the average of the two years followingprivatization. We report Z-statistics for signed rank tests and Wilcoxon rank sumtests for change in mean and median values, respectively. Definitions for each variablecan be found in appendix table 4B.1.
Source: Authors’ calculations.
COSTS AND BENEFITS OF PRIVATIZATION: EVIDENCE FROM BRAZIL 189
Table 4C.2 (continued)
Mean and Mean andmedian median Z-test
Variable N before after (1)
Table 4C.3 Change in Performance: Tests of Means and Medians(All Years before and after Privatization, without Adjustment)
Mean and Mean andmedian median Z-test
Variable N before after (1)
ProfitabilityOperating income/sales 71 �0.052 0.050 1.511
0.080 0.096 1.037Operating income/PPE 70 0.057 0.291 3.042***
0.045 0.097 3.408***Net income/sales 71 �0.067 �0.042 0.815
0.010 0.039 0.889ROA 73 �0.812 0.017 2.967***
0.003 0.026 2.311**ROE 73 �1.109 0.021 2.258**
0.008 0.038 2.150**
Operating efficiencyLog(sales/PPE) 64 �0.247 �0.076 5.600***
�0.285 0.012 5.244***
(Table continues on the following page.)

Table 4C.3 (continued)
Mean and Mean andmedian median Z-test
Variable N before after (1)
Operating costs/sales 64 0.428 0.245 �3.138***0.255 0.207 �2.756***
AssetsLog(PPE) 70 6.889 5.994 �1.141
5.911 5.809 �0.952Investment/sales 62 0.191 0.038 �1.406
0.202 0.113 �1.157Investment/PPE 62 �0.017 0.118 �1.288
0.085 0.098 0.168
OutputLog(sales) 71 5.823 6.004 2.032*
5.800 5.974 1.956*
ShareholdersPayout ratio 59 34.406 30.860 �0.138
38.848 42.268 1.232
FinanceCurrent 73 0.849 1.106 2.662***
0.843 0.905 2.642***LTD/equity 66 0.529 0.576 3.192***
0.167 0.298 3.302***
Net taxes Net taxes/sales 68 0.015 0.009 �3.821***
0.018 0.006 �4.296***
* Significant at the 10 percent level.** Significant at the 5 percent level.*** Significant at the 1 percent level.Note: N � number; PPE � property, plant, and equipment; ROA � return on
assets; ROE � return on equity; and LTD � long-term debt. The table presents, foreach empirical proxy, the number of usable observations and the mean and medianvalues before and after privatization. The full sample contains 102 privatizedcompanies. Before privatization refers to the average of all the years before the sale;after privatization refers to the average of all the years following privatization. Wereport Z-statistics for signed rank tests and Wilcoxon rank sum tests for change inmean and median values, respectively. Definitions for each variable can be found inappendix table 4B.1.
Source: Authors’ calculations.
190 ANUATTI-NETO, BAROSSI-FILHO, CARVALHO, AND MACEDO

Table 4C.4 Change in Performance: Tests of Means and Medians(All Years before and after Privatization, with Adjustment)
Mean and Mean andmedian median Z-test
Variable N before after (1)
ProfitabilityOperating income/sales 71 �0.050 �0.005 0.107
0.072 0.036 �0.241Operating income/PPE 70 �0.003 0.385 6.112***
�0.010 0.207 6.387***Net income/sales 71 �0.084 �0.064 0.693
0.005 0.014 0.262ROA 73 �0.831 �0.003 3.130***
�0.017 0.003 2.736***ROE 73 �1.159 �0.012 3.236***
�0.440 0.014 3.223***
Operating efficiencyLog(sales/PPE) 63 �0.677 �0.255 5.226***
�0.600 �0.264 4.914***Operating costs/sales 64 0.236 0.066 �3.199***
0.090 0.025 �2.819***
AssetsLog(PPE) 69 1.380 1.017 �2.001*
1.111 0.993 �1.885*Investment/sales 62 0.098 0.011 �0.394
0.123 0.086 �0.730Investment/PPE 62 �0.018 0.055 �1.385
0.022 0.029 1.072
OutputLog(sales) 71 0.906 1.178 2.333***
0.855 1.029 2.599***
ShareholdersPayout ratio 59 0.082 �5.963 �0.731
�29.35 �9.292 1.169
FinanceCurrent 73 �0.526 �0.232 3.653***
�0.503 �0.313 3.937***LTD/equity 66 0.233 �0.002 �2.086**
�0.107 �0.238 �2.286**
COSTS AND BENEFITS OF PRIVATIZATION: EVIDENCE FROM BRAZIL 191
(Table continues on the following page.)

Net taxesNet taxes/sales 68 0.007 0.005 3.173***
0.007 0.002 �3.534***
* Significant at the 10 percent level.** Significant at the 5 percent level.*** Significant at the 1 percent level.Note: N � number; PPE � property, plant, and equipment; ROA � return on
assets; ROE � return on equity; and LTD � long-term debt. The table presents, foreach empirical proxy, the number of usable observations and the mean and medianvalues before and after privatization, adjusted to take into account unstablemacroeconomic policies. See text for full explanation. The full sample contains 102privatized companies. Before privatization refers to the average of all the years beforethe sale; after privatization refers to the average of all the years following privatization.We report Z-statistics for signed rank tests and Wilcoxon rank sum tests for change inmean and median values, respectively. Definitions for each variable can be found inappendix table 4B.1.
Source: Authors’ calculations.
192 ANUATTI-NETO, BAROSSI-FILHO, CARVALHO, AND MACEDO
Table 4C.4 (continued)
Mean and Mean andmedian median Z-test
Variable N before after (1)
Table 4D.1 Definition of the Control Variables Included in theVector of the Econometric Model
ExpectedVariable Definition impact on iit
Split/merger A dummy variable that takes the (�) or (�)value 1 if the company had been split or merged as a result of its privatization, and 0 otherwise.
Minority control A dummy variable that takes the (�)value 1 if the government, owned only a minority participation beforeprivatization, and 0 otherwise.
Listed A dummy variable that takes the (�)value 1 if the privatized enterprise was listed on the São Paulo stock exchange before privatization, and 0 otherwise.
Appendix 4D
(Table continues on the following page.)

COSTS AND BENEFITS OF PRIVATIZATION: EVIDENCE FROM BRAZIL 193
Table 4D.1 (continued)
ExpectedVariable Definition impact on iit
Tradable A dummy variable that assumes the (�)value 1 if the privatized firm is in a tradable goods industry, following three criteria: its typical product is included in the international classification of tradable goods; it is free from nontariff restrictions; and its effective protection tariff is not redundant, and 0 otherwise.
Regulateda A dummy variable that assumes a (�) or (�)value of 1 if the privatized firm is in a regulated industry, and 0 otherwise.
Private mean The yearly average of each (�) or (�)performance indicator based on private companies only.
a. Regulated refers to privatized firms that belong to an industry whose priceshave been controlled by the government before and after privatization.
Source: Authors’ calculations.
Notes
The authors acknowledge financial support from Fundação Instituto de PesquisasEconômicas (FIPE) and the Latin American and Caribbean Research Network Pro-gram (LACRNP) of the Inter-American Development Bank; the assistance ofEconomática; Austin Assis, and the Getúlio Vargas Foundation for providing the datasets; and the research assistance of Renata Domingos and Alan de Genaro Dario.
1. These numbers, as well as others quoted from the same study, have beenrounded.
2. This section draws from Macedo (2000) and updates and extends hisanalysis.
3. These values exclude concessions of public services. All dollar amounts areU.S. dollars.
4. The major source of data on the Brazilian privatization program is BNDES,which was given the task of managing it, including a part developed at the statelevel. The reports and other documents used as sources are BNDES 1999a, 1999b,and 2001.
5. The same kind of data is used later in the analysis of employment effects.This data base is known as RAIS (Relação Anual das Informações Sociais, or An-nual Survey of Social Data).

6. The differential, net of the workers’ characteristics, reached a peak of 80percent when the workers’ characteristics were valued according to the private sec-tor criteria, as measured by the regression coefficients of the workers’ characteris-tics in the wage equation of that sector.
7. More recently, in a seminar sponsored by BNDES to celebrate the 10th an-niversary of the privatization program, Pinheiro (2000) presented some additionaland updated results, again based on data that cannot be disclosed, this time cover-ing 55 firms. The analysis simply compared the performance of the firms beforeand after privatization, thus not relating their performance to that of the privatefirms. Pinheiro found sizable increases in net operational revenues, investment, netprofit, productivity, and tax collections as well as a reduction in employment, insome cases compensated by an expansion in contracted-out services.
8. High rates of inflation plagued the economy from 1986 to 1994, a periodin which indexation following legal rules was widespread. Because the analysis isdeveloped in terms of ratios based on flow variables, such as operating income tosales, the problems of inflation and indexation are circumvented. For a few casesin which the absolute value of the indicator is used, the original values in Braziliancurrency were converted into U.S. dollars.
9. In the process of privatization, BNDES franchised to interested bidders theexisting information on the firms. The files are kept by BNDES, but they are con-sidered a proprietary right of the winning bidder. BNDES has also occasionallyused questionnaires to gather information from firms after privatization. BNDESresponded to our request for both types of data saying that it could not make themavailable to third parties.
10. This procedure differs from that of La Porta and López-de-Silanes (1999)in that they used one fixed year for the period after privatization. In the Mexicancase, privatization was heavily concentrated in a few years. In Brazil it has extendedover a decade and more. Therefore, a fixed year for comparison would be inade-quate.
11. Our adjustment, however, could not be done by industry, as some priva-tized enterprises do not have a corresponding match in the private sector. This isthe case, for instance, with the major mining company (Companhia Vale do RioDoce), the telecommunications companies, and many companies in the energysector.
12. This information was available only for listed companies. 13. According to Baltagi (1995), inclusion of a lagged dependent variable ren-
ders the OLS (ordinary least squares) estimator biased and inconsistent even if theerror terms are not serially correlated. Baltagi (1995) and Hsiao (1986) alsodemonstrate that the same problem affects GLS (generalized least squares) andFGLS (feasible generalized least squares) estimators. Finally, the instrumental vari-able (IV) estimation method alone leads to consistent, but not necessarily efficient,estimates of the parameters in the model, because it does not make use of all theavailable moment conditions (Ahn and Schmidt 1995).
14. For the lagged dependent variables, this method resorts to instrumentalvariables that are obtained in a dynamic panel data model once existing orthogo-nality conditions between these lagged values and the disturbances are taken intoaccount. A set of valid instruments is represented by all the dependent variableslagged more than one period. In this chapter, the parameter estimates were ob-tained by using as an instrument the independent variable lagged two years.
15. The incentives gained strength after new “social rights” were established bythe constitution of 1988, as detailed by Fernandes (1998).
16. Pinheiro (2000) tackled both the direct impact and the effect of contractingout on employment, on the basis of questionnaires sent to the privatized firms byBNDES. He found a 33 percent reduction in the total number of formal workers.
194 ANUATTI-NETO, BAROSSI-FILHO, CARVALHO, AND MACEDO

For production workers, the reduction was 29.5 percent, evidence that overstaffingwas concentrated in white-collar workers. In absolute numbers, he found that, ex-cluding telecommunications, the total reduction was 10,000 workers in the year ofprivatization and 35,000 in the year before, thus showing adjustment by SOEs be-fore privatization. In the telecommunications sector, he found that 145,000 newjobs were contracted out to expand services. This number might sound high, butnotice that in this country of 170 million inhabitants, the number of fixed tele-phone lines increased from 9.6 per 100 people in 1996 to 21.4 in 2000, while thenumber of cellular phones rose from 1.6 per 100 people to 12.9, an expansion thathas required a lot of labor, particularly in the case of fixed lines.
17. Data obtained from the Brazilian Central Bank and Department of Treasury.18. Macedo (2000) compares the fiscal picture at that time to what Kornai
(1979) calls a soft budget constraint, typical of centralized governments whosebudgets are only vaguely monitored or controlled by Congress and society, if at all.Under such conditions, the only effective constraint emerges when markets react tothe piling up of debt and the interest rate becomes a problem in itself.
19. Interestingly enough, the devaluation in early 1999 came after the telecom-munications privatization auction in 1998, in which the presence of foreign directinvestment was stronger. These investments were seen by the market as a sign thatthe government could hold on to the overvalued real. As the program came to ahalt, devaluation came sooner than expected.
20. The other countries are Argentina, Bolivia, Colombia, Costa Rica,Ecuador, El Salvador, Guatemala, Honduras, Mexico, Nicaragua, Paraguay, Peru,and Uruguay.
21. The highest ratings were given to the aviation industry (80 percent), inwhich Embraer, the only former SOE, has been very successful; steel (65 percent);and telecommunications (58 percent). The lowest ratings were received by rail-roads (9 percent), electricity (13 percent), and one airline (11 percent)—a smallcompany that belonged to the state of São Paulo and was individually privatized inthe mid-1980s.
22. In 2000, for the first time since the program started, the federal governmentresorted to a public offer of minority shares in Petrobrás, totaling $4 billion, inwhich workers were also allowed to participate with their FGTS deposits. The op-eration was very successful, as was another public offer of a remaining state-ownedblock of minority shares of Companhia Vale do Rio Doce, sold in 2002 for $1.9billion.
23. The source of the tax burden data is the Secretary of Federal Revenue, Min-istry of Finance, as published by Folha de São Paulo (May 10, 2003).
References
Ahn, S. C., and P. Schmidt. 1995. “Efficient Estimation of Models for DynamicPanel Data.” Journal of Econometrics 68: 5–27.
Arellano, M., and S. Bond. 1991. “Some Tests of Specification for Panel Data:Monte Carlo Evidence and an Application to Employment Equations.” Reviewof Economic Studies 58: 277–97.
Baltagi, B. H. 1995. Econometric Analysis of Panel Data. New York: John Wiley& Sons.
BNDES (Banco Nacional de Desenvolvimento Econômico e Social). 1999a. Priva-tizações no Brasil – 1991/99. Rio de Janeiro.
COSTS AND BENEFITS OF PRIVATIZATION: EVIDENCE FROM BRAZIL 195

———. 1999b. Sistema de Informações. Rio de Janeiro.
———. 2001. “Privatização, www.gov.br.
Fernandes, R. 1998. “Encargos Sociais e Demanda por Trabalho no Setor Formalda Economia.” Economia Aplicada 2(3): 553–78.
Hsiao, C. 1986. Analysis of Panel Data. Cambridge, U.K.: Cambridge UniversityPress.
Kornai, J. 1979. “Resource vs. Demand-Oriented Systems.” Econometrica 47 (4):801–19.
La Porta, Rafael, and Florencio López-de-Silanes. 1999. “The Benefits of Privati-zation: Evidence from Mexico.” The Quarterly Journal of Economics (Novem-ber): 1193–242.
La Porta, Rafael, Florencio López-de-Silanes, Andrei Shleifer, and Robert Vishny.1997. “Legal Determinants of External Finance.” Journal of Finance 52 (3):1131–50.
Lamounier, B., and A. De Souza. 2002. “As Elitres Brasileiras e o DesenvolvimentoNacional: Fatores de Consenso e Dissenso.” Relatório de Pesquisa. São Paulo:IDESP (Instituto de Estudos Econômicos, Sociais e Políticos).
Levine, Ross. 1997. “Financial Development and Economic Growth: Views andAgenda.” Journal of Economic Literature (35): 688–726.
Levine, Ross, and S. Zervos. 1998. “Stock Markets, Banks, and EconomicGrowth.” American Economic Review (88): 537–58.
Lora, Eduardo, and U. Panizza. 2002. “Structural Reforms in Latin America underScrutiny.” Paper prepared for the seminar “Reforming Reforms,” held at theannual meeting of the Board of Governors, Inter-American Development Bank,Fortaleza, Brazil. Available at www.iadb.org/res.
Macedo, R. 1985. Os Salários nas Empresas Estatais. São Paulo: Nobel.
———. 2000. “Privatization and the Distribution of Assets and Income in Brazil.”Working Paper 14. Carnegie Endowment for International Peace, Washington,D.C.
Megginson, William L., and Jeffry M. Netter. 2001. “From State to Market: ASurvey of Empirical Studies of Privatization.” Journal of Economic Literature39 (June): 321–89.
Megginson, William L., Robert C. Nash, and Matthais van Randenborgh. 1994.“The Financial and Operating Performance of Newly Privatized Firms: An In-ternational Empirical Analysis.” Journal of Finance 49 (2): 403–52.
Pinheiro, Armando C. 1996. “Impactos Microeconômicos da Privatização noBrasil.” Pesquisa e Planejamento Econômico 26 (3): 357–98.
———. 2000. “Após a Privatização.” Rio de Janeiro: BNDES. Presentation inPowerpoint format available at www.bndes.gov.br.
Pinheiro, Armando C., and F. Giambiagi. 1997. “Lucratividade, Dividendos e In-vestimentos das Empresas Estatais: Uma Contribuição para o Debate sobre Pri-vatização no Brasil.” Revista Brasileira de Economia 51 (January–March):93–131.
196 ANUATTI-NETO, BAROSSI-FILHO, CARVALHO, AND MACEDO

5
The Effects of Privatization onFirms: The Chilean CaseRonald Fischer, Rodrigo Gutiérrez,
and Pablo Serra
THIS CHAPTER EVALUATES THE EFFECTS OF privatization on the efficiencyof firms and institutions in Chile. One of the chief characteristics of theChilean privatization process is that it has been all-encompassing. In thethree decades that followed the fall of the government of the socialistpresident Salvador Allende (December 1970–December 1973), all thebanks and firms that had been acquired or expropriated by the Allendeadministration were either privatized or liquidated. Farms that hadbeen expropriated after the agrarian reform of 1965 were privatized, aswell as a majority of the firms that were state-owned before December1970.
The military government of Augusto Pinochet also privatized the pen-sion system and a part of the health insurance system. It promoted vouch-ers for subsidized private schools and allowed free entry of new institutionsinto university and other tertiary education. Finally, the private sector im-proved or built and undertook the operation of most large infrastructureprojects such as highways, seaports, airports, water reservoirs, and evenjails. In addition, in a bid to decentralize government, local governments(municipalities) became responsible for the lowest level of the public healthcare system as well as for public schooling.
The privatization effort has been part of a much wider process of eco-nomic liberalization that Chile initiated in 1974. The process represents amajor reversal of the policies the country had followed since the 1940s,when the state played a role not only through the public firms, but alsothrough regulations and other mechanisms (Galetovic 1998). The govern-ment set interest rates and exchange rates, as well as regulating almost3,000 prices for goods and services. As part of its import substitution
197
strategy, the state protected those sectors deemed essential. All of thesemechanisms started to disappear in 1974 with the country’s shift towarda market economy in which the price system was the main determinantof resource allocation and the private sector was the centerpiece of theeconomy. Moreover, many traditional supervisory activities were sur-rendered to the private sector.
It is possible to distinguish three main phases of the privatizationprocess, even though any chronological division is arbitrary. In the firstphase, which covers the period 1974–83, 259 firms that were expropri-ated or illegally taken during the Allende administration were restored totheir original owners. The government also sold or liquidated an addi-tional 112 nonfinancial firms acquired in the same period (retaining 1 inthat category). In addition, 33 of the 65 firms owned by the governmentbefore 1970 were also privatized or liquidated. Nevertheless, in 1983 thegovernment still owned 45 firms, some of them because they were consid-ered of strategic importance and some because there were no takers. Theseincluded all of the major telecommunications and electric power firms, aswell as copper mining companies.
In the second phase, from 1984 to 1989, the state privatized thetelecommunications and electric power firms as well as most of the firmspreviously considered strategic: the CAP steel works, the national airlineLAN Chile, and other major firms. It also finished selling the last fewfirms that had been acquired by the socialist government. By 1989 only19 of the 65 firms dating from the pre-Allende period were still state-owned.
The privatization of state-owned enterprises (SOEs) slowed down inthe 1990–2001 period. However, the government sold the three mainwater and sewage companies and completed the privatization of the elec-tricity sector. The distinguishing feature of this period, however, is theprivatization—through concession contracts—of infrastructure manage-ment. Since 1993, the main highways and airports have been built, main-tained, and operated by private investors. The main state-owned portshave also been franchised to private firms.
Most analysts ascribe the strong growth of the Chilean economy thatbegan in 1985 (after a severe crisis in the first half of the decade) to eco-nomic liberalization. If we accept this premise, we may still question thespecific contribution of privatization. So many systemic changes occurredat the same time that it is difficult to evaluate the individual contributionof a particular policy. Nevertheless, Larraín and Vergara (1995) suggestthat the rest of the program would not have been credible in the absenceof a privatization process. Moreover, privatization was important in help-ing balance the budget and in developing capital markets.1 In this chapter,however, we focus on the direct effect of privatization on the efficiency ofprivatized sectors and therefore do not look at the global effects on the restof the economy.
198 FISCHER, GUTIÉRREZ, AND SERRA

Privatization of SOEs
The Chilean privatization of SOEs has been a long-lasting and yet unfinishedprocess. There are still 38 firms—most of them of economic importance—that remain in public hands. They include ENAP, the monopoly oil refin-ery; Codelco, a copper mining concern that is the largest company inChile; ENAMI, a copper refinery; Banco del Estado, the fourth largestcommercial bank; the post office; the subway; the Chilean mint; the raillines; 10 ports; Zofri, a free trade zone; and other minor companies, rep-resenting, in all, around 9 percent of total gross domestic product (GDP)in 1998 (Hachette 2000). The perception that Chile has advanced furtheralong the privatization route than most other countries is probably due tothe fact that the bulk of traditional infrastructure and social services hasbeen privatized rather than to the extent to which the state has retiredfrom the productive sector.
As can be seen from table 5.1, 125 firms were privatized between1974 and 2001. Most of these firms, however, were owned by the statefor only a short time, and only 65 of these stayed in public hands longenough to count as true SOEs. Most of the firms acquired during thesocialist administration (1970–73) were privatized by 1978, and by1983 only 1 of those firms was still state-owned. At least 55 other firmscontrolled by the government have been liquidated. Several of these wereviable only while protected by large tariffs and other nontariff barriers,and thus became nonviable after the opening of the economy (Hachetteand Lüders 1994). Note also that in the 1979–89 period many state-owned firms were created by the breaking up of larger firms and werelater sold.
THE EFFECTS OF PRIVATIZATION ON FIRMS: THE CHILEAN CASE 199
Table 5.1 Nationalization and Privatization of Firms in Chile,1970–2001
Number of firms 1970–73 1974–78 1979–83 1984–89 1990–2001
Beginning of period 65 179 82 45 44Acquired 113 1 0 0 0Created 1 0 10 29 12Privatized 0 70 14 27 14Liquidated 0 28 20 3 4No information 0 0 13 0 0End of period 179 82 45 44 38
Note: The table does not include Pehuenche, which was privatized as a project. Itdoes include Corporación del Cobre (Codelco) and 10 seaports originating in thebreakup of Emporchi.
Source: Authors.

Compared with later processes (in Mexico, for instance, see La Portaand López-de-Silanes 1999), privatization in Chile was not transparent inits early stages. This can be explained partially by the violent social con-vulsions that affected Chile from 1970 through 1982. This era saw a coupoverthrowing the socialist government and bringing in a dictatorship,three large economic crises (1973, 1975, and 1982), and major structuralchanges in the economy. Furthermore, policymakers explored untriedpolicies in the absence of a free press—there is almost no record of priva-tizations that took place in the 1970s. Moreover, accounting books con-vey little about the value of a firm as inflation rates reached levels of morethan 500 percent in some years, and bookkeeping regulations were looseand not upgraded until the 1982 crisis. Therefore, most of the usable dataon privatization for Chile correspond to the firms privatized since the early1980s that remained public corporations (that is, that trade shares on thestock market), because they were required to publish financial informa-tion. More than half of these firms provide public services, and their dataare contaminated by the effects of regulation, while the remaining firmsare usually dominant in their markets or have sizable market shares.
The most important conclusion we draw in this section is that contraryto other documented cases (see La Porta and López-de-Silanes 1999), mostSOEs in Chile were fairly efficient before being sold, except perhaps in thesense of overinvestment in the electric power sector. As a matter of fact,employment increased after privatization in most firms. As a result, priva-tization did not substantially improve the behavior of privatized firms,and by many measures, investment was lower than average for their sec-tors after privatization. 2 A second conclusion is that in the case of severalvariables of interest, the main divide is that between firms operating in aregulated market and those acting in a competitive market. In particular,privatized firms that face competition have had lower profit rates, withprofitabilities that are similar to those of their respective industries, whilefirms in the regulated sector have had significantly higher profit rates thanthe average for their industries at the 2-digit SIC (Standard Industrial Clas-sification) level. In the case of the regulated sectors, the effects of privati-zation may result from differences in management efficiency or from theintroduction of new regulations on the sector, or from the interplay ofthose two factors. Thus, it is necessary to evaluate the regulations in orderto understand the impact of privatization.
Privatization of Regulated Sectors
This section focuses on the privatization of utilities that occurred in the1980s and on the private infrastructure franchises of the 1990s. In these sec-tors the government switched from the role of provider to the role of regu-lator. The government was aware that in some cases adequate incentives
200 FISCHER, GUTIÉRREZ, AND SERRA

were required in order for privatization to increase welfare. For that rea-son the regulations that were introduced before privatization tended topromote competition whenever it was feasible and to stimulate efficientbehavior when competition was impossible.
Privatization of Utilities
In this section we analyze the postprivatization performance of regulatedutilities and relate it to regulatory legislation. We focus on the electricityand telecommunications companies that were privatized in the 1980s.3
The gains in efficiency from privatization derive both from the differentialefficiency between the public and private management and from the effectof the rules and regulations that were imposed on the sector.
During the 1980s Chile reformed and liberalized its electricity andtelecommunications sectors. The process started in the late 1970s, with theestablishment of new regulatory bodies and the introduction of new legis-lation in 1982, and culminated in the privatization of the major firms be-tween 1985 and 1989. One trait that infrastructure-based sectors share isthat competitive segments coexist with other segments that constitute anatural monopoly. Chile’s policy has been to introduce competition wher-ever possible and to regulate noncompetitive segments of industry. Thegovernment believed that market discipline played an essential role in eco-nomic policy, so much so that one of the first economic laws it introduced(in October 1973) was a thorough revamping of antitrust legislation.
With respect to the Chilean electricity sector, the cornerstone of the re-form process was the introduction of competition in the wholesale con-tract market for energy. The unbundling of transmission services was aprerequisite for wholesale competition to survive. Thus, it was necessaryto introduce the principle of open access to the transmission network.The second major change was that investment in power generation wasleft to market forces. It was assumed that existing firms or potential en-trants would invest in generation capacity whenever a project had a re-turn on capital that was commensurate with the sector’s risk. The thirdmajor regulatory innovation was the introduction of incentive regulationto calculate the distribution rates. This implies that prices are set so thatan efficient distribution company attains a predetermined rate of return(Fischer and Serra, 2000). The legislation regulating the telecommunica-tions sector follows a similar pattern. These laws allow for free marketprices in all sectors deemed competitive but regulate rates of basic phoneservices considered to be local monopolies. As the local network is con-sidered an essential facility for competitors, the 1982 law requires localtelephone service operators to provide access to their network to anyother operator that requests the service.
On average, SOEs increased their profitability and efficiency after pri-vatization, following the trend of the national economy, but the behavior
THE EFFECTS OF PRIVATIZATION ON FIRMS: THE CHILEAN CASE 201

of firms providing regulated services stood out. Their labor productivity—and consequently their profitability—increased more than that of the un-regulated firms. Hence, there is some evidence that the incentive mecha-nisms worked and provided incentives for efficiency. At the same time, thehigh profit rates of these firms are also evidence of regulatory failure. Infact, the available evidence shows that a large fraction of the efficiencygains was not transferred to consumers as prescribed by the regulatorymodel. Nonetheless, this situation has changed since the turn of the cen-tury as regulators have become more forceful and competition has madeits mark even on sectors previously considered to be natural monopolies.
The Privatization of Infrastructure
Despite the existence of some early plans to franchise infrastructure dur-ing the Pinochet government, it was the democratically elected Aylwinadministration (1990–94) that managed to pass a law allowing privatefranchises of highways and other infrastructure projects. Because of ini-tial delays and practical hurdles, it was not until the Frei administration(1994–2000) that the groundwork was completed and the franchising ofinfrastructure went into full swing. For the next six years, during and af-ter the Frei administration, most profitable private projects were fran-chised to national and international firms. Projects worth more than $4billion are operational or are close to being operational. An additional$2.5 billion in projects was auctioned or was scheduled for auction dur-ing 2002, but construction had not yet started; another $650 million wasunder consideration at the time of this writing but had not been evaluatedin detail.
By the mid-1990s, the government discovered that it faced bottlenecksin seaports—a serious problem since most Chilean international cargo istransported by sea. Each port had multiple private cargo transfer and stor-age operators, but there was little investment in equipment, and activitieswere not well coordinated. The government decided to franchise port ter-minals (frentes de atraque) to private operators.4 Given the scarcity ofports in Chile because of geographical reasons, terminals can be consid-ered essential facilities. To increase efficiency and investment in the ports,the main terminals were auctioned under restrictions on horizontal andvertical integration designed to prevent monopolization of the ports.
Overall, the program of infrastructure franchising has been successful.The highway program has encountered few problems, especially com-pared with the experience of Mexico, which eventually cost taxpayers anestimated $8 billion. By now Chile can boast of a substantially upgradedroad infrastructure and lower transportation costs. Moreover, since fran-chise auctions were open and competitive, tolls (user prices) should beclose to average cost, which is the second-best outcome in the presenceof economies of scale. There are, however, potential problems with the
202 FISCHER, GUTIÉRREZ, AND SERRA

traffic guarantees the government has included in contracts to facilitateaccess to loans, since they represent unaccounted contingent liabilities ofthe government that are pro-cyclical. Finally, there have been noticeableimprovements in the efficiency of the privatized ports. The loading andunloading process has become twice as fast in just one year, having amultiplier effect on transportation costs since shorter stays in port meanthat more efficient and more capital-intensive ships can afford to operatefrom Chile.
In this chapter we report the effects of privatization on 37 nonfinan-cial firms that were privatized between 1979 and 1999. During this pe-riod 13 additional nonfinancial firms were privatized, but the availabledata for those entities were insufficient. This is symptomatic of one ofthe negative features of the Chilean privatization process: the lack oftransparency (Hachette and Lüders 1994). There are no public recordsfor privatizations that occurred during the 1970s. Some of these firmssubsequently went bankrupt or became private corporations (that is,with no publicly traded shares) and did not publish accounting informa-tion. Therefore, most of the usable data on privatization for Chile cor-respond to the now publicly traded firms that were privatized starting inthe early 1980s, which are required to publish financial information.Nineteen of the 37 firms in the sample belong to regulated sectors, so theirdata are contaminated by the effects of regulation, while the remainder areusually dominant firms in their markets or have sizable market shares.5
In this chapter we report both absolute and normalized (adjusted)changes in various performance ratios before and after privatization.The normalization allows us to compare the behavior of privatized firmsto the performance of the sector to which they belong.
The rest of the chapter is organized as follows. The next three sectionsanalyze the privatization of state-owned firms and its effect on their per-formance, efficiency, and other parameters. That is followed by a sectiondevoted to a qualitative assessment of privatization of regulated sectors.First, we analyze the privatized utilities and their sectors in more detail.Then we look at the private provision of infrastructure through franchises.The last section concludes.
A Brief History of the Privatization of Public Enterprises
The Era of State Intervention
State participation in the economy has had a long history in Chile, althoughit has only been truly significant since 1940. After the crisis of the 1930s—according to Mamalakis (1976), Chile was one of the countries that suf-fered most heavily in the crisis—the country chose an import substitutionstrategy and more state intervention. Thirty years later, the government
THE EFFECTS OF PRIVATIZATION ON FIRMS: THE CHILEAN CASE 203

owned or had a controlling interest in 65 firms (and 1 bank), 21 of whichwere created by law and 44 that were controlled by the Corporación deFomento (CORFO), a government organization created to promote indus-trial production (table 5.2). These firms either operated only in sectors thatthe state deemed too important to be left to the market or were originallyprivate firms that had gone bankrupt until government intervention savedthem.6
CORFO was set up in 1939 to spur economic development through thepromotion of investment. It operated through loans and loan guaranteesto the private sector, through research and development of projects, andeventually, through their implementation. CORFO established firms thatwere deemed essential for Chile’s development,7 among them EmpresaNacional de Electricidad (ENDESA, 1944), Compañía de Acero del Pací-fico (CAP, 1946), Industria Azucarera Nacional (IANSA, 1953), EmpresaNacional de Telecomunicaciones (ENTEL, 1964), Petroquímica Chilena(Petrox, 1967), Sociedad Química y Minera de Chile (Soquimich, 1968),Celulosa Constitución (Celco, 1969), Celulosa Arauco (1967), and Indus-trias Forestales SA (Inforsa, 1970). There were minority private share-holders in these firms (43 percent in the case of CAP). CORFO was also aminority shareholder in two other firms.
Among the firms created by law are Correo y Telégrafos, which hasbeen public since before independence; Ferrocarriles del Estado,founded in 1851; Línea Aérea Nacional (LAN), created in 1931; Em-presa Nacional del Petróleo (ENAP), established in 1950; the EmpresaMarítima del Estado, spun off from Ferrocarriles in 1953; the Banco delEstado, established in 1953 by the merger of state-owned financial in-stitutions established in the previous century; Empresa Nacional deMinería, created in 1960; and the Empresa Portuaria de Chile, split offfrom the customs office in 1960.
A change of policy occurred in the late 1960s when the government be-gan a modest process of acquiring private firms. Previously, all SOEs hadbeen created by the state itself, except for those troubled firms unable torepay the CORFO loans. Codelco was established in 1968 to acquire 50
204 FISCHER, GUTIÉRREZ, AND SERRA
Table 5.2 State-Owned and State-Seized Firms, 1970–2001
Type of firm 1970 1973 1983 1989 2001
Enterprises 65 179 45 44 38Banks 1 19 2 1 1Seized 0 259 0 0 0
Note: Between 1970 and 1973, the government increased from 2 to 68 thenumber of firms in which it had minority stakes.
Source: Corporación de Fomento de la Producción; Hachette and Lüders (1994).Data for 2000 compiled by the authors.

percent of the shares of the four largest copper mines (copper representedmore than 80 percent of all exports). In 1970 Chilectra was acquired byCORFO, which meant that the state owned almost the entire electricpower sector. Moreover, in the 1965–70 period, 22 percent of the arableland (4.1 million hectares) was expropriated in a land reform process.Most of the land was not transferred by deed to the peasants (except for2,600 hectares), but was kept in public hands (Rosende and Reinstein1986).
The pace of state intervention in the economy accelerated in December1970 when the socialist Allende administration took office with the pro-fessed aim of creating a vast state-owned sector. The target was to acquireall firms whose equity exceeded $500,000 in current dollars, as well as allof the banking sector, the import-export sector, and all utilities. A ma-jority in the Chilean congress opposed this plan, so the executive branchresorted to administrative measures and legal loopholes. First, CORFOoffered to buy shares in any bank or publicly traded firm. Given the un-certainty of the times, many investors decided to sell out (table 5.3).
In the 1971–73 period CORFO managed to buy a majority share in113 industrial firms and 14 banks, as well as a minority shareholding in68 other firms and 5 banks, while creating only 1 new firm (Trans-marchilay). Therefore, in September 1973 the state was a majority con-troller in 179 firms and 15 banks and was a minority shareholder in 70firms and 4 banks. Another 259 firms were intervened in or nationalized.In this case the administration used preexisting legislation that allowed in-tervention or expropriation of firms when there was a threat of shortages.In the case of strikes, firms stopped operating, so a risk of shortage existed,allowing the intervention of the government.
THE EFFECTS OF PRIVATIZATION ON FIRMS: THE CHILEAN CASE 205
Table 5.3 Number of State-Owned Firms, by Year, 1973–2001
Date 1973 1978 1983 1989 2001
State-owned pre-1970 65 46 32 19 15Acquired 1970–73 113 34 1 0 0Created 1970–73 1 1 1 1 0Acquired 1974–78 1 1 0 0Created 1979–83 10 2 1Created 1984–89 22 13Created 1990–2001 10Total 179 82 45 44 38
Note: The table does not include Pehuenche, which was privatized as a project. Itdoes includes Corporación del Cobre (Codelco) and 10 seaports originating in thebreakup of Emporchi.
Source: Authors’ computations based on Hachette and Lüders (1994) andCorporación de Fomento de la Producción.

To recapitulate, by September 1973 the government controlled 441 firmsand 15 banks, and there were few important companies in private hands(the firms under control of the state represented almost 40 percent of GDP).In addition, 66 agro-industrial plants were built or operated, or both, bySocoagro, a subsidiary of CORFO. The state owned 8,979,000 hectares, ofwhich 5,873,000 had been expropriated in 1971–73 (Larroulet 1984), andthe share of the economy in the hands of the state was growing apace.
The First Round of Privatization
After the coup of September 1973, the military government in power be-gan to develop a strategy of economic liberalization. One of its aspects wasthe return to the original owners of the firms in which the government hadintervened. During 1974, 202 firms were returned to their owners; 39were given back the next year, leaving only 18 firms to be normalized inthe next few years. Most of these firms that were returned to their origi-nal owners by 1975 had been in the hands of the government for only afew years and are therefore not representative of SOEs (Meller 1996; Sáez1996). At the same time, the land that had been expropriated was priva-tized: 28 percent of the land that had been expropriated illegally was re-turned to its original owners, another 52 percent was divided into smalllandholdings and sold to the peasants at subsidized prices (many of thepeasants later resold the land), while the remainder was privatizedthrough public auction or was transferred to the Corporación NacionalForestal (Hachette and Lüders 1994).
Between 1975 and 1977 the government privatized most of the firmsthat had been acquired in 1971–73. Most of the shareholdings in bankswere sold in 1976, leaving a few to be sold the next year. In the 1975–77period, 70 state-controlled firms were privatized, while 28 other firmswere closed and their assets auctioned off (table 5.4). By 1980 the statehad control over only 10 of the firms acquired by the socialist government.At the same time, the military dictatorship decided to keep the largest elec-tricity and telecommunications companies. The same strategic reasonsmade the military government buy a controlling interest in the main tele-phone company in 1974 (thus obtaining control of 100 percent of thetelecommunications sector).
Of those SOEs that dated to the period before 1970, only 46 were stillowned by the state by the end of the 1970s, with the government havingeither sold or liquidated 30 of them. The state retained the 22 companiesthat had been created by a special law, but the number of CORFO com-panies shrank from 44 to 11. CORFO sold all of the firms it had acquiredthrough debt capitalization and kept only a portion of the companies ithad created. Thus, by the end of the 1970s the state owned the major elec-tric utilities, telecommunications companies, the big mining companies,and a large fraction of the transportation industry (railways, two shipping
206 FISCHER, GUTIÉRREZ, AND SERRA
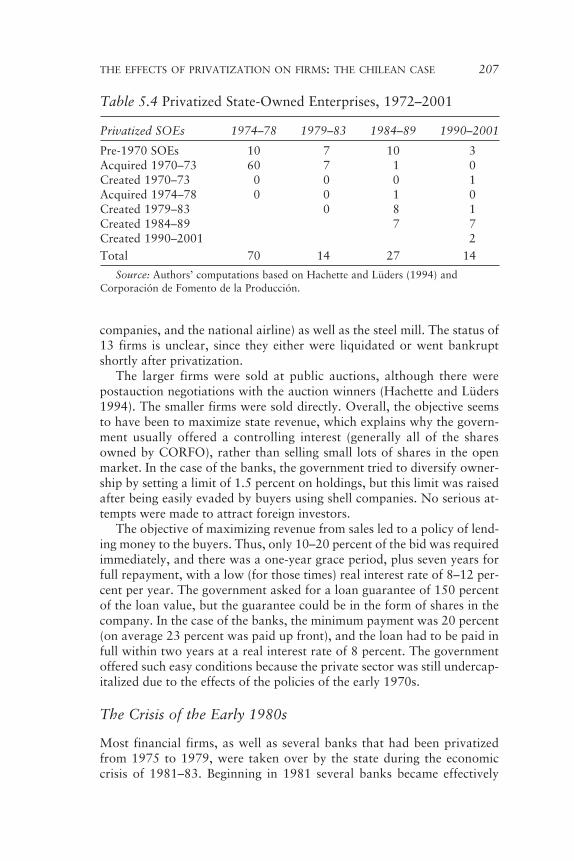
companies, and the national airline) as well as the steel mill. The status of13 firms is unclear, since they either were liquidated or went bankruptshortly after privatization.
The larger firms were sold at public auctions, although there werepostauction negotiations with the auction winners (Hachette and Lüders1994). The smaller firms were sold directly. Overall, the objective seemsto have been to maximize state revenue, which explains why the govern-ment usually offered a controlling interest (generally all of the sharesowned by CORFO), rather than selling small lots of shares in the openmarket. In the case of the banks, the government tried to diversify owner-ship by setting a limit of 1.5 percent on holdings, but this limit was raisedafter being easily evaded by buyers using shell companies. No serious at-tempts were made to attract foreign investors.
The objective of maximizing revenue from sales led to a policy of lend-ing money to the buyers. Thus, only 10–20 percent of the bid was requiredimmediately, and there was a one-year grace period, plus seven years forfull repayment, with a low (for those times) real interest rate of 8–12 per-cent per year. The government asked for a loan guarantee of 150 percentof the loan value, but the guarantee could be in the form of shares in thecompany. In the case of the banks, the minimum payment was 20 percent(on average 23 percent was paid up front), and the loan had to be paid infull within two years at a real interest rate of 8 percent. The governmentoffered such easy conditions because the private sector was still undercap-italized due to the effects of the policies of the early 1970s.
The Crisis of the Early 1980s
Most financial firms, as well as several banks that had been privatizedfrom 1975 to 1979, were taken over by the state during the economiccrisis of 1981–83. Beginning in 1981 several banks became effectively
THE EFFECTS OF PRIVATIZATION ON FIRMS: THE CHILEAN CASE 207
Table 5.4 Privatized State-Owned Enterprises, 1972–2001
Privatized SOEs 1974–78 1979–83 1984–89 1990–2001
Pre-1970 SOEs 10 7 10 3Acquired 1970–73 60 7 1 0Created 1970–73 0 0 0 1Acquired 1974–78 0 0 1 0Created 1979–83 0 8 1Created 1984–89 7 7Created 1990–2001 2Total 70 14 27 14
Source: Authors’ computations based on Hachette and Lüders (1994) andCorporación de Fomento de la Producción.

insolvent because they could not recover loans from troubled companies,many of them related firms, which were either bankrupt or had sufferedsevere losses.8 The government took over four banks in November 1981and two more the following year, all of which were later closed. In Janu-ary 1983 the government had to take over eight additional banks that hadfailed to repay international loans (three of these banks were later closeddown). Ironically, most of the financial institutions that had been priva-tized during 1975 and 1976—representing 55 percent of all financial as-sets—were again being run by the state in the early 1980s (Rosende andReinstein 1986).
By December 1984 the accumulated losses of the financial sector rep-resented more than 200 percent of the sector’s equity and reserves and 18percent of GDP (Valenzuela 1989). To continue to have access to interna-tional credit markets, the government had to guarantee all foreign loans ofthe banks that it had taken over while rescuing local depositors. The gov-ernment also took over many nonfinancial companies, as well as the pri-vate pension funds (Administradoras de Fondos de Pensiones [AFPs]) thatwere linked to the troubled banks, either because they had unpaid loansfrom the banks or because they were owned by the same economic con-glomerates (Rosende and Reinstein 1986). Between 40 and 90 firms weretaken over by the state, giving rise to the so-called área rara (“gray sector”).Hence in the 1982 crisis, the state once more became the controller ofmany previously privatized firms. This new period of state control wasfairly short-lived, and firms were not considered to be truly state-owned.
The trigger of the crisis may have been international in origin (a largerise in the prime lending rate in 1981 plus a moderate fall in the terms oftrade), but the impact was amplified by mistakes in economic policy,some of which were related to the privatization process. The Chileanfinancial system was sufficiently fragile that the rise in interest rates, cou-pled with the stoppage in capital inflows, weakened the new conglomer-ates, most of which had high debt-to-asset ratios. The mechanisms usedfor privatization in the 1970s led to concentrated property holdings andgave rise to conglomerates that were highly leveraged (Sanfuentes 1984).In many cases, the buyers of banks used bank deposits to pay the loansincurred in acquiring the banks. When nonfinancial firms were priva-tized in 1976–77, the new owners of banks also used their clients’deposits or loans from other financial institutions to buy the firms. Asmentioned, the buyers were required to put up collateral for 150 percentof the loan used to buy state-owned firms, but shares in the firm couldbe used as collateral. In this way, large and highly indebted conglomer-ates were formed.
The lack of regulation in the banking system made it easy for the banksto lend money to related firms, and even when restrictions were imposed onrelated lending, they were easily eluded. In the case of the two main banks,21 percent and 50 percent of all loans went to conglomerate members.
208 FISCHER, GUTIÉRREZ, AND SERRA

Bank regulators did not keep track of the quality of the loan portfolios.Ideology played its part in the lack of regulation, since government econ-omists argued that if the banks were receiving deposits, private investorsmust have decided that the projects to which the banks were loaningmoney were profitable, and regulation was unnecessary. However, theregulators failed to realize the effect of implicit deposit insurance on theirassumptions. In 1976 depositors in a failing newly privatized bank hadbeen protected from losses, which created the perception among deposi-tors of the existence of implicit state insurance. Moreover, investors in theconglomerates believed that they were too large to fail (Vergara 1996).Regulatory changes to monitor the quality and supervise the concentra-tion of bank loans were put in place only in 1982; a stringent new bank-ing law was not introduced until 1986.
In addition to the financial resources from their affiliated banks, the twolargest conglomerates managed mutual funds (82 percent), insurance com-panies (53 percent), and pension funds (68 percent) that granted them evenmore control over the economy (Sanfuentes 1984). These institutionsbought shares of firms in the conglomerate, thus raising share prices. Theindebtedness of the conglomerates resulted in part from the level of real in-terest rates in the 1975–81 period, which was high because of the excessivedemands for credit from the conglomerates to buy even more privatizedfirms. The high real rates were compensated by capital gains in the stockmarket. In 1981 the government allowed banks to contract loans abroad,which led to a rapid increase in indebtedness. Firms that had access to in-ternational loans obtained credit at much lower rates than could smallerfirms with no access. In less than two years foreign debt doubled, with thetwo largest groups holding 52 percent of the debt.
Starting in 1985 the banks that had been taken over began to be pri-vatized once again. Preferred shares representing 70 percent of equitywere sold to new buyers. The banks sold their bad loans to the centralbank and were recapitalized. In return, the central bank became aclaimant on future profits of the banks.9 When selling the two majorbanks, the government strove to create a broad-based class of sharehold-ers for two reasons: to provide stability and to make it more difficult toreverse the privatization process. The mechanism was so-called “popularcapitalism”: buyers were required to put only 5 percent down, whileCORFO gave them a 15-year loan for the remainder. There was a 1-yeargrace period at a zero real interest rate, a 30 percent discount for timelyrepayment of the loan, and generous tax benefits. The number of sharesper buyer was limited (and limits were enforced). Three additional bankswere sold to groups of investors.
The two main conglomerates had been the owners of the larger AFPs(Provida, Santa María, San Cristóbal, and Alameda), which held 68 per-cent of workers’ pension funds. The two largest (Provida and Santa María)were sold under the popular capitalism scheme (without the tax benefits).
THE EFFECTS OF PRIVATIZATION ON FIRMS: THE CHILEAN CASE 209

Aetna, which owned 49 percent of AFP Santa María, bought enoughshares to get control, while the rest went to small buyers. Banker’s Trustbought 40 percent of the shares in Provida, with the remaining shares go-ing to small buyers. The other two AFPs were merged and auctioned un-der the name of AFP Unión.
After their recapitalization, the government also auctioned the otherfirms it had taken over. In most cases, a controlling package was auc-tioned, but in contrast to the procedures of the 1970s, the governmentrequired that payment be up-front. Local conglomerates in associationwith foreign investors bought the major companies. To make the auctionsmore attractive to foreigners, they were allowed to pay with Chileanbonds that were selling in the market at 60 percent of par value. Unfortu-nately, little information is available about the details of the transactionsof that period, as there seem to be no clear records.
The Privatization of the Historic SOEs (1985–89)
In the period 1985–89, the government privatized 27 firms and closeddown 3 other companies, while creating 29 companies by splitting uplarger SOEs. Only 3 of the SOEs created were entirely new (Zofri, Metro,and Cotrisa). In particular, 11 water and sewage companies were createdfrom the national water works. The firms that were sold in this period
210 FISCHER, GUTIÉRREZ, AND SERRA
Table 5.5 Revenues from Privatization of Chilean PublicEnterprises, 1985–89 (US$ million)
Firm 1985 1986 1987 1988 1989 Total
Electricity firms (13) 16.4 124.3 393.0 632.5 77.9 1,244.1Telecommunications 0.9 55.6 35.5 344.0 192.1 628.1
firms (3)Soquimich 4.7 85.4 71.5 60.9 0.0 222.5CAP 12.1 139.5 53.2 0.0 0.0 204.8ECOM 3.2 0.2 0.0 0.0 2.8 6.2IANSA 0.0 8.8 1.0 50.8 8.0 68.6Lab. Chile 0.0 2.8 3.8 18.1 3.1 27.8Schwager 0.0 0.0 6.1 2.2 7.0 15.3ENAEX 0.0 13.4 0.0 0.0 0.0 13.4Isegen 0.0 0.0 0.0 0.0 5.6 5.6LAN Chile 0.0 0.0 0.0 7.0 75.9 82.9Chilefilms 0.0 0.0 0.0 4.5 0.0 4.5Isevida 0.0 0.0 0.0 0.0 8.8 8.8Total 37.3 430.0 564.1 1,120.0 381.2 2,532.6
Source: Corporación de Fomento (CORFO) annual reports.

were pre-1970 SOEs or firms that were spin-offs of pre-1970s SOEs thatwere created in order to be privatized. The state sold 12 pre-1970s SOEsand 14 firms that were spin-offs of SOEs, as well as two other firms thatwere acquired in the 1970s and had been kept for strategic reasons. Mostof the firms sold in this period were utilities and included 13 electric and3 telecommunications companies (table 5.5).
Four different privatization mechanisms were used in this period. Thefirst was through best price offers for the firm or for controlling packagesin open international auctions. The second mechanism was the auction ofnoncontrolling packages of shares on the stock market. A third mechanismwas the direct sale of shares to the workers of privatized companies, pub-lic employees, and small investors—the so-called labor and popular capi-talism. Workers and public employees financed the purchases of shares byusing their severance benefits and loans from public institutions at subsi-dized interest rates. Private pension funds participated in the privatizationprocess through the acquisition of packages of shares in the stock market.Finally, public utility users that needed to connect to the system or increasethe capacity of their connection were required to pay for the infrastructurein return for shares in the company (Bitrán and Sáez 1994).
Privatization during the 1990s
The first elected government after the military regime (1990–94) stoppedthe privatization process almost completely, in contrast to the secondelected government (1994–2000), which gave new life to the privatiza-tion process. From 1994 to 2001, 14 companies were privatized while 4others were closed down. During the same period 12 new firms were cre-ated, 10 of them being subdivisions of Emporchi, the port authority. Bylate 2001, 38 firms remained in public hands; 14 of these were pre-1970SOEs, and 24 had been created after 1980, mainly by splitting up tradi-tional SOEs. The current SOEs include the largest copper mining com-pany, the oil refinery, 9 regional water and sewage companies, the postoffice, the subway, a copper refinery, 10 ports, the post office, and acommercial bank.
Between 1994 and 2000 the government used public auctions to sell thestate-owned transportation companies: two shipping companies (Empre-mar and Transmarchilay), a cargo railway company in the northern partof the country (Ferronor), and the cargo railway company in the centralzone (Fepasa). It also sold the remaining 27 percent of the national airlineon the stock exchange. Ferronor bought the northern rail system, whichconsists of several lines that run from mines in the Andes to ports andcarry minerals. It has been a successful company. Fepasa got the cargoconcession in the rail system south of Santiago, but the lines were kept bythe state (which also kept the money-losing passenger rail system). Unfor-tunately for this second company, the rail lines were in worse shape than
THE EFFECTS OF PRIVATIZATION ON FIRMS: THE CHILEAN CASE 211

expected, as was the case with the rolling equipment. Moreover, its hold-ing company had financial problems, and initially Fepasa made some busi-ness mistakes. Hence, it is only after several years in private hands that ithas been able to achieve positive operational flows.
During this period, the state also completed the privatization of theelectric power sector. Edelnor was privatized in the 1991–94 period. In1995 Codelco, the state-owned copper mining company, hived off andthen sold its thermal power plant (Tocopilla). A 37.5 percent stake in Col-bún was sold in 1996. Before the sale just over 15 percent of Colbún wastraded on the stock market. In December 1997 the government auctioned4.65 percent of Colbún in the stock market, selling its remaining shares in2001.10
The two most important privatizations of the 1990s were those of thethree largest water and sewage companies. Unlike other public services,the military regime did not privatize sanitation services. The need to raiserates significantly before it became feasible to privatize these services wasa hindrance to the sale of the water companies. The military governmentfelt that privatization followed by a substantial price hike would have beenpolitically unpopular. In fact, in the late 1980s, water rates were on aver-age less than half of what was needed to finance provision of the service,with prices covering less than 20 percent of outlays in the desertic north-ern regions. Before privatization, however, rates had to be raised so thatthe water companies could cover their costs.
Modernization of the water and sewer sector began in 1977 with thecreation of the Servicio Nacional de Obras Sanitarias (Sendos). This en-tity absorbed several agencies belonging to different ministries and madeit possible to reduce the work force from 10,000 to 3,000. Apart fromregulatory responsibilities for the whole sector, Sendos was charged withproviding water services to the regions. In the same year, state-owned wa-ter companies were set up based on preexisting companies both in theSantiago metropolitan region (Emos) and in the central zone, or RegionV (Esval). In 1989, 11 regional joint-stock companies affiliated withCORFO were created out of Sendos.
In 1988 a new regulatory framework was set up for the sector, closelymatching its electricity sector counterpart. The new rate system allowed forthe self-financing of efficient firms. Pricing zones with relatively homoge-neous costs were also established. The new pricing system was introducedgradually in 1990, and charges rose by an average of 90 percent in realterms between 1990 and 1994, although the rate adjustment process wasstill not complete in all regions. The rise in prices was steeper in areas withhigher costs, exceeding 500 percent in some cases, and by 1998 average re-gional water rates ranged from $0.43 to $1.21 per cubic meter. Arrearswere cut from 7.9 percent in 1990 to 2.9 percent in 1994, as a result of abusiness-oriented approach and by the possibility of cutting off service tocustomers in arrears. In 1994 the average rate of return on equity amongpublic water companies was 6.3 percent.
212 FISCHER, GUTIÉRREZ, AND SERRA

The Frei administration decided to privatize water companies. How-ever, it wanted to strengthen the regulatory framework before selling thefirms, since it was not totally satisfied with the way the regulation of pri-vatized public utilities was working. In 1995 the administration sent a billto Congress improving the rate settlement process. Congress approved thebill in December 1997 after a prolonged and heated debate, since it wasassumed that the bill was in preparation for privatization.
The privatization of the water sector began in 1998. Since then thethree major water and sewerage companies have been sold. A scheduledrate revision took place in the two major sanitation companies after pri-vatization. The revision resulted in a 20 percent increase in the rates ofboth firms. The increase is more or less in line with the 10 percent cost ofcapital estimated for the sector (the public firms had a 7 percent rate of re-turn on equity), and the sale prices reflect these numbers. The privatizedfirms are investing in sewage treatment plants and this will lead to furtherrate hikes. In 2002 the government was in the process of franchising its re-maining water and sewerage companies.
Data on Privatized Chilean Firms
Given the history of the privatization process described above, the data aredifficult to obtain in usable form. We excluded from our analysis privati-zations that took place between 1975 and 1979, first, because most firmsthat were privatized during that period were managed by the governmentfor only a few years. Second, the political and economic turbulence of the1970s renders available information highly idiosyncratic. In fact, eco-nomic data from 1971 to 1973 show significant distortions, and the eco-nomic recovery did not start until 1976. Moreover, accounting standardswere lax and were changed in 1982. Hence, in this chapter we focus on the54 firms privatized from 1979 to 2001. Two of these are insurance com-panies and are thus excluded from the sample, which includes only nonfi-nancial firms. Two water companies that were privatized in 1999 havealso been excluded, since there is only one year of postprivatization data.Of the remaining 50 firms, only 34 are publicly traded on the stock ex-change and thus are required to provide financial information to the pub-lic, while the other 16 have no public disclosure requirements.11 However,we were able to access the information of 3 of the firms in the latter group(Empremar, Fepasa, and Ferronor) and they have been included in thesample.12 This leaves 37 firms for which we have usable data.
Data Problems
The basic source of information is the so-called FECUs (Ficha EstadísticaCodificada Uniforme), the standardized quarterly reports that companieswith publicly traded shares (plus some other firms designated by law) must
THE EFFECTS OF PRIVATIZATION ON FIRMS: THE CHILEAN CASE 213

provide the Chilean Securities and Exchange Commission. The DecemberFECU typically includes the annual financial report and other informa-tion, including the number of workers in the firm.13 FECUs have been re-quired since 1982 and are available in digital form.14 Before the importantchanges in the accounting standards introduced in 1982,15 the accountinginformation of firms was not standardized; it is thus less descriptive of thetrue financial status of firms. An additional source of information is theannual company reports. However, the data in the annual reports are notstandardized and are therefore less useful.
No source exists for the following data at the firm level: number ofwhite- and blue-collar workers, average wages, salary differentials, andoutput price indexes. Another important data limitation is the lack of read-ily available physical data, since the output of some products is describedonly in the annual reports; the products themselves change between annualreports; and, finally, we have no price index of these products. As an ex-ample, a steel company might produce steel in ingots and as sheets andbars, iron ore, and other products. Should we assume that physical pro-ductivity has gone down because steel ingots per worker have fallen, ordoes that decline result from a change in the demand for ingots as com-pared to steel bars and iron ore, for instance?
In principle, one might look at sales per worker as an index of produc-tivity, and we do this. However, most of the firms we analyze either are reg-ulated or face very few competitors, so that prices are not determined in afree market environment. More sales per employee after privatizationcould therefore be attributable to either higher prices or higher productiv-ity, or to a combination of both factors. In our analysis, in addition toworking with the whole sample of firms, we analyze the performance of thegroup of regulated and unregulated firms. Our definition of a regulatedfirm is slightly ad hoc: a firm is regulated if the government, through inter-ventions in the market or through rate regulation, has the ability to changeits profitability.16 This implies that all electric distribution companies areregulated for our purposes, as are local and long-distance telephone com-panies.17 IANSA, the sugar refining monopoly, is a doubtful case, sincehigh trade barriers protect it. IANSA was assumed to be unregulated, butresults do not change if we group it among the regulated firms.
We have defined investment as the difference between net physical assets(that is, accumulated depreciation is subtracted from accumulated invest-ment) at time t minus the same variable at t � 1.
To measure the impact of privatization on firms, we exclude the twoyears immediately before and after privatization. As described in La Portaand López-de-Silanes (1999), there is a potential cleansing effect in the ac-counts before the sale of the company, while the two years following priva-tization might not be representative of the postprivatization performance ifthe firm is still undergoing a reorganization process. Hence, we compareyears three to five before privatization with years three to five after privati-
214 FISCHER, GUTIÉRREZ, AND SERRA

zation. Nevertheless, we have examined the data in the three years beforeprivatization to get a feeling for the cleansing effect.
Treatment of Mergers and Divestitures
Using data three to five years before and after privatization creates its ownset of problems. Some firms were spun off just a short period before beingprivatized. For instance, Chilectra was divided into three firms before pri-vatization. Six regional distribution companies, Colbún, and smaller gen-erating companies were spun off from ENDESA. The problem is thatpreprivatization FECUs for the newly independent firms do not exist, anddetermining the change in performance caused by privatization is there-fore not straightforward. Similarly, in the case of mergers, we do not havepostprivatization independent FECUs. In these cases we have to reworkthe data in order to assign the assets of the original firms to each daugh-ter firm. Conversely, when the firms are merged, we have to “disassemble”the merged firm into its original constituents.
The procedure we follow is to assign the different variables in propor-tion to their fraction of the merged firm at the time of privatization. Forexample, suppose that firm A splits off from firm Z and both are priva-tized. To obtain data on a variable prior to privatization, we take the dataat privatization and consider the proportions of that variable for the com-bined firm. We then assign the data in the combined FECU or variablesnot in the FECU (before privatization) in those proportions. A similarprocedure is used to analyze data for merged firms.
Data Adjustments
To eliminate the effect of economic conditions on the performance offirms, we also present normalized comparisons. Subtracting the averagevalues of the performance ratios for the two-digit SIC group to which theybelong normalizes firm performance ratios. Although the two-digit de-composition encompasses widely differing industries, going to more digitsin the decomposition would not have been useful, since the firms in ques-tion represent most if not all of the industry at more detailed SIC levels.We have subtracted the two-digit averages rather than using ratios becauseof the extreme variations in these ratios, which would have given excessiveweight to some observations. Moreover, the interpretation is simple: if anadjusted ratio for a privatized firm is negative, the ratio for that firm isworse than the average of that variable in its (two-digit) sector. Some two-digit average ratios have been treated differently because of the extremevariation in the data. For example, consider the ratio of net income to sales(or to property, plant, and equipment) for a small timber company in thecontrol group that sells a forest. This is nonoperational income, there arevery few sales, and the ratio of net income to sales is astronomical. In these
THE EFFECTS OF PRIVATIZATION ON FIRMS: THE CHILEAN CASE 215

cases we have taken the sum of net income for firms in the control groupand divided it by total sales of the firms in the control group to obtain amore reasonable result.
Effects of Privatization on Chilean Firms
We analyze the firms before and after privatization both in terms ofabsolute performance and by comparing them to a benchmark given bythe average behavior of their sector at the two-digit level, as mentionedpreviously. The first part of the analysis in each subsection is devoted tounadjusted data. Perhaps the most interesting result we obtain is the dif-ference between the performance of regulated and unregulated firms.Detailed tables and figures showing the pre- and postprivatizationperformance appear in the appendix.
Profitability
Before privatization, in contrast to Mexico (see La Porta and López-de-Silanes 1999), Chilean SOEs were fairly profitable. That was the case formost of the large SOEs that were privatized, as shown in table 5.6, so thefirms did not have to go through the large changes that were required inother countries. Even though, on average, privatized firms were profitable,several smaller firms (and a few large ones such as ENDESA in 1985) didhave losses before privatization. If anything, at the time there were com-plaints that the government was selling the crown jewels. Hence, the scopefor efficiency benefits from privatization was relatively small.
216 FISCHER, GUTIÉRREZ, AND SERRA
Table 5.6 Net Income to Equity for Privatized Firms beforePrivatization, 1970–86
YearFirm 1970 1974 1979 1983 1986 privatized
CAP 10.9 0.5 0.2 0.7 2.3 1986Chilectra 0.5 �3.2 2.6 4.6 — 1986CTC 0.7 �4.1 1.7 11.9 10.9 1987ENDESA 0.3 �4.3 2.4 6.4 4.9 1988ENTEL �0.7 �3.4 12.3 13 35.4 1988IANSA �9.3 12.1 �9.8 �24 5.5 1988Lab. Chile 4.1 7.9 0.5 �196.4 12.8 1989Soquimich �65.3 11.9 �7.9 10.1 30.8 1986
— Not available.Source: Sáez 1996.

Using table 5A.1 of the appendix, which is analogous to the first partof table IV in La Porta and López-de-Silanes (1999), we can analyze prof-itability before and after privatization. If we consider the profitabilityvariables—operating income to sales (OI/S), operating income to physicalassets (OI/PPE, or property, plant, and equipment), net income to sales(NI/S), and net income to physical assets (NI/PPE)—we observe that thereseems to be a significant change in the profitability ratios before and af-ter privatization. In particular, we observe that NI/S rose from less than2 percent to 13 percent, on average, and that NI/PPE rose from less than4 percent to more than 16 percent. Moreover, the profitability measuresare strongly positive.
This change in profitability, however, comes mainly from the changein the results of regulated firms. While the profitability ratios improvefor the group of unregulated firms, there is enough variation in theresults that we cannot show that the change is significant. The importantratio NI/PPE increases from a low of 4 percent to a fairly reasonable rateslightly above 12 percent. By contrast, in the case of regulated firms thechange in profitability ratios is far more important. The ratio NI/PPErises from 3.5 percent to 20.5 percent, and the same pattern of large in-creases in profitability of regulated firms occurs for the other profitabil-ity ratios.
When we consider adjusted variables (appendix table 5A.4), obtainedby normalizing the profitability ratios by subtracting the average ratio oftheir sector, we find that the improvement is less significant. This impliesthat part of the improvement observed in the unadjusted data can beexplained largely by a simultaneous improvement in the average prof-itability of the sector. Nevertheless, the ratio NI/PPE for the sample offirms rises from 1.5 percent above the average in the sector to almost 10percent. What is interesting is that the profitability ratios with respect tosales are not significantly different from those of the industry as a whole,which seems to indicate that the increased profitability is related tobetter use of physical assets or, alternatively, to overinvestment beforeprivatization.
As in the case of unadjusted variables, most of the change in prof-itability results from the increase in the profitability ratios of the regu-lated firms. While adjusted profitability of unregulated firms increasesafter privatization, the increase is insignificant. Moreover, the profitabil-ity of these firms is not significantly different from that of the other firmsin their sector. By contrast, all adjusted profitability ratios except for NI/Sincrease significantly after privatization in the group of regulated firms.Moreover, these firms, which had average profitability similar to that oftheir sectors, became much more profitable afterward, seeming to indi-cate that the regulators were unable to pass the gains in efficiency on toconsumers.
THE EFFECTS OF PRIVATIZATION ON FIRMS: THE CHILEAN CASE 217

Efficiency
Efficiency is described by the ratios of cost per unit (cost/sales) and salesto physical assets (S/PPE), shown in appendix table 5A.2. The cost-per-unit ratio falls by a small but significant amount at the 10 percent level forthe sample of privatized firms. The S/PPE ratio falls slightly but insignifi-cantly. Once again, there is a large difference in the behavior of regulatedand unregulated firms. Cost per unit falls significantly for regulated firms,while it barely changes for unregulated firms. Similarly, the S/PPE ratio in-creases significantly (at 10 percent) for the regulated firms, whereas it fallsfor unregulated firms.
When we examine adjusted efficiency ratios (appendix table 5A.5),we observe that there is no difference between the privatized firms andthe cost per unit in their sectors, and there is no change postprivatiza-tion. Moreover, for this ratio there is no difference between regulatedand unregulated firms. Things are different for the S/PPE ratio, since theprivatized firms seem to have much higher ratios than the average fortheir sector.
Assets and Investment
Appendix table 5A.3 shows variables related to assets and investment. Weuse net investment, defined as the year-to-year difference in the depreci-ated stock of fixed assets. The average value of the logarithm of physicalassets (the log of the geometric mean of PPE) shows a slight increase,which is not significant, after privatization.18 The change is concentratedin the regulated firms, where the effect is statistically significant. The in-vestment to sales ratio (I/S) fell after privatization but not significantly.This would seem to indicate that firms invested more productively. An al-ternative explanation is that SOEs that operated in a competitive settingwere investing efficiently before privatization so there was not that muchscope for improvement.
The ratio of investment to physical assets (I/PPE) for the whole set offirms fell, but again, the effect is not statistically significant. There was afall in this ratio for the unregulated firms and an increase for regulatedfirms (again, insignificant). The ratios of investment per employee (I/em-ployee) increased, but not significantly. Physical assets per employee(PPE/employee) increased significantly after privatization. This seems toimply that workers had access to better equipment, but what is interestinghere is that it is in the unregulated firms that the increase is more signifi-cant (at 10 percent).
When we consider adjusted ratios (appendix table 5A.6), no significantchanges appear in the behavior before and after privatization, except forthe investment-to-sales (I/S) ratio, which is lower than average in the sec-tor before privatization and approaches the average—but is still lower—
218 FISCHER, GUTIÉRREZ, AND SERRA

after privatization. This effect is significant both for the whole sample offirms and for the regulated firms.
Productivity
In appendix table 5A.2 we show the labor productivity ratios of sales to em-ployees and operating income to employees. Both of these ratios show thatproductivity increased significantly as firms became private, as expected.Once again, however, most of the change was attributable to the behaviorof regulated firms, for which sales-to-employment ratios increased by 88percent and operating-income-to-employment ratios rose by 325 percent.We were unable to obtain employment data for all the firms in a sector atthe two-digit level, so we have not been able to compare the growth in pro-ductivity of privatized firms with the other firms in their sectors.
We have also examined physical productivity for firms for which wecould obtain measures of physical product (tons, passengers per kilome-ter, gigawatt hours [GWh], and so forth) as shown in appendix table5A.8. We have used these variables to construct productivity ratios, andthen we have taken the percentage difference before and after privatiza-tion. The results show that firms increased their productivity by about 25percent on average after privatization, but there is enough variation in thedata that this is not significant for the whole sample nor for regulated orunregulated firms separately. Some caution is required in the use of thesedata, however: most firms have more than one line of production, andtherefore a fall in physical productivity on the basis of one product maymean nothing. As an example, the airline LAN Chile seems to have de-creased its productivity in terms of passengers per kilometer after privati-zation. However, after privatization, the firm launched a successful cargobranch, the revenues of which are generally on par with those of the pas-senger segment of the company. Therefore, the data in this section mayshow that productivity has increased in physical terms, but without theprices of these different products and their production, this comparisonis not very informative.
Employment
As can be seen from table 5.7, there is no evidence that firms fired work-ers during the 1983–92 period, which includes the years in which the firmswere privatized. In fact, it appears that firms took on more workers on ag-gregate. Moreover, it is clear that SOEs reduced their employment levelsseveral years before they were privatized (more than three years in mostcases). However, different firms were privatized at different times, andtherefore it is interesting to see if this continues to hold for the completesample of privatized firms, considering the time at which they were priva-tized. To examine this issue, we use appendix table 5A.7. Again, there is
THE EFFECTS OF PRIVATIZATION ON FIRMS: THE CHILEAN CASE 219

no evidence that firms fired workers after privatization. Employment in-creased slightly but not significantly after privatization: the average firmgrew from 1,193 to 1,381 employees. Both regulated and unregulatedfirms grew in size. Note that on average, unregulated firms are larger.
Privatization of Regulated Sectors: The Efficiency ofPrivatized Utilities
In this section we provide an assessment of the privatization-cum-regulation process of electricity and telecommunications companies car-ried out between 1985 and 1989. The evaluation considers the aims ofthe privatization efforts, namely, to provide capital for expansion of util-ities that the state was not able to fund at the necessary level, to enhancethe efficiency of enterprises, and to transfer those efficiency gains to con-sumers. In the previous section we showed that SOEs increased theirprofitability and efficiency after privatization. These changes, however,are in line with those of their corresponding industries in the case of un-regulated firms. But firms that provide regulated services stand apart.Their profitability increased more than did that of their unregulatedcounterparts. This difference must be attributed to the interplay betweenprivatization and regulation.
220 FISCHER, GUTIÉRREZ, AND SERRA
Table 5.7 Employment Changes in Privatized Firms, 1970–92
YearFirm 1970 1973 1979 1983 1986 1992 privatized
CAP 7,025 11,637 9,321 6,519 6,667 9,643 1986Chilectra NA 4,250 4,196 3,846 4,133 4,712 1986CTC 5,887 7,252 7,206 6,338 6,938 8,504 1987ECOM 188 341 333 165 149 — 1986ENAEX 344 340 394 388 470 — 1987ENDESA 6,512 8,504 4,270 2,705 2,905 2,980 1988ENTEL 1,161 1,458 1,236 1,338 1,402 1,748 1988IANSA 2,827 2,881 1,597 1,079 2,027 1,561 1988Lab. Chile 3,608 4,546 2,059 1,372 883 797 1989Soquimich 10,814 10,684 7,109 4,096 4,704 3,242 1986
— Not available.Note: ECOM went bankrupt before 1992.Source: Sáez (1996), except data for 1992, which is from the FECUs (Ficha
Estadística Codificada Uniforme). Data for ENDESA (apart from 1970) fromHachette and Lüders (1994). Data for Chilectra from Sáez (1996), except for 1986and 1992. Those years obtained by aggregation of all the firms that were originallypart of the firms in 1980 using data in Hachette and Lüders (1994) for 1986.

The Privatization Process
The government privatized most of the telecommunications and electric-ity industries between 1985 and 1989. Some of the smallest companieswere sold through public auctions. Larger firms were privatized through avariety of mechanisms: sale of shares on the stock market; the periodicauction of packages of shares on the stock market; and the direct sale ofshares to employees of privatized firms (labor capitalism), public employ-ees, and small investors (popular capitalism).
In the late 1970s the telecommunications industry was dominated bytwo public enterprises: CTC, which provided basic telephone servicethroughout almost the entire country, and ENTEL, the only internationallong-distance provider. These two companies shared the domestic long-distance market. The state also owned two regional local telephone com-panies (CNT and Telcoy) and Correos y Telégrafos, which provided tele-graph service. In 1982 the government sold CNT and Telcoy throughpublic bidding. However, the privatization of the large telecommunica-tions firms started only in 1985. By the end of 1987, 25 percent of theequity of CTC was in private hands. In 1988 the government sold 45 per-cent of the ownership of the company to a foreign investor. In the case ofENTEL, in 1985 and 1986 the government sold 30 percent and 3 percent,respectively, of its shares, most of which were acquired by pension funds.In 1988 the state further reduced its stake in ENTEL to 37.7 percent. Thistime, company workers were the main purchasers (12.5 percent). The rev-enues from the privatization process of the main telecommunicationsfirms appear in table 5.8.
The privatization of the two largest electric power companies (EN-DESA and Chilectra) started in 1986. To create competition in thewholesale electricity market, they were restructured before privatization.The restructuring involved separating distribution from generation. EN-DESA, the largest company, was divided into six generating companies,six distribution companies, and two small, isolated companies combin-ing generation and distribution in the southern part of the country.
THE EFFECTS OF PRIVATIZATION ON FIRMS: THE CHILEAN CASE 221
Table 5.8 Privatization of Chilean Telecommunications Firms,1984–89(US$ million)
Firm 1985 1986 1987 1988 1989 Total
ENTEL 0.2 36.7 8.4 81.8 105.0 232.2CTC 0.7 4.7 27.1 262.2 87.1 381.7Telex 0 14.2 0 0 0 14.2Total 0.9 55.6 35.5 344.0 192.1 628.1
Source: Corporación de Fomento (CORFO) annual reports.

Chilectra was divided into three firms: a generating company and twodistribution companies. Most of the firms were under private control by1989. The revenues from the privatization process of the main electric-ity firms appear in table 5.9.
The Regulatory Framework
Some services provided by utilities were considered to be natural mo-nopolies, and therefore the development of regulatory institutions pre-ceded their privatization. Regulatory bodies were created in the late1970s for each sector: the National Energy Commission (CNE) and theUndersecretariat of Telecommunications, respectively. They are re-sponsible for granting operating licenses, monitoring technical stan-dards, and setting rates for services where competition is insufficient.Regulation, operation, and, to some extent, policymaking had previ-ously been in the hands of the SOEs themselves. Moreover, new regu-latory legislation was introduced in 1982. The aims of these laws wereto create the conditions for competition to arise whenever possible andto guarantee, in cases where there was insufficient competition, that
222 FISCHER, GUTIÉRREZ, AND SERRA
Table 5.9 Privatization of Electric Power Firms, 1984–89 (US$ million)
Firm 1985 1986 1987 1988 1989 Total
DistributionChilmetro 10.0 36.0 83.3 0 0 129.3Chilquinta 2.4 11.1 18.7 0 0 32.2Emec 0 6.0 7.5 0 0 13.5Emel 0 7.9 0 0 0 7.9Emelat 0 0 9.7 0.9 0 10.6Emelari 0 0 0 0 3.1 3.1Eliqsa 0 0 0 0 4.8 4.8Elecda 0 0 0 0 6.1 6.1Generationa
Endesa 0 0 180.0 585.4 63.8 829.2Pullinque 0 0 62.0 0 0 62.0Chilgener 4.0 22.2 31.8 33.8 0 91.8Pilmaiquen 0 41.1 0 0 0 41.1IntegratedEdelmag 0 0 0 4.8 0.1 4.9Total 16.4 124.3 393.0 624.9 77.9 1,236.5
a. Excludes Pehuenche, which was sold as a project for $7.6 million.Source: Corporación de Fomento (CORFO) annual reports.

the efficiency gains expected from privatization would be transferredto consumers.
Under these rules, concessions to operate utility services are not ex-clusive, and objective, nondiscriminatory criteria govern the granting oflicenses. Only technical reasons, as in the case of mobile telephony, maylimit the number of operators. At the same time, legislation mandatesthat service be provided within the area of the concession, defines conti-nuity and quality standards, and requires interconnection with otherfirms when regulators deem this to be necessary. Rates of regulated serv-ices are based on the long-term marginal cost of a hypothetical efficientfirm. Prices are set every four (electricity distribution) or five (basictelephony) years, and within the price-setting periods they are indexed tothe prices of the main inputs used to provide the service. The separationof rates from current costs is intended to create an incentive for firms tobe efficient.
Chile’s regulations did provide for open access to essential facilities butdid not initially regulate access charges. Moreover, Chilean legislationdoes not preclude vertical integration. Thus, in 1992 Enersis, a holdingcompany that owned distribution companies supplying 44.4 percent of themarket in the Central Interconnected System, took control of ENDESA,the largest power generation company, which in turn owned the maintransmission system. It is fairly well known that regulated monopolies thatare vertically integrated into unregulated segments may have an incentiveto sabotage their downstream competitors (Beard, Kaserman, and Mayo2001). Accusations by their competitors that integrated monopolies werediscriminatory led to regulatory changes. In 1994 the telecommunicationslaw was amended to mandate the regulation of access charges to the localtelephone network. In 1997 the Antitrust Commission instructed EN-DESA to recharter its transmission subsidiary as a public corporation andopen its ownership to the participation of other shareholders. ENDESAsold the transmission subsidiary in 1999.
The Electricity Sector. Legislation regulating the electric power sector dis-tinguishes among three distinct activities: generation, transmission, anddistribution. Only distribution firms need concessions. Distribution li-censes are granted for indefinite periods but may be canceled if the qual-ity of service falls below the legal standard. Power-generating firms andtransmission companies within the same area must interconnect, and theymust coordinate their operations through an economic load dispatch cen-ter (CDEC). This center’s aims are to guarantee the most economicaloperation of all generating facilities, to guarantee the right of power-generation companies to sell energy at any point in the system, and to safe-guard the security of the system. All plants must be available for dispatch(refusal to provide energy when requested can lead to severe penalties), un-less maintenance has been scheduled. The optimal operation of the various
THE EFFECTS OF PRIVATIZATION ON FIRMS: THE CHILEAN CASE 223

facilities, independently of existing supply contracts, calls for transfers ofenergy to be made between power generators at the so-called spot price,which is the operational (or marginal) cost of the most expensive plant inoperation at a given time.
The Chilean regulatory system distinguishes between large and smallcustomers. Large customers, with maximum power demands above 2megawatts (MW), are free to negotiate the terms of their supply with thevarious generating firms. Small customers, in contrast, purchase energyfrom distribution companies at regulated prices, which are made up of twocomponents: the node price, at which the distribution firms buy energyfrom power-generation firms, and the value added of distribution, whichpays for distribution services. Distribution charges are computed for thevarious urban or rural areas in such a way that an efficient firm operatingin an area with those characteristics would make a 10 percent return onthe net replacement value of its assets. This charge is calculated as aweighted average of the findings of outside studies contracted by the in-dustry and the national energy commission, respectively, with the com-mission study accounting for two-thirds. This figure is applied to the realfirms to calculate average profit levels for the industry over the net re-placement value of assets. If these average profit ratios are more than 14percent or less than 6 percent, distribution costs are adjusted to the nearestof the two ranges.
The node price, in turn, has two components: the price of energy and theprice of peak power. To guarantee stable rates for small consumers, theprice of energy is computed every 6 months as an average of the marginalcosts expected over the next 48 months, using projections of demand, fuelprices, water reserve levels, generating plants under construction, and theindicative investment plan drawn up by the national energy commission.The price of peak power is defined as the annual cost of increasing powerduring peak hours with the least expensive type of plant. This cost is in-creased to take into account the reserve margin (or security level) of thesystem.
Large customers (including distribution companies) are required tohave contracts with generating companies. In turn, every power-genera-tion company must have the capacity to meet the yearly energy contracts,bearing in mind potential dry spells that would affect the hydroelectricplants and the average capacity of thermal-generation units. Power-generation firms must also be able to satisfy peak demand, measured asthe average gross hourly demand they have undertaken to supply theircustomers at the system’s peak times. A yearly determination is made ofpower and energy deficits or surpluses incurred by the generation com-panies with respect to their supply contracts that would give rise to trans-fers between producers. The terms of energy transfer arrangements arenegotiated between the firms, while transfers of peak power are made atthe price set by the regulatory commission.
224 FISCHER, GUTIÉRREZ, AND SERRA

Finally, power-generating firms pay the marginal cost plus a fee (the“basic” fee) for the use of the transmission lines. Given that there are sig-nificant economies of scale in building lines, marginal-cost pricing doesnot allow for recovery of all transmission costs. The difference betweenthe total cost of a line and the revenue collected through marginal costsis designated as the basic fee. Then, for each line, the basic fee has to bedistributed among the various power-generating firms. The basic fee isnegotiated between the transmission company and the generating com-pany, and disagreements must be settled by arbitration. The assignmentof the basic fee cost of a line among the various generating firms is basedon the firm’s demand at the moment of maximum total demand. Theforegoing criteria have no solid conceptual basis, particularly with re-spect to the assignment of the entire transmission cost to the generatingfirms.
Telecommunications. The legislation governing telecommunications gen-erally provides for free market pricing of telecommunications services.However, rates are regulated for those services that the Antitrust Com-mission considers to be provided under conditions of inadequate compe-tition.19 The telephone companies themselves, on the basis of guidelinesset by Subtel (Subsecretaría de Telcomunicaciones, a department underthe Ministry of Transportation and Telecommunications), carry out thestudies that are used to set rates. The companies hand in these studies toSubtel, which has 120 days to present its objections and counterproposals.A committee of three experts arbitrates disagreements between the com-panies and Subtel, with respect to both guidelines and objections. Thecompany appoints one member of the committee, the regulator appointsthe second one, and the two parties agree on the third. Although the reg-ulators make the final decision, they tend to follow the recommendationsof the experts, since the companies are otherwise likely to go to court.
The ambiguities of the 1982 law had created a legal monopoly in thelong-distance service market. In 1989 a number of companies applied toSubtel for licenses to operate this service. The final decision was nothanded down for several years because of the indecisiveness of the courtsas to whether or not vertical integration of local and long-distance serviceshould be allowed. Finally, in 1993 the Antitrust Commission authorizedthe participation of local telephone companies in the long-distance mar-ket. In 1994 the law was modified to introduce competition to long-distance service through a multicarrier system, and following the ruling ofthe commission, it imposed restrictions on local telephone companies thatwished to operate in the long-distance market. In the first place, they hadto do so through subsidiaries organized as independent joint-stock com-panies, subject to supervision by the Superintendent of Securities and In-surance (the Chilean Securities and Exchange Commission). The law alsorequired that local telephone firms not discriminate among long-distance
THE EFFECTS OF PRIVATIZATION ON FIRMS: THE CHILEAN CASE 225

carriers with respect to quality of service and information on long-distancetraffic demand. Moreover, the charges to access the local network wereregulated.
In 1988 the government set standards for mobile telephone service, al-though an early entrant had had a concession since 1981. The new regu-lations created two concession areas for mobile service, with two licensesin each area, to be granted on a first-come, first-served basis. In Novem-ber 1996 Subtel granted three nationwide personal communications sys-tem (PCS) licenses, using a “beauty contest” in which geographic coveragewas the key bidding variable. Until 1999 subscribers had to pay the samefee for both the calls they made and the calls they received, which was adisincentive to the use of mobile phones. In February 1999 the regulatorintroduced a “calling party pays” principle, under which callers pay for allcharges (including the regulated access charges) when using mobilephones.
Evaluation of Privatization in the Regulated Sectors
An assessment of the privatization efforts carried out at electricity andtelecommunications companies between 1985 and 1989 should considerthe objectives of the process. As we mentioned earlier, the goals were toincrease the efficiency of these firms and to invest in new capacity. There-fore, a complete evaluation of the privatization-cum-regulation processwould require, as a counterfactual, a prediction on how the privatizedfirms would have developed had they remained in the public sector. Herewe take a more modest approach. We analyze, for each sector, the post-privatization evolution of a set of variables and relate their behavior to theregulatory changes. In particular, the comparison between regulated utili-ties and those that operate in competitive markets makes it possible todraw inferences regarding the effectiveness of the regulatory system. Insome cases, the differences are so significant that inferences can be drawndespite the obvious limitations of this approach.
The Electricity Sector. Between 1988 and 2000 electricity generation grewfrom 16,914 GWh to 39,142 GWh, and installed capacity rose from 4,016MW to 10,045 MW. In the Central Interconnected System, capacity grewless than electric generation, as peak demand grew at a lower rate duringthose years because of the use of peak-demand pricing.20 Moreover,power-generating firms have generally invested earlier than required un-der the government’s indicative investment plan. Despite the installationof new capacity ahead of the plan, there have been periods of energyshortages in the system because of its heavy dependence on hydroelectricpower (in rainy years, such as 1992, 97 percent of generation is providedby hydroelectric power). These outages, however, seem to have beencaused by regulatory failures.
226 FISCHER, GUTIÉRREZ, AND SERRA

Small customers face regulated (forward-looking) energy prices. Thisprice inflexibility, however, should not be an obstacle to market clearingeven in very dry years. If generating companies were to compensate usersby an amount equal to the outage cost per unit of undelivered energy dur-ing a severe drought, this would make users indifferent to a reduction intheir energy consumption, so that in theory, the supply deficit should beeliminated.21 Unfortunately, this compensation mechanism has never beenused. Changes to the law (introduced at the suggestion of the largest hy-droelectric operator) eliminated these compensations when the drought ismore severe than in the driest year that is used in computing the nodeprice, leaving an incomplete price system. Moreover, no procedures wereintroduced to deal with that case. After the 1998 blackouts the law wasmodified and now imposes compensations under all circumstances. In re-sponse, generators have not renewed their contracts with distributors tosupply energy at the node price, leading to an impasse.
Labor productivity in the privatized companies has improved consider-ably. In ENDESA power generated per worker rose from 2.2 GWh in1989 to 18.1 GWh in 2001 (table 5.10). If we consider only employeesworking in the holding company and in the generation subsidiaries, thepower generated per worker rose from 6.3 GWh in 1991 to 28.7 GWh in2000. Labor productivity in electricity distribution also grew substantiallyafter privatization. For example, Chilectra, the largest distributor, hasmore than doubled its annual sales of electricity since privatization, from3,612 GWh in 1987 to 9,253 GWh in 2001, and its customer base hasgrown from 973,000 to 1,289,000. The number of workers, meanwhile,fell from 2,587 to 722, and the number of clients per worker grew from376 in 1987 to 1,785 in 2001. In addition, energy losses fell from 19 per-cent to 5.4 percent in the same period (table 5.11).
Table 5.12 shows the node prices in the two main interconnected sys-tems (Sistema Interconectado Central and Sistema Interconectado delNorte Grande) in current dollars and pesos. There has been a clear down-ward trend in energy prices since generating firms were privatized. In con-stant pesos, the drop is approximately 33 percent for the central system and73 percent for the northern system. This drop is explained primarily by thedecline in the prices of fuels used at the thermoelectric plants (partly due tothe appreciation of the peso), which play a part in determining marginalprices. In the central system, the fall was particularly sharp from 1997 on-ward, owing to the anticipation of the arrival of natural gas supplies fromArgentina (recall that the regulated price of energy is forward-looking). Agreater load factor as a fraction of installed capacity (that is, the system op-erates closer to capacity) and the transfer to consumers of these gains inproductivity also help explain the lower prices. The profits of the mainpower-generating company have increased moderately since privatization,reaching a peak of 15.7 percent return on equity in 1995 and declining inthe following years. This decline is a result of unfavorable hydrological
THE EFFECTS OF PRIVATIZATION ON FIRMS: THE CHILEAN CASE 227

228
Table 5.10 ENDESA: Investment, Power Generation, and Labor Productivity
Investment, Investment, Domesticdomestic foreign generation
Year (US$ million) (US$ million) (GWh) All Generationb All Generation
1988 — — 7,420 — — — —1989 110 — 6,649 2,980 — 2.2 —1990 — — 6,608 2,883 — 2.3 —1991 131 — 8,521 2,445 1,357 3.5 6.31995 180 119 11,783 2,255 1,038 5.2 11.41999 301 362.4 13,672 1,383 711 9.9 19.22000 145 78 15,346 888c 574 17.3 26.72001 — — 15,741 — — — —
— Not available.Note: GWh � gigawatt hours.a. In GWh per worker.b. Assumes that 30.5 percent of employees work in transmission in 1991 and 1992 (the 1993 figure).c. The reduction in the labor force is partially explained by the sale of the transmission subsidiary.Source: ENDESA (Empresa Nacional de Electricidad) annual reports.
Labor productivityaLocal workers

THE EFFECTS OF PRIVATIZATION ON FIRMS: THE CHILEAN CASE 229
Table 5.11 Chilectra: Sales, Employees, Labor Productivity, andEnergy Loss
Item 1987 1988 1989 1990 1995 2000 2001
Sales (GWh) 3,612 3,844 4,070 4,230 6,676 8,854 9,523Customers 973 1,008 938 935 1,100 1,262 1,289Employees 2,587 2,565 2,144 2,159 1,801 867 722Labor 376 393 437 433 610 1,455 1,785
productivitya
Sales per 1.4 1.5 2 2 3.7 10.2 12.8workerb
Energy losses 19.8 18.8 16 14 9 5.2 5.4(percent)
Note: GWh � gigawatt hour.a. Customers per worker.b. GWh per worker.Source: Chilectra annual reports.
Table 5.12 Change in Node Prices and Residential Rates
Node price Residential
Year Centrala Northa Centralb Northb Centralb
1987 22.2 53.4 2.4 5.9 14.731988 26.1 49.7 2.9 5.6 15.871989 26.8 51.7 3.3 6.4 16.971990 22.6 59.5 3.0 7.9 18.151991 19.3 47.8 2.6 6.5 15.831992 18.9 36.9 2.9 5.6 15.721993 20.4 37.8 3.1 5.7 15.081994 21.1 34.7 3.7 6.1 15.311995 18.4 23.1 3.7 4.6 15.441996 15.4 23.5 3.1 4.8 14.651997 12.7 18.8 2.7 4.0 13.771998 10.7 14.0 2.1 2.8 12.161999 11.4 11.4 2.1 2.1 12.162000 14.9 13.7 2.6 2.4 —
— Not available.a. October 2,000 pesos per kilowatt hour.b. Current US cents per kilowatt hour.Source: National Energy Commission (CNE).

conditions and the fact that the installation of more efficient combined-cyclegas turbines and the arrival of natural gas from Argentina have reduced theeconomic value of existing plants.22 Note that the fall in profitability ingeneration led to further labor productivity gains in the late 1990s.
Regulation of distribution firms has been less successful. According todata from the Ministry of Economics, the value added (that is, the chargeto consumers) of distribution for Chilectra fell by 18 percent in the rate-setting process of 1992 and by an additional 5 percent in the rate-settingprocess of 1996. However, this price reduction does not match the effi-ciency gains achieved after privatization. This situation led to increases inthe profits of distribution companies. The return on equity obtained byChilectra increased from 8 percent in 1988 to 32 percent in 1996–98. Inthe 2000 rate-setting process, rates were reduced by a further 18 percent,which led to lower profit margins at first. In response, Chilectra increasedlabor productivity substantially. The rest of the industry has gone througha similar process.
The profit levels in distribution are much higher than those of the gen-erating companies, which in any event are subject to greater risks, both forlack of a secure market (they operate under competition) and because ofthe potential for droughts (table 5.13). Some of the distribution industryprofits come from unregulated services that are unlikely to become com-petitive, because they are closely related to regulated services, as in the caseof the renting of meters. Distribution companies also obtain significant re-turns by allowing phone and cable TV companies to hang cables on theirpoles. However, these returns are not considered when estimating the in-come of the efficient firm, so, in effect, consumers can pay more than twicefor the same infrastructure.
Telecommunications. Since privatization, the telecommunications sectorhas experienced rapid growth, as shown by all indicators. Between 1987and 2001, the number of lines in service rose by a factor of almost six, sothe line density rose from 4.7 to 23.1 lines per 100 inhabitants (table 5.14).In the main local phone company (Telefónica), which accounts for 76 per-cent of all subscribers, average installation time was reduced from 416 daysin 1993 to 6 days in 2001, and the waiting list, which in 1987 included236,000 people, had been reduced to 32,000 by 2001, having reached apeak of 314,000 in 1992. Digital conversion rose from 36 percent in 1987to 100 percent in 1993. Long-distance traffic also grew significantly. Out-going international traffic rose by a factor of 10, from 21.2 million minutesin 1987 to 241.0 million minutes in 2001. Growth was especially rapid af-ter the introduction of competition in long-distance services (table 5.14).The number of lines per worker in the largest telecommunications firmgrew from 74 in 1987 to 845 in 2001 (table 5.15).
This period also saw the emergence of new services, such as beepers,data transmission, private networks, and the Internet. However, the new
230 FISCHER, GUTIÉRREZ, AND SERRA

231
Table 5.13 Profits of the Main Electric Sector Companies: 1987–2000(percent)
Distribution Generation
Year Chilectra CGE Chilquinta Saesa ENDESA Gener ElectroAndina Edelnor
1987 — 18.5 8.8 17.6 5.2 3.1 — �7.71988 7.4 19.7 12.4 19.9 13.7 7.8 — �2.81989 21.3 17.8 19.5 25.9 7.7 8.4 — �0.71990 22.9 17.5 19.5 25.2 6.4 9.4 — 3.31991 19.4 16.5 21.7 26.6 10.4 7.4 — 3.01992 17.3 16.7 42.3 24.9 13.5 7.3 — 3.41993 14.5 18.3 15.7 27.1 11.0 8.6 — 3.41994 17.9 17.1 7.9 22.5 15.7 8.4 — 7.21995 27.6 21.1 9.5 24.8 14.5 11.6 — 2.31996 32.1 22.0 19.8 26.3 12.7 9.5 — 0.11997 31.8 20.0 11.8 22.2 9.9 10.3 5.6 2.51998 31.6 20.2 9.3 18.6 3.6 5.9 8.2 2.61999 20.6 16.9 111.3ª 16.4 �13.5 0.8 6.2 �0.92000 16.0 15.3 8.9 29.2 9.1 0.3 8.8 �3.9
— Not available. a. Profits of Chilquinta in 1999 include nonrecurring profits from sales of shares.Source: Authors’ computations from FECUs (Ficha Estadística Codificada Uniforme).

service that has had the greatest impact is mobile services. At the end of1997, 16 years after the entry of the first operator, there were only410,000 subscribers. This number rose sharply with the fall in pricesbrought about by the entry of new PCS concessionaires. By mid-1998, thenumber of subscribers had risen to 650,000. With the introduction of the“calling party pays” system in February 1999, the number of subscribersjumped again. By the end of 2001 the number of subscribers had reached5.3 million.23 This explosion in the number of mobile phones is partiallyexplained by the high level of the access charge to mobile companies set bythe regulator. This charge was set too high, so mobile phone companieshave been willing to give away the phones in order to benefit from the ac-cess charge paid on incoming calls.
Real residential local telephone charges have increased by about 5percent since privatization (table 5.16). However, there was a simulta-neous rebalancing of rates, which makes it difficult to reach definiteconclusions about the evolution of charges. Before 1993 phones rateswere much higher for business subscribers than for residential clients.Moreover, clients have benefited from the extension of basic phone
232 FISCHER, GUTIÉRREZ, AND SERRA
Table 5.14 Telecommunications Statistics, 1987–2000
InternationalDensity traffic
Lines in service (lines/100 Mobile phones (millions ofYear (thousands) inhabitants) (thousands) minutes)
1980 363 — — 8.01985 537 — — 13.41988 631 4.9 — 27.51989 689 5.4 4.9 29.91990 864 6.5 13.9 38.81991 957 7.8 36.1 47.01992 1,283 9.6 64.4 53.11993 1,521 10.9 85.2 59.51994 1,634 11.6 115.7 63.51995 1,891 13.2 197.3 113.61996 2,264 15.6 319.5 144.21997 2,693 18.3 409.7 198.81998 2,947 20.4 964.2 215.01999 3,109 20.6 2,260.7 210.22000 3,365 22.0 3,401.5 222.52001a 3,581 23.1 5,271.5 241.0
— Not available.a. December 2001 (estimated).Source: Subtel.

zones. In fact, many calls that were previously considered long-distancecalls are now considered local calls. In 1993 rates were 8.6 percenthigher than they were in 1987 as a result of the 1988 rate-settingprocess. In the 1993 rate-setting process residential rates were furtherincreased by 9.8 percent. This rate hike was explained by the need tocompensate for the partial elimination of subsidies from long-distanceservice to local service and the unification of residential and commercialrates. Starting in 1994 access charges for long-distance calls were sub-stantially reduced.
The 1999 rate-setting process can be considered a turning point. Basicphone rates were reduced by 11 percent, at the same time that accesscharges to the local network were reduced by an average of 72 percent. Asa result, in 2001 basic phone rates for an average family were still 5 per-cent higher than in 1987, but access charges for long-distance calls weremuch lower. The deregulation of long-distance service in 1994 eliminatedthe need for rate-setting in that market. Deregulation coupled with the re-duction in access charges to the local network led to a dramatic fall inlong-distance rates. This is illustrated by the value of a one-minute call tothe United States, a route that represents 42 percent of international traf-fic. In 1987 the average per minute cost of a call to the United States was
THE EFFECTS OF PRIVATIZATION ON FIRMS: THE CHILEAN CASE 233
Table 5.15 Telefónica-CTC: Basic Fixed Phone Statistics
Lines Lines per Installation Waiting listYear (thousands) Share Workersa workera time (days) (thousands)
1980 360 99.3 6,911 52 — 1501985 505 94.1 6,894 73 — 1811988 592 93.7 7,518 79 — 2361989 646 93.8 7,366 88 — 2841990 812 94.0 7,530 108 — 3081991 997 94.3 7,994 125 — 2411992 1,213 94.5 7,991 152 — 3141993 1,437 94.5 8,133 177 416.0 1981994 1,545 94.6 7,424 208 208.9 1171995 1,754 92.8 7,449 235 169.8 521996 2,056 90.8 7,073 291 55.4 721997 2,394 88.9 6,898 347 38.6 971998 2,650 89.9 6,917 383 35.4 581999 2,592 83.4 5,649 459 15.4 272000 2,701 80.3 4,639 582 4.3 102001 2,723 76.1 3,223 845 5.7 32
— Not available.a. Excludes employees working in subsidiaries.Source: Subtel and CTC annual reports.

$1.51. If the regulated rate-setting process had remained in place, the pricetoday during normal hours would have been $2.40, instead of the currentprice of about $0.10.24
Since long-distance companies, as well as other telecommunicationsoperators, require access to local networks in order to provide service, itbecame crucial to regulate fees for access to the public network. In the1994 rate-setting process, the regulator established the rule that theaccess charge for incoming and outgoing domestic long-distance callsand outgoing international calls would be 0.63 times the charge for a lo-cal call, which is higher than the real cost of providing the service. Evenworse, the per minute access charge for incoming international calls wasset at a rate that was 14 times the local rate during normal hours and 84times the local rate during reduced-rate hours. High access charges to lo-cal networks, coupled with strong competition in the industry on thepart of the market leader, Telefónica-CTC, meant that many long-distance operators had serious financial difficulties during the 1994–99period. The local telephony companies, which were allowed to operatein the long-distance market through subsidiaries, had incentives tocharge below cost on long-distance calls, since by lowering rates long-distance traffic would increase and the companies would benefit from thehigher revenue arising from access charges to the local network, a rewardthat the other long-distance companies did not have. In response, the1999 rate-setting process reduced access rates by an additional 62.7 per-cent on national and international outgoing calls. In the case of incoming
234 FISCHER, GUTIÉRREZ, AND SERRA
Table 5.16 Cost of Local Monthly Telephone Service for theAverage Family
Year (May) US$ May 1987 pesos
1987 11.62 9,8531988 11.00 9,1511989 11.24 8,3471990 13.44 9,4751991 15.69 10,2131992 17.75 10,1561993 18.91 10,8171994 19.96 11,7421995 24.36 11,5841999 23.57 11,4322000 19.43 10,1372001 17.11 10,340
Note: Fixed charge plus variable consumption, including value added tax.Source: National Institute of Statistics (1987–98), authors’ estimations for
1999–2001.

international traffic, the charge was reduced by 97.5 percent in normalhours and by 99.6 percent in off-peak periods (from the previous highlevels). The average reduction in regulated access charges was about 72percent.
Prices of mobile telephony have also declined sharply with increasedcompetition. At the end of 1997 subscribers paid a fixed charge of 15,000pesos plus 130 pesos per minute for calls made as well as calls received.The entry of ENTEL PCS in March 1998 led to a marketing war amongoperators that entailed heavy spending on advertising and brought abouta significant decline in prices. In early 1998 Telefónica-CTC offered 60free calling minutes for a fixed monthly charge of 7,080 pesos and billedadditional outgoing minutes at 124 pesos during normal hours and 80 pe-sos during reduced-rate hours. In addition, customers who signed a two-year contract received the mobile phone for free. Other plans offered 200free calling minutes for 16,000 pesos. Clearly, increased competition sig-nificantly reduced rates.
The profitability of Telefónica-CTC increased after privatization andremained high until 1997, as shown in table 5.17. Regulators wereunsuccessful in passing Telefónica-CTC’s efficiency gains on to cus-tomers. This state of affairs changed in 1998, as Telefónica-CTC beganto shift investment toward competitive sectors such as mobile telephonyand long-distance. The rate-setting process of 1999 that lowered localrates and access charges to the local network also had a large impact on
THE EFFECTS OF PRIVATIZATION ON FIRMS: THE CHILEAN CASE 235
Table 5.17 Profits of Telecommunications Enterprises, 1987–2000 (percent return on equity)
Year CTC CNT Telcoy ENTEL Telex BellSouth
1987 11.5 20.1 20.5 56.4 n.a. n.a.1988 12.7 26.7 23.9 73.6 n.a. n.a.1989 17.8 18.7 26.2 73.8 57.4 n.a.1990 12.9 20.2 15.6 52.7 21.9 n.a.1991 16.2 22.7 16.7 50.5 14.5 n.a.1992 19.4 29.2 22.8 49.7 28.3 n.a.1993 23.0 30.2 30.4 37.4 58.9 n.a.1994 18.7 24.9 32.2 17.2 16.5 0.01995 17.3 13.7 29.2 8.4 10.2 �70.41996 20.9 21.0 37.3 2.4 5.6 �250.31997 18.7 18.6 39.0 5.1 �29.9 �1.01998 10.8 24.1 47.8 �3.8 �41.5 62.61999 �3.8 24.6 36.3 7.0 �30.1 �3.02000 �8.5 15.7 20.0 6.3 �45.1 1.1
n.a. Not applicable. Source: Authors’ figures, based on companies’ annual reports.

Telefónica-CTC. Moreover, Telefónica-CTC suffered from the devalu-ation of the peso (20–30 percent) that began in 1998, since it had nothedged its dollar-denominated debt. Another negative effect was thedecline in demand growth and the increase in nonpaying clients attribut-able to the economic slowdown that began in late 1998. Finally, Telefónica-CTC is responsible for the access charges to mobile phone companies ofits nonpaying clients, and these access charges are 20 times higher thanthose that Telefónica-CTC can charge.
Telefónica-CTC has implemented a strict cost reduction plan, which in-cludes a drastic reduction in the number of workers. This cutback resultsfrom the elimination of inefficiencies in the firm as well as the reduction inplanned investment made necessary by the decline in profitability broughton by the new rates and slower economic growth. This increase in effi-ciency allowed the company to achieve modest profits in 2001 after twoyears of large losses. Since severance payments are large, part of the ex-planation for the losses is the cost of scaling back the level of employmentin the company.
The two basic regional telephone companies that are dominant intheir respective areas (Telcoy and CNT) were less affected by the rate-setting process and have maintained their profit levels. ENTEL is in theopposite situation. While it was a regulated monopoly provider of long-distance services, its rates were much higher than the cost of providingservice, which allowed it to have profit levels of above 50 percent forseveral years. Deregulation led to dramatic falls in long-distance ratesand profits (see table 5.17). In 1998 the company reported losses result-ing from the strong competition in long distance, its restructuring costs,and the cost of entry into the mobile telephony market, where it has be-come one of the key players. In 1999 and 2000 the firm showed profitsonce again, in part because of the asymmetric access rates between thefixed and mobile networks and its successful marketing approach inmobile telephony.
In short, the telecommunications sector has been one of the mostactive in the last few years, and only since 2001 has a slowdown becomenoticeable. The increased competition in the sector has had a favorableeffect on consumers, who are spoiled for choice. Even in local calls, amarket that is monopolized in most countries, the market share of Tele-fónica-CTC has declined from 94 percent in 1987 to 76 percent in theyear 2001. There are substantial unresolved regulatory problems, how-ever. The most important revolve around the principles that should guidethe regulation of access charges. The central issue is that, apart from thedirect effect on the profitability of the company, high access rates presenta cost on competitors. One dilemma is whether access charges should bebased on costs adjusted for the demand facing a company—a principlethat Telefónica-CTC claims represents a subsidy to the competition andthat the competition deems essential for survival—or if rates should be
236 FISCHER, GUTIÉRREZ, AND SERRA

symmetric for identical services. The inclusion of fixed costs is also an is-sue in this regard: should they be included in the cost calculations?Finally, a further issue is whether time-metering of calls or access is ap-propriate when capacity is not a constraint (at least for standard tele-phone calls) due to technological change.
The underlying problem is that in the case of access charges, price com-petition can break down. Consider a situation in which users value out-going calls more than incoming calls and Telefónica-CTC’s access ratesare set low, while its smaller rivals have high regulated rates due to theirhigher costs. A Telefónica-CTC client would pay the regulated rate forcalls within the Telefónica-CTC network, but a higher rate for calls toTelefónica-CTC’s rivals. Conversely, a rival’s client faces a cheaper rate tocall a Telefónica-CTC phone. Since Telefónica-CTC is by far the largestcompany, with 76 percent of all telephone lines, most of the otherproviders’ calls end up on Telefónica-CTC’s network in any case. Since thecompetitors pay a low access rate for these calls, they might be able tocharge a low rate for phone service even though their own networks aremore expensive. Thus, the rivals can gain market share at the expense ofTelefónica-CTC by having high access charges. Of course, if users alsovalue incoming calls, this incentive to raise access charges is smaller sinceclients will not appreciate the fact that people are reluctant to call them be-cause it is expensive. Nevertheless, on balance, heavy users of outgoingcalls are more attractive to firms than clients who put more weight onincoming calls.
At the same time, the last mile is an essential facility in telecommu-nications. Last-mile technology is any telecommunications technology,such as wireless radio, that carries signals from the telecommunicationsfacility along the relatively short distance (hence, the “last mile”) to andfrom the home or business. Cable companies usually have access to thelast mile, but other operators (long-distance, mobile telephony, Internetaccess providers) require access to the local telephone network (or tothe cable network) to reach consumers. A wireless fixed system, WLL,has not been as successful as expected. Since Telefónica-CTC faces reg-ulated rates, it has incentives to become a monopoly in the competitivesectors (Beard, Kaserman, and Mayo 2001). It can achieve a monopolyby nonprice discrimination against the other operators. To reduce thisrisk and preserve competition in the other markets, the regulator mayprefer to incur the social cost of having more than one last-mile serviceprovider. Which option is better depends on the extent of economies ofphone-line density.
Infrastructure Franchises
By the early 1990s continuous high growth rates for the preceding yearshad led to congestion and severe quality problems in highways, seaports,
THE EFFECTS OF PRIVATIZATION ON FIRMS: THE CHILEAN CASE 237

and airports. Even though the government had increased the expenditurein infrastructure several times over the minuscule amounts spent duringthe 1980s, they were insufficient. Therefore, franchising became the hopefor rehabilitating and expanding public infrastructure. In 1992 a franchiselaw was passed allowing the private sector to finance and operate high-ways, airports, and other infrastructure.
Franchises have other advantages in addition to solving the problemsof governments that do not have the resources (financial, managerial,and supervisory) to provide for infrastructure needs.25 First, when thesame firm is in charge of construction and maintenance, it has better in-centives to invest in nonverifiable quality; second, justifying cost-basedtolls is politically easier when the project is a private concession; third,the cost of the project is imposed on users and not on the rest of soci-ety; and fourth, there is a built-in screening mechanism against sociallywasteful projects, since a project with a negative private return willmost likely also have a negative social return. Moreover, when franchiseauctions are open and competitive, tolls or user prices should be closeto average cost, which is second-best optimal in the presence ofeconomies of scale.
From 1994 and 2004, 32 projects were auctioned for a total of about$5 billion; about 18 are already operational. In addition, in 1997 a lawwas passed allowing franchises of the infrastructure of public ports.Currently, more than 2,000 kilometers of interurban highways togetherwith the main airports and seaports are privately managed. Even thoughthe system has been remarkably successful, several challenges remain.One of these is how to incorporate flexibility in order to react tochanged conditions (for instance, unexpected permanent increases intraffic that require widening a road or raising the toll) while at the sametime keeping a reputation for not renegotiating contracts when the fran-chise is losing money or for not expropriating money-making fran-chises. Another problem is that most of the profitable private projectshave been franchised, and the projects that remain require governmentsubsidies to attract interested bidders. The existence of government sub-sidies, however, negates many of the advantages of infrastructure fran-chises, and the optimal approach to franchising in this case is equivalentto the traditional approach of franchising the building of the road outto the lowest bidder and financing it up-front with public funds (Engel,Fischer, and Galetovic 2002).
Highways and Airports
The private sector has financed the construction of new highways andairports through build-operate-transfer concessions (table 5.18). Morerecently the government has extended the range of concession contractsto the building of water reservoirs for irrigation and to penal complexes
238 FISCHER, GUTIÉRREZ, AND SERRA

(appendix tables 5A.9 and 5A.10).26 In general the auction process forconcessions has operated as follows. The government sets the minimumtechnical specifications of the project and grants a concession for 20 or30 years to the bidder offering to charge the lowest user price for build-ing, operating, and maintaining the project. Bidders must first go througha technical vetting process that qualifies them to make an economic bid.A ceiling and a floor price are imposed. If the ceiling is reached, the bid-ders compete on the minimum subsidy requested. If the floor price is
THE EFFECTS OF PRIVATIZATION ON FIRMS: THE CHILEAN CASE 239
Table 5.18 Concessions in Operation
Investment Franchise lengthProject name Project origin (US$ million) (years)
Northern access to Public 214 28 Concepción
Access to Santiago’s Public 9 12 Airport
La Serena Airport Public 4 10Route 78, Santiago— Public 172 23.7
San AntonioRoad of La Madera Public 31 25Road Nogales— Public 12 22
PuchuncavíRoad Santiago— Private 131 28
Los AndesRoute 5, Chillán— Public 192 21
CollipulliRoute 5, Los Vilos— Public 244 25
La SerenaRoute 5, Santiago— Public 251 23
Los VilosRoute 5, Talca— Public 171 12.5
ChillánRoute 5, Temuco— Public 211 25
Río BuenoCarriel Sur Airport, Private 25 16.5
ConcepciónEl Loa Airport, Private 4 12
CalamaEl Tepual Airport, Public 6 12
Puerto MonttIquique Airport Public 6 12El Melón tunnel Public 50 23
Source: Ministerio de Obras Publicas.

reached, the firm that offers the largest payment to the state wins theconcession.
The first project, a $42 million tunnel, was put out to tender at the endof 1992, was completed on time at very close to the budgeted cost, andwas inaugurated in 1995. The most important franchised highway projecthas been the improvement of the Pan-American Highway, with a total in-vestment estimated at $2.4 billion and total length of 1,511 kilometers.The project was divided into eight segments and put out to tender, withconcessions awarded over a two-year period. The final stretch, adjudi-cated in May 1998, runs from Santiago to Talca, with an estimated costof $750 million. The concession will last 25 years. Starting in 1995 con-tracts for building and operating the cargo and passenger terminals of theeight main airports were awarded in a public bidding process. Airport con-cession-holders have invested about $271 million, of which $200 millionwere spent in Santiago.
Concessions raise important regulatory issues. There are end-pointproblems, especially regarding maintenance close to the end of the con-cession period. The length of infrastructure concessions and the rigidity ofthe contract rules pose a major dilemma. For instance, in cases of conges-tion, welfare maximization may require increases in the user fee set in theoriginal contract. The question is how to share the increased income, sincethe firm bid on a lower price and unless it gets a fraction of the increasedrevenue, prefers to keep the lower price. However, when bidders expectcontracts to be renegotiated, the benefits of competitive bidding arelargely lost, since the firm’s ability to negotiate, or its lobbying capacity,counts as much as or more than its efficiency (Williamson 1976). Short-ening the concession period is not a solution, since concessionaires wouldnot have enough time to recoup their investments, necessitating govern-ment subsidies.
The Melón Tunnel illustrates these problems. Although it had no costoverruns and was built on time, it has not been successful and is unlikelyto recoup the original investment (the firm has been incurring annual lossesof about $1.5 million). The successful bidder fell victim to the winner’scurse (fairly common in a newly developed system such as infrastructureconcessions), having offered to pay substantially more than the runner-up.The concessionaire overestimated the demand for the road at the toll ceil-ing, since a significant percentage of drivers choose the old alternativeroad.27 The winner claims that the lower-than-estimated demand resultsfrom the construction of new alternative roads and offers to reduce the tollif the government lowers the annual payment. Such an agreement wouldalmost certainly be socially beneficial in the short run, but the governmenthas refused to renegotiate on the grounds that it would set a dangerousprecedent.
Franchise-holders have discovered that willingness to pay is less thananticipated when an alternative free route is available, even if an economic
240 FISCHER, GUTIÉRREZ, AND SERRA

computation shows that the savings in time and wear and tear on the ve-hicle compensate for the toll. Even in cases in which alternatives are notcompetitive at all, demand can be highly variable and depend on macro-economic and regional effects. Moreover, the traffic on a specific roaddepends on the other links in the highway network. Thus, governmentmay affect the demand on a particular route when it alters the rest of thenetwork, and government flexibility in this respect is obviouslyrequired.28 The government dealt with this problem by introducing min-imum traffic guarantees, which promise that if traffic flows fall belowpredetermined levels (usually equivalent to the toll revenues that wouldpay 70 percent of estimated construction costs), the government willmake up the shortfall.
Giving guarantees to concession-holders makes it easier for bidders toobtain loans in the financial system, which translates into a larger num-ber of bidders and therefore greater competition. At the same time, stateguarantees have some disadvantages. First, they increase the chances thatprojects that are neither privately nor socially profitable will be under-taken. Private investors might push for higher estimated constructioncosts so that the guarantee covers all of their actual construction costs,even though they know that actual traffic would probably be much lower(given that the guarantee covers 70 percent of estimated constructioncosts). Second, it is inconvenient to eliminate all risks from the conces-sion-holder during the highway operation period, because it would meanlosing the benefits of private management. Third, guarantees create con-tingent liabilities for the government, but they are seldom valued and areexcluded in the year-to-year budget or counted as government debt.However, guarantees carry a seldom-observed political economy advan-tage: if traffic falls far below expectations, the government can alwayspoint to the guarantees as a way of reducing the pressure to renegotiatethe franchise contract.
To avoid some of the problems associated with standard auctions, thegovernment has been experimenting with a new mechanism advocated byEngel, Fischer, and Galetovic (forthcoming) for auctioning infrastructureconcessions.29 In their proposal, the regulator sets the maximum toll thatthe concession-holder can charge and then awards the concession to thefirm demanding the least present value of revenue (PVR) for building andthen operating the highway until the required revenue is collected throughtoll payments. Hence, the duration of the concession is endogenous. Thisauction mechanism reduces the risk faced by the franchise-holder, becausethe present value of the total income the concession-holder will receive isknown in advance.
An additional advantage of PVR auctions is that they are inherentlyflexible. Early termination of a concession is not a problem, if required,for instance, to widen the highway. If the government compensates theoperator with the amount remaining to be collected minus estimated
THE EFFECTS OF PRIVATIZATION ON FIRMS: THE CHILEAN CASE 241

savings on maintenance and operation costs, this is a fair compensationto the franchise-holder. Hence, PVR greatly reduces the scope for dis-agreement. The authority could also adjust the toll charged by the fran-chise-holder to more closely approximate the optimal toll given the levelof congestion.30
The highway linking Santiago and Valparaíso was auctioned usingthe PVR method. In February 1998, a Spanish consortium won the con-cession. It sought a present value revenue of UF (Unidades de Fomento)11,938,207, or approximately $400 million, an amount it expects tocollect in 15 years. The price-cap for the toll is 1,800 Chilean pesos(about $3). In this instance, the rules required that bidders seeking aminimum guaranteed income would have had to pay the governmentfor this guarantee. Remarkably, two out of four bidders, including thewinner, did not seek the guarantee. Thus, in principle, the state did notassume any risk.
Starting in 1999 the government has awarded four urban highwayconcessions in Santiago that represent a total investment of about $1.4billion (two franchises for the improvement of a road that rings Santi-ago and two that cross Santiago in the north-south and east-west direc-tions). Auctioning urban highways has proven more difficult thanexpected. First, in urban highways the range of government decisionsinfluencing traffic is much broader than in interurban highways. Theconstruction of access roads, the use of complementary or substituteroutes, the expansion of the subway system, or the introduction of tollson congested streets can affect traffic patterns. Moreover, the construc-tion of highways generates urban problems. The construction of large-capacity urban expressways can cause the deterioration of the sur-rounding area. In Santiago people living in a well-to-do residential areaadjacent to a proposed highway mounted a strong campaign against itsconstruction. Although they could not prevent its construction, theyforced major changes that increased the cost substantially. Ecologistshave opposed urban highways because they believe highways will en-courage car use and thereby increase pollution; instead they favor in-vesting in public transport. While the argument is correct when thehighways are free, it no longer holds when these highways have tollsthat depend on the level of congestion.
Concessions for Port Management and Operation
There are 10 state-owned ports and 22 private ports in Chile. The state-owned seaports have natural advantages because of their better geograph-ical locations. In general the private ports are used for bulk cargo, so theyneed less infrastructure than the state-owned ports, which tend to special-ize in general cargo (normally in containers). This type of cargo requires
242 FISCHER, GUTIÉRREZ, AND SERRA

calm waters for loading and unloading, so extensive works usually protectthe state-owned ports.
Private participation in state-owned ports started in 1981 when pri-vate firms were allowed to perform the duties of loading and unloadingships at the docks, as well as on-port storage services. This change greatlyincreased efficiency in cargo handling, making it unnecessary to invest inexpanding these ports, even though previously, under public operation,the ports were always congested. The port authority (Empresa Portuariade Chile, or Emporchi), however, retained the management of all state-owned port infrastructure, that is to say, docking sites and storage facili-ties (Foxley and Mardones 2000).
In the mid-1990s, it became evident that rapid growth in foreigntrade would, in the short term, render inadequate the cargo transfer ca-pacity of state-owned ports. This was particularly true of ports locatedin the central zone of the country where, for geographic reasons, thereis little potential for development of new ports. Chile has only a fewwell-protected bays and inlets, and most of these lie in the middle of ur-ban centers. Expanding the number of docking sites at existing ports ispossible, at least in the case of the port of San Antonio, but costly. Inaddition to these stumbling blocks, a dearth of stacking and storagespace at the ports further compounds problems, since urban growth andsprawl have severely limited the ability of these port service areas to ex-pand.31 Finally, having multiple private operators conspired against thecoordination of activities and investment in specialized gantry cranesfor containers.
The government feared that inefficient port operations would have amultiplier effect on the costs of the transportation chain. Ships range fromlarge, fast, and expensive types to slower, more sea-worn vessels. Since anefficient ship costs tens of millions of dollars, from the point of view of ashipping company the main cost of an inefficient port is not the fees fordocking, loading, and unloading but rather the capital cost of the ship. In-efficient ports tend to be able to receive only slower, older, and smallerships with higher operational costs. Hence, even in addition to having highdocking and loading costs, inefficient ports raise the total transport cost oftraded goods by much more and render a country uncompetitive in the in-ternational market for its goods. This was one of the fears of the Chileangovernment, since Chile is an open economy that depends on remainingcompetitive for its future growth.
The government believed that it was possible to expand the transfercapacity of the state-owned ports by increasing private participation inport administration and operation. Moreover, the government began tothink of ports as consisting of terminals, known as frentes de atraque,which combine groups of docking sites and storage space that could func-tion as independent units. By coordinating activities and internalizing
THE EFFECTS OF PRIVATIZATION ON FIRMS: THE CHILEAN CASE 243

all the benefits of investment in new equipment, a single operator wouldbe the best way of operating a terminal. Based on this assessment, a billwas introduced in Congress for modernization of the state-owned portsector, which was enacted in December 1997. The law split Emporchiinto 10 different SOEs or port authorities, one for each state-ownedport, which were granted the power to award concessions to multiple orsingle private companies for the administration and operation of portinfrastructure.
Granting concessions for state-owned port administration and opera-tions posed certain risks to the sector’s competitiveness. There are onlythree ports in the central zone of Chile (Region V), which is where most ofthe general cargo enters and leaves the country. Two of these ports arestate-owned (Valparaíso and San Antonio), while one (Ventanas) is pri-vately owned. Altogether, these three ports are endowed with seven frentesde atraque, but not all of these are able to berth large vessels. Additionally,it is necessary to consider that some terminals are especially built for trans-fer of containers, others for bulk cargo (where there is no lack of compe-tition), and still others, for standard cargo.
In other countries, large-scale port users, mainly shipping compa-nies, own their own cargo terminals, because such an arrangement pro-vides operational advantages. In Chile, however, so few frentes deatraque are available that only a small number of users of significantsize would be able to own their terminal. This would, of course, placeother users at a great disadvantage. Even though regulations make itmandatory for prices to be made public and set on a nondiscriminatorybasis, concessionaires can use subtle ways of discriminating againstnonintegrated shippers that are difficult to prove and therefore to pe-nalize. These methods include assigning the choice spaces in the hold-ing areas to one company over another, providing one company withbetter service than others, using insider information, and manipulatingdocking reservations.
In drafting the port modernization law (Law 19.542), legislators tookthese problems into account and included several clauses designed to safe-guard competition in the sector. First, the law requires that concessions beawarded through public auctions and for no more than 30 years. Second,concessionaires must be incorporated as publicly owned companies thatare engaged in a single line of business. Third, the rates set by concession-aires must be made public and established on a nondiscriminatory basis.Fourth, proposed by-laws and internal regulations for concessions are re-quired as an integral part of the rules of bidding. These rules must conformto objective technical and nondiscriminatory standards, especially with re-gard to assignment of spaces and reserve capacity.
The two port authorities in Region V put up for simultaneous pub-lic bidding three out of the six docking areas they owned. Two of thesewere the frentes de atraque capable of berthing the largest vessels at
244 FISCHER, GUTIÉRREZ, AND SERRA

each port, while the third was the bulk terminal of San Antonio. Theport authorities, in consultation with the Antitrust Prevention Com-mission, imposed additional conditions on concession-holders to pre-vent risks of abuse of a dominant position, as provided for by the law.Their conditions included ceilings on horizontal integration, restric-tions on vertical integration, additional rules of transparency, reservingthe right to set maximum prices to prevent low bidder turnout, andquality standards.
The rules specified, for instance, that significant users (defined as thosethat shipped more than 15 percent of the cargo in the region) should notown more than 40 percent of the stock or voting shares in the firms thatoperated the port franchises. According to the port authorities, it was nec-essary to limit significant users to a minority position in the company in or-der to reduce the possibility of discrimination. Concessionaires are requiredto grant any interested party expeditious access to information such ascargo contracts, service priorities, and types of cargo and consignees, sothat all of the interested parties would have the same information. Finally,the port authorities can impose penalties for low quality of service. Mini-mum transfer speeds and maximum waiting times for ships are specifiedin the concession contracts.
The concessions were awarded in July 1999. In principle, each onewas to be awarded to the bidder that offered the lowest maximum porttransfer rate index, which was an average of four transfer charges.Nonetheless, in fairness to private port competitors, the rules of biddingfor each docking front specified a minimum rate floor index. Moreover,the minimum rate floor has the beneficial effect of creating ex-post rentsfor the nonintegrated port, which implies that the incentives for under-hand integration with a shipper and then discriminating against its com-petition are reduced. In the event that more than one bidder offered theminimum rate index established in the rules, a tie-breaking paymentwas to be offered in addition.32 This payment was over and above theleasing payment that was established in the rules of bidding for the portinfrastructure and was calculated on the basis of the economic value ofthe property.
The bidding attracted a great deal of interest, and a total of 21 bidswere tendered by consortia made up of leading domestic and foreign com-panies, of which 19 included the minimum rate index, plus the additionaltie-breaking payment. All terminals were awarded in the end on the basisof the tie-breaking payment amount. Consequently, the average rates forport services were reduced by more than 10 percent in the frentes deatraque that were awarded in concession, and the government was alsoable to take in revenues of $267 million, tripling its expectations (Foxleyand Mardones 2000).
The results of the first years of operation have also satisfied thegovernment’s expectations, as can be seen with data for the Port of
THE EFFECTS OF PRIVATIZATION ON FIRMS: THE CHILEAN CASE 245

Valparaíso (table 5.19). The efficiency in port services increased sub-stantially. Similarly, the transfer speed at the port of Iquique increasedby 41 percent in just half a year.33 Finally, at the franchised terminal atSan Antonio, the main port, the transfer speed rose from 475 tons anhour to 635 tons an hour, an increase of 34 percent.34 At the Valparaísoconcession, investment in new cranes, computer software, and otherequipment during 2001 topped $8 million, with another $27.5 millionexpected by 2006.
Conclusions
This section collects our results and presents some hypotheses that offerconsistent explanations for these results. Unfortunately, the lack of infor-mation limits the verifiability of these hypotheses. First, we find that pri-vatized firms experienced significant improvements in efficiency, but thisimprovement is no different from the change experienced by other privatefirms in their respective economic sectors. This allows us to conclude thatChilean SOEs were efficient before privatization, at least if we comparethem with private firms in their respective sectors. Hachette and Lüders(1994) have noted this previously. This conclusion is consistent with thefact that employment levels in privatized firms were stable for severalyears before privatization and rose afterward. This is not surprising giventhat many years before privatization, state-owned enterprises had under-gone reorganizations that were especially geared toward reducing thenumber of workers (see table 5.7).
Second, we find that there are significant differences in the postprivati-zation performance of regulated and unregulated firms. Hence, we reportseparate results for each group. We give an account of adjusted results,that is, where we have normalized the performance of firms with respectto the performance of their economic sectors at the 2-digit SIC levels. Wefocus first on the behavior of firms that were not regulated. Results for thisgroup show no major changes in efficiency measured as unit costs andsales over physical assets after privatization. Since these firms operated in
246 FISCHER, GUTIÉRREZ, AND SERRA
Table 5.19 Valparaíso: Time Spent Loading and Unloading andTransfer Speed
Productivity measure 1999 2001 2002 (est.)
Loading, unloading (hours) 45.0 26.3 21.0Transfer speed (containers per hour) 25.5 43.7 54.8
Note: Loading and unloading time is for a Eurosal vessel with 1,150 cargomovements.
Source: Empresa Puerto Valparaíso.

competitive sectors and their efficiency did not grow compared with otherfirms in their sectors, adjusted profitability should not show majorchanges after privatization, as is the case.
The postprivatization performance of regulated firms is quite different.The profitability of regulated firms grew after privatization. In fact, theratio of net income over PPE rose substantially, while the ratio of incometo sales also increased, though at a more modest rate. These firms enjoyedefficiency gains after privatization, but those gains are not statistically sig-nificant. Similarly, the cost per unit indicator shows a slight decrease, whilethe ratio of sales to PPE shows a modest increase. These results are consis-tent with efficiency gains resulting primarily from a more efficient use ofcapital (and probably a minor increase in regulated prices). There is someevidence that before privatization, regulated SOEs had overinvested inphysical assets. This implies that privatization should result in higher prof-its rates, as observed.
The implication is that Chile’s approach to incentive regulation haspaid off, promoting efficiency in regulated firms. As shown, the efficiencygains in the regulated sectors that were privatized do not lag behind thoseof the unregulated privatized sectors. However, regulators have been un-able to transfer all these efficiency gains to consumers. This should notcome as a complete surprise. It is well known that regulation is an imper-fect substitute for competition, and Chile is no exception. Moreover, theability of regulators to transfer gains to consumers has recently improvedsubstantially.
Certain aspects of the Chilean regulatory legislation and practiceshould be improved. In particular, the transparency of the rate-settingprocess should increase. Currently, regulators in the electricity andtelecommunications sectors can exchange the information used to set ratesonly with the regulated companies; this prevents consumer organizationsfrom countering the lobbying pressures of the regulated enterprises. Therecent law regarding the water and waste treatment sector takes the op-posite approach: all the information used in setting rates must be madepublic. However, it is not clear that this new law has been effective inrestraining lobbying while at the same time limiting the possibility of reg-ulatory takings.
The regulatory process requires improvement in access to information onthe regulated firm. It also necessitates modeling an efficient firm, but this inturn requires information that is uniquely available to the real firm, sincecosts depend, among other factors, on topography, geographic density ofcustomers, and demand. Regulators have encountered major problems ingaining access to company data, because legislation does not provide spe-cific penalties for failure to deliver information or for submitting falseinformation. Currently, when a company refuses to hand over information,the regulator must go to the courts, where the process is lengthy and penal-ties are low.
THE EFFECTS OF PRIVATIZATION ON FIRMS: THE CHILEAN CASE 247

Another lesson that may be learned from the Chilean experience is theimportance of properly regulating essential facilities. A 1982 law, for ex-ample, required the dominant local telephone operators to provide in-terconnection access for other operators requesting it, with the cost ofaccess to be negotiated by the parties. However, the negotiation of thesecharges led to prolonged lawsuits that made it difficult for new compa-nies to enter the market. A 1994 law solved the problem by regulating allinterconnection charges. Similarly, Chilean legislation guarantees power-generating firms access to the transmission system, but the fact that thelargest power-generating company owned the transmission system, com-bined with the fact that transmission tolls are negotiated, created someproblems. In June 1997 the Antitrust Commission ruled that the power-generating company should divest its transmission assets to an indepen-dent company.
Other types of natural monopolies were also privatized: those relatedto infrastructure. In those cases, the rate-setting problem was solved bycompetition for the field (Demsetz 1968), auctioning franchises to thefirms that asked for the lowest user fee. It has been a successful system.The main highways have been completely overhauled and their capacityhas increased substantially, reducing internal transportation costs andmaking the country as a whole more efficient. Only a few potential prob-lems remain. First, the traffic guarantees offered by the government tosuccessful bidders created unaccounted liabilities; and, second, fran-chise-holders might be successful in lobbying the government forchanges in the terms of their contracts. In fact, many contracts have al-ready been renegotiated because the highway projects were awardedthrough agreements that omitted important details and thus had to be re-vised. This has meant a substantial (but not overwhelming) increase inthe cost of the projects. At the same time, the government was able to re-main firm when Tribasa (a company that had received three importanthighway concessions) failed to complete one of its projects on time, andthis is an encouraging sign.
Seaport franchises have also been successful so far: investment has in-creased, port efficiency is higher, and ships require much shorter periodsfor loading and unloading. There have been no complaints from ship-ping companies that they are discriminated against in the franchisedports, so it appears that the horizontal and vertical integration restric-tions on the port operators have served their purpose. Despite these fa-vorable results, however, it is too soon to have a fair evaluation of theport franchises.
To summarize, privatization has benefited the country, even in the caseof the regulated sectors. Market imperfections mean that it is not alwayseasy to align the interests of private providers in regulated sectors andthose of society as a whole. However, regulation has partially succeededin this goal, in part because of ongoing fine-tuning.
248 FISCHER, GUTIÉRREZ, AND SERRA

249
Table 5A.1 Changes in Profitability of Privatized Firms
t-statistic for Z-statistic for Test for Test forMean before Mean after change in change in mean before � 0 mean after � 0
Variable N Median before Median after mean median median before � 0 median after � 0
All firmsOperating 37 0.1182 0.2051 3.6298* �2.5459* 3.6213* 7.6211*
income/sales 0.0835 0.1512 0.0000* 5,12E–09*Operating 37 0.0969 0.2000 2.5620* �2.9784* 3.7906* 4.7129*
income/PPE 0.0624 0.1269 0.0000* 5,12E–09*Net income/sales 37 0.0172 0.1303 3.2708* �3.2811* 0.6074 3.8679*
0.0192 0.1459 0.1620 5,42E–07*Net income/PPE 37 0.0386 0.1636 3.3633* �3.5189* 2.8923* 4.7555*
0.0214 0.0968 0.0494* 6,17E–08*
UnregulatedOperating 18 0.1113 0.1797 1.2527 �0.9808 1.8682 3.8725*
income/sales 0.0763 0.1294 0.0038* 0.0006*Operating 18 0.1206 0.2139 0.9345 �0.7277 2.4296* 2.5125*
income/PPE 0.0711 0.0788 0.0038* 0.0006*Net income/sales 18 �0.0331 0.0461 0.9706 �1.0124 �0.7044 0.7687
0.0299 0.0456 0.2403 0.0154*Net income/PPE 18 0.0510 0.1273 0.9072 �0.5379 2.1953* 2.0011
0.0402 0.0476 0.0481* 0.0037*(Table continues on the following page.)
Appendix 5A

250
Table 5A.1 (continued)
t-statistic for Z-statistic for Test for Test forMean before Mean after change in change in mean before � 0 mean after � 0
Variable N Median before Median after mean median median before � 0 median after � 0
RegulatedOperating 19 0.1247 0.2291 4.7276* �2.8465* 4.0062* 7.9657*
income/sales 0.0872 0.1726 0.0004* 1,91E–06*Operating 19 0.0744 0.1868 5.8026* �3.6347* 4.4425* 8.2944*
income/PPE 0.0549 0.1649 0.0004* 1,91E–06*Net income/sales 19 0.0649 0.2101 5.1091* �3.3720* 2.1687* 9.6619*
0.0143 0.2030 0.3238 1,91E–06Net income/PPE 19 0.0268 0.1981 4.5417* �4.2478* 1.9231 6.7673*
0.0019 0.1607 0.3238 1,91E–06*
* Significant at the 10 percent level.** Significant at the 5 percent level.*** Significant at the 1 percent level.Note: N � number and PPE � property, plant, and equipment.Source: Authors’ calculations.

THE EFFECTS OF PRIVATIZATION ON FIRMS: THE CHILEAN CASE 251
Figure 5A.1 Cost per Unit before and after Privatization,Adjusted and Unadjusted
Note: t � year of privatization; the number represents the number of yearsbefore or after privatization.
Source: Authors’ calculations.
0.74
0.72
0.70
0.68
0.66
0.64
0.62
0.60
[t−5: t−3] [t−3: t−1] [t+1: t+3] [t+3: t+5]
All firms Unregulated firmsRegulated firms
All firms Unregulated firms
Regulated firms
All firms Unregulated firmsRegulated firms
0.820.80
0.760.78
0.740.720.700.680.660.64
[t–5: t−3] [t−3: t−1] [t+1: t+3] [t+3: t+5]
All firms Unregulated firmsRegulated firms
a. Cost per unit (mean) b. Cost per unit (median)
c. Cost per unit, adjusted (mean) d. Cost per unit, adjusted (median)
0.08 0.140.120.100.080.060.040.020.00
–0.02–0.04–0.06
0.06
0.04
0.02
0.00
–0.02
–0.04
–0.06
–0.08
[t−5: t−3] [t−3: t−1] [t+1: t+3] [t+3: t+5]
[t−5: t−3][t−3: t−1][t+1: t+3][t+3: t+5]

252
Table 5A.2 Changes in Operating Efficiency of Privatized Firms
t-statistic for Z-statistic for Test for Test forMean before Mean after change in change in mean before � 0 mean after � 0
Variable N Median before Median after mean median median before � 0 median after � 0
All firmsCost per unit 37 0.7049 0.6606 �1.8235 1.2595 22.8569* 21.9694*
0.7769 0.7149 0.0000* 0.0000*Sales/PPE 37 1.1686 1.1570 �0.2074 �1.1838 4.3087* 7.2498*
0.5787 0.7487 0.0000* 0.0000*Sales/employee 30 69284.4870 102795.0097 3.9218* �2.1290* 5.4755* 6.5359*
42013.6095 82924.2615 0.0000* 0.0000*Operating income/ 30 14705.0275 25088.0736 2.8042* �2.7795* 2.9264* 4.2550*
employee 4087.5993 13788.9867 0.0000* 0.0000*
UnregulatedCost per unit 18 0.6979 0.6747 �0.4239 0.3797 17.4061* 14.3750*
0.7234 0.6978 0.0000* 0.0000*Sales/PPE 18 1.7011 1.0906 �1.0359 �5.7266* 3.2401* 4.2907*
0.6083 0.6532 0.0000* 0.0000*

253
Sales/employee 12 1.07647.9371 134806.9036 1.3016 �0.4041 4.0110* 3.7855*85164.2136 107110.7778 0.0002* 0.0032*
Operating income/ 12 29483.4651 39012.3794 0.8572 �0.1732 2.5880* 2.8487*employee 6807.3028 22053.4960 0.0002* 0.0193*
RegulatedCost per unit 19 0.7116 0.6473 �2.7041* 1.4159 14.9651* 16.5470*
0.8083 0.7257 0.0000* 0.0000*Sales/PPE 19 0.6641 1.1394 1.6805 �1.8539 6.3889* 6.1465*
0.5589 0.8323 0.0000* 0.0000*Sales/employee 18 43708.8536 81453.7471 4.0624* �2.9108* 6.2884* 8.6217*
34940.3242 82345.8544 0.0000* 0.0000*Operating income/ 18 4852.7357 15805.2031 5.8470* �3.8915* 3.9250* 6.8893*
employee 3448.3215 13788.9867 0.0007* 0.0000*
* Significant at the 10 percent level.** Significant at the 5 percent level.*** Significant at the 1 percent level.Note: N � number and PPE � property, plant, and equipment.Source: Authors’ calculations.

254 FISCHER, GUTIÉRREZ, AND SERRA
Figure 5A.2 Investment as a Fraction of Physical Assets (PPE)before and after Privatization, Adjusted and Unadjusted
Note: PPE � property, plant, and equipment; t � year of privatization; thenumber represents the number of years before or after privatization.
Source: Authors’ calculations.
1.20
1.00
0.80
0.60
0.40
0.20
0.00
1.20
1.00
0.80
0.60
0.40
0.20
0.00
0.50
0.40
0.30
0.20
0.10
0.00
–0.10
–0.20
0.50
0.40
0.30
0.20
0.10
0.00
–0.10
–0.20
[t−5: t−3] [t−3: t−1] [t+1: t+3] [t+3: t+5]
All firms Unregulated firms
Regulated firms
[t−5: t−3] [t−3: t−1] [t+1: t+3] [t+3: t+5]
All firms Unregulated firms
Regulated firms
[t−5: t−3] [t−3: t−1] [t+1: t+3] [t+3: t+5] [t−5: t−3] [t−3: t−1] [t+1: t+3] [t+3: t+5]
All firms Unregulated firms
Regulated firms
All firms Unregulated firms
Regulated firms
a. Investment over PPE (mean)
c. Investment over PPE, adjusted (mean) d. Investment over PPE, adjusted(median)
b. Investment over PPE (median)

255
Table 5A.3 Changes in Investment and Assets in Privatized Firms
t-statistic for Z-statistic for Test for Test forMean before Mean after change in change in mean before � 0 mean after � 0
Variable N Median before Median after mean median median before � 0 median after � 0
All firmsLog(PPE) 36 16.4534 16.7571 1.1599 �0.7658 41.4029* 38.2008*
16.3349 16.6948 0.0000* 0.0000*Investment/sales 28 0.1612 0.1074 �0.6339 0.5899 2.6560* 2.1901*
0.0977 0.0265 0.1725 0.0436*Investment/ 24 4885.4701 18064.6755 1.2613 �0.3093 0.9709 2.0507
employees 3106.3502 2235.6167 0.1537 0.0758Investment/PPE 28 0.0537 0.0322 �0.4064 �0.0655 1.3310 1.6093
0.0443 0.0448 0.1725 0.0436*PPE/employees 30 233653.7571 330056.5131 2.3351* �0.7097 2.2491* 2.5458*
60346.6975 70591.5865 0.0000* 0.0000*
UnregulatedLog(PPE) 17 16.0596 16.2138 0.2260 �0.3272 21.9867* 19.9756*
16.0273 16.5830 0.0000* 0.0000*Investment/sales 12 0.1771 0.0930 �0.3470 0.4041 1.3215 0.9619
�0.0302 �0.0159 0.3872 0.6128Investment/ 6 6420.8692 54646.7804 1.0025 �0.9608 0.4668 2.3891*
employees �10070.6767 65872.1966 0.3438 0.3438Investment/PPE 12 0.0493 �0.0049 �0.3395 0.1155 0.5256 �0.1229
�0.0250 0.0268 0.3872 0.6128
(Table continues on the following page.)

256
PPE/employees 12 470839.7510 670100.9661 1.6964 �0.7506 1.8877 2.2080*173215.2970 283717.7356 0.0002* 0.0002*
RegulatedLog(PPE) 19 16.8058 17.2432 3.5192* -0.8321 44.4567* 43.4982*
16.5665 17.1940 0.0000* 0.0000*Investment/sales 16 0.1492 0.1182 �0.4954 0.9422 3.6193* 2.4036*
0.1132 0.0265 0.0384* 0.0106*Investment/ 15 4100.1476 8183.0048 0.3273 0.0622 3.0199* 2.1897*
employees 3242.7176 2307.4099 0.0592 0.0176*Investment/PPE 16 0.0570 0.0600 0.1086 �0.1131 3.4090* 3.7712*
0.0494 0.0448 0.0384* 0.0106*PPE/employees 18 75529.7611 103360.2111 0.6359 �0.8542 5.7723* 4.6236*
57560.8634 70591.5865 0.0000* 0.0000*
* Significant at the 10 percent level.** Significant at the 5 percent level.*** Significant at the 1 percent level.Note: N � number and PPE � property, plant, and equipment.Source: Authors’ calculations.
Table 5A.3 (continued)
t-statistic for Z-statistic for Test for Test forMean before Mean after change in change in mean before � 0 mean after � 0
Variable N Median before Median after mean median median before � 0 median after � 0

THE EFFECTS OF PRIVATIZATION ON FIRMS: THE CHILEAN CASE 257
Figure 5A.3 Investment as a Fraction of Sales before andafter Privatization, Adjusted and Unadjusted
Note: t � year of privatization; the number represents the number of yearsbefore or after privatization.
Source: Authors’ calculations.
2.50
2.00
1.50
1.00
0.50
0.00
[t−5: t−3] [t−3: t−1] [t+1: t+3] [t+3: t+5]
All firms Unregulated firms
Regulated firms
2.50
2.00
1.50
1.00
0.50
0.00
[t−5: t−3] [t−3: t−1] [t+1: t+3] [t+3: t+5]
All firms Unregulated firms
Regulated firms
All firms Unregulated firms
Regulated firms
0.60
0.40
0.20
0.00
–0.20
–0.40
–0.60
a. Investment over sales (mean)
c. Investment over sales, adjusted(mean)
d. Investment over sales,adjusted (median)
b. Investment over sales (median)
[t−5: t−3] [t−3: t−1] [t+1: t+3] [t+3: t+5]
All firms Unregulated firms
Regulated firms
0.60
0.40
0.20
0.00
–0.20
–0.40
–0.60
–0.80
–1.00
[t−5: t−3] [t−3: t−1] [t+1: t+3] [t+3: t+5]

258
Table 5A.4 Changes in Profitability of Privatized Firms, Adjusted
t-statistic for Z-statistic for Test for Test forMean before Mean after change in change in mean before � 0 mean after � 0
Variable N Median before Median after mean median median before � 0 median after � 0
All firmsOperating 36 �0.0570 �0.0128 2.0203 �1.1374 �2.0925* �0.5885
income/sales �0.0576 �0.0313 0.0005* 0.1214Operating 36 0.0223 0.1093 2.1198* �1.9934* 1.1384 2.6297*
income/PPE �0.0030 0.0296 0.2025 0.0662Net income/sales 36 �0.0621 �0.0355 0.8480 �0.3941 �2.6489* �1.3586
�0.0405 �0.0328 0.0326* 0.0326*Net income/PPE 36 0.0149 0.0964 2.2858* �1.6555 1.0682 3.0114*
�0.0110 0.0141 0.3088 0.1214
UnregulatedOperating 18 �0.0170 0.0301 1.0079 �0.4113 �0.3470 0.8091
income/sales �0.0072 0.0005 0.1189 0.5927Operating 18 0.0408 0.1410 1.0144 �1.0124 1.1243 1.7721
income/PPE �0.0030 0.0094 0.4072 0.2403

259
Net income/sales 18 �0.0879 �0.0487 0.5670 �0.1898 �2.0494 �1.0150�0.0150 �0.0242 0.2403 0.1189
Net income/PPE 18 0.0211 0.0804 0.7612 �0.2214 0.8746 1.41810.0150 �2.3359E–05 0.4072 0.5927
RegulatedOperating 18 �0.0970 �0.0559 1.8235 �1.4553 4.4782* 2.8959*
income/sales �0.1085 �0.0714 0.0006* 0.0481*Operating 18 0.0037 0.0776 3.4631* �1.9299 0.2543 3.0121*
income/PPE �0.0031 0.0756 0.2403 0.1189Net income/sales 18 �0.0363 �0.0222 0.4705 �0.2847 1.9511 1.0098
�0.0442 �0.0368 0.0481* 0.1189Net income/PPE 18 0.0087 0.1124 2.9345* �1.9932* 0.5940 3.6010*
�0.0140 0.0783 0.1189 0.0481*
* Significant at the 10 percent level.** Significant at the 5 percent level.*** Significant at the 1 percent level.Note: N � number and PPE � property, plant, and equipment.Source: Authors’ calculations.

260 FISCHER, GUTIÉRREZ, AND SERRA
Figure 5A.4 Net Income as a Fraction of Physical Assetsbefore and after Privatization, Adjusted and Unadjusted
Note: PPE � property, plant, and equipment; t � year of privatization; thenumber represents the number of years before or after privatization.
Source: Authors’ calculations.
0.25
0.20
0.15
0.10
0.05
0.00
0.25
0.20
0.15
0.10
0.05
0.00
[t−5: t−3] [t−3: t−1] [t+1: t+3] [t+3: t+5]
[t−5: t−3] [t−3: t−1] [t+1: t+3] [t+3: t+5][t−5: t−3] [t−3: t−1] [t+1: t+3] [t+3: t+5]
All firms Unregulated firms
Regulated firms
[t−5: t−3] [t−3: t−1] [t+1: t+3] [t+3: t+5]
All firms Unregulated firms
Regulated firms
All firms Unregulated firmsRegulated firms
All firms Unregulated firmsRegulated firms
a. Net income over PPE (mean) b. Net income over PPE (median)
c. Net income over PPE, adjusted(mean)
d. Net income over PPE, adjusted(median)
0.12
0.10
0.08
0.06
0.04
0.02
0.00
−0.02
0.140.120.100.080.060.040.020.00
−0.02−0.04

261
Table 5A.5 Changes in Operating Efficiency of Privatized Firms, Adjusted
t-statistic for Z-statistic for Test for Test forMean before Mean after change in change in mean before � 0 mean after � 0
Variable N Median before Median after mean median median before � 0 median after � 0
All firmsCost per unit 36 �0.0017 0.0055 0.2858 �0.1126 �0.0679 0.2343
0.0275 0.0322 0.4340 0.1215Sales/PPE 36 0.6096 0.6121 0.0093 �1.0812 2.3561* 4.0088*
0.1922 0.2864 0.3089 0.0662
UnregulatedCost per unit 18 �0.0652 �0.0419 0.4396 �0.6328 �1.7328 �1.0239
�0.0441 �0.0093 0.1189 0.2403Sales/PPE 18 0.8943 0.4995 �0.6096 �0.3797 1.7690 2.0071
�0.0600 0.1074 0.4073 0.4073
RegulatedCost per unit 18 0.0617 0.0529 �0.3107 0.8226 2.2441* 2.8640*
0.1164 0.0548 0.0481* 0.0038*Sales/PPE 18 0.3248 0.7248 1.7461 �1.4237 3.1721* 4.0149*
0.2820 0.4787 0.1189 0.0481*
* Significant at the 10 percent level.** Significant at the 5 percent level.*** Significant at the 1 percent level.Note: N � number and PPE � property, plant, and equipment.Source: Authors’ calculations.

262 FISCHER, GUTIÉRREZ, AND SERRA
Figure 5A.5 Operating Income as a Fraction of Physical Assetsbefore and after Privatization, Adjusted and Unadjusted
Note: PPE � property, plant, and equipment; t � year of privatization; thenumber represents the number of years before or after privatization.
Source: Authors’ calculations.
0.25
0.20
0.15
0.10
0.05
0.00
0.200.180.160.140.120.100.080.060.040.020.00
[t−5: t−3] [t−3: t−1] [t+1: t+3] [t+3: t+5]
[t−5: t−3] [t−3: t−1] [t+1: t+3] [t+3: t+5][t−5: t−3] [t−3: t−1] [t+1: t+3] [t+3: t+5]
All firms Unregulated firms
Regulated firms
[t−5: t−3] [t−3: t−1] [t+1: t+3] [t+3: t+5]
All firms Unregulated firms
Regulated firms
All firms Unregulated firms
Regulated firms
All firms Unregulated firms
Regulated firms
a. Operating income over PPE (mean) b. Operating income over PPE(median)
c. Operating income over PPE, adjusted(mean)
d. Operating income over PPE, adjusted(median)
0.16
0.14
0.12
0.10
0.08
0.06
0.04
0.02
0.00
0.12
0.10
0.08
0.06
0.04
0.02
0.00
−0.02

263
Table 5A.6 Changes in Investment and Assets in Privatized Firms, Adjusted
t-statistic for Z-statistic for Test for Test forMean before Mean after change in change in mean before � 0 mean after � 0
Variable N Median before Median after mean median median before � 0 median after � 0
All firmsLog(PPE) 35 0.7909 0.7846 �0.4744 0.3230 39.4821* 39.0845*
0.7845 0.7779 0.0000* 0.0000*Investment/sales 28 �1.8959 �1.5611 2.0772* �2.4089* �11.7751* �14.2995*
�2.0177 �1.6611 0.0000* 0.0000*Investment/PPE 28 �0.6250 �0.6034 0.2502 �0.8193 �11.1709* �13.1927*
�0.5748 �0.5465 0.0000* 0.0000*
UnregulatedLog(PPE) 17 0.7785 0.7628 �0.4644 0.4650 23.5227* 22.6188*
0.7845 0.7779 0.0000* 0.0000*Investment/sales 12 �1.4619 �1.3864 0.1834 �0.6351 �6.1159* �7.0902*
�1.6319 �1.3423 0.0032* 0.0002*Investment/PPE 12 �0.6013 �0.6354 �0.1415 �0.3464 �5.4303* �6.0524*
�0.5748 �0.5435 0.0032* 0.0002*
RegulatedLog(PPE) 18 0.8026 0.8052 0.3869 �0.1898 33.6094* 35.8317*
0.7866 0.7699 0.0000* 0.0000*Investment/sales 16 �2.2214 �1.6922 2.8174* �2.9397* 12.0912* 14.3819*
�2.2513 �1.6893 0.0000* 0.0000*Investment/PPE 16 �0.6428 �0.5793 0.8667 �0.6030 11.6052 27.7174*
�0.5759 �0.5501 0.0000* 0.0000*
* Significant at the 10 percent level.** Significant at the 5 percent level.*** Significant at the 1 percent level.Note: N � number and PPE � property, plant, and equipment.Source: Authors’ calculations.

264 FISCHER, GUTIÉRREZ, AND SERRA
Figure 5A.6 Operating Income as a Fraction of Sales beforeand after Privatization, Adjusted and Unadjusted
Note: t � year of privatization; the number represents the number of yearsbefore or after privatization.
Source: Authors’ calculations.
0.25
0.20
0.15
0.10
0.05
0.00
0.25
0.20
0.15
0.10
0.05
0.00
0.040.020.00
−0.02−0.04−0.06−0.08−0.10−0.12−0.14
[t−5: t−3] [t−3: t−1] [t+1: t+3] [t+3: t+5]
All firms Unregulated firms
Regulated firms
[t−5: t−3] [t−3: t−1] [t+1: t+3] [t+3: t+5]
All firms Unregulated firms
Regulated firms
All firms Unregulated firmsRegulated firms
All firms Unregulated firmsRegulated firms
a. Operating income over sales (mean) b. Operating income over sales(median)
c. Operating income over sales, adjusted(mean)
d. Operating income over PPE, adjusted(median)
0.02
0.00
−0.04
−0.02
−0.06
−0.08
−0.10
−0.12
[t−5: t−3] [t−3: t−1] [t+1: t+3] [t+3: t+5][t−5: t−3] [t−3: t−1] [t+1: t+3] [t+3: t+5]

265
Table 5A.7 Employment in Privatized Firms
t-statistic for Z-statistic for Test for Test forMean before Mean after change in change in mean before � 0 mean after � 0
Type of firm N Median before Median after mean median median before � 0 median after � 0
All firms 32 1193 1381 1.3374 �0.1880 3.8391* 3.4071*380 360 0.0000* 0.0000*
Unregulated 15 1557 1764 0.6502 �0.1867 3.1965* 2.7635*754 874 0.0000* 0.0000*
Regulated 17 871 1044 1.2049 �0.3272 2.2127* 2.0096179 236 0.0001* 0.0001*
* Significant at the 10 percent level.** Significant at the 5 percent level.*** Significant at the 1 percent level.Note: N � number.Source: Authors’ calculations.

266
Table 5A.8 Physical Productivity before and after Privatization
PercentFirm Before After variation Unit of measurement
UnregulatedCAP 0.0718 0.0629 �0.1233 Tons of steel forged (MT/worker)Colbún 17.0733Electroandina 12.4271ENDESA 2.6206 3.6677 0.3995 Energy generated (GWh/workers)Fepasa 0.4554 0.4123 �0.0947 (Millions of tons km/workers)Ferronor 0.2891 0.5084 0.7584 (Millions of tons km/workers)Gener 5.7859 4.7388 �0.1810 Energy generated (GWh/workers)Laboratorios Chile 1394.5421LAN Chile 1.7089 1.0008 �0.4144 (Passengers per kilometer/workers)Pilmaiquén 7.1905 8.6277 0.1999 Energy generated (GWh/workers)Telex 39.0387
RegulatedMean 0.0778Median �0.0947Standard deviation 0.4002Number 7Chilectra 1.3412 1.7036 0.2702 Energy purchased (GWh/workers)Chilquinta 0.8038 1.6152 1.0093 Energy purchased (GWh/workers)CTC 69.3534 151.1731 1.1797 Number of lines in operation (units/
workers)

267
Edelaysén 0.3208Edelmag 0.6296 0.8611 0.3676 Energy purchased (GWh/workers)Elecda 0.9252 1.4479 0.5649 Energy purchased (GWh/workers)Eliqsa 1.6372 2.0288 0.2391 Energy purchased (GWh/workers)Emec 1.7957 1.4135 �0.2128 Energy purchased (GWh/workers)Emel 1.2992 0.8345 �0.3577 Energy purchased (GWh/workers)Emelari 1.0657 1.6876 0.5836 Energy purchased (GWh/workers)Emelat 1.5176 1.5749 0.0377 Energy purchased (GWh/workers)Emos 0.1911IANSA 278.0696 266.4219 �0.0419 Sugar produced per worker (metric tons/
workers)Saesa 0.6055 0.9196 0.5188 Energy generated (GWh/workers)Telefónica del Sur 39.0387Mean 0.3466Median 0.3189Standard deviation 0.4612Number 12
All firmsMean 0.2475Median 0.2391Standard deviation 0.4485Number 19
Note: MT � metric tons, GWh � gigawatt hours, and km � kilometers.Source: Authors’ calculations.

268
Table 5A.9 Concession Projects under Construction
Bidder’s budgetedPercent built (as of Project expense Franchise
Project name December 2001) origin (US$ million) length (years)
Cerro Moreno Airport, Antofagasta 100 Private 8 10International Airport, Santiago 100 Public 170 15Punta Arenas Airport 98.95 Public 10 9Santiago-Valparaíso—Viña del Mar highway 77.96 Public 383 25Litoral Central Road 0 Public 67 30Route 5, Collipulli—Temuco 91.79 Public 256 25Route 5, Río Bueno—Puerto Montt 99.3 Public 236 25Route 5, Santiago—Talca and southern access 33.78 Public 698 25
to Santiago North—South urban highway, Santiago 1.08 Public 517 30Costanera Norte urban highway 33.4 Public 405 30El Bato reservoir, Illapel Auctioned 2001 NA 37 25Alternate Melipilla road Auctioned NA 19 25Américo Vespucio South urban highway Auctioned 2001 NA 28 30Américo Vespucio North urban highway, Auctioned 2001 NA 250 30
SantiagoInternational road 60 Auctioned January 2002 NA 165 30Route Talcahuano—Penco Auctioned 2001 NA 19 25Group 1 jails (Iquique-La Serena-Rancagua) Auctioned 2001 75 15 to 20
Source: Ministerio de Obras Publicas.

269
Table 5A.10 Projects in Concession Process
Status December Project cost FranchiseProject name 2001 (US$ million) length (years) Auction date Bidding date
New regional airport, Atacama Call for bids 25 20 October 2001 April 2002Jails, Group 2 (Concepción, Valdivia) Call for bids 50 22 October 2001 May 2002Commuter Rail Melipilla—Santiago— Call for bids 300 18 July 2002
BatucoChiloé bridge Call for bids 350 30a August 2002Airport, Arica NYA 10 10 June 2002 September 2002Jails, Group 3 (Santiago1, 2, region V, NYA 80 20 June 2002 October 2002
interior)International airport, IV region NYA 45 20 November 2002Intermediate Tech., Recoleta— NYA 171 20 June 2002 December 2002
IndependenciaEcological complex, Santiago NYA 50 30 2nd half, 2002North-West access Santiago NYA 160 30 1st half, 2002 2nd half, 2002Exchange stations, Quinta Normal, NYA 60 30 2nd half, 2002 1st half, 2003
Gran AvenidaLand Port, Los Andes NYA 16 25 2nd half, 2002 1st half, 2003Intermediate highway ring, El Salto— NYA 32 30 2nd half, 2002 1st half, 2003
KennedyConvento Viejo Reservoir NYA 210 20 to 25 2nd half, 2002 1st half, 2003Improvement, Route 5: La Serena— NYA 105 17a 2nd half, 2002 1st half, 2003
Caldera
(Table continues on the following page.)

270
Table 5A.10 (continued)
Status December Project cost FranchiseProject name 2001 (US$ million) length (years) Auction date Bidding date
Exchange Stations Pajaritos, Santos NYA 60 — 1st half, 2003 2nd half, 2003Dumont
Jails, Group 4 (Santiago 2, region V) NYA 50 15 to 20 1st half, 2003 2nd half, 2003New airport, Region IX NYA 48 20 to 25 1st half, 2003 2nd half, 2003Maintenance, Route 66 NYA 64 18 1st half, 2003 2nd half, 2003
— Not available.NYA Not yet auctioned.a. Approximate.Source: Ministerio de Obras Publicas.

Notes
The authors wish to thank Florencio López-de-Silanes for many helpful com-ments. They also thank Pablo González, Manuel Cruzat, and Ángel Gajardo fortheir valuable assistance.
1. During the 1980s taxes were reduced and the government was able tofinance the transition to a private pension system without going into deficit.Privatization revenues were not used to delay fiscal adjustment, as happened inArgentina.
2. In a personal communication, Rolf Lüders observed that he had not beenable to detect improved performance in privatized firms discussed in Hachette andLüders (1994). His explanation was that managers of state-owned firms were ide-ologically committed to efficiency during the 1980s. For further evidence of this,see appendix table 5A.1.
3. We do not include the water sanitation companies, which were sold duringthe late 1990s.
4. A terminal is an autonomous operational unit within a port that consists ofadjoining berthing spaces and their associated support and service areas, therebymaking it possible to auction them as separate units.
5. Of the 12 companies in the unregulated sector, 4 face no domestic compe-tition (CAP, ENAEX, LAN Chile, and Soquimich), while Colbun, ENDESA, andGener represent almost all of the generating capacity in the interconnected centralelectric system.
6. For example, in 1965, value added in state-related firms was just 14.5 per-cent of GDP.
7. However, CORFO may have only displaced private investment in thosesectors.
8. Related firms are those that belong to the same conglomerate.9. In other words, the Central Bank exchanged fresh money for a claim on
profits.10. The government also privatized a radio company. The only valuable assets
in this company were the rights to the FM spectrum, which were sold separatelyunder allegedly questionable circumstances. The remaining AM frequencies werenot valuable, and the company went bankrupt very shortly thereafter.
11. Some of these 16 firms had never been publicly traded, while others weretaken off the stock market (that is, became private or “closed”) after privatization.
12. This is a very slow process, since the firms are not required to provide theinformation. Obtaining data for Empremar, Fepasa, and Ferronor took almostthree months because it required obtaining information not only from the firms butalso from the original state-owned firms, which no longer exist.
13. Another source of information at the plant level is the Instituto Nacional deInvestigación Agropecuaria survey, which registers quarterly data on many of thevariables of interest for this study. Unfortunately, privacy considerations sur-rounding information provided by the National Institute of Statistics, which ownsthe survey, make it impossible to use the data for our purposes.
14. The digital form does not include the number of workers, which must bereconstructed from the FECUs in paper form.
15. Circular 239, Superintendencia de Valores y Seguros, Santiago, 1982.16. We have included the electric-generating companies among unregulated
firms because they sell a large fraction of their energy through unregulated long-term contracts.
THE EFFECTS OF PRIVATIZATION ON FIRMS: THE CHILEAN CASE 271

17. Telex, a long-distance operator, was not regulated during the period underconsideration.
18. PPEs appear in the FECUs. The PPE increase is significant for the change inmedians.
19. The law excludes mobile telephony (except for access charges) from the re-quirement that the Antitrust Commission should decide whether the market iscompetitive, so user prices are free.
20. Initially, the creation in the early 1990s of an independent interconnectedsystem in the northern part of the country helped to increase the use of existing ca-pacity in that area. However, business mistakes in the late 1990s led to overcapac-ity and large losses.
21. When computing future marginal costs, and very dry conditions are simu-lated, the regulated or node price is the outage cost (that is, the cost to users of long-run supply failures).
22. Chile has no stranded-cost principle, so the introduction of new technologymay reduce the value of existing power plants to zero.
23. The majority of the mobile phones are sold as calling card phones and donot have fixed monthly contracts.
24. The price drop has not been as sharp on other routes. Carriers pay so-calledaccountancy rates to their foreign counterparts for traffic imbalances on interna-tional routes. On those routes where outgoing traffic exceeds incoming calls, themarginal cost of providing service should include the accountancy rate.
25. For more details on these arguments, see Engel, Fischer, and Galetovic(forthcoming). For a different perspective, see Gómez-Lobo and Hinojosa (2000).
26. Some doubts exist about the rationale for this last type of concession con-tract, since it appears to be a means of evading the standard budgetary process.
27. The franchise was awarded to the firm that had the highest score on an in-dex that weighed (mainly) the toll and the payment to the government. Because ofpoor auction design, payments to the government had a higher relative weight, sothe bidders set tolls at the ceiling and bid positive payments.
28. If the government promised to compensate the franchise-holders for eachchange in the network that was claimed to affect their traffic flows, there would beendless and expensive negotiation of the impact of the changes. An example of theeffects of such restrictions is Orange County’s Riverside Freeway, which is terminallycongested because its contract with the private 91 Express Lanes does not allow ex-pansion without permission from the owner of the private franchise. See Engel, Fis-cher, and Galetovic (forthcoming).
29. A similar approach had already been used in the United Kingdom whenawarding the franchises of the Second Severn Bridge and the Queen Elizabeth IIBridge over the Thames. The main difference with the U.K. approach is that therewere no auctions for the bridges.
30. This requires that the contract specify a minimum toll in order to avoid thethreat of expropriation of the franchise-holder.
31. San Antonio is an exception and has been able to expand these support areas.32. Ex ante rents are dissipated through this cash payment. See Engel, Fischer,
and Galetovic (2001) for a detailed analysis.33. Report of the President of Empresa Portuaria de Iquique, 2000.34. Empresa Portuaria San Antonio.
References
Beard, T. Randolph, David L. Kaserman, and JohnW. Mayo. 2001. “Regulation, Ver-tical Integration and Antitrust.” Journal of Industrial Economics 49 (3): 319–33.
272 FISCHER, GUTIÉRREZ, AND SERRA

Bitran, Eduardo, and Raul Sáez. 1994. “Privatization and Regulation in Chile.” InBarry Bosworth and others, eds., The Chilean Economy: Policy Lessons andChallenges, pp. 329–77. Washington, D.C.: Brookings Press.
Corporación de Fomento de la Producción. n.d. “Privatización de empresas y ac-tivos, 1973–1978.” Gerencia de Normalización de Empresas, Santiago.
Demsetz, Harold. 1968. “Why Regulate Utilities?” Journal of Law and Econom-ics 11: 55–66.
Engel, Eduardo, Ronald Fischer, and Alexander Galetovic. 2001. “How to Auctionan Essential Facility When Underhand Integration Is Possible.” NBER WorkingPaper 8146. National Bureau of Economic Research, Washington, D.C.
———. 2002. “Highway Franchising with Subsidies.” Cowles Foundation Discus-sion Paper 1354; Economic Growth Center Discussion Paper 840. Yale Uni-versity, New Haven, Conn.
———. Forthcoming. “Privatizing Roads: An ‘Old’ New Approach to Infrastruc-ture Provision.” Regulation.
Fischer, Ronald, and Pablo Serra. 2000. “Regulation of the Electric Market inLatin America.” Economía 1 (1): 155–98.
Foxley, Juan, and Jose Luis Mardones. 2000. “Port Concessions in Chile: ContractDesign to Promote Competition and Investment.” Public Policy Journal. Issue223. World Bank, Washington, D.C.
Galetovic, Alexander. 1998. “Desatando a prometeo: Reformas microeconómicasen Chile 1973–1989.” Perspectivas en política, economía y gestión 2 (1):131–56.
Gómez-Lobo, Andrés, and Sergio Hinojosa. 2000. “Broad Roads in a Thin Coun-try: Infrastructure Concessions in Chile.” Technical Report 2279. World Bank,Washington, D.C.
Hachette, Dominique. 2000. “Privatizaciones: Reforma estructural pero incon-clusa.” In F. Larraín and R. Vergara, eds., La transformación económica enChile. Santiago: Centro de Estudios Públicos.
Hachette, Dominique, and Rolf J. Lüders. 1994. La privatización en Chile. Santi-ago, Chile: Centro Internacional para el Desarrollo Económico.
La Porta, Rafael, and Florencio López-de-Silanes. 1999. “The Benefits from Priva-tization: Evidence from Mexico.” The Quarterly Journal of Economics 114:1193–242.
Larraín, Felipe, and Rodrigo Vergara. 1995. Macroeconomic Effects of Privatiza-tion: Lessons from Chile and Argentina. Washington, D.C.: World Bank.
Larroulet, Cristián. 1984. “Reflexiones en torno al estado empresario en Chile.”Estudios Públicos (14): 129–51.
Mamalakis, Markos J. 1976. The Growth and Structure of the Chilean Economy:From Independence to Allende. New Haven, Conn.: Yale University Press.
Meller, Patricio. 1996. Un siglo de economía política chilena (1890–1990). Santi-ago: Editorial Andrés Bello.
Rosende, Francisco, and Andrés Reinstein. 1986. “Estado de avance del programade reprivatización en Chile.” Estudios Públicos (23): 251–74.
Sáez, Raul E. 1996. “Las privatizaciones de empresas en Chile.” In Oscar MuñozG., ed., Después de las privatizaciones: Hacia el estado regulador. Santiago:Dolmen-CIEPLAN.
Sanfuentes, Andrés. 1984. “Los grupos económicos: Control y políticas.” Colec-ción Estudios Cieplan (15): 131–70.
THE EFFECTS OF PRIVATIZATION ON FIRMS: THE CHILEAN CASE 273

Valenzuela, Mario. 1989. “Reprivatización y capitalismo popular en Chile.” Estu-dios Públicos (33): 175–217.
Vergara, Rodrigo. 1996. “Privatización de la banca: La experiencia chilena.” Es-tudios Públicos (63): 335–45.
Williamson, Oliver. 1976. “Franchise Bidding for Natural Monopoly–In Generaland with Respect to CATV.” Bell Journal of Economics 7 (spring): 73–104.
274 FISCHER, GUTIÉRREZ, AND SERRA

6
Privatization in Colombia: APlant Performance Analysis
Carlos Pombo and Manuel Ramírez
IN THE EARLY 1990S, THE COLOMBIAN government launched an economicliberalization program through the promotion of market competition andinstitutional deregulation. The economic openness package included ma-jor structural reforms encompassing foreign trade policy, the exchangerate regime, capital flow controls, central bank independence, privatiza-tion, labor legislation, foreign investment legislation, and social securityand pension regimes.1
Historically, the size of the public sector in Colombia has been belowthe average of other Latin American countries such as Argentina, Brazil,Peru, and Venezuela. Yet revenues from privatization have had an im-portant impact on the government’s short-run fiscal policy, financing themajority of investment in social programs from 1994 to 1998. Duringthe 1993–98 period, the privatization program in the productive sectorwas dominated by the sale of assets in the power, natural gas trans-portation, manufacturing, and, to a lesser degree, the water and sewer-age sectors. Reforms in the telecommunications sector have induced newprivate investment in the public enterprises rather than outright changesin ownership.
Colombia’s most important institutional and regulatory reform dur-ing the 1990s took place in public utilities, where free entry was grantedto private sector providers. This implied the establishment of modernand independent regulatory commissions for electricity and natural gas,water and sanitation, and telecommunications. Hence, economic dereg-ulation in Colombia was part of a comprehensive long-term strategy topromote new roles for the public and private sectors. However, a decadelater, economic liberalization has not been well documented or analyzedon a sectoral basis.2
275

Some examination has been undertaken of the privatization process,however, including the work of Zuleta and others (1993) and Montene-gro (1994, 1995). These papers document in a preliminary manner themotivations that induced the government to rely on privatization as aneconomic instrument for promoting market competition, but they do notprovide any empirical analysis of efficiency performance after privatiza-tion. Papers by Gutierrez and Berg (1999) on telecommunications andPombo (2001a) on electric utilities document the regulatory reforms inthese two sectors and present the evolution of some indicators that pro-vide a partial evaluation of such reforms. Thus, the documentation ofColombia’s privatization programs and regulatory reforms during the1990s is still incomplete; empirical evidence is required to gauge the suc-cess of the design and implementation of those economic policies.
This chapter seeks to fill that gap by providing an ex post performanceanalysis of the privatization programs based on a representative samplewith emphasis on manufacturing and power plants, following the bench-mark approach of Megginson, Nash, and van Randenborgh (1994) andLa Porta and López-de-Silanes (1999). The objectives of the study aretwofold. First, it seeks to measure the changes in performance indicatorsfor a sample of manufacturing and power firms that underwent privatiza-tion, were restructured because of new regulations, or started operationsunder the new regulatory environment. Second, the chapter aims to modeltechnical efficiency and profitability variables controlling for industry andplant characteristics, ownership type, and regulatory variables in order toevaluate the effect of privatization on plant performance.
The chapter is organized as follows. The next section analyzes privati-zation efforts within the context of overall deregulation, private invest-ment in public infrastructure, and the promotion of free market policies.The chapter then examines the privatization programs by economic sec-tor. It begins by analyzing the divestiture program of former Institute forIndustrial Promotion (Instituto de Fomento Industrial, or IFI) enterprisesfrom 1986 to 1997 and then continues with a brief summary of the di-vestiture program for the state oil company, which affected the natural gasand regional gasoline distributing companies. The section ends with ananalysis of the regulatory reform of Colombia’s power sector, which wasgreatly affected by privatization. Next we present the core results of thechapter, evaluating the null hypothesis of structural changes in indicatormean and median regarding firm profitability, efficiency, investment,payroll size, and sales. The analysis takes into account industry-adjustedindicators by specific control group for the newly privatized firms in man-ufacturing and power utilities. It also looks at thermal power generationas a measure of technical efficiency—based on Data Envelopment Analy-sis (DEA) techniques—before and after the 1994 regulatory reform in thepower sector. The chapter then presents the empirical evidence of firms’efficiency and profitability indicators, controlling for plant characteristics,
276 POMBO AND RAMÍREZ

industry-specific variables, ownership structure, and variables related toregulatory policy. The last section offers some concluding remarks.
The Deregulation and Privatization Program in Colombia
Privatization in Colombia was originally approached as a tool for eco-nomic deregulation and promotion of market competition. The objectiveof the privatization program designed during the 1990s was to create in-centives for and redirect private investment in public infrastructure andnetwork industries. This was to be achieved through concession contracts,sales contracts, and sectoral regulatory reforms.
Concession contracts are instruments for promoting the involvement ofprivate investment in public works and residential services. Concessionshad been virtually abolished in Colombia since 1930, when nationaliza-tion and direct government involvement in the market economy becamemore prevalent. Before that, concessions had been widely used during the19th century in railroads, mining, and crude oil exploitation. The eco-nomic deregulation policy of the 1990s restored concessions as a favoredinstrument for enhancing investment in strategic infrastructure sectorssuch as railroads, ports, airports, and highways. In 1991 the constitutionwas amended to introduce new rules for property rights regarding resi-dential public services and the development of public infrastructure, cre-ating a legal basis for implementing concessions. In 1993 new legislation(Law 80) set up a flexible legal framework regarding public contractingand concession regimes. The main objectives of the law were to introduceequal treatment into the awarding of state contracts to private and publicfirms and to extend the length of contracts. Specifically, the law allows thesigning of contracts of more than 20 years in duration. At roughly thesame time, the 1990 Government Development Plan was addressingthe new economic agenda: economic deregulation, trade liberalization,and sectoral regulatory reforms. Afterward, a series of documents fromthe National Council for Economic and Social Policy (Concejo Nacionalde Política Económica y Social, or CONPES), as well as the laws govern-ing residential public services, electric power, telecommunications, andprivatization, set forth specific rules and guidelines regarding private in-vestment, the upcoming privatizations, and regulatory reform of networkindustries.3
Concession-type contracts were used in public works infrastructureprojects such as maritime ports, road construction and maintenance,airports, aqueducts and sewers, railroads, and mobile phone networks.The recent studies of Alonso and others (2001) and Bonilla and others(2000) document the most important concession contracts by economicsector in Colombia. The former focuses on the contracts’ characteristics
PRIVATIZATION IN COLOMBIA: A PLANT PERFORMANCE ANALYSIS 277

and incentive mechanisms, providing a preliminary assessment. The lat-ter analyzes the provision of utilities and transportation infrastructurein the largest cities of Colombia’s Atlantic coast region. This study isimportant because concessions have been more active in those cities,where a history of poor local governance had translated into low-quality residential public services for decades before private providerswere allowed to enter the market.
According to the results of those studies and several follow-up CON-PES documents, one can conclude that concessions have not been widelyimplemented. By 1998, 35 concession contracts were signed (see appendixtable 6A.1 for a list of concessions). Out of 1,400 municipal and ruralaqueducts within the country, only 4 contracts were written for watercompanies; out of a possible 20 airports, only 3 contracts were written.The only concessions in telecommunications have been in mobile teleph-ony. Local phone companies have implemented joint-venture contractswith private investors for network expansion, as has the public long-distance carrier, TELECOM. Railroad concessions have been limited tocargo transportation, mainly to one operating concessionaire in coaltransportation. In fact, in 1998 the rail network in operation was only halfthe size of the national network in 1970.4 Despite their limited coverage,concessions have been important in promoting private investment in roadmaintenance, maritime ports, and the construction of new gas pipelines.
Concessions were not the only facet of the privatization program. Inaddition, the program involved the outright sale by local, regional, or na-tional public institutions of equity shares in several enterprises in the man-ufacturing, network utilities, natural gas distribution, and banking indus-tries.5 The privatization program was centered on the IFI equity transfers,the Colombian state oil company (ECOPETROL) divestiture program,and the direct sales of municipal or regional public utilities (MPUs andRPUs), most of which were in the power sector. Table 6.1 displays a com-plete list of the number of privatization contracts that took place in theproductive sector between 1986 and 1998.
Three comments are worth making. First, the number of sale contractsas well as their amount is too low in comparison with other internationalexperiences. Aside from public utilities, privatization sales added up to$547 million.6 This amount is equivalent for instance, to the privatizationsale of a government shareholding in a single company such as Volkswa-gen, Singapore International Airline, or Elf Aquitane.7 Privatization con-tracts were generally limited to the sale of equity shares of mixed-capitalenterprises in manufacturing, natural gas and gasoline distribution, and,to a lesser degree, in services and mining, according to data up to 1998.
Second, privatization in Colombia was not a centerpiece of policy, butrather a policy instrument designed to complement economic deregula-tion. In that sense, privatization was intended to ease industrial restruc-turing processes. Third, privatization of network industries arose as one
278 POMBO AND RAMÍREZ

instrument for promoting market competition. It came as part of ongoingsectoral regulatory reforms aimed at enhancing industry efficiency, chan-neling private investment, and deregulating market entry, especially in theprovision of residential public services. The power sector has been theleader by far in accumulated privatization sales (90 percent of all privati-zation sales) followed by sales in manufacturing (5.1 percent) and naturalgas transportation and gas distribution (3.6 percent).
Hence, one can conclude that privatization in Colombia, in contrast tothe experiences of other Latin American countries such as Argentina,Chile, Mexico, and Peru, was not a comprehensive process.
Privatization in Manufacturing
The privatization program in manufacturing was centered around the saleby the Instituto de Fomento Industrial of shares from its investment port-folio in a group of manufacturing and nonmanufacturing enterprises. TheIFI was founded by Decree-Law 1157 of 1940 and became a strategic toolfor state promotion of industrialization. The IFI’s main objectives are toprovide long-term credit to private enterprises and to advance risk capital
PRIVATIZATION IN COLOMBIA: A PLANT PERFORMANCE ANALYSIS 279
Table 6.1 Privatization Program in the Real Sector in Colombia,1986–98
TotalNumber of Divesting public sale
Industry contracts institution (US$ million)
Manufacturing 27 IFI 288.1Consumer goods 8 IFI 7.3Intermediate goods 12 IFI 220.8Capital goods 7 IFI 60.0
Mining 4 IFI 3.5Natural gas 2 ECOPETROL 205.5Gasoline distribution 5 ECOPETROL 41.2Fishing 1 IFI 1.5Services 6 IFI 6.9Power sector 12 MPU 5,060.0Water and sanitation 1 MPU 2.9Total 58 5,610
Note: IFI � Instituto de Fomento Industrial, ECOPETROL � CompañíaColombiana de Petróleos, MPU � municipal public utility, and RPU � regionalpublic utility. The privatized firms of IFI and ECOPETROL shareholdings were in allcases mixed-capital enterprises rather than state-owned enterprises.
Source: ECOPETROL, requested files; IFI, requested files; DNP 1993, 1997b,1997c; Dager 1999; Bonilla and others 2000; Alonso and others 2001; Pombo2001b.

to industrial investment projects. Typically, the IFI’s resources come fromdomestic saving through the issue of certificates of deposit and long-termbonds. In the international market, the IFI leverages loans from multilat-eral agencies and commercial banks.
The role of the IFI in creating new manufacturing was central duringthe 1950s and 1960s. Today Colombia’s largest private capital enter-prises in the steel, chemical, paper, fertilizer, metalworking, and automo-bile sectors are former IFI-associated companies. The IFI’s larger projectswere oriented to capital-intensive industries and producers of intermedi-ate materials and were an integral part of Colombia’s import substitutionindustrialization policy, which sought to generate a new supply of manu-factured goods for the domestic market. The IFI firms to a large extentdrove Colombia’s industrialization process during the postwar years.Thus, the formation of mixed-capital enterprises channeled private-sectorinvestments into new activities. IFI also guaranteed a degree of stabilityin foreign investment participation. The IFI’s founding statutes are spe-cific in ordering the sale of equity shares once the government considersthe new enterprises to be established in their respective markets. Hence,privatization traditionally has been a financial instrument used by theColombian government. The role of the IFI, however, made for a differ-ent type of privatization than that carried out in other Latin Americancountries, as most firms in the Colombian case were mixed-capital enter-prises rather than state-owned enterprises.
CONPES document 2378 (DNP 1988) set forth an acceleratedtimetable for the privatization of IFI enterprises. In so doing, the policyplaced more emphasis on the transfer of assets than on the IFI’s new in-vestments. In December of 1987, the IFI had capital shares in 45 manu-facturing and nonmanufacturing enterprises. Thirty of them were in oper-ation and the others had already begun a liquidation process. In addition,there were investments in 6 ongoing projects.8 Table 6.2 summarizes theIFI’s sale program.
The equity transfer program involved three steps in each privatizationcontract: the selection criteria, the stock assessment, and the method ofsale. The selection criteria singled out for sale of equity shares all those op-erating enterprises that were not subject to special legal procedures, as wellas ongoing projects that had not started business operations within threeyears of initial disbursements.9 The stock assessment process sought to de-termine the value of the firms’ net assets and the stock price. The assess-ment studies took into account several parameters such as the presentvalue of company cash flows, asset benchmarking, asset book values,stock exchange prices, and reposition and liquidation costs. In addition,all stocks were listed on the domestic stock exchange markets as well as atthe National Stock Registry Office to lend transparency to the process.
Regarding the sale method, the IFI used several bidding procedures: pri-vate offers to current shareholders or to the company’s employee unions
280 POMBO AND RAMÍREZ

Table 6.2 IFI Privatization Program, 1986–97
Stock Stock Total TotalIFI assessment sale sale sale
Privatization share (current (current (million (millionSector Company name date (percent) pesos) pesos) pesos) US$) Selling method
Fishing COPESCOL July 1991 49.0 1,000 6,505 956 1.5 Public bidManufacturing EMPACA S.A. May 1986 29.2 10 150 54 0.3 Public bidManufacturing SUCROMILES S.A. May 1986 15.6 100 2,400 247 1.3 Public bidManufacturing VIKINGOS S.A. July 1986 35.5 10 16 113 0.6 Stock marketManufacturing UNIKA S.A. March 1988 3.4 10 95 105 0.4 Stock marketManufacturing FORJASCOL S.A. Dec. 1988 n.a ASSETS 1,700 5.7 Public offerManufacturing SOFASA Feb. 1989 49.8 1,000 18,362 19,935 52.1 Public offerManufacturing CICOLSA March 1990 17.4 100 100 14 0.0 Private offerManufacturing AICSA S.A. April 1990 49.0 10 144 190 0.4 Public offerManufacturing ING RISARALDA S.A. July 1990 11.7 100 421 972 1.9 Public offerManufacturing PAPELCOL S.A. Aug. 1990 22.7 ASSETS 16,218 32.3 Public offerManufacturing COLCLINKER S.A. Oct. 1990 15.7 1,000 16,160 1,909 3.8 Private offerManufacturing RIOCLARO S.A. Dec. 1990 10.3 100 430 2,185 4.4 Stock marketManufacturing CCAa Dec. 1990 0.0 0 0 0 0.0 Private offerManufacturing COSEDA June 1991 20.0 1,000 1,277 255 0.4 Private offerManufacturing ASTIVAR Aug. 1991 31.0 100 2,800 130 0.2 Private offerManufacturing TEXPINAL Sep. 1991 32.4 5 160 3,534 5.6 Private offerManufacturing PROVICA Sep. 1991 13.2 1,000 1,414 67 0.1 Private offerManufacturing CONASTIL Jan. 1992 59.9 1,000 1,000 1,014 1.5 Private offerManufacturing FERTICOL April 1992 0.7 10 10 1 0.0 Preferential offerManufacturing PENNWALT Nov. 1992 40.7 10 158 1,223 1.8 Private offer
(Table continues on the following page.)
281

Manufacturing FATEXTOL Feb. 1993 16.0 1,000 2,250 540 0.8 Stock marketManufacturing FRIGOPESCA Dec. 1994 47.4 100 440 2,512 3.2 Public bidManufacturing INTELSA April 1995 15.7 1,500 16,500 130 0.2 Public offerManufacturing COSECHAR Oct. 1995 1.4 500 695 8 0.0 Public offerManufacturing QUIBI S.A. April 1996 20.7 10 45 578 0.6 Public offerManufacturing CERRO MATOSO Feb. 1997 47.7 100 28,264 155,814 150.3 Preferential offer/
public bidManufacturing NITROVEN Dec. 1997 10.3 1,000 702,933 21,088 20.3 Preferential offer/
public bidMining FOSFONORTE S.A. Jan. 1989 1.1 1,000 1,250 1 0.0 Private offerMining FOSFOBOYACA S.A. Feb. 1990 6.4 1,000 1,000 9 0.0 Private offerMining PROCARBON Sep. 1991 0.1 100 270 9 0.0 Stock market
Table 6.2 (continued)
Stock Stock Total TotalIFI assessment sale sale sale
Privatization share (current (current (million (US$Sector Company name date (percent) pesos) pesos) pesos) million) Selling method
282

Mining PRODESAL Oct. 1991 11.6 100 921 2,164 3.5 Stock marketServices PROHOTELES S.A. May 1986 10.8 10 39 43 0.2 Stock marketServices CIAC S.A. March 1989 0.5 10 38 4 0.0 Private offerServices COLAR LTDA. Aug. 1989 n.a ASSETS 100 0.3 Public offerServices CORFERIAS S.A. Oct. 1989 5.6 10 65 276 0.7 Private offerServices CORFIDESARROLLO Sep. 1993 16.1 100 217 3,295 4.8 Stock marketServices COKOSILK S.A. Jan. 1997 16.2 690 690 876 0.8 Preferential offer/
public bid
Manufacturing 23.7 230,536 288.1Mining 4.8 2,184 3.5Services 9.8 4,593 6.9Fishing 49.0 956 1.5Total 238,269 300.1
Note: IFI � Instituto de Fomento Industrial. The stock assessment value is the equity book value after the assessment study, which represents thepreprivatization price. After 1995 all privatization contracts were subject to Law 226.
a. CCA: Equity shares seized by Banco Colombia’s trust fund in 1986.Source: IFI, requested files; Dager 1999.
283

and retirement associations, public bids, and the domestic stock exchange.The first method consisted of one preferential offer to individuals or com-mercial partners who had a direct involvement in either the company’sownership or control. These transfers followed the logic that block-holdersrepresent the company’s best interests. The second method followed apublic bid scheme. Specifically, either the IFI or the investment bank incharge of underwriting the sale called for offers from strategic investors.Similarly, the listing on the stock exchange was intended to give smallshareholders the opportunity to benefit from privatization. In addition,before 1995 at least 15 percent of the public equity shares in a companyhad to be offered to cooperatives, investment funds, union associations,and the company’s employees.
From May 1986 to December 1997, there were 38 privatizations af-fecting IFI enterprises. Three aspects merit further comment. First, in allbut one case, the shares held by the IFI accounted for less than half of thefirm’s net worth. In one firm (CONASTIL), the IFI reported a 59 percentshareholding. In three cases the sale was based on book values of assets offirms undergoing liquidation. One of them was a liquidating paper-millproject (PAPELCOL) that never started operations. These data confirmthat the role of the IFI was oriented toward promoting technology trans-fers and fostering entrepreneurship rather than exerting direct control onmanaging policies. Second, the data suggest that the sales process was suc-cessful in the sense that stock prices were in all cases greater than or equalto the preprivatization nominal stock price. However, there is no evidenceto ascertain if fixed assets were correctly valued before privatization.Third, the total sales figure for manufacturing was $288 million, which re-flects the modest government involvement in manufacturing by the end ofthe 1980s.
Privatization of Natural Gas and Gasoline Distribution
The state oil company’s sale of equity shares from its investments in thenatural gas and distribution industry as well as the gasoline retail distri-bution networks represented the privatization program in the natural gasand gasoline industry. Privatization was restricted to the sale of those as-sets that were not directly related to crude oil exploration, transportation,and refineries, and other investments in nonoil businesses.10 Table 6.3summarizes the divestiture program of ECOPETROL up until mid-1999.
During this period two gas companies were sold. Law 226 of 1995 reg-ulated these transactions and required that privatization sales must give apreferential offer to the solidarity sector, which includes the former com-pany’s labor union, worker associations, and cooperative firms. For thatreason, these sales had two rounds. First was the preferential offer to co-operative associations. The offer price was equal to the assessment price.Cooperatives purchased around 10 percent of shares of Gas Natural and
284 POMBO AND RAMÍREZ

Table 6.3 ECOPETROL Privatization Program, 1993–99
Stock Stockassessment sale Value Value
ECOPETROL price price sale salePrivatization shareholding (current (current (million (US$
Company name Activity year (percent) pesos) pesos) pesos) million) Sale method
Natural gas companiesGas natural Transportation 1997 60.6 6,667 19,902 168,494 147.8 Preferential-offer
distribution stock marketCOLGAS Distribution Ongoing 16.2 143 Preferential-offer
stock marketPromigas Transportation 1997 28.8 2,800 3,362 56,830 49.8 Preferential-offer
stock marketINVERCOLSA Distribution Ongoing 24.8 64 Preferential-offer
stock marketSurtigas Distribution No sale 15.4 256Gases Guajira Transportation No sale 6.2 n.a
distributionGasoline companiesTerpel Sabana Distribution 1993 40.0 n.a 6,562 4,200 5.3 Direct offerTerpel Bucaramanga S.A. Distribution 1993 36.1 n.a 7,691 14,477 18.4 Stock marketTerpel del Centro S.A. Distribution 1993 49.7 n.a 221 10,386 13.2 Stock marketTerpel Sur S.A. Distribution 1993 45.6 n.a 6,502 1,705 2.2 Stock marketTerpel Norte S.A. Distribution 1993 18.0 n.a 705 1,615 2.1 Stock marketTotal natural gas 197.6Total gasoline 41.2
n.a. Not applicable.Note: After 1995 all privatizations were subject to Law 226; ECOPETROL stopped the sale of IVERCOLSA in 2000. COLGAS had not been sold as of 2001.Source: ECOPETROL Planning Office, requested files; Decree 829 of 1999; DNP 1993b, 1997b, 1997c.
285
2 percent of Promigas at those prices. The second round consisted of a si-multaneous first price auction on the country’s three stock markets amongpreviously registered bidders. These auctions were successful, particularlyfor Gas Natural, where the sale price was three times greater than the baseprice.11
Privatization of the gasoline distribution companies took place in 1993,so no preferential offer was made. The sale was through the stock ex-change, except in one case where the sale was through a direct offer. Do-mestic investors bought 100 percent in three TERPEL companies and 50percent in the other two cases.12 ECOPETROL also offers financing forthese purchases. On average, 36 percent of the shares was financedthrough direct credits, and the remaining 64 percent was paid in cash.
Two observations are worth mentioning. First, except for Gas Natural,ECOPETROL’s shareholdings in the privatized companies were less than 50percent on the privatization date. Therefore, like the IFI enterprises, firmswere not directly subordinated to or controlled by ECOPETROL manage-ment policies. Moreover, those companies were independent in their invest-ment expansion plans, and company wage policy was set independently ofECOPETROL. Second, the sale of the TERPEL gasoline stations was thefirst privatization transfer after the privatization was authorized in 1993.TERPEL was traditionally the competitor of private retailers. Thus, thistransfer implied that gasoline retail distribution became wholly privatelyowned and run, in contrast to other oil producers in Latin American coun-tries such as Ecuador, Mexico, and Venezuela, where gasoline distributionremains vertically integrated with the state oil company.
Industry Restructuring and Privatization in the Power Sector
Regulatory reform in Colombia’s electricity supply industry is supportedby the Electric Law (Law 143) and by the Residential Public ServicesLaw (Law 142) of July 1994. This reform has been the most importantand comprehensive since 1967, when the national grid company, Inter-conexión Eléctrica S.A. (ISA), was established. The reform changed thestructure of the vertically integrated industry. The new regulatory insti-tutions started to operate one year later. The reform’s core elements fol-lowed the schemes adopted in Great Britain: separating generation,transmission, and distribution markets; setting up an electricity spotmarket or pool; and developing a long-term contract market for elec-tricity.13 Law 143 created the Regulatory Commission for Energy andGas (Comisión de Regulación de Energía y Gas, or CREG) and rules re-garding the sector’s planning and expansion plans, the regulatoryscheme, power generation, transmission and grid operation, grid accessfees, the rate-setting regime for electricity sales, concession contracts,and environmental issues.
286 POMBO AND RAMÍREZ

The power sector reform sought to introduce new competition and setup an independent regulatory system. In that sense, the main purpose wasto set the basis for the expansion and diversification of power generationsources, improving both the sector’s efficiency and its reliability. Politicalwillingness to support this plan was high after 1992, when the countrywas caught in the middle of a generalized power shortage and electricityrationing schedules were imposed. The generating system had to be madeless vulnerable to abnormal hydrological conditions (namely, El Niño)and more reliant on thermal generation from either coal or natural gas.
There are several points to make about the separation of electricity gen-eration, transmission, and distribution. First, the split among power ac-tivities implied the divestiture of the main power holdings that were verti-cally integrated monopolies. The same happened with the national gridcompany, which had to sell all of its power-generating units in 1995. Thenew regulatory framework seeks to promote market entry and competi-tion among generators. They compete openly by sending their bids oneday ahead to the pool. The sale price is based on an hour of use, and it dif-ferentiates between peak and off-peak hours. The National Dispatch Center,which is located at ISA headquarters, combines information regarding thesystem’s constraints, such as hydrological factors, reservoir levels, andtransmission bottlenecks, with final commercial demand in order to de-termine the dispatch orders. Thus, the market price that the pool sets is thehighest marginal bid that clears the market each hour. Based on the above,the pool administrator runs the next-day merit order dispatches.14 Electricpower is bought either through direct purchases from the pool or throughcontracts signed directly between generators and final users. However, thepool administrator runs the invoicing generated by all financial agree-ments. That is, that office pays and collects bills derived from contracts.
The regulatory scheme treats power transmission as a natural monop-oly, and thus CREG guarantees equal access to the grid to all providers.ISA is not allowed to have an equity share in either power-generating or-distributing companies. Power distributors face two types of regulation.The first one is price regulation. CREG currently sets the markup formulafor distributors, as well as determining the nature of the costs that can bepassed through to final users. These include the direct purchase costs suchas the pool sale price and transportation charges, capacity charges, andcosts of the reserve provisions that stabilize the system and prevent bot-tlenecks in the transmission system. Price regulation at this stage differsfrom most systems that have moved toward electricity markets that haveadopted price-cap rules. The second type of regulation concerns qualitycontrol, whereby companies are subject to sanctions if their service fails tomeet minimum quality standards. The reform was designed to protect twotypes of final users. Residential users are mainly consumers whose elec-tricity prices are set by a markup formula, which includes past inflation.The reform also covered large clients, mainly commercial and industrial
PRIVATIZATION IN COLOMBIA: A PLANT PERFORMANCE ANALYSIS 287

users that use at least half a megawatt of electricity a month. Large clientsmay enter into purchase agreements with power distributors, wholesale re-tailers, or generators, enabling them to hedge against pool price volatility, asensitive variable especially in hydro-based systems.
The reforms and regulations led to a general divestiture across electric-ity holdings to fully separate power generation, transmission, distribution,and the setting up of new commercialization activities. Thus, privatizationarose as one instrument for promoting market competition and industryrestructuring, and it became a complementary policy within a broadderegulatory context. Table 6.4 describes the privatization process in thepower sector.
Privatization in the power sector had two phases. The first one was the1996–97 privatization round, which focused on the sale of thermal plantsand hydroelectric stations. Sales reached $3.9 billion and covered half ofoverall generating capacity. The most important transaction was the saleof 48 percent of the Bogotá Power Company’s net worth, which also in-cluded the transfer of the local distribution network and the regional grid.The buyers were two holding companies owned by ENDESA andCHILECTRA, Chile’s largest power generators.
The second phase of the privatization program took place in 1998 andfocused on the capitalization and sale of the CORELCA holding, whichcovered Colombia’s northern Atlantic region. The restructuring involvedsplitting the holding into several independent companies according topower activity: generation, transmission, and distribution. The nationalgrid company ISA bought 65 percent of the new transmission company’sequity share. A holding company formed by American and Venezuelanutilities purchased a 65 percent equity share of the two distribution utili-ties founded after CORELCA’s restructuring. The two transactions addedup to $1.16 billion.
Performance Analysis
This section studies firm performance within a sample of former IFI man-ufacturing enterprises and the privatized power holdings. It also providesan efficiency analysis of the thermal generation sector in which new regu-lations led to privatization, restructuring, and the entry of new entities.The approach follows the general framework of Megginson, Nash, andvan Randenborgh (1994) and La Porta and López-de-Silanes (1999) forperformance analysis within the privatized power holdings; in the case ofmanufacturing, it follows as closely as possible the definition and con-struction of the performance variables of the benchmark cases. Nonethe-less, we include other performance variables regarding efficiency, marketpower, technology, and profitability indicators that follow standardmethodologies in industrial economics and are based on a combination of
288 POMBO AND RAMÍREZ

Table 6.4 Privatization in the Power Sector, 1995–98
Sale Buyer InvestorCapacity (US$ share country
Utility (megawatts) Type million) Seller Buyer (percent) origin
Batania 500 Hydro 497 ICEL ENDESA 100 ChileChivor 1,000 Hydro 645 ISA CHILGENER 100 ChileTasajero 150 Thermal, coal 30 ICEL Cooperative 58 ColombiaTermoCartagena 180 Thermal, coal 15 CORELCA Electricidad-Caracas 15 Venezuela
Cooperative 85 ColombiaEPSA-generation 772 Hydro 535 CVC Houston Industries 56 United States
210 Thermal, gasEPSA-distribution Electricidad-Caracas VenezuelaEEB-generation 2,312 Hydro 810 EEB Capital-Energia Holdinga 48.5 Chile, Spain
104 Thermal, coal (EMGESA)EEB-distribution 1,085 EEB Luz-Bogota Holdingb 48.5 Chile, Spain
(CODENSA)EEB-transmission 141 EEB Capital-Energia Holdinga 5.5 Chile, Spain
141 EEB Luz-Bogota Holdingb 5.5 Chile, Spain(EEB-Head Quarters)
CORELCAElectroCosta- CORELCA Houston Inc. - Electricidad 65 United States,
distribution Caracas Venezuela
289
(Table continues on the following page.)

ElectroCaribe- 980 CORELCA Houston Inc. - Electricidad 65 United States,distribution Caracas Venezuela
Transelca- 180.5 CORELCA ISA 65 Colombiatransmission
Total generation 5,228 2,532Total distribution 2,065Total transmission 462.5Total privatization 5,060
Note: EEB � Empresa de Energía de Bogota, EPSA � Empresa del Pacifico S.A. (formerly CVC), CVC � Corporación Autónoma del Cauca,ICEL � Instituto Colombiano de Energía Eléctrica, CORELCA � Corporación Eléctrica de la Costa atlántica, and ISA � Interconexión Eléctrica S.A.
a. Capital Energía � ENDESA (Chile) � ENDESA-Desarrollo (Sapin).b. Luz Bogota � CHILECTRA (Chile) � ENERSIS (Chile) � ENDESA-Desarrollo (Spain).Source: MME 1996, 1998; reports to the Congress; ISA 1998, 1999.
Table 6.4 (continued)
Sale Buyer InvestorCapacity (US$ share country
Utility (megawatts) Type million) Seller Buyer (percent) origin
290

physical and financial series at the plant level, which have a similar orequivalent interpretation to those constructed from financial statements.
Data Sets
There were two reasons for taking such measures. One was the lack of avail-ability of data at the plant or firm level. In particular, there were no consis-tent records of the financial statements at IFI headquarters that would allowus to assemble a data set similar to that of La Porta and López-de-Silanes(1999). The second reason was the quality of data. The most comprehensivelongitudinal data set is the Annual Manufacturing Survey (Encuesta AnualManufacturera, or EAM) of Colombia’s National Statistics Department(Departamento Administrativo Nacional de Estadística, or DANE). Thissurvey is a census of medium and large manufacturing enterprises that hasbeen undertaken annually since 1958. The variables and industrial classifi-cations in this data set have been relatively unchanged in format since the1970 industrial census. In general, the EAM includes around 140 variables,covers 94 specific groups (at the four-digit international standard industrialclassification level), and surveys an average of 6,000 plants.15 The survey re-ports variables such as gross output, number of employees, wages and bene-fits, raw materials, electricity consumption, sales, gross investment, and somefinancial variables such as asset book value and accounting depreciation.
The manufacturing data set consists of 30 former IFI enterprises that wereat some point either publicly owned or mixed-capital companies for whichIFI was a founding partner or strategic investor. Nineteen of the 30 startedbusiness operations between the 1950s and mid-1970s. Among them werethe country’s largest steel mills, tire and tube plants, pulp and paper mills,and basic industrial chemical plants. Twenty-one firms were part of the1986–97 IFI transfer program, accounting for 75 percent of total accumu-lated privatization sales. Four firms in the data set were exiting firms thatwere liquidated after 1992. The remaining firms are cases in which either thecompanies were transferred to the private sector before 1987 or the sale waspostponed for strategic reasons. The data set is an unbalanced panel thatrecords individual information from 1974 to 1998. Hence, the panel permitsanalysis of market dynamics at the firm level by tracking entry and exit flows.That feature makes the study sample appealing because of the robustness andlength of this data set in contrast to the data sets used in other privatizationstudies, which at most have available time series with three or four obser-vations before and after privatization (Megginson and Netter 2001).16
Table 6.5 shows a summary of the basic variables for the IFI sampleand total manufacturing before and after privatization. The sample con-sists of larger capital-intensive plants in Colombia. For instance, the sam-ple accounts for 5 percent of manufacturing’s value added, 3 percent ofmanufacturing employment, and most important, 20 percent of the totalcapital stock as well as power consumption of manufacturing.
PRIVATIZATION IN COLOMBIA: A PLANT PERFORMANCE ANALYSIS 291

For the privatized power holdings, we were able to collect the financialreports as far back as 1983 from several sources; this data set allowed usto replicate similar measures of profitability, efficiency, assets and invest-ment, sales, and employment as in the benchmark study done by La Portaand López-de-Silanes (1999). See appendix table 6D.1 for a completedescription of the power sector data sets.
Changes in Performance in Manufacturing
The study of IFI enterprises seeks to analyze changes in economic per-formance before and after privatization. The postprivatization period forthe manufacturing sector has coincided with the economic openness pol-icy that began in the 1990s. In fact, 30 out of 37 IFI privatization contractshave taken place since March 1990. Thus, the analysis relies on the meas-urement of five types of indicators of performance and strategic competi-tion: efficiency and productivity, profitability and market concentration,labor, assets and investment, and sales or total output.
The proxies are measured at the firm level. For incumbent firms thepreprivatization period is 1974–89. Thus, changes in performance cap-ture two effects: privatization and economic deregulation. For entrants,the time series starts with the first recorded observation, which in mostcases coincides with the start-up year of commercial operations. The
292 POMBO AND RAMÍREZ
Table 6.5 Average Changes in Manufacturing Basic Variablesafter Privatization for IFI Sample and Total Manufacturing(US$ million at 1995 prices, unless otherwise specified)
Manufacturing before Manufacturing afterprivatization, privatization,
1974–89 1990–98
IFI Total Ratio IFI Total Ratio
Variable 1 2 1/2 3 4 3/4
Gross output 1,203 20,145 6.0 1,751 31,052 5.6Value added 497 9,030 5.5 697 13,495 5.2Total employment 20,631 495,404 4.2 15,806 622,594 2.5Gross investment 127 956 13.2 92 1,372 6.7Capital stock 2,016 9,679 20.8 2,934 14,450 20.3Number of plants 25 6,356 0.39 27 7,475 0.36Electricity consumption 1,060 4,953 21.4 1,594 8,299 19.2(gigawatts per year)
Note: IFI � Instituto de Fomento Industrial. Definitions of each variable and itsmethodology can be found in appendix table 6.C1.
Source: Authors’ estimations based on DANE, various years.

sample has four exiting firms, which shut down operations within the pri-vatization period (1990–98). The time period covered by the data set allowsus to assume that in most cases firms have had enough time to complete re-structuring processes after privatization. Changes in performance are testedby using the Mann-Whitney (1947) rank sum test of means.
The reading of the results is not straightforward because one has toanalyze two forces behind the tests. On one hand, testing differences insample means and assuming equal variances shows the direction of pri-vatization effects. On the other hand, by testing for differences in medi-ans, one is evaluating a change in the distribution shape, which may ormay not coincide with the direction of the change in means. For exam-ple, increases in the sample mean with a negative change in the medianshow that a few individuals in the sample might explain overall varia-tion. Thus, privatization effects are not equally distributed or might haveopposite results across firms.
The basic results regarding performance changes in manufacturing aresummarized in table 6.6, which depicts the raw indicators, and table 6.7,which presents the industry-adjusted indicators. The latter are ratios rela-tive to specific industry classification groups. These results call for severalcomments. The effects of structural changes on profitability are mixed.The traditional ratios of operating income to sales, operating income tocapital stock, and net income to sales show that changes in means are notstatistically significant and that the companies therefore were not neces-sarily unprofitable before privatization. The industry-adjusted ratios showthat changes in medians rather than means are significant, in all cases atthe 5 percent level. The median of the three indicators for the privatizingfirms fell 25 points, on average, relative to their private competitors. Atfirst glance, this outcome suggests that at least half of the IFI companiesbecame less profitable after privatization.
We analyzed those results further by constructing a set of complemen-tary profitability indicators that either are similar or have the same inter-pretation. These nontraditional indicators are the Lerner index as a proxyfor the markup rates, the gross margin, and market share.17 According tothe Lerner index, IFI enterprises were highly profitable before privatiza-tion. For example, the mean of the Lerner index as a proxy of the markuprate is 14.8 percent. That rate fell to 12.7 percent during the 1990s. More-over, the adjusted indicator shows that, on average, IFI firms were morethan twice as profitable as their private competitors before privatization.After privatization this ratio fell slightly. The median of the markup rate,although statistically insignificant, increased from 6.6 percent to 10 per-cent, meaning that there was a positive convergence within the sample,partly due to the exit of less profitable plants after 1990. Changes are sta-tistically significant at the 5 and 10 percent levels. This result is contraryto most privatization studies, which have found that unprofitable publicenterprises constituted a central argument in favor of equity transfers.
PRIVATIZATION IN COLOMBIA: A PLANT PERFORMANCE ANALYSIS 293

294 POMBO AND RAMÍREZ
Table 6.6 Changes in Performance for the Sample of PrivatizedIFI Firms
N N Mean before Mean after t-statisticVariable before after Median before Median after Z-statistic
ProfitabilityTraditional indicatorOperating income/sales 394 227 0.2289 0.2206 �0.37
0.2476 0.2403 0.43Operating income/ 393 227 0.8684 0.8286 �0.28capital stock 0.4580 0.3045 1.96**
Net income/sales 394 227 0.1328 0.1793 1.330.1953 0.2033 �1.19
Nontraditional indicatorLerner index 394 227 0.148 0.127 �1.59**
0.066 0.101 1.07Gross margin 394 227 0.557 0.534 �0.34
0.608 0.689 3.16***Market share 394 227 0.135 0.108 �2.50***
0.073 0.079 1.32
EfficiencyTraditional indicatorCost per unit 394 227 0.5757 0.5159 �1.35*
0.5452 0.5312 1.45*Log(sales/employees) 394 227 10.562 11.037 6.59***
10.527 11.177 �6.28***Log(sales/capital stock) 393 227 0.442 0.313 �1.03*
0.777 0.435 2.41***Nontraditional indicatorCapital: partial 394 227 6.02 4.68 �1.10productivity 1.29 0.75 2.65***
Labor: partial 394 227 30,487 43,837 4.97***productivity 21,161 29,207 �4.33***
Translog index TFP 394 227 118.85 140.39 2.36***93.76 81.89 2.38***
LaborLog(workers) 394 226 5.59 5.47 �1.07
5.84 5.62 1.58Log(technicians) 354 221 3.04 2.89 �1.34*
3.00 2.75 1.12Log(administrative 394 222 4.53 4.56 0.34employees) 4.71 4.54 0.33
Assets and investmentLog(capital stock) 393 246 8.98 9.44 2.42***
9.20 10.00 �2.34 ***

Part of the explanation can be found in the economic openness pro-gram and the corporate structure of these firms. IFI firms were a centralpiece within the mixed strategy of import substitution and export diversi-fication implemented since the mid-1960s.18 These firms enjoyed higheffective protection until 1990. The drop observed in the mean of firmmarket share from 13.5 percent to 10.8 percent reflects the increase of im-ports within industry-specific domestic supply. Figure 6.1 depicts themarkup rate evolution for the IFI sample and total manufacturing.Clearly, profitability shows a decreasing trend, although IFI firms stillshow above-average profitability in manufacturing.
PRIVATIZATION IN COLOMBIA: A PLANT PERFORMANCE ANALYSIS 295
Table 6.6 (continued)
N N Mean before Mean after t-statisticVariable before after Median before Median after Z-statistic
Capital/labor 394 227 173,184 228,968 1.28*16,446 32,928 �4.08***
Investment/value added 394 225 0.861 0.187 �1.020.069 0.055 2.41***
Investment/before 393 225 0.091 0.059 �3.53***capital stock 0.059 0.025 5.27***
Machinery/investment 389 221 0.860 0.757 �0.410.724 0.703 �0.78
Investment/total 393 225 8,360 6,418 �0.76employees 1,533 1,529 1.13
OutputLog(gross output) 394 227 16.69 17.07 2.61***
16.89 17.48 �2.74***
* Significant at the 10 percent level.** Significant at the 5 percent level.*** Significant at the 1 percent level.Note: IFI � Instituto de Fomento Industrial, N � sample size, and TFP � total
factor productivity. This table presents raw results for 28 manufacturing enterprisesthat were included in the 1988 IFI divestiture program. The data set includes 4plants that shut down operations after 1990. The panel is unbalanced byconstruction, and the sample size refers to firm-year observations for two timeperiods: 1974–89, the years before privatization, and 1990–98, the years afterprivatization. The maximum number of firm-year observations before privatizationis 394; after privatization, 227. The table presents for each empirical proxy thenumber of usable observations, the mean, and the median values before and after1990. The table reports t-statistics and Z-statistics (Mann-Whitney nonparametricrank sum) as the test for significance for the change in mean and median values,respectively. Capital and labor productivities and capital/labor andinvestment/employee ratios are in 1995 US$. Definitions of each variable and itsmethodology can be found in appendix table 6C.1.
Source: Authors’ calculations.

296 POMBO AND RAMÍREZ
Table 6.7 Industry-Adjusted Changes in Performance for theSample of Privatized IFI Firms
Industry-adjusted
N N Mean Mean t-statisticVariable before after Median Median Z-statistic
ProfitabilityTraditional indicatorOperating income/sales 394 227 0.9165 0.8788 �0.26
0.9401 0.8018 2.46***Operating income/ 393 227 2.1877 1.8446 �0.95
capital stock 1.1061 0.6317 2.53***Net income/sales 394 227 0.6348 0.6212 �0.03
0.9157 0.7554 2.51***
Nontraditional indicatorLerner index 394 227 2.181 1.936 �1.35*
1.416 1.398 0.20Gross margin 394 227 0.190 1.281 1.23
1.022 1.000 3.62***Market share 394 227 0.197 0.150 �2.35***
0.052 0.063 1.32
EfficiencyTraditional indicatorCost per unit 394 227 1.012 0.964 �0.89
0.948 0.984 �0.49Log(sales/employees) 393 227 0.998 1.008 1.99**
1.005 1.016 �2.11**Log(sales/capital stock) 393 227 0.535 1.705 1.87**
1.018 1.127 �2.05**
Nontraditional indicatorsCapital: partial 393 227 8.681 7.197 �0.85productivity 1.733 0.986 2.72***
Labor: partial 394 227 1.321 1.385 0.76productivity 1.069 1.022 0.98
Translog index TFP 391 158 1.408 1.609 1.66*1.043 1.026 �0.22
LaborSize 394 227 5.584 6.265 0.93
3.643 2.961 0.59Size-workers 394 227 5.628 6.370 1.02
3.739 3.128 0.48
Assets and investmentCapital stock 393 227 10.576 11.433 0.45
2.504 3.327 �0.70

The gross margin rate is an indicator of working capital that showshow firms are restricted by payroll structures.19 The change in medians ofthis indicator is positive and significant at the 5 percent level, increasingfrom 60.8 percent before privatization to 68.9 percent afterward. Thisresult indicates that half of the distribution was able to adjust its payrollstructure to efficiency parameters. Most former IFI firms have had strictunion convention clauses. The 1990 labor market reform (Law 50) elimi-nated wage rigidities such as the retroactive severance pay system and themandatory reinstatement regime for workers with more than 10 years onthe payroll.20 Thus, IFI firms could ease their payroll constraint and speedup the benefits derived from the 1990 labor reform after privatization.However, the industry-adjusted margin rate shows an opposite change inmedians, which moved from 1.02 to 0.92 times, meaning that despite theIFI firms’ new contracting flexibility, private competitors increased theirgross margin faster than IFI firms during the 1990s.
PRIVATIZATION IN COLOMBIA: A PLANT PERFORMANCE ANALYSIS 297
Table 6.7 (continued)
Industry-adjusted
N N Mean Mean t-statisticVariable before after Median Median Z-statistic
Capital/labor 393 227 4.915 4.153 �0.770.674 0.966 �2.12**
Investment/value added 394 225 2.580 1.399 �0.990.736 0.560 1.83*
Investment/capital stock 393 225 1.186 1.068 �0.490.577 0.382 3.57***
Investment machinery/ 393 225 1.612 1.190 �0.90investment 1.018 0.974 1.61*
Investment/employees 393 225 1.744 1.646 �0.220.746 0.616 1.13
OutputScale 394 227 6.313 7.846 1.81**
3.377 2.674 �0.46
* Significant at the 10 percent level.** Significant at the 5 percent level.*** Significant at the 1 percent level.Note: IFI � Instituto de Fomento Industrial, N � sample size, and TFP � total
factor productivity. The industry control group is the four-digit international standardindustrial classification group to which a specific firm belongs. For each year and firmwe compute industry-adjusted indicators by taking the ratio of the value of theindicator for the IFI firm to its industry control group. See table 6.6 for an explanationof the data set and significance tests on which this table is based. Definitions of eachvariable and its methodology can be found in appendix table 6C.1.
Source: Authors’ calculations.

Corporate structure is another explanatory factor of IFI firms’ prof-itability levels. As was pointed out earlier, the IFI companies were mixed-capital enterprises. At the time of privatization, the share of IFI in manu-facturing company equity was on average 24 percent and the accumulatedsales were under US$300 million (see table 6.2). These numbers under-score the state’s limited participation in manufacturing, where the IFI’spolicy of capital rotation implied a sale of equity once companies becameincumbents and mature within the market. This limited state role in theeconomy was a sharp contrast to other Latin American countries. State-owned enterprises (SOEs) in Mexico, for example, represented 38 per-cent of the economy’s capital stock by 1982, and there were SOEs inalmost all manufacturing groups. In Chile SOE sales represented 14 per-cent of gross domestic product in 1965, and the government controlledthe key foreign export sector of copper mining, as well as most largemanufacturing enterprises located in industries such as paper and pulpmanufacturing.21
298 POMBO AND RAMÍREZ
0.06
0.08
0.10
0.12
0.14
0.16
0.18
0.20
1970 1974 1978 1982 1986 1990 1994 1998
Markup rates
IFI Manufacturing
Figure 6.1 Markup Rates for IFI Sample and TotalManufacturing, 1970–98
Source: Authors’ estimations based on DANE, various years, and Pombo1999a.

Efficiency gains underpin part of the pro-competitive pricing strategythat followed trade liberalization. In contrast to the profitability results,the efficiency outcomes are in the expected direction: there is evidence thatIFI firms improved technical efficiency during the 1990s. The average(median) cost per unit decreased 6 percent (1.4 percent), while the meanand the median ratio of sales to employees rose 48 percent. At the sametime, the median ratio of sales to capital stock fell 34 percent. Thesechanges are all significant at either the 5 or the 10 percent level. The in-dustry-adjusted ratios of these indicators behave in different directions.On one side, the average and median ratios of sales to employees rise onlyslightly, but on the other side the average of sales to capital stock triplesfrom 0.54 to 1.71 times. The median increases more moderately, movingfrom 1.02 to 1.13 times relative to their control group. These changes aresignificant at the 5 percent level. Last, neither the mean nor the medianchange in the industry-adjusted cost per unit is significant.
These results indicate at least two things. First, an efficiency gainresulted from the large increase in labor productivity that improved firms’total factor productivity (TFP). Second, evidence of gains is not conclusiveconcerning capital productivity in the raw indicator of sales-to-capitalratio. Nonetheless, the change in the industry-adjusted indicator impliesthat even if IFI firms did not improve their capital productivity, they didmuch better than their private peers, which experienced a large drop incapital input productivity after 1990. To pin down the source of efficiencygains, we constructed nontraditional indicators of partial and total factorproductivity. Ratios of value added to capital or labor are direct measuresof partial input productivity. These measures are more accurate than sales-to-input ratios because changes in quality in raw materials are in fact asource of a firm’s efficiency gains that might influence the direction ofthese performance indicators.
The measuring of partial and total productivity shows that average(median) firm labor productivity increased 43 percent (13 percent) at con-stant prices,22 and the average TFP index rose by 22 basis points, which isequivalent to a 2.4 percent annual productivity growth rate. The TFP me-dian fell 11 basis points, meaning that efficiency gains were asymmetricacross plants. The median for capital partial productivity contracted 58percent, moving from $1.29 per unit of installed fixed capital to $0.75 atconstant prices. These changes are significant at the 5 percent level.
These results illustrate the direction of plant restructuring in these com-panies. IFI firms represent 20 percent of Colombia’s manufacturing capitalstock (see table 6.5). The study sample consists of large capital-intensiveplants. In fact, the measurements of capital-to-labor ratios show that be-fore privatization, IFI firms were 4.9 times more capital intensive thantheir counterparts in the private sector. That number dropped to 4.1 after1990. The behavior of the TFP index for the IFI sample closely follows thecycle for total manufacturing (figure 6.2). Productivity for IFI companies
PRIVATIZATION IN COLOMBIA: A PLANT PERFORMANCE ANALYSIS 299

plummets by 40 basis points between 1979 and 1983, according to theTFP index. This means a –10 percent TFP growth per year, whereas theaverage efficiency loss in manufacturing was �2.6 percent per year. Thisproductivity shock implied that even 15 years later the surviving firms hadnot been able to reach the TFP levels of the mid-1970s.
One factor that explains this cycle in productivity is the crisis in capitalproductivity of the 1980s and its slow pace of recovery. The adjustedindicator shows that for IFI firms the median of capital productivity was 1.8times that of their private competitors. During the 1990s the number con-verged to 0.99 times, meaning that productivity was about the same in bothgroups and reaching industry benchmarks. Moreover, investment plum-meted because of an overinvestment problem. In fact, the mean (median)rate of capital accumulation dropped from rates of 9.1 percent (5.9 percent)per year before privatization to rates of 5.9 percent (2.5 percent) per yearwhile the median investment rate fell from 6.9 percent to 5.5 percent per
300 POMBO AND RAMÍREZ
50
60
70
80
90
100
110
1970 1974 1978 1982 1986 1990 1994 1998
Indexes
IFI Manufacturing
Figure 6.2 Total Factor Productivity Indexes for IFI Sampleand Total Manufacturing, 1970–98
Source: Authors’ estimations based on DANE, various years, and Pombo1999a.

year after 1990. These changes are significant at the 5 percent level. At thesame time, the mean of investment per employee decreased from $8,360 to$6,418 per year at constant prices, while the median remained unchanged.The change in the last indicator is not statistically significant. The changesin the adjusted indicators of investment rates are in the same direction.
Figure 6.3 illustrates the overinvestment problem for IFI companies,where investment rates were 2.5 times the level for total manufacturinguntil 1989. Thereafter the gap decreased to 1.4 times. Thus, IFI firmsstrongly rationalized capital spending in order to pin down excess capac-ity. Various factors help explain the sample’s overinvestment. One isassociated with the macroeconomic disequilibriums of the late 1970s gen-erated by coffee boom prices that led to the appreciation of the Colombianpeso. Temporary trade liberalization, which enhanced capital goodsimports, was another factor. Microeconomic factors also came into play.During the 1977–83 period, the IFI and private investors undertook thetwo largest industrial investment projects since the 1960s. One was acement mill (Compañía Colombiana de Clinker, or Colclinker) that began
PRIVATIZATION IN COLOMBIA: A PLANT PERFORMANCE ANALYSIS 301
0.00
0.02
0.04
0.06
0.08
0.10
0.12
0.14
0.16
0.18Manufacturing
0.00
0.10
0.20
0.30
0.40
0.50
0.60
0.70
0.80
IFI
1970 1974 1978 1982 1986 1990 1994 1998
Manufacturing IFI
Figure 6.3 Investment Rates for IFI Sample and TotalManufacturing, 1970–98
Source: Authors’ estimations based on DANE, various years.

operations in 1977 and still is the country’s largest. The second, theestablishment of one of the largest nickel processing plants in Latin Amer-ica (Cerromatoso), began operations in 1983. As a founding partner, IFIhad a 45 percent equity share in this nickel plant.
Similar results have been found in other country-specific studies of pri-vatization. Equity transfers to private holders do not necessarily boostinvestment, as many government officials argue when calling for privati-zation. By the late 1980s, most IFI-associated firms clearly had an excesscapacity problem, which became a bottleneck once the domestic marketstarted to peter out as a source of demand growth.23 Nonetheless, evenwith decreasing trends in overall investment rates, one might expect in-vestment to become more selective through spending on new machinery toreplace worn-out capital equipment. This was not the case for the IFI com-panies. The mean (median) embodied investment rate—the ratio of in-vestment spending on machinery to total investment—declined from 86percent before 1990 (72 percent) to 76 percent (70 percent) after privati-zation. However, these changes are not statistically significant. The ad-justed embodied investment rate shows that the median changed from1.02 to 0.97 times after privatization and is significant at the 10 percentlevel. These results on investment behavior suggest that one aspect of firmrestructuring after privatization was the reduction of excess capacity.
Labor productivity is the other component explaining the direction of thefirms’ restructuring after privatization. As was pointed out, IFI firms wereable to increase their TFP growth by 2.4 percent per year after 1990. How-ever, those rates have not allowed a full recovery from the dramatic loss incapital productivity that those companies experienced during the 1980s.The mean (median) of labor productivity rose from $30,487 ($21,161) to$43,837 ($29,207) at constant prices during the 1990s. This change meansa 43 percent real increase in value added per worker. As reported in table6.2, around 4,800 workers were laid off, representing a 23 percent totalpayroll reduction within IFI companies after privatization. The layoff com-position was 3,700 workers, 750 administrative employees, and 340 tech-nicians. However, the changes in means and medians of the labor series bytype of occupational category are not statistically significant.
The adjusted labor indicators given by plant size show an increase inthe mean from 5.58 to 6.26, while the medians decrease from 3.64 to2.96. These measurements also show the asymmetric effects of labor lay-offs across plants, but the direction of change in medians implies a lowerplant operating scale. Again these changes are not statistically conclu-sive; therefore, one might have some caveats about the labor adjustmentdirection. In any case, labor cuts were small in comparison with othernational experiences. The Mexican manufacturing payroll was halvedduring privatization (La Porta and López-de-Silanes 1999), for example,while the privatization of British Telecom involved the layoff of morethan 5,000 workers (Armstrong, Cowan, and Vickers 1994).
302 POMBO AND RAMÍREZ

Figure 6.4 depicts the labor productivity indexes for the IFI sample andfor total manufacturing. One sees a positive gap between IFI firms and theaverage for total manufacturing, starting in 1984 and coinciding with theturning point for the IFI firms’ productivity trends. The average value ofthe labor productivity gap was 20 points during the 1980s and nearly triplethat in the 1990s. Thus, IFI firms made greater efforts in increasing laborproductivity relative to their private competitors. This is partly explainedby the moderate levels of layoffs but also by adjustment in plant efficiencyscales, which by definition eliminates any diseconomies in production.
The positive but lower rates of capital accumulation plus the payrollcontraction after 1990 explain changes in the ratio of plant capital to la-bor. The mean (median) capital units per employee rose 32 percent (100percent) at constant prices after privatization. The adjusted indicatoralso shows that IFI firm plants became more capital-intensive relative totheir control group. The median changed from 0.67 to 0.97 times—thatis, these firms effectively substituted capital for labor input, adjusting
PRIVATIZATION IN COLOMBIA: A PLANT PERFORMANCE ANALYSIS 303
0.00
0.02
0.04
0.06
0.08
0.10
0.12
0.14
0.16
0.18Manufacturing
0.00
0.10
0.20
0.30
0.40
0.50
0.60
0.70
0.80
IFI
1970 1974 1978 1982 1986 1990 1994 1998
Manufacturing IFI
Figure 6.4 Labor Productivity Indexes, IFI Sample andTotal Manufacturing, 1970–98
Source: Authors’ estimations based on DANE, various years.

their relation to industry benchmarks. The changes are significant at the5 percent level.
Another important result is that IFI firms were able to increase theirsales despite the payroll contraction and the lower rates of capital accu-mulation. Mean (median) gross output increased 38 percent (59 percent).This increase implies a 4.2 percent (6.5 percent) output growth rate peryear during the 1990s. The adjusted indicator shows that, on average, out-put rises from 6.3 to 7.8 compared with the control group. These resultscomplement those found regarding plant size. On one hand, plant sizeadjustment implies a correction in plant scale but on the other hand, IFIfirms were able to exploit new economies of scale. Thus, part of the ob-served TFP growth is explained by economies of scale and the rest mightbe attributable to changes in technology.24
Another issue that is important to analyze is the role of labor costs inexplaining cost reductions that allow firms to set lower prices and behavemore competitively. According to the redistribution hypothesis, one canexpect a drastic fall in wages after privatization because of lower laborproductivity and a renegotiation of unions’ convention clauses. In the caseof the IFI firms, we do find that the mean (median) of the industry-adjusted value added per worker before privatization was 1.3 (1.07) (seetable 6.7). Hence, the argument does not apply.
Table 6.8 presents the wage data by type of worker. The striking resulthere is the large increase in real wages of workers in the privatized IFI firms.The increase in means (median) in the per capita wage for blue-collar work-ers was 30 percent (17 percent) after privatization in real terms. For white-collar workers, the mean (median) increase was 36 percent (27 percent) at1995 prices. More interesting are the changes in the industry-adjusted percapita wages. Wages for both blue- and white-collar workers increased rela-tive to private competitors. La Porta and López-de-Silanes (1999) documentsimilar results for Mexico. All tests are significant at the 5 percent level.
To summarize, the analysis of changes in performance indicates thatIFI firms followed pro-cyclical trends relative to their control group.That is, there was no asymmetric performance of these companies incontrast to their private peers. Part of the explanation for this is that IFIfirms were mixed-capital enterprises and followed profit-maximizingpricing rules rather than pursuing second-best prices or net transfersthrough subsidized sale prices. As a result, management strategies fol-lowed private-sector benchmarks, although rate-setting policy favored,at some points and for some cases, the dominant position of IFI firmswithin domestic markets. Because IFI’s role was the strategic but sup-portive one of promoting firm capitalization, it never sought to controlcompany management policies. The results regarding plant efficiency areconsistent with the expected effects, but in this case, privatization helpedto speed up firm labor restructuring, which implied a strong change inmagnitude in the labor productivity indexes. Finally, the wage data
304 POMBO AND RAMÍREZ

indicate that we can reject the hypothesis of transfers from workers toshareholders after privatization.
Changes in Performance in the Power Sector
Our analysis of the performance in the power sector takes into accountthe effects of the 1994 reform on firm entry, market competition, and ef-ficiency gains. In that sense, the analysis focuses on firm changes in meansand medians of direct measures of profitability, efficiency, assets and in-vestments, and sales of the privatized power holdings. The study samplecovers the equity transfers in three of five regional power systems whereprivatization took place in both power generation and power distribu-tion, as described earlier. They are the former Bogotá Power Company,Cauca Valley Corporation (CVC), and the Corporación Regional de la
PRIVATIZATION IN COLOMBIA: A PLANT PERFORMANCE ANALYSIS 305
Table 6.8 IFI Firms: Role of Transfers from Workers
N N Mean before Mean after t-statisticVariable before after Median before Median after Z-statistic
Total wages/sales 394 227 0.1154 0.0988 �2.33***0.0914 0.0691 4.06***
Log(total employees) 394 227 5.98 5.90 �0.746.12 5.96 1.28
Real wages per 394 226 338.4 437.1 5.96***blue-collar worker 312.5 363.1 �3.98***
Industry-adjusted real 394 226 1.06 1.18 3.28***wages per blue-collar 1.04 1.09 �2.30***worker
Real wages per 394 222 543.43 738.71 6.34***white-collar worker 492.02 625.07 �5.01***
Industry-adjusted real 394 222 1.09 1.26 3.80***wages per white-collar 1.04 1.14 �3.14***worker
Real wages per worker 394 227 386.7 500.1 6.83***355.8 448.4 �5.23***
Industry-adjusted real 394 227 1.16 1.34 3.32***wages per worker 1.05 1.12 �1.79*
* Significant at the 10 percent level.** Significant at the 5 percent level.*** Significant at the 1 percent level.Note: IFI � Instituto de Fomento Industrial and N � sample size. The series of per
capita wages are expressed in US$ at 1995 prices. See tables 6.6 and 6.7 for anexplanation of the data set and significance tests on which this table is based.Definitions of each variable and its methodology can be found in appendix table 6C.1.
Source: Authors’ calculations.

Costa Atlántica (CORELCA) holding. The control group is Public Enter-prises of Medellín (EPM), which is a municipally owned company andhas been traditionally the most efficient public utility. Series were chainedafter 1995 keeping the prereform holding structure in order to have com-parable statistics.
Tables 6.9 and 6.10 present the main results regarding the performanceeffects of privatization on the power holdings. Several facts are worth not-ing. First, the reform has had a direct and positive effect on operatingefficiency. The average cost per unit dropped 45 percent at constant pricesafter reform, compared with the preprivatization rate. The mean (median)ratio of sales to assets (property, plant, and equipment, or PPE) rose 17percent (18 percent), while the mean (median) ratio of sales to employeesrose 20.3 percent (15.7 percent). The same happened with the ratio ofoperating income to employee, where the mean (median) increase was 63percent (48 percent) at constant prices after the reform. Changes are sig-nificant at the 5 percent level.
There are at least three important sources of these efficiency gains.First, utilities made an effort to reduce both power losses and the tariff-collecting problem in power distribution. This was the case for the BogotáPower Company in particular, which drastically reduced its power loss in-dexes from 53 percent in 1985 to 22 percent in 1996.25 Second, the reformand privatization induced new investment in incumbent firms, in contrastto what was observed for manufacturing. All investment rates at least dou-bled, on average. Notice that capital stock remained unchanged, but thisfinding is not statistically significant. Total assets usually have several bi-ases depending on the depreciation schedules. For that reason a more ac-curate indicator is the current investment rate. Notice that in most casesthe industry-adjusted changes in performance of operating efficiency andinvestment-adjusted indicators are not statistically significant, meaningthat despite their efforts, the newly privatized power holdings could notmatch EPM’s efficiency changes. Third, employment cuts were not as sig-nificant as in the case of manufacturing. The four electric holdings alto-gether had, on average, 13,300 employees before the reform. This numberonly decreased to 11,600 employees during the 1995–99 period. Thus, theobserved 23 percent real increase in labor productivity resulted from an in-crease in sales rather than drastic employment cuts. In fact, mean (median)sales increased by 16.4 percent (21.1 percent).
The new regulation has used two instruments to encourage market entry.One is a guaranteed minimum return on installed capacity. The second in-strument is the power purchase agreement (PPA). These agreements arelong-term contracts that allow generators to hedge against unexpectedchanges in demand and distributors to hedge against system constraints.One type of PPA initially implemented in Colombia is to pay what is gen-erated, which involves an advance purchase of plant capacity by a powerdistribution company Most thermal generators are marginal producers
306 POMBO AND RAMÍREZ

Table 6.9 Changes in Performance in the Sample of Privatized Power Utilities and Public Enterprises of Medellín
N N Mean before Mean after t-statisticVariable before after Median before Median after Z-statistic
ProfitabilityOperating income/ 48 20 0.3208 0.1891 �3.093***sales 0.3587 0.2262 2.410**
Net income/sales 48 20 0.1382 0.0882 �0.6930.1992 0.0998 0.794
Operating income/ 48 20 0.0562 0.0288 �3.060***PPE 0.0556 0.0397 2.544**
Operating income/ 48 20 0.0997 0.0463 �3.155***net worth 0.0958 0.0452 3.876***
Operating efficiencyCost per unit 48 20 0.0292 0.0207 �1.790**
0.0226 0.0194 1.561Log(sales/PPE) 48 20 1.2574 1.4289 3.260***
1.2278 1.4101 �2.907***Log(sales/employees) 48 20 2.0020 2.2035 4.469***
2.0021 2.1578 �3.957***Operating income/ 48 20 112.82 183.91 4.367***employees 105.54 156.68 �4.321***
LaborLog(employees) 48 20 3.4354 3.3987 �0.4701
3.5205 3.4255 0.8080307
(Table continues on the following page.)

Assets and investmentLog(PPE) 48 20 4.1807 4.1733 �0.1135
4.1513 4.1509 0.1750Investment/salesa 48 8 0.0039 0.0066 1.9950**
0.0033 0.0063 �1.1710Investment/ 48 8 0.4869 0.8374 1.6493*employeesa 0.2721 0.6909 �1.5220
Investment/PPEa 48 8 0.0742 0.1579 3.1909***0.0647 0.1521 �1.9900**
Log(PPE/total 48 20 0.7453 0.7746 0.4286employees) 0.7817 0.7960 �0.2690
OutputLog(sales) 48 20 5.4382 5.6023 2.5933***
5.4771 5.6886 �2.6250***
* Significant at the 10 percent level.** Significant at the 5 percent level.*** Significant at the 1 percent level.Note: N � sample size and PPE � property, plant, and equipment. This table presents raw results for three privatized power holdings and for
public enterprises of Medellin. The data set is a balanced panel by construction, and the sample size refers to firm-year observations for two timeperiods: 1983–94, the years before the regulatory reform, and 1995–99, the postreform years. The maximum number of firm-year observationsbefore the reform is 40; after the reform, 20. The table reports for each empirical proxy the number of usable observations, the mean, and themedian values before and after the sector regulatory reform (1995), and the t-statistic and Z-statistic (Mann-Whitney nonparametric rank sum) asthe test for significance of the change in mean and median values. Value variables before transformations in logs are in millions of pesos at 1995prices. Definitions of each variable as well as details on Colombia’s power sector data sets and definitions can be found in appendix table 6.C1.
a. Postreform years are 1995–96 due to unavailability of appropriate data for later years.Source: Authors’ calculations.
Table 6.9 (continued)
N N Mean before Mean after t-statisticVariable before after Median before Median after Z-statistic
308

Table 6.10 Industry-Adjusted Changes in the Performance of Privatized Power Utilities
N N Mean before Mean after t-statisticVariable before after Median before Median after Z-statistic
ProfitabilityOperating income/ 36 15 0.7122 0.4088 2.308**
sales 0.8264 0.6109 1.757*Net income/sales 36 15 0.1677 0.0504 0.341
0.1949 �0.0076 0.537Operating income/PPE 36 15 0.7458 0.3206 2.018**
0.6933 0.4037 2.233**Operating income/ 36 15 0.7647 0.3152 1.996**
net worth 0.7559 0.3729 1.736*Mean tariff 26 6 1.7088 1.0469 2.032**
1.4213 1.0296 1.977**
Operating efficiencyCost per unit 36 15 0.5101 0.6649 �1.242
0.4162 0.5036 �1.137Log(sales/PPE) 36 15 1.0055 1.0488 �0.828
0.9663 0.9989 �1.116Log(sales/employees) 36 15 1.0296 0.9910 1.394
1.0324 0.9955 1.220Operating income/ 36 15 1.2877 1.1073 1.142
employees 1.2240 1.0026 1.199
LaborLog(employees) 36 15 1.0013 0.9974 0.128
1.0477 0.9974 0.475
309
(Table continues on the following page.)

Assets and investmentLog(PPE) 36 15 1.0133 0.9763 1.826**
1.0031 0.9593 2.150**Investment/salesa 36 6 1.1585 1.0014 0.371
0.9723 0.9074 0.539Investment/employeesa 36 6 1.6667 0.6618 1.350
0.8622 0.3741 1.546Investment/PPEa 36 6 1.2120 1.0372 0.411
1.0115 1.4047 0.108Log(PPE/employees) 36 15 1.0733 0.9021 1.386
1.2772 0.9461 1.530
OutputLog(sales) 36 15 1.0115 0.9937 1.225
1.0361 1.0081 1.199
*Significant at the 10 percent level.**Significant at the 5 percent level.***Significant at the 1 percent level.Note: N � sample size and PPE � property, plant, and equipment. This table presents the industry-adjusted results for three privatized power
holdings. Performance proxies are adjusted relative to Public Enterprises of Medellín. The data set is a balanced panel by construction, and thesample size refers to firm-year observations for two time periods: 1983–94, the years before the regulatory reform, and 1995–98, the postreformyears. The maximum number of firm-year observations before the reform is 36; afterwards it is 15. See table 6.9 for an explanation of thesignificance tests; see appendix table 6C.1 for definitions of the variables.
a. Postreform data are for 1995–96 due to unavailability of appropriate data for later years.Source: Authors’ calculations.
Table 6.10 (continued)
N N Mean before Mean after t-statisticVariable before after Median before Median after Z-statistic
310
PRIVATIZATION IN COLOMBIA: A PLANT PERFORMANCE ANALYSIS 311
whose objective is to generate a hedge for the system. In fact, thermal unitsare spread across electricity holdings, and some of them became inde-pendent companies after privatization as mentioned earlier (see table 6.4).Overall, 63 thermal plants with an effective capacity of 3,800 megawattswere operating in 1998; that represented a 32 percent share of all gener-ated electricity. Among those thermal units, 21 started commercial opera-tions after 1993, and 16 are privately owned. This is not a coincidencesince the government had already undertaken an emergency plan to ex-pand thermal generators to overcome the 1992 power generation crisis.26
Figure 6.5 illustrates the evolution of the country’s effective and avail-able capacity from 1991 to 1999. The available capacity rose from 1,000gigawatt hours (GWh) in 1990 to around 2,500 GWh in 1998.27 In sum,fixed investment in thermal generation has played a central role in im-proving system reliability as well as promoting market entry in powergeneration.
The behavior of profitability indicators, however, did not mirror the ef-ficiency gains. Notice the striking result that all profitability indicators,adjusted and unadjusted, dropped after the regulatory reform. The mean(median) ratio of operating income to sales was 32.1 percent (35.8 per-cent) before the reform for the study sample (see table 6.9). The indicatorfell to 18.9 percent (22.6 percent) during the postreform years. The ratiosof operating income to PPE and to net worth, indicators of firms’ profitrates on gross and net fixed assets, respectively, were reduced by close toone-half. These changes are significant at the 5 percent level. The adjustedindicators show the same behavior, that is, the privatized holdings lostrelative profitability compared with their control group.
As in the case of manufacturing, these results are the opposite of theexpected effects of privatization on firm profitability. The conventionalwisdom would say that any gains in input productivity must have a directimpact on firm profitability rates if and only if there are no drastic changesin market competition. The 1994 regulatory reform implied more marketcompetition for both power generation and distribution. First, ownershipcomposition changed drastically within the first five years after the regu-latory reform, which led to a balanced distribution of power-generatingcapacity between public and private utilities. By 1998 public utilitiesaccounted for 42 percent of the power-generating capacity, while privateand mixed-capital utilities held a 58 percent share. The largest generatorhad a 21 percent market share.28 This outcome contrasts with the initialdivestiture in the United Kingdom where nonnuclear generation was splitinto a duopoly, and in Chile, where the three largest power generatorscontrol 85 percent of the market.
On the power distribution side, privatized utilities dropped their ratesfor final users after 1995. Moreover, they have converged to EPM’s final-user rate. The industry-adjusted rate for residential users dropped from1.70 to 1.04 after the reform. If one takes into account the unregulated
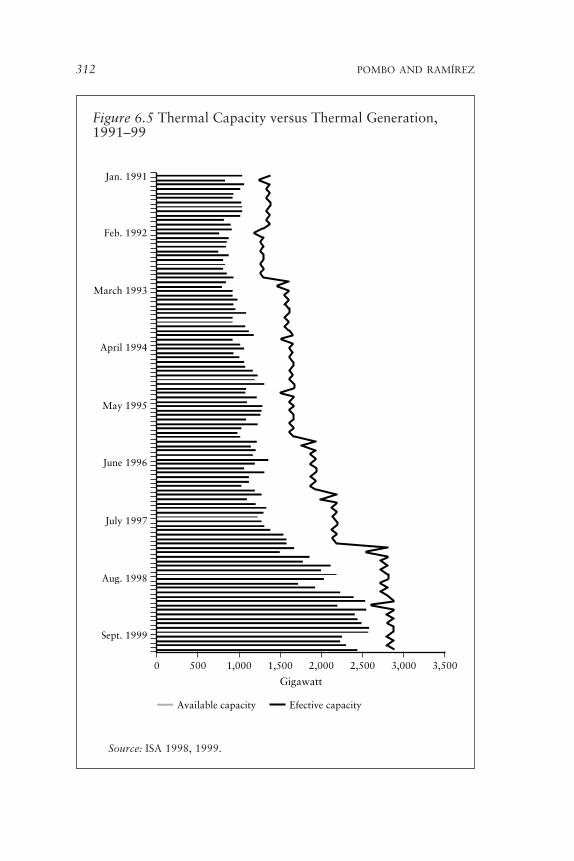
312 POMBO AND RAMÍREZ
Figure 6.5 Thermal Capacity versus Thermal Generation,1991–99
Source: ISA 1998, 1999.
0 500 1,000 1,500 2,000 2,500 3,000 3,500
Jan. 1991
Feb. 1992
March 1993
April 1994
May 1995
June 1996
July 1997
Aug. 1998
Sept. 1999
Gigawatt
Available capacity Efective capacity

electricity market (industrial users), the drop must be even greater. Table6.11 summarizes the main variables of the wholesale electricity market.Two facts are noteworthy. First, the evolution of electricity spot pricessuggests that buyers—power distributors—have effectively hedged againstpool price volatility. Real contract prices dropped 42 percent from 1996to 2000. That outcome is important since contracts have a 75 percentmarket share in bulk electricity. Another important outcome is that mar-ket deregulation has sharply increased the number of unregulated users,most of which are large industrial and commercial clients.
A sharp increase in financial costs during the first half of the 1990s alsocontributed to narrowing gross and net utility profits. The four regionalmarkets under study had, on average, a 90 percent real increase in theirfinancial costs relative to the average of the 1980s. The Bogotá Power Com-pany faced most of the indebtedness burden because of the overcosts gener-ated by the five-year delay in the start-up of the Guavio hydroelectric plant.
An Analysis of the Productive Efficiency of Thermal Plants
The previous section shows that the 1994 regulatory reform and resultingmarket competition encouraged power firms to achieve improvements inefficiency, to try to stop theft and other nontechnical losses of power, andto undertake new investments in power-generating capacity. This sectionpresents the measurement of productive efficiency at the plant level for asample of thermal plants that belong to public, private, and mixed-capitalutilities. Of the 63 plants that belong to the interconnected system, only32 units have been active, having a permanent or temporary productionwithin a specific year. Because of changes in the statistical sources, thedata set was divided into two samples. The first sample has records for 33thermal plants, on average, for the 1988–94 period, that is, the years be-fore reform. The second one has records for 32 thermal units for thepostreform years (1995–2000).
The measurement of plant technical efficiency is based on Data Envel-opment Analysis techniques and requires information about inputs andoutput for each thermal unit. Plant inputs are capital, or capacity inmegawatts (MW); labor (number of employees); and fuel consumption(coal, gas, fuel oil, and diesel oil). All fuels must have a common meas-ure unit, such as British thermal units (Btus) or thermal calories.29
Output is given in gigawatt hours (millions of kilowatt hours). Informa-tion for power generation, consumption by type of fuel, and capacity atthe plant level is available by crossing the different data sets before andafter 1994.
Labor input is not directly observable for most units. There are tworeasons for that problem. One is that before privatization thermal unitswere vertically integrated with power utilities; thus, payroll series wererecorded following accounting criteria. Power companies kept labor
PRIVATIZATION IN COLOMBIA: A PLANT PERFORMANCE ANALYSIS 313

Table 6.11 Annual Averages for Wholesale Electricty Market Efficiency Variables, 1996–2000
Mean Mean Spot PPAspot PPA price price Commercial Unregulated Regulated Unregulated Unregulatedprice price index index demand demand demand demand users
Year (US$/kWh) (US$/kWh) (Dic98�100) (Dic98�100) (GWh) (GWh) (GWh) share (percent) (number)
1996 0.0084 0.0348 52.8 125.0 3,329.6 454.5 2,875.0 0.1365 11.21997 0.0548 0.0321 342.7 115.2 3,410.1 453.9 2,956.2 0.1336 95.31998 0.0374 0.0288 233.7 103.4 3,452.5 659.5 2,793.0 0.1910 678.81999 0.0159 0.0220 99.3 79.1 3,316.5 676.1 2,640.4 0.2038 891.62000 0.0204 0.0203 127.7 72.9 3,387.3 843.7 2,543.6 0.2489 2,377.0
Note: GWh � gigawatt hour, kWh � kilowatt hour, and PPA � power purchase agreement. This table shows the main variables of thewholesale electricity market. The spot price indicates the pool daily prices, and the PPAs are forward contracts of electricity prices and dispatchedquantities. Both are market prices. Final residential and small commercial users, whose price formula is set by the regulatory commission, form theregulated demand. Unregulated users are large clients that underwrite purchase contracts with power generators and distributors. Commercialdemand is equal to the sum of the regulated and unregulated demand. The last column reports the average number of large clients that areregistered in the electricity market for a given year. Prices per kilowatt hour are in US$ at 1998 prices. Value series were deflated by the U.S.consumer price index.
Source: ISA 1998, 1999; Mercado de Energía Mayorista (MEM) requested files.
314

records to fulfill the requirements of financial reporting. Second, therewas no regulator requesting information by power activity. Labor sta-tistics after 1996 have improved sharply since the regulator (Superin-tendent of Domiciliary Public Services) has been in charge of theSIVICO database. Labor series by power company are broken down byoccupational categories, sectoral activities (that is, generation, trans-mission, and distribution), and by type of power generation. In addi-tion, after privatization the plants that were sold became new utilities.This allowed for making direct inferences about labor input (number ofemployees) by thermal substations. Fixed coefficients of labor to capac-ity were assumed based on the information sent by power generators tocomplete labor series before 1995. The results of the efficiency frontiermeasurement exercise based on 42 thermal plants that were active asmarginal producers before and after the 1995 regulatory reform are dis-played in appendix table 6E.1. The results show that the most efficientplants before the reform were not the most efficient afterward. Entrantsindeed pushed efficiency up and became benchmark technologies. Thus,the 1994 reform that sought to promote plant entry also spurred gainsin technical efficiency through the new plants and the overhaul of oth-ers. Such was the case of Termo-Barranquilla, which is the country’slargest thermal plant.
Econometric Analysis of IFI Manufacturing Plants
This section analyzes the role that plant characteristics, foreign trade vari-ables, and privatization played in determining privatization outcomes forthe sample of IFI firms. The econometric analysis focuses on two key per-formance variables: plant profitability rates (Lerner indexes) and thetranslog indexes of total factor productivity as a proxy for technologicalchange. This econometric exercise hopes to shed light on plant efficiencyand markup determinants as well as to evaluate the significance of priva-tization within the model. The data set is an unbalanced panel of 28 IFIfirms that records information for the 1974–98 period. The estimatingequation follows the baseline pooled regression model:
(6.1)
where i equals 1, ..., n is the number of individual firms; t � 1, 2,..., T isthe number of observations in each panel; X is equal to firm characteris-tics variables; and Z is equal to specific industrial classification variables.Equation 6.1 allows the running of several types of regression models ac-cording to specific assumptions on the residual variance covariance matri-ces and individual effects �i. In particular, the estimations relax the as-sumptions of constant variance across panels, the nonexistence of
performance it � (0��i) � Xit B � Zit� � �it
PRIVATIZATION IN COLOMBIA: A PLANT PERFORMANCE ANALYSIS 315
individual effects, and instruments for endogeneity on right-hand-sidevariables.
Plant characteristic variables are related to technology structures, la-bor composition, and the firm’s market positioning actions. One ex-pected result is that technology-related variables have a positive impacton profitability gains. In that sense, plant size, operative scale, quality ofraw materials, capital intensity, and relative labor productivity result inlower average costs that represent productivity gains due to neweconomies of scale. Plant payroll composition reflects quality in labor in-put. Thus, technicians should lead overall plant labor productivity be-cause skilled workers are more dynamic and generate productivityspillovers. Administrative employees, in turn, may generate inflexibilitiesthat end up hurting profitability. Market positioning variables are thoseactions that strengthen a firm’s market share. The firm’s signals are in-vestment rates, the use of technological licenses, and product differentia-tion tactics such as advertising. These actions may persuade rivals tosoften competition and adopt collusive prices, but because a competitor’sbest response might include hardening competition and setting dumpingprices, there is no expected sign.
Industry-specific variables are mostly related to foreign trade. Threemain variables are used in the estimating equations: nominal tariffs, effec-tive protection rates, and Grubel and Lloyd (1975) indexes. The last is aproxy for trade in differentiated goods.30 Protectionism increases domesticprofitability by deterring entry. Intraindustry trade, in contrast, impliestrade in similar goods that makes entry credible because of the monopo-listic competition market structure, which drives sale prices to second-bestprices.31 Hence, profitability decreases.
Table 6.12 displays the main results for the markup determinants; theseresults call for several comments. First, in all cases, the firm’s market shareis the robust determinant. This is consistent with the observation that eco-nomic openness reduces the firm’s market power and therefore decreasesmarkup rates. Estimations show that a 10 percent decrease in marketshare reduces profitability by 9 percent.
Second, the foreign trade variables are robust regressors and show theexpected sign. On average, an increase of 10 percent in the effective pro-tection rate increases markups by 4 percent. In contrast, if intraindustrytrade indexes rise 10 percent, markups will decrease on average by 3 per-cent. This finding is important from the perspective of strategic trade pol-icy. Competition through similar goods forces firms to undertake furtherspecialization strategies to promote efficiency gains in order to compen-sate for the reduction in markup rates. Third, plant size and productiveefficiency are important sources of profitability gains. IFI firms are on av-erage seven times larger than their competitors. As a result the observedgains in TFP partially offset the falling trend in firm markup. On average,if TFP indexes rise 10 points, they will increase markup rates by between
316 POMBO AND RAMÍREZ

Table 6.12 Markup Determinants for IFI Firms
Equation 1 Equation 2 Equation 3 Equation 4 Equation 5Pooled Panel Panel Within Pooled Equation 6
Independent variable OLSa FGLS FGLS FE 2SLSa FE � IV
Market share 0.8751*** 0.9318*** 0.9264*** 0.8931*** 0.9641*** 0.9459***(0.0470) (0.0263) (0.0255) (0.0305) (0.0311) (0.0341)
Labor productivity 0.0195*** 0.0085*** 0.0089*** 0.0108*** — —industry-adjusted (0.0039) (0.0017) (0.0016) (0.0024) — —
Translog index TFP 0.0001* 0.0001*** 0.0001*** 0.0001* 0.0003*** 0.0002**(0.00003) (0.00001) (0.00001) (0.00004) (0.00011) (�0.00006)
Size 0.0012** 0.0008*** 0.0009*** — — —(0.0006) (0.0002) (0.0002) — — —
Human capital �0.0226*** — — — — —(0.0054) — — — — —
Grubel and Lloyd index �0.0521*** �0.0280*** �0.0385*** �0.0170* �0.0400** �0.0182*(0.0160) (0.0079) (0.0084) (0.0094) (0.0156) (0.0095)
Effective protection — 0.0381*** 0.0433*** 0.0337*** 0.0878*** 0.0328***— (0.0055) (0.0059) (0.0079) (0.0136) (0.0080)
Dummy privatization — — 0.0125*** — — —— — (0.0029) — — —
Dummy foreign investment — — �0.0144*** — — —— — (0.0031) — — —
Constant 0.0084 �0.0228*** �0.0214*** �0.0039 �0.0470** �0.0016(0.0076) (0.0035) (0.0041) (0.0069) (0.0206) (0.0089)
317 (Table continues on the following page.)

Regression statisticsR2 0.6315 0.6699 0.6249 0.6245Number of groups 28 28 28 28Number of observations 613 621 621 621 620 564Observations per group:Minimum 13 13 13 13Maximum 25 25 25 25F-test 116.03 238.69 145.15 235.16
[0.0000] [0.0000] [0.0000] [0.0000]Wald-Chi2(k � 1) 2741 2932
[0.0000] [0.0000]F-test for all �i � 0 93.6
[0.0000]
Heteroscedasticity testsCook-Weisberg 267.79
[0.0000]White 293.58
[0.0000]
Table 6.12 (continued)
Equation 1 Equation 2 Equation 3 Equation 4 Equation 5Pooled Panel Panel Within Pooled Equation 6
Independent variable OLSa FGLS FGLS FE 2SLSa FE � IV
318

Variance matrix residualsHomoscedastic panels Yes No No Yes Yes YesInstrumental variable No No No No Yes Yes
RHS endogenous variables TFP TFP
Other equations in system TFP � F(partial labor productivity, industry-adjusted; scale;capital/labor ratio, industry-adjusted).
* Significant at the 10 percent level.** Significant at the 5 percent level.*** Significant at the 1 percent level.Note: FE � fixed effects, FGLS � feasible generalized least squares, IFI � Instituto de Fomento Industrial, OLS � ordinary least squares, IV �
instrumental variables, 2SLS � two-stage least squares, and TFP � total factor productivity. The table reports results from ordinary least squares,feasible generalized least squares, fixed effects, two-stage ordinary least squares, and fixed effects with instrumental variables for an unbalancedpanel of 28 IFI firms for the 1974–98 period that were included in the 1988 privatization program. The maximum number of observations is 621.The dependent variable in all equations is the Lerner index, or markup rate. Standard errors appear in parentheses and p-values in brackets.Definitions of each variable and its methodology can be found in appendix table 6C.1.
a. White-Hubert robust heteroskedastic standard errors. Source: Authors’ calculations.
319

0.005 and 0.02 points in markup rates. Fourth, privatization shows aconsistent sign. Privatization induced a 1.2 percent increase in profit rates(column 3 in table 6.12). Finally, the foreign investment dummy has theopposite sign. In the context of the IFI sample, this result is not surpris-ing since some firms are located in industries that were once highly pro-tected and that kept lower efficiency levels with respect to parent firmsand international standards.
The econometric results on productive efficiency are displayed in table6.13. Five comments are worth making. First, plant characteristics are rel-evant for TFP indexes. All the regression equations show that plant laborproductivity, licensing, and number of technicians have positive effects.On average, an increase of 10 percent in partial labor productivity relativeto the specific control group raises TFP by 3.2 percent. The effect of li-censing is the largest. If plants expand their spending on technological li-censing relative to their value added by 1 percent, they boost productivityby between 5.5 and 8.2 times. This finding is consistent with previous re-sults for total manufacturing and calls attention to the short-run effective-ness of using patented licenses for improving productivity rather than en-gaging in direct research and development spending.32 The number oftechnicians is a proxy for labor input quality. A 10 percent increase in thisvariable improves productivity by 1.12 percent.
Second, the equation includes two variables to capture demand ef-fects on TFP measured by either the growth in value added or the logvalue of a firm’s specific control group. The sign matches with the ex-pected one, which is consistent with the traditional hypothesis derivedfrom the Verdoom law by which growth and productivity are con-strained by effective demand. The impact of aggregate demand is two-fold: domestic demand and export demand induce growth and improveproductivity by learning. This in turn leads to improvements in pricecompetitiveness, which induces higher levels of effective demand(Dixon and Thirlwall 1975).33 Third, privatization has a positive effecton productivity, causing an increase ranging from 0.27 to 0.53 pointson TFP indexes. Fourth, the scale and the adjusted capital partial pro-ductivity coefficients have a negative impact on productivity. The inter-pretation of this result is not straightforward. The losses in capital pro-ductivity due to overinvestment suggest that IFI firms adjusted capitalspending to close gaps with industry benchmarks.
Fifth, markups are inversely related with TFP, which is not consistentwith the self-investment-financing hypothesis of endogenous growth mod-els (Romer 1990; Barro and Sala-i-Martin 1995). In particular, one shouldexpect a positive impact since larger profitability rates ease the self-financing of capital equipment and spending on research and develop-ment. After controlling for fixed effects, however, the expected sign isrecovered. The within-regression coefficients show that a 10 percent in-crease in markups improves TFP by 13 percent.
320 POMBO AND RAMÍREZ

Table 6.13 Total Factor Productivity Determinants for IFI Firms
Equation 1 Equation 2 Equation 3 Equation 4 Equation 5Pooled Panel Panel Within Pooled Equation 6
Independent variable OLSa FGLS FGLS FE 2SLSa FE � IV
Labor productivity, industry- 0.3803*** 0.3633*** 0.3295*** 0.2219*** 0.4811*** 0.2384***adjusted (0.0598) (0.0321) (0.0318) (0.0248) (0.0769) (0.0223)
Capital productivity, �0.0094*** �0.0049*** �0.0050*** — �0.0103*** —industry-adjusted (0.0017) (0.001) (0.0009) — (0.0019) —
Demand growthb 0.2011*** 0.0812** 0.0977** — 0.1915** —(0.0782) (0.0457) (0.0444) — (0.0783) —
Scale �0.0316*** �0.0190*** �0.0175*** �0.0136*** �0.0262*** �0.0185***(0.0043) (0.0023) (0.0023) (0.0038) (0.0045) (0.0035)
Licensing 7.9312*** 7.9246*** 8.1922*** — 5.3740** —(1.9463) (1.3614) (1.4664) — (2.1096) —
Compensation per worker, �0.3283*** �0.1031*** �0.1135*** — �0.2392** —industry-adjusted (0.0943) (0.0424) (0.0432) — (0.1125) —
Advertising coefficient �2.2255*** �1.6442*** �1.4812*** — �2.2842*** —(0.5537) (0.4407) (0.4422) — (0.5543) —
Log technicians 0.1152*** 0.1019*** 0.0778*** 0.1418*** 0.1875*** 0.1071***(0.0324) (0.0176) (0.0163) (0.0262) (0.0353) (0.0215)
Privatization dummy 0.3626*** 0.0525 — — 0.2700 —(0.1073) (0.0438) — — (0.1118) —
Lerner index — �0.4968*** �0.4130*** 1.3185*** �2.1912*** 1.3116***— (0.1570) (0.1502) (0.2899) (0.4225) (0.3626)
(Table continues on the following page.)
321

Log value addedb — — — 0.3308*** — 0.2702***— — — (0.0462) — (0.0412)
Relative capital/labor ratio — — — — — �0.0339***— — — — — (0.0040)
Constant 0.9934*** 0.6140*** 0.7227*** �5.7045*** 0.8739*** �4.3417***(0.1497) (0.0762) (0.0691) (0.8684) (0.1591) (0.7796)
Regression statisticsR2 0.1954 0.2708 0.1663 0.4047Number of groups 28 28 28 28Number of observations 554 554 554 575 554 476Observations per group: Minimum 4 4 5 5Maximum 24 24 25 25F-test 22.9 40.25 20.73 54.93
[0.0000] [0.0000] [0.0000] [0.0000]Wald-chi2(k � 1) 289.6 296.4
[0.0000] [0.0000]F-test for all �i � 0 142.5
[0.0000]
Table 6.13 (continued)
Equation 1 Equation 2 Equation 3 Equation 4 Equation 5Pooled Panel Panel Within Pooled Equation 6
Independent variable OLSa FGLS FGLS FE 2SLSa FE � IV
322

Heteroscedasticity testsCook-Weisberg 73.51
[0.0000]Breuch-pagan LM stat 158.9
[0.0000]Variance matrix residualsHomoscedastic panels Yes No No Yes Yes YesInstrumental variables No No No No Yes YesRHS endogenous variables LERNER LERNEROther equations in system Lerner � F( market share, Grubel & Lloyd index, effective protection)
* Significant at the 10 percent level.** Significant at the 5 percent level.*** Significant at the 1 percent level.Note: FE � fixed effects, FGLS � feasible generalized least squares, IFI � Instituto de Fomento Industrial, OLS � ordinary least squares, IV �instrumental variables, and 2SLS � two-stage least squares. The table reports results from ordinary least squares, feasible generalized least squares,fixed effects, two-stage ordinary least squares, and fixed effects with instrumental variables for an unbalanced panel of 28 IFI firms for the1974–98 period that were included in the 1988 privatization program. The maximum number of observations is 621. The dependent variable inall equations is the translog index of total factor productivity (1974 � 100). For each year and firm, we compute industry-adjusted indicators bytaking the ratio of the value of the indicator for the IFI firm to its industry control group. Industry control group is the four-digit standardindustrial classification group to which a specific firm belongs. Standard errors appear in parentheses and p values in brackets. Definitions of eachvariable and its methodology can be found in appendix table 6C.1.a. White-Hubert robust heteroskedastic standard errors. b. By specific industrial classification.Source: Authors’ calculations.
323

Power Plants: Statistical Analysis of Efficiency Scores
This section reports the results of an econometric analysis of thermalpower plant DEA efficiency scores. The exercise follows a limiteddependent variable model because the dependent variable under analysisis censored by construction. It takes positive values and is bounded at1.00; thus, the efficient plants record an efficiency score, yit, of 1. Other-wise, . The sample might also be truncated because there isknowledge of independent variables only if yit is observed. This is partic-ularly important for marginal power producers when the thermal plantsare shut down by maintenance, transmission, and generation constraintsbecause there is no power dispatch. The baseline-censored model followsa linear specification:
(6.2)
and the residuals follow a normal distribution with zero mean and con-stant variance.
Equation 6.2 models efficiency scores as a function of plant characteris-tics, ownership structure, and regulatory policy dummies. Plant character-istics include plant age, capital-to-labor ratio, technology type, and loadfactor. Controlling for the load factor indicates how marginal a given pro-ducer is. A dummy that takes the value of 1 for all private plants capturesownership. The regulatory dummy tries to capture the effect of large cus-tomer definition. Thus, for each plant that dummy takes a value of 1 after1998 (when the minimum usage limit was lowered, thus increasing thenumber of unregulated users from 100 to 900). The data set includes all ob-served records from all active thermal plants during the 1995–2000 period.Therefore, the data set is an unbalanced panel with 166 observations.
Table 6.14 displays the Tobit regressions. The dependent variable inthe first two equations is Score1, which represents plant efficiency scoresmeasured under the assumption of constant returns to scale, and capitalinput is adjusted by its effective utilization. This adjustment normalizesplant capacity by load factor, which means that all producers are treatedas if they were off-peak generators. The dependent variable in the thirdequation is Score2, in which the measure of plant efficiency relaxes the as-sumption of constant returns to scale. The reading of those results is as fol-lows. First, the equations exhibit high quality of fit, reported by the R2 ofthe OLS regressions.34 In particular, the overall effect of the plant charac-teristics, ownership structure, and regulatory policy dummy explains 90percent of the efficiency scores once capital input is adjusted by capacityutilization; that number falls to 78 percent when the assumption of con-stant returns to scale is relaxed. Second, dummy variables for technology
yit � cx�it B�eit 0 � yit � 10 otherwise
0 � yit � 1
324 POMBO AND RAMÍREZ

PRIVATIZATION IN COLOMBIA: A PLANT PERFORMANCE ANALYSIS 325
Table 6.14 Determinants of Thermal Plants’ Efficiency Scores
Equation 1 Equation 2 Equation 3Pooled Pooled PooledTobit Tobit Tobit
Independent variable Score1 Score1 Score2
Adjusted capacity �0.0004*(0.0002)
Age �0.0155*** �0.0175*** �0.0183***(0.0018) (0.0018) (0.0029)
Age2 0.0004*** 0.0005*** 0.0005***(6E-04) (6E-05) (9.5E-05)
Load factor 0.4169*** 0.3700*** 0.1128***(0.0445) (0.031) (0.0428)
Load factor2 �5.1005*** �4.5298***(1.207) (1.125)
Capital/labor ratio 0.0010(0.0006)
Gas dummy 0.3653*** 0.3704*** 0.3960***(0.0118) (0.0122) (0.0196)
Combined cycle 0.1431dummy (0.0923)
Private ownership 0.0323***dummy (0.0116)
Public ownership �0.0423***dummy (0.0117)
Regulatory policy 0.0201* 0.0229** 0.0432**dummy (0.0108) (0.0112) (0.1762)
Constant 0.4098*** 0.4593*** 0.5020***(0.0206) (0.0208) (0.0315)
Sigma 0.0660 0.0691 0.1122
Regression statisticsR2-OLS 0.9104 0.9074 0.775Uncensored 155156 152observations
Censored 710 14observations
LR~Chi(k�1) 377.3 379.5 228.9[0.0000] [0.0000] [0.0000]
Test residualsCook-Weisberg (OLS) 0.00 0.04 2.46
[0.9924] [0.8445] [0.1168]Breuch-Pagan (OLS) 6.87
[0.4416]
(Table continues on the following page.)

326 POMBO AND RAMÍREZ
Table 6.14 (continued)
Equation 1 Equation 2 Equation 3Pooled Pooled PooledTobit Tobit Tobit
Independent variable Score1 Score1 Score2
Ramsey-RESET (OLS) 1.83 0.59 0.28[0.1439] [0.6225] [0.8391]
Swilk (OLS) 4.99 4.67 3.35[0.0000] [0.0000] [0.0004]
* Significant at the 10 percent level.** Significant at the 5 percent level.*** Significant at the 1 percent level.Note: OLS � ordinary least squares. This table reports results from Tobit
regressions for an unbalanced panel of 33 thermal plants for the 1995–2000 period.The total number of observations is 166. The dependent variables are Score1 andScore2. Score1 is equal to plant efficiency scores measured under the assumptions ofconstant return to scale and convex technology. Capital input is multiplied by itseffective utilization rate. Score2 is equal to plant efficiency scores measured under theassumptions of variable returns to scale and convex technology. Capital input ismultiplied by its effective capacity utilization rate. Gas technology is a dummy thattakes the value of 1 if plant technology is gas based, and 0 otherwise; combined cycleis a dummy that takes the value of 1 if plant technology, whether a thermal plant, hasa combined cycle technology, and 0 otherwise; private ownership is a dummy thattakes the value of 1 if the plant is privately owned, and 0 otherwise; public ownershipis a dummy that takes the value of 1 if the plant is publicly owned, and 0 otherwise;and regulatory policy is a dummy that takes the value of 1 for the years that thedefinition of a large client was set to a minimum consumption of 0.5 megawatt permonth. Standard errors appear in parentheses and p-values in brackets.
Source: Authors’ calculations.
are robust and statistically significant in all equations. This implies thatnew gas-based technologies improve system efficiency, because they saveon fuel consumption. Entrants played a central role in this particular issue.Third, the load factor is positively related, meaning that power lossesassociated with the frequent and costly plant start-ups are effectivelyreduced. The square of the variable is negatively related, however, showingthat there are decreasing returns to scale at full plant capacity.
Fourth, plant age is negatively related, meaning that older plants loserelative efficiency. Nonetheless, the behavior of the square of the age vari-able shows the presence of positive learning effects that partially offsetplant aging. For example, the accumulated efficiency loss after 10 years is17 percent, but the learning effect represents a 4.5 percent efficiency gain.Fifth, regulatory policy has had positive effects. The regression coefficientsindicate that, on average, the three equations show an overall efficiencygain of 2.8 percent. Sixth, the exercise is inconclusive about whether
ownership leads to structural differences in productive efficiency. The pri-vate ownership dummy was not significant once capital input was cor-rected for capacity utilization and the assumption of constant returns toscale was relaxed (see table 6.14, column 3). This result is in line withother studies. Pollit (1995) reports statistically insignificant regression co-efficients for his ownership dummy based on a cross-sectional data set of768 thermal power plants for 14 countries.
Concluding Remarks
This chapter has given an overview of the privatization program inColombia, gathering detailed information in a comprehensive way thatsets this process in context within the global economic deregulation andmarket promotion competition strategy. In that sense, the chapter offersfor the first time a complete description of Colombia’s privatization expe-rience in the 1990s and is also the first to provide empirical evidence basedon an ex post performance evaluation for the privatized plants. The chap-ter has explored in-depth the cases of IFI manufacturing enterprises andpower holdings. These sectors account for 95 percent of the privatizationsales up to 1998, which undoubtedly make the results comprehensive interms of the overall effects of privatization on firm performance.
The study yielded several interesting results. For the case of manufac-turing, we found that IFI firms followed the cycles and trends of their pri-vate competitors across the manufacturing industry. This was provedthrough the study’s measurement of 25 indicators of economic perfor-mance. The evolution of firm market power and profitability ratesindicates that privatized firms are pricing more competitively and stilladjusting to global economic deregulation and foreign competition. Inparticular, the decreasing trends in firms’ markup after 1990 is a counter-intuitive result. Most studies on privatization show an opposite result be-cause when they were state-owned, the privatized firms were unprofitableor experiencing permanent operative deficits. The IFI firms were differentbecause the government did not exercise control of the companies’ man-agement policies. As a result, the IFI companies behaved more like theirprivate competitors than like typical state-owned enterprises. Thus, thelower markup rates after privatization show that the markets are morecompetitive because of deregulation on entry and the exposure to interna-tional competition brought about by lower tariffs.
The study also shows that privatization had a positive effect on firmefficiency. The analysis of the changes in performance of the efficiencyindicators shows a sharp increase in labor productivity as well as a re-duction in the cost per unit. In contrast, IFI firms experienced a drasticreduction in the median of the ratios of sales and value added to capitalstock. This was a direct consequence of the overinvestment problem of
PRIVATIZATION IN COLOMBIA: A PLANT PERFORMANCE ANALYSIS 327

the late 1970s and 1980s that hit the IFI companies harder because oftheir capital-intensive technologies. Privatization in this case did notboost investment. Instead, IFI companies rationalized capital spendingto overcome their fall in sales per unit of capital. Nonetheless, themeasurements of total factor productivity had a net positive change forthese firms—the industry-adjusted indicators even showed that theiroverall efficiency gain was greater than their private competitors. Thus,privatization was important as a complementary mechanism that facil-itated and sped up industrial restructuring in these plants. This obser-vation is supported in econometric results in which the privatizationdummy turned out to be a robust determinant of the indexes of totalfactor productivity.
The analysis of the power sector also yielded important results. Thegeneral trends of electricity contract prices, the evolution of plant entryin thermal generation, and the increasing share of unregulated users incommercial demand suggest that the regulatory reform has been effectivein promoting market competition and system efficiency. As was true forthe IFI manufacturing firms, the performance analysis shows that the1994 regulatory reform and the privatization program had a positiveimpact on the efficiency of electric utilities but a negative impact on theirprofitability.
The sources of efficiency gains are explained by market competitionin power generation; the reduction of nontechnical power losses, suchas theft, in distribution; and the new investment in gas-based thermaltechnologies. The measurement of efficiency scores by thermal units re-inforces the evidence in favor of the existence of an overall gain in sys-tem efficiency and reliability. Regulatory policy has had positive effectson plant efficiency based on the econometric results. The increasingnumber of unregulated users has led generators to offer more competi-tive prices to secure generating contracts and thus a steady flow of busi-ness. Consistent with other studies, we found no evidence that privateownership of electricity utilities had a positive impact on efficiency. In-stead, regulation and market reform pin down the positive change intechnical efficiency across thermal units.
The results of the reform on utilities’ profitability do not go in the ex-pected direction; instead of rising, they have fallen. This outcome is par-tially explained by the introduction of market competition in electricitygeneration. Competition implies that utilities have less market power,which limits their capacity to obtain extra profits through power genera-tion. In fact, the wholesale electricity market in Colombia is one of themost competitive given the number of power generators relative to the sizeof the market. Two additional facts are worth noting. First, power hold-ings faced financial burdens caused by an increase in their external debtservice and delays in start-up in some hydro units at the beginning of the1990s. Second, power distributors have decreased real prices to final
328 POMBO AND RAMÍREZ

users. This is a consequence of a deregulated market that has introducedcompetition in the market of forward contracts.
Finally, although privatization in Colombia has been small in size andscope, this study provides elements to conclude that the experiment wassuccessful because it helped to consolidate entry and market competitionin previously protected industries and to break up vertically integratedmonopolies.
PRIVATIZATION IN COLOMBIA: A PLANT PERFORMANCE ANALYSIS 329
Table 6A.1 Infrastructure Concession Projects with OngoingPrivate Investment by 1998
Project name Project name
RoadsArmenia–Pereira–Manizale
Barranquilla–CienagaBogota–FacatativaBogota–VillavicencioBuga–Tulua–PailaCarreteras MetaCartagena–BarranquillaCortijo–VinoEspinal NeivaMedellin–RioNegroPatios–GuascaSta–Marta–Paraguanchon
Total road kilometers 1,388under concession
Gas pipelinesSebastopol–MedellinBarranca–B/mangaSur–HuilaMariquita–CaliHuila–TolimaTotal length in kilometers 861
under concession
AirportsBogota-Second TrackBarranquilla, Aereopuertodel Caribe S.A.
Cartagena, Airport
Water and sanitationACUACAR-CartagenaTriple A-BquillaSta MartaMetro-AguaTIBITOC Plant forwater treatmentBogota Water Company
RailroadsAtlantic Line–cargo
Maritime portsTotal ports under concession 15
Telecomunicationsa
COMCEL (mixed capital)CELCARIBE (mixed capital)OCCEL (mixed capital)CELUMOVIL (private)CELUMOVIL COSTA (private)COCELCO (private)
Note: This table excludes the power sector. Concession contracts are either build-operate-maintain-transfer or rehabilitate-operate-maintain-transfer.
a. Refers to mobile phone company names and their capital structure by 1998.Source: Law 37 of 1993; DNP 1993, 1995, 1997c; Bonilla and others (2000);
Alonso and others (2001).
Appendix 6A

Table 6B.1 List of IFI Enterprises in the Sample
Number Name Startup ISIC4 ISIC–name
1 Acerías Paz del Río 1947 3710 Iron and steel basic industries2 Aicsa 1977 3845 Manufacture of aircraft3 Alcalis-Betania 1951 3511 Basic industrial chemicals except fertilizers4 Alcalis-Mamonal 1967 3511 Basic industrial chemicals except fertilizers5 Astivar 1974 3841 Shipbuilding and repairing6 Catsa Compañía Colombiana 1978 3116 Grain mill products7 Automotriz 1974 3843 Manufacture of motor vehicles8 Cementos Boyacá 1955 3523 Cement, lime, and plaster9 Cementos Rioclaro 1986 3692 Cement, lime, and plaster
10 Cerromatoso 1979 3722 Recovery and founding of tin and nickel11 Colclinker 1974 3692 Cement, lime, and plaster12 Conastil 1969 3841 Shipbuilding and repairing13 Empaques del Cauca 1965 3211 Spinning, weaving, and finishing textiles14 Fatextol 1988 3220 Wearing apparel15 Federaltex 1987 3211 Spinning, weaving, and finishing textiles
Appendix 6B
330

16 Ferticol 1966 3511 Fertilizers and pesticides17 Frigopesca 1978 3114 Canning, processing of fish, shellfish18 Icollantas 1942 3551 Tire and tube industries19 Ingenio de Risaralda 1978 3118 Sugar refineries20 Intelsa 1979 3832 Manufacture of radio, tv, and
telecommunications equipment21 Monomeros 1967 3512 Fertilizers and pesticides22 Penwalt 1967 3512 Fertilizers and pesticides23 Propal 1961 3411 Pulp, paper, and paperboard24 Quibi 1968 3522 Manufacture of drugs and medicines25 Simesa 1938 3710 Iron and steel basic industries26 Sofasa 1969 3843 Manufacture of motor vehicles27 Sucromiles 1973 3511 Basic industrial chemicals except fertilizers28 Tejidos Unica 1953 3216 Weaving and cotton manufactures29 Texpinal 1973 3211 Spinning, weaving, and finishing textiles30 Vikingos de Colombia 1968 3114 Canning, processing of fish, shellfish
Note: IFI � Instituto de Fomento Industrial.Source: DANE, Industrial Directory; IFI, Investment Department.
331

332 POMBO AND RAMÍREZ
Appendix 6C
Performance Indicators for IFI Firms: Definitions andMethodology
The Annual Manufacturing Survey of Colombia (Encuesta Anual Manu-facturera, or EAM) is in practice a census of medium and large enterprisesin manufacturing. The EAM has undergone three methodological changesaffecting the following time periods: 1970–91, 1992–93, and 1994 todate. The changes have affected the inclusion or exclusion of variableswithin chapters; the addition or suppression of new information acrosschapters; the modification of the format or variable classification criteria;and the rescaling of the sample cohorts.
Some specific examples are the changes of the payroll classification, theinclusion of temporary workers after 1987, the exclusion of direct exportsas a component of a firm’s sales, the elimination of the direct tax variablesafter 1991, the redefinition of large enterprise according to number of em-ployees, and the addition of new components for fixed investment after1992, among many others.
Despite the format modifications, the survey has kept the basic vari-ables and structure across time. The database cleanup process was a two-step procedure. First, we worked with the basic variables of the 1970–91survey. Second, all basic series were overlapped and grouped, keeping theoriginal definitions of the older survey.35 The manufacturing survey offersthe following five types of variables:
• Identification variables—location, specific standard industrial classi-fication, firm’s legal capital structure, and size classification.
• Labor variables—wages, benefits, permanent and temporary em-ployees, administrative employees, workers, technicians, and gender sta-tistics.
• Output-related variables—gross output, value added, intermediateconsumption components, industrial expenditures, and inventories of fi-nal products and raw materials.
• Finance-related variables—fixed asset investment, accounting depre-ciation, sales, marketing spending, paid royalties, and other general ex-penditure variables.
• Consumption, generation, and sales of electricity.
The survey recorded data for 133 variables from 1970 to 1991. Thesurvey recorded 380 variables during 1992 and 1993. Since 1994 thesurvey has worked with 200 variables. The 1992–93 period is problem-atic because the survey included information that was not comparablewith previous data. However, the core variables were recorded.

PRIVATIZATION IN COLOMBIA: A PLANT PERFORMANCE ANALYSIS 333
Table 6C.1 The Indicators for IFI Firms in the Sample
Variable Description
Fixed capital stockseries by type ofdepreciable assets
Cost per unit
Log(sales/employees)
Log(sales/capitalstock)
Value added/capital
Value added/labor
Value added/workers
Total factorproductivity (TFP)
Operatingincome/sales
kt � kt�1 (1 � �)�It, perpetual inventory method,
and K0 is the initial capital , where
g is the historic growth rate of the fixed assetsgross investment series; � is the economicdepreciation rate; IB0 is gross investment at theinitial date. Depreciation rates are taken fromPombo (1999b).
The ratio of cost of sales to net sales. Cost of salesis equal to the direct expenses involved in theproduction of a good, including raw materialsexpenditures plus compensation paid to blue-collar workers. Sales are equal to the totalvalue of products and services sold nationallyand internationally.
The log of the ratio of sales to the total numberof employees. Sales are equal to the total valueof products and services sold nationally andinternationally. Employees correspond to thetotal number of paid workers who dependdirectly on the company.
The log of the ratio of sales to capital stock.Sales are equal to the total value of productsand services sold nationally and internationally.Capital stock series follow the perpetualinventory method, defined above.
Partial capital productivity is the ratio of valueadded to capital stock. Capital stock series followthe perpetual inventory method, defined above.
Partial labor productivity is the ratio of valueadded to labor. Capital stock series follow theperpetual inventory method, defined above. Laboris the total number of permanent employees.
Partial labor productivity. Workers stand for thenumber of blue-collar workers by firm.
TFP decomposition following the methodology inJorgenson and Grilliches (1967), using atranslog technology.
Operating income is equal to sales minus operatingexpenses, the cost of sales, and depreciation.Sales are equal to the total value of products andservices sold nationally and internationally.
k0 �IB0
g � �
(Table continues on the following page.)

334 POMBO AND RAMÍREZ
Net income/sales
Operating income/capital stock
Gross margin rate
Lerner index
Capital intensity ratio 1
Capital intensity ratio 2Plant size
Permanentworkers/averagepermanent workers
Output scale indicator
Gross investment rate
Machinery andequipment investmentrate/output
Machinery andequipment investmentrate/total investment
Real wages per worker
Net income is equal to operating incomeminus interest expenses and net taxespaid. Sales are equal to the total value ofproducts and services sold nationally andinternationally.
The ratio of operating income to capitalstock. Operating income is equal to salesminus operating expenses, the cost ofsales, and depreciation. Capital stockseries follow perpetual inventory method.
The ratio of value added minus
wages over value added.
The ratio of firm’s market share over
demand elasticity.Ratio of capital over permanent
employment.Ratio of capital over blue-collar workers.Ratio of total workers of firm i in sector j
over plant average workers in industry j.Ratio of permanent blue-collar workers of
firm i in sector j over average permanentblue-collar workers in industry j.
Ratio of output of firm i in sector
j over average plant output in sector j.
Ratio of investment of firm i over
output in firm i.The ratio of new investment of firm i in
machinery and equipment to the totaloutput of firm i.
The ratio of new investment of firm i inmachinery and equipment to the totaloutput of investment of firm i.
Real average wages paid per worker byfirm. The consumer price index was usedas deflator to calculate real wages atconstant pesos. The monthly average
Ii
Yi
Yij
Yj
�i
�
VAi � Wi
VAi
Table 6C.1 (continued)
Variable Description

PRIVATIZATION IN COLOMBIA: A PLANT PERFORMANCE ANALYSIS 335
Industry-adjusted realwages per worker
Total wages/sales
Wage rate
Compensation rate
CR4 entropy index
Herfindal index
Imported rawmaterial/domesticraw materials
official exchange rate of 1995 is used toconvert series to constant prices in US$. Asimilar procedure is used for thecalculation of real wages per blue-collarand per white-collar workers.
Industry control group is the four-digitstandard industrial classification to which aspecific firm belongs. For each year and firmwe compute the industry-adjusted indicatorby taking the ratio of the value of theindicator for the IFI firm to its industrycontrol group. A similar procedure is usedfor blue-collar and white-collar workers.
The ratio of total wages paid by the firm tothe sales of the firm. Total wages is equalto the total wage bill paid to all workersin payroll. Sales are equal to the totalvalue of products and services soldnationally and internationally.
The ratio of total wages paid by the firm tothe firm’s value added. Total wages isequal to the total wage bill paid to allworkers in payroll. Value added is equalto the firm’s gross output minusintermediate consumption.
The ratio of total compensation paid by thefirm to the firm’s value added. Totalcompensation is equal to wages plus socialbenefits paid to workers in payroll. Valueadded is equal to the firm’s gross outputminus intermediate consumption.
The output of the four largest plants ofindustry j over industry j output.
Summation of market shares (s) of
firm i in industry j.A measure of quality in intermediate
consumption, where imported raw materialsstand for the raw materials used in aproduction process whose country of originis not Colombia. Domestic raw materials areraw materials produced in Colombia.
an
i�1s2
ij
Table 6C.1 (continued)
Variable Description
(Table continues on the following page.)

336 POMBO AND RAMÍREZ
Human capitalAdvertising rate
Licensing indicatorIntraindustry trade
coefficientGross output
Intermediateconsumption
Value added
Ratio of technicians over workers.Ratio of advertising expenditures over value
added.Ratio of paid royalties on value added.Grubel and Lloyd index of intraindustry trade
by industry.For the manufacturing industry, gross output is
equal to the total of product sales plus sales ofall self-produced electricity plus income forindustrial services plus sales of all nontrans-formed goods.
For manufacturing, intermediate consumption isthe combination of raw materials plusindustrial expenses plus purchases ofelectricity.
Gross output minus intermediate consumption.
Table 6C.1 (continued)
Variable Description
Appendix 6D
The Power Sector Indicators and Data Sets
The performance indicators for the power sector are based on the finan-cial statements. These indicators follow the definition and methodology ofthe privatization studies of Megginson, Nash, and van Randenborgh(1994) and La Porta and López-de-Silanes (1999). Most of the variablesare defined in appendix table 6C.1.
The cost per unit indicator is expressed in pesos per kilowatt at 1995prices. Output is in gigawatts.
The Data Sets
Currently, the power sector statistics in Colombia are split among thethe National Grid Company (Interconexión Eléctrica S.A, or ISA); theMining and Energy Planning Unit; the Electricity and Gas RegulatoryCommission; the National Planning Department; and the Superinten-dent of Domiciliary Public Services (SSPD). As a result, each source hasa different format and contents.
The information is sorted by plant, utilities, regional electricity mar-kets, and geographical regions, or at a countrywide aggregate level. Table6D.1 describes the contents of the collected data sets.
Note: IFI � Instituto de Fomento Industrial.

PRIVATIZATION IN COLOMBIA: A PLANT PERFORMANCE ANALYSIS 337
Table 6D.1 Colombia: Power Sector Statistics and Description ofthe Data Sets
Data sources Contents
ISA Reports Operative reports of the National (1995–99) Interconnected System
HydrologyGrid constraintsGenerationDemandAvailable effective capacity
The Electricity Spot Market ReportPool’s prices and contactsTotal traded amount (gigawatts)Pool’s marginal supply prices by type of generation
SIVICO The following data are available by utility 1997–99 level:Source: SSPD Financial statements
Income statement Balance sheet
Labor statisticsNumber of employees by sector’s activityNumber of employees by occupational category
Number of employees by type of generation
Market composition by type of userConsumptionInvoicingNumber of subscribersAverage tariffs by users
Results and performance control process indicatorsQuality service indicatorsSpending and indebtedness indicators
SIEE The Energy and Economic Information 1970–98 System (SIEE) is a data set covering the Source: Organización Latin American economies’ energy-related Latinoamericana de Energía statistics.
The SIEE sections arePricesDemand and supplyEnergy-related equipmentEnvironmental impact
(Table continues on the following page.)

Table 6D.1 (continued)
Data sources Contents
Economic � energy indicatorsWorldwide energy statistics
FEN The power sector historical financial data 1983–94 compiled by the Financiera ElectricaSource: FEN Nacional (FEN). The database offers a
summary by power company ofIncome statementsBalance sheetsOther variables: purchase � sales of bulk electricity; available capacity; power losses
SINSE The power sector national system is a 1970–94 comprehensive database. The data are Source: MME available by utility and regional market.
The SINSE chapters areEnergy balancesGeneration and electricity demandNumber and type of subscribersAverage tariffs by users
338 POMBO AND RAMÍREZ
In addition to the data sets, we made direct requests to ISA for themonthly indicators of the Mercado de Energia Mayorista, starting in July1995, and the Thermal Park Data Set. The crossing of information amongISA’s thermal park data set, SIVICO, and SINSE allowed us to collect theinput-output variables by thermal unit that are depicted in appendix table6D.2 To make direct inferences of labor input by plant after 1996, a sur-vey was carried out among the members of the Colombian GeneratorsAssociation. The collected information allowed for distinguishing bench-marks of capacity-to-labor ratios; under normal assumptions of Leontieftechnology of noninput substitution, that coefficient turns out a constantparameter. The data provided by the power utilities along with SIVICOallowed us to identify the number of employees by thermal plants for theperiod 1996–99, given the reported capacity per unit. The estimatedbenchmark labor-to-capacity ratios by occupational category for a base-technology thermal plant were 0.036597 (directors), 0.151852 (adminis-trative), and 0.527731 (operative).
For the 1988–94 period, the FEN books recorded some physical vari-ables per power utility, among them the permanent employment series.

Thus, the inference of labor series by the thermal units followed a constantdistributing capacity assumption, that is:
Thermal Unit Labor (L1) � (Max Theoretical Thermal Plant Unit Capac-ity in GWh/Utility Available Capacity in GWh) * Total Permanent UtilityEmployees
Other formulas were used to generate alternative labor series by thermalplants. One was based on power generation:
Thermal Unit Labor (L2) � (Thermal Plant Generation in GWh/UtilityAvailable Capacity in GWh) * Total Permanent Utility Employees
Then an adjusted L2 series was generated under the assumption:
; where: ;
Rationing Price: MgPhydro � MgPthermal � 1.8;Without Rationing: MgPhydro � MgPthermal � 0.6,
where MgP � marginal price, MW � megawatts of installed capacity.The above coefficients are observed parameters. L1 and L2 were used
as the labor input series in the estimation of plant efficiency scores.
x � avgMgPhydro
MgPthermala L
MWb
thermal� a L
MWb
hydro/ (1�x)
PRIVATIZATION IN COLOMBIA: A PLANT PERFORMANCE ANALYSIS 339
Table 6D.2 Thermal Plants: Input and Output Variables
Sample Variables
1988–1994 Generation (gigawatt hours)Gross capacity (megawatts)Net capacity (megawatts)Coal (tons)Fuel oil (gallons)Diesel oil (gallons)Gas (cubic feet)
1995–1999 Generation (gigawatt hours)Effective capacity (megawatts)Labor (number of employees)a
Heat rate
Note: Labor information is recorded by power utility and industry activity:generation, transmission, and distribution (SIVICO).
a. Since 1996.Source: SINSE, ISA, SIVICO.

Table 6E.1 DEA Efficiency Scores in Thermal Generation before and after the Regulatory Reform
Decision-making Startup Capacity Owner- Score Score Score1 Score1 Relative Relativeunit Plant name year megawatts ship before after before after effic. effic.1
1 Barranca1 1982 13 Public 0.7859 0.5932 0.7859 0.7939 � �2 Barranca2 1982 13 Public 0.7203 0.5932 0.7448 0.7702 � �3 Barranca3 1972 66 Public 0.8798 0.6404 0.8798 0.8211 � �4 Barranca4 1983 32 Public 0.6625 0.6118 0.6625 0.8110 � �5 Barranca5 1983 21 Public 0.7023 0.6176 0.7023 0.8217 � �6 Bquilla1 1980 58 Public 0.9211 . 0.9139 .7 Bquilla3 1980 66 Private 1.0000 0.6624 1.0000 0.7156 � �8 Bquilla4 1980 69 Private 0.9699 0.7439 0.9803 1.0000 � �9 Cartagena1 1980 66 Private 0.8677 0.6428 1.0000 0.7447 � �
10 Cartagena2 1980 54 Private 0.7932 0.6515 0.7437 0.8274 � �11 Cartagena3 1980 67 Private 0.8712 0.6815 0.8603 0.8245 � �12 Chinu4 1982 14 Public 0.4242 . 0.7097 .13 Cospique1 1960 4 Public 0.9086 . 1.0000 .14 Cospique2 1960 4 Public 0.7277 . 1.0000 .15 Cospique3 1967 8 Public 1.0000 . 0.9722 .16 Cospique4 1966 9 Public 1.0000 . 0.7791 .17 Cospique5 1965 12 Public 0.4487 . 0.8584 .18 Flores1 1993 152 Private 0.9881 1.0000 0.9881 1.0000 � �
Appendix 6E
340

19 Guajira1 1987 160 Public 1.0000 0.8563 1.0000 0.7743 � �20 Guajira2 1987 160 Public 1.0000 0.8374 1.0000 0.8915 � �21 Paipa 1 1963 31 Public 0.4048 0.4977 0.3208 0.8859 � �22 Paipa 2 1975 74 Public 0.7307 0.3794 0.4755 0.7891 � �23 Paipa3 1978 74 Public 0.6331 0.4154 0.3874 0.7735 � �24 Palenque 3-4 1972 15 Public 0.8780 0.4586 1.0000 0.8011 � �25 Palenque5 1985 21 Public 0.6706 . 0.6706 . . .26 Proeléctrica1 1993 46 Private 0.9993 0.9695 0.9993 0.8857 � �27 Proeléctrica2 1993 46 Private 1.0000 0.9695 1.0000 0.9654 � �28 Tasajero 1985 163 Private 1.0000 0.6755 1.0000 0.8241 � �29 Tibú1 1965 6 Public 0.1669 . 0.315730 Tibú2 1965 6 Public 0.1632 . 0.802631 Zipa2-3 1976 104 Mixed 0.4904 0.8888 0.4213 0.6721 � �32 ZIPA3 1976 66 Mixed . 0.2235 . 0.8021 . .33 Zipa4 1981 66 Mixed 0.4626 0.1879 0.4601 0.6797 � �34 Zipa5 1985 66 Mixed 0.2692 0.3213 0.3042 0.8655 � �35 Flores2 1996 100 Private . 0.9199 . 0.920536 Flores3 1998 152 Private . 1.0000 . 1.000037 Merilectrica 1998 157 Private . 0.7887 . 0.927338 TebsaB1 1998 768 Private . 1.0000 . 0.914139 Termocentro1 1997 99 Public . 0.9160 . 1.000040 Dorada1 1997 52 Public . 0.2554 . 0.801041 Sierra1 1998 150 Public . 0.1442 . 0.8564
(Table continues on the following page.)
341

42 Termovalle1 1998 214 Private . 0.8237 . 0.8858
Total decrease 19 12(plants)
Share capacity 35.3 24.6(percent)
. No data are available.Note: This table shows the results of the efficiency frontier measurement on 42 thermal plants that were active as marginal producers before
and after the 1995 regulatory reform. The first three columns depict the plant name, startup year, and plant capacity in megawatts. All thermalunits before the reform belonged to one of the five electric holdings in the country as described in text. The fourth column indicates the ownershipstatus by the year 2000, that is, whether the thermal unit belonged to a public, private, or a mixed-capital electric utility. The next four columnsdescribe the efficiency scores before and after the 1994 reform. The table presents two types of scores. The first one is the variable Score, whichuses megawatts of capacity as total capital input. The second one is the variable Score1, in which capacity is adjusted by its effective utilization,and this is the definition of capital input used in these estimations. The reason to make such an adjustment is that most thermal units are marginalproducers. In Colombia the base system is hydro. The efficiency measures assume constant return to scale assumption, that is, the value of totaloutput is equal to total input spending and therefore the sum of inputs weights is equal to 1.
Source: Authors’ estimations based on EMS 1.3 software written by Scheel (2000).
Table 6E.1 (continued)
Decision-making Startup Capacity Owner- Score Score Score1 Score1 Relative Relativeunit Plant name year megawatts ship before after before after effic. effic.1
342

PRIVATIZATION IN COLOMBIA: A PLANT PERFORMANCE ANALYSIS 343
Notes
The authors wish to give special thanks to the following people and institutions:Eduardo Granados (DANE), Francisco Ochoa (ACOLGEN), Adriana Calderon(IFI), Gerson Castaneda (SSPD), Alberto Jose Uribe (Banco de la República),Ferney Niño (Banco de la República), and Diana Espinoza (ECOPETROL). Theauthors are grateful for the comments of Florencio López-de-Silanes, AlbertoChong, and other IDB seminar participants; Claude Crampes and the electricityworkshop participants at the Institut d’Economie Industrialle, Toulouse; and LuisEduardo Fajardo at the Universidad del Rosario. Rodrigo Taborda provided su-perb research assistance. Financial support from the IDB’s Latin American Re-search Network is gratefully acknowledged.
1. The general objectives and the scope of the economic openness program arein the 1990–94 Development Plan (DNP 1991a). The main institutional reformsare embodied in the following laws and CONPES (National Council for Economicand Social Policy) documents: foreign control regime (Law 9/1991), foreign tradereform (Law 7/1991), financial reform (Law 45/1990), new statute of foreign in-vestment (CONPES document, January 22/1991), labor reform (Law 50/1990),and privatization of maritime ports (Law 1/1991). See DNP (1991b).
2. One example is the study by Spiller and Guasch (1998) on the regulatoryprocess in Latin America, in which they skip over the Colombian experience de-spite the country’s advances in public utilities regulation. Furthermore, in the col-lective studies of privatization in Latin America, such as those by Glade (1996),Baer and Conroy (1994), and Baer and Birch (1994), references to Colombia areusually limited, in contrast to other Latin American countries.
3. The CONPES documents are 2648 (DNP 1993); 2775 (DNP 1995); and2929 (DNP 1997c). Law 37 of 1993 deals with concessions contracts for telecom-munications; Law 142 of 1994, the residential public services reform; Law 143 of1994, the power sector reform; and Law 226 of 1995, the privatization transfers.
4. For details, see Alonso and others (2001) and DNP 1993, 1995, 1997b, and1997c.
5. The schedule for public divestiture of public and mixed-capital enterprisesand public financial institutions was laid out in CONPES documents 2378 (DNP1988) and 2648 (DNP 1993).
6. All dollar values are in U.S. dollars unless otherwise indicated.7. For details, see Megginson, Nash, and van Randenborgh (1994).8. It is important to highlight that the IFI made major transfers of assets to the
private sector before the privatization program of the 1990s. One example wasIcollantas, in which the IFI sold its equity shares in 1980 and 1985. In 1994 the IFIparticipated in a 20 percent share of the company’s capitalization of $60 million.
9. “Special legal procedures” were applied to companies with property sharesfrom two or more public institutions, companies with direct investments from for-eign government agencies, and companies with ongoing settlement processes withtheir lenders. For details, see DNP (1988).
10. For instance, by March 1993 ECOPETROL had equity shares in three do-mestic investment banks (Corficaldas, Corfinorte, Corfinanza), one power utility(ESSA), one fertilizer plant (FERTICOL), and one craft enterprise (Artesanias deColombia). For details, see DNP (1993).
11. For details, see ECOPETROL’s press release of June 6, 1997. According tothat bulletin there was tight competition among the winner (Gas Natural of Spain)and British Petroleum, Amoco, Empresas Públicas de Medellín, and France Gas.
12. These cases were TERPEL CENTRO and TERPEL SUR, which sold 60 per-cent and 38 percent of their shares, respectively.

344 POMBO AND RAMÍREZ
13. The national grid company Interconexión Eléctrica S.A. (ISA) was foundedin 1967. By that time, the sectoral development view was to consolidate ISA as thelargest nationwide power generator and transporter of bulk electricity followingthe vertically integrated natural monopoly model. For more details, see WorldBank (1991). A complete description of the regulatory reform in Colombia’s powersector is in Pombo (2001b) and ISA reports. Historically, Colombia’s power sectorhas been divided into five regional markets: Bogotá Power Company (EEB), the At-lantic Coast Regional Electric Corporation (CORELCA), Public Enterprises ofMedellín (EPM), Public Enterprises of Cali and the Cauca Valley Corporation(EMCALI and CVC), and the Colombian Power Institute (ICEL). Only three of thefive regional power distribution networks have been privatized, leaving 70 percentof the distribution network in the National Interconnected System in public own-ership. Hence, privatization and entry competition remain a pending and unfin-ished task for local distribution.
14. The power market in Colombia parallels the British pool of the early 1990s.For more details on electricity markets and the British experience, see Armstrong,Cowan, and Vickers (1994) and Newbery (2000). For Latin America, good reviewsare found in Spiller and Guasch (1998) and the Inter-American DevelopmentBank’s 2001 annual report.
15. Although the survey is conducted annually, dissemination of the informa-tion at the plant level is restricted to protect the sources’ identities. We were ableto access the plant level data thanks to a technical cooperation agreement betweenthe Universidad del Rosario in Bogotá and DANE. All the information wasprocessed at DANE’s headquarters.
16. See appendix table 6B.2 for a list of the companies in the date set and ap-pendix 6C for a description of Colombia’s Annual Manufacturing Survey.
17. Again we want to point out that although the use of nontraditional indica-tors is not that common within the privatization or financial economics literature,these indicators are widely used in industrial economics.
18. Ocampo (1994) presents a comprehensive analysis of the trade policy andindustrialization in Colombia for the 1967–91 period.
19. Firm i’s gross margin is equal to , where VA is thefirm’s value added and W denotes wages.
20. For details of the reforms of the 1990s, see Montenegro (1995). 21. See La Porta and López-de-Silanes (1999) for more details about the Mex-
ican privatization program. For more details on Chile’s privatization process, see,for example, Maloney (1994); Hachette, Lüders, and Tagle (1993); and the studyon Chile in this volume.
22. Partial productivities are expressed in U.S. dollars at 1995 prices. Thus, av-erage labor productivity per worker before privatization was $30,487, and averageproductivity per unit of capital stock was $6.02.
23. Garay’s (1998) study presents a demand-side growth decomposition exer-cise for Colombian manufacturing. The main result is that the contribution ofimport-substituting industrialization to manufacturing growth has not been posi-tive since the mid-1970s. For the case of Mexico, La Porta and López-de-Silanes(1999) found that the mean (median) ratio of investment to sales of privatized firmsis 3.58 (5.80) percentage points lower than the control group levels after privati-zation. In the study of Mexico, the adjusted indicators are differences rather thanratios, which is the methodology used in this study.
24. Unfortunately, we do not have detailed discrete information across IFIfirms regarding plant restructuring such as firms’ labor training programs, adjust-ments in plant automation, administrative adjustments, and reengineering inprocesses and products. What we do have, from some internal IFI documents andspecial publications sponsored by IFI (1987) and MDE (1995), is partial informa-tion regarding the technological history for some companies.
GM i � (VAi � Wi) /Wi

PRIVATIZATION IN COLOMBIA: A PLANT PERFORMANCE ANALYSIS 345
25. See Pombo (2001b) for more details. The point here is that there are twosources of power losses. One is the technical loss due to the power losses in transmis-sion necessary to maintain the system’s stability. The nontechnical loss is the differencebetween real consumption and invoicing. Cities such as Bogotá used to have powerstealing, illegal connections, and adulterated meters, among other irregularities.
26. See Pombo (2001b) for an analysis of the 1992 blackout. The official ver-sion of the blackout causes and policy measures is in the 1993 Ministry of Miningreport to the Congress.
27. Effective capacity refers to all plants generating at full capacity. Availablecapacity does not take into account units that are shut down for maintenance andthe fraction of power that is used to stabilize the electric system, such as the loadfactor and voltage.
28. See Pombo (2001b) for more details. 29. One kilowatt hour (kWh) � 3,412.1 Btus; 1 gigawatt hour � 0.86 thermal
calories; 1 megawatt of capacity � 1,000 kWh. The literature of DEA as well as itsapplications is extensive. Good introductions can be found in Coelli, Prasada Rao,and Battesse (1998) and Thanassoulis (2002).
30. See Pombo (2001a) for a specific study on intraindustry trade and technol-ogy applied to the case of Colombia.
31. This idea is similar to the competition behind contestability in which firmsapply the hit-and-run strategy in order to capture profits. However, in this casethere are significant sunk costs. For theoretical details, see Baumol (1982) andBaumol, Panzar, and Willig (1988).
32. For details, see Pombo (1999b). 33. Notice that the possible simultaneity bias that arises from running TFP
against value added growth is partially avoided here because value added growthrefers to the overall industry-specific group.
34. In general, the variables included in the Tobit regressions are robust. Resid-uals are homoskedastic according to the reported OLS tests. The residuals are notnormal, which is associated with the distribution Kurtosis. The distribution of theresiduals is symmetric.
35. The main problem with the methodological changes was the modificationin the basic plant identification (ID) variable from 1991 to 1992 and 1993. This istroublesome if one wants to track the information at plant level. We ran a cross-matching program throughout plant commercial names, recorded at the industrialdirectories, and generated an identification key for the ID variables in the 1991–92and 1992–93 surveys.
References
Alonso, Juan, Juan Benavides, Israel Fainboim, and Carlos Rodríguez. 2001. “Par-ticipación privada en proyectos de infraestructura y determinantes de los es-quemas contractuales: El caso colombiano.” Latin American Research NetworkWorking Paper R-412. Inter-American Development Bank, Research Depart-ment, Washington, D.C.
Armstrong Mark, Steven Cowan, and John Vickers. 1994. Regulatory Reform:Economic Analysis and British Experience. Cambridge, Mass.: MIT Press.
Baer, Werner, and Michelle Birch, eds. 1994. Privatization in Latin America. West-port, Conn.: Praeger.
Baer, Werner, and Michael Conroy. 1994. “Latin America: Privatization, PropertyRights, and Deregulation.” Quarterly Review of Economics and Finance Spe-cial Issue 34. December.

Barro, Robert, and Xavier Sala-i-Martin. 1995. Economic Growth. New York:McGraw Hill.
Baumol, William. 1982. “Contestable Markets: An Uprising in the Theory of In-dustry Structure.” American Economic Review 72(1): 1–15.
Baumol, William, John Panzar, and Robert D. Willig. 1988. Contestable Marketsand the Theory of Industrial Structure. Rev. ed. San Diego: Harcourt BraceJovanovich.
Bonilla, J., V. Cantillo, A. Escudero, C. González, and A. Herrera. 2000. “Los ser-vicios públicos en las ciudades puerto del Caribe colombiano.” Universidad delNorte, Barranquilla, Colombia.
Coelli, Tim, D. S. Prasada Rao, and George Battesse. 1998. An Introduction to Ef-ficiency and Productivity Analysis. London: Kluwer Academic Publishers.
Dager, Vanessa. 1999. “Proceso de venta de empresa del IFI.” Departamento In-geniería Industrial, Universidad de los Andes, Bogotá.
DANE (Departamento Administrativo Nacional de Estadística). Various years.“Annual Manufacturing Survey.” Bogotá.
DNP (Departamento Nacional de Planeación). 1988. Venta de las empresas del IFI.Documento CONPES 2378, Bogotá, Colombia: Departamento Nacional dePlaneación.
———. 1991a. La revolución pacífica: Plan Nacional de Desarrollo 1990–1994.Bogotá.
———. 1991b. Modernización y apertura de la economía, vol. 1. Bogotá.
———. 1993. Nuevos espacios para la inversión privada en Colombia. DocumentoCONPES 2648. Bogotá.
———. 1995. Participación del sector privado en infraestructura física. Docu-mento CONPES 2775. Bogotá.
———-1997a. Asignación de utilidades de la nación y saneamiento de las empre-sas industriales y comerciales del sector eléctrico. Documento CONPES 2923.Bogotá.
———. 1997b. Balance de los procesos de vinculación de capital privado: Las pri-vatizaciones. Documento CONPES 2929. Bogotá.
———. 1997c. La participación privada en infraestructura: Seguimiento. Docu-mento CONPES 2928. Bogotá.
Dixon, R., and P. Thirlwall. 1975. “A Model of Regional Growth Rate: Differ-ences on Kaldorian Lines.” Oxford Economic Papers 27 (2): 201–14.
Garay, Luis Jorge. 1998. “Colombia: estructura industrial e industrialización:1967–1996.” Departamento Nacional de Planeación, Colciencias, Bogotá.
Glade, William., with Rosanna Corona, eds. 1996. Bigger Economies, SmallerGovernments: Privatization in Latin America. Boulder, Colo.: Westview Pressin cooperation with Institute of the Americas.
Grubel, Herbert, and Peter Lloyd. 1975. Intraindustry Trade: The Theory andMeasurement of International Trade in Differentiated Goods. London:Macmillan.
Gutierrez, Luis, and Sanford Berg. 1999. “Telecommunications Liberalization andRegulatory Governance: Lessons from Latin America.” TelecommunicationsPolicy 24: 865–84.
Hachette, Dominique, Rolf Lüders, and Guillermo Tagle. 1993. “Five Cases of Pri-vatization in Chile.” In Rosanna Corona and Manuel Sánchez, eds., Privatization
346 POMBO AND RAMÍREZ

in Latin America. Washington, D.C.: Johns Hopkins University Press for theInter-American Development Bank.
IFI (Instituto de Fomento Industrial). 1987. Aporte al progreso de una nación.Bogotá.
ISA (Interconexión Eléctrica S.A.). 1998, 1999. Informes de gestión. On CD.Medellín.
Jorgenson, Dale W., and Zvi Grilliches. 1967. “The Explanation of ProductivityChange.” Review of Economic Studies 34(3): 249–80.
La Porta, Rafael, and Florencio López-de-Silanes. 1999. “The Benefits of Privati-zation: Evidence from Mexico.” Quarterly Journal of Economics 114:1193–242.
Maloney, William. 1994. “Privatization with Share Diffusion: Popular Capitalismin Chile.” In Werner Baer and Michelle Birch, eds., Privatization in Latin Amer-ica: New Roles for the Public and Private Sectors. Westport, Conn.: Praeger.
Mann, H. B., and D. R. Whitney. 1947. “On a Test of Whether One of Two Ran-dom Variables Is Stochastically Larger than the Other.” Annals of Mathemati-cal Statistics 18: 50–60.
MDE (Ministerio de Desarrollo Económico). 1995. Instituto de Fomento Indus-trial: 1940–1995. Bogotá.
Megginson, William, and Jeffry Netter. 2001. “From State to Market: A Survey ofEmpirical Studies on Privatization.” Journal of Economic Literature 39(2):321–89.
Megginson, William, Robert Nash, and Matthias van Randenborgh. 1994. “TheFinancial and Operating Performance of Newly Privatized Firms: An Interna-tional Analysis.” The Journal of Finance 49(2): 403–52.
MME (Ministerio de Minas y Energía). 1996, 1998. Memorias al Congreso Na-cional. Bogotá.
Montenegro, Armando. 1994. “El sector privado y la reforma del estado.” RevistaPlaneación y Desarrollo 24(2): 153–66.
———. 1995. “Economic Reforms in Colombia: Regulation and Deregulation1990–1994.” EDI Working Paper 95-04. World Bank, Economic DevelopmentInstitute, Washington, D.C.
Newbery, David. 2000. Privatization, Restructuring, and Regulation of NetworkUtilities. Cambridge, Mass.: MIT Press.
Ocampo, Jose Antonio. 1994. “Trade Policy and Industrialization in Colombia,1967–1991.” In G. Helleiner, ed., Trade Policy and Industrialization in Turbu-lent Times. London: Routledge.
Pollit, Michael. 1995. Ownership and Performance in Electric Utilities. Oxford,U.K.: Oxford University Press.
Pombo, Carlos. 1999a. “Economías de escala, markups, y determinantes del cam-bio técnico en la industria en Colombia.” Coyuntura Económica 29(4): 107–32.
———. 1999b “Productividad industrial en Colombia: una aplicación de númerosíndices,” Revista de Economía del Rosario 2(1): 107–39.
———. 2001a. “Intraindustry Trade and Innovation: An Empirical Study of theColombian Manufacturing Industry.” International Review of Applied Eco-nomics 15(1): 77–106.
———. 2001b. “Regulatory Reform in Colombia’s Electric Utilities.” QuarterlyReview of Economics and Finance 41(5): 683–711.
PRIVATIZATION IN COLOMBIA: A PLANT PERFORMANCE ANALYSIS 347

Romer, Paul. 1990. “Endogenous Technical Change.” Journal of Political Econ-omy 98: 71–102.
Scheel, Holger. 2000. “EMS: Efficiency Measurement System User’s Manual.”Available at http://www.wiso.uni-dortmund.de/lsfg/or/scheel/ems/.
Spiller, Pablo, and José Guasch. 1998. “Managing the Regulatory Process: Design,Concepts, Issues and the Latin American and the Caribbean Story.” WorldBank, Washington, D.C.
Sprent, Peter, and Nigel Smeeton. 2001. Applied Non-Parametric Statistical Meth-ods, 3d ed. New York: Chapman and Hall.
Thanassoulis, Emmanuel. 2002. Introduction to the Theory on Application ofData Envelope Analysis. London: Kluwer Academic Publishers.
World Bank. 1991. “Colombia: The Power Sector and the World Bank1970–1987.” In Comision Nacional de Energía, Evaluación del Sector EléctricoColombiano. Bogotá: Ministerio de Minas.
Zuleta, L. H., L. Jaramillo, E. Ballen, and A. M. Gomez. 1993. “Privatization inColombia: Experiences and Prospects.” In Manuel Sanchez and RosannaCorona, eds., Privatization in Latin America. Washington, D.C.: Johns Hop-kins University Press for the Inter-American Development Bank.
348 POMBO AND RAMÍREZ

7
Privatization in MexicoAlberto Chong and Florencio López-de-Silanes
WHAT SHOULD PRIVATIZATION ATTEMPT TO achieve? Why does it work? Howdoes it affect firm performance? What are the determinants of privatizationprices? What are the effects in terms of fiscal policy? How should a privati-zation program be structured? What role should deregulation or reregula-tion have in a privatization policy, and why? In this chapter, we provideempirical answers to these questions through a micro- and macroeconomicanalysis of the Mexican privatization program. The Mexican program, car-ried out since the mid-1980s, has been one of the largest in the world in itsscale and scope. It implied the reversal of 40 years of state interventionismand profoundly transformed the economic landscape of Mexico.
Recently, politicians and the media have harshly questioned the effectof privatization, claiming that benefits are greatly exaggerated and thatprivatization invariably leads to welfare losses for society. This chapter’skey finding is that privatization leads to dramatic improvements in firmperformance and that those improvements result from efficiency gains, notfrom transfers from workers or exploitation of consumers. We find thatthe operating-income-to-sales ratio for the median firm increased 24 per-centage points, and by assuming that quality is unchanged and that firedworkers have zero productivity, we estimate that price increases and trans-fers from workers can account for at most 5 percent and 31 percent of theincrease in profitability, respectively. Similar improvements are observedfor operating efficiency and output. Furthermore, we calculate industry-adjusted indicators to ensure that the results obtained are directly attrib-utable to the transfer of control to the private sector and not a reflectionof general macroeconomic trends or a sector-specific phenomenon.
Even when this initial objection is overcome, many argue that privatiza-tion should be opposed because benefits accrue to the new owners only,while consumers and the poor are left behind. It is claimed that the sale ofstate-owned enterprises (SOEs) amounts to a privatization of benefits while
349

the government is left to foot the bill if things go wrong. Contrary to thisbelief, we find that there are significant social benefits to privatization, par-ticularly in greater access to goods and services. It is precisely the poor whoare usually left out of the telephone, electricity, and water networks whenthey are public and therefore it is the poor who have the most to gain fromincreased coverage. Moreover, although it is true that the government hassometimes footed the bill for botched privatizations, an often-overlookedaspect is its beneficial fiscal effect. Lower subsidies, increased taxes, and ofcourse, the direct revenues from the sale provided Mexico with the rev-enues needed to dramatically reduce its stock of external debt and increasespending on education and poverty alleviation programs.
Among those who accept that privatization is a positive force, there isa widespread belief that SOEs need extensive restructuring and nurturingbefore they are fit for sale. With this in mind, governments often pour vastsums of money and spend valuable time implementing investment andefficiency plans which are not valued by bidders. In the case of Mexico,the presence of an efficiency restructuring program or an investmentplan reduced the net privatization price received by the government by56 percent and 95 percent, respectively. Furthermore, each additionalmonth taken to complete the privatization decreased prices by 2.2 percent.This evidence clearly suggests that governments should think twice beforeengaging in these types of restructuring programs and that often the bestsolution is simply to concentrate on the sale of SOEs and leave therestructuring to the market. If politicians wish to help displaced workers,there is sure to be a more cost-effective way to do it than by trying to fixpublic firms before they are sold. An additional lesson that can be drawnfrom the Mexican experience is that simplicity and transparency are para-mount to a successful program. Special requirements such as cash-onlysales reduced net prices by 30 percent, while allowing foreign participationboosted prices by 32 percent, and the presence of an additional bidder inthe final round increased them by 17 percent.
Finally, this chapter attempts to make sense of the cases of failed pri-vatization by analyzing the importance of a set of complementary policiessuch as the design of the privatization contracts, deregulation and reregu-lation of privatized firms, and the corporate governance framework. Wefind that the main instances of botched privatization can be traced back tomistakes in one or more of these complementary policies. Although moreattention is clearly needed in these areas, the good news is that the failuresseen so far seem to have a readily available solution.
The Mexican SOEs and Privatization
To understand the opportunities presented by the Mexican privatizationprogram, it is helpful to analyze first the role of the government in the
350 CHONG AND LÓPEZ-DE-SILANES

economy and the motives behind this role. The 1917 Mexican constitutionestablished the general jurisdictional framework under which the role ofthe state in the economy was defined. From this foundation, the Mexicangovernment launched a gradual takeover of the economy, and by 1982,the year in which banks were nationalized, the government controlledmore than 1,100 firms in all sectors of the economy, including havingmonopolistic control of strategic areas such as energy and infrastructure.Since then, government ownership of enterprises has declined precipi-tously and is now significant only in some entrenched sectors, mostnotably oil and electricity, that have successfully used their political cloutto resist divestiture. This section analyzes the rise of the SOE sector andthe subsequent privatization program in more detail.
The Growth of the SOE Sector
Table 7.1 shows the main focus of state expansion for different periodsduring 1917–2003, as well as the number of SOEs at the end of each
PRIVATIZATION IN MEXICO 351
Table 7.1 State-Owned Enterprises in Mexico, 1917–2003
Number of state-owned enterprises
Main focus of state activity Period (end of period)
Public administration, creation of 1917–40 36infrastructure, administration of natural resources, and provision of basic services
Import-substitution-oriented investments 1941–54 144(capital-intensive and long-maturity areas; industry input suppliers); transportation and communications; and social security institutions
Stable development, unplanned expansion: 1955–70 272regional development, production expansion, and creation of employment
Planned expansion: oil bonanza, government 1971–75 504as an industrial investment engine
Planned expansion: bank nationalization, 1976–82 1,155government investment in strategic areas, and takeover of firms in distress
Main program of liberalization of the 1983–93 258economy and divestiture of the state-owned sector
Consolidation of the privatization program: 1994–2003 210public utilities and pension system
Source: Aspe 1993; Presidencia de la República, 1982–2003.

period. During the 1920s government operations mostly reflectedattempts to regulate the economy; the central bank (Banco de Mexico) wasestablished to control monetary policy, and investments in infrastructurewere used to stimulate the economy.1 The Great Depression in theUnited States and the worldwide economic crises that accompanied it ledthe Mexican government to take direct responsibility for the provisionof many basic services. In 1934 the “Cardenista” era began with the im-plementation of a six-year plan that emphasized the role of agriculturaldevelopment and the provision of basic services. Predictably, thisapproach quickly spawned an array of funding institutions that wouldoutlive their initial mandate and become engines for state expansion.2
Pemex, the national oil company and probably the most prominent SOEin Mexican history, was created during this period and remains in statehands today.
By 1940 the government owned 36 enterprises, and the stage was setfor a massive expansion of the state-owned sector. The period from 1940to the mid-1950s witnessed the state’s implementation of an import-substitution model and the undertaking of capital-intensive and long-maturity investments such as steel mills, coal mines, paper mills, and oilrefineries. The government also took over the social security system dur-ing this period and created two institutions to run it: the National Institutefor Social Security (to manage private sector pensions) and the SocialSecurity of Government Employees. Until 1947 each company was almostcompletely responsible for its own operations, and the whole SOE sectorwas managed in a decentralized fashion. In that year, however, as the sizeof government operations increased, centralized control was establishedunder two ministries.3
The late 1950s and 1960s were known as a period of stable develop-ment, during which the economy grew swiftly and the governmentexpanded its influence in a seemingly random way. The number of SOEsmore than doubled, and public ownership of firms expanded to new sec-tors including sugar cane mills and the manufacture of textiles, tobacco,and food processing. The state’s major investments were directed towardregional development with the aim of increasing employment andproduction across the nation. Supervision became more complex as thenumber of SOEs increased, and in 1970 control of these firms wascentralized under the control of three ministries: the Ministry of Finance(SHCP), the Secretariat of the Presidency (SP), and the Secretariat ofNational Patrimony (SENEPAL).
Starting in the first half of the 1970s, a fall in private investment andstricter restrictions imposed by the government consolidated the role ofthe public sector as the main engine of investment. The government bor-rowed heavily and used income from high oil prices to expand the num-ber of SOEs under its control. During the 1970s and early 1980s, thegovernment followed a haphazard strategy of taking over companies that
352 CHONG AND LÓPEZ-DE-SILANES

fell into financial distress or were of particular interest to the politiciansin charge. By 1982 the number of SOEs reached 1,155, and their weightin the economy was unprecedented: they accounted for 4.4 percent of thecountry’s labor force and 30 percent of fixed capital formation, and theyreceived subsidies equivalent to almost 13 percent of gross domesticproduct (GDP).4
The Privatization Program
The Mexican privatization program was one of the world’s largest, interms of both the number of companies privatized and their relative size.Between 1982 and 2003 the number of SOEs dropped from 1,155 to 210.Table 7.2 shows the evolution of the SOE sector from 1982 to 2003, whiletable 7.3 shows the number of privatized firms and the number of privati-zation contracts per year for the same period.5 The scope of the programentailed the privatization of close to 440 companies in 49 four-digitStandard Industrial Classification (SIC) codes.
PRIVATIZATION IN MEXICO 353
Table 7.2 State-Owned Enterprises, 1982–2003
State-owned enterprises 1982–88 1989–93 1994–2003
Total at the beginning of period 1,155 666 258Creation 59 39 108Liquidations/shutdowns 294 193 58Mergers 72 17 16Transfers 25 11 26Privatizations 157 226 56In processa 37
Total at the end of the period 666 258 210
Note: To obtain the total number of state-owned enterprises (SOEs) at the end ofeach period, we add the number of created SOEs to the number at the beginning of theperiod and subtract the liquidations, shutdowns, mergers, transfers, and privatizations.Total at the beginning of period is the number of legal entities forming part of theparastatal sector at the start of each period; creation is the number of created companiesby the state in the specified period; liquidations/shutdowns is the number of companiesshut down by the state in the specified period; mergers is the number of SOEs thatmerged with other SOEs in the specified period; transfers is the number of SOEs thatwere transferred to other levels of government, including firms that ceased to be treatedas state-owned by legal mandate (Ley Federal de Entidades Paraestatales); privatizationsis the number of SOEs sold in the specified period; in process is the number of SOEspending privatization in the specified period; this number reflects the number ofongoing privatizations, liquidations, shutdowns, mergers, or transfers in 2003.
a. The most important ongoing processes are Banrural System (13 institutions), FIDELIQ, and Nacional Hotelera de Baja California S.A. de C.V.
Source: Presidencia de la República 1982–2003.
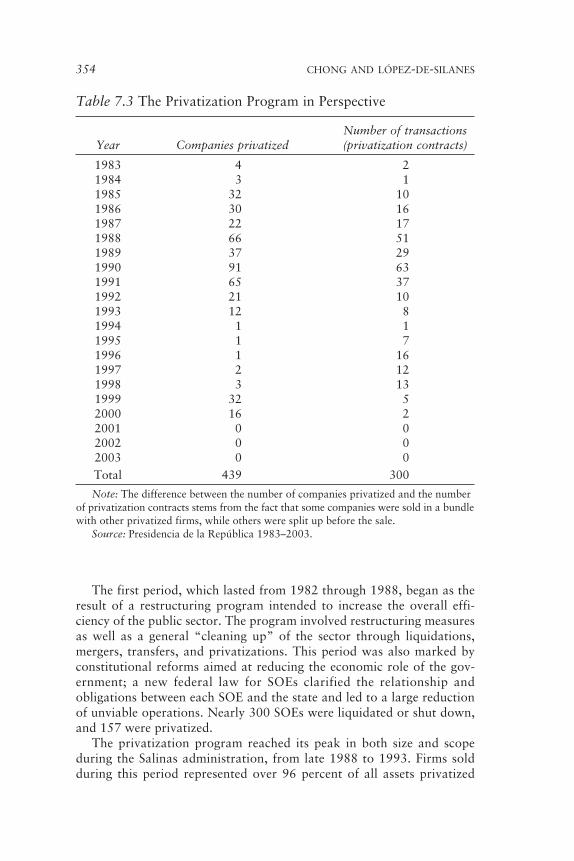
The first period, which lasted from 1982 through 1988, began as theresult of a restructuring program intended to increase the overall effi-ciency of the public sector. The program involved restructuring measuresas well as a general “cleaning up” of the sector through liquidations,mergers, transfers, and privatizations. This period was also marked byconstitutional reforms aimed at reducing the economic role of the gov-ernment; a new federal law for SOEs clarified the relationship andobligations between each SOE and the state and led to a large reductionof unviable operations. Nearly 300 SOEs were liquidated or shut down,and 157 were privatized.
The privatization program reached its peak in both size and scopeduring the Salinas administration, from late 1988 to 1993. Firms soldduring this period represented over 96 percent of all assets privatized
354 CHONG AND LÓPEZ-DE-SILANES
Table 7.3 The Privatization Program in Perspective
Number of transactions Year Companies privatized (privatization contracts)
1983 4 21984 3 11985 32 101986 30 161987 22 171988 66 511989 37 291990 91 631991 65 371992 21 101993 12 81994 1 11995 1 71996 1 161997 2 121998 3 131999 32 52000 16 22001 0 02002 0 02003 0 0Total 439 300
Note: The difference between the number of companies privatized and the numberof privatization contracts stems from the fact that some companies were sold in a bundlewith other privatized firms, while others were split up before the sale.
Source: Presidencia de la República 1983–2003.

and employed 311,000 workers, or 35 percent of the total work force ofSOEs (López-de-Silanes 1994). To manage this huge task in such a shorttime, the president created a special unit within the Ministry of Finance,the Office of Privatization of State-Owned Enterprises (OP), to coordinatea decentralized process that encouraged the involvement of commercialbanks, foreign businesses, and financial valuators.
The third period, from 1994 to 2003, was characterized by the consol-idation of the previous efforts of divestiture of the parastatal sector. Theadministration in charge undertook the privatization of strategic areas ofthe economy and public utilities such as telecommunications (satellites),ports, airports, toll roads, railroads, and the distribution of natural gas. Amajor reform to the private sector pension system took place in 1995. By2003 the privatization program had lost its appeal, and in fact the gov-ernment marginally reversed the process by expropriating some previouslyprivatized companies.6 All in all, net privatizations of SOEs were negativein 2003.
A central objective of divestiture in Mexico was to transfer control ofSOEs to privately owned groups that could provide the necessary align-ment in incentives for better financial and investment decisions of thefirms. As a general rule, the government sold 100 percent of its ownershipin each SOE privatized, retaining a minority share in only eight cases.7 Sixof these companies were instances where the companies were already trad-ing in the stock market, and the intention was to sell secondary packagesthrough the stock exchange.8
The Benefits of Privatization
Critics often argue that the benefits of privatization come at significantcost to society through higher prices, lower wages, and reduced income forthe government (Campbell-White and Bhatia 1998; Bayliss 2002). In thissection we analyze the validity of these claims for the case of Mexicoand find evidence that points to the contrary. We study unadjusted andindustry-adjusted performance ratios to quantify the effects of privatiza-tion on firms and to ensure that these are not explained by macroeconomicfactors. We then examine the importance of price increases, marketpower, and worker exploitation as potential determinants of the observedincrease in profitability. Finally, we analyze the effect of privatization onthe quality and accessibility of services.
Raw Data
We rely on seven broad indicators to measure performance: profitability,operating efficiency, employment and wages, capital investment, out-put, taxes, and prices. For each firm, we measure the change in any given
PRIVATIZATION IN MEXICO 355

indicator by comparing its value in 1993 to the average value during thefour years preceding privatization.9
The results, shown in table 7.4, reveal several interesting phenomena.Profitability increased significantly after privatization according to allindicators: the mean (median) change in profitability ranges from a lowof 24.1 (12.1) percentage points for operating income to sales to a high
356 CHONG AND LÓPEZ-DE-SILANES
Table 7.4 Changes in Performance for the Sample of Privatized Firms
Variable Number Mean change Median change
ProfitabilityOperating income/sales 170 0.2411*** 0.1208***Operating income/PPE 170 0.3450*** 0.1347***Net income/sales 170 0.3996*** 0.1447***Net income/PPE 170 0.2713*** 0.1567***Operating efficiencyCost per unit 170 �0.2149*** �0.1676***Log (sales/PPE) 170 0.6464*** 0.2385***Log (sales/employees) 169 1.0530*** 0.9909***LaborLog (employees) 169 �64.89*** �56.75***Log (blue-collar workers) 168 �53.44*** �60.87***Log (white-collar workers) 169 �53.52*** �46.34***Assets and investmentInvestment/sales 170 0.0150* 0.0103***Investment/PPE 170 0.0474*** 0.0216***OutputLog (sales) 170 0.5428*** 0.6816***Net taxesNet taxes/sales 170 0.1301*** 0.0763***PricesIndex of real prices (Paasche) 83 1.31 1.27
* Significant at the 10 percent level.** Significant at the 5 percent level.*** Significant at the 1 percent level.Note: PPE � property, plant, and equipment. This table presents raw results for a
subsample of 170 privatized firms between 1983 and 1992. The table presents, foreach empirical proxy, the number of usable observations, the mean change, and themedian change before and after privatization. Before privatization refers to the aver-age value for the four years before privatization, while after privatization refers to thevalue as of 1993. We report t-statistics and Z-statistics (Wilcoxon rank sum) as ourtest for significance for the change in mean and median values, respectively. All variablesdefinitions can be found in the appendix.
Source: La Porta and López-de-Silanes (1999).

of 40.0 (14.5) percentage points for net income to sales. All t-statisticsand Z-statistics are significant at the 1 percent level.
This increase in profitability seems to stem from significant gains inefficiency. The mean (median) cost per unit decreased 21.5 (16.8) per-centage points, while the mean (median) ratio of sales to physical assets(property, plant, and equipment, or PPE) increased 64.6 (23.9) percent.Regarding the efficiency of employees, both mean and median sales peremployee double. Once again, all changes are significant at the 1 percentlevel.
The higher profitability and especially the higher levels of sales peremployees can be partially explained by reduced employment levels, as themean (median) numbers of employees plummet by 64.9 (56.8) percent. Thisreduction is shared more or less equally between blue- and white-collarworkers: the mean (median) number of white-collar workers falls by 53.5(46.3) percent, while the mean (median) number of blue-collar workers fallsby 53.4 (60.9) percent.10
The data indicate that investment increases only slightly and thereforecannot be responsible for the vast increase in profitability and operatingefficiency documented above. The mean (median) investment-to-salesratio increased 1.5 (1.0) percentage points and the investment-to-PPEratio increased by a mean (median) of 4.7 (2.2) percentage points.
One of the most surprising findings is that privatized firms increasedtheir sales substantially despite a reduced labor force and only marginalincrements in their capital stock. The mean (median) real growth in salesis 54.3 (68.2) percent and is statistically significant at the 1 percent level.11
Once we consider that there is no statistically significant increase in prod-uct prices of privatized firms, the increase in production suggests thatconsumer surplus should also have increased significantly.
To assess the social impact of privatization, we must also account forthe taxes paid by newly privatized firms and the prices paid by consumers.The ratio of net taxes to sales increased by a mean (median) of 13.0 (7.6)percent, a significant increase when we consider that sales increased sub-stantially. The magnitude of this change is more evident when we considerthat the average firm received a small subsidy before privatization but paidapproximately $8.55 million in taxes in 1993.
Contrary to predictions, we find that the prices of the products of themean (median) firm increased only 1.3 (1.3) percent in real terms. Oneway to gauge the contribution of price hikes to the observed change inprofitability is to compare the observed percentage-point increase in theratio of operating income to sales to that which would take place if pri-vatized firms had increased output but left prices unchanged in realterms.12
Our results suggest that price increases account for 1.24 (0.9) per-centage points of the ratio of operating income to sales. Accordingly,price increases explain about 5.1 percent of the observed change in mean
PRIVATIZATION IN MEXICO 357
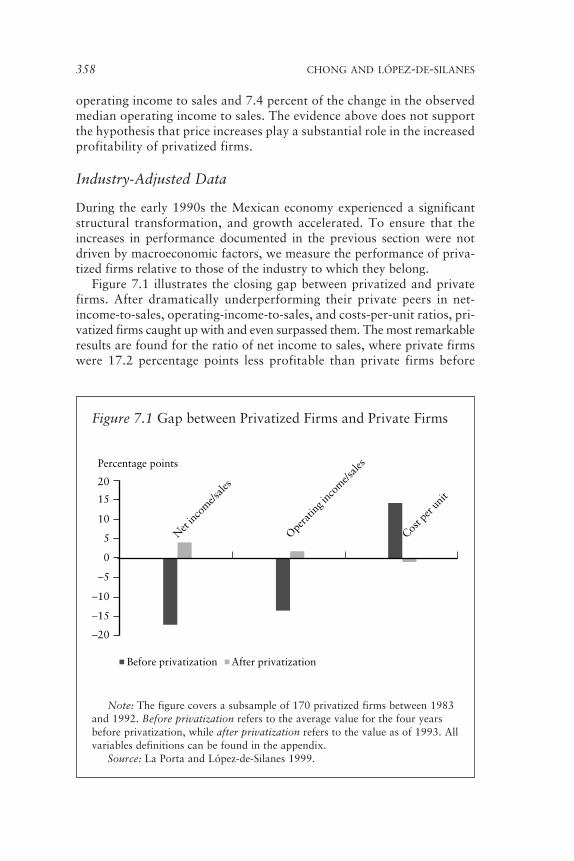
operating income to sales and 7.4 percent of the change in the observedmedian operating income to sales. The evidence above does not supportthe hypothesis that price increases play a substantial role in the increasedprofitability of privatized firms.
Industry-Adjusted Data
During the early 1990s the Mexican economy experienced a significantstructural transformation, and growth accelerated. To ensure that theincreases in performance documented in the previous section were notdriven by macroeconomic factors, we measure the performance of priva-tized firms relative to those of the industry to which they belong.
Figure 7.1 illustrates the closing gap between privatized and privatefirms. After dramatically underperforming their private peers in net-income-to-sales, operating-income-to-sales, and costs-per-unit ratios, pri-vatized firms caught up with and even surpassed them. The most remarkableresults are found for the ratio of net income to sales, where private firmswere 17.2 percentage points less profitable than private firms before
358 CHONG AND LÓPEZ-DE-SILANES
Figure 7.1 Gap between Privatized Firms and Private Firms
Note: The figure covers a subsample of 170 privatized firms between 1983and 1992. Before privatization refers to the average value for the four yearsbefore privatization, while after privatization refers to the value as of 1993. Allvariables definitions can be found in the appendix.
Source: La Porta and López-de-Silanes 1999.
−20
−15
−10
−5
0
5
10
15
After privatization
20
Net
inco
me/s
ales
Ope
ratin
g inc
ome/s
ales
Cost p
er un
it
Percentage points
Before privatization

privatization and 4 points more profitable afterward. Costs per unit showa similar converging trend, albeit from a different starting point. Beforeprivatization SOEs had median costs per unit 14.2 percentage pointshigher than their private competitors. After privatization they closed thisgap completely and even experienced costs per unit 1 percentage pointbelow their control group.
Table 7.5 shows that controlling for industry factors explains a non-trivial fraction of the employment cuts. Relative to industry benchmarks,mean (median) employment in privatized firms fell by roughly 35.4(34.4) percent. Growth in sales remains strong relative to industry as themean (median) industry-adjusted growth in sales is 43.2 (48.9) percent.Macroeconomic factors can therefore account for only about 21.4 (28.2)percent of the mean (median) growth in sales while firm restructuringaccounts for the rest.13
Although some of the improvements in performance are attributable tomacroeconomic factors, the bulk of the observed increase in performanceresults from privatization. The next step is to address a number of issuesrelating to the robustness of our results. In particular, we explore thehypothesis that the increased profitability of privatized firms comes fromexploitation of consumers through the use of market power and ofworkers through wage cuts.
Market Power
One of the main criticisms of privatization is that the increase in prof-itability is attributable to transfers from consumers extracted throughmarket power. To test this hypothesis, we compare the profitability ofprivatized firms in competitive and noncompetitive industries. If newlyprivatized firms use market power to extract rents, the social view of pri-vatization predicts that noncompetitive firms would experience largerincreases in profitability than would competitive firms, as well as lowergrowth in output, employment, and investment. In table 7.6 we classifyfirms as operating in competitive or noncompetitive industries based ontwo objective criteria.14 The table shows, for each ratio, the medianchange for competitive and noncompetitive firms following privatizationas well as the difference between these changes.
Changes in the ratios of operating income to sales and operating in-come to PPE are higher in competitive industries than in noncompetitiveones. In contrast, both net-income-to-sales and net-income-to-PPE ratiosincrease more in the noncompetitive sector than in the competitive one.With one exception (net income to sales in the classification based onthe number of firms), all differences between the competitive andnoncompetitive sectors are statistically insignificant.
By construction, three factors can account for the conflicting behaviorof operating income and net income: taxes, extraordinary items, and
PRIVATIZATION IN MEXICO 359

interest expense. The increase in taxes paid is larger for noncompetitivefirms than for competitive firms and therefore its explanatory power isdiminished. Changes in leverage provide a more promising explanation.We conjecture that firms in oligopolistic and monopolistic sectors,
360 CHONG AND LÓPEZ-DE-SILANES
Table 7.5 Industry-Adjusted Changes in Performance for theSample of Privatized Firms
Variable Number Mean change Median change
ProfitabilityOperating income/sales 168 0.3264*** 0.1531***Operating income/PPE 168 2.4274*** 0.1492***Net income/sales 168 0.4144*** 0.2121***Net income/PPE 168 0.2524*** 0.1736***Operating efficiencyCost per unit 168 �0.1848*** �0.1528***Log (sales/PPE) 168 0.4684*** 0.2014**Log (sales/employees) 168 0.9157*** 0.8834***LaborLog (employees) 169 �35.35*** �34.37***Log (blue-collar workers) 168 �36.78*** �32.61***Log (white-collar workers) 168 �32.21*** �31.59***Assets and investmentInvestment/sales 168 �0.0474*** �0.0495***Investment/PPE 168 �0.0328*** �0.0503***OutputLog (sales) 170 0.4324*** 0.4891***Net taxesNet taxes/sales 168 0.1609*** 0.0757***
* Significant at the 10 percent level.** Significant at the 5 percent level.*** Significant at the 1 percent level.Note: PPE � property, plant, and equipment. This table presents industry-adjusted
results for a subsample of 170 privatized firms between 1983 and 1992. The tablepresents, for each empirical proxy, the number of usable observations, the meanchange, and the median change before and after privatization. Before privatizationrefers to the average value for the four years before privatization, while after privatiza-tion refers to the value as of 1993. We constructed the industry control groups usingall private firms trading in the Mexican Stock Market (three-digit SIC code level). Foreach privatized firm and for each year, we compute industry-adjusted indicators bytaking the difference between the value of the indicator for the firm and its industrycontrol group. We use economywide aggregates, if available, for those firms for whichwe cannot find a matched industry sample. We report t-statistics and Z-statistics(Wilcoxon rank sum) as our test for significance for the change in mean and medianvalues, respectively. All variables definitions can be found in the appendix.
Source: La Porta and López-de-Silanes 1999.

361
Table 7.6 Median Performance Changes in Privatized Firms in Competitive versus Noncompetitive Industries
Sorted by number of firms Sorted by market share
Non- Difference Non- DifferenceVariable N Competitive N competitive in medians N Competitive N competitive in medians
ProfitabilityOperating income/ 124 0.1365 42 0.1334 0.0031 104 0.1799 62 0.0712 0.1087
salesOperating income/ 124 0.1714 42 0.1698 0.0016 103 0.1832 62 0.1222 0.0610
PPENet income/sales 122 0.1838 41 0.4260 �0.2422** 101 0.2263 62 0.2524 �0.0261Net income/PPE 122 0.2102 41 0.2781 �0.0679 101 0.2015 62 0.2716 �0.0701Operating efficiencyCost per unit 124 �0.1255 42 �0.2362 0.1107*** 104 0.1415 62 0.1907 �0.0492Log (sales/ 126 1.0353 43 0.7875 0.2478 107 1.0877 62 0.7474 0.3403**
employees)Log (sales/PPE) 124 0.5882 42 0.3313 0.2569 104 0.6429 62 0.2859 0.3570Operating income/ 125 19.7240 43 20.9320 �1.2080 106 21.6320 62 14.9110 6.7210
employeesLaborLog (total 126 �0.4339 43 �0.3592 �0.0747 107 �0.4338 62 �0.3645 �0.0693
employment)Log (blue-collar 126 �0.4365 43 �0.2473 �0.1892 107 �0.4495 62 �0.2518 �0.1977
workers)
(Table continues on the following page.)

362
Log (white-collar 126 �0.4264 43 �0.3342 �0.0922 107 �0.3327 62 �0.4443 0.1116workers)
Assets and investmentInvestment/sales 123 0.0059 42 0.0098 �0.0039 104 0.0048 62 0.0096 �0.0048Investment/PPE 123 0.0144 42 0.0180 �0.0036 104 0.0144 62 0.0191 �0.0047OutputLog (sales) 124 0.6479 42 0.3752 0.2727 105 0.6479 61 0.4419 0.2060PricesIndex of real prices 66 4.60 17 �3.64 8.24 53 9.29 30 �2.82 12.1148*
(Paasche)Net taxesNet taxes/sales 124 0.0717 41 0.0897 �0.0180 104 0.0675 61 0.0815 �0.0140
* Significant at the 10 percent level.** Significant at the 5 percent level.*** Significant at the 1 percent level.Note: N � number of observations and PPE � property, plant, and equipment. This table presents median performance results for a subsample
of 170 privatized firms between 1983 and 1992. In the first measure, firms are considered competitive if they are in an industry with more than 10firms and as noncompetitive otherwise; in the second measure, firms are considered competitive if they have less than 10 percent of market shareand as noncompetitive otherwise. For each group of firms, the table presents median change in each indicator following privatization and their dif-ference. We report Z-statistics (Wilcoxon rank sum) as our test for significance for the change in median values between competitive and noncom-petitive firms. All definitions of the variables can be found in the appendix.
Source: La Porta and López-de-Silanes 1999.
Table 7.6 (continued)
Sorted by number of firms Sorted by market share
Non- Difference Non- DifferenceVariable N Competitive N competitive in medians N Competitive N competitive in medians

perhaps because of their greater access to government-backed capitalbefore privatization, exhibit greater reductions in leverage after privati-zation than do firms in competitive sectors. Finally, it is also possible thatthe net income of SOEs was unduly depressed by restructuring changesbefore privatization. The bottom line is that operating income, in contrastto net income, is unaffected by changes in leverage and is thus a bettergauge for the impact of market power on profits. In any event, differencesin profitability changes are not statistically significant.
We also analyze the behavior of investment, employment, and out-put and find no statistically significant evidence to suggest that marketpower plays a significant role in explaining the increased profitability ofprivatized firms. In any case, the differences that exist point toward amore dynamic restructuring in the noncompetitive sector relative to thecompetitive one. For example, according to the classification of com-petitiveness based on number of firms, costs per unit decreased 11 per-centage points more in noncompetitive firms, while according to theclassification of competitiveness based on market share, sales peremployees increased 34 percent more in noncompetitive firms than incompetitive ones.
Perhaps the most interesting result is the behavior of real prices. Notonly does the increase in the noncompetitive sector lag behind that of thecompetitive sector, but prices in the former actually fell. According to themarket-share classification, the growth of prices in the competitive sectorwas 9.29 percent while that of the noncompetitive sector was �2.82 percent.This difference is statistically significant at the 10 percent level. All in all,we find no evidence that market power or the exploitation of consumersexplains the increased profitability of privatized firms.
Transfers from Workers
In this section we consider the role of labor retrenchment in explaining thelarge gains in profitability experienced by privatized firms. The redistribu-tion hypothesis links postprivatization gains in profitability to transfersfrom workers to shareholders, as wages fall from above-market levelsinduced by income-redistribution goals. Political models of state ownershipalso imply that SOE workers are overpaid, but unlike redistribution mod-els, these models lack strong predictions regarding the behavior of wages inthe postprivatization period. This uncertainty comes from the fact thatpublic sector jobs are attractive for several reasons besides pay; for exam-ple, they may be desirable because they do not require much effort orbecause they provide the opportunity to collect bribes in exchange for pub-lic services. We try to quantify the contribution of layoffs and wage cuts tothe observed changes in profitability. Examining changes in real wages is anatural way to test competing hypotheses regarding the channels throughwhich privatization works.
PRIVATIZATION IN MEXICO 363

364 CHONG AND LÓPEZ-DE-SILANES
Contrary to the predictions of the redistribution hypothesis, availableevidence shows that real wages increased substantially for the mean andmedian firm (table 7.7). Real wages per worker increased by a mean (me-dian) of almost 80 (125) percent. This is even more striking since overallreal wages in Mexico stagnated during the sample period. Furthermore,gains by blue-collar workers are larger than gains by white-collar workers.Even though white-collar wages increased substantially, the mean andmedian index of industry-adjusted blue-collar wages rose much more—well over 100 percent. Although both skilled and unskilled workersexperience impressive increases in wages, it is the lowest-paid workers whogain the most.
To provide an estimate of the cost savings attributable to layoffs, wemake the extreme assumption that the marginal product of all fired work-ers is zero and calculate what the increase in profitability would have beenif no workers were fired. Even in this extreme case, savings that come fromlayoffs are not as large as the reductions in employment suggest. This is sofor two reasons: first, total wages represent only 23.38 percent of sales inthe preprivatization period, and second, labor costs in the postprivatiza-tion period are spread over a much wider base since sales increase signifi-cantly. Our estimate yields a saving from layoffs equivalent to 6.80 (4.45)percent of sales in 1993. During the same period, the mean (median) ratioof operating income to sales increased 22.12 (9.59) percentage points.Therefore, savings from layoffs account for only 31 to 46 percent of theobserved gains in profitability. If, instead of assuming that fired workers’value added is equal to zero, we assume they are half as productive asretained workers, savings from layoffs drop to between 15 and 23 percentof the increase in profitability.
In conclusion, real wages experience large increases in the postprivati-zation period probably because those workers who are retained arerequired to work and are paid accordingly.15 Overall, the high level oflabor redundancy in the preprivatization period, the observed increases inreal wages, and the productivity gains in the postprivatization period areconsistent with the political view.
Services and Access
The Mexican privatization program spread benefits to society beyond itsdirect effects on prices and firm profitability. These benefits take the formof greater access to, extended coverage of, and enhanced quality of theservices provided by the privatized firms. Table 7.8 summarizes some ofthese benefits. Among the most important improvements are a dramaticincrease in freight road transport and in the provision of natural gas, asubstantial increase in the capacity and efficiency of the port system, andsubstantial investments and increased coverage in the provision of runningwater and sanitation.

365
Table 7.7 The Role of Transfers from Workers
Mean Median
Before After Before AfterVariable N privatization privatization privatization privatization
Index of real wages per worker 101 100.00 179.64*** 100.00 224.92***Index of industry-adjusted real wages per worker 101 100.00 209.30 *** 100.00 198.96***Index of real wages per blue-collar worker 101 100.00 235.43*** 100.00 248.14***Index of industry-adjusted real blue-collar wages 101 100.00 265.61*** 100.00 222.43***Index of real wages per white-collar worker 101 100.00 158.26*** 100.00 200.95***Index of industry-adjusted white-collar wages 101 100.00 177.97*** 100.00 147.92***Index of total employment 101 100.00 57.92*** 100.00 58.05***Total wages/sales 101 0.2338 0.1441*** 0.1506 0.1143***Operating income/sales 101 �0.1530 0.0682*** �0.0251 0.0708***
*** Significant at the 1 percent level.Note: N � number of observations. The table presents data of total number of workers, blue-collar workers, and white-collar workers for a sub-
sample of 101 privatized firms between 1983 and 1992 for which we have full employment data. For each empirical proxy we show mean and me-dian real wages per worker and the index of industry-adjusted real wages per worker for all three groups. Before privatization refers to the averagevalue for the four years before privatization, while after privatization refers to the value as of 1993. We report t-statistics and Z-statistics (Wilcoxonrank sum) as our test for significance for the change in mean and median values, respectively. All variables definitions can be found in the appendix.
Source: La Porta and López-de-Silanes 1999.

366 CHONG AND LÓPEZ-DE-SILANES
Table 7.8 Other Benefits of Privatization Programs
Program Impacts
Freight road transport Between 1988 and 1993, the number of firmsproviding freight road transport service nearlytripled—from 4,456 to 12,972. The number oftrucks increased from 58,133 to 142,973.
Natural gas Between 1996 and 2000, the ComisiónReguladora de Energía (CRE) awarded 21 gasdistribution permits under which concessionaireswere obligated to serve 2.3 million customers by2004. This represents a 15-fold increase in thecustomer base relative to 1995.
Passenger road The impact of the reform has been seen in transport increased entry of new firms or regularization and
registration of existing firms; increased demand(between 1990 and 1996 the number of totalpassengers transported increased from 1.97million to 2.75 million and the number of vehiclesrose from 36,593 to 53,133); and in significantlyimproved quality and reliability of services.
Ports There have been huge increases in installed capacity(from 59 million tons in 1993 to 94 million tons in1998) and capacity utilization (from 41 percent in1993 to 59 percent in 1998). In 1993 the port ofVeracruz was handling 43 containers/hour pership. In 2003 this figure was 84. Manzanillomoves 65 containers/hour per ship, and Altamirahas achieved the international standard of 50moves per hour. In Veracruz the total capacity forloading and unloading agricultural bulk cargoimproved from 2,500 to 9,000 tons per daybetween 1995 and 1998, with the port ofProgreso showing similar improvement.
Railroads New operators invested more than P$3 billion onmaintenance of infrastructure and the renewal ofrolling stock during 1997–98 and another P$3.3billion during 1999. Between 1997 and 1998 thetotal volume of freight handled by the railsystem in Mexico increased by 21.5 percent.
Telecommunications During the 1990s the number of wire-linetelephones in service doubled; wireless telephonygrew from negligible levels to nearly 40 percentof all telephones; and waiting lists for servicevirtually disappeared during the first decadeafter privatization.
(Table continues on the following page.)
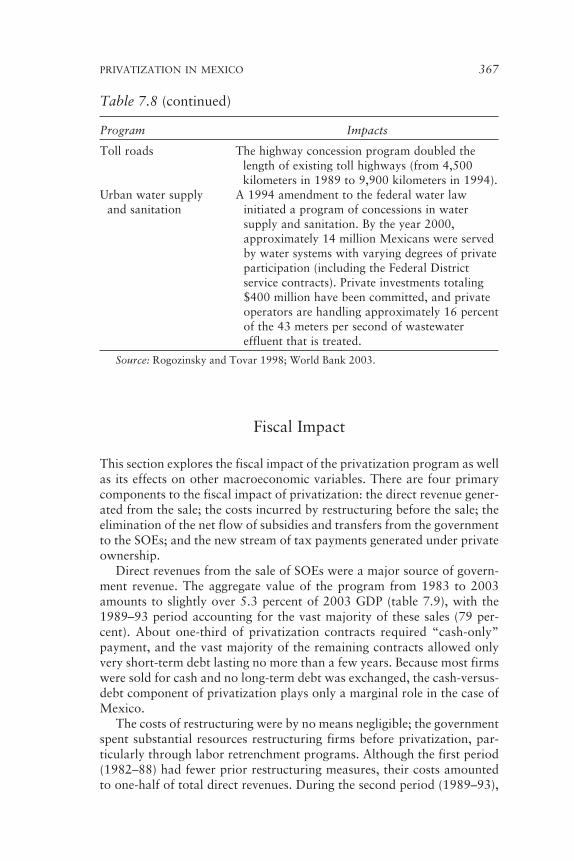
Fiscal Impact
This section explores the fiscal impact of the privatization program as wellas its effects on other macroeconomic variables. There are four primarycomponents to the fiscal impact of privatization: the direct revenue gener-ated from the sale; the costs incurred by restructuring before the sale; theelimination of the net flow of subsidies and transfers from the governmentto the SOEs; and the new stream of tax payments generated under privateownership.
Direct revenues from the sale of SOEs were a major source of govern-ment revenue. The aggregate value of the program from 1983 to 2003amounts to slightly over 5.3 percent of 2003 GDP (table 7.9), with the1989–93 period accounting for the vast majority of these sales (79 per-cent). About one-third of privatization contracts required “cash-only”payment, and the vast majority of the remaining contracts allowed onlyvery short-term debt lasting no more than a few years. Because most firmswere sold for cash and no long-term debt was exchanged, the cash-versus-debt component of privatization plays only a marginal role in the case ofMexico.
The costs of restructuring were by no means negligible; the governmentspent substantial resources restructuring firms before privatization, par-ticularly through labor retrenchment programs. Although the first period(1982–88) had fewer prior restructuring measures, their costs amountedto one-half of total direct revenues. During the second period (1989–93),
PRIVATIZATION IN MEXICO 367
Table 7.8 (continued)
Program Impacts
Toll roads The highway concession program doubled thelength of existing toll highways (from 4,500kilometers in 1989 to 9,900 kilometers in 1994).
Urban water supply A 1994 amendment to the federal water law and sanitation initiated a program of concessions in water
supply and sanitation. By the year 2000,approximately 14 million Mexicans were servedby water systems with varying degrees of privateparticipation (including the Federal Districtservice contracts). Private investments totaling$400 million have been committed, and privateoperators are handling approximately 16 percentof the 43 meters per second of wastewatereffluent that is treated.
Source: Rogozinsky and Tovar 1998; World Bank 2003.

firms were restructured more often, but total costs were equivalent to onlyone-third of total revenues. In any case, it is clear that restructuring costswere significant.
Subsidies and transfers accounted for a significant percentage of theoverall government budget—totaling almost 13 percent of GDP in 1982.16
Table 7.9 provides a measure of subsidies net of dividends, revenues, andrestructuring costs associated with privatization during the four-yearperiod before privatization; it reveals that these operations imposed a largenet burden on the public finances. During the first privatization period, netsubsidies during the four years before privatization equaled 0.18 percentof 2003 GDP, almost half of the sale price of the firms privatized duringthe period. During the second period, net subsidies were more than twicetheir previous value but represented only about 8 percent of the nominalprice of privatization contracts.
Overall, the evidence suggests that privatization had a positive andsignificant impact on the fiscal position of the government. The operatingbalance and total public-sector borrowing requirements show a significantturnaround. In fact, during the second period the government’s budgetdeficit (without considering direct privatization revenues) climbed from16 percent of GDP to a small budget surplus (figure 7.2). Furthermore, thegreater fiscal discipline afforded by privatization contributed to a sharpreduction in inflation and therefore to improved macroeconomic stability(López-de-Silanes 1994).
The funds obtained from the sale of SOEs were allocated to three prin-cipal uses: an emergency contingency fund to protect against nonrecurrentexternal shocks; a fund destined to reduce the stock of external debt; and
368 CHONG AND LÓPEZ-DE-SILANES
Table 7.9 The Fiscal Impact of Privatization: 1983–2003(percentage of 2003 GDP)
Nominal Net subsidiesprice of Privatization during the four
privatization restructuring years beforePeriod contract costs privatization
1983–88 0.40 0.20 0.181989–93 4.20 1.30 0.351994–2003 0.73 n.a. n.a.Total 5.32 1.51 0.53Number of privatization 255 220 95
contracts
n.a. � Not available.Source: Data collected by the authors from the original privatization sales and
prospectuses from the Secretaría de Hacienda y Crédito Público and Secretaría deComunicaciones y Transportes (2000).

a permanent increase in the budget for education and social assistance.The relative composition of public and private investment also changedbecause of privatization: total government investment in the economyshrank from more than 10 percent of GDP in 1982 to less than 3 percentin 2001 (SHCP 1982–2003b). During this period, investments by SOEsfell from more than one-half of private investment to less than one-tenth,reflecting the joint effect of lower government involvement in the economyand a recovery of private investment.
The privatization program also encouraged foreign direct investment.Although foreign investors won only 9 percent of all privatization con-tracts auctioned, they engaged in joint ventures with domestic investorsfor an additional 11 percent of privatization contracts, including severalof the largest firms (table 7.10).
The net effect of these factors contributed to the radical reduction ofgovernment debt experienced by Mexico since the mid-1980s. As shownin figure 7.3, total debt, both internal and external, dropped from a high
PRIVATIZATION IN MEXICO 369
Figure 7.2 The Overall Fiscal Impact of Privatization
Note: SOE � state-owned enterprise. The figure shows the evolution of thesubsidies and transfers to the total SOE sector, the public sector borrowingrequirements, and the public sector total operational balance as a percentageof annual gross domestic product.
Source: Data collected by the authors from SHCP 1982–2003a, 1982–2003band Banco de México 1996–99.
−20
−15
−10
−5
0
5
10
15
1982
1983
1984
1985
1986
1987
1988
1989
1990
1993
1994
1995
1996
1997
1998
1999
2000
2001
Percentage of annual GDP
Subsidies and transfers to the total SOE sector
Public sector total operational balance
Public sector borrowing requirements
1991
1992
2002

of 80.7 percent of GDP in 1986 to only 38.7 percent in 1991 and to 27percent in 2001. Although the stock of external debt increased sharplybefore the 1995 financial crisis, and the stock of internal debt hasincreased continuously since 1996, it is clear that Mexico’s debt situa-tion is very different from what it once was. The privatization program,through its fiscal windfall and especially the lower financial require-ments of a reduced SOE sector, is one of the main factors explaining thistransformation.
Allocative Efficiency
Allocative efficiency refers to the idea that firms should be placed in thehands of those who value them the most. The guiding principle behindthe idea of maximizing allocative efficiency is that any other mechanismwould provide an inferior potential welfare outcome because any distri-bution goal can be achieved by giving the asset to whoever values it themost and then taxing them to compensate others. Some privatizationprograms, particularly in former communist countries, used vouchermechanisms to achieve a direct transfer of resources. These programsgave each individual a share of the former national industry with theobjective of achieving a more equitable distribution of wealth and toprevent a few rich investors from pocketing most of the potential gainsfrom privatization.
Recent literature on the subject (Galal and others 1994; Maskin 1992)has emphasized that voucher programs are less efficient than fiscal policyin achieving wealth distribution and are subject to more problems. Diffused
370 CHONG AND LÓPEZ-DE-SILANES
Table 7.10 Foreign Direct Investment in Privatization
Number of privatization contracts in the sample
1938–88 1989–93 1994–2003
Foreign 6 118 9 15.58Foreign– 4 116 8 67.35
domesticjointventure
Domestic 77 110 18 171.96Total 87 134 35 255.17
Note: FDI � foreign direct investment.Source: Data collected by the authors from the original privatization sales and
prospectuses from the Secretaría de Hacienda y Crédito Público, Secretaría deComunicaciones y Transportes, and Banco de México.
Present value of saleprice as a percentageof average FDI flows
Winner’snationality

shareholders are often bought out at deep discounts by agents with asym-metric information, and entrenched management can more easily resistreform because there is no organized pressure from the new owners.Because of this, it seems a wiser idea for governments to follow a processsimilar to Mexico’s, which focused its attention on maximizing allocativeefficiency and then used the proceeds from privatization to benefit therest of the population. As of June 1992 the Mexican privatizationprogram involved a total of more than 2,200 interested individuals andcompanies who formally requested information and 839 actual bidders.This wide participation is one of the main reasons for the high prices paidfor privatized firms in Mexico (López-de-Silanes 1997).
As a result of the income derived from privatization programs, spend-ing on education and social assistance increased dramatically. The re-sources generated and liberated by privatization account for a significant
PRIVATIZATION IN MEXICO 371
Figure 7.3 Total Net Debt of the Public Sector
Note: GDP � gross domestic product. The figure includes debt held by thefederal government, government enterprises and entities, development banks,and official trust funds.
Source: Data collected by the authors from SHCP 1982–2003a, 1982–2003band Banco de México 1996–99.
0
10
20
30
40
50
60
70
1982
1983
1984
1985
1986
1987
1988
1989
1991
1992
1993
1994
1995
1996
1997
1998
1999
2000
2001
2002
Average balances as percentage of annual GDP
1990
External debt Domestic debt

share of these programs, and have helped the levels of education, health,and regional development regain their pre-1982-crisis levels (around 9percent of GDP). For example, in 1992 the education budget increased 9.5percent in real terms, while the health and social services sector receivedan increase of 7.7 percent, and transfers to rural development programsincreased almost 40 percent (López-de-Silanes 1994).
Dos and Don’ts in Privatization
The Mexican privatization program provides an excellent opportunity tostudy the effects of different privatization policies and restructuring pro-grams. Privatization requires heavy government involvement and is usu-ally fraught with conflicts of interest as politicians set up the method andrun the process through which they end up either “selling their own firms”or “firing themselves or their friends” (Perotti 1995; Biais and Perotti2002; Bortolotti, Fantini, and Scarpa 2001; Earle and Gehlbach 2003).Table 7.11 shows the most common restructuring measures adoptedbefore privatization and their frequency in the different periods of theMexican privatization program.
The most popular restructuring measures in both periods (1983–88and 1989–92) are labor retrenchment and debt absorption, which werecarried out with the hope that bidders would be willing to pay more forfirms that had been restructured in this way. During the second period,other restructuring mechanisms such as changing the management team,firing the chief executive officer (CEO), and implementing investment andefficiency programs became much more common.
To assess the impact of different restructuring measures on the pricepaid for privatized firms, we need to construct a variable that controlsfor the value of the firm sold and captures the resources that accrue tothe government from the sale of the SOE. We propose an approxima-tion of Tobin’s Q—the ratio of the firm’s market value to the replace-ment cost of its physical assets—which we call privatization Q (PQ) andestimate as:
where GNPP is the price received by the government once all restructur-ing costs have been deducted; sh is the number of shares sold; TD are totalliabilities at the time of privatization; and TA are total assets at the timeof privatization.17 The PQ standardization considers GNPPi as theproxy for market value of stock while controlling for debt and assets andallows for the calculation of a good proxy for Tobin’s Q.18
PQ �
GNPPsh
� TD
TA
372 CHONG AND LÓPEZ-DE-SILANES

PRIVATIZATION IN MEXICO 373
Table 7.11 Restructuring Actions before Privatization
Number of privatization contracts
Actions 1983–88 1989–92
ManagementChief executive officer replaced 11 25Change of management team 15 54Change or creation of board of directors 1 30
LaborLabor cuts 24 65Collective contract canceled 4 13Collective contract renegotiated 3 10
Debt absorption Outsiders debt 23 53Cross liabilities 10 45Fiscal debt 11 37
Efficiency programsPerformance measures 6 29Increased management responsibilities 0 27
Investment programsInvestment-performance agreements 10 29Other investment programs 5 1
Deinvestment measures 9 32Legal measures
Legal debt absorption or solution of 2 15disputes
Negotiations with minority shareholders 11 9Reorganization or changes in legal status 7 11
Assets restructuringClarify or document assets ownership 7 22Patent registrations 1 5Breaking up companies for sale 3 37Bundling companies for sale 14 4Assets spin-offs 10 14
Number of privatization contracts in 87 134the sample
Note: The table shows the main groups of restructuring actions before privatiza-tion and their frequency by period for a subsample of 221 privatization contracts inMexico between 1983 and 1992. Some privatization contracts did not undergo anyof the actions listed above, while others underwent several restructuring actionssimultaneously. The exact definition of each restructuring group can be found in theappendix.
Source: Data collected by the authors from the original privatization sales andprospectuses from the Secretaría de Hacienda y Crédito Público.

The estimations shown in this section regarding the effects of the saleprocess on privatization prices consider PQ as the dependent variable andfirm-specific characteristics, industry characteristics, auction require-ments, and restructuring measures undertaken before privatization as theindependent variables. Ordinary least square (OLS) results as well asinstrumental variable (IV) results that take into account the possibleendogeneity of our proposed measures are shown in table 7.12.
Firm and Industry Characteristics
All firm and industry characteristics show their expected effect on PQand are statistically significant. An increase of 10 percentage points onthe ratio of net income to sales increases PQ by 16 (15) percent usingestimates from an ordinary least squares (instrumental variables)regression. A more aggressive labor force, measured by the cost of firingworkers or by the number of strikes suffered in the years leading up toprivatization, significantly reduces the price received for privatizedfirms. For example, an additional strike in the five years leading up toprivatization lowers PQ by 17 (23) percent. Government involvement inthe industry significantly increases the price paid for a privatized firm,but privatizations that do not transfer control of the firms to privatehands are sold at a significant discount. A 10 percentage point increasein the market share of public enterprises increases PQ by about 7 per-cent, probably as a result of protection against competition granted tosectors under heavy state control.19 In contrast, the sale of governmentholdings in private firms is heavily penalized. The average noncontrolprivatization fetched PQs 91 (78) percent lower than those privatiza-tions where the government owned the controlling interest, probably asa result of poor corporate governance and deficient enforcement ofshareholder’s rights, which fueled investors’ fears that they would beexploited by the current majority shareholder.
Auction Process and Requirements
Auction requirements make a substantial difference in the net pricereceived by the government. Bans on foreign participation reduced PQsby 32 (30) percent. Cash-only sales, another common restriction, werepopular because they lowered the government’s risk to future breachesof contract and provided an instant infusion into the treasury. Never-theless, these advantages must be carefully weighed against the 30 (27)percent discount in PQ they entailed. It is important to point out thatthese penalties are independent of the fact that they lower auction com-petition, a substantial factor when we consider that an additionalbidder in the final round increased PQ by 17 (12) percent for the aver-age firm.
374 CHONG AND LÓPEZ-DE-SILANES

PRIVATIZATION IN MEXICO 375
Table 7.12 Prior Restructuring: Dos and Don’ts
Percentage change Percentage changein privatization in privatization
Independent variables Q (OLS) Q (IV)
Firm and industry characteristics
Net income/sales 15.83*** 15.33***Contingent labor liabilities �1.97** �1.38*
per workerNumber of strikes �16.98** �23.12**Government in industry 7.06* 7.12*Noncontrol package �90.89*** �78.28**
dummyAuction process and
requirementsTotal length of sale �2.23*** �3.35***Additional bidder in final 16.96*** 11.64**
roundFDI allowed dummy 31.56* 29.63*Cash-sale only dummy �30.41 �26.52Prior restructuring policyCEO change dummy 34.13 54.88**Percentage of labor cuts �2.82 12.28*Debt absorbed/total liabilities �40.89 11.44Efficiency measures dummy �14.71 �56.09Investment measures dummy 2.40 �95.31Deinvestment measures �16.57 3.96
dummy
* Significant at the 10 percent level.** Significant at the 5 percent level.*** Significant at the 1 percent level.Note: OLS � ordinary least squares, IV � instrumental variables, FDI � foreign
direct investment, and CEO � chief executive officer. The table shows the effect of firmand industry characteristics, auction characteristics and requirements, and prior restruc-turing policies on the mean privatization Q for a subsample of 140 firms privatized inMexico between 1983 and 1992 for which full information is available. We calculatethe effect of a 10 percentage point increase in the net-income-to-sales ratio; an addi-tional strike; a 10 percentage point increase in the government’s preprivatization marketshare of the industry of the privatized firms; an additional month in the length of sale;and a 10 percent reduction in the labor force. For all other variables, we show the dis-crete change of the dummy from 0 to 1. The first column considers prior restructuringmeasures and the rest of the variables as “exogenous” and uses estimates from an OLSregression. The second column shows the second step of the two-step instrumental vari-ables procedure in which prior restructuring measures, total length of sale from rumorsto completion, and the number of bidders in the final round are treated as potentiallyendogenous variables. All variables definitions can be found in the appendix.
Source: López-de-Silanes 1997.

The speed at which privatization takes place also has important effectson the net price raised. While there are potential costs of rushing a sale,the benefits of a quick process include disposing of money-losing firms andavoiding costly restructuring. Additionally, a lengthy process usually leadsto a deterioration of the operating performance of the firm as managers’incentives collapse and workers are disgruntled about the possibility oflosing their jobs. Evidence from Mexico suggests this is the case, as eachadditional month taken to complete the privatization process costs anaverage of 2.2 (3.4) percent of PQ.20
Prior Restructuring Policies
Government restructuring of SOEs before their sale is fraught withpolitical difficulties. Direct costs of restructuring are quite substantial—equivalent, on average, to about 30 percent of the sale price. As withother policies, restructuring programs can be defended rationally on thegrounds that they increase revenues from the sale, or that they minimizelayoffs and contribute to the future success of the privatized firm. As aresult, there is great ambivalence about the optimal policy approach to-ward restructuring before privatization. Analyzing this question is not astraightforward proposition because restructuring measures are notundertaken randomly but are selectively targeted to firms that need themmost.21 To solve this problem, we use an instrumental variable approachto capture the true effect of restructuring measures on privatizationprices.22
In this section, we look at six types of prior restructuring: change inmanagement, labor retrenchment, debt absorption, efficiency programs,investment measures, and deinvestment measures. Restructuring measuresare almost certainly endogenous, and therefore we focus on the resultsprovided by the instrumental variable regression.
On one hand, management shake-ups before privatization can lead tolower privatization prices if the loss of experienced managers leads todeteriorating performance (Bolton and Roland 1992). On the other hand,removing an entrenched team can improve the operating performance ofa firm as well as make it easier to tackle mismanagement and corruption.This is especially likely if management was appointed for political ratherthan technical reasons (Barberis and others 1996). The empirical evidencesupports the second hypothesis, as firing the CEO leads to a statisticallysignificant increase of 55 percent in the PQ.23
The argument against restructuring labor contracts or firing workersbefore privatization rests on the assumption that the new owner will bebetter suited to choose which workers to retain and which to dismiss andcan therefore restructure the labor force to suit the firm’s needs at a lowercost than the government could. This may be particularly true if unionshave significant power to influence the political process through elections
376 CHONG AND LÓPEZ-DE-SILANES

or collective action (Freeman 1986). Conversely, the public sector mayhave a comparative advantage in bargaining with unions if it can convinceworkers that social mechanisms will be put in place to assist them. For oursample of Mexican privatized firms, labor retrenchment had a slight neg-ative effect on PQ under the OLS regression but a significant positive im-pact once we account for its endogenous nature. Under this specification,a 10 percent reduction in the labor force is associated with a statisticallysignificant 12 percent increase in PQ. This evidence should be taken withcare, as recent investigations dealing specifically with the effects of laborretrenchment on privatization suggest that these programs are seldom theoptimal policy (Chong and López-de-Silanes 2003).
Classical finance theory holds that government’s absorption ofSOEs’ debt should have a neutral effect on price because potentialacquirers would simply increase their bids by the same amount as thedecrease in debt (Donaldson and Wagle 1995). However, one can imag-ine scenarios under which debt absorption could have a positive or neg-ative effect on net prices if the borrowing terms for the private buyersare different from those for the government or if debt absorptionreduces the expected cost of financial distress for excessively leveragedcompanies (Bolton and Roland 1992). Once we control for endogene-ity, the effect of debt absorption on PQ becomes quantitatively andstatistically insignificant.
Some of the most frequent restructuring policies undertaken includeinvestment programs and efficiency measures. We would expect a pre-mium in PQ for restructured firms if the government is able to improvethe operating performance of firms at a lower cost than the private sectorcould. However, if restructuring decisions are driven by political motiva-tions or if the government is unable to match the know-how of privatefirms, the restructuring effort will be a waste of resources and thereforelower PQ. The latter seems to be the case in Mexico as, controlling forendogeneity, firms subject to efficiency measures and investment planswere sold for PQs 56 and 95 percent lower, respectively.
If bidders value investments by the government at less than their cost,it is worth investigating whether PQ could be increased by cutting theflow of resources and canceling previously approved investment pro-grams. This may not be straightforward, however, as deinvestment mayhurt the long-term profitability of firms and lead to lower prices. Ourresults find that, on average, undertaking deinvestment measures has nosignificant effect.
Available empirical evidence strongly suggests that restructuringpolicies do not lead to better net prices per dollar of assets sold. We findthat the optimal policy seems to be to refrain as much as possible fromengaging in SOE restructuring. Some of the most popular measures suchas debt absorption do not increase net prices, while others such asinvestment and efficiency programs actually reduce net prices. These
PRIVATIZATION IN MEXICO 377

results are actually quite intuitive once we realize that all they imply isthat new owners are able to satisfy their own goals better than politi-cians could.
Complementary Policies of Privatization
Privatization should not be looked at in isolation. Its success or failure islikely to depend on a set of complementary policies that are sometimesneglected. First, the outcome of a privatization process depends cruciallyon the quality and appropriateness of the contracts written, particularlywhen dealing with the provision of public services or public-private ven-tures. Policymakers should not rely on the good will of the private sectorto act in the best interest of society. If the privatization contracts do notestablish the right incentives, it should come as no surprise that newly pri-vatized firms will try to use market power to increase their benefits or thatconcession holders may manipulate their accounts to extract rents fromthe government. Second, it is crucial to consider carefully the necessaryderegulation or reregulation for sectors with market power or in whichgovernment ownership represented a substantial percentage of total assetsbefore privatization. Without adequate deregulation, firms may notrestructure as planned, and potential efficiency gains may be lost, as it iseasier to extract rents from the government. Conversely, without a pro-gram to reregulate privatized firms, those with market power may usetheir ability to influence prices to exploit consumers, and those in sectorswith protective regulations may benefit from barriers to entry and othermeasures originally intended to protect SOEs from competition. Finally, itis important to establish a set of institutions that promote good corporategovernance and strengthen shareholder and creditor rights in order tofacilitate firms’ access to capital and allow recently privatized firms tofinance their growth without dependence on the state.
The Type of Contract Written
The type of privatization contract written is of the utmost importance toensure that no room is left for opportunistic behavior at the hands ofpoliticians or private buyers. The simplest contracts are straightforwardsales of assets in which the government disconnects itself completely fromthe operational future of the privatized firm. Other types of contracts maylead to a perverse relationship between the privatized firm and the state asmanagers and bureaucrats collude to serve their own interests at theexpense of consumers and taxpayers.
Most vulnerable to this sort of manipulation are the provision ofservices, the construction of infrastructure projects, and the establish-ment of joint ventures between private companies and the government.
378 CHONG AND LÓPEZ-DE-SILANES

The common element in these cases is that the umbilical cord between thegovernment and the firm has not been severed, leaving room for rent-seeking behavior. When privatized firms depend on the state for fundingor need permission to undertake certain decisions, it is likely that theincentives to restructure will not be as strong and that management willinstead focus its efforts on extracting rents from the government. Theseperverse incentives are fed by politicians who often aspire to transformfirms into national champions by subsidizing them and shielding themfrom competition. This collusion with business is often rewarded directlyby economic support from firms and by the political benefits derivedfrom being perceived as standing up for labor and against foreign com-petitors. To minimize the potential losses from these arrangements and toensure that privatized firms live up to their commitments, clear disclosureand monitoring mechanisms are needed.
The importance of writing adequate contracts can be illustrated by oneof the major instances of failure in Mexico’s privatization program, theconcessions to construct and manage highways. As Rogozinsky and Tovar(1998) explain, to encourage private sector participation in highways, thegovernment included clauses in its contracts guaranteeing minimum traf-fic growth rates. If revenues fell below the guaranteed level, the privateparty would be entitled to claim a revision of the length of the concession.Moreover, under this scheme, the only variable of adjustment was thelength of the concession. These incentives created perverse rent-seekingincentives for concession holders to inflate construction costs and tocharge excessively high toll charges. With the peso devaluation of 1994, abad situation was made much worse as lower than expected revenues andhigher interest rates pushed many concession holders to the brink of bank-ruptcy. Banks that had supplied much of the debt were themselves hard hitand thus unable or unwilling to provide relief through debt restructuring(World Bank 2003).
The World Bank’s 2003 report on private solutions for infrastructurein Mexico points out four basic causes for the failure of road privatization.First, the program as a whole was not financially sound; concessions withthe highest profit potential were awarded first, but the overall programwas too extensive for each concession to be financially self-sufficient. Sec-ond, the decision to award concessions based on the shortest period ofprivate ownership led to excessively high toll levels. The average durationof concessions was 12 years, and in two cases an award was given for only5 years. This led to inefficiencies as several newly built toll roads were vir-tually empty while parallel public roads remained heavily congested; trucktraffic, in particular, fell below forecast levels. Third, poor feasibility stud-ies led to overgenerous contracts. The Secretaría de Comunicaciones yTransportes did not have the necessary experience or resources to carryout appropriate cost and demand forecasts for such an extensive programand, in particular, it seems to have substantially underestimated the
PRIVATIZATION IN MEXICO 379

demand elasticity of toll roads. Finally, underbidding and overvaluation ofcontractor contributions were widespread. Contractors overvalued theircontributions, especially once financial problems emerged, because theycould then press for extensions on the concession.
The policy lesson is clear: contracts must be designed to take intoaccount moral hazard incentives and the asymmetries of information be-tween the government and the private sector. The design of the contractsshould be based on considerations of economic efficiency rather than onpolitical or macroeconomic ones and, in particular, contracts should helplimit rent-seeking behavior.
Deregulation
An appropriate regulatory framework after privatization is a key com-ponent of the success or failure of the program. A common elementacross many failed examples of privatization is inadequate deregulation,which may lead to suboptimal levels of competition and allows produc-ers to keep the gains from privatization without sharing them with con-sumers.24 Deregulation is particularly important in sectors where thestate owned most of the assets before privatization, as they tend to beprotected by a web of regulations originally instituted to cut the lossesof state-owned firms and reduce fiscal deficits. Without a thoroughreview of these regulations, privatized firms will be artificially shieldedfrom competition and able to make extraordinary gains at the cost ofconsumers.
Deregulation complements privatization in two ways. First, productmarket competition provides a tool for weeding out the least efficientfirms. This process may take too long—or not work at all—if regulationinhibits new entry or makes exit costly. Second, deregulation may alsocomplement privatization by raising the cost of political intervention.Whereas an inefficient monopoly can squander its rents without endan-gering its existence, an inefficient firm in a competitive industry wouldhave to receive a subsidy to stay afloat.
Figure 7.4 shows the frequency and composition of deregulation meas-ures taken in Mexico from 1983 to 1992 before privatization. These in-clude price and quantity deregulation, simplified entry and exit barriers,lower restrictions on foreign direct investment and ownership, increasedinternational competition, and the elimination or reduction of subsidies.During the De la Madrid administration, 87 privatization contracts werecarried out, with trade liberalization and changes in specific regulatoryschemes as the most popular measures. During the Salinas administration,134 privatization contracts were signed, and deregulation was undertakenmuch more aggressively. In particular, price and quantity quotas were dis-banded and entry barriers were lowered, both directly and by granting amore prominent role to foreign direct investment. Although it is clear that
380 CHONG AND LÓPEZ-DE-SILANES

the Salinas administration engaged in deregulation with greater alacritythan the previous administration, privatization coupled with deregulationplayed a key role throughout the period.
Reregulation
Regulation should be carefully revised in conjunction with privatizationfor firms in industries characterized as natural monopolies or in oligopo-listic markets. The reasoning behind the first case is that firms with mar-ket power may have ample opportunities to exploit consumers and thatthe institutions necessary to supervise them either are nonexistent or do
PRIVATIZATION IN MEXICO 381
Figure 7.4 Deregulation Actions Taken before Privatization
Note: The figure shows the main groups of deregulation actions takenbefore privatization for a subsample of 221 privatization contracts between1983 and 1992. Not every privatization contract underwent some form ofderegulation, while others underwent several. Eighty-seven privatizationcontracts were carried out during the first period (1983–88) and 134 duringthe second period (1989–92). The exact definition of each restructuring groupcan be found in the appendix.
Source: Data collected by the authors from the original privatization salesand prospectuses from the Secretaría de Hacienda y Crédito Público.
9 9
2
1714
1
10
57
38
29
35
43
19
24
Pricederegulation
Quantity/quotas/routes deregulation
Foreign directinvestment
Tradeliberalization
Changes to specificregulation schemes
Lower entrybarriers
Elimination /reduction of subsidies
Number of privatization contracts
1983–88 1989–92

not have the necessary experience to do the job appropriately. When firmswith market power are in public hands, it is likely that the profit-maximizing incentive is held in check as the government places prioritieson other goals such as providing subsidized services to certain sectors ormaximizing employment. Once firms are handed over to the private sec-tor, however, it is likely that the new owners will use whatever means theyhave at their disposal to increase profits. It is therefore necessary to com-plement privatization with adequate reregulation and with the creation ofinstitutions that ensure fair competition and a level playing field to allparticipants.
A clear example of the perils of not reregulating privatized SOEsappropriately is that of the Mexican banking industry. During the yearsunder state management, banks functioned as an annex to the nationaltreasury and served mainly as a tool for financing state deficits andhanding out favors to politically influential sectors. As a result, banksdid not develop the necessary experience in valuing the risks associatedwith particular loans or the skills needed to value collateral. Moreover,when banks were privatized, no supervisory mechanism was in place toensure that bank loans to related parties were in the best interests of thebank or that reserves were proportional to the riskiness of the loansundertaken. The combination of these two shortcomings proved fatalfor the banks’ future and to the thousands of shareholders who purchasedminority stakes in them.
The changes made in the regulatory framework of the banking indus-try were structured around three main objectives: First, they aimed to de-crease the role of the government in determining the allocation of bankloans; second, they tried to create a new market structure for financialservices as a whole; and third, they attempted to curtail barriers to entry.Unfortunately, the reforms carried out to achieve these objectives wereexecuted in a piecemeal fashion and not within the context of a compre-hensive plan to provide the banking industry with adequate regulation. Inthe end, the greater flexibility granted to private banks allowed them toengage in risky behavior and to extract benefits from consumers and thegovernment without providing incentives for banks to reform and becomemore efficient.
Following privatization, lending increased rapidly and was accom-panied by improvements in bank profitability. The average bankincreased its operating margin by almost 2 percentage points to 10.85percent, and profit margins increased from 5.37 percent to 6.36 percent(figure 7.5). Interest margins, however, remained steady at about 7 per-cent despite the fact that nominal interest rates fell from 80 percent toonly 35 percent.25
Two hypotheses can be used to explain the higher profitability of pri-vatized banks without resorting to charges of collusion and market power:the employee-wealth-transfer hypothesis, and the reduced-agency-cost
382 CHONG AND LÓPEZ-DE-SILANES

hypothesis. The former argues that wealth is transferred to investors bylaying off workers and reducing the wages of remaining employees(Shleifer and Summers 1988), while the latter argues that proper incentivesreduce agency costs and lead to higher profitability.
Figure 7.6 shows that the average annual change in employmentafter privatization is �1.64 percent, which would seem to lend credenceto the employee-wealth-transfer hypothesis. However, the real annualgrowth rate of personnel expenses per employee more than doubled in
PRIVATIZATION IN MEXICO 383
Figure 7.5 Mexican Banks’ Profitability Indicators before andafter Privatization
Note: This figure shows mean performance indicators before and afterprivatization for the cross section of banks privatized in Mexico. Financialmargin/financial revenue is the ratio of the financial margin to financialrevenue; interest margin is the financial margin divided by the sum of loansportfolio plus securities portfolio; profit margin is the ratio of period netincome to the period total revenue; operating margin is the ratio of periodoperating income to the period total revenue; operating income is the realannual growth rate in the operating income. Before privatization refers to theperiod between January 1989 and the month of privatization of each bank,while after privatization is the period ranging from the month of privatizationto the end of 1992, or for the largest period for which information is available.The banks included in the sample are Atlantico, Banpais, Banamex, Banco delCentro, Bancomer, Bancrecer, Banco Oriente, Banoro, Banorte, B.C.H., Cremi,Confia, Comermex, Internacional, Mercantil, Serfin, Somex, and Promex.
Source: López-de-Silanes and Zamarripa 1995.
0.2278
0.07450.0537
0.0896
0.26560.2804
0.0699 0.06360.1085
0.5900
Financial margin /Financial revenue
Interest margin Profit margin Operating margin Operating income
Before privatization After privatization

the period following privatization, jumping from 14.9 percent to 32.5percent.26 When put together, these two pieces of evidence show thatlabor costs did not decrease, but that they in fact increased significantlyfollowing privatization. The employee-wealth-transfer hypothesis,therefore, cannot explain the increased operating performance ofbanks.
In terms of the reduced-agency-costs hypothesis, two elements pointtoward possible savings. The first concerns banking operations as such.Under government ownership, banks had deviated from their mainlending activity and entered the securities market, possibly in reaction to
384 CHONG AND LÓPEZ-DE-SILANES
Figure 7.6 Mexican Banks’ Performance Indicators beforeand after Privatization
Note: This figure shows mean performance indicators before and afterprivatization for the cross-section of Mexican privatized banks. Growth in thenumber of employees is the annual percentage increase in the number ofemployees; growth in personnel expenses per employee is the real annual growthin the monthly personnel expense per employee; growth in loan portfolio is thereal growth rate in the loan portfolio; growth in securities portfolio is the realgrowth rate in the securities portfolio. Before privatization refers to the periodbetween January 1989 and the month of privatization of each bank, while afterprivatization is the period ranging from the month of privatization to the end of1992, or for the longest period for which information is available. The banksincluded in the sample are Atlantico, Banpais, Banamex, Banco del Centro,Bancomer, Bancrecer, Banco Oriente, Banoro, Banorte, B.C.H., Cremi, Confia,Comermex, Internacional, Mercantil, Serfin, Somex, and Promex.
Source: López-de-Silanes and Zamarripa (1995).
0.0116
0.1489
0.35080.3007
−0.0164
0.3252
0.5197
−0.0204Growth in the number
of employeesGrowth in personnel
expenses per employeeGrowth in loan
portfolioGrowth in securities
portfolio
Before privatization After privatization

increased competition from brokerage houses. This deviation reflectedmanagement or political objectives, such as size or growth, which arecommon for SOEs all over the world. After privatization, the growthrate of the loan portfolio increased from 35.08 percent to 51.97 percent,while the securities portfolio decreased at an annual rate of 2.04 percent(see figure 7.6). Given that the financial margin on loans ranged from 3to 15 percent, while that of securities was only about 1 to 3 percent(López-de-Silanes and Zamarripa 1995), it is tempting to argue that pri-vatization reduced the agency problem because resources were channeledtoward lending and not toward other objectives. A second source of re-duced agency costs can be found in the ownership structure that emergedafter privatization. Most bank managers were also shareholders, whichhelps increase the incentives to maximize shareholder value. In addition,although management had seats on the board of directors, the board wascontrolled by outsiders, a management structure that is more likely toallow the board of directors to act as an effective mechanism of corporategovernance (Fama and Jensen 1983).
These two pieces of supporting evidence notwithstanding, the bankingcrisis of the mid-1990s and the role that related lending played in bringingabout the collapse of the banking system seriously undermine the idea thatreduced agency costs can explain the increase in profitability experiencedby privatized banks. The conclusion we are left with, therefore, is thatinadequate competition allowed banks to collude and increase theirprofitability without really restructuring.
In terms of failed supervision, the government turned a blind eye tooverdue loans. The supervisory system was not modernized, and the gov-ernment did not require banks to increase their reserves or to tie them tothe underlying riskiness of the loans. Meanwhile, banks continued to payhigh dividends and reserves were progressively decapitalized, leavingthe whole system vulnerable to collapse. Signs of stress in the financialsector first appeared in 1993 as the economy slipped into a recession,and by July 1994 most financial institutions were experiencing seriousdifficulties.
As the financial crisis evolved, the government took over financiallydistressed banks with the goal of restructuring them and finding a buyerfor them in better times. Once the dust settled, however, only 3 out of 18commercial banks remained independent, and none escaped unscathed. Asof the year 2000, 7 banks were under government management, 5 hadbeen acquired by foreign financial institutions, and 3 had been acquiredby domestic financial institutions.
Interestingly, many, if not most, of the defaulted loans that led to thecollapse of the banking industry were related loans, or loans granted todirectors of the bank or companies in the same industrial conglomerateas others owned by bank directors. Many economists have argued thatrelated lending is beneficial to banks as it allows them to better assess
PRIVATIZATION IN MEXICO 385

the risks related to particular projects and to monitor the compliance ofdebtors. If this is true, banks may be able to get higher ex post returnsfrom preferential loans granted to related parties than from arm’s-length transactions at full rates. In the Mexican case, however, there isevidence that related lending was used by controlling shareholders toloot banks.
There are four basic results that, when put together, overwhelminglysupport the looting view of related lending. First, the borrowing termsoffered to related parties were substantially better than those availableto unrelated ones (figure 7.7). Controlling for observable financialcharacteristics, the interest rate for fixed-rate related loans in pesos was amean of 6.88 percentage points lower than that of unrelated loans. Thesmallest difference is 2.25 percent for floating-rate dollar-denominatedloans, still a significant margin and, like all the others, statisticallysignificant at the 1 percent level. Moreover, loans to related parties postedcollateral or personal guarantees less often than unrelated loans, and whenthey did it was for a lower amount. Finally, the maturity of related loanswas an average of three months longer and the grace period seven monthslonger than those of unrelated loans. These facts clearly establish thatrelated loans were given preferential treatment over unrelated ones.
The second point is that the default rate on related loans was 70 percentcompared with only 39 percent for unrelated parties and recovery rateswere 19 to 40 cents per dollar lower for related borrowers than for unre-lated ones (figure 7.8). This clearly undermines the idea that preferentialloans can be justified by higher ex post returns.
Third, related lending represented about 20 percent of all loans out-standing, the limit established by law. Moreover, as the economy slippedinto recession, the fraction of related lending doubled for banks that sub-sequently went bankrupt, while it increased only slightly for the banks thatsurvived. This suggests that when bankers thought they might lose their in-vestment, they stepped up the rate of looting to extract as much value aspossible while they still controlled the bank, and it is consistent with whata theoretical model of looting would predict.
Finally, and most interestingly, the worst-performing loans were thosemade to persons or companies closest to the controllers of the banks. Inmost cases, a dollar lent to a firm owned by the bank’s owners turned outto be a dollar lost.
The evidence provided here clearly shows that related lending had anegative effect on the banking sector in Mexico. Loans to related partieswere granted not because compliance was easier to supervise or becauserelated parties were more suitable candidates. Instead, there is clear evi-dence that related loans were used to divert funds away from banks andto exploit minority shareholders. Even so, bank owners emerged from thecrisis relatively unscathed; after “tunneling” money out of their bank, theylost control of the bank but not of their industrial assets.
386 CHONG AND LÓPEZ-DE-SILANES

Figure 7.7 Terms of Related and Unrelated Loans
*** Significant at the 1 percent level.Note: This table shows the main characteristics of related and unrelated
loans in Mexico for a random sample of loans between 1995 and 1999. Panel ashows the mean change in real interest rates for the sample of related versusunrelated loans. Panel b shows the mean difference of the percentage of loanswith collateral; percentage points difference in the collateral to value of the loanratio; and the difference in the percentage of loans backed up with personalguarantees. Panel c shows the mean difference in months to maturity of the loanand the difference in months of grace granted to the loans. For a description ofthe sample and definitions of all variables, refer to the appendix.
Source: La Porta, López-de-Silanes, and Zamarripa 2003.
a. Real interest rates
0.0225***
0.0688***
0.0408***
0.0281***
Flexible rate anddomestic currency
Flexible rate andU.S. dollars
Fixed rate anddomestic currency
Fixed rate andU.S. dollars
b. Collateral and guarantees
0.3108***
1.7072***
0.1860***
Loans with collateral Collateral value / loan Loans with personalguarantees
c. Maturity and grace period
−3.1043***
−7.3768***
Loans with collateral Collateral value / loan

Although related lending explains a significant part of the problem infinancial institutions, it cannot be blamed completely for the currentmalaise of the banking sector. The other aspect of lending is collecting,and banks need to have effective collecting mechanisms in place. Effectivecorporate governance through creditor protection has recently proven tobe a key component of the development of financial systems around theworld. As the next section shows, the problems brought on by relatedlending were exacerbated and in part instigated by deficient shareholderand creditor rights.
Privatization and Corporate Governance
The development and appropriate functioning of stock and credit marketsneed a solid regulatory framework that promotes investor protection anddisclosure. Recent research shows a strong link between firms’ access tocapital and efficiently enforced laws (La Porta and Florencio López-de-Silanes 1999; La Porta and others 1997, 1998, 2000a, 2000b; La Porta,López-de-Silanes, and Shleifer 2002). In countries where large numbers of
388 CHONG AND LÓPEZ-DE-SILANES
Figure 7.8 Default and Recovery Rates: Related and UnrelatedLoans(percentage)
Note: This table covers a random sample of 300 loans during the 1995–99period.
Source: La Porta, López-de-Silanes, and Zamarripa 2003.
69.96
27.20
3938.6946.24
79.20
Default rates Recovery rates of bad loans Overall recovery rates
Related Unrelated

firms have been privatized and deregulation has increased competitionand lowered trade barriers, institutions are urgently needed that canefficiently channel resources to the private sector. The old laws and insti-tutions that might have been efficient in covering the needs of state-ownedenterprises will probably not suffice for the requirements of private enter-prises and privatized firms. This section focuses on the role of shareholderrights and creditor rights as important determinants of the success of stockmarkets and credit institutions.
Modigliani and Miller (1958) argue that the size of capital markets isdetermined only by the cash flows that accrue to investors; roughly speak-ing, this implies that the size of capital markets should be proportional togross national product. To explain the large discrepancies in the size offinancial markets across countries with similar gross national products,however, we need to recognize that securities are more than the cash flowsthey represent. They entitle investors to exercise certain rights and toexercise control over management through the voting process. Similarly,debt not only entitles creditors to receive interest payments, but also toregain their collateral in the event of bankruptcy.
Countries differ enormously in the extent to which they afford legalprotection to investors. Not only does a shareholder in Mexico have a verydifferent set of rights from a shareholder in the United Kingdom or theUnited States, but his/her recourse to redress is also likely to be signifi-cantly different—that is, weaker. The legal theory (La Porta and others1997, 1998) predicts larger capital markets in countries where agencycosts are reined in by the law and the institutions built to support their en-forcement. The evidence presented in these studies shows that, all in all,Mexico offers investors a rather unattractive legal environment.
Figure 7.9 shows market capitalization as a percentage of GDP and thenumber of listed firms in the Mexican stock exchange. Not surprisingly,the Mexican market has a low capitalization by international standards.The stock market enjoyed a significant boom during the Salinas adminis-tration, as many privatized firms were subsequently listed and those thatalready were privatized increased their capitalization considerably. Mar-ket capitalization increased from slightly over 5 percent in 1988 to almost45 percent in only six years. Following the 1994–95 crisis, capitalizationplunged to 25 percent and has dropped further since. Moreover, the num-ber of listed firms itself is declining, which suggests that firms are eithergoing bankrupt or being taken private. In either case, it is a clear sign thatcorporate governance structures are not functioning efficiently.
Some recent attempts have been made to strengthen shareholder rightsin Mexico. Most notably, the 1997 and 2001 securities acts moved froma merit to a disclosure system of regulation. They also established re-quirements for a minimum number of independent directors on boards oflisted companies and mandated the creation of an independent audit com-mittee. A forthcoming securities act attempts to expand protection further
PRIVATIZATION IN MEXICO 389

by making the economic group the subject of regulation, establishing theduty of loyalty and care for directors, improving disclosure requirements,improving the enforcement powers of the Securities and Exchange Com-mission, and establishing a special committee to monitor conflicts ofinterest and related-party transactions. Furthermore, the new securities actseeks to limit the issuing of nonvoting shares and expand the rights ofminority shareholders to obtain information about the firm, conveneshareholder meetings, designate comptrollers, and even challenge unfairactions through the judicial system. Although these reforms are expectedto have a significant effect, their scope is inherently limited as they apply
390 CHONG AND LÓPEZ-DE-SILANES
Figure 7.9 Market Capitalization as Percentage of GDPand Number of Companies Listed in the Mexican StockExchange
Note: This table shows the number of firms listed on the Mexican stockexchange and their market capitalization as a percentage of GDP (grossdomestic product).
Source: For market capitalization/GDP, Standard and Poor’s EmergingMarket Database (and Emerging Stock Markets Factbook); for the number oflisted companies in 1985 and 1988, Banco de México and BMV 1985–92);for the number of listed companies 1990 to 2001, the World Federation ofExchanges.
0
5
10
15
20
25
30
35
40
45
50
1985
1988
1990
1991
1992
1993
1994
1995
1996
1997
1998
1999
2000
2001
Percentage of annual GDP
0
50
100
150
200
250
300
350
400
450Number of listed firms
Listed firms Market capitalization/GDP

only to listed companies. The next step will be to expand some of thesebest practices to a broader set of firms.
Another source of finance for privatized firms and other businesses isbank lending. However, if financing for privatized SOEs is expected tocome from privatized banks—or from any other private credit institution—then creditor rights, embedded in bankruptcy laws and the efficiency ofcourts, must be strengthened and streamlined.
Without proper bankruptcy procedures that allow for the expedient re-covery of assets, financial institutions will be reluctant to lend and mayend up failing to satisfy the financial needs of the private sector. La Portaand others (1997) empirically confirmed the existence of a strong link be-tween efficient creditor rights and an efficient judiciary with deeper debtmarkets. In a more recent paper, Djankov and others (2003) studied thecosts, in both time and money, involved in collecting a bounced check orevicting a tenant in 109 countries. Their results show that Mexico ranksamong the worst countries, which suggests that if there are considerabledifficulties in using the court system for simple procedures, foreclosing ondefaulted loans would be even more maladroit. The lesson is clear: ifbanks are to function appropriately, they must have mechanisms in placeto recover the costs of loans in the case of default. Otherwise, the possi-bility of having a large number of irrecoverable loans default will drive upthe interest rates for all projects, stifling growth and aggravating adverseselection problems.
Two types of reforms may be key to building stronger and sounderfinancial institutions. First, potential conflicts of interest in boards ofdirectors of banks must be reduced. These boards have allowed large-scale, unprofitable related lending to occur, which has increased thefragility of the banks and of the overall financial system. Corporategovernance reform must be designed to prevent interested directorsfrom voting on approving related transactions that do not benefit theinstitution as a whole. Tougher limits on related loans, disclosure ofrelated credits, and laws that effectively punish directors who vote infavor of unprofitable transactions should be among the first group ofreforms. Second, in the event that a borrower defaults on its loans,financial institutions need to be able to exercise their rights to collecttheir debts. An essential condition for improved creditor protection is tostrengthen bankruptcy laws and to increase efficiency in the implemen-tation of these rights.
Conclusion
Empirical evidence shows that the Mexican government was effective inimproving its fiscal discipline, increasing the efficient allocation of re-sources and restructuring inefficient SOEs. Success, however, has not been
PRIVATIZATION IN MEXICO 391

absolute. Although the privatization process was drastic and far-reaching,public utilities and firms in the energy sector remain in state possession.Moreover, there have been important failures in the Mexican privatizationprocess, such as banks and highways.
The Mexican experience provides valuable insights into what to do andwhat not to do regarding large-scale privatization programs. Mexico’sprogram should be considered a success, as the performance of firms in-creased dramatically according to all performance measures and both thegovernment and consumers are better off as a result. Nevertheless, partic-ular care should be taken to provide appropriate regulation to oligopolis-tic sectors or those that have spent considerable time under the control ofthe state.
This study provides three useful lessons that any privatization programshould heed to maximize the probability of success. First, the privatizationprocess must be carefully designed. Special requirements such as a ban onforeign direct investment or cash-only payments lead to substantial pricediscounts for firms sold. Simplicity and transparency, in contrast, increaseprices because they expedite the whole process and increase the number ofbidders. Speed is important because the operational efficiency of SOEstends to atrophy once rumors of divestiture arise. The ability to draw on awide pool of bidders is crucial to maximize the price received for privatizedfirms and therefore to obtain the most social benefit from the program.Privatization of services and infrastructure provides a valuable opportunityto enhance social welfare, but contracts must be carefully designed. Specialattention is needed to ensure that the incentives of future owners arealigned with those of the government.
Second, restructuring firms before privatization is usually counterpro-ductive in raising net sale prices. Restructuring programs are usuallypolitically motivated and cost more than the value they add to companies;this is in addition to the fact that they lengthen the privatization processand therefore increase the costs related to the sale. Although the evidencefrom Mexico shows that labor retrenchment paid off, this is probably dueto the abnormally bloated work force of most Mexican SOEs. Laborretrenchment is fraught with difficulties because the most politicallypalatable option, voluntary retirement programs, is plagued by adverseselection problems. Under these schemes, the most experienced and pro-ductive workers tend to leave and the least productive stay. The govern-ment is thus left with a steep bill from severance payments and biddersare left with a lower-quality work force that may not possess the skillsnecessary to run the firm successfully.
Third, reregulation of sectors with market power, deregulation of in-dustries previously protected by the government, and efficient corporategovernance institutions are important complementary measures to pri-vatization. Mounting evidence is underscoring the importance of good
392 CHONG AND LÓPEZ-DE-SILANES

corporate governance institutions in ensuring positive results from pri-vatization and avoiding debacles similar to the related-lending problemssuffered by the Mexican banking industry. The need for better regulationand corporate governance is not an argument for slower privatization,but it does point to the need for studying similar privatization programsto anticipate the regulatory framework and best practices codes neededfor firms to have a smooth transition into the private sector.
Privatization and deregulation have allowed the Mexican governmentto withdraw from virtually all commercial and industrial activities and toconcentrate on providing a stable economic environment. The proceedsfrom privatization helped deal with a crushing debt burden and allowedthe government to invest in education and poverty alleviation. Theevidence provided in this chapter leaves but one conclusion: The overalleffect of privatization has been positive for Mexico.
Appendix 7A Description of Variables
This appendix describes all variables used to compute the results pre-sented in the chapter. It contains three sections, each based on a differentsection of the chapter. The first section describes the restructuring ac-tions undertaken for a cross section of 221 privatized SOEs in the1983–92 period. We gathered these data from the original privatizationsales and prospectuses from the Mexican Ministry of Finance and PublicCredit (SHCP). The second section corresponds to the quantitative vari-ables collected for a cross section of 170 nonfinancial firms privatized inMexico during the 1983–92 period and used to measure the performanceof privatized firms. We gather the preprivatization data from the originalprivatization sales and prospectuses from SHCP. For each firm, we com-pute the preprivatization value of each variable or ratio by averaging itsvalue in the four years before the privatization of the firm. The postpri-vatization data come from the 1994 economic census from the MexicanNational Statistics Institute (INEGI) and refer to 1993 data for each firm.When necessary, industry adjustments are made to various variables andratios with the use of financial data of publicly traded firms in the Mex-ican stock market, INEGI’s “Monthly Survey of Industry,” and the pro-ducer price index at the sector level. The third section of the table definesthe loan characteristic variables used in our related-lending section. Reg-ulation in 1995 required banks to submit a list of the 300 largest loans,as well as their size and detailed information about the borrowers. Oursources are the SAM-300 database (largest 300 loans for each bank), theSENICREB database (complete list of loans made by each of the priva-tized banks), and banks’ individual databases as reported to the MexicanBanking Commission.
PRIVATIZATION IN MEXICO 393

394 CHONG AND LÓPEZ-DE-SILANES
These actions include changes of the CEO (chiefexecutive officer) and in the next level of themanagement team, as well as the creation of orchanges in the board of directors in the two yearsbefore privatization.
These actions include preprivatization laborreductions of union or nonunion workers with theirrelated severance payment costs, as well as varyingforms of labor contract restructuring, plans forworker ownership of shares, cancellation ofcollective contracts in some subsidiaries or for thewhole company, and union unification under thesame contract.
The actions include the government’s engagement inpartial or total debt absorptions of outsiders’ debt(that was owed to private companies or privatebanks), cross liabilities, and the absorption of thecompany’s past-due fiscal liabilities or taxes.
This category includes all of those detected actions thatincreased the management responsibility, increasedthe flexibility of investment policies, or referred to theinstallation of programs with defined performancetargets and internal restructuring of operations.
These actions involve only detectable programs ofrehabilitation and maintenance plans, agreements offinancial restructuring tied to inflow of resources foroperation improvements, and temporary reopeningsof the plant.
These actions include partial or total shutdown ofoperation, stopping of major investment programs,declarations of emergency-only expenditure takingplace, and stopping of all government funding.
This group involves the solution or clarification of legaldisputes, the reorganization and consolidation of alllegal information and demands against the company,renewal or creation of necessary operation concessionsand permits, and changes in the legal incorporation orin the company’s by-laws. Under this category are alsoconsidered negotiations with other shareholdersregarding either their “preference status” in the caseof sale or their agreement to sell their shares to thenew buyer or to put them in the government’s handsfor privatization of a larger package.
Management
Labor
Debt absorption
Efficiencyprograms
Investmentprograms
Deinvestmentmeasures
Legal measures
Table 7A.1 Definition of Variables
Variable Definition
Restructuring action

PRIVATIZATION IN MEXICO 395
The actions include the government’s engagement,before the sale, in clarification, or sometimesdocumentation, of fixed-assets ownership, especiallyin the cases of broken-up corporations; patentregistrations and changes in assets classificationmechanisms; break-ups or splits of the SOE for itssale; and spin-offs of specific assets.
These measures reflect deregulatory actionsundertaken by the government tied to privatization.The range of actions includes price and quantityderegulations, foreign direct investment andownership restrictions, international trade quotas ortariffs, entry or exit barriers for domestic orinternational competitors, changes in the regulationscheme of the company or the industry, andelimination or reduction of subsidies.
The value of the government’s net privatization price(GNPP) adjusted by the fraction of shares sold plustotal liabilities at the time of privatization, dividedby total assets of the company at the time ofprivatization. GNPP is calculated as follows:
GNPP � B� � P * R � GC � Adj
where (B�) is the present value of the nominal priceof sale as registered in the sale contract that isadjusted in the following ways: subtraction of thecost of the restructuring measures (P*R) undertakenby the government before the sale; subtraction of thecosts of the “government commitments” and the“special clauses” promised by the government at thetime of the sale (GC), matching them with the actualbills paid later on; and addition and subtraction ofthe adjustments made to the sale contract (Adj),which includes reimbursements on both sides whenthe financial statements differ from the ones given tothe bidders before the sale.
The ratio of operating income to sales. Operatingincome is equal to sales minus operating expenses,minus cost of sales and depreciation. Sales are equal tothe total value of products and services sold, nationallyand internationally, minus sales returns and discounts.
(Table continues on the following page.)
Assetsrestructure
Deregulation
Privatization Q
Operatingincome/sales
Table 7A.1 (continued)
Variable Definition
Firm characteristics

396 CHONG AND LÓPEZ-DE-SILANES
The ratio of operating income to property, plant, andequipment. Operating income is equal to salesminus operating expenses, minus cost of sales anddepreciation. PPE is equal to the value of acompany’s fixed assets adjusted for inflation.
The ratio of net income to sales. Net income is equalto operating income minus interest expenses and nettaxes paid, as well as the cost of any extraordinaryitems. Sales are equal to the total value of productsand services sold, nationally and internationally,minus sales returns and discounts.
The ratio of net income to property, plant, andequipment. Net income is equal to operating incomeminus interest expenses and net taxes paid, as well asthe cost of any extraordinary items. PPE is equal tothe value of a company’s fixed assets adjusted forinflation.
The ratio of cost of sales to net sales. Cost of sales isequal to the direct expense involved in theproduction of a good (or provision of a service),including raw material expenditure plus totalcompensation paid to blue-collar workers. Sales areequal to the total value of products and services sold,nationally and internationally, minus sales returnsand discounts.
The log of the ratio of sales to property, plant, andequipment. Sales are equal to the total value ofproducts and services sold, nationally andinternationally, minus sales returns and discounts.PPE is equal to the value of a company’s fixed assetsadjusted for inflation.
The log of the ratio of sales to total number ofemployees. Sales are equal to the total value ofproducts and services sold, nationally andinternationally, minus sales returns and discounts.Employees correspond to the total number ofworkers (paid and unpaid) who depend directly onthe company.
The log of the total number of employees. Employeescorrespond to the total number of workers (paid andunpaid) who depend directly on the company. Theyreceive, in general, either salary or wage paymentson a regular schedule and work at least 15 hours
Operatingincome/PPE
Net income/sales
Net income/PPE
Cost per unit
Log (sales/PPE)
Log (sales/employees)
Log (totalemployment)
Table 7A.1 (continued)
Variable Definitions

PRIVATIZATION IN MEXICO 397
a week. A minimal number of these workers do notreceive a regular salary. This number includes allworkers on strike, as well as workers who still reportto officials of the company despite different worklocations, and workers on sick-leave or vacation. Itdoes not include individuals who are retired orworking on commission.
The log of the total number of white-collar workers.White-collar workers perform skilled labor andadministrative tasks for modest to high salaries. Theyare individuals involved in sales, administration, andmanagement.
The log of the total number of blue-collar workers.Blue-collar workers perform unskilled or semiskilledlabor for modest to low wages. They perform tasksdirectly related to the (mass) production process ormenial services. Typically, they are factory line ormaintenance workers.
The ratio of investment to sales. Investment is equalto the value of expenditure to acquire property,equipment, and other capital assets that producerevenue. Sales are equal to the total value ofproducts and services sold, nationally andinternationally, minus sales returns and discounts.
The ratio of investment to property, plant, andequipment. Investment is equal to the value ofexpenditure to acquire property, equipment, andother capital assets that produce revenue. PPE isequal to the value of a company’s fixed assetsadjusted for inflation.
The log of sales. Sales are equal to the total value ofproducts and services sold, nationally andinternationally, minus sales returns and discounts.
The Paasche price index is the ratio (expressed as apercentage) of the total value in the given year of thequantity of each commodity produced in the givenyear to what would have been the total value ofthese quantities in a base year. To isolate changes inrelative prices, for each firm and for each of thefirm’s line of business, we found an appropriatecontrol group among the 61 sectors that have officialproducer price index statistics and report the
Log (white-collar workers)
Log (blue-collarworkers)
Investment/sales
Investment/PPE
Log (sales)
Index of realprices(Paasche)
Table 7A.1 (continued)
Variable Definitions
(Table continues on the following page.)

398 CHONG AND LÓPEZ-DE-SILANES
postprivatization behavior of the firm-level priceindex relative to its control group.
The ratio of net taxes to sales. Net taxes are equal tocorporate income taxes paid net of direct subsidiesreceived during the fiscal year. Sales are equal to thetotal value of products and services sold, nationallyand internationally, minus sales returns anddiscounts.
For each firm, the index takes a value of 100 for thepreprivatization period. The 1993 value is computedby augmenting the preprivatization value by thedifference between the cumulative growth rate ofemployment of the firm and the cumulative growthrate of employment of the control group in thepostprivatization period relative to the averageemployment in the four years that precededprivatization. Industry control groups are given bythree digit SIC code sectors for all manufacturingfirms, and an index of economywide totalemployment for firms in the mining and the servicesectors. A similar procedure is used for thecalculation of the index of blue-collar workers andthe index of white-collar workers.
For each firm, the index takes the value of 100 for thepreprivatization period. This refers to the realaverage wages paid per worker in each firm. Theconsumer price index was used as a deflator tocalculate real wages. A similar procedure is used forthe calaculation of the index of real wages per blue-collar and per white-collar worker.
For each firm, the index takes the value of 100 for thepreprivatization period. The 1993 value is computedby augmenting the preprivatization value by thedifference between the cumulative growth rate of realwages per worker of the firm and the cumulativegrowth rate of real wages per worker of the controlgroup in the postprivatization period relative to theaverage real wage per worker in the four yearsbefore privatization. Industry control groups aregiven by three-digit SIC code sectors for allmanufacturing firms, and an index of economywidereal wages per worker for firms in the mining andthe service sectors. A similar procedure is used for
Net taxes/sales
Index of totalemployment
Index of realwages perworker
Index ofindustry-adjusted realwages perworker
Table 7A.1 (continued)
Variable Definitions

PRIVATIZATION IN MEXICO 399
the calculation of the index of industry-adjusted realwages per blue-collar worker and the index ofindustry-adjusted real wages per white-collar worker.
The ratio of the total wages paid by the firm to thesales of the firm. Total wages are equal to the totalwage bill paid by the firm to blue- and white-collaremployees. Sales are equal to the total value ofproducts and services sold, nationally andinternationally, minus sales returns and discounts.
The average real interest rate paid during the durationof the loan. The average real interest rate iscomputed as:
where i is the reference interest rate assigned to theloan, s is the spread above the interest rate, and π theinflation rate. For loans in Mexican pesos, theinflation rate was calculated using the producer priceindex (INPP) excluding oil products. For loans inU.S. dollars and other foreign currencies, theinflation rate was calculated using the U.S. producerprice index of finished products.
Variable that takes a value equal to 1 if the loan isbacked by collateral, and 0 otherwise. Definitionsfrom collateral include physical tangible assets,financial documents (such as title documents orsecurities), intangibles, and business proceedspledged by the borrower to ensure repayment onthe loan. Collateral does not include personalguarantees such as obligations backed only by thesignature of the borrower or the submission ofwealth statements from guarantors to the bank—ausual practice in Mexico.
The ratio of collateral value to loan value when theloan was first granted.
Variable that takes a value equal to 1 if the loan issecured by a personal guarantee, and 0 otherwise. Apersonal guarantee is defined as the obligation ofrepayment by a letter of compromise. Usually the
1Ta
T
t�1
(1 � it � s)
(1 � pt),
Totalwages/sales
Real interest rate
Collateral
Collateral value/loan value
Personalguarantees
Table 7A.1 (continued)
Variable Definitions
Loan characteristics
(Table continues on the following page.)

Notes
The authors thank Patricio Amador and José Caballero for excellent research as-sistance. The authors would also like to thank Guillermo Babatz, José AntonioGonzález, and Abraham Zamora from Secretaría de Hacienda y Crédito Público(SHCP) and Rodolfo Salgado, Alonso Martínez, and Linda del Barrio from Secre-taría de Comunicaciones y Transportes (SCT) for facilitating access to part of thedata.
1. For example, the National Commission of Irrigation and the NationalCommission of Highways and Roads were in charge of providing investments torural areas and of encouraging trade by improving the infrastructure of Mexico.
2. Among the most important firms and funding institutions created duringthis period are the National Commission of Electricity, the National RailwayCompany, the Exporting and Importing Mexican Company (CEIMSA), theNational Bank of Agricultural Credit, and the National Bank of Ejido Credit.
3. The Ministry of Finance and the Ministry of National Goods and Admin-istrative Inspection were the two entities with overseeing powers established by the1947 Law for the Federal Government’s Control of Decentralized Institutions andEnterprises of State Participation.
4. According to Aspe (1993), even this number does not capture the truemagnitude of the drain on the government from the SOE sector. If we include thebanking sector operations that led to the nationalization of commercial banking inSeptember 1982, the corrected figure would increase to a staggering 18.5 percentof GDP.
400 CHONG AND LÓPEZ-DE-SILANES
debtor must submit wealth statements from aguarantor who is willing to back his/her loan.
The number of months to maturity of the loan,starting the moment the loan was granted.
The number of months beyond maturity given to adebtor to repay the balance due. A grace period isgranted to a debtor on an individual basis. A loanmay have no grace period at all, but, if granted, thegrace period may vary according to the loan typeand terms established in the loan contract.
Variable that takes a value equal to 1 if the loan isdenominated in Mexican pesos or in Mexicaninflation-adjusted currency units (UDIs or Unidad deInversión), and 0 otherwise.
Variable that takes a value equal to 1 if the loan paysa fixed interest rate, and 0 otherwise. A fixed interestrate loan pays an annual percentage rate on a fixedrate for the duration of the loan.
Maturity
Grace period
Loan indomesticcurrency
Loan with fixedinterest rate
Table 7A.1 (continued)
Variable Definitions
Source: Authors’ calculations.

5. We group our observations in three periods, and for each, the privatizationstrategy often involved splitting companies into smaller units or making multifirmconglomerates For instance, Ferrocarriles Nacionales was split into 8 railroads,whereas 35 local airports were sold in packages of about 10 each.
6. For example, in 2001 the government expropriated several sugar mills forquestionable public interest reasons. In addition, between 2001 and 2003 thegovernment created the following enterprises: Consejo Nacional para Prevenir laDiscriminacion (National Council to Prevent Discrimination); Servicio de Ad-ministracion y Enajenacion de Bienes (Service of Administration and Alienationof Goods); Consejo Nacional de la Cultura Física y el Deporte (National Coun-cil of Physical Culture and Sport); and Instituto Nacional de Lenguas Indígenas(National Institute of Indigenous Languages).
7. For a detailed description of the auction process followed for SOE divesti-tures, see López-de-Silanes (1994, 1997).
8. The clearest case is Telmex (the telephone communications monopoly),where the government originally kept 31 percent of shares and now owns only 4.75percent. The other five cases include three banks (Bancomer, Banca Serfín, andBanco International) and two companies in transportation (Cia. Mexicana deAviación and Transportación Marítima Mexicana).
9. We use industry-matched producer price indexes (PPI) to adjust all productprices and the aggregate consumer price index (CPI) to adjust the values of all othernominal values. The choice of deflator is not irrelevant since the CPI series showshigher inflation than the PPI series over the sample period. Therefore, the use of theCPI index imparts a conservative bias against finding significant increases in sales,earnings, fixed assets, wages, and taxes in the postprivatization period.
10. Even though these figures seem large, they probably underestimate the truelevel of labor retrenchment experienced by privatized firms. In fact, looking at thesubsample of firms for which we have complete employment data for all fourpreprivatization years (117), we find that the mean (median) number of workersfalls 16.5 (4.2) percent between t-4 and t-1 and a further 62.4 (64.7) percentbetween t-1 and 1993, where t is the year of privatization.
11. It is possible that this increase in output overestimates the true impact ofprivatization as some of the observed gains may simply reflect redistribution awayfrom customers. Some SOEs priced their output below market levels or failed tocharge for goods and services produced because of corruption, political meddling,or sheer incompetence. Although there is no way to directly quantify the impor-tance of these factors in our sample, available evidence regarding the evolution ofprices for the products of privatized firms suggests this is not the driving forcebehind increased sales.
12. Specifically, we define Sales1993 and Cost1993, respectively, as sales and op-erating costs in the postprivatization period and π as the increase in real prices, andcompute the following measure for the contribution of price increases to higherprofitability:
Price Contribution � [(Sales1993�Cost1993)/Sales1993]�{[(Sales1993/1��)�Cost1993]/[Sales1993/1��]}
13. We can calculate the macroeconomic contribution to the growth in sales bymeasuring the difference in raw and industry-adjusted indicators (0.1164 and0.1925, respectively) as a proportion of the raw increase (0.5428 and 0.6816,respectively).
14. Under the first classification, firms are considered competitive if they are inan industry with more than 10 firms and as noncompetitive otherwise. Under thesecond classification, firms are considered competitive if they have less than 10 per-cent of market share and as noncompetitive otherwise.
PRIVATIZATION IN MEXICO 401

15. To confirm the robustness of our interpretations, we carried out a poll todetermine the principal perceived reasons for increased wages. The essentialelement of the respondents’ explanation was that SOE jobs were desirable notbecause they paid well, but because they required little effort. After privatization,employers quickly moved to dismiss workers who did not increase their produc-tivity and hired new workers from a different pool than those who were hiredunder state management. Firms retained the most productive workers and offeredthem conditions similar to both those prevailing in the private sector and thoseoffered to new hires. We therefore believe that higher wages are explained byimprovements in worker productivity.
16. Based on data from SHCP 1982–2003a, 1982–2003b.17. For the calculation of GNNP, see the definition of privatization Q in the
appendix.18. As a robustness check, an additional standardization was calculated in the
same fashion but using total shareholders’ equity (defined as the sum of total assetsand total liabilities at the time of privatization) to normalize the privatization Q.The results obtained from this estimate are very similar and are thus omitted.
19. An alternative hypothesis is that sectors under control of the state tend tobe those with the greatest untapped capacity for efficiency gains. In this case thepremium is explained because of a higher perceived future growth rate and notbecause of the belief that protective regulations will be maintained.
20. This hypothesis is supported by López-de-Silanes (1997), who finds thatthe discount in privatization Q is explained by “internal speed,” the length of timebetween the moment when the first rumors of privatization arise to the time ofthe public announcement, and not by “public length,” the time elapsed from theformal announcement to the conclusion of the sale.
21. We would expect the government to absorb debt of highly indebted SOEs,to fire workers when firms face serious overemployment, or to invest in new ma-chinery when production processes are outdated. If the endogenous nature of thesemeasures is not considered, we run the risk of reaching the wrong conclusions asregression coefficients would capture not only the effect of the restructuring meas-ure, but also the negative effects of being in distress or having a bloated work force.
22. We apply a two-step instrumental variables approach by estimating anonlinear reduced-form equation that describes the probability that a particularlabor-restructuring policy will be implemented. The instruments used are classi-fied in two groups: firm-level and macroeconomic-level determinants. The firm-level variables include the presence of a leading agent bank, involvement of agovernment ministry before privatization, the political affiliation of unions, andsectoral dummies. The macroeconomic variables include the average GDPgrowth rate, the degree of openness in the three years before privatization, andthe legal origin of the country. None of these variables is statistically significantwhen included in the price equation. The F statistic for the excluded instrumentsis statistically significant at 1 percent in all cases.
23. We also investigated the effects of changing the management team inde-pendently of the CEO and found no significant effect. We can therefore tentativelyconclude that the main benefit stems from changing the head and not the body ofthe management team.
24. Megginson and Netter 2001; Boubakri and Cosset 1998.25. For this section, we consider the period before privatization as the time
elapsed from the beginning of 1989 to the time of privatization of each bank; afterprivatization corresponds to the period from the time banks were privatized untilthe end of 1992, or for the longest period for which we have data. This division bi-ases our findings against finding dramatic improvements in bank performance,which had been increasing since 1986, first because of a partial flotation of bank
402 CHONG AND LÓPEZ-DE-SILANES

shares through the Mexican stock market and, second, because of the deregula-tion measures adopted between 1987 and 1988. For example, although the ratioof financial margin to financial revenue increased almost 6 percentage pointsbetween 1988 and 1994, it increased a further 12 percentage points between 1987and 1989. For a detailed analysis of bank performance during this period, seeLópez-de-Silanes and Zamarripa (1995).
26. The most likely explanation for this increase in personnel expenses despitethe reduction in employment is that wages increased as private financial institu-tions competed for talented employees. This conjecture is reinforced by the factthat the cuts in employment show a higher concentration in unskilled labor.
References
Aspe, Pedro. 1993. Economic Transformation The Mexican Way. Cambridge,Mass: MIT Press.
Banco de México. 1996–99. “The Mexican Economy.” Annual publication of theDirección de Organismos y Acuerdos Internacionales of the Bank of Mexico,Mexico D.F.
Barberis, Nicholas, Maxim Boycko, Andrei Shleifer, and Natalia Tukanova. 1996.“How Does Privatization Work? Evidence from the Russian Shops.” Journal ofPolitical Economy 104: 764–90.
Bayliss, Kate. 2002 “Privatization and Poverty: The Distributional Impact ofUtility Privatization.” Annals of Public and Cooperative Economics 73:603–25.
Biais, Bruno, and Enrico Perotti. 2002. “Machiavellian Privatization.” AmericanEconomic Review 92: 240–58.
BMV (Bolsa Mexicana de Valores). Various issues for 1985 through 1992. Indi-cadores Bursatiles. Mexico City.
Bolton, Patrick, and Gerald Roland. 1992. “Privatization Policies in Central andEastern Europe.” Economic Policy 15: 275–303.
Bortolotti, Bernardo, Marcela Fantini, and Carlo Scarpa. 2001. “Privatisation: Pol-itics, Institutions and Financial Markets.” Emerging Markets Review 2:109–36.
Boubakri, Narjess, and Jean Claude Cosset. 1998. “The Financial and OperatingPerformance of Newly Privatized Firms: Evidence from Developing Countries.”Journal of Finance 53(3): 1081–110.
Campbell-White, Oliver, and Anita Bhatia. 1998. “Privatization in Africa.” Direc-tions in Development series. World Bank, Washington, D.C.
Chong, Alberto, and Florencio López-de-Silanes. 2003. “Privatization and LaborRestructuring Around the World.” Yale University, New Haven, Conn.
Djankov, Simeon, Rafael La Porta, Florencio López-de-Silanes, and AndreiShleifer. 2003. “Courts.” Quarterly Journal of Economics 118: 453–517.
Donaldson, David J., and Dileep M. Wagle. 1995. “Privatization: Principles andPractice.” Lessons of Experience Series, 1. World Bank, International FinanceCorporation, Washington, D.C.
Earle, John, and Scott Gehlbach. 2003. “A Spoonful of Sugar: Privatization andPopular Support for Reform in the Czech Republic.” Economics and Politics 15(1): 1–32.
PRIVATIZATION IN MEXICO 403

Fama, Eugene, and Michael Jensen. 1983. “Separation of Ownership and Control.”Journal of Law and Economics 26 (2) (June): 301–25.
Freeman, Richard. 1986. “Unionism Comes to the Public Sector.” Journal ofEconomic Literature 24 (March): 41.
Galal, Ahmed, Leroy Jones, Pankay Tandon, and Ongo Vogelsang. 1994. WelfareConsequences of Selling Public Enterprises. Oxford, U.K.: Oxford UniversityPress.
La Porta, Rafael, and Florencio López-de-Silanes. 1999. “The Benefits of Privati-zation: Evidence from Mexico.” Quarterly Journal of Economics 4: 1193–242.
La Porta, Rafael, Florencio López-de-Silanes, and Andrei Shleifer. 2002. “Govern-ment Ownership of Banks.” Journal of Finance 57: 265–302.
La Porta, Rafael, Florencio López-de-Silanes, and Guillermo Zamarripa. 2003.“Related Lending.” Quarterly Journal of Economics 118 (1): 231–68.
La Porta, Rafael, Florencio López-de-Silanes, Andrei Shleifer, and Robert Vishny.1997. “Legal Determinants of External Finance.” Journal of Finance 52 (3):1131–50.
———. 1998. “Law and Finance.” Journal of Political Economy 106:1113–55.
———. 2000a. “Agency Problems and Dividend Policies Around the World.”Journal of Finance 55: 1–33.
———. 2000b. “Investor Protection and Corporate Governance.” Journal ofFinancial Economics 58: 1–25.
López-de-Silanes, Florencio. 1994. “A Macro Perspective on Privatization; TheMexican Program.” In S. Levy and L. Svensson, eds., Macroeconomic Aspectsof Privatization. Washington, D.C.: World Bank.
———. 1997. “Determinants of Privatization Prices.” Quarterly Journal ofEconomics 112 (4): 965–1025.
López-de-Silanes, Florencio, and Guillermo Zamarripa. 1995. “De-regulation andPrivatization of Commercial Banking.” Revista de Análisis EconómicoILADES/Georgetown University 10: 113–64.
Maskin, Eric. 1992. “Auctions and Privatization.” In Horst Siebert, ed., Privatiza-tion, pp.115–36. Tübingen, Germany: J. C. B. Mohr Publisher.
Megginson, William, and Jeffry Netter. 2001. “From State to Market: A Survey ofEmpirical Studies on Privatization.” Journal of Economic Literature 39 (2):321–89.
Modigliani, Franco, and Merton Miller. 1958. “The Cost of Capital, CorporationFinance, and the Theory of Investment.” American Economic Review 48 (June):261–97.
Perotti, Enrico. 1995. “Credible Privatization.” American Economic Review 85:847–59.
Presidencia de la República. 1982–2003. “Informe de Gobierno.” Mexico City:Presidencia de la Republica Mexicana, Direccion General de ComunicacionSocial.
Rogozinsky, Jacques, and Ramiro Tovar. 1998. “Private Infrastructure Conces-sions: The 1989–1994 National Highway Program in Mexico.” In High Pricefor Change: Privatization in Mexico. Washington, D.C.: Inter-AmericanDevelopment Bank.
Secretaría de Comunicaciones y Transportes. 2000. El Sector Comunicaciones yTransportes 1994–2000. Mexico City.
404 CHONG AND LÓPEZ-DE-SILANES

SHCP (Secretaria de Hacienda y Crédito Público). 1982–2003a. Cuenta Pública.Mexico City.
———. 1982–2003b. Situación Económica de México. Mexico City.
Shleifer, Andrei, and Lawrence Summers. 1988. “Breach of Trust in HostileTakeovers.” In Alan J. Auerbach, ed., Corporate Takeovers: Causes andConsequences. Chicago: University of Chicago Press. Reprinted in R. Romano,ed., Foundations of Corporate Law, Oxford University Press, 1993.
World Bank. 2003. Private Solutions for Infrastructure in Mexico. Washington,D.C.: World Bank.
PRIVATIZATION IN MEXICO 405


8
Peruvian Privatization: Impacts on Firm Performance
Máximo Torero
SINCE THE EARLY 1980S, COUNTRIES AROUND the world have embarked on ma-jor privatization programs. Yet many remain reluctant to privatize, while stillmore have had to halt ongoing processes of privatization. This is particularlytrue in developing countries, where state-owned enterprises (SOEs) still ac-count for more than 10 percent of gross domestic product, 20 percent of in-vestment, and about 5 percent of formal employment (Kikeri, Nellis, andShirley 1994). The aversion to privatization appears to be associated withpublic distrust of the privatization process. Unions and other traditional op-ponents of privatization have argued that it results in layoffs and poorer serv-ices. Political leaders, meanwhile, fear that the higher profitability of privatecompanies comes at the expense of the rest of society, especially during thedifficult transition period from state ownership to private ownership.
The transfer from the public to the private sector (Vickers and Yarrow1988) necessarily implies a change in the relationships between those respon-sible for the firm’s decisions and the beneficiaries of the profit flows (the so-cial view and the agency view). In theory, the transfer of property rights leadsto a different structure of management incentives, causing changes in mana-gerial behavior, company performance, and quality of service in terms of ac-cess and use. To prove these theories, however, empirical work is crucial.
Yet little empirical knowledge is available about how well privatizationhas worked. There are difficult methodological problems as well as specialproblems with data availability and consistency. Furthermore, the possibilityof bias in the sample selection can arise from several sources, including a gov-ernment’s desire to sugarcoat the process by privatizing the healthiest firmsfirst. Megginson and Netter (2001) carried out a detailed review of 22 stud-ies on privatization in nontransitional economies and concluded that Galaland others (1994), La Porta and López-de-Silanes (1999), and the studies
407

summarized in D’Souza and Megginson (1999) are the most solid and per-suasive supporting the proposition that privatization improves the operatingand financial performance of firms. The author of this chapter considers LaPorta and López-de-Silanes (1999) the finest study of an individual country,since it examines nearly the entire universe of Mexican privatizations.
These studies, especially La Porta and López-de-Silanes (1999), investigatewhether companies increase profits after privatization and whether privati-zation inflicts significant social losses, and, if so, through which channels.They conclude that the improved performance of privatized firms is the re-sult of significant restructuring efforts, not of market power exploitation normassive layoffs and lower wages. In other words, firms undergo a harsh re-structuring process following privatization and do not simply mark up pricesand lower wages, as many economists have predicted. Deregulation, particu-larly the removal of price or quantity controls and trade protections, is asso-ciated with faster convergence to industry benchmarks. The authors suggestthat the sale profits and increased tax revenues the government receives fromprivatizations are probably enough to offset the cost of job losses to society.
According to these studies, newly privatized firms cut employment,usually reducing the roll of white- and blue-collar workers by nearly half.These numbers may actually underestimate the effects of privatization,since in the preceding years most companies have already trimmed pay-rolls to prepare for divestiture. These findings suggest that transfers fromworkers to shareholders play a role in the success of privatization. Evenso, productivity gains resulted in large real wage increases of 114 percentin the postprivatization period.
La Porta and López-de-Silanes showed, for example, that privatized firmsincreased sales 54.3 percent, despite work force reductions and only modestincreases in capital. Surprisingly, prices rose only 2.9 percent relative to theproducer price index. La Porta and López-de-Silanes also decomposed re-ported increases in profitability. Approximately 10 percent of the gain inprofits was attributable to higher prices and 33 percent to worker layoffs,while productivity gains accounted for the remaining 57 percent. Some of thesocial effects of higher prices and layoffs were offset by corporate taxes,which absorbed slightly more than half of the gains in operating income.
In this study, the author follows an approach similar to that of La Portaand López-de-Silanes (1999) by collecting information on nearly the entirepopulation of privatized firms in Peru to evaluate the impact of privatiza-tion there. The author then compares the performance of those firms withthe remaining SOEs and, when possible, with industry-matched privatefirms. Through this method, the impact of privatization on profitabilityratios, operating efficiency ratios, labor indicators, and capital-deepeningindicators is analyzed. Even though the ultimate effect of changes in man-agement incentives depends on the competitive and regulatory environmentin which a given firm operates, it is argued that the degree of market com-petition and the effectiveness of regulatory policy have more important
408 TORERO

effects on performance than does change of ownership (Vickers andYarrow 1988). This is extremely important in the case of the Peruvian pri-vatization process because it was accompanied by large-scale sectoralreforms in which competitive structures and independent regulatory agen-cies were established to monitor and promote competition in each sector.Therefore, variables needed to identify the roles played by the regulatoryagencies and the competitive forces that determine firm performance (exis-tence of a regulatory framework, autonomy of the regulatory agency, andso forth) are taken into account in the analysis.
Peru’s privatization experience was rated one of the early success sto-ries in Latin America. The privatization process, begun by then-presidentAlberto Fujimori, was launched as part of a rigorous process of stabiliza-tion and structural reform initiated in response to a crisis in the Peruvianeconomy. At the time, inflation had reached an annualized rate of 36,000percent, and per capita income had dropped to its lowest level in 30 years.Although privatization was not part of the initial set of reforms, it soonbecame a central plank of the overall reform program.
By 2001 the privatization process had involved 252 transactions, in-cluding 42 SOEs; had brought $9.2 billion in revenue (including capital-ization) to the national treasury; and had mobilized an additional $11.4billion in new investments.1 Nevertheless, Peru’s considerable success in at-tracting private participation and capital was focused on a few sectors suchas telecommunications, electricity, banking, hydrocarbons, and mining.Unlike some countries, such as Argentina and Bolivia, there has been vir-tually no private participation in the transportation, water, or sanitationsectors. Furthermore, as is the case in other countries, public support forprivatization has been declining steadily—from 65 percent in May 1992 toless than 25 percent by 2000. This decline has brought the privatizationprocess nearly to a halt. This report, written during a period of antipriva-tization sentiment, is of special importance because it aims to analyze em-pirically the impact on performance of privatized SOEs.
This study reviews the privatization process and its principal results. Itthen summarizes the empirical methodology followed by the author, de-tails the database developed, and presents the results of the calculations ofthe differences in pre- and postprivatization performance, difference-in-difference comparisons for which control groups were developed, and apanel data regression analysis of the static and dynamic performance ofprivatized firms relative to SOEs.
The Privatization Process
At the beginning of 1990, Peru faced its worst macroeconomic situationever.2 The country had never experienced such large and prolonged periodsof inflation and recession. The economic model implemented in response
PERUVIAN PRIVATIZATION: IMPACTS ON FIRM PERFORMANCE 409

to the crisis assigned the state a central role in economic policymaking. Thepolicies adopted by the government were not up to the challenge at hand:public expenditure and public internal credit rose impressively, price con-trols and subsidies were established, tariffs on public services were fixed,and exchange rate controls were set. These policies translated into a per-sistent fiscal imbalance, a considerable drop in tax revenues and a strikingdecline in financial intermediation.3
The macroeconomic crisis was hardest on Peru’s poorest citizens,around 43 percent of the 1990 population. The situation worsened as pub-lic services, such as education and health, deteriorated. In addition, by theend of the 1980s, informal economic activity, delinquency, drug traffick-ing, and terrorism had all increased. In 1990 Peru reached record under-employment (86.4 percent), while unemployment was around 8.3 percent,and formal employment barely reached 5.3 percent.4
In this context, public enterprises were characterized by inefficient pro-vision of goods and services, ambiguous objectives, extensive interventionby politicians, decapitalization of investment resources, and a lack of freshinvestment. Not surprisingly, public firms registered accumulated losses ofmore than $4 billion in 1989–90.5 In an effort to reverse this situation, thePeruvian government decided to design an attractive normative and insti-tutional framework to promote private investment as the main vehicle ofeconomic growth. One of the key aspects of this new framework was aprogram to privatize public-sector companies in 1991.
In February 1991 the privatization process was launched with the enact-ment of Supreme Decree 041, which regulated and restructured the manage-rial activity of the state, even though the state was limited to managing nomore than 23 companies. In November 1991 the government extended moreactive and decisive support for the privatization process by enacting Legisla-tive Decree (LD) 674, also known as the Promotion of Private Investment inState Companies. LD 674 introduced the Commission for the Promotion ofPrivate Investment (COPRI) and the Special Privatization Committees(CEPRIs), as well as private investment promotion schemes, which includedsales of stocks and assets, service provision, concessions, and other items.One of the most important laws enacted was LD 662, or the “Law of For-eign Investment Promotion,” which mandated equal treatment of nationaland foreign capital. This law permitted foreign investment in all economicsectors and its execution through any legal administrative means.
To give more dynamic and political support to the process, PresidentFujimori appointed five state ministers to lead COPRI. These ministerswere in charge of the general management of the privatization process;they had to establish the policies and objectives of the process, appoint theCEPRIs that were responsible for the planning and execution of individ-ual privatizations, and approve the most important decisions.
Diverse reforms were instituted in 1992 to facilitate the privatiza-tion process. The government was authorized to grant the safeguards and
410 TORERO

guarantees necessary to protect foreign acquisitions and investments. For-eign investors were also granted facilities for the payment of taxes and debtsowed by SOEs in the privatization process. In some cases, these commit-ments were suspended until the end of the process.
In 1993 all of these reforms were codified into law with the approval ofthe new Political Constitution. The new constitution included the promotionof free private initiative, the establishment of equality between national andforeign investors, the encouragement of competition and equal treatment forall economic activities, and a guarantee of the possibility of the signing of sta-bility agreements between private investors and the state. In addition, thestate subscribed to many international agreements for the protection of for-eign investment and conflict resolution through international arbiters.
Together with the launching of the privatization program, the govern-ment undertook another set of structural reforms. Through these reforms,the government promoted market-based competition and free interna-tional trade, installed policies to create a more flexible labor market, lib-eralized the financial system, eliminated price controls, and implementedsector reforms for the deregulation of markets. All the reforms carried outwere complementary and necessary to the privatization program. In so do-ing, the government recognized that adequate regulatory and institutionalframeworks and a competitive market, not just ownership, were deter-mining factors in the success of the privatization process.
Peru’s privatization scheme began in earnest between November 1991and February 1992. Its main objective was simple: privatize as many pub-lic companies as quickly as possible. The initial tasks were defining priva-tization methods, prioritizing the public enterprises to be privatized(which depended on their importance and the ease with which they couldbe privatized), and creating the CEPRIs.6 Because of its transparent andcompetitive scheme, the public auction was the most common practiceadopted for privatization.
In the following years, the design of an appropriate juridical-legalframework for the development of private investment continued. One par-ticularly important law provided for the regulation of immigration appli-cations and facilitated the nationalization of foreign citizens who wantedto provide capital and invest in Peru.
The results of the privatization process were outstanding. Beyond thesimple transfer of assets, companies were purchased and significantamounts of investment were committed (see table 8.1 for details). In 1991two public companies were privatized (Sogewiese Leasing and Buenaven-tura Mine). In 1992, under an operational COPRI and various CEPRIs,10 SOEs were privatized, drawing in revenues of $208 million and another$706 million in projected investment. In 1993 the process gathered mo-mentum, with 13 companies privatized for a total of $317 million andprojected investment of $589 million. The next year the government soldits natural monopolies in the telecommunications and electricity sectors,
PERUVIAN PRIVATIZATION: IMPACTS ON FIRM PERFORMANCE 411

412 Table 8.1 Privatization Revenues and Investment, 1991–2001(US$ million)
Transactions
OptionSale of shares rights, small
Year and assets Concessions assets, and others Capitalizations Total Projected investment
1991 2.6 2.6 0.01992 207.5 1.4 208.9 706.01993 316.7 20.7 6.5 343.9 589.31994 2,579.2 4.7 610.8 3,194.7 2,050.01995 1,089.0 6.6 9.1 120.1 1,224.8 70.11996 2,281.8 344.2 2.7 40.0 2,668.7 2,695.01997 447.1 99.0 8.8 126.4 681.3 706.21998 251.6 35.1 5.2 291.9 220.61999 285.8 10.9 3.1 299.8 323.32000 95.1a 209.9a 317.0b 4,480.02001 19.5a 65.4a 261.0b 98.0Total 7,575.9 791.8 41.5 897.3 9,494.6 11,938.5
Note: Sale of shares and assets includes resources obtained through private purchases of public firms; concessions are resources acquired throughconcession contracts with private agents; option rights, small assets, and others are resources obtained through sales of minor assets like machines orequipment from companies; and capitalizations are resources assigned to raise a firm’s equity.
a. The information for these items is incomplete because of unavailability of data, particularly for the year 2001.b. These numbers are gross amounts for annual totals, so they do not equal the sum of the first four columns. Source: PROINVERSION.

PERUVIAN PRIVATIZATION: IMPACTS ON FIRM PERFORMANCE 413
which resulted in $2,579 million in revenues collected and a total amountof $2,050 million of projected investments.
During 1995 and 1996 the privatization process accelerated and deep-ened. Sixty-four companies were privatized, producing revenue of $3.4billion and investment commitments of $2.8 billion. This continued in1997 when 25 more companies were transferred for $447 million and pro-jected investments of $706 million. In 1998 the privatization process madeway for the concessionary process of transportation infrastructure.7
CEPRIs were created to handle the concessions of airports, ports, roadnetworks, and mobile telephone bands, among other facilities.
Between 1991 and 2001, Peru’s privatization and concessionary processesgenerated revenues totaling $9.5 billion (including capitalizations) and in-vestment commitments of approximately $11.45 billion. Figure 8.1 showsthe evolution of the privatization process and the timeline for the transfer ofnearly all of the public enterprises since 1991. Figure 8.2 shows the revenuesand projected investment resulting from privatization outlined by sector.8 Al-together 203 privatization operations were carried out, representing $7.85billion in revenues and $6.4 billion of investment commitments. Concessionsraised $726 million in revenue and $4.60 billion in investment commitments.
Most of the privatization process occurred in the telecommunica-tions, electricity, finance, mining, and hydrocarbons sectors. Figure 8.3shows the percentage privatized in various sectors. Telecommunicationsand finance are already entirely privatized. Those two sectors, alongwith electricity and mining, represent more than 80 percent of privatiza-tion revenues collected by the Peruvian government. Yet, to date, therehas been virtually no private participation in the transportation, water,or sanitation sectors, and there are still sectors, such as agriculture,where much remains under public ownership.
Despite the increase in government revenues and investment commit-ments, public approval of the privatization process has decreased steadily,as shown in figure 8.4. Therefore, to develop a complete picture of the im-pact of privatization on other fundamental areas of the Peruvian economy,the results of previous privatization studies must be complemented by adetailed analysis of the impact on firm performance.
This chapter evaluates the privatization process by analyzing the per-formance of all privatized firms in Peru. The report studies a sample offirms representing 63 percent of the privatized SOEs and 91 percent of thetransactions involved in the privatization process. In addition, this studyanalyzes in detail the three sectors where most of the privatization tookplace: telecommunications, electricity, and financial services.
In the telecommunications sector, the Peruvian government sold bothCompañía Peruana de Teléfonos (CPT) and Empresa Nacional de Tele-comunicaciones (ENTEL). CPT provided basic telecommunicationsservices in the Lima area, and ENTEL provided national and interna-tional long-distance services, as well as local service for the rest of Peru.

Divestiture took place in 1994 after an auction to the highest bidder. Us-ing a first-price sealed bid mechanism, approximately 35 percent of CPTand ENTEL common shares (the minimum required to give the buyercontrol of the merger) were sold to Spain’s Telefónica de España.9 Theresults of the auction were impressive: Telefónica paid a little more than$2 billion, far larger than the second highest bid of $800 million—a bidthat was closer to the base price set by the government. Soon after buy-ing both companies, Telefónica de España merged them and created Tele-fónica del Perú S.A. (TdP). Initially, TdP was granted a five-year nationalmonopoly for the provision of lines, local calls, national long-distance, andinternational long-distance throughout the country.10 Simultaneously, thegovernment created the Supervisory Agency for Private Investment inTelecommunications (OSIPTEL).
414 TORERO
Figure 8.1 Evolution of the Privatization Process, 1991–2000
Note: The bars represent the number of projects completed in one year as apercentage of projects privatized between 1991 and 2000, the amount of salesin one year as a percentage of total sales of shares or assets made between1991 and 2000, and the amount of projected investments in one year as apercentage of total investments made between 1991 and 2000.
a Through June 30.Source: PROINVERSION.
0
5
10
15
20
25
30
35
40
1991 1992 1993 1994 1995 1996 1997 1998 1999 2000a
Number of projects Sales of shares or assets Projected investment
Percent

The privatization of TdP continued over the following years. In 1996,65 percent of the company’s shares were divided between minor share-holders (36.3 percent) and the Peruvian government (28.7 percent). Thelatter decided to sell 26.6 percent of its shares to small individual investors
PERUVIAN PRIVATIZATION: IMPACTS ON FIRM PERFORMANCE 415
Figure 8.2 Privatization Revenues by Sector, 1991–99 (US$ million)
Source: PROINVERSION.
050
01,
000
1,50
02,
000
2,50
03,
000
3,50
04,
000
4,50
05,
000
Other
Agriculture
Tourism
Transport
Fishery
Financing
Industry
Hydrocarbon
Mining
Electricity
Telecommunications
Projected investment Transactions

through a process known as Sistema de Participación Ciudadana (CitizenParticipation System). In total, privatization in the telecommunicationssector raised $3.6 billion in revenues and $1.56 billion in investment com-mitments for the government.
For the electricity sector, the government approved in 1992 the Law ofElectric Concessions (LD 25844), which split power generation from elec-tricity distribution and transmission. Power generation is a market open tocompetition, whereas transmission and distribution are usually considerednatural monopolies. Between 1994 and 1997, the government privatized10 electricity SOEs (5 in distribution and 5 in generation) for a total of$1.43 billion. There was also a significant investment commitment to in-crease the total capacity of the privatized generation companies by 560megawatts (MW). At present, the privatized companies represent 64 per-cent of the total power generation capacity of the national electric systemand 79 percent of the distribution service.
The government also created two regulatory bodies for the electricitysector: the Supervisory Agency for Private Investment in Energy (OSIN-ERG) and the Commission of Energy Tariffs, which was absorbed laterby OSINERG. The privatization process in this sector is not yet concludedbecause one of the major generating enterprises in the south of Peru, Cen-tral Hidroelectrica del Mantaro, and all of the region’s distribution enter-prises are not yet privatized. Even though the privatization is incomplete,
416 TORERO
Figure 8.3 Privatization Process Progress, 1991–2000
Source: PROINVERSION.
0 10 20 30 40 50 60 70 80 90 100
Other
Agriculture
Financing
Industry
Hydrocarbon
Mining
Electricity
Telecommunications
Percent

the electric sector has already become the second largest generator of pri-vatization revenues and investment commitments for the state: $2.3 bil-lion in revenue and $716 million in investment commitments.
Water and sanitation is the only public utility where no privatizationhas occurred, although a concession was given to the Italian companyImpregilo to operate wells and a water treatment plant in the Chillónriver basin to sell water to the Lima water company. Instead of priva-tizing, the government sought to improve the organization and man-agement of the water and sanitation system by decentralizing it. Thisnew reform gave municipalities control over water services. The onlyexception was the most important municipal water service, Empresa deServicio de Agua Potable y Alcantarillado de Lima (SEDAPAL), whichremains a state company. SEDAPAL was the only water-serviceprovider included in the privatization program, but it has yet to be pri-vatized. Despite this, the government has tried to improve SEDAPAL’sservices and coverage. Additionally, in 1992 the government created theSuperintendencia Nacional de Servicios de Saneamiento (SUNASS), theNational Office for Services of Sanitation, as the regulatory body forthis sector. SUNASS is responsible for controlling the quality of the
PERUVIAN PRIVATIZATION: IMPACTS ON FIRM PERFORMANCE 417
Figure 8.4 Public Approval of Privatization, 1991–2000
Note: Values refer to December of the corresponding year.Source: PROINVERSION.
22%
10
20
30
40
50
60
70
1991 1992 1993 1994 1995 1996 1997 1998 1999
Rate of approval of privatization
Percent

service provided, the pricing system, and regulation, as well as intersec-tor coordination, establishment of norms for the execution of invest-ment plans, and supervision of those plans.
With respect to the financial sector, on July 20, 1994, 99.86 percentof the government’s shares in Interbanc were auctioned. The winnerwas a consortium formed by International Financial Holding (GrandCayman) and IFH Peru S.A., with the advice of Banco Osorno and LaUnion (Chile), for $51 million (workers paid $4.83 million of this for atotal of 9.46 percent of the bank’s shares). Interbanc branchesFinanciera Peruana (Interfip), Internacional de Inmuebles, and Empre-sas de Servicios Internacionales (Interserv) were also included in theauction.
And on April 18, 1995, 60 percent of the shares of Banco Continen-tal were awarded to the consortium formed by Banco Bilbao Vizcaya(Spain) and the companies Inversiones Breca, Inversiones San Borja, Ur-banizadora Jardin, and Minsur (all belonging to the Brescia Group ofPeru). In August 1995, in agreement with the share purchase sale con-tract of Banco Continental, 15,325,388 shares belonging to the statewere transferred to Holding Continental S.A for $32 million.11 By July21, 1998, the Peruvian government had managed to sell 19 percent ofBanco Continental’s remaining shares on the international and localmarkets.
Methodology
Following Boubakri and Cosset (1998), the analysis conducted in thischapter tries to determine whether firms improve their performance afterprivatization. Firm performance is measured by profitability, operating ef-ficiency, capital expenditures, output, employment, and leverage. Table8.2, taken from Megginson, Nash, and van Randenborgh (1994), showsdetails on the proxies for these performance measures as well as the pre-dicted relationships.
Based on these performance measures, the empirical approach consistsof two stages. In the first stage, a simple statistical analysis is conducted tostudy the postprivatization changes in firms’ performance. In the secondstage, a regression analysis is performed, controlling most of the differ-ences between firms and variables, other than privatization, that could ex-plain the performance of the firm.
The statistical analysis consists of computing the performance variablesfor each company in the sample for a 15-year period (1986–2000). Thenthe means for each performance variable (Y) for the preprivatization andpostprivatization periods are computed. To avoid any bias resultingfrom a preprivatization restructuring of the firm, all years in which re-structuring took place before the divestiture are excluded.12 After the
418 TORERO

419
Table 8.2 Firm Performance Measures
Performancemeasure Proxies Predicted relationship
Profitability Return on sales (ROS) � net income/sales ROSA � ROSBReturn on assets (ROA) � net income/total assets ROAA � ROABReturn on equity (ROE) � net income/equity ROEA � ROEB
Operating Sales efficiency (SALEFF) � sales/number of employees SALEFFA � SALEFFBEfficiency Net income efficiency (NIEFF) � net income/number of employees NIEFFA � NIEFFBCapital Capital expenditure to sales (CESA) � capital expenditures/sales CESAA � CESABInvestment Capital expenditure to assets (CETA) � capital expenditures/total assets CETAA � CETABOutput Real sales (SAL) � nominal sales/consumer price index SALA � SALBEmployment Total employment (EMPL) � total number of employees EMPLA � EMPLBLeverage Debt to assets (LEV) � total debt/total assets LEVA � LEVB
Long-term debt to equity (LEV2) � long-term debt/equity LEV2A � LEV2BPayout Dividends to sales (DIVSAL) � cash dividends/sales DIVSALA � DIVSALB
Dividends payout (PAYOUT) � cash dividends/net income PAYOUTA � PAYOUTB
Note: This table presents some of the most common firm performance measures found in the literature (see appendix table 8B.1 for variable def-initions). Each type of measure is associated with one or more proxy variables (column 2). For each proxy there is a predicted relationship betweentwo firms (column 3). Firm A (the postprivatization firm) would have a better performance than firm B (the preprivatization firm) if the predictedrelationship stated is satisfied.
Source: Megginson, Nash, and van Randenborgh 1994.
means are calculated, using differences from the sample counterpartof the privatization effect and the performance variables, the following isobtained:
The two-tailed Wilcoxon signed-rank test and the Hotelling test arethen used to test for significant changes in performance variables after pri-vatization. Both tests are based on the assumption that the distributionsare normal. If the sample size is small and the true distribution of differ-ences is far from normal, the stated probability levels may be significantlyin error. Specifically, when looking at each individual firm, the centrallimit theorem cannot be applied since the sample of years for each is small.For that reason, it is necessary to verify the normality of the series. There-fore, the Shapiro-Francia test for normality is used. When the Shapiro-Francia test rejects the null hypothesis of normality, a nonparametric test,the Kolmogorov-Smirnov (K-S) statistic, is used to formally test the equal-ity of the empirical hazards functions of the different pre- and postpriva-tization performance indicators.13
The above methodology is equivalent to considering the simplest pos-sible model for capturing the effect on performance with no regressors; itcan easily be derived so that performance depends only on the date of theprivatization dummy,
Yi,t � � � � Privatizationi,t � ui,t E(ui,t/Privati,t) � 0 (8.1)
Nevertheless, the above result is likely to be biased for two reasons.First, the two groups of years may have different characteristics and thusdifferent performance behavior. Second, the two groups of years may besubject to different shocks. Part of the differences in pre- and postprivati-zation performance patterns may simply be a result of these differences.
An alternative way to solve this problem is to develop a benchmark tocontrol for these different characteristics and shocks. In this sense, a dif-ference-in-difference measure is calculated for each economic sector inwhich privatization is important:
(8.2)
The main caveat of the difference-in-difference measure is the lack ofan appropriate control group with which to compare the difference in per-formance of the privatized firms. It is not possible to use an optimalmatching methodology such as propensity scores, as detailed in Rubin(1974, 1977, 1979), Heckman and Smith (1995), Heckman and others
[Ypost�privyear
� Ypre�privyear
]notpriv. firms
¢2Y � [Ypost�privyear
� Ypre�privyear
]priv. firms �
¢Y � [Ypostprivatization � Ypreprivatization]
420 TORERO
(1996), Heckman, Ichimura, and Todd (1997), and Heckman, Lalonde,and Smith (1999), because in all sectors under analysis, except banking,there are not enough cases to find the appropriate control group. For thisreason, the author tries to reduce this problem by complementing theabove equations with a regression analysis.
The regression analysis added to equations 8.1 and 8.2 incorporatesinto the model regressors that control for observable characteristics at thefirm level. It also includes sectoral and macroeconomic variables. The lat-ter variables try to capture different shocks, thereby isolating the impactof privatization.
The regression analysis consists primarily of an attempt to model eachof the performance measures (P) as a function of the following variables:
Yi,t � f(Xi,t, Ti,, Pi,t, Pi,r, Sj, Rj, Zt)
where Yi,t are the different performance measures previously detailed for firmi in period of time t; Xi,t are firm characteristics; Ti are the characteristics ofthe privatization process of the specific firm; Pi,t is the date in which the firmwas privatized or given in concession; Pi,r is a dummy indicating whether thefirm is privatized or not; Sj are variables at the sector level of the firm; Rj arecharacteristics of the regulatory agency (for details, see Guasch and Spiller1999), and Zt are other controls such as macroeconomic variables.
Additionally, the author explored interaction effects of the privatiza-tion dummy, and carried out panel estimations using differences to dropout all firm-observed and -unobserved time-invariant fixed effects. There-fore, the three econometric specifications regressed are:
Pi,t � �0 � 0Pi,t � 1t � 2Xi,t � 3Sj � 4Ti
� 5Rj � 6Z1 � �i,t (8.3)
Pi,t � �0 � 0Pi,t � �0Pi,r � 1t � 2Xi,t � 3Sj � 4Ti
� 5Rj � 6Z1 � �i,t (8.4)
Pi,t � �0 � 0Pi,t � �0Pi,r � 1t � �1tPi,r � �2Pi,rt � 2Xi,t
� 3Sj � 4Ti � 5Rj � 6Z1 � �i,t (8.5)
Equation 8.3 is the same as equation 8.1 but includes firm, sector, andmacroeconomic variables and, when available, some variables for thecharacteristics of the regulatory agency. Equation 8.4 includes a privati-zation dummy and a control group in the sample to be able to carry out adifference-in-difference estimation as in equation 8.2, but again with thecontrols previously specified. Finally, equation 8.5 includes additional in-teractions of the year-privatized dummy (Pi,t) and the dummy of whetherthe firm is privatized or not (Pi,r), and a time trend to capture trend andconvergence over time of newly privatized firms with firms in the controlgroup (public firms or already private firms).
PERUVIAN PRIVATIZATION: IMPACTS ON FIRM PERFORMANCE 421

Equations 8.3, 8.4, and 8.5 are estimated using simple ordinary leastsquares (OLS) panel data of firms, as detailed below. In addition, it is nec-essary to account for unmeasured industry and industry/year effects. Mak-ing establishment fixed effects allows all firm-observed and -unobservedtime-invariant fixed effects to drop out. However, since these performancemodels could suffer from endogeneity problems, simultaneous determina-tion and reverse causality of the explanatory variables are used, followingwhat is now standard procedure in the literature of instrumental vari-ables.14 Because the privatization process directly affects most of the ex-planatory variables for many of the performance indicators, reversecausality or simultaneous determination is a latent problem. Additionally,the GMM-IV (generalized method of moments instrumental variables) es-timation allows for heteroskedasticity of unknown form.15 In order tohave appropriate instruments, the lags of the instrumentalized variables aswell as the privatization variables are used. Also, a test of overidentifyingrestrictions—Hansen’s J statistic (1982)—is provided to check whetherthe equation is overidentified by an abundance of instruments. If this sta-tistic rejects the null hypothesis, the validity of the model is called intoquestion.16
Although this estimator is restricted to models linear in the parame-ters, it is relatively more efficient than an OLS with instrumental vari-ables, even with correction for heteroskedasticity with the White proce-dure. The efficiency gain is derived from the GMM-IV estimator’s use ofan optimal weighting matrix (rather than the identity weighting matriximplicit in any least squares estimator) to define the appropriate combi-nation of moment conditions.17 In this context, the moment conditionsare the orthogonality conditions of each instrument with the errorprocess. A discussion of the development of the estimator is given inGreene (2000).
The Data
The construction of the database required several sources of statistical in-formation. For the preprivatization period, the primary sources of infor-mation were the White Books (a collection of all information available forfirms to be privatized) and the published histories of the respective firms.This information was complemented by sources such as the fiscal statisti-cal summary of the Central Reserve Bank of Peru, the National Instituteof Statistics and Computing, annual economic surveys, and others (for fur-ther details on data sources, see appendix 8A).
For the postprivatization period, the author collected information fromvarious sources. Again, company histories were an excellent source of in-formation. Data on the characteristics of the firms were complemented by
422 TORERO

statistics from the Supervising Committee of Companies and Securities,annual economic surveys, and monthly financial reports of the Bank andInsurance Superintendent. The author also collected data for sectoral in-dicators from statistics published by the regulatory agencies. To provideenough preprivatization sectoral data, the data collected include infor-mation for the period 1986–2000. The preprivatization data allowed theauthor to control for the period of restructuring that many enterprises ex-perienced before they could be privatized.
One major problem was the merger, absorption, or division of manycompanies or business units during the privatization process. This sort ofrestructuring made it difficult to follow companies as a single unitthrough the privatization process. Two alternative methods were adoptedto resolve the issue. In the first method, the author aggregated prepriva-tization accounting information provided in the White Books; the secondalternative relied on the fact that in most of the privatization agreements,such as the merger of CPT and ENTEL into TdP, the privatized entitieswere required to keep separate accounting books. Thus, the author couldeither aggregate a company’s important data or follow the merged unitover time.
A second problem of data collection was that some privatization strate-gies required that SOEs be divided and each individual unit offered sepa-rately. The registers kept before the privatization processes were based onaggregated data, since all the different business units operated as a singleenterprise. However, from the day of the decision to privatize, the regis-ters were kept separately for each unit and then consolidated into onerecord for the company.
Although the companies were considered single units after the privati-zation process, in some cases there existed a combination of private busi-nesses and SOEs that were only partially privatized. Mixed ownership ina firm’s record complicated the measurement of the impact of privatiza-tion. To control partially for this problem, the author generated a variablebased on the percentage of the firm still owned by the government tomeasure the intensity of the privatization process and added a discretedummy of the period in which the privatization started.
The final problem was that parts of the SOE portfolios had been liqui-dated. Those companies usually represented inefficient units of SOEs thathad not been absorbed by the private system. In these cases, when possi-ble, the unit of the company liquidated was excluded, or it was assumedthat the new private owner decided to shut down that unit for efficiencyreasons.
Between the years 1992 and 2000, 185 transactions took place. Thisprocess included 42 privatized SOEs. However, for several important rea-sons, the sample of companies in this chapter does not include all of theprivatized SOEs:
PERUVIAN PRIVATIZATION: IMPACTS ON FIRM PERFORMANCE 423

• Some state companies were divided horizontally or vertically intosmall units and privatized separately. In most cases, it was possible tojoin all the parts in which the company was divided and to assume thatit remained a single operating unit. In the case of Telefónica del Perú, in-formation from CPT and ENTEL Perú has been added. This was notpossible in other cases due to lack of information about some of the unitsinto which the company was divided.
• Most of the concessions and projects were not included due to thelack of financial information from the preprivatization period.
• Several firms were liquidated or had their operations stopped.• Some firms were absorbed, or another firm acquired some of their
business units.18
• In some cases, information was unavailable.
Despite these limitations, the sample includes 86 percent of the totalvalue of transactions undertaken and 47 percent of the privatized SOEsinvolved in the process. These percentages increase to 91 percent and 63percent, respectively, when liquidated or extinct companies are not con-sidered. Table 8.3 presents the set of nonfinancial SOEs included in thestudy; nonfinancial companies not included in the study are listed intable 8.4.
A separate database was constructed for the financial sector. It consistsof annual data and considers private banks during the period as the con-trol group and the Banco de la Nación as a state-owned enterprise. Theprivatized banks are detailed in table 8.5. The evolution of privatizationin the financial sector is given in appendix table 8C.2.
Appendix table 8B.1 gives a detailed explanation of the variablesconstructed and the manner in which they were calculated. Figure 8.5plots all of the performance indicators for the entire database of priva-tized firms using a nonparametrical approximation (kernel densities)for the distribution of the values of the pre- and postprivatization per-formance indicators.19 A clear increase (larger for the privatized firmsthan for the SOEs) of the performance indicators can be seen since1994, when the process of privatization accelerated. For some indica-tors, such as return on assets, the difference between SOEs and priva-tized firms is not clear. This could occur because privatized firmssignificantly increased their possession of assets, which, in turn, reducesthe impact of an increase in sales. When looking at employment, in-come, sales, and asset efficiency, the positive impact of privatization onthe efficiency of firms is even more apparent, even though the reductionin total number of workers is similar for both SOEs and privatizedfirms.
Furthermore, after analyzing the performance indicators for each in-dividual firm, it becomes apparent that the distributions of privatizedfirms shifted to the right for practically all of the performance indica-
424 TORERO

425
Table 8.3 Nonfinancial Companies Included in the Study
Firm data availability (years)
Under public Under private Name of state-owned enterprise Name of private firm ownership ownership
Electrolima Edelnor 1986–93 1994–99Luz del SurEdegelEde – CañeteEde – Chancay
Electroperú Electroperú 1986–94 1995–99EgenorEgesurCahua
Empresa Eléctrica de Piura Empresa Eléctrica de Piura — 1997–99— Electro Andes — 1997–99Electro Centro Electro Centro 1986–98 1999Electro Noroeste Electro Noroeste 1986–98 1999Electro Norte Electro Norte 1986–98 1999Electro Norte Medio Electro Norte Medio 1986–98 1999Electro Oriente — 1986–99 —Electro Sur — 1986–99 —Electro Sur Este — 1986–99 —Electro Sur Medio Electro Sur Medio 1986–96 1997–99Etevensa Etevensa 1994–95 1996–99Seal — 1986–99 —Cemento Sur Cemento Sur 1986–89, 1994 1996–98
(Table continues on the following page.)

426
Cementos Lima Cementos Lima 1987–93 1994–2000Cementos Norte Pacasmayo Cementos Norte Pacasmayo 1992–93 1994–2000Cemento Yura Yura 1986–90 1994–95Centromín — 1986–90 —Sociedad Minera Cerro Verde Sociedad Minera Cerro Verde 1993 1994–96, 1999–2000Compañía Minera Condestable Compañía Minera Condestable 1987–90 1992–2000Hierro Perú Shougan Hierro Perú 1986–90 1998–99Minero Perú — 1986–90 —Empresa Minera Especial Tintaya — 1986–89 —Empresa de la Sal Empresa de la Sal 1991–94 1995–2000Petroperú Petroperú 1986–91 1992–98Petroperú - Refinería la Pampilla Refinería la Pampilla — 1996–98Química del Pacífico Química del Pacífico 1988–92 1993–2000Certificaciones del Perú Certificaciones del Perú 1991–93 —Reactivos Nacionales Reactivos Nacionales 1987–89, 1991–92 1993–2000Industrias Navales Industrias Navales 1991–92 1993–96Sudamericana de Fibras Sudamericana de Fibras 1991–92 1993–96Siderperú Siderperú 1986–90, 1993–95 1996–97Solgas — 1986–90 —Compañía Peruana de TeléfonosEntel Perú Telefónica 1986–93 1994–2000SEDAPAL — 1986–99 —
— Not applicable.Source: Author’s data.
Table 8.3 (continued)
Firm data availability (years)
Under public Under private Name of state-owned enterprise Name of private firm ownership ownership

427
Table 8.4 Nonfinancial Companies Not Included in the Study
Absorbed by Ceased or liquidated Divided Land privatizations another firm Information not found
Minpeco USA Sociedad Paramonga Proyecto Especial Lar Carbón Petrolera TransoceánicaAeroperú Epsep Chavimochic Sia Refineria CajamarquillaPetromar Tierras del Proyecto Nisa Pesca PerúEcasa Especial Pastogrande Planta de Cemento EnaferFlopesca Tierras del Proyecto Rioja Empresa Minera YauliyacuPesquera Grau Especial Chinecas Petrolube Empresa Radio Fertisa Tierras del Proyecto Enata PanamericanaEpersur Especial Majes-Siguas Empresa Minera Empresa Difusora RadioPlesulsa Tierras del Proyecto Especial Mahr Túnel TeleMetaloroya Jequetepeque-Zaña Empresa Minera PletasaAmfa Tierras Eriazas Paragsha Planta Lechera de IquitosTalleres de Tierras del Proyecto Especial
Moyopampa Chira-PiuraEmpresa Minera
CobrizaCedega TEnatru PerúErtur ArequipaEretruErtsa PunoEntur PerúEmturínKuélapComplejo Pesquero
de SamancoErgusaIncasaErtur
Note: See text for an explanation of why firms were excluded from the study.Source: Author’s data.
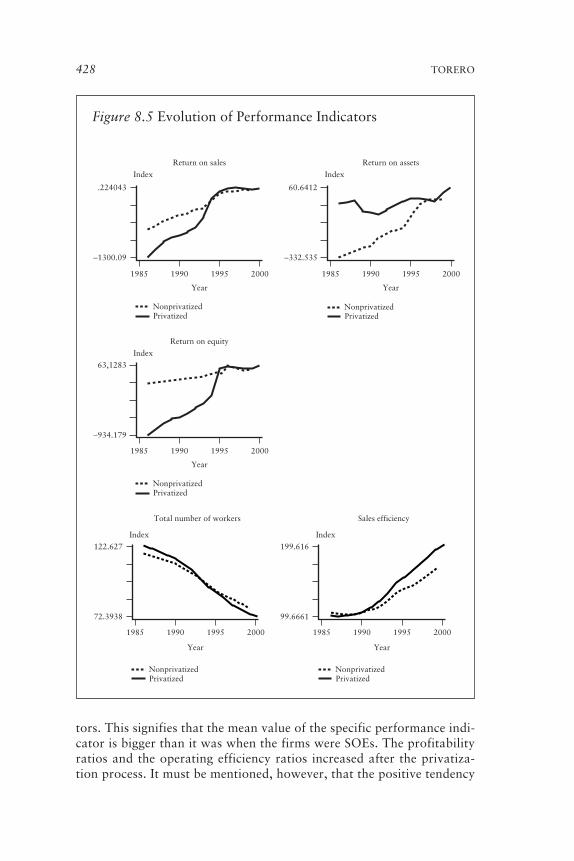
428 TORERO
Figure 8.5 Evolution of Performance Indicators
Index
Return on sales
Year
1985 1990 1995 2000
−1300.09
.224043
NonprivatizedPrivatized
Index
Return on equity
Year
1985 1990 1995 2000
−934.179
63,1283
NonprivatizedPrivatized
Index
Return on assets
Year
1985 1990 1995 2000
−332.535
60.6412
NonprivatizedPrivatized
Index
Total number of workers
Year
1985 1990 1995 2000
72.3938
122.627
NonprivatizedPrivatized
Index
Sales efficiency
Year
1985 1990 1995 2000
99.6661
199.616
NonprivatizedPrivatized
tors. This signifies that the mean value of the specific performance indi-cator is bigger than it was when the firms were SOEs. The profitabilityratios and the operating efficiency ratios increased after the privatiza-tion process. It must be mentioned, however, that the positive tendency

PERUVIAN PRIVATIZATION: IMPACTS ON FIRM PERFORMANCE 429
Note: The individual figures show the trend of performance variablesbetween privatized and nonprivatized companies during 1985–2000 (seeappendix 8B.1 for variable definitions). The group of privatized companiesincludes all the firms that were privatized during the period 1985–2000, whilethe nonprivatized group comprises firms that have remained under publicownership. Values have been estimated using lowess smoothing—KSM (kerneldensities). Banks have been excluded from the estimations.
in profitability ratios emerged a few years before the actual processbegan, since many of the privatized enterprises had to undertake a re-structuring process instituted through the implementation of reforms inall these sectors.
Additionally, it should be noted that the profitability indicators for thebanks under examination showed an important decline a few years after
Figure 8.5 (continued)
Index
Assets to employment
Year
1985 1990 1995 2000
130.759
221.182
NonprivatizedPrivatized
Index
Net income efficiency
Year
1985 1990 1995 2000
−632.605
180.942
NonprivatizedPrivatized
Index
Debt to assets
Year
1985 1990 1995 2000
55.5072
176.941
NonprivatizedPrivatized
Index
Debt to equity
Year
1985 1990 1995 2000
41.6735
5305.84
NonprivatizedPrivatized

430 TORERO
the privatization process. This result can be explained by the severe globalfinancial crisis at the end of the 1990s.
Improvement in the operating efficiency ratios demonstrated not onlya recovery in sales and income of companies across sectors, but also thestrong decline in postprivatization total employment across sectors.These indicators had a positive, but weak, evolution in the years beforethe privatization process, but only after privatization occurred did theirpace accelerate.
The capital-deepening indicator (the ratio of assets to employment)showed a very important increase after the privatization process. In allsectors, this indicator was more or less stagnant before the process oc-curred, but afterward, it started rising very rapidly. Furthermore, lever-age indicators, which had a very negative and unstable tendency beforeprivatization, began to improve, although not immediately. In all sectorsthe negative tendency was reversed after the privatization process began,but many sectors faced a relapse during the global financial crisis. Themeans and variances for these ratios during the period of analysis, as wellas for the values of the most important indicators for all sectors, can befound in appendix 8D.
Even though businesses in the sanitation sector (specifically SEDA-PAL) have not been privatized, they are included in this project as a con-trol group for the privatized firms in the utilities sector. SEDAPAL is usedas a control group because it is a utility, like telephones or electricity, andbecause it had a similar evolution in performance indicators for thepreprivatization period. That occurred because the government initiallyprepared SEDAPAL for privatization. This similarity presents an oppor-tunity to compare an “untreated group” (a firm that was prepared for pri-vatization but then not privatized) with a “treated group” (TdP). In thecase of electricity, as detailed in appendix table 8C.1, state-owned firmsstill exist. Thus, there are enough controls to evaluate the impact of pri-vatization in the utilities sector under the difference-in-differencemethodology.
Table 8.5 Privatized Banks Included in the Study
Number of yearly observations
Bank Privatization date Preprivatization Postprivatization
Continental April 1995 9 6Interbank July 1994 8 7Comercio June 1992 6 9Popular November 1993 6 —
— Not applicable.Source: Author’s data.

Empirical Results
In this section, the methodologies outlined earlier are used to analyze theimpact of the privatization process on firm performance. First, a detailedanalysis of performance indicators is carried out for all the privatized firmsin the sample; then the three major privatized sectors are analyzed:telecommunications, electricity, and the financial sector.
Each of the tables consists of two tests comparing pre- and postpri-vatization. The first test is a first-difference analysis using firm and yearfixed effects to analyze the difference between pre- and postprivatiza-tion information for all firms under study. The second test is a differ-ence-in-difference test, as detailed in the methodological section. Thedifference-in-difference statistic both tests for the change in firm per-formance compared with the privatization period and takes into ac-count relative firm performance when compared with a control groupof SOEs that did not undergo the privatization process. In the all-firmpanel, the control groups are all the SOEs present for every year forwhich information was collected. The gross national product per capitafor each sector is also included to control for the size of the sector towhich the specific firms belong.
When analyzing the two principal sectors where privatization tookplace, the control firms were those identified as most similar to the onesunder analysis. In the case of telecommunications, the control group isSEDAPAL, the main firm in the water and sanitation sector. This firm wasnot privatized but underwent a preprivatization reform process similar tothat of the telecommunications firm.20 For the electricity sector, the con-trol group is a group of nonprivatized electric companies (Electro Oriente,Electro Sur, Electro Sur Este, and Electro Sur Medio). Finally, for the caseof the two privatized banks, Banco Continental and Interbanc, two differ-ent control groups were used. The first group consisted of all private banksin operation between 1986 and 2000; the comparison was between priva-tized banks and private banks. The second control was the state-ownedbank, Banco de la Nación.
Since there were enough private banks to develop the control group, apropensity score, in which the probability of belonging to the treatedgroup, given observable characteristics (interbank funds, assets, total lia-bilities, and equity),21 was used as a summary of those characteristics inorder to measure the average treatment effect on the treated variables incomparison with the performance variables.
Finally, a regression analysis and the estimation of equation 8.5 werecarried out to find a possible convergence of performance indicators. Theregression analysis also allowed controlling for different variables men-tioned in the literature that could explain the impact of the privatizationof the SOEs. In addition to characteristics of the firm such as size, sector,
PERUVIAN PRIVATIZATION: IMPACTS ON FIRM PERFORMANCE 431

432 TORERO
gross domestic product, and assets over employment, controls that helpedmeasure the size of market failure were included.
As noted above, and as mentioned by Megginson and Netter (2001),welfare theory argues that privatization tends to have the greatest positiveimpact in cases where the role of the government in minimizing marketfailure is the weakest, that is, for SOEs in competitive markets or marketsthat can readily become competitive. In contrast, Shleifer (1998) and oth-ers have argued that both in natural monopolies and in the markets forpublic goods, where competitive considerations are weaker, government-owned firms are rarely the appropriate solution.
Consistent with this literature, the regression analysis includes a set ofvariables that control for the degree of competition approximated byconcentration indexes, as well as variables that measure the type of reg-ulatory processes that accompanied the privatization process. In addi-tion, and of utmost importance, the inclusion of such variables allowsfor the separation of the effects of market power from those of privati-zation. It is possible that some companies may have had market powerbefore their sale but did not exploit it because they were under state con-trol. If this is the case, then part of the improvement in firm performancecould be a result of exploitation of consumers through market powerand not a consequence of efficiency and incentive improvements result-ing from privatization.
Results for All Privatized Firms
Table 8.6 presents the results for all of the privatized firms in the sample.In the table, first and second differences in performance changes are pre-sented using both the mean and the median. The second differences arepresented using as a control group all the firms not privatized in the re-spective periods of analysis. In all performance indicators and as men-tioned in the methodological section, a simple regression was carried out(equation 8.1) in which fixed effects were included at the level of the firm(figure 8.5 plots each of the indicators). Additionally, a test for normalitywas carried out as well as the Kolmogorov-Smirnov nonparametric test todetermine if the difference in the distribution of the performance indica-tors was significant. In all the performance indicators, with the exceptionof leverage and assets to employee, the test showed significant differences.
Even accounting for the wide range of firms included in the study, theperformance indicators show a significant improvement after privatiza-tion. Specifically, when analyzing three basic indicators, sales, cost perunit, and labor, the results obtained are as expected: privatized firms sig-nificantly increase their sales compared with nonprivatized SOEs. At thesame time, there is a statistically significant reduction in cost per unit, anddirect employment falls significantly, in line with the restructuring processthat the privatized firms went through.

PERUVIAN PRIVATIZATION: IMPACTS ON FIRM PERFORMANCE 433
Table 8.6 Changes in Performance for the Privatized Firms
Difference in First difference difference
Mean before Mean after t-statistica t-statistica
Variable Median before Median after t-statisticb t-statisticb
ProfitabilityOperating income/ 0.053 0.187 2.70 2.700
sales 0.083 0.207 5.57 4.850Net income/sales �0.293 0.028 2.41 2.410
�0.128 0.074 0.30 0.300Net income/PPE �0.062 0.010 1.41 1.410
�0.027 0.042 1.56 1.090Operating efficiencyCost per unit 0.947 0.813 �2.70 �2.700
0.917 0.793 �2.81 �2.980Sales/employeec 110.317 242.909 11.91 11.910
105.089 249.802 2.12 1.970Log(sales/ 5.336 5.770 10.85 10.850
employees) 5.377 5.789 3.35 2.550Sales/PPE 1.215 1.007 �1.43 �1.430
1.167 0.936 0.25 �0.260Log(sales/PPE) �0.443 �0.321 1.98 1.980
�0.377 �0.323 0.14 0.240OutputLog(sales) 6.590 11.636 8.47 8.470
7.596 11.674 1.25 0.350LaborEmployeec 114.621 68.621 �13.93 �13.930
116.612 67.377 �4.88 �2.740Log(employee) 6.145 5.635 �14.65 �14.650
6.183 5.622 �0.28 �5.740AssetsLog(PPE) 11.641 11.722 0.73 0.730
11.594 11.768 1.22 0.490
Note: PPE � property, plant, and equipment. See text for an explanation of theempirical results; see appendix table 8B.1 for variable definitions. Pre- and postprivati-zation categories are defined according to the privatization date for each company.Second differences (last column) calculated from a panel regression are presented usingas a control group all the firms not privatized in the period of analysis.
a. Corresponds to the test of significance of an ordinary least squares regressionwith fixed effects.
b. Corresponds to the test of significance of an LMS (Lagrange multiplier statistic)regression with fixed effects.
c. Index (year 1993 � 100).Source: Author’s calculations.

Moreover, the profitability indicators and all the operating efficiencyindicators show significant improvement for both the privatized firmsand in comparison with the nonprivatized firms. The ratio of net incometo assets (property, plant, and equipment, or PPE) shows no significantdifference between the pre- and postprivatization periods. This result wasexpected because both the denominator and the numerator increase withthe privatization given the high levels of investments made by new com-panies to increase efficiency.
Results for Public Utilities Sector. A detailed analysis of the two majorprivatized sectors (public utilities and finance) is carried out for thefirms included in the panel and the different time periods over whichthey were privatized. As previously mentioned, these two sectors repre-sent about 80 percent of the total revenue collected by the privatizationprocess.
The results of estimating equation 8.5 for public utilities (electricity,telephones, and water as a control) are shown in table 8.7. As expected,the results are consistent with the literature: privatized firms are moreprofitable and productive than are public firms (Boardman and Vining1989; Vining and Boardman 1992; La Porta and López-de-Silanes1999). The results of the privatization date dummy are significant onlyfor the debt indicators. At the same time, the time trend is positive andsignificant, which means that over time all the performance measuresimproved. This finding, together with the insignificant dummy that cap-tures the date of privatization, suggests that the performance indicatorsstarted to improve before the privatization process and that only thedebt indicators improved significantly faster after the privatizationprocess.
When examining the dummy that captures a firm’s privatization sta-tus, through a treatment on the treated type of analysis (similar to thesecond difference) in the return on sales, debt indicators, sales efficiency,and the ratio of assets to employment, the privatized utilities show a sig-nificant improvement compared with SEDAPAL, which is used as a con-trol group. However, the variable of time trend times the privatized firmdummy is significant and negative, meaning that over time, the priva-tized firms are converging to the lower performance of SEDAPAL. Thisfinding is very important because it sheds light on the decline in recentyears in the financial performance of both the telephone company andthe electric utilities, which could be a consequence of increased marketcompetition.
At the same time, the coefficient on the percent of government par-ticipation has a negative and significant sign for two of the three prof-itability indicators (return on assets and return on sales), although itshows a positive and significant sign in sales efficiency and ratio of as-sets to employment. These results sharply contradict expectations. In
434 TORERO

435
Table 8.7 Performance Indicators of Privatized Utilities, Difference in Difference(Generalized method of moments instrumental variables estimator)
NetDebt to Debt to Sales income Assets/
Variable ROS ROA ROE assets equity efficiency efficiency employment
Dummy for date of �0.5355 0.0788 �0.0263 �0.5594 �1.9622 �3.9619 20.346 4,453.08privatization (fpriv) (0.8867) (0.1070) (0.1706) (0.2133)*** (0.6373)** (324.041) (186.8696) (4209.4528)
Dummy if firm is 1.3155 0.0114 �0.008 0.4892 1.4444 233.929 40.0353 5,574.28privatized (epriv) (0.4665)*** (0.0242) (0.0425) (0.0549)*** (0.2800)*** (47.0005)*** (32.4350) (1,771.816)***
Time trend (t) 0.1517 0.0113 0.0176 0.0097 0.0162 34.3105 11.3793 35.6078(0.0292)*** (0.0038)*** (0.0063)*** (0.0046)** (0.0130) (4.6841)*** (2.7264)*** (84.3298)
t * fpriv 0.1455 �0.0026 0.0077 0.0502 0.1705 53.5472 13.581 192.7965(0.0885) (0.0074) (0.0123) (0.0174)*** (0.0525)*** (28.5794) (15.1040) (372.0849)
t * epriv �0.1305 �0.0067 �0.0093 �0.0345 �0.1115 �26.3847 �6.3136 �443.6183(0.0425)*** (0.0032)** (0.0061) (0.0071)*** (0.0306)*** (5.0188)*** (3.3763) (148.8121)***
Concentration index �0.004 0.0002 0.0003 0.0000 �0.0017 1.1352 0.1334 �15.8996(0.0025) (0.0003) (0.0006) (0.0006) (0.0025) (1.0208) (0.4399) (14.9523)
Percent change of 0.0484 0.0012 0.0015 0.0013 0.0033 20.0098 4.6774 �72.6033GDP per capita (0.0141)*** (0.0018) (0.0030) (0.0022) (0.0101) (2.0111) (1.9953)** (66.4124)
Percent government 1.1136 20.0448 �0.0635 0.1108 0.1387 513.6258 104.3681 6,369.42participation (0.7313) (0.0184)** (0.0310)** (0.0603) (0.1850) (122.735)*** (78.5154) (1,345.163)***
(Table continues on the following page.)

436
Table 8.7 (continued)
NetDebt to Debt to Sales income Assets/
Variable ROS ROA ROE assets equity efficiency efficiency employment
Dummy regulation �0.4064 0.0602 0.1393 0.1374 0.3629 �66.4621 �58.5637 �626.2109by price cap (0.2648) (0.0352) (0.0569)** (0.0622)** (0.1887) (77.8893) (36.9691) (1017.4182)
Dummy regulation 0.0522 �0.0177 �0.0137 �0.0415 0.0214 222.233 22.2343 21,485.57based on costs (0.3372) (0.0303) (0.0530) (0.0469) (0.2030) (56.4033)*** (39.7200) (1524.1113)
Log(employment) 0.2742 0.0247 0.0463 0.0138 0.0598 104.4154 40.8697 �572.6417(0.1328)** (0.0094)*** (0.0176)*** (0.0182) (0.0818) (19.5389)*** (13.6881)*** (714.1734)
Assets/employment �0.0002 0.0000 0.0000(0.0001) (0.0000)*** (0.0000)***
Constant �4.4631 �0.2313 �0.4215 �0.0884 �0.4686 �1,450.22 �505.2756 �1,151.88(1.5426)*** (0.0860)*** (0.1583)*** (0.1853) (0.6785) (256.104)*** (175.467)*** (6526.9513)
Observations 93 93 93 96 96 98 98 93Pseudo-R2 0.349 0.335 0.335 0.569 0.502 0.741 0.371 0.426
* Significant at the 10 percent level.** Significant at the 5 percent level.*** Significant at the 1 percent level.Note: ROA � return on assets, ROE � return on equity, and ROS � return on sales. This table reports difference-in-difference panel data GMM-IV (generalized
method of moments instrumental variables estimator) results of performance indicators for utilities. SEPADAL, the most important water and sanitation enterprise, isused as a control group. There are eight different regressions with distinct dependent performance variables; see appendix table 8B.1 for variable definitions. Standarderrors are in parentheses. Log(employment) has been instrumented using one period lag, fpriv and epriv by GMM-IV. Pseudo-R2 is the R2 using IV regression with ro-bust standard errors. Hansen J-statistic (1982) has been used to test for overidentifying restrictions. In every case the null hypothesis that the additional moment condi-tions are approximately satisfied was rejected, validating the use of the instruments.
Source: Author’s calculations.

addition, the dummy variable for price cap regulation is significant andpositive for the return on equity and on the debt-to-assets ratio, imply-ing that the type of regulation carried out by the regulatory agency alsohas an important impact on firm performance. Finally, the concentrationindex is not significant, possibly because there is competition in the elec-tricity sector, especially in distribution, and a monopoly in the telephonesector: the effects of the two different market structures go in oppositedirections.
When examining each of the privatized firms, the results of the first-and second-difference statistics for the privatized SOEs are completelyconsistent with the findings shown in table 8.7. In the cases of Tele-fónica del Perú S.A. and Electrolima, both the first and second differ-ences are significant and in the expected direction. In the case of thetelephone company, only the difference in means in the leverage indi-cators in both the first and second differences were not significant (seeappendix table 8E.1).
Similarly for Electrolima, all the performance indicators, includingleverage, improved significantly (appendix table 8E.2). This also holdswhen a control group is included and the second difference is calcu-lated. The profitability ratios moved from being negative on average topositive in magnitudes from 8 percent to 20 percent. Another significantchange occurred in debt ratios, which fell more than 50 percent. Fur-thermore, sales efficiency increased by 400 percent, and net income ef-ficiency reached high levels compared with previously negative results.One of the expected explanations for such a significant increase in op-erating efficiency would be the reduction of employment by more thanhalf (55.6 percent) after privatization. This reduction, however, onlydoubles the ratio and is thus not sufficient to explain the improvement.It is safe to conclude that efficiency gains through restructuring and im-proved incentives play a key role in contributing to the rise in operatingefficiency. In summary, the results for Electrolima showed that al-though the reduction in employment affected labor productivity, laborproductivity and total factor productivity increased after the privatiza-tion process.
The results for Electroperú, which was privatized between 1995 and1996, two years after Electrolima, are shown in appendix table 8E.3.The results in this case are not as significant as the results for Elec-trolima. Only two indicators improved: operating efficiency, as observedin the first difference, and the ratio of debt to assets, as observed in thedifference in difference when the performance of this firm is comparedto other firms not yet privatized. The state’s assumption of Electrolima’slong-term debts just before privatization explains the improvement inthe ratio of debts to assets. These unsatisfactory results could be a con-sequence of the incomplete privatization process in this sector. One ofthe major electricity-generating enterprises, Central Hidroeléctrica del
PERUVIAN PRIVATIZATION: IMPACTS ON FIRM PERFORMANCE 437

Mantaro, and all of the distribution enterprises in the south of Peru arenot yet privatized.
Results for the Financial Sector. The results for simple differences in meanfor the financial sector were similar to those of the public utilities sector.There was no significant impact on profitability measures and leverage in-dicators, but there was a significant increase in the operating efficiencyand coverage of the privatized banks (Interbanc and Banco Continental).The increase in operating efficiency is mainly explained by the 50 percentreduction in employment, which practically duplicates the indicator of op-erating efficiency. At the same time, the difference-in-difference indicatorsare similar to the first-difference indicators when public banks are used asa comparison. When a comparison is made with private banks of similarsize, the private banks still demonstrate better performance measures thanprivatized banks. Finally, when the control group was defined withpropensity scores, and the difference-in-difference estimation for priva-tized banks against matched private banks was carried out, private banksstill performed better.
Furthermore, when analyzing indicators specific to banks, such aspersonnel expenses per employee, bad loan portfolios, administrativeexpenses, and financial margin per branch, an increase in the perfor-mance was discovered. These results even hold for personal expensesper employee in the difference-in-difference indicators despite the factthat the comparison group is preexisting private banks (see table 8.8).
The results of estimating equation 8.5 can be observed in table 8.9.The table shows that, unlike the results for the utilities sector, the dateof privatization (fpriv) is significant for all the performance indicators.This finding reveals that there was an important change after the priva-tization process. At the same time, there is no direct difference betweenthe privatized banks (epriv � 1) and the already private banks (the con-trol group). These results are consistent with the fact that privatizedbanks are being compared to banks that were always private, and theirperformance is therefore expected to be better or similar to the privatebanks.
When analyzing the interaction between the time trend and the dummyfor privatized banks (epriv), there is a significant and positive effect for thereturn on sales, indicating that over time newly privatized banks improvein comparison with banks that were always private. This result reflects apossible convergence of performance. As expected, there is also a negativetime trend, which could be explained by the international financial crisisthat affected all the banks in the region. Additionally, the interaction be-tween the time trend and dummy for year of privatization is significantand negative, implying that the growth rate of performance since priva-tization is declining. The decline can also be explained by the interna-tional effects of the Japanese and Russian financial crises. However, the
438 TORERO

439
Table 8.8 Changes in Performance in the Financial Sector after Privatization (Differences between means and difference-in-difference tests)
Difference in Means First Differences difference
S-Franciac Kolmogorov-Sector Preprivatization Postprivatization t-testa Hotellingb Hotellingb Prob � Z Smirnov
Performance measure (Pi)
ProfitabilityReturn on sales (ROS) 0.0545 0.0784 �1.320* 1.743 2.971 0.116 0.476
(0.010) (0.016)Return on assets (ROA) 0.0112 0.0099 0.383 0.147 0.167 0.314 0.994
(0.002) (0.002)Return on equity (ROE) 0.1467 0.1193 0.629 0.395 0.429 0.291 0.994
(0.029) (0.027)
Operating efficiencySales efficiency (SALEFF)d 188.85 404.10 �7.122*** 50.725*** 35.071*** 0.125 0.007***
(17.921) (24.582)Net income efficiency (NIEFF)d 10.70 22.60 �2.641** 6.973** 12.031** 0.178 0.082**
(2.403) (4.249)
EmploymentTotal employment (EMPL) 3132.5 1831.2 7.101*** 50.419*** 44.613*** 0.146 0.001***
(95.085) (177.859)
LeverageDebt to assets (LEV) 0.9125 0.9175 �0.555 0.308 0.758 0.077 0.329
(0.007) (0.002)Debt to equity (LEV2) 12.134 11.189 0.485 0.235 0.733 0.029 0.476
(1.432) (0.304)
(Table continues on the following page.)

440
Table 8.8 (continued)
Difference in Means First Differences difference
S-Franciac Kolmogorov-Sector Preprivatization Postprivatization t-testa Hotellingb Hotellingb Prob � Z Smirnov
CoverageLoans per worker (LOAW) 354.17 1440.36 �13.329*** 177.654*** 120.006*** 0.015 0.001***
(40.902) (81.520)Deposit per worker (DEPW) 513.23 1742.60 �9.216*** 84.940*** 93.298*** 0.051 0.001***
(52.243) (154.157)
Indicators specific to banksPersonal expenses per employee �31.45 �53.48 6.74*** 45.41*** 22.79*** 0.665 0.007***
(1.98) (2.54)Bad loan portfolio 0.08 0.08 �0.26 0.07 0.60 0.671 0.721
(0.07) (0.01)Administrative expenses 0.49 0.42 1.19 1.43 3.91* 0.010 0.216
(0.04) (0.01)Financial margin per branch 1913.80 2374.20 �1.27 1.62 1.30 0.724 0.476
(253.46) (145.10)
* Significant at the 10 percent level.** Significant at the 5 percent level.*** Significant at the 1 percent level.

441
Note: This table reports results for two privatized banks, Banco Continental and Interbank First, and second differences for changes in perfor-mance are shown, for each empirical proxy, using the mean values (see appendix table 8B.1 for variable definitions). Columns 1 and 2 present themean values before and after privatization (the year of privatization is 1995). Columns 3 and 4 show results for two tests for significance in changesin performance after privatization (first differences): t-test (two-tailed Wilcoxon signed-rank test) and the Hotelling test. Column 5 displays signifi-cance of difference-in-difference results using a Hotelling test (control group is based on propensity score matching). Column 6 presents Shapiro-Francia test for normality. Finally, column 7 shows the results for the Kolmogorov-Smirnov (K-S) statistic, a nonparametric test used to formallytest the equality of the empirical hazards functions of the different pre- and postprivatization performance indicators.
a. t-test for Ho (null hypothesis) for difference between means. Numbers are unequal.
where x is an l � k matrix of the means and S is the estimated covariance matrix.b. Test of equality:
c. Shapiro-Francia test for normality. Ho (null hypothesis) variable is normally distributed.d. Thousands of nuevos soles.
T 2 � (x1 � x2) S�1(x1 � x2)�
t �(X1 � X2)
S x1 � x2�
(X1 � X2)
B(n1 � 1) s 2
1 � (n2 � 1) s 22
(n1 � n2 � 2)*B
1n1
�1n2

442
Table 8.9 Performance Indicators of Privatized Banks, Difference in Difference(Generalized method of moments instrumental variables estimator)
Debt to Debt to Sales Net income Assets/Variable ROS ROA ROE assets equity efficiency efficiency employment
Dummy for date of 0.3092 0.0538 0.4506 �0.0922 �11.4328 �1.4313 111.1536 �900.2763privatization (fpriv) (0.1237)** (0.0182)*** (0.2096)** (0.0323)*** (4.1852)*** (112.163) (36.1325)*** (627.2483)
Dummy if firm is �0.1219 �0.0114 0.0778 0.0334 7.1600 �96.5512 �40.8681 �27.2020privatized (epriv) (0.0508)** (0.0080) (0.0696) (0.0227) (4.0179) (82.2342) (20.4276)** (461.7338)
Time trend (t) �0.0208 �0.0023 �0.0132 �0.0002 �0.0470 6.4866 �2.9459 121.4275(0.0085)** (0.0009)*** (0.0070) (0.0010) (0.0648) (2.8684)** (1.1379)*** (19.2942)***
t * fpriv �0.0247 �0.0041 �0.0260 0.0108 1.4272 12.5945 �8.1146 175.8407(0.0102)** (0.0017)*** (0.0185) (0.0036)*** (0.5373)*** (13.5645) (3.7083)** (77.6577)**
t * epriv 0.0116 0.0014 �0.0096 �0.0054 �1.0251 4.9709 4.2447 �51.8588(0.0059)** (0.0011) (0.0080) (0.0029) (0.5275) (11.7789) (2.9500) (68.2979)
Participation in total �0.1551 0.0567 1.1762 0.0521 12.3772 1748.686 274.5105 14982.4047credit allocations (0.6042) (0.0601) (0.7128) (0.0696) (6.2735)** (202.047)*** (61.9442)*** (1,549.272)***(share)
Percent change of 0.0006 �0.0005 �0.0035 0.0019 0.0754 �12.4515 �1.8681 �56.0758GDP per capita (0.0017) (0.0003) (0.0021) (0.0006)*** (0.0423) (1.8376)*** (0.8185)** (9.3183)***

443
Dummy for closed �0.0548 �0.0067 �0.0125 0.0127 1.4007 �76.3966 �24.4158 �67.1054state-owned banks (0.0301) (0.0048) (0.0818) (0.0106) (1.0590) (27.8619)*** (10.8307)** (157.1675)
Log(employment) 0.0283 �0.0026 �0.0549 0.0126 0.3098 �115.6341 �19.1690 �942.4289(0.0451) (0.0045) (0.0479) (0.0055)** (0.3564) (14.6869)*** (6.4199)*** (97.4552)***
Loans per worker 0.0001 0.0000 0.0001(0.0001)** (0.0000) (0.0000)
Constant �0.0258 0.0347 0.4267 0.8055 7.0200 878.7896 154.4391 5849.7005(0.2340) (0.0252) (0.2199) (0.0325)*** (1.8918)*** (95.6279)*** (46.8079)*** (594.3191)***
Observations 285 285 285 285 285 285 285 285Pseudo-R2 0.111 0.115 0.06 0.162 0.144 0.411 0.146 0.4755
* Significant at the 10 percent level.** Significant at the 5 percent level.*** Significant at the 1 percent level.Note: ROA � return on assets, ROE � return on equity, and ROS � return on sales. This table reports difference-in-difference panel data GMM-IV
(generalized method of moments instrumental variables estimator) results of performance indicators for privatized banks. Private banks are used as a controlgroup. There are eight different regressions with distinct dependent performance variables (see appendix table 8B.1 for variable definitions). Standard errorsare in parentheses. Log(employment) and loans per worker have been instrumented using one period lag, fpriv and epriv by GMM-IV. Pseudo-R2 is the R2
using IV regression with robust standard errors. Hansen J-statistic (1982) has been used to test for overidentifying restrictions. In every case the null hypoth-esis that the additional moment conditions are approximately satisfied was rejected, validating the use of the instruments.
Source: Author’s calculations.

444 TORERO
size of the coefficient is less than a tenth of the coefficient of the date ofthe privatization dummy, implying that the overall effect of privatizationon performance is positive.
Employment
The impact of privatization on the welfare of displaced public workershas received little attention in the literature. One of the main problemsfaced by researchers is the lack of available data, since information fordisplaced workers is provided for only one period of time (the moment ofdisplacement from the SOE). In fact, it would require large amounts oftime, effort, and resources to trace displaced public workers for the pur-pose of analyzing the long-term impact of privatization on their welfareand earnings. This is possibly the reason why most of the studies analyzethe effects of privatization on employment, welfare, and wage levels us-ing gross national figures or industry and firm information.
The employment indicators make clear that direct employment wasreduced significantly after privatization (table 8.10). On average, employ-ment in the former SOEs fell almost 35 percent after privatization, al-though when the figures are compared with industry averages, the averagedecrease in employment is 0.7 percent higher than the average for the in-dustry.22 When decomposing the employment data by white- and blue-collar employees, the privatized firms show a smaller overall reductionthan the industry average of 4.1 percent, but the reduction in employmentof blue-collar workers is 17.6 percent higher for the privatized firms than
Table 8.10 Changes in Employment after Privatization
Before privatization After privatization ChangeVariable 1993 1997 (percent)
TotalMean 2461.17 1605.75 �34.76Median 2237.50 1393.50 �37.72
(1508.536) (1300.427)White-collarMean 2049.17 1387.00 �32.31Median 1746.50 1102.00 �36.90
(1457.232) (1153.019)Blue-collarMean 412.00 218.75 �46.91Median 210.00 149.50 �28.81
(495.463) (247.820)
Note: See text for explanation. Standard deviations are in parentheses. Source: Author’s calculations.
for the industry average, which means that the main reduction of directemployment took place among blue-collar workers.
One of the chief criticisms of the privatization process is that the majorreason for improvement in performance is a significant reduction in thenumber of employees, rather than a real increase in total factor produc-tivity. To address this issue, the author follows La Porta and López-de-Silanes (1999) to calculate the impact on privatized companies if all thelayoffs were instead kept on at their original salaries.23 For this purpose,the cost of layoffs was calculated as: (Lpre � L1994)*Wpre, where Wpre isthe average wage in the year preceding privatization, Lpre is the averagenumber of employees in the years preceding privatization, and L1994 is thelevel of employment in 1994 after privatization.
The results are shown in table 8.11. There is no significant differencebetween the postprivatization performance indicators and the postprivati-zation performance indicators under the assumption that there were nolayoffs. For utilities, the percentage change in the profit indicators goesfrom �2 percent to �5 percent, while in the case of the banks the impactis bigger, averaging �12 percent and �26 percent for Banco Continentaland Interbanc, respectively. After including all laid-off workers at theiroriginal salaries, net income efficiency (a variable that is directly affectedby the number of employees) fell substantially; the percentage change forTdP was �12 percent, for Interbanc �34 percent, and for Continental�14 percent.
In the case of TdP, contracting service companies created a significantamount of indirect employment. These service companies frequentlyconsisted of personnel laid off as a result of the privatization. This re-quired an additional exercise that involved subtracting the costs from allservice payments carried out by the company to find the net employmentlayoff. This resulted in a positive percentage change for some of theprofitability indicators since the wage costs before privatization weresmaller than the fees the company pays the service companies. Further-more, the number of employees in the telecommunications sector rosefrom 13,000 employees in 1993 to 34,000 employees in 1998, accordingto OSIPTEL.
In general, for all the companies studied, the results of the modified ver-sion of La Porta and López-de-Silanes’ (1999) exercise can be explainedthrough the following reasons: total wages of laid-off employees repre-sented only 1.4 percent of total sales, since the average wages paid beforeprivatization were extremely low; postprivatization sales increased signif-icantly, which spread labor costs over a wider base; and there was also asignificant increase in the productivity of other factors, especially capital,because of the increase in coverage and the new investments undertakenby privatized firms.24
In the case of utility companies, there was a clear and significant increasein sales. In telecommunications, the number of fixed-line phones per 100
PERUVIAN PRIVATIZATION: IMPACTS ON FIRM PERFORMANCE 445

446
Table 8.11 Impact of Layoffs on Performance Indicators for Major Privatized Firms
Postprivatization Postprivatization without layoffs
Net income Net incomeFirm ROS ROA ROE efficiency ROS ROA ROE efficiency
Telefonica 0.385 0.162 0.287 81.385 0.366 0.155 0.272 71.883(0.09) (0.05) (0.08) (42.84) (0.09) (0.05) (0.07) (40.57)
Electrolima 0.170 0.056 0.072 136.742 0.165 0.054 0.069 132.152(0.08) (0.03) (0.03) (72.01) (0.08) (0.03) (0.03) (69.05)
Electroperú 0.257 0.030 0.050 258.850 0.252 0.029 0.049 252.863(0.22) (0.02) (0.04) (206.78) (0.22) (0.02) (0.04) (206.65)
SEDAPAL 0.160 0.027 0.034 33.496 0.154 0.026 0.032 25.160(0.04) (0.01) (0.01) (7.70) (0.04) (0.01) (0.01) (11.61)
Continental 0.091 0.011 0.130 23.434 0.080 0.010 0.115 20.051(0.05) (0.01) (0.09) (13.67) (0.06) (0.01) (0.09) (13.70)
Interbank 0.066 0.010 0.116 17.323 0.048 0.007 0.087 11.457(0.06) (0.01) (0.10) (14.27) (0.06) (0.01) (0.11) (16.37)
Note: ROA � return on assets, ROE � return on equity, and ROS � return on sales. See text for explanation. See appendix table 8B.1 for variabledefinitions.
Source: Author’s calculations.

PERUVIAN PRIVATIZATION: IMPACTS ON FIRM PERFORMANCE 447
inhabitants grew from 2.9 in 1993 to 7.8 in 1998. Cellular phones grewfrom 50,000 to 735,000 in the same two years. In the electricity sector, thecoefficient of electrification grew an average of 27 percent, and the genera-tion of electricity grew an average of 25 percent as a result of the heavy vol-ume of investments (approximately $682 million). Even more important,prices for telephone and electricity services were brought into line with thecosts of producing those services; before privatization, prices typically cov-ered 75 percent or less of the costs (see Torero and Pascó-Font 2001).
In summary, the results show a clear improvement in firm performancefollowing privatization; a relative improvement compared with industrycontrol groups; and an improvement in both labor productivity and totalfactor productivity.
Conclusions
Privatization began in Peru in 1991 to generate vital fiscal revenues for thegovernment and improve the quality and coverage of infrastructure andother services. Privatization took place in the telecommunications, elec-tricity, mining, financial services, and hydrocarbons sectors. The processwas accompanied by sector reforms aimed at establishing competitivemarkets and autonomous regulatory agencies. The result was one of LatinAmerica’s greatest privatization success stories. A strong record of eco-nomic policy and performance underpinned the success of the privatiza-tion process, however. Macroeconomic stability, an open policymakingenvironment, and competitive sector markets gave the firms a stable andcertain environment through 1998. Without such conditions, successwould not have been achieved.
Unfortunately, the depth of the reforms, especially the extent of priva-tization, was uneven across sectors. Despite this reform mixture, the re-sults in terms of improvement on the supply side are positive and very sig-nificant. The analysis clearly shows a significant improvement in firmperformance since privatization.
It is clear from the analysis that privatization had an impact on priva-tized public utility firms in comparison to firms that went through a simi-lar preprivatization restructuring but then were not privatized. Althoughover time there was a decrease in the performance of the privatized utili-ties, implying lower profits, this could have resulted from increased com-petition in the sector and a slowdown in certain services such as electric-ity due to the incomplete privatization process.
Results for the financial sector are similar. The main difference is thatprivatized banks performed better than they had before they were priva-tized, but not as well as the private banks in the control group. The resultsalso show that privatized banks have a convergence tendency toward thebest performers in the private sector.

448 TORERO
It is clear that in the short run, the impact of privatization on employ-ment is negative since SOEs usually hired people based on political ratherthan technical criteria. The privatized firms had to adjust to the new mar-ket conditions and reduce the level of employment by 35 percent, on aver-age. Two effects have been demonstrated: a significant increase in indirectemployment through services, and an average growth of 28 percent in to-tal employment—both direct and indirect—since privatization. Neverthe-less, to measure the real impact on employment in the medium run, it isinadequate to study only employment in a specific sector. One also has tostudy the effects on other sectors stemming from the higher demand forservices by the privatized firms.
Despite the success in terms of firm performance, service quality andconsumer benefits must be taken into account to make a balanced judg-ment of the privatization process. As mentioned in Torero and Pascó-Font(2001), there exist important problems in the privatization process thatcould explain why positive welfare impacts on consumers were not verysignificant, or were even negative in electricity. Although, the electricitysector has shown important improvements, the positive effects of privati-zation had not yet reached important regions of urban Peru. This could ex-plain why, on average, consumers are not experiencing an increase in wel-fare. In contrast, telephony is the sector that has experienced the mostsignificant improvements since privatization. In terms of both supply anddemand, the results show a positive balance, including an increase in ab-solute levels of consumer surplus and in progressiveness, for the telecom-munications sector. However, since 1997 the positive trend of gains inconsumer surplus was reduced.
In summary, improved firm performance clearly suggests the necessityof continuing the privatization process, especially in electricity, water, andother SOEs where major reforms need to be concluded—or in some casesbegun. This is only a supply-side analysis, but when combined with resultsfrom the demand-side analysis (see Torero, Schroth, and Pascó-Font2004), it is apparent that firms and regulatory agencies must develop ad-equate policies to facilitate the transfer of performance benefits from pri-vatized firms to consumers. In so doing, even further increases in the gainsin welfare derived from the process will be possible. Policymakers mustfortify the regulatory agencies and increase their independence. They alsomust work with privatized firms to identify vulnerable groups and to de-velop tailored measures, such as appropriate consumption plans, that willhelp increase consumer welfare.

PERUVIAN PRIVATIZATION: IMPACTS ON FIRM PERFORMANCE 449
Appendix 8A
Data Sources
Banco Central de Reserva del Perú (BCRP). 1986–2000. Annual Report.Lima.
———. Web page: http://bcrp.gob.pe.
Cementos Lima S.A. 1988–98. Annual Report. Lima.
Comisión de Promoción de la Inversión Privada (COPRI). 1996. WhiteBook. Cementos Lima S.A. Lima.
———. White Book. CEPREL – Electrolima S.A. Lima.
———. White Book. Electroperú, S.A. Lima.
———. White Book. Electro Sur Medio, S.A. Lima.
———. White Book. Empresas Regionales de Electricidad: Electro Norte,S.A., Electro Norte Medio, S.A., Electro Noroeste, S.A., and ElectroCentro, S.A. Lima.
———. Web page: http://www.copri.org.
Comisión de Tarifas Eléctricas (CTE). 1984, 1985, 1986–89, 1990–91,1996, 1999. Annual Report. Lima.
———. 1992–93, 1994, 1995, 1996, 1997, 1998, 1999. Statistical Year-book. Lima.
Comisión Nacional Supervisora de Empresas y Valores (CONASEV).Web page: http://www.conasevnet.gob.pe.
Compañía Peruana de Teléfonos S.A. 1985–87, 1990–93. Annual Report.Lima.
Electrolima, S.A. 1985–88, 1990–94, 1997. Annual Report. Lima.
Electroperú, S.A. 1985–99. Annual Report. Lima.
Entel Perú, S.A. 1990, 1991, 1993. Annual Report. Lima.
———. 1985–92. Statistical Yearbook. Lima.
SEDAPAL, S.A. 1984–99. Annual Report. Lima.
———. 1997. “Historia del abastecimiento del agua potable de Lima1535–1996.” Lima.
Superintendencia de Banca y Seguros (SBS). 1986–2000. Weekly Notes.Lima.
Superintendencia Nacional de Servicios de Saneamiento (SUNASS).1996–99. Annual Report. Lima.
———. 1998. “Indicadores de Gestión 1996–1998.” Lima.

450 TORERO
———. Centro de Documentación, Web page: http://www.sunass.gob.pe/cendoc.html.
Telefónica del Perú, S.A. 1994–2000. Annual Report. Lima.
Other Data Sources
From the Commission of Energy Tariffs:
Commercial Information (First quarter, 2000).Publication containing results from the processing and analysis of com-
mercial information provided by the electric sector companies.
CTE Informs (June 1999–November 2000).Monthly publication with news about regulation, markets, agents, and
other current topics of interest in the electricity and hydrocarbon sec-tors in Peru and all around the world.
Electric Sector Operations (January 2000–November 2000).Monthly publication containing information on production and demand
of electricity, prices, and other information related to the operation ofthe sector.
El Informativo (June 1996–November 2000).Periodical publication containing technical articles, market information,
evolution of rates, company news, statistics, and sector news.
The Statistical Yearbook (1994–98).A yearly publication that details regulation of electricity rates and eco-
nomic results for the Peruvian electricity market.
Yearly Report (1994–1999).
From OSIPTEL (Supervisory Agency for Private Investment in Telecom-munications):
The Transformation of Telecommunications in Peru. 1995 Report.
Regulation and the Telecommunications Market. 1996 Report.
The Opening of the Telecommunications Market. 1997 Report.
Consumers and Telecommunications. 1998 Report.
Five Years in the Telecommunications Market. 1999 Report.
Institutional Report. 2000.
Technical studies (various titles).
Studies in telecommunications (various titles).
Bulletins (various titles).

PERUVIAN PRIVATIZATION: IMPACTS ON FIRM PERFORMANCE 451
Return on sales is the ratio of net income tosales. Net income is equal to total incomeminus operating and administrative expenses,plus financial income minus financialexpenses, and net taxes paid. Sales are equalto the total value of products and servicessold, nationally and internationally, minussales returns and discounts.
Return on assets is the ratio of net income toassets. Net income is equal to total incomeminus operating and administrative expenses,plus financial income minus financialexpenses, and net taxes paid. Assets are thetotal value of the entire property of the firmon December 31.
Return on equity is the ratio of net income toequity. Net income is equal to total incomeminus operating and administrative expenses,plus financial income minus financialexpenses, and net taxes paid. Equity is thevalue of the participation that the partners orowners have in the company.
Debt/assets is the ratio of liability to assets.Liability is the value of the debt owed by thecompany. Assets are the total value of theentire property of the firm on December 31.
Debt/equity is the ratio of liability to equity.Liability is the value of the debt owed by thecompany. Equity is the value of theparticipation that the partners or ownershave in the company.
Sales efficiency is the ratio of sales toemployment. Sales are equal to the total valueof products and services sold, nationally andinternationally, minus sales returns anddiscounts. Employment is measured as thetotal number of employees in the firm,including white- and blue-collar workers.
ROS
ROA
ROE
Debt/assets
Debt/equity
Sales efficiency
Table 8B.1 Description of Variables
Variable Description
Performance variable
Appendix 8B
(Table continues on the following page.)

452 TORERO
Net income efficiency is the ratio of net incometo employment. Net income is equal to totalincome minus operating and administrativeexpenses, plus financial income minusfinancial expenses, and net taxes paid.Employment is measured as the total numberof employees in the firm, including white-and blue-collar workers.
Total employment is the total number ofemployees. The employees include white-collarworkers and blue-collar workers at full time.
The ratio of assets to employment indicates theproportion of assets that on average, wouldcorrespond to each employee. Assets are thetotal value of the entire property of the firmon December 31. Employment is measured asthe total number of employees in the firm,incuding white- and blue-collar workers.
The share rate is the ratio of participation of thefirm in its economic sector. In the case ofutilities, participation is constructed by thecontribution of the firm to total invoicing ofthe sector. In other words, it is the ratio of thefirm’s invoicing to the total invoicing of thesector. In the case of banks, the rate isconstructed by the participation of the bank intotal credit allocations.
The concentration index of the sector is theCI4. This index is the sum of the share rateof the four firms with the highestparticipation in the sector. The share rate isthe ratio of participation of the firm in itseconomic sector. In the case of utilities,participation is constructed by thecontribution of the firm to total invoicing ofthe sector. In the case of banks, the rate isconstructed by the participation of the bankin total credit allocations. The highest valuethe CI4 can take is 1, which indicates theexistence of a monopoly.
A dummy that takes the value 1 if the firmbelongs to the utilities sector, and 0 otherwise.
Net income efficiency
Total employment
Assets/employment
Share rate
Concentration index bysector
Utilities
Table 8B.1 (continued)
Variable Description
Sector variable

PERUVIAN PRIVATIZATION: IMPACTS ON FIRM PERFORMANCE 453
A dummy that takes the value 1 for all yearsthe firm has been in private hands, and 0otherwise.
A dummy that takes the value 1 for all yearsthe firm has been in private hands, and 0otherwise.
The value of transactions is the amount, incurrent US$ millions, paid by the investor forthe available share package or managementrights.
The projected investment is the amount, incurrent US$ millions, that the investorcommits to invest.
A dummy that takes the value 1 if foreigninvestors hold a greater percentage of stocksthan any other investor, and 0 otherwise.
A dummy that takes the value 1 if the buyerowns and manages one or more companiesthat belong to the same sector of theprivatized firm, and 0 otherwise. Industries orsectors considered are telecommunications,electricity, water and sanitation, and banking.
A dummy that takes the value 1 if the firmbelongs to a regulated industry, and 0otherwise. A regulated industry ischaracterized by the presence of a regulatoryagency. Industries or sectors considered aretelecommunications, electricity, water andsanitation, and banking.
A dummy that takes the value 1 if a regulatoryagency operated in the firm’s sector in thatyear, and 0 otherwise. Industries or sectorsconsidered are telecommunications,electricity, water and sanitation, and banking.
A dummy that takes the value 1 if there was aprice cap regulation in a specific year, and 0otherwise. Industries or sectors consideredare telecommunications, electricity, water andsanitation, and banking.
Privatization
Concession
Value of transactions
Projected investment
Foreign participation
Buyer’s experience
Regulated industry
Regulatory agency
Price cap regulation
Table 8B.1 (continued)
Variable Description
Privatization variable
Operator’s characteristic
Regulatory agency variable
(Table continues on the following page.)

454 TORERO
A dummy that takes the value 1 if the rate ofreturn is regulated, and 0 otherwise.Industries or sectors considered aretelecommunications, electricity, water andsanitation, and banking.
A dummy that takes the value 1 if theregulatory agency adopts a discretionaryprice regulation in that year, and 0 otherwise.Industries or sectors considered aretelecommunications, electricity, water andsanitation, and banking.
Per capita real GNP is the gross nationalproduct by inhabitant at 1994 prices.
Average precipitation is the average annual rainprecipitation, measured in cubic millimeters.
The annual average exchange rate, measuredas the value of a U.S. dollar in Nuevos Soles.
The IPG (generalized price index) is amodification of the consumer price index(CPI). It has the advantage of solvingproblems that are found in traditionalestimations of changes in prices, and thatbecome particularly severe in hyperinflationperiods. It is a measure of how much theaverage price has changed since the baseyear (1994).
The gross national product is the value ofgoods and services produced by a country’sresidents over a year at 1994 prices. GNP isthe sum of the value of consumption,investment, government expenses, andexports, minus imports.
The total number of inhabitants in Peru.The value of the goods and services produced
in the agricultural sector in a specific year at1994 prices.
The value of the goods and services producedin the fishing sector in a specific year at 1994prices.
The value of the goods and services producedin the mining and hydrocarbons sector in aspecific year at 1994 prices.
Table 8B.1 (continued)
Variable Description
Rate of returnregulation
Discretionary prices
Peruvian per capita realGNP
Average precipitation
Average exchange rate
IPG
GNP
PopulationAgriculture GNP
Fishing GNP
Mining andhydrocarbons GNP
Macro variable

PERUVIAN PRIVATIZATION: IMPACTS ON FIRM PERFORMANCE 455
The value of the goods and services producedin the manufacturing sector in a specific yearat 1994 prices.
The value of the goods and services producedin the construction sector in a specific year at1994 prices.
The change in the value of the economy’s assetsas a whole, calculated as a percentage of GNP.
The change in the value of the Peruvian publicsector’s assets calculated as a percentage ofthe GNP.
The change in the value of the Peruvian privatesector’s assets, calculated as a percentage ofthe GNP.
The value of total purchases of capital goodsas a percentage of GNP.
The value of public purchases of capital goodsas a percentage of GNP.
The value of private purchases of capital goodsas a percentage of GNP.
The value of goods produced by domesticresidents (including the net factor income fromabroad) plus net transfers from abroad, minusthe expenditure by domestic residents on goodsas a percentage of the GNP. When the currentaccount balance is positive (negative), there is asurplus (deficit) in the current account.
The value of exports of goods minus the valueof imports of goods, expressed as apercentage of GNP.
The value of exports of services minus thevalue of imports of services, expressed as apercentage of GNP.
The net income from labor or capital factors,which includes claims on assets abroad anddebt interest payments. It is calculated as apercentage of GNP.
The value of received foreign assets minusassets transferred outside the country. Anyextraordinary contributions, such asdonations, are included. It is calculated as apercentage of GNP.
Table 8B.1 (continued)
Variable Description
Manufacturing GNP
Construction GNP
Total domestic savings(percent of GNP)
Public savings (percentof GNP)
Private savings (percentof GNP)
Total investment(percent of GNP)
Public investment(percent of GNP)
Private investment(percent of GNP)
Current account balance(percent of GNP)
Trade balance (percentof GNP)
Services balance(percent of GNP)
Net factor income(percent of GNP)
Current transfers(percent of GNP)
(Table continues on the following page.)

456 TORERO
Total exports, measured in $US millions at1994 prices.
Total imports measured in $US millions at1994 prices.
The value of debt contracted with foreignagents by public and private organizations,measured in US$ millions at 1994 prices.
The value of debt contracted with foreignagents by the government, measured in US$millions at 1994 prices.
The value, in US$ millions at 1994 prices, ofliquid assets, including internationalcurrency, which the Central Bank uses forinternational transactions.
The percentage change in the general level ofprices, as measured by the IPG (defined above).
The value of exports as a percentage of GNP.Exports are goods that are produced by theresidents of a country and sold to foreigners.
The value of imports as a percentage of GNP.Imports are goods that are produced by foreign-ers and sold to the residents of a country.
The value of exports plus imports as apercentage of GNP. Exports are goods thatare produced by the residents of a countryand sold to foreigners. Imports are goodsthat are produced by foreigners and sold tothe residents of a country.
The price of Peru’s tradable goods expressedrelative to the price of a market basket of theworld’s tradable goods. It is approximated bythe ratio of Peru’s export prices to importprices.
The national production of potable water in ayear, measured in cubical meters.
The national production of electricity in ayear, measured in kilowatts per hour.
The number of telephone calls in a year.Legal minimum wage that a firm can pay.The number of persons working at jobs in the
market sector divided by the number of workersin January 1995 and multiplied by 100.
Total exports
Total imports
Private and public totalexternal debt
Public total externaldebt
RIN (net internationalreserves)
Inflation (percent)
Export (percent ofGNP)
Import (percent ofGNP)
Export � import(percent of GNP)
Terms-of-trade index
Potable water
Electricity
TelephonyVital minimum wageIndex of total
employment (Jan.1995 � 100)
Table 8B.1 (continued)
Variable Description

PERUVIAN PRIVATIZATION: IMPACTS ON FIRM PERFORMANCE 457
Number of strikes in a year for all industries ofthe economy. The Ministry of Labor registersthe strikes, the number of affected workers,and the total loss of work hours as a result ofstrikes.
Total number of workers affected by strikes ina year for all industries of the economy.
The sum of all lost work hours per worker dueto strikes.
The number of subversive attacks in a yearwithin the Peruvian territory.
The ratio of total personal expenses to thetotal number of employees. Personal expensesare equal to all resources dedicated to laborissues and services in a firm. Total number ofemployees is the total employment. Theemployees include white-collar workers andblue-collar workers at full time.
The ratio of bad loans to the net loanportfolio. Bad loans are defined as expiredloans plus legal costs. Net loan portfolio isequal to current accounts less discounts, pluslong- and short-term loans, refinanced loans,mortgages, and other loans.
The ratio of total administrative expenses tofinancial income. Administrative expenses areequal to personal expenses, general expenses,depreciation, and amortization. Financialincome is equal to income obtained bycommissions and interests on loans.
The ratio of the financial margin to thenumber of branches. Financial margin isequal to financial income (income obtainedby commissions and interests on loans) lessfinancial expenses. Branch is defined as thetotal number of offices.
Strikes
Affected workers
Man-hours lost
Subversive activity
Personal expenses peremployee
Bad loan portfolio
Administrative expenses
Financial margin perbranch
Table 8B.1 (continued)
Variable Description
Financial variables
Source: Author’s calculations.

458
Table 8C.1 Evolution of Privatization in the Electricity Sector
1986–93 1994 1995 1996 1997 1998 1999
Electroperú Electroperú Electroperú Electroperú ElectroperúEgenor Egenor Egenor Egenor Egenor
Electroperú Electroperúb Egesur Egesur Egesur Egesur EgesurCahua Cahua Cahua Cahua Cahua
Luz del Sur Luz del Sur Luz del Sur Luz del Sur Luz del Sur Luz del SurEdegel Edegel Edegel Edegel Edegel EdegelElectrolimaa
Edelnor Edelnord
Electrolimac EDE-Chancayd Edelnor Edelnor Edelnor Edelnor
EDE-Cañete EDE-Cañete EDE-Cañete EDE-Cañete EDE-CañeteElec. Centro Elec. Centro Elec. Centro Elec. Centro Elec. Centro Elec. CentroElec. Nor Oeste Elec. Nor Oeste Elec. Nor Oeste Elec. Nor Oeste Elec. Nor Oeste Elec. Nor OesteElect. Norte Elect. Norte Elect. Norte Elect. Norte Elect. Norte Elect. NorteElec. Nor. Medio Elec. Nor. Medio Elec. Nor. Medio Elec. Nor. Medio Elec. Nor. Medio Elec. Nor. MedioElec. Oriente Elec. Oriente Elec. Oriente Elec. Oriente Elec. Oriente Elec. OrienteElec. Sur Elec. Sur Elec. Sur Elec. Sur Elec. Sur Elec. SurElec. Sur Este Elec. Sur Este Elec. Sur Este Elec. Sur Este Elec. Sur Este Elec. Sur EsteElec. Sur Medio Elec. Sur Medio Elec. Sur Medio Elec. Sur Medio Elec. Sur Medio Elec. Sur MedioSeal Seal Seal Seal Seal Seal Seal
Emsemsa Emsemsa Emsemsa Emsemsa EmsemsaEtevensa Etevensa Etevensa Etevensa Etevensa
Appendix 8C

459
Egasa Egasa Egasa Egasa EgasaGera Gera Gera Gera GeraEgemsa Egemsa Egemsa Egemsa EgemsaEtecen Etecen Etecen Etecen EtecenEtesur Etesur Etesur Etesur EtesurElectro Ucayali Electro Ucayali Electro Ucayali Electro Ucayali Electro Ucayali
Coelvisa Coelvisa Coelvisa CoelvisaSers Sers Sers SersC.H. Virú
Electro Andes Electro Andes Electro AndesEepsa Eepsa EepsaChavimochic Chavimochic Chavimochic
Shougesa ShougesaPariac PariacElectro Pangoa Electro Pangoa
EmseusaElectro TocacheElectro PunoSan Gabán
a. Electrolima was divided into four different companies: Edelnor (distribution), Luz del Sur (distribution), Edegel (generation), and Electrolima(residual company).
b. Electroperú split into four different companies: Electroperú, Egenor, Egesur, and Cahua.c. Electrolima (residual company) was again divided into two companies: EDE-Chancay and EDE-Cañete.d. The merger between Edelnor and EDE-Chancay resulted in Edelnor. Source: Author’s tabulations.

460 Table 8C.2 Evolution of Privatization in the Financial Sector
Birth State Financial reform:Name year participation 1992–98 1986 1987 1988 1989 1990 1991 1992
Amazónico 1962 Yes Liquidación Amazónico Amazónico Amazónico Amazónico Amazónico AmazónicoAmerica 1966 America America AmericaBandesco 1980 Bandesco Bandesco Bandesco Bandesco Bandesco Bandesco BandescoCentral de 1984 Central de Central de Madrid Madrid Madrid
CCC 1988 CCC CCC CCCCitibank 1920 Citibank Citibank Citibank Citibank Citibank Citibank CitibankComercio 1967 Comercio Comercio Comercio Comercio Comercio Comercio ComercioContinental 1951 Yes Privatización Continental Continental Continental Continental Continental Continental ContinentalContinorte 1961 Yes Liquidación Continorte Continorte Continorte Continorte Continorte ContinorteCrédito 1889 Crédito Crédito Crédito Crédito Crédito Crédito CréditoDe los Andes 1962 Yes Liquidación De los andes De los andes De los andes De los andes De los andes De los AndesDel Norte 1960 Del Norte Del Norte Del Norte Del Norte Del Norte Del Norte Del NorteExtebandes 1982 Extebandes Extebandes Extebandes Extebandes Extebandes Extebandes ExtebandesFinanciero 1986 Financiero Financiero Financiero Financiero Financiero FinancieroInteramericano 1991 Interamericano InteramericanoInterandino 1990 Interandino Interandino Interandino InterandinoInterbank 1897 Yes Privatización Interbank Interbank Interbank Interbank Interbank Interbank InterbankLatino 1982 Latino Latino Latino Latino Latino Latino LatinoLima 1952 Lima Lima Lima Lima Lima Lima LimaLondres 1936 Londres LondresManhattan 1984 ManhattanMercantil 1984 Mercantil Mercantil Mercantil Mercantil Mercantil Mercantil MercantilPopular 1889 Yes Liquidación Popular Popular Popular Popular Popular PopularProbank 1990 Probank Probank ProbankSur Perú 1962 Sur Perú Sur Perú Sur Perú Sur Perú Sur Perú Sur Perú Sur PerúSurmebanc 1962 Yes Liquidación Surmebanc Surmebanc Surmebanc Surmebanc Surmebanc SurmebancTokyo 1965 Tokyo Tokyo

461
Wiese 1943 Wiese Wiese Wiese Wiese Wiese Wiese WieseSudamericano 1993Banex 1993Nuevo Mundo 1993Del Libertador 1994Del Trabajo 1994Solventa 1994Serbanco 1996Boston 1996Republica 1980Orion 1995Del pais 1997Mibanco 1998BNP-andes 1999
Name 1993 1994 1995 1996 1997 1998 1999 2000
AmazónicoAmericaBandesco Bandesco BandescoCentral deMadrid
CCCCitibank Citibank Citibank Citibank Citibank Citibank Citibank Citibank CitibankComercio Comercio Comercio Comercio Comercio Comercio Comercio Comercio ComercioContinental Continental Continental Continental Continental Continental Continental Continental ContinentalContinorteCrédito Crédito Crédito Crédito Crédito Crédito Crédito Crédito CréditoDe los AndesDel Norte Del Norte Del Norte Del Norte Del Norte Del Norte Del Norte Del Norte NBK-BostonExtebandes Extebandes Extebandes Extebandes Extebandes Extebandes Standard Standard StandardFinanciero Financiero Financiero Financiero Financiero Financiero Financiero Financiero Financiero
(Table continues on the following page.)
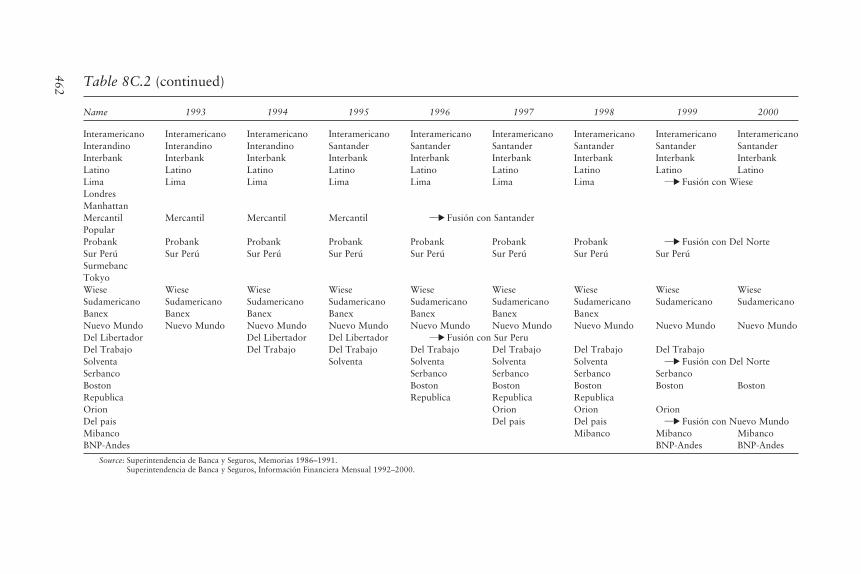
462
Interamericano Interamericano Interamericano Interamericano Interamericano Interamericano Interamericano Interamericano InteramericanoInterandino Interandino Interandino Santander Santander Santander Santander Santander SantanderInterbank Interbank Interbank Interbank Interbank Interbank Interbank Interbank InterbankLatino Latino Latino Latino Latino Latino Latino Latino LatinoLima Lima Lima Lima Lima Lima Lima ¬N Fusión con WieseLondresManhattanMercantil Mercantil Mercantil Mercantil ¬N Fusión con SantanderPopularProbank Probank Probank Probank Probank Probank Probank ¬N Fusión con Del NorteSur Perú Sur Perú Sur Perú Sur Perú Sur Perú Sur Perú Sur Perú Sur PerúSurmebancTokyoWiese Wiese Wiese Wiese Wiese Wiese Wiese Wiese WieseSudamericano Sudamericano Sudamericano Sudamericano Sudamericano Sudamericano Sudamericano Sudamericano SudamericanoBanex Banex Banex Banex Banex Banex BanexNuevo Mundo Nuevo Mundo Nuevo Mundo Nuevo Mundo Nuevo Mundo Nuevo Mundo Nuevo Mundo Nuevo Mundo Nuevo MundoDel Libertador Del Libertador Del Libertador ¬N Fusión con Sur PeruDel Trabajo Del Trabajo Del Trabajo Del Trabajo Del Trabajo Del Trabajo Del TrabajoSolventa Solventa Solventa Solventa Solventa ¬N Fusión con Del NorteSerbanco Serbanco Serbanco Serbanco SerbancoBoston Boston Boston Boston Boston BostonRepublica Republica Republica RepublicaOrion Orion Orion OrionDel pais Del pais Del pais ¬N Fusión con Nuevo MundoMibanco Mibanco Mibanco MibancoBNP-Andes BNP-Andes BNP-Andes
Source: Superintendencia de Banca y Seguros, Memorias 1986–1991.Superintendencia de Banca y Seguros, Información Financiera Mensual 1992–2000.
Table 8C.2 (continued)
Name 1993 1994 1995 1996 1997 1998 1999 2000

463
Table 8D.1 Basic Statistics of Privatized Firms
Debt Debt Net Number Assetsto to Sales income of to Net
Firm Number ROS ROA ROE assets equity efficiency efficiency workers employment income Assets
Nonfinancial firms 336 �0.249 �0.039 0.595 0.469 33.372 369.818 �43.185 1,337 1,443.96 �70,480 1,540,130(0.72) (0.23) (12.18) (0.55) (519.60) (554.37) (262.36) (2,533.35) (3,508.70) (802,842) (3,612,434)332 298 297 301 300 317 317 336 296 331 311
TelecommunicationsTelefonica 15 0.174 0.077 0.136 0.462 1.047 270.121 37.457 10,523 663.55 343,455 5,398,240
(0.22) (0.09) (0.17) (0.15) (0.77) (177.89) (51.47) (4,284.89) (490.97) (427,695) (2,266,784)
EnergyElectro Centro 14 �0.443 �0.034 �0.053 0.263 0.407 146.745 �43.999 618 722.48 �31,089 388,853
(0.76) (0.05) (0.08) (0.14) (0.29) (72.39) (60.80) (150.04) (338.59) (42,847) (99,896)14 10 10 10 10 14 14 14 11 14 11
Electro Nor Oeste 13 �0.600 �0.141 �0.259 0.459 1.140 203.269 �94.758 372 695.36 �35,737 240,917(0.95) (0.25) (0.43) (0.18) (1.07) (89.24) (114.65) (87.02) (283.27) (47,839) (103,963)
13 10 10 10 10 13 13 13 11 13 11Electro Norte 14 �0.473 �0.105 �0.534 0.455 2.030 156.803 �54.046 327 405.53 �18,137 125,990
(0.60) (0.08) (1.20) (0.22) (4.00) (85.14) (44.42) (46.00) (135.30) (15,795) (33,007)13 10 10 10 10 13 13 14 11 13 11
Electro Norte Medio 14 �0.367 �0.025 �0.066 0.387 1.010 260.329 �69.090 550 1,024.26 �41,454 468,014(0.66) (0.04) (0.10) (0.24) (1.14) (183.68) (116.46) (140.05) (777.21) (71,836) (298,246)
14 10 10 10 10 14 14 14 11 14 11
Appendix 8D
(Table continues on the following page.)

464
Electro Oriente 14 �0.437 �0.046 �0.074 0.329 0.555 237.351 �84.553 199 1,285.01 �17,795 240,264(0.61) (0.04) (0.07) (0.14) (0.39) (86.83) (95.37) (32.33) (475.32) (20,692) (82,307)
14 10 10 10 10 14 14 14 11 14 11Electro Sur 14 �0.408 �0.124 �0.010 0.419 0.333 187.524 �50.600 152 519.93 �8,429 74,913
(0.61) (0.23) (0.73) (0.41) (1.71) (67.67) (71.51) (23.42) (327.13) (11,603) (50,539)14 10 10 10 10 14 14 14 11 14 11
Electro Sur Este 14 �0.283 �0.027 �0.054 0.313 0.578 203.681 �51.568 313 778.74 �16,760 233,936(0.46) (0.03) (0.08) (0.21) (0.62) (60.11) (70.13) (35.53) (333.17) (23,075) (87,921)
14 10 10 10 10 14 14 14 11 14 11Electro Sur Medio 14 �0.248 �0.044 �0.100 0.295 0.516 140.550 �15.698 368 337.86 �7,816 110,249
(0.45) (0.08) (0.18) (0.18) (0.47) (74.78) (26.94) (124.89) (135.52) (13,078) (36,632)14 10 10 10 10 14 14 14 13 14 13
Electrolima 14 �0.031 0.012 0.012 0.345 0.577 415.272 47.692 3,252 1,370.89 51,941 3,533,158(0.30) (0.05) (0.08) (0.12) (0.29) (323.15) (94.74) (1,275.97) (967.23) (221,382) (1,480,396)
Electroperú 14 �0.475 0.010 0.017 0.453 0.905 540.289 69.958 1,503 8,463.11 �26,213 12,500,000(1.52) (0.03) (0.05) (0.10) (0.47) (497.82) (240.49) (806.17) (3,448.23) (320,191) (9,487,072)
SanitationSEDAPAL 14 �0.279 �0.002 �0.001 0.192 0.241 133.730 �0.536 2,514 1,059.30 �47,248 2,500,485
(0.70) (0.03) (0.04) (0.05) (0.08) (78.19) (40.12) (954.74) (408.21) (183,016) (1,143,402)
MiningCentromin 5 �0.133 �0.069 �0.541 0.877 8.169 1,909.095 �206.377 714 3,935.96 �147,339 2,810,561
(0.17) (0.10) (0.70) (0.04) (3.71) (578.95) (257.10) (0.00) (2,321.44) (183,552) (1,657,888)
Table 8D.1 (continued)
Debt Debt Net Number Assetsto to Sales income of to Net
Firm Number ROS ROA ROE assets equity efficiency efficiency workers employment income Assets
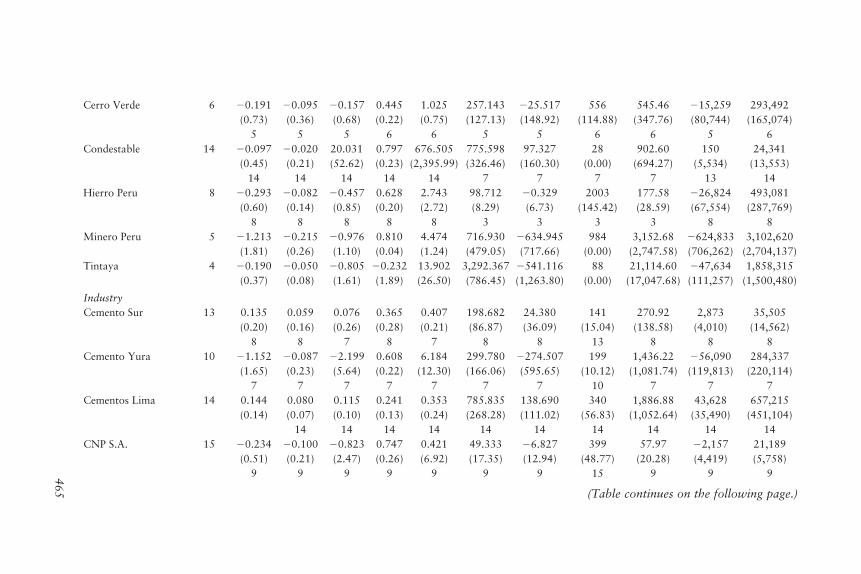
465
Cerro Verde 6 �0.191 �0.095 �0.157 0.445 1.025 257.143 �25.517 556 545.46 �15,259 293,492(0.73) (0.36) (0.68) (0.22) (0.75) (127.13) (148.92) (114.88) (347.76) (80,744) (165,074)
5 5 5 6 6 5 5 6 6 5 6Condestable 14 �0.097 �0.020 20.031 0.797 676.505 775.598 97.327 28 902.60 150 24,341
(0.45) (0.21) (52.62) (0.23) (2,395.99) (326.46) (160.30) (0.00) (694.27) (5,534) (13,553)14 14 14 14 14 7 7 7 7 13 14
Hierro Peru 8 �0.293 �0.082 �0.457 0.628 2.743 98.712 �0.329 2003 177.58 �26,824 493,081(0.60) (0.14) (0.85) (0.20) (2.72) (8.29) (6.73) (145.42) (28.59) (67,554) (287,769)
8 8 8 8 8 3 3 3 3 8 8Minero Peru 5 �1.213 �0.215 �0.976 0.810 4.474 716.930 �634.945 984 3,152.68 �624,833 3,102,620
(1.81) (0.26) (1.10) (0.04) (1.24) (479.05) (717.66) (0.00) (2,747.58) (706,262) (2,704,137)Tintaya 4 �0.190 �0.050 �0.805 �0.232 13.902 3,292.367 �541.116 88 21,114.60 �47,634 1,858,315
(0.37) (0.08) (1.61) (1.89) (26.50) (786.45) (1,263.80) (0.00) (17,047.68) (111,257) (1,500,480)
IndustryCemento Sur 13 0.135 0.059 0.076 0.365 0.407 198.682 24.380 141 270.92 2,873 35,505
(0.20) (0.16) (0.26) (0.28) (0.21) (86.87) (36.09) (15.04) (138.58) (4,010) (14,562)8 8 7 8 7 8 8 13 8 8 8
Cemento Yura 10 �1.152 �0.087 �2.199 0.608 6.184 299.780 �274.507 199 1,436.22 �56,090 284,337(1.65) (0.23) (5.64) (0.22) (12.30) (166.06) (595.65) (10.12) (1,081.74) (119,813) (220,114)
7 7 7 7 7 7 7 10 7 7 7Cementos Lima 14 0.144 0.080 0.115 0.241 0.353 785.835 138.690 340 1,886.88 43,628 657,215
(0.14) (0.07) (0.10) (0.13) (0.24) (268.28) (111.02) (56.83) (1,052.64) (35,490) (451,104)14 14 14 14 14 14 14 14 14 14
CNP S.A. 15 �0.234 �0.100 �0.823 0.747 0.421 49.333 �6.827 399 57.97 �2,157 21,189(0.51) (0.21) (2.47) (0.26) (6.92) (17.35) (12.94) (48.77) (20.28) (4,419) (5,758)
9 9 9 9 9 9 9 15 9 9 9
(Table continues on the following page.)

466
Cerper 3 0.065 0.105 0.176 0.412 0.707 0.000 0.000 0 0.00 1,213 11,460(0.10) (0.13) (0.22) (0.04) (0.12) (0.00) (0.00) (0.00) (0.00) (1,469) (217)
Sider Peru S.A. 12 �0.149 �0.051 �0.105 0.505 1.414 138.729 �14.741 3,271 262.68 �73,433 848,168(0.55) (0.21) (0.76) (0.19) (1.17) (64.26) (47.50) (1,052.99) (166.00) (153,536) (724,436)
10 10 10 10 10 10 10 12 10 10 10Empresa de la Sal 10 �0.051 �0.023 �0.041 0.358 0.575 113.040 �1.783 187 162.10 �458 19,505
(0.16) (0.09) (0.15) (0.07) (0.18) (60.39) (11.86) (147.11) (90.17) (1,858) (1,952)10 10 10 10 10 10 10 10 10 10
Industrias Navales 6 0.018 0.069 0.062 0.333 0.675 90.090 6.622 34 140.94 279 4,483(0.37) (0.12) (0.28) (0.20) (0.73) (40.56) (22.17) (13.29) (48.94) (657) (1,076)
La Pampilla 1 0.024 0.025 0.039 0.362 0.566 1,486.441 35.453 341 1,442.04 12,089 491,734. . . . . . . . . . .
Petroperu S.A. 13 �0.540 �0.403 �1.394 1.422 2.455 1,055.132 �274.642 4,772 793.46 �1,592,135 3,835,390(1.10) (0.81) (2.28) (2.04) (11.70) (1,216.42) (657.35) (1,733.10) (759.62) (3,759,827) (4,588,286)
13 13 13 13 13 13 13 13 13 13
Table 8D.1 (continued)
Debt Debt Net Number Assetsto to Sales income of to Net
Firm Number ROS ROA ROE assets equity efficiency efficiency workers employment income Assets

467
Quimica del Pacifico 6 0.129 0.081 0.118 0.314 0.497 154.684 18.946 323 210.63 6,379 66,508(0.11) (0.05) (0.06) (0.11) (0.30) (77.20) (19.41) (95.18) (117.05) (8,553) (49,123)
Renasa 13 0.050 0.024 0.042 0.357 0.576 170.530 7.394 82 221.96 1,235 17,262(0.21) (0.14) (0.21) (0.08) (0.19) (64.52) (33.13) (31.24) (93.80) (4,067) (10,391)
SEAL 14 �0.224 �0.005 �0.017 0.377 0.781 263.449 �27.685 433 636.37 �16,490 245,730(0.38) (0.06) (0.11) (0.17) (0.77) (167.86) (54.21) (146.53) (351.27) (27,328) (185,602)
14 10 10 11 11 14 14 14 11 14 11Solgas 5 �0.003 0.042 0.060 0.323 1.743 309.336 �0.852 230 184.35 �196 42,403
(0.07) (0.13) (0.14) (0.35) (3.32) (154.65) (29.10) (0.00) (124.02) (6,694) (28,530)Sufisa 6 �0.047 �0.075 �8.294 0.757 24.466 339.473 �6.461 401 451.71 �7,384 159,632
(0.18) (0.20) (20.30) (0.32) (46.83) (81.74) (51.93) (124.37) (236.92) (26,100) (47,332)Financial firms 340 0.725 0.080 1.600 0.883 9.462 277.628 269.940 1179 1636.41 1,904,351 1,738,226
(12.85) (1.32) (28.00) (0.07) (4.43) (182.05) (4,621.28) (1,573.68) (1,182.42) (34,800,000) (2,983,462)Continental 15 0.080 0.012 0.167 0.920 13.073 273.887 18.716 2913 1,656.87 52,323 4,491,742
(0.05) (0.01) (0.11) (0.02) (6.10) (109.48) (12.73) (491.96) (923.11) (34,154) (1,929,788)Interbank 15 0.056 0.011 0.121 0.908 10.313 254.653 12.846 2361 1,310.12 28,045 2,408,220
(0.05) (0.01) (0.10) (0.02) (2.22) (141.65) (12.25) (911.15) (974.21) (27,476) (886,993)
Note: This table reports raw results for performance indicators (see appendix 8B for variable definitions). The results are simple means for each one ofthe variables. Standard deviations are shown in parentheses. Column (1) presents the number of available observations per firm or group of firms used toobtain the estimations. However, when there are fewer observations for a specific variable, this number is shown under the standard deviation for such avariable.
Source: Author’s calculations.

468
Table 8E.1 Changes in Performance after Privatization for Telefónica del Perú
MeansFirst differences Diff. in diff.
Pre- Post- S-Franciac Kolmogorov-Sector privatization privatization t-test a Hotelling b Hotelling b prob � z Smirnov
Performance measure (Pi)
ProfitabilityReturn on sales (ROS) �0.0099 0.4083 �10.2639*** 105.3480*** 49.6114*** 0.1974 0.001***
(0.029) (0.028)Return on assets (ROA) 0.0024 0.1714 ��6.9935*** �48.9086*** 24.4539*** 0.3279 0.001***
(0.014) (0.021)Return on equity (ROE) 0.0036 0.3128 ��7.8995*** �62.4022*** 33.4508*** 0.2083 0.007***
(0.032) (0.014)
Operating efficiencySales efficiency (SALEFF)d 143.9187 455.3162 ��6.3317*** �40.0909*** 42.5110*** 0.0382 0.007***
(23.373) (47.931)Net income efficiency (NIEFF)d �0.9794 93.7577 ��8.3231*** �69.2732*** 47.2743*** 0.0299 0.008***
(3.662) (12.355)
EmploymentTotal employment (EMPL) 14125.6 5992.17 ��9.9687*** �99.3749*** 38.4810*** 0.1090 0.001***
(575.074) (543.713)
LeverageDebt to assets (LEV) 0.4999 0.4584 ��0.5444 ��0.2964 11.9149 0.8725 0.921
(0.055) (0.049)Debt to equity (LEV2) 1.2433 0.9228 ��0.7603 ��0.5781 11.6069 0.0026 0.921
(0.339) (0.170)

469
CoverageLines per worker (LINES) 39.6038 261.0051 ��8.0536*** �64.8610*** 0.0047 0.001***
(9.763) (78.008)
* Significant at the 10 percent level.** Significant at the 5 percent level.*** Significant at the 1 percent level.Note: First and second differences for changes in performance are shown, for each empirical proxy, using the mean values (see appendix table 8B.1 for
variable definitions). Columns 1 and 2 present the mean values before and after privatization (the year of privatization is 1994). Columns 3 and 4 showresults for two tests for significance in changes in performance after privatization (first differences): t-test (two-tailed Wilcoxon signed-rank test) and theHotelling test. Column 5 displays significance of difference-in-difference results using a Hotelling test (control group is the water and sanitation enterpriseSEDAPAL). Column 6 presents Shapiro-Francia test for normality. Finally, column 7 shows the results for the Kolmogorov-Smirnov (K-S) statistic, a non-parametric test used to formally test the equality of the empirical hazards functions of the different pre- and postprivatization performance indicators.
a. t-test for Ho (null hypothesis) for difference between means. Numbers are unequal.
where x is an l � k matrix of the means and S is the estimated covariance matrix.b. Test of equality:
c. Shapiro-Francia test for normality. Ho (null hypothesis) variable is normally distributed.d. Thousands of nuevos soles.Source: Author’s calculations.
T 2 � (x1 � x2) S�1(x1 � x2)�
t �(X1 � X2)
S x1 � x2�
(X1 � X2)
B(n1 � 1) s 2
1 � (n2 � 1) s 22
(n1 � n2 � 2)*B
1n1
�1n2

470
Table 8E.2 Changes in Performance after Privatization for Electrolima
Means
Pre- Post- S-Franciac Kolmogorov-Sector privatization privatization t-test a Hotellingb Hotellingb prob � z Smirnov
Performance measure (Pi)
ProfitabilityReturn on sales (ROS) �0.1811 0.2018 1�2.6239** 116.8848** 113.6440* 0.0032 0.017***
(0.320) (0.024)Return on assets (ROA) �0.0205 0.0661 1�4.2075*** 117.7033*** 117.5367** 0.2327 0.017***
(0.016) (0.004)Return on equity (ROE) �0.0335 0.0850 1�3.2998*** 110.8884*** 112.4812 0.0583 0.017***
(0.028) (0.005)
Operating efficiencySales efficiency (SALEFF)d 162.9284 803.5256 �12.5352*** 157.1316*** 119.0269*** 0.0155 0.002***
(16.391) (60.559)Net income efficiency (NIEFF)d �19.0959 163.0455 1�9.4166*** 188.6730*** 133.3117*** 0.0424 0.017***
(11.569) (16.074)
EmploymentTotal employment (EMPL) 4210.3 1855.60 1�7.2221*** 152.1582*** 150.8770*** 0.1292 0.002***
(239.607) (138.342)
LeverageDebt to assets (LEV) 0.4302 0.2208 1�5.1558*** 126.5819*** 115.2595*** 0.6949 0.001***
(0.023) (0.037)Debt to equity (LEV2) 0.7739 0.2952 1�4.7567*** 122.6259*** 148.3539*** 0.8744 0.002***
(0.069) (0.062)
First differences Diff. in diff.

471
CoverageLines per worker (LINES) 229.3598 794.4770 1�8.8517*** 178.3535*** 0.0183 0.002***
(57.742) (169.273)
* Significant at the 10 percent level.** Significant at the 5 percent level.*** Significant at the 1 percent level.Note: First and second differences for changes in performance are shown, for each empirical proxy, using the mean values (see appendix table
8B.1 for variable definitions). Columns 1 and 2 present the mean values before and after privatization (the year of privatization is 1994). Columns3 and 4 show results for two tests for significance in changes in performance after privatization (first differences): t-test (two-tailed Wilcoxonsigned-rank test) and the Hotelling test. Column 5 displays significance of difference-in-difference results using a Hotelling test (control group isbasd on Electro Oriente, Electro Sur, Electro Sur Este, and Electro Sur Medio for SALEFF, NIEFF, and EMPL). Column 6 presents Shapiro-Francia test for normality. Finally, column 7 shows the results for the Kolmogorov-Smirnov (K-S) statistic, a nonparametric test used to formallytest the equality of the empirical hazards functions of the different pre- and postprivatization performance indicators.
a. t-test for Ho (null hypothesis) for difference between means. Numbers are unequal.
where x is an l � k matrix of the means and S is the estimated covariance matrix.b. Test of equality:
c. Shapiro-Francia test for normality. Ho (null hypothesis) variable is normally distributed.d. Thousands of nuevos soles.Source: Author’s calculations.
T 2 � (x1 � x2) S�1(x1 � x2)�
t �(X1 � X2)
S x1 � x2�
(X1 � X2)
B(n1 � 1) s 2
1 � (n2 � 1) s 22
(n1 � n2 � 2)*B
1n1
�1n2

472
Table 8E.3 Changes in Performance after Privatization for Electroperú(Differences between means and difference-in-difference tests)
Means
Pre- Post- S-Franciac Kolmogorov-Sector privatization privatization t-testa Hotellingb Hotellingb prob � z Smirnov
Performance measure (Pi)
ProfitabilityReturn on sales (ROS) �0.8485 0.2229 �1.1486 111.3194 11.6025 0.0001 0.274
(0.605) (0.096)Return on assets (ROA) 0.0008 0.0300 �1.9676* 113.8716* 11.6639 0.4842 0.234
(0.008) (0.012)Return on equity (ROE) 0.0021 0.0483 �1.7341 113.0070 10.2457 0.5607 0.234
(0.015) (0.021)
Operating efficiencySales efficiency (SALEFF)d 205.7400 1222.7810 �10.7568*** 115.7089*** 45.2077*** 0.0177 0.003***
(57.770) (51.656)Net income efficiency (NIEFF)d �26.6490 285.7193 1�2.4842** 116.1711** 13.3408* 0.6345 0.197
(65.580) (119.717)
First differences Diff. in diff.

473
EmploymentTotal employment (EMPL) 1976.7 593.00 1�4.6217*** 121.3599*** 19.9168*** 0.3306 0.003***
(194.342) (30.257)
LeverageDebt to assets (LEV) 0.4757 0.4010 �1.1977 111.4345 3.5220* 0.0858 0.749
(0.035) (0.049)Debt to equity (LEV2) 1.0039 0.7000 �1.0279 111.0565 2.4812 0.0005 0.749
(0.185) (0.125)
CoverageLines per worker (LINES) 0.0034 0.0216 �6.8787*** 147.3159*** 0.0031 0.003***
(0.002) (0.008)
* Significant at the 10 percent level.** Significant at the 5 percent level.*** Significant at the 1 percent level.Note: For explanation, see appendix table 8E.2.Source: Author’s calculations.
474 TORERO
Notes
This chapter has been prepared for the project “Costs and Benefits of Privati-zation in Latin America” of the Inter-American Development Bank’s Latin Ameri-can Research Network. Dean Hyslop gave valuable advice on the econometricanalysis of these results; and Florencio López-de-Silanes, Alberto Chong, AlbertoPascó-Font, and all the participants in the IDB Research Network on Costs andBenefits of Privatization offered numerous and helpful comments. The author isalso indebted to the enormous effort and support of Virgilio Galdo throughout thisproject, as well as to his remarkably talented team of research assistants: DanielOda, Jorge de la Roca, Gissele Gajate, and Linette Lecussan. Finally, the authorthanks the Comisión de Promoción de la Inversión Privada (COPRI) for grantingaccess to the White Books of all the privatized firms.
1. All dollar amounts are U.S. dollars unless otherwise indicated.2. For the period 1987–92 the annual change in gross domestic product at
constant prices was �4.9 percent, annual inflation was 733.1 percent (reaching ahigh of 7,649.6 percent in 1990), and the real effective exchange rate depreciationfor the period was �2.04 percent.
3. According to Apoyo (2002), during the second half of 1985, the amount ofbanking deposits reached 23 percent of gross national product (GNP); five yearslater, in May 1990, bank deposits fell to 5 percent of GNP. A similar drop also oc-curred in the net internal credit of the banking system to the private sector (inter-est rates rose between 200 and 400 percent annually in real terms).
4. These figures are for the Lima metropolitan area; see Perú en Números1991, Cuánto S.A.
5. Apoyo (2002). 6. The first 26 CEPRIs initiated their operations in February 1992.7. This entailed the creation of the Commission for the Promotion of Private
Concessions in 1997, which was later absorbed by COPRI.8. The slowdown in privatizations between 1997 and 2000 is attributable to
domestic and foreign factors, among them, the Russian financial crisis, “El Niño,”and the Peruvian political crisis.
9. Telefonica was no stranger to the acquisition of Latin American telecom-munications providers, having already bought the former Teléfonos de Chile, cur-rently known as CTC, and Argentina’s ENTEL.
10. Although the monopoly was initially scheduled to expire in June 1999, theTdP moved the expiration forward to August 1, 1998.
11. This transaction corresponds to the shares not purchased by the workers ofBanco Continental and subsidiaries as part of their preferential right conferred byLD 674. In agreement with the contract, these shares had to be purchased by Hold-ing Continental S.A. at the auction price.
12. The privatization year is the year in which the government sold, for the firsttime, a certain amount of shares.
13. The test evaluates the closeness of the distributions �pre�priv and �post�priv
by computing the least upper bound of all pointwise differences | post�priv (x) �pre�priv (x)|. The K-S statistic can be written as:
The null hypothesis (H0 : post�priv � pre�priv) is accepted if post�priv issufficiently close to �pre-priv, in other words, if the value of D is sufficiently small orsmaller than the critical value at a certain significance level.
lll
D � supx[ ƒ lpost�priv(x) � lpre�priv(x) ƒ ]
l
l

14. Heterogeneity may also be present but can be controlled by pooling thedata.
15. For further details, see Arellano and Bond (1991, 1998).16. This statistic is distributed Chi-squared in the number of overidentifying re-
strictions. The null hypothesis is that the additional moment conditions are ap-proximately satisfied.
17. Hansen (1982) showed that the optimal weighting matrix for this class ofestimators is W � AsyVar[1/N Z�e], where Z is the N � L matrix of instrumentsand e is the N � 1 matrix of the GMM residuals. For the procedure followed forN observations, the optimal W is given by:
where zi is the ith row of Z and ei is the ith element of e, and GMMIV saves W ine(W).
18. Among the companies acquired, the most important are Lar Carbon, Sia,and Nisa, acquired by Cementos Lima; Petrolube, acquired by Mobil Oil; Enata,acquired by Tabacalera del Sur S.A.; Compania Minera Mahr Tunel and Compa-nia Minera Paragsha, acquired by Volcan; and Planta de Cemento Rioja, acquiredby Cementos Norte Pacasmayo.
19. An unweighted and locally weighted smoothing is carried out.20. Barber and Lyon (1996) suggest that sample firms must be matched to con-
trol firms with similar pre-event performance, which is especially difficult in stud-ies of privatized firms, but SEDAPAL went through the same reform as the priva-tized firms.
21. For this purpose a probit model was used to estimate the propensity score.For further reference, see Heckman and Hotz (1989); Heckman and others (1996);Heckman, Ichimura, and Todd (1997).
22. It is important to mention that Peru had possibly the most restrictive andprotective labor legislation of any Latin American country. After the successivewaves of reform in 1991 and 1995, no other country had so liberalized its labormarket (Lora and Márquez 1998; Márquez and Pagés 1998; Saavedra and Torero1999). Such drastic reform must be considered when looking at the impact of pri-vatization on employment.
23. Wages of the privatized firms increased significantly after privatization, inboth absolute and relative terms with respect to the industry. On average, salariesincreased 180 percent in the privatized companies and were 91 percent higher thanthe average of the specific industry of the privatized firm.
24. Note that, as in La Porta and López-de-Silanes (1999), the methodologyoverstates the contribution of layoffs, given the assumption that laid-off workershad zero productivity.
References
Arellano, M., and S. Bond. 1991. “Some Tests of Specification for Panel Data:Monte Carlo Evidence and an Application to Employment Equations.” Reviewof Economic Studies 58: 277–97.
———. 1998. Dynamic Panel Data Estimation Using DPD98 for Gauss: a Guidefor Users. Oxford, U.K.: Oxford University.
Apoyo. 2002. Análisis de coyuntura, perspectivas económicas, tendencias. Apoyo,Lima.
W � (1/N2)aN
i�1zizr
i e2i
PERUVIAN PRIVATIZATION: IMPACTS ON FIRM PERFORMANCE 475

476 TORERO
Barber, B., and J. Lyon. 1996. “Detecting Abnormal Operating Performance: TheEmpirical Power and Specification of Test Statistics.” Journal of Financial Eco-nomics 41: 539–99.
Boardman, Anthony, and Aidan R.Vining. 1989. “Ownership and Performance inCompetitive Environments: A Comparison of the Performance of Private,Mixed, and State-Owned Enterprises.” Journal of Law and Economics 32:1–33.
Boubakri, Narjess, and Jean Claude Cosset. 1998. “The Financial and OperatingPerformance of Newly Privatized Firms: Evidence from Developing Countries.”Journal of Finance 53 (3): 1081–110.
D’Souza, Juliet, and William L. Megginson. 1999. “The Financial and OperatingPerformance of Privatized Firms during the 1990s.” Journal of Finance 54 (4):1397–438.
Galal, A., L. Jones, P. Tandon, and I. Vogelsang, 1994. Welfare Consequences ofSelling Public Enterprises. Washington, D.C.: Oxford University Press for theWorld Bank.
Greene, W. 2000. Econometric Analysis, 4th ed. New York: Prentice-Hall.
Guasch, José Luis, and P. Spiller. 1999. Managing the Regulatory Process: Design,Concepts, Issues, and the Latin America and Caribbean Story. Washington,D.C.: World Bank.
Hansen, L. 1982. “Large Sample Properties of Generalized Methods of MomentsEstimators.” Econometrica 50: 1029–54.
Heckman, J., and J. Hotz. 1989. “Choosing among Alternative NonexperimentalMethods for Estimating the Impact of Social Programs: The Case of ManpowerTraining.” Journal of the American Statistical Association 84: 862–80.
Heckman, J., and J. Smith. 1995. “Assessing the Case of Social Experiments.”Journal of Economic Perspectives 9: 85–110.
Heckman, J., H. Ichimura, and P. Todd. 1997. “Matching as an Econometric Eval-uation Estimator: Evidence from Evaluating a Job Training Program.” Reviewof Economic Studies 64: 605–54.
Heckman, J., R. LaLonde, and J. Smith. 1999. “The Economics and Econometricsof Active Labor Market Programs.” In O. Ashenfelter and D. Card, eds., Hand-book of Labor Economics, vol. III. Elsevier, Amsterdam: North-Holland Press.
Heckman, J., H. Ichimura, J. Smith, and P. Todd. 1996. “Characterizing SelectionBias Using Experimental Data.” Econometrica 66: 1017–98.
Kikeri, Sunita, John Nellis, and Mary Shirley. 1994. “Privatization: The Lessonsfrom Market Economies.” World Bank Research Observer 9: 241–72.
La Porta, Rafael, and Florencio López-de-Silanes. 1999. “Benefits of Privatization:Evidence from Mexico.” Quarterly Journal of Economics 114(4): 1193–242.
Lora, Eduardo, and G. Márquez. 1998. “El problema del empleo en AméricaLatina: Percepciones y hechos estilizados.” Paper prepared for the meeting ofthe Governors of the Inter-American Development Bank, Cartagena, Colombia.
Mackenzie, G. 1998. “The Macroeconomic Impact of Privatization.” IMF StaffPapers 45 (2): 363–73.
Márquez, G., and C. Pagés. 1998. Ties That Bind: Employment Protection and Labor Market Outcomes in Latin America. Paper prepared for the meeting ofGovernors of the Inter-American Development Bank, Cartagena, Colombia.
Megginson, William, and Jeffry Netter. 2001. “From State to Market: A Survey ofEmpirical Studies on Privatization.” Journal of Economic Literature 39:321–89.
Megginson, William, Robert Nash, and Matthias van Randenborgh. 1994. “TheFinancial and Operating Performance of Newly Privatized Firms: An Interna-tional Empirical Analysis.” Journal of Finance 49(2): 403–52.
Rubin, D. 1974. “Estimating Causal Effects to Treatments in Randomized andNonrandomized Studies.” Journal of Educational Psychology 66: 688–701.
———. 1977. “Assignment to Treatment Group on the Basis of a Covariate.”Journal of Educational Studies 2:1–26.
———. 1979. “Using Multivariate Matched Sampling and Regression Adjustmentto Control Bias in Observational Studies.” Journal of the American StatisticalAssociation 74: 318–28.
Saavedra, J., and Máximo Torero. 1999. “Labor Market Reforms and Their Im-pact on Formal Labor Demand and Job Market Turnover: The Case of Peru.”Working Paper R-394. Inter-American Development Bank, Research Depart-ment, Washington, D.C.
Shleifer, Andrei. 1998. “State versus Private Ownership.” Journal of EconomicPerspectives 12(4):133–50.
Torero, Máximo, and Alberto Pascó-Font. 2001. “The Social Impact of Privatiza-tion and Regulation of Utilities in Peru.” WIDER Discussion Paper 2001-XX.
Torero, Máximo, Enrique Schroth, and Alberto Pascó-Font. 2004. “The Impact ofTelecommunications Privatization in Peru on the Welfare of Urban Con-sumers.” Economía 4(1).
Vickers, John, and George Yarrow. 1988. Privatization: An Economic Analysis.Cambridge, Mass.: MIT Press.
Vining, Aidan R., and Anthony Boardman. 1992. “Ownership versus Competi-tion: Efficiency in Public Enterprises.” Public Choice 73: 205–39.
PERUVIAN PRIVATIZATION: IMPACTS ON FIRM PERFORMANCE 477


Acronyms and Abbreviations
AFPs Administradoras de Fondos de Pensiones (Private pensionfunds) (Chile)
BCRA Banco Central de la Republica Argentina
BNDES National Social and Economic Development Bank (Brazil)
Btu British thermal unit
CAP Compañía de Acero del Pacífico (Chile)
CEO Chief executive officer
CEPRI Comité Especial de Privatizaciones (Special PrivatizationCommittee) (Peru)
CIIU Clasificación Industrial Internacional Uniforme (Manufacturing Industry Survey) (Bolivia)
CONPES Concejo Nacional de Política Económica y Social (National Council for Economic and Social Policy)(Colombia)
COPRI Comision de Promoción de la Inversión Privada (Commission for the Promotion of Private Investment)(Peru)
CORFO Corporación de Fomento (Chile)
CPI Consumer price index
CPT Compañía Peruana de Teléfonos (Peru)
CREG Comisión de Regulación de Energía y Gas (RegulatoryCommission for Energy and Gas) (Colombia)
CST Companhia Siderúrgica de Tubarão (Brazil)
479

DANE Departamento Administrativo Nacional de Estadística(National Statistics Department) (Colombia)
DEA Data Envelopment Analysis
EAM Encuesta Anual Manufacturera (Annual ManufacturingSurvey) (Colombia)
EDS Encuesta de Desarrollo Social (Argentina)
ENAP Empresa Nacional del Petróleo (Chile)
ENDE Empresa Nacional de Electricidad (Bolivia)
ENDESA Empresa Nacional de Electricidad S.A. (Chile)
ENFE Empresa Nacional de Ferrocarriles (Bolivia)
ENTEL Empresa Nacional de Telecomunicaciones (Bolivia, Chile,Peru)
EPM Public Enterprises of Medellín (Colombia)
FECUs Ficha Estadística Codificada Uniforme (Chile)
FFDP Fondo Fiduciario para el Desarrollo Provincial (Argentina,a World Bank–IDB-created fund)
FGLS Feasible generalized least squares
FGTS Fundo de Garantia de Tempo de Serviço (Workers’Tenure Guarantee Fund) (Brazil)
GDP Gross domestic product
GLS Generalized least squares
GMM-IV Generalized method of moments instrumental variables
GNP Gross national product
GWh Gigawatt hour
IFI Instituto de Fomento Industrial (Institute for IndustrialPromotion) (Colombia)
ISA Interconexión Eléctrica S.A. (Colombia)
IV Instrumental variable
kWh Kilowatt hour
LAB Lloyd Aéreo Boliviano (Bolivia)
LAD Least absolute deviation
480 ACRONYMS AND ABBREVIATIONS

LD Legislative decree
MPU Municipal public utility
MW Megawatt
NPD National Program of “Destatization” (Brazil)
OLS Ordinary least squares
OSINERG Organismo Supervisor de la Inversión en Energía (Supervisory Agency for Private Investment in Energy)(Peru)
OSIPTEL Organismo Supervisor de Inversión Privada en Telecomunicaciones (Supervisory Agency for Private Investment in Telecommunications) (Peru)
OSN Obras Sanitarias de la Nación (Argentina)
PCS Personal communications services
PPA Power purchase agreement
PPE Property, plant, and equipment
PPI Producer price index
PQ Privatization Q
PVR Present value of revenue
ROA Return on assets
ROE Return on equity
RPU Regional public utility
SEDAPAL Empresa de Servicio de Agua Potable y Alcantarillado de Lima (Peru)
Sendos Servicio Nacional de Obras Sanitarias (Chile)
SIC Standard Industrial Classification
SIRESE Sistema de Regulación Sectorial (Bolivia)
SOE State-owned enterprise
Subtel Subsecretaría de Telecomunicaciones (Chile)
SUNASS Superintendencia Nacional de Servicios de Saneamiento(National Office for Services of Sanitation) (Peru)
TdP Telefónica del Perú S.A. (Peru)
ACRONYMS AND ABBREVIATIONS 481

TFP Total factor productivity
WSP Water and sewerage provider
YPF Yacimientos Petrolíferos Fiscales (Argentina)
YPFB Yacimientos Petrolíferos Fiscales Bolivianos
482 ACRONYMS AND ABBREVIATIONS

Aaccounting information
Chile, 200, 213–14and noncomparable data, 17,
58n15Peru, 423
accounting standards, 56, 213Aerolineas Argentinas, 107AFPs. see private pension funds
(AFPs)Africa, 4, 58n6age, and worker displacement,
97–98, 99, 114n26agency, and privatization, 119–20Aguas Argentinas, 91, 92–93, 106–7Aguas de Corrientes, 92Aguas del Illimani, Bolivia, 127–28Aguas del Tunari, Bolivia, 127airlines sector, 36
Argentina, 107Chile, 219
airports, Chile, impact ofprivatization on, 238–42,268t5A.9, 269t5A.10,272nn26–30
Allende, Salvador, 197, 198, 205allocative efficiency, Mexico,
370–72Alonso, Juan, 277Annual Manufacturing Survey
(EAM), 291, 344n15
Annual Survey of Social Data(RAIS), Brazil, 163, 193n5
antiprivatization sentiment, 409Antitrust Commission, Chile,
225–26, 272n19Anuatti-Neto, Francisco, 17, 28,
145–96Apoyo, 474n3Argentina
airlines sector, 107banking sector, 69, 79t2.4,
86–90, 108, 112, 113n19data collection, 15electricity sector, 106employment,
banking sector, 87, 89t2.8, 90 displaced workers, 96–103,
104, 114n24–29gas sector, 105oil industry, 108postal services, 108privatization
program overview, 70–73results for nonfinancial firms,
74–86, 112–13nn6–18sample studied, 73–74,
75–76t2.2, 77–78t2.3,79t2.4, 112nn3–4
study overview, 67–70railroad sector, 107, 112nn3–4
483
Index
Note that f indicates figure, n indicates note (nn is notes), and t indicates table.

Argentina (continued)sanitation services, 68, 70,
90–96, 106–7shipping, 108steel manufacturing, 108telecommunications sector, 85,
105–6water services, 68, 70, 90–96,
106–7, 113n17Argentine Financial System, 86Arin, Kermin, 40Ariyo, Ademola, 55–56Artana, D., 92assets
Brazil, 155, 186–92tt4C.1–4C.4Chile, 218–19, 254f5A.2,
255–56t5A.3, 257f5A.3,263t5A.6, 272n18
Mexico, 356t7.4, 357changes in, 359, 360t7.5in competitive vs.
noncompetitive industries,359, 361–62t7.6, 363
Peru, 433t8.6assets to employment ratio, Peru,
430auctions
Bolivia, 123Brazil, 145, 146–47, 151,
152t4.2, 165–66proceeds from, 171–72
Chile, 202–3, 207, 211infrastructure, 238, 242,
272n27Mexico, 374, 375t7.12, 376,
402n20Peru, 414requirements of, 40–41, 374,
375t7.12, 376, 402n20for SOEs, 40–41
Bbailouts, 27Baltagi, B. H., 194n13Banco Central de la Republica
Argentina (BCRA), 86Banco Continental, 445, 446t8.11
Banco do Brasil, 172banking sector
Argentina, 108, 112impact of privatization on,
86–90, 104, 113n19included in research
database, 79t2.4operating efficiency of, 69,
87, 88t2.7, 89t2.8, 90Brazil, 172Chile
government take over of, 208
regulation of, 208–9, 271n9and corporate governance, 56Mexico, 382–83, 400n4,
402–3n25loans, 384–88, 384f7.6performance indicators, 383,
384f 7.6reregulation of, 382–83,
402–3n25ownership of, 6Peru, 424, 430t8.5, 431,
438–44, 460–61t8C.2, 474n3performance of, 442–43t8.9
bankruptcy, 56, 391Barber, B., 475n20Barberis, Nicholas, 120Barja, Gover, 121Barossi-Filho, Milton, 17, 145–96Basser, G., 81Bayliss, Kate, 36, 37, 49BCRA. see Banco Central de la
Republica Argentina (BCRA)Berg, Sanford, 276bias, 6, 8–17, 407bidding process, 39Birdsall, Nancy, 37, 59n19blue-collar workers
Bolivia, 133Colombia, 304layoffs, 32Mexico, 364Peru, 444–45
BNDES, 151, 171–72, 173,180–81t4A.2, 194n9
484 INDEX

Bogota Power Company, 288, 305–6Bolivia
data collection, 15employment, 133, 135t3.4, 136,
139–41t3A.2foreign investment, 125privatization
adoption of capitalization asmethod of, 123–28
analysis of study results,130–36, 139–41t3A.2,142nn11–13
arguments for and against,119–20, 142n2
data collection, 128–29,142nn8–10
empirical studies of, 121industry-adjusted data,
134–36, 142n13list of privatized firms,
137–39t3A.1objectives of, 118, 119t3.1overview, 121–24variables used to evaluate
impact of privatization,139–41t3A.2
sanitation services, 128telecommunications sector,
126–27water sector, 127–28
Bonilla, J., 277Bortolotti, Bernardo, 40Boubakri, Narjess, 120, 418Brazil
data collection, 17net-taxes-to-sales ratio, 28privatization
benefits and costs of, 162–69and capital ownership,
167–68components of, 146–47costs of, 162–69empirical analysis of data,
153–62, 153t4.3,184–86t4B.1,186–92tt4C.1–4C.4,194nn10–11, 194nn13–14
at federal level, 147–48,175–79t4A.1,180–81t4A.2
impact of capital markets on,168, 170
impact of fiscal discipline on,169
impact on employment,163–65, 166f4.1,194–95nn15–16,194–95nn15–16
impact on prices, 165–67literature review of, 148–49,
194nn6–7perspectives on, 171–73,
195n22program description and
sample coverage, 150,150t4.1, 151
public opinion of, 170–71,174, 195nn20–21
revenues from, 28study data set and variables,
149–53, 194nn8–9summary and conclusions
about, 173–74Brazilian elites, 171British Airways, 120British Telecom, 302budget deficits, Brazil, 169budgets, Chile, 198bureaucratic quality index, 40
CCampos-Méndez, Javier, 56Capital Federal, Argentina, 91, 95capital markets
absence of, 55–56Brazil, 168, 170Chile, 198and methods of capitalization,
40Mexico, 389–91
capital ownership, Brazil, 167–68,170
capital-to-labor ratio, Colombia,299, 303
INDEX 485

capitalizationArgentina, banking sector, 90Bolivia, 122, 123, 125
as means of privatization,123–28
Mexico, 389, 390f7.9Capra, Katherina, 15, 117–44Cardoso, Fernando Henrique, 169Carey, Alan, 56Cauca Valley Corporation, 305–6cellular phones, 447cement mills, Colombia, 301–2Central Interconnected System,
Chile, 223CEPRIs. see Special Privatization
Committees (CEPRIs), Peruchild mortality
Argentina, 68, 70, 104, 113n17and water delivery services, 38,
95Chile
airline sector, 219Antitrust Commission, 225–26,
272n19banking sector, 208–9, 271n9data collection, 15electricity sector, 198, 200, 201,
205, 212 node prices, 224, 227,
229t5.12privatization process, 221–22and productivity, 227,
228t5.10, 229t5.11regulatory framework,
222–25, 226–30,231t5.13, 272nn20–11
residential rtes, 227,229t5.12
ports, 202, 203, 271n4, 242–46,272nn31–32
privatization, 20, 21f1.5concessions in operations,
238–42, 268t5A.9,269t5A.10, 272n26
data on privatized firms,213–16, 271nn11–14,271–72nn16–17
historical perspective,197–98, 203–6, 206–13,271nn6–10
impact on airports, 238–42,268t5A.9, 269t5A.10,272nn26–30
impact on assets andinvestments, 218–19,254f5A.2, 255–56t5A.3,257f5A.3, 263t5A.6,272n18
impact on efficiency, 218,252–53t5A.2, 261t5A.5
impact on electricity sector,221–22
impact on employment,219–20, 265t5A.7
impact on firms, 216–20,249–67(Appendix 5A)
impact on highways, 238–42,268t5A.9, 269t5A.10,272nn26–30
impact on infrastructure,202–3, 237–38, 271nn4–5
impact on operatingefficiency, 218,252–54t5A.2, 261t5A.5
impact on productivity, 219,254f5A.2, 266–67t5A.8
impact ontelecommunicationssector, 221–22
of SOEs, 199–200, 207t5.4,210–13, 271n2, 271n10
and state intervention ineconomy, 203–6,271nn6–7
of utilities industry, 201–2,271n3
regulatory framework, 214,247–48
sales-to-employment ratio, 20,21f1.5
Chilean Securities and ExchangeCommission, 214
Chilectra, Chile, 205, 215, 221,227, 229t5.11, 230
486 INDEX

China, 4Chisari, Omar, 54Chong, Alberto
“Privatization and FirmPerformance in Bolivia”,117–44
“Privatization in Mexico”,349–405
“The Truth about Privatizationin Latin America”, 1–66
Claessens, Stijn, 120CNT, Chile, 221, 236Codelco, Chile, 204–5, 212Colbún, Chile, 212, 215Colombia
concession contracts, 278,329t6A.1
data collection, 15and deregulation, 277–79,
343n3, 343n5economic liberalization of,
275–76, 343nn1–2infrastructure, 278, 329t6A.1performance indicators for IFI
firms, 332, 345n35privatization
data sets, 291–92, 336,337t6D.1, 344n15
econometric analysis ofmanufacturing sector,315–23, 345n31, 345n33
efficiency gains inmanufacturing sector,197t6.7, 294–95t6.6, 299
impact on manufacturingsector, 292–305, 344n17
impact on profitability, 19,293, 294–95t6.6, 295,296–97t6.7, 298
impact on thermal plants,311, 312f6.5, 313–15,340–42t6E.1, 345n27,345n29
indicators for IFI firms insample, 333–36t6C.1
manufacturing, 279–84, 302,343nn8–9
natural gas and gasolinedistribution, 284–86,343nn10–12
overview, 277–79, 343n3,343n5
performance in power sector,305–13, 314t6.11,345n25, 345n27
and productivity inmanufacturing sector,294–95t6.6, 296t6.7,299–303, 344n22
restructuring of power sector,286–88, 289–90t6.4,344n13
profitability gap betweenprivatized and private firms,24–25, 58n16
regulatory framework, 275, 276,343nn1–2
thermal plantsinput and output variables,
339t6D.2statistical analysis of power
plant efficiency scores,324–27, 345n34
variables, electricity sector, 313,314t6.11
Commission for the Promotion ofPrivate Investment (COPRI),Peru, 410, 411
Compañía Peruana de Teléfonos(CPT), 413–14, 424
competition, 408Chile, 201, 225, 236–67Colombia, 316, 328and deregulation, 53Mexico, 359, 361–63,
401n14and politics, 53–54
CONASTIL, Colombia, 284concession contracts, 51, 54–55
Chile, 198in construction of highways
and airports, 238–42,268t5A.9, 269t5A.10,272n26
INDEX 487

concession contracts (continued)for port management and
operation, 242–46,272nn31–32
utility services, 223Colombia, 277–78
infrastructure, 278, 329t6A.1Mexico, 379–80Peru, 413, 417–18, 474n7
conglomerates, Chile, 208–9consumer price index (CPI), 401n9
Argentina, 80Brazil, 166–67
consumer welfare, 36–39,59nn18–19
consumers, exploitation of, 32–36,58–59n17
contract theory, 119contracts
Argentina, for privatized SOEs,73–74, 112nn3–4
Bolivia, shared-risk, 122Mexico, 353, 354t7.3
types of, 378–80types of, 49, 51, 378–80see also concession contracts
cooperatives, Bolivia, 125, 127COPRI. see Commission for the
Promotion of PrivateInvestment (COPRI), Peru
CORELCA, Colombia, 288Corporación de Fomento
(CORFO), Chile, 204–6,271n7
Corporación Nacional Forestal,Chile, 206
Corporación Regional de la CostaAtlantica, 305–6
corporate governance, 55–56Mexico, 388–91
corporate structure, Colombia, 298Correos y Telégrafos, Chile, 221corruption, 39
lack-of-corruption index, 40Cosser, Jean Claude, 418costs per unit. see unit costsCPI. see consumer price index (CPI)
CPT. see Compania Peruana deTelefonos (CPT)
credit market, Argentina, 90creditor rights, Mexico, 389–91cross-country firm-level analyses, 39
bias of, 8, 58n9cross-section studies, 120cross-subsidies, 28Crosser, Jean-Claude, 120CTC, Chile, 221currency, devaluation of, 169,
195n19
Dda Silva, Lula, 173data
adjusted ratios, 23, 24–36availability of, and sample
selection, 8, 58n9firm-level data, 40industry-adjusted
Bolivia, 139–41t3A.2Brazil, 163Colombia, 296–97t6.7, 302Mexico, 358–59, 360t7.5,
401n13noncomparable, 17–18, 58n15nonpublic information, 15on privatization in Latin
America, 15, 16f1.3raw data, 19–23within-country data, 40see also names of specific
countriesDe la Madrid administration, 380De Souza, A., 171DEA efficiency scores, 324–27,
345n34debt
Brazil, 169, 173capitalization of, 206Mexico, 369–70, 371t7.3, 377SOEs, 377
debt-to-asset ratio, Chile, 208decentralization
Bolivia, 121–22Mexico, 355
488 INDEX

demand-side growth, Colombia,302, 344n23
deregulation, 52–55, 59n24Chile, 233, 236Colombia, 277–79, 343n3,
343n5Mexico, 380–81, 389
developing countries, proceedsfrom privatization, 5, 5t1.1
difference-in-difference estimates,112n6
Argentina, 82, 83t2.6, 84, 85,87, 90, 92, 94t2.10
Bolivia, 130Peru, 435–36t8.7, 437
disclosures, 51and corporate governance, 56
displaced workers, 29–32divestitures, Chile, 215dividends-to-net-operating-income
ratio, Brazil, 155–56,186–92tt4C.1–4C.4
Djankov, Simeon, 120, 391downsizing programs, 43,
44–47t1.4, 48, 49D’Souza, Juliet, 120, 408
EEAM. see Annual Manufacturing
Survey (EAM)Earle, John, 58n4Eckel, Catherine, 120Eckel, Doug, 120economic growth
Bolivia, 121, 134Brazil, 168, 170Chile, 198Mexico, 352–53, 400nn1–2
ECOPETROL, Colombia, 284–86,343nn10–11
Edelnor, Chile, 212EDS. see Encuestra de Desarrollo
Social (EDS)education, Mexico, 371–72efficiency gains
Argentina, 69, 80, 104Bolivia, 130, 134
Chileimpact of privatization on,
218, 252–53t5A.2,261t5A.5
port services, 246Colombia, 311, 328
manufacturing sector,197t6.7, 294–95t6.6, 299
power sector, 306statistical analysis of power
plant efficiency scores,324–27, 345n34
and deregulation, 52–53Mexico, 402n19and profits, 23
electricity sectorArgentina, 85, 106Bolivia, 124, 125–26
reform throughcapitalization, 125
Brazil, 164t4.5, 165, 172–73impact of privatization on
prices of, 167Chile, 198, 200, 201, 205, 212
node prices, 224, 227,229t5.12
privatization process, 221–22and productivity, 227,
228t5.10, 229t5.11regulatory framework,
222–25, 226–30,231t5.13, 272nn20–22
residential rates, 227,229t5.12
Colombiaefficiency variables, 313,
314t6.11restructuring of, 286–88,
289–90t6.4, 343n13impact of privatization on, 36,
38Peru, 413, 416–17, 416f8.3,
431, 437, 470–71t8E.2,472–73t8E.3privatization in, 458–59t8C.1
Electrolima, Peru, 437,470–71t8E.2
INDEX 489

Electroperú, 437, 472–73t8E.3Eletrobras, Brazil, 172employee-wealth-transfer
hypothesis, 382–84employment, 408
Argentinabanking sector, 87, 89t2.8, 90displaced workers, 96–103,
104, 114nn24–29impact of privatization on, 84as measure of profitability, 81
Bolivia, 133, 135t3.4, 136,139–41t3A.2
Brazil, 163–65, 166f4.1,194–95nn15–16
changes in postprivatization, 21,22f1.6, 23
Chile, 200, 219–20, 265t5A.7Colombia, 306, 307–8t6.9,
309–10t6.10competitive vs. noncompetitive
industries, 34, 34f1.13displaced workers, 29–32hiring policies, 43, 48, 48f1.14,
50t1.6, 59n23layoffs, 32Mexico, 356t7.4, 357
changes in, 359, 360t7.5in competitive vs.
noncompetitive industries,359, 361–62t7.6, 363
during Salinasadministration, 354–55
impact of privatization on,375t7.12, 376–78,402nn21–22
postprivatization, 383,403n26
role of transfers fromworkers, 363–64, 365t7.7,402n15
Peru, 410, 433t8.6, 448impact of privatization on,
444–47, 475nn22–24power sector, 306
postprivatization, 29see also labor force
Empresa Ferroviaria Andina,Bolivia, 138t3A.1
Empresa Ferroviaria Oriental,Bolivia, 138t3A.1
Empresa Nacional de Correos yTelégrafos, 108
Empresa Nacional de Electricidad(ENDE), Bolivia, 124,125–26
Empresa Nacional deTelecommunicaciones,Bolivia, 124, 126–27,138t3A.1
Empresa Nacional deTelecommunicaciones(ENTEL), Peru, 413–14, 424
Encuestra de Desarrollo Social(EDS), 93–94
ENDE. see Empresa Nacional deElectricidad (ENDE), Bolivia
ENDESA, Chile, 215, 221, 223Enersis, Chile, 223Engel, Eduardo, 51, 55, 241ENTEL. see Empresa Nacional de
Telecommunicaciones(ENTEL), Peru
ENTEL, Chile, 221, 236ENTEL PCS, Chile, 235enterprises
Argentina, impact ofprivatization on, 111t2B.2
availability of data, and sampleselection, 8, 58n9
Boliviaanalysis of study results,
130–36, 139–41t3A.2,142nn11–13
data sample, 128–29,142nn8–10
list of privatized firms,137–39t3A.1
Brazil, list of privatized firms,151, 152t4.2
Chile, data on privatized firms,213–16, 271nn11–14,271–72nn16–17
490 INDEX

ColombiaIFI list used in sample,
330–31t6B.1sale of under privatization
program, 278, 279t6.1and data collection efforts, 15,
16f1.3Mexico
auction process andrequirements, 374,375t7.12, 376, 402n20
data collection, 422–30,449–50(Appendix 8A),475nn18–19
firm and industrycharacteristics, 374,375t7.12
and market power, 359,361–63, 401n14
raw data concerning,355–58, 401nn9–12
restructuring programs,375t7.12, 376–78,402nn21–23
mixed-capital, 280noncomparable data concerning,
17–18, 58n15performance after privatization,
8, 9–14t1.2see also state-owned enterprises
(SOEs)EPM. see Public Enterprises of
Medellin (EPM), Colombiaequity transfer programs,
Colombia, 280, 284, 302Estache, Antonio, 54, 56Europe, and firm-level data, 18,
58n15ex ante rents, 272n32export diversification, 295
FFantini, Marcella, 40FECUs. see Ficha Estadistica
Codificada Uniforme(FECUs), Chile
Fepassa, Chile, 211–12
Fernandes, R., 194n15Ferrocarriles Argentinos, 107, 112n2Ferronor, Chile, 211FFDP. see Fondo Fiduciario para el
Desarrollo Provincial (FFDP)FGTS. see Workers’ Tenure
Guarantee Fund (FGTS),Brazil
Ficha Estadística CodificadaUniforme (FECUs), Chile,213–14, 215
financial sectorPeru, 410, 413, 416f8.3, 418,
424, 430t8.5, 438–44,460–61t8C.2, 474n3,474n11impact of privatization on,
447see also banking sector
firm-level data, 18, 40, 58n15firms. see enterprisesfiscal management
Brazil, 169Chile, 198, 271n1Mexico, 367–70, 371f7.3
Fischer, Ronald, 15, 51, 53, 55,197–274
Fondo Fiduciario para el DesarrolloProvincial (FFDP), 87
foreign direct investmentBrazil, 168–69Mexico, 369, 370t7.10
foreign investmentBolivia, 125, 142n13Colombia, 320Peru, 410, 411
foreign trade, 316franchises
Chile, 237–38, 272nn27–28United Kingdom, 272n29
free press, Chile, 200Frei administration, 202freight road transport, Mexico,
366–67t7.8frentes de atraque, 243–45Frydman, Roman, 120Fujimori, Alberto, 409, 410
INDEX 491

GGalal, Ahmed, 36, 120, 407Galetovic, Alexander, 51, 55, 241Galiani, Sebastián, 15, 37–38,
67–116Garay, Luis Jorge, 344n23Garrón, Mauricio, 15, 117–44gas distribution industries, Brazil,
165Gas Natural, Colombia, 284, 286gas sector, Argentina, 105gasoline distribution, Colombia,
284–86, 343nn10–12GDP. see gross domestic product
(GDP)Gehlbach, Scott, 58n4Gerchunoff, P., 71Gertler, Paul, 15, 67–116Giambiagi, F., 148Gledson de Carvalho, Antonio, 17,
145–96GMM-IV estimation, 422goods and services
demand for, 320public vs. private provision of,
119–20government, 40
Braziland fiscal management, 169privatization at federal level,
147–48, 175–79t4A.1,180–81t4A.2
Chile, state intervention ineconomy, 203–6, 271nn6–7
maintenance of infrastructure, 49Mexico, 352, 400n3
expropriation of privatecompanies, 355, 401n6
fiscal impact on privatizationprograms, 367–70
and SOEs, 351–53, 400nn1–4and types of privatization
contracts, 378–80Peru, role in privatization
process, 410–11and privatization contracts, 49,
51, 378–80
Government Development Plan(1990), Colombia, 277
Greene, W., 422gross domestic product (GDP)
Brazil, tax burden as percent of,173, 195n23
Chile, losses of financial sectoras percent of, 208
market capitalization as percentof, 389, 390f7.9
and SOEs, 3–4, 4f1.1gross margin rate, manufacturing
sector, 294t6.6, 296t6.7,344n19
Grubel, Herbert, 316Guasch, José Luis, 51, 55, 343n2Gutierrez, Luis, 276Gutiérrez, Rodrigo, 15, 37,
197–274
HHachette, Dominique, 246, 271n2Hansen’s J statistic, 422Heckman, J., 420–21Hidronor, Argentina, 106highways
Chile, 202, 238–42, 268t5A.9,269t5A.10, 272nn26–30
Mexico, 379Hotelling test, 420hydrocarbons industry, Bolivia,
124, 126Hydrocarbons Law, Bolivia, 126
IIchimura, H., 421Icollantas, Colombia, 343n8IFI. see Instituto de Fomento
Industrial (IFI), Colombiaimmigration, Peru, 411import substitution, 295incentives, 51income
Argentina, banking sector, 87,88t2.7, 89t2.8
see also wagesincome guarantees, 51
492 INDEX

India, and SOEs, 4–5industry-adjusted data, 23, 24–26
Bolivia, 139–41t3A.2, 142n13Brazil, 163changes in wages, 29, 30f1.10,
32Colombia
for IFI firms in, 296–97t6.7,302
manufacturing sector, 293,296–97t6.7, 344n17,344n19, 344nn22–24
power sector, 306,309–10t6.10, 311, 313
Mexico, 358–59, 359, 360t7.5,401n13
inflation, Chile, 200infrastructure
Bolivia, 125Chile, 198
franchises, 238, 272n27impact of privatization on,
202–3, 237–38, 238–42,268t5A.9, 269t5A.10,271nn4–5, 272nn26–30
Colombia, concession contractsfor, 278, 329t6A.1
government maintenance of, 49Mexico, and privatization
contracts, 379–80Peru, 411and privatization contracts, 49,
51, 379–80railroad, 37
Instituto de Fomento Industrial(IFI), Colombia, 279–84,327–28, 343nn8–9
analysis of performance inmanufacturing, 292–305,344n17
data sets, 291–92, 336,337t6D.1, 344n15
list of firms used in sample,330–31t6B.1
manufacturing plants,econometric analysis of,315–23, 345n31, 345n33
performance indicators for IFIfirms, 332, 345n35
Instituto Nacional de InvestigacionAgropecuaria survey,271n13
insurance mechanisms, 51Inter-American Development Bank,
121–22Interbanc, 445, 446t8.11Interconexión Eléctrica S.A.,
Colombia, 286–88intercountry studies, 120–21interest rates, Chile, 208, 209investment-spending-on-machinery-
to-total-investment ratio,Colombia, 302
investment-to-employee ratioChile, 218Colombia, 301
investment-to-physical assets (PPE)ratio
Chile, 218, 219, 254f5A.2Mexico, 357
investment-to-sales ratioChile, 218, 218–19, 257f5A.3Colombia, 344n23
investments, 23, 44Argentina, 85
as measure of performance,81
and success of SOEs, 71Bolivia, 133–34, 139–41t3A.2Brazil, 185t4B.1Chile, impact of privatization
on, 218–19, 254f5A.2,255–56t5A.3, 257f5A.3,263t5A.6, 272n18
Colombia, power sector, 306,307t6.9, 309–10t6.10
Mexico, 356t7.4, 357, 369changes in, 359, 360t7.5in competitive vs.
noncompetitive industries,359, 361–62t7.6, 363
impact of privatization on,377
Peru, 409, 413
INDEX 493

investments (continued)impact of privatization on,
313f8.1, 411, 412t8.1,413
iron and steel industryArgentina, 108Brazil, 156–57
ISNSA, Chile, 214
JJerome, Afeikhena, 55–56
KKoenker,, R., 81Kolmogorov-Smirnov (K-S) test,
420, 432Kornai, J., 195n18
LLa Porta, Rafael, 6–68, 8, 15, 29
on creditor rights, 391employment issues, 445intercountry studies, 120labor force in Mexico, 133on positive aspects of
privatization, 407–8preprivatization process, 214–15privatization study in Mexico,
82, 85use of difference in difference
estimators, 112n6labor costs, 28–29, 31f1.11
Colombia, 304labor force
Argentina, 96–103, 104,114nn24–30
Mexico, 377postprivatization, 21, 22f1.6and restructuring prior to
privatization, 42–43,44–47f1.4
unskilled workers, 32see also employment
labor productivity. see productivitylack-of-corruption index, 40Lalonde, R., 421Lamounier, B., 171
LAN Chile, 219land reform, Chile, 205, 206Larraín, Felipe, 198last-mile technology, 237layoffs
Argentina, 84, 85, 96–97Bolivia, 133British Telecom, 302Mexico, 364Peru, 445, 446t8.11and profitability after
privatization, 29, 31f1.11Lerner indexes, 293, 294t6.6,
296t6.7, 315, 344n17Levine, Ross, 168Lloyd Aéreo Boliviano, 124,
138t3A.1Lloyd, Peter, 316loans, 28
Mexico, 385–88, 391López-Calva, Luis F., 3López-de-Silanes, Florencio, 67–68,
82, 85employment issues, 445intercountry studies, 120labor force in Mexico, 133on positive aspects of
privatization, 407–8preprivatization process, 214–15“Privatization and Firm
Performance in Bolivia”,117–44
“Privatization in Mexico”,349–405
“The Truth about Privatizationin Latin America”, 1–66
use of difference in differenceestimators, 112n6
Lora, Eduardo, 145, 171Lüders, Rolf J., 16, 246, 271n2Lyon, J., 475n20
MMacedo, Roberto, 17, 145–96Machicado, Carlos, 15, 117–44management
banking sector, 385
494 INDEX

Mexico, 376of SOEs, 3
manufacturing sectorColombia
econometric analysis of,315–23, 345n31, 345n33
performance in, 292–305,344n17
privatization data sets,291–92, 336, 337t6D.1,344n15
privatization of, 279–84,343nn8–9
profitability of, 25market power
abuse of, 32–36, 58–59n17Mexico, 359, 361–63, 381–82,
401n14market share, manufacturing sector,
294, 294–95t6.6, 295,296t6.7
markupsColombia, 293, 295, 298f6.1
for IFI firms, 315, 316,317–19t6.12, 320
Martin, Stephen, 120media, Brazil, 171Megginson, William L., 120, 145,
174, 407, 408, 432Melón Tunnel, Chile, 240, 272n27Menem, Carlos, 70–71mergers and acquisitions, 17
Brazil, 156Chile, 215
Mexicoand allocative efficiency, 370–72banking sector, 382–83,
384f7.6, 384–88, 400n4,402–3n25
data collection, 15deregulation, 380–81employment, 354–55, 375t7.12,
376–78, 402nn21–22growth of SOEs, 351–53,
400nn1–4net-taxes-to-sales ratio, 28,
357
privatizationauction process and
requirements, 374,375t7.12, 376, 402n20
data on firms, 8definitions of variables,
394–400t7A.1firm and industry
characteristics, 374,375t7.12
fiscal impact of, 367–70,371f7.3
historical perspective,353–55, 401nn5–6, 401n8
impact on corporategovernance, 388–91
impact on employment,375t7.12, 376–78, 383,402nn21, 403n26
industry-adjusted data,358–59, 360t7.5, 401n13
and market power, 359,361–63, 401n14
raw data utilized, 355–58,401nn9–12
restructuring programsutilized, 372–78,402nn18–23, 350
role of transfers fromworkers, 363–64, 365t7.7,402n15
social impact of, 357types of contracts written,
378–80public services, 364, 366–67t7.8reregulation, 381–88,
402–3nn25–26restructuring programs,
375t7.12, 372–78,402nn18–23, 350
sales-to-employment ratio, 20,21f1.5, 357
variables, 356t7.4, 359, 360t7.5,393, 394–400t7A.1
military government, Chile, 206Miller, Merton, 389mining sector, Peru, 413, 416f8.3
INDEX 495

mixed-capital enterprises, 280, 298mobile phones, 232, 235, 272n23Modigliani, Franco, 389monitoring mechanisms, 51monopolies, Chile, 225, 248Montero, Marcelo, 121
NNash, Robert C., 120National Council for Economic and
Social Policy, Colombia, 277National Institute for Social
Security, Mexico, 352National Program of Destatization
(NPD), 146natural gas sector
Colombia, 284–86, 343nn10–12export industry, 126Mexico, 366–67t7.8
Navajas, F., 92Nellis, John, 37, 59n19net-income-to-equity ratio, Chile,
216t5.6net-income-to-physical assets (PPE)
ratioChile, 217, 260f5A.4Mexico, 359
net-income-to-sales ratio, 19, 20f1.4Argentina, 69, 80, 82, 82t2.5Chile, 215Colombia, 293, 294t6.6gains in, 29Mexico, 358–59pre- and postprivatization, 24,
25f1.8and worker transfers, 29,
31f1.11net prices, 40–41, 59n20
and labor force restructuringpreprivatization, 42–43,44–47t1.4
and restructuring methods, 42net-taxes-to-sales ratio, 156–57
Brazil, 28Mexico, 28, 357
net-worth-to-assets ratio,Argentina, 90
Netter, Jeffry M., 145, 174, 407,432
Newberry, David, 120nickel processing plants, 302node prices, Chile, 224, 227,
229t5.12nominal interest rates, Mexico,
382nonfinancial firms
Argentinadata collection, 74,
74–75t2.2, 77–78f2.3impact of privatization on,
74–86, 109–10t2B.1,112–13nn6–18
Chile, 203Peru, 424, 427t8.4
included in privatizationstudy, 424, 425–26t8.3
not included in privatizationstudy, 427t8.4
NPD. see National Program ofDestatization (NPD)
OObras Sanitarias de la Nacion
(OSN), 91, 106–7, 114n20oil industry
Argentina, 108Brazil, 172
Okten, Cagla, 40oligopolistic powers, 52, 53operating costs, Mexico, 357,
401n12operating-costs-to-sales ratio,
Brazil, 155operating efficiency, 19, 20f1.4
Argentina, 81, 84banking sector, 87, 88t2.7,
89t2.8, 90Bolivia, 130Brazil, 154–55, 161–62,
185t4B.1, 186–87t4C.1changes after privatization, 20,
21f1.5Chile, 218, 252–54t5A.2,
261t5A.5
496 INDEX

Colombia, 306, 307t6.9,309–10t6.10
Mexico, 356t7.4, 357changes in, 359, 360t7.5in competitive vs.
noncompetitive industries,359, 361–62t7.6, 363
Peru, 429, 430, 433t8.6operating-income-to-capital stock
ratio, Colombia, 293,294t6.6
operating-income-to-employmentratio
Bolivia, 130, 131–32t3.3, 133Chile, 219Colombia, 306
operating-income-to-physical assets(PPE) ratio
Argentina, 80Bolivia, 139t3A.2Brazil, 154, 185t4B.1Chile, 217, 262f5A.5Colombia, 311Mexico, 359
operating-income-to-sales ratio, 19,20f1.4, 24–25
Argentina, 69, 80, 82, 82t2.5,85
Bolivia, 130, 131–32t3.3,139t3A.2
Brazil, 161changes in, 32–34, 58–59n17Chile, 217, 264f5A.6Colombia, 293, 294t6.6, 311gains in, 29Mexico, 349, 357–58, 359and worker transfers, 29,
31f1.11OSIPTEL. see Supervisory Agency
for Private Investment inTelecommunications(OSIPTEL), Peru
OSN. see Obras Sanitarias de laNación (OSN)
output, 23, 24f1.7Argentina, 81Bolivia, 134
Brazil, 155, 185t4B.1,186–92t4C.1–4C.4
competitive vs. noncompetitivesectors, 34, 35f1.13
Mexico, 356t7.4, 357changes in, 359,
360t7.5in competitive vs.
noncompetitive industries,359, 361–62t7.6, 363
Peru, 429, 430, 433t8.6outsourcing, Brazil, 163ownership
banking sector, 6capital ownership, 167–68, 170electricity sector, 126power sector, 311private vs. public, 146
PPan-American Highway, Chile,
240Panizza, U., 145, 171PAPELCOL, Colombia, 284Parker, David, 120partial input productivity,
Colombia, 294–95t6.6,296t6.7, 299, 344n22
Pasco-Font, Alberto, 37passenger road transport, Mexico,
366–67t7.8payrolls
Colombia, 297, 304Mexico, 302
Pemex, Mexico, 352pension systems
Chile, 208, 209–10, 211Mexico, 355
performanceArgentina
banking sector, 87, 88t2.7,89t2.8
changes in, 82, 83t2.6indicators of, 80–86
Boliviadata results analyses, 130–36,
139–41t3A.2, 142nn11–13
INDEX 497

performance (continued)industry-adjusted data,
134–36, 142n13Brazil, empirical analysis of,
153–62, 153t4.3,184–86t4B.1,186–92tt4C.1–4C.4,194nn10–11, 194nn13–14
Colombiaindicators for IFI firms, 332,
345n35manufacturing sector,
292–305, 344n17power sector, 305–13,
314t6.11, 345n25, 345n27thermal plants, 311, 312f6.5,
313–15, 340–42t6E.1,345n27, 345n29
variables for IFI firms insample, 333–36t6C.1
Mexicochanges in, 356t7.4industry-adjusted data,
358–59, 360t7.5, 401n13and market power, 359,
361–63, 401n14raw data concerning,
355–58, 401nn9–12Peru, 448
banking sector, 442–43t8.9data concerning, 424,
428–29f8.5, 451–57t8B.1privatization study overview,
428–29f8.5, 431–34,475n20
study methodology, 418–22,474n13, 475n14,475nn16–17
social view vs. agency view of,119–20
studies on firms in LatinAmerica, 9–14t1.2
see also variablesPeru
banking sector, 424, 430t8.5,431, 438–44, 460–61t8C.2,474n3
privatizationbanking sector, 424, 430t8.5,
460–618C.2data collection, 15, 422–30,
449–50(Appendix 8A),475nn18–19
electricity sector, 437,458–59t8C.1,470–71t8E.2,472–73t8E.3
financial sector, 438–44, 447historical perspective,
409–18, 474nn2–3,474nn6–11
impact on employment,444–47, 448, 475nn22–24
impact on utilities sector, 447methodology of, 418–22,
474n13, 475n14,475nn16–17
overview, 431–34, 475n20revenues and investments,
313f8.1, 411, 412t8.1,413
revenues by sector, 413,415f8.2, 416f8.3
statistics on privatized firms,430, 463–67t8D.1
telecommunications sector,437, 445, 446t8.11,468–69t8E.1
Petrobras, Brazil, 172petroleum products, 126physical assets per employee ratio,
Chile, 218Pinheiro, Armando C., 148–49,
194n7, 194–95n16Pinochet, Augusto, 197Pohl, Gerhard, 120policymakers, support for
privatization, 1, 58n4Political Constitution, Peru, 411politics, 6, 372
Brazil, and privatization, 172,173
and inefficiency of SOEs, 27–28and market competition, 53–54
498 INDEX

Mexicoand restructuring policies,
376–77, 402n23and types of privatization
contracts, 378–80and privatization contracts, 49,
51, 378–80and SOEs, 3
Pollitt, Michael G., 120Pombo, Carlos, 15, 53, 275–348popular capitalism, 209–10, 211port transfer rate index, 245ports
Chile, 202, 203, 271n4concessions for management
and operation of, 242–46,272nn31–32
regulatory framework,244–45
Mexico, 366–67t7.8postal services, Argentina, 108Potable Water and Sewerage Law,
Bolivia, 127power companies, Bolivia, 124,
125–26power sector
Colombia, 328performance, 305–13,
314t6.11, 345n25,345n27
see also thermal plantsPPI. see producer price index (PPI)PQ. see privatization Q (PQ)present-value of revenue (PVR),
241–42prices
Argentina, 85–86Brazil, 165–67Chile
energy sector, 227, 229t5.12telecommunications sector,
233–34, 272n24Colombia, electricity sector,
287–88impact of auction requirements
on, 374, 375t7.12, 376,402n20
and method of privatization, 40Mexico, 357–58, 401n12
in competitive vs.noncompetitive industries,359, 361–62t7.6, 363
paid for privatized firms,372, 402n18
restructuring programs,375t7.12, 376–78,402nn21–23
and operating income to sales,34, 58–59n17
private investors, Bolivia, 123–24private pension funds (AFPs), Chile,
208, 209–10, 211privatization
benefits of, 2costs of, 162–69empirical studies on, 120–21failures of, 2historical perspective, 2–6,
58n6, 58n8impact of length of on prices
paid for firms, 41methods of, 39–41, 59nn20–21overview, 407restructuring firms before,
41–49, 50t1.6, 59nn22–23support for, 1, 57–58n3see also privatization under
names of specific countriesPrivatization Law of 1992, Bolivia,
123privatization Q (PQ), 372–74, 377,
402n18definition, 395t7A.1impact of firm and industry
characteristics on, 374,375t7.12
producer price index (PPI), 401n9,408
productive efficiency, Colombia, 320productivity
Argentina, 84, 104Chile
electricity sector, 227,228t5.10, 229t5.11
INDEX 499

productivity (continued)impact of privatization on,
219, 254f5A.2,266–67t5A.8
Colombiamanufacturing sector,
294–95t6.6, 296t6.7,299–303, 344n22
profitabilityand abuse of market power,
32–36, 58–59n17Argentina, 103–4
banking sector, 86–90,113n19
changes in, 82, 82t2.5as measured by performance
indicators, 80Bolivia, 13, 131–32t3.3
industry-adjusted data,134–36, 142n13
Brazil, 154, 157, 159–60t4.4,161, 162, 184–86t4B.1,186–92tt4C.1–4C.4
Chileenergy sector, 227, 230,
231t5.13impact of privatization on,
216–17, 249–50t5A.1,258–59t5A.4
telecommunications sector,235–36
utilities sector, 201–2, 224Colombia
impact of privatization on,293, 294–95t6.6, 295,296–97t6.7, 298
manufacturing sector,315–23, 345n31,345n33
power sector, 305–13,314t6.11, 345n25,345n27
and consumer welfare, 37and labor costs, 29, 31f1.11Mexico
banking sector, 382–83, 385,402–3n25
changes in, 356t7.4, 357,359, 360t7.5
in competitive vs.noncompetitive industries,359, 361–62t7.6, 363
and role of transfers fromworkers, 363–64, 365t7.7,402n15
Peru, 429, 433t8.6post-privatization, 19, 20f1.4transfers from workers as
percent of, 29, 31f1.11Promigas, Colombia, 286Promotion of Private Investment in
State Companies, 410property theory, 119public corporations, Chile, 200public debt, Brazil, 169public disclosure requirements,
213, 271n11Public Enterprises of Medellin
(EPM), Colombia, 306,307–8t6.9, 311
public health, Argentina, 90–96,106–7, 113n17
public opinionBrazil, 170–71, 174,
195nn20–21Peru, 413, 417f8.4
public services, 58n8Bolivia, 124Brazil, 145Chile, 200Mexico, 364, 366–67t7.8Peru, 410
public utility firms, Peru, 447PVR. see present-value of revenue
(PVR)
Rrailway sector, 37
Argentina, 107, 112nn3–4Chile, 211–12Mexico, 366–67t7.8
RAIS. see Annual Survey of SocialData (RAIS)
Ramamurti, Ravi, 36–37, 120
500 INDEX

Ramírez, Manuel, 15, 53, 275–348rate floor index, 245real average wages, Argentina, 81,
84–85real growth in sales, Mexico, 357real interest rates, Chile, 209redistribution hypothesis, 363, 364reduced-agency-cost hypothesis,
382–83, 384–85reform, Bolivia, 125Regulatory Commission for Energy
and Gas, Colombia, 286–88regulatory framework, 52, 408–9
Bolivia, 125hydrocarbons industry, 126telecommunications sector,
127Chile, 214, 247–48
banking sector, 208–9electricity sector, 222–25,
226–30, 230, 231t5.13,272nn20–22
infrastructure concessions,240
ports, 244–45telecommunications sector,
222–23, 225–26, 230–37,272nn23–24
water services, 212–13Colombia, 275, 276, 297, 306,
328, 343nn1–2electricity sector, 286–88,
344n13gas company sales, 284, 286thermal plants, 313, 315,
340t6E.1gains from, 54Mexico, 352
deregulation, 380–81reregulation, 381–88,
392–93, 402–3nn25–26stock market, 389–90
Peru, 410, 411see also corporate governance
rentsArgentina, 96, 97, 102f2.3, 103,
114n24
ex ante, 272n32Reordenamiento de las Empresas
Públicas, 121Reorganization Unit, Bolivia, 129Requena, Mario, 121reregulation, 52–55, 59n24
Mexico, 381–88, 392–93,402–3nn25–26
researchadjusted ratios, 23, 24–26noncomparable data, 17–18,
58n15raw data, 19–23sample selection bias, 6, 8–17see also privatization under
names of countriesrestructuring programs, 408
Brazil, 168Colombia
manufacturing sector, 299,302
power sector, 286–88,289–90t6.4, 344n13
methods of, 372, 373t7.11Mexico, 350, 372–78, 392,
402nn18–23cost of, 367–68impact on efficiency of public
sector, 354–55Peru, 423preprivatization, 41–49, 50t1.6,
59nn22–23and privatization contracts, 49
return on assets (ROA)Argentina, 87, 88t2.7, 89t2.8Brazil, 154, 161Peru, 428f8.5
return on equity (ROE)Argentina, 87, 88t2.7, 89t2.8Brazil, 154, 161Peru, 428f8.5
revenuesArgentina, 71, 72t2.1, 73f2.1Brazil, 147Chile, 207, 210t5.5, 211in developing countries, 5,
5t1.1
INDEX 501
revenues (continued)government, 27–28in Latin America, 5, 5t1.1, 6,
7f1.2Mexico, 367Peru, 411, 412t8.1, 413,
415f8.2, 416f8.3Riaño, Aljandro, 39ROA. see return on assets (ROA)ROE. see return on equity (ROE)Rogozinski, Jacques, 379Romero, Carlos, 54
SSáez, Raul, 16sales, Mexico, 357, 359,
401nn12–13sales-to-assets ratio, 20, 21f1.5sales-to-capital-stock ratio,
Colombia, 299sales-to-employment ratio
Argentina, 81Chile, 214, 219Colombia, 299Mexico, 20, 21f1.5, 357
sales-to-input ratio, Colombia, 299sales-to-physical assets (PPE) ratio
Bolivia, 130Brazil, 154–55, 161–62,
186–87t4C.1Chile, 218Colombia, 306Mexico, 357
Salinas administration, 354–55,380–81, 389, 390f7.9
San Antonio, Chile, 243, 272n31Sanchez de Lozada, Gonzalo, 122,
142n3Sánchez, Jose Miguel, 40, 54sanitation services
Argentina, 68, 70, 90–96,106–7
Bolivia, 128Brazil, 164t4.5, 165Chile, 212, 213Mexico, 366–67t7.8Peru, 417, 430, 431
São Paulo State PrivatizationProgram, 147, 180–81t4A.2
Scarpa, Carlo, 40Schargrodsky, Ernesto, 15, 67–116Schleifer, Andrei, 432Schroth, Enrique, 37seaport franchises, Chile, 248SEDAPAL, Peru, 430, 431, 434,
475n20SEGBA. see Servicios Electricos del
Gran Buenos Aires (SEGBA)Sendos. see Servicio Nacional de
Obras Sanitarias (Sendos),Chile
Serra, Pablo, 15, 37, 53, 197–274Servicio Nacional de Obras
Sanitarias (Sendos), Chile,212
Servicios Electricos del GranBuenos Aires (SEGBA), 106
sewerage services. see sanitationservices
Shapiro-Francia test for normality,420
shared risk contracts, 122shareholders
Brazil, 155–56, 168, 186t4B.1,186–92tt4C.1–4C.4
Mexico, 389–91 Sheshinski, Eytan, 3shipping sector
Argentina, 108Chile, 202see also ports
Shleifer, Andrei, 49Singal, Vijay, 120Sistema de Participacion
Ciudadana, Peru, 416Sistema de Regulación Sectorial
(SIRESE) Law, Bolivia, 125Smith, J., 420–21social rights, 194n15social Security of Government
Employees, Mexico, 352social services, Mexico, 371–72Sociedad Mixta Siderurgica
Argentina (SOMISA), 108
502 INDEX

SOEs. see state-owned enterprises(SOEs)
SOMISA. see Sociedad MixtaSiderurgica Argentina(SOMISA)
Special Privatization Committees(CEPRIs), Peru, 410, 411,474n6
Spiller, Pablo, 343n2state-owned enterprises (SOEs), 1,
21, 22f11.6, 29, 407and adjusted ratios, 23, 24–36Argentina
impact of privatization on,74–86, 81–82,112–13nn6–18
nonfinancial, 74, 74–75t2.2,77–78f2.3
revenues from privatizationof, 71, 72t2.1, 73f2.1
bias in selection samples, 6Bolivia, 122, 124Brazil
benefits and costs ofprivatization of, 162–69
empirical analysis of data,153–62, 153t4.3,184–86t4B.1,186–92f4C.4,194nn10–11,194nn13–14
impact of privatization on,163–65, 166f4.1,194–95nn15–16
literature review, 148–49,194nn6–7
owned by government butnot privatized, 147–48,182–84t4A.3
privatization at federal level,147–48, 175–79t4A.1,180–81t4A.2
public opinion concerning,170
study data set and variables,149–53, 194nn8–9
wages in SOEs vs. privatefirms, 148, 194n6
Chile, 198, 216–20,249–50t5A.1crisis of early 1980s, 207–10,
271nn8–9data on privatized firms,
213–16, 271nn11–14,271–72nn16–17
first round of privatizationof, 206–7
privatization of, 199–200,210–13, 271n2, 271n10
state intervention in, 203–6,271nn6–7
utilities sector, 201–3, 271n3Colombia, profitability of, 19and consumer welfare, 36–39,
59nn18–19employment, 21, 22f1.6, 29evidence of failure of, 3and government revenues,
27–28historical perspective, 58n6,
58n8, 206insolvency of, 156and labor force restructuring, 43Mexico, 298
fiscal impact of sale of,367–70, 371f7.3
growth of, 351–53,400nn1–4
industry-adjusted data,358–59, 360t7.5,401n13
privatization program,353–55, 401nn5–6,401n8
restructuring programs,375t7.12, 376–78,402nn21–23
noncomparable data concerning,17–18, 58n15
operating efficiency changes in,20, 21f1.5
performance of, 120Peru
INDEX 503

state-owned enterprises (SOEs)(continued)data collection, 422–30,
449–50(Appendix 8A),475nn18–19
employment, 444–47,475nn22–24
privatization of, 411, 413privatization study overview,
431–34, 475n20profitability of, 24–26see also enterprises
stock marketsBrazil, 168and corporate governance, 56Mexico, 355, 389, 401n8
structural reforms, Peru, 411Sturzenegger, Federico, 67–116Suarez, Hugo Banzer, 243n3subsidies
Chile, 238Mexico, 368, 368t7.9, 369
sunk costs, 345n31Supervisory Agency for Private
Investment inTelecommunications(OSIPTEL), Peru, 414
supervisory system, Mexico, 385
Ttaxation
Mexico, 357net-taxes-to-sales ratio, 156–57revenues from, 28
TdP. see Telefónica del Perú S.A.(TdP)
technical efficiency, thermal plants,313
technology, manufacturing sector,316, 317–19t6.12
Telcoy, Chile, 221, 236Telecel, Bolivia, 127Telecom, Argentina, 105Telecommunications Law, Bolivia,
127telecommunications sector
Argentina, 85, 105–6
Bolivia, 126–27Brazil, 146–47, 194–95n16
impact of privatization onprices of, 167
public opinion concerning,170
Chile, 198, 201privatization process, 221–22regulatory framework,
222–23, 225–26, 230–37,272nn23–24
impact of privatization on,36–37
Mexico, 366–67t7.8mobile phones, 232, 235,
272n23Peru, 413–16, 416f8.3, 431,
437, 468–69t8E.1employment in, 445,
446t8.11preprivatization, 54and regulation, 53
Telefónica-CTC, Chile, 234,235–37
Telefonica de Argentina, 105Telefónica de España, Spain, 414,
474n9Telefónica del Perú, 424Telefónica del Perú S.A. (TdP),
414, 415–16, 437, 445,468–69t8E.1, 474n10
terminals, Chile, 243–44TERPEL companies, Colombia,
286, 343n12TFP. see total factor productivity
(TFP)thermal generation sector, 288thermal plants
Colombia, 311, 312f6.5, 345n27input and output variables,
339t6D.2productive efficiency of,
313–15, 340–42t6E.1,345n29
statistical analysis ofefficiency scores, 324–27,345n34
504 INDEX

Tobin’s Q, 372, 402n18Tobit regressions, 324–27, 345n34Todd, P., 421toll roads, Mexico, 366–67t7.8,
379Torero, Máximo, 15, 37, 407–77total factor productivity (TFP),
299–300, 315Tovar, Ramiro, 379trade, 295, 301, 316traffic guarantees, Chile, 241, 242,
248transfers from workers, Colombia,
305t6.8transition countries, move to
privatization programs, 5transparency, 39, 40
Chile, 200, 213, 271n11transportation sector
Chile, 211Peru, 411
Tribasa, Chile, 248Trujillo, Lourdes, 18n59, 56Turkey, 59n21
Uunemployment rate, Argentina, 98,
114n29unit costs, 19, 20f1.5
Argentina, 81, 84, 104Bolivia, 130, 139–41t3A.2Chile, 218, 251f5A.1, 261t5A.5Colombia, 294–95t6.6, 296t6.7,
299, 306competitive vs. noncompetitive
sectors, 34, 36gap between private and
privatized firms, 26–27Mexico, 357, 358, 359
United Kingdom, 57–58n3, 272n29unskilled workers, 32Urbiztondo, s., 92Urquiola, Miguel, 121utilities sector
Chile, 201–2, 271n3and consumer welfare, 36–39,
59nn18–19
Peru, 430, 445, 446t8.11study results, 434–48
see also specific utility
VValparaíso Port, Chile,
245–46value added growth, 345n33value added to capital, 299van Randenborgh, Matthias, 120variables
Argentinabanking sector, 87, 88t2.7,
89t2.8used to evaluate impact of
privatization on financialfirms, 1112B.2
used to evaluate impact ofprivatization onnonfinancial firms,109–10t2B.1
Bolivia, used to evaluationimpact of privatization,139–41t3A.2
Brazilempirical analysis of data,
157, 162, 184–86t4B.1,192–93t4D.1
and study data set, 149–53,194nn8–9
Chilemerged firms, 215profitability, 216–17,
249–505A.1,258–59t5A.4
Colombiaelectricity sector, 313,
314t6.11indicators for IFI firms in
sample, 333–36t6C.1manufacturing sector,
291–92, 315–23, 336,337t6D.1, 344n15,345n31, 345n33
thermal plants input andoutput variables,339t6D.2
INDEX 505

variables (continued)Mexico
changes in performance, 359,360t7.5
definitions of, 394–400t7A.1description overview, 393performance changes, 356t7.4
Peru, 432, 433t8.6difference-in-difference,
435–36t8.7, 437of performance, 418–22,
474n13, 475n14,475nn16–17
Verdoom law, 320Vergara, Rodrigo, 198Vishny, Robert W., 49voucher programs, Mexico, 370–71
Wwages
Argentina, impact ofprivatization on, 84–85,98–105, 114n25, 114n30
Bolivia, 133, 140t3A.2Brazil, private firms vs. SOEs,
148, 194n6Colombia, manufacturing sector,
304, 305t6.8Mexico, 363–64, 402n15and privatization, 29real and industry-adjusted
changes in, 29, 30f1.10, 32see also income
Wallsten, Scott, 53water services, 37–38, 49
Argentina, 68, 70, 106–7and child mortality, 95,
113n17impact of privatization on,
90–96Bolivia, 127–28Brazil, 164t4.5, 165Chile, 212, 213
Mexico, 366–67t7.8Peru, 417, 431
welfare-enhancing outcomes, 28,36–39, 59nn18–19
Argentina, 68, 70, 95, 96t2.11Mexico, 364, 366–67t7.8Peru, 448
white-collar workersBolivia, 133Brazil, 194–95n16Colombia, wages, 304layoffs, 32Mexico, 357, 364Peru, 444–45
Wilcoxon signed-rank test, 165,420
Winston, Clifford, 52within-country data, 40WLL, Chile, 237workers
Argentina, displaced workers,96–103, 114nn24–29
displaced, 29–32labor costs, 28–29transfers from as percent of
profitability, 29, 31f1.11see also blue-collar workers;
employment; white-collarworkers
Worker’s Party, Brazil, 173Workers’ Tenure Guarantee Fund
(FGTS), Brazil, 167–68, 170,174, 195n22
World Bank, 122
YYacimientos Petrolíferos Fiscales
Bolivianos (YPFB), 124
ZZamora, Jaime Paz, 142n3Zervos, S., 168Zuleta, L. H., 276
506 INDEX


STANFORD UNIVERSITY PRESS
THE WORLD BANK ISBN 0-8213-5882-0
L AT I N A M E R I C A N D E V E L O P M E N T F O R U M
Privatization is under attack. Since the 1980s, thousands of failing state-ownedenterprises worldwide have been turned over to the private sector. But public opinionhas turned against privatization. A large political backlash has been brewing for sometime, infused by accusations of corruption, abuse of market power, and neglect of
the poor. What is the real record of privatization and are the criticisms justified?
Privatization in Latin America: Myths and Reality evaluates the empirical evidence on privatization in a region that has witnessed an extensive decline in the state’s share of productionover the past 20 years. The book is a compilation of recent studies that provide detailed coveragewithin a systematic econometric framework. Seven countries are investigated: Argentina,Bolivia, Brazil, Chile, Colombia, Mexico, and Peru. The quality of the data enables the researchersto comprehensively analyze the record of and accusations against privatization, with importantrecommendations for the future.
This book will be vital to anyone interested in the privatization debate but especially to those involved in civil service reform, corporate governance, economic policy, finance, and anticorruption efforts.
“Privatization is important but controversial. While economists typically favor it, others areskeptical. This book provides strong scientific evidence that privatization has been beneficialfor many Latin American countries, although some privatizations failed and some groups in society lost out. As usual, the devil is in the details: how privatization is carried out andwhat reforms accompany it are crucial to its success. The book is definitely an invaluablecontribution to the privatization debate.”
—Oliver Hart, Andrew E. Furer Professor of Economics, Harvard University
“There are few issues in economics that elicit such passionate opinion as privatization in LatinAmerica. Typically, privatization is berated because the 1990s failed to deliver the kind ofgrowth and prosperity expected at the start of the decade, without taking into account theserious disruption in financial markets following the 1998 Russian crisis. This book, incontrast, addresses the issue by bringing to the table new, relevant, and rich information. Itprovides powerful evidence of the benefits of privatization in the region—benefits that largelyoffset any potential costs. Further, the evidence presents a compelling case that privatizationfailure is more likely due to poor contract design, lack of regulation, or opaque processesthan to privatization per se. The book should be required reading for policymakers and academics alike.”
—Guillermo A. Calvo, Distinguished University Professor, University of Maryland,
College Park, and Chief Economist, Inter-American Development Bank