REE and ε Nd of clay fractions in sediments from the eastern Pacific Ocean: Evidence for clay...
12
Science in China Ser. D Earth Sciences 2005 Vol.48 No.5 701—712 701 Copyright by Science in China Press 2005 REE and ε Nd of clay fractions in sediments from the eastern Pacific Ocean: Evidence for clay sources LIU Jihua 1,2 , SHI Xuefa 1 , CHEN Lirong 2 , HUANG Yongyang 3 , WANG Yinxi 4 , CUI Yingchun 1 & BU Wenrui 1 1. Key Laboratory of Marine Sedimentology & Environmental Geology, First Institute of Oceanography, State Oceanic Administration, Qingdao 266061, China; 2. Institute of Oceanology, Chinese Academy of Sciences, Qingdao 266071, China; 3. Guangzhou Marine Geological Survey, Guangzhou 510760, China; 4. Modern Analysis Center, Nanjing University, Nanjing 210093, China Correspondence should be addressed to Liu Jihua (email: [email protected] ) Received June 25, 2003; revised December 13, 2004 Abstract Clay fractions in the non-calcareous surface sediments from the eastern Pacific were ana- lyzed for clay minerals, REE and 143 Nd/ 144 Nd. Montmorillonite/illite ratio (M/I ratio), total REE contents (ΣREE), LREE/HREE ratio and cerium anomaly (δ Ce) may effectively indicate the genesis of clay min- erals. Clay fractions with M/I ratio >1, δ Ce <0.85, ΣREE >400 µg/g, LREE/HREE ratio ≈4, and REE patterns similar to those of pelagic sediments are terrigenous and autogenetic mixed clay fractions and contain more autogenetic montmorillonite. Clay fractions with M/I ratio <1, δ Ce=0.86 to 1.5, ΣREE=200 to 350 µg/g, LREE/HREE ratio ≈6 and REE distribution patterns similar to that of China loess are identi- fied as terrigenous clay fraction. The 143 Nd/ 144 Nd ratios or ε Nd values of clay fractions inherit the features of terrigenous sources of clay minerals. Clay fractions are divided into 4 types according to ε Nd values. Terrigenous clay minerals of type I with the ε Nd values of −8 to −6 originate mainly from North American fluvial deposits. Those of type II with the ε Nd values of −9 to −7 are mainly from the East Asia and North American fluvial deposits. Those of type III with ε Nd values of −6 to −3 could come from the central and eastern Pacific volcanic islands. Those of type IV with ε Nd values of −13 to −12 may be from East Asia eolian. The terrigenous and autogenetic mixed clay fractions show patchy distributions, indicating that there are volcanic or hot-spot activities in the eastern Pacific plate, while the terrigenous clay fractions cover a large part of the study area, proving that the terrigenous clay minerals are dominant in the eastern Pacific. Keywords: eastern Pacific Ocean, clay fraction, REE, ε Nd , clay source. DOI: 10.1360/03yd0276 The surface sediments from the eastern Pacific Ocean are mainly composed of biogenetic fossils, silicate detritus, ferromanganese spherolites and clay fractions. Among them, the clay fractions with grain size less than 2 µm (mainly clay minerals) are most prevalent, especially in the non-calcareous sediments (the content of calcareous fossils is less than 5%), the clay fraction contents often exceed 70% [1―5] . Because of the influences of Antarctic Bottom Water (AABW), equatorial currents, low and high altitude winds [6―9] as
Transcript of REE and ε Nd of clay fractions in sediments from the eastern Pacific Ocean: Evidence for clay...

Science in China Ser. D Earth Sciences 2005 Vol.48 No.5 701—712 701
Copyright by Science in China Press 2005
REE and εNd of clay fractions in sediments from the eastern Pacific Ocean: Evidence for clay sources LIU Jihua1,2, SHI Xuefa1, CHEN Lirong2, HUANG Yongyang3, WANG Yinxi4, CUI Yingchun1 & BU Wenrui1
1. Key Laboratory of Marine Sedimentology & Environmental Geology, First Institute of Oceanography, State Oceanic Administration, Qingdao 266061, China;
2. Institute of Oceanology, Chinese Academy of Sciences, Qingdao 266071, China; 3. Guangzhou Marine Geological Survey, Guangzhou 510760, China; 4. Modern Analysis Center, Nanjing University, Nanjing 210093, China Correspondence should be addressed to Liu Jihua (email: [email protected])
Received June 25, 2003; revised December 13, 2004
Abstract Clay fractions in the non-calcareous surface sediments from the eastern Pacific were ana-lyzed for clay minerals, REE and 143Nd/144Nd. Montmorillonite/illite ratio (M/I ratio), total REE contents (ΣREE), LREE/HREE ratio and cerium anomaly (δ Ce) may effectively indicate the genesis of clay min-erals. Clay fractions with M/I ratio >1, δ Ce <0.85, ΣREE >400 µg/g, LREE/HREE ratio ≈4, and REE patterns similar to those of pelagic sediments are terrigenous and autogenetic mixed clay fractions and contain more autogenetic montmorillonite. Clay fractions with M/I ratio <1, δ Ce=0.86 to 1.5, ΣREE=200 to 350 µg/g, LREE/HREE ratio ≈6 and REE distribution patterns similar to that of China loess are identi-fied as terrigenous clay fraction. The 143Nd/144Nd ratios or εNd values of clay fractions inherit the features of terrigenous sources of clay minerals. Clay fractions are divided into 4 types according to εNd values. Terrigenous clay minerals of type I with the εNd values of −8 to −6 originate mainly from North American fluvial deposits. Those of type II with the εNd values of −9 to −7 are mainly from the East Asia and North American fluvial deposits. Those of type III with εNd values of −6 to −3 could come from the central and eastern Pacific volcanic islands. Those of type IV with εNd values of −13 to −12 may be from East Asia eolian. The terrigenous and autogenetic mixed clay fractions show patchy distributions, indicating that there are volcanic or hot-spot activities in the eastern Pacific plate, while the terrigenous clay fractions cover a large part of the study area, proving that the terrigenous clay minerals are dominant in the eastern Pacific.
Keywords: eastern Pacific Ocean, clay fraction, REE, εNd, clay source.
DOI: 10.1360/03yd0276
The surface sediments from the eastern Pacific Ocean are mainly composed of biogenetic fossils, silicate detritus, ferromanganese spherolites and clay fractions. Among them, the clay fractions with grain size less than 2 µm (mainly clay minerals) are most
prevalent, especially in the non-calcareous sediments (the content of calcareous fossils is less than 5%), the clay fraction contents often exceed 70%[1―5]. Because of the influences of Antarctic Bottom Water (AABW), equatorial currents, low and high altitude winds[6―9] as

702 Science in China Ser. D Earth Sciences
well as frequent volcanic and hydrothermal activities in the Pacific plate[10], the sources of clay minerals in the Pacific sediments are complicated[11]. The clay minerals can be terrigenous or autogenetic (associated with altering of volcanic debris). It is very important to identify different genetic clay minerals in studying of marine sedimentation and palaeoenvironment in the eastern Pacific. The methods of mineralogy and geo-chemistry have commonly been used by geologists for tracing the sources of clay fractions in the eastern Pa-cific. As the contents and the differentiation of rare earth elements (REE), and the isotopic compositions of neodymium (Nd) have effective roles in tracing the sources of materials, they have been used to indicate the origin of clay fractions in sea sediments[12―15]. By now the method of REE has been perfectly used. Based on REE result, it is approved that the clay frac-tions in most areas of the Pacific Ocean are terri-genous, and the autogenetic clay minerals mainly ap-pear in the volcanic activity areas[5,12,16―18]. Compara-tively, the study of isotopic compositions of Nd in the clay fractions is primary, and it is shown from the study results that the isotopic compositions of Nd in marine clay fractions have inherited their source’s isotopic compositions, so they are more sensitive in tracing the sources of clay fractions[19,20]. In this paper, the regional distributions of REE parameters, εNd val-ues, and the ratios of diagnostic clay minerals in clay fractions of surface sediments from the eastern Pacific Ocean are used to trace the genesis, sources and trans-port mechanism of clay minerals, and thus to make the division of clay fraction provinces.
1 Samples and analysis methods
43 non-calcareous surface sediment samples were collected from the East and West Area of Chinese ferromanganese nodule survey area, between Clarion and Clipperton Fractures (CC zone) of the eastern Pa- cific Ocean (Fig. 1). The locations and water depth as well as sediment types of samples are given in Table 1. Although the samples were collected asymmetrically, the surface sediments are mostly non-calcareous sedi- ments as the water depth in the study area is greater than the calcite compensation depth (CCD≈ 4900 m)[3],
so the samples are considered to be well representa- tive. The procedures for sample selecting, initial treat- ing and analyzing are described as follows.
(1) To ensure that the samples are non-calcareous sediments in which the total calcareous fossils content is less than 5%, the smear slides of bulk sediments were detected under a microscope. According to the Dean’s classification of pelagic sediments[21], non- calcareous sediment samples were divided into three types: zeolite clay, siliceous ooze and siliceous clay.
(2) To obtain clay fractions, the bulk sediments weighed 15―20 g firstly emerged into 1l distilled wa-ter for 3 times to wash salts away, then 30% hydrogen peroxide solution was added in to get rid of organic matter, and finally 5% hydrochloric acid was used to remove calcium carbonate. The clay fractions were extracted according to the Stokes settling law. Mean-while, natural oriented sections and glycol-saturated oriented sections for X-ray diffraction (XRD) analysis were made. High temperature sections for XRD analy-sis of some samples were prepared. The relative con-tents of clay minerals were estimated by Biscaye method[22], that is, the total peak area of 3 diagnostic peaks of montmorillonite (17Å), illite (10Å), chlorite (7Å) plus kaolinite (7Å) on the spectrum of gly-col-saturated oriented section was regarded as the ba-sic data with their weighting factors being 1, 4 and 2, respectively, the ratio between gaolinite and chlorite contents was derived from the ratio between their peak heights within 25°(2θ ) around 3.5Å, and the total content of 4 clay minerals was normalized to 100%. The extracted clay fractions were dried at constant temperature of 40℃ for chemical analysis.
(3) Clay fraction samples weighed 1g were ana-lyzed by the inductive coupling plasma spectrometry (ICP) to determine their REE, the standard was GBW7313 (national marine sediment standard of China). The relative error of REE analysis is 0.5%―6%. Characteristic parameters, such as total REE con-tent (∑REE), ratio of light REE contents to heavy REE contents (LREE/HREE), as well as Ce and Eu anomaly values were calculated by the following for-mulae[23]: ∑REE= ∑(La…Lu, Y), LREE/HREE= ∑

REE and εNd of clay fractions in sediments from the eastern Pacific Ocean 703
(La…Eu)/∑(Gd…Lu), δ Ce=CeN/(LaN×PrN)1/2 and δ Eu=EuN/(SmN×GdN)1/2, where subscript N means normalization by the value of North American Shale Composite (NASC)[24]. The REE analysis was carried out by Qingdao Marine Geology Institute. 143Nd/144Nd ratios of Clay fraction samples weighed 5 g were ana-lyzed on VG354 surface thermal ionizing isotope mass spectrograph. In the measurement, the background value of Nd was (5―7)×10−11g. The 143Nd/144Nd ratio of La Jolla standard was 0.511868±10 (n=10), 146Nd/144Nd ratio used for standard was equal to 0.7219, and εNd =((143Nd/ 144Nd)sample/0.512638−1)×104, where 0.512638 is the present chondritic uniform res-ervoir (CHUR) value[25]. The isotope analysis was made by Modern Analysis Center of Nanjing Univer-sity.
ples with the M/I ratios close to 1 (0.90 and 0.93, re-spectively).
The differences of REE parameters between clay fractions are more distinct than those of clay minerals. Almost all the parameters have large variation ranges with ΣREE, LREE/HREE and δ Ce being in ranges of 217―1118 µg/g, 3.27―7.15 and 0.22―1.37, res- pectively, except for δ Eu, which is in the range of 0.98 to 1.06 and shows a common character of no or weak positive Eu anomaly. Furthermore, there are certain correlations between these parameters. Ac-cording to δ Ce values, the clay fractions can be di-vided into three types (Table 2): (1) negative Ce anom-aly (δ Ce<0.85), (2) weak or no Ce anomaly (δ Ce = 0.86―1.05) and (3) positive Ce anomaly (δ Ce>1.05). It is shown from Table 2 that the mean ∑REE values increase with the decrease of δ Ce value, especially when δ Ce value is less than 0.37, most of ∑REE values are higher than 586 µg/g (Table 1), much higher than those of other samples, and the LREE/ HREE ratios are reduced accordingly. As a whole, the features of the clay fractions with weak or no Ce anomaly and positive Ce anomaly are very similar, but these two types of clay factions are obviously distinct from the clay fractions with negative Ce anomaly.
2 Results
The clay mineral components of 38 sites and the REE and Nd isotopic data of 43 sites are listed in Ta-ble 1. The contents of montmorillonite and illite are 66%―87%, and those of kaolinite and chlorite are 13%—34%. The montmorillonite/illite (M/I) ratios have a large variation range of 0.13—2.35. There are 8 samples with the M/I ratios greater than 1, 28 samples with the M/I ratios ranging from 0.13 to 0.71, 2 sam-
Fig. 1. Location of the study area and sampling sites.

Table 1 Site, water depth, sediment type, REE content, Nd isotopic and clay mineral composition of clay fraction in sediment from the eastern Pacific Ocean
Sea area Site Longitude
(W) Latitude
(N)
Water depth
/m
Sedi-ment type
La Ce Pr Nd Sm Eu Gd Tb Dy Ho Er Tm Yb Lu Y ΣREE LREE/ HREE δ Ce δ Eu 143Nd/144Nd εNd Mon Illi Kao Chl M/I
CC14 140°00′58″ 11°59′09″ 5400 SC 36.40 100.7 9.71 40.94 9.02 2.05 9.07 1.36 7.41 1.62 4.31 0.60 3.98 0.63 39.19 266.98 6.86 1.18 1.00 0.512313±15 −6.34 16 58 10 16 0.28
CC29 141°32′30″ 10°59′33″ 5162 ZPC 114.7 95.60 32.01 154.6 35.73 8.49 39.38 5.91 33.46 7.18 18.43 2.58 16.14 2.49 186.2 752.89 3.51 0.35 0.99 0.512284±15 −6.91 23 56 9 12 0.41
CC31 142°33′07″ 11°00′18″ 4909 ZPC 133.8 97.51 40.86 192.8 44.12 10.83 48.39 7.41 42.44 8.89 23.22 3.22 20.22 3.06 231.1 907.87 3.31 0.29 1.03 0.512262±18 −7.33 45 37 8 10 1.22
CC57 140°47′10″ 11°01′39″ 5127 SO 37.30 94.44 9.74 41.67 9.21 2.06 8.83 1.37 7.49 1.60 4.32 0.61 4.04 0.62 38.82 262.11 6.73 1.09 1.00 0.512304±19 −6.52 8 63 11 18 0.13
CC60 142°45′25″ 11°15′04″ 5038 SO 34.68 91.78 9.56 40.08 8.50 1.92 8.71 1.29 7.33 1.58 4.05 0.58 3.85 0.62 37.36 251.90 6.66 1.11 0.98 0.512292±14 −6.75 39 37 11 13 1.05
CCA2 141°45′43″ 10°15′45″ 5070 SO 94.59 64.38 26.11 121.2 27.23 6.46 29.38 4.55 25.56 5.59 14.73 2.04 13.26 1.96 149.7 586.75 3.50 0.29 1.00 0.512328±11 −6.05
CCA17 139°13′13″ 9°00′03″ 5044 ZPC 99.45 79.44 27.41 130.3 28.98 6.98 30.75 4.83 27.65 5.88 15.32 2.10 13.36 1.94 153.8 628.18 3.66 0.34 1.03 0.512341±14 −5.79 43 36 10 11 1.19
CCA22 138°57′43″ 9°30′37″ 4816 ZPC 101.3 94.01 31.38 144.3 33.59 8.22 36.67 5.73 31.49 6.64 17.58 2.37 15.10 2.16 173.1 703.64 3.51 0.37 1.03 0.512308±12 −6.44 39 35 10 16 1.11
CCA49 139°46′50″ 10°45′41″ 4926 SO 36.22 79.65 9.84 40.28 8.95 2.03 8.59 1.26 7.45 1.60 4.14 0.60 3.96 0.78 37.73 243.08 6.24 0.93 1.01 0.512312±18 −6.36 20 56 9 15 0.36
CCA68 139°43′56″ 9°31′21″ 5059 ZPC 182.7 96.60 50.34 245.8 56.60 13.70 60.51 9.17 52.25 10.91 28.09 3.87 24.31 3.62 279.8 1118.27 3.35 0.22 1.03 0.512210±20 −8.35 54 23 13 10 2.35
CCA143 139°14′20″ 8°31′30″ 4927 SC 34.50 92.33 9.51 39.91 8.98 2.07 8.72 1.36 7.18 1.54 4.15 0.56 3.74 0.56 36.79 251.91 6.73 1.13 1.03 0.512258±19 −7.41 15 53 12 20 0.28
CCC5 144°28′26″ 8°30′39″ 5225 SC 44.28 93.72 12.26 54.51 12.51 2.89 13.06 1.92 10.76 2.32 5.95 0.83 5.30 0.82 57.61 318.74 5.38 0.89 0.99 0.512009±17 −12.27 28 48 10 14 0.58
CCC6 143°57′13″ 8°00′07″ 5139 SC 36.76 91.98 9.76 41.53 9.18 2.04 8.86 1.32 7.47 1.60 4.29 0.58 3.89 0.61 38.27 258.14 6.68 1.07 0.99 0.511986±13 −12.72 17 55 11 17 0.31
CCC13 142°00′02″ 9°02′19″ 5154 SC 37.50 87.73 10.31 44.20 9.70 2.21 9.98 1.51 8.50 1.77 4.49 0.62 4.15 0.62 43.41 266.69 6.06 0.99 0.99 0.512014±19 −12.17 17 58 10 15 0.29
C5501 143°52′41″ 10°00′57″ 5212 SC 35.43 102.5 9.18 39.29 8.81 1.98 8.40 1.27 7.23 1.52 4.12 0.57 3.84 0.63 36.98 261.75 7.15 1.26 1.01 0.512226±20 −8.04 14 52 14 20 0.27
C5525 145°15′28″ 9°07′59″ 5225 SC 41.52 79.84 10.90 46.98 10.25 2.31 10.39 1.53 9.20 1.98 5.35 0.74 5.00 0.88 51.51 278.38 5.47 0.83 0.98 0.512201±22 −8.52 21 57 10 12 0.37
C5532 144°22′60″ 9°10′15″ 5074 SC 35.32 99.18 9.82 40.69 9.16 2.10 8.87 1.33 7.68 1.61 4.34 0.60 3.99 0.61 37.95 263.26 6.76 1.18 1.02 0.512213±18 −8.29 20 58 8 14 0.34
C5547 143°53′11″ 9°00′35″ 5133 SC 29.62 83.09 8.14 33.27 7.34 1.62 7.12 1.06 6.10 1.29 3.42 0.50 3.26 0.69 30.60 217.11 6.96 1.18 0.98 0.512287±16 −6.85 17 59 10 14 0.29
C5554 144°51′18″ 8°52′23″ 5173 SC 37.40 96.40 10.09 45.13 10.12 2.31 10.27 1.54 8.59 1.83 4.72 0.67 4.42 0.68 45.27 279.43 6.16 1.10 0.99 0.512306±15 −6.48 29 47 9 15 0.62
C5566 143°21′11″ 8°52′52″ 5242 SC 32.21 87.74 9.10 37.62 8.50 1.92 7.94 1.23 6.95 1.47 3.93 0.54 3.66 0.56 34.09 237.47 6.74 1.13 1.03 0.512294±13 −6.71 16 59 9 16 0.27
C5581 147°07′42″ 8°44′59″ 5220 SC 36.94 107.2 9.62 42.49 9.43 2.15 9.03 1.34 7.79 1.64 4.43 0.59 4.06 0.60 40.05 277.34 7.05 1.26 1.02 0.512261±19 −7.35 17 50 13 20 0.34
East
Are
a
C5626 146°24′00″ 8°30′02″ 5190 SC 38.07 110.5 10.56 43.85 9.78 2.23 9.59 1.47 8.28 1.74 4.50 0.64 4.26 0.65 41.67 287.77 6.91 1.22 1.01 0.512385±23 −4.94 26 51 10 13 0.51
(To be continued on the next page)

(Continued)
Sea area Site Longitude
(W) Latitude
(N)
Water depth
/m
Sedi-ment type
La Ce Pr Nd Sm Eu Gd Tb Dy Ho Er Tm Yb Lu Y ΣREE L REE/ HREE δ Ce δ Eu 143Nd/144Nd εNd Mon Illi Kao Chl M/I
C5652 145°28′59″ 8°23′05″ 5189 SC 39.46 91.91 10.62 48.40 11.10 2.63 11.12 1.67 9.58 2.00 5.38 0.71 4.86 0.72 49.37 289.51 5.67 0.99 1.04 0.512268±17 −7.22 38 41 8 13 0.93
C5687 146°38′41″ 8°07′38″ 5275 SC 38.25 109.2 10.13 44.30 9.87 2.31 9.68 1.43 8.29 1.72 4.62 0.64 4.35 0.65 41.63 287.06 6.82 1.23 1.04 0.512198±10 −8.58 14 62 10 14 0.23
C5696 145°21′18″ 8°06′46″ 5100 SC 37.19 108.2 9.98 43.41 10.01 2.29 9.61 1.43 8.31 1.72 4.53 0.64 4.24 0.65 41.74 283.94 6.78 1.24 1.03 0.512217±15 −8.21 20 58 9 13 0.34
C5702 144°36′32″ 8°07′01″ 5040 SC 32.16 80.68 9.87 38.54 8.58 1.99 8.64 1.28 7.38 1.56 4.11 0.57 3.78 0.72 37.56 237.41 6.13 1.00 1.02 0.512254±19 −7.49 22 47 13 18 0.47
C5709 143°22′05″ 8°09′26″ 5077 SO 33.98 92.87 9.30 39.08 8.66 1.94 8.19 1.23 7.26 1.49 3.92 0.55 3.74 0.55 36.18 248.94 6.90 1.15 1.01 0.512201±15 −8.52 14 61 10 15 0.23
C5727 146°29′59″ 7°52′44″ 5219 SC 44.46 91.57 12.69 55.89 12.73 2.99 13.38 2.02 11.55 2.42 6.27 0.86 5.61 0.83 60.07 323.33 5.13 0.85 1.00 0.512273±14 −7.12 53 31 6 10 1.71
C5734 145°36′29″ 7°51′03″ 5142 SC 39.90 93.57 10.92 48.86 11.31 2.64 11.39 1.70 9.60 2.01 5.40 0.75 4.89 0.73 50.18 293.86 5.68 0.99 1.02 0.512268±19 −7.22 29 41 12 18 0.71
C5739 144°51′03″ 7°51′47″ 5200 SC 35.03 101.7 9.01 40.60 9.34 2.11 8.97 1.31 7.57 1.59 4.31 0.59 3.96 0.61 38.84 265.52 6.84 1.26 1.01 0.512284±21 −6.91
C5744 144°14′13″ 7°52′14″ 5179 SC 46.33 83.53 12.98 54.82 12.17 2.82 12.53 1.89 10.77 2.32 6.05 0.86 5.63 0.84 58.71 312.24 5.20 0.75 1.00 0.512295±12 −6.69
C5748 143°44′09″ 7°53′44″ 5164 SC 37.99 95.30 11.31 48.02 10.53 2.44 11.06 1.69 9.20 1.98 5.05 0.72 4.68 0.72 48.93 288.89 5.98 1.02 0.99 0.512318±16 −6.24
C5767 146°38′15″ 7°37′10″ 5181 SC 39.85 98.09 10.56 48.71 11.14 2.53 10.99 1.62 9.61 1.97 5.28 0.71 4.80 0.72 49.25 295.82 5.91 1.06 1.00 0.512214±18 −8.27
C5798 143°22′44″ 7°31′34″ 5091 SC 132.8 120.3 43.02 199.5 47.56 11.63 50.38 8.00 46.40 9.63 25.77 3.49 22.72 3.21 238.4 959.60 3.33 0.35 1.04 0.512306±17 −6.48 48 31 9 12 1.55
East
Are
a
C5799 143°07′29″ 7°31′23″ 5010 SC 37.65 108.3 10.00 44.44 10.04 2.25 9.86 1.47 8.33 1.74 4.61 0.63 4.27 0.65 42.57 286.79 6.74 1.23 0.99 0.512295±15 −6.69 20 50 13 17 0.40
C5222 152°00′12″ 11°21′49″ 5236 SO 39.00 85.70 12.10 48.40 9.68 2.83 14.40 2.00 11.80 2.33 6.42 0.95 5.94 0.94 64.50 306.99 4.42 0.87 1.05 0.512436±19 −3.94 16 53 12 19 0.30
C5233 152°07′33″ 10°59′56″ 5150 SO 35.60 88.90 10.10 41.20 8.79 2.39 11.60 1.61 9.54 1.89 5.09 0.77 4.80 0.76 50.00 273.04 5.19 1.04 1.04 0.512425±16 −4.15 18 56 9 17 0.32
C5250 152°52′49″ 10°44′54″ 5150 SO 40.20 110.0 9.58 43.60 9.14 2.41 11.70 1.68 9.77 1.88 5.13 0.78 4.97 0.74 50.50 302.08 5.86 1.24 1.02 0.512398±18 −4.68 22 55 8 15 0.40
C5270 152°52′31″ 10°29′58″ 5160 SO 60.20 93.70 15.80 69.90 15.20 4.06 20.90 2.88 17.70 3.66 10.10 1.52 9.42 1.72 106.0 432.76 3.81 0.67 1.00 0.512344±17 −5.74 60 27 6 7 2.22
C5343 153°15′16″ 9°37′48″ 4995 SC 31.30 103.0 8.85 37.90 9.01 2.30 11.40 1.64 9.65 1.88 5.25 0.79 4.96 0.75 52.40 281.08 5.30 1.37 1.00 0.512352±19 −5.58 25 47 11 17 0.53
C5385 151°45′28″ 9°22′20″ 5184 SC 34.00 99.60 9.16 39.20 7.87 2.21 10.60 1.54 8.79 1.76 4.81 0.71 4.55 0.71 47.90 273.41 5.74 1.25 1.06 0.511995±19−12.54 20 59 8 13 0.34
Wes
t A
rea
C5355 151°38′48″ 9°38′51″ 5017 SC 43.32 99.98 12.01 52.60 11.88 2.70 12.30 1.81 10.19 2.15 5.72 0.78 5.09 0.78 54.06 315.37 5.73 0.97 0.98 0.512363±19 −5.36 28 52 7 13 0.54
ZPC: Zeolite Clay, SO: Siliceous Ooze, SC: Ssiliceous Clay, Mon: Montmorillonite, Illi: Illite, Kao: Kaolinite, Chl: Chlotite, M/I: Montmorillonite/Illite ratio. The contents of REE (µg/g) were analyzed by ICP in Qingdao Marine Geology Institute, the standard is GBW7313, relative error is of 0.5%—6%. 143Nd/144Nd were measured by mass spectrometer in Modern Analysis Center of Nanjing University, 143Nd/144Nd(La Jolla)=0.511868±10 (n=10), and the background value of Nd is (5—7)×10−11g. 143Nd/144Nd ratios are normalized to 146Nd/144Nd of 0.7219. εNd was calculated by the formula εNd=((143Nd/144Nd)sample/0.512638−1)×104, where 0.512638 is the present CHUR’s εNd value. The clay minerals were determined in XRD lab of Key Laboratory of Marine Sedimentology & Environment Geology, SOA.

706 Science in China Ser. D Earth Sciences
Table 2 REE parameters of clay factions with different Ce anomalies Ce anomaly (Number of sample) ΣREE/µg·g−1 LREE/HREE δ Ce
maximum 1118.27 5.47 0.85 minimum 278.38 3.27 0.22 Negative Ce anomaly (11) average 636.72 3.98 0.48 maximum 318.74 6.90 1.15 minimum 237.41 4.42 0.87 Weak or no Ce anomaly (19) average 274.50 6.04 1.03 maximum 302.08 7.15 1.37 minimum 217.11 5.30 1.18 Positive Ce anomaly (13) average 273.39 6.60 1.24
The 143Nd/144Nd ratios and εNd values of samples are in the ranges of 0.511986―0.512436 and −12.72 to −3.9, respectively. Of 43 samples, 4 samples have εNd value ranging from −13 to −12, 31 samples from −9 to −6, and the other 8 samples from −6 to −3. There is distinct difference between the εNd values in the West Area and the East Area. Most of the εNd values in the eastern part of the East Area are in the range of −7 to −6, and those in the western part are in the range of −9 to −7. The εNd values in the West Area change in the range of −6 to −3. 4 samples with εNd values of −13 to −12 are distributed in the latitude zone of 9―10°N in the East and West Areas.
3 Discussions
3.1 Clay mineral components as indicators to clay mineral genesis
It is recognized that the illite and kaolinite in ma-rine sediments originate from terrene, and they seldom change after deposition, therefore they are indicators to terrestrial sources[11,26,27]. Most of chlorite in marine sediments originates from weathering of the terri-genous materials, some of it can also be formed by alteration of marine volcanic debris[11,26,27]. As chlorite is easy to change during transportation, it cannot be simply used as an indicator to material sources. Montmorillonite in oceanic sediments also come from various sources, but most of them are formed from seawater associated with alteration of marine volcanic debris, so this type of montmorillonites is autogenetic. Some of it originates from the weathering of old ter-restrial volcanic rocks. Because montmorillonite is
relatively stable in the marine environment, and its content increases with that of marine volcanic debris (such as volcanic ash)[11,28], the M/I ratios of clay frac-tions can reflect the relative contributions of auto-genesis and terrigenesis. So M/I ratios could be con-sidered as an “index of autogenetic sources” of clay minerals, lower M/I ratios indicate higher content of terrigenous clay minerals and lower content of auto-genetic clay originating from alteration of volcanic materials, while higher M/I ratios indicate reverse conditions. Based on the data of clay mineral compo-nents of surface sediments in world oceans (after Chamley, 1989[11]), the mean value of M/I ratios of clay fractions in every ocean is calculated and used as an index to determine the clay source in the eastern Pacific Ocean (Table 3).
Table 3 Mean values of clay mineral compositions (%) and M/I ratios in surface sediments from world oceans and the study area
Ocean area Mont-morill-onite Illite Kaolinite Chlorite M/I
North Atlantica) 16 55 19 10 0.29 South Atlantica) 26 47 16 11 0.55 North Pacifica) 34 40 8 18 0.85 South Pacifica) 53 26 8 13 2.04 India Oceana) 46 29 15 10 1.59 Study area 27 50 10 13 0.65 Terrigenous and autogenetic mixed clay
48 32 9 11 1.55
Terrigenous clay 21 53 10 16 0.41 a) After Chamley, 1989[11].
Table 3 shows that the M/I ratios of clay fractions from world oceans decrease in the following order: South Pacific, India Ocean, North Pacific, South At-lantic and North Atlantic. It seems that the contents of terrigenous clay minerals increase in this order, while those of autogenetic clay minerals change in opposite

REE and εNd of clay fractions in sediments from the eastern Pacific Ocean 707
order. Chamley[11] has proved that clay fractions in the Atlantic sediments are almost composed of terrigenous clay minerals. The reason is that most areas of the At-lantic Ocean are short of strong volcanic activities and autogenic clay minerals. The lowest mean value of M/I ratio (0.29) appears in the North Atlantic sedi-ments, that also reflects that the clay fractions contain the highest content of terrigenous clay minerals. The mean value of M/I ratio in South Atlantic sediments less than the value of the North Atlantic shows that terrigenous clay minerals are rich in the North Atlantic sediments. The values of M/I ratios in the South Pa-cific and North Pacific are higher than those in the Atlantic, indicating that the Pacific sediments contain more autogenous clay minerals. The highest mean value of M/I ratio (2.04) appears in the South Pacific sediments. It is because the volcanic eruptions or hydrothermal process are most active in the area, and autogenic montmorillonite is richest in the sediments. The mean value of M/I ratio in the North Pacific much lower than that of the South Pacific sediments reflects that the sediments in the North Pacific are abundant of terrigenous clay minerals. Furthermore, the kaolinite contents in the Atlantic sediments are generally higher than that of chlorite, but the kaolinite contents from the Pacific are generally lower than that of chlorite. It is deduced similarly that the India Ocean sediments enrich terrigenous clay minerals. The study area be-longs to the North Pacific, and its mean values of clay mineral contents and M/I ratio are close to those of the North Pacific, which indicates that the clay sources are nearly the same as that of the North Pacific. However, the distributions of clay minerals are not homogeneous. Based on the M/I ratio the clay fractions can be di-vided into two types. One type of the clay fractions has the values of M/I ratio greater than 1, the mean values of clay mineral contents lie between those of the South Pacific and the North Pacific, so this type of clay fractions is classified as terrigenous and autoge-netic mixed clay fraction. Zeolite formed by the weathering of volcanic ash and hydrothermal genetic minerals such as barite, autogenetic magnetite and pyroxene were found in relative bulk sediments, which also confirms the existence of submarine volcanism or hot spots[29]. Another type of clay fractions has a mean
value of M/I ratio less than 1, and the mean values of clay mineral contents are close to those of the Atlantic, and the contents of kaolinite and chlorite are close to those of the North Pacific sediments,so this type of clay fractions is classified as terrigenous clay fraction.
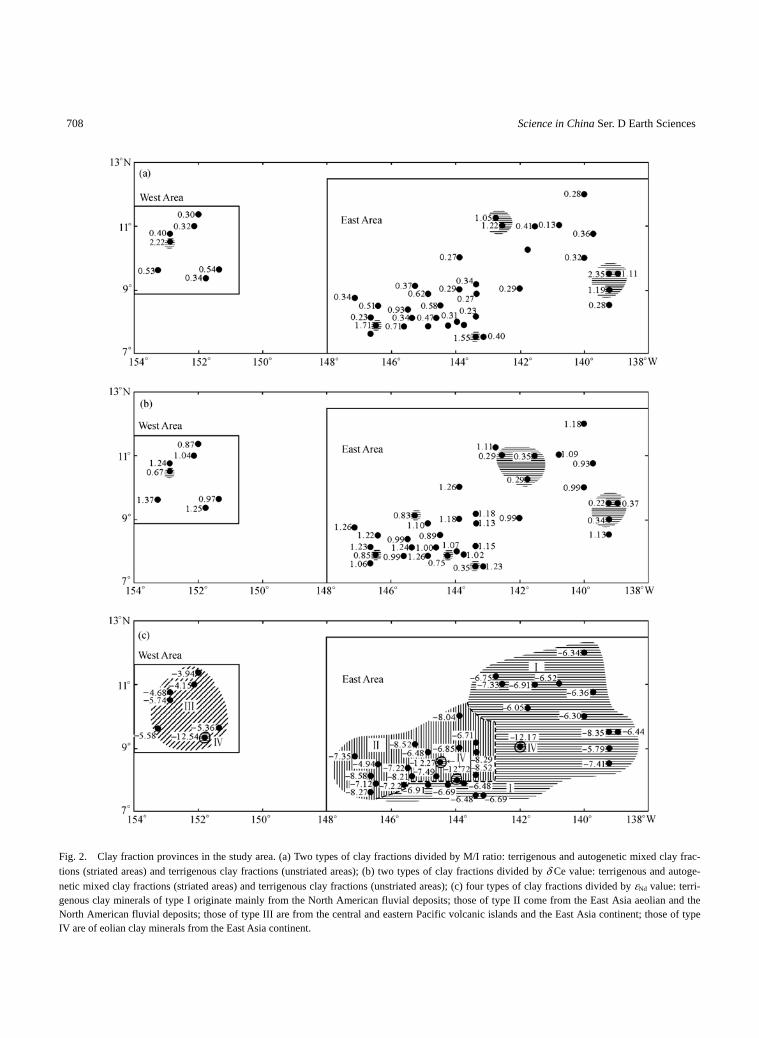
The terrigenous and autogenetic mixed clay frac-tions in the study area show patchy distribution (stri-ated areas in Fig. 2(a)), while the terrigenous clay frac-tions covers a large area (unstriated areas in Fig. 2(a)). The occurrence frequency of terrigenous and autoge-netic mixed clay fractions in the East Area is relatively higher than that in the West Area. There is no definite relationship between clay fraction type and bulk sediment type. For example, the bulk sediments of terrigeous and autogenetic mixed clay fractions in the eastern part of the East Area are mainly of zeolite clay, and those in the western part of the East Area and in the West Area are mainly of siliceous clay and sili-ceous ooze; the bulk sediments of terrigenous clay fractions are of siliceous clay and siliceous ooze.
3.2 Implication of REE in clay fractions to clay mineral genesis
As mentioned above, the clay fractions can be di-vided into 3 types by δ Ce values: clay fractions with negative Ce anomaly, small or no Ce anomaly and positive Ce anomaly. Because δ Ce values of marine sediments can implicate their sources and sedimentary environment[12―14], and have been used to identify the genesis of clay minerals successfully[11,16―18], the δ Ce values with REE contents and REE patterns of clay fractions can reflect the genesis of clay minerals.
( i ) Clay fractions with negative Ce anomaly. The REE patterns of clay fractions with negative Ce anomaly (δ Ce<0.85) normalized by NASC[24] (Fig. 3) are very similar to those of deep seawater from the Pacific[30,31] and to that of the mean value for 22 bulk non-calcareous sediments from the study area[18,32], which indicates that clay minerals are formed from marine environment and have characteristics of auto-genesis. Meanwhile, the REE patterns are very similar to those of clay fractions in sediments from the Nazca Plate of the South Pacific[11] and that of autogenetic
708 Science in China Ser. D Earth Sciences
Fig. 2. Clay fraction provinces in the study area. (a) Two types of clay fractions divided by M/I ratio: terrigenous and autogenetic mixed clay frac-tions (striated areas) and terrigenous clay fractions (unstriated areas); (b) two types of clay fractions divided by δ Ce value: terrigenous and autoge-netic mixed clay fractions (striated areas) and terrigenous clay fractions (unstriated areas); (c) four types of clay fractions divided by εNd value: terri-genous clay minerals of type I originate mainly from the North American fluvial deposits; those of type II come from the East Asia aeolian and the North American fluvial deposits; those of type III are from the central and eastern Pacific volcanic islands and the East Asia continent; those of type IV are of eolian clay minerals from the East Asia continent.

REE and εNd of clay fractions in sediments from the eastern Pacific Ocean 709
Fig. 3. NASC-normalized REE patterns of clay fractions with various Ce anomaly. The REE mean values of China loess come from [33], and the REE mean value of the eastern Pacific non-calcareous bulk sedi-ments was calculated from Table 1.
montmorillonite from the Pacific[12]. It has been sug-gested that there is more than 50% of montmorillonite in the sediments of Nazca Plate originating from al-tering of volcanic materials, so it is deduced that there are considerable autogenetic montmorillonite in this type of clay fractions, and the clay fractions have characteristics of autogenesis.
The proportion of autogenetic montmorillonite in clay fractions could be estimated by the comparison of REE contents or patterns between samples and typical sediments, for example, REE patterns of the clay frac-tions with negative Ce anomaly are similar to those from the Nazca Plate (Fig. 2) indicate that this type of clay fraction contains about 50% of autogenetic montmorillonite. Some REE patterns of clay fractions with δ Ce value less than 0.37 (mainly distributed in the eastern part of East Area) are similar to those of Piper’s autogenetic montmorillonite from the South Pacific. Because autogenetic montmorillonite has a high value of REE, these clay fractions (δ Ce<0.37) may have more than 50% of autogenetic montmorillo-nite. The δ Ce values of some clay fractions are close to 0.8, and their REE patterns are very similar to those with small or no Ce anomaly and positive Ce anomaly. It implicates that these clay fractions may contain less
autogenetic montmorillonite. In summary, the clay fractions with negative Ce anomaly can be classified as terrigenous and autogenetic mixed clay, and their autogenetic montmorillonite contents are variable.
(ii) Clay fractions with weak or no Ce anomaly and positive Ce anomaly. The REE patterns of clay frac-tions with weak or no Ce anomaly (δ Ce 0.86―1.05) are very similar to the patterns of those with positive Ce anomaly clay (δ Ce 1.05―1.37) (Fig.3). The REE patterns of these two types of clay fraction resemble the pattern of the mean value of China loess (including sand loess, clay loess, and loess)[33], and show rather strong characteristics of terrigenous clay. The REE contents of them are a little higher than those of the mean value of China loess, which indicates that they contain a little amount of autogenetic montmorillonite, but those autogenetic montmorillonite do not influence their terrigenous character, so the two types of clay can be classified as terrigenous clay fraction.
The terrigenous and autogenetic mixed clay frac-tions determined by δ Ce value show patchy distribu-tions (Fig. 2(b), striated area), and is more developed in the eastern part of the East Area, while the terri-genous clay fractions (unstriated area) cover a large area in the study area. Comparing Fig. 2(b) with Fig. 2(a), it is shown that the genesis types and distribu-tions of clay fractions determined by δ Ce values and M/I ratios are very similar, except for a few sites. For example, the clay fractions at sites C5744 and C5525 are classified as terrigenous and autogenetic mixed clay fraction by δ Ce values, but this is not the case by M/I ratios, which may indicate that REE are more sen-sitive to the source of clay fractions, especially can effectively determine the influence of submarine vol-canic activity or hot spot.
3.3 εNd as a tracer to the source of terrigenous clay minerals
Clay fractions in the study area can be divided into 4 types by their εNd values (Fig. 2(c)). The distribu-tions of them are different with two types of clay frac-tions classified by M/I ratios and δ Ce values, which indicates that the geological significance of εNd is different from those of M/I ratio and δ Ce value. εNd

710 Science in China Ser. D Earth Sciences
ferent from those of M/I ratio and δ Ce value. εNd value is less sensitive than M/I ratio and δ Ce value to autogenetic clay minerals, contrarily it inherits the feature of the source of terrigenous clay minerals. The εNd values of terrigenous materials are all less than those of submarine autogenetic materials[20], so a few amount of terrigenous clay may cause the εNd values of clay fractions to decrease obviously[15]. Since ma-rine sediments barely attain Nd isotopic balance with seawater[15,34―37], the εNd values of clay fractions can be considered as a tracer to terrigenous clay minerals.
Clay fractions of type I are distributed in the eastern part and the southern part of the East Area. Most of the εNd values are in the range of –7 to –6, some of the values are less than –7, which are much less than the mean εNd value (–3±2) of the modern Pacific surface seawater[34], and less than the εNd values of deep sea-water (–5[20] or –5 to –4[37]). In the clay fractions of type I, autogenetic clay minerals should inherit the εNd value of bottom seawater. Based on the mass balance law, there should exist some terrigenous clay minerals with lower εNd values in the clay fractions. The εNd values of these clay fractions are close to but little less than those of American continental fluvial deposits (about –6)[38―40], indicating that the terrigenous clay minerals originate mainly from American fluvial de-posits, and a little amount of terrigenous clay minerals with εNd values less than –6 originates from other sources such as the East Asia continent. The clay min-erals from the American continent were transported to the study area by the westward equatorial current, while those from the East Asia continent may be transported by wind or other forces.
Clay fractions of type II are distributed in the west-ern part of the East Area. The εNd values are mainly in the range of –9 to –7 and are close to those of terri-genous silicate detritus (–11 to –9[20]) from the central North Pacific, which proves that terrigenous clay min-erals are enriched in this type of clay fractions. This result is the same as that reflected by M/I ratios and εNd values. As the εNd values of type II are lower than those of type I, there must be other terrigenous clay minerals with more low εNd values in the clay fractions
besides the American fluvial clay minerals. Among the continents encircling the Pacific, materials from the North American continent (old craton) have the lowest εNd values (sometimes as low as –19)[37], and the εNd values of the East Asia continent material are in the range of –14―–12[20]. There is still no evidence to indicate that the eolian materials in the eastern Pacific sediments originate from the North American conti-nent. As viewed from the general circulation of at-mosphere, the terrigenous clay minerals with low εNd values in the eastern Pacific Ocean are likely to be from the East Asia continent brought by the west wind.
Clay fractions of type III are distributed in the West Area. The εNd values are in the range of –6 to –3 and are the highest in the study area. This type of clay fraction is abundant in terrigenous clay minerals ac-cording to the M/I ratio and εNd value. Compared with the clay fractions of type II, those of type III have higher εNd values, meaning that they have more radio-genic Nd which originates mainly from mantle and basic volcanic materials[15]. In the Pacific Ocean, the seawater and silicate detritus with high εNd values are mainly distributed in the volcanic zone in the north-western Pacific and the mid-ocean ridge area[20,37]. The εNd values of volcanic glass in sediments from the northwestern Pacific island arcs are in the range of –8.8―8.3 with an average of –4.2[20]. It can be de-duced that most of clay minerals could come from the central and eastern Pacific islands, even from the western Pacific island arcs, some of them may be from East Asia. Although the transportation of the western Pacific island materials is still uncertain, it has been proved from the current circulation system that the eastward flowing AABW[6] can transport the terri-genous material to the study area.
Clay fractions of type IV are distributed sporadi-cally in the latitude band between 9―10°N. The εNd values at 4 sites are in the range of –13 to –12, and are much lower than those of clay fractions of other types. As the εNd values are close to those of the East Asia continent material[20], the clay factions of type IV are mainly composed of eolian clay minerals originating

REE and εNd of clay fractions in sediments from the eastern Pacific Ocean 711
from the East Asia continent. As the mechanisms of transportation and deposition of the clay fractions are not very clear, it is necessary to do more researches.
4 Conclusions
(1) M/I ratios and REE parameters such as ΣREE, δ Ce and LREE/HREE ratio of clay fraction in non- calcareous sediment from the eastern Pacific can indi-cate the genesis and sources of clay minerals, and the εNd value can serve as a tracer to the distribution pat-tern of clay province and sources of terrigenous clay minerals.
(2) Clay fractions with M/I ratios >1, δ Ce <0.85, ΣREE >400 µg/g, LREE/HREE ratios ≈ 4, and REE patterns similar to those of pelagic sediments contain a large amount of autogenetic montmorillonite. The clay fractions are identified as terrigenous and autogenetic mixed clay fraction. They show patchy distributions, implicating that volcanism or hydrothermal activities (hot spot) exist on the eastern Pacific plate. Clay frac-tions with M/I ratios <1, δ Ce=0.86―1.5, ΣREE= 200―350 µg/g, LREE/HREE ratio ≈ 6, and REE pat-terns similar to those of China loess belong to the type of terrigenous clay fraction. They are distributed in large areas, indicating that the terrigenous clay miner-als are dominant in the clay fractions of the eastern Pacific.
(3) The εNd values of clay fractions are mainly con-trolled by the sources of terrigenous clay minerals. According to εNd values, the clay fractions can be di-vided into 4 types: those of type I are distributed in the eastern and the southern part of the East Area with εNd values being –8 to –6, and terrigenous clay minerals originate mainly from the North American fluvial de-posits; those of type II are distributed in the western part of the East Area with εNd values being –9 to –7, and the clay minerals come from the East Asia eolian and the North American fluvial deposits; those of type III are distributed in the West Area with εNd values of –5 to –3, and clay minerals come from the central and eastern Pacific volcanic islands and the East Asia con-tinent; those of type IV are distributed sporadically in the latitude band between 9―10°N with εNd values
being –13 to –12, and are mainly composed of eolian clay minerals from the East Asia continent.
Acknowledgements This work was supported by the National Natu-ral Science Foundation of China (Grant Nos. 49676291 and 49776295) and the China Ocean Mineral Resources R & D Association (Grant No. Dy105-01-04-02).
References
1. Guangzhou Marine Geology Survey, Reports of Pacific Geologi-cal Investigation, Vol.2 (in Chinese), Beijing: Geological Pub-lishing House, 1992, 1―116.
2. Guangzhou Marine Geology Survey, Reports of Pacific Geologi-cal Investigation, Vol.3 (in Chinese), Beijing: Geological Pub-lishing House, 1993, 1―175.
3. Xu Dongyu, Chen Zongtuan, Meng Xiangying, Late Cenozoic Palaeoenvironments and Events in the Central Pacific Ocean (in Chinese), Beijing: Geological Publishing House, 1994, 1―11.
4. Bischoff, J. L., Heath, G. R., Leinen, M., Geochemistry of deep-sea sediments from the Pacific manganese nodule province: Domes, A, B and C, in: Marine Geology and Oceanography of the Pacific Manganese Nodule Province (eds. Bischoff, J. L., Piper, D. Z.), New York: Plenum Press, 1979, 397―436.
5. Riech, V., Grafenstein, R. V., Sedimentological and geochemical trends in deep-sea sedimentation of the Clarion-Chipperton block southeast of Hawaii since the early Miocene, in: Manganese Nod-ules and Sediments in the Equatorial North Pacific Ocean, Sonne Cruise SO25, 1982 (eds. von Stackelberg, U., Beiersdorf, H.), Hannover: Burdesanstalt für Geowissenschaften und Rohstoffe und Geologischelandesämster in der Bundesrepublic Deutschland, 1987, 71―104.
6. Johnson, G. C., Toole, J. M., Flow of deep and bottom water in the Pacific at 10°N, Deep-Sea Reseach, 1993, 40(2): 371―394. [DOI]
7. Marine Geology Department of Tongji University, Introduction to Palaeo-oceanography (in Chinese), Shanghai: Tongji University Press, 1989, 45―147.
8. Seibold, E., Berger, W. H., The Sea Floor, Berlin: Springer-Verlag, 1993, 97―125.
9. Rea, D. K., The paleoclimatic record provided by eolian deposi-tion in the deep sea: The geologic history of wind, Rev. Geophys., 1994, 32: 159―195. [DOI]
10. Menard, H. W., Marine Geology of the Pacific, New York: McGraw-Hill Book Company, 1964.
11. Chamley, H., Clay Sedimentology, Berlin: Springer-Verlag, 1989, 259―289.
12. Piper, D. Z., Rare earth elements in the sedimentary cycle: A summary, Chemistry Geology, 1974, 14: 285―304.
13. Piper, D. Z., Rare earth elements in ferromanganese nodules and other marine phase, Geochim. Cosmochim. Acta, 1974, 38: 1007―1023.
14. Fleet, A. J., Aqueous and sedimentary geochemistry of rare earth

712 Science in China Ser. D Earth Sciences
elements, in Rare Earth Elements Geochemistry (ed. Henderson, P.), Amsterdam: Elsevier, 1984, 343―421.
15. Faure, G., Principles of Isotope Geology, New York: John Wiley & Sons, 1986, 117―248.
16. Tlig, S., Steinberg, M., Distribution of rare earth elements (REE) in size fractions of recent sediments of the Indian Ocean, Chemi-cal Geology, 1982, 37: 317―333. [DOI]
17. Toyoda, K., Nakamura, Y., Masuda, A., Rare earth elements of Pacific pelagic sediments, Geochim. Cosmochim. Acta, 1990, 54: 1093―1103. [DOI]
18. Liu Jihua, Liang Hongfeng, Xia Ning et al., REE geochemistry of fractions less than 2 µm in pelagic sediments from the eastern Pa-cific, Geochimica (in Chinese), 1998, 27(1): 49―58.
19. Goldstein, S., O’Nions, R. K., Nd and Sr isotopic relationships in pelagic clay and ferromanganese deposits, Nature, 1981, 292: 324―327.
20. Jones, C. E., Halliday, A. N., Rea D. K. et al., Neodymium iso-topic variations in North Pacific modern silicate sediment and the insignificance of detrital REE contributions to seawater, Earth Planet Sci. Lett., 1994, 127: 55―66. [DOI]
21. Dean, W. E., Leinen, M., Stow, D. A. V., Classification of deep-sea fine-grained sediments, Journal of Sedimentary Petrol-ogy, 1985, 55: 250―256.
22. Biscaye, P. E., Mineralogy and sedimentation of recent deep-sea clay in the Atlantic Ocean and adjacent seas and oceans, Geologi-cal Society of American Bulletin, 1965, 76: 803―832.
23. Wang Zhonggang, Yu Xueyuan, Zhao Zhenhua et al., Rare Earth Element Geochemistry (in Chinese), Beijing: Science Press, 1989, 88―93.
24. Haskin, L. A., Haskin, M. A., Frey, F. A. et al., Relative and abso-lute terrestrial abundances of the rare earths, in: Origin and Dis-tribution of Elements, 1 (ed. Ahrens, L.H.), Oxford: Pergamon, 1968, 889―910.
25. Jocobsen, S. B., Wasserburg, G. J., Sm-Nd isotopic evolution of chondrites, Earth Planet Sci. Lett., 1980, 50: 139. [DOI]
26. He Liangbiao, Clay minerals in Chinese seas and their adjacent area, Science in China, Series B (in Chinese), 1989, 1: 75―83.
27. Liu Zhifei, Trentesaux, A., Clemens, S. C. et al., Quaternary clay mineralogy in the northern South China Sea (ODP Site 1146)―Implications for oceanic current transport and East Asian mon-soon evolution, Science in China, Series D (in Chinese), 2003, 46(12): 1223―1235. [Abstract] [PDF]
28. Zhang Haiping, Shi Xuefa, Chen Jin et al., Mineralogy of smec-tites in the surface sediments from the East Pacific and its signifi-cance, Chinses Science Bulletin, 2003, 48(Supp.): 110―116. [Abstract] [PDF]
29. Liu Jihua, Liang Hongfeng, Hydrothermal activities recorded in surface sediments from the eastern Pacific, Marine Geology Let-ters (in Chinese), 1996, 9: 4―6.
30. De Baar, H. J. W., Bacon, M. P., Brewer, P. G. et al., Rare-earth elements in the Pacific and the Atlantic Oceans, Geochim. Cos-mochim. Acta, 1985, 49: 1953―1959.
31. Zhang, J., Amakawa, H., Nazaki, Y., The comparative behaviors of yttrium and lanthanides in the seawater of the North Pacific, Geophysics Research Letters, 1994, 21: 2677―2680. [DOI]
32. Liu Jihua, REE geochemistry of pelagic sediments from the cen-tral Pacific, Marine Geology Quaternary Geology (in Chinese), 1992, 2(2): 33―42.
33. Wen Qizhong, Geochemistry of Chinese Loess (in Chinese), Bei-jing: Science Press, 1989, 66―114.
34. Piepgras, D. J., Wasserburg, G. J., Neodymium isotopic variations in seawater, Earth Planet Sci. Lett., 1980, 50: 128―138. [DOI]
35. Goldstein, S., O’Nions, R. K., Nd and Sr isotopic relationships in pelagic clay and ferromanganese deposits, Nature, 1981, 292: 324―327.
36. Aplin, A., Michard, A., Albrede, F., 143Nd/144Nd in Pacific ferro-manganese encrustations and nodules, Earth Planet Sci. Lett., 1987, 81: 7―14. [DOI]
37. Albarede, F., Goldstein, S. L., World map of Nd isotopes in sea-floor ferromanganese deposits, Geology, 1992, 20: 761―763. [DOI]
38. Nakai, S., Halliday, A. N., Rea, D. K., Provenance of dust in the Pacific Ocean, Earth Planet Sci. Lett., 1993, 119: 143―157. [DOI]
39. Goldstein, S. L., O’Nions, R. K., Hamilton, P. J., A Sm-Nd iso-topic study of atmospheric dusts and particulates from major river systems, Earth Planet Sci. Lett., 1984, 70: 221―236. [DOI]
40. Goldstein, S. J., Jacobsen, S. B., Nd and Sr isotopic systematics of river water suspended materials: Implications for crustal evolution, Earth Planet Sci. Lett., 1988, 87: 249―265. [DOI]