
Electrically Addressed Dual Resonator Sensing Platform for Biochemical Detection
Upload
independentCategory
view
4download
0
R(s
Aa
b
a
ARRA
KEAPAMM
1
easwssaaiTeame
(
0d
Journal of Neuroscience Methods 191 (2010) 66–74
Contents lists available at ScienceDirect
Journal of Neuroscience Methods
journa l homepage: www.e lsev ier .com/ locate / jneumeth
ecording and analysis of electrically evoked compound action potentialsECAPs) with MED-EL cochlear implants and different artifact reductiontrategies in Matlab
ndreas Bahmera,∗, Otto Peterb, Uwe Baumanna
University of Frankfurt Main, Clinic for Otolaryngology, Audiological Acoustics, 60590 Frankfurt, GermanyUniversity of Innsbruck, Institute for Ion Physics and Applied Physics, 6020 Innsbruck, Austria
r t i c l e i n f o
rticle history:eceived 15 February 2010eceived in revised form 2 June 2010ccepted 7 June 2010
eywords:CAPrtifact reductionrecision triphasic pulseslternating sequence
a b s t r a c t
Electrically evoked compound action potentials (ECAPs) are used in auditory research to evaluate theresponse of the auditory nerve to electrical stimulation. Animal preparations are typically used for therecording. With the introduction of a new generation of cochlear implants, however it is possible to recordthe response of the auditory nerve to electrical stimulation in humans as well, which is used in the clinicto test whether the implant works properly and whether the auditory nerve is responsive. Currently,ECAPs are used to estimate thresholds for speech processor programs. In addition, ECAPs recordingsallow new research to be addressed, e.g., to evaluate enhanced electrical stimulation patterns. Researchplatforms are required to test user-defined stimuli and algorithms for the ECAPs analysis. Clinical fittingsoftware that records ECAPs is not flexible enough for this purpose. To enable a larger group of scientists
iller sequenceatlab
to pursue research in this field, we introduce a flexible setup that allows to change stimulation andrecording parameters. ECAP recording and analysis software was developed in Matlab (The Mathworks,Inc.) for standard PC, using a National instruments (PCI-6533, National Instruments, Austin, TX) card anda Research Interface Box 2 (RIB2, Department of Ion Physics and Applied Physics at the University ofInnsbruck, Innsbruck, Austria) for MED-EL cochlear implants. ECAP recordings of a human subject with
ductired.
three different artifact reare presented and compa
. Introduction
The new generation of cochlear implants allows electricallyvoked compound action potentials (ECAPs), which are small volt-ges generated by the auditory nerve in response to electricaltimulation, to be recorded. The small response signal is recordedithin a short timespan after a stimulation pulse. The response
ignal from the auditory nerve is the sum of action potentials fromeveral auditory nerve fibers and is called the evoked compoundction potential. The action potential has a latency of 0.2–0.4 msfter stimulus onset and consists of two phases differing in polar-ty, namely the N1 (negative, first) and P2 (positive, second) peaks.he amplitude and latency of the neural response peaks can be
valuated for diagnostic purposes. During cochlear implant surgeryuditory nerve response to stimulation from the implant can beonitored. For implant fitting the responses can provide thresholdsstimates that maybe used in the speech processor program (Brown
∗ Corresponding author.E-mail addresses: [email protected] (A. Bahmer), [email protected]
O. Peter), [email protected] (U. Baumann).
165-0270/$ – see front matter © 2010 Elsevier B.V. All rights reserved.oi:10.1016/j.jneumeth.2010.06.008
on methods (alternating, Miller modified masker-probe, triphasic pulses)
© 2010 Elsevier B.V. All rights reserved.
et al., 2000; Franck and Norton, 2001; Potts et al., 2007; Milleret al., 2008). For neurophysiological research, the ECAP recordingin cochlear implant (CI) patients has good clinical utility becauseanimal preparations are not required and the research can bemore directly applied to humans. Therefore, research platformsare required to test user-defined stimuli, alterations of recordingparameters, and algorithms for the ECAP analyses. Currently, clin-ical software from most manufacturers offers the possibility topursue auditory nerve response measurements; however they onlyallow the user the employment of limited parameter settings forstimulation and recording, give limited access to artifact reductionmethods, and mostly give no access to raw recording data. In con-trast, our setup gives full access to the stimulation and recordingabilities of the MED-EL implant which offers the implants’ widestrange of abilities. Stimuli can be selected to be biphasic or tripha-sic pulses with different pulse and interphase durations or pulsepolarity; recording parameters can be selected such as the num-
ber of recording that are averaged, filter settings, signal-recordingstart-time after the stimuli, or input voltage range of the recording.In addition, raw data that is provided can be used for user-definedpost hoc analyses. Besides, the setup is the first and only one thatis capable to stimulate with user-defined triphasic pulse shapes. In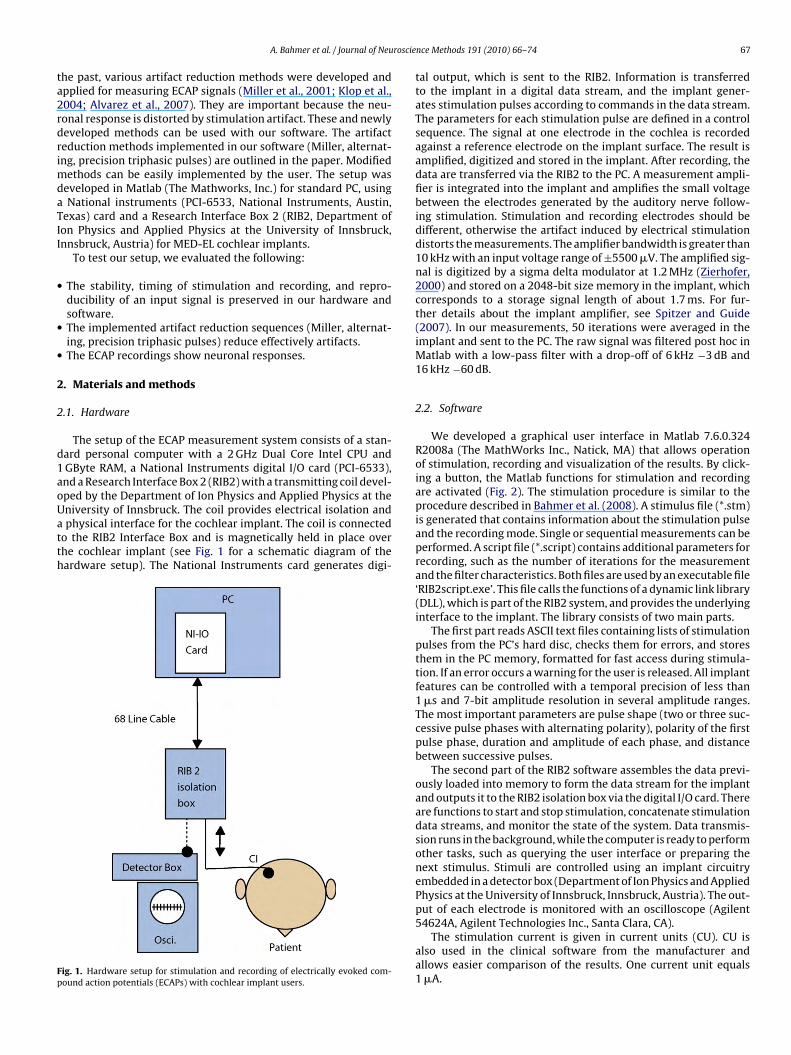
roscie
ta2rdrimdaTII
•
•
•
2
2
d1aoUatth
Fp
A. Bahmer et al. / Journal of Neu
he past, various artifact reduction methods were developed andpplied for measuring ECAP signals (Miller et al., 2001; Klop et al.,004; Alvarez et al., 2007). They are important because the neu-onal response is distorted by stimulation artifact. These and newlyeveloped methods can be used with our software. The artifacteduction methods implemented in our software (Miller, alternat-ng, precision triphasic pulses) are outlined in the paper. Modified
ethods can be easily implemented by the user. The setup waseveloped in Matlab (The Mathworks, Inc.) for standard PC, usingNational instruments (PCI-6533, National Instruments, Austin,
exas) card and a Research Interface Box 2 (RIB2, Department ofon Physics and Applied Physics at the University of Innsbruck,nnsbruck, Austria) for MED-EL cochlear implants.
To test our setup, we evaluated the following:
The stability, timing of stimulation and recording, and repro-ducibility of an input signal is preserved in our hardware andsoftware.The implemented artifact reduction sequences (Miller, alternat-ing, precision triphasic pulses) reduce effectively artifacts.The ECAP recordings show neuronal responses.
. Materials and methods
.1. Hardware
The setup of the ECAP measurement system consists of a stan-ard personal computer with a 2 GHz Dual Core Intel CPU andGByte RAM, a National Instruments digital I/O card (PCI-6533),nd a Research Interface Box 2 (RIB2) with a transmitting coil devel-ped by the Department of Ion Physics and Applied Physics at the
niversity of Innsbruck. The coil provides electrical isolation andphysical interface for the cochlear implant. The coil is connectedo the RIB2 Interface Box and is magnetically held in place overhe cochlear implant (see Fig. 1 for a schematic diagram of theardware setup). The National Instruments card generates digi-
ig. 1. Hardware setup for stimulation and recording of electrically evoked com-ound action potentials (ECAPs) with cochlear implant users.
nce Methods 191 (2010) 66–74 67
tal output, which is sent to the RIB2. Information is transferredto the implant in a digital data stream, and the implant gener-ates stimulation pulses according to commands in the data stream.The parameters for each stimulation pulse are defined in a controlsequence. The signal at one electrode in the cochlea is recordedagainst a reference electrode on the implant surface. The result isamplified, digitized and stored in the implant. After recording, thedata are transferred via the RIB2 to the PC. A measurement ampli-fier is integrated into the implant and amplifies the small voltagebetween the electrodes generated by the auditory nerve follow-ing stimulation. Stimulation and recording electrodes should bedifferent, otherwise the artifact induced by electrical stimulationdistorts the measurements. The amplifier bandwidth is greater than10 kHz with an input voltage range of ±5500 �V. The amplified sig-nal is digitized by a sigma delta modulator at 1.2 MHz (Zierhofer,2000) and stored on a 2048-bit size memory in the implant, whichcorresponds to a storage signal length of about 1.7 ms. For fur-ther details about the implant amplifier, see Spitzer and Guide(2007). In our measurements, 50 iterations were averaged in theimplant and sent to the PC. The raw signal was filtered post hoc inMatlab with a low-pass filter with a drop-off of 6 kHz −3 dB and16 kHz −60 dB.
2.2. Software
We developed a graphical user interface in Matlab 7.6.0.324R2008a (The MathWorks Inc., Natick, MA) that allows operationof stimulation, recording and visualization of the results. By click-ing a button, the Matlab functions for stimulation and recordingare activated (Fig. 2). The stimulation procedure is similar to theprocedure described in Bahmer et al. (2008). A stimulus file (*.stm)is generated that contains information about the stimulation pulseand the recording mode. Single or sequential measurements can beperformed. A script file (*.script) contains additional parameters forrecording, such as the number of iterations for the measurementand the filter characteristics. Both files are used by an executable file‘RIB2script.exe’. This file calls the functions of a dynamic link library(DLL), which is part of the RIB2 system, and provides the underlyinginterface to the implant. The library consists of two main parts.
The first part reads ASCII text files containing lists of stimulationpulses from the PC’s hard disc, checks them for errors, and storesthem in the PC memory, formatted for fast access during stimula-tion. If an error occurs a warning for the user is released. All implantfeatures can be controlled with a temporal precision of less than1 �s and 7-bit amplitude resolution in several amplitude ranges.The most important parameters are pulse shape (two or three suc-cessive pulse phases with alternating polarity), polarity of the firstpulse phase, duration and amplitude of each phase, and distancebetween successive pulses.
The second part of the RIB2 software assembles the data previ-ously loaded into memory to form the data stream for the implantand outputs it to the RIB2 isolation box via the digital I/O card. Thereare functions to start and stop stimulation, concatenate stimulationdata streams, and monitor the state of the system. Data transmis-sion runs in the background, while the computer is ready to performother tasks, such as querying the user interface or preparing thenext stimulus. Stimuli are controlled using an implant circuitryembedded in a detector box (Department of Ion Physics and AppliedPhysics at the University of Innsbruck, Innsbruck, Austria). The out-put of each electrode is monitored with an oscilloscope (Agilent
54624A, Agilent Technologies Inc., Santa Clara, CA).The stimulation current is given in current units (CU). CU isalso used in the clinical software from the manufacturer andallows easier comparison of the results. One current unit equals1 �A.
68 A. Bahmer et al. / Journal of Neuroscience Methods 191 (2010) 66–74
ing of
2
r1uulittmmiapm(tTcprDa
R
2
tpBitiaspapsr
asrT
R
Fig. 2. Software modules used for stimulation and record
.2.1. Miller artifact reduction sequenceThe Miller artifact reduction method (Miller et al., 2000) is
elated to the standard masker-probe methods (Brown and Abbas,990; Charlet de Sauvage et al., 1983). These methods are basedpon the auditory nerve showing a saturation effect when stim-lation pulses are applied at high rates. The higher the rate, the
ower the neuronal response until no response is evoked. Thiss called refractory behavior. In the absolute refractory period,he nerve shows no response; in the relative refractory period,he nerve shows reduced response. The Miller method (improved
asker-probe method) consists of four measurements. Two of theeasurements have double pulses, with one having an inter-pulse
nterval within the absolute refractory period. The other can bedjusted within the absolute refractory period, relative refractoryeriod, or outside refractory period. The remaining two measure-ents are a single pulse which corresponds in time to the first pulse
masker) of the double pulses. These pulses evoke only artifactshat are introduced in the double pulse sequence by the masker.he response from the double pulse outside the refractory periodontains the neuronal signal (B). The response from the doubleulse within the refractory period (A) is subtracted from this. Theesponses from the remaining two pulses (C corresponding to B, and
corresponding to A) are also subtracted to get rid of the maskerrtifacts. Thus, the neuronal response is
= B − A − C + D
.2.2. Alternate and zero template artifact reduction sequenceTwo hypotheses are the basis for the alternating artifact reduc-
ion sequence. (1) Artifacts follow the stimulus in phase andolarity. Given two symmetric stimuli of opposite polarity (A and), the resulting artifacts are also symmetric but opposed in polar-
ty. (2) The ECAP signal is not stimulus polarity sensitive. Based onhese hypotheses, averaging of two stimuli with opposing polar-ty results, theoretically, in a perfect cancellation of the artifactnd the ECAP signal remains. However, because the two hypothe-es are often violated, the result is not as perfect as desired. First,olarity depending artifacts are caused by amplifier and tissue char-cteristics, which results in asymmetric artifacts that do not cancelerfectly. Second, the responses of the auditory nerve are also notymmetric for stimuli of opposing polarity (Miller et al., 1998). Thisesults in distortion of the neuronal signal.
To get rid of artifacts resulting solely from the recording setup,reference measurement with zero amplitude stimulation is often
ubtracted from the measurement with non-zero stimulation. Thiseference measurement is called a zero amplitude template (ZT).hus, the neuronal response is
= A + B2
− ZT
electrically evoked compound action potentials (ECAPs).
2.2.3. Precision triphasic pulses artifact reduction sequenceA triphasic pulse consists of three phases (+/−/+ or −/+/−),
resulting in a charge-balanced pulse. One way of charge balancingis to make the duration of all three phases equal, and make the sumof the amplitudes of phase one and phase three equal to the ampli-tude of phase two. In the context of MED-EL implants, this is calleda precision triphasic pulse. The amplitude of the first phase (thethird phase is automatically adjusted such that the total amountof charge is zero) can be adjusted so that the stimulation artifct iscanceled (Schoesser et al., 2001). The choice of the optimal ampli-tude for the first (and last) phase depends on stimulation and/orrecording parameters. Thus, it can differ from patient to patient.
3. Results
3.1. Recordings with a signal generator
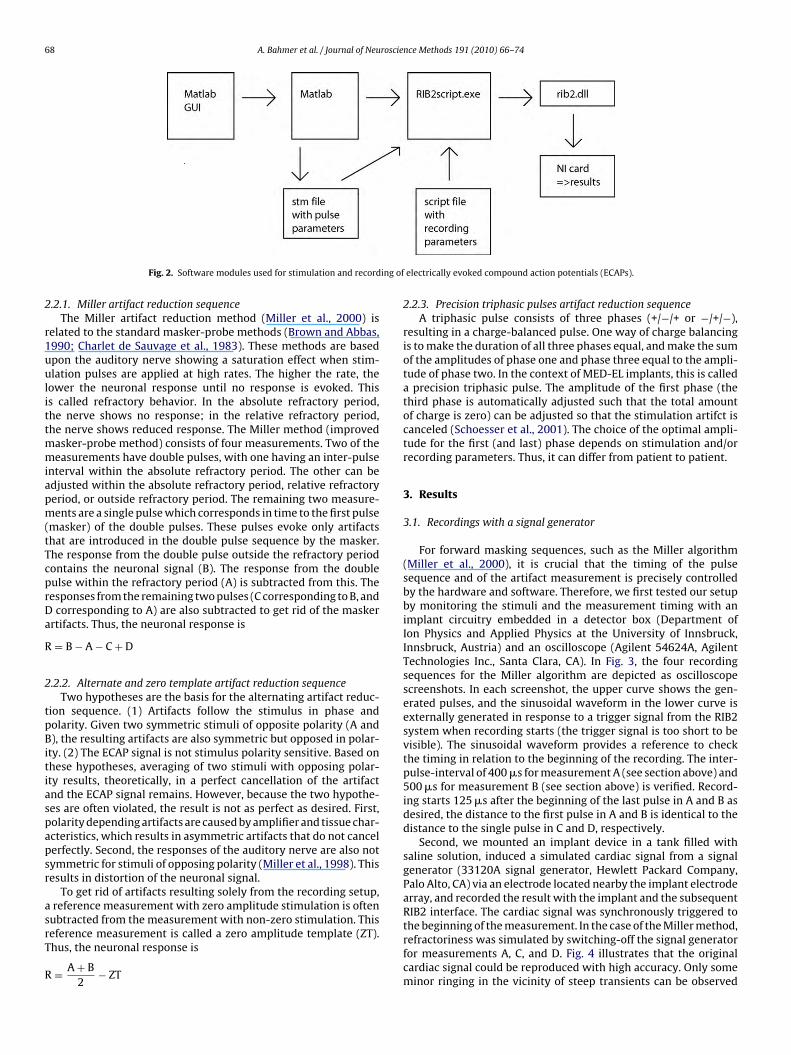
For forward masking sequences, such as the Miller algorithm(Miller et al., 2000), it is crucial that the timing of the pulsesequence and of the artifact measurement is precisely controlledby the hardware and software. Therefore, we first tested our setupby monitoring the stimuli and the measurement timing with animplant circuitry embedded in a detector box (Department ofIon Physics and Applied Physics at the University of Innsbruck,Innsbruck, Austria) and an oscilloscope (Agilent 54624A, AgilentTechnologies Inc., Santa Clara, CA). In Fig. 3, the four recordingsequences for the Miller algorithm are depicted as oscilloscopescreenshots. In each screenshot, the upper curve shows the gen-erated pulses, and the sinusoidal waveform in the lower curve isexternally generated in response to a trigger signal from the RIB2system when recording starts (the trigger signal is too short to bevisible). The sinusoidal waveform provides a reference to checkthe timing in relation to the beginning of the recording. The inter-pulse-interval of 400 �s for measurement A (see section above) and500 �s for measurement B (see section above) is verified. Record-ing starts 125 �s after the beginning of the last pulse in A and B asdesired, the distance to the first pulse in A and B is identical to thedistance to the single pulse in C and D, respectively.
Second, we mounted an implant device in a tank filled withsaline solution, induced a simulated cardiac signal from a signalgenerator (33120A signal generator, Hewlett Packard Company,Palo Alto, CA) via an electrode located nearby the implant electrodearray, and recorded the result with the implant and the subsequentRIB2 interface. The cardiac signal was synchronously triggered to
the beginning of the measurement. In the case of the Miller method,refractoriness was simulated by switching-off the signal generatorfor measurements A, C, and D. Fig. 4 illustrates that the originalcardiac signal could be reproduced with high accuracy. Only someminor ringing in the vicinity of steep transients can be observed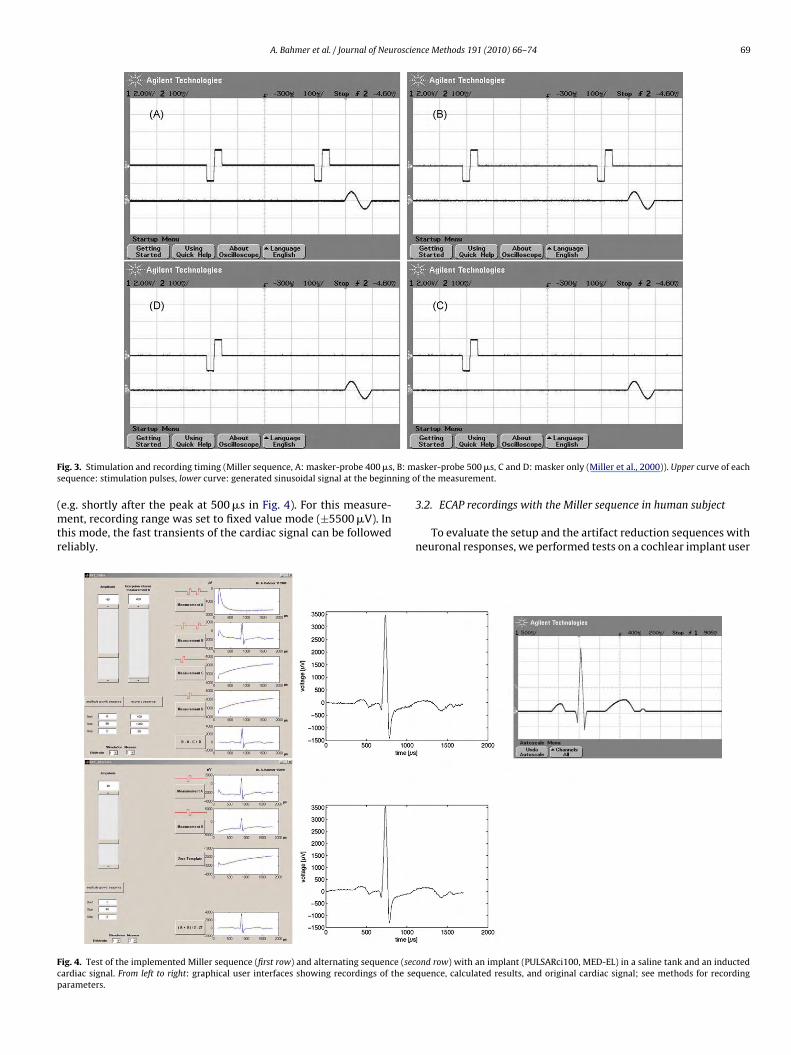
A. Bahmer et al. / Journal of Neuroscience Methods 191 (2010) 66–74 69
F , B: ms ning o
(mtr
Fcp
ig. 3. Stimulation and recording timing (Miller sequence, A: masker-probe 400 �sequence: stimulation pulses, lower curve: generated sinusoidal signal at the begin
e.g. shortly after the peak at 500 �s in Fig. 4). For this measure-ent, recording range was set to fixed value mode (±5500 �V). In
his mode, the fast transients of the cardiac signal can be followedeliably.
ig. 4. Test of the implemented Miller sequence (first row) and alternating sequence (secardiac signal. From left to right: graphical user interfaces showing recordings of the searameters.
asker-probe 500 �s, C and D: masker only (Miller et al., 2000)). Upper curve of eachf the measurement.
3.2. ECAP recordings with the Miller sequence in human subject
To evaluate the setup and the artifact reduction sequences withneuronal responses, we performed tests on a cochlear implant user
ond row) with an implant (PULSARci100, MED-EL) in a saline tank and an inductedquence, calculated results, and original cardiac signal; see methods for recording
7 roscie
(sterlsufMo
Fcos
0 A. Bahmer et al. / Journal of Neu
MED-EL SONATAti100). First, we determined which electrodeshowed clear responses in auditory response telemetry (ART) inhe MAESTRO fitting software (MED-EL, Innsbruck). Stimulation oflectrode #9 resulted in strong and clear neuronal responses at theecording electrode #8 (electrode #1 most apical) with stimulationevels greater than 471 current units (CU). The patient tolerated
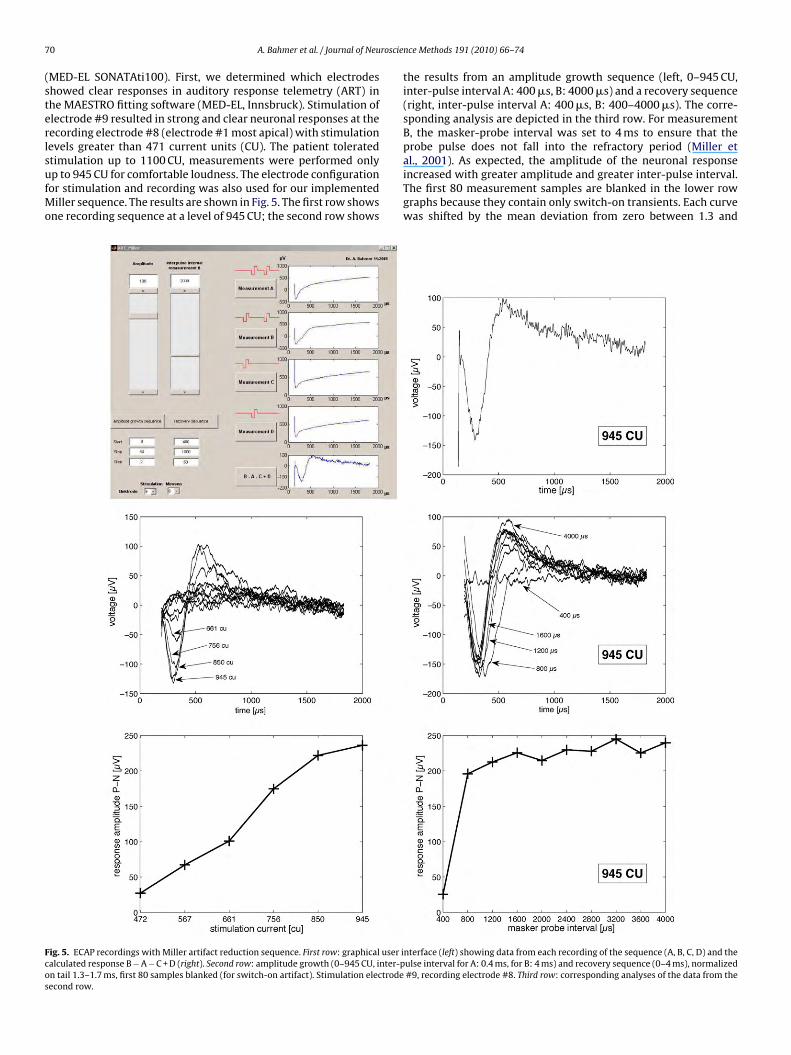
timulation up to 1100 CU, measurements were performed onlyp to 945 CU for comfortable loudness. The electrode configurationor stimulation and recording was also used for our implementediller sequence. The results are shown in Fig. 5. The first row showsne recording sequence at a level of 945 CU; the second row shows
ig. 5. ECAP recordings with Miller artifact reduction sequence. First row: graphical user ialculated response B − A − C + D (right). Second row: amplitude growth (0–945 CU, inter-pn tail 1.3–1.7 ms, first 80 samples blanked (for switch-on artifact). Stimulation electrodeecond row.
nce Methods 191 (2010) 66–74
the results from an amplitude growth sequence (left, 0–945 CU,inter-pulse interval A: 400 �s, B: 4000 �s) and a recovery sequence(right, inter-pulse interval A: 400 �s, B: 400–4000 �s). The corre-sponding analysis are depicted in the third row. For measurementB, the masker-probe interval was set to 4 ms to ensure that theprobe pulse does not fall into the refractory period (Miller et
al., 2001). As expected, the amplitude of the neuronal responseincreased with greater amplitude and greater inter-pulse interval.The first 80 measurement samples are blanked in the lower rowgraphs because they contain only switch-on transients. Each curvewas shifted by the mean deviation from zero between 1.3 andnterface (left) showing data from each recording of the sequence (A, B, C, D) and theulse interval for A: 0.4 ms, for B: 4 ms) and recovery sequence (0–4 ms), normalized#9, recording electrode #8. Third row: corresponding analyses of the data from the
A. Bahmer et al. / Journal of Neuroscience Methods 191 (2010) 66–74 71
F ence.r alizes excep
1n
3t
se
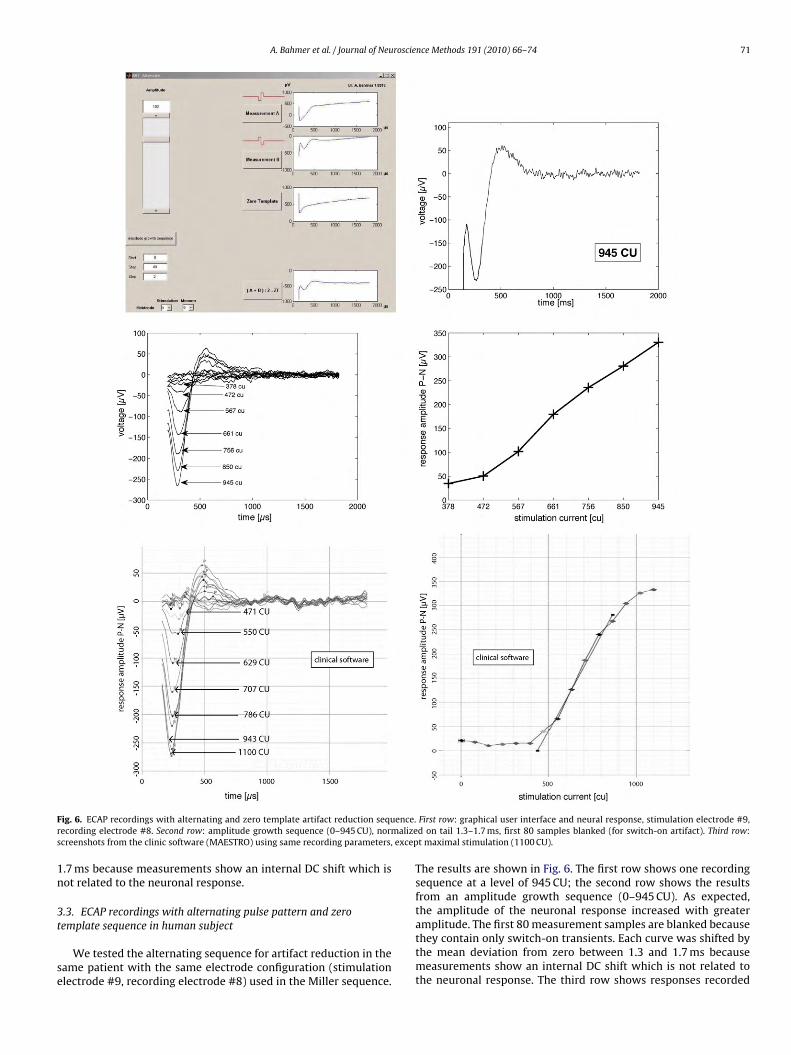
ig. 6. ECAP recordings with alternating and zero template artifact reduction sequecording electrode #8. Second row: amplitude growth sequence (0–945 CU), normcreenshots from the clinic software (MAESTRO) using same recording parameters,
.7 ms because measurements show an internal DC shift which isot related to the neuronal response.
.3. ECAP recordings with alternating pulse pattern and zero
emplate sequence in human subjectWe tested the alternating sequence for artifact reduction in theame patient with the same electrode configuration (stimulationlectrode #9, recording electrode #8) used in the Miller sequence.
First row: graphical user interface and neural response, stimulation electrode #9,d on tail 1.3–1.7 ms, first 80 samples blanked (for switch-on artifact). Third row:t maximal stimulation (1100 CU).
The results are shown in Fig. 6. The first row shows one recordingsequence at a level of 945 CU; the second row shows the resultsfrom an amplitude growth sequence (0–945 CU). As expected,the amplitude of the neuronal response increased with greater
amplitude. The first 80 measurement samples are blanked becausethey contain only switch-on transients. Each curve was shifted bythe mean deviation from zero between 1.3 and 1.7 ms becausemeasurements show an internal DC shift which is not related tothe neuronal response. The third row shows responses recorded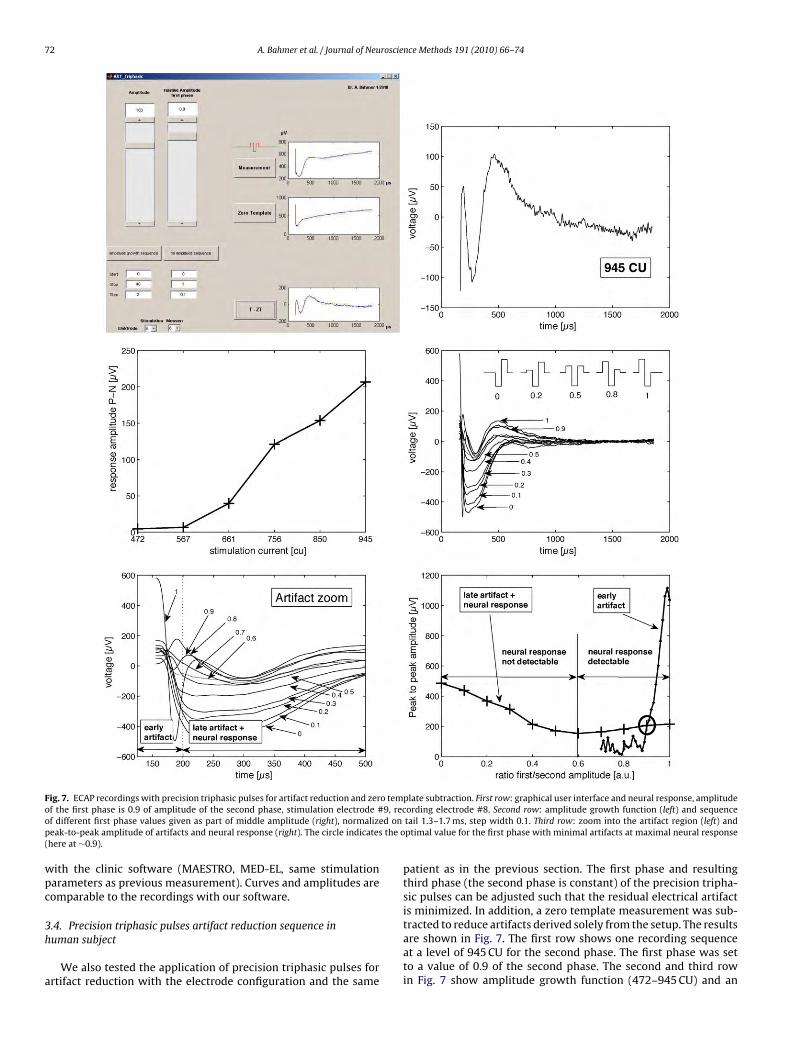
72 A. Bahmer et al. / Journal of Neuroscience Methods 191 (2010) 66–74
Fig. 7. ECAP recordings with precision triphasic pulses for artifact reduction and zero template subtraction. First row: graphical user interface and neural response, amplitudeo 9, reco d onp the o(
wpc
3h
a
f the first phase is 0.9 of amplitude of the second phase, stimulation electrode #f different first phase values given as part of middle amplitude (right), normalizeeak-to-peak amplitude of artifacts and neural response (right). The circle indicateshere at ∼0.9).
ith the clinic software (MAESTRO, MED-EL, same stimulationarameters as previous measurement). Curves and amplitudes areomparable to the recordings with our software.
.4. Precision triphasic pulses artifact reduction sequence inuman subject
We also tested the application of precision triphasic pulses forrtifact reduction with the electrode configuration and the same
ording electrode #8. Second row: amplitude growth function (left) and sequencetail 1.3–1.7 ms, step width 0.1. Third row: zoom into the artifact region (left) andptimal value for the first phase with minimal artifacts at maximal neural response
patient as in the previous section. The first phase and resultingthird phase (the second phase is constant) of the precision tripha-sic pulses can be adjusted such that the residual electrical artifactis minimized. In addition, a zero template measurement was sub-
tracted to reduce artifacts derived solely from the setup. The resultsare shown in Fig. 7. The first row shows one recording sequenceat a level of 945 CU for the second phase. The first phase was setto a value of 0.9 of the second phase. The second and third rowin Fig. 7 show amplitude growth function (472–945 CU) and an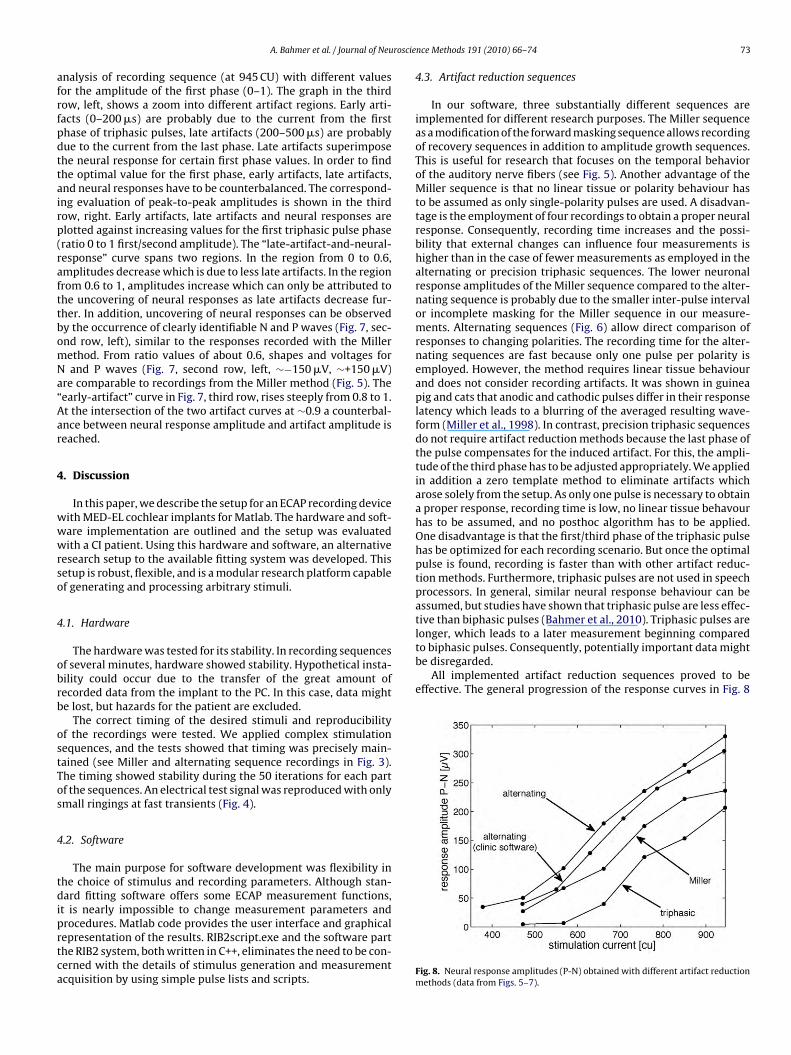
roscie
afrfpdttairp(rafttbomNa“Aar
4
wwwrso
4
obrb
ostTos
4
tdiprtca
longer, which leads to a later measurement beginning comparedto biphasic pulses. Consequently, potentially important data mightbe disregarded.
All implemented artifact reduction sequences proved to beeffective. The general progression of the response curves in Fig. 8
A. Bahmer et al. / Journal of Neu
nalysis of recording sequence (at 945 CU) with different valuesor the amplitude of the first phase (0–1). The graph in the thirdow, left, shows a zoom into different artifact regions. Early arti-acts (0–200 �s) are probably due to the current from the firsthase of triphasic pulses, late artifacts (200–500 �s) are probablyue to the current from the last phase. Late artifacts superimposehe neural response for certain first phase values. In order to findhe optimal value for the first phase, early artifacts, late artifacts,nd neural responses have to be counterbalanced. The correspond-ng evaluation of peak-to-peak amplitudes is shown in the thirdow, right. Early artifacts, late artifacts and neural responses arelotted against increasing values for the first triphasic pulse phaseratio 0 to 1 first/second amplitude). The “late-artifact-and-neural-esponse” curve spans two regions. In the region from 0 to 0.6,mplitudes decrease which is due to less late artifacts. In the regionrom 0.6 to 1, amplitudes increase which can only be attributed tohe uncovering of neural responses as late artifacts decrease fur-her. In addition, uncovering of neural responses can be observedy the occurrence of clearly identifiable N and P waves (Fig. 7, sec-nd row, left), similar to the responses recorded with the Millerethod. From ratio values of about 0.6, shapes and voltages forand P waves (Fig. 7, second row, left, ∼−150 �V, ∼+150 �V)
re comparable to recordings from the Miller method (Fig. 5). Theearly-artifact” curve in Fig. 7, third row, rises steeply from 0.8 to 1.t the intersection of the two artifact curves at ∼0.9 a counterbal-nce between neural response amplitude and artifact amplitude iseached.
. Discussion
In this paper, we describe the setup for an ECAP recording deviceith MED-EL cochlear implants for Matlab. The hardware and soft-are implementation are outlined and the setup was evaluatedith a CI patient. Using this hardware and software, an alternative
esearch setup to the available fitting system was developed. Thisetup is robust, flexible, and is a modular research platform capablef generating and processing arbitrary stimuli.
.1. Hardware
The hardware was tested for its stability. In recording sequencesf several minutes, hardware showed stability. Hypothetical insta-ility could occur due to the transfer of the great amount ofecorded data from the implant to the PC. In this case, data mighte lost, but hazards for the patient are excluded.
The correct timing of the desired stimuli and reproducibilityf the recordings were tested. We applied complex stimulationequences, and the tests showed that timing was precisely main-ained (see Miller and alternating sequence recordings in Fig. 3).he timing showed stability during the 50 iterations for each partf the sequences. An electrical test signal was reproduced with onlymall ringings at fast transients (Fig. 4).
.2. Software
The main purpose for software development was flexibility inhe choice of stimulus and recording parameters. Although stan-ard fitting software offers some ECAP measurement functions,
t is nearly impossible to change measurement parameters and
rocedures. Matlab code provides the user interface and graphicalepresentation of the results. RIB2script.exe and the software parthe RIB2 system, both written in C++, eliminates the need to be con-erned with the details of stimulus generation and measurementcquisition by using simple pulse lists and scripts.nce Methods 191 (2010) 66–74 73
4.3. Artifact reduction sequences
In our software, three substantially different sequences areimplemented for different research purposes. The Miller sequenceas a modification of the forward masking sequence allows recordingof recovery sequences in addition to amplitude growth sequences.This is useful for research that focuses on the temporal behaviorof the auditory nerve fibers (see Fig. 5). Another advantage of theMiller sequence is that no linear tissue or polarity behaviour hasto be assumed as only single-polarity pulses are used. A disadvan-tage is the employment of four recordings to obtain a proper neuralresponse. Consequently, recording time increases and the possi-bility that external changes can influence four measurements ishigher than in the case of fewer measurements as employed in thealternating or precision triphasic sequences. The lower neuronalresponse amplitudes of the Miller sequence compared to the alter-nating sequence is probably due to the smaller inter-pulse intervalor incomplete masking for the Miller sequence in our measure-ments. Alternating sequences (Fig. 6) allow direct comparison ofresponses to changing polarities. The recording time for the alter-nating sequences are fast because only one pulse per polarity isemployed. However, the method requires linear tissue behaviourand does not consider recording artifacts. It was shown in guineapig and cats that anodic and cathodic pulses differ in their responselatency which leads to a blurring of the averaged resulting wave-form (Miller et al., 1998). In contrast, precision triphasic sequencesdo not require artifact reduction methods because the last phase ofthe pulse compensates for the induced artifact. For this, the ampli-tude of the third phase has to be adjusted appropriately. We appliedin addition a zero template method to eliminate artifacts whicharose solely from the setup. As only one pulse is necessary to obtaina proper response, recording time is low, no linear tissue behavourhas to be assumed, and no posthoc algorithm has to be applied.One disadvantage is that the first/third phase of the triphasic pulsehas be optimized for each recording scenario. But once the optimalpulse is found, recording is faster than with other artifact reduc-tion methods. Furthermore, triphasic pulses are not used in speechprocessors. In general, similar neural response behaviour can beassumed, but studies have shown that triphasic pulse are less effec-tive than biphasic pulses (Bahmer et al., 2010). Triphasic pulses are
Fig. 8. Neural response amplitudes (P-N) obtained with different artifact reductionmethods (data from Figs. 5–7).
7 roscie
wamhmlnebpp
5
•
•
•
•
A
psOlrcb
4 A. Bahmer et al. / Journal of Neu
ith increasing stimulation current is similar for all methods;lternating methods are smoother than the Miller and triphasicethod. Our implemented alternating sequence shows slightly
igher response amplitudes than the alternating sequence imple-ented in the clinical software; the triphasic sequence shows
owest response amplitudes due to the lower neural responsive-ess of triphasic pulses in comparison to biphasic pulses (Bahmert al., 2010). Further experiments should address the response sta-ility for the Miller sequence, the polarity dependency in differentatients for alternating sequence, and the range of optimizationarameters for the triphasic sequence.
. Conclusions
A flexible and robust hardware and software environment in Mat-lab for recording ECAPs with MED-EL cochlear implant subjectswas developed.The hardware and software showed stability, correct timing ofstimulation, and reproducibility of the signal and measurements.The implemented artifact reduction sequences (Miller, alternat-ing, precision triphasic pulses) proved to be effective.ECAP amplitude growth and recovery sequences in a human sub-ject showed reasonable neuronal responses.
cknowledgments
We would like to thank the University of Innsbruck for thereparation of the Resarch Interface Box 2 (RIB2) and the corre-ponding software library. We also would like to thank Dr. Jane M.
pie for improvements to our English language usage and wouldike to thank the cochlear implant subject for participation. Theecordings were performed under the authorization of the Ethicommittee of the University of Frankfurt. The work was supportedy a grant from the DFG (BA 2085/3-1).
nce Methods 191 (2010) 66–74
References
Alvarez I, Torre A, Sainz M, Roldan C, Schoesser H, Spitzer P. Generalized alternatingstimulation: a novel method to reduce stimulus artifact in electrically evokedcompound action potentials. J Neurosci Meth 2007;165:95–103.
Bahmer A, Peter O, Baumann U. Recording of electrically evoked auditory brainstemresponses (E-ABR) with an integrated stimulus generator in Matlab. J NeurosciMeth 2008;173:306–14.
Bahmer A, Polak M, Baumann U. Recording of electrically evoked auditory brain-stem responses after electrical stimulation with biphasic, triphasic and precisiontriphasic pulses. Hear Res 2010;259:75–85.
Brown CJ, Abbas PJ. Electrically evoked whole-nerve action-potentials: data fromhuman cochlear implant users. J Acoust Soc Am 1990;88:1385–91.
Brown CJ, Hughes ML, Luk B, Abbas PJ, Wolaver A, Gervais J. The relationship betweeneap and eabr thresholds and levels used to program the nucleus 24 speechprocessor: data from adults. Ear Hearing 2000;21:151–63.
Charlet de Sauvage R, Cazals Y, Erre JP, Aran JM. Acoustically derived auditory nerveaction potential evoked by electrical stimulation: an estimation of the waveformof single unit contribution. J Acoust Soc Am 1983;73:616–27.
Franck KH, Norton SJ. Estimation of psychophysical levels using the electricallyevoked compound action potential measured with the neuronal responsetelemetry capabilities of cochlear corporation’s CI24m device. Ear Hearing2001;22:289–99.
Klop W, Hartlooper A, Briare JJ, Frijns JH. A new method for dealing with the stimulusartefact in electrically evoked compound action potential measurements. ActaOto-Laryngol 2004;124:137–43.
Miller CA, Brown CJ, Abbas PJ, Chi SL. The clinical application of potentials evokedfrom the peripheral auditory system. Hear Res 2008;242:184–97.
Miller CA, Abbas PJ, Brown CJ. Response properties of the refractory auditory nervefiber. JARO 2001;2:216–32.
Miller CA, Abbas PJ, Brown CJ. An improved method of reducing stimulus artifact inthe electrically evoked whole-nerve potential. Ear Hearing 2000;21:280–90.
Miller CA, Abbas PJ, Rubinstein JT, Robinson BK, Matsuoka AJ, Woodworth G. Elec-trically evoked compound action potentials of guinea pig and cat: responses tomonopolar, monophasic stimulation. Hear Res 1998;119:142–54.
Potts LG, Skinner MW, Gotter BD, Strube MJ, Brenner CA. Relation between neuralresponses telemetry thresholds, T- and C-levels, and loudness judgments in 12adults nucleus 24 cochlear implant recipients. Ear Hearing 2007;28:495–511.
Schoesser H, Zierhofer C, Hochmair ES. Measuring electrically evoked compound
action potentials using triphasic pulses for the reduction of the residual stimu-lation artifact. In: Conference on implantable auditory prosthesis; 2001.Spitzer P, Guide ART. ART guide. Innsbruck, Austria: MED-EL Worldwide Head-quaters; 2007.
Zierhofer C. Adaptive sigma-delta modulation with one-bit quantization. IEEE TransCircuit Syst 2000;47(5):408–15.
Copyright © 2022 FDOKUMEN