Recent developments in non-Newtonian molecular dynamics
92
Physics Reports 305 (1998) 1—92 Recent developments in non-Newtonian molecular dynamics Sten S. Sarman!,",1, Denis J. Evans#, Peter T. Cummings!,",* ! Department of Chemical Engineering, 419 Dougherty Engineering Building, University of Tennessee, Knoxville, TN 37996-2200, USA " Chemical Technology Division, Oak Ridge National Laboratory, Oak Ridge, TN 37831-6268, USA # Research School of Chemistry, Australian National University, Canberra, ACT 0200 Australia Received December 1997; editor: M.L. Klein Contents 1. Introduction 4 2. Background 5 2.1. Fluctuation relations for transport coefficients 5 2.2. Gauss’s principle and thermostats 7 2.3. Tensors 8 3. Nonequilibrium molecular dynamics algorithms for molecular fluids 9 3.1. Rigid molecular fluids under shear 9 3.2. Thermal conductivity of rigid molecular fluids 16 4. Coupled thermal conductivity and mass diffusion in liquid mixtures 18 4.1. Heat flow algorithms for large systems 24 5. Transport coefficients in shearing fluids 26 5.1. The self-diffusion coefficient 26 5.2. The mutual diffusion coefficient 32 5.3. Thermal conductivity 33 6. Anisotropic liquids 36 6.1. Introduction 36 6.2. Constraint algorithms 36 6.3. Diffusion and thermal conductivity 38 6.4. Flow properties 42 7. Developments in the fundamental theory of nonequilibrium steady states 52 7.1. Equivalence of thermostatting mechanisms away from equilibrium 52 7.2. Equivalence of constant field (The´venin) and constant current (Norton) ensembles 60 7.3. Lyapunov exponents and transport coefficients 63 7.4. Probability of second law violations in steady states away from equilibrium 67 7.5. Probability of finding equilibrium states which subsequently lead to second law violating steady states 71 7.6. Verification of the Kawasaki representation of nonlinear response theory 76 7.7. A connection between dynamical systems theory and nonlinear response theory 87 8. Postscript 89 Acknowledgments 89 References 89 * Corresponding author. 1 Current address: Department of Physical Chemistry, Go¨teborgs Universitet, S-412 96 Go¨teborg, Sweden. 0370-1573/98/$19.00 ( 1998 Elsevier Science B.V. All rights reserved PII S0370-1573(97)00018-0
-
Upload
independent -
Category
Documents
-
view
2 -
download
0
Transcript of Recent developments in non-Newtonian molecular dynamics

Physics Reports 305 (1998) 1—92
Recent developments in non-Newtonian molecular dynamics
Sten S. Sarman!,",1, Denis J. Evans#, Peter T. Cummings!,",*! Department of Chemical Engineering, 419 Dougherty Engineering Building, University of Tennessee, Knoxville,
TN 37996-2200, USA" Chemical Technology Division, Oak Ridge National Laboratory, Oak Ridge, TN 37831-6268, USA
# Research School of Chemistry, Australian National University, Canberra, ACT 0200 Australia
Received December 1997; editor: M.L. Klein
Contents
1. Introduction 42. Background 5
2.1. Fluctuation relations for transportcoefficients 5
2.2. Gauss’s principle and thermostats 72.3. Tensors 8
3. Nonequilibrium molecular dynamicsalgorithms for molecular fluids 93.1. Rigid molecular fluids under shear 93.2. Thermal conductivity of rigid molecular
fluids 164. Coupled thermal conductivity and mass
diffusion in liquid mixtures 184.1. Heat flow algorithms for large systems 24
5. Transport coefficients in shearing fluids 265.1. The self-diffusion coefficient 265.2. The mutual diffusion coefficient 325.3. Thermal conductivity 33
6. Anisotropic liquids 366.1. Introduction 366.2. Constraint algorithms 366.3. Diffusion and thermal conductivity 386.4. Flow properties 42
7. Developments in the fundamental theory ofnonequilibrium steady states 527.1. Equivalence of thermostatting mechanisms
away from equilibrium 527.2. Equivalence of constant field (Thevenin)
and constant current (Norton)ensembles 60
7.3. Lyapunov exponents and transportcoefficients 63
7.4. Probability of second law violations insteady states away from equilibrium 67
7.5. Probability of finding equilibrium stateswhich subsequently lead to second lawviolating steady states 71
7.6. Verification of the Kawasakirepresentation of nonlinear responsetheory 76
7.7. A connection between dynamical systemstheory and nonlinear response theory 87
8. Postscript 89Acknowledgments 89References 89
*Corresponding author.1Current address: Department of Physical Chemistry, Goteborgs Universitet, S-412 96 Goteborg, Sweden.
0370-1573/98/$19.00 ( 1998 Elsevier Science B.V. All rights reservedPII S 0 3 7 0 - 1 5 7 3 ( 9 7 ) 0 0 0 1 8 - 0

RECENT DEVELOPMENTS INNON-NEWTONIAN MOLECULAR DYNAMICS
Sten S. SARMANa,b, Denis J. EVANS#, Peter T. CUMMINGSa,b
! Department of Chemical Engineering, 419 Dougherty Engineering Building,University of Tennessee Knoxville, TN 37996-2200, USA
" Chemical Technology Division, Oak Ridge National Laboratory, Oak Ridge,TN 37831-6268, USA
# Research School of Chemistry, Australian National University, Canberra, ACT 0200, Australia
AMSTERDAM — LAUSANNE — NEW YORK — OXFORD — SHANNON — TOKYO

Abstract
In just 25 years, nonequilibrium molecular dynamics (NEMD) has gone from a largely empirical molecular simulationmethodology based on reproducing planar Couette flow in brute force fashion to a fully developed subfield of molecularsimulation, underpinned rigorously by linear and nonlinear response theory, with prescriptions now available to simulatesynthetically, in thermodynamically homogeneous systems, all of the transport properties measured experimentally(viscosity, self- and mutual diffusion coefficients, thermal conductivity, and Soret and Dufor coefficients). Many of thesedevelopments were reviewed in the 1990 monograph by Evans and Morriss (Statistical Mechanics of NonequilibriumLiquids, Academic Press, New York, 1990). However, progress in this field has been very rapid since 1990, and this reviewdescribes some of the major developments over the intervening period. These include extensions of the NEMDsimple-fluid algorithms for viscosity and thermal conductivity to rigid nonspherical molecules, coupling of thermalconductivity and mass diffusion in mixtures, calculation of transport properties (diffusion coefficient and thermalconductivity) in systems subjected to nonlinear shear, application of NEMD to model liquid crystal systems, and the useof NEMD simulation to understand the nonlinear dynamics of nonequilibrium steady states. ( 1998 Elsevier ScienceB.V. All rights reserved.
PACS: 05.20.!y; 05.60.#w; 61.20.Ja
S.S. Sarman et al. / Physics Reports 305 (1998) 1—92 3

1. Introduction
The field of nonequilibrium molecular dynamics (NEMD) is relatively new, dating back justa quarter century to the early efforts of Hoover and co-workers [1]. Yet in this remarkably shortperiod, NEMD has gone from a largely empirical molecular simulation methodology based onreproducing in brute force fashion the phenomenology associated with planar Couette flow (bydirect implementation of shearing boundary conditions) [1] to a fully developed subfield ofmolecular simulation, underpinned rigorously by linear and nonlinear response theory, withprescriptions now available to simulate synthetically, in thermodynamically homogenous systems,all of the transport properties measured experimentally (viscosity, self- and mutual diffusioncoefficients, thermal conductivity, and Soret and Dufor coefficients). This effort has been thesubject of several reviews [2—7] culminating in the authoritative monograph by Evans and Morriss[8] published in 1990. This monograph focused primarily on the algorithms and theory of NEMD.Accordingly, applications of NEMD were largely limited to two- and three-dimensional Lennard-Jones or soft-sphere fluids. A review of applications of NEMD to predict the transport propertiesof “real” systems — i.e., systems modeled using known accurate intermolecular potentials to predicttransport properties for comparison with experimental measurements — was subsequently pub-lished by Cummings and Evans [9] and serves as a compendium of NEMD applications up to andincluding 1992 which is complementary to the Evans and Morriss monograph.
However, the recent rapid progress in the field of NEMD, and more generally systems subject toexternal fields in the nonlinear regime, suggests that is an opportune time to provide a review ofdevelopments since 1990. Some of these recent developments have been in algorithms, whileanother significant body of new results concerns the fundamental statistical mechanical propertiesof systems in nonlinear steady states. These two areas represent natural extensions of the focus ofthe Evans—Morriss monograph [8], and are thus the focus of this review. There has also beenconsiderable growth in the applications of NEMD to complex bulk liquids, such as alkanes, and tosystems in confined geometries. We choose not to review applications in this review, as theapplications area is expanding rapidly at this time; additionally, a recent review of applications tocomplex fluids has recently appeared [10].
This review is organized as follows: In Section 2, we recall definitions of the transport coeffi-cients, the methods for calculating them, algorithms and tensors. Then, in Section 3, we describeextensions of the NEMD simple-fluid algorithms for viscosity and thermal conductivity to rigidnon-spherical molecules. The coupling of thermal conductivity and mass diffusion in mixtures isaddressed in Section 4. For mixtures, these properties become problematic due to the existence ofseveral definitions of the heat flux, and because a temperature gradient not only drives a heat fluxbut also mass currents. Section 5 summarizes the substantial body of work on the calculation oftransport properties (diffusion coefficient and thermal conductivity) in systems subjected tonon-linear shear. In this regime, the transport properties, which are scalars in the equilibrium andlinear regimes, become anisotropic.
An interesting case study for NEMD is its application to model liquid crystal systems. Inparticular, in a liquid crystal system in the isotropic state at equilibrium, application of non-linearshear can induce an isotropic-nematic phase transition. Recent work on the Gay—Berne model forliquid crystals by Sarman and co-workers is reviewed in Section 6. In Section 7, the current state ofour growing fundamental understanding of steady states away from equilibrium is described. An
4 S.S. Sarman et al. / Physics Reports 305 (1998) 1—92

important ingredient in this growing understanding is that NEMD provides model systems inwell-controlled steady states as systems to test hypotheses concerning these systems.
Although we have made a concerted effort to make this review as self-contained as possible, itwill be most accessible to those readers with some familiarity with the Evans—Morriss monograph.Likewise, this review can be regarded as an ideal companion to the Evans—Morriss monograph,since it updates with recent developments many of the major focuses on that book.
2. Background
2.1. Fluctuation relations for transport coefficients
A linear transport process can be modeled by a phenomenological relation between thethermodynamic forces X
jand thermodynamic fluxes, J
i,
SJiT"+
j
Lij· X
j, (2.1)
where Lij
is a transport coefficient. We assume that the forces are given external parameterswhereas the fluxes are ensemble averages of phase functions, hence the angular brackets. Commonexamples of relations of this kind are Fourier’s law of thermal conductivity and Fick’s law ofdiffusion. The first mentioned law is
SJQT"!k ·e¹ , (2.2)
where SJQT is the heat flux vector, k is the thermal conductivity tensor and ¹ is the absolute
temperature. Fick’s law can be written as
SJ1T"!L
12·e(k
1!k
2)
¹
"oL12
·ew1
, (2.3)
where SJ1T mass current of component 1 in a binary mixture, k
1and k
2are the chemical potentials,
o is the mass density, D12
is the mutual diffusion tensor and w1is the mass fraction of component 1.
It is possible to derive [11] fluctuation relations for the transport coefficients. For isotropicfluids, the transport tensors k and D
12become isotropic, and the corresponding transport
coefficients are given by
j"»
3kB¹2P
=
0
SJQ(t) · J
Q(0)T
%2dt (2.4)
and
D12
"
»
3okB¹C
k1
w1
!
k2
w1DP
=
0
SJ1(t) · J
1(0)T
%2dt , (2.5)
S.S. Sarman et al. / Physics Reports 305 (1998) 1—92 5
where kB
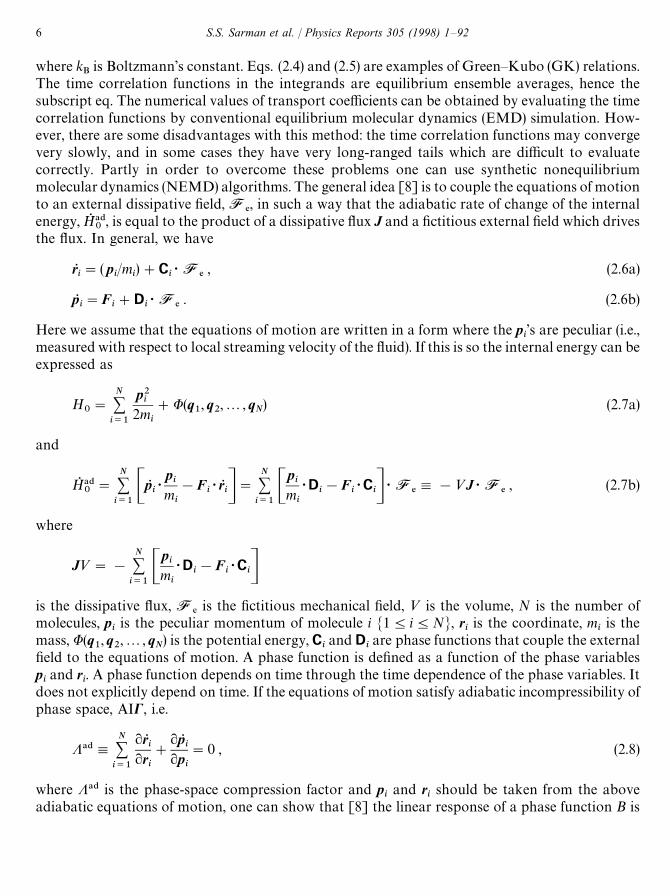
is Boltzmann’s constant. Eqs. (2.4) and (2.5) are examples of Green—Kubo (GK) relations.The time correlation functions in the integrands are equilibrium ensemble averages, hence thesubscript eq. The numerical values of transport coefficients can be obtained by evaluating the timecorrelation functions by conventional equilibrium molecular dynamics (EMD) simulation. How-ever, there are some disadvantages with this method: the time correlation functions may convergevery slowly, and in some cases they have very long-ranged tails which are difficult to evaluatecorrectly. Partly in order to overcome these problems one can use synthetic nonequilibriummolecular dynamics (NEMD) algorithms. The general idea [8] is to couple the equations of motionto an external dissipative field, F
%, in such a way that the adiabatic rate of change of the internal
energy, HQ !$0
, is equal to the product of a dissipative flux J and a fictitious external field which drivesthe flux. In general, we have
rRi"( p
i/m
i)#C
i· F
%, (2.6a)
pRi"F
i#D
i· F
%. (2.6b)
Here we assume that the equations of motion are written in a form where the pi’s are peculiar (i.e.,
measured with respect to local streaming velocity of the fluid). If this is so the internal energy can beexpressed as
H0"
N+i/1
p2i
2mi
#U(q1, q
2,2, q
N) (2.7a)
and
HQ !$0"
N+i/1CpR
i·
pi
mi
!Fi· rR
iD"N+i/1C
pi
mi
· Di!F
i· C
iD · F%,!»J · F
%, (2.7b)
where
J»"!
N+i/1C
pi
mi
· Di!F
i· C
iDis the dissipative flux, F
%is the fictitious mechanical field, » is the volume, N is the number of
molecules, piis the peculiar momentum of molecule i M14i4NN, r
iis the coordinate, m
iis the
mass, U(q1, q
2,2, q
N) is the potential energy, C
iand D
iare phase functions that couple the external
field to the equations of motion. A phase function is defined as a function of the phase variablespiand r
i. A phase function depends on time through the time dependence of the phase variables. It
does not explicitly depend on time. If the equations of motion satisfy adiabatic incompressibility ofphase space, AIC, i.e.
K!$,N+i/1
rRi
ri
#
pRi
pi
"0 , (2.8)
where K!$ is the phase-space compression factor and piand r
ishould be taken from the above
adiabatic equations of motion, one can show that [8] the linear response of a phase function B is
6 S.S. Sarman et al. / Physics Reports 305 (1998) 1—92

given by
limt?=
SB(t)T"SB(0)T%2#bP
=
0
dt@SB(t@)HQ !$0
(0)T"!b»P=
0
dt@SB(t@)J(0)T%2
· F%, (2.9)
where b"1/kB¹ and t is the time that has elapsed after the force F
%was turned on. The utility of
this relation lies in finding equations of motion (2.6) such that J becomes one of the currentsappearing in the Green—Kubo relation for the transport coefficient in question. Then, by lettingB be the other current in the GK relation, one can evaluate the GK relation by monitoring thenonequilibrium steady-state average of B. The equilibrium GK integral and the linear transportcoefficient are obtained in the limit of zero F
%. Note that the time correlation function in the above
equation is the equilibrium time correlation function, hence the subscript ‘eq’, but SB(t)T is thenonequilibrium response. One can thus express the nonequilibrium linear response in terms ofequilibrium averages.
Because NEMD involves simulating a nonequilibrium system under the influence of anexternal force, one can use NEMD to study the nonequilibrium structure and dynamicsin a nonequilibrium steady state. Although this is possible using EMD and GK, in practiceit is so difficult that none has yet attempted to do this. The ability to study nonequilibriumstructure and dynamics in nonequilibrium steady states is perhaps the greatest advantage ofNEMD over EMD.
When NEMD algorithms are applied in practice to calculate transport coefficients, one calcu-lates the linear response of B for a range of external fields. Then one extrapolates to zero field. It isnot possible to apply an arbitrarily small field because the signal to noise ratio goes to zero in thezero field limit. If the field is large, the signal to noise ratio is larger but one may go outside thelinear response regime. In most cases it is possible to find an interval where the signal to noise ratiois large enough and the linear relations are still valid. If this is not possible, special hybrid models,such as the transient time correlation function (TTCF) method, are available [8].
2.2. Gauss’ principle and thermostats
If the equations of motion, Eq. (2.6), are applied, work is done on the system. This work isconverted to heat. If this heat is not removed the system will heat up indefinitely and no steady statewill be reached. This problem can be solved by introducing a thermostat. In practice, this is done byutilising Gauss’ principle of least constraint [12]. We begin by forming the square of the curvature,C. Written in terms of the laboratory coordinates, r
i, the peculiar momenta, p
i,m
i(rRi!u(r
i)), and
the peculiar accelerations, pRi/m
i, the radius of curvature can be written as,
C(( pRi/m
i)Dr
i, p
i,; i"1,N),
12
N+j/1
( pRj!F
i!D
j(q, p) · F
%)2/m
j. (2.10)
One regards the coordinates and peculiar momenta as given and one tries to determine the peculiaraccelerations by minimising C subject to any constraints. One can immediately see that if theexternal field is equal to zero and there are no constraints, we recover Newtons’s equations ofmotion. We can maintain a constant temperature by making the peculiar kinetic energy a constant
S.S. Sarman et al. / Physics Reports 305 (1998) 1—92 7

of motion. This gives the following constraint:
Ek"
N+i/1
p2i
2mi
"const. (2.11a)
The isokinetic equations of motion can be obtained by minimising C subject to this constraint.Gauss’s principle requires that the constraint is expressed in terms of the accelerations. This can beachieved by differentiation of E
kwith respect to time:
EQk"
N+i/1
pi· ( pR
i/m
i)"0 . (2.11b)
The minimisation condition then becomes
( pR
i/m
i)CC#a
N+j/1
pj· ( pR
j/m
j)D"0 (2.12)
which gives
pRi"F
i#D
i· F
%!a p
i. (2.13)
The value of the constraint multiplier a is determined by inserting the equations of motion into theconstraint equation (2.11b). This yields
a"+N
i/1
pi
mi
· [Fi#D
i· F
%]
+Ni/1
p2i
mi
. (2.14)
This version of Gauss’ principle is easier to apply for many systems of interest than is the usualform which is written in terms of laboratory velocities and accelerations rather than peculiarmomenta. One can easily verify that this version is identical to the usual form of Gauss principle.This principle is not limited to fixing the peculiar kinetic energy. It can also be applied to treatholonomic constraints such as bond lengths [8] and nonholonomic constraints that are homo-geneous functions of the momenta [8]. When applied to holonomic constraints, it yields dynamicsidentical to that derived using more well known methods [12].
2.3. Tensors
The thermodynamic forces and fluxes and the transport coefficients are tensors. Therefore, it isappropriate to review some of their properties [13]. There are two kinds of zeroth rank tensors,scalars and pseudoscalars. A scalar is invariant under inversion of the coordinate system, whereasa pseudoscalar changes sign. There are two kinds of first rank tensors: polar vectors andpseudovectors. A polar vector is invariant under inversion of the coordinate system whereasa pseudovector changes direction. They are tensors of the same rank but different parities. A secondrank tensor, A, can be written as a sum of a symmetric traceless tensor, A_ 4, an antisymmetric tensor,
8 S.S. Sarman et al. / Physics Reports 305 (1998) 1—92

A!, and a scalar trace, Tr(A),
A"A_ 4#A!#13Tr(A)1 , (2.15)
where
A_ 4,12[A#AT]!1
3Tr(A)1 , (2.16)
A!,12[A!AT] , (2.17)
and 1 is the second-rank unit tensor. A second-rank antisymmetric tensor can also be written asa pseudovector,
A!,!12e : A (2.18)
or
A!a,!12eabcAcb (2.19)
where eabc is the isotropic third-rank tensor. It is zero if two or more indices are equal and it is #1for an even permutation of 123 and !1 for an odd permutation. The left-hand side of Eqs. (2.18)and (2.19) is called the pseudovector dual of A.
Heat currents and mass currents are polar vectors. Diffusion coefficients and thermal conductivi-ties are second rank tensors. The pressure tensor and the strain rate are also second rank tensors. Inthe linear regime they are related by the viscosity which is a fourth rank tensor. Curie’s principlestates that in an isotropic fluid linear couplings are only possible between tensors of the same rankand parity [13]. This principle is not valid if the symmetry is broken, as is the case in solid crystals,liquid crystals and, for example, if a high strain rate or a strong electric field is applied to anotherwise isotropic fluid.
3. Nonequilibrium molecular dynamics algorithms for molecular fluids
3.1. Rigid molecular fluids under shear
In order to study transport processes in molecular fluids it is necessary to define the streamingangular velocity, x, and the order tensor, Q. We present the formalism valid for uniaxial molecules.It is straightforward but cumbersome to extend the formalism to less symmetric or flexiblemolecules. The average angular velocity is given by
x,H~1 · S"H~11N
N+i/1
Ii· x
i, (3.1)
where
S,1N
N+i/1
Ii· x
i"
1N
N+i/1
Ixi
(3.2)
S.S. Sarman et al. / Physics Reports 305 (1998) 1—92 9

is the intrinsic angular momentum per molecule, xiand I
iare the angular velocity and the inertia
tensor of molecule i and H,SIiT is the average intertia tensor. Eq. (3.1) and the first equality in
Eq. (3.2) is valid for rigid molecules of arbitrary shape. The second equality in Eq. (3.2) is only validfor uniaxial molecules. The moment of inertia around the axes perpendicular to the axis ofrevolution is denoted by I. The average inertia tensor of uniaxial molecules can be expressed as
H,
1N
N+i/1
S1!uLiuLiT"
2I3
1 , (3.3)
where uLiis the unit vector of molecule i in the direction of the molecular symmetry axis and 1 is the
unit second rank tensor. The last equality is valid for isotropic fluids.The degree of orientational ordering in a liquid is given by the order parameter, S, which is the
largest eigenvalue of the symmetric traceless order tensor Q. In the case of uniaxial molecules, Q isgiven by
Q,
32C
1N
N+i/1
uLiuLi!
131D . (3.4)
When the molecules are perfectly aligned S is unity and when the orientations are random it is zero.A measure of the average orientation is given by the director n. It is the unit eigenvector pertainingto the largest eigenvalue of Q. In a small system such as a simulation cell, it is sufficient to use oneorder parameter and one director for the whole system. The scalar order parameter S should not beconfused with the intrinsic angular momentum S, which is a pseudovector.
In order to study shearing systems it is convenient to apply the SLLOD equations of motion.Regardless of the nature of the fluid, atomic or molecular, these equations provide an exactdescription of steady planar Couette flow arbitrarily far from equilibrium [8]. If the velocitygradient is given by eu"ce
zex, i.e. a flow in the x-direction varying linearly in the z-direction, then
the thermostatted SLLOD equations for rigid molecules are
rRi"( p
i/m)#e
xcz
i, (3.5a)
pRi"F
i!e
xcp
zi!ap
i, (3.5b)
I1·xR
1i"x
1i]I
1·x
1i#C
1i. (3.5c)
In the case of uniaxial molecules, Eq. (3.5c) simplifies to
IxRi"C
i. (3.5d)
There are a number of different ways of formulating the relation between duLi/dt and the x
pi’s,
which has been omitted. One possibility is to express it in terms of quarternions [14].The coordinate r
iis the laboratory position of the centre of mass of molecule i, c"u
x/z, the
velocity gradient, x1i
is the angular velocity in the principal coordinate frame of moleculei (indicated by subscript p), F
iand C
1iare the force and principal torque about the centre of mass of
molecule i due to interactions with the other molecules and I1
is the principal inertia tensor, andeach molecules is assumed to have mass m.
10 S.S. Sarman et al. / Physics Reports 305 (1998) 1—92

The square of the curvature for a system of rigid molecules can be separated into an orientationalpart Cu and a translational part C
r, i.e. C"Cu#C
rwhere C
ris given by Eq. (2.10) and
Cu,12
N+i/1
(I1· xR
1i!x
1i]I
1·x
1i!C
1i) · I~1
1· I
1· xR
1i!x
1i]I
1· x
1i!C
1i) . (3.6)
The orientational part of the thermostatted equations of motion is obtained by minimisingCu with respect to the x
1i’s. If no constraint torques are applied one recovers the Euler equations.
If the Reynolds number is low, the streaming velocity at the centre of mass of molecule i is excz
iwhich means that p
i/m is the peculiar velocity of the centre of mass. This velocity can be regarded as
the thermal motion of the molecules. The simplest way of devising a thermostat for a shearing rigidbody fluid is to make the peculiar translational energy a constant of motion. This constraint onlyaffects the translational equations of motion and it gives the following expression for the thermo-statting multiplier a:
a"N+i/1
[Fi· p
i!cp
xipzi]N
N+i/1
p2i
. (3.7)
This thermostat does not exert any torques on the molecules. Consequently, the thermostat doesnot interfere with shear alignment phenomena or the streaming angular velocity. It is possible todevise other thermostats that involve the rotational kinetic energy too. However, in this case it isvery important to prevent the thermostat from exerting systematic torques on the molecules[15,16].
The adiabatic rate of change of the internal energy when these equations are applied is
HQ !$0"
N+i/1C
pi· pR
im
!Fi· rR
i#xR
1i· I
1·x
1i!C
1i·x
1iD"!cP
zx»"!c[P_ 4
zx#P!
zx]»"!c[P_ 4
zx#pa
y]» , (3.8)
where Pzx
is the zx element of the molecular pressure tensor, P_ 4zx,(1
2)(P
zx#P
xz),
P!zx,(1
2)(P
zx!P
xz), p!
yis the pseudo-vector dual of P!
zx. In an atomic fluid the pressure tensor is
symmetric. The antisymmetric part is identically zero. In a molecular fluid this is not the case. Thepressure tensor can be obtained from the Irving—Kirkwood expression [17]
P»"
N+i/1C
pipi
m#r
iF
iD"N+i/1
pipi
m!
N~1+i/1
N+
j/i`1
rijF
ij, (3.9)
where rij"r
j!r
i. Note that a planar Couette strain field actually constitutes two thermodynamic
forces: one symmetric traceless strain rate and one antisymmetric strain rate. The above expressionfor HQ !$
0can be inserted into the linear response formula (2.9). Some prudence is appropriate here.
There are several different versions of the SLLOD equation for molecular fluids. For example,there are atomic SLLOD equations and molecular SLLOD equations. Their transient responsesare somewhat different. However, the long time limit of the linear response formula (2.9) is thesame. The proof of this is based on the fact that at low Reynolds number shearing steady states withthe same temperature, volume and c are unique [18].
S.S. Sarman et al. / Physics Reports 305 (1998) 1—92 11

3.1.1. Relaxation of the intrinsic angular momentumIn order to derive linear phenomenological relations between the pressure tensor and the strain
rate we start with entropy production per unit volume, p, caused by viscous flow [13].
p"!
1¹GP_ 4 : (es u)4#P! · (e]u!2x)#C
13Tr(P)!P
%2De · uH , (3.10)
where P is the molecular pressure tensor and u is the streaming velocity of the fluid. The symmetrictraceless part and the pseudo-vector dual of the pressure tensor are denoted byP_ 4,1
2(P#PT)!1
3Tr(P)1 and P!,!1
2e : P. The entropy production makes it possible to identify
three pairs of thermodynamic forces and fluxes, P_ 4 and (es u)4, P! and e]u!2x and finally13Tr(P)!P
%2and e · u. In an isotropic fluid only couplings between tensors of the same rank and
parity are allowed. This gives the following relations between the forces and fluxes:
SP_ 4T"!2g(es u)4 , (3.11)
SP!T"!g3(e]u!2x) , (3.12)
and
13Tr(SPT)!P
%2"!g
Ve ) u . (3.13)
The transport coefficient g is the shear viscosity, g3is the vortex viscosity or rotational viscosity and
gV
is the bulk viscosity or the volume viscosity. The Green—Kubo relations are well known for theshear viscosity and the bulk viscosity [11],
g"»
10kB¹P
=
0
dtSP_ 4(t) : P_ 4(0)T%2
(3.14)
and
gV"
»
9kB¹P
=
0
dtS[TrMP(t)N!3P%2
][TrMP (0)N!3P%2
]T%2
. (3.15)
These two fluctuation relations might lead one to suggest that the vortex viscosity is given by thetime integral of the correlation function of the antisymmetric pressure tensor. However, it issomewhat more complicated than this. The antisymmetric pressure tensor is equal to the timederivative of the intrinsic angular momentum provided no external torques are applied and if oneneglects the couple tensor and the flow of intrinsic angular momentum [19],
!2P!(t)»"NSQ (t)"NH ·xR "N+i/1
IxRi. (3.16)
The first and second equalities are valid for any molecule whereas the last equality only applies torigid uniaxial molecules. Since we have SSQ T"0 in steady state, we must also have SP!T "0 ina steady state. When Eq. (3.16) is combined with the phenomenological relation, Eq. (3.12), we
12 S.S. Sarman et al. / Physics Reports 305 (1998) 1—92

obtain
xR "2g
3n
H~1 · (e]u!2x) , (3.17)
where n is the number density. One should be careful not to confuse the scalar number density withthe director n. The solution to this equation with the initial condition x"0 is
x(t)"12C1!expA!
4g3t
nH~1BD ·e]u . (3.18)
In the long time limit x is equal to 12e]u, i.e. half the vorticity. The vorticity can be regarded as the
angular velocity of the fluid. The physical significance of the above equation is that x will attain thesame value as the angular velocity of the background fluid. The antisymmetric pressure tensor willbe zero in the steady state if no external torques act on the system. We can see that the relaxationtime of x is inversely proportional to the vortex viscosity. The relaxation time only depends on thethermodynamic state point. It is an example of a fast transport process. In order to explain thedifference between fast and slow transport processes we can study the relaxation of a velocitygradient. This can be seen if we combine the phenomenological relation (3.11) with a condition formomentum conservation,
o(du/dt)"!e · P , (3.19)
where u is the streaming velocity of the fluid o is the mass density and d/dt denotes the streamingderivative. In a planar Couette flow geometry, u
x"cz we get
odu
x(z, t)dt
"ou
x(z, t)t
"g2u
x(z, t)
z2, (3.20)
a Fourier transformation with respect to z gives
odu
x(k
z, t)
dt"o
ux(k
z, t)
t"!gk2
zux(k
z, t) , (3.21)
where
ux(k
z, t),P
=
~=
dz exp(ikzz)u
x(z, t) , (3.22)
and kzis the z-component of the wave vector. From Eq. (3.21) we can see that the relaxation time is
inversely proportional to k2z. When the wave vector goes to zero the relaxation time goes to infinity.
Thus, the relaxation of a velocity gradient is an infinitely slow transport process contrary to therelaxation of the intrinsic angular momentum where the relaxation time is constant. Fast transportprocesses are discussed in detail Refs. [11,20]. The Green—Kubo relation for the vortex viscosity ofa fluid consisting of uniaxial molecules is [21]
g3"
kB¹
4»:=0dtSua(t)ua(0)T
%2
, a"x, y or z . (3.23)
S.S. Sarman et al. / Physics Reports 305 (1998) 1—92 13

It is unusual in that the time correlation function appears in the denominator, whereas it isgenerally found in the numerator. Note that the integral of the time correlation function of theantisymmetric pressure tensor is identically zero, i.e.,
P=
0
dtSP!(t) · P!(0)T%2"0 . (3.24)
This is easy to prove by utilising Eq. (3.16) to replace P! by SQ .It is possible to devise a NEMD algorithm for g
3[22]. One adds a constant torque of magnitude
m to the equation for the angular acceleration,
IxRi"C
i#n"C
i#mea , (3.25)
where a"x, y or z and ea is the unit pseudo vector in the a-direction. This means that the balanceEq. (3.16) becomes
23Nmea!2P!(t)»"NSQ (t) . (3.26)
The factor of 23
arises because a uniaxial molecule has only two rotational degrees of freedom. Westill must have SSQ T"0 in a steady state so 3SP!T»"Nmea. If the rest of the equations of motionare free from external dissipative fields, it is easy to see that the adiabatic rate of change of theinternal energy is
HQ !$0"mea ·
N+i/1
xi"mea ·
NSI
"
Nm(H ·x)aI
"
2Nmua3
. (3.27)
According to linear response theory, the correlation function in Eq. (2.9) is given by
limm?0
limt?=
Sua(t)Tm
"
2N3k
B¹P
=
0
dtSua(t)ua(0)T%2"
n6g
3
. (3.28)
One can thus calculate the vortex viscosity by performing NEMD simulations at a few differentvalues of m and extrapolating to zero m.
There is a slightly different way of implementing this NEMD algorithm. We can apply Gauss’principle of least constraint to make S a constant a motion. We write this constraint as a function ofthe angular accelerations,
NSQ aI
"
N+i/1
uRia"
2N3
uR a"0 . (3.29)
Since the constraint only depends on the uR a’s it is sufficient to minimise Cu. In the special case ofuniaxial molecules the minimisation condition becomes
xR
iCCu!m
NSQ aI D"
xR
iC12
N+j/1
IAxR j!C
jI B
2!m
NSQ aI D"0 , (3.30)
14 S.S. Sarman et al. / Physics Reports 305 (1998) 1—92

which gives
IxRi"C
i#mea . (3.31)
Inserting this equation in the constraint equation (3.29) gives
m"!
1N
N+i/1
Cia . (3.32)
When Sa is constrained to be zero, no work is done on the system by the constraint torques. Thismeans that the system remains in equilibrium. However, a new equilibrium ensemble where ma isfluctuating is generated. Inserting HQ !$
0from Eq. (3.27) into the linear response formula (2.9) gives
limm?0
limt?=
Sm(t)Tua
"
2N3 P
=
0
dt Sm(t)m(0)T%2, S
"
6g3
n, (3.33)
where the subscript ‘eq, S’ denotes an equilibrium ensemble where Sa is zero.This constraint SQ a"0 has a few interesting consequences. Since SQ is constrained to be zero, it
follows from Eq. (3.26) that
n"3P !/n (3.34)
at all times. Substituting this into the fluctuation relation (3.33) gives
g3"
paa2ua
"
»
kB¹P
=
0
dt Sp!a(t)p!a(0)T%2, S
. (3.35)
This expression looks similar to conventional Green—Kubo relations. The reason why the vortexviscosity has a conventional Green—Kubo relation in this ensemble whereas it is a rational functionof the time correlation function integral in the conventional canonical ensemble can be understoodif we study the linear phenomenological relation for the vortex viscosity (3.12). In the constantSQ ensemble the thermodynamic flux n, which is equal to P !, is fluctuating whereas the thermodyn-amic force which is proportional to x is a constant external parameter. In the conventionalcanonical ensemble the torque density n is constant whereas the thermodynamic force is fluctuat-ing. One consequently obtains simple equilibrium fluctuation relations if the thermodynamic forceis a given external parameter and the flux is a fluctuating phase function.
This example illustrates the utility of switching between different nonequilibrium ensembles, inwhich either the thermodynamic force or the flux is the independent variable. We address this issuein more detail in Section 7.2 below.
3.1.2. Shear-induced alignment and shear-induced rotationShear-induced alignment in planar Couette flow was first predicted theoretically and observed
experimentally by Maxwell in 1873 by using continuum models for liquids [23]. He proved that theaverage alignment angle was 45° relative to the stream lines. This can also be proved for morerealistic models by applying linear response theory. The response of the order tensor of an isotropic
S.S. Sarman et al. / Physics Reports 305 (1998) 1—92 15

fluid in a Couette strain field is
limt?=
SQkl(t)T"!b»P=
0
dsSQkl(s)P_ 4zx(0)T%2
c!b»P=
0
dsSQkl(s)p!y(0)T
%2c . (3.36)
In an isotropic fluid, Curie’s principle is valid, so the only elements of the order tensor that cancouple with the P_ 4
zxelement is Q
zx. The second term is zero because a pseudovector cannot couple
with a symmetric traceless second-rank tensor. We consequently have
Qxz"Q
zx"s4c , (3.37)
where
s4"!b»P=
0
dsSQzx
(s)P_ 4zx
(0)T%2
. (3.38)
The eigenvalues of the order tensor are then s4c, 0,!s4c with the eigenvectors (1,0,1),(0,1,0) and(!1,0,1). The first eigenvector is the director because it is associated with the largest eigenvalue.Since the stream lines are parallel to the x-direction, the alignment angle is 45°.
We can find the value of x in planar Couette flow by applying linear response theory,
limt?=
Suy(t)T"!b»P
=
0
dsSuy(s)P_ 4
zx(0)T
%2c!b»P
=
0
dsSuy(s)p!
y(0)T
%2c"
c2
. (3.39)
In an isotropic fluid the first integral is zero because the pseudovector x cannot couple with thesymmetric traceless strain rate. The second integral can be evaluated analytically. The details aregiven in Ref. [24]. Since we have +u"ce
zex
and +]u"cey
this equation implies the intuitiveresult that x is equal to half the vorticity or the angular velocity of the background fluid.
There are some interesting implications of Eq. (3.37). In the linear regime, the order parameter isproportional to the strain rate. This means that if the strain rate is high enough the symmetry of thesystem is broken. Then Q can cross-couple with the antisymmetric strain rate and x cancross-couple with the symmetric traceless strain rate. The alignment angle will no longer be equalto 45° and is usually less than 45°. The absolute magnitude of u
ywill be less than c/2. In molecular
dynamics one always simulates small systems. In order to prevail over the thermal fluctuations onehas to apply relatively large strain rates. Therefore, one almost always breaks the symmetry and itis very hard to observe the linear regime values of the alignment angle and the angular velocity[22,25].
3.2. Thermal conductivity of rigid molecular fluids
The original Evans heat flow algorithm for atomic fluids [8] can be generalised to fluidsconsisting of rigid molecules [26]. In this case the heat flux vector is
»JQ"
12
N+i/1
pi
mAp2i
m#x
1i· I
1· x
1i#
N+j/1
/ijB!
12
N+i/1
N+j/1
rijA
pi
m· F
ij#x
1i· C
1ijB , (3.40)
16 S.S. Sarman et al. / Physics Reports 305 (1998) 1—92

where /ij, F
ijand C
1iare the energy, force and principal torque of molecule i due to interaction with
molecule j. The vector rij"r
j!r
iis the distance vector from molecule i to molecule j. A set of
synthetic equations of motion that drive this heat flux vector is
rRi"
pi
m, (3.41a)
pRi"F
i#ASi
!
1N
N+j/1
SjB · F
Q!ap
i, (3.41b)
Si"
12A
p2i
m#x
1i· I
1·x
1i#
N+j/1
UijB1!
12
N+j/1
Fijrij
, (3.41c)
I1·xR
1i"x
1i]I
1·x
1i#C
1i!
12
N+i/1
C1ij
rij· F
Q, (3.41d)
where FQ
is an external fictitious field that drives the heat current JQ. It is straightforward to show
that these equations conserve the linear momentum and that the phase-space compression factor iszero. The thermal conductivity simply becomes
j" limF
Q?0
limt?=
SJQ(t)T ·FK
Q¹F
Q,
(3.42)
where FKQ
is the unit vector in the direction of FQ
and FQ
is the magnitude of FQ. In order to
reach a steady state a thermostat must be applied. In the isokinetic case, a becomes
a"+N
i/1pi· (F
i#S
i·F
Q)
+Ni/1
p2i
. (3.43)
This algorithm has successfully been applied to calculate the thermal conductivity of variousmodels for hydrochloric acid [26,27], carbon dioxide [28] and mixtures of methane and benzene[29]. The general conclusion of these calculations is that these model systems yield thermalconductivities in very good agreement with experimental measurements. The deviations are atworst 20% but mostly they are less than 5%. A major result from all these calculations is that thereis a substantial contribution to the thermal conductivity from x
1i· I
1·x
1i, the rotational part of the
heat flux vector. Therefore, it is not possible to use single-site Lennard—Jones potentials to model,for example, benzene or cabon dioxide, if one wishes to predict values of k accurately.
Another phenomenon that can be studied is heat-induced polarisation [30,31]. If a dipolar fluidis subject to a temperature gradient, the dipoles will orient relative to the gradient. Because boththe polarization and the temperature gradient are polar vectors it is possible to have a linearrelationship between them. This has been confirmed in simulations of model systems for hydro-chloric acid.
The reverse of heat-induced polarization, i.e. an electric field interacting with a heat flow, alsooccurs. An electric field cannot drive a heat current but it can modify the thermal conductivity. Theelectric field can do this in two ways, the Hamiltonian of the system is different, so the phase space
S.S. Sarman et al. / Physics Reports 305 (1998) 1—92 17

density must be different. Secondly, the electric field appears in the equations of motion, so theLiouville operator is different. Simulations have shown that very high electric fields are required toaffect the thermal conductivity. However, if the electric field is very strong the thermal conductivitymay increase by up to 50% [30].
4. Coupled thermal conductivity and mass diffusion in liquid mixtures
In a multicomponent mixture the thermal conductivity becomes more complicated because thereare several ways of defining the heat flux vector. An additional complication is that a temperaturegradient not only drives a heat flux but also mass currents. This is known as the Dufour effect. Tofurther complicate matters, the mass current can also be defined in several different ways. In orderto avoid confusion we will review the necessary nonequilibrium thermodynamics in this section. Inan n-component mixture the thermodynamic forces and fluxes are related in the following way[13]:
SJQT"
n~1+k/1
LQk · Xk#L
QQ· X
Q, (4.1)
SJlT"n~1+
k/1
Lkl · Xk#LlQ · XQ
, (4.2)
where SJlT is the macroscopic mass current of component l, Xl is the thermodynamic forceconjugate to SJlT, SJ
QT is the macroscopic heat current and X
Qis the thermodynamic force driving
the heat flux. The Lkl’s, LlQ’s, LQl’s and L
QQare transport coefficients. In the general case they are
second-rank tensors with nine independent components. In an isotropic fluid there is only oneindependent component, since all of the off-diagonal components are zero and the three diagonalcomponents are equal. The cross-coupling coefficients LlQ and L
Ql are the Soret and the Dufourcoefficient, respectively. According to the Onsager reciprocity relations, Lkl"Llk and LlQ"L
Ql.The mass currents are defined as
SJlT"ol(�l!�) , (4.3)
where ol is the mass density of component l, �l is the centre of mass velocity of species l, and � is thecentre of mass velocity of the whole system. Because of momentum conservation there are onlyn!1 independent mass currents in an n-component system. The thermodynamic forces are
XQ"!(1/¹2)e¹ (4.4)
and
Xl"!
e(kl!kn)
¹
, (4.5)
where kl is the chemical potential of component l. Note that Xn
is zero, reflecting the fact thatonly n!1 of the mass currents are independent. The Irving—Kirkwood [17] definition of the
18 S.S. Sarman et al. / Physics Reports 305 (1998) 1—92

macroscopic heat current is
SJQT"SJ
eT![oSeTS�T!SP T · S�T] , (4.6)
where o is the mass density of the fluid and SeT is the internal energy density. The current SJeT
satisfies the energy continuity equation
oSeTt
"!e ·SJeT . (4.7)
The entropy production, p, is
p"SJQT · X
Q#
n~1+l/1
SJlT · Xl#SJnT ·
n~1+l/1
Xl . (4.8)
In order to write down a microscopic expression for the heat flux vector we consider ann-component system with Nl molecules of component l. The total number of molecules in thesystem is N"RNl. The position and momenta of molecule i of species l are denoted by rl
iand pl
i,
respectively. The distance between the centers of mass of molecule i of species l and molecule j ofspecies k is rlk
ij"rk
j!rl
i. The pair interaction energy between these two molecules is Ukl
ijand the
force on molecule i due to interaction with molecule j is Fklij
. With these definitions we can writedown the microscopic Irving—Kirkwood heat flux vector,
»JQ"
12
n+l/1
Nl+i/1C
pli
ml!�D ·GCmlA
pli
ml!�B
2#
n+k/1
Nk+j/1
Uklij D1!
n+b/1
Nb+j/1
rklij
Fklij H , (4.9)
where ml is the mass of molecules of species l and 1 is the unit second-rank tensor. The microscopicform of the mass current is simply
»Jl"Nlml(�l!�) , (4.10)
where
�l"1
Nlml
Nl+i/1
pli. (4.11)
Given these microscopic expressions for the heat currents and the mass currents, it is possible towrite down the Green—Kubo expressions for the above-mentioned transport coefficients [11,32],
Lkl1"»
kBP
=
0
dtSJk(t)Jl(0)T , (4.12a)
LlQ1"»
kBP
=
0
dtSJl(t)JQ(0)T , (4.12b)
LQl1"
»
kBP
=
0
dtSJQ(t)Jl(0)T (4.12c)
S.S. Sarman et al. / Physics Reports 305 (1998) 1—92 19

and
LQQ
1"»
kBP
=
0
dtSJQ(t)J
Q(0)T . (4.12d)
These Green—Kubo expressions can be calculated by applying conventional EMD simulations. It isalso possible to derive NEMD algorithms. As mentioned in Section 2, one usually requires that thesynthetic equations of motion should conserve momentum, that they should satisfy AIC and thatthey should drive a thermodynamic current that is equal to one of the currents in a Green—Kuborelation. In most cases it is possible to find equations of motion that satisfy these conditions.However, in this case it is not possible to fulfill the two last conditions. In order to solve thisproblem, we have to use a somewhat different version of linear response theory. To start with, weemploy the following set of equations of motion [33]:
qR li"pl
i/ml , (4.13a)
pR li"F
i#CSl
i!
1N
S#
chlN
S!kB¹
,*/chl1D · F
Q!a( pl
i!pN l) , (4.13b)
where
Sli,
12CmlA
pli
ml!�B
2#
n+k/1
Nk+j/1
Uklij D1!
12
n+
k/1
Nk+j/1
rklij
Fklij
, (4.14)
S,
n+l/1
Nl+i/1
Sli. (4.15)
and
pN l,1Nl
Nl+i/1
pli. (4.16)
The parameters chl are colour charges. They are determined by requiring momentum conservation
which gives,
n+l/1
Nlchl"0 (4.17)
and the imposed conditions,
1ml
!
1m
n
"
chl
ml!
chn
mn
, l"1, 2,2, n!1 . (4.18)
Solving for chl gives
chl"
M!NmlM
, ∀l , (4.19)
20 S.S. Sarman et al. / Physics Reports 305 (1998) 1—92

where
M,
n+k/1
Nkmk (4.20)
is the total mass of the system and N is the total number of molecules. Thus, Eq. (4.18) does notmean that component n is singled out. If the molecular masses of all the components are the same,all the c
hl’s are identically zero. The thermostatting multiplier, a, is determined by making thekinetic energy a constant of motion,
EQ,*/
"
ddt
n+l/1
12ml
Nl+i/1
( pli!pN l)2"0 . (4.21)
When the kinetic energy is calculated, the mean mass current of the component in question, pN l, isdeducted in order to prevent the thermostat from affecting these currents. Application of Gauss’principle gives the following expression for a:
a"+n
l/1
1ml
+Nli/1
[pli!pN l] ·CF
i#ASl
i!
1N
S#
chlN
S!kB¹
,*/chl1B · F
QD+n
l/1
1ml
+Nli/1
(pli!pN l)2
. (4.22)
Note that the term kB¹
,*/, in the equations of motion, Eq. (4.13), is defined from the relation
32Nk
B¹
,*/"E
,*/. It is thus a phase function. These equations of motion do not satisfy AIC. Instead
the adiabatic phase-space compression factor is
K!$"n~1+l/1A
1ml
!
1m
nBJl · F
Q. (4.23)
The rate of change of the internal energy is
HQ !$0"»CJ
Q#k
B¹
,*/
n~1+l/1A
1ml
!
1m
nBJlD · F
Q. (4.24)
The conditions usually assumed necessary for linear response theory to work are thus not fulfilled.However, Evans and MacGowan have derived a more general form of the linear response formula(2.9) [34—36].
limt?=
SB(t)T"SB(0)T%2#bP
=
0
dtSB(t)[HQ !$0
(0)!kB¹K(0)]T . (4.25)
We can consequently evaluate the time-correlation function integral in the Green—Kubo integralfor the thermal conductivity by NEMD methods, provided
HQ !$0!k
B¹K"»J
Q· F
Q. (4.26)
S.S. Sarman et al. / Physics Reports 305 (1998) 1—92 21

Inspection of the expression for HQ !$0
and K!$, Eqs. (4.23) and (4.24), shows that this condition isfulfilled. We obtain the following expressions for the thermal conductivity and the Dufourcoefficients:
LQQ
" limF
Q?0
limt?=
¹SJQ(t)T · FK
QF
Q
(4.27)
and
LlQ" limF
Q?0
limt?=
¹SJl(t)T · FKQ
FQ
∀l , (4.28)
where FKQ
is a unit vector in the direction of the heat field andFQ
is the magnitude of the heat field.A concentration gradient not only drives mass currents but also a heat current. The cross-
coupling coefficient relating them is called the Soret coefficient. It can also be evaluated by NEMDmethods. The appropriate method to apply is the colour conductivity algorithm,
rR li"pl
i/ml (4.29a)
and
pR li"F
i#clF#
!a( pli!pN l) (4.29b)
where F#is the colour field and cl is the colour charge. In order to conserve momentum they must
satisfy the colour neutrality condition, RNlcl"0. This can be done in several different ways.A convenient choice is to set c
1"!N/N
1and
cl"!
Nml+nk/2
Nkmk24l4n . (4.30)
The expression for a is obtained in the same way as above, i.e. the mass current is deducted from themomenta when the kinetic energy is calculated,
a"+nl/1
1ml
+Nli/1
[pli!pN l] · F
i
+nl/1
1ml
+Nli/1
(pli!pN l)2
. (4.31)
These equations satisfy AIC. The rate of change of the internal energy is
HQ !$0"
n+l/1
Nl+i/1
clpli
ml· F
#"
n+l/1
clNlpN miml
· F#
"
n+l/1
clJlml
· F#"
NN
1
J1· F
#m
1
!N+nl/2
Jl · F#
+nl/2Nlml
"AN
N1m
1
#N/n+l/2
NlmlBJ1· F
#.
(4.32)
22 S.S. Sarman et al. / Physics Reports 305 (1998) 1—92

This gives the following linear response expressions:
Ll1" limF
#?0
limt?=
¹SJl(t)T · FK#
AN
N1m
1
#N/+nk/2NkmkBF#
∀l (4.33a)
and
LQ1
" limF
#?0
limt?=
¹SJQ(t)T · FK
#
AN
N1m
1
#N/+nl/2NlmlBF#
, (4.33b)
where FK#is a unit vector in the direction of the colour field and F
#is the magnitude of the colour
field. These two linear response expressions makes it possible to evaluate the time-correlation partof the mutual diffusion coefficient and the Soret coefficient.
The heat flow algorithm (4.13) has been successfully applied to calculate the thermal conductivityand Dufour coefficients of equimolar binary Lennard—Jones mixtures [37—39]. The potentialparameters were adjusted to model an argon—krypton mixture. Two state points were studied, onenear the triple point and one high-temperature low-density supercritical state point. The resultswere cross-checked by using the colour conductivity algorithm to obtain the Soret coefficient.A further cross check was provided by evaluating the Green—Kubo relations for the varioustransport coefficients by EMD-simulations. In Fig. 1 we depict the heat and mass current autocor-relation function at the triple point. As one can see, the heat—current autocorrelation function isvery similar to the same function of a triple point one component Lennard—Jones fluid. The masscurrent autocorrelation function is very similar to the velocity autocorrelation function of a onecomponent dense Lennard—Jones fluid. There is a negative ‘rebound region’ immediately followingthe initial decay. This means that the mutual diffusion coefficient is very small in this dense mixture.In Fig. 2 we show cross-correlation function between the heat current and the mass current. Theyconsist of two regions that almost cancel each other, so the resulting time integral is very small.This explains why it is difficult to calculate these quantities at high densities. However, the timeintegrals of the cross-correlation functions agree reasonably well with the NEMD estimates of thecross-coupling coefficients. The heat flow algorithm and the colour conductivity algorithm giveconsistent results for the cross-coupling coefficients as they should according to the Onsagerreciprocity relations. The relative errors of the various estimates is about 15%. At the low-densityhigh-temperature state point the heat—current autocorrelation function decays monotonically. Asone can see in Fig. 3, it seems to have two different decay times, one for the initial decay and onelonger decay time for the tail. The mass current correlation function also decays monotonically atthis state point. This means that there are no cancellation problems when their time integrals arecalculated. It is consequently quite large, which in turn yields a large mutual diffusion coefficient.Finally, in Fig. 4 we depict the cross correlation function. It also decays monotonically with two,or even three, distinct decay times. The monotonic decay facilitates the evaluation of the crosscoupling coefficient. The statistical error when it was evaluated in this case was about 5% eventhough the run times were comparable to those used to obtain the transport coefficients at thetriple point.
S.S. Sarman et al. / Physics Reports 305 (1998) 1—92 23

Fig. 1. The heat current autocorrelation function, CQQ
(t),13»SJ
Q(t) ) J
Q(0)T
%2(full curve) and the mass current autocor-
relation function C11
(t),13»SJ
1(t) ) J
1(0)T
%2(dashed curve) as functions of time at the triple point. The function have been
normalised by the initial value. We actually display CQQ
(t)/CQQ
(0) and C11
(t)/C11
(0).
Fig. 2. The cross-correlation functions of the triple point mixture, C1Q
(t),13(»/k
B)SJ
1(t) ) J
Q(0)T
%2(full curve) and
CQ1
(t),13(»/k
B)SJ
Q(t) ) J
1(0)T
%2(dotted curve) as functions of time.
Fig. 3. The heat current autocorrelation function, (»/kB)C
QQ(t), as a function of time at the low-density high-temperature
state point.
Fig. 4. The cross-correlation functions, (»/kB)C
1Q(t), (full curve) and (»/k
B)C
Q1(t), (dotted curve) as functions of time at
the low-density high-temperature state point.
4.1. Heat flow algorithms for large systems
The heat flow algorithms discussed in the previous sections work very well for small systems, i.e.systems with a few hundred molecules. When the system size increases the fluid becomes unstablewhen the heat field, F
Q, exceeds some size-dependent limiting value. The heat is transported
through the system by solitary shock waves instead of being conducted uniformly [40]. The shockwaves travel at supersonic speeds. The critical heat field decreases as the system size increases.
24 S.S. Sarman et al. / Physics Reports 305 (1998) 1—92

Because the thermal conductivity is calculated by extrapolation to zero field, this makes it difficultto evaluate the thermal conductivity for large systems.
That shock waves occur can be understood if we examine the equations of motion for the heatflow algorithm,
pRi"F
i#p
i· C(Ei
!EM )1!12
N+j/1
rijFij#
12N
N+k/1
N+j/1
rkj
FkjD · F
Q!ap
i, (4.34)
where
Ei"
p2i
2m#
12
N+j/1
Uij
, (4.35)
the energy of molecule i and
EM "1N
N+i/1
Ei, (4.36)
the average energy per molecule. The most important term in this equation is the Ei!EM term. This
is the difference between the energy of molecule i and the average energy. This term is a positivefeedback. If a molecule acquires more energy than the average energy it is accelerated in thedirection of the heat field. If the molecules in a whole region acquire more than average energy thisregion is accelerated. In a dense fluid the fast molecules will soon collide with a neighbouringmolecule and lose their energy. Thus, the molecules do not travel in waves but the energy does.When an isokinetic thermostat is applied the fast molecules will soon absorb the whole kineticenergy of the system. Thus, the only molecules moving will be the ones in the fast region.
Since shock waves do not arise in small systems, one way of reducing them is to divide the largesystem into smaller bins, containing a few hundred molecules each. The average energy permolecule, EM , that appears in the equations of motion will then be taken over the molecules in thebin. We obtain
pRi"F
iC(Ei!EM
r)1!
12
Nr
+j/1
rij
Fij#
12N
r
Nr
+k/1
Nr
+j/1
rkj
FkjD · F
Q!a
r(p
i!pN
r) . (4.37)
The index r refers to bin r, which is located between xr$Dx, y
r$Dy and z
r$Dz. The number of
molecules and average energy per molecule in the bin are Nrand EM
r. The sums are over molecules in
the bin. Each bin has its own thermostatting multiplier, ar. The bins have different streaming
velocities. That is why we deduct the average momentum per molecule, pNr, from the momentum in
the thermostat term. It can easily be calculated,
pNr"
1N
r
Nr
+i/1
pi. (4.38)
The expression for arbecomes
ar"
+Nr
i/1( p
i!pN
r) · CF
i#G(Ei
!EMr)1!
12+Nr
j/1rij
Fij#
12N
r
+Nr
k/1+Nr
j/1rkj
FkjH · F
QD+Nr
i/1( p
i!pN
r)2
. (4.39)
S.S. Sarman et al. / Physics Reports 305 (1998) 1—92 25

This algorithm has been tested by calculating the thermal conductivity of two-dimensional softdiscs. In a 3000-molecule system the conventional Evans heat flow algorithm generates shockwaves even at very low heat fields. The algorithm (4.37) removes the shock waves and yields valuesfor the thermal conductivity that agree fairly well with the thermal conductivity of smaller systemswhere the conventional heat flow algorithm does not generate shock waves [41].
5. Transport coefficients in shearing fluids
5.1. The self-diffusion coefficient
When a fluid is subject to very strong dissipative fields, the structure and the symmetry of thefluid change. The fluid will no longer be isotropic. This means that transport coefficients change.A particularly important case of fluids subject to strong fields are fluids subject to planar Couetteflow. If the stream lines are parallel to the x-direction and there is a velocity gradient in thez-direction, the only symmetry operation that can be performed is a 180° rotation around they-axis. This means that transport coefficients that are second rank tensors no longer are isotropic.Instead, all the diagonal elements are different and the xz and zx elements are nonzero anddifferent. For example, the self-diffusion coefficient becomes,
D"AD
xx0 D
xz0 D
yy0
Dzx
0 Dzz
B . (5.1)
Other transport coefficient tensors with the same rank and parity as the self-diffusion tensor (SDT)are the mutual diffusion coefficient and the thermal conductivity. It is not trivial to generaliseGreen—Kubo relations and NEMD algorithms to shearing steady states. We begin with theself-diffusion coefficient because it is the easiest one to generalise. It can be obtained by threedifferent methods: mean square displacement, Green—Kubo methods and NEMD. The firstmentioned method is based on the convective diffusion equation
ct
#czcx
"+ )D )+c"Dxx
2cx2
#Dyy
2cy2
#(Dxz#D
zx)2cxz
#Dzz
2cz2
, (5.2)
where c is the concentration of tracer molecules at the point (x, y, z) at time t and c"ux/z, u
xbeing the velocity in the x-direction. It is straightforward but tedious to solve this equation.Fortunately, we are only interested in the mean square displacements for which it is not necessaryto solve it. The different MSDs are [25,42,43]
Sx(t)2Tc"2Dxx
t#ct2(Dxz#D
zx)#2
3c2t3D
zz, (5.3)
Sy(t)2Tc"2Dyy
t , (5.4)
Sz(t)2Tc"2Dzzt (5.5)
26 S.S. Sarman et al. / Physics Reports 305 (1998) 1—92

and
Sx(t)z(t)Tc"(Dxz#D
zx)t#ct2D
zz. (5.6)
These averages are ensemble averages over shearing steady states, hence the subscript c. They areconsequently nonequilibrium ensemble averages. It is interesting to note that the MSD in thex-direction is proportional to t3. The reason for this is that we have coupling between diffusive andconvective motion. The velocity in the x-direction is proportional to the z-coordinate. Thez-coordinate is proportional to t1@2. Thus, the displacement in the x-direction is proportional tot3@2 so the MSD must therefore be proportional to t3. The mean square displacements can beevaluated directly by applying the translational SLLOD equations of motion,
rRi"( p
i/m)#e
xcz
i, (5.7a)
pRi"F
i!e
xcp
zi!ap
i, (5.7b)
where riis the laboratory position of molecule i and e
xis a unit vector in the x-direction and p
iis the
peculiar momentum of molecule i. The expression for the thermostatting multiplier a is obtained byrequiring that the kinetic energy should be a constant of motion,
a"+N
i/1[F
i) p
i!cp
xipzi]
+Ni/1
p2i
. (5.8)
It is also useful to define the unconvected Lagrangian position of a molecule i,
qi(t),r
i(0)#P
t
0
dspi(s)m
. (5.9)
Note that the Lagrangian positions are different from the laboratory coordinates in the x-directiononly. In the y- and z-directions they are the same as the laboratory positions. In Ref. [42] it wasshown that the elements of the diffusion tensor could be related to MSDs of the Lagrangianpositions,
limt?=
Sqix(t)2Tc"2D
xxt, ∀i"1,N , (5.10)
limt?=
Syi(t)2Tc"2D
yyt, ∀i"1,N , (5.11)
limt?=
Szi(t)2Tc"2D
zzt, ∀i"1,N (5.12)
and
limt?=
Sqix(t)z
i(t)Tc"(D
xz#D
zx)t, ∀i"1,N . (5.13)
S.S. Sarman et al. / Physics Reports 305 (1998) 1—92 27

Note that it is only possible to obtain the sum of the off-diagonal elements from the MSD. This canbe understood if we write the diffusion tensor as a sum of a symmetric and an antisymmetric tensorand substitute it into the convective diffusion equation
(c/t)#cz c/x"e · D ·ec"e · (D!#D4) ·ec
"e · D4 ·ec#12e · e : D!]ec"e · D4 ·ec (5.14)
The antisymmetric part of the diffusion coefficient vanishes. Therefore it is not possible to obtaininformation about D! from methods based on the diffusion equations. By rewriting the MSD’s forthe diagonal elements of D, one can obtain fluctuation relations in terms of the peculiar momenta,
Dab"1m2P
=
0
dtSpia(t)pib(0)Tc"P
=
0
dtSqRia(t)qR ib(0)Tc, ∀i"1,N . (5.15)
These expressions can also be obtained by applying the formalism used to derive ordinaryequilibrium Green—Kubo relations [44]. This method gives expressions both for the diagonal andthe off-diagonal elements of D.
Since the colour conductivity algorithm has been so successful for equilibrium diffusion coeffi-cients one might think that it would be a simple matter to generalise it to shearing steady states.Unfortunately, this is not possible. The reason for this is rather subtle and it is described in detail inRef. [45].
The self-diffusion coefficient of shearing fluids has been calculated for Lennard—Jones fluids [42]and various models for fluids consisting of rod-like molecules such as carbon disulphide, theRyckaert—Bellemans model of decane [46] and the Gay-Berne fluid [47]. The effect of the shearfield on the diagonal coefficients of the SDT is most pronounced in dense fluids. In a triple pointLennard—Jones fluid the SDT increases significantly with the strain rate. At a reduced strain rate ofunity the xx element of the diffusion tensor is twice the equilibrium value. The reason for this is thatthe strain field destroys the nearest neighbour shell structure around the molecules. This meansthat the molecules are no longer trapped in a cage. As one can see in Fig. 5, the negative reboundregion of the velocity autocorrelation function vanishes. Thus, the time integral of it and therebythe self-diffusion coefficient become much larger. The time correlation function SqR
x(t)zR (0)Tc is
displayed in Fig. 6. Its time integral is virtually zero due to cancellations. Thus the off-diagonalelements of the SDT are negligible in dense fluids.
At low densities, the diagonal elements do not change very much. Even at very high strain ratesthe change is not more than 25%. On the other hand, the off-diagonal elements can be comparableto the diagonal elements at low densities and a reduced strain rates of unity. Then they are alwaysnegative. The reason for this can be understood if we look at their GK-relations,
Dxz"P
=
0
dtSqRx(t)zR (0)Tc . (5.16)
The time zero value of the velocity autocorrelation function is SqRx(0)zR (0)Tc. This quantity is also the
average value of the xz-element of the pressure tensor in the low density limit. It must be negative inorder to make the entropy production positive, thereby obeying the second law of thermo-dynamics. At low densities the correlation functions decay monotonically to zero. The whole
28 S.S. Sarman et al. / Physics Reports 305 (1998) 1—92

Fig. 5. The diagonal velocity autocorrelation functions Zxx
(t)"SqRx(t)qR
x(0)Tc (full curve), Z
yy(t)"Sl
y(t)l
y(0)Tc (dashed
curve) and Zzz(t)"Sl
z(t)l
z(0)Tc (dotted curve), for the triple point Lennard—Jones fluid at a reduced shear rate cq"1.0
Fig. 6. The off-diagonal velocity autocorrelations Zxz
(t)"SqRx(t)l
z(0)Tc (full curve) and Z
zx(t)"Sl
z(t)qR
x(0)Tc (dotted
curve) for the same system as above.
velocity autocorrelation function is consequently negative, so Dxz
and Dzx
must be negative too.Another intuitive way of understanding why SqR
x(0)zR (0)Tc is negative at low densities is to study
a molecule where zR (0) is positive. This means that the molecule has been travelling in the positivez-direction since the last collision at time t"!t
0. As it moves in this direction the streaming
velocity increases in the x-direction, so qRx
decreases. If one assumes that the expectation value ofqRx
is zero after a collision SqRx(0)zR (0)Tc will be negative.
In Fig. 7 we display the mean square displacement of the various elements of the SDT ofa Lennard—Jones fluid at reduced density np3, temperature k
B¹/e and strain rate cq of 0.300, 2.50
and 1.00, respectively. The time unit, q, is defined as p(m/e)1@2. As one can see, the MSD becomeslinear after very short times. We can also use these calculations to verify that the sum of theoff-diagonal component of the MSD-tensor is equal to the sum of the off diagonal elements of theSDT obtained from the fluctuation relation (5.16).
The behaviour of the velocity autocorrelation functions and the SDT of rod-like molecules athigh strain rates is very rich because of the profound effects that the shear field has on the structureof these fluids. In Ref. [25] the behaviour of the SDT for the Tildesley—Madden model ofCS
2[48,49], the Ryckaert—Bellemans model of decane [46] and the Gay—Berne fluid [50] were
compared. They are all rod-like molecules with approximate length to width ratios of 2 : 1, 5 : 1 and3 : 1. A very important effect is shear alignment. In the linear regime at low strain rates the rod-likemolecules align at 45° relative to the stream lines as we have shown in Section 3.1.2. This is not verysignificant because the order parameter is very low. However, as one can see in Fig. 8 the orderparameter increases sharply when the strain rate is increased and it will eventually be as high as0.50—0.80. The strain rate field consequently creates a nonequilibrium liquid crystalline phase. Thealignment angle decreases to about 20°. This means that most of the molecules point in thedirection close to the x-direction thus enhancing D
xx. In decane and the GB-fluid, D
xxincreases by
a factor of 3. In CS2this factor is about 40. The reason for this very large increase is that two factors
are operating here, firstly the shear alignment and secondly the eradication of the nearest
S.S. Sarman et al. / Physics Reports 305 (1998) 1—92 29

Fig. 7. The various components of the means square displacement tensor as a function of the shear rate for a pureLennard—Jones fluid at the low density high temperature state point and a reduced shear rate cq"1.0. From top tobottom, Sq
x(t)2Tc,Sy(t)2Tc, Sz(t)2Tc and Sq
x(t)z(t)Tc as functions of time.
Fig. 8. The order parameter S as a function of the shear rate for the three different systems discussed in this work. Theopen circles, the open squares and the filled circles represent the GB fluid, decane and CS
2, respectively.
Fig. 9. The diagonal elements of the SDT of decane as a function of the shear rate. The open squares, the open circles andthe open diamonds depict D
xx, D
yyand D
zz, respectively.
neighbour shell structure. A state point very close to the triple point was studied, so the cagestructure was very rigid to start with. In Fig. 9 we depict the strain rate dependence of the diagonalelements of the SDT of decane. It is qualitatively the same as that of CS
2. In decane and CS
2the
Dyy
and Dzz
elements also increase with the strain rate whereas they decrease in the GB-fluid. Thiscan be rationalised by noting that the order parameter in the Gay—Berne fluid is much higher thanin the other two fluids. When the molecules diffuse in the y- or x-direction in the strain rate ordered
30 S.S. Sarman et al. / Physics Reports 305 (1998) 1—92

GB-fluid they have to move sideways. This will be very difficult for elongated molecules if they areall lined up in almost the same direction.
The elements Dxz
and Dzx
increase with the strain rate at low to intermediate strain rates. Themechanism behind this can be understood if we look at the off-diagonal velocity correlationfunctions. In Fig. 10 we have depicted SqR
x(t)zR (0)Tc and SzR (t)qR
x(0)Tc for CS
2. (The corresponding
correlation functions of decane and the Gay—Berne fluid are qualitatively similar.) They are verysmall at time zero but almost immediately afterwards, there is a large positive peak whichdominates the time integral of the correlation function. These positive peaks are considerablylarger than the first positive peak of the off-diagonal correlation function of a dense LJ-fluid, cf.Fig. 6. In Fig. 11 we propose a collision sequence that would generate a large peak in SqR
x(t)zR (0)Tc
and SzR (t)qRx(0)Tc at short times: We assume that there is still some space left between the molecules.
A molecule moving in the positive z-direction at time zero will soon collide with another moleculeparallel to itself, i.e. at an angle of 15—30° to the stream lines. The result of this collision is that somevelocity in the z-direction is deflected to the positive x-direction. This would give a positivecontribution to SqR
x(t)zR (0)Tc at short times. In a similar way one can argue that SzR (t)qR
x(0)Tc should
be positive at short times.It is reasonable to ask to what extent the shear-induced rotation affects the diffusion. As we
explained in Section 3.1.1, x cross-couples with the symmetric strain rate when the symmetry of thesystem is broken and it is thereby decreased. We have found that the rotation period usually is anorder of magnitude longer than the decay time of the various velocity autocorrelation functions.Thus it is reasonable to assume that it does not affect the diffusion very much.
One has to be somewhat cautious when one interprets the simulation results of systems far fromequilibrium. We have applied a thermostat that maintains the translational kinetic energy con-stant, whereas the rotational kinetic energy is unconstrained. This is not of much concern becauseup to a reduced strain rate of unity, the equipartition principle is approximately valid. At higher
Fig. 10. Off-diagonal velocity autocorrelation functions of CS2. The full curve denotes Z
xz(t)"SqR
x(t)l
z(0)Tc and the
dashed curve denotes Zzx
(t)"Slz(t)qR
x(0)Tc at a reduced shear rate of 0.090.
Fig. 11. A possible collision sequence that could account for the positive peak of the off-diagonal velocity autocorrela-tion functions at low shear rates. Particle 1 starts at A at time zero. A short while afterwards it collides with particle 2 atB and is deflected towards C.
S.S. Sarman et al. / Physics Reports 305 (1998) 1—92 31

strain rates this principle breaks down and it is very likely that different thermostats would yieldquantitatively or even qualitatively different results. However, the phenomena described in theprevious section take place at reasonably low strain rates, so they are not very likely to be affectedby the particular choice of thermostat.
5.2. The mutual diffusion coefficient
By introducing Lagrangian coordinates one can derive a Green—Kubo relation for the mutualdiffusion coefficient. The constitutive relation for mutual diffusion in a two-component mixture canbe deduced from Eq. (4.1) in Section 4,
SJ1T"L
12· X
12"!L
12·e(k
1!k
2)
¹
"oD12
·ew1
, (5.17)
where w1
is the mass fraction of component 1, D12
is the mutual diffusion coefficient, o is the massdensity and the mass current is the Lagrangian mass current,
J1"
N1
+i/1
p1i
. (5.18)
Far away from equilibrium, neither the chemical potential nor the temperature are defined, so onemight be led to believe that this expression is invalid for strongly shearing systems. However, thegradients of the chemical potential are related to the potential of mean force which can be definedaway from equilibrium. The temperature can be replaced by the kinetic temperature. Applying theformalism used for deriving the equilibrium, Green—Kubo relation for the mutual diffusioncoefficient [11] gives
D12ab(c)"
»2
Nw1w
2m
1m
2
]:=0
dtSJ1a(t)J1b(0)Tc
[1#n1x2(G
11#G
22!2G
12)]
, (5.19)
where (a, b)"x, y, z, n1
is the number density of component 1, w2
and x2
are the mass fraction andmole fraction of component 2. The currents J
1a are the Lagrangian currents of component 1 and
Gkl"Pdr2[g(2)kl (r1, r2)c!1] , (5.20)
where g(2)kl (r1, r2)c is the pair correlation function between components k and l.We have evaluated [45] the time-correlation function part of the mutual diffusion coefficient for
equimolar Lennard—Jones mixtures. The various potential parameters have been adjusted tomodel an argon—krypton mixture. One state point close to the triple point and one high-temperature low-density state point were studied. The behaviour of the mass current autocorrela-tion function is similar to the behaviour of the mass current correlation function of a denseLennard—Jones fluid. At equilibrium there is a negative rebound region at high densities. At highstrain fields this rebound region vanishes, so the diagonal elements of the mass current autocorrela-tion function are enhanced. The off-diagonal elements are negligible at high densities irrespective of
32 S.S. Sarman et al. / Physics Reports 305 (1998) 1—92

the strain rate. At low densities and high temperatures, the diagonal elements are less affected thanat the triple point. The change is less than 20% even at very high strain rates. The off-diagonalelements increase with the strain rate but they do not become as large as the diagonal elements. Wehave not evaluated the thermodynamic factor, so we do not know the exact value of the mutualdiffusion coefficient. However, since an argon—krypton mixture is nearly ideal the thermodynamicfactor is probably quite close to unity.
5.3. Thermal conductivity
In order to derive a Green—Kubo relation for the thermal conductivity of a shearing fluid onecan start with the macroscopic energy continuity equation.
(e/t)#u )ee,de/dt"e ) JQ!P :eu"e ) J
Q!cP
zx, (5.21)
where the last equality is valid for planar Couette flows. The internal energy per unit volume isdenoted by e(r, t). It does not include any kinetic energy due to the streaming motion of the fluid.We can derive a microscopic expression for the heat flux vector by writing down the internal energydensity. At low Reynolds numbers the SLLOD momenta, Mp
i, 14i4NN can be regarded as
peculiar momenta with respect to the streaming velocity. The internal energy can consequently bedefined as
H0,+
p2i
2m#
12
N+i/1
N+j/1
Uij
, (5.22)
and we can define a contribution to the internal energy from molecule i as
ei,
p2i
2m#
12
N+j/1
Uij
. (5.23)
Given these definitions, we can write down a Lagrangian energy density,
e(q, t)"N+i/1
ei(t)d(q!q
i(t)) , (5.24)
where the qi’s are the Lagrangian positions defined in Eq. (5.9). Differentiating this expression with
respect to time and some algebraic manipulations gives the Lagrangian heat flux vector,
JQL
(t)»"
12
N+i/1
pi
m)CG
p2i
m#
N+j/1
UijH1!
N+j/1
Fij
qijD"
12
N+i/1
pi
m)Cei1!
N+j/1
FijqijD . (5.25)
The thermal conductivity is defined from Fourier’s law,
JQL
(k, u)"k(k,u)ocl
) ike(k,u) . (5.26)
S.S. Sarman et al. / Physics Reports 305 (1998) 1—92 33

This is Fourier’s law in the wave vector and frequency domain. The wave vector is denoted by k, wis the frequency, r is the mass density and cl is the specific heat at constant volume. Because there isno temperature defined away from equilibrium we use the internal energy density instead.A derivation similar to that used for obtaining the thermal conductivity in the linear regime close toequilibrium [11] gives
k"»
kB¹2
eP
=
0
dtSJQL
(t)JQL
(0)Tc . (5.27)
As before, the subscript c denotes a nonequilibrium shearing steady state. Note that a canonicalensemble of systems that have been brought into a shearing steady state using constant energydynamics has the same energy fluctuations as the equilibrium ensemble from which it wasgenerated [51]. This means that the time zero value of the correlation function of internal energydensity fluctuations is the same as it is at equilibrium. This, in turn, is related to the specific heatand the temperature ¹
%of the generating equilibrium ensemble. Therefore, the temperature
appearing in Eq. (5.27) is the equilibrium temperature, not the kinetic temperature of the non-equilibrium steady state. Note that, at equilibrium, Eq. (5.27) reduces to Eq. (2.4).
Whereas it is quite straightforward to evaluate the generalised Green—Kubo relations for theself-diffusion coefficient and the mutual diffusion coefficient it is considerably more difficult toevaluate the generalised Green—Kubo relations for the thermal conductivity. The origin of thisproblem is that we need Lagrangian coordinates when we evaluate the heat flux vector, Eq. (5.25).This means that the time origin occurs explicitly in the definition of J
QL. This causes severe
complications when one wants to evaluate the heat—current autocorrelation function. When oneevaluates conventional Green—Kubo relations by computer simulation one collects the currentappearing in the GK-relation in a shift register. The time correlation function is formed bymultiplying each element in the shift register by the first element in the shift register. The next timethe correlation function is evaluated the last element of the shift register is discarded and a newelement is added at the beginning. When the heat—current autocorrelations of a shearing fluid areevaluated, one first fills the shift register. Then one forms the time-correlations function in the sameway as above. After this one discards the whole shift register and starts accumulating a new one.This means that the evaluation of the thermal conductivity of a shearing fluid is vastly less efficientthan evaluating the thermal conductivity at equilibrium. To further complicate matters, theqij"q
j!q
iappearing in Eq. (5.25) become very large at times that are shorter than the decay time
of the heat—current autocorrelation function. Thus, the tails become very noisy.Despite these difficulties, the thermal conductivity has actually been evaluated for a Len-
nard—Jones fluid at a reduced temperature of 2.0 and a reduced density of 0.8. The variousheat—current correlation functions are shown in Fig. 12. The diagonal heat—current correlationfunctions are very similar to equilibrium heat—current autocorrelation functions. The off-diagonalelements are negative at time zero and decay monotonically to zero. Thus, the off-diagonalelements of the thermal conductivity tensor are negative. The yy, zz and zx elements do not dependon the time origin. The xx and xz components can be split into sums of two terms one of which isindependent of the time origin. All these elements can consequently be calculated very accuratelyby using conventional shift registers. The time-origin-dependent terms of xx and xz turns out to bemuch smaller than the other time-origin-independent terms. It is consequently possible to obtain
34 S.S. Sarman et al. / Physics Reports 305 (1998) 1—92

Fig. 12. The elements of CQQ
"SJQL
(t)JQL
(0)Tc of a Lennard—Jones fluid at a reduced temperature, density and strainrate of 2.0, 0.80 and 2.0, respectively. The curves depict from top to bottom the C
QQxx, C
QQyy, C
QQzz, C
QQzxand C
QQxz.
Fig. 13. The diagonal elements of the thermal conductivity tensor of a Lennard—Jones fluid as a function strain rate forthe same state point as in Fig. 12. The diamonds, squares and circles depict the j
xx, j
yyand j
zz, elements, respectively.
Fig. 14. The off-diagonal elements of the thermal conductivity tensor of a Lennard—Jones fluid as functions of the strainrate for the same state point as in Fig. 12. The full circles depict j
xzand the open circles depict j
zx.
accurate estimates of every element of the thermal conductivity tensor without prohibitively longsimulation runs.
It was found that the diagonal elements of the thermal conductivity tensor, which are shown inFig. 13, were independent of the strain rate up to a reduced strain rate of 1.0. After this, theyincrease faster than linearly with c. The off-diagonal elements, shown in Fig. 14, are almost linear inc. The strain rate dependence of the various elements of the thermal conductivity tensor can bededuced by reversing the strain rate. Inverting the x-axis causes J
Qxto change sign whereas ¹/z
remains the same. Therefore jxz
must be an odd function of the strain rate. In a similar way one canconclude that j
zxmust also be an odd function of c. When the x-axis is inverted both J
Qxand ¹/x
change sign, so jxx
must be an even function of c. This is also the case for the other two diagonalelements. This analysis is also valid for the mutual diffusion coefficient and the self-diffusion
S.S. Sarman et al. / Physics Reports 305 (1998) 1—92 35

coefficient. The simulation data obtained on these quantities so far are consistent with theseconclusions.
6. Anisotropic liquids
6.1. Introduction
In the previous sections we have discussed systems that are isotropic at equilibrium. Whena strong shear field was applied, the symmetry of the system was broken. This made the transportproperties of the system much more complex. The diffusion and thermal conductivity tensors havefive independent components instead of just one. Another class of anisotropic fluids is comprised ofvarious types of liquid crystals. They are anisotropic at equilibrium. The most obvious modelsystem to use for liquid crystals is the hard ellipsoid fluid. By varying the eccentricity of theellipsoid one can study any system from the infinitely thin plate fluid through the hard sphere fluidto the infinitely thin needle fluid. It has been shown to form uniaxial and biaxial nematic crystalphases as well as ordinary isotropic phases [52—56]. A length to width ratio of about 2.5 : 1 orgreater is required for the formation of a nematic phase. Hard spherocylinders have been shown toform not only nematic phases but also smectic phases. This shows that the formation of liquidcrystals to a large extent is an anisotropic excluded volume effect. Another model system is stringsof spherical interaction sites, such as hard spheres, soft spheres or Lennard—Jones cores [57—59].They exhibit a wide variety of liquid crystal phases. The length to width ratio required for theformation of a liquid crystal phase in this case is somewhat higher, about five to one. A thirdcommonly studied model potential is the Gay—Berne potential [50]. It can be regarded asa Lennard—Jones fluid generalised to ellipsoidal molecular cores. It displays a rich phase diagramof anisotropic phases [60—65]. Recently, a few simulations of biaxial nematic liquid crystals withsoft cores have been carried out [66,67]. It should be kept in mind that factors other than excludedvolume, such as electrostatic forces and dispersion forces also are important for the phasebehaviour of liquid crystals. Unfortunately, they are much more expensive to study by computersimulation techniques, so they have not received much attention to date.
The equilibrium properties and the phase diagrams of the above-mentioned systems have beenstudied in great detail. There has also been some studies on nonequilibrium properties andtransport coefficients such as diffusion coefficients [56,68,69], thermal conductivities [24,70] andviscosities [24,71—74].
The great advantage of using hard body fluids is that the molecular linear momenta and theangular momenta are constant between collisions. This means that molecular dynamics algorithmscan be very fast. Unfortunately, when thermostats and external dissipative fields are applied, themolecules accelerate between collisions. The advantage of the hard core potential is consequentlylost and it becomes more convenient to use a soft potentials.
6.2. Constraint algorithms
In a liquid crystal it is convenient to express various properties relative to a director-basedcoordinate system. This is not a problem in the thermodynamic limit when the director is virtually
36 S.S. Sarman et al. / Physics Reports 305 (1998) 1—92

fixed. It becomes a problem in a small system such as a simulation cell, because the director isslowly diffusing on the unit sphere. For finite systems, a director-based coordinate system isconsequently not an inertial frame. If the director is reorienting on the time scale of the decay timeof a time correlation function, the transport coefficient obtained from the time integral will beincorrect. When NEMD algorithms are applied the external field exerts a torque on the director. Ifit is not fixed it will rotate and it will not be possible to obtain a steady state. One way of solvingthese problems is to devise a Gaussian constraint algorithm that makes the angular velocity of thedirector, X, a constant of motion. By setting the angular velocity equal to zero, the directorbecomes fixed. A director-based coordinate system thus becomes an inertial frame and there is noreorientation. The algorithm also makes it possible to determine whether an external field such asa heat field or a strain rate exerts a torque on the molecules.
The director angular velocity only depends on the orientational phase variables. This means thatonly the angular accelerations but not the linear accelerations are affected when X is constrained[66]. This makes it possible to obtain the equations of motion by applying Gauss’s principle ofleast constraint and minimising the angular part of the square of the curvature,
cu,12
N+i/1
(I1·xR
1i!x
1i]I
1·x
1i!C
1i) · I~1
1· (I
1· xR
1i!x
1i]I
1· x
1i!C
1i) (6.1)
with respect to the x1i’s. The X constraint can be expressed in terms of angular accelerations by
differentiation with respect to time,
XQx(xR
1i; i"1, 2,2, N)"0 (6.2a)
and
XQy(xR
1i; i"1, 2,2,N)"0 . (6.2b)
Minimisation of Cu subject to these constraints gives
CuxR
1i
!jx
XQx
xR1i
!jy
XQy
xR1i
"0 (6.3a)
or
I1·xR
1i"x
1i]I
1·x
1i#C
1i#j
x
Xx
x1i
#jy
Xy
x1i
. (6.3b)
The expression for the multipliers jx
and jycan be obtained by inserting the equations of motion
into the constraint equations. This gives two simultaneous linear equations for jxand j
y. They can
be expressed in terms of the orientational phase variables Mx1i, uL
i, 14i4NN. If one constrains
X to be zero the constraints (6.2) are holonomic constraints. In this case one can derive the angularequations of motion by minimising the action (i.e., the time integral of the Lagrange function).However, the algebra becomes simpler when one uses Gauss’s principle.
One can show that these constraint equations do not cause any additional dissipation. The rateof change of the internal energy is
HQ !$0"
N+i/1Cjx
Xx
x1i
· x1i#j
y
Xy
x1i
·x1iD"j
xX
x#j
yX
y"k ·X"»kK · X , (6.4)
S.S. Sarman et al. / Physics Reports 305 (1998) 1—92 37

where k,(jx, j
y, 0) and kK ,k/». When director is fixed, X is identically zero and the constraint
equations do not do any work on the system. The ensemble averages obtained with the constraintequations are thus the same as the ones obtained without the constraints according to the theoremabout the equivalence of constant current and constant force ensembles described in Section 7.2below. The only exceptions are phase functions and time correlation functions that couple with theconstraint torques.
6.3. Diffusion and thermal conductivity
The most studied liquid crystal phase is the uniaxial nematic phase. In this case the self-diffusioncoefficient and the thermal conductivity are second rank tensors with two independent compo-nents. The components j
,,and D
,,relate forces and fluxes in the direction parallel to the director.
The components jMM
and DMM
relate forces and fluxes perpendicular to the director. The generalis-ed Fourier’s and Fick’s laws read
SJQT"![j
,,nn#j
M M(1!nn)] ·e¹ (6.5)
and
SJT"![D,,
nn#DM M
(1!nn)] ·ec (6.6)
where SJT and c are the current and the concentration of tracer molecules. The Green—Kuborelations for D and jaa are
Daa"P=
0
dtSla(t)la(0)T (6.7)
and
jaa"»
kB¹2P
=
0
dtSJQa(t)JQa(0)T , (6.8)
where JQa and la are the heat current and velocity in the a-direction and a"E or o. There is
a reasonable number of studies of the self-diffusion coefficient available for various liquid crystalmodel systems [56,68,69,75]. This is the simplest transport coefficient to evaluate. So far very fewstudies have applied the above constraint method to fix the director [66,70]. However, if thedensity and the order parameter are very high, which sometimes is the case, the reorientation timeof the director is very long. One can also show that the reorientation time of the director goes tozero in the thermodynamic limit. In these cases a director-based frame is to a very goodapproximation an inertial frame.
If the nematic liquid crystal consists of prolate (i.e., rod-like) molecules, the self-diffusioncoefficient is usually larger in the direction parallel to the director. It is easy to realise that this is thecase because the molecules are streamlined in the parallel direction. This makes it is easier for themto move in that direction than in the perpendicular direction. In Fig. 15 we depict the twocomponents of the velocity autocorrelation function for the prolate Gay-Berne fluid. When thenematic liquid crystal consists of oblate (i.e., plate-like) molecules, the relation between the two
38 S.S. Sarman et al. / Physics Reports 305 (1998) 1—92

Fig. 15. Velocity autocorrelation functions for prolate ellipsoids in the nematic phase. The full curve depictsZ
MM(t)"Sl
M(t)l
M(0)T
%2and the dashed curve depicts Z
,,(t)"Sl
,(t)l
,(0)T
%2. The length to width ratio is equal to 3 : 1.
The reduced densities and temperatures are 0.30 and 1.00, respectively.
Fig. 16. Velocity autocorrelation functions for oblate ellipsoids in the nematic phase. The full curve depictsZ
MM(t)"Sl
M(t)l
M(0)Teq and the dashed curve depicts Z
,,(t)"Sl
,(t)l
,(0)T
%2. The reduced density and temperature are
equal to 1.7 and 1.00, respectively. The length to width ratio is equal to 1 : 3.
components of the diffusion coefficient is, not surprisingly, reversed. Fig. 16 shows the componentsof the velocity autocorrelation function of a fluid consisting of oblate ellipsoids. These velocityautocorrelation functions were obtained using the constraint algorithm above. The self-diffusioncoefficient can also be obtained from the colour conductivity algorithm. Because the self-diffusion
S.S. Sarman et al. / Physics Reports 305 (1998) 1—92 39

coefficient is a single-molecule property, the Green—Kubo relation is more efficient than theNEMD algorithm. However, the NEMD algorithm has been tested and found to yield resultsconsistent with the GK-relations [24].
It is considerably more difficult to evaluate the thermal conductivity. Heat conduction isa dissipative process. The entropy production per unit time and unit volume, p, caused by the heatflow is
p"!
SJQT ·e¹
¹
"
1¹
[jMM
e¹ · e¹#(j,,
!jMM
)(n · e¹)2] . (6.9)
This means that the entropy production is dependent on the orientation of the director. Ina nematic liquid crystal consisting of prolate molecules j
,,'j
MM. The entropy production is
consequently minimal in the perpendicular orientation. In a nematic system consisting of oblatemolecules the reverse is true, j
MM'j
,,. Thus, the entropy production is minimal in the parallel
orientation.The thermal conductivity can either be calculated by GK relations or by the NEMD-algorithm
for rigid molecules, Eq. (3.41). The heat—current correlation functions for prolate ellipsoid fluids aredepicted in Fig. 17. The perpendicular component resembles the heat—current correlation functionof a Lennard—Jones fluid. The parallel component, which is the largest one, is different. Immediate-ly after the initial decay there is a negative region. The absolute magnitude of this region is rathersmall though, and it does not contribute very much to the time integral of the heat—currentcorrelation function or the thermal conductivity. In Fig. 18 we depict the heat—current correlationfunctions of an oblate ellipsoidal fluid. Here the roles of the two components are interchanged. Theperpendicular component is the largest one. It has a fairly long plateau immediately after the initialdecay. The parallel component is similar to a heat—current correlation function of an isotropicfluid. There may be a barely discernible negative region, similar to that of the prolate ellipsoids.However, it is very hard to discern from the statistical noise.
Fig. 17. The parallel CQQ,,
(t)"»SJQ,
(t)JQ,
(0)T%2
(dashed curve), and perpendicular CQQMM
(t)"»SJQM
(t)JQM
(0)T%2
(fullcurve) components of the heat current correlation functions of the prolate ellipsoids. Note that the scales are different.The left-hand scale pertains to C
QQ,,(t) and the right-hand scale pertains to C
QQMM(t) which has been enlarged.
Fig. 18. The parallel CQQ,,
(t)"»SJQ,
(t)JQ,
(0)T%2
(dashed curve), and perpendicular CQQMM
(t)"»SJQM
(t)JQM
(0)T%2
(fullcurve) components of the heat current correlation functions of the oblate ellipsoids.
40 S.S. Sarman et al. / Physics Reports 305 (1998) 1—92

An interesting question that arises is whether there is any preferred orientation of the directorrelative to the temperature gradient. The most straightforward way of answering this question is toperform a simulation with a heat field on and monitor the angular distribution of the director. Thishas been done for a prolate ellipsoidal fluid. The director was found to prefer to be perpendicular tothe temperature gradient.
One can also use the constraint algorithm to fix the director in the z-direction and apply a heatfield in the yz-plane at various angles relative to the director, cf. Fig. 19. After this one can calculatethe average constraint torque, SC
cxT, needed to maintain the director in a fixed orientation,
SCcxT"Tj
x
N+i/1
Xx
uxi
#jy
N+i/1
Xy
uxiU"Sj
xT . (6.10)
The second equality is valid when the director points in the z-direction. It has been found that fora fluid consisting of prolate ellipsoids that the constraint torque is negative. That means that ittwists the director towards the parallel direction. Since the constraint torque exactly cancels thetorque exerted by the temperature gradient, it must twist the director towards the perpendicularorientation. This is consistent with the free director simulations. If one calculates the constrainttorque that is needed to keep the director fixed in the nematic phase of an oblate ellipsoid fluid onefinds that it is positive. It consequently twists the director towards the perpendicular orientation.Therefore the temperature gradient twists the director towards the parallel orientation. Thisbehaviour can be rationalised by recalling that j
,,'j
MMin the prolate ellipsoid fluid and that
j,,
(jMM
in the oblate system. This means that in both cases the dissipation is minimised when thedirector takes up its preferred orientation relative to the temperature gradient. This is consistentwith the principle of minimum entropy production and Evans—Baranyai conjecture [76] whichpostulates that the absolute magnitude of the phase space compression factor is minimal ina steady state. In this case the phase space compression factor is proportional to the dissipation.
Fig. 19. Arrangement of the director and the heat field, FQ, for computation of torques exerted by F
Q. The director is
fixed in the positive z-direction. The heat field, FQ, is applied in the yz-plane at an angle h to the director.
S.S. Sarman et al. / Physics Reports 305 (1998) 1—92 41

It is possible to analyse this phenomenon of field-induced director alignment in somewhatgreater detail. It is obviously due to a coupling between the rate of change of the order tensor, Q0 ,and the temperature gradient. It is not possible to have a linear coupling between Q0 and e¹,because the first mentioned quantity is a second rank symmetric traceless tensor and the last one isa polar vector. However, one can form a second rank tensor from the dyadic of the temperaturegradient. We can begin by imagining that the temperature gradient exerts a torque, C, on thedirector. This torque must be zero at the perpendicular and parallel orientations because ofsymmetry. The perpendicular orientation must be stable and the parallel orientation must beunstable for the prolate ellipsoids. The reverse must be true for the oblate ellipsoids: the parallelorientation must be stable and the perpendicular orientation must be unstable. It is also reasonableto assume that the torque is proportional to the anisotropy of the thermal conductivity, j
,,!j
MM.
An algebraic expression that satisfies these requirements is
C"!(2k/¹2)(j,,
!jMM
)(n ·e¹)n]e¹ , (6.11)
where k is a proportionality constant. It is interesting to note, that this expression could havebeen obtained by differentiation of the entropy production, Eq. (6.9), with respect ton,C"!kn]p/n. We can obtain a relation between Q0 and the temperature gradient by notingthat the thermodynamic flux conjugate to C is the angular velocity of the director, X, i.e. C"0X,where 0 is another proportionality constant. Utilising the relation nR "X]n gives
Q0 "32S(nnR #nR n)"!(3S0k/¹2)(j
,,!j
MM)[(n ·e¹)(ne¹#e¹n)!2nn(n ·e¹)2] . (6.12)
We have assumed that the temperature gradient does not affect the order parameter or any otherthermodynamic quantities. It is reasonable to assume that, in the thermodynamic limit, onlya small temperature gradient that does not affect the order parameter will be needed to orient thedirector. The application of the principle of minimum entropy production here is unusual. It isgenerally assumed that this principle requires linear relations between thermodynamic forces andfluxes. Here the relationship is quadratic.
6.4. Flow properties
In order to find a phenomenological relation between the pressure tensor and the strain rate westart with the entropy production for a shearing nematic liquid crystal. The most generalexpression for the irreversible entropy production in this case is
p"!(1/¹)MP_ 4 : (es u)4#kK · (e]u!2X)#nK · (e]u!2x)#[13Tr(P)!P
%2]e · uN (6.13)
If we select (es u)4, e]u!2X, e]u!2x and e · u as the thermodynamic forces the conjugatefluxes become SP_ 4T, SkK T, SnK T and S1
3Tr(P)!P
%2T. We define nK "nn(S#2)/3. The forces are given
external parameters whereas the fluxes are ensemble averages of phase variables hence the angularbrackets. The phenomenological relations between fluxes and forces become
SP_ 4T"!2g@(es u)4!2gJ @1[(n>n)4 · (es u)4]4!2gJ @
3(n>n)4[(n>n)4 : (es u)4]!f(n>n)4e · u
#2gJ @2[(n>n)4 · e · (1
2e]u!X)]4#2gJ @
4[(n>n)4 · e · (1
2e]u!x)]4 , (6.14a)
SkK T"!cJ @1[231!(n>n)4] · (1
2e]u!X)!cJ @
3[231!(n>n)4] · (1
2e]u!x)!cJ @
2e : [(n>n)4 · (es u)4] ,
(6.14b)
42 S.S. Sarman et al. / Physics Reports 305 (1998) 1—92

SnK T"!gJ @31
[231!(n>n)4] · (1
2e]u!x)!gJ @
32[131#(n>n)4] · (1
2e]u!x)
!gJ @33
[231!(n>n)4] · (1
2e]u!X)!cJ @
4e:[(n>n)4 · (es u)4] (6.14c)
and
13STr(P)T!P
%2"!g
V+kuk!i(+s u)4
33. (6.14d)
In order to simplify the following discussion we introduce a director-based coordinate system(e
1, e
2, e
3). The stream lines are parallel to the e
x-direction, the velocity varies linearly in the
ez-direction. The director is confined to the xz-plane. In the director-based coordinate system the
director points in the e3-direction. The directions perpendicular to the director are denoted e
1and
e2. The director-based coordinate system can be obtained from the observer-based coordinate
system by a n/2!h rotation around the ey-axis, see Fig. 20. In the director-based coordinate
system these relations can be rewritten in a component wise manner,
SP_ 411
T"!(2g@#23gJ @3)(+s u)4
11!(2
3gJ @1#2
3gJ @3)(+s u)4
22#1
3f+kuk , (6.15a)
SP_ 422
T"!(2g@#23gJ @3)(+s u)4
22!(2
3gJ @1#2
3gJ @3)(+s u)4
11#1
3f+kuk , (6.15b)
SP_ 433
T"!(2g@#23gJ @1#4
3gJ @3)(+s u)4
33!2
3f+kuk , (6.15c)
SP_ 412
T"!(2g@!23gJ @1)(+s u)4
12, (6.15d)
SP_ 423
T"!(2g@#13gJ @1)(+s u)4
23!gJ @
2(12e]u!X)
1!gJ @
4(12e]u!x)
1, (6.15e)
SP_ 431
T"!(2g@#13gJ @1)(+s u)4
31!gJ @
2(12e]u!X)
2!gJ @
4(12e]u!x)
2, (6.15f)
SjK1T"!cJ @
1(12e]u!X)
1!cJ @
3(12e]u!x)
1!cJ @
2(+s u)4
23, (6.15g)
SjK2T"!cJ @
1(12e]u!X)
2!cJ @
3(12e]u!x)
2#cJ @
2(+s u)4
31, (6.15h)
SmK1T"!gJ @
31(12e]u!x)
1!gJ @
33(12e]u!X)
1!cJ @
4(+s u)4
23, (6.15i)
SmK2T"!gJ @
31(12e]u!x)
2!gJ @
33(12e]u!X)
2#cJ @
4(+s u)4
31, (6.15j)
SmK3T"!gJ @
32(12e]u!x)
3(6.15k)
Fig. 20. The Couette shearing coordinate system. In the right-handed space fixed coordinate system (ex, e
y, e
z) the stream
lines are in the x-direction and the velocity varies linearly in the z-direction. The y-axis is perpendicular to the shear planeand pointing away from the observer. The director fixed coordinate system, (e
1, e
2, e
3) is obtained from the space fixed
coordinate system by rotating it p/2!h around the y-axis. Consequently we have e2"e
y.
S.S. Sarman et al. / Physics Reports 305 (1998) 1—92 43

and
13STr(P)T!P
%2"!g
V+kuk!i(+s u)4
33. (6.15l)
The coefficients g@, gJ @1
and gJ @3
are shear viscosities. The twist viscosity is denoted by cJ @1. The
symmetric traceless pressure tensor cross-couples with the trace of the strain rate and the twoangular velocities 1
2e]u!X and 1
2e]u!x. The corresponding cross coupling coefficients are f,
gJ @2
and gJ @4. According to the Onsager reciprocity relations, they must be equal to i, cJ @
2/2 and cJ @
4/2.
They couple the symmetric traceless strain rate to the trace of the pressure tensor and the twotorque densities SkK T and SnK T. The coefficients gJ @
31and gJ @
32are the vortex viscosities. It is important
to distinguish between the vortex viscosity and the twist viscosity. They are different transportcoefficients. In an isotropic fluid the twist viscosity is zero whereas the vortex viscosity is finite andgJ @31"gJ @
32. Finally, gJ @
33is the cross-coupling coefficient between SnK T and 1
2+]u!X. It is equal to cJ @
3,
the cross coupling between SkK T and 12+]u!u. The bulk viscosity is g
V.
In most liquid crystal flow experiments and computer simulations the torque density nK is equalto zero. In this case the entropy production simplifies to
p"!(1/¹)MP_ 4 : (+su)4#P ! · (e]u!2X)#[13Tr(P)!P
%2]e · uN (6.16)
Defining (es u)4, 12+]u!X, 1
2+]u!u and + · u as the thermodynamic forces, the conjugate fluxes
become SPs 4T,SP !T and S13Tr(P)!P
%2T. The linear phenomenological relations corresponding to
this set of forces are
SP_ 4T"!2g(es )4!2gJ1[(n>n)4 · °(es u)4]4!2gJ
3(n>n)4[(n>n)4 : (es u )4]!f(n>n)4e · u
#2gJ2[(n>n)4 · e · (1
2e]u!X)]4 , (6.17a)
SkK T"S2P !T"!cJ1[231!(n>n)4] · (1
2e]u!X)!cJ
2e : [(n>n)4 · (es u)4] (6.17b)
and
13STr(P)T!P
%2"!g
Ve · u!i(n>n)4 : (es u)4 . (6.17c)
Rewriting these expressions in a component manner in a director-based coordinate system gives
SP_ 411
T"!(2g#23gJ3)(+s u)4
11!(2
3gJ1#2
3gJ3)(+s u)4
22#1
3f+kuk , (6.18a)
SPs 422
T"!(2g#23gJ3)(+s u)4
22!(2
3gJ1#2
3gJ3)(+s u)4
11#1
3f+kuk , (6.18b)
SP_ 433
T"!(2g#23gJ1#4
3gJ3)(+s u)4
33!2
3f+kuk , (6.18c)
SP_ 412
T"!(2g!23gJ1)(+s u)4
12, (6.18d)
SP_ 423
T"!(2g#13gJ1)(+s u)4
23!gJ
2(12e]u!X)
1, (6.18e)
SP_ 431
T"!(2g#13gJ1)(+s u)4
31#gJ
2(12e]u!X)
2, (6.18f)
SjK1T"!cJ
1(12e]u!X)
1!cJ
2(+s u)4
23, (6.18g)
SjK2T"!cJ
1(12e]u!X)
2#cJ
2(+s u)4
31(6.18h)
44 S.S. Sarman et al. / Physics Reports 305 (1998) 1—92

and
13STr(P)T!P
%2"!g
V+kuk!i(+s u)4
33, (6.18i)
where g, gJ1
and gJ3
are shear viscosities. The twist viscosity is cJ1. The symmetric traceless pressure
tensor couples with e ) u and 12e]u!X. The cross coupling coefficients are f and gJ
2. According to
the Onsager reciprocity relations, they must be equal to i and cJ2/2. They couple symmetric
traceless strain rate to the trace of the pressure tensor and to SkK T. The bulk viscosity is denoted bygV. Note that even though we only eliminated SnK T and 1
2+]u!u, almost every viscosity
coefficient is affected. Therefore, we have primed the coefficients in Eqs. (6.14) and (6.15) and usedunprimed coefficients in Eqs. (6.17) and (6.18).
In order to obtain simple equilibrium fluctuation relations for the various viscosity coefficientsone has to select the ensemble very carefully. We have found that the fluctuation relations becomeparticularly simple, i.e. they are linear combinations of time correlation function integrals, providedone uses an ensemble where the thermodynamic forces are given external parameters and the fluxesare fluctuating. If one wants simple fluctuation relations for the primed viscosities one should usean ensemble where both X and x are constants of motion. The conjugate torque densities, kK andnK should be fluctuating phase functions. If one wants simple relations for the unprimed viscositiesone should apply an ensemble where X is a constant of motion. Such an ensemble can easily beobtained by employing the director constraint algorithm discussed in the previous section.Fluctuation relations for the unprimed viscosities were originally derived by Forster using projec-tion operator techniques [77]. The same relations were later derived in Refs. [24,73] by analysingthe linear response to the SLLOD equations. The fluctuation relations were generalised to theprimed viscosities and to ensembles where X and x are constants of motion. Here we will quote theresults for the unprimed viscosities in an equilibrium ensemble where X is constrained to be zero.
The expressions for the various shear viscosities are very complicated,
g"13(g
1212#g
2323§X#g
3131§X) , (6.19a)
gJ1"g
2323§X#g
3131§X!2g
1212(6.19b)
and
gJ3"3
8(g
1111#g
2222)!g
1212#3
8(g
2222#g
3333)!g
2323§X#3
8(g
3333#g
1111)!g
3131§X,
(6.19c)
where
gabcd§X,b»P=
0
dsSP_ 4ab(t)P_ 4ab(0)T%2§X
. (6.19d)
The subscript ‘eq;X’ denotes an equilibrium ensemble where X is zero. It is obvious that g can beregarded as an orientationally averaged viscosity. When the order parameter goes to zero thisviscosity coefficient becomes the ordinary shear viscosity. The other two shear viscosities aremeasures the anisotropy of the shear viscosity. They vanish in an isotropic fluid. The twist viscosity
S.S. Sarman et al. / Physics Reports 305 (1998) 1—92 45

is given by
cJ1"b»P
=
0
dsSjK a(s)jK a(0)T%2§X
, a"1 or 2 (6.20)
and for the cross-coupling coefficients gJ2"cJ
2/2 we have
gJ2"cJ
2/2"!b»P
=
0
dsSjK a(s)P_ 4bc(0)T%2§X
(!1)a, abc"123 or 231 . (6.21)
Since we have the relation cos 2h0"!cJ
1/cJ
2we also have a fluctuation relation for the preferred
alignment angle,
1cos 2h
0
"2b»:=
0dsSjK a(s)P_ 4bc(0)T
%2§X
b»:=0
dsSjK a(s)jK a(0)T%2§X
(!1)a , abc"123 or 231 . (6.22)
Each of these fluctuation relations become considerably more complicated in the conventionalcanonical ensemble. They are rational functions of the time-correlation function integrals. Thismakes it difficult to evaluate them numerically. However, it is worth mentioning that the twistviscosity is given by
1cJ1
"b»P=
0
dsSXa(s)Xa(0)T%2
, a"1 or 2 . (6.23)
This viscosity is also related to the mean square displacement of the director,
1cJ1
"limt?=
limV?=
b»Sn2a (t)T%22t
, a"1 or 2 . (6.24)
Here one has to let » go to infinity before time goes to infinity, since otherwise the limit will be zerobecause the unit sphere is finite. Thus if the twist viscosity is high, the director reorients moreslowly. This relationship also shows that the mean square displacement goes to zero in thethermodynamic limit. Finally, we note that there is another fluctuation relation for the preferredalignment angle.
1cos 2h
0
"!2b»P=
0
dsSXa(s)P_ 4bc(0)T%2
(!1)a, abc"123 or 231 . (6.25)
All the fluctuation relations discussed here can be evaluated by conventional EMD simulationsalthough very long simulations may be needed for them to converge. One can also use the SLLODequations together with the constraint algorithm, Eq. (6.3), to fix the director at various directionsrelative to the stream lines. In order to simplify the algebra it is useful to express the strain rate ina director-based coordinate system. The symmetric traceless strain rate becomes
(es u)4n"c2 A
!sin 2h 0 !cos 2h
0 0 0
!cos 2h 0 sin 2h B , (6.26)
46 S.S. Sarman et al. / Physics Reports 305 (1998) 1—92

where h is the alignment angle. The antisymmetric part of the strain rate is not affected by therotation of the coordinate system because its pseudo-vector dual is parallel to the y-axis, i.e.!1
2e :+u"1
2+]u"e
yc/2"e
2c/2. The torque density kK also remains unchanged, jK
yey"jK
2e2. If
this strain is inserted into the phenomenological relations (6.18) we get
SP_ 411
T"(g#13gJ3)c sin 2h , (6.27a)
SP_ 422
T"13(gJ
1#gJ
3)c sin 2h , (6.27b)
SP_ 433
T"!(g#13gJ1#2
3gJ3)c sin 2h , (6.27c)
SP_ 431
T"(g#16gJ1)c cos 2h#gJ
212c (6.27d)
and
2Sp!2T"SjK
2T"!cJ
1
c2!cJ
2
c2cos 2h . (6.27e)
From these equations it is obvious that the various viscosity coefficients can be obtained by fixingthe director at a number of different angles relative to the stream lines and calculating the ensembleaverage of the pressure tensor. In particular, this is a direct method of calculating the Miesowiczviscosities, which are the effective viscosities, SP
zxT"!g
ic, i"1, 2, 3, with the director fixed in
the x, z and y directions, respectively.
g1"g#1
6gJ1#gJ
2#1
4cJ1
, (6.28a)
g2"g#1
6gJ1!gJ
2#1
4cJ1
(6.28b)
and
g3"g!1
3gJ1
. (6.28c)
Of course, it is also possible to calculate the viscosity at any orientation of the director relative tothe stream lines.
The flow properties of nematic fluids are different from isotropic fluids. In the latter case fluidsconsisting of prolate molecules align on average at a 45° angle relative to the stream lines andoblate ones at 135°. The order parameter is proportional to the strain rate, so the degree ofordering is not very high unless a very strong strain rate is applied. In a nematic fluid the orderparameter is very high, i.e. 0.2—0.9, even at equilibrium. When the strain field is applied the directorstarts rotating. Then there are two possibilities: The director might come to rest at a fixed anglerelative to the stream lines or it may continue rotating forever. In the first case the liquid crystal issaid to be flow stable and a steady state is attained. The alignment angle is usually less than 45° forprolates and less than 135° for oblates. The alignment angle is given by cos 2h
0"!cJ
1/cJ
2and the
equilibrium fluctuation relations (6.22) and (6.25). If a torque density kK is applied, the alignmentangle changes. If the magnitude of kK is not too large the alignment angle will still attain a constantvalue, cos 2h"!(2jK
2/c#cJ
1)/cJ
2. If the torque is too large, D(2jK
2/c#cJ
1)/cJ
2D'1 the director will
S.S. Sarman et al. / Physics Reports 305 (1998) 1—92 47

start rotating and the steady state is destroyed. If DcJ1/cJ
2D'1 the director will rotate forever even if
no external torque is applied. The liquid crystal is said to be flow unstable. No steady state will beattained because the properties of the system change with time. However, if one applies a torquedensity the director might come to rest and a steady state can be attained. Both flow stable and flowunstable liquid crystals have been found experimentally [78—81]. The flow properties of flowunstable liquid crystals have been discussed in detail by Zun8 iga and Leslie [82,83] and by Carlsson[81]. Flow-unstable liquid crystal model systems had not been observed in computer simulationstudies until very recently [84].
The first attempt to evaluate the viscosity of a liquid crystal model system by computersimulation methods was made by Baalss and Hess [71,72]. They calculated the Miesowiczviscosities of a perfectly aligned nematic liquid crystal. In order to simplify the calculations theydevised a mapping from an isotropic soft sphere fluid onto a perfectly aligned liquid crystal. A morerealistic model was used by Sarman and Evans in Ref. [24] and by Sarman in Refs. [73,74] wherethe above fluctuation relations were evaluated for a nematic phase of the Gay—Berne fluid. In orderto shorten the computation time, the Lennard—Jones core was replaced by a purely repulsive 1/r18potential. Both prolate ellipsoids with a length to width ratio of 3 : 1 and oblates with a length towidth ratio of 1 : 3 were studied. These simulations dealt with a few basic problems, firstly the flowstability of the molecular model system and, secondly, numerical evaluation of the various viscositycoefficients. The flow stability can be determined by subjecting the fluid to a strain rate field byapplying the SLLOD equations of motion. In addition, one uses the director constraint algorithmto force the director to lie in the vorticity plane but one leaves it free to attain any angle relative tothe stream lines. If the director comes to rest at a fixed angle the model system is flow stable. Theresult of such a calculation for prolate ellipsoids is shown in Fig. 21. As one can see the angulardistribution of the director is approximately Gaussian with a maximum around 20° relative to thepositive x-direction. This simulation was carried out for a 256-molecule system. As the system sizeincreases the distribution will become narrower and in the thermodynamic limit the director will bevirtually fixed.
Fig. 21. The angular distribution of the director, p(h), where h is measured in degrees, at a reduced strain rate, cq, of 0.04for oblate ellipsoids. The circles are the simulation results and the full curve is a Gaussian curve fit.
48 S.S. Sarman et al. / Physics Reports 305 (1998) 1—92

Fig. 22. The diagonal pressure tensor elements SP_ 411
T/c (open circles) and SP_ 433
T/c (filled circles) as functions of thealignment angle. The reduced strain rate, cq, is 0.02. The continuous curves are fits to the function a
0sin 2h.
Fig. 23. The pressure tensor elements SP_ 431
T/c (open circles) and Sp!2T/c (filled circles) as functions of cos 2h at a reduced
strain rate of 0.02. The circles are the simulation results and the lines are least-square fits.
As mentioned in the previous paragraph it is possible to calculate the shear viscosities and thetwist viscosities by fixing the director at various angles relative to the stream lines and applying theSLLOD equations of motion. The results of such a calculation is shown in Figs. 22 and 23. As onecan see, SP_ 4
31T and Sp!
2T are linear functions of cos 2h, as they should according to the phenom-
enological relations (6.27). One can also see that SP_ 411
T, and SP_ 433
T are proportional to sin 2h.The SLLOD equations and the director constraint algorithm is an excellent method for
evaluating the Miesowicz viscosities. One simply fixes the director at the appropriate angle relativeto the stream lines. Although the prolate Gay—Berne fluid differs significantly from the perfectlyaligned liquid crystal simulated by Baals and Hess, the relative magnitudes are surprisingly similar,g2<g
3'g
1. In practice these viscosities vary significantly with the state point. However, the
relative magnitudes are fairly constant and not very different from those obtained in our simula-tions. It is easy to realise that g
1is the smallest viscosity in a prolate liquid crystal because this is the
effective viscosity when the molecules are parallel to the stream lines. In this orientation it is veryeasy for the molecules to pass each other because only the vertices of the ellipsoids hit each otherwhen they collide. It is also easy to understand that g
2is the largest viscosity. This is the effective
viscosity when the director is perpendicular to the stream lines and to the normal of the vorticityplane. It is fairly difficult for the molecules to pass each other in this orientation because their broadsides collide. In an oblate liquid crystal the relative magnitudes of the Miesowicz viscosities arereversed, g
1<g
3'g
2. In this case g
1is the largest viscosity. This is easily understood because
when the director is parallel to the stream lines, the broad sides of the molecules hit each otherwhen they pass each other. On the other hand, when the director is perpendicular to the streamlines and the normal of the vorticity plane only the edges of the oblates collide when the moleculespass each other. The effective viscosity is consequently very low.
The NEMD estimates of the various viscosity coefficients can be cross checked by evaluating thetime correlation functions in Eqs. (6.19)—(6.25). They can be evaluated in the j or the X ensemble.
S.S. Sarman et al. / Physics Reports 305 (1998) 1—92 49

Most time correlation functions are the same in the two ensembles. The only ones that are differentare those where one or both of the components couple with X or kK . This means thatb»SPs 4aa(t)Ps 4aa(0)T, a"1, 2, 3 and b»SP4
12(t)Ps 4
12(0)T are ensemble independent whereas
b»SP431
(t)Ps 431
(0)T"b»SPs 423
(t)Ps 423
(0)T are different in the two ensembles. The correlation functionsinvolving the diagonal elements of the pressure tensor and the j ensemble version ofb»SPs 4
31(t)P4
31(0)T are shown in Fig. 24. A major difference between the TCFs and those of isotropic
fluids, is that they do not decay monotonically to zero. They have a rebound region similar to thatof a velocity autocorrelation function of a dense simple fluid. However, this rebound region is notlarge enough to cause any numerical cancellation problems when the time integral from zero tointegral from zero to infinity is calculated. In Fig. 25 we depict b»SX
2(t)X
2(0)T"b»SX
1(t)X
1(0)T
and b»SX2(t)Ps 4
31(0)T"!b»SX
1(t)Ps 4
23(0)T. The first mentioned correlation function is an even
function of time whereas the second one is an odd function of time. They both have reboundregions at short times. In Fig. 26 we display the X ensemble correlation functions,b»SjK
2(t)jK
2(0)T"b»SjK
1(t)jK
1(0)T, b»SjK
2(t)Ps 4
31(0)T"!b»SjK
1(t)Ps 4
23(0)T and b»SPs 4
31(t)Ps 4
31(0)T. As
one can see, they all decay monotonically to zero. The correlation functions that are ensembledependent are considerably less structured in the X ensemble.
In Fig. 27 we depict the mean square displacement of the director as a function of time. In thiscase it is very low. After ten time units, the square root of the MSD of the director is only 4°. It isimportant to keep this figure in mind. This low reorientation rate means that a director-basedcoordinate system is an inertial frame to a very good approximation even if one does not apply theconstraint equation, (6.3). This MSD was obtained from a simulation of 256 molecules. If thesystem size increases the MSD will be even smaller.
Fig. 24. Various time correlation functions, Cpp
(t), involving the symmetric traceless pressure tensor. The full curvedenotes b»SPs 4
33(t)Ps 4
33(0)T
%2, the dotted curve represents b»SPs 4
11(t)Ps 4
11(0)T
%2and the dashed curve stands for
b»SPs 431
(t)Ps 431
(0)T%2
. Note that the last correlation function has been evaluated in the j-ensemble. It is different in theX-ensemble whereas the first two correlation functions are ensemble independent.
Fig. 25. The time correlation functions CXX(t),b»SX2(t)X
2(0)T
%2(full curve), magnified by a factor of 10 and
CX1(t),b»SX
2(t)Ps 4
31(0)T
%2(dotted curve).
50 S.S. Sarman et al. / Physics Reports 305 (1998) 1—92

Fig. 26. Various X-ensemble time correlation functions, CAB§ X(t), involving SPs 4
31T and jK
2(t). We include
b»SjK2(t)jK
2(0)T
%2§ ) (full curve), !b»SjK2(t)Ps 4
31(0)T
%2§ ) (dotted curve) and b»SPs 431
(t)Ps 431
(0)T%2§ ) (dashed curve).
Fig. 27. The mean square displacement of the director as a function of time in the nematic phase of a prolate ellipsoidfluid. The system and the state point is the same as in Fig. 16.
We have verified that the fluctuation formula for the alignment angle gives results con-sistent with the actually observed alignment angles. As mentioned in the previous paragraphthe alignment angle is primarily determined by the requirement that the antisymmetricpressure tensor must be zero. However, one might also ask, whether the alignment angle minimisesthe irreversible entropy production, p. The expression for p in terms of the above viscositycoefficients is
p/c2"SPs 4
zxT
c"
omc2 A
dsdtB
*33
"
1¹Cg#
gJ16#
gJ32
sin2 2h#gJ22
cos 2hD . (6.29)
Note that this is not the total entropy production, it is only the entropy production dueto the traceless symmetric pressure and strain rates. When no external torques are applied,this becomes the total entropy production. We have evaluated this entropy production bothfor the oblate ellipsoids and the prolate ellipsoids by fixing the director at various anglesrelative to the stream lines. A curve fit to the above expression yields estimates of the vis-cosity coefficients that are consistent with the NEMD estimates and the equilibrium fluctuationestimates. This is a significant consistency check of our algorithm. However, more important,the minimum entropy production seems to take place very close to the alignment angle that thesystem actually prefers. This is in agreement with the principle of minimal entropy production oflinear irreversible thermodynamics. The behaviour is reminiscent of the behaviour of a liquidcrystal in a temperature gradient discussed in the previous paragraph. However, more work needsto be done before one can tell whether this is purely coincidence or due to more fundamentalprinciples.
S.S. Sarman et al. / Physics Reports 305 (1998) 1—92 51

7. Developments in the fundamental theory of nonequilibrium steady states
Over the past decade, our fundamental understanding of steady states away from equilibriumhas grown substantially, in part because of the availability via nonequilibrium molecular dynamicsof model systems in well-controlled steady states as systems to test hypotheses concerning thesesystems. In this section, we summarize some of the recent developments in the theory of nonequilib-rium steady states. We begin by reviewing the theoretical demonstrations of the equivalence ofthermostatting mechanisms away from equilibrium (Section 7.1) and of the constant field(Thevenin) and constant current (Norton) ensembles, so named because of the similarity toelectrical circuits. In Section 7.3, we describe the computation of transport coefficients fromLyapunov exponents, thus establishing a fundamental link between the distortion of phase spacebrought about by the imposition of an external field and the transport properties of the system inquestion. Finally, we conclude in Sections 7.4 and 7.5 with a discussion of the probabilitiesassociated with violations of the second law of thermodynamics.
7.1. Equivalence of thermostatting mechanisms away from equilibrium
In this section we show that, in general, both steady state averages and time correlation functionscomputed under either Gaussian isokinetic, Gaussian isoenergetic dynamics or underNose—Hoover thermostats are equivalent. This result is true even in the far from equilibriumnonlinear regime as long as the system is mixing and the quantities involved are local and nottrivially related to constants of the motion. We describe computer simulation results which supportthis theoretical prediction.
7.1.1. IntroductionConsider an N-molecule system of structureless molecules with coordinates, q
1, q
2,2, and
peculiar momenta, p1, p
2,2, and a potential energy, U(q
1, q
2,2). In 1984, Evans and Morriss
established [4] that the linear thermostatted response of a phase function, B(C)"B(q
1, q
2,2, p
1, p
2,2), to an external perturbing field, F
%, can usually2 be written in a Kubo form,
limF
%?0
SB(tı)T"!b»Pt
0
dsSJ(0)B(sı0)T · F
%, (7.1)
where the dissipative flux, J, is defined in terms of the adiabatic (i.e. unthermostatted) derivative ofthe internal energy, by Eqs. (2.6) and (2.7).
In Eq. (7.1) the subscript, ı, for the time arguments t, s, denotes the form of the thermostat used toextract the heat produced in the system by the dissipative external field. The most commonreversible, deterministic thermostats that have been studied include [8]: the Gaussian isokineticthermostat (ı"K), Gaussian isoenergetic (ı"E), the usual Nose—Hoover thermostat (ı"NHK)
2This result assumes the usual condition [dC/dt]/CDad"0 which is known as the adiabatic incompressibility ofphase space — see Ref. [12] for details.
52 S.S. Sarman et al. / Physics Reports 305 (1998) 1—92

which employs an integral feedback mechanism based on the peculiar kinetic energy. In this sectionwe shall also introduce a variant of the Nose—Hoover thermostat which is based on an internalenergy feedback equation (ı"NHE). In Eq. (7.1) the zero subscript for the time argument s,denotes that the external field, F
%, is set to zero. If there is no zero subscript on a time argument (as
is the case for t in Eq. (7.1)), it is understood that the time generation proceeds in the presence of theexternal field F
%.
The equations of motion for each of these thermostats (ı"K,E, NHK,NHE) can be written ina form which is identical to Eq. (2.13) [8],
qRi"p
i/m#C
i· F
%,
pRi"F
i#D
i· F
%!aı pi
. (7.2)
For ı"K,E, NHK,NHE all that changes from Eq. (2.13) is the expression for the thermostattingmultiplier, a. In the two cases we shall give most detailed consideration to, ı"K,E, we have
aK"
+Ni/1
[Fi· p
i/m#F
%· D
i· p
i/m]
+Ni/1
p2i/m
, (7.3)
which is identical to Eq. (2.14), and
aE"
F%·+N
i/1[D
i· p
i/m!F
i· C
i]
+Ni/1
p2i/m
"
!J» · F%
+Ni/1
p2i/m
. (7.4)
In words, Eq. (7.1) simply states that the thermostatted linear response (limFeP0), of a phase
function B, is related to the time integral of a thermostatted equilibrium (F%"0), time correlation
function which correlates the phase function B, to the dissipative flux which is generated by theperturbing external field.
In 1983, Evans and Morriss [85] showed that in the thermodynamic limit, equilibrium timecorrelation functions evaluated under Gaussian isothermal dynamics are identical to the corre-sponding equilibrium time correlation functions evaluated under Newtonian dynamics. Later inthe same year, Evans and Holian [86] showed that Nose—Hoover thermostatted dynamics (NHK)also leaves equilibrium time correlation functions unchanged in the thermodynamic limit.
When this equivalence of thermostatted equilibrium time correlation functions is combined withthe results of thermostatted linear response theory summarised in Eq. (7.1), we observe that at thesame thermodynamic state point, the linear thermostatted response is independent of the nature ofthe thermostat.
These results however, only relate to the linear response regime where F%P0. From a practical
point of view it has been known for some time that even in the non-linear regime computedaverages and time correlation functions are remarkably insensitive to the form of the thermostat.
Recently, Liem et al. [87] performed accurate comparisons of the viscosity and the nonequilib-rium equation of state of systems which are thermostatted homogeneously (as described above)with corresponding results for systems which are thermostatted by conduction to thermal bound-aries. They compared the results of homogeneous thermostatted shear flow with results fromsimulations of Couette flow between atomistically modelled walls. They found that within the
S.S. Sarman et al. / Physics Reports 305 (1998) 1—92 53

estimated statistical uncertainties of their calculations ($2%), the homogeneously sheared andthermostatted results, agreed with the inhomogeneous simulations. It is worth pointing out thatthese comparisons were carried out reasonably far from the linear regime. In fact at their higheststrain rates the viscosity was some 20% smaller than the extrapolated zero shear value.
Somewhat earlier, in 1985 Evans and co-workers [88,89] presented a comparison of soft sphereviscosities obtained homogeneously using Gaussian isothermal, Gaussian isoenergetic andNose—Hoover thermostats. Again all of these results agreed with each other within estimateduncertainties ($2%). This comparison was carried out far into the nonlinear regime where theviscosity is 30% smaller than its limiting Newtonian value.
In this section we sketch a proof of the thermostat independence of both steady state averagesand steady state time correlation functions, in the nonlinear regime. We also provide numericaldata which supports these proofs.
7.1.2. Theory7.1.2.1. Steady-state averages. If we denote the Heisenberg representation of a phase variable as
B(C(tı))"e*LıtB(C(0)), ı"K,E , (7.5)
where C"(q1,2, q
N, p
1,2, p
N) denotes the average of the phase function B, computed under
Gaussian thermostatted or Gaussian ergostatted (i.e. constant internal energy) dynamics, a Dysondecomposition of the propagators can be used to show that
e*LKt"e*LEt#Pt
0
dt1e*LEt1id¸e*LK(t~t1)
"e*LEt#Pt
0
dt1e*LEt1id¸Ge*LE(t~t1)#P
t~t1
0
dt2e*LEt2id¸e*LK(t~t1~t2)H
"e*LEt#Pt
0
dt1e*LEt1id¸e*LE(t~t1)#P
t
0
dt1P
t~t1
0
dt2e*LEt1id¸e*LEt2id¸e*LE(t~t1~t2)#2, (7.6)
where id¸,i¸K!i¸
E.
Without loss of generality, consider the difference between the steady-state averages of anarbitrary extensive phase function A(C). We assume that the two systems (i.e. the K and E thermo-statted systems) are at the same nonequilibrium state point. To ensure this we assume the twosystems have the same values for the number of molecules, N, the volume, », the external field, F
%,
and the same steady state average value of the phase space compression factor [8], K,
ddt
ln f (C, t),!K(C(t)) . (7.7)
For E, K, NHK, NHE thermostatted systems this implies that the average values of the thermo-statting multipliers are identical since for these systems K(tı)"!3Na(tı). So in particular for E,K thermostatted systems we have
limt?=
Sa(tK)T!Sa(t
E)T"0 . (7.8)
54 S.S. Sarman et al. / Physics Reports 305 (1998) 1—92

The difference in the nonlinear thermostatted response of a canonical ensemble average of anarbitrary local, extensive phase function A(C), is therefore
SA(tK)T!SA(t
E)T"PdC f
#(C)(e*LKt!e*LEt)A"PdC f
#(C)GP
t
0
dt1e*LEt1id¸e*LE(t~t1)
#Pt
0
dt1P
t~t1
0
dt2e*LEt1id¸e*LEt2id¸e*LE(t~t1~t2)#2HA . (7.9)
(A local, extensive phase function, A(C), can by definition be written as a sum, +Ni/1
Ai(C) and
SAiA
jTP0 and Dq
i!q
jDPR [8,88,89].)
It is convenient to define a new phase function B@(t) in the following manner:
B@(t),+ pi·
p
i
B(t) . (7.10)
From this definition it is clear [8], that if B is extensive, so too is B@. From Eq. (7.6)
id¸e*LE(t~s)A"!daN+i/1
pi·
p
i
A(tE!s
E),!daA@(t
E!s
E) , (7.11)
where da"aK!a
E.
Substituting this result into Eq. (7.9), we see that
SA(tK)T!SA(t
E)T"PdCf
#(C)G!P
t
0
dt1e*LEt1daA@(t!t
1)
#Pt
0
dt1P
t~t1
0
dt2e*LEt1da da@(t
E2)A@@(t
E!t
E1)!2H , (7.12)
where A@@ is defined recursively in terms of da and A@,
da@(sE2
)A@@(tE!t
E1),+ p
i·
p
i
da(tE2
)A@(tE!t
E1) . (7.13)
From Eqs. (7.13) and (7.12) we see that
SA(tK)T!SA(t
E)T"!P
t
0
dt1Sda(t
E1)A@(t
E)T
#Pt
0
dt1P
t~t1
0
dt2Sda(t
E1)da@(t
E2#t
E1)A@@(t
E)T#2 . (7.14)
Now there are two very important properties of the primed variables. Firstly, as alreadymentioned, if A is extensive so too are A@, A@@,2. Likewise a, a@, a@@ are local, intensive variables.Secondly, in the long time limit A@,A@@ and da,da@, da@@ have zero means. This can be proved quiteeasily.
S.S. Sarman et al. / Physics Reports 305 (1998) 1—92 55

From definition (7.10) we see that
SB@(tı)T"PdCf#(C)+ p
i·
p
i
B(tı)"!PdCB(tı)+
pi
· ( pif#(C))
"!3NSB(tı)T!PdCB(t)+pi·
p
i
f#(C)"!3NSB(tı)T
#
BmPdCB(t)+p2
if#(C)"2bSB(tı)[K(0)!SK(0)T]T . (7.15)
Assuming that the variable B is not a trivial function of either of the constants of motion, the kineticor the internal energy, and assuming that the system is mixing,3
limt?=
SB@(tı)T"0, ı"E,K . (7.16)
Similarly one can show that
limt1,t2?=
Sda@(tı1)A@@(tı2)T"0 . (7.17)
Returning to Eq. (7.14) we see that in the long time limit, the difference in averages ofA computed under E, K thermostats can be expressed as time integrals of correlation functions ofzero mean variables. Further, since A@,A@@,2 are extensive while da, da@,2 are intensive, it followsthat in the long time limit the difference SA(t
K)T!SA(t
E)T is intensive and therefore becomes
insignificant compared to SA(tE)T in the large system limit. (In deriving this result we use the fact
that the average of products of zero mean, local, extensive variables is itself extensive — see p. 4071of Ref. [88].)
7.1.2.2. Steady-state correlation functions. We now consider the thermostat dependence of steady-state time correlation functions, lim
t?=:dCf
#A(t)B(t#s), of extensive phase functions A, B. With-
out loss of generality, we assume that under the K-thermostat the steady-state means of both A andB are zero. Using the Dyson equation we see that
SA(tK)B(t
K#q
K)T"PdCf
#[e*LKtA][e*LK(t`q)B]
(7.18)
3Under this definition of mixing, lim(t?=)
SA(t)B(0)T"0 and lim(t?=)
:t0dsSA(s)B(0)T is finite, for all A, B that are not
trivially related to constants of the motion.
56 S.S. Sarman et al. / Physics Reports 305 (1998) 1—92

where the parentheses above the Dyson expanded propagators denote the total time eachexpansion works through. The operators within each of the two expansions t and t#q onlyoperate on the phase functions A and B, respectively. Writing out the first few terms of the Dysonexpansion we see
SA(tK)B(t
K#q
K)T"SA(t
E)B(t
E#q
E)T
(7.19)
We note that from the results of Section 7.1.2.1, since A,B have zero steady state means under theK-thermostat they also must be zero mean variables under the E-thermostat.
We now consider the second term on the right-hand side of Eq. (7.19),
"Pt`q
0
dsPdCf#B(t
E#q
E)e*LEsid¸e*LE(t~s)A
"!Pt`q
0
dsPdC f#B(t
E#q
E)da(s
E)A@(t
E)"O(1) as t
EPR . (7.20)
In deriving the last equality we have again assumed the system is mixing2 and that there is no trivialrelation between the variables B, da,A@ and either of the constants of the motion. Clearly the thirdterm on the right-hand side of Eq. (7.19) is also O(1).
The fourth term on the right-hand side of Eq. (7.19) can be expanded as
"!Pt`q
0
dsPdCf#B(t
E#q
E)da(s
E)A@(t
E)"O(1) as t
EPR
"Pt
0
ds1P
t`q
0
ds2PdC f
#da(s
1E)A@(t
E)da(s
2E)B@(t
E#q
E)
"Pt
0
ds1P
t`q
0
ds2Sda(s
1E)da(s
2E)A@(t
E)B@(t
E#q
E)T"O(1/N) as t
E,qEPR . (7.21)
S.S. Sarman et al. / Physics Reports 305 (1998) 1—92 57

It is clear that the same methods can be used to conclude that higher order terms in Eq. (7.19) are atleast of O(1) and can therefore be ignored in the large system limit. This completes our proof of theequivalence of steady state time correlation functions computed under Gaussian isoenergetic andGaussian isothermal thermostats.
It is straightforward to extend the proof in Section 7.1.2.1 to encompass the equivalence ofNose—Hoover (NHK, NHE) averages as well (see Ref. [90]).
7.1.3. Numerical calculationsThe results reported here are for a WCA fluid undergoing planar Couette flow. The results are
given in reduced units. The length unit is p, the energy unit is e and the time unit is t0"p(m/e)1@2,
where m is the mass of the molecule. The equations of motion have been solved by a fourth orderGear Predictor—Corrector method with a timestep of 0.002t
0.
We chose a state point with a reduced density np3"0.8442, a reduced temperaturekB¹/e"0.722 and a reduced strain rate ct
0"1.0. We performed two 20 000 t
0— long simulations
for a 108-molecule system and four 1000t0—long simulations for a 2048-molecule system.
In the small system we compared the pressure tensor, P, the temperature, ¹, the internal energy,H
0, the a’s and the self-diffusion tensor, D, for a Gaussian isokinetic system and a Gaussian
isoenergetic system. In the isoenergetic simulation the internal energy was set equal to the averageinternal energy from the isokinetic simulation.
From the theory presented in Section 7.1.2.1, the differences in the averages of the phasefunctions for the pressure, energy and the a’s should all be at least of order 1/N. The self-diffusiontensor for a shearing fluid has recently been shown [25,42,91] to be the time integral of steady-statetime cross-correlation functions of the various Cartesian components of the peculiar velocity (p
i/m
in (6.1.34)). Thus, a comparison of the diffusion tensors computed under different thermostats teststhe predictions of the theory given in Section 7.1.2.2.
In Table 1 we compare the various properties of the isokinetic and the isothermal 108-moleculesystems. The normal stress differences g
0and g
~are defined as ![P
zz!(P
xx#P
yy)/2]/2c and
Table 1Comparison of thermostat for 108 WCA molecules (ct
0"1, k
B¹/e+0.722, np3"0.8442)
Property Gaussian const H0
Gaussian const ¹
a 0.998$0.002 0.989$0.002Pxy
1.785$0.003 1.786$0.003Pxx
7.181$0.004 7.182$0.005Pyy
7.205$0.004 7.207$0.002Pzz
6.833$0.001 6.832$0.005D
xx0.0625$0.0003 0.0627$0.0003
Dyy
0.0581$0.0005 0.0582$0.0004D
zz0.0524$0.0002 0.0525$0.0002
g~
0.012$0.003 0.012$0.002g0
0.180$0.001 0.180$0.001
58 S.S. Sarman et al. / Physics Reports 305 (1998) 1—92

![Pxx!P
yy]/2c. All the properties except the a’s agree very well within estimated statistical
uncertainties. For g~
this is not a very convincing test since the error bars are &25%. Howeverthe larger relative bars for g
~are simply due to the rather small difference between P
xxand P
yy. For
the other properties the relative errors are about 0.5% or less. We omitted the off diagonal elementsof the self-diffusion tensor because they are zero within error bars of 0.001. Although the a’s do notagree within the estimated statistical uncertainties, they do agree to O(1/N)"0.01 as predicted bytheory.
The velocity autocorrelation functions whose Cartesian elements form the self-diffusion tensor,are thermostat independent to within absolute error bars of $0.003. In Fig. 28 we show a typicalcomparison of steady state velocity autocorrelation functions.
We performed four simulations for a 2048-molecule system to compare all four differentthermostats. The results are shown in Table 2. Here, all the properties also agree within an error of$0.5% including the a’s. Note also that there are small but statistically significant differencesbetween the properties of the large system and the small system. The magnitude of all the elementsof the pressure tensor and g
~increase slightly. The value of g
0changes by some 5%. The
N-dependence of g0has been noted before [92]. In spite of this N-dependence, for a given N there is
good agreement between estimates obtained for this sensitive property using each of the differentthermostats.
We have shown that for mixing systems where the variables A,A@,2, B,B@,2, a, a@,2 have notrivial relations to the constants of the motion, steady state time averages SAT,SBT, and steadystate time correlation functions SA(0)B(t)T, formed under E, K, NHK, NHE thermostats areidentical in the large system limit. This is true even far into the nonlinear regime as long as thesystem retains the mixing property as required in Eq. (7.15).
The theory and the simulation results presented here provide good support for the predictionthat at the same state point, Gaussian ergostats, Gaussian thermostats and their Nose—Hooveranalogs produce the same steady state averages and time correlation functions. One should not
Fig. 28. In this graph we show the steady-state peculiar velocity autocorrelation function Cxx
(ti)"
Spx(ti)p
x(0)T/m2, ı"K, computed for the 108 particle WCA system described in the text. The squares show, after
expansion by a factor of 100, the differences Cxx
(tE)!C
xx(tK), between this correlation function and that computed at the
corresponding times under the E-thermostat. The differences between these results are of the same size as the estimatedstatistical uncertainties in the correlation functions themselves, $0.001.
S.S. Sarman et al. / Physics Reports 305 (1998) 1—92 59

Table 2Comparison of thermostat for 2048 WCA molecules (ct
0"1, k
B¹/e+0.722, np3"0.8442)
Property Gaussian const ¹ NH const ¹ Gaussian const H0
NH const H0
a 0.990$0.001 0.990$0.002 0.992$0.001 0.987$0.001Pxy
1.808$0.001 1.808$0.003 1.811$0.001 1.805$0.002Pxx
7.226$0.002 7.226$0.004 7.232$0.003 7.226$0.003Pyy
7.269$0.003 7.272$0.008 7.274$0.001 7.270$0.002Pzz
6.912$0.002 6.910$0.003 6.912$0.003 6.913$0.001g~
0.021$0.002 0.023$0.005 0.021$0.002 0.022$0.002g0
0.168$0.002 0.170$0.002 0.171$0.002 0.168$0.001
Note: For Nose—Hoover thermostats, q"3.3 in the isothermal case and 2.0 in the iso-energetic case.
think that these results imply that the thermostat independence of both steady state averages andtime correlation functions is observed for all thermostats. We recently introduced k-thermostats[93] in which the thermostatted equation of motion for the peculiar momenta reads
pR di"Fdi#DiF%d!ak
pdiDpdiD
DpdiDk, d"x, y, z . (7.22)
Both steady-state averages and time-correlation functions differ under k and K-thermostats. Thishas recently been observed in computer simulations [93].
7.2. Equivalence of constant field (¹hevenin) and constant current (Norton) ensembles
In linear irreversible thermodynamics it is assumed [13] that nonequilibrium systems can bedescribed by taking either the thermodynamic force or the thermodynamic flux as an independentstate defining variable. In electrical circuit theory it is assumed that any circuit can be representedby either a Norton (constant current) or a Thevenin (constant voltage) equivalent circuit [94] andone refers interchangeably to a circuit’s resistance or conductance. The assumed equivalence ofNorton and Thevenin equivalent circuits, implies that the resistance of the Thevenin circuit must bethe reciprocal of the conductance of a Norton-equivalent circuit [94].
Assuming the Norton—Thevenin equivalence, we have derived microscopic Green—Kubo expres-sions for the electrical conductivity of a Norton circuit and compared this numerically with the wellknown Green—Kubo relation for the resistance of a Thevenin circuit [95]. We verified by computersimulation that the frequency-dependent conductivity computed either by monitoring currentfluctuations in a Thevenin circuit at equilibrium or voltage fluctuations in an equivalent equilib-rium Norton circuit, were identical within statistical errors for all frequencies [95]. Later wederived analogous formulae and carried out corresponding calculations for shear flow — either atconstant strain rate (Thevenin) or at constant stress (Norton) [96].
Even earlier we had noticed that when nonequilibrium molecular dynamics calculations arecarried out far outside the linear regime, averages computed when the thermodynamic forces areheld constant agree with their Norton equivalents (i.e. averages computed with the appropriatethermodynamic fluxes held fixed) [97].
60 S.S. Sarman et al. / Physics Reports 305 (1998) 1—92

We now sketch a quite general statistical mechanical proof of the equivalence of Norton andThevenin ensembles [98]. This equivalence is shown to hold beyond the linear response regimewhere Green—Kubo relations are valid. The main requirements for the equivalence are that thesystem should be large and, it should exhibit mixing [8].
We now consider two related circumstances: the Thevenin case where the external field, F%, is
a constant, namely FT, and the Norton case where F
%is obtained from an integral feedback
mechanism [8] designed to keep the average value of the dissipative flux constant, at the value J0:
(d/dt)FN"!(J(C)!J
0)/Q , (7.23)
where C"q1, q
2,2, q
N, p
1, p
2,2, p
N. This particular feedback mechanism is often referred to as
Nose—Hoover feedback [8,99]. We denote the phase vector representing the microstate of theNorton system as C*"(C,F
N)"(q
1, q
2,2, q
N, p
1, p
2,2, p
N, F
N).
Without loss of generality we assume that the value chosen for J0
is such that in the nonequilib-rium steady state (i.e. tPR),
FT"lim
t?=
SFN(C*(t
N))T
J0, (7.24)
where S2TJ0
denotes a Norton ensemble time average in which the dissipative flux is fixed at thevalue J
0. We also assume that both systems have the same number of molecules N, the same
volume », and the same initial equilibrium temperature ¹. For future reference we also note thatlike F
T, F
N(C*) is intensive.
We assume that in the absence of thermostatting the equations of motion satisfy the conditionknown as the adiabatic incompressibility of phase space (AIC),
(/C*) ·CQ *!$"0 . (7.25)
The phase Liouvillean, i¸ı(C), in the two ensembles, ı"¹, N, is defined by the equation ofmotion,
(d/dt)A(C)Dı"i¸ı(C)A(C) , (7.26)
of an arbitrary phase function A(C). Using Eq. (7.23) i¸ı can be written as
i¸ı"N+j/1CqR ıj ·
q
j
#pR ıj ·
pjD"Fı · il#i¸
0. (7.27)
In this equation,
i¸0,
N+j/1
pj
m·
q
j
#(Fj!ap
j) ·
p
j
(7.28)
and
il,N+j/1
Cj·
q
j
#Dj·
p
j
. (7.29)
S.S. Sarman et al. / Physics Reports 305 (1998) 1—92 61

It is convenient to make the following definition for an arbitrary extensive phase functionA(t
T)"A(C(t
T)), evolving under Thevenin dynamics:
A@(tT),
N+j/1CCj
·
qj
#Dj·
p
jDA(t
T)"ilA(t
T) . (7.30)
From this definition it is easy to show that in the steady state, at long times, the Thevenin averageof A@ ) dF is zero, where
dF,FN(C)!F
T. (7.31)
If the initial distribution function is canonical, f (C*)"d(FN)exp[!bH
0(C)]/
:dFN:dCexp[!bH
0(C)], then from Eq. (7.30) we see that
SA@(tT)T"PdC f (C)ilA(t
T)"!PdCA(t
T)ilsf (C)"!PdCA(t
T)
N+j/1CCj
·
qj
#Dj·
p
jD f (C)
!PdC f (C)A(tT)
N+j/1C
q
j
· C+#
p
j
· DjD . (7.32)
The superscript - is to denote the Hermitian adjoint.Using the AIC condition the last term in Eq. (7.32) vanishes. Now if we use the fact that the
initial function is canonical, we find
SA@(tT)T"!PdC*A(t
T)
N+j/1CCj
·
qj
#Dj·
p
jD f (C*)
"!b»PdC* f (C*)A(tT)J(C)"!b»SA(t
T)J(0)TP0 as tPR , (7.33)
where we have assumed that the variable A is unrelated to any of the constants of the motion, andthe systems is mixing. We also use the fact that since at t"0, the system is at equilibrium,SJ(0)T"0.
Now we consider the difference of the average of an arbitrary extensive phase variable evaluatedunder the Norton and the Thevenin ensembles. Using a Dyson decomposition of the Nortonpropagator in terms of its Thevenin counterpart (see pp. 61 and 117 of [8]) we find that
SA(tN)T!SA(t
T)T"PdC* f (C*)P
t
0
ds e*LTS[id¸#MQFN
· /FN]e*LT(t~s)A(C)#2 , (7.34)
where
id¸"i¸N!i¸
T"dF · il
62 S.S. Sarman et al. / Physics Reports 305 (1998) 1—92

and
dF,FN(C)!F
T.
Now neither the phase function A(C) nor the Thevenin Liouvillean i¸T(C) are functions of the
Norton field, FN. Thus, the term involving /F
Nmay be omitted from Eq. (7.34) and we obtain,
to leading order,
SA(tN)T!SA(t
T)T"PdC* f (C*)P
t
0
ds e*LTSdF · ile*LT(t~s)A
"PdC* f (C*)Pt
0
ds dF(sT) · e*LTSA@(t
T!s
T)
"PdC* f (C*)Pt
0
ds dF(sT) · A@(t
T)
"Pt
0
dsSdF(sT) · A@(t
T)T"O(1) as tPR . (7.35)
In deriving this last result we have used the fact that limt?=
SdF(tT)T"0, that the external forces
FN,T
are intensive and that the average of a product of zero-mean extensive variables is extensive.This completes our demonstration that differences in averages of extensive quantities computed
at equivalent state points, under either Thevenin or Norton dynamics differ at most by terms ofO(1).
7.3. Lyapunov exponents and transport coefficients
Lyapunov exponents describe the rate at which nearby phase-space trajectories separate. Untilrecently mathematicians and mathematical physicists were the main people interested in Lyapunovexponents. However, Lyapunov spectra have been found to possess properties that are importantfor statistical mechanics (see [100] for a more extensive discussion of these results). In a dynamicalsystem one can define one Lyapunov exponent per degree of freedom. The set of Lyapunovexponents, Mj
i; i"1, 3N, j
i'j
jif i(jN, can be used to calculate the dimension of phase space
accessible to a nonequilibrium steady state. The Kaplan—Yorke dimension of the accessible phasespace, DKY"nKY#+nKY
i/1ji/Dj
nKY`1D, where nKY is the largest integer for which +nKY
i/1ji'0. For
second law satisfying steady states this dimension is always less than the ostensible dimension ofphase space, 3N.
The most important results that have been obtained thus far show that there are relationshipsbetween transport coefficients and the Lyapunov exponents. In 1990 Gaspard and Nicolis [101]derived a relation between the self-diffusion coefficient and certain sums of Lyapunov exponentscalculated for a two dimensional array of scatterers. This relation is not easy to apply in practicesince the diffusion coefficient is calculated in a limit where the radius of the region containing thescatterers goes to infinity (RPR). In this limit, the difference of the sums of Lyapunov exponentsvanishes as R~2. In spite of this practical difficulty, the Gaspard—Nicolis result shows that linear
S.S. Sarman et al. / Physics Reports 305 (1998) 1—92 63

transport coefficients can be obtained from a knowledge of Lyapunov spectra. The Gaspard—Nicolis relation has recently been generalised to other linear Navier—Stokes transport coefficientsby Dorfman and Gaspard [102,103].
For thermostatted nonequilibrium steady states, one can show that the sum of all the Lyapunovexponents is equal to the phase space compression factor [8]. The sum is consequently negative, ina stable (second-law satisfying) nonequilibrium steady state. In the linear regime close to equilib-rium, the negative sum of the Lyapunov exponents is precisely the entropy production divided byBoltzmann’s constant, SQ "!k
B+3N
i/1ji. Outside the linear regime the negative sum of Lyapunov
exponents can thus be regarded as a generalised entropy production. Since the generalised entropyproduction is proportional to the product of the thermodynamic fluxes and forces,SQ "!»J(F
%) · F
%/¹ and a nonlinear transport coefficient, ¸(F
%) is defined by a constitutive
relation J(F%)"!¸(F
%)F
%, one can compute the transport coefficient from the sum of
Lyapunov exponents. For example, the nonlinear strain rate, c, dependent shear viscosity, g(c), isg(c)"!k
B¹/»c2+3N
i/1ji.
Thus, one can, at least in theory, calculate transport coefficients by evaluating all the Lyapunovexponents. In 1990, Evans, Cohen and Morriss showed for systems whose adiabatic (unthermostat-ted) equations of motion are deriveable from a Hamiltonian (or are symplectic), if the momentumoccurring in those equations is peculiar and if these systems are thermostatted in the usual waysused in nonequilibrium molecular dynamics, then the Lyapunov exponents occur on conjugatepairs (j
1, j
3N), (j
2, j
3N~1),2 (i.e. the largest with the smallest, the second largest with the second
smallest etc), whose individual sums are equal to the time average value of the thermostatmultiplier. For large systems this result is independent of whether a Gaussian isokinetic,Nose—Hoover or Gaussian isoenergetic thermostat is employed. This theorem is known as theconjugate pairing rule. This rule makes it possible to evaluate the sum of all the Lyapunovexponents by just calculating one pair of exponents, preferably the smallest and the largest one.
For systems far from equilibrium the difference in the maximal Lyapunov exponents is relativelyeasy to compute and the method presents a computationally viable route to transport coefficients.Close to equilibrium, the difference in the maximal Lyapunov exponents vanishes like F2
%. Thus,
this method becomes very inefficient compared to either traditional Nonequilibrium MolecularDynamics (where the flux vanishes linearly with F
%) or with Green—Kubo where the expression for
the transport coefficient is independent of F%.
The Lyapunov exponents can be evaluated by the following algorithm. The equations of motionof an NEMD algorithm can formally be written as
CQ "G(C, t) , (7.36)
where C is the phase-space trajectory. The SLLOD and DOLLS tensor equations of motion havean explicit time dependence through the Lee—Edwards’ sliding brick periodic boundary conditions.They are said to be nonautonomous. The equations of motion of most other algorithms have noexplicit time dependence. They are autonomous.
We can define displacement vectors, di"C
i!C
0, between a reference trajectory, C
0, and an
adjacent trajectory, Ci. In the limit when the norm of the displacement vector goes to zero, the
adjacent trajectory will be referred to as a tangent trajectory and the displacement vector will bereferred to as a tangent vector. The equation of motion for the first tangent vector is
dQ1"G/CDC/C
0· d
1,T · d
1, (7.37)
64 S.S. Sarman et al. / Physics Reports 305 (1998) 1—92

where T is the stability matrix of the equations of motion. The largest Lyapunov exponent can bedefined as
j.!9
"j1"lim
t?=
12t
lnd21(t)
d21(0)
, (7.38)
The ith exponent, i"2, 3,2, 6N, can be evaluated by following a tangent vector di(t), that is
constrained to be orthogonal to the tangent vectors dj(t), j"1, 2, 3,2, i!1. The equation of
motion for the ith tangent vector becomes
dQi"T · d
i!
i~1+j/1
fijdj, (7.39)
where the multipliers fij
are determined by differentiating the orthogonality constraintdi(t) ) d
j(t)"0, which gives
dQi· d
j#d
i· dQ
j"0 (7.40)
and
fij"
di· T · d
j#d
j· T · d
id2i
. (7.41)
The ith Lyapunov exponent can then be obtained from the limit
ji"lim
t?=
12t
lnd2i(t)
d2i(0)
. (7.42)
This method is related to the Benettin et al. algorithm [104] with their iterative Gram—Schmidtorthogonalisation procedure replaced by a continuous constraint multiplier orthogonalisation.From a numerical point of view, their method is not very convenient to use. The tangent vectorsgrow or shrink exponentially with time, so periodic rescalings are necessary to keep the lengthswithin appropriate limits. Therefore it is more convenient to use a method originally due toGoldhirsch et al. [105] and Hoover and Posch [106], where the norms of the tangent vectors areconstrained to be constant. There are different ways of doing this. We have chosen the followingmethod:
dQ #i"T · d#
i!
i~1+j/1
fijd#j!f
iid#i
(7.43)
where
fii"
d#i· T · d#
idc2i
(7.44)
and d#idenotes the ith tangent vector, whose norm is constrained to be constant. It is possible to
prove that the ith Lyapunov exponent, jiis equal to the time average of f
ii.
S.S. Sarman et al. / Physics Reports 305 (1998) 1—92 65

When Lyapunov exponents are depicted graphically, it is convenient to show the conjugate pairsare displayed as a function of the pair index. The conjugate pair consisting of the smallest positiveexponent and the largest negative exponent is given index one, the pair consisting of the secondsmallest positive exponent and second largest negative exponent is given index two, and so on tothe pair consisting of the largest positive exponent and smallest negative exponent. In Fig. 29 wedisplay the Lyapunov spectrum of a system consisting of two dimensional soft disks at equilibrium.The spectrum is symmetric about zero. In Fig. 30 we display the same system subject to a strainrate, induced by applying the SLLOD equations of motion. The spectrum is no longer symmetric.The negative exponents have become more negative. The shift of the negative exponent increaseswith the pair index. The largest positive exponent is barely effected at all. The other positiveexponents are shifted downward, the shift increases as the pair index decreases, contrary to the caseof the negative exponents. Note that the sum of the conjugate pairs is the same. As yet there is noproof that these thermostatted SLLOD equations satisfy the conjugate pairing rule. In Fig. 31 wedepict the spectrum generated when the heat flow algorithm [8] is applied. The general behaviourof the spectrum is the same as in the shear flow case. Note however that the sum of the conjugatepairs is not constant. The reason for this is that the stability matrix generated by the heat flowalgorithm does not satisfy the symmetry conditions necessary for the conjugate pairing rule, i.e. theeigenvalues do not occur in pairs of the same magnitude but opposite sign. Finally, in Fig. 32 wedisplay the Lyapunov spectrum generated by the colour conductivity algorithm. It can be derivedfrom a Hamiltonian, so it satisfies the conjugate pairing rule, which the calculation verifies. In the
Fig. 29. Conjugate pairs of Lyapunov exponents are denoted by open circles and the sums of the conjugate pairs aredenoted by filled symbols. The pair index is largest for the maximal Lyapunov exponents and decrements by 1 for eachsubsequent conjugate pair. The unpaired exponent is assigned a pair index of 1. The system is at equilibrium. The systemwas a two dimensional WCA fluid consisting of eight particles. The reduced density, np2, was equal to 0.40 and thereduced temperature k
B¹/e was equal to 1.00.
Fig. 30. Same as Fig. 29 except that the system is studied under SLLOD dynamics with a reduced shear rate, cq"1.0.The Lyapunov exponents and the conjugate sums are given in units of q1.
66 S.S. Sarman et al. / Physics Reports 305 (1998) 1—92

Fig. 31. The same as Fig. 29 but the Evans thermal conductivity algorithm with a heat field of 0.5 has been appliedinstead of the SLLOD equations. The conjugate pairing rule is not satisfied in this case, so no straight line can be drawnthrough the sums of the conjugate pairs. Note that away from equilibrium, one of the Lyapunov exponents remains atzero.
Fig. 32. The same as Fig. 29 but the nonequilibrium system has been created by using the colour field equations ofmotion with a colour field of 1.5.
colour conductivity spectrum and the heat conductivity spectrum the odd exponent is zerowhereas it is finite in the SLLOD spectrum. The reason for this is that the equations ofmotion of the former two algorithms are autonomous but the SLLOD equations arenonautonomous. One can prove that if the equations of motion are autonomous, at least oneLyapunov exponent is zero [107].
7.4. Probability of second law violations in steady states away from equilibrium
In this section we use an established result from dynamical systems theory, to derive anexpression for the probability of violating the second law of thermodynamics for finite times innonequilibrium steady states [108,109].
The normalised natural invariant measure, ki, of a multi-dimensional dynamical system can be
written as
ki" lim
q?=
K~1i
+jK~1
j
" limq?=
exp [!+n@jni;0
jniq]
+jexp [!+
n@jnj;0jnjq]
, (7.45)
where the index i labels trajectory segments, Ci(t), in phase space which each have length q,
04t4q. Kiis the Lyapunov number and Mj
niN the set of Lyapunov exponents, for segment, i. The
exponents are ordered: j1i'j
2i'2. The sums appearing in Eq. (7.45) are carried out only over
the positive Lyapunov exponents for each segment, i. Eq. (7.45) is a known result. See, for example,Ref. [110] and references cited therein, Refs. [111,112].
S.S. Sarman et al. / Physics Reports 305 (1998) 1—92 67

In a steady state those phase-space motions with negative Lyapunov exponents will eventuallyshrink into insignificance. On a computer they eventually shrink to lengths that cannot be resolvedwith the finite word length of the computer, while in experiment these lengths eventually shrink somuch that they become insignificant compared to inevitable externally induced noise. If one nowimagines trajectory segments, j, of duration, q. These segments see nearby segments expanding intoan ever growing volume, »
j(t)"»
j(0) exp [Rj
njt]. The fraction of initially nearby segments that
remain nearby after a time t is &exp[!Rjnjt]. Therefore, segments will asymptotically be
populated in proportion to the negative exponential of the sum of positive exponents multiplied bythe duration of the segments.
From this formula steady state averages can be computed. If
SATqi"1q P
q
0
dsA(Ci(s)) , (7.46)
then the average of the phase function A, taken over all segments of length q is
limq?=
SATq" limq?=
+iSATqiK~1
i+
jK~1
j
. (7.47)
We now consider a nonequilibrium steady state driven by a strain rate, ux/y"c, with
a dissipative flux [8], Pxy
, defined by the adiabatic (i.e. unthermostatted) time derivative of theinternal energy phase function, H
0(C), HQ !$
0,!P
xyc», where » is the system volume. The SLLOD
equations of motion give an exact description [8] of the adiabatic dynamics of a system subject toshear.
We now prove that for every i-segment with q-averaged current SPxy
Tq,i, there exists a conjugatesegment which we will call the i(K) segment for which SP
xyTq,i(K)
"!SPxy
Tq,i. Suppose that allsegments were generated from an equilibrium distribution of phases, C, at t"!R. Assume thatfor all subsequent time, the time evolution is given by Eq. (5.7) and that by t"0 the systems haverelaxed to a shearing steady state.
We denote a K-mapping of a phase, C, by MK(x, y, z, px, p
y, p
z, c)"(x,!y, z,!p
x, p
y,!p
z, c)
[8]. It is straightforward to show that the Liouville operator for the thermostatted SLLOD system(3.5), i¸(C, c)"+qR
i· /q
i#pR
i· /p
ihas the property that under a K-map, MK i¸(C, c)"
!i¸(C, c), from which it follows that [8]
Pxy
(!t,C, c)"exp[!i¸(C, c)t]Pxy
(C)"!Pxy
(t,C(K), c) . (7.48)
Thus, a trajectory starting from an initial phase, C, will for all time generate segments with equaland opposite tau-averaged shear stresses to the corresponding segments of a trajectory which startsfrom, MKC"C(K).
Now it is trivial to show [8] that MK is the product of the time-reversal mapping,MT : MT(q, p, c)"(q,!p,!c), and the y-reflection mapping, MY : MY(x, y, z, p
x, p
y, p
z, c)"
(x,!y, z, px,!p
y, p
z,!c). Since the Lyapunov exponents are invariant under MY, but invert
under MT it is easy to show that jn,i(K)
"!j2g~n`1,i
. (For N-molecule systems in three Cartesiandimensions g"3N while for two dimensions, g"2N.)
68 S.S. Sarman et al. / Physics Reports 305 (1998) 1—92
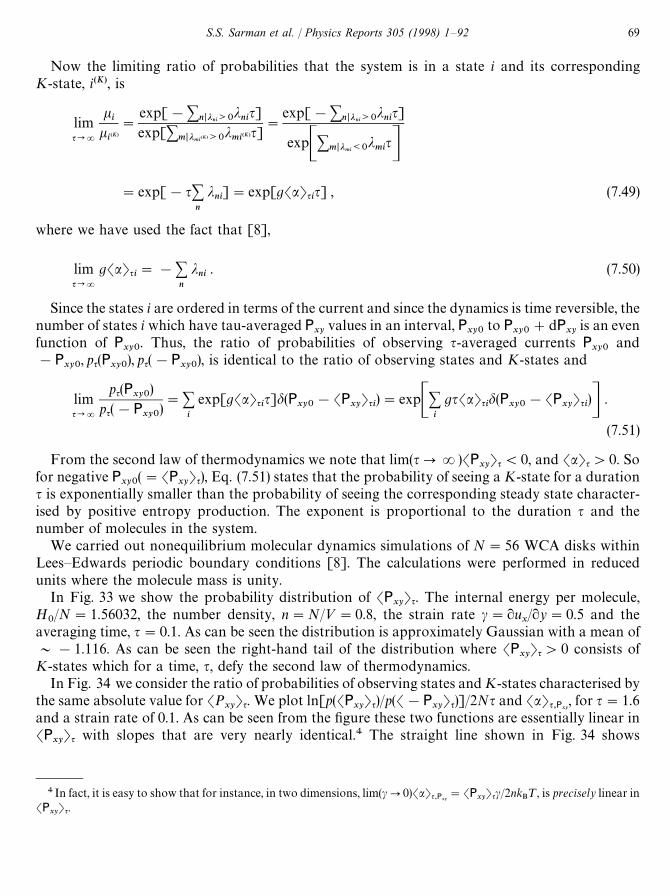
Now the limiting ratio of probabilities that the system is in a state i and its correspondingK-state, i(K), is
limq?=
ki
ki(K)
"
exp[!+n@jni;0
jniq]
exp[+m@jmi(K);0
jmi(K)q]
"
exp[!+n@jni;0
jniq]
expC+m@jmi:0jmi
qD"exp[!q+
n
jni]"exp[gSaTqiq] , (7.49)
where we have used the fact that [8],
limq?=
gSaTqi"!+n
jni
. (7.50)
Since the states i are ordered in terms of the current and since the dynamics is time reversible, thenumber of states i which have tau-averaged P
xyvalues in an interval, P
xy0to P
xy0#dP
xyis an even
function of Pxy0
. Thus, the ratio of probabilities of observing q-averaged currents Pxy0
and!P
xy0, pq(Pxy0
), pq(!Pxy0
), is identical to the ratio of observing states and K-states and
limq?=
pq(Pxy0)
pq(!Pxy0
)"+
i
exp[gSaTqiq]d(Pxy0
!SPxy
Tqi)"expC+i
gqSaTqid(Pxy0
!SPxy
Tqi)D .
(7.51)
From the second law of thermodynamics we note that lim(qPR)SPxy
Tq(0, and SaTq'0. Sofor negative P
xy0("SP
xyTq), Eq. (7.51) states that the probability of seeing a K-state for a duration
q is exponentially smaller than the probability of seeing the corresponding steady state character-ised by positive entropy production. The exponent is proportional to the duration q and thenumber of molecules in the system.
We carried out nonequilibrium molecular dynamics simulations of N"56 WCA disks withinLees—Edwards periodic boundary conditions [8]. The calculations were performed in reducedunits where the molecule mass is unity.
In Fig. 33 we show the probability distribution of SPxy
Tq. The internal energy per molecule,H
0/N"1.56032, the number density, n"N/»"0.8, the strain rate c"u
x/y"0.5 and the
averaging time, q"0.1. As can be seen the distribution is approximately Gaussian with a mean of&!1.116. As can be seen the right-hand tail of the distribution where SP
xyTq'0 consists of
K-states which for a time, q, defy the second law of thermodynamics.In Fig. 34 we consider the ratio of probabilities of observing states and K-states characterised by
the same absolute value for SPxy
Tq. We plot ln[p(SPxy
Tq)/p(S!Pxy
Tq)]/2Nq and SaTq,Pxy, for q"1.6
and a strain rate of 0.1. As can be seen from the figure these two functions are essentially linear inSP
xyTq with slopes that are very nearly identical.4 The straight line shown in Fig. 34 shows
4 In fact, it is easy to show that for instance, in two dimensions, lim(cP0)SaTq,Pxy"SP
xyTqc/2nk
B¹, is precisely linear in
SPxy
Tq.
S.S. Sarman et al. / Physics Reports 305 (1998) 1—92 69

Fig. 33. For 56 WCA disks at H0/N"1.56032, np2"N/»p2"0.8 and a shear rate, u
x/y"0.5 we show the
probability distribution of segment averages, SPxy
Tq, of the xy-element of the pressure tensor. The averaging time, q, was0.1. For those states where SP
xyTq is positive the entropy production is negative for a period of time q, defying the second
law of thermodynamics.
Fig. 34. For q"1.6 and c"0.1, we show the logarithmic probability ratio and the average of the thermostat multiplier,as a function of the segment averaged shear stress, SP
xyTq. As can be seen the two curves are essentially linear$9, with
slopes that are very nearly equal. As q increases the agreement between the two slopes becomes progressively better(Table 1). The straight line shows the results of a weighted linear least squares fit to the logarithmic probability ratio data.
a weighted least-squares fit to the logarithmic probability ratio. For smaller segment time lengths,q, both functions are still linear but the slope of the logarithmic probability ratio becomesprogressively more negative with decreasing q. From Eq. (7.50) we see that as qPR, these twoslopes should become equal.
In Fig. 35 we graph the slope, Mln[pSPxy
Tq/pS!Pxy
Tq]/2NqN/SPxy
Tq, as a function of q forc"0.1. The corresponding results for SaTq,Pxy
, are not shown here since they are independent of theaveraging time q. In determining the slopes a weighted least-squares fit of the data was used. We seethat as qPR, the slope approaches the q-independent, slope of SaTq,Pxy
as a function of SPxy
Tq,which is shown by the arrow. Thus, there is excellent agreement with the prediction of Eq. (7.50).Table 3, gives the slope data in tabular form for two strain rates.
In the zero strain rate limit the entropy production is given by ga(t). The second law ofthermodynamics states that ga(t)50, ∀t. Eq. (7.50) predicts the probability with which for finitesystems and times, the second law is violated. The predictions based on Eq. (7.50) are in excellentagreement with the results of computer simulations presented here.
It might appear that since the fundamental result of this section, Eq. (7.50), does not refer directlyto measures of chaos such a Lyapunov numbers, etc., one might be able to derive our result usingthe standard methods of nonequilibrium thermodynamics. In the linear regime close to equilib-rium, Prigogine and co-workers postulated [113] that in nonequilibrium steady states the entropyproduction ("3NSaT/k
Bas cP0) is a minimum. So far as we are aware, even close to equilibrium
this principle is insufficient to establish our result, Eq. (7.50).
70 S.S. Sarman et al. / Physics Reports 305 (1998) 1—92

Fig. 35. We show the slope obtained from the logarithms of probabilities as a function of q for "0.1. The error barswhich are shown, are for most of the data smaller than the plotting symbols. The smooth curve shows a weightedleast-squares fit to a double exponential: a#b]exp(!q/q
")#c]exp(!q/q
#). The asymptotic fitted slope, namely
a"0.0633$0.001, agrees within estimated statistical uncertainties with the slope predicted from the SaTq,Pxy data usingEq. (7.51) (and depicted by the arrow), namely 0.06259$0.00003.
Table 3
Mln[pSPxy
Tq/pS!Pxy
Tq]/2NqN/SPxy
Tqq c"0.5 c"0.1
0.05 0.9842$0.020.10 0.6169$0.004 0.147 $0.0020.20 0.4006$0.008 0.10143$0.0010.30 0.3766$0.006 0.08605$0.00050.40 0.3278$0.013 0.07968$0.00050.50 0.3125$0.0095 0.07530$0.00040.60 0.07252$0.00040.70 0.07050$0.00040.90 0.06808$0.00041.10 0.06624$0.00041.30 0.06523$0.00051.60 0.06420$0.00062.00 0.06346$0.0006
R 0.3137$0.0003! 0.06259$0.00003!
!These values were predicted from Eq. (7.50) using the slope of SaTq,Pxyas a function of SP
xyTq.
7.5. Probability of finding equilibrium states which subsequently lead to second law violatingsteady states
For reversible deterministic N-molecule thermostatted systems, we examine the question of whyit is so difficult to find initial microstates, that will at long times, under the application of anexternal dissipative field, lead to second law violating nonequilibrium steady states. In reversible
S.S. Sarman et al. / Physics Reports 305 (1998) 1—92 71

systems, for each second law satisfying trajectory there is by definition a second law violatinganti-trajectory [8]. It is also known that anti-trajectories are less stable mechanically than theirconjugate Second Law satisfying trajectories [8,108,109]. It might appear that microscopic mech-anical stability thus provides an explanation for the validity of the second law. We show howeverthat this argument is not directly relevant to the validity of the second law.
When trajectories are followed essentially exactly and mechanical instabilities have not yetbecome large enough to have observable consequences on system dynamics, second law satisfyingtrajectories are still observed overwhelmingly often. We show that the second law is observedoverwhelmingly often because at equilibrium, the measure of those initial states that subsequentlylead to second law violating trajectories vanishes exponentially with respect to the time over whichthese violations occur.
Because the initial equilibrium distribution is an even function of the molecule momenta,pi"(p
xi, p
yi, p
zi), and Hamilton’s equations of motion are reversible, the equilibrium ratio of
probabilities of observing any phase space trajectory segment, C(t : t0Pt
1),C
(*), and its time
reversed antisegment, C(t : t1Pt
0),C
(i*)is unity, k
i*/k
i"1. If we adopt the convention that away
from equilibrium a trajectory segment has a positive average entropy production over the timespan, t
1!t
0,q, then by definition the corresponding antisegment has a negative average entropy
production and is therefore forbidden macroscopically according to the second law of thermo-dynamics. In this section we explore the temporal evolution of the anisotropy in the probability ofobserving segments and their conjugate antisegments for reversible deterministic systems.
One might assume that the decrease in the ratio ki*/k
ifrom its equilibrium value of unity to its
steady state value of zero is a direct result of the fact that antisegments are less stable mechanicallythan their corresponding segments. This is certainly true. Both the largest Lyapunov exponent andthe sum of the expanding Lyapunov exponents are observed [8,108,109] to be larger for antiseg-ments than for segments. Therefore in any imperfect integration of the equations of motion, thesystem will, because of error/noise propagation, eventually follow the more stable class of trajecto-ries namely the second law satisfying segments.
However, from nonlinear response theory [8] we have the exact result for the initial transientresponse of, say, the ensemble averaged dissipative flux to a step function external field,F
%(t)"F
%H(t), that [8]
limt?0
SJ(t)T"!b»tFe ·SJ(0)J(0)T(0 , (7.52)
where b"1/kB¹, k
Bis Boltzmann’s constant and ¹ is the t"0 equilibrium absolute temperature.
This result is exact for arbitrary F%
and is derived assuming that the equations of motion aresolved exactly. The fact that the t"0` response immediately assumes a sign which is consistentwith the second law of Thermodynamics means that the relative mechanical stability of segmentsand their conjugates, plays no role here.
We saw in Section 7.4 that for every i-segment with q-averaged current SPxy
Tq,(i){,1/q:q
0Pxy
(C(i)(s)) ds, there exists a conjugate segment which we will call the i(K) segment for which
SPxy
Tq,(i(K))"!SP
xyTq,(i). The K-mapping of a phase, C, is defined by MKC"MK(x,y, z,p
x,p
y,p
z, c)"
(x,!y, z,!px, p
y,!p
z, c)"C(K) [8]. It is straightforward to show that the Liouville operator for
the system described by Eq. (5.7), i¸(C, c),+[qRi· /q
i#pR
i· /p
i] has the property that under
72 S.S. Sarman et al. / Physics Reports 305 (1998) 1—92

Fig. 36. Pxy
for trajectory segments from a simulation of 200 disks at ¹"+ p2i/2mNk
B"1.0, and np2"0.4. The
trajectory segment, C(1,3)
, was obtained from a forward time simulation. At t"2, a K-map was applied to C(2)
, to giveC(5)
. Forward and reverse time simulations from this point give the trajectory segments C(5,6)
and C(5,4)
, respectively. Ifone inverts P
xyin P
xy"0 and inverts time about t"2, one transforms the P
xy(t) values for the anti-segment C
(4,6)into
those for the conjugate segment, C(1,3)
.
a K-map, MKi¸(C, c)"i¸(C(K), c)"!i¸(C, c), from which it follows that [8]
Pxy
(!t,C, c)"exp[!i¸(C, c)t]Pxy
(C)"!Pxy
(t,C(K), c) . (7.53)
We will now describe how to construct, from an arbitrary phase space trajectory segment i, itsconjugate segment i(K). From this construction we will be able to deduce the time dependent ratio,ki(K)(q)/ki
(q) and understand why as q increases, it becomes progressively more difficult to observeantisegments rather than segments.
If we select an initial, t"0, phase, C(1)
, and we advance time from 0 to q using the Gaussianergostatted SLLOD equations of motion for planar Couette flow (5.7a), (5.7b) and (7.4) we obtainC(2)"C(q;C
(1))"exp[i¸(C
(1), c)q]C
(1). Continuing on to 2q gives C
(3)"exp[i¸(C
(2), c)q]C
(2)"
exp[i¸(C(1)
, c)2q]C(1)
.At the midpoint of the trajectory segment C
(1,3)(i.e. at t"q) we apply the K-map to C
(2)generat-
ing M(K)C(2),C
(5).5 If we now reverse time keeping the same strain rate, we obtain
C(4)"exp[!i¸(C
(5), c)q]C
(5). C
(4)is the initial t"0 phase from which a segment C
(4,6)can be
generated with C(6)"exp[i¸(C
(4), c)2q]C
(4).
We now show that segments C(1,3)
and C(6,4)
are conjugate. Using the symmetry of the equationsof motion it is trivial to show that P
xy(C
(2))"!P
xy(C
(5)), and from Eq. (7.53), that
Pxy
(t;C(1)
, 0(t(2q)"!Pxy
(2q!t;C(6)
, 0(t(2q). Thus, C(1,3)
is the conjugate segment ofC(6,4)
and SPxy
Tq,(6,4)"!SPxy
Tq,(1,3). We now h!ave an algorithm for finding initial phases whichwill subsequently generate the conjugate segments. These trajectory segments and mappings areillustrated in Fig. 36 where q"2.
5We denote the trajectory q-segment C(i)PC
(j), segment C
(i,j).
S.S. Sarman et al. / Physics Reports 305 (1998) 1—92 73

We now discuss the ratio of probabilities of finding the initial phases C(1)
, C(4)
which generatethese conjugate segments. In the microcanonical ensemble the probabilities of observing thesegments C
(1,3), C
(4,6)are of course proportional to the probabilities of observing the initial phases
which generate those segments. It is convenient to consider a small phase space volume, »(C(i)(0))
about an initial phase, C(i)(0). Because the initial phases are distributed microcanonically, the
probability of observing ensemble members inside »(C(i)(0)), is proportional to »(C
(i)(0)). From the
Liouville equation d f (C, t)/dt"3Na(C) f (C, t)#O(1) and the fact that for sufficiently small vol-umes, »(C(t))&1/f (C(t), t), we can make the following observations:
»2"»
1(q)"»
1(0) expC!P
q
0
3Na(s;C(1)
) dsD (7.54a)
and
»3"»
1(2q)"»
1(0) expC!P
2q
0
3Na(s;C(1)
) dsD . (7.54b)
Because the segment C(4,6)
is related to C(1,3)
by a K-map which is applied at t"q, and theJacobian of the K-mapping is unity, »
2"»
5, »
3"»
4and »
1(0)"»
6.
However, since »1(0) and »
4are volumes at t"0 and since the distribution of initial phases is
microcanonical, we can compute the ratio of probabilities of observing t"0 phases within »1(0)
and »4. This ratio is just the volume ratio,
k1*/k1
"»4/»
1(0)"»
1(2q)/»
1(0)"expCP
2q
0
!3Na(s;C(1)
) dsD, ∀q . (7.55)
This is the same result as that deduced from Eq. (7.49) except that the segment length is 2q ratherthan q, the ratio of probabilities is valid for arbitrary q, rather than just in the asymptotic qPR
limit as is the case in [108,109]; and the trajectory segments are transient segments extending fromequilibrium (q"0) to a time 2q. Eq. (7.49) referred only to steady-state segments which do notcontinue back to equilibrium.
Thus, if SaTq,(1,3) is positive, it becomes exponentially probable that states sampled at equilib-rium will subsequently generate segments rather than antisegments, i.e. lim(qPR) »
4/»
1(0)"0.6
The measure of antisegment generating initial phases vanishes exponentially with the duration, q,of the segment.
We decided to test Eq. (7.55) for the probability ratio of observing transient segments andantisegments by performing numerical simulations. We carried out molecular dynamics simula-tions of N"50 and N"200 disks in two Cartesian dimensions. The disks were characterised bythe WCA potential. Lees-Edwards periodic boundary conditions were used to minimise boundaryeffects [8].
In Fig. 36 we show Pxy
(t) for a single trajectory segment of length q"2.0 and its mappings. Theinitial phase was selected from an equilibrium distribution and a strain rate of unity was applied
6 If we assume SaTq,(1,3)(0, the same conclusion is obtained since »4is then the segment producing initial volume and
lim(qPR) »4/»
1(0)"R.
74 S.S. Sarman et al. / Physics Reports 305 (1998) 1—92

to the system at t"0. The simulation was carried out at a constant kinetic temperature,¹"Rp2
i/2mNk
B, of 1.0 with N"200 and n"N/»"0.4. At t"2, a K-map was applied, enabling
the construction of the antisegment, C(4,6)
, from its conjugate segment namely C(1,3)
, as describedabove.
If one looks at the results in Fig. 36 very closely one can see that if the segment C(1,3)
is timereversed and inverted in P
xy"0, then one obtains the segment C
(4,6), exactly as predicted above
from the symmetry of the equations of motion. One can also see if one inspects the results in detail,that the accuracy of the calculations is such that these calculations are time reversible over the timescale shown in the figure. Numerical integration accuracy is not an issue for the timescales shown inthis figure. Further, these timescales are much longer than the Maxwell time for this system.
Fig. 37 shows the time evolution of the phase space volume ratio »i(K)(2q)/»
i(0)"
»i(2q)/»
i(0)"exp[:2q
0!(2N!3)a(s;C
(i)) ds] for 4 different typical initial equilibrium phases, C
(i).
The data are plotted for a constant internal energy, H0/N"1.09161, system where N"200,
n"N/»"0.4, c"1.0 for q up to 0.1. The volume ratios were computed by taking the exponentialof the time integral of a for each of the trajectory segments. Note that the computed volume ratiosdo not necessarily decay to zero monotonically. For a short period of time near t"0 the volumeratio actually increased for two of the trajectory segments. Eq. (7.55) however predicts that as timeincreases it will become overwhelmingly likely that the segments satisfy the Second Law andtherefore have SaT
t,(1,3)'0 and an exponential decay of the volume ratio to zero. This is observed
for each of these segments.In Fig. 38 we directly compute the ratio of probabilities of seeing transient trajectory segments
and their conjugates. These probabilities were found by generating transient shearing trajectoriesfrom a set of phases sampled from the equilibrium microcanonical distribution. The probabilitieswere estimated by histogramming the segments according to their value of A(2q),:2q
0a(s) ds, the
time integrated entropy production per degree of freedom.In Fig. 38 we plot lnP(2q),ln[p(A(2q))/p(!A(2q))] for a system where N"50, q"0.5,
H0/N"0.907 and a strain rate of 0.1. As can be seen from the figure this function is essentially
linear in A(2q). The straight line shows a weighted least-squares fit to the observed logarithmicprobability ratio which has a slope of 95$2, in agreement with the value of the slope predicted
Fig. 37. The time evolution of the volume ratio, »i*/»
ifor four different typical initial equilibrium phases from
a constant internal energy simulation of 200 disks at H0/N"1.09161, np2"0.4 and c"1.0.
S.S. Sarman et al. / Physics Reports 305 (1998) 1—92 75

Fig. 38. The logarithmic probability ratio of observing segments and anti segments, lnP,ln[p(A(2q))/p(!A(2q))], asa function of the integrated entropy production per degree of freedom, A(2q). The data were obtained by histogrammingobserved segment frequency data from a simulation of 50 disks where H
0/N"0.907, np2"0.4 and c"0.1. The straight
line is a weighted least squares fit to the data and has a slope of 95$2.
from the ratio of phase space volumes, namely, 2N!3"97. Thus, the ratio of probabilities ofobserving segments to that of observing antisegments is in numerical agreement with the predictionof (7.55).
In summary, the use of symmetry properties of the reversible equations of motion, has enabled usto predict the relative probability of sampling at equilibrium, phases which will subsequentlygenerate segments and antisegments. We have shown that it becomes exponentially probable thatinitial phases will generate second law satisfying segments rather than their time reversed conju-gates, namely antisegments. This anisotropic probability ratio results from the fact that themeasure of those phases which will generate second law violating trajectories vanishes exponenti-ally with the product of time, the number of molecules, and the entropy production per degree offreedom.
7.6. Verification of the Kawasaki representation of nonlinear response theory
In recent years a number of numerical tests [8,114,115] have been performed on response theorypredictions of the nonlinear thermostatted response of classical systems to applied dissipativefields. In the most stringent numerical test [8] that had then been performed the nonlinear responsecomputed using the so-called [8] transient time-correlation function formalism (TTCF), wasshown to be in agreement with the directly observed response to an accuracy of better than 0.15%,for timescales that are sufficiently long that the response has relaxed to within 1% of itssteady-state value. For this same system the difference between the observed nonlinear responseand the extrapolated linear response was &30%.
However, another formulation of nonlinear response theory, the so-called Kawasaki formalism[8,116,117], was much more difficult to test. In the same computer experiment as that used to test
76 S.S. Sarman et al. / Physics Reports 305 (1998) 1—92

the TTCF prediction, large statistical uncertainties in the Kawasaki predictions made the testmeaningless [8,118,119]. However, of the two formalisms, the Kawasaki approach has generallyproven to be the more useful in terms of predicting new steady state fluctuation inter-relations forspecific heats and compressibilities [8]. These fluctuation relations have been confirmed to highnumerical accuracy. It is against this background that we present in this section the results of thefirst convincing numerical test of the predictions of the Kawasaki response [120]. We also discussthe Kawasaki normalisation.
In order to test the predictions of nonlinear response theory, we examine a model system whichexhibits the salient features of a general system undergoing nonlinear response. We consider anensemble of systems each of N molecules in a volume », interacting with an external dissipativefield F
%(t)"F
%H(t), where H(t) is a unit Heaviside step function. The initial phases
C,(x1, y
1, z
1,2, p
yN, p
zN) are assumed to be distributed according to a canonical distribution
f (C,0)"exp[!b0H
0(C)]/:dCexp[!b
0H
0(C)] with absolute temperature ¹
0"1/(k
Bb0), where
kB
is Boltzmann’s constant. The internal energy is H0(C)"+N
i/1p2i/2m#U, where m is the
molecule mass and U the total interatomic potential energy.For t50 the equations of motion for this system are Eqs. (7.2) and (7.4). Since the internal
energy is a constant of the motion, the thermostat multiplier a that is required to fix the internalenergy is
a"!J» · F
%+ p2
i/m
. (7.56)
For an arbitrary phase function, B(C), the nonlinear thermostatted response that is obtainedunder the combined influence of the external field and the thermostat can be written as thetransient time correlation function (TTCF) expression [114], which for ergostatted dynamics reads
SB(t)T"SB(0)T!F%·»P
t
0
dsSb(0)J(0)B(s)T"SB(0)T#3NPt
0
ds Sa(0)B(s)T . (7.57)
Unless otherwise indicated, the time evolution is generated by the field-dependent thermostattedequations of motion (7.2) and the brackets S2T denote the ensemble average calculated at time t,
SB(t)T,PdCB(C(t)) f (C, 0)":dCB(C(t))exp[!b
0H
0(C)]
:dCexp[!b0H
0(C)]
. (7.58)
In Eq. (7.57) we have used the fact that at constant internal energy b(t)F%· J(t)»"!3Na(t),
where b(t),3Nm/+p2i. We note that for strong applied fields, F
%,Sb(t)TOb
0, since H
0(t)"H
0(0).
From Eq. (7.57) it is trivial to see that in the zero field limit the linear response (if it exists) can bewritten
limF%?0
SB(t)T"SB(0)T!b0F
%·»P
t
0
ds SJ(0)B(s0)T , (7.59)
where the zero subscript on the time argument denotes the fact that the time dependence isgenerated by the thermostatted field free equations of motion. Eq. (7.59) is a thermostattedgeneralisation of the well-known Green—Kubo relation for the linear response.
S.S. Sarman et al. / Physics Reports 305 (1998) 1—92 77

An equivalent form for the nonlinear thermostatted response is the so-called ‘bare form’, BK, ofthe Kawasaki response [116],
SB(t)T"TB(0) expC3NPt
0
ds a(!s)DU , (7.60)
while the ‘renormalised’, RK, expression for the Kawasaki nonlinear response is
SB(t)T"SB(0) exp[3N:t
0ds a(!s)]T
Z(t), (7.61)
where the denominator Z(t), defined as
Z(t),TexpC3NPt
0
ds a(!s)DU"PdC expC!3NP~t
0
ds a(s)D f (C, 0) , (7.62)
is the Kawasaki normalisation factor. It is easy to show that in the linear regime the Kawasakiforms (7.60)—(7.62) reduce to the Green—Kubo linear response expression (7.59).
When we say that each of these expressions (7.57), (7.60)—(7.62) are equivalent we mean that theiridentity can be proven using the thermostatted field dependent Liouville equation,f (C, t)/t"![ f (C, t)CQ ] · /C, where f (C, t) is the N-molecule distribution function at timet evaluated under the combined influence of the external field and the thermostat. The identity ofEqs. (7.60) and (7.61) follows from the fact that one can show from the Liouville equation thanZ(t)"1 for all values of t.
Both the Kawasaki forms involve averages of exponentials of integrals of extensive quantitiesand hence are exceedingly difficult to calculate. Typically, averages computed using the renor-malised Kawasaki expression (7.61) have a smaller variance than those using the bare form (7.60).From previous numerical data it was by no means obvious that Z(t)"1 at long times. Previousnumerical data seemed to indicate that Z(t) is a monotonically decreasing function of time.However the extreme difficulty of carrying out such calculations has meant that the situation waslargely unresolved.
Hoover, Morriss and coworkers have shown that in the non-equilibrium steady state, thedistribution function becomes fractal [8,121—124]. Holian et al. [123] argued that the fractal natureof the distribution function meant that although for finite times the TTCF expression is correct,both of the Kawasaki forms for the nonlinear response are incorrect. However no numerical datawas provided in support of this assertion.
In the present section we present computer simulation data comparing the directly observedtransient nonlinear response with the TTCF, Kawasaki and renormalised Kawasaki theoreticalpredictions. Our results show, to unprecedented accuracy ((1%), numerical agreement betweentheory and experiment. We argue that the concerns raised in [123] regarding the nonanlayticnature of the fractal steady state distribution function, although correct in principle, are notrelevant in practice. The reason is that nonlinear response theory predictions are for the finite timetransient response. The distribution functions on the other hand only become truly fractal (to thearbitrarily small phase space length scales required for nonanalyticity) in the infinite time limit. Forany finite time, no matter how large, the distribution functions are analytic and only approximate
78 S.S. Sarman et al. / Physics Reports 305 (1998) 1—92

the steady state fractal attractors. Hence for any finite time, no matter how long, nonlinearresponse theory predictions are correct.
The Kawasaki normalisation is the key to a clear understanding of nonlinear response theory. Ifthe equations of motion are integrated exactly, the Liouville equation can be used to show that thenormalisation factor (7.62), Z(t), is unity. Since Z(0) is a phase integral of the normalised equilib-rium distribution function, Z(0), is unity. The rate of change of Z(t) after the external field isswitched on and the thermostat applied, is given by
dZ(t)dt
"PdC f (C, 0)t
expC3NPt
0
ds a(!s)D"3NPdC f (C, t)a(!t)"3NPdC f (C, 0)a(0)"0 .
(7.63)
In deriving the last line of this equation we have used the Schrodinger—Heisenberg equivalence [8]to show that :dC f (C, t)a(C(!t))":dC f (C, 0)a(C)"Sa(0)T"0. This implies that the bareKawasaki distribution is normalised for all times provided the dynamical equations of motion aresolved essentially exactly and the N-molecule distribution is therefore governed by the Liouvilleequation. Of course as time increases in any real system it will eventually become impossible for theforward and reverse propagators in the second line of Eq. (7.63), f (C, t) and a(C(!t)) respectively,to annihilate each other. When this occurs, the proof of normalisation given in Eq. (7.63) breaksdown.
The time over which the forward and reverse propagators annihilate each other can be measuredby the so-called lifetime of the antisteady state, t
1@2. This lifetime is defined in the following manner.
In a typical nonequilibrium steady state the average entropy production is positive and the averagedissipative flux is negative. Since the equations of motion are time reversible, when we apply thetime reversal mapping to any typical phase, sampled in the steady state, the trajectory will reverseitself exactly with negative entropy production. As before, we call such a trajectory segment anantisegment and we say that the positive entropy producing trajectory segment from which it wasconstructed is its conjugate. In reversible systems with reversible thermostats every trajectorysegment has a conjugate antisegment. The existence of this conjugacy is a sufficient condition forthe Kawasaki normalisation to be unity.
We will now consider the Kawasaki normalisation in more detail. Without loss of generality weassume the dissipative flux, J, is odd under time reversal mapping, MT: MT(q, p,F
%)"
MT(q,!p,F%). It is then straightforward to show that MTi¸(C,F
%)"i¸(CT,F
%)"!i¸(C,F
%).
From this it is easy to show that
J(!s,C, F%)"!J(s,CT,F
%) and a(!s,C,F
%)"!a(s,CT,F
%) . (7.64)
Applying this to the Kawasaki normalisation (7.62) gives
Z(t)"PdC expC3NPt
0
ds a(C(!s))D f (C, 0)"Pd CexpC!3NPt
0
ds a(CT(s))D f (CT, 0)
"PdC expC!3NPt
0
ds a(C(s))D f (C, 0)"Z(!t) , (7.65)
where we have used that DCT/CD"1, in obtaining the last line of Eq. (7.65).
S.S. Sarman et al. / Physics Reports 305 (1998) 1—92 79

Intuitively, Eq. (7.63) is somewhat unexpected since the overwhelming majority of trajectorysegments will be entropy increasing, which implies for each of these segments the time averagedthermostat multiplier will be positive and the dissipative flux negative, leading to a negativeexponent in that segment’s contribution to Z(t) (see Eq. (7.62)). Therefore, in the overwhelmingmajority of trajectory segments, as tPR, exp(!3NSaT
tt)P0, where S2T
tdenotes a time
average calculated over a time t.However, in those rare cases where an entropy reducing trajectory segment is observed the
exponent will be positive and because of the highly nonlinear dependence of an exponential uponits argument, such entropy reducing segments, although rare, will have a highly enhanced effect onthe determination of Z(t). It turns out that these two effects cancel exactly: the rarity of observingantisegments exactly cancels their exponential effect in the Kawasaki exponent leading to thenormalisation being unity.
To show this, it is convenient to consider a small phase space volume »(C(0)), about an initialphase, C(0). We can analyse the time evolution of such a volume by writing the solution of theLiouville equation
f (C, t)t
,!iL f (C, t)"!CQ ·f (C, t)
C#f (C, t)
C
·CQ
"!CQ ·f (C, t)
C#3Na(C) f (C, t)#O(1) . (7.66)
The formal solution of the Liouville equation can be written in terms of the distribution functionpropagator, exp(!iL(C)t), as f (C, t)"exp(!iL(C)t) f (C, 0). Clearly, one can write
exp(iL(C)t) f (C, 0)"f (C,!t) . (7.67)
However, since this equation is true for all C it must also be true for C(!t), so that
exp(iL(C(!t))t) f (C(!t), 0)"f (C(!t),!t) . (7.68)
Using a Dyson decomposition of the distribution function propagator in terms of the phasefunction propagator, exp(i¸(C)t), where A(C(t))"exp(i¸(C)t)A(C), one can show [8] that
exp(iL(C)t)"expC!Pt
0
3Na(C(s)) dsDexp[i¸(C)t] . (7.69)
Substituting Eq. (7.69) into Eq. (7.68) gives
f (C(!t),!t)"expC!Pt
0
3Na(C(s!t)) dsDexp[i¸(C(!t))t] f (C(!t), 0)
"expC!Pt
0
3Na(C(s!t)) dsDf (C(0), 0)"expCP~t
0
3Na(C(s)) dsD f (C(0), 0)
(7.70)
80 S.S. Sarman et al. / Physics Reports 305 (1998) 1—92

and therefore,
f (C(t), t)"expCPt
0
3Na(C(s)) dsD f (C(0), 0) . (7.71)
We call this equation the Lagrangian form of the Kawasaki distribution, LK. It should becontrasted with the usual Kawasaki expression for the nonlinear N-molecule distribution functionwhich can easily be obtained from Eq. (7.60),
f (C, t)"expCPt
0
3Na(C(!s)) dsD f (C, 0)"expC!P~t
0
3Na(C(s)) dsD f (C,0) . (7.72)
Eq. (7.71) shows that from almost every initial phase, C(0), the distribution function along thetrajectory, C(t), diverges to positive infinity. Eq. (7.72) on the other hand says that at time t, almosteverywhere in phase space, C, the distribution function collapses towards zero. These two state-ments are consistent with the conservation of total probability.
Eq. (7.71) enables us to characterise the time dependent evolution of a small, co-moving, phasespace volume, »(C(t)), about a moving phase vector, C(t). If this volume initially contains M en-semble members then »(C(t))"M/f (C(t), t). Using Eq. (7.71) we can show
»(C(t))"»(C(0)) expC!Pt
0
ds 3Na(C(s))D . (7.73)
This equation shows that for normal positive entropy producing trajectories, (SaTt'0), which are
produced from almost all starting phases C(0), the streaming phase space volume element under-goes contraction. Substituting this into Eq. (7.65) shows
Z(t)"S»(C(t))/»(C(0))T . (7.74)
We can now analyse the time evolution of the Kawasaki normalisation as a result of anindividual trajectory segment i and its conjugate antisegment i*. These segments are depictedschematically in Fig. 39. Without loss of generality the figure shows segment ‘i’ as a positiveentropy producing segment with a negative value for the average dissipative flux. As was discussedin detail in Ref. [125] segment ‘i*’ can be constructed from segment ‘i’ by applying a time reversalmapping, MT, to the phase, C
i(t), of segment ‘i’ at time t. Following this time reversed phase
backwards in time to t"0, is equivalent to following the original Ci(0) phase forward in time from
t to 2t. Because the Jacobian of the time reversal map is unity, »i*(t)"»
i(t), and from the
reversibility of the equations of motion »i*(0)"»
i(2t) while »
i*(2t)"»
i(0).
The normalisation Z(t) can be written in terms of co-moving ‘Lyapunov volumes’, as
Z(t)&+i
»(Ci(0))
»(Ci(t))
»(Ci(0))
#»(Ci*(0))
»(Ci*(t))
»(Ci*(0))
, (7.75)
where we have used the fact that in the microcanonical ensemble the probability of observingphases inside a volume is simply proportional to the magnitude of that volume (in other ensembles
S.S. Sarman et al. / Physics Reports 305 (1998) 1—92 81

Fig. 39. A schematic diagram depicting the time evolution of the dissipative flux of a trajectory segment i and itsantisegment i*. Segment ‘i*’ is constructed from segment ‘i’ by applying a time reversal mapping to the phase, C
i(q), of
segment ‘i’ at time q. For convenience we denote: Ci(0) as 1, C
i(q) as 2, C
i(2q) as 3, C
i*(0) as 4, C
i*(q) as 5, C
i*(2q) as 6.
this becomes asymptotically true as tPR). Using the fact that »(Ci*(0))"
»(Ci(0)) exp[!:2t
03Na(s
i) ds] (see Fig. 39 and Ref. [125]) the last relation can be written as
Z(t)&+i
»(Ci(0)) exp[!3NSaT
it]#»(C
i*(0)) exp[!3NSaT
i*t]
&+i
»(Ci(0)) exp[!3NSaT
it]#»(C
i*(0)) exp[#3NSaT
it]
&+i
»(Ci(0)) exp[!3NSaT
it]#»(C
i*(0)) exp[!3NSaT
i2t] exp[#3NSaT
it]
&+i
»(Ci(0)) exp[!3NSaT
it]#»(C
i(0)) exp[!3NSaT
it] . (7.76)
Thus, the contribution of the antisegment, ‘i*’ to the normalisation at time t is exactly the same asthat made by its conjugate namely ‘i’. The rarity of observing antisegments is exactly cancelled bythe exponentially enhanced effect these expanding phase volumes have on the normalisation.
The validity of the TTCF and the Kawasaki expressions for nonlinear response was examined[120] using nonequilibrium molecular dynamics simulations of a system which was subject toa colour field. A two dimensional system of two disks with periodic boundary conditions wasstudied using the self-diffusion algorithm [97]. The response of the colour current was observedwhen a constant colour field is applied to the equilibrium ensemble. The disks were characterisedby the WCA pair potential, /(r). Reduced units, where the mass is unity, will be used throughoutthis section.
82 S.S. Sarman et al. / Physics Reports 305 (1998) 1—92

The self-diffusion algorithm assumes the system consists of two species which differ only bya colour label. The equations of motion for an N-body system of colour labelled species subject toa constant field, F
%, in the x-direction can be derived from the colour Hamiltonian [126] and are
given by
qRi"p
i/m
pRi"F
i#e
xciFe!a( p
i!mu
si) , (7.77)
where ex
is the unit vector in the x direction, ci"(!1)i is the colour label of molecule i, o is the
molecule density, usi
is the streaming velocity of atom i and the term a( pi!mu
si) is the Gaussian
thermostat which is used to constrain the temperature. In the definition of the temperature, thepeculiar molecule velocity relative to the streaming velocity of each species is used. That is, theconstraint equation is given by
N+i/1
( pi!mu
si)2/m"(2N!3)k
B¹ . (7.78)
Hence, the thermostat multiplier is
a"+N
i/1Fi) ( p
i!mu
si)
+Ni/1
pi) ( p
i!mu
si). (7.79)
In general, the streaming velocity, usi, is given by e
xciJx/o; however in the 2-molecule system it is
not possible to define an instantaneous streaming velocity, therefore it is assumed to be zero.A periodic system of WCA disks was studied and the response of the dissipative flux was
monitored, which in this case is the colour current density Jx,
Jx"
1»
N+i/1
ciqRxi
. (7.80)
The nonequilibrium molecular dynamics simulations used the fourth order Runge—Kutta methodto integrate the equations of motion with a time step *t"0.005. The Runge—Kutta method isself-starting which is necessary for an examination of the transient response. A density ofo"0.396850 (which is sufficiently low that the box length is greater than twice the range of theWCA potential) and a temperature of ¹"1.0 was used. The colour labels for the two species werec1"#1 and c
2"!1. After equilibration a constant colour field was applied.
The response of the colour current density for the 2-molecule periodic system calculated usingthe TTCF, the bare Kawasaki and the renormalised Kawasaki expressions was compared with thedirect ensemble average. Colour fields of F
%"0.1 and F
%"1.0 were used. In each case, the
average was caried out over a set of 2]106 starting states from the isothermal equilibriumensemble. In the simulations these were generated as phase space points of a single trajectory whichare 4800 time steps apart, which is sufficiently long that they are not correlated. For efficiency,phase space maps were carried out at each of the generated phases to produce additional startingpoints from the isothermal equilibrium ensemble. For each starting phase, C"(q
x, q
y, p
x, p
y) a time
reversal mapping MT(C)"(qx, q
y,!p
x,!p
y) was used.
Fig. 40a shows the response of the colour current density to a colour field of F%"0.1. The field
was applied at t"0 and averaged over 2]106 starting states. In Fig. 40b, a section of the same
S.S. Sarman et al. / Physics Reports 305 (1998) 1—92 83

Fig. 40. (a) The colour current density response to a constant field of 0.1 determined using nonequilibrium moleculardynamics simulation. The response calculated using a direct ensemble average (— — —) is compared with that calculatedusing the TTCF (————), bare Kawasaki (BK) (- - - - - -) and renormalised Kawasaki (RK) (— - — -) expressions. Thecolour field was applied to a microcanonical equilibrium ensemble of 2]106 initial configurations. The system consistedof two WCA disks in a periodic box at ¹"1.0 and np2"0.396850. (b) The scale in (a) is expanded for part of the data.
data is magnified. The figures show that for a colour field of 0.1 the bare Kawasaki (BK) andrenormalised Kawasaki (RK) expressions are in excellent agreement with each other ($0.05%)and with the comparatively low accuracy ($5.0%) direct results. Remarkably, the BK and TTCFresults disagree with each other by no more than 0.3%. The ensemble-averaged current is highlystructured and is not a monotonic increasing function of time. This is a reflection of the growingunderlying complexity of the phase-space distribution function.
The half-life of the antisteady state, which is a function of our integration accuracy, for thissystem is &8. Therefore, the accuracy of the Kawasaki expressions and the TTCF expression ismaintained for times which are much longer than the decay time of the antisteady state. This decaytime is a measure of the time over which microscopic reversibility holds. Throughout the timescale
84 S.S. Sarman et al. / Physics Reports 305 (1998) 1—92

shown in Fig. 40a, the Kawasaki renormalisation factor is unity, within estimated statisticaluncertainties ($0.04%). Thus, microscopic reversibility is apparently not a necessary condition forthe Kawasaki normalisation to be unity, at least for relatively weak fields. This is in agreement withour theoretical discussion above.
In Fig. 41a the response of the colour current density of the same system to a colour field of 1.0 isshown. Averages are carried out using 2]106 initial configurations. For F
%"1.0, the results
determined using the direct method are more precise than for F%"0.1 and these results are in
agreement to within 0.7% with those obtained using the TTCF expression. For t(6.5, both thebare Kawasaki and renormalised Kawasaki expressions agree with the direct response to within1.0% and 0.7%, respectively. After this time, larger fluctuations occur with the renormalised
Fig. 41. (a) The colour current density response to a constant field of 1.0 determined using nonequilibrium moleculardynamics simulation. The response calculated using a direct ensemble average (— — —) is compared with that calculatedusing the TTCF (————), bare Kawasaki (BK) (- - - - - -) and renormalised Kawasaki (RK) (— - — -) expressions. Thecolour field was applied to a microcanonical equilibrium ensemble of 2]106 initial configurations. The system consistedof two WCA disks in a periodic box at ¹"1.0 and np2"0.396850. (b) Deviation from the direct ensemble average of thecolour current density response calculated using the TTCF, bare Kawasaki and renormalised Kawasaki expressions forthe system examined in (a). The deviation of the TTCF results is magnified by 100 for clarity.
S.S. Sarman et al. / Physics Reports 305 (1998) 1—92 85

Kawasaki expression generally in better agreement than the bare expression. In Fig. 41b thedeviation of the results obtained using the TTCF, renormalised Kawasaki and bare Kawasakiresponse expression from the direct response results are plotted. The deviation of the TTCFexpression has been magnified by 100 for clarity and is just 0.2% at t"12. The agreement of theTTCF expression and the directly calculated results indicates that the Green—Kubo type expres-sions are accurate far from the thermodynamic limit — in this case for just 2 molecules.
In Fig. 42 the time evolution of a selected region of the coordinate space pair distributionfunction is shown for this system with a field of F
%"1.0 applied at t"0. Clearly, a developing
structure is observed soon after the field is applied and this structure becomes more distinct as timeprogresses. This structure which is observed here in the pair distribution function is a projection ofthe developing fractal characteristics of the full phase space distribution. Importantly, the depar-ture of the Kawasaki-based averages from their directly computed counterpart does not appear tocorrespond to the emergence of the fractal characteristics in the projected phase-space distributionfunction [123]. These results indicate that although the phase space distribution function ap-proaches a fractal in the long time limit, this is not directly related to the apparent inaccuracy of theKawasaki expressions for phase space averages.
Fig. 42. The time evolution of the coordinate space distribution function for a system to which a constant colour field of1.0 is applied at t"0. The data was obtained from a nonequilibrium molecular dynamics simulation two WCA disks ina periodic box at ¹"1.0 and np2"0.396850.
86 S.S. Sarman et al. / Physics Reports 305 (1998) 1—92

To summarize the results of this section, the results reviewed here provide an accurate confirma-tion of the validity of the Kawasaki expression for nonlinear response. The TTCF and Kawasakiexpressions for the nonlinear response in autonomous systems have been shown to be accurate forsystems with as few as two molecules. For autonomous systems taking the thermodynamic limit isnot required. Although the bare and renormalised Kawasaki expressions are formally exact, it hasbeen demonstrated that they are subject to large (systematic) statistical errors and they aretherefore usually not of much direct computational use. This remark must be qualified however forsystems subject to weak external fields. For example in Fig. 40a and b we see a situation where theresponse computed using both the Kawasaki forms, Eqs. (7.60) and (7.61), are in fact more accuratethan direct simulation. Previous attempts to verify the Kawasaki expressions have been unsuccess-ful due to insufficient sampling of phase space, rather than the fractal nature of phase space, as hasbeen previously presumed [123]. Also, it is evident that microscopic reversibility is a sufficientcondition for the Kawasaki normalisation factor to be unity. This theoretical result is supported bythe nonequilibrium molecular dynamics simulation results reviewed here. However, these resultssuggest that microscopic reversibility of the integrated equations of motion is not a necessarycondition either for the Kawasaki normalisation to be unity or for the ability of either therenormalised or of the bare Kawasaki response to correctly predict the nonlinear response. Thisempirical result mirrors that obtained many years ago for the linear response [127]. In the linearregime we have proved that microscopic reversibility is a sufficient but not a necessary conditionfor the Kawasaki normalisation to be unity. A weaker sufficient condition is microscopic reversibil-ity over the convergence time of the Green—Kubo integrand for the dissipative flux.
Finally, we should add that a generalisation of nonlinear response theory which is valid anduseful for classical systems subject to time periodic external fields has recently been proposed andtested against computer simulations [128].
7.7. A connection between dynamical systems theory and nonlinear response theory
Recently Evans et al. [108,109] derived a formula for the ratio of probabilities of observing, ina steady state, finite duration trajectory segments and their time reversed trajectory antisegments.This ratio formula was derived from a natural invariant measure (which we shall call the Lyapunovinstability measure), originally proposed by Eckmann and Procaccia [126] for the steady stateattractor. In the present section we show that the ratio formula for observing segments andantisegments can also be derived [120] from a new generalisation of the Kawasaki expressions ofnonlinear response theory. When combined with accurate numerical tests of nonlinear responsetheory predictions, this theoretical result provides a link between the two apparently differentapproaches to describing nonequilibrium steady states. Evans, Cohen and Morriss (ECM)[108,109] derived an expression for the probability ratio of observing phase space trajectorysegments which satisfy the second law of thermodynamics and their time reversed antisegmentswhich violate the second law. This ratio formula was based on a natural invariant measure (whichwe shall call the Lyapunov instability measure), which was originally proposed by Eckmann andProcaccia [126] for the steady state attractor. We now show that the Lagrangian form of theKawasaki response distribution (7.71) can be used to deduce the same expression for this ratio.
In the steady-state ECM predicted that the probability, ki, of observing a steady-state trajectory
segment, i, should, for long segments, be proportional to the exponential of the negative sum of
S.S. Sarman et al. / Physics Reports 305 (1998) 1—92 87

segment i’s local Lyapunov exponents, jni, multiplied by the observation time q,
limq?=
ki"
exp[!+n@jni;0
jniq]
+jexp[!+
n@jnj;0jnjq]
. (7.81)
We call this the q-segment probability formula. The observation time, q, must be shorter than thelifetime of the antisteady state, that is q(t
1@2(i.e. trajectories must be accurate for a time q),
however the equation is supposed to be valid arbitrarily long after the system was at equilibrium.Consider a microcanonical ensemble of initial, t"0, phases which is used to generate an
ensemble of subsequent nonequilibrium trajectory segments. The ratio of probabilities of observinga segment of duration 2q(t!q, t#q), namely segment i, and its conjugate antisegment, i*, is
limq?=
ki*
ki
"
exp[!+n@ji*n;0
ji*n2q]
exp[!+m@jim;0
jim
2q]"
exp[+n@jin:0
jin2q]
exp[!+m@jim;0
jim
2q]
"exp[+njin2q]"exp[!3NSaT
2q,i2q] , (7.82)
where +njin
is the sum of all Lyapunov exponents for segment i and SaT2q,i is the time average value
of the thermostat multiplier over the segment i. This result was first accurately tested againstsimulation results in ECM [108,109].
As q increases to the value of t, the starting time for the segments approaches zero. We haveshown [125] that when q"t, and the segments begin from microcanonically distributed equilib-rium phases, the probability ratio given above is exact for all q("t) not just in the long q("t) limit.
Following the arguments given in [125] for shear flow, if we select an initial, t"0,phase, C
(1), and advance time from 0 to q using the equations of motion (5.7) we obtain C
(2)"
C(q;C(1)
)"exp[i¸(C(1)
, F%)q]C
(1). Continuing on to 2q gives C
(3)"exp[i¸(C
(2), F
%)q]C
(2)"
exp[i¸(C(1)
,F%)2q]C
(1)(see Fig. 39).
At the midpoint of the trajectory segment C(1,3)
(i.e. at t"q) we apply the time reversal map toC(2)
generating M(T)C(2),C
(5).7 If we now reverse time keeping F
%fixed, we obtain
C(4)"exp[!i¸(C
(5), F
%)q]C
(5). C
(4)is the initial t"0 phase from which a segment C
(4,6)can be
generated with C(6)"exp[i¸(C
(4), F
%)2q]C
(4)(see Fig. 39 for details). By construction, the seg-
ments C(1,3)
and C(6,4)
are conjugate.We now discuss the ratio of probabilities of finding the initial phases C
(1), C
(4)which generate
these conjugate segments. The probabilities of observing the segments C(1,3)
, C(4,6)
are of courseproportional to the probabilities of observing the initial phases which generate those segments. It isconvenient to consider a small phase space volume, »(C
(i)(0)) about an initial phase, C
(i)(0). As time
evolves the number of ensemble members inside »(C(i)(t)) is fixed.
Because the segment C(4,6)
is related to C(1,3)
by a time reversal mapping which is applied att"q, and the Jacobian of that mapping is unity, »
2"»
5,»
3"»
4and »
1(0)"»
6. However,
since »1(0) and »
4are volumes at t"0 and since the distribution of initial phases is assumed to be
microcanonical, we can compute the ratio of probabilities of observing t"0 phases within »1(0)
7We denote the trajectory q-segment C(i)PC
(j), segment C
(i,j).
88 S.S. Sarman et al. / Physics Reports 305 (1998) 1—92

and »4. This ratio is just the volume ratio,
k1*/k1
"»4(0)/»
1(0)"»
1(2q)/»
1(0)"f (C
1(0),0)/f (C
1(2q), 2q), ∀q . (7.83)
If we now use the Lagrangian form of the Kawasaki distribution function (7.71), we obtainan equation which is identical to Eq. (7.82) except that we now do not need to take the qPR
limit. This limit is unnecessary for q-segments that extend back to, and include, the equilibriumphase.
This result shows that there is a deep connection between nonlinear response theory and recentwork which has used the mathematical machinery of dynamic systems theory to characterise thenatural invariant measure (i.e. the N-molecule steady state distribution function) of nonequilibriumsteady states [108,109,126]. Far from being incompatible with the fractal nature of the nonequilib-rium steady state distribution, nonlinear response theory is consistent with it and leads to a betterunderstanding of at least one of the invariant measures that have been proposed for nonequilib-rium steady states.
8. Postscript
Recently, a special issue of Physica A has appeared which contains a useful set of papers whichtreat the connections between nonequilibrium statistical mechanics and dynamical systems theory[129—137]. Refs. [130,132—134] treat material not covered in the present review while Ref. [131]provides a more rigorous discussion of the material described in Section 7.4. A recent advance inthe theory of thermostats and in the proof of the Conjugate Pairing Rule is due to Dettmann andMorriss [138,139].
Acknowledgements
PTC acknowledges the support of the Division of Chemical Sciences, Office of Basic EnergySciences, U.S. Department of Energy. PTC also acknowledges the joint support of the ChemicalTechnology Division of Oak Ridge National Laboratory (ORNL) and the Science Alliance, a stateof Tennessee Center of Excellence located at the University of Tennessee-Knoxville. ORNL ismanaged by Lockheed Martin Energy Research Corp. for the DOE under Contract No. DE-AC05-96OR22464. DJE would like to thank the staff of the National Institute of Standards andTechnology, Physical and Chemical Properties Division for their hospitality during the course ofwriting this review.
References
[1] W.T. Ashurst, W.G. Hoover, Bull. Am. Phys. Soc. 17 (1972) 1196.[2] W.G. Hoover, W.T. Ashurst, Theor. Chem. Adv. Perspec. 1 (1975) 1.[3] W.G. Hoover, Ann. Rev. Phys. Chem. 34 (1983) 103.[4] D.J. Evans, G.P. Morriss, Comput. Phys. Rep. 1 (1984) 297.
S.S. Sarman et al. / Physics Reports 305 (1998) 1—92 89

[5] G. Ciccotti, W.G. Hoover (Eds.), Molecular-Dynamics Simulation of Statistical-Mechanical Systems, North-Holland, Amsterdam, 1986.
[6] D.J. Evans, W.G. Hoover, Ann. Rev. Fluid Mech. 18 (1986) 243.[7] D.J. Evans, Nonequilibrium molecular dynamics, in: Molecular Dynamics Simulation of Statistical-Mechanical
Systems, Italian Physical Society, North-Holland, Amsterdam, 1986.[8] D.J. Evans, G.P. Morriss, Statistical Mechanics of Nonequilibrium Liquids, Academic Press, New York, 1990.[9] P.T. Cummings, D.J. Evans, Ind. Eng. Chem. Res. 31 (1992) 1237—1252.
[10] C.J. Mundy, S. Balasubramanian, K. Bagchi, J.I. Siepmann, M.L. Klein, Faraday Discussions 104 (1997) 17.[11] R. Zwanzig, J. Chem. Phys. 40 (1964) 2527.[12] L.A. Pars, A Treatise on Analytical Dynamics, Heinemann, London, 1965.[13] S.R. de Groot, P. Mazur, Nonequilibrium Thermodynamics, Dover, New York, 1984.[14] D.J. Evans, S. Murad, Mol. Phys. 34 (1977) 327.[15] K.P. Travis, P.J. Daivis, D.J. Evans, J. Chem. Phys. 103 (1995) 1109.[16] K. Travis, P. Daivis, D. Evans, Chem. Phys. 103 (1995) 10638.[17] J.H. Irving, J.G. Kirkwood, J. Chem. Phys. 18 (1950) 817.[18] M.P. Allen, Mol. Phys. 52 (1984) 705.[19] H. Grad, Comm. Pure Appl. Math. 5 (1952) 455.[20] N.K. Ailawadi, B.J. Berne, D. Forster, Phys. Rev. A 3 (1970) 1462.[21] D.J. Evans, H.J.M. Hanley, Phys. Rev. A 25 (1982) 1771.[22] R. Edberg, D.J. Evans, G.P. Morriss, Mol. Phys. 62 (1987) 1357.[23] J.C. Maxwell, Proc. R. Soc. A 22 (1873) 151.[24] S. Sarman, D.J. Evans, J. Chem. Phys. 99 (1993) 9021.[25] S. Sarman, D.J. Evans, P.T. Cummings, J. Chem. Phys. 95 (1991) 8675.[26] D.J. Evans, S. Murad, Mol. Phys. 68 (1989) 1219.[27] S. Murad, D.P. Singh, H.J.M. Hanley, D.J. Evans, Mol. Phys. 72 (1991) 487.[28] B.Y. Wang, P.T. Cummings, D.J. Evans, Mol. Phys. 75 (1992) 1345.[29] P. Ravi, S. Murad, Mol. Simulation 9 (1992) 239.[30] S. Murad, D.J. Evans, Mol. Phys. 69 (1990) 697.[31] S. Murad, D.J. Evans, Mol. Phys. 80 (1993) 219.[32] W.W. Wood, J. Stat. Phys. 57 (1989) 675.[33] D.J. Evans, P.T. Cummings, Mol. Phys. 72 (1991) 893.[34] D. MacGowan, D.J. Evans, Phys. Rev. A 34 (1986) 2133.[35] D. MacGowan, D.J. Evans, Phys. Lett. A 117 (1986) 414.[36] D.J. Evans, D.M. MacGowan, Phys. Rev. A 36 (1987) 948.[37] S. Sarman, D.J. Evans, Phys. Rev. A 45 (1992) 2370.[38] S. Sarman, D.J. Evans, Phys. Rev. A 46 (1992) 1960.[39] D. MacGowan, Mol. Phys. 59 (1986) 1017.[40] D.J. Evans, H.J.M. Hanley, Mol. Phys. 68 (1989) 97.[41] D.P. Hansen, D.J. Evans, Mol. Phys. 81 (1994) 767.[42] P.T. Cummings, B.Y. Wang, D.J. Evans, K.J. Fraser, J. Chem. Phys. 94 (1991) 2149.[43] T.G.M. van de Ven, Colloidal Hydrodynamics, Academic Press, London, 1989.[44] D.J. Evans, Phys. Rev. A 44 (1991) 3630.[45] D.J. Evans, A. Baranyai, S. Sarman, Mol. Phys. 76 (1992) 661.[46] J.P. Ryckaert, A. Bellemans, Discuss. Faraday Soc. 66 (1978) 95.[47] S. Sarman, P.J. Daivis, D.J. Evans, Phys. Rev. E 47 (1993) 1784.[48] D.J. Tildesley, P.A. Madden, Mol. Phys. 42 (1981) 1137.[49] D.J. Tildesley, P.A. Madden, Mol. Phys. 48 (1983) 129.[50] J.G. Gay, B.J. Berne, J. Chem. Phys. 74 (1981) 3316.[51] P.J. Daivis, D.J. Evans, Phys. Rev. E 48 (1993) 1058.[52] D. Frenkel, B.M. Mulder, J.P. McTague, Phys. Rev. Lett. 52 (1984) 287.[53] A. Stroobants, H.N.W. Lekkerkerker, D. Frenkel, Phys. Rev. A 36 (1987) 2929.
90 S.S. Sarman et al. / Physics Reports 305 (1998) 1—92

[54] D. Frenkel, Mol. Phys. 60 (1987) 1.[55] D. Frenkel, J. Phys. Chem. 92 (1988) 3280.[56] M.P. Allen, Phys. Rev. Lett. 65 (1990) 2881.[57] G.V. Paolini, G. Ciccotti, M. Ferrario, Mol. Phys. 80 (1993) 297—312.[58] M. Whittle, A.J. Masters, Mol. Phys. 72 (1991) 247.[59] M.R. Wilson, M.P. Allen, Mol. Phys. 80 (1993) 277.[60] E. de Miguel, L.F. Rull, M.K. Chalam, K.E. Gubbins, F. van Swol, Mol. Phys. 72 (1991) 593.[61] E. de Miguel, M.K. Chalam, K.E. Gubbins, Mol. Phys. 71 (1990) 1223.[62] E. de Miguel, M.K. Chalam, K.E. Gubbins, Mol. Phys. 74 (1991) 405.[63] M.K. Chalam, K.E. Gubbins, E. de Miguel, L.F. Rull, Mol. Sim. 7 (1991) 357.[64] A.P.J. Emerson, R. Hashim, G.R. Luckhurst, Mol. Phys. 76 (1992) 241.[65] G.R. Luckhurst, P.S.J. Simmonds, Mol. Phys. 80 (1993) 233.[66] S. Sarman, J. Chem. Phys. 104 (1996) 342.[67] G. Ayton, G.N. Patey, J. Chem. Phys. 102 (1995) 9040.[68] S. Hess, D. Frenkel, M.P. Allen, Mol. Phys. 74 (1991) 765.[69] A. Alavi, D. Frenkel, Phys. Rev. A 45 (1992) 5355.[70] S. Sarman, J. Chem. Phys. 101 (1994) 480.[71] D. Baalss, S. Hess, Phys. Rev. Lett. 57 (1986) 86.[72] D. Baalss, S. Hess, Z. Naturforsch. 43a (1988) 662.[73] S. Sarman, J. Chem. Phys. 103 (1995) 393.[74] S. Sarman, J. Chem. Phys. 103 (1995) 10378.[75] E. de Miguel, L.F. Rull, K.E. Gubbins, Phys. Rev. A 45 (1992) 3813.[76] D.J. Evans, A. Baranyai, Phys. Rev. Lett. 67 (1991) 2597.[77] D. Forster, Ann. Phys. 85 (1974) 505.[78] C. Gahwiller, Phys. Rev. Lett. 28 (1972) 1554[79] P. Pieranski, E. Guyon, Phys. Rev. Lett. 32 (1974) 924.[80] P. Pieranski, E. Guyon, Phys. Rev. A 9 (1974) 404.[81] T. Carlsson, K. Skarp, Liquid Cryst. 1 (1986) 455.[82] I. Zun8 iga, F.M. Leslie, Europhys. Lett. 9 (1989) 689.[83] I. Zun8 iga, F.M. Leslie, Liquid Cryst. 5 (1989) 725.[84] S. Sarman, J. Chem. Phys., in preparation.[85] D.J. Evans, G.P. Morriss, Chem. Phys. 87 (1983) 451.[86] B.L. Holian, D.J. Evans, J. Chem. Phys. 78 (1983) 5147.[87] S.Y. Liem, D. Brown, J.H.R. Clarke, Phys. Rev. A 45 (1992) 3706.[88] D.J. Evans, B.L. Holian, J. Chem. Phys. 83 (1985) 4069.[89] D.J. Evans, in: G. Ciccotti, W.G. Hoover (Eds.), Nonequilibrium Molecular Dynamics, North-Holland, Amster-
dam, 1986, pp. 221—240.[90] D.J. Evans, S. Sarman, Phys. Rev. E 48 (1993) 65.[91] D.J. Evans, Phys. Rev. A 44 (1991) 3630.[92] D.J. Evans, G.P. Morriss, L.M. Hood, Mol. Phys. 68 (1989) 637.[93] D.J. Evans, A. Baranyai, Mol. Phys. 77 (1992) 1209—1216.[94] J.J. Brophy, Basic Electronics for Scientists,, McGraw-Hill, New York,, 1966.[95] D.J. Evans, G.P. Morriss, Phys. Rev. A 31 (1985) 3817.[96] L.M. Hood, D.J. Evans, G.P. Morriss, Mol. Phys. 62 (1987) 419.[97] D.J. Evans, W.G. Hoover, B.H. Failor, B. Moran, A.J.C. Ladd Phys. Rev. A 28 (1983) 1016[98] D.J. Evans, Mol. Phys. 80 (1993) 221.[99] M.P. Allen, D.J. Tildesley, Computer Simulation of Liquids,, Oxford University Press, Oxford,, 1987.
[100] E.G.D. Cohen, Physica A 213 (1995) 293—314[101] P. Gaspard, Nicolis, Phys. Rev. Lett. 65 (1990) 1693.[102] J.R. Dorfman, P. Gaspard, Phys. Rev. E 51 (1995) 28.[103] J.R. Dorfman, P. Gaspard, Phys. Rev. E 51 (1995) 5332.
S.S. Sarman et al. / Physics Reports 305 (1998) 1—92 91

[104] G. Benettin, L. Galgani, J.-M. Strelcyn, Phys. Rev. A 14 (1976) 2338.[105] I. Goldhirsch, P.L. Sulem, S.A. Orszag, Physica D 27 (1987) 311.[106] W.G. Hoover, H.A. Posch, Phys. Lett. 113A (1985) 82.[107] S. Sarman, D.J. Evans, G.P. Morriss, Phys. Rev. A 45 (1992) 2233.[108] D.J. Evans, E.G.D. Cohen, G.P. Morriss, Phys. Rev. Lett. 71 (1993) 2401.[109] D.J. Evans, E.G.D. Cohen, G.P. Morriss, Phys. Rev. Lett. 71 (1993) 3616.[110] R. Artuso, P. Cvitanovic, Nonlinearity 3 (1990) 325.[111] P. Gaspard, F. Baras, in: M. Mareschal, B.L. Holian (Eds.), Microscopic Simulations of Complex Hydrodynamic
Phenomena, Plenum Press, New York, 1991.[112] G. Gallavotti, E.G.D. Cohen, J. Stat. Phys. 80 (1995) 931.[113] I. Prigogine, Physica (Utrecht) 55 (1949) 272.[114] G.P. Morriss, D.J. Evans, Phys. Rev. A 35 (1987) 792.[115] D.J. Evans, G.P. Morriss, Phys. Rev. A 38 (1988) 4142.[116] G.P. Morriss, D.J. Evans, Mol. Phys. 54 (1985) 629.[117] T. Yamada, K. Kawasaki, Prog. Theor. Phys. 38 (1967) 1031.[118] D.J. Evans, G.P. Morriss, Mol. Phys. 61 (1987) 1151.[119] D.J. Evans, Phys. Rev. A 36 (1987) 4515.[120] D.J. Evans, D.J. Searles, Phys. Rev. E 52 (1995) 5839.[121] W.G. Hoover, H.A. Posch, B.L. Holian, M.J. Gillan, M. Mareschal, C. Massobrio, Mol. Sim. 1 (1987) 79.[122] B.L. Holian, W.G. Hoover, H.A. Posch, Phys. Rev. Lett. 59 (1987) 10.[123] B.L. Holian, G. Ciccotti, W.G. Hoover, B. Moran, H.A. Posch, Phys. Rev. A 39 (1989) 5414.[124] B.L. Holian, H.A. Posch, W.G. Hoover, Phys. Rev. A 42 (1990) 3196.[125] D.J. Evans, D.J. Searles, Phys. Rev. E 50 (1994) 1645.[126] J.P. Eckmann, I. Procaccia, Phys. Rev. A 34 (1986) 659.[127] W.W. Wood, in: E.G.D. Cohen (Ed.), Fundamental Problems in Statistical Mechanics III, North-Holland,
Amsterdam, 1975, p. 331.[128] J. Petravic, D.J. Evans, Phys. Rev. Lett. 78 (1996) 1199—1202; J. Petravic, D.J. Evans, Phys. Rev. E 56 (1997) 1207.[129] W.G. Hoover, Physica A 240 (1997) 1.[130] J.R. Dorfman, H. van Beijeren, Physica A 240 (1997) 12.[131] E.G.D. Cohen, Physica A 240 (1997) 43.[132] P. Gaspard, Physica A 240 (1997) 54.[133] C. Dellago, H.A. Posch, Physica A 240 (1997) 68.[134] G.P. Morriss, C.P. Dettmann, L. Rondoni, Physica A 240 (1997) 84.[135] D.J. Searles, D.J. Evans, D.J. Isbister, Physica A 240 (1997) 96.[136] D.J. Isbister, D.J. Searles, D.J. Evans, Physica A 240 (1997) 105.[137] M. D’Alessandro, A. D’Aquino, A. Tenenbaum, Physica A 240 (1997) 115.[138] C.P. Dettmann, G.P. Morriss, Phys. Rev. E 53 (1996) R5545.[139] C.P. Dettmann, G.P. Morriss, Phys. Rev. E 55 (1997) 3693.
92 S.S. Sarman et al. / Physics Reports 305 (1998) 1—92