Real-time PCR-based determination of gene copy numbers in Pichia pastoris
24
For Peer Review Real time PCR based determination of gene copy numbers in Pichia pastoris Journal: Biotechnology Journal Manuscript ID: biot.200900233.R2 Wiley - Manuscript type: Technical Report Date Submitted by the Author: 23-Jan-2010 Complete List of Authors: Abad, Sandra; Research Centre Applied Biocatalysis, Molekulare Biotechnologie Kitz, Kerstin; Research Centre Applied Biocatalysis, Molekulare Biotechnologie Schreiner, Ulrike; Research Centre Applied Biocatalysis, Molekulare Biotechnologie Hoermann, Astrid; Graz University of Technology, Institute for Molecular Biotechnology Hartner, Franz; Graz University of Technology, Institute for Molecular Biotechnology Glieder, Anton; Research Centre Applied Biocatalysis, Molekulare Biotechnologie Primary Keywords: White/Industrial Biotechnology Secondary Keywords: Genetic Engineering Keywords: real-time PCR, Pichia pastoris, CalB Wiley-VCH Biotechnology Journal peer-00552336, version 1 - 6 Jan 2011 Author manuscript, published in "Biotechnology Journal 5, 4 (2010) 413" DOI : 10.1002/biot.200900233
-
Upload
independent -
Category
Documents
-
view
0 -
download
0
Transcript of Real-time PCR-based determination of gene copy numbers in Pichia pastoris

For Peer Review
Real time PCR based determination of gene copy numbers in Pichia pastoris
Journal: Biotechnology Journal
Manuscript ID: biot.200900233.R2
Wiley - Manuscript type: Technical Report
Date Submitted by the Author:
23-Jan-2010
Complete List of Authors: Abad, Sandra; Research Centre Applied Biocatalysis, Molekulare Biotechnologie Kitz, Kerstin; Research Centre Applied Biocatalysis, Molekulare Biotechnologie Schreiner, Ulrike; Research Centre Applied Biocatalysis, Molekulare
Biotechnologie Hoermann, Astrid; Graz University of Technology, Institute for Molecular Biotechnology Hartner, Franz; Graz University of Technology, Institute for Molecular Biotechnology Glieder, Anton; Research Centre Applied Biocatalysis, Molekulare Biotechnologie
Primary Keywords: White/Industrial Biotechnology
Secondary Keywords: Genetic Engineering
Keywords: real-time PCR, Pichia pastoris, CalB
Wiley-VCH
Biotechnology Journalpe
er-0
0552
336,
ver
sion
1 -
6 Ja
n 20
11Author manuscript, published in "Biotechnology Journal 5, 4 (2010) 413"
DOI : 10.1002/biot.200900233
For Peer Review
1
Technical Report
Real time PCR based determination of gene copy numbers in Pichia
pastoris
Sandra Abad 1,*, Kerstin Kitz 1,*, Astrid Hörmann 2, Ulrike Schreiner1, Franz S. Hartner
1, Anton Glieder 1,2 §.
1Applied Biocatalysis Research Centre, Petersgasse 14, 8010 Graz, Austria
2Institute of Molecular Biotechnology, Graz University of Technology, Petersgasse 14,
8010 Graz, Austria
*equally contributing authors
§Corresponding author
Keywords: real-time PCR, Pichia pastoris, CalB
Correspondence: Dr. Anton Glieder
Petersgasse 14/II, 8010 Graz, Austria
email: [email protected]
tel: +43 316 8734074
fax: +43 316 8739302
Page 1 of 23
Wiley-VCH
Biotechnology Journal
123456789101112131415161718192021222324252627282930313233343536373839404142434445464748495051525354555657585960
peer
-005
5233
6, v
ersi
on 1
- 6
Jan
2011

For Peer Review
2
ABSTRACT
Pichia pastoris is a prefered host for heterologous protein production. Expression
cassettes are usually integrated into the genome of this methylotrophic yeast. This
manuscript describes a method for fast and reliable gene copy number
determinations for P. pastoris expression strains. We believe that gene copy number
determinations are important for all researchers working with P. pastoris and also
many other research groups using similar gene integration techniques for the
transformation of other yeasts. The described method uses Real Time PCR to
quantify the integrated expression cassettes. Similar methods were employed
previously for other host systems such as animal and plant cells but no such method
comparing different detection methods and describing details for yeast analysis by
quantitative PCR is known to us especially not for methylotrophic yeasts such as P.
pastoris. Neglecting gene copy numbers can easily lead to false interpretations of
experimental results from codon optimization or promoter studies and coexpression
of helper proteins as demonstrated in an application example, which is also
described in this manuscript.
Page 2 of 23
Wiley-VCH
Biotechnology Journal
123456789101112131415161718192021222324252627282930313233343536373839404142434445464748495051525354555657585960
peer
-005
5233
6, v
ersi
on 1
- 6
Jan
2011

For Peer Review
3
INTRODUCTION
The methylotrophic yeast Pichia pastoris has emerged to a frequently used protein
expression host. High product titers have been obtained with the standard expression
system [1, 2] employing the methanol inducible AOX1 promoter (PAOX1).
Nevertheless, recent studies reported even higher expression rates when the target
gene was under the control of deletion variants of the AOX1 promoter [3] or in some
cases also with the constitutive glyceraldehyde-3-phosphate dehydrogenase
promoter (PGAP) [4]. Depending on the target gene, high copy number expression
strains do not necessarily lead to optimal expression rates. For example, for some
secreted proteins rising numbers of expression cassettes resulted in a decreased
expression due to other bottlenecks than transcript levels [5, 16]. Other approaches
such as co-expression of helper proteins e.g. chaperones or proteins which initiate
the unfolded protein response have shown reasonable expression improvements [6-
9]
Although many studies describe improved expression due to different promoters
variants, codon optimization or co-expression of helper proteins, hardly any
information of copy numbers of the expression cassettes is given. Consequently,
false interpretation of experimental results is possible, leaving the question whether
improvements either correlated with a certain promoter, co-expressed chaperone or
an accompanying copy number effect. Inan et al. pointed out the importance of the
copy number determination for P. pastoris expression strains, reporting the
correlation between increased protein secretion and the copy number of the co-
expressed chaperone protein disulfide isomerase from P. pastoris, PpPDI. Copy
numbers were determined by southern blot analysis, which was so far the method of
choice for this question. However, it is a time-consuming and laborious method, and
requires large amounts of genomic DNA. In addition, restriction site loss during
Page 3 of 23
Wiley-VCH
Biotechnology Journal
123456789101112131415161718192021222324252627282930313233343536373839404142434445464748495051525354555657585960
peer
-005
5233
6, v
ersi
on 1
- 6
Jan
2011

For Peer Review
4
integration is possible, complicating the molecular analysis. To overcome these
drawbacks and also in order to deal with increasing numbers of expression strains
from high throughput experiments, an additional reliable and faster method for copy
number determination of integrated expression cassettes was needed.
Quantitative PCR emerged as an important and widely used analytical tool (reviewed
in [7]). But, there are only few studies reporting on real time PCR based copy number
determination in human-, animal- and plants cells [10, 11]. No detailed method for
yeast could be found, probably also since for many yeasts plasmid systems are still
quite common. In general, assay design, template preparation and analytical
methods are essential for accurate quantitative gene amplification [12, 13] and were
especially adapted for P. pastoris in this study as a fast and simple alternative to
southern blotting.
Two settled detection methods, namely TaqMan and SYBR Green were compared,
as well as approaches for absolute and relative quantification. For a simple
visualization of our results and for a correlation between copy numbers and
expression, green fluorescent protein (GFP) fusion with a Zeocin resistance marker
has been chosen as a simple intracellular reporter system [14]. Furthermore the
importance of expression cassettes quantitation in P. pastoris was emphasized in an
industrially relevant example. Real time PCR was already used for copy number
determination in P. pastoris in our group and independently also by others before [3,
15, 16]. A demonstration of the importance of copy number determination as a
routinely performed experiment for molecular strain characterization and a first
detailed protocol especially adapted for P. pastoris and including the comparison of
two different detection methods, were the main goals of this work.
MATERIALS AND METHODS
Page 4 of 23
Wiley-VCH
Biotechnology Journal
123456789101112131415161718192021222324252627282930313233343536373839404142434445464748495051525354555657585960
peer
-005
5233
6, v
ersi
on 1
- 6
Jan
2011

For Peer Review
5
Chemicals and materials
Sterile water was purchased from Fresenius Kabi Austria (Graz, Austria). Unless
otherwise stated, all chemicals were purchased from Carl Roth GmbH (Karlsruhe,
Germany), Becton, Dickinson and Company (Franklin Lakes, NJ, USA) and Sigma-
Aldrich (St Louis, MO, USA). DNA modifying enzymes were supplied by Fermentas
GmbH (Burlington, Ontario, Canada). All PCRs were performed with Phusion HF
according to the producer’s manual (Finnzymes Oy, Espoo, Finland).
GFP reporter expression cassette
PAOX1 and the AOX1 terminator were amplified from vector pPICZ-B (Invitrogen,
Carlsbad, USA), and cycle-3-GFP-Zeocin from pTracerTM-CMV2 [14, 17]. All PCR
products were purified by agarose gel electrophoresis prior to overlap extension PCR
[18].
The obtained PCR product displayed 2.4 kb and was purified by agarose gel
electrophoresis and gel extraction using Wizard® SV Gel and PCR Clean-Up system
(Promega, Madison, WI, USA). pAOX was constructed by digesting the PAOX1-GFP-
Zeo-AOX1TT fragment with KpnI and NotI and ligation with KpnI/NotI-digested
pBlueScript® SK- vector (Stratagene, La Jolla, CA, USA).
The P. pastoris PAOX1d6* promoter variant was excised from vector pPICZ-GFP-d6*
[3] employing BglII/EcoRI restriction sites into the vector pAOX thereby generating
vector pAOXd6*. The correct sequence was verified by sequencing (AGOWA
Genomics, Berlin, Germany).
P. pastoris transformation
BglII and NotI linearized pAOX or pAOX∆6* was transformed into electro-competent
P. pastoris cells. Electro-transformation was performed as described in [19]. After a
regeneration phase, aliquots were spread on MSM-Zeo agar plates (1.5% BactoTM
Page 5 of 23
Wiley-VCH
Biotechnology Journal
123456789101112131415161718192021222324252627282930313233343536373839404142434445464748495051525354555657585960
peer
-005
5233
6, v
ersi
on 1
- 6
Jan
2011

For Peer Review
6
Agar, 1.34% DifcoTM Yeast Nitrogen Base w/o Amino Acids, 4.10-5% d-Biotin, 2%
Sorbitol, 1% methanol, 100 µg/mL ZeocinTM) and incubated for 3-4 days at 30°C.
Pichia pastoris microscale cultivation and GFP reporter expression
P. pastoris cultivation for GFP expressing strains was performed as described in [20].
GFP intensity was detected with SPECTRA MAX Gemini XS plate reader (Molecular
Devices Corp., Sunnyvale, CA, USA) as described in [3].
Generation of a Pichia pastoris genomic DNA-library
Genomic DNA (gDNA) from P. pastoris X-33 was isolated employing the Easy-
DNATM-Kit (Invitrogen). 10µg from the DNA was partially digested with Sau3AI. Gel
purified fragments (6-9 kb) were ligated into XhoI digested pGAPZ plasmid
(Invitrogen) which was partially filled with Klenow fragment. Ligation was transformed
into E.coli Top 10 F’ (Invitrogen). Transformation was plated into LB-Zeocin (25
mg/mL). Transformants were pooled and cultivated for plasmid isolation with Wizard®
Plus SV (Promega) according to manufacturer’s protocol. The library contained
10,500 clones and the average insert size of 14 independent transformants was
estimated to 4.5 kb. The probability to find any given unique sequence in this library
is 99%.
CalB reporter strain construction
Zeocin resistance cassette from pPICZ-B (Invitrogen) was replaced with the KanMX6
cassette from PFA6a-kanMX6 [21], which confers resistance against Kanamycin in
E. coli and Geneticin (G418) in yeasts. The resulting plasmid was named pPICK.
Codon optimized Candida antartica lipase B (CalB, GenBank: ACIO6118) was
assembled via oePCR. The resulting gene was EcoRI/NotI digested, gel purified and
cloned into an equally digested pPICK-plasmid. E.coli Top 10 F’ (Invitrogen) was
transformed with this construct and plated onto LB-Kanamycin (50 mg/mL). The
construct was analyzed by sequencing, and linearized with BglII for P. pastoris
Page 6 of 23
Wiley-VCH
Biotechnology Journal
123456789101112131415161718192021222324252627282930313233343536373839404142434445464748495051525354555657585960
peer
-005
5233
6, v
ersi
on 1
- 6
Jan
2011

For Peer Review
7
KM71H (Invitrogen) transformation as described before. After transformation the cell
suspensions were plated on YPD-G418-plates (300 mg/L) and incubated at 28°C for
2 days. Transformants were cultivated in deep-well plates as described before, and
screened for CalB activity.
Transformation of X-33 gDNA library into CalB reporter strain
The P. pastoris CalB-H5 (multicopy CalB strain) was transformed with 3 µg of BglII
linearized genomic DNA (gDNA) library. Cells were plated in YPD-Zeocin-plates (50
mg/L) and incubated at 28°C for 2 days. Using a Genetix QPixII robot (Genetix
Limited, Hampshire, UK) the transformants were picked into 384-plates filled with 50
µL BMD1%. Incubation was carried out at 28°C for 5 days. Glycerol-stocks were
prepared by addition of 30 µL of glycerol/BMD1% to a final concentration of 15%
glycerol. The 384-plates were covered with foil seal (Silverseal Aluminium-tape,
Greiner, Frickenhausen, Germany) and stored at -80°C. Transformants were
replicated into deep-well plates and cultivated as described before with one minimal
modification, cell harvest after 60 h of methanol induction.
CalB activity assay
P. pastoris strains were cultivated in deep-well plates as described before. Esterase
activity determination of CalB was performed according to [22] with minimal
modifications. Briefly, 20 µL of the supernatant or a dilution of it was pipetted into a
micro-titer plate well. The CalB esterase activity was measured following color
development (due to p-nitro phenolate formation) at 405 nm for 5min at RT after
addition of 180 µL of the assay solution. The assay solution consisted of 300 mM
Tris/HCl pH7, 1% ethanol and 4 mM of p-nitrophenyl butyrate. One unit was defined
as the formation of 1 µmol para nitrophenol per minute (ε= 17,700 M-1cm-1)
Recovery of the library-insert from the CalB-clones
Page 7 of 23
Wiley-VCH
Biotechnology Journal
123456789101112131415161718192021222324252627282930313233343536373839404142434445464748495051525354555657585960
peer
-005
5233
6, v
ersi
on 1
- 6
Jan
2011

For Peer Review
8
gDNA from selected strains was isolated employing the Easy-DNATM-Kit from
Invitrogen. 500 ng gDNA were digested with BglII, after purification with Wizard® SV
Gel and PCR Clean-Up system (Promega), self-ligation with T4-ligase was incubated
at 16°C over night. 2 µL of the ligation mixture were transformed into chemical
competent One Shot® Top10 (Invitrogen). Resulting transformants were sent for
sequencing (AGOWA genomics).
Isolation of genomic DNA for RT-PCR
The isolation procedure was performed as described by Hoffman and Winston [23].
The DNA concentration was measured at 260 nm. DNA quality was checked by gel
electrophoresis and photometrically (SPECTRAmax PLUS plate reader, Molecular
Devices Corp.). Samples displaying 260 nm/280 nm ratios higher than 1.8 were used
for further analysis. Alternatively gDNA was isolated employing the E.N.Z.A.® Yeast
DNA Kit (Omega Bio-Tek, Norcross, Georgia, USA) and the Easy-DNATM-Kit
(Invitrogen) as described by the suppliers protocols. gDNA isolation was also
performed with Y-PER Yeast Protein Extraction Reagent (Thermo Fisher Scientific
Inc.,Rockford, Illinois, USA). Briefly, the cells of a 10-15 mL an overnight culture were
lysed with 300 µL Y-PER (30 min, room temperature, mixed on an Eppendorf shaker
with 600 rpm). Lysed cells were spun down at 13,000 rpm, 10 min at room
temperature. The supernatant then was subjected to a chloroform/phenol/isopropanol
extraction followed by ethanol precipitation. Finally, the DNA pellet was resuspended
with 50 µL H2O, dest.
Primer sets for real time PCR
The primer design was performed using Primer Express v2.0 software (Applied
Biosystems, Foster City, CA, USA). The primers had similar melting temperatures
(Tm) (58 – 60°C) and the Tm of the probe was 10°C higher. The amplicon size
settings were defined between 80 and 150 bp. The nucleotide sequences are shown
Page 8 of 23
Wiley-VCH
Biotechnology Journal
123456789101112131415161718192021222324252627282930313233343536373839404142434445464748495051525354555657585960
peer
-005
5233
6, v
ersi
on 1
- 6
Jan
2011

For Peer Review
9
in Table 1. Primers were purchased from Invitrogen and probes were purchased from
MWG-Biotech (Ebersberg, Germany).
The real time PCR assays were optimized with respect to the primer concentration by
titration experiments. Thereby, combinations of different concentrations (100 nM –
300 nM) of forward and reverse primers for GFP and ARG4 genes, respectively,
were tested, using the same template amount per real time PCR reaction (see
below). The primer combinations with lowest Ct values and no occurrence of by-
products in the non-template control (NTC) reactions were considered as optimal.
Real time PCR using SYBR Green and TaqMan probes
Real-time PCR amplification was performed using an ABI 7300 instrument with
Sequence Detection Software SDS v1.2 (Applied Biosystems). Real-time PCR
mixtures were prepared using the TaqMan® Universal PCR Master Mix or Power
SYBR® Green Master Mix (both Applied Biosystems), respectively.
For TaqMan probe based determinations, a single reaction contained 1x TaqMan®
Universal PCR Master Mix, 200 nM of each primer and 125 nM of the corresponding
FAM/TAMRA labeled probe. For SYBR Green examinations, 200 nM of each primer
were added to the 1x Power SYBR® Green Master Mix. In both cases, reactions were
performed in triplicate for the method establishment and in duplicate for faster routine
strain analysis. 2 ng of genomic DNA were added in a reaction volume of 20 µL.
For each unknown strain, reactions with GFP and ARG4 primer sets were performed
in separate tubes. Standard curves and NTCs for both genes were recorded in every
plate. The reactions were done in MicroAmp® Optical 96-Well Reaction Plates sealed
with MicroAmp® Optical Adhesive Covers (Applied Biosystems).
The thermal profile initiates with a 10 min step at 95°C followed by 40 cycles of
15 sec at 95°C and 1 min at 60°C. The data collection of the fluorescence signal was
performed at the end of the elongation step. These settings were the same for both
Page 9 of 23
Wiley-VCH
Biotechnology Journal
123456789101112131415161718192021222324252627282930313233343536373839404142434445464748495051525354555657585960
peer
-005
5233
6, v
ersi
on 1
- 6
Jan
2011

For Peer Review
10
detection strategies. In case of the SYBR Green samples, the amplification period
was followed by a melting curve analysis with a temperature gradient of 0.1°C/s from
70 to 95°C to exclude amplification of unspecific products.
Establishment of standard curves for copy number determination
The GFP-Zeo strain X-33 pAOX D2 was first identified as single copy strain via two
colony PCRs. The first primer pair served as control and binds in the coding region of
the GFP gene, the second pair was set on the origin of replication region (forward) of
the integrated linearized plasmid and in the PAOX1 (reverse). One or multiple tandem
integration of the expression cassette delivers a defined band with both primer
combinations, whereas the single copy integration only displays a band with the
control primer setting. The strain was confirmed by previously measured intracellular
fluorescence level as a single copy strain due to its low value in the
fluorescent/transformant landscape and selected as calibrator for the establishment
of the GFP and ARG4 standard curves. In addition the integration of further
expression cassettes in other orientations or in other loci was excluded by southern
blot analysis (data not shown). The standard curves cover a copy quantity range from
1.2 x 10⁴ to 3.1 x 10⁶ and 1.1 x 10⁵ to 3.1 x 10⁶ copies per reaction for SYBR Green
and TaqMan detection, respectively.
For calculations with the Sequence Detection Software SDS v1.2 (Applied
Biosystems), the copy quantity equation as described in [24] was used, considering a
P. pastoris genome size of 9.7 Mbp [25] since at the time when this work was
performed the genome sequence was not public available. Resulting in 94,000
copies of the genome present in 1 ng of haploid P. pastoris genomic DNA.
Meanwhile the published sequence (GenBank: FN392319.1, FN392320.1,
FN392321.1, FN392322.1, FN392323.1, FN392324.1 and FN392325.1) which still
contains a few gaps shows a similar size of about 9.4 Mbp [26].
Page 10 of 23
Wiley-VCH
Biotechnology Journal
123456789101112131415161718192021222324252627282930313233343536373839404142434445464748495051525354555657585960
peer
-005
5233
6, v
ersi
on 1
- 6
Jan
2011

For Peer Review
11
The mean Ct values were plotted against the log10 of their initial template copy
quantity and standard curves were generated by a linear regression of the plotted
points. The PCR efficiency was calculated from the slope of each standard curve by
the following equation [24]:
E = 10-1/slope - 1
Samples displaying Ct values lower than 26 and standard deviations lower than 0.3
were used for copy number determinations according to absolute and relative
calculations.
Absolute and relative quantification
For correct determination of the starting copy quantity regardless of precise amounts
and qualities of input genomic DNAs, the reference gene ARG4 was also quantified
in parallel. The normalized copy number calculated by absolute quantification is
given by the following equation [11]:
GENEARG
GENETARGET
GENETARGET quantityCopy
quantityCopynumberCopy
4
=
Relative quantification of the copy number was performed according to the 2-∆∆Ct
method [27], where ∆∆Ct = ∆Ct of target – ∆Ct of calibrator; ∆Ct = Ct of target or
calibrator – Ct of reference (ARG4); E = PCR efficiency.
Ct
GENETARGETEnumberCopy
∆∆−+= )1(
A strain with known copy number (in our case P. pastoris X-33 pAOX D2), ideally
with one copy of the target gene served as a calibrator strain.
Page 11 of 23
Wiley-VCH
Biotechnology Journal
123456789101112131415161718192021222324252627282930313233343536373839404142434445464748495051525354555657585960
peer
-005
5233
6, v
ersi
on 1
- 6
Jan
2011
For Peer Review
12
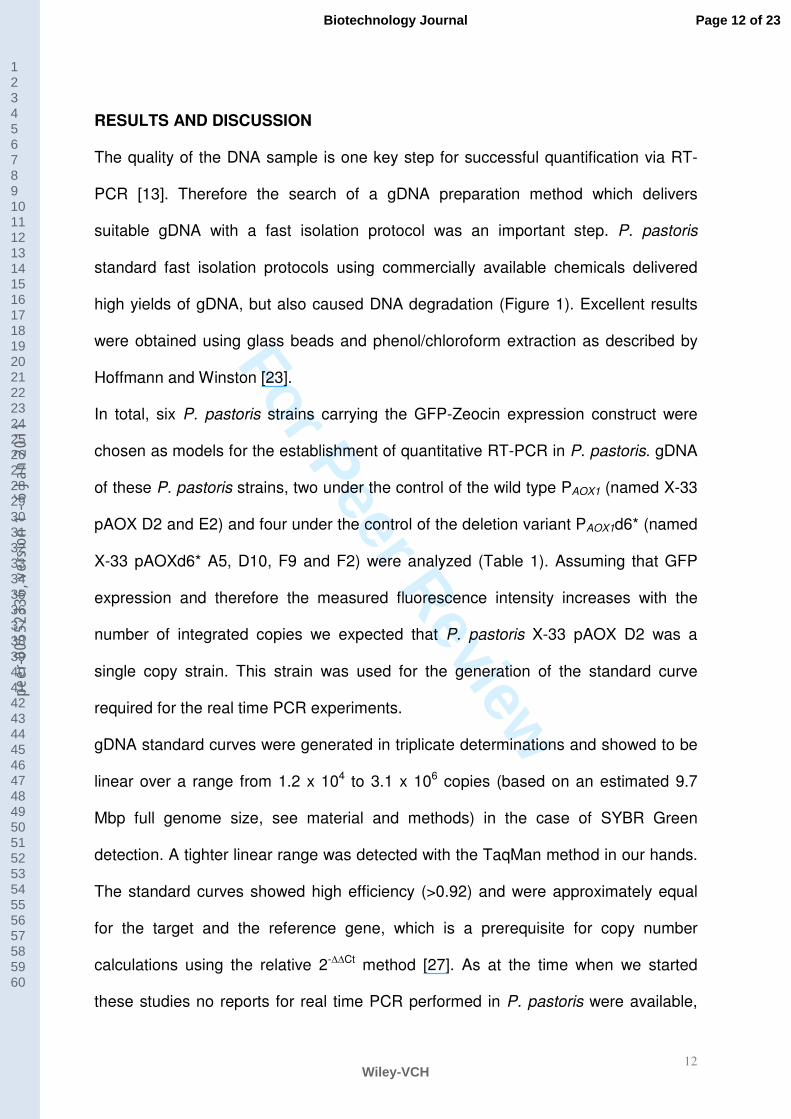
RESULTS AND DISCUSSION
The quality of the DNA sample is one key step for successful quantification via RT-
PCR [13]. Therefore the search of a gDNA preparation method which delivers
suitable gDNA with a fast isolation protocol was an important step. P. pastoris
standard fast isolation protocols using commercially available chemicals delivered
high yields of gDNA, but also caused DNA degradation (Figure 1). Excellent results
were obtained using glass beads and phenol/chloroform extraction as described by
Hoffmann and Winston [23].
In total, six P. pastoris strains carrying the GFP-Zeocin expression construct were
chosen as models for the establishment of quantitative RT-PCR in P. pastoris. gDNA
of these P. pastoris strains, two under the control of the wild type PAOX1 (named X-33
pAOX D2 and E2) and four under the control of the deletion variant PAOX1d6* (named
X-33 pAOXd6* A5, D10, F9 and F2) were analyzed (Table 1). Assuming that GFP
expression and therefore the measured fluorescence intensity increases with the
number of integrated copies we expected that P. pastoris X-33 pAOX D2 was a
single copy strain. This strain was used for the generation of the standard curve
required for the real time PCR experiments.
gDNA standard curves were generated in triplicate determinations and showed to be
linear over a range from 1.2 x 10⁴ to 3.1 x 10⁶ copies (based on an estimated 9.7
Mbp full genome size, see material and methods) in the case of SYBR Green
detection. A tighter linear range was detected with the TaqMan method in our hands.
The standard curves showed high efficiency (>0.92) and were approximately equal
for the target and the reference gene, which is a prerequisite for copy number
calculations using the relative 2-∆∆Ct method [27]. As at the time when we started
these studies no reports for real time PCR performed in P. pastoris were available,
Page 12 of 23
Wiley-VCH
Biotechnology Journal
123456789101112131415161718192021222324252627282930313233343536373839404142434445464748495051525354555657585960
peer
-005
5233
6, v
ersi
on 1
- 6
Jan
2011

For Peer Review
13
we decided to use the ARG4 gene as an endogenous control [28] as this is a single
copy gene of the haploid host. In this comparative technique, the amount of the
target gene GFP is normalized by using the reference gene ARG4 and set relative to
the calibrator, which was in our case the single copy X-33 pAOX D2 strain (Figure 2).
Hence, the GFP/ARG4 ratio of a sample was normalized by the GFP/ARG4 ratio of
the calibrator.
Two detection strategies were followed: 1) sequence-specific TaqMan probes and 2)
SYBR Green. It was tested if the use of SYBR Green leads to similar results as the
more expensive TaqMan probe based detection system, which is described to be the
more sensitive detection method [29] (Table 1). In the range of one to five copies of
the expression cassette the results were similar, no matter if SYBR Green or TaqMan
probe was used. Important to mention are the higher Ct values obtained with the
TaqMan detection method which is in line with the already mentioned narrow linear
range compared with the SYBR Green method. In any case absolute or relative
quantification delivered consistent results, although a modest deviation for the multi
copy strain was detected with the TaqMan method.
The quantitation of integrated expression cassettes showed that pAOX D2 and
pAOXd6* A5, although displaying different GFP intensities, are single copy
transformants (or have identically integrated expression cassettes). These results
confirm that the deletion d6* leads to a decrease of promoter activity to about 60% [3]
under the described cultivation conditions.
Sustaining the aim of a universal tool for copy number determination, which fits for
numbers of different expression constructs, good results have been obtained by
using common sequences (e.g. PAOX1), which are present in the integrated
expression cassette and in the P. pastoris haploid genome. This setting resolves the
identification of one single copy strain (calibrator), since the wild type strain already
Page 13 of 23
Wiley-VCH
Biotechnology Journal
123456789101112131415161718192021222324252627282930313233343536373839404142434445464748495051525354555657585960
peer
-005
5233
6, v
ersi
on 1
- 6
Jan
2011

For Peer Review
14
contains one copy of the sequence, and designed primers and probes can be used
as universal tools.
To show the importance of this method in a laboratory routine, a real case scenario
has been followed. The already mentioned benefits of helper protein co-expression
have been focused in a so called non-rational approach. Therefore, a reporter strain
was transformed with a P. pastoris genomic DNA library cloned under the control of
the PGAP. The P. pastoris reporter strain harbored 7-8 copies of a CalB expression
cassette under the control of the PAOX1 (named P. pastoris pPICK-CalB H5), and
displayed rather low levels of active enzyme in the culture supernatant compared to
single copy strains. Previous experiments showed that certain bottlenecks during the
secretion pathway led to a limited growth of the P. pastoris CalB strains and low
expression levels of the target gene, which could be at least in part be removed by
co-expression of PpPDI (S. Abad unpublished data). Following this outcome, we
aimed at identifying additional putative helper proteins by a second transformation
and individual co-overexpression of P. pastoris genomic DNA library clones.
Therefore genomic P. pastoris DNA fragments had been ligated behind the GAP
promoter of the pGAPZB expression plasmid. Putative new helper proteins from this
library were expected to lead to an increased CalB expression which can be
determined by measuring the lipase activity in the culture supernatant of the reporter
strain.
In total 3250 transformants were screened, which seemed to be an acceptable
number for our initial purpose since four candidates (CalB H5/2-L18, H5/9-H21,
H5/10-H22, H5/10-F22) displayed higher CalB expression levels as the reporter
strain. These improved transformants were chosen for a re-screen and the
expression improvement was confirmed for all candidates. Interestingly, none of the
chosen co-expression strains delivered higher expression values than single copy
Page 14 of 23
Wiley-VCH
Biotechnology Journal
123456789101112131415161718192021222324252627282930313233343536373839404142434445464748495051525354555657585960
peer
-005
5233
6, v
ersi
on 1
- 6
Jan
2011

For Peer Review
15
CalB strains, and no reproducibility of the results was possible after transformation of
the recovered construct into the reporter strain. The copy number determination
performed with the SYBR Green method using primers designed for PAOX1 sequence
and the P. pastoris KM71H strain as calibrator explained the described results. The
chosen “improved” transformants showed lower numbers of integrated CalB
expression cassettes. The transformants H5/2-L18 and H5/10-F22 harbored four and
two copies, respectively while H5/9-H21 and H5/10-H22 displayed only one CalB
expression cassette (Table1).
CONCLUDING REMARKS
Quantitative PCR allows the determination of the number of integrated expression
cassettes of P. pastoris. Strains harboring up to five copies were analyzed and
delivered consistent results with two different detection methods. However, the
narrow linear range of the TaqMan method should be taken into account for further
experiments. This PCR based procedure provides a reliable but faster and simple
alternative to standard southern blot analysis. It also allows correlations between
integration events into the genome and the respective expression levels which is
highly relevant for expression studies employing different promoters, redesigned
genes or alternative signal sequences. Due to its simplicity it can be applied
routinely..
Absolute and relative quantification showed to have no influence in the final outcome
of the experiment, whereas the latter demands more precise parameters. The house-
keeping gene ARG4 showed to be a reliable endogenous control. However, caution
should be taken when an Arg- auxotroph strain is used as platform for expression
experiments.
Page 15 of 23
Wiley-VCH
Biotechnology Journal
123456789101112131415161718192021222324252627282930313233343536373839404142434445464748495051525354555657585960
peer
-005
5233
6, v
ersi
on 1
- 6
Jan
2011

For Peer Review
16
As demonstrated by application of the described method multiple transformation
steps can lead tto the potential loss of previously integrated expression cassettes,
especially if the same locus is targeted for the genomic integration. Gene dosage
control of previously integrated expression cassettes after every further
transformation step is essential.
ACKNOWLEGDMENTS
The authors acknowledge the FFG, the Province of Styria and SFG for financial
support.
CONFLICT OF INTEREST STATEMENT
The authors have declared no conflict of interest.
REFERENCES
[1] Macauley-Patrick, S., Fazenda, M. L., McNeil, B., Harvey, L. M., Heterologous protein
production using the Pichia pastoris expression system. Yeast 2005, 22, 249-270.
[2] Lin-Cereghino, J., Cregg, J. M., Heterologous protein expression in the methylotrophic
yeast Pichia pastoris. FEMS Microbiol. Rev. 2000, 24, 45-66.
[3] Hartner, F. S., Ruth, C., Langenegger, D., Johnson, S. N., et al., Promoter library designed
for fine-tuned gene expression in Pichia pastoris. Nucleic Acids Res. 2008, 36, 76.
[4] Zheng, H., Wang, X., Chen, J., Zhu, K., et al., Expression, purification, and
immobilization of His-tagged D-amino acid oxidase of Trigonopsis variabilis in Pichia
pastoris. Appl. Microbiol. Biotechnol. 2006, 70, 683-689.
Page 16 of 23
Wiley-VCH
Biotechnology Journal
123456789101112131415161718192021222324252627282930313233343536373839404142434445464748495051525354555657585960
peer
-005
5233
6, v
ersi
on 1
- 6
Jan
2011

For Peer Review
17
[5] Hohenblum, H., Gasser, B., Maurer, M., Borth, N., Mattanovich, D., Effects of gene
dosage, promoters, and substrates on unfolded protein stress of recombinant Pichia pastoris.
Biotechnol. Bioeng. 2004, 85, 367-375.
[6] Gasser, B., Maurer, M., Gach, J., Kunert, R., Mattanovich, D., Engineering of Pichia
pastoris for improved production of antibody fragments. Biotechnol. Bioeng. 2006, 94, 353-
361.
[7] Inan, M., Aryasomayajula, D., Sinha, J., Meagher, M. M., Enhancement of protein
secretion in Pichia pastoris by overexpression of protein disulfide isomerase. Biotechnol.
Bioeng. 2006, 93, 771-778.
[8] Tsai, C. W., Duggan, P. F., Shimp, R. L., Miller, L. H., Narum, D. L., Overproduction of
Pichia pastoris or Plasmodium falciparum protein disulfide isomerase affects expression,
folding and O-linked glycosylation of a malaria vaccine candidate expressed in P. pastoris. J.
Biotechnol. 2006, 121, 458-470.
[9] Vad, R., Nafstad, E., Dahl, L. A., Gabrielsen, O. S., Engineering of a Pichia pastoris
expression system for secretion of high amounts of intact human parathyroid hormone. J.
Biotechnol. 2005, 116, 251-260.
[10] Ballester, M., Castello, A., Ibanez, E., Sanchez, A., Folch, J. M., Real-time quantitative
PCR-based system for determining transgene copy number in transgenic animals.
Biotechniques 2004, 37, 610-613.
[11] Laurendeau, I., Bahuau, M., Vodovar, N., Larramendy, C., et al., TaqMan PCR-based
gene dosage assay for predictive testing in individuals from a cancer family with INK4 locus
haploinsufficiency. Clin. Chem. 1999, 45, 982-986.
[12] Ginzinger, D. G., Gene quantification using real-time quantitative PCR: an emerging
technology hits the mainstream. Exp. Hematol. 2002, 30, 503-512.
Page 17 of 23
Wiley-VCH
Biotechnology Journal
123456789101112131415161718192021222324252627282930313233343536373839404142434445464748495051525354555657585960
peer
-005
5233
6, v
ersi
on 1
- 6
Jan
2011

For Peer Review
18
[13] Cankar, K., Stebih, D., Dreo, T., Zel, J., Gruden, K., Critical points of DNA
quantification by real-time PCR-effects of DNA extraction method and sample matrix on
quantification of genetically modified organisms. BMC Biotech. 2006, 6, 37.
[14] Bennett, R. P., Cox, C. A., Hoeffler, J. P., Fusion of green fluorescent protein with the
ZeocinTM
-resistance marker allows visual screening and drug selection of transfected
eukaryotic cells. Biotechniques 1998, 24, 478-482.
[15] Schroer, K., Luef, K. P., Hartner, F. S., Glieder, A., Pscheidt, B., Engineering the Pichia
pastoris methanol oxidation pathway for improved NADH regeneration during whole-cell
biotransformation. Metab. Eng. 2009, 8-17.
[16] Marx, H., Mecklenbrauker, A., Gasser, B., Sauer, M., Mattanovich, D., Directed gene
copy number amplification in Pichia pastoris by vector integration into the ribosomal DNA
locus. FEMS Yeast Res 2009, 9, 1260-1270.
[17] Crameri, A., Whitehorn, E. A., Tate, E., Stemmer, W. P., Improved green fluorescent
protein by molecular evolution using DNA shuffling. Nat. Biotechnol. 1996, 14, 315-319.
[18] Liu, Z., Pscheidt, B., Avi, M., Gaisberger, R., et al., Laboratory evolved biocatalysts for
stereoselective syntheses of substituted benzaldehyde cyanohydrins. ChemBioChem 2008, 9,
58-61.
[19] Cregg J.M., R. K. A., Transformation, Methods in Molecular Biology 1998; 103, pp. 27-
39.
[20] Weis, R., Luiten, R., Skranc, W., Schwab, H., et al., Reliable high-throughput screening
with Pichia pastoris by limiting yeast cell death phenomena. FEMS Yeast Res. 2004, 5, 179-
189.
[21] Wach, A., Brachat, A., Alberti-Segui, C., Rebischung, C., Philippsen, P., Heterologous
HIS3 marker and GFP reporter modules for PCR-targeting in Saccharomyces cerevisiae.
Yeast 1997, 13, 1065-1075.
Page 18 of 23
Wiley-VCH
Biotechnology Journal
123456789101112131415161718192021222324252627282930313233343536373839404142434445464748495051525354555657585960
peer
-005
5233
6, v
ersi
on 1
- 6
Jan
2011

For Peer Review
19
[22] Zhang, N., Suen, W. C., Windsor, W., Xiao, L., et al., Improving tolerance of Candida
antarctica lipase B towards irreversible thermal inactivation through directed evolution.
Protein Eng. 2003, 16, 599-605.
[23] Hoffman, C. S., Winston, F., A 10 minute DNA preparation from yeast efficiently
releases autonomous plasmids for transformation of Escherichia coli. Gene 1987, 57, 267-
272.
[24] Lee, C., Kim, J., Shin, S. G., Hwang, S., Absolute and relative qPCR quantification of
plasmid copy number in Escherichia coli. J. Biotechnol. 2006, 123, 273-280.
[25] Ohi, H., Okazaki, N., Uno, S., Miura, M., Hiramatsu, R., Chromosomal DNA patterns
and gene stability of Pichia pastoris. Yeast 1998, 14, 895-903.
[26] De Schutter, K., Lin, Y. C., Tiels, P., Van Hecke, A., et al., Genome sequence of the
recombinant protein production host Pichia pastoris. Nat. Biotechnol. 2009, 27, 561-566.
[27] Livak, K. J., Schmittgen, T. D., Analysis of relative gene expression data using real-time
quantitative PCR and the 2-∆∆CT
method. Methods 2001, 25, 402-408.
[28] Lin Cereghino, G. P., Lin Cereghino, J., Sunga, A. J., Johnson, M. A., et al., New
selectable marker/auxotrophic host strain combinations for molecular genetic manipulation of
Pichia pastoris. Gene 2001, 263, 159-169.
[29] Bubner, B., Baldwin, I. T., Use of real-time PCR for determining copy number and
zygosity in transgenic plants. Plant Cell Rep. 2004, 23, 263-271.
Page 19 of 23
Wiley-VCH
Biotechnology Journal
123456789101112131415161718192021222324252627282930313233343536373839404142434445464748495051525354555657585960
peer
-005
5233
6, v
ersi
on 1
- 6
Jan
2011

For Peer Review
20
FIGURE LEGENDS
Figure 1: Comparison of P. pastoris gDNA quality of diverse isolation methods.
G: GeneRuler 1kb (Fermentas), λ: λ-HindIII Standard (Fermentas), 1: 5 µL of gDNA isolated
using Y-PER (Novagen) and chloroform/phenol extraction followed by ethanol precipitation,
2: 5 µL of gDNA isolated according to Easy DNATM-Kit (Invitrogen), 3: 5 µL of gDNA isolated
using a E.Z.N.A.® Yeast DNA Kit, 4: 5 µL of gDNA isolated using glass beads and
phenol/chloroform extraction as described by Hoffmann and Winston [23].
Figure 2: RT-PCR determination using SYBR Green and TaqMan methods. Target and
reference gene amplification of P. pastoris GFP-Zeocin strains and standard curve. A: SYBR
Green detection, B: TaqMan detection.
Page 20 of 23
Wiley-VCH
Biotechnology Journal
123456789101112131415161718192021222324252627282930313233343536373839404142434445464748495051525354555657585960
peer
-005
5233
6, v
ersi
on 1
- 6
Jan
2011

For Peer Review
21
Table 1: Copy number calculation according to absolute (Abs. Q) and relative (Rel. Q) quantification.
SYBR Greena)
TaqManb)
Pichia pastoris
strain Abs. Q Rel. Q Abs Q. Rel Q.
Resulting
copy number
Measured Expression
GFP: [RFU], CalB: [mU/L]
Expected
copy number e)
X-33 pAOX D2 1.0 1.0 0.8 1.0 1 c)
987 ± 81 1
X-33 pAOX E2 1.7 1.8 1.6 2.0 2 c)
2068 ± 219 2
X-33 pAOX∆6* A5 1.1 1.1 1.0 1.2 1 c)
422 ± 22 1
X-33 pAOX∆6* D10 1.9 2.1 2.0 2.4 2 c)
1063 ± 189 2
X-33 pAOX∆6* F9 2.0 2.1 1.8 2.2 2 c)
925 ± 58 2
X-33 pAOX∆6* F2 4.6 4.8 4.0 5.0 4-5 c)
1678 ± 437 4-5
KM71H pPICK-CalB H5 8.9 8.6 - - 7-8 d)
0.033 ± 0.005 -
KM71H CalB H5/2-L18 5.7 5.8 - - 4-5 d)
0.390 ± 0.051 -
KM71H CalB H5/9-H21 2.2 2.3 - - 1 d)
0.853 ± 0.086 -
KM71H CalB H5/10-H22 2.6 2.7 - - 1-2 d)
0.876 ± 0.054 -
KM71H CalB H5/10-F22 3.1 3.1 - - 2 d)
0.955 ± 0.075 -
a) ARG(sense/antisense): 5’-TCCTCCGGTGGCAGTTCTT-3’/5’-TCCATTGACTCCCGTTTTGAG-3’ and
GFP(sense/antisense): 5’-AAATTTAAGGGTAAGCTTTCCGTATG-3’/5’-ATGGTGATGTTAATGGGCACAA-3’ or
PAOX1(sense/antisense): 5´-GAAGCTGCCCTGTCTTAAACCTT-3´/5´-CAAAAGCTTGTCAATTGGAACCA-3´
b) GFP-probe: 5’-ATCACCTTCACCCTCTCCACTGACAGAAAA-3’ , ARG-probe: 5’-TTCAACACTGGCTTCAAAGTCAAACGTTGAA-3’
c) based on absolute and relative quantifications results with SYBR Green and TaqMan methods.
d) based on results of absolute and relative quantifications with SYBR Green method. The endogenous PAOX1 sequence has been subtracted.
e) based on fluorescence measurement assuming a linear correlation between GFP intensity and the number of integrated copies.
Page 21 of 23
Wiley-VCH
Biotechnology Journal
123456789101112131415161718192021222324252627282930313233343536373839404142434445464748495051525354555657585960
peer
-005
5233
6, v
ersi
on 1
- 6
Jan
2011

For Peer Review
Figure 1: Comparison of P. pastoris gDNA quality of diverse isolation methods. G: GeneRuler 1kb (Fermentas), λ: λ-HindIII Standard (Fermentas), 1: 5 µL of gDNA isolated using
Y-PER (Novagen) and chloroform/phenol extraction followed by ethanol precipitation, 2: 5 µL of gDNA isolated according to Easy DNATM-Kit (Invitrogen), 3: 5 µL of gDNA isolated using a E.Z.N.A.® Yeast DNA Kit, 4: 5 µL of gDNA isolated using glass beads and phenol/chloroform
extraction as described by Hoffmann and Winston [23]. 86x208mm (300 x 300 DPI)
Page 22 of 23
Wiley-VCH
Biotechnology Journal
123456789101112131415161718192021222324252627282930313233343536373839404142434445464748495051525354555657585960
peer
-005
5233
6, v
ersi
on 1
- 6
Jan
2011

For Peer Review
Figure 2: RT-PCR determination using SYBR Green and TaqMan methods. Target and reference gene amplification of P. pastoris GFP-Zeocin strains and standard curve. A: SYBR Green detection, B:
TaqMan detection. 249x92mm (300 x 300 DPI)
Page 23 of 23
Wiley-VCH
Biotechnology Journal
123456789101112131415161718192021222324252627282930313233343536373839404142434445464748495051525354555657585960
peer
-005
5233
6, v
ersi
on 1
- 6
Jan
2011