Artifacts and Their Functions - Oxford Handbooks - PhilArchive
Upload
independentCategory
view
3download
0
Real-time MR artifacts filtering during continuousEEG/fMRI acquisition
G. Garreffaa,b,c, M. Carnıa,f, G. Gualnierae, G.B. Riccid, L. Bozzaod, D. De Carlia,b,P. Morassoe, P. Pantanod, C. Colonnesec, V. Romaf, B. Maravigliaa,b,*
aDepartment of Physics, University of Rome, La Sapienza, Rome, ItalybEnrico Fermi Center, Rome; Istituto Nazionale Fisica Della Materia Uda Roma 1, Rome, Italy
cIstituto Neurologico Mediterranteo Neuromed Pozzilli, Isernia, ItalydDepartment of Neurological Sciences, University of Rome, La Sapienza, Rome, ItalyeDepartment of Informatics, Systems, Telematics, University of Genova, Genova, Italy
fEBNeuro S.p.A., Florence, Italy
Received 15 August 2003; received in revised form 22 August 2003; accepted 23 August 2003
Abstract
The purpose of this study was the development of a real-time filtering procedure of MRI artifacts in order to monitor the EEG activityduring continuous EEG/fMRI acquisition. The development of a combined EEG and fMRI technique has increased in the past few years.Preliminary “spike-triggered” applications have been possible because in this method, EEG knowledge was only necessary to identify atrigger signal to start a delayed fMRI acquisition. In this way, the two methods were used together but in an interleaved manner. In realsimultaneous applications, like event-related fMRI study, artifacts induced by MRI events on EEG traces represent a substantial obstaclefor a right analysis. Up until now, the methods proposed to solve this problem are mainly based on procedures to remove post-processingartifacts without the possibility to control electrophysiological behavior of the patient during fMRI scan. Moreover, these methods are notcharacterized by a strong “prior knowledge” of the artifact, which is an imperative condition to avoid any loss of information on thephysiological signals recovered after filtering. In this work, we present a new method to perform simultaneous EEG/fMRI study withreal-time artifacts filtering characterized by a procedure based on a preliminary analytical study of EPI sequence parameters-relatedEEG-artifact shapes. Standard EEG equipment was modified in order to work properly during ultra-fast MRI acquisitions. Changes included:high-performance acquisition device; electrodes/cap/wires/cables materials and geometric design; shielding box for EEG signal receiver;optical fiber link; and software. The effects of the RF pulse and time-varying magnetic fields were minimized by using a correct head capwires-locked environment montage and then removed during EEG/fMRI acquisition with a subtraction algorithm that takes in account themost significant EPI sequence parameters. The on-line method also allows a further post-processing utilization. © 2003 Elsevier Inc. Allrights reserved.
Keywords: Functional MRI; Electroencephalograph (EEG); Real-time filtering
1. Introduction
Functional MRI allows the high spatial resolution of MRimaging and the possibility to spatially detect changes oftissue oxygenation and perfusion induced by neuronal acti-vation to be combined in one technique . Changes in bloodoxygenation induce changes in MR signal (BOLD, BloodOxygen Level Dependent) that can be detected with a res-olution of a few millimeters and a temporal resolution of a
few seconds. These characteristics are complementary to theelectrophysiologic methods that have a higher temporal butlower spatial resolution. It is therefore clear that the inte-gration of these two noninvasive methods may provide anaccurate investigation of brain function. The main applica-tion of the combined techniques is represented by the iden-tification of the cortical area associated with neuronal ac-tivity. Warach et al. (1996) [1] first demonstrated theclinical applicability of EEG-triggered fMRI by using EEGequipment specifically designed for recording during MRacquisition [2]. However, they did not address the pulseartifact problem. They observed an artifact synchronizedwith cardiac activity (ballistocardiogram). According to
* Corresponding author. Tel.: �39-0649913473; fax: �39-0649913484.E-mail address: [email protected] (B. Maraviglia).
Magnetic Resonance Imaging 21 (2003) 1175–1189
0730-725X/03/$ – see front matter © 2003 Elsevier Inc. All rights reserved.doi:10.1016/j.mri.2003.08.019
Allen et al. [3], the pulse artifact is induced by blood flowinside the head, normal to the static magnetic field. Initially,this interaction was virtually impossible to eliminate, andthe authors showed that a simple adaptive subtraction algo-rithm can partly solve the problem [4,5]; instead, it ispossible to reduce this cardiac activity effect simply throughan opportune cable montage and patient head-lock protocol.
Concerning EEG signal alterations due to the gradients(time-varying magnetic fields), Ives et al. [2] and Huang-Hellinger et al. [6] observed that they induce an electromo-tive force (EMF) in each apparent wire loop perpendicularto the gradient field direction, which is proportional to thecross sectional area of the wire loop and to the slew rate ofthe gradients.
When wires and electrodes of an EEG device are placedinside the MR scanner, the fast varying gradient fields andthe radio-frequency pulses during MRI scan induce a veryintense electric noise that obscures the EEG signal. Thebasic idea of our method is a detailed analysis of the elec-tromagnetic interference in the shape and in space-temporalfeatures. Exact effects estimation of EPI sequence parame-ters into the raw EEG data gives us the possibility toidentify an analytical expression of “artifacts function” thatrepresents a reference (template) for filtering and also tofind “endogenous” trigger events. Indeed, we use an internalpeak detection algorithm that matches two discriminationcriteria to evaluate MRI artifact peaks within the EEGsignal: the first and most simple criterion checks signalamplitude, the second one takes into account the timing.
2. Materials and methods
Experimental steps to develop our real-time filtering pro-cedure are described as follows:
1. Standard EEG equipment was modified to work prop-erly during fMRI acquisitions.
2. Detailed EEG-artifact shapes analysis was performedto identify principal relations with EPI sequence pa-rameters commonly used for these studies.
3. A specific algorithm was implemented in order toremove on-line pulse sequence artifacts from EEGwithout affecting its quality. The software (initiallydeveloped in Matlab 6.1 environment and then inC�� programming language using Borland C��
Builder) is characterized by an interface for loading ofEPI sequence parameters.
We investigated the artifact features; this study is barelyreported in the literature. About electromagnetic interfer-ence that entirely obscures the EEG during scanning, weknow both the frequency spectrum and the artifact shapethat is closely linked with the most significant EPI sequenceparameters. A detailed analysis of RF (radio frequency) andgradient artifact allows us to remove them through an on-line “sample by sample” subtraction. Preliminary results
prove that our filtering method assures good EEG quality;our conclusions open an important scene in the use of thisnew simultaneous EEG/fMRI.
Estimated maximum gradient artifacts amplitude is ofabout a few tens of millivolts [7–9] (more precisely 12 mVfor EEG signals and 120 mV for ECG signal); thus exceed-ing a standard EEG amplifier range (a diagnostic EEG studyis normally recorded with a resolution of a few �V). There-fore, after a preliminary study based on geometrical consid-erations, we were able to reduce preventively the artifacts’intensity [10]. Our EEG equipment is able to record with upto 32 kHz sampling rate and up to �65.5 mV dynamicrange. For our study, the amplifier was set at 4 kHz sam-pling rate, which allows a suitable time resolution to pick upthe switching effect of the readout gradient in the high slewrate condition, and the EEG dynamic range of �65.5 mV toprevent that MRI artifact waveforms saturate the EEG/ECG.
A standard portable 40-channel digital EEG amplifierBE/Mizar (EBNeuro S.p.A., Florence, Italy) was adapted tooperate inside the MR room. Conic Ag-AgCl electrodesprearranged into a cap of amagnetic material were filledwith conductive gel [11]. The EEG device inside a shieldedbox amplifies the signal and performs A/D conversion. Thedigital signal is then transferred, via an optical fiber con-nection, to the host computer outside the magnet room fordemultiplexing, data acquisition, processing, and storage.
2.1. EEG-artifact shapes analysis
Simultaneous EEG and EPI acquisitions were performedby means of 1.5 T MR scanner Intera (Philips MedicalSystems, Nederland) at the Neurologic Sciences Depart-ment of University of Rome, La Sapienza, with gradientsamplitude 30 mT/m and slew rate 150 T/m/s.
On-line filtering procedure was applied in biologic phan-tom (a melon) and in humans: 3 healthy volunteers all malesage ranging 25-30 years, and 3 epileptic patients: 1 femaleand 2 males age ranging 30–60 years.
The approval of the local ethics committee was obtainedfor all EEG recordings during MRI. All subjects gave theirinformed, written consent for the study. EPI (Echo PlanarImaging) images were acquired by single shot pulse se-quence with the following parameters: TE 60 ms, FOV 24cm, flip angle 90°, matrix 64 � 64, 18 contiguous sliceswith 5 mm thickness.
Continuous fMRI acquisition method was applied with200 volumes, each one consisting of 18 slices with a repe-tition delay of 3 s for a total scan time of 10 min. The effectsof principal sequence parameters are shown in Fig. 1.
Main dominant frequencies carry out from gradientswitching events (see Fig. 2) and from slice timing vs. TR(see Fig. 7C).
Artifact shapes analysis allows us to identify most sig-nificative parameters related to gradient-EPI sequence.Temporal determination of the recurrent interference is car-
1176 G. Garreffa et al. / Magnetic Resonance Imaging 21 (2003) 1175–1189

ried out on the EEG-acquired simultaneously with fMRI. Itis possible to recognize: low frequency modulation (shape)of RF pulse and slice selection gradient in overlapping manner;alternate lobes of frequency-encoding gradient (the effects ofphase encoding gradient are negligible); echo time (whichelapses between RF pulse and the middle point in the period ofgradient frequency encoding expression); slice acquisition time(TR/number of slices); and other secondary events.
Now we show in details the EEG recorded events insidethe MRI scanner during the EPI sequence and the featuresof induced artifact on the EEG. When the gradients workwith high slew rate the encoding period lasts 40 ms whileextend up to to 88 ms when lower slew rate is setting (Fig.1c).
The large artifact called ballistocardiogram is correlatedto the current, induced by a wire-like BLOOD movement in
Fig. 1. (A) EEG recorded during EPI acquisition. (B) Enlargement of two channels: the EEG length, concerning 18 slices (1 volume) is equal to TR � 3 s.(C) Single EPI slice artifact events on two EEG channels. In this enlargement, the following are identifiable: slice acquisition time (TR/number of slices: 3s/18� 166 ms), echo time TE � 60 ms that elapses between RF pulse and the half readout gradient train (88 ms, lower slew rate).
1177G. Garreffa et al. / Magnetic Resonance Imaging 21 (2003) 1175–1189

a magnetic field [3]. This artifact is originated by the slightmicromovements of the head due to heartbeat and originatepotentials that are sometimes higher than the EEG ampli-tude. Several methods were proposed to reduce this artifact:by using the spatial properties of the bipolar montage;moreover, cardiac pulse interference can significantly bereduced by a suitable wire setting patient head locking.
2.2. Artifact filtering algorithm
The features of EEG recorded inside the MRI scannerduring the EPI sequence were used, in order to consider thewhole magnetic artifact interferences on the EEG traces asevoked responses due to a specified “stimulation.” For thisreasons, the RF pulse and gradient field artifacts were de-tected, evaluated, and then computed with a standardevoked potential methodic, considering x(t) as raw contin-uous signal acquired by the EEG amplifier.
Two fundamental hypothesis were used. The first oneconsiders x(t) as a set of uncorrelated components: the EEGbasal activity eeg(t), the instrumental noise n(t), and theEPI-evoked response epi(t):
x�t� � eeg�t� � n�t� � epi�t� (1)
The second one assumes that eeg(t) and n(t) have zeromean. The EPI signal averaging procedure was briefly ar-ticulated in the following steps:
● Applying M EPI dynamic stimuli, and record resultingM responses;
● Aligning M responses to form an ensemble with eachresponse EPI aligned in time;
● Averaging across all responses in the ensemble to getthe EPI estimate.
We assume that each response (with N samples lengthcorresponding to the duration of each EPI dynamic) wascomputed by M averages:
xi�t� � � xi,1�t�, xi,2�t�,. . ., xi,N�t�
� eegi�t� � ni�t� � epii�t�, (2)
i � 1,. . .,M
xavg�t� �1
M�i�1
M
xi�t�,1
M�i�1
M
xi�t� �1
M(3)
� � �i�1
M
eegi�t� � �i�1
M
ni�t� � �i�1
M
epii�t��xavg�t� � eegavg�t� � navg�t� � epiavg�t� (4)
After M averages eegavg(t) 3 0 and navg(t) 3 0
xavg�t� � epiavg�t� (5)
In this way, the EPI synchronously averaged EEG is anestimate of the average waveform of the whole EPI inter-ference (RF pulses and gradient fields) in the EEG channels.In other words, the overall computational process comprisesthe following basic operations (Fig. 3):
1. Evaluation of the EPI sequence information into theEEG raw data and subsequently EPI event triggerdetection;
Fig. 2. Main dominant frequencies carry out from gradient switching events.
1178 G. Garreffa et al. / Magnetic Resonance Imaging 21 (2003) 1175–1189

2. Computation of the artificial reference artifact model;and
3. Synchronized interference cancellation by zero-phaseband pass filtering, subtraction and final appropriatewindowing application.
The filtering algorithm consists of four main steps:
1. First useful MRI sequence scanning;2. Filter calibration;3. Artifact model creation; and4. Cleaning sequence.
The filter, when activated, starts in a wating mode, re-jecting any event not concerning dynamic measurements(for instance, scanner calibration like dummy or reference
scan). Any valid (discerned by amplitude and waveform)MRI sequence will wake up filtering algorithm.
When EPI sequence (dynamic) runs, the filter enters incalibration mode, and here only 48 s are needed (dependingof fMRI parameters setting) to build a robust dynamicmodel where pre-delay, post-delay and inter-peak delay aremeasured and averaged to compute scanner specific bestsettings (Fig. 4). Our study protocol obviously takes inaccount this silent phase, and co-registration starts when thefilter acts in real-time and EEG traces appear cleaned (i.e.,48 s after dynamic EPI scan start).
Moreover, mean signal amplitude will be used to esti-mate appropriately peak detection threshold.
Artifact model (model) is built by averaging a suitable
Fig. 3. Block scheme of real-time filter algorithm.
Fig. 4. Particular of a slice sample when specified measures, each related to a specific label, are applied for the slice events, and used for a dedicated peakdetection interface algorithm.
1179G. Garreffa et al. / Magnetic Resonance Imaging 21 (2003) 1175–1189

number of dynamics: in this way the “background” EEGsignal tends to zero and what’s left is the MRI artifact.According to filter settings, a window and a band-pass filtermay be applied to model. A peak detection algorithm, tofind peaks, slices and dynamics, processes each sample(which may be cleaned with additional low-pass andsmoothing filters to make peak detection work easy). Peakdetection results are used to synchronize raw data (the“dirty” signal) with artifact model.
Each raw sample is associated with the corresponding (intime) sample in the model; cleaned signal is the differencebetween raw sample and model. Empiric tests demonstratethat a band-pass filter, applied to raw signal before subtrac-tion, dramatically increases filter quality.
Default settings provide a zero-phase 10th order Butter-worth low-pass filter pointed to 70 Hz but they can bechanged according to user’s preferences. Additional filtersmay be applied: windows (best results with raised cosine),notch (applicable to raw signal before and after peak detec-tion and to cleaned signal) and a simple de-noiser (forGaussian white noise).
The computation path seen above isn’t so easy: eachaction must be fast enough to guarantee real-time cleaning,to check signal quality, and last but not least, to be adaptableto a wide range of MRI scanners. These goals are reachedgranting a wide range of options to customize filter behav-ior.
2.3. Peak detection
Peak detection has a thankless task: to find peaks and torecognize dynamics and slices start points (setting apartnoise and spurious peaks). Specific filters (such as a 5th
order low-pass Butterworth filter and a smoothing algo-rithm) can be used and they would be applied to peakdetection data only. To reach goals and keep filter flexibletwo peak detection algorithms are provided and can becombined together:
1. Threshold: a sample’s virtually considered a potentialpeak if its amplitude exceeds a given threshold (esti-mated at the calibration step).
2. Time and position: This set of rules is applied topeaks (validated by previous threshold rule), and aimsto validate peak by position and to collocate them inthe dynamic:
Potential peaks are thinned out measuring their distancefrom most recent one. This to avoid a long peak (which“occupies” a lot of near samples) to be considered as a setof peaks.
Time and position (of the peak) are used to match itsright position, making possible to setting apart spuriouspeaks because they “don’t happen” at the right moment.
The virtual dynamic used here for comparison purposesis a pulse train in this sequence:
RF pulse;Clean signal (called pre-delay);n/2 pulses (where n is the number of image pixels);Clean signal (called post-delay); andRepeated s times (where s is the number of slices per
dynamic).
Each dynamic can be compared to this ideal dynamic.Counting each slice (RF pulses with which each slice starts),peak detection establishes dynamic edges.
Of course, each channel has its own peak detection withits private threshold (time settings are shared). When a peakis judged to be valid in a given number of channels in thesame time, this is then considered a valid peak.
2.4. Automatic calibration
Parameters (threshold and time settings) are critical; inorder to always obtain the finest results without the need toinvolve an excessive effort from the users side, an automaticcalibration algorithm is provided. Few dynamics are ana-lyzed (starting with default parameters) to collect real val-ues.
2.5. Model creation
By collecting each sample and averaging them by posi-tion (Fig. 3), we obtain a model of the artifact. Instead ofcomputing the length of the model, the length of the firstdynamic is assumed as valid. Subsequent dynamics will bestretched or reduced to this size. Longer dynamics will bechopped, reducing their post-delay (in other words cuttingoff useless samples: they’ll be zeroes).
After the model is built, a window may be applied tosoften edges. The same window will be applied to rawsignal too (of course because model will be subtracted toraw signal!). As told, a band-pass filter may be applied toimprove filter quality: identical filter applied to raw signalshould be applied to model too, but best results oblige toapply it only when the model is built and averaged.
2.6. The cleaning algorithm
A large number of cleaning algorithms can be used: asimple (synchronized) subtraction allows operating in real–time with a good signal quality. An adaptive Schur–Levin-son algorithm [12] (which uses Toeplits equation solving) isused too but it needs fast computers (of course for off-linepurposes, speed doesn’t matter). The filter “core” is reallysimple; the signal is cleaned with few actions:
A band-pass filter is applied to raw signal (option-ally);
The model is subtracted from raw signal; andA window is applied to cleaned signal (optionally).
These actions are performed for each sample using peakdetection results to keep blocks synchronized.
1180 G. Garreffa et al. / Magnetic Resonance Imaging 21 (2003) 1175–1189

A smart mixer option can be enabled to subtract onlycompatible values. If amplitude of the cleaned signal isgreater than model amplitude or if it is too big to be an EEGsignal then, maybe, model shouldn’t be subtracted from rawsignal. This feature may avoid noise near dynamic edges.
Filter is fast enough to ensure real-time cleaning withstandard computers (test PC was a Pentium III 800 MHz,128 Mb RAM). At 4 kHz sampling frequency, the process-ing time is less than 0.244 ms for one sample. Filter, in theworst case, consumes 0.100 ms/sample. Better case wasaround 0.01/0.015 ms/sample. Speed can be improved, butat a sampling rate of 8 kHz real-time is still guaranteed.Buffers and filter optimizations (or faster computers) willmove sampling limit to 32 kHz and over.
3. Results
A yellow melon was initially studied, like a biologicphantom (Fig. 5), in order to verify the effective contribu-tion (both in time and frequency domain) of the only EPIsequence inside the MR scanner in a simultaneous electricalsignal/fMRI acquisition.
The initial hypothesis was to completely recognize theshape of this artifact and to evaluate this one as an uncor-related information respect to the standard basic noise ofthis phantom.
A 10-20 system configured head cap was used on themelon, and this “virtual patient” was accurately placed in-side the MR scanner, electrical activity was acquired indifferent MR situations.
A limited number of electrodes was placed on the melonwith respect to the standard 10-20 EEG system (which wellrepresent the axial and lateral positions of the head, andwhere the contribution of the gradient, static and RF fieldsare the supposed representative), and then acquired for thispurpose: F3, Fz, F4, Cz, P3, P4.
Our standard measure protocol for each measure was:
1. Up to 2 min recording inside the MR scanner, afterthe correct positioning of the phantom and pre scanloading sequence, in absence of the EPI scan (Fig.6A);
2. From 30 to 100 volumes EPI sequence recording:other two fundamental effects was evidenced, onestrictly related to the RF pulse and the last to thegradient fields (Fig. 6C);
3. Up to 2 min of recording inside the MR scanner afterEPI protocol scanning. (Fig. 6B).
An accurate study of the biologic phantom recordingsevidenced that the morphology of the noise before and afterthe EPI scan reports the same features both in time andfrequency domain, in particular the amplitude spectrum ofthe channels acquired was computed in a restricted band ofthe standard EEG signal bandwidth (0-24 Hz respect to 0-32Hz). We found that the percent variation of the energy of theentire band considered was more or less 9%, so there is nosignificative variability of information in these two cases(see Table 1).
Percent Variation function: Vpband%
� abs((beforeband � afterband)/beforeband)
*100.
By using these positives results, we considered that it ispossible to study the nature of all artifacts due to the mag-netic field in order to obtain similar results when the EPIsequence started. All considerations about the algorithmwere reported in another section of this article.
After this, good results were obtained with the adaptivefilter, and was found that all features in time and frequencydomain of the electrical signals acquired on the biologicphantom does not exceed out of the variability range of the“Before” and “After” cases. (Fig. 6D) note that for eachcleaned channel is possible to see the starting point of thevolumes (spikes) that are visible because of we have notapplied a raised cosine windowing function just to leavevisible a temporal volume markers.
In particular the amplitude spectrum for each channelacquired (comparable like 1/Frequency hyperbolic function)was found before, after and also during the sequence (Fig.7A, B, and D).
Fig. 5. Particular of a biologic phantom shape of wave, in which are shownthe correct location (based on a 10-20 system) of the electrodes used for theexperimental registration.
1181G. Garreffa et al. / Magnetic Resonance Imaging 21 (2003) 1175–1189

It is interesting to note that it’s possible to consider theamplitude spectrum computed during the EPI sequence likethe linear combination of the hyperbolic noise shape plusthe repetitive pulse artifact due to all magnetic fields (Fig,7C).
Similar values were discovered computing the percentvariation of the energy of the entire band between thecleaned signal and the average of the spectrum before andafter the EPI sequence: more or less 9% (Table 2).
Percent variation function: Vpband%
� abs((cleanedband � average(beforeband,
afterband)/cleanedband)*100.
The real-time filtering allows us to directly monitor theEEG and the patient behavior during the EPI acquisition. Inparticular, this becomes useful when the patient is veryanxious and tense, and the EEG even with rich epileptic
Fig. 6. Twenty-second recording of a biologic phantom in four different cases (0.30 s Time Costant, 70 Hz Low Pass filter, 50 Hz Notch enabled). (A) BeforeEPI sequence (noise with only static magnetic field effect). (B) After EPI sequence (noise with only static magnetic field effect). (C) During EPI sequence(noise with gradients and static magnetic field, RF pulse effects). (D) During EPI sequence with adaptive filtering.
Table 1Percent variation for each channel: biological phantom before and after EPI sequence
Band [Hz] F3 Fz F4 Cz P3 P4
Delta [0–4] 7.403651 0.42283 8.8525 14.40678 12.59755 19.0141Theta [4–8] 8.22762 11.96676 13.9739 0.1912 11.97917 15.1242Alpha [8–12] 18.18182 13.83648 8.629 13.3048 7.823129 4.42478Beta1 [12–16] 11.64384 11.76471 4.31034 9.53347 9.418838 1.02564Beta2 [16–24] 2.92398 12.5 9.7561 17.1875 7.82123 4.97512TOT 9.676182 9.7288 9.1022 9.12 9.92351 9.54763
Percent variation for each channel, for each rhythm between the energy of amplitude spectrum of 1-min trace before the EPI sequence, and the energy ofamplitude spectrum after the EPI sequence, of biological phantom. The amplitude spectrum was computed by real FFT of 2-s epochs averaging of 1-mintraces considered. Note that the percent value of the entire band considered, for each channel, was more or less 9%, so there is not significant variation inenergy. It’s possible to use the hypothesis that during the EPI sequence, the only contribution of information of electrical signal of phantom wouldn’t havesubstantial changes out of this percent values.
1182 G. Garreffa et al. / Magnetic Resonance Imaging 21 (2003) 1175–1189

grapho-elements can be altered either by a consistent reduc-tion or by the disappearance of the seizures activity pre-venting any fMRI study. In this case it’s possible to avoid aloss of time and an useless stress for the patient by stoppingthe EEG/fMRI acquisition and, in turn, by completing theexamination with a better anatomic MRI study.
Regarding these best results, it’s confirmed that the na-ture of the magnetic interference during the EPI sequence iscompletely known and does not depend properly by the typeof objects studied, hence it is possible to obtain similar goodresults also recording EEG signal of healthy normal subjects
and pathologic subjects too. For each of these cases thesame EEG/fMRI acquisition protocol was used, and bestresults were obtained too.
Presented below is the case of one representative healthysubject (volunteer, male, age 30). A specified Real-timeartifact reduction algorithm was launched during the EEG/fMRI recording, and after 15 volumes EPI time acquisition(used in order to create and calibrate the artifact model) acompletely cleaned EEG without any loss of informationwas presented also during the recording, making possible tomonitor the neuronal activity.
Fig. 7. One-minute amplitude spectrum of one channel recorded of biologic phantom, inside the MR scanner. The amplitude spectrum was computed byaverage of 2-s epoch FFT signal. Here are represented four different situations recording: (A) before EPI sequence (only static magnetic field effect); (B)after EPI sequence (only static magnetic field effect); (C) during EPI sequence (gradients fields, static magnetic field and RF pulse effects); and (D) duringEPI sequence with adaptive filtering.
Table 2Percent variation for each channel: biological phantom during EPI sequence
Band [Hz] F3 Fz F4 Cz P3 P4
Delta [0–4] 8.701923 5.389222 1.234568 25.5102 7.480818 0.320513Theta [4–8] 29.81928 14.55823 35.43103 15.70048 1.09589 10.81395Alpha [8–12] 39.32039 63.72549 6.743421 6.218905 13 19.4186Beta1 [12–16] 17.66467 53.9823 3.947368 9.385965 6.840816 3.921569Beta2 [16–24] 13.39869 10.11984 7.027027 13.97059 1.639344 2.830189TOT 7.146446 20.47893 6.611227 15.62288 2.196259 2.445652
Percent variation for each channel, for each rhythm between the energy of amplitude spectrum of 1-min trace out of the EPI sequence (computed by usingthe average of amplitude spectrum before and after the EPI sequence), and the energy of amplitude spectrum during the EPI sequence (after adaptive filtering),of biological phantom. The amplitude spectrum was computed by real FFT of 2-s epochs averaging of 1-min traces considered. Note that the percent valueof the entire band considered, for each channel was more or less 9%, so the hypothesis of range variability was hence confirmed.
1183G. Garreffa et al. / Magnetic Resonance Imaging 21 (2003) 1175–1189

With the same modality used for the biologic phantom,humans studies were performed, the amplitude spectruminside the MR scanner was computed for 1 min recording ofeach channel (averaged along 2 s epoch length) in fourdifferent situations: before, during and after the EPI se-quence, and during the artifact filtering (Fig. 8)
In particular, to the subject we asked to close the eyes forall the duration of recording. In this condition it was foundthat, in all four situations (Fig. 8), the alpha rhythm ([8-12]Hz bandwidth) is more evident than the other rhythmsbecause the normal EEG activity was substituted by theinitial rest state (closed eyes).
The percent variation of the energy of the entire bandconsidered between the “before sequence” to the “aftersequence” was around 6.2%, hence the variability obtainedwas less relevant than the variability computed on the bio-logic phantom (9%) (Table 3).
Percentual Variation function: Vpband%
� abs((beforeband � afterband)/beforeband)
*100.
Similar variability values were obtained between the
Fig. 8. One-minute amplitude spectrum of four channels recorded of healthy male volunteer patient (age 30) inside the MR scanner. The amplitude spectrumwas computed by average of 2-s epoch FFT signal. Here are represented four different situations recording: (A) before EPI sequence (only static magneticfield effect); (B) after EPI sequence (only static magnetic field effect); (C) during EPI sequence (gradient fields, static magnetic field and RF pulse effects);and (D) during EPI sequence with adaptive filtering.
Table 3Percent variation for each channel: male healthy volunteer before and after EPI sequence
Band Fp1 Fp2 F7 F3 Fz F4 F8 T3 C3 Cz C4 T4 T5 P3 Pz P4 T6 O1 O2
Delta 7.94 12.8 27.59 3.23 9.17 12.61 5.80 2.22 2.96 8.92 21.53 9.30 2.02 5.20 4.20 2.32 1.69 55.72 38.85Theta 0.00 1.74 5.88 4.53 15.18 2.80 2.08 3.60 11.67 5.13 4.05 1.00 16.43 16.24 11.42 3.79 1.48 34.33 20.48Alpha 4.48 2.08 4.39 5.91 3.66 3.51 2.26 6.29 3.20 9.85 4.40 0.89 4.70 1.05 1.21 0.55 4.64 4.23 2.27Beta1 7.04 6.21 6.25 12.94 6.72 10.28 8.99 7.33 8.40 45.57 5.02 0.14 7.11 9.30 6.72 1.92 4.96 21.90 9.09Beta2 1.10 2.51 0.66 7.38 7.26 6.58 7.05 2.95 10.16 7.28 2.76 3.67 7.59 6.82 5.12 5.17 2.44 26.61 9.63TOT 3.62 4.99 5.29 2.70 8.34 7.67 4.35 2.46 1.22 11.46 4.27 1.76 1.85 1.85 0.70 0.18 0.88 33.63 20.75
Percent variation for each channel, for each rhythm between the energy of amplitude spectrum of 1-min trace before the EPI sequence, and the energy ofamplitude spectrum after the EPI sequence, of 30 aged male healthy volunteer. The amplitude spectrum was computed by real FFT of 2-s epochs averagingof 1-min traces considered. Note that the percent value of the entire band considered, for each channel was more or less 6.2%, so there is not significantvariation in energy.
1184 G. Garreffa et al. / Magnetic Resonance Imaging 21 (2003) 1175–1189

Fig. 9. Bar plot of energy computed for each channel recorded from the amplitude spectrum, in three different cases, related to delta rhythm (0-4) Hz. Notethat there is no substantial variability before, during (with artifact reduction), and after the EPI sequence.
Fig. 10. Bar plot of energy computed for each channel recorded from the amplitude spectrum, in three different cases, related to theta rhythm (4-8) Hz. Notethat there is no substantial variability before, during (with artifact reduction) and after the EPI sequence.
1185G. Garreffa et al. / Magnetic Resonance Imaging 21 (2003) 1175–1189

Fig. 11. Bar plot of energy computed for each channel recorded from the amplitude spectrum, in three different cases, related to alpha rhythm (8-12) Hz.Note that there is no substantial variability before, during (with artifact reduction), and after the EPI sequence.
Fig. 12. Bar plot of energy computed for each channel recorded from the amplitude spectrum, in three different cases, related to beta1 rhythm (12-16) Hz.Note that there is no substantial variability before, during (with artifact reduction), and after the EPI sequence.
1186 G. Garreffa et al. / Magnetic Resonance Imaging 21 (2003) 1175–1189

“before/after” sequence and the “cleaned” sequence, shownas follows (Figs. 9-13).
4. Conclusions
It has been proven that it is possible—in real-timemode—to remove quite completely the effects due to themagnetic fields of the EPI sequence during simultaneousEEG/fMRI acquisitions.
Best results were obtained during the time and frequencydomain validation, noting that there is no loss of informa-tion for each channel and for each band considered, and novariation in the shapes and amplitude of the traces. Thereal-time filtering allows us to directly monitor the EEG andthe patient behavior during the EPI acquisition.
In particular, the on-line filtering described above allowsclinicians to constantly monitor the patient during fMRI,and we retain this very important for pathologic subjects.Moreover, this becomes useful when the patient does notshow a suitable activity for fMRI study. In this case, it ispossible to avoid useless stress for the patient and a loss oftime and, for example, defer the EEG/fMRI acquisition.Concluding, real-time filtering combined with an optimalEPI protocol, does not modify the morphology and theamplitude of previous EEG activity (Fig. 14). In order toverify this, a study was performed on three pathologicsubjects, and representative results were summarized in Fig.
Fig. 13. Bar plot of energy computed for each channel recorded from the amplitude spectrum, in three different cases, related to beta2 rhythm (16-24) Hz.Note that there is no substantial variability before, during (with artifact reduction), and after the EPI sequence.
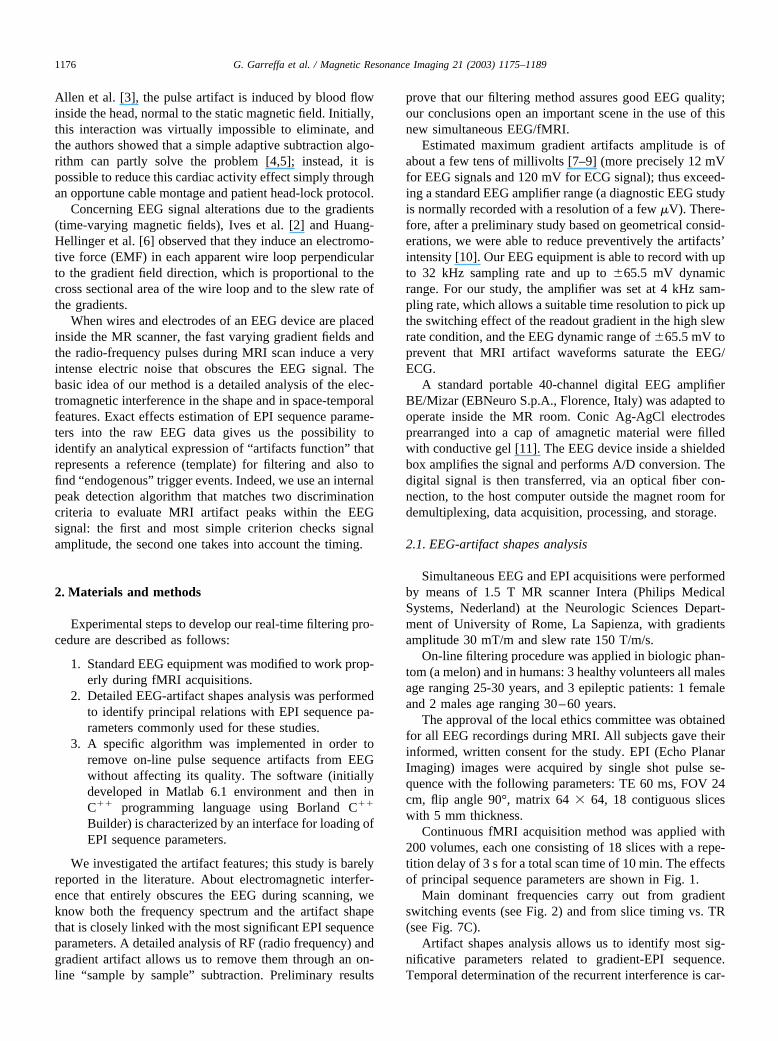
Fig. 14. Particular of EEG acquisition of epileptic patient before, during,and after the MRI scanning. The morphology and the amplitude of thespike activity during the MRI sequence is not changed in respect to thebefore and after EPI recording
1187G. Garreffa et al. / Magnetic Resonance Imaging 21 (2003) 1175–1189
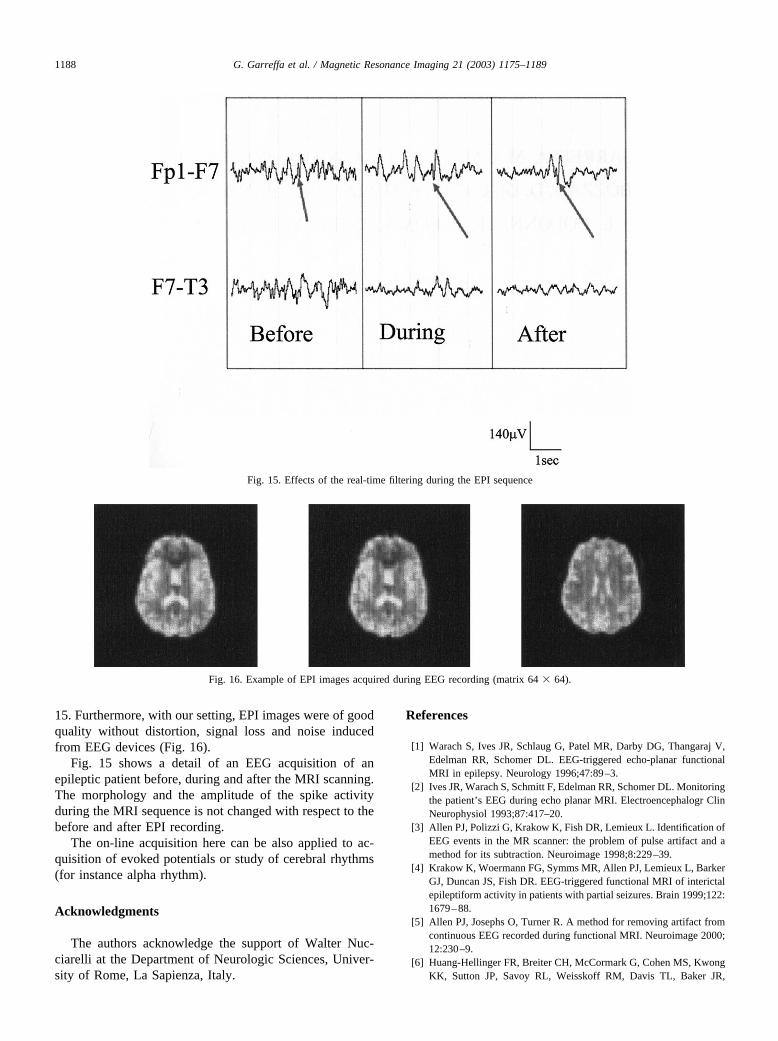
15. Furthermore, with our setting, EPI images were of goodquality without distortion, signal loss and noise inducedfrom EEG devices (Fig. 16).
Fig. 15 shows a detail of an EEG acquisition of anepileptic patient before, during and after the MRI scanning.The morphology and the amplitude of the spike activityduring the MRI sequence is not changed with respect to thebefore and after EPI recording.
The on-line acquisition here can be also applied to ac-quisition of evoked potentials or study of cerebral rhythms(for instance alpha rhythm).
Acknowledgments
The authors acknowledge the support of Walter Nuc-ciarelli at the Department of Neurologic Sciences, Univer-sity of Rome, La Sapienza, Italy.
References
[1] Warach S, Ives JR, Schlaug G, Patel MR, Darby DG, Thangaraj V,Edelman RR, Schomer DL. EEG-triggered echo-planar functionalMRI in epilepsy. Neurology 1996;47:89–3.
[2] Ives JR, Warach S, Schmitt F, Edelman RR, Schomer DL. Monitoringthe patient’s EEG during echo planar MRI. Electroencephalogr ClinNeurophysiol 1993;87:417–20.
[3] Allen PJ, Polizzi G, Krakow K, Fish DR, Lemieux L. Identification ofEEG events in the MR scanner: the problem of pulse artifact and amethod for its subtraction. Neuroimage 1998;8:229–39.
[4] Krakow K, Woermann FG, Symms MR, Allen PJ, Lemieux L, BarkerGJ, Duncan JS, Fish DR. EEG-triggered functional MRI of interictalepileptiform activity in patients with partial seizures. Brain 1999;122:1679–88.
[5] Allen PJ, Josephs O, Turner R. A method for removing artifact fromcontinuous EEG recorded during functional MRI. Neuroimage 2000;12:230–9.
[6] Huang-Hellinger FR, Breiter CH, McCormark G, Cohen MS, KwongKK, Sutton JP, Savoy RL, Weisskoff RM, Davis TL, Baker JR,
Fig. 15. Effects of the real-time filtering during the EPI sequence
Fig. 16. Example of EPI images acquired during EEG recording (matrix 64 � 64).
1188 G. Garreffa et al. / Magnetic Resonance Imaging 21 (2003) 1175–1189

Belliveau JW, Rosen BR. Simultaneous functional magnetic reso-nance imaging and electrophysiological recording. Hum Brain Map-ping 1995;3:13–23.
[7] Lemieux L, Allen PJ, Franconi F, Symms MR, Fish DR. Recordingof EEG during fMRI experiments: patient safety. Magn Reson Med1997;38:943–52.
[8] Hoffmann A, Jager L, Werhahn KJ, Jaschke M, Noachtar S, ReiserM. Electroencephalography during functional echo-planar imaging:detection of epileptic spikes using post-processing methods. MagnReson Med 2000;44:791–8.
[9] Benar CG, Aghakhani Y, Wang Y, Izenberg A, Al-Asmi A, DubeauF, Gotman J. Quality of EEG in simultaneous EEG-fMRI for epi-lepsy. Clin Neurophysiol 2003;114:569–80.
[10] Goldman RI, Stern JM, Engel J, Cohen MS. Acquiring simultaneousEEG and functional MRI. Clin Neurophysiol 2000;111:1974–80.
[11] Baumann SB, Noll DC. A modified electrode cap for EEG recordingsin MRI scanners. Clin Neurophysiol 1999;110:2189–93.
[12] Strobach P, Klaus A-F, Harer W. Event-synchronous cancellation ofthe heart interference in biomedical signals. IEEE Trans BiomedEngineer 1994;41:343–50.
1189G. Garreffa et al. / Magnetic Resonance Imaging 21 (2003) 1175–1189
Copyright © 2022 FDOKUMEN