Real time modeling, simulation and validation of protective ...
162
Mississippi State University Mississippi State University Scholars Junction Scholars Junction Theses and Dissertations Theses and Dissertations 12-11-2009 Real time modeling, simulation and validation of protective relays Real time modeling, simulation and validation of protective relays Ankush Saran Follow this and additional works at: https://scholarsjunction.msstate.edu/td Recommended Citation Recommended Citation Saran, Ankush, "Real time modeling, simulation and validation of protective relays" (2009). Theses and Dissertations. 3728. https://scholarsjunction.msstate.edu/td/3728 This Graduate Thesis - Open Access is brought to you for free and open access by the Theses and Dissertations at Scholars Junction. It has been accepted for inclusion in Theses and Dissertations by an authorized administrator of Scholars Junction. For more information, please contact [email protected].
-
Upload
khangminh22 -
Category
Documents
-
view
3 -
download
0
Transcript of Real time modeling, simulation and validation of protective ...
Mississippi State University Mississippi State University
Scholars Junction Scholars Junction
Theses and Dissertations Theses and Dissertations
12-11-2009
Real time modeling, simulation and validation of protective relays Real time modeling, simulation and validation of protective relays
Ankush Saran
Follow this and additional works at: https://scholarsjunction.msstate.edu/td
Recommended Citation Recommended Citation Saran, Ankush, "Real time modeling, simulation and validation of protective relays" (2009). Theses and Dissertations. 3728. https://scholarsjunction.msstate.edu/td/3728
This Graduate Thesis - Open Access is brought to you for free and open access by the Theses and Dissertations at Scholars Junction. It has been accepted for inclusion in Theses and Dissertations by an authorized administrator of Scholars Junction. For more information, please contact [email protected].

REAL TIME MODELING, SIMULATION AND VALIDATION OF PROTECTIVE
RELAYS
By
Ankush Saran
A Thesis Submitted to the Faculty of Mississippi State University
in Partial Fulfillment of the Requirements for the Degree of Master of Science
in Electrical Engineering in the Department of Electrical and Computer Engineering
Mississippi State, Mississippi
December 2009

Copyright by
Ankush Saran
2009

REAL TIME MODELING, SIMULATION AND VALIDATION OF PROTECTIVE
RELAYS
By
Ankush Saran
Approved:
_________________________________ _____________________________ Anurag K. Srivastava Noel N. Schulz Assistant Research Professor of Electrical Professor of Electrical and Computer Engineering and Computer Engineering (Director of Thesis and Major Advisor) (Committee Member) ______________________________ _____________________________ Herbert L. Ginn James E. Fowler Assistant Professor of Electrical and Professor and Director of Graduate Computer Engineering Studies, Electrical and Computer (Committee Member) Engineering _________________________________ Sarah A. Rajala Dean of Bagley College of Engineering Name: Ankush Saran
Date of Degree: December 11, 2009
Institution: Mississippi State University
Major Field: Electrical Engineering
Major Professor: Dr. Anurag K. Srivastava
Title of Study: REAL TIME MODELING, SIMULATION AND VALIDATION OF PROTECTIVE RELAYS Pages in Study: 144
Candidate for Degree of Master of Science
The protection system plays an important role in the power system to detect the
fault, isolate the faulted zone and restore the power supply to the healthy part. Terrestrial
power systems (TPS) as well as shipboard power system (SPS) test cases are developed
to conduct hardware in the loop (HIL) and the software in the loop (SIL) test using
commercial relays and a Real Time Digital Simulator (RTDS). The comparison of the
HIL and SIL simulation results were used to validate the develop software overcurrent
relay model.
This research work is further extended to implement multiple relay operation and
coordination tests on the SPS and TPS using multiple commercial hardware overcurrent
relays as well as multiple software relay models. In addition to modeling overcurrent
relay, a differential relay was also modeled using LabVIEW. The relay model was tested
for different types of fault conditions.

DEDICATION
This thesis work is dedicated to my mother and father
ii

ACKNOWLEDGMENTS
I would like to thank my major advisor Dr. Anurag K. Srivastava for his
constant support, keen interest and valuable advice, which kept me motivated through
out the research work. I would sincerely like to thank Dr. Noel N. Schulz and Dr.
Herbert Ginn for being on my graduate committee and helping me with their valuable
suggestions.
I would like to acknowledge the financial support provided by the Office of
Naval Research (ONR) for funding this research work.
I would like to extend my special thanks to Florida State University for
providing the specifications of the shipboard power system, Mississippi State
University (MSU) alumni’s Chengfeng Zhang, Sunil Kumar Palla and Vamsi Krishna
Vijapurapu and my colleagues, Padmavathy Kankanala, Krishnanjan Gubba
Ravikumar, Vinoth Mohan and Udita Singh.
iii

TABLE OF CONTENTS Page DEDICATION.................................................................................................................... ii
ACKNOWLEDGEMENT ................................................................................................. iii
LIST OF TABLES........................................................................................................... viii
LIST OF FIGURES ........................................................................................................... ix
CHAPTER
I. INTRODUCTION..........................................................................................1
1.1 Introduction.............................................................................................1 1.2 Overview of Protection System ..............................................................2 1.3 Why Protection Scheme is required in the Power System......................2 1.4 Problem Statement ..................................................................................3 1.5 Thesis Objective......................................................................................3 1.6 Thesis Organization ................................................................................6
II. BACKGROUND AND LITERATURE REVIEW.........................................8
2.1 Introduction.............................................................................................8 2.2 Previous Work ........................................................................................8 2.2.1 Hardware in the Loop platform....................................................9 2.2.2 Protective Relay Modeling ..........................................................9 2.2.3 Multiple Relay Coordination .....................................................10 2.3 Protection Schemes...............................................................................11 2.3.1 Protective Relays .......................................................................12 2.3.2 Protection Scheme Selection......................................................14 2.4 Hardware and Software Tools ..............................................................15 2.4.1 Real Time Digital Simulator (RTDS) ........................................15 2.4.1.1 RTDS Hardware..........................................................16 2.4.1.2 RTDS Software (RSCAD)..........................................17 2.4.2 SEL 351S Overcurrent Relay.....................................................19 2.4.3 GE D60 Distance Relay .............................................................20 2.4.4 LabVIEW Software ...................................................................21
iv

2.5 Test Case Power Systems .....................................................................21 2.5.1 Shipboard Power System (SPS) Characteristics ........................22 2.5.2 Terrestrial Power System (TPS) Characteristics........................24
2.5.2.1 Two-Bus Power System..............................................24 2.5.2.2 Eight-Bus Power System ............................................25
2.6 Hardware-in-the-Loop (HIL) Test ........................................................27 2.7 Software-in-the-Loop (SIL) Test ..........................................................30 2.8 Multiple Relay Coordination in a System.............................................32 2.9 Summary ...............................................................................................33
III. HARDWARE-IN-THE-LOOP (HIL)...........................................................34
3.1 Introduction...........................................................................................34
3.2 SEL 351S Overcurrent Relay Protection ..............................................34 3.2.1 Settings of the SEL 351S Overcurrent Relay ............................35 3.3 General Electric D60 Distance Relay Protection..................................39 3.4 Hardware-in-the-Loop (HIL) Setup......................................................41 3.5 Fault Inception Logic............................................................................45 3.6 Circuit Breaker Control Logic for HIL and SIL Test ...........................46 3.7 Hardware-in-the-Loop Test Using SEL 351S Overcurrent Relay and RTDS...................................................................................47 3.7.1 HIL test on eight-bus power system ..........................................47 3.7.2 HIL test on shipboard power system .........................................54 3.7.3 HIL test on two-bus power system ............................................57 3.8 Hardware-in-the-Loop Test using GE D60 Distance Relay and RTDS .......................................................................................59 3.8.1 HIL test on eight-bus power system ..........................................59 3.9 Summary ...............................................................................................64
IV. SOFTWARE RELAY MODEL DEVELOPMENT.....................................65
4.1 Introduction...........................................................................................65 4.2 Software Model of Overcurrent Relay in RSCAD ...............................65
4.2.1 Analog Signal Sampler ..............................................................66 4.2.1 Relay Logic to Open and Reclose the Breaker ..........................67 4.2.3 Circuit Breaker Control Logic for SIL Test...............................69 4.2.4 Basic Operation of SIL test........................................................69
4.3 Software-in-the-Loop Test using RTDS...............................................69 4.3.1 SIL test on eight-bus power system...........................................69 4.3.2 SIL test on shipboard power system ..........................................74 4.3.3 SIL test on two-bus power system.............................................76 4.4 Comparison of HIL and SIL Results ....................................................77
4.5 LabVIEW Differential Relay Modeling ...............................................81 4.5.1 Analog and Digital Filter ...........................................................82
v

4.5.2 Analog to Digital Converter.......................................................83 4.5.3 Comparator and Threshold Value..............................................83
4.6 Internal Mode of LabVIEW Differential Relay Model ........................83 4.7 Results for LabVIEW Differential Relay Model Operating in
Internal Mode............................................................................85 4.7.1 Single Line to Ground (L-G) Fault (Inside the protection
zone)..................................................................................85 4.7.2 Single Line to Ground (L-G) Fault (Outside the protection
zone)..................................................................................86 4.8 Summary ...............................................................................................88
V. MULTIPLE RELAY OPERATION AND RELAY COORDINATION .....89
5.1 Introduction...........................................................................................89 5.2 Procedure to connect two Hardware Relays to the RTDS....................89 5.3 Simulation Results with Multiple Hardware Relays in the System......92
5.3.1 Eight-Bus Power system............................................................92 5.3.2 Shipboard Power System ...........................................................97
5.4 Simulation Results with Multiple Software Relays in the System .....101 5.4.1 Eight-Bus Power system..........................................................102 5.4.2 Shipboard Power System .........................................................105
5.5 Coordination of Relays .......................................................................108 5.6 Simulation Results for Hardware Relay Coordination .......................109
5.6.1 Shipboard Power System .........................................................109 5.6.1.1 Case 1: Operation of breakers after FAULT 1.........111 5.6.1.2 Case 2 Operation of breakers after FAULT 2..........113 5.6.2 Eight-Bus Power System .........................................................115 5.6.2.1 Case 1: Operation of breakers after FAULT 1.........117 5.6.2.2 Case 2 Operation of breakers after FAULT 2..........119
5.7 Simulation Results for Software Relay Coordination.........................121 5.7.1 Shipboard Power System .........................................................122
5.7.1.1 Case 1: Operation of breakers after FAULT 1.........123 5.7.1.2 Case 2: Operation of breakers after FAULT 2.........125 5.7.2 Eight-Bus Power System .........................................................127 5.7.2.1 Case 1: Operation of breakers after FAULT 1.........128 5.7.2.2 Case 2: Operation of breakers after FAULT 2.........130 5.8 Comparison of Hardware and Software Relay Coordination .............132 5.9 Summary .............................................................................................134 VI. CONCLUSIONS AND FUTURE WORK.................................................136
6.1 Conclusions.........................................................................................136 6.2 Contributions.......................................................................................137 6.3 Future Work ........................................................................................138
vi

REFERENCES ................................................................................................................140
vii
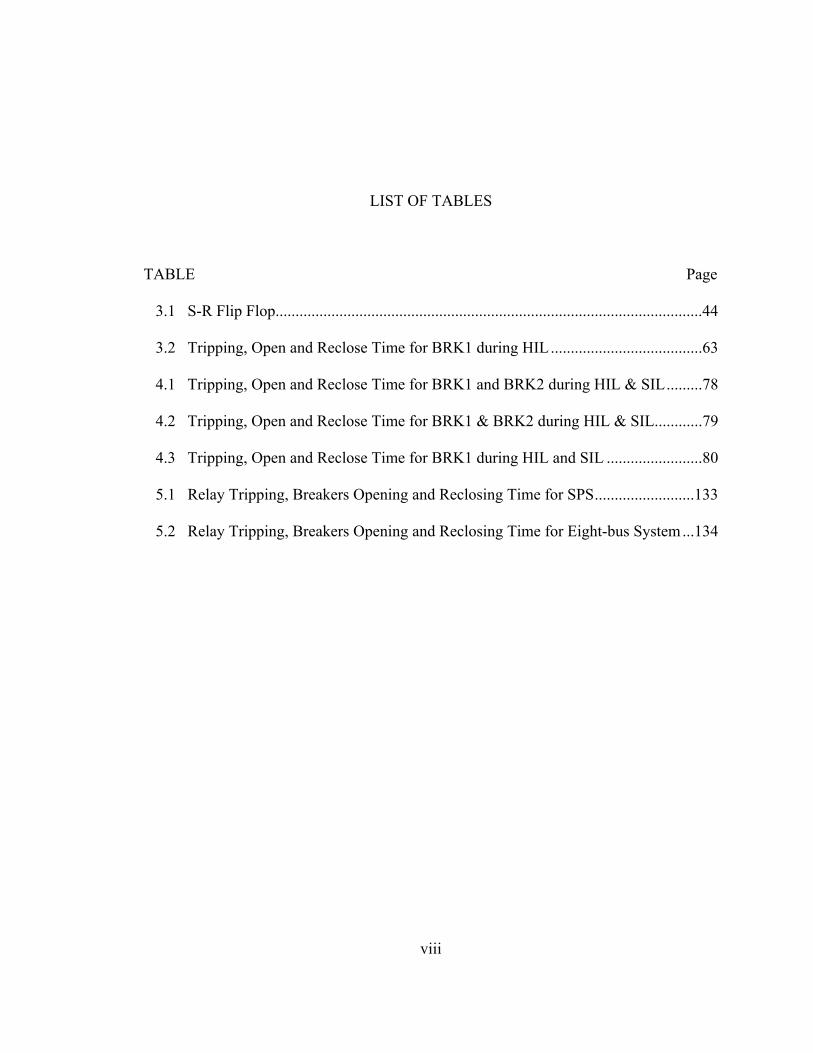
LIST OF TABLES
TABLE Page
3.1 S-R Flip Flop...........................................................................................................44
3.2 Tripping, Open and Reclose Time for BRK1 during HIL......................................63
4.1 Tripping, Open and Reclose Time for BRK1 and BRK2 during HIL & SIL.........78
4.2 Tripping, Open and Reclose Time for BRK1 & BRK2 during HIL & SIL............79
4.3 Tripping, Open and Reclose Time for BRK1 during HIL and SIL ........................80
5.1 Relay Tripping, Breakers Opening and Reclosing Time for SPS.........................133
5.2 Relay Tripping, Breakers Opening and Reclosing Time for Eight-bus System...134
viii
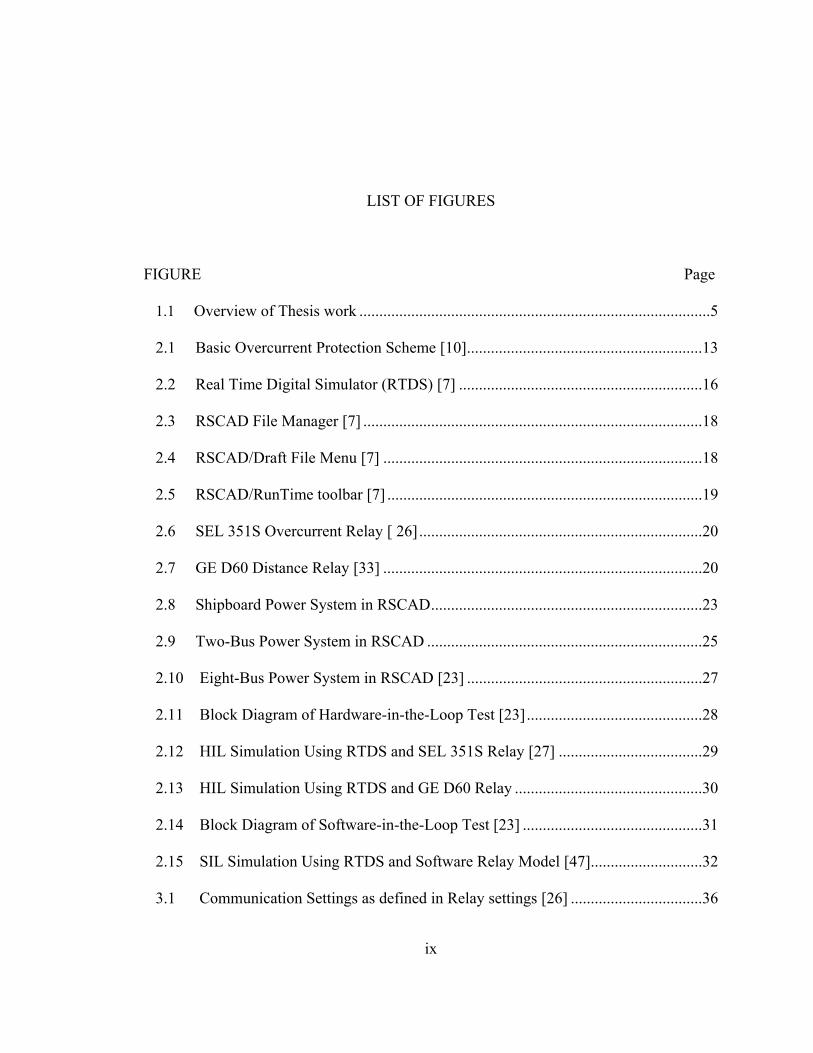
LIST OF FIGURES
FIGURE Page
1.1 Overview of Thesis work ........................................................................................5
2.1 Basic Overcurrent Protection Scheme [10]...........................................................13
2.2 Real Time Digital Simulator (RTDS) [7] .............................................................16
2.3 RSCAD File Manager [7] .....................................................................................18
2.4 RSCAD/Draft File Menu [7] ................................................................................18
2.5 RSCAD/RunTime toolbar [7] ...............................................................................19
2.6 SEL 351S Overcurrent Relay [ 26].......................................................................20
2.7 GE D60 Distance Relay [33] ................................................................................20
2.8 Shipboard Power System in RSCAD....................................................................23
2.9 Two-Bus Power System in RSCAD .....................................................................25
2.10 Eight-Bus Power System in RSCAD [23] ...........................................................27
2.11 Block Diagram of Hardware-in-the-Loop Test [23]............................................28
2.12 HIL Simulation Using RTDS and SEL 351S Relay [27] ....................................29
2.13 HIL Simulation Using RTDS and GE D60 Relay ...............................................30
2.14 Block Diagram of Software-in-the-Loop Test [23] .............................................31
2.15 SIL Simulation Using RTDS and Software Relay Model [47]............................32
3.1 Communication Settings as defined in Relay settings [26] .................................36
ix
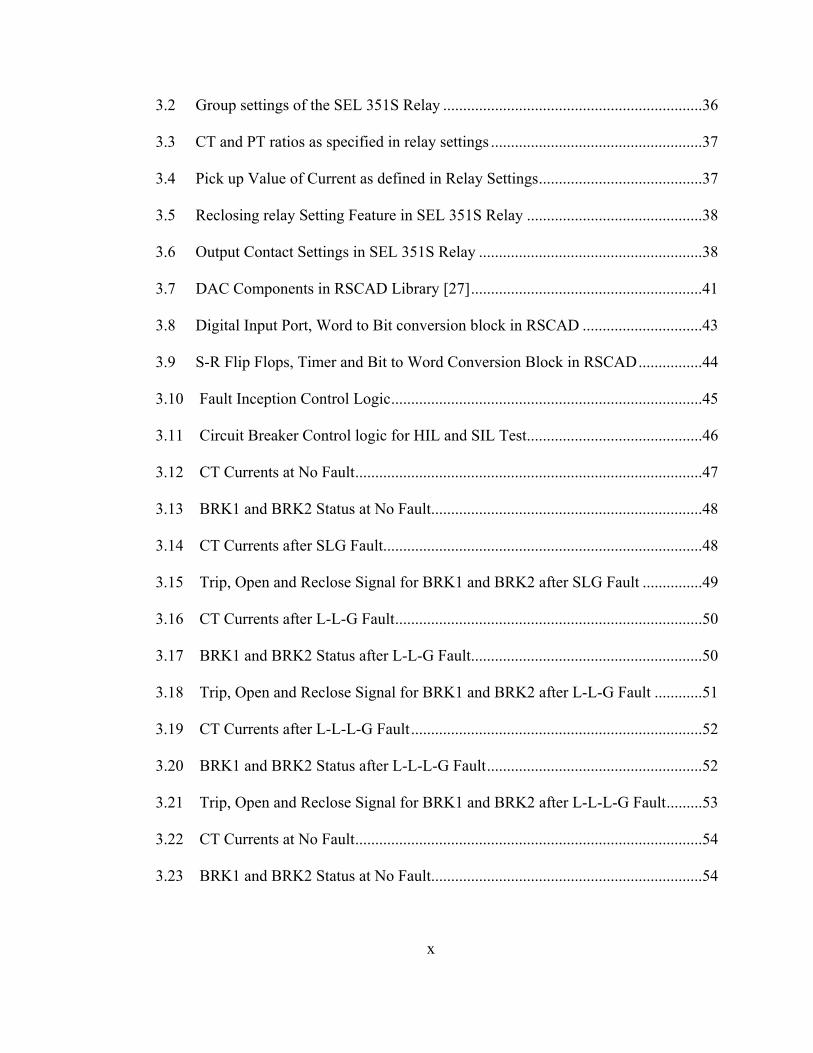
3.2 Group settings of the SEL 351S Relay .................................................................36
3.3 CT and PT ratios as specified in relay settings .....................................................37
3.4 Pick up Value of Current as defined in Relay Settings.........................................37
3.5 Reclosing relay Setting Feature in SEL 351S Relay ............................................38
3.6 Output Contact Settings in SEL 351S Relay ........................................................38
3.7 DAC Components in RSCAD Library [27]..........................................................41
3.8 Digital Input Port, Word to Bit conversion block in RSCAD ..............................43
3.9 S-R Flip Flops, Timer and Bit to Word Conversion Block in RSCAD................44
3.10 Fault Inception Control Logic..............................................................................45
3.11 Circuit Breaker Control logic for HIL and SIL Test............................................46
3.12 CT Currents at No Fault.......................................................................................47
3.13 BRK1 and BRK2 Status at No Fault....................................................................48
3.14 CT Currents after SLG Fault................................................................................48
3.15 Trip, Open and Reclose Signal for BRK1 and BRK2 after SLG Fault ...............49
3.16 CT Currents after L-L-G Fault.............................................................................50
3.17 BRK1 and BRK2 Status after L-L-G Fault..........................................................50
3.18 Trip, Open and Reclose Signal for BRK1 and BRK2 after L-L-G Fault ............51
3.19 CT Currents after L-L-L-G Fault.........................................................................52
3.20 BRK1 and BRK2 Status after L-L-L-G Fault......................................................52
3.21 Trip, Open and Reclose Signal for BRK1 and BRK2 after L-L-L-G Fault.........53
3.22 CT Currents at No Fault.......................................................................................54
3.23 BRK1 and BRK2 Status at No Fault....................................................................54
x

3.24 CT Currents after L-L-L-G Fault.........................................................................55
3.25 BRK1 and BRK2 Status after L-L-L-G Fault......................................................55
3.26 Trip, Open and Reclose Signal for BRK1 and BRK2 after L-L-L-G Fault.........56
3.27 CT Currents at No Fault.......................................................................................57
3.28 BRK1 Status at No Fault......................................................................................57
3.29 CT Currents after L-L-L-G Fault.........................................................................58
3.30 BRK1 Status after L-L-L-G Fault........................................................................58
3.31 Trip, Open and Reclose Signal for BRK1 after L-L-L-G Fault...........................59
3.32 RSCAD model of Modified Eight-bus Power System ........................................60
3.33 CT Currents at No Fault Condition......................................................................61
3.34 Voltage at Bus-8 at No Fault Condition ..............................................................61
3.35 CT Currents after L-L-L-G Fault.........................................................................62
3.36 Voltage at Bus-8 after L-L-L-G Fault..................................................................62
3.37 Trip, Open and Reclose Signal for BRK1 after L-L-L-G Fault...........................63
4.1 Analog Signal Sampler .........................................................................................67
4.2 Relay Logic to Open and Reclose the Breaker [23] .............................................68
4.3 CT current after SLG fault on phase A.................................................................70
4.4 Trip, Open and Reclose Signal for BRK1 and BRK2 after SLG Fault ................71
4.5 CT current after L-L-G fault on phase A and B....................................................72
4.6 Trip, Open and Reclose Signal for BRK1 and BRK2 after L-L-G Fault .............72
4.7 CT current after L-L-L-G fault on phase A B C...................................................73
4.8 Trip, Open and Reclose Signal for BRK1 and BRK2 after L-L-L-G Fault..........74
4.9 CT current after L-L-L-G fault on phase A B C...................................................75
xi

4.10 Trip, Open and Reclose Signal for BRK1 and BRK2 after L-L-L-G Fault.........75
4.11 CT current after L-L-L-G fault on phase A B C..................................................76
4.12 Trip, Open and Reclose Signals for BRK1 after L-L-L-G Fault .........................77
4.13 Basic Differential Relay Circuit [11]...................................................................82
4.14 Block diagram of the components of differential relay .......................................82
4.15 LabVIEW Differential Relay in Internal Model..................................................84
4.16 Power system model with fault on the bus ..........................................................85
4.17 L-G fault on Phase A (Inside the protection zone) ..............................................86
4.18 Power system model with fault on transmission line...........................................87
4.19 L-G fault on Phase A (Outside the protection zone)............................................87
5.1 DAC Components in RSCAD Library ................................................................90
5.2 Breaker Logic to Control BRK1 and BRK3........................................................91
5.3 Modified Eight-Bus System in RSCAD ..............................................................93
5.4 CT1 and CT3 Burden Currents at no fault condition...........................................94
5.5 CT1 currents, BRK1 and BRK2 Trip, Open and Reclose Signals after L-L-L-G ..................................................................................................96 5.6 CT3 currents, BRK3 and BRK4 Trip, Open and Reclose Signals after L-L-L-G ..................................................................................................97 5.7 Modified Shipboard Power System in RSCAD...................................................98
5.8 CT1 and CT3 Burden Currents at no fault condition...........................................99
5.9 CT1 currents, BRK1 and BRK2 Trip, Open & Reclose Signals after L-L-L-G ................................................................................................100 5.10 CT3 currents, BRK3 and BRK4 Trip, Open & Reclose Signals after L-L-L-G ................................................................................................101 5.11 RMS Calculator Block in RSCAD ....................................................................102
xii
5.11 CT1 currents, BRK1 and BRK2 Trip, Open & Reclose Signals after L-L-L-G ................................................................................................104 5.12 CT3 currents, BRK3 and BRK4 Trip, Open & Reclose Signals after L-L-L-G ................................................................................................105 5.13 CT1 currents, BRK1 and BRK2 Trip, Open & Reclose Signals after L-L-L-G ................................................................................................107 5.15 CT3 currents, BRK3 and BRK4 Trip, Open & Reclose Signals after L-L-L-G ................................................................................................108 5.16 Modified Shipboard Power System for Hardware Relay Coordination ............110
5.17 CT1 and CT2 Currents at No Fault Condition...................................................111
5.18 Operation of BRK1 and BRK2 after FAULT 1.................................................112
5.19 CT1 & CT2 currents after L-L-L-G FAULT 1..................................................112
5.20 BRK1 & BRK2 operation after L-L-L-G FAULT 1 .........................................113
5.21 Operation of BRK2 and BRK3 after FAULT 2.................................................114
5.22 CT1 & CT2 currents after L-L-L-G FAULT 2..................................................114
5.23 BRK2 & BRK3 operation after L-L-L-G FAULT 2 .........................................115
5.24 Modified eight-bus Power System for Hardware Relay Coordination..............116
5.25 CT1 and CT2 Currents at No Fault Condition...................................................117
5.26 Operation of BRK1 and BRK2 after FAULT 1.................................................118
5.27 CT1 & CT2 currents after L-L-L-G FAULT 1..................................................118
5.28 BRK1 & BRK2 operation after L-L-L-G FAULT 1 .........................................119
5.29 Operation of BRK1 and BRK3 after FAULT 2.................................................120
5.30 CT1 & CT2 currents after L-L-L-G FAULT 2..................................................120
5.31 BRK1 & BRK3 operation after L-L-L-G FAULT 2 .........................................121
5.32 Modified Software Overcurrent Relay Model for Relay Coordination .............122
xiii

5.33 Operation of BRK1 and BRK2 after FAULT 1.................................................124
5.34 CT1 & CT2 currents after L-L-L-G FAULT 1..................................................124
5.35 BRK1 & BRK2 operation after L-L-L-G FAULT 1 .........................................125
5.36 Operation of BRK2 and BRK3 after FAULT 2.................................................126
5.37 CT1 & CT2 currents after L-L-L-G FAULT 2..................................................126
5.38 BRK2 & BRK3 operation after L-L-L-G FAULT 2 .........................................127
5.39 Operation of BRK1 and BRK2 after FAULT 1.................................................129
5.40 CT1 & CT2 currents after L-L-L-G FAULT 1..................................................129
5.41 BRK1 & BRK2 operation after L-L-L-G FAULT 1 .........................................130
5.42 Operation of BRK1 and BRK3 after FAULT 2.................................................131
5.43 CT1 & CT2 currents after L-L-L-G FAULT 2..................................................131
5.44 BRK1 & BRK3 operation after L-L-L-G FAULT 2 ........................................132
xiv

CHAPTER I
INTRODUCTION
1.1 Introduction A shipboard power system (SPS) plays a vital role in the electric ship, which is
utilized for supplying power to different loads present on the ship such as the
communication system, navigation system, pulsed weapons and propulsion system.
Maintaining the continuity of power supply under varied conditions is a challenge and an
effective, efficient as well as economical protection scheme is the first step for SPS to
maintain the continuity of power supply.
The main requirements for the protection of any power system and especially for
SPS are dependability and rapid fault isolation. The shipboard power system needs to
provide power to the healthy part of the ship all the time even in adverse conditions.
Protective devices used in the protection scheme sense the fault and immediately take an
action to isolate the faulted zones. After the fault is cleared, the isolated parts of the SPS
are restored back and supplied with power. The isolation of the unhealthy zone and
restoration of power after a fault is cleared on the SPS are handled by the protection
system.
1
1.2 Overview of Protection System
The main aims of a protection system are: quick detection of faulted zone,
isolation of the unhealthy zone while supplying power to the healthy zone and restoration
of the power to the isolated zone after clearing of the fault. A protection system should
ensure the proper tripping of the circuit breakers present in the power system. The
protection system consists of protective devices like circuit breakers, protective relays,
fuses etc. There are different types of relays available for utility use like differential relay,
distance or impedance relay and overcurrent relay. The protection system, which has
mainly been studied and developed in this thesis work, is based on the overcurrent relay
protection. Directional overcurrent relay operates the circuit breaker upon the occurrence
of a fault based on the basic principle that when the fault current magnitude goes beyond
the threshold current (as specified in the relay setting) then the trip signal is generated by
the relay to open the circuit breaker. The protection schemes are explained in detail in
Chapter II of this thesis.
1.3 Why Protection Scheme is required in the Power System
The shipboard power system is a complex system and needs to maintain the
continuity of power supply in every part of the ship at all the time consistently. The
shipboard and terrestrial power systems are susceptible to different types of fault, which
may occur due to short circuit, overloading, over current, or over voltage resulting in the
loss of power supply. A protection system takes care of such scenarios and takes quick
actions in order to avoid catastrophic circumstances in the system. Protective devices like
fuses are used in the smaller system while circuit breakers operated by relays are used in
2
the large power system. The protection scheme utilized in the power system should act
according to the fault intensity and location. In other words, if a high intensity fault
occurs in a system for a longer duration then the chances of damage to the system are
more so the protection scheme should act fast in time as compared to the short duration
fault condition, which is less severe or intense.
1.4 Problem Statement
The objective of this work here was to determine the characteristics, ratings, and
settings of the protective devices to minimize fault effects on the system. Shipboard
power systems have different characteristics compared to terrestrial power system. There
is a need of integrated modeling and simulation of shipboard power system with an
embedded protection system. To do integrated modeling and simulation, a relay model
needs to be developed. To validate these relay models the hardware in the loop
simulation technique is established.
1.5 Thesis Objective
The circumstances causing undesired behavior are usually unpredictable; however,
sound design and preventive maintenance can reduce the likelihood of system problems.
The electrical system, therefore, should be designed and maintained to protect itself
automatically. The objectives of electrical system protection are summarized as:
1. Limit the extent and duration of service interruption whenever equipment
failure, human error, or adverse natural events occur on any part of the system
2. Minimize damage to the system components involved in the failure.
3

The present day power systems are highly complex and the continuity of power
supply has become a necessary requirement. In order to maintain the power supply
continuity at all the time from the power system, a protection system with high
efficiency, consistency and economy is required which can detect the fault immediately
and takes the remedial measures as quickly as possible. The main objective of this work
is to integrate the power, control and protection system to develop an integrated
protection scheme. The overcurrent protection scheme is selected to implement on the
shipboard power system (SPS) as well as on the terrestrial power system (TPS). The test
case systems are built in RSCAD software, which will be explained in the Chapter II of
this thesis. The shipboard and terrestrial systems are selected so that the protection
scheme can be tested on both the shipboard power system as well as the terrestrial power
system, which are completely different in their topology. Figure 1.1 gives an overview of
the tasks that have been accomplished during this thesis work.
The first step towards the objective was to set up a hardware interface to conduct
the hardware in the loop (HIL) test on the power system test cases using protective relay
and Real Time Digital Simulator (RTDS). The protective relays from two vendors are
used to conduct the HIL test on SPS and TPS. The second step was to develop the
software overcurrent relay model and test it for the same test case power systems for
similar fault scenarios as software in the loop (SIL) test. The HIL and SIL simulation
results are compared to validate the software model of overcurrent relay.
4

Figure 1.1 Overview of Thesis work
After the validation of the software overcurrent relay model, the next step is to
conduct the more complex applications in the power system protection like multiple relay
operation, relay coordination etc in the SPS and TPS. In multiple relay operation,
multiple numbers of relays are used to protect different parts of the power system during
5

fault conditions while in relay coordination technique, different relays are made to
operate in a timely manner in order to provide primary protection for its own zone and
back up protection for the other zone. The simulation results of the multiple hardware
relay operation and relay coordination tests provide an outline to modify the software
overcurrent relay model.
In this thesis work, the LabVIEW software was also used in order to develop a
software differential relay model. The developed differential relay model was
successfully tested for different fault conditions.
1.6 Thesis Organization
This thesis consists of seven chapters. Chapter I gives an overview of the work
done in this thesis. Chapter II will give a literature review, an introduction to test cases as
well as software and hardware tools. Chapter II also gives detailed information about how
the HIL and SIL test are conducted in real time.
Chapter III explains the HIL test using SEL 351S overcurrent relay (or GE D60
distance relay) and Real Time Digital Simulator (RTDS). The interfacing of the software
model of test case power system compiled on RTDS with the hardware relay and relay
settings are also explained in this chapter. This chapter also presents the simulation
results for the real time HIL test conducted on the terrestrial as well as on the shipboard
power system using SEL 351S overcurrent relay (or GE D60 distance relay). Chapter IV
illustrates the step-by-step procedure to design the software model of SEL 351S over
current relay and how it is implemented to perform the SIL test on the test case power
system. The results of the SIL test for different test cases are presented and the
6

comparison of the results of the HIL and SIL results validates the relay model. The
procedures to develop the LabVIEW differential relay model including the simulation
result are presented. Chapter V explains how the hardware and software model of relays
together can be used at different locations in test cases to protect the power system. This
chapter shows the simulation results for the multiple relay and relay coordination tests
conducted on the shipboard as well as on the eight-bus power system.
Chapter VI concludes the thesis by providing a summary of all the work done in
this thesis and proposing some of the potential future work.
7

CHAPTER II
BACKGROUND AND LITERATURE REVIEW
2.1 Introduction
This chapter gives an introduction and background of various topics needed to
perform research work in this thesis work. Different protection schemes implemented in
the power system are briefly explained and the importance of the overcurrent protection
scheme is explained in detail. The specifications of the terrestrial and shipboard power
system test cases in RSCAD software are explained in detail. The hardware and software
tools like RTDS, RSCAD software, SEL 351 overcurrent relay, GE D60 distance relay,
and LabVIEW software are also discussed. An overview of the importance of the
hardware–in-the-loop and software-in-the-loop test is also presented.
2.2 Previous Work
This part of the chapter gives an overview of the previous work on the real time
HIL simulation and related work.
8
2.2.1 Hardware in the Loop platform
Zhang and Vijapurapu et al. [10] [11] had created a test bed platform to simulate
the hardware in the loop test in real time using SEL 421 impedance relay in the RSCAD
software to be simulated on RTDS [6]. The terrestrial (8-bus) power system is used to
conduct the HIL test for different fault conditions [11]. The real time hardware-in-the-
loop test was conducted successfully using SEL 421 impedance relay and RTDS for
different types of line to ground fault on the eight-bus power system [11] [6]. The
commercially available SEL 421 impedance relay [6] was interfaced with RTDS to
simulate single-line to ground and double-line to ground fault for the test case power
system [7].
Reference [8] presents the closed loop test conducted between the RTDS and
311C overcurrent relay for fault conditions on different parts of the radial power system
designed in RSCAD. The hardware requirements and modeling issues related to closed
loop testing with a relay in real time are discussed in detail [42] [43].
2.2.2 Protective Relay Modeling
Palla et al. [9] had developed the overcurrent relay model in the LabView
software. The LabVIEW overcurrent relay model is simulated on the shipboard power
system and terrestrial power systems in real time for different fault conditions using
national instruments (NI-PXI) [21] [38]. Development of the hardware in the loop
platform using NI-PXI was also presented in [9].
9
An instantaneous overcurrent relay model was developed in MATLAB/Simulink
and simulated in real time by using dSPACE controller hardware [10] [42]. The software
relay model was tested for different contingencies in several hardware-in-the-loop
platforms, including RTDS, VTBRT and NI [9] [10] [23]. The simulation results verify
that the developed overcurrent relay model performed successfully with different types of
software tools [43]. Saran et al [23] proposed a software model for an overcurrent relay,
which comprised of analog signal sampler and breaker logic to open and reclose the
breakers in RSCAD [23].
Vijapurapu et al. [11] had developed a protective relay model for the shipboard
power system utilizing bus differential protection scheme. The hardware-in-the-loop
testing for different fault conditions was done on the shipboard as well as on the
terrestrial power system developed in RSCAD [7] using SEL 487B differential relay and
RTDS [11]. The results obtained from the HIL test were utilized to develop a software
model of the differential relay [11]. The software in the loop test was performed on the
same test case power system under similar fault conditions to validate the bus differential
protection scheme.
The modeling of the software model of impedance relay in RSCAD and real time
simulation results for a test case power system were presented in reference [12] [6]. The
test case power system was simulated on RTDS for different contingencies.
2.2.3 Multiple Relay Coordination
Real time protective relay coordination is a widely used technique from decades
by power system utilities in order to protect the system [13, 14]. Relay coordination
concept is not new but it has been modified with the advancement in the power industry
[15]. Initially, the power system parameters were calculated manually to set the relays,
10
which in turn helped to utilize multiple relays in a system in order to protect the system
from damages for certain types of faults. After the development of computer aided
methods of relay coordination it became easier to predict the impact of a fault on the
system and to design the proper time delay between the operations of relays present at
different locations in the power system. Many methods were adopted for the relay
coordination using GAMS (General Algebraic Modeling Systems) technology [16],
computer aided relay coordination [17], Genetic Algorithm method of relay coordination
[18] and other intelligent automatic coordination of relays technique [19,20].
Research efforts at Mississippi State University are working in direction of
designing an integrated adaptive relay. A simple relay model has been developed and
hardware in the loop platforms were developed to validate the developed model [6, 21,
22]. In this work, the relay model has been developed and integrated with the power
system model [23]. Test cases have been developed to demonstrate coordination of two
software relay models using the RTDS [32]. Final objective is to design an integrated
adaptive relay incorporating all developed models in one box [44].
2.3 Protection Schemes
The power system can be protected against the fault conditions by using an
appropriate protection scheme, which should be fast, reliable, efficient and economic [3].
The protective relays are positioned at different locations in the power system to act
based on monitoring of the system variables (like currents and voltages) of the specific
protection zone in the power system [48]. The protection system consists of current
11
transformer (CT), potential transformer (PT), circuit breakers and relays (e.g. differential
relays, impedance relay and overcurrent relay).
2.3.1 Protective Relays
Protective relay can be defined as “a device whose function is to detect defective
lines or apparatus or other power system conditions of an abnormal or dangerous nature
and to initiate appropriate control circuit action [50].” The function of a specific
protective relay can be thought of as either primary or backup. When a relay is applied to
protect its own system element (or zone of protection) then it is referred as a primary
relay; but when the relay is used as a backup for other relays when the fault is located at a
remote location then those relays are referred as a backup relay [24]. Usually, a specific
relay is providing both functions simultaneously; that is, it is serving as a primary relay
for its own zone of protection and as a backup relay for remote zones of protection. Most
commonly used relays for the protection of power systems are explained here.
Differential protection is a very reliable method of protecting transformers and
buses from the internal faults [11]. Differential relays are based on the principle that
when the magnitude difference between the two or multiple input currents exceed a
specified limit then the relay sends a trip signal to the simulated circuit breaker in order to
protect the specific zone of the power system [35]. In a differential protection scheme,
currents on both sides of the equipment are measured by using current transformers
(CTs). For example, consider that CT1 and CT2 are present on two opposite sides of the
equipment to be protected. The current measured by the secondary of CT1 and CT2 are I1
and I2 [11]. Under normal conditions, I1 = I2 and no difference of current flows through
12

the relay. Now, if a fault occurs inside protected zone then currents I1 and I2 no longer
remains equal and a difference of current occurs which is sent to the relay coil that allows
the relay to send a trip signal to open the circuit breaker in order to protect the equipment
from damaging [49].
Overcurrent relays are used for the protection of transmission lines, transformers,
generators and motors [9] [23] [38]. For most large, medium-voltage systems,
overcurrent protection are used only as a backup for primary protection [50] [24]. Figure
2.1 shows the basic diagram of the overcurrent protection scheme for the transmission
line protection having current transformer, potential transformer and circuit breaker [25].
The operating principle of overcurrent relay can be described as when the current in the
transmission line exceeds the threshold value of the current specified in the relay settings
then the relay sends a trip signal to open the circuit breaker to isolate the faulted zone
from the un-faulted zone [26]. The overcurrent relay is connected to a current
transformer and calibrated to operate at or above a specific current level. Relay operation
causes control action to open one or more contacts of the circuit breaker [24]. The
overcurrent protection scheme is widely used for the protection of power system devices
because of its quick operation at all voltage levels [50].
Figure 2.1 Basic Overcurrent Protection Scheme [10]
13

The overcurrent relays can be classified as: instantaneous and time overcurrent
relays. Instantaneous Relays operate without intentional time delay. They are used for
faults close to the source when the fault current is very high. The operating time is
approximately 10 ms. Time Overcurrent Relays operate with a time delay. The time
delay is adjustable. For a given setting, the actual time delay depends on the current
through the relay coil. In general, higher currents will cause a faster operation of the
relay. The minimum current at which the relay operates (pick-up current) is also
adjustable [25].
Distance or impedance relays are generally used for the protection of transmission
line [46]. The distance relays are similar in operation as the overcurrent relay but have
more functionality as compared to the overcurrent relay. Impedance relays are used
whenever overcurrent relays do not provide adequate protection e.g.:- they function even
if the short circuit current is relatively low. Impedance relays monitor the impedance
between the relay location and the fault. The speed of operation is independent of current
magnitude.
2.3.2 Protection Scheme Selection
The major challenge is to select the best protection scheme to protect the power
system. The protection scheme for a given power system can be selected by considering
different system parameters like type of grounding, line impedances, number of sources
and line/cable length. There are different protection schemes with their own advantages
and disadvantages that can be used for the power system protection like differential,
overcurrent and distance protection [48]. The distance protection scheme can not be used
14
in the SPS because of the short cable length. Therefore, overcurrent protection and
differential relay schemes are considered as the suitable protection scheme for the
shipboard power system.
The shipboard power system is small in size geographically, which makes the
overcurrent protection scheme appropriate for the protection of various zones of the
power system. [10]
2.4 Hardware and Software Tools
2.4.1 Real Time Digital Simulator (RTDS)
The Real Time Digital Simulator (RTDS) is a widely used tool for the design,
development, and testing of small as well as large power system protection and control
schemes in real time. RTDS can be used for the investigation, development, and
integration of new and complex power system components [7]. It enables the user to
study both the device itself and the response of the existing power system to its operation
(or misoperation). Real time simulation is a commonly used tool for studying power
system behavior in response to events and to analyze the system under different fault
conditions. This kind of virtual test could uncover potential problems in advance and the
corrective measures could then be taken before implementing the algorithm or logic in
the real system [29].
The RTDS allows users to accurately develop their models in RSCAD software
and simulate them efficiently in real time. RTDS employs high-speed DSP (digital signal
processor) chips to compute simulations results with simulation step sizes as small as two
15
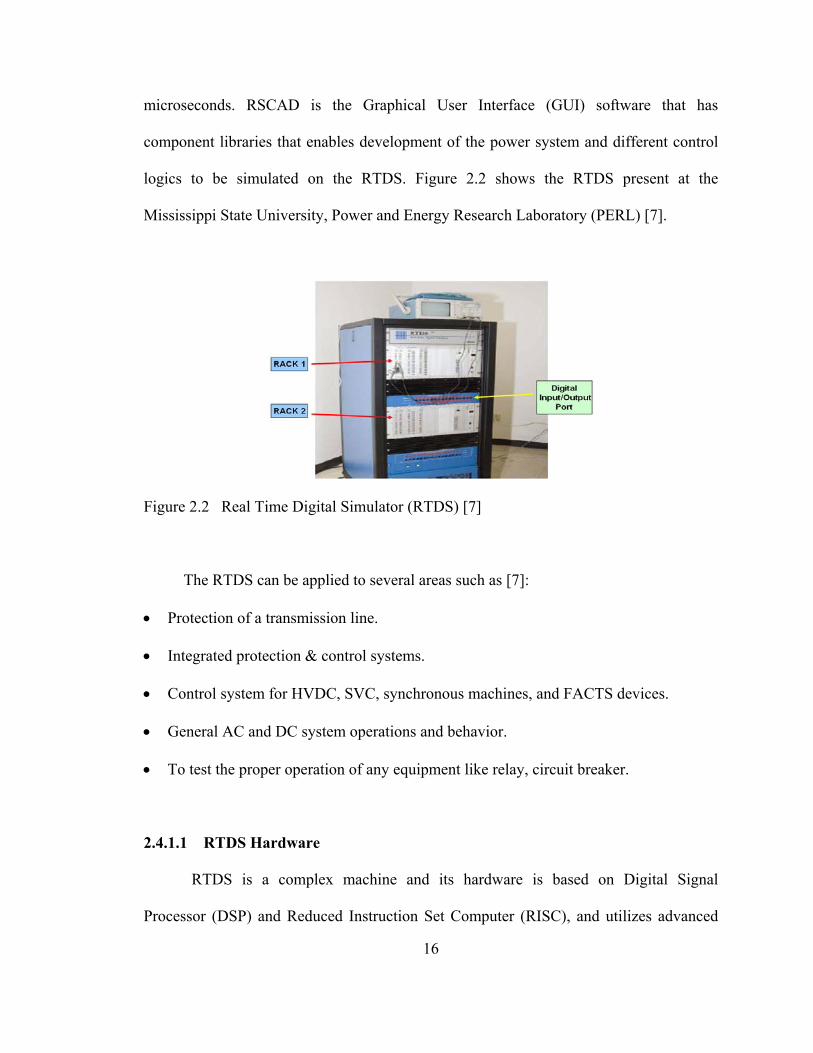
microseconds. RSCAD is the Graphical User Interface (GUI) software that has
component libraries that enables development of the power system and different control
logics to be simulated on the RTDS. Figure 2.2 shows the RTDS present at the
Mississippi State University, Power and Energy Research Laboratory (PERL) [7].
Figure 2.2 Real Time Digital Simulator (RTDS) [7]
The RTDS can be applied to several areas such as [7]:
• Protection of a transmission line.
• Integrated protection & control systems.
• Control system for HVDC, SVC, synchronous machines, and FACTS devices.
• General AC and DC system operations and behavior.
• To test the proper operation of any equipment like relay, circuit breaker.
2.4.1.1 RTDS Hardware
RTDS is a complex machine and its hardware is based on Digital Signal
Processor (DSP) and Reduced Instruction Set Computer (RISC), and utilizes advanced
16

parallel processing techniques, which provide faster computational speeds required to
maintain continuous operation in real-time. One rack of RTDS consists of three types of
processor cards and these are 3PC, GPC and RPC. 3PC is locally known as Triple
Processor Card which includes three independent Analog Digital Signal Processors
(ADSP21062) having clock speed of 40 MHz. RPC referred as RISC Processor card
consists of two PowerPC 750Cxe RISC processors operating at a clock speed of 600
MHz. The Giga Processor Card is abbreviated as GPC, which combines two IBM
PowerPC 750GX RISC processors each operating at 1 GHz. The RTDS simulator is
available in different configurations having only 3PC or having a combination of all the
3PC, GPC and RPC cards [7].
2.4.1.2 RTDS Software (RSCAD)
The Graphical User Interface known as RSCAD is used to construct, run and
analyze the simulation test cases. RSCAD allows the user to build a test case by using the
different power and control system components present in the RSCAD library [7]. The
following steps are required to prepare and run a new simulation case.
• Start the RSCAD/Draft software module.
• Create a new ‘Project’ and ‘Case’ directory in the ‘File Manager’ module.
• Create the new circuit diagram for simulation.
• Compile the new circuit.
• Start the simulation case from RSCAD/RunTime.
The RSCAD/Draft software module helps to create the power system model by
using the libraries present in the RSCAD component libraries and then the power system
17

model will be simulated in real time using RTDS. Figure 2.3 shows the file manager of
RSCAD. The RSCAD/Draft file menu is shown in Figure 2.4.
Figure 2.3 RSCAD File Manager [7]
Figure 2.4 RSCAD/Draft File Menu [7]
After the successful development of the power system model in draft mode, the
system is compiled and simulated on the RSCAD/RunTime software module. In
RunTime module, the graphs for different physical quantities like voltage, current,
power, and frequency can be plotted. Switches, buttons, meters and sliders are added in
the RunTime module for fault application or to observe different physical quantities.
Figure 2.5 shows the RSCAD/ RunTime toolbar.
18
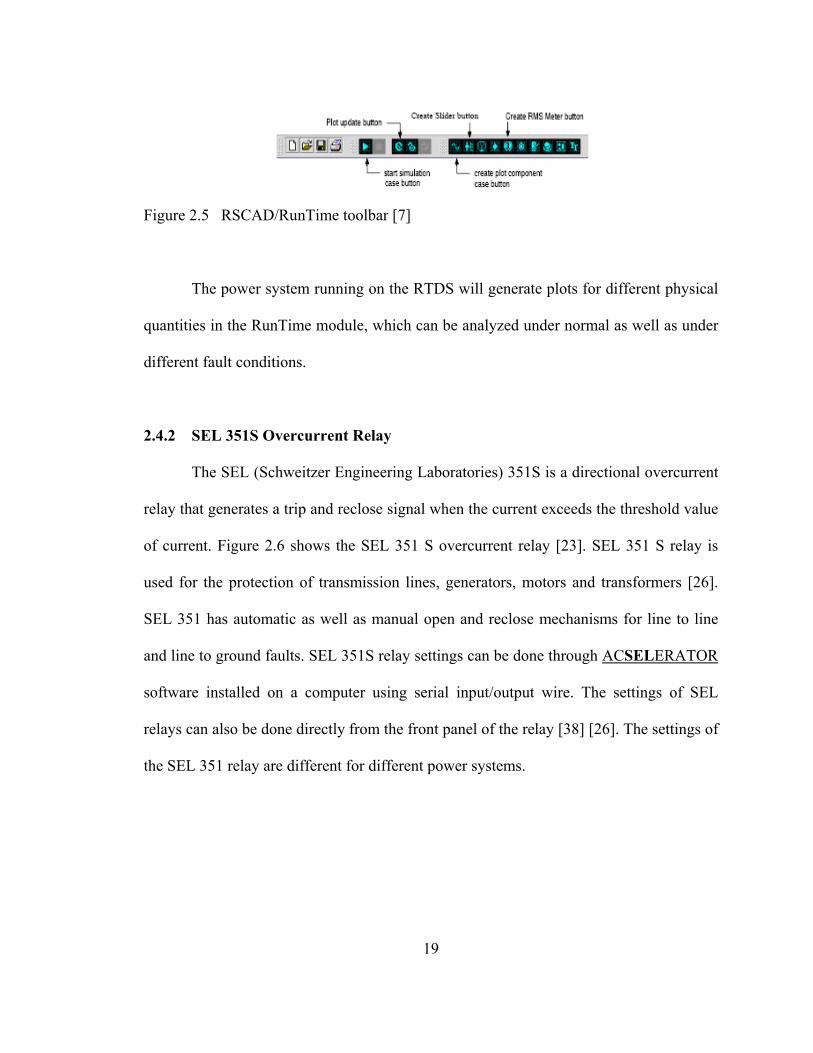
Figure 2.5 RSCAD/RunTime toolbar [7]
The power system running on the RTDS will generate plots for different physical
quantities in the RunTime module, which can be analyzed under normal as well as under
different fault conditions.
2.4.2 SEL 351S Overcurrent Relay
The SEL (Schweitzer Engineering Laboratories) 351S is a directional overcurrent
relay that generates a trip and reclose signal when the current exceeds the threshold value
of current. Figure 2.6 shows the SEL 351 S overcurrent relay [23]. SEL 351 S relay is
used for the protection of transmission lines, generators, motors and transformers [26].
SEL 351 has automatic as well as manual open and reclose mechanisms for line to line
and line to ground faults. SEL 351S relay settings can be done through ACSELERATOR
software installed on a computer using serial input/output wire. The settings of SEL
relays can also be done directly from the front panel of the relay [38] [26]. The settings of
the SEL 351 relay are different for different power systems.
19
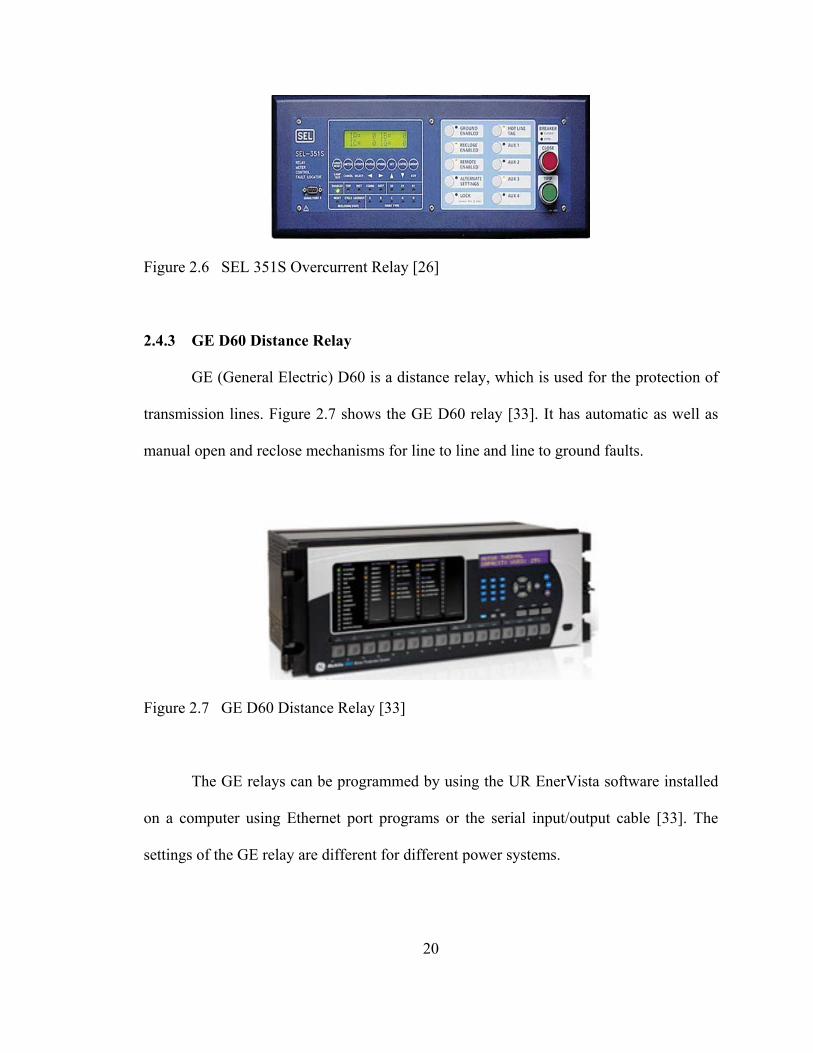
Figure 2.6 SEL 351S Overcurrent Relay [26]
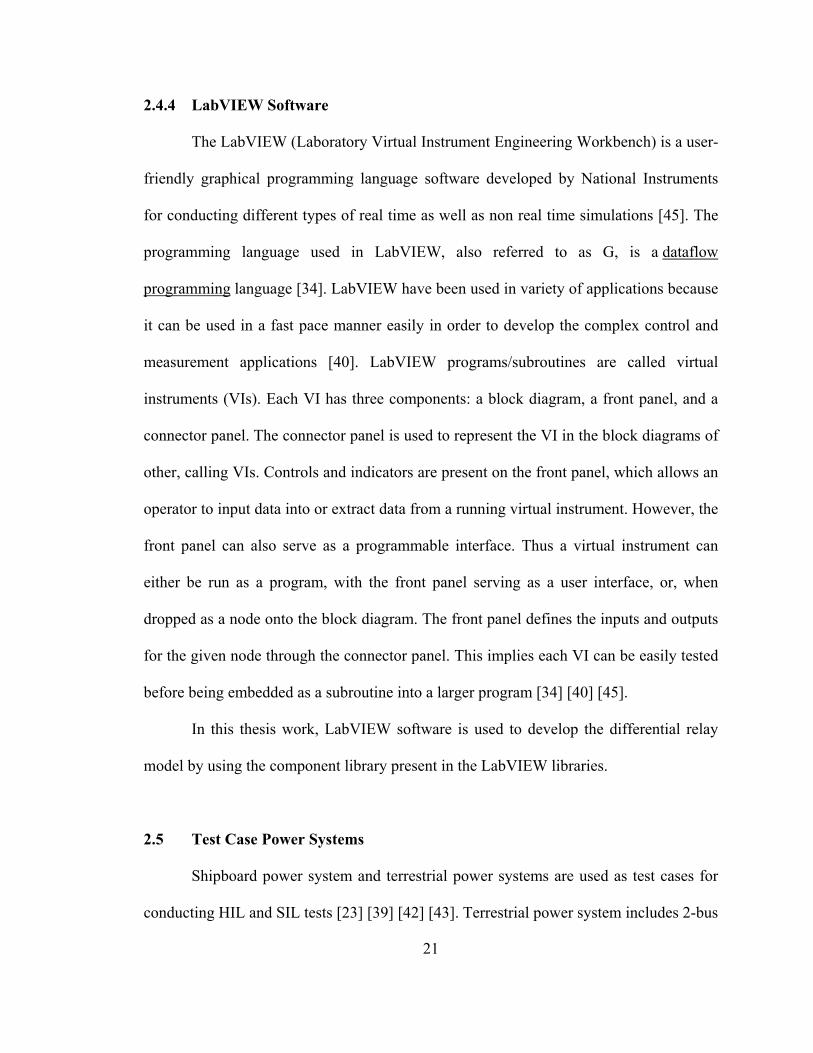
2.4.3 GE D60 Distance Relay
GE (General Electric) D60 is a distance relay, which is used for the protection of
transmission lines. Figure 2.7 shows the GE D60 relay [33]. It has automatic as well as
manual open and reclose mechanisms for line to line and line to ground faults.
Figure 2.7 GE D60 Distance Relay [33]
The GE relays can be programmed by using the UR EnerVista software installed
on a computer using Ethernet port programs or the serial input/output cable [33]. The
settings of the GE relay are different for different power systems.
20
2.4.4 LabVIEW Software
The LabVIEW (Laboratory Virtual Instrument Engineering Workbench) is a user-
friendly graphical programming language software developed by National Instruments
for conducting different types of real time as well as non real time simulations [45]. The
programming language used in LabVIEW, also referred to as G, is a dataflow
programming language [34]. LabVIEW have been used in variety of applications because
it can be used in a fast pace manner easily in order to develop the complex control and
measurement applications [40]. LabVIEW programs/subroutines are called virtual
instruments (VIs). Each VI has three components: a block diagram, a front panel, and a
connector panel. The connector panel is used to represent the VI in the block diagrams of
other, calling VIs. Controls and indicators are present on the front panel, which allows an
operator to input data into or extract data from a running virtual instrument. However, the
front panel can also serve as a programmable interface. Thus a virtual instrument can
either be run as a program, with the front panel serving as a user interface, or, when
dropped as a node onto the block diagram. The front panel defines the inputs and outputs
for the given node through the connector panel. This implies each VI can be easily tested
before being embedded as a subroutine into a larger program [34] [40] [45].
In this thesis work, LabVIEW software is used to develop the differential relay
model by using the component library present in the LabVIEW libraries.
2.5 Test Case Power Systems
Shipboard power system and terrestrial power systems are used as test cases for
conducting HIL and SIL tests [23] [39] [42] [43]. Terrestrial power system includes 2-bus
21
and 8-bus power system while shipboard power system is a 4-bus system. The test case
power systems are developed in RSCAD software by using the component and power
system libraries present in the RSCAD draft file [7].
2.5.1 Shipboard Power System (SPS) Characteristics
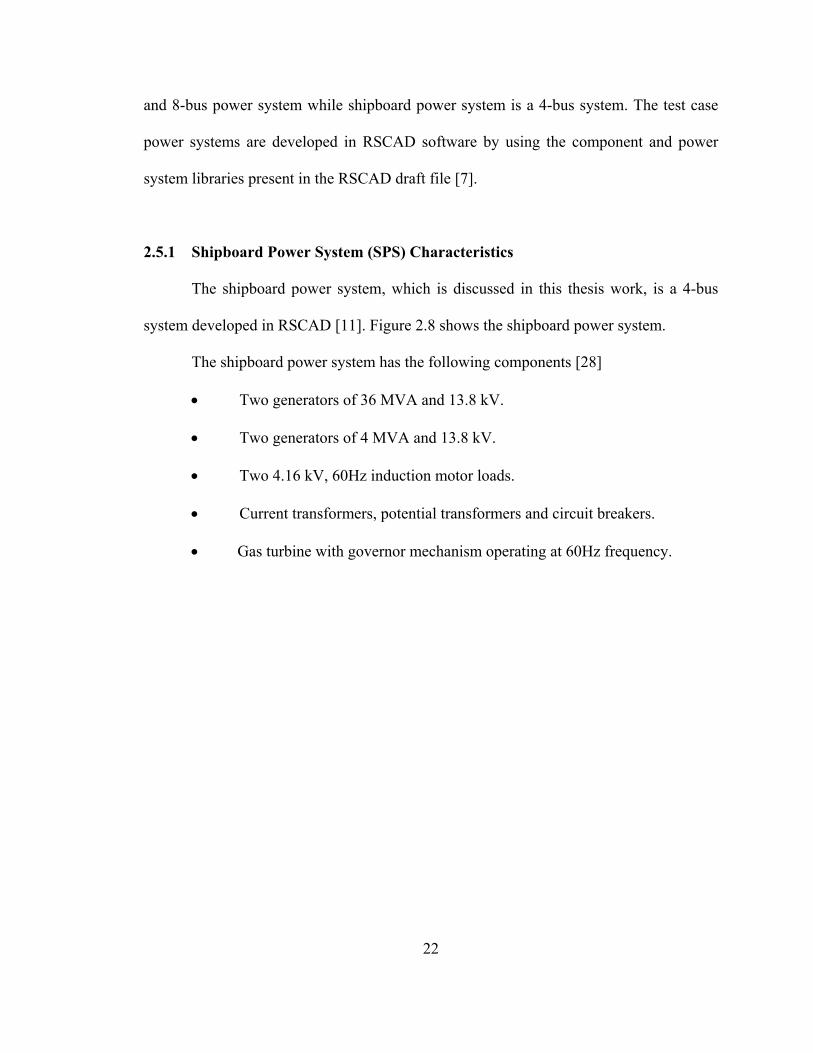
The shipboard power system, which is discussed in this thesis work, is a 4-bus
system developed in RSCAD [11]. Figure 2.8 shows the shipboard power system.
The shipboard power system has the following components [28]
• Two generators of 36 MVA and 13.8 kV.
• Two generators of 4 MVA and 13.8 kV.
• Two 4.16 kV, 60Hz induction motor loads.
• Current transformers, potential transformers and circuit breakers.
• Gas turbine with governor mechanism operating at 60Hz frequency.
22
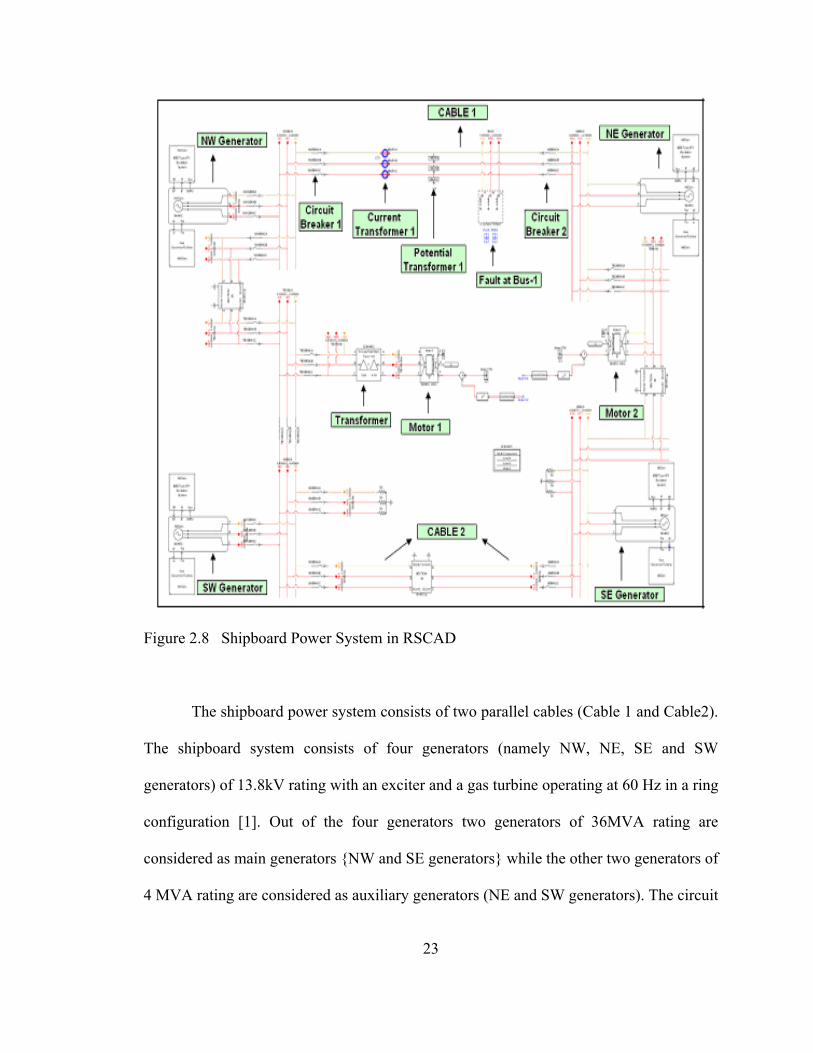
Figure 2.8 Shipboard Power System in RSCAD
The shipboard power system consists of two parallel cables (Cable 1 and Cable2).
The shipboard system consists of four generators (namely NW, NE, SE and SW
generators) of 13.8kV rating with an exciter and a gas turbine operating at 60 Hz in a ring
configuration [1]. Out of the four generators two generators of 36MVA rating are
considered as main generators {NW and SE generators} while the other two generators of
4 MVA rating are considered as auxiliary generators (NE and SW generators). The circuit
23

breakers are located at different locations in the power system. BRK1 and BRK2 are
present on cable 1 as shown in the Figure 2.9. There are two types of loads present in the
shipboard power system: vital and non-vital loads. The vital loads are those loads, which
are to be feed with power at all the time in the ship under normal as well as severe
conditions. The automatic bus transfers (ABTs) or manual bus transfers (MBTs) make
the power available to the vital loads at all the time [2] [11]. There are two propulsion
motors (Motor 1 and Motor 2) in the ship system, which acts as a load operating at 4.16
kV. The current and potential transformers are present for the measurement of current
and voltages flowing in the three phases of the shipboard power system. The CT ratio of
the current transformer 1 (CT1) is 300:1.
2.5.2 Terrestrial Power System (TPS) Characteristics
The terrestrial power systems are land based power system extended over wide
area and the power is generated, transmitted and distributed through long overhead
transmission lines. The hardware and software in the loop test are conducted over the
terrestrial power system for two-bus and eight-bus power system.
2.5.2.1 Two-Bus Power System
The two-bus power system is a simple test system having load and source
connected through a transmission line of 100 Km length. The CT ratio of the current
transformer is 800:1. Two circuit breakers are present at the two ends of the long
transmission line, which are operated either by a hardware relay or a software relay.
Figure 2.9 shows the basic two-bus system developed in RSCAD software suite. The
24
fault is applied at the center of the transmission line at bus-3 by the fault inception logic
developed in RSCAD software.
The specifications of the two-bus test case system are:
• AC source of 500 kV
• Load of 300 MW operating at 230 kV
• Current transformer, potential transformer and circuit breaker
• Fault inception logic
Figure 2.9 Two-Bus Power System in RSCAD
2.5.2.2 Eight-Bus Power System
The eight-bus power system has two parallel transmission lines (transmission line
1 & transmission line 2) of 100 km length connecting the source and the load. An AC
source of 230 kV is used to supply a synchronous type of load having a rating of 1200
MVA operating at 15 kV. The circuit breakers are connected at different locations on the 25

transmission line in order to isolate the faulted zone upon the occurrence of fault. Two
circuit breakers (BRK 3 and BRK 4) are present on transmission line 1 while two circuit
breakers (BRK 1 and BRK 2) are present on transmission line 2 as shown in figure 2.11.
The current flowing in to the BRK1 are IBRK1A, IBRK1B and IBRK1C while the
currents entering in to the BRK2 are IBRK2A, IBRK2B and IBRK2C. The current
transformer and potential transformers are placed to measure the currents (IBUR1A,
IBUR1B and IBUR1C) and voltages (VBUR1A, VBUR1B and VBUR1C) flowing in
each phase of the transmission line. The CT ratio of the current transformer 1 is 300:1.
The fault inception logic is present at 50% of the transmission line 2. The fault inception
logic is used to apply different types of line to ground faults like single-line-to-ground
fault, double-line-to-ground fault or three phase faults on bus-8 on the transmission line
2. Figure 2.10 shows the eight-bus power system developed in RSCAD software suite.
The specifications of the 8-bus system are
• 230 kV AC source
• 230 kV/230kV(delta-star) Transformer
• Bergeron type transmission lines of 100 km length
• 1200MVA, 15kV Synchronous motor
• Current Transformers, Potential Transformers and Circuit Breakers
• Speed governor, Turbines and Exciter
26

Figure 2.10 Eight-Bus Power System in RSCAD [23]
2.6 Hardware-in-the-Loop (HIL) Test
In HIL simulation, some of the components of the virtual power system are
replaced with physical devices [30]. HIL technology is one of the methods to understand
nonlinear and dynamic behavior of the system and helps in building and validating a
model for physical devices [4] [41]. In simple words, Hardware-in-the-loop test can be
defined as “A test in which software model of a power system designed in RSCAD is
connected with an actual physical hardware device in order to observe the system
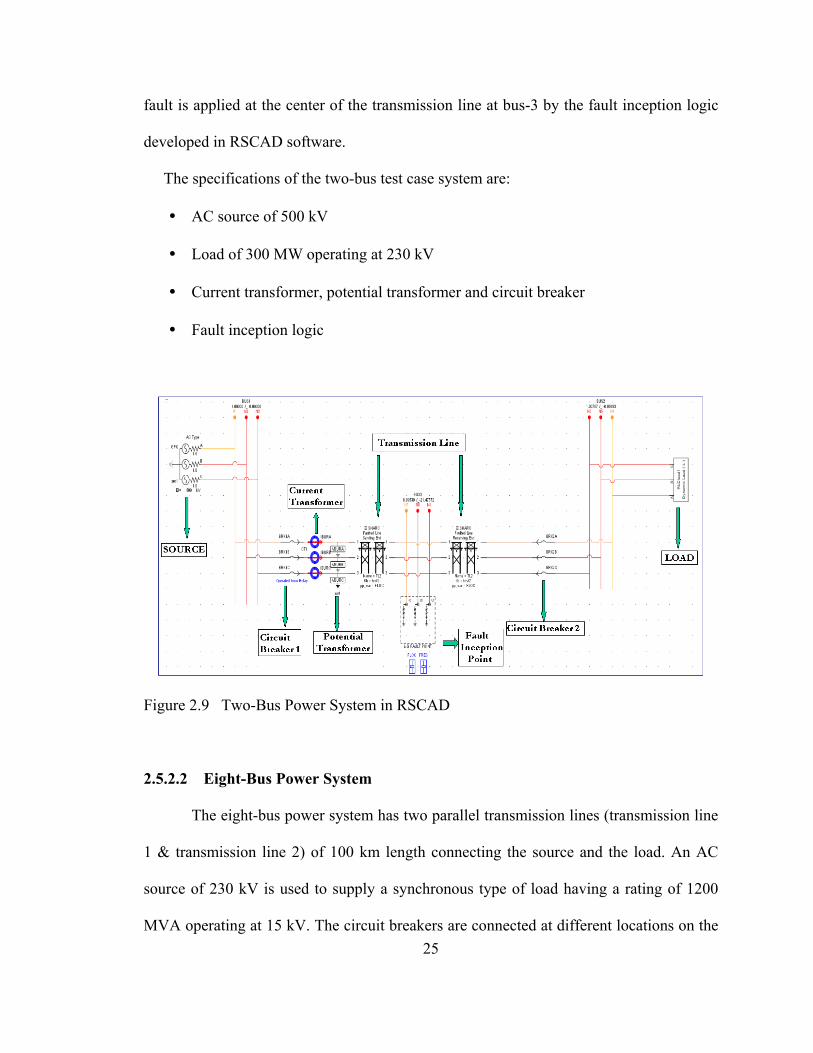
behavior or response to different fault conditions” [23]. Figure 2.11 shows the block
diagram of the hardware–in-the-loop test.
27
Figure 2.11 Block Diagram of Hardware-in-the-Loop Test [23]
In this approach, a detailed real time power system model is developed in the
RSCAD software by the user on a personal computer; this model represents all the power
system plant and components like source/generators, transmission lines, motors, circuit
breaker, current and potential transformers and fault control logic [23] [27]. The power
system model is then executed in real time using the RTDS hardware [5] [8] [39]. The
SEL 351S overcurrent relay or GE D60 relay which are to be tested are uploaded with
specified relay settings and then interfaced with the power system model simulated on
RTDS using actuator wires. The simulated power system is then subjected to a range of
fault scenarios which occurs in actual power system in order to analyze the performance
of the protection relay for the given power system. Issues and challenges faced in using
RTDS for HIL simulation have been discussed in [31]. Figure 2.12 shows the HIL
simulation conducted on test case power system using RTDS and SEL 351S overcurrent
relay [27].
28

Figure 2.12 HIL Simulation Using RTDS and SEL 351S Relay [27]
Figure 2.13 shows the HIL simulation conducted on 8-bus system using GE D60
relay and RTDS. An amplifier is placed between the GE relay and RTDS. The main
function of the amplifier is to amplify the small analog signals generated by the RTDS so
that it can be sensed by the GE relay for its proper operation. The test cases, which were
used to conduct the HIL test, were shipboard power system, eight-bus power system and
two-bus power system. The simulation result for the test case power system has been
given in detail in chapter V.
29

Figure 2.13 HIL Simulation Using RTDS and GE D60 Relay
2.7 Software-in-the-Loop (SIL) Test
Software in the loop (SIL) test is defined as “A test in which software model of
the power system designed in RSCAD is connected to a software model of the device,
which performs the same operation as a physical hardware device in order to observe the
system behavior under different fault conditions [23]” The SIL test is similar to the HIL
test but the main difference is that the hardware device in the HIL test is replaced by the
software model of the hardware device in the SIL test [27]. SIL is a test in which the
software model of the hardware device is developed in the RSCAD software and tested
on the power system model simulated in real time under different fault conditions to
observe the performance of the software model of the device and its interaction with the
power system.
30

Figure 2.14 Block Diagram of Software-in-the-Loop Test [23]
A block diagram of software-in-the-loop test is shown in Figure 2.14. The SEL
351S overcurrent relay is used as a hardware device whose software model was
developed by Kankanala [23] and then modified in this research work [32]. The software
model of overcurrent relay should have the same functionality as that of the hardware
device. The software relay model consists of two control logics: analog signal sampler
and software relay logic to open and reclose the breaker. An analog signal sampler is
used to sample, filter and calculate the root mean square (RMS) current, which is flowing
in the transmission lines-cables [23]. The relay logic compares the RMS current with the
pick-up value of the current in order to generate a trip signal to open the breaker and
generates a reclose signal to close the breaker if fault is cleared. SIL simulation on the
test case power system utilizing RTDS and software relay model is shown in Figure 2.15
[47].
31

Figure 2.15 SIL Simulation Using RTDS and Software Relay Model [47]
2.8 Multiple Relay Coordination in a System
After conducting and validating the HIL and SIL test successfully, the next step is
to use the hardware and software relays together to operate the circuit breakers present at
different location as well as on the same transmission lines/cables in the power system.
The main purpose of this work is to establish that if the fault is present at certain location
in the power system then only the circuit breaker present on that faulted line/cable will be
operated by the relays related to those breakers while the circuit breaker located on the
un-faulted line/cable will not be operated by the relay and the loads connected to the
healthy line will be fed by the power supply normally. In this way the power system is
protected against the fault located anywhere in the system and the main objective of
maintaining the continuity of power supply in the healthy zone of the power system will
be achieved successfully. Multiple relay operation and coordination of relay tests were
conducted on the shipboard and eight-bus power system utilizing hardware and software
relays separately as well as together. Some of the tests conducted were:
32
• Test case power system utilizing multiple hardware SEL 351S relays for the
operation of breakers located at different transmission line/ cables in the system.
• Test case power system having software overcurrent relay models for the
operation of breakers located at different transmission lines/ cables in the system.
• Coordination of software model of overcurrent relays for the shipboard [32] as
well as for the 8-bus system.
• Coordination of hardware SEL 351 overcurrent relays for the shipboard [47] as
well as for the 8-bus system.
2.9 Summary
This chapter gives an introduction of the various protection schemes, which are
utilized in the power system protection, and gives the reason why overcurrent protection
scheme is adopted in this thesis work. The application and description of the RSCAD and
LabVIEW software are discussed and the hardware tools like RTDS, SEL 351S
overcurrent relay and GE D60 distance relay, to conduct the HIL and SIL test, were
explained. Terrestrial and shipboard power system test cases are explained in detail. The
importance of HIL and SIL tests were explained briefly with the help of figures. The
protection scheme for the shipboard power system and terrestrial power system using
multiple hardware as well as software relays were briefly discussed.
33

CHAPTER III
HARDWARE-IN-THE-LOOP (HIL) TEST
3.1 Introduction
This chapter deals with the hardware in the loop test. The procedure of interfacing
the commercial hardware relay with the RTDS is explained in this chapter. The procedure
to develop the hardware setup for the performance of HIL test using RTDS and SEL
351S overcurrent relay (or GE D60 distance relay) is discussed. The simulation results of
the HIL test conducted on the terrestrial as well as on the shipboard power system are
presented.
3.2 SEL 351S Overcurrent Relay Protection
The basic working of the SEL 351S overcurrent relay is explained in section 2.4.2
of this thesis. The SEL 351 relay is connected to the computer through serial input-output
port cables to set the relay by using the ACSELARATOR software. The hardware SEL
351S overcurrent relay is shown in Figure 2.6 of chapter II of this thesis.
The SEL 351S relay has some key features like [26],
i. The SEL 351S overcurrent relay has the automatic as well as manual reclose
mechanism which helps to open the breaker during the fault condition and also
34
closes the breaker if the fault is removed from the line in a given time as specified
in the relay settings.
ii. The SEL 351S overcurrent relay can be set by using the front panel or by using
the ACSELERATOR software as explained above. The pickup value of current
and other parameters related to the given power system are entered into the relay
settings in order to achieve fast and reliable relay operation.
iii. Detailed event report can be obtained from the SE 351S relay for its response to
different fault conditions.
iv. The current and potential transformers present in the power system continuously
provide data to the SEL 351S relay. The current values measured by the current
transformers can be monitored from the front panel of the SEL 351S relay before
and after the fault conditions.
v. The light emitting diodes present at the front panel help to display the breaker
opening and reclosing signals, which in turn helps to predict the breaker
operation.
vi. The SEL 351S overcurrent relays have directional elements, which enable them to
operate either in forward or in reverse direction of the current flow in the transmission
lines/cables.
3.2.1 Settings of the SEL 351S Overcurrent Relay
The SEL 351S relay is programmed according to the topology and specification
of the test case power system as discussed in section 2.4. The communication settings are
35

required for the relay in order to read the settings of the relay. There are four ports (Port
1, Port2, Port 3 and Port F) in the hardware relay through which relay settings can be
read. The communication settings parameters for SEL 351S relay are shown in Figure
3.1.
Figure 3.1 Communication Settings as defined in Relay settings [26]
The SEL 351S relay has six groups, which can be programmed for six different
settings of the relay. Each group of relay settings can be used either for different zones of
the power system or for different types of power system. Figure 3.2 shows the six groups
present in the SEL 351S overcurrent relay.
Figure 3.2 Group settings of the SEL 351S Relay
36
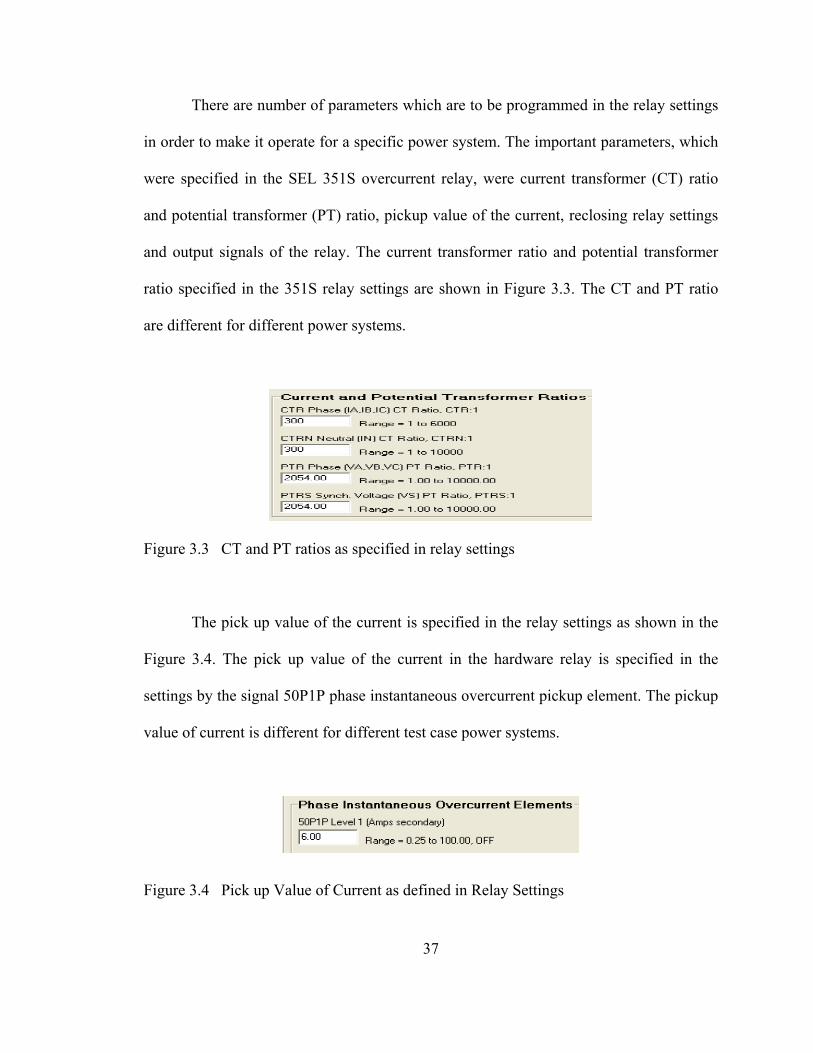
There are number of parameters which are to be programmed in the relay settings
in order to make it operate for a specific power system. The important parameters, which
were specified in the SEL 351S overcurrent relay, were current transformer (CT) ratio
and potential transformer (PT) ratio, pickup value of the current, reclosing relay settings
and output signals of the relay. The current transformer ratio and potential transformer
ratio specified in the 351S relay settings are shown in Figure 3.3. The CT and PT ratio
are different for different power systems.
Figure 3.3 CT and PT ratios as specified in relay settings
The pick up value of the current is specified in the relay settings as shown in the
Figure 3.4. The pick up value of the current in the hardware relay is specified in the
settings by the signal 50P1P phase instantaneous overcurrent pickup element. The pickup
value of current is different for different test case power systems.
Figure 3.4 Pick up Value of Current as defined in Relay Settings
37

The SEL 351S relay has a reclosing feature in it, which enables to close the
breaker if the fault is cleared in a specific duration of time. The signal E79 in the relay
settings is used to specify whether to enable or disable the reclosing relay element feature
in the relay settings.
Figure 3.5 Reclosing relay Setting Feature in SEL 351S Relay
Three current signals of CT denoted by IBUR1A, IBUR1B and IBUR1C and the
three voltage signals of PT denoted by VBUR1A, VBUR1B and VBUR1C are entering in
to the relay while the outputs of the relay are used to operate the circuit breaker. The
output signal which are specified in the relay settings are shown in Figure 3.6.
Figure 3.6 Output Contact Settings in SEL 351S Relay
38

3.3 General Electric D60 Distance Relay Protection
The General Electric (GE) D60 is a distance relay used for high-speed
transmission line protection with flexibility for three or single pole tripping. The D60 is a
member of the UR (Universal Relay) family of protective relays. GE D60 relay is a
numerical line distance protection system, which provides protection for medium to extra
high voltage transmission lines and an integrated system providing control, automation,
metering, synchrophasors, monitoring and communications in one easy to use package.
The GE D60 relays are used in the applications which require fast single or three phase
tripping, single or three poles re-closing, series compensated lines, with multiple breakers
per terminal [33].
The GE D60 relay has some key features like [33]:
1. The GE D60 relays can be used to protect the overhead AC transmission lines of
any voltage level, which includes series, compensated lines, with single and three
pole tripping.
2. The GE D60 relay has automatic as well as manual reclose mechanism which
helps to open the breaker during the fault condition and also closes the breaker if
the fault is removed in a specified time. There are up to four shots of single/three
pole automatic breaker reclosing.
3. Single GE D60 relay can support multiple breaker applications like Ring Bus,
Breaker-and-a-Half etc.
4. The GE D60 relays can be programmed by using the EnerVista software to read
the settings of the relay via Ethernet or through serial input output cable.
39

5. The GE D60 relays have a feature to obtain the detailed event report for the fault
conditions.
6. There are 48 programmable LED’s on the front panel of the GE D60 relays to
indicate the breaker status, type of fault and many other different system
parameters.
7. The GE D60 relay has an integrated protection and phasor measurement units.
8. The GE D60 relays have directional elements, which enable them to operate
either in forward or in reverse direction of the current flow in the transmission
lines/cables.
The GE D60 relays are set according to the test case power system specifications.
Here, the GE D 60 relay was programmed for the eight bus system in order to conduct the
hardware in the loop (HIL) test successfully for different types of line to ground faults.
There were different parameters which have to be specified in the GE D60 relay settings
like secondary side current, secondary side voltage, pick up value of the current,
transmission line impedance, length of the line, fault location, auto reclose settings,
directional settings, single/triple pole tripping or reclosing, initial status of the breakers
etc. After setting the parameters of the GE D60 relay, the RSCAD model of eight-bus
system is simulated on the RTDS and the RTDS is interfaced with the GE D60 relay
through hardware connections. The GE D60 relay receives the current and voltage signals
from the simulated CT and PT in RTDS through connecting actuator cables and, sends
the trip and reclose signals to the simulated circuit breaker in the power system through
digital input/output port present on the front panel of RTDS.
40

3.4 Hardware-in-the-Loop (HIL) Setup
The hardware relays like the SEL 351S or GE D60 relays are interfaced with real
time digital simulator (RTDS) by using the RTDS hardware interface block present in the
RSCAD software. The power system model developed in RSCAD software is simulated
in real time by using RTDS, and the current and voltages measurement of the current and
potential transformers present in the power system model are continuously sent to the
hardware relay. The trip and reclose signals generated by the hardware relay are sent to
the simulated circuit breaker present in the power system model through the digital input-
output port present at the front panel of the RTDS[7].
The current and voltages measurements of the current and potential transformers
are input into the digital to analog converter (DAC) component present in the RSCAD,
which in turn sends the information to the hardware relays. The currents measured by
CT1 are IBUR1A, IBUR1B and IBUR1C and the voltages measured by PT1 are
VBUR1A, VBUR1B and VBUR1C. Three current and three voltage signals entering in to
the DDAC card of the RTDS are shown below in Figure 3.7.
Figure 3.7 DAC Components in RSCAD Library [27]
41
The DDAC component writes input signals to a DDAC high precision analog
output board. The DDAC board is a 12 channel RTDS hardware component mounted at
the back of the RTDS cubicle, which allows maximum of two hardware relays based on
6-channel relay. The 12 channels are divided into four groups. Each group contains three
channels. Each channel can be scaled independently or in a group. If each channel is
scaled independently then the initial output advance is set to 1.0 but if three channels are
considered in a group then only one scaling value is required which in turn requires an
output advance per group. The DDAC board is connected to a 3PC card, which must be
assigned to a C processor. The inputs to the DDAC component are physical relay signals.
The component’s software converts and scales the input signals to 16 bit and writes them
to the DDAC card via the optical port. The output range of the DDAC is a +/−10 volt.
The DDAC continuously sends the current and voltage signals to the hardware
relay. Three current and three voltage signals coming out of the RTDS are connected at
the back of the SEL 351S or GE D60 relay through wires. The current entering into the
hardware relay is displayed on the front panel. The protective logic present in the
hardware relay generates a trip signal upon the occurrence of fault in the system. The trip
and reclose signals generated by the hardware relays are sent to the simulated circuit
breaker in the system via digital input-output ports present on the front panel of the
RTDS through cables. The hardware in the loop setup using SEL 351S overcurrent or GE
D60 relay and RTDS is shown in figures 2.12 and 2.13 in Chapter II of this thesis.
The digital input port can read the 16-bit data from the processors. 3PC processors
A and B only have an access to the digital input port. The 3PC processor C does not have
access to a digital input port. The digital input port component reads 16 bits and returns
42

an INTEGER word. When the digital input port pins are not connected to the external
equipment then it reads logic ‘1’. The multiple INTEGER words are split in to multiple
logical signals by using word to bit conversion block. The input is INTEGER while all
the output signals are logical (ie. 0 or 1 only). In the HIL test, there are six output signals
generated from word to bit conversion block as shown in figure 3.8. The six output
signals are TRIP1A, REC1A, TRIP1B, REC1B, TRIP1C and REC1C, which are denoted
as the three-phase trip and reclose signals. The digital input port block, word to bit
conversion block and the trip and reclose signals is shown in figure 3.8.
Figure 3.8 Digital Input Port, Word to Bit conversion block in RSCAD
Three trips and three reclose signals generated by word to bit conversion blocks
are sent to the S-R flip flops which is set as high. The initial state of the flip-flop (Q=0 or
Q=1) is defined by the International Safe Transit Association (ISTA) parameter. Here, the
initial state of S-R flip flops is set as Qinit= 0. The flip-flop operates according to the
truth table as shown in table 3.1.
43
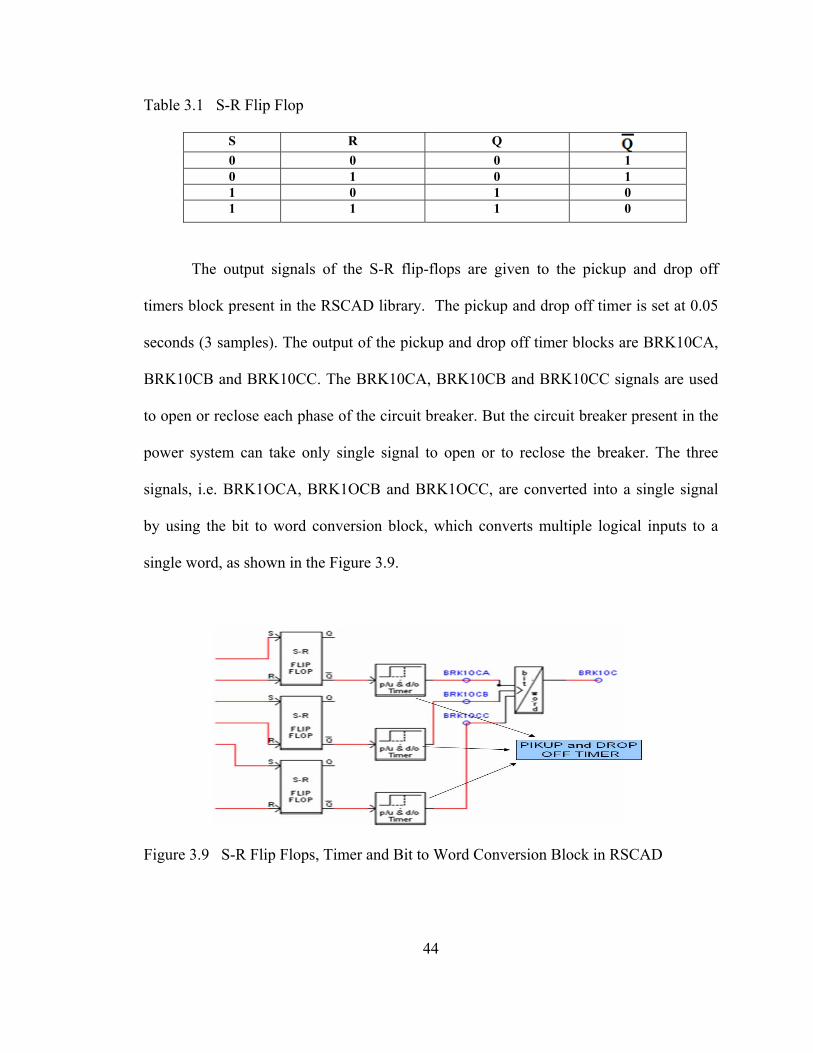
Table 3.1 S-R Flip Flop
S R Q 0 0 0 1 0 1 0 1 1 0 1 0 1 1 1 0
The output signals of the S-R flip-flops are given to the pickup and drop off
timers block present in the RSCAD library. The pickup and drop off timer is set at 0.05
seconds (3 samples). The output of the pickup and drop off timer blocks are BRK10CA,
BRK10CB and BRK10CC. The BRK10CA, BRK10CB and BRK10CC signals are used
to open or reclose each phase of the circuit breaker. But the circuit breaker present in the
power system can take only single signal to open or to reclose the breaker. The three
signals, i.e. BRK1OCA, BRK1OCB and BRK1OCC, are converted into a single signal
by using the bit to word conversion block, which converts multiple logical inputs to a
single word, as shown in the Figure 3.9.
Figure 3.9 S-R Flip Flops, Timer and Bit to Word Conversion Block in RSCAD
44
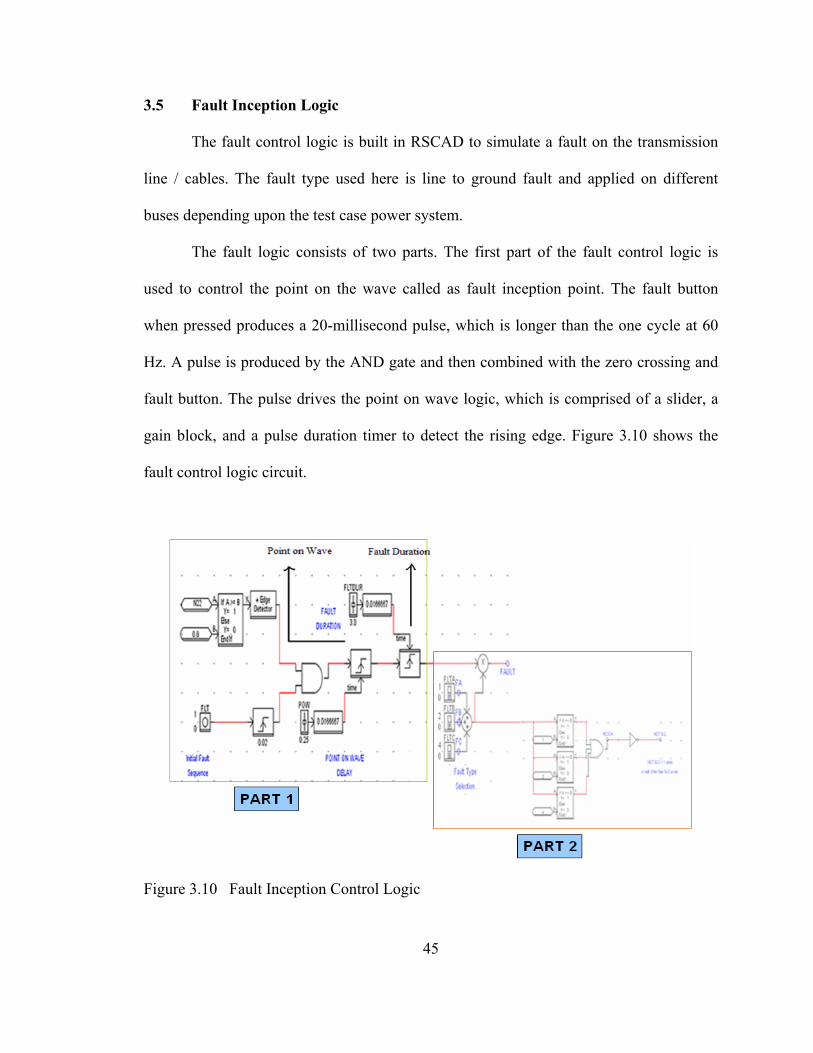
3.5 Fault Inception Logic
The fault control logic is built in RSCAD to simulate a fault on the transmission
line / cables. The fault type used here is line to ground fault and applied on different
buses depending upon the test case power system.
The fault logic consists of two parts. The first part of the fault control logic is
used to control the point on the wave called as fault inception point. The fault button
when pressed produces a 20-millisecond pulse, which is longer than the one cycle at 60
Hz. A pulse is produced by the AND gate and then combined with the zero crossing and
fault button. The pulse drives the point on wave logic, which is comprised of a slider, a
gain block, and a pulse duration timer to detect the rising edge. Figure 3.10 shows the
fault control logic circuit.
Figure 3.10 Fault Inception Control Logic
45

The second part of the fault control logic circuit is used to control the fault type
and location. Fault switches for the phase to ground fault types are combined to create the
necessary integer value. This value is multiplied by the pulse from the first part of the
logic, thereby creating a pulse width with an integer value that can control the fault
branches.
3.6 Circuit Breaker Control Logic for HIL and SIL Test
The main task of the breaker control logic is to operate the BRK2 in a sequential
manner with the BRK1. For example if a SLG fault is applied on Phase A then breaker
logic will open only phase A of the breaker while the other two phases (B and C) will
remain close during the SLG fault. But for double line to ground and three phase faults,
the breaker logic opens all the three phases of the breaker irrespective of the type of
double line to ground (A-B-G, B-C-G, C-A-G) or three-phase fault. The circuit breaker
control logic developed in RSCAD software is shown in Figure 3.11.
Figure 3.11 Circuit Breaker Control logic for HIL and SIL Test 46
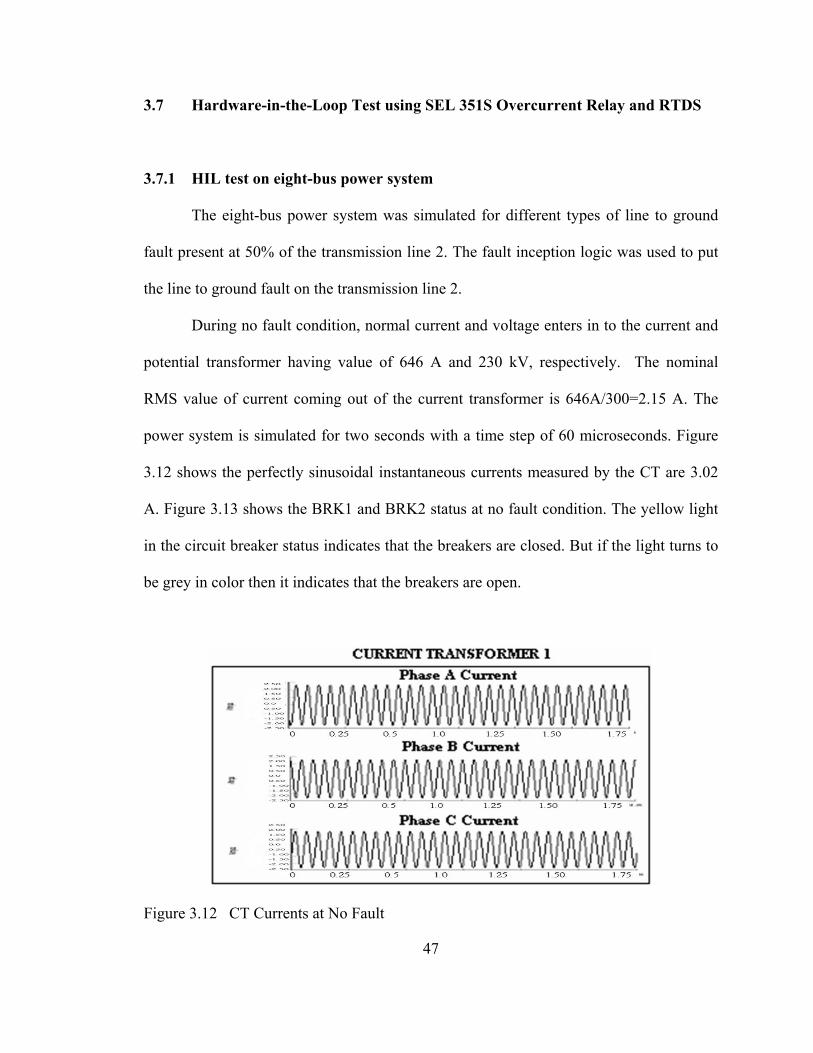
3.7 Hardware-in-the-Loop Test using SEL 351S Overcurrent Relay and RTDS
3.7.1 HIL test on eight-bus power system
The eight-bus power system was simulated for different types of line to ground
fault present at 50% of the transmission line 2. The fault inception logic was used to put
the line to ground fault on the transmission line 2.
During no fault condition, normal current and voltage enters in to the current and
potential transformer having value of 646 A and 230 kV, respectively. The nominal
RMS value of current coming out of the current transformer is 646A/300=2.15 A. The
power system is simulated for two seconds with a time step of 60 microseconds. Figure
3.12 shows the perfectly sinusoidal instantaneous currents measured by the CT are 3.02
A. Figure 3.13 shows the BRK1 and BRK2 status at no fault condition. The yellow light
in the circuit breaker status indicates that the breakers are closed. But if the light turns to
be grey in color then it indicates that the breakers are open.
Figure 3.12 CT Currents at No Fault
47

Figure 3.13 BRK1 and BRK2 Status at No Fault
The eight-bus system is simulated for all types of line to ground faults such as
single line to ground (SLG), double line to ground (L-L-G) and three phase fault (L-L-L-
G). In the eight-bus system, the nominal current flowing in the line is 2.15A and in the
SEL 351 relay settings it is specified that the pickup value of current during the fault is
4A. The pickup value of current programmed in the SEL settings should be generally 1.5
times or greater than the nominal current. Figure 3.14 and 3.15 shows the CT current,
breaker status for SLG fault.
Figure 3.14 CT Currents after SLG Fault
48

Figures 3.14 indicate that the burden current in phase A of CT goes to 14A when
a SLG fault is present on phase A at bus 8. When SLG fault is present on bus 8 then SEL
351S opens all the three phase of the BRK1.
Figure 3.15 Trip, Open and Reclose Signal for BRK1 and BRK2 after SLG Fault
Figure 3.15 shows trip, open and reclose signals for BRK1 and BRK2 during SLG
fault. At fault condition, as the current exceeds the threshold current, the SEL 351 relay
generates a trip signal to open the BRK1 after three cycles (one cycle=0.01667). After 65
cycles, SEL 351S relay tries to reclose the BRK1. After getting the reclose signal, BRK1
recloses in 3 cycles. If the fault is not cleared then BRK1 stays open and it goes to
lockout stage. The BRK2 operation by circuit breaker control logic can be explained as
49
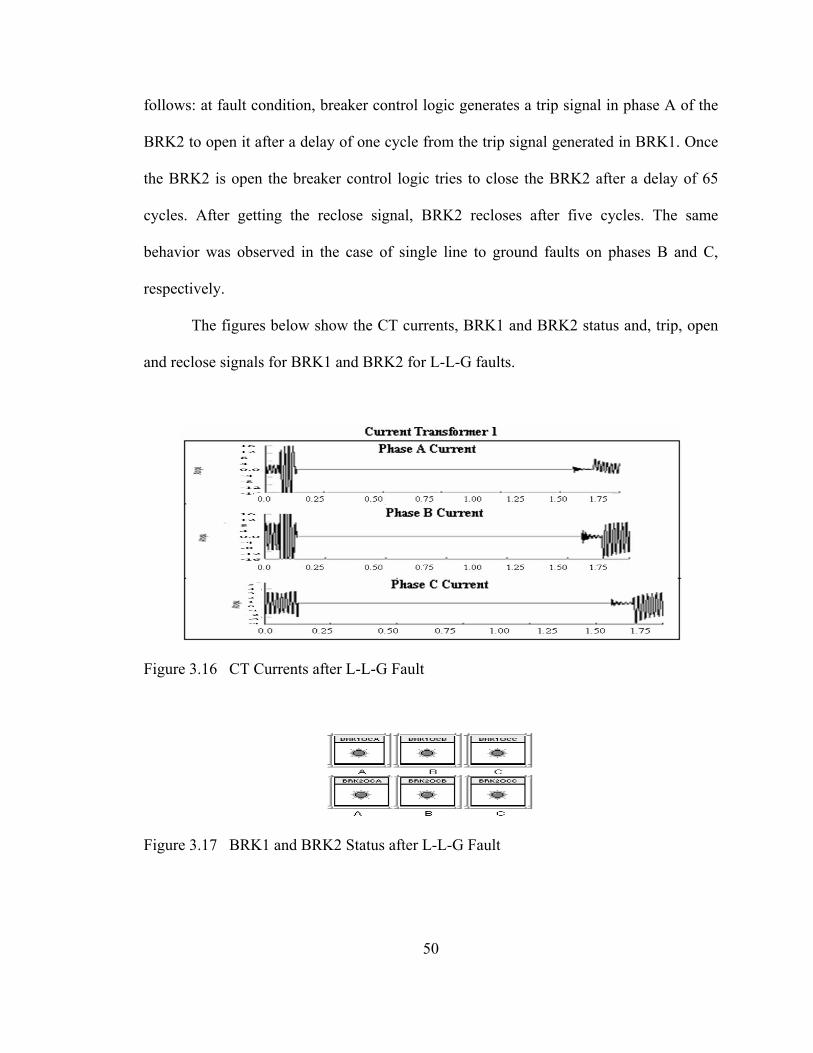
follows: at fault condition, breaker control logic generates a trip signal in phase A of the
BRK2 to open it after a delay of one cycle from the trip signal generated in BRK1. Once
the BRK2 is open the breaker control logic tries to close the BRK2 after a delay of 65
cycles. After getting the reclose signal, BRK2 recloses after five cycles. The same
behavior was observed in the case of single line to ground faults on phases B and C,
respectively.
The figures below show the CT currents, BRK1 and BRK2 status and, trip, open
and reclose signals for BRK1 and BRK2 for L-L-G faults.
Figure 3.16 CT Currents after L-L-G Fault
Figure 3.17 BRK1 and BRK2 Status after L-L-G Fault
50
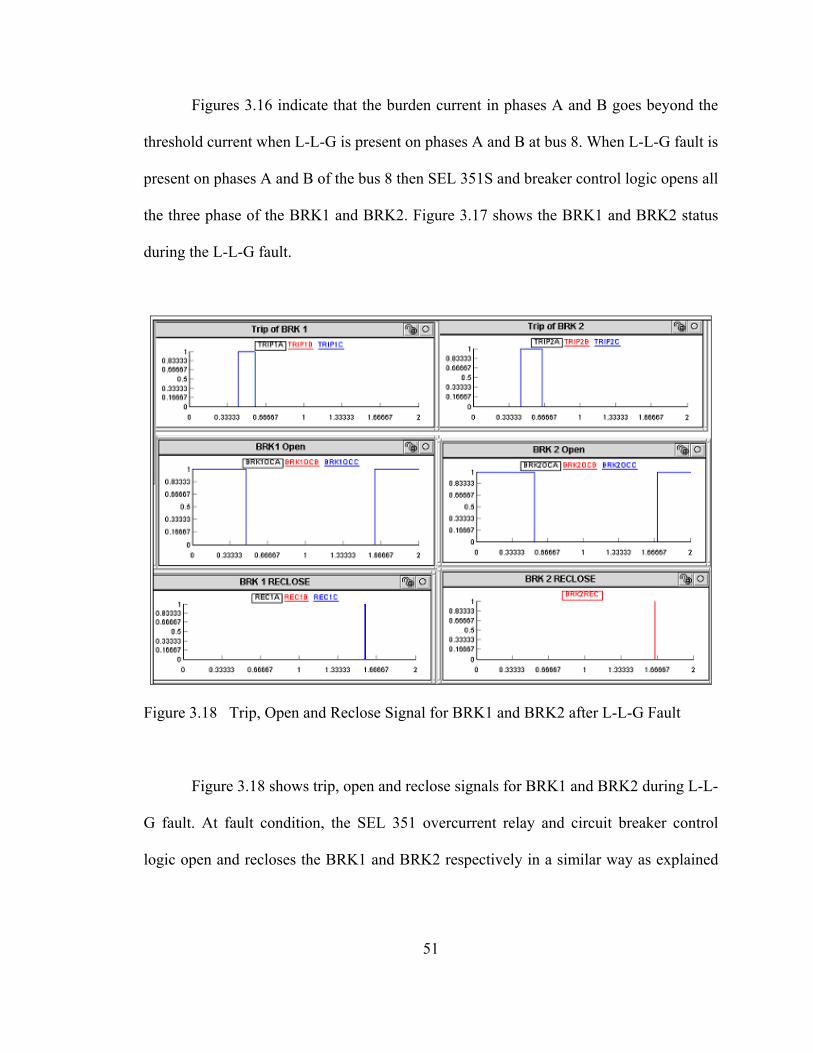
Figures 3.16 indicate that the burden current in phases A and B goes beyond the
threshold current when L-L-G is present on phases A and B at bus 8. When L-L-G fault is
present on phases A and B of the bus 8 then SEL 351S and breaker control logic opens all
the three phase of the BRK1 and BRK2. Figure 3.17 shows the BRK1 and BRK2 status
during the L-L-G fault.
Figure 3.18 Trip, Open and Reclose Signal for BRK1 and BRK2 after L-L-G Fault
Figure 3.18 shows trip, open and reclose signals for BRK1 and BRK2 during L-L-
G fault. At fault condition, the SEL 351 overcurrent relay and circuit breaker control
logic open and recloses the BRK1 and BRK2 respectively in a similar way as explained
51

for the SLG fault. The same behavior was observed in the case of double line to ground
faults on phases B C and phases C A, respectively.
The eight-bus system is simulated for three phase to ground fault. Figure 3.19
below shows the CT current during the three-phase fault (L-L-L-G). Figure 3.20 shows
the BRK1 and BRK2 status during the L-L-L-G fault condition.
Figure 3.19 CT Currents after L-L-L-G Fault
Figure 3.20 BRK1 and BRK2 Status after L-L-L-G Fault
Figure 3.19 shows that during the three phase fault, the burden current in all the
three phases of the CT goes way beyond the threshold limit which enables the SEL 351S
and breaker control logic to open all the three phases of the BRK1 and BRK2. Figure
52
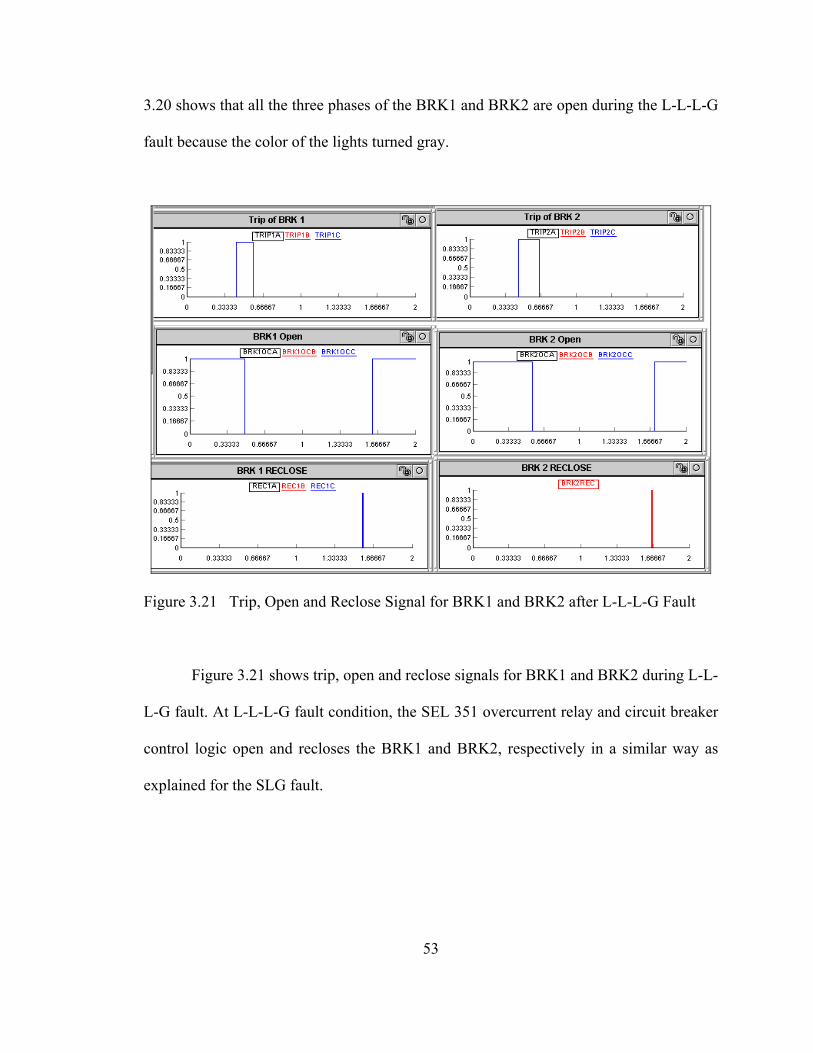
3.20 shows that all the three phases of the BRK1 and BRK2 are open during the L-L-L-G
fault because the color of the lights turned gray.
Figure 3.21 Trip, Open and Reclose Signal for BRK1 and BRK2 after L-L-L-G Fault
Figure 3.21 shows trip, open and reclose signals for BRK1 and BRK2 during L-L-
L-G fault. At L-L-L-G fault condition, the SEL 351 overcurrent relay and circuit breaker
control logic open and recloses the BRK1 and BRK2, respectively in a similar way as
explained for the SLG fault.
53
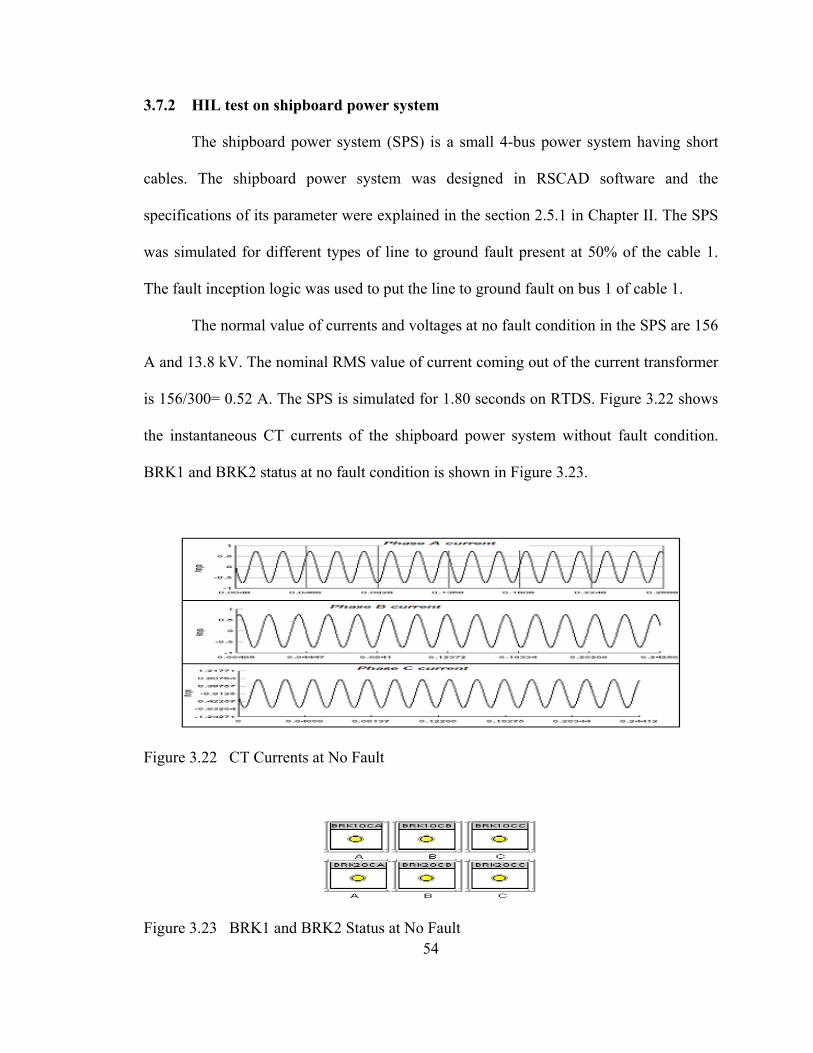
3.7.2 HIL test on shipboard power system
The shipboard power system (SPS) is a small 4-bus power system having short
cables. The shipboard power system was designed in RSCAD software and the
specifications of its parameter were explained in the section 2.5.1 in Chapter II. The SPS
was simulated for different types of line to ground fault present at 50% of the cable 1.
The fault inception logic was used to put the line to ground fault on bus 1 of cable 1.
The normal value of currents and voltages at no fault condition in the SPS are 156
A and 13.8 kV. The nominal RMS value of current coming out of the current transformer
is 156/300= 0.52 A. The SPS is simulated for 1.80 seconds on RTDS. Figure 3.22 shows
the instantaneous CT currents of the shipboard power system without fault condition.
BRK1 and BRK2 status at no fault condition is shown in Figure 3.23.
Figure 3.22 CT Currents at No Fault
54
Figure 3.23 BRK1 and BRK2 Status at No Fault
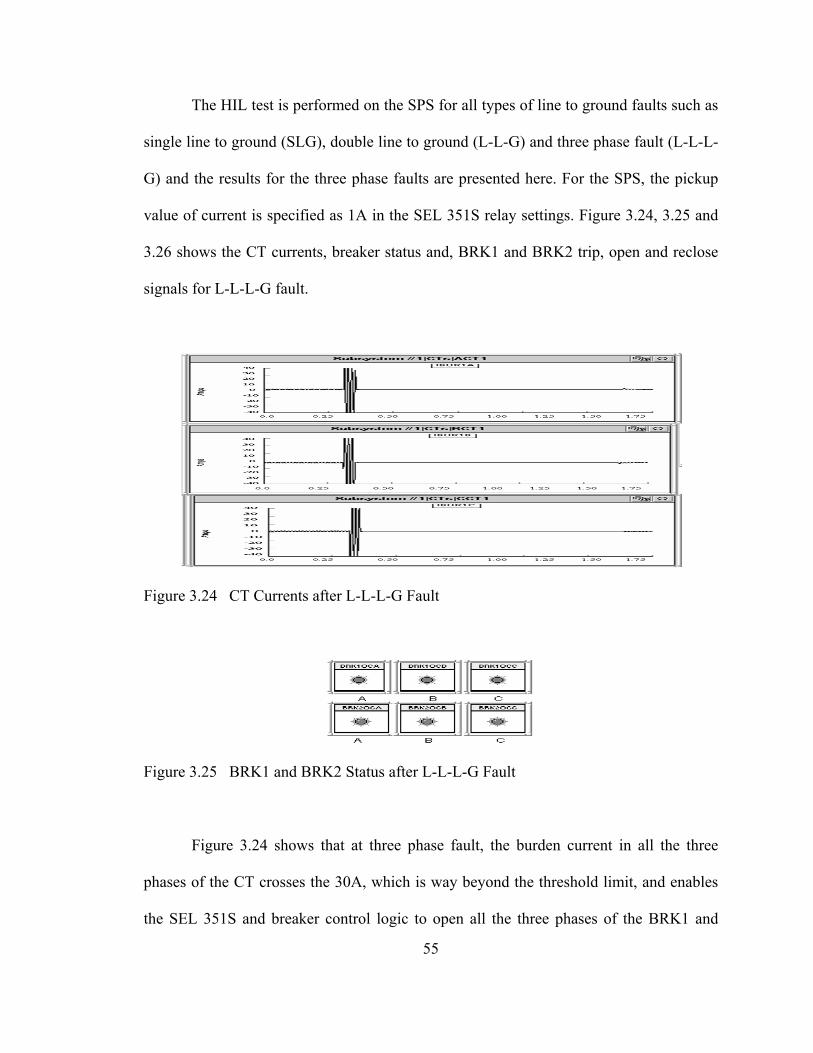
The HIL test is performed on the SPS for all types of line to ground faults such as
single line to ground (SLG), double line to ground (L-L-G) and three phase fault (L-L-L-
G) and the results for the three phase faults are presented here. For the SPS, the pickup
value of current is specified as 1A in the SEL 351S relay settings. Figure 3.24, 3.25 and
3.26 shows the CT currents, breaker status and, BRK1 and BRK2 trip, open and reclose
signals for L-L-L-G fault.
Figure 3.24 CT Currents after L-L-L-G Fault
Figure 3.25 BRK1 and BRK2 Status after L-L-L-G Fault
Figure 3.24 shows that at three phase fault, the burden current in all the three
phases of the CT crosses the 30A, which is way beyond the threshold limit, and enables
the SEL 351S and breaker control logic to open all the three phases of the BRK1 and
55

BRK2. Figure 3.25 shows that all the three phases of the BRK1 and BRK2 are open
during the L-L-L-G fault.
Figure 3.26 Trip, Open and Reclose Signal for BRK1 and BRK2 after L-L-L-G Fault
Figure 3.26 shows trip and reclose signals for BRK1 and BRK2 during L-L-L-G
fault. At fault condition, as the current exceeds the threshold current, the SEL 351 relay
generates a trip signal to open the BRK1 after three cycles (one cycle=0.01667. BRK1
and BRK2 operate as expected similar to 8-bus power system test case.
56

3.7.3 HIL test on two-bus power system
The fault inception logic was used to put the line to ground fault on bus 3 of the
transmission line 1 at 50% length of line.
The CT ratio of the current transformer is 300:1. At no fault condition normal
currents in the line is 165A. The nominal RMS current coming out of the current
transformer is 165/300= 0.55 A. The simulation time for the two-bus system on RTDS is
1.80 seconds with a time step of 60 microseconds. Figure 3.27 shows the no fault CT
current. Figure 3.28 shows the BRK1 status during the no fault condition.
Figure 3.27 CT Currents at No Fault
Figure 3.28 BRK1 Status at No Fault
57
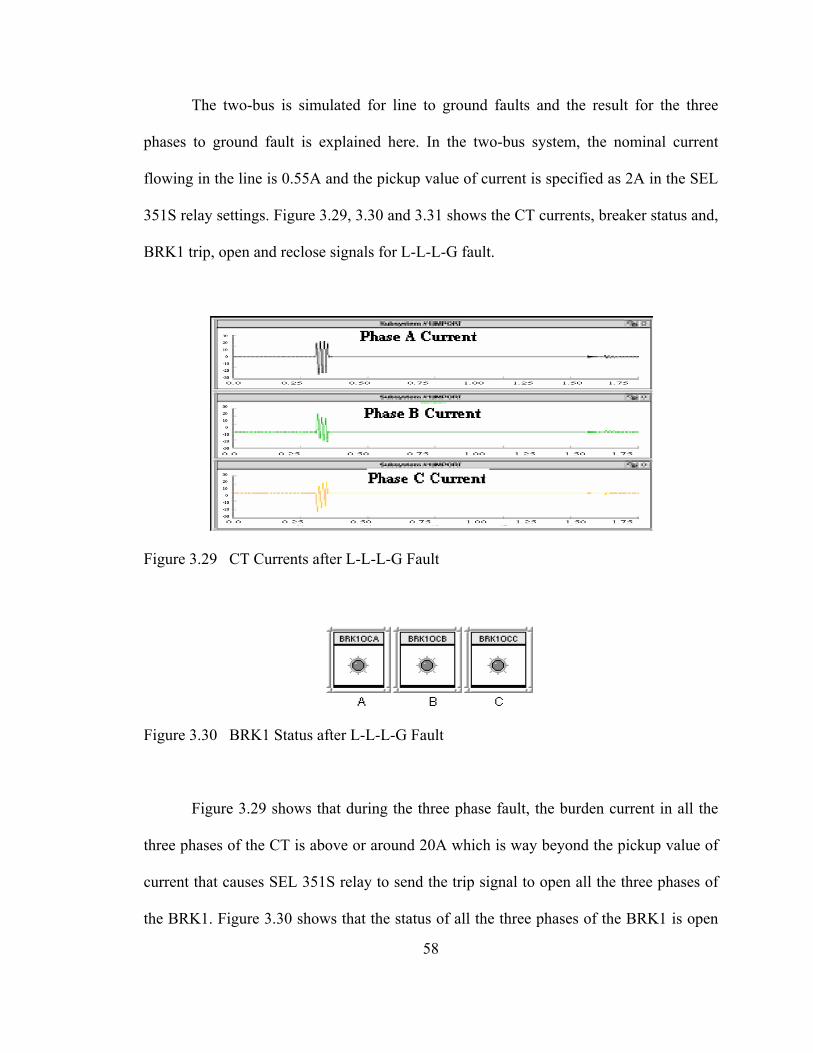
The two-bus is simulated for line to ground faults and the result for the three
phases to ground fault is explained here. In the two-bus system, the nominal current
flowing in the line is 0.55A and the pickup value of current is specified as 2A in the SEL
351S relay settings. Figure 3.29, 3.30 and 3.31 shows the CT currents, breaker status and,
BRK1 trip, open and reclose signals for L-L-L-G fault.
Figure 3.29 CT Currents after L-L-L-G Fault
Figure 3.30 BRK1 Status after L-L-L-G Fault
Figure 3.29 shows that during the three phase fault, the burden current in all the
three phases of the CT is above or around 20A which is way beyond the pickup value of
current that causes SEL 351S relay to send the trip signal to open all the three phases of
the BRK1. Figure 3.30 shows that the status of all the three phases of the BRK1 is open
58

during the L-L-L-G fault. Figure 3.31 shows trip and reclose signals for BRK1 during L-
L-L-G fault.
Figure 3.31 Trip, Open and Reclose Signal for BRK1 after L-L-L-G Fault
3.8 Hardware-in-the-Loop Test using GE D60 Distance Relay and RTDS
3.8.1 HIL test on eight-bus power system
The eight-bus power system was simulated for different types of line to ground
fault present at 10% of the transmission line 2 on bus 8 for HIL simulation with GE D60
relay. The fault inception logic was used to put the line to ground fault on the
transmission line 2. The eight-bus power system model developed in RSCAD software is
shown in Figure 3.32.
59
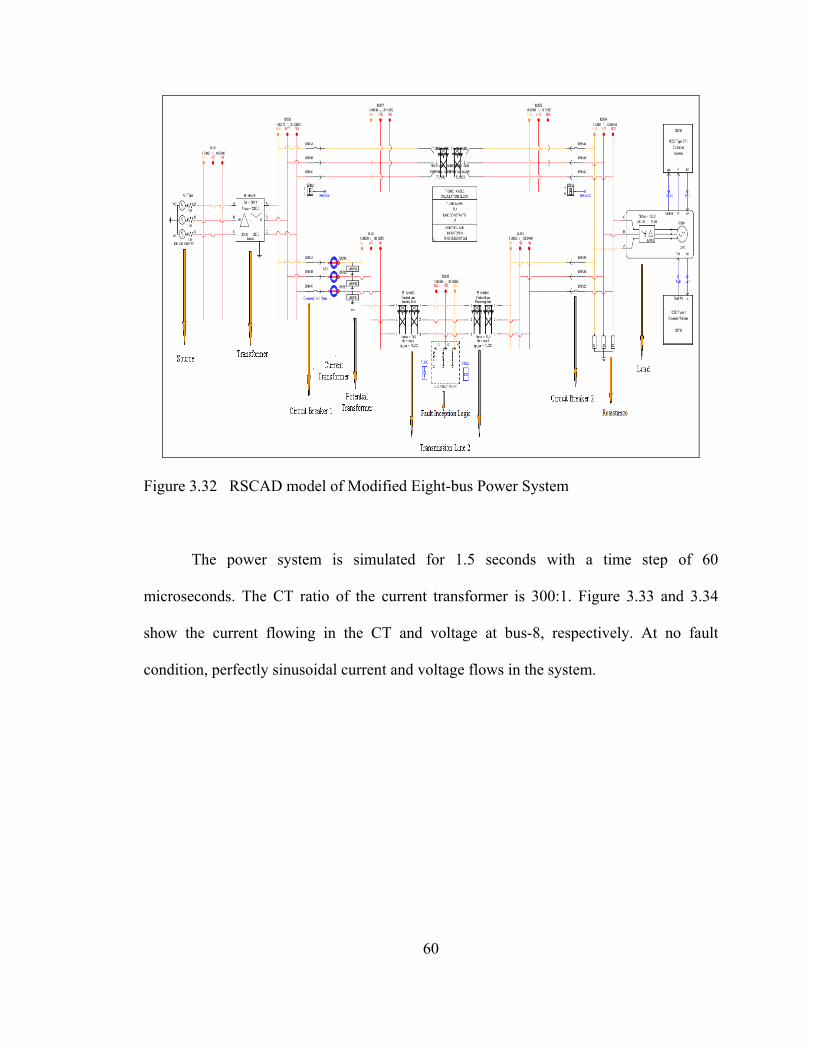
Figure 3.32 RSCAD model of Modified Eight-bus Power System
The power system is simulated for 1.5 seconds with a time step of 60
microseconds. The CT ratio of the current transformer is 300:1. Figure 3.33 and 3.34
show the current flowing in the CT and voltage at bus-8, respectively. At no fault
condition, perfectly sinusoidal current and voltage flows in the system.
60

Figure 3.33 CT Currents at No Fault Condition
Figure 3.34 Voltage at Bus-8 at No Fault Condition
The HIL simulation was done for all types of line to ground faults and the result
for the three phase fault is presented here. In the eight-bus system, the magnitude of the
nominal current in the line and nominal voltage at bus 8 are 5.52A and 186kV
respectively. In the GE D60 relay settings it is specified that the pickup value of current
during the fault condition is 10A and impedance reach is set at 20 ohms.
61
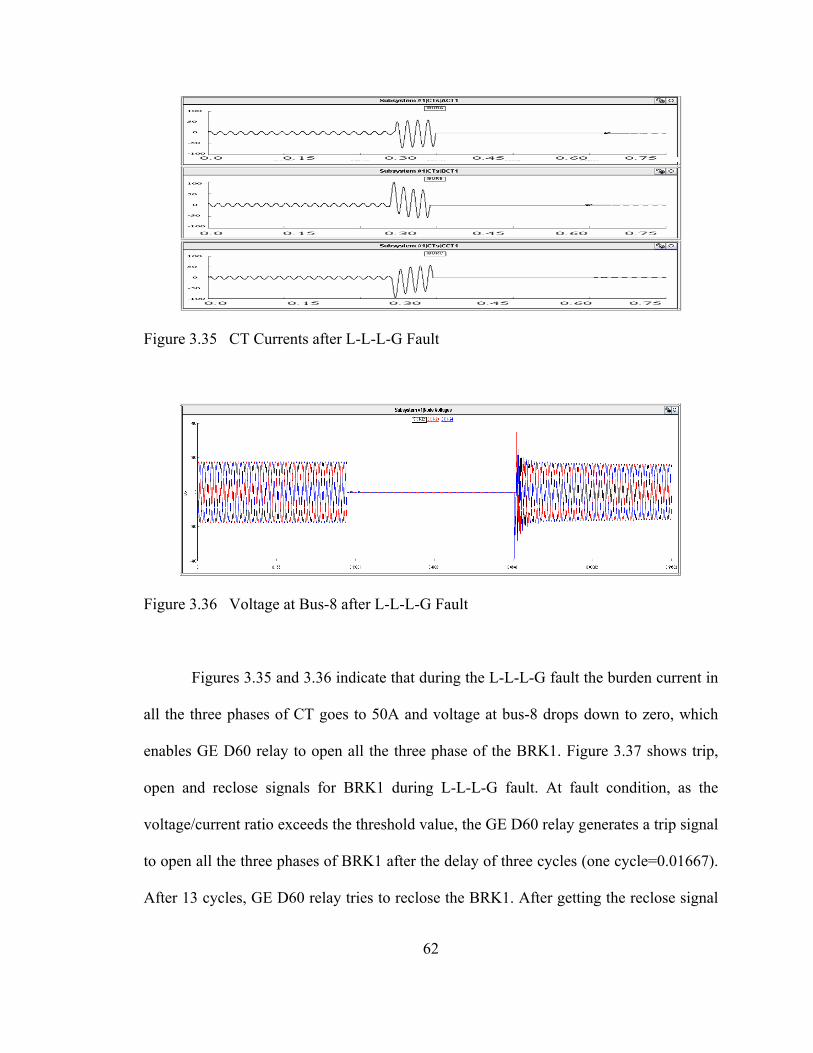
Figure 3.35 CT Currents after L-L-L-G Fault
Figure 3.36 Voltage at Bus-8 after L-L-L-G Fault
Figures 3.35 and 3.36 indicate that during the L-L-L-G fault the burden current in
all the three phases of CT goes to 50A and voltage at bus-8 drops down to zero, which
enables GE D60 relay to open all the three phase of the BRK1. Figure 3.37 shows trip,
open and reclose signals for BRK1 during L-L-L-G fault. At fault condition, as the
voltage/current ratio exceeds the threshold value, the GE D60 relay generates a trip signal
to open all the three phases of BRK1 after the delay of three cycles (one cycle=0.01667).
After 13 cycles, GE D60 relay tries to reclose the BRK1. After getting the reclose signal
62
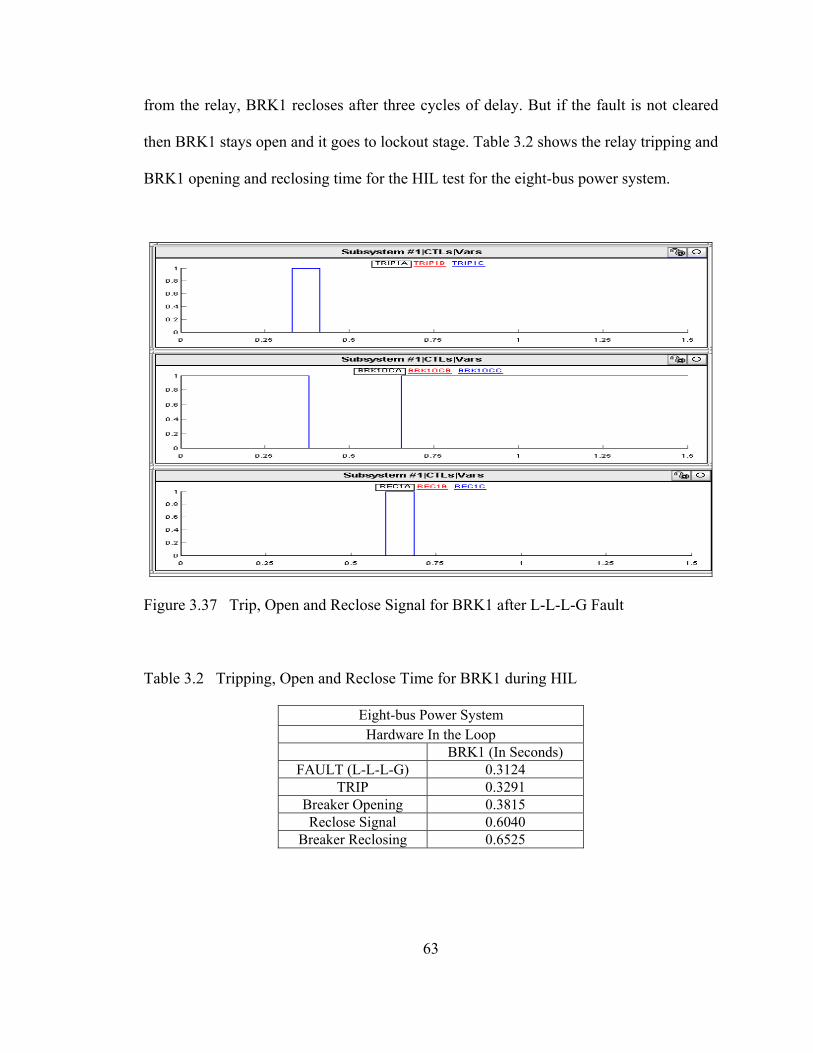
from the relay, BRK1 recloses after three cycles of delay. But if the fault is not cleared
then BRK1 stays open and it goes to lockout stage. Table 3.2 shows the relay tripping and
BRK1 opening and reclosing time for the HIL test for the eight-bus power system.
Figure 3.37 Trip, Open and Reclose Signal for BRK1 after L-L-L-G Fault
Table 3.2 Tripping, Open and Reclose Time for BRK1 during HIL
Eight-bus Power System Hardware In the Loop
BRK1 (In Seconds) FAULT (L-L-L-G) 0.3124
TRIP 0.3291 Breaker Opening 0.3815 Reclose Signal 0.6040
Breaker Reclosing 0.6525
63

3.9 Summary
The concept of overcurrent protection scheme and the procedure to set the SEL
351S overcurrent was explained. A brief idea about the parameters, which have to be set
in the GE D60 relay settings, was also explained. The step-by-step procedure to develop
the hardware interface setup to perform the HIL test is also discussed. The simulation
results were presented for the HIL test conducted on the eight-bus, shipboard (4-bus) and
two-bus system for different types of line to ground faults using RTDS and hardware
SEL 351S overcurrent relay. The real time HIL test was also conducted on the GE D60
distance relay on the eight-bus system for all type of line to ground fault and the result for
the three-phase fault were presented.
64

CHAPTER IV
SOFTWARE RELAY MODEL DEVELOPMENT
4.1 Introduction
This chapter deals with the development of protective relay models. The software
overcurrent relay model is developed in RSCAD software and designed by analyzing the
HIL simulation results. The developed overcurrent relay model is tested on the terrestrial
as well as for the shipboard system under different fault scenarios in software in the loop
(SIL) test. The HIL and SIL results are compared to validate the software overcurrent
relay model. The software relay model should mimic the basic functionality of the
commercially available hardware overcurrent relay. The procedure to develop the
differential relay model in LabVIEW for different fault conditions is also presented in
detail in section 4.5.
4.2 Software Model of Overcurrent Relay in RSCAD
In the software in the loop (SIL) test the hardware device used in the hardware in
the loop (HIL) test setup is replaced by a software model of the device and is tested under
different fault conditions. Here in this thesis work, SEL 351S overcurrent relay is
65
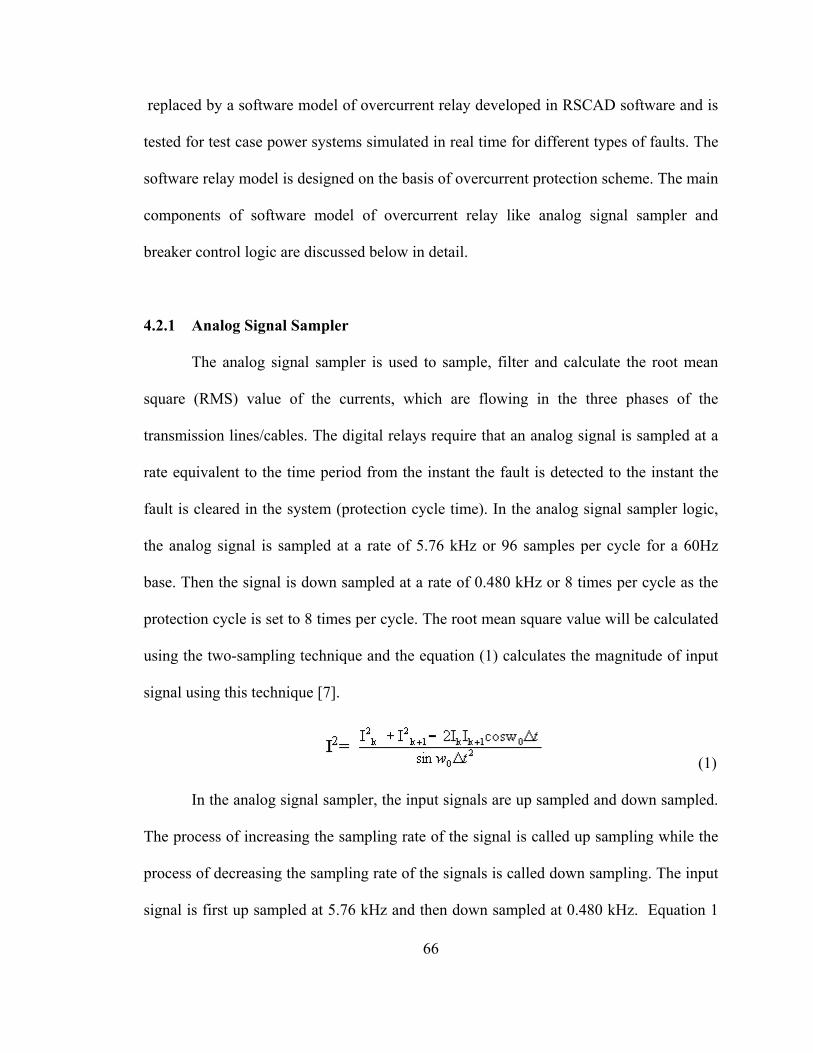
replaced by a software model of overcurrent relay developed in RSCAD software and is
tested for test case power systems simulated in real time for different types of faults. The
software relay model is designed on the basis of overcurrent protection scheme. The main
components of software model of overcurrent relay like analog signal sampler and
breaker control logic are discussed below in detail.
4.2.1 Analog Signal Sampler
The analog signal sampler is used to sample, filter and calculate the root mean
square (RMS) value of the currents, which are flowing in the three phases of the
transmission lines/cables. The digital relays require that an analog signal is sampled at a
rate equivalent to the time period from the instant the fault is detected to the instant the
fault is cleared in the system (protection cycle time). In the analog signal sampler logic,
the analog signal is sampled at a rate of 5.76 kHz or 96 samples per cycle for a 60Hz
base. Then the signal is down sampled at a rate of 0.480 kHz or 8 times per cycle as the
protection cycle is set to 8 times per cycle. The root mean square value will be calculated
using the two-sampling technique and the equation (1) calculates the magnitude of input
signal using this technique [7].
(1)
In the analog signal sampler, the input signals are up sampled and down sampled.
The process of increasing the sampling rate of the signal is called up sampling while the
process of decreasing the sampling rate of the signals is called down sampling. The input
signal is first up sampled at 5.76 kHz and then down sampled at 0.480 kHz. Equation 1
66
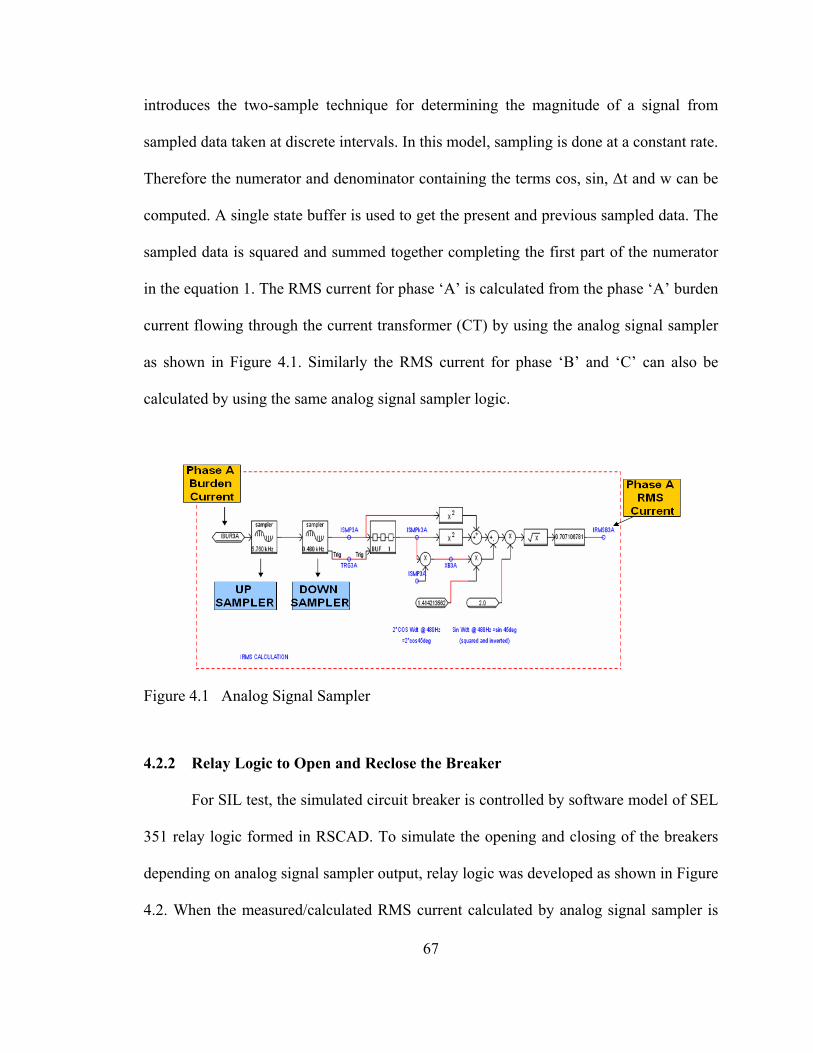
introduces the two-sample technique for determining the magnitude of a signal from
sampled data taken at discrete intervals. In this model, sampling is done at a constant rate.
Therefore the numerator and denominator containing the terms cos, sin, ∆t and w can be
computed. A single state buffer is used to get the present and previous sampled data. The
sampled data is squared and summed together completing the first part of the numerator
in the equation 1. The RMS current for phase ‘A’ is calculated from the phase ‘A’ burden
current flowing through the current transformer (CT) by using the analog signal sampler
as shown in Figure 4.1. Similarly the RMS current for phase ‘B’ and ‘C’ can also be
calculated by using the same analog signal sampler logic.
Figure 4.1 Analog Signal Sampler
4.2.2 Relay Logic to Open and Reclose the Breaker
For SIL test, the simulated circuit breaker is controlled by software model of SEL
351 relay logic formed in RSCAD. To simulate the opening and closing of the breakers
depending on analog signal sampler output, relay logic was developed as shown in Figure
4.2. When the measured/calculated RMS current calculated by analog signal sampler is
67

greater than the specified pick up value, then the IF THEN ELSE block output will be 1.
The type of fault is checked by the second IF THEN ELSE block, if the fault applied is
phase to ground then the output will be 1. These two outputs forms an input to the AND
gate. A trip signal to the BRK1 is sent out if the output of the AND gate is high.
Figure 4.2 Relay Logic to Open and Reclose the Breaker [23]
68
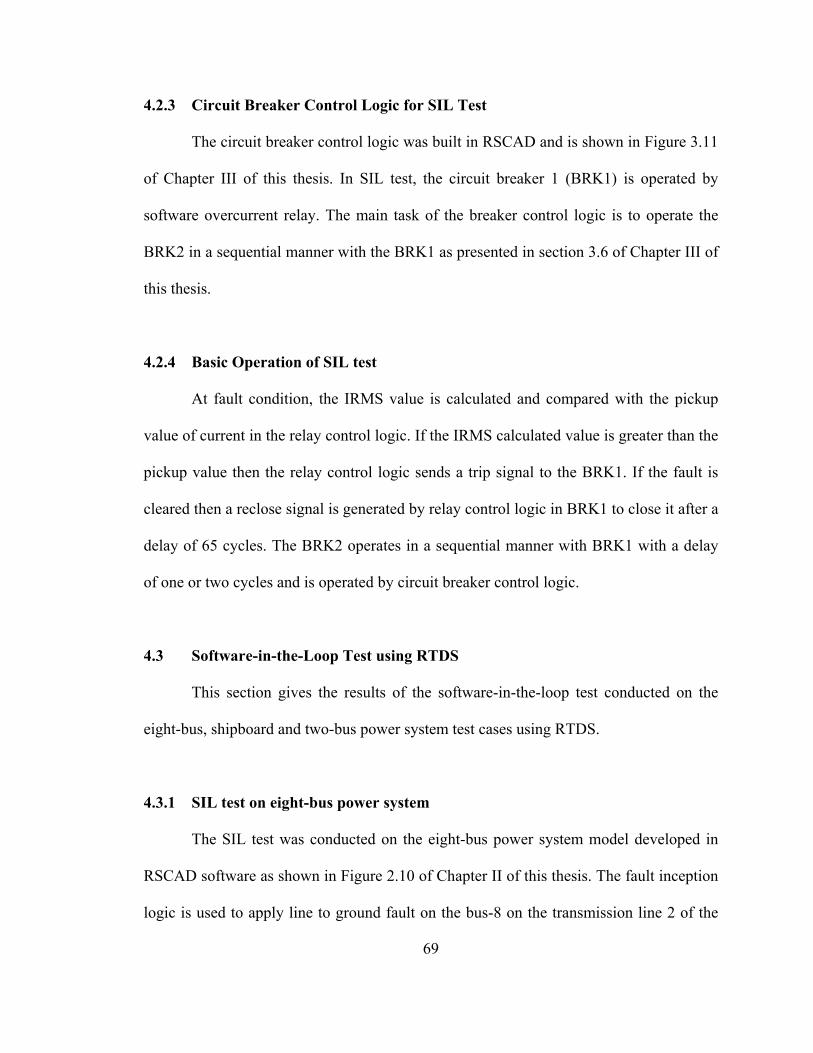
4.2.3 Circuit Breaker Control Logic for SIL Test
The circuit breaker control logic was built in RSCAD and is shown in Figure 3.11
of Chapter III of this thesis. In SIL test, the circuit breaker 1 (BRK1) is operated by
software overcurrent relay. The main task of the breaker control logic is to operate the
BRK2 in a sequential manner with the BRK1 as presented in section 3.6 of Chapter III of
this thesis.
4.2.4 Basic Operation of SIL test
At fault condition, the IRMS value is calculated and compared with the pickup
value of current in the relay control logic. If the IRMS calculated value is greater than the
pickup value then the relay control logic sends a trip signal to the BRK1. If the fault is
cleared then a reclose signal is generated by relay control logic in BRK1 to close it after a
delay of 65 cycles. The BRK2 operates in a sequential manner with BRK1 with a delay
of one or two cycles and is operated by circuit breaker control logic.
4.3 Software-in-the-Loop Test using RTDS
This section gives the results of the software-in-the-loop test conducted on the
eight-bus, shipboard and two-bus power system test cases using RTDS.
4.3.1 SIL test on eight-bus power system
The SIL test was conducted on the eight-bus power system model developed in
RSCAD software as shown in Figure 2.10 of Chapter II of this thesis. The fault inception
logic is used to apply line to ground fault on the bus-8 on the transmission line 2 of the
69

eight-bus system. This section gives the SIL simulation results for the single line to
ground (SLG), double line to ground (L-L-G) and three-phase (L-L-L-G) fault simulated
on the eight-bus system.
On RTDS, the eight-bus power system was simulated for 1.8 seconds. Figures 4.3
and 4.4 show the CT currents, trip signal, and BRK1 and BRK2 open and reclose signals
for SLG fault applied on phase A of bus 8 of the eight bus power system.
Figure 4.3 CT current after SLG fault on phase A
70

Figure 4.4 Trip, Open and Reclose Signal for BRK1 and BRK2 after SLG Fault
The burden currents flowing through the CT1 are used to measure the RMS
current by analog signal sampler and are compared with the pickup value of current in the
software relay model 1. The pick up value of current is specified as 4A in the software
overcurrent relay model 1 for the eight-bus system. Figure 4.4 shows that when the SLG
fault is present then the software overcurrent relay model generates a trip signal to open
the phase A of the BRK1 because the IRMS current goes beyond the pickup value of the
current as specified in the software relay model. After the fault clearance the software
relay model generates a reclose signal after 65 cycles from the BRK1 tripping to reclose
the BRK1. The operation of BRK2 is controlled by the circuit breaker control logic as
explained in section 3.5 of Chapter III of this thesis.
Figures 4.5 and 4.6 show the CT currents and trip, open and reclose signals for
BRK1 and BRK2 for the SIL test after double line to ground fault. Figure 4.5 show that
71

the currents in the CT have peak current of 10A and 20 A in A and B phases, respectively
after the L-L-G fault on phases A and B.
Figure 4.5 CT current after L-L-G fault on phase A and B
Figure 4.6 Trip, Open and Reclose Signal for BRK1 and BRK2 after L-L-G Fault
72
Figure 4.6 shows how the software relay model and breaker control logic
generates the trip, open and reclose signals for A and B phases for BRK1 and BRK2,
respectively after the L-L-G fault. Simulation was done for all possible double line to
ground fault but not presented in thesis. This simulation results shows satisfactory
response similar to results obtained for phase A and B fault.
The figures below show the CT currents and, trip, open and reclose signals for BRK1 and
BRK2 for the SIL test when a three phase (L-L-L-G) fault is applied at the bus 8 of the
eight-bus power system test case. Figure 4.7 shows CT1 currents having magnitude of
around 20A in all phases after L-L-L-G fault.
Figure 4.7 CT current after L-L-L-G fault on phase A B C
73

Figure 4.8 Trip, Open and Reclose Signal for BRK1 and BRK2 after L-L-L-G Fault
Figure 4.8 shows that all the three phases of the BRK1 open and reclose after the
L-L-L-G fault by the software relay logic while the circuit breaker control logic operates
the BRK2 opening and reclosing in sequential manner with BRK1 with a delay of one
cycle.
4.3.2 SIL test on shipboard power system
This section gives the SIL simulation results for the three phases (L-L-L-G) fault
simulated on the shipboard power system.
The simulation time for the shipboard power system on RTDS is 1.8 seconds with
time step of 60 microseconds. Figure 4.9 shows the three phase burden current in CT.
74
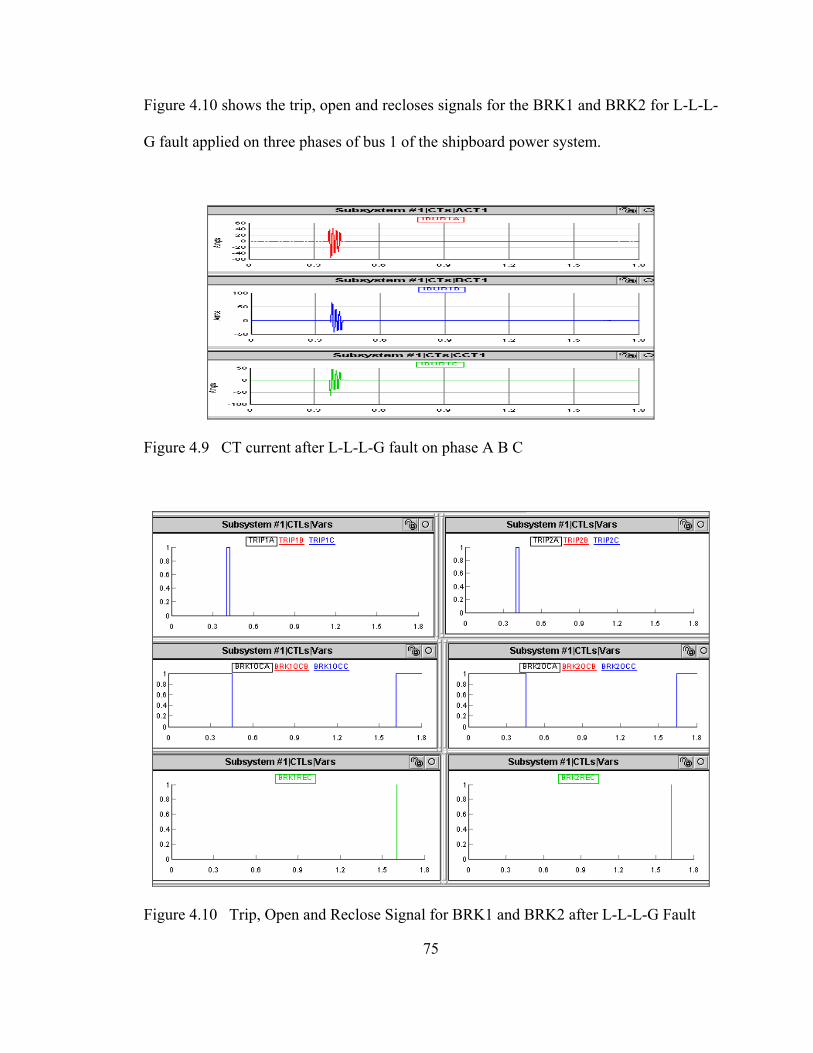
Figure 4.10 shows the trip, open and recloses signals for the BRK1 and BRK2 for L-L-L-
G fault applied on three phases of bus 1 of the shipboard power system.
Figure 4.9 CT current after L-L-L-G fault on phase A B C
Figure 4.10 Trip, Open and Reclose Signal for BRK1 and BRK2 after L-L-L-G Fault
75

The pick up value of current is specified as 1A in the software overcurrent relay
model 1 for the shipboard power system. Figure 4.10 shows that when the L-L-L-G fault
is present then the IRMS current goes beyond the pickup value of current, which enables
the software overcurrent relay model to generate a trip signal to open BRK1. After the
fault clearance the software relay model generates a reclose signal after 65 cycles from
the BRK1 tripping to close the BRK1. The BRK2 is operated by circuit breaker control
logic as explained in section 3.5 of Chapter III of this thesis.
4.3.3 SIL test on two-bus power system
The SIL test was conducted on the two-bus system for all type of line to ground
faults. The fault is present at bus 3 on the transmission line 1 of the two-bus system. This
section gives the real time SIL simulation results for the three-phase (L-L-L-G) fault
simulated on the two-bus system.
The two-bus power system was simulated on RTDS for 1.8 seconds. Figures 4.11
and 4.12 show the CT currents, trip signal and, BRK1 open and reclose signals for L-L-
L-G fault applied on phases A, B and C of bus 3 of the two bus power system.
Figure 4.11 CT current after L-L-L-G fault on phase A B C
76

Figure 4.12 Trip, Open and Reclose Signals for BRK1 after L-L-L-G Fault
The pick up value of current is specified as 2A in the software overcurrent relay
model 1 for the two-bus power system. Figure 4.12 shows that when the L-L-L-G fault is
present then the software overcurrent relay model generates a trip signal to open all the
three phases of the BRK1.
4.4 Comparison of HIL and SIL Results
In this section, the simulation results of the hardware in the loop and software in
the loop test conducted on different test case power system are compared on the basis of
functionality criteria and value of ∆T (time difference between the operation of breakers
by relay). The relay tripping time and breaker open and reclose time are used as
reference to validate the software overcurrent relay model.
According to functionality criterion, upon the occurrence of fault the hardware or
software relay should generate a trip signal after a delay of 1 to 2 cycles (1cycle = 16.667
77

milliseconds) to open the breaker after a delay of 2 to 5 cycles. After the delay of 65 to 70
cycles from the breaker opening, the relay should generate a reclose signal to close the
breaker contacts. After getting the reclose signal, the breaker contact should close after a
delay of 2 to 5 cycles. The hardware and software relays are compared based on this
functionality criterion.
Table 4.1 below shows the relay tripping and breakers (BRK1 and BRK2)
opening and reclosing time for the HIL and SIL test for the eight-bus power system.
Here, ∆T1H and ∆T2S are the time difference between the operations of breakers by the
hardware and software overcurrent relay model during HIL and SIL test while ∆THS is
the time difference between the operation of hardware and software relay minus the
offset time during HIL and SIL test respectively. Offset time is defined as the time
difference between the fault occurrence during the HIL and SIL test. Keeping the
functionality criterion in mind, the ∆T1H and ∆T2S for the HIL and SIL test are
compared. The ∆THS also shows that the software relay model is operating in a similar
way as that of the hardware relay irrespective of the time of fault inception. The
comparison shows that the software overcurrent relay model is showing the same basic
functionality as that of the actual SEL 351S overcurrent hardware relay.
Table 4.1 Tripping, Open and Reclose Time for BRK1 and BRK2 during HIL & SIL
Eight Bus System Hardware In the Loop Software In the Loop BRK 1
(Seconds) BRK 2
(Seconds) BRK 1
(Seconds) BRK 2
(Seconds) FAULT (L-L-L-G) 0.3735 0.3815
Trip 0.3902 0.4106 0.3982 0.4193 Breaker Opening 0.4488 0.4608 0.4571 0.4702 Reclose Signal 1.5702 1.5907 1.5835 1.5906
Breaker Reclose 1.6199 1.6434 1.6313 1.6440 78

Table 4.1 (continued)
∆T1H (Seconds) ∆T2S (Seconds)
Trip 1 - Fault 1 0.0167 Trip 1 - Fault 1 0.0167 Breaker 1 Opening -
Trip 1 0.0586 Breaker 1
Opening - Trip 1 0.0589
Reclose Signal - Breaker 1 Opening
1.1214 Reclose Signal - Breaker 1 Opening
1.1264
Breaker 1 Reclose - Reclose Signal
0.0497 Breaker 1 Reclose -
Reclose Signal
0.0478
Offset (Fault1H – Fault1S) 0.3735 - 0.3815 -0.008
∆THS (Seconds) Trip1 H-Trip1S –(Offset) 0.3902-0.3982 - (0.008) 0.000
Breaker 1 Opening H-Breaker 1 Opening S – (Offset)
0.4488-0.4571 - (0.008) 0.000
Reclose Signal H – Reclose Signal S –(Offset)
1.5702-1.5835 – (0.008) -0.0053
Breaker 1 Reclose - Breaker 1 Reclose S –(Offset)
1.6259-1.6313 – (0.008) 0.002
The relay tripping and breakers (BRK1 and BRK2) opening and reclosing time
for the HIL and SIL tests for the shipboard power system are compared on the basis of
∆T1H and ∆T2S in Table 4.2. From the table it can be observed that the values of ∆T1H
and ∆T2S during the HIL and SIL test are very similar and the time difference between
the operation of hardware and software relay minus offset time (∆THS) during the HIL
and SIL test is very small, which concludes that the software overcurrent relay model is
operating in a similar way as actual hardware SEL 351S overcurrent relay operates.
Table 4.2 Tripping, Open and Reclose Time for BRK1 & BRK2 during HIL & SIL
Shipboard System Hardware In the Loop Software In the Loop BRK 1
(Seconds) BRK 2
(Seconds) BRK 1
(Seconds) BRK 2
(Seconds) FAULT (L-L-L-G) 0.3538 0.3833
Trip 0.3708 0.3875 0.4000 0.4157
79

Table 4.2 (continued)
Breaker Opening 0.4228 0.4415 0.4513 0.4676 Reclose Signal 1.5336 1.5679 1.5673 1.5906
Breaker Reclose 1.5826 1.6188 1.6183 1.6409 ∆T1H
(Seconds) ∆T2S
(Seconds) Trip 1 - Fault 1 0.0170 Trip 1 - Fault 1 0.0167
Breaker 1 Opening - Trip 1
0.0520 Breaker 1 Opening - Trip 1
0.0513
Reclose Signal - Breaker 1 Opening
1.1108 Reclose Signal - Breaker 1 Opening
1.1160
Breaker 1 Reclose - Reclose Signal
0.0490 Breaker 1 Reclose - Reclose Signal
0.0510
Offset |Fault1H – Fault1S| |0.3538-0.3833| -0.0295
∆THS (Seconds) Trip1 H-Trip1S –(Offset) 0.3708 - 0.4000 – (-0.0295) 0.0003
Breaker 1 Opening H-Breaker 1 Opening S – (Offset)
0.4228 - 0.4513 – (-0.0295) 0.0030
Reclose Signal H – Reclose Signal S–(Offset)
1.5336 - 1.5673 – (-0.0295) -0.0042
Breaker 1 Reclose - Breaker 1 Reclose S –(Offset)
1.5826 - 1.6183 – (-0.0295) -0.0062
Similarly, the simulation results of HIL test conducted on two-bus system are
compared with SIL test as shown in the Table 4.3. Simulation results and the comparison
of ∆T1H and ∆T2S indicate that the software overcurrent relay model is replicating the
same functionality as that of the hardware SEL 351S overcurrent relay.
Table 4.3 Tripping, Open and Reclose Time for BRK1 during HIL and SIL
Two Bus System Hardware In the Loop Software In the Loop BRK 1 (Seconds) BRK 1 (Seconds) FAULT (L-L-L-G) 0.35621 0.3849 Trip 0.3728 0.4018 Breaker Opening 0.4248 0.4521 Reclose Signal 1.5286 1.5561 Breaker Reclose 1.5806 1.6086
∆T1H (Seconds) ∆T2S (Seconds)
80
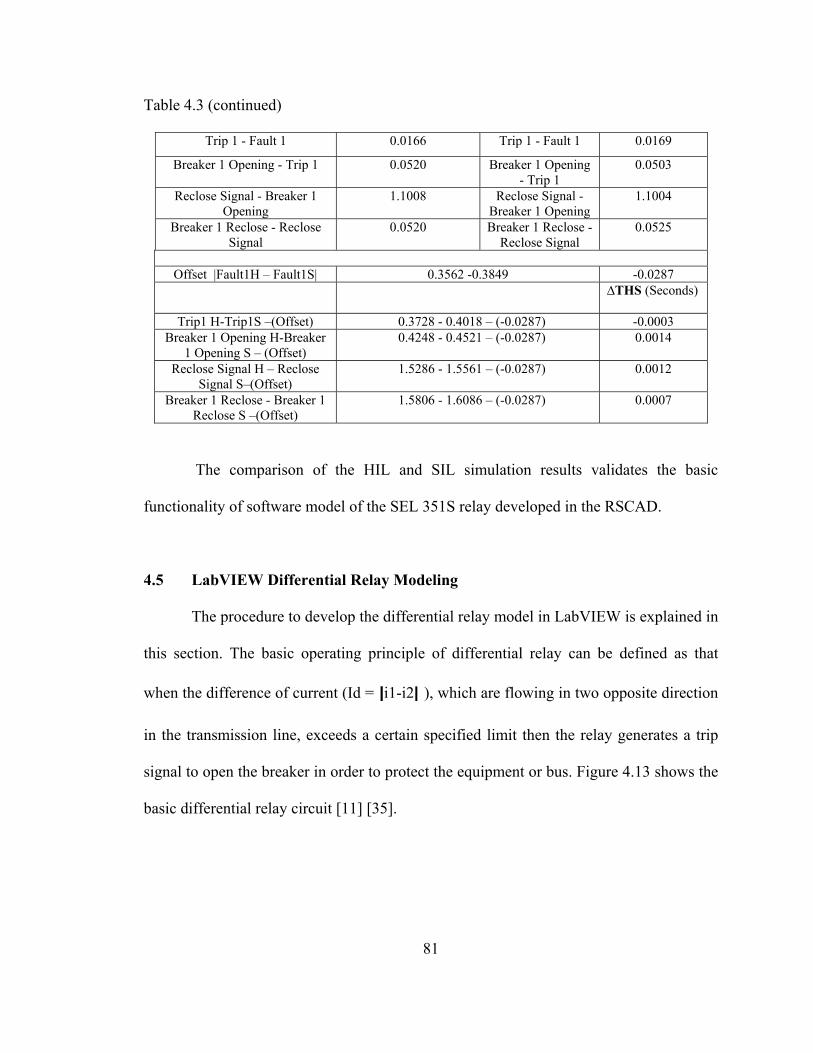
Table 4.3 (continued)
Trip 1 - Fault 1 0.0166 Trip 1 - Fault 1 0.0169
Breaker 1 Opening - Trip 1 0.0520 Breaker 1 Opening - Trip 1
0.0503
Reclose Signal - Breaker 1 Opening
1.1008 Reclose Signal - Breaker 1 Opening
1.1004
Breaker 1 Reclose - Reclose Signal
0.0520 Breaker 1 Reclose - Reclose Signal
0.0525
Offset |Fault1H – Fault1S| 0.3562 -0.3849 -0.0287
∆THS (Seconds)
Trip1 H-Trip1S –(Offset) 0.3728 - 0.4018 – (-0.0287) -0.0003 Breaker 1 Opening H-Breaker
1 Opening S – (Offset) 0.4248 - 0.4521 – (-0.0287) 0.0014
Reclose Signal H – Reclose Signal S–(Offset)
1.5286 - 1.5561 – (-0.0287) 0.0012
Breaker 1 Reclose - Breaker 1 Reclose S –(Offset)
1.5806 - 1.6086 – (-0.0287) 0.0007
The comparison of the HIL and SIL simulation results validates the basic
functionality of software model of the SEL 351S relay developed in the RSCAD.
4.5 LabVIEW Differential Relay Modeling
The procedure to develop the differential relay model in LabVIEW is explained in
this section. The basic operating principle of differential relay can be defined as that
when the difference of current (Id = |i1-i2| ), which are flowing in two opposite direction
in the transmission line, exceeds a certain specified limit then the relay generates a trip
signal to open the breaker in order to protect the equipment or bus. Figure 4.13 shows the
basic differential relay circuit [11] [35].
81

Figure 4.13 Basic Differential Relay Circuit [11]
If Id is less then threshold value than the differential relay does not generate the
trip signal to open the breaker but if Id is greater than the threshold value then the
differential relay sends the trip signal to open the breaker. Figure 4.14 shows the block
diagram of the differential relay model.
Figure 4.14 Block diagram of the components of differential relay
4.5.1 Analog and Digital Filter
The analog signals are filtered by using the analog filters to remove the noises
from the signal before converting them into the digital signals. The analog filter is a 5th
order band pass Butterworth filter with a band pass frequency ranging from 40 to 80 Hz
82
[9]. Similarly the digital signals are filtered by using digital filters to make the digital
signal free from any kind of noises or disturbances. The low pass digital FIR filter is used
as a digital filter in the LabVIEW differential relay model [37].
4.5.2 Analog to Digital Converter
The analog to digital converter (ADC) is an important block in the LabVIEW
relay model, which is used to convert the three phase analog signals in to three phase
digital signals. A zero order hold and sampling block combine to form an ADC [36] that
samples the signal at the rate of 16 samples per cycle [9].
4.5.3 Comparator and Threshold Value
The digital signals coming out of the digital filter are compared with the threshold
value in the comparator. If the output digital signals is above the threshold value then
only the LabVIEW differential relay model generates the trip signal otherwise no trip
signal is generated [9]. The threshold range of value, which is specified in the LabVIEW
differential relay model, is from –0.5A to 0.5A. It means that if at fault condition, the
difference between the CT1 and CT2 currents (I=i1-i2) is less then –0.5A or greater then
0.5A then only the relay model generates the digital trip signals to open the system.
4.6 Internal Mode of LabVIEW Differential Relay Model
In internal mode, the LabVIEW differential relay model can be tested for different
types fault condition. The current signals, which are to be monitored, are generated by
three single-phase internal supply sources, which are displaced by 120-degree phase
83

angle. The value of the current, which is generated by the source, is 3000A. The CT ratio
of the current transformer 1 and 2 (CT1 and CT2) is 1500:1. The current coming out from
the secondary side of the CT1 and CT2 is 3000/1500= 2A. Current was sampled, filtered
using the analog and digital filter and then processed using the signal processing block to
get the magnitude of current. Figure 4.15 shows front panel of the differential relay
model developed in LabVIEW software operating in internal mode. The LabVIEW
differential relay model was tested for single line to ground fault condition. Figure 4.15
also shows that there are three buttons (Phase A fault, Phase B fault and Phase C fault)
present on the front panel of the LabVIEW in order to apply different kinds of faults. The
simulation results of the LabVIEW differential relay model operating in internal mode
are presented in the next section of this thesis.
Figure 4.15 LabVIEW Differential Relay in Internal Model
84

4.7 Results for LabVIEW Differential Relay Model Operating in Internal Mode
This section presents the simulation results of the LabVIEW differential relay
model operating in internal mode for single line to ground (L-G) fault inside as well as
outside its zone of protection.
4.7.1 Single Line to Ground (L-G) Fault (Inside the protection zone)
In the internal mode of operation, the internal source generates the current signals
and these current signals are fed to the CT1 and CT2, respectively. The current signals
measured by the CT1 and CT2 are fed to the differential relay model. The differential
relay model is then tested for single line to ground fault present inside the protection zone
of the relay. Figure 4.16 shows the power system model with the fault present on the bus,
which lies inside the protection zone of the differential relay. So in this case the
differential relay will generate a trip signal to open the breaker to protect the bus.
Figure 4.16 Power system model with fault on the bus
In the LabVIEW differential relay model, the single line to ground fault is applied
on phase A at 0.1 sec by pressing the button present on the front panel of the relay model.
85

Figure 4.17 shows the behavior of the current signals and the corresponding trip signal
upon occurrence of phase A fault.
Figure 4.17 L-G fault on Phase A (Inside the protection zone)
4.7.2 Single Line to Ground (L-G) Fault (Outside the protection zone)
The relay model operating in internal mode is also tested for single line to ground
fault applied outside the protection zone of the relay. In this case the differential relay
will not generate the trip signal to open the breaker. Figure 4.18 shows the power system
model with the fault present on the transmission line, which lies outside the protection
zone of the differential relay. So the differential relay will not generate the trip signal to
open the breaker.
86
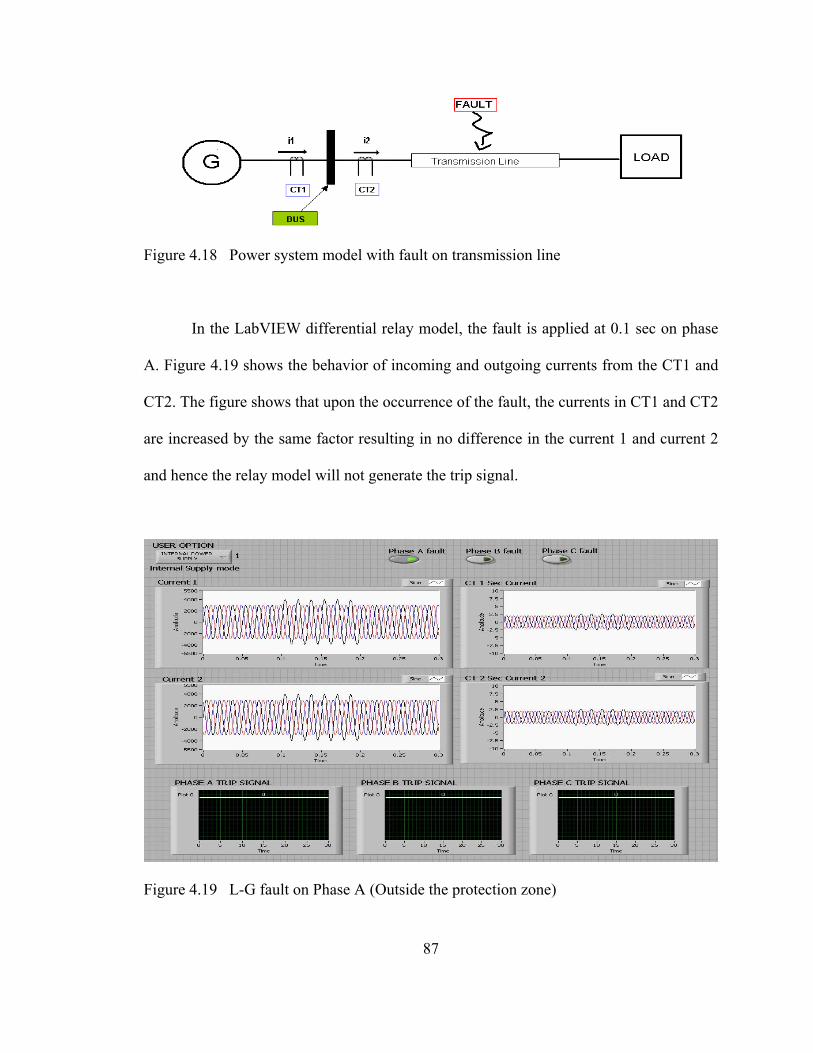
Figure 4.18 Power system model with fault on transmission line
In the LabVIEW differential relay model, the fault is applied at 0.1 sec on phase
A. Figure 4.19 shows the behavior of incoming and outgoing currents from the CT1 and
CT2. The figure shows that upon the occurrence of the fault, the currents in CT1 and CT2
are increased by the same factor resulting in no difference in the current 1 and current 2
and hence the relay model will not generate the trip signal.
Figure 4.19 L-G fault on Phase A (Outside the protection zone) 87

4.8 Summary
The procedure to develop the software overcurrent relay model was discussed in
this chapter. Different control logics like analog signal sampler and relay logic were
required for the development of software model of overcurrent relay in RSCAD software.
The software relay model was tested on the two-bus, SPS and eight-bus power system
under different fault conditions in software in the loop (SIL). The HIL and SIL
simulation results were compared to validate the software overcurrent relay model. This
chapter also explains the basic principle for the development of differential relay model
in LabVIEW and the simulation results for the LabVIEW differential relay model.
88
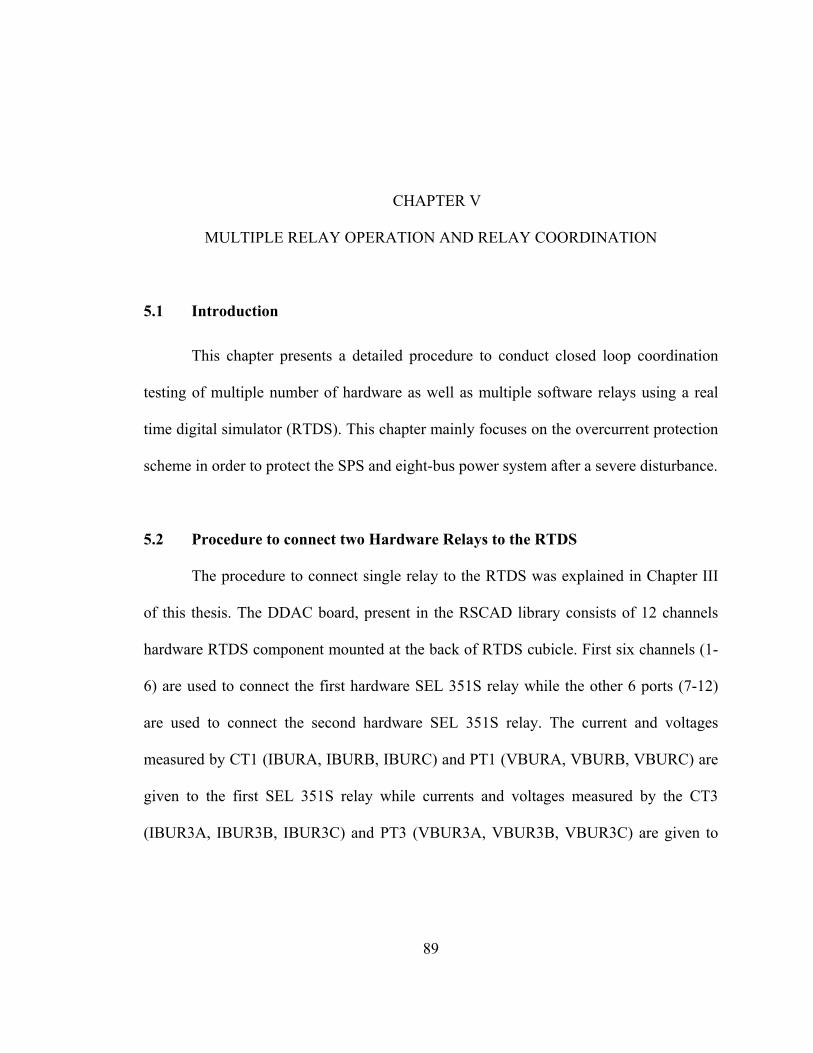
CHAPTER V
MULTIPLE RELAY OPERATION AND RELAY COORDINATION
5.1 Introduction
This chapter presents a detailed procedure to conduct closed loop coordination
testing of multiple number of hardware as well as multiple software relays using a real
time digital simulator (RTDS). This chapter mainly focuses on the overcurrent protection
scheme in order to protect the SPS and eight-bus power system after a severe disturbance.
5.2 Procedure to connect two Hardware Relays to the RTDS
The procedure to connect single relay to the RTDS was explained in Chapter III
of this thesis. The DDAC board, present in the RSCAD library consists of 12 channels
hardware RTDS component mounted at the back of RTDS cubicle. First six channels (1-
6) are used to connect the first hardware SEL 351S relay while the other 6 ports (7-12)
are used to connect the second hardware SEL 351S relay. The current and voltages
measured by CT1 (IBURA, IBURB, IBURC) and PT1 (VBURA, VBURB, VBURC) are
given to the first SEL 351S relay while currents and voltages measured by the CT3
(IBUR3A, IBUR3B, IBUR3C) and PT3 (VBUR3A, VBUR3B, VBUR3C) are given to
89
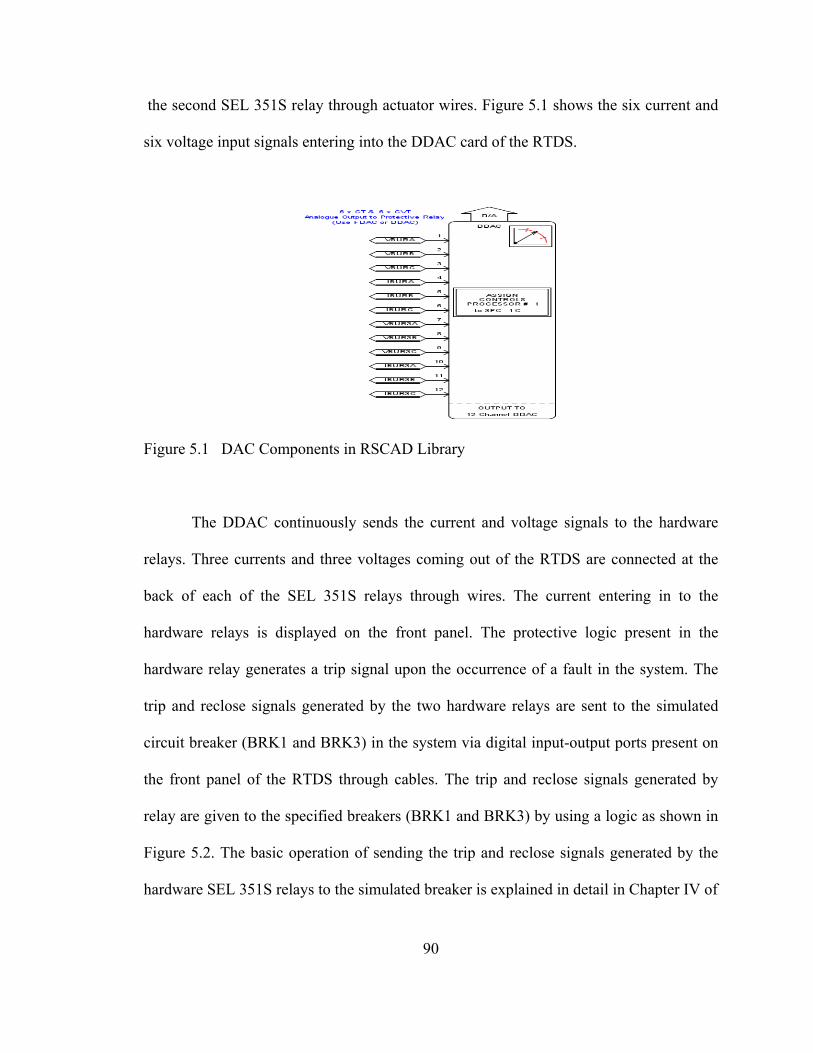
the second SEL 351S relay through actuator wires. Figure 5.1 shows the six current and
six voltage input signals entering into the DDAC card of the RTDS.
Figure 5.1 DAC Components in RSCAD Library
The DDAC continuously sends the current and voltage signals to the hardware
relays. Three currents and three voltages coming out of the RTDS are connected at the
back of each of the SEL 351S relays through wires. The current entering in to the
hardware relays is displayed on the front panel. The protective logic present in the
hardware relay generates a trip signal upon the occurrence of a fault in the system. The
trip and reclose signals generated by the two hardware relays are sent to the simulated
circuit breaker (BRK1 and BRK3) in the system via digital input-output ports present on
the front panel of the RTDS through cables. The trip and reclose signals generated by
relay are given to the specified breakers (BRK1 and BRK3) by using a logic as shown in
Figure 5.2. The basic operation of sending the trip and reclose signals generated by the
hardware SEL 351S relays to the simulated breaker is explained in detail in Chapter IV of
90
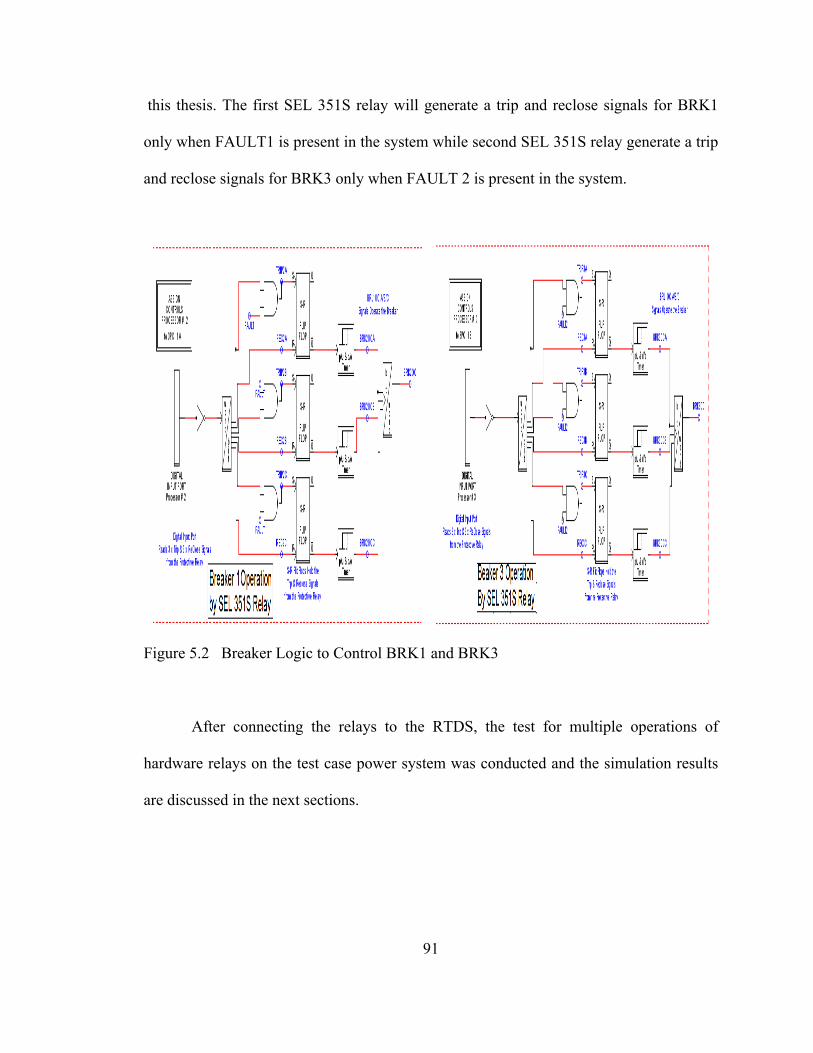
this thesis. The first SEL 351S relay will generate a trip and reclose signals for BRK1
only when FAULT1 is present in the system while second SEL 351S relay generate a trip
and reclose signals for BRK3 only when FAULT 2 is present in the system.
Figure 5.2 Breaker Logic to Control BRK1 and BRK3
After connecting the relays to the RTDS, the test for multiple operations of
hardware relays on the test case power system was conducted and the simulation results
are discussed in the next sections.
91

5.3 Simulation Results with Multiple Hardware Relays in the System
5.3.1 Eight-Bus Power system
The eight-bus system shown in Figure 2.10 of Chapter II of this thesis is modified
in order to conduct the test having multiple hardware SEL 351S overcurrent relays
located on two different transmission lines. The modified eight-bus system is shown in
Figure 5.1 where another transmission line 1 was developed similar to the transmission
line 2. The specifications of the eight-bus system were described in Chapter II of this
thesis. The line to ground fault is applied on bus-9 and bus-8 on the transmission line 1
and transmission line 2 respectively at 50% of the transmission line length by using the
fault inception logic as explained in section 3.5 of Chapter III of this thesis work.
92

Figure 5.3 Modified Eight-Bus System in RSCAD
93
As shown in the above figure that there are four circuit breakers in the system,
namely BRK1, BRK2, BRK3, and BRK4. Here, BRK1 and BRK2 are located on
transmission line 2 while BRK3 and BRK4 are located on transmission line 1. In this
work, two hardware SEL 351S relays were used to operate the BRK1 and BRK3. The
current transformer 1 (CT1) and potential transformer 1 (PT1) are located on
transmission line 2 across BRK1 while current transformer 3 (CT3) and potential
transformer 3 (PT3) are located on transmission line1 across the BRK3. The current and
voltages measured by CT1 and PT1 are fed to the first SEL 351S overcurrent relay in
order to control the BRK1 operation, which is located on the transmission line 2 while the
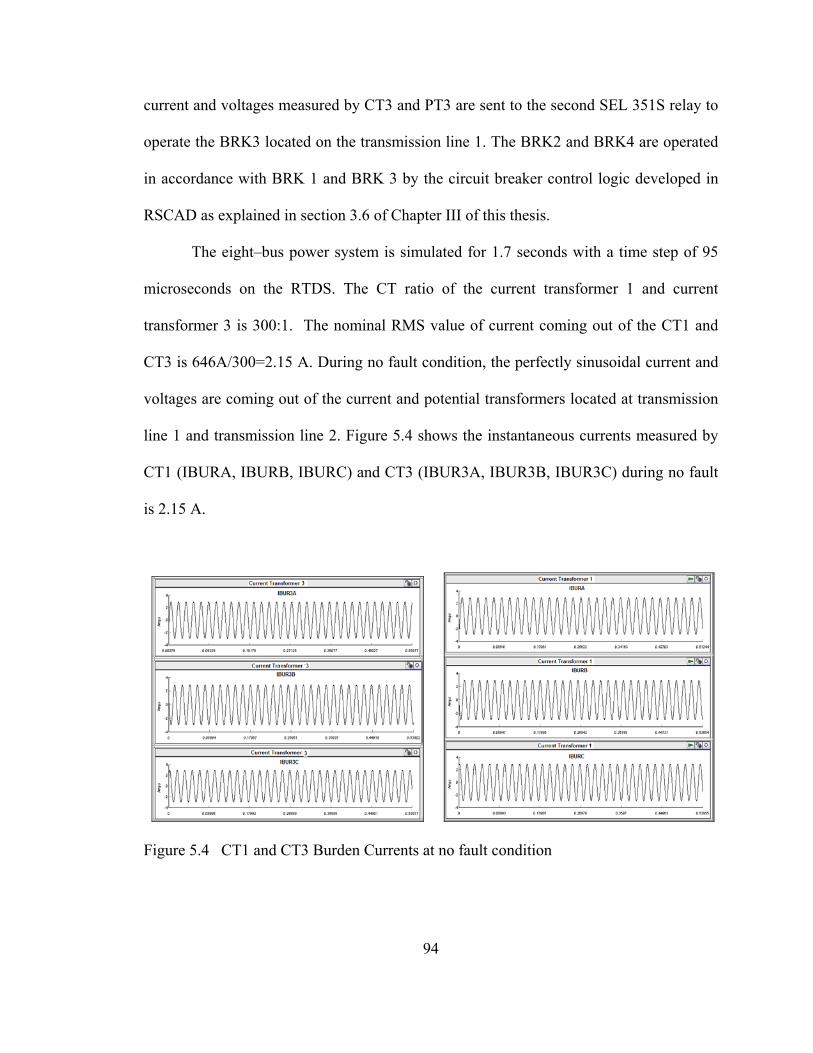
current and voltages measured by CT3 and PT3 are sent to the second SEL 351S relay to
operate the BRK3 located on the transmission line 1. The BRK2 and BRK4 are operated
in accordance with BRK 1 and BRK 3 by the circuit breaker control logic developed in
RSCAD as explained in section 3.6 of Chapter III of this thesis.
The eight–bus power system is simulated for 1.7 seconds with a time step of 95
microseconds on the RTDS. The CT ratio of the current transformer 1 and current
transformer 3 is 300:1. The nominal RMS value of current coming out of the CT1 and
CT3 is 646A/300=2.15 A. During no fault condition, the perfectly sinusoidal current and
voltages are coming out of the current and potential transformers located at transmission
line 1 and transmission line 2. Figure 5.4 shows the instantaneous currents measured by
CT1 (IBURA, IBURB, IBURC) and CT3 (IBUR3A, IBUR3B, IBUR3C) during no fault
is 2.15 A.
Figure 5.4 CT1 and CT3 Burden Currents at no fault condition
94

The eight-bus power system is simulated for all types of line to ground faults such
as single line to ground (SLG), double line to ground (L-L-G) and three phase fault (L-L-
L-G) but the results for the three phase faults are presented here. In the eight-bus system,
the nominal RMS current flowing in the transmission line 1 and transmission line 2 is
2.15 A and the pickup value of current in both the hardware SEL 351S relay is specified
as 6 A. The pickup value of current programmed in the SEL settings should be 1.5 times
or greater than the nominal current.
Upon the occurrence of three phase fault on bus 8 on the transmission line 2 then
the burden current in all the three phases of the CT1 increases abruptly to a very high
value of 20 A, which is above the pickup value of current specified in the SEL 351S relay
settings. This results in the generation of trip signal by the first SEL 351S overcurrent
relay to open the BRK1. If the fault is cleared then the first SEL 351S relay generates a
reclose signal to close the contacts of BRK1 after a delay of 65 cycles. The operation of
BRK2 is controlled by circuit breaker control logic, which operates BRK2 in a sequential
manner with BRK1 with a delay of one cycle. The BRK1 and BRK2 remain open if the
fault is not cleared. Figure 5.5 show the CT1 currents and, BRK1 and BRK 2 trip, open
and reclose signals after L-L-L-G fault.
95
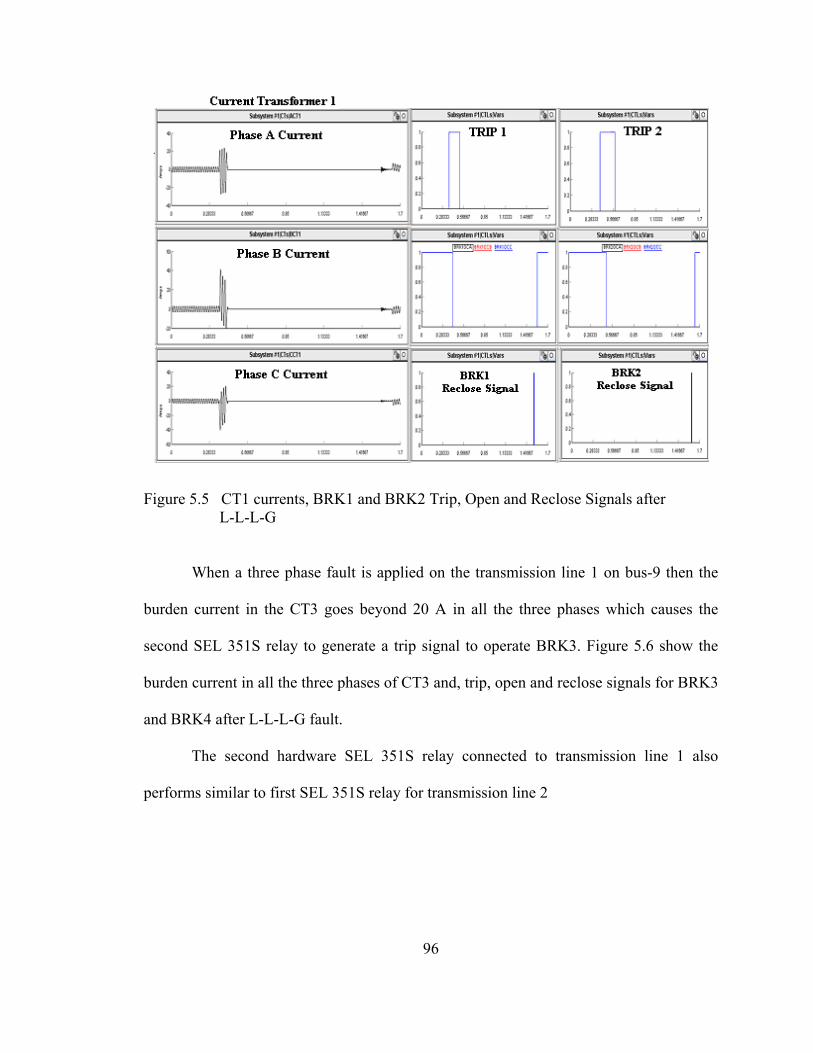
Figure 5.5 CT1 currents, BRK1 and BRK2 Trip, Open and Reclose Signals after L-L-L-G
When a three phase fault is applied on the transmission line 1 on bus-9 then the
burden current in the CT3 goes beyond 20 A in all the three phases which causes the
second SEL 351S relay to generate a trip signal to operate BRK3. Figure 5.6 show the
burden current in all the three phases of CT3 and, trip, open and reclose signals for BRK3
and BRK4 after L-L-L-G fault.
The second hardware SEL 351S relay connected to transmission line 1 also
performs similar to first SEL 351S relay for transmission line 2
96

Figure 5.6 CT3 currents, BRK3 and BRK4 Trip, Open and Reclose Signals after L-L-L-G
5.3.2 Shipboard Power System
The shipboard power system shown in Figure 2.8 of Chapter II of this thesis is
modified in order to conduct the test having multiple hardware SEL 351S overcurrent
relay. The modified shipboard system is shown in Figure 5.7 where another cable 2 is
developed similar to the cable 1. The line to ground fault is applied on bus-1 and bus-2 on
the cable 1 and cable 2, respectively, by the fault inception logic as explained in section
3.5 of Chapter III of this thesis work.
97

Figure 5.7 Modified Shipboard Power System in RSCAD
Here, BRK1 and BRK2 are located on cable 1 while BRK3 and BRK4 are located
on cable 2. The current transformer 1 (CT1) and potential transformer 1 (PT1) are located
on cable 1 across BRK1 while current transformer 3 (CT3) and potential transformer 3
(PT3) are located on cable 2 across the BRK3. The current and voltages measured by
CT1 and PT1 are fed to the first SEL 351S overcurrent relay to operate BRK1 located on
cable 1 while the current and voltages measured by CT3 and PT3 are sent to the second
SEL 351S relay to operate BRK3 located on cable 2. The BRK2 and BRK4 are operated
in accordance with BRK 1 and BRK 3 by the circuit breaker control logic developed in
RSCAD as explained in section 3.6 of Chapter III of this thesis.
98

The shipboard power system is simulated for 1.7 seconds with a time step of 95
microseconds on RTDS. The CT ratio of the current transformer 1 and current
transformer 3 is 300:1. The nominal RMS value of current coming out of the CT1 is
176A/300=0.58A and from CT3 is 216/300= 0.72A. During no fault condition, the
perfectly sinusoidal current and voltages are coming out of the current and potential
transformers located at cable 1 and 2. Figure 5.8 shows the instantaneous current
measured by CT1 (IBURA, IBURB, IBURC) and CT3 (IBUR3A, IBUR3B, IBUR3C)
during no fault condition.
Figure 5.8 CT1 and CT3 Burden Currents at no fault condition
The shipboard power system is simulated for all types of line to ground faults but
the results for the three phase faults are presented here. In the shipboard system, the
nominal current flowing in the cable 1 and cable 2 is 0.58A and 0.72A respectively. The
pickup value of current for the first hardware SEL 351S relay to operate BRK1 is
99
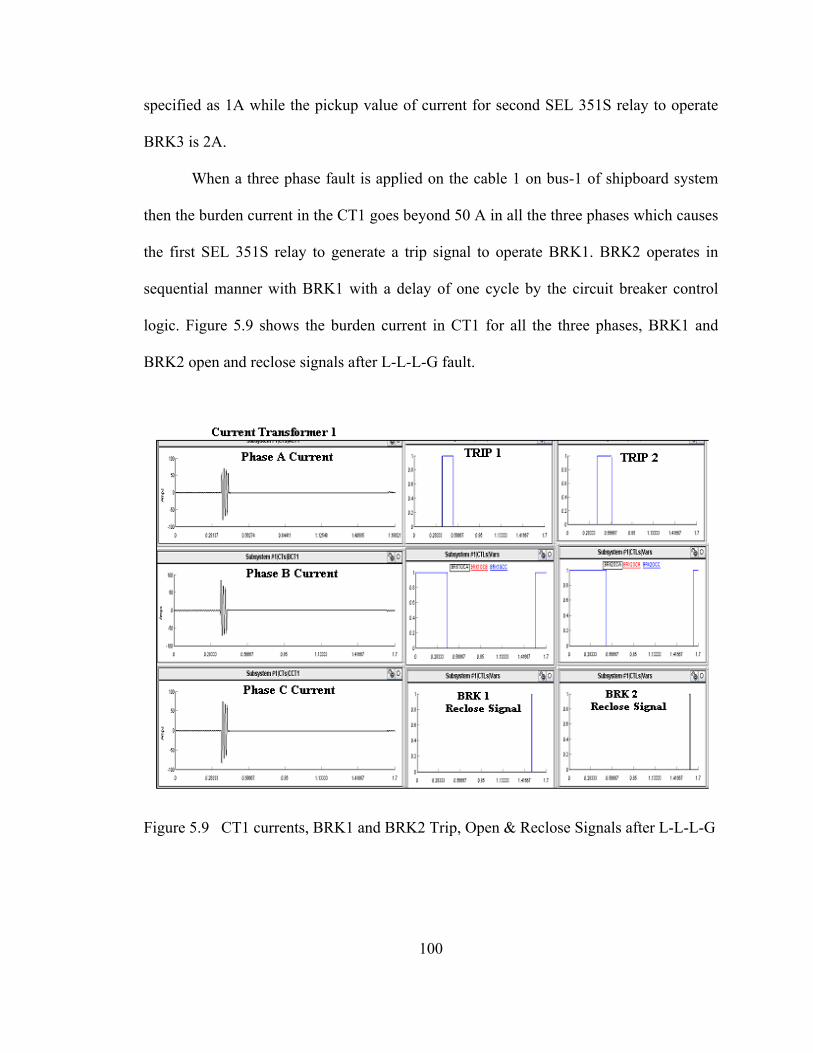
specified as 1A while the pickup value of current for second SEL 351S relay to operate
BRK3 is 2A.
When a three phase fault is applied on the cable 1 on bus-1 of shipboard system
then the burden current in the CT1 goes beyond 50 A in all the three phases which causes
the first SEL 351S relay to generate a trip signal to operate BRK1. BRK2 operates in
sequential manner with BRK1 with a delay of one cycle by the circuit breaker control
logic. Figure 5.9 shows the burden current in CT1 for all the three phases, BRK1 and
BRK2 open and reclose signals after L-L-L-G fault.
Figure 5.9 CT1 currents, BRK1 and BRK2 Trip, Open & Reclose Signals after L-L-L-G
100
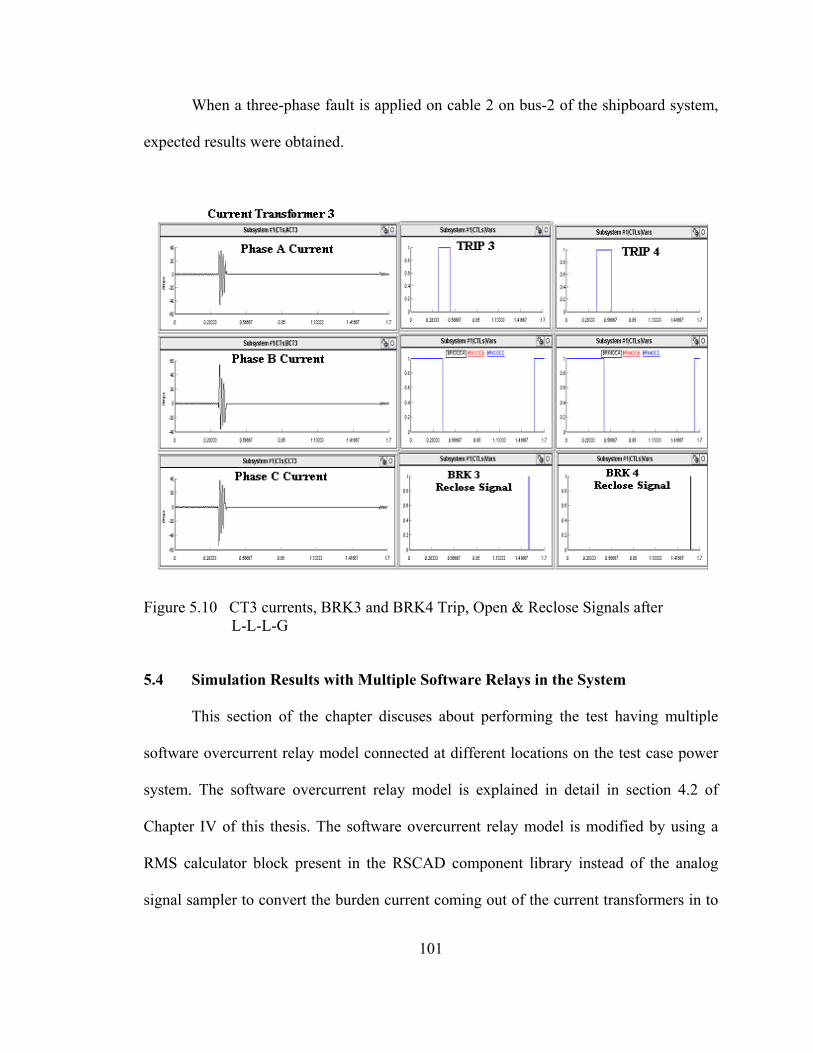
When a three-phase fault is applied on cable 2 on bus-2 of the shipboard system,
expected results were obtained.
Figure 5.10 CT3 currents, BRK3 and BRK4 Trip, Open & Reclose Signals after L-L-L-G
5.4 Simulation Results with Multiple Software Relays in the System
This section of the chapter discuses about performing the test having multiple
software overcurrent relay model connected at different locations on the test case power
system. The software overcurrent relay model is explained in detail in section 4.2 of
Chapter IV of this thesis. The software overcurrent relay model is modified by using a
RMS calculator block present in the RSCAD component library instead of the analog
signal sampler to convert the burden current coming out of the current transformers in to
101

RMS current. The functionality of the RMS calculator block is same as that of the analog
signal sampler. RMS calculator block sample, filter and then calculate the RMS value of
current flowing in the line/cable. Figure 5.11 shows the RMS calculator block present in
the RSCAD library.
Figure 5.11 RMS Calculator Block in RSCAD
The eight-bus power system and shipboard power system are used as test case
power systems for conducting the multiple software relays operation tests. The main
difference between the multiple hardware relay operation and multiple software relay
operation is that all the hardware relays used in the multiple hardware relay operation are
replaced by the software overcurrent relay models in the multiple software relay
operation. The simulation results on the eight-bus and shipboard power system are shown
in the next sections.
5.4.1 Eight-Bus Power system
The modified eight-bus power system is shown in Figure 5.3 of section 5.2 of this
thesis and it is used as a test case system to perform the test having multiple software
relay models for different type of line to ground faults. The test case power system is
102

tested under different type of line to ground faults. The fault is applied on the
transmission line 1 and transmission line 2 at bus-9 and bus-8, respectively, by using two
fault inception logics. The simulation result for the three-phase fault is presented below.
The BRK1 and BRK3 are operated by two software overcurrent relay models
while BRK2 and BRK4 are operated in accordance with BRK 1 and BRK 3 by the circuit
breaker control logic developed in RSCAD as explained in section 4.2.4 of Chapter IV of
this thesis.
The eight–bus power system is simulated for 1.7 seconds with a time step of 95
microseconds on RTDS. The CT ratio of the current transformer 1 and current
transformer 3 is 300:1. The nominal RMS value of current coming out of the CT1 and
CT3 is 646A/300=2.15 A. During no fault condition, the perfectly sinusoidal currents are
coming out of the current transformers located at transmission line 1 and transmission
line 2. Figure 5.4 shows the instantaneous current measured by CT1 (IBURA, IBURB,
IBURC) and CT3 (IBUR3A, IBUR3B, IBUR3C) during no fault condition.
The burden currents flowing through the CT1 and CT3 are used to measure the
RMS current by using RMS calculator block and are compared with the pickup value of
current in the software relay models 1 and 3. The pick up value of current is specified as
6A in the software overcurrent relay models 1 and 3 to operate BRK1 and BRK3, which
are located on two parallel transmission lines in the eight-bus system.
103
Three-phase fault (L-L-L-G) on the transmission line 2 on bus-8 of eight-bus
system causes the IRMS current to go beyond the pickup value of current which results in
the generation of trip signal by the software overcurrent relay model to open all the three
phases of the BRK1. The software relay model closes the BRK1 after 65 cycles after the
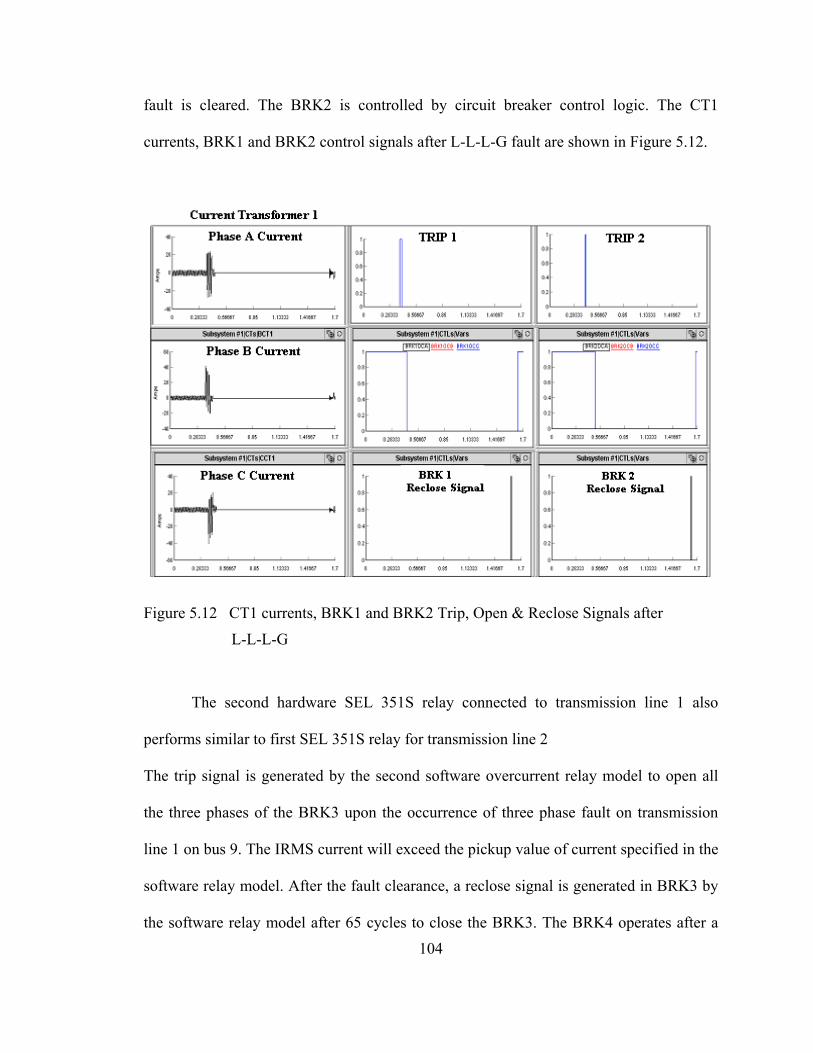
fault is cleared. The BRK2 is controlled by circuit breaker control logic. The CT1
currents, BRK1 and BRK2 control signals after L-L-L-G fault are shown in Figure 5.12.
Figure 5.12 CT1 currents, BRK1 and BRK2 Trip, Open & Reclose Signals after
L-L-L-G
The second hardware SEL 351S relay connected to transmission line 1 also
performs similar to first SEL 351S relay for transmission line 2
The trip signal is generated by the second software overcurrent relay model to open all
the three phases of the BRK3 upon the occurrence of three phase fault on transmission
line 1 on bus 9. The IRMS current will exceed the pickup value of current specified in the
software relay model. After the fault clearance, a reclose signal is generated in BRK3 by
the software relay model after 65 cycles to close the BRK3. The BRK4 operates after a 104
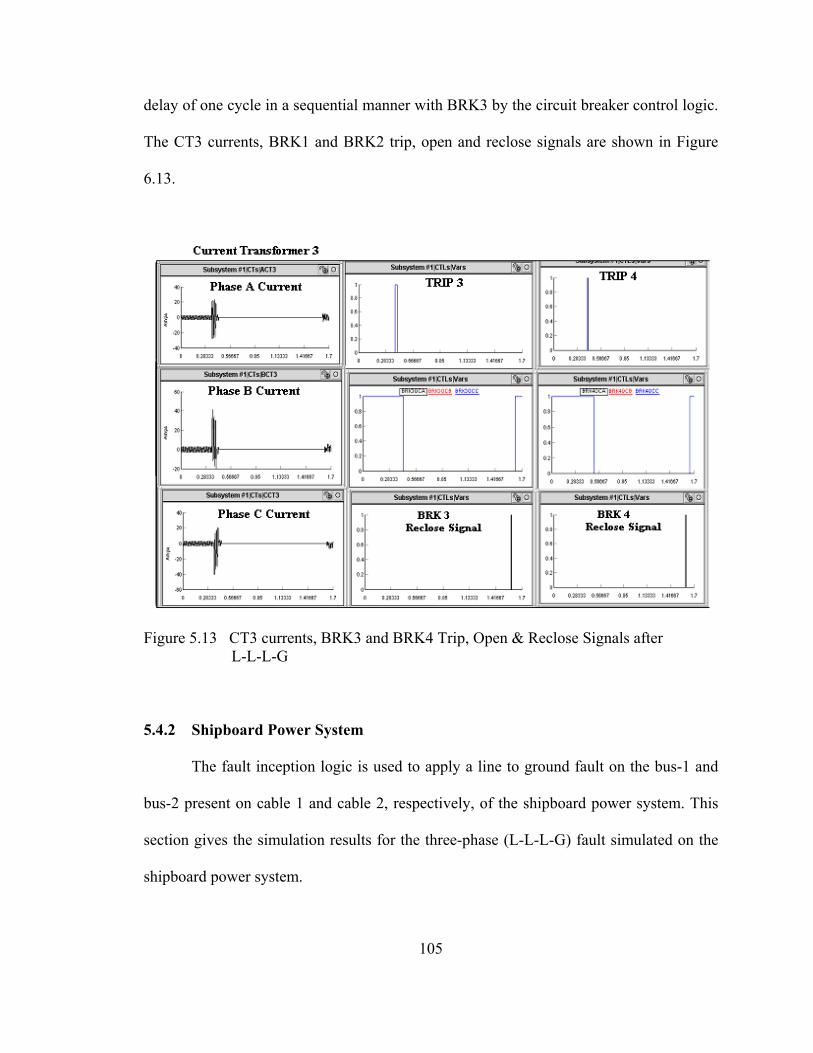
delay of one cycle in a sequential manner with BRK3 by the circuit breaker control logic.
The CT3 currents, BRK1 and BRK2 trip, open and reclose signals are shown in Figure
6.13.
Figure 5.13 CT3 currents, BRK3 and BRK4 Trip, Open & Reclose Signals after L-L-L-G
5.4.2 Shipboard Power System
The fault inception logic is used to apply a line to ground fault on the bus-1 and
bus-2 present on cable 1 and cable 2, respectively, of the shipboard power system. This
section gives the simulation results for the three-phase (L-L-L-G) fault simulated on the
shipboard power system.
105

The simulation time for the shipboard system on the RTDS was 1.7 seconds.
There are two current transformers (CT1 and CT3) in the shipboard system with CT
ratios 300:1. The currents entering in to the CT1 and CT3 are 176A and 216A,
respectively, while the current coming out of the CT1 and CT3 are 0.58A and 0.72 A.
The CT1 and CT3 currents are shown in figure 5.8 for no fault condition.
The burden currents flowing through the CT1 and CT3 are used to measure the
RMS current by using RMS calculator block and are compared with the pickup value of
current in the software relay model 1 and 3. The pick up value of current is specified as
1A in the software overcurrent relay model 1 to operate BRK1 while the pickup value of
current is specified as 3A in software relay model 3 to operate BRK3. BRK1 and BRK3
are located on two parallel cables in the shipboard power system.
When the three-phase fault (L-L-L-G) is applied on the cable 1 on bus-1 of
shipboard power system then the IRMS current goes beyond the pickup value of the
current as specified in the software relay model which results in the generation of trip
signal by the software relay model to open all the three phases of the BRK1. After the
fault clearance the software relay model generates a reclose signal after 65 cycles from
the BRK1 tripping to reclose the BRK1. The BRK2 is controlled by circuit breaker
control logic. Figure 5.14 shows the burden current in CT1 for all the three phases, BRK1
and BRK2 trip, open and reclose signals after L-L-L-G fault.
106

Figure 5.14 CT1 currents, BRK1 and BRK2 Trip, Open & Reclose Signals after L-L-L-G
When three-phase fault (L-L-L-G) is applied on the cable 2 on bus-2 of shipboard
power system then the second software overcurrent relay model generates a trip signal to
open all the three phases of the BRK3 because the IRMS current goes beyond the pickup
value of the current as specified in the software relay model. If the fault is cleared then
the reclose signal is generated by the relay model after a delay of 65 cycles from the
BRK3 opening to close the BRK3. The circuit breaker control logic operates BRK4 in
sequential manner with BRK3 with a delay of one cycle. Figure 5.15 show the burden
current in CT3 for all the three phases, BRK3 and BRK4 trip, open and reclose signals
after L-L-L-G fault.
107

Figure 5.15 CT3 currents, BRK3 and BRK4 Trip, Open & Reclose Signals after L-L-L-G
5.5 Coordination of Relays
Relay coordination is a widely used technique for the protection of power system
from several decades. The function of a specific protective relay can be thought of as
either primary or backup. When a relay (or a system of relays) is applied to protect its
own system element (or zone of protection), it is thought of as a primary relay; when the
function is to back up other relays for a fault at a remote location, it is serving as a
backup relay. Usually, a specific relay provides both functions simultaneously; serving
as a primary relay for its own zone of protection and as a backup relay for remote zones
of protection. In this thesis work the relay coordination is performed on the shipboard as
108

well as on eight-bus power system by using hardware SEL 351S overcurrent relays as
well as by using software overcurrent relay models, respectively.
5.6 Simulation Results for Hardware Relay Coordination
The simulation results for the hardware relay coordination on the shipboard and
eight bus systems are presented in the following sections.
5.6.1 Shipboard Power System
The shipboard power system is modified in order to conduct the hardware relay
coordination test. The specifications of the shipboard system are the same as those
detailed in the section 2.5.1 of Chapter II of this thesis. One more circuit breaker (namely
BRK 3) is added to the system which will be operated by a hardware SEL 351S relay to
protect the NW generator side. The circuit breaker 1 (BRK1) and circuit breaker 3
(BRK3) are controlled by the two hardware SEL 351S overcurrent relay while circuit
breaker 2 (BRK2) is controlled by software model of overcurrent relay. The relay
connected to BRK 1 and BRK 2 provides the primary protection while relay operating
BRK 3 provides back up protection to the BRK 1. Two different types of line to ground
faults are applied on bus-1 on cable 1 of the shipboard system namely, FAULT 1 and
FAULT 2. Figure 5.16 shows the modified shipboard power system.
109

Figure 5.16 Modified Shipboard Power System for Hardware Relay Coordination
The CT ratio of the current transformer 1 (CT1) and current transformer 2 (CT2)
is 300:1. The nominal RMS values of current flowing through CT1 and CT2 at no fault
condition are 0.58A and 0.85A, respectively. The shipboard system is simulated for 1.7
seconds on the RTDS for different types of line to ground fault. During the no fault
condition, the nominal current flow in to the system and there is no trip signal. The
instantaneous current sensed by current transformers (CT1 and CT2) is sinusoidal as
shown in Figure 5.17.
110
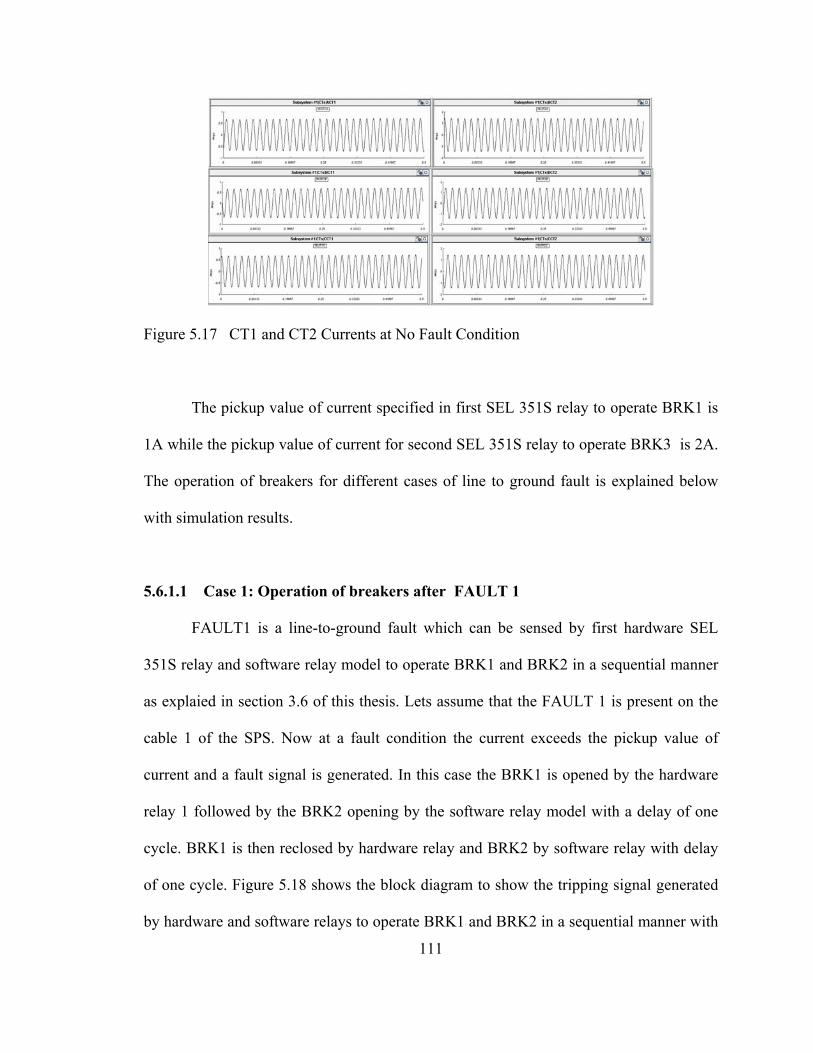
Figure 5.17 CT1 and CT2 Currents at No Fault Condition
The pickup value of current specified in first SEL 351S relay to operate BRK1 is
1A while the pickup value of current for second SEL 351S relay to operate BRK3 is 2A.
The operation of breakers for different cases of line to ground fault is explained below
with simulation results.
5.6.1.1 Case 1: Operation of breakers after FAULT 1
FAULT1 is a line-to-ground fault which can be sensed by first hardware SEL
351S relay and software relay model to operate BRK1 and BRK2 in a sequential manner
as explaied in section 3.6 of this thesis. Lets assume that the FAULT 1 is present on the
cable 1 of the SPS. Now at a fault condition the current exceeds the pickup value of
current and a fault signal is generated. In this case the BRK1 is opened by the hardware
relay 1 followed by the BRK2 opening by the software relay model with a delay of one
cycle. BRK1 is then reclosed by hardware relay and BRK2 by software relay with delay
of one cycle. Figure 5.18 shows the block diagram to show the tripping signal generated
by hardware and software relays to operate BRK1 and BRK2 in a sequential manner with
111

a time delay between the operation of BRK1 and BRK2. Figures 5.19 and 5.20 shows the
simulation results for the FAULT1 condition.
Figure 5.18 Operation of BRK1 and BRK2 after FAULT 1
Figure 5.19 CT1 & CT2 currents after L-L-L-G FAULT 1
112
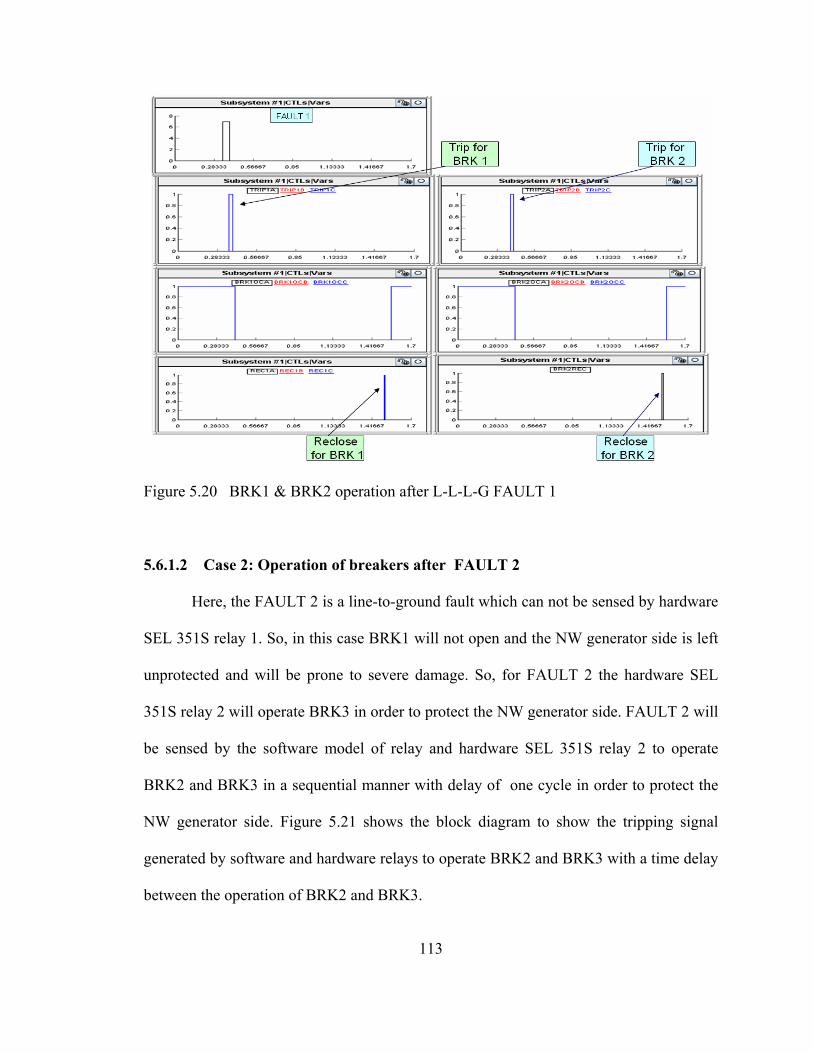
Figure 5.20 BRK1 & BRK2 operation after L-L-L-G FAULT 1
5.6.1.2 Case 2: Operation of breakers after FAULT 2
Here, the FAULT 2 is a line-to-ground fault which can not be sensed by hardware
SEL 351S relay 1. So, in this case BRK1 will not open and the NW generator side is left
unprotected and will be prone to severe damage. So, for FAULT 2 the hardware SEL
351S relay 2 will operate BRK3 in order to protect the NW generator side. FAULT 2 will
be sensed by the software model of relay and hardware SEL 351S relay 2 to operate
BRK2 and BRK3 in a sequential manner with delay of one cycle in order to protect the
NW generator side. Figure 5.21 shows the block diagram to show the tripping signal
generated by software and hardware relays to operate BRK2 and BRK3 with a time delay
between the operation of BRK2 and BRK3.
113
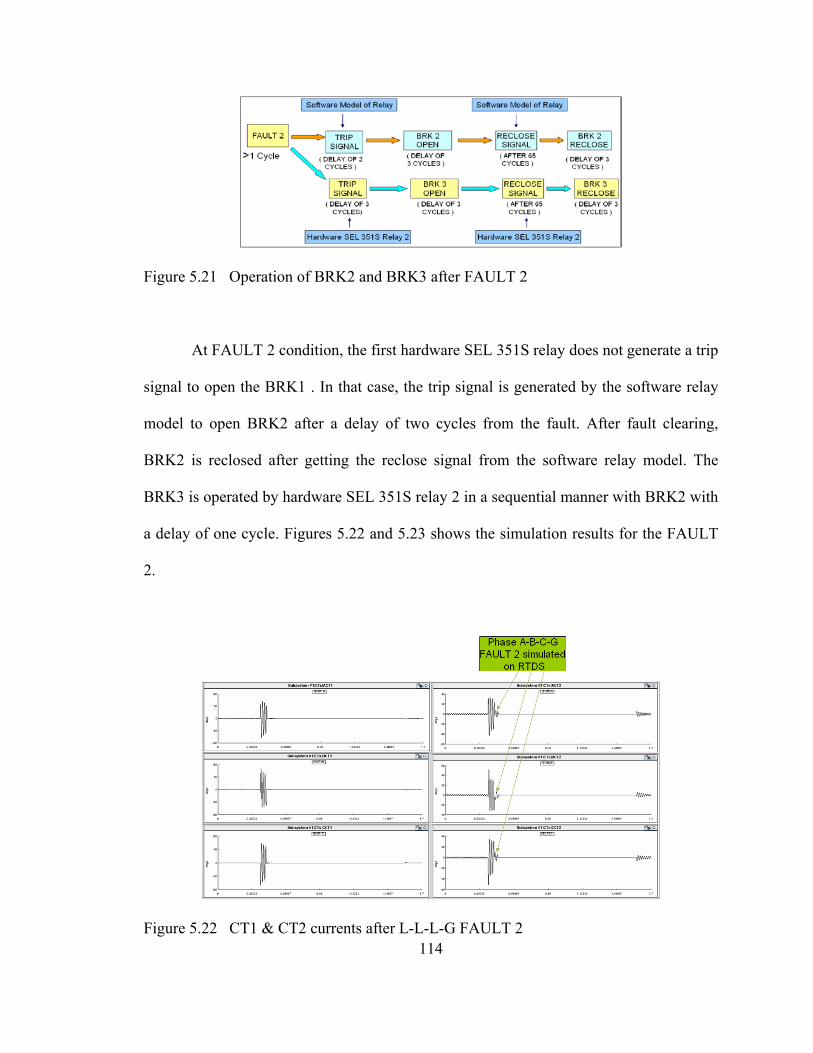
Figure 5.21 Operation of BRK2 and BRK3 after FAULT 2
At FAULT 2 condition, the first hardware SEL 351S relay does not generate a trip
signal to open the BRK1 . In that case, the trip signal is generated by the software relay
model to open BRK2 after a delay of two cycles from the fault. After fault clearing,
BRK2 is reclosed after getting the reclose signal from the software relay model. The
BRK3 is operated by hardware SEL 351S relay 2 in a sequential manner with BRK2 with
a delay of one cycle. Figures 5.22 and 5.23 shows the simulation results for the FAULT
2.
114
Figure 5.22 CT1 & CT2 currents after L-L-L-G FAULT 2

Figure 5.23 BRK2 & BRK3 operation after L-L-L-G FAULT 2
5.6.2 Eight-Bus Power System
The eight-bus power system is modified in order to conduct the hardware relay
coordination test. The specifications of the eight-bus system are same as explained in the
section 2.5.2.2 of Chapter II of this thesis. The main modification in the eight bus system
is that an additional circuit breaker, namely BRK 3, operated by the hardware SEL 351S
overcurrent relay is added. BRK 1 and BRK 2 provide primary protection while BRK 3
provides back up protection to the BRK2 in the system. BRK1 is controlled by software
relay logic while BRK2 and BRK3 are controlled by two SEL 351S overcurrent relays.
Two different types of line to ground faults are applied on bus-8 on the transmission line
2 of the system, namely FAULT 1 and FAULT 2, by using the fault inception logic as
115

explained in section 3.5 of this thesis. Figure 5.24 shows the modified shipboard power
system.
Figure 5.24 Modified eight-bus Power System for Hardware Relay Coordination
The CT ratio of the current transformer 1 (CT1) and current transformer 2 (CT2)
is 300:1. The nominal RMS value of current flowing through CT1 and CT2 at no fault
condition is 2.15A and 4.20A, respectively. The eight-bus system is simulated for 1.7
seconds on the RTDS for different types of line to ground fault. During the no fault
condition, the nominal current flow in to the system and there is no trip signal. The
current sensed by current transformers (CT1 and CT2) are sinusoidal as shown in figure
5.25.
116
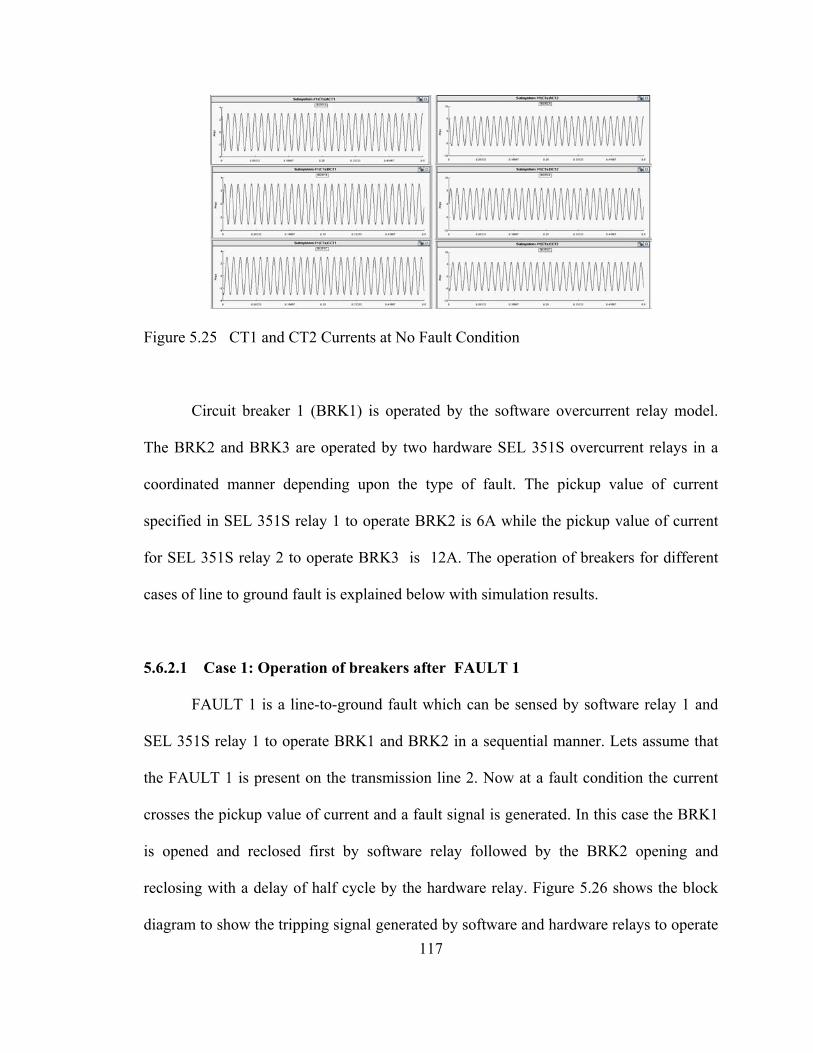
Figure 5.25 CT1 and CT2 Currents at No Fault Condition
Circuit breaker 1 (BRK1) is operated by the software overcurrent relay model.
The BRK2 and BRK3 are operated by two hardware SEL 351S overcurrent relays in a
coordinated manner depending upon the type of fault. The pickup value of current
specified in SEL 351S relay 1 to operate BRK2 is 6A while the pickup value of current
for SEL 351S relay 2 to operate BRK3 is 12A. The operation of breakers for different
cases of line to ground fault is explained below with simulation results.
5.6.2.1 Case 1: Operation of breakers after FAULT 1
FAULT 1 is a line-to-ground fault which can be sensed by software relay 1 and
SEL 351S relay 1 to operate BRK1 and BRK2 in a sequential manner. Lets assume that
the FAULT 1 is present on the transmission line 2. Now at a fault condition the current
crosses the pickup value of current and a fault signal is generated. In this case the BRK1
is opened and reclosed first by software relay followed by the BRK2 opening and
reclosing with a delay of half cycle by the hardware relay. Figure 5.26 shows the block
diagram to show the tripping signal generated by software and hardware relays to operate 117
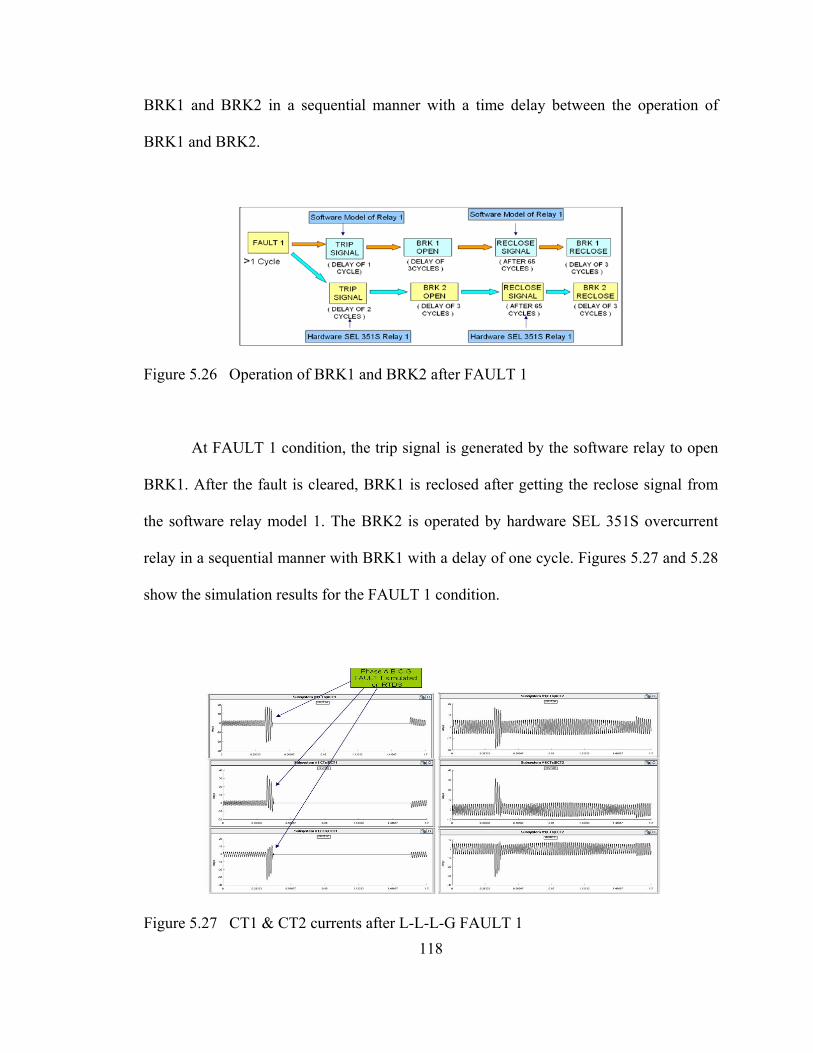
BRK1 and BRK2 in a sequential manner with a time delay between the operation of
BRK1 and BRK2.
Figure 5.26 Operation of BRK1 and BRK2 after FAULT 1
At FAULT 1 condition, the trip signal is generated by the software relay to open
BRK1. After the fault is cleared, BRK1 is reclosed after getting the reclose signal from
the software relay model 1. The BRK2 is operated by hardware SEL 351S overcurrent
relay in a sequential manner with BRK1 with a delay of one cycle. Figures 5.27 and 5.28
show the simulation results for the FAULT 1 condition.
Figure 5.27 CT1 & CT2 currents after L-L-L-G FAULT 1 118

Figure 5.28 BRK1 & BRK2 operation after L-L-L-G FAULT 1
5.6.2.2 Case 2: Operation of breakers after FAULT 2
Here, the FAULT 2 is a line-to-ground fault which cannot be sensed by SEL 351S
hardware relay 1. So, in this case BRK2 will not open, the load side is left unprotected
and will be prone to severe damage. So, for FAULT 2 the SEL 351S relay 2 will operate
BRK3 in order to protect the load side. FAULT 2 will be sensed by software models of
relay and the hardware SEL 351S relay 2 to operate BRK1 and BRK3 in a sequential
manner with delay of one cycle in order to protect the load side. Figure 5.29 shows the
block diagram to show the tripping signal generated by software and hardware relay to
operate BRK1 and BRK3 with a time delay.
119

Figure 5.29 Operation of BRK1 and BRK3 after FAULT 2
At FAULT 2 condition, the trip signal is generated by the software relay to open
BRK1. After the fault is cleared, BRK1 is reclosed after getting the reclose signal from
the software relay. The hardware SEL 351S relay 1 is not able to sense the FAULT 2 and
in order to protect the load side, the BRK3 is operated by second SEL 351S relay in a
sequential manner with BRK1 with a delay of one cycle. Figure 5.30 and 5.31 shows the
simulation results for the FAULT 2.
Figure 5.30 CT1 & CT2 currents after L-L-L-G FAULT 2
120

Figure 5.31 BRK1 & BRK3 operation after L-L-L-G FAULT 2
5.7 Simulation Results for Software Relay Coordination
In the software relay coordination, the hardware relays used in the hardware relay
coordination are replaced by modified software overcurrent relays and the power system
test cases are simulated for the same fault scenarios. Figure 5.32 shows the modified
software overcurrent relay, which is used for conducting the software relay coordination.
The software relay logic is modified and made it operate for different types of line to
ground fault.
121

Figure 5.32 Modified Software Overcurrent Relay Model for Relay Coordination
The simulation results for the software relay coordination on shipboard as well as
on the eight-bus power system are presented in the next sections.
5.7.1 Shipboard Power System
The shipboard power system is modified in order to conduct the software relay
coordination. Figure 5.16 shows the modified shipboard power system which was used to
conduct the software relay coordination. The specifications of the shipboard system are
same as explained in the section 2.5.1 of Chapter II of this thesis. The modification is that
all the circuit breakers i.e., circuit brekaer 1 (BRK1), circuit breaker 2 (BRK2) and circuit
breaker 3 (BRK3) are controlled by three modified software model of overcurrent relay.
BRK 1 and BRK 2 provides the primary protection while BRK 3 provides back up 122

protection to the BRK 1 to protect the NW generator side. Two different types of line to
ground faults (FAULT 1 and FAULT 2) are applied on bus-1 on cable 1 of the shipboard
system.
For the shipboard system, the current transformer 1 (CT1) and current transformer
2 (CT2) have the CT ratio of 300:1 and the normal RMS currents coming out of the CT1
and CT2 are 0.58A and 0.85A at no fault condition. The shipboard power system is
simulated for different fault conditions for 1.7 seconds on RTDS. The instantaneous
currents sensed by current transformers (CT1 and CT2) at no fault condition are shown in
Figure 5.17.
The circuit breakers are operated by modified software model of relays in a
coordinated manner depending upon the type of fault. The pickup value of current
specified in modified software relay model 1 and 2 to operate BRK1 and BRK2 is 1A
while the pickup value of current for modified software relay model 3 to operate BRK3 is
2A. The operation of breakers for different cases of line to ground fault is explained
below with simulation results.
5.7.1.1 Case 1: Operation of breakers after FAULT 1
FAULT1 is a line-to-ground fault which can be sensed by the modified software
model of relay 1 and 2 to operate BRK1 and BRK2 in a sequential manner as explained
in section 4.2.4. Lets assume that the FAULT 1 is present on the cable 1 of the SPS. Now
at a fault condition the current exceeds the pickup value of current and a fault signal is
generated. In this case the BRK1 is opened and reclosed first followed by the BRK2
opening and reclosing with a delay of one cycle. Figure 5.33 shows the block diagram to
123
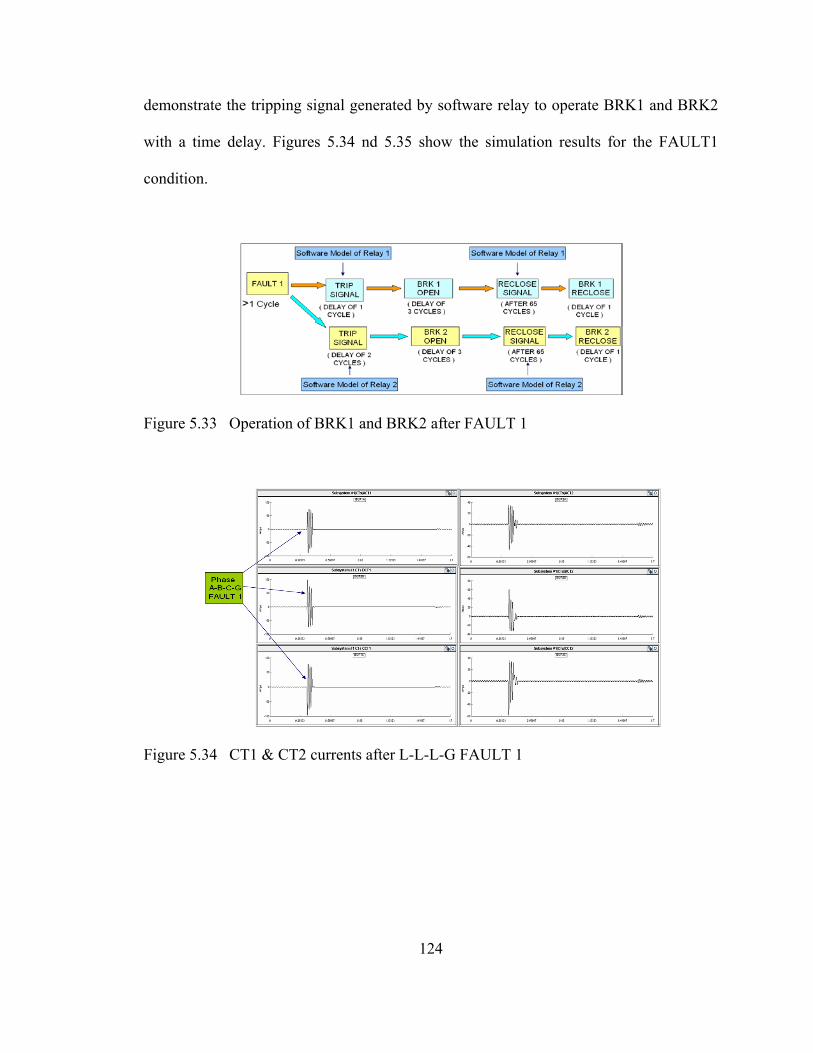
demonstrate the tripping signal generated by software relay to operate BRK1 and BRK2
with a time delay. Figures 5.34 nd 5.35 show the simulation results for the FAULT1
condition.
Figure 5.33 Operation of BRK1 and BRK2 after FAULT 1
Figure 5.34 CT1 & CT2 currents after L-L-L-G FAULT 1
124

Figure 5.35 BRK1 & BRK2 operation after L-L-L-G FAULT 1
5.7.1.2 Case 2: Operation of breakers after FAULT 2
Here, the FAULT 2 is a line-to-ground fault which cannot be sensed by modified
software relay 1 and the BRK1 will not operate which leaves the NW generator side
unprotected. So, for FAULT 2 the modified software model of relay 3 will operate BRK3
in order to protect the NW generator side. FAULT 2 will be sensed by modified software
models of relay 2 and 3 to operate BRK2 and BRK3 in a sequential manner with delay of
few cycles in order to protect the NW generator side. Figure 5.36 shows the block
diagram to show the tripping signal generated by software relay, and the BRK2 and
BRK3 opening and reclosing sequence with a time delay between the operation of BRK2
and BRK3.
125

Figure 5.36 Operation of BRK2 and BRK3 after FAULT 2
At FAULT 2 condition, the software relay model 1 does not generate a trip signal
to open the BRK1. In that case, the trip signal is generated by relay model 2 to open
BRK2 after a delay of two cycles from the fault. After fault clearing, BRK2 is reclosed
after getting the reclose signal from the software relay model 2. The BRK3 is operated in
a sequential manner with BRK2 with a delay of one cycle. Figure 5.37 and 5.38 shows
the simulation results for the FAULT 2.
Figure 5.37 CT1 & CT2 currents after L-L-L-G FAULT 2
126

Figure 5.38 BRK2 & BRK3 operation after L-L-L-G FAULT 2
5.7.2 Eight-Bus Power System
The modified eight-bus power system shown in Figure 5.22 is used to conduct the
software relay coordination test. The specifications of the eight-bus system are same as
explained in the section 2.5.2.2 of Chapter II of this thesis. The main modification in the
eight bus system is that all the circuit brekers (BRK1, BRK2, BRK3) are controlled by
software relay models. BRK 1 and BRK 2 act as the primary protection while BRK 3
provides back up protection to the BRK2 to protect the load side. Two different types of
line to ground faults are applied on bus-8 on the transmission line 2 of the system,
namely FAULT 1 and FAULT 2, by using the fault inception logic as explained in
Chapter III of this thesis.
127

The CT ratio of the current transformer 1 (CT1) and current transformer 2 (CT2)
is 300:1. The nominal value of current flowing through CT1 and CT2 at no fault
condition is 2.15A and 4.20A, respectively. The eight-bus system is simulated for 1.7
seconds on the RTDS for different types of line to ground faults. During no fault
condition, the nominal current flow into the system and there is no trip signal. The
current sensed by current transformers are sinusoidal as shown in Figure 5.25.
The pickup value of current specified in modified software relay model 1 and 2 to
operate BRK1 and BRK2 is 6A, while the pickup value of current for modified software
relay model 3 to operate BRK3 is 12A. The operation of breakers for different cases of
line to ground faults is explained below with simulation results.
5.7.2.1 Case 1: Operation of breakers after FAULT 1
FAULT 1 is a line-to-ground fault which can be sensed by modified software
model of relay 1 and 2 to operate BRK1 and BRK2 in a sequential manner as explained
in section 4.2.4. Lets assume that the FAULT 1 is present on the transmission line 2 of
the eight-bus system. Now at a fault condition the current crosses the pickup value of
current and a fault signal is generated. In this case the BRK1 is opened and reclosed first
followed by the BRK2 opening and reclosing with a delay of one cycle. Figure 5.39
shows the block diagram to show the tripping signal generated by software relays to
operate BRK1 and BRK2 in a sequential manner with a time delay.
128

Figure 5.39 Operation of BRK1 and BRK2 after FAULT 1
At FAULT 1 condition, the trip signal is generated by relay model 1 to open
BRK1. After fault clearing, BRK1 is reclosed after getting the reclose signal from the
software relay model 1. The BRK2 is operated in a sequential manner with BRK1 with a
delay of one cycle. Figures 5.40 and 5.41 show the simulation results for the FAULT 1.
Figure 5.40 CT1 & CT2 currents after L-L-L-G FAULT 1
129
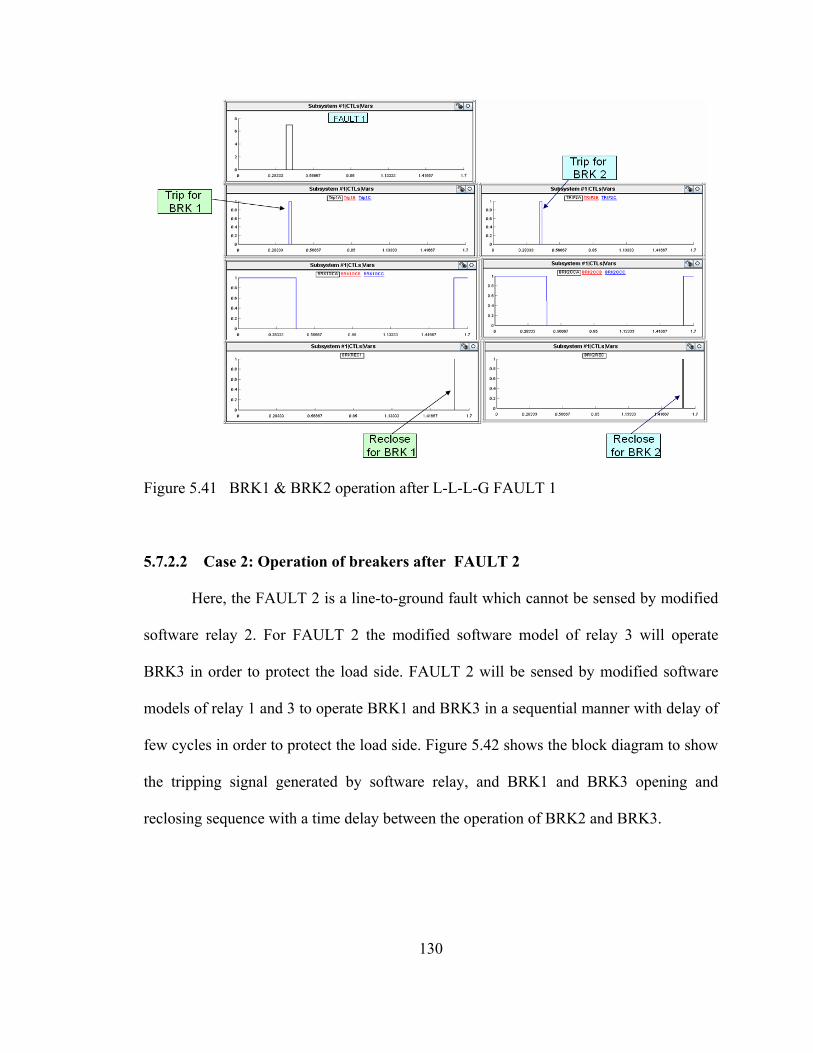
Figure 5.41 BRK1 & BRK2 operation after L-L-L-G FAULT 1
5.7.2.2 Case 2: Operation of breakers after FAULT 2
Here, the FAULT 2 is a line-to-ground fault which cannot be sensed by modified
software relay 2. For FAULT 2 the modified software model of relay 3 will operate
BRK3 in order to protect the load side. FAULT 2 will be sensed by modified software
models of relay 1 and 3 to operate BRK1 and BRK3 in a sequential manner with delay of
few cycles in order to protect the load side. Figure 5.42 shows the block diagram to show
the tripping signal generated by software relay, and BRK1 and BRK3 opening and
reclosing sequence with a time delay between the operation of BRK2 and BRK3.
130
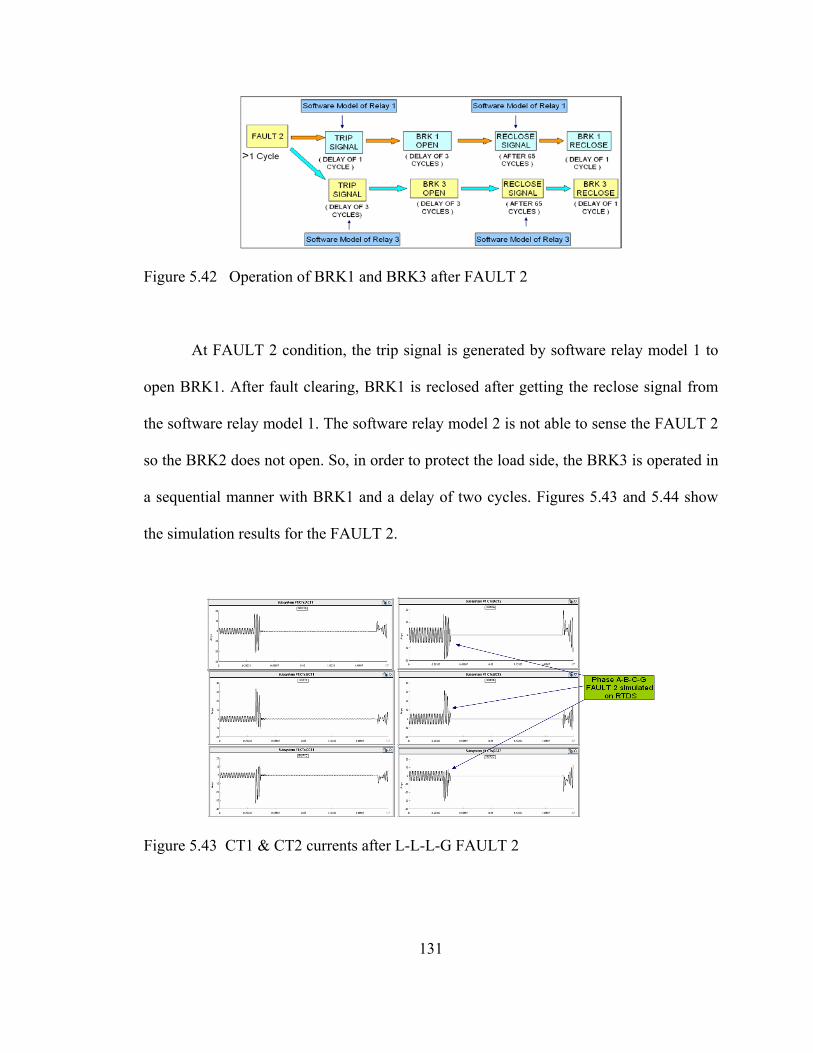
Figure 5.42 Operation of BRK1 and BRK3 after FAULT 2
At FAULT 2 condition, the trip signal is generated by software relay model 1 to
open BRK1. After fault clearing, BRK1 is reclosed after getting the reclose signal from
the software relay model 1. The software relay model 2 is not able to sense the FAULT 2
so the BRK2 does not open. So, in order to protect the load side, the BRK3 is operated in
a sequential manner with BRK1 and a delay of two cycles. Figures 5.43 and 5.44 show
the simulation results for the FAULT 2.
Figure 5.43 CT1 & CT2 currents after L-L-L-G FAULT 2
131
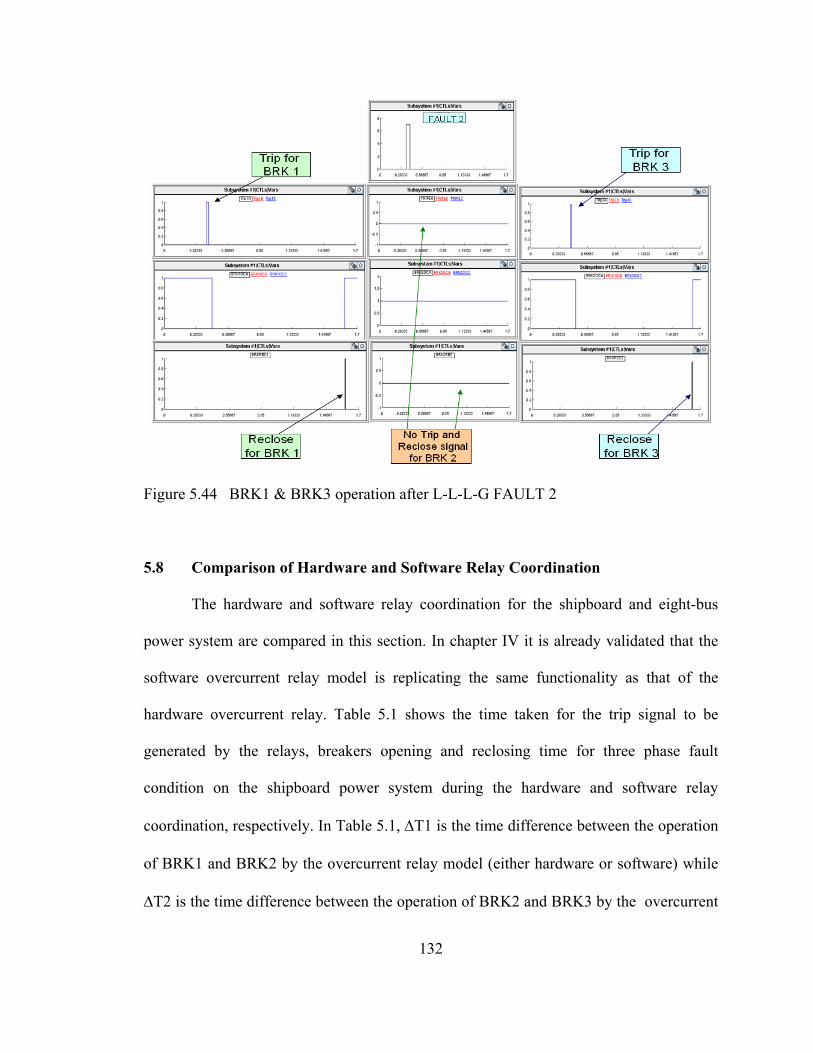
Figure 5.44 BRK1 & BRK3 operation after L-L-L-G FAULT 2
5.8 Comparison of Hardware and Software Relay Coordination
The hardware and software relay coordination for the shipboard and eight-bus
power system are compared in this section. In chapter IV it is already validated that the
software overcurrent relay model is replicating the same functionality as that of the
hardware overcurrent relay. Table 5.1 shows the time taken for the trip signal to be
generated by the relays, breakers opening and reclosing time for three phase fault
condition on the shipboard power system during the hardware and software relay
coordination, respectively. In Table 5.1, ∆T1 is the time difference between the operation
of BRK1 and BRK2 by the overcurrent relay model (either hardware or software) while
∆T2 is the time difference between the operation of BRK2 and BRK3 by the overcurrent
132
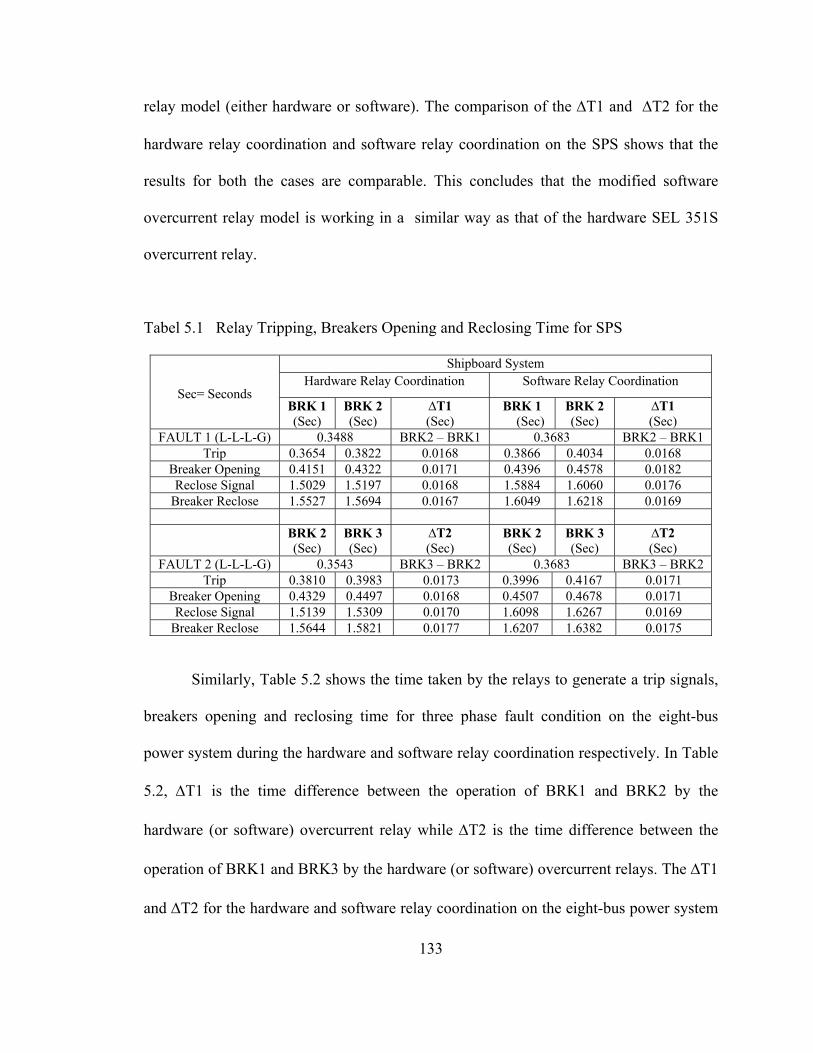
relay model (either hardware or software). The comparison of the ∆T1 and ∆T2 for the
hardware relay coordination and software relay coordination on the SPS shows that the
results for both the cases are comparable. This concludes that the modified software
overcurrent relay model is working in a similar way as that of the hardware SEL 351S
overcurrent relay.
Tabel 5.1 Relay Tripping, Breakers Opening and Reclosing Time for SPS
Shipboard System Hardware Relay Coordination Software Relay Coordination
Sec= Seconds BRK 1 (Sec)
BRK 2 (Sec)
∆T1 (Sec)
BRK 1 (Sec)
BRK 2 (Sec)
∆T1 (Sec)
FAULT 1 (L-L-L-G) 0.3488 BRK2 – BRK1 0.3683 BRK2 – BRK1 Trip 0.3654 0.3822 0.0168 0.3866 0.4034 0.0168
Breaker Opening 0.4151 0.4322 0.0171 0.4396 0.4578 0.0182 Reclose Signal 1.5029 1.5197 0.0168 1.5884 1.6060 0.0176
Breaker Reclose 1.5527 1.5694 0.0167 1.6049 1.6218 0.0169 BRK 2
(Sec) BRK 3 (Sec)
∆T2 (Sec)
BRK 2 (Sec)
BRK 3 (Sec)
∆T2 (Sec)
FAULT 2 (L-L-L-G) 0.3543 BRK3 – BRK2 0.3683 BRK3 – BRK2 Trip 0.3810 0.3983 0.0173 0.3996 0.4167 0.0171
Breaker Opening 0.4329 0.4497 0.0168 0.4507 0.4678 0.0171 Reclose Signal 1.5139 1.5309 0.0170 1.6098 1.6267 0.0169
Breaker Reclose 1.5644 1.5821 0.0177 1.6207 1.6382 0.0175
Similarly, Table 5.2 shows the time taken by the relays to generate a trip signals,
breakers opening and reclosing time for three phase fault condition on the eight-bus
power system during the hardware and software relay coordination respectively. In Table
5.2, ∆T1 is the time difference between the operation of BRK1 and BRK2 by the
hardware (or software) overcurrent relay while ∆T2 is the time difference between the
operation of BRK1 and BRK3 by the hardware (or software) overcurrent relays. The ∆T1
and ∆T2 for the hardware and software relay coordination on the eight-bus power system
133

are compared which shows that the modified software overcurrent relay model is
repliacting the same functionality as that of the hardware SEL 351S overcurrent relay.
Tabel 5.2 Relay Tripping, Breakers Opening and Reclosing Time for Eight-bus System
Eight Bus System Hardware Relay Coordination Software Relay Coordination
Sec= Second BRK 1 (Sec)
BRK 2 (Sec)
∆T1 (Sec)
BRK 1 (Sec)
BRK 2 (Sec)
∆T1 (Sec)
FAULT 1 (L-L-L-G) 0.3547 BRK2 – BRK1 0.3478 BRK2 – BRK1 Trip 0.3701 0.38680 0.0167 0.3641 0.3808 0.0167
Breaker Opening 0.4213 0.4384 0.0171 0.4202 0.4371 0.0169 Reclose Signal 1.4931 1.5098 0.0167 1.5724 1.5893 0.0169
Breaker Reclose 1.5425 1.5594 0.0169 1.5909 1.6070 0.0170 BRK 1
(Sec) BRK 3 (Sec)
∆T2 (Sec)
BRK 1 (Sec)
BRK 3 (Sec)
∆T2 (Sec)
FAULT 2 (L-L-L-G) 0.3498 BRK3 – BRK1 0.3587 BRK3 – BRK1 Trip 0.3609 0.3948 0.0339 0.3772 0.4116 0.0338
Breaker Opening 0.4136 0.4459 0.0321 0.4311 0.4644 0.0333 Reclose Signal 1.4921 1.5250 0.0329 1.5858 1.6189 0.0331
Breaker Reclose 1.5549 1.5885 0.0336 1.6008 1.6330 0.0322
The results of the hardware and software relay coordination conducted on
shipboard and eight-bus power system are compared and it shows that the software relays
are giving almost the same results as given by the hardware SEL 351S overcurrent relays.
5.9 Summary
This chapter describes the procedure to connect two hardware SEL 351S
overcurrent relays to the RTDS. The software overcurrent relay model was modified by
adding the RMS calculator block instead of analog signal sampler to calculate the RMS
current from the burden current coming out of the current transformer. The shipboard and
eight-bus power systems were used as test cases to conduct the multiple relay and relay
134

coordination tests. The simulation results for the eight-bus and shipboard system are
presented for different fault scenarios having multiple hardware (or software) relays and
for hardware (or software) relay coordination. The hardware and software relay
coordination simulation results and timing performance were compared and a conclusion
was made that the modified software overcurrent relay model performs satisfactorily for
the relay coordination.
135

CHAPTER VI
CONCLUSIONS AND FUTURE WORK
6.1 Conclusions
Power system protection is still one of the primary focus of the utility companies.
Real time simulation is an effective and efficient way to test the equipment for severe
conditions and helps to take the corrective measures before installing them to the main
power system. Real time digital simulator (RTDS) is a hardware power system
simulation tool which helps to run the power system models designed in RSCAD
software in real time. RTDS helps to conduct the test like hardware in the loop (HIL),
software in the loop (SIL), multiple relay operation and coordination of relay testing. HIL
testing is a widely used technique in which a hardware device like relay or motor etc are
connected in a closed loop with the power system model. The SIL test is similar to HIL
test but the basic difference is that a hardware device used in the HIL test is replaced by a
software prototype of the hardware device and connected in close loop with the power
system model for different fault scenarios. In multiple relay operation and relay
coordination tests, multiple numbers of hardware devices (or software prototype of the
hardware device) are connected to the power system model and simulated for different
fault scenarios in order to observe the system and equipment behavior.
136

The shipboard and terrestrial power systems are used as test case power system in
this thesis work. RSCAD software is used for the development of power system models,
overcurrent relay model and control logics. The software overcurrrent relay model is
developed in RSCAD software and then tested in real time for the shipboard and
terrestrial power system.
6.2 Contributions
The main contributions of thesis work are summarized as:
A hardware interface was developed to conduct the hardware-in-the-loop (HIL)
test on the shipboard power system (SPS) and terrestrial power system (TPS)
models developed in RSCAD software for different fault conditions using SEL
351S overcurrent relay (or GE D60 distance relay) and Real Time Digital
Simulator (RTDS).
Different control logics like fault inception logic, circuit breaker control logic,
and sampling logic were developed in RSCAD to conduct the HIL test.
The HIL simulation results provide an outline to design the software overcurrent
relay model in RSCAD software suite in order to replicate the functionality of the
hardware SEL 351S overcurrent relay.
After developing the software prototype of the hardware overcurrent relay, the
real time software in the loop (SIL) test was conducted on the SPS and TPS for
different fault conditions.
The results of the HIL and SIL test were compared to validate the software
overcurrent relay model.
137
The developed hardware interface setup was modified in order to interface two
hardware SEL 351S overcurrent relays with the RTDS to conduct multiple relay
operation and relay coordination simulation on the modified SPS and eight-bus
system.
The developed software overcurrent relay model was modified to add more
functionality into it to conduct multiple software relay operation and software
relay coordination on the SPS and eight-bus power.
Differential relay model was also developed in LabVIEW software and tested
successfully for different fault conditions.
6.3 Future Work
• The hardware interface setup developed during the thesis work can be utilized for
conducting different tests like differential relay, overcurrent relay or distance
relay on the small as well as on the large power systems.
• The developed software overcurrent relay model can be further modified to add
more functionality to develop the software model of distance relay.
• The developed software overcurrent and differential [11] relay model can be
utilized to perform the software relay coordination on the small as well as on the
large power system.
• The developed LabVIEW differential relay model can be tested in real time for
different fault conditions.
138
• Other power system applications tool such as stability index, reconfiguration
algorithm can be implemented in hardware/software in the loop using developed
framework.
139
REFERENCES
[1] X. Yang and Y. Zhang, “Study of Shipboard Power System Intelligent Network Reconfiguration”, Sixth International Conference on Intelligent Systems Design and Applications, 2006, ISDA '06, Vol.1, pp 1055-1060. [2] K. R. Padamati, “Reconfiguration of shipboard power systems using a genetic algorithm”, Masters Thesis, Department of Electrical and Computer Engineering, Mississippi State University, Mississippi State, 2007. [3] Y. Gong, Y. Huang and N. N. Schulz, “Integrated protection system design for shipboard power system”, IEEE proceedings on Electric Ship Technologies
Symposium, 2005 IEEE, pp 237- 243. [4] Applied Dynamics International http://www.adi.com/products_sim_qhil.htm [5] Sunil Palla, Anurag K Srivastava, and Noel N. Schulz, “Hardware in the loop test for relay model Validation”, Proceedings of the IEEE ESTS, Arlington, VA, June 2007. [6] Chenfeng Zhang, Vamsi Vijapurapu, Anurag K Srivastava, Jimena Bastos, Noel N Schulz, and Rudi Wierckx, “Hardware In the Loop Test of an Impedance Relay using RTDS”, Proceedings of the Summer Computer Simulation Conference, San Diego, CA, July 2007. [7] RTDS Technologies, “Real-Time Digital Simulator (RTDS) User’s Manual Set, available online at http://www.rtds.com. [8] B.S.Rigby, “Closed-Loop Testing of an Overcurrent Relay Using a Real-Time Digital Simulator” 7th AFRICON Conference in Africa, AFRICON 2004 Volume 2, Page(s): 783 – 788. [9] Sunil Kumar Palla, “Development of Overcurrent Relay Model and Power System Simulator Using National Instruments Devices in Real-Time”, M.S thesis, Dept of Electrical and Computer Engineering, Mississippi State University, Mississippi, 2008.
140

[10] Yujie Zhang, “Model-Based Design of a Protection Scheme For Shipboaard Power Systems”, M.S thesis, Dept of Electrical and Computer Engineering, Mississippi State University, Mississippi, 2008. [11] Vamsi Krishna Vijapurapu, “Differential Relay Model Development and Validation Using Real-Time Digital Simulator”, M.S thesis, Dept of Electrical and Computer Engineering, Mississippi State University, Mississippi, 2008. [12] D.S. Ouellette, W.J. Geisbrecht, R.P. Wierckx and P.A. Forsyth, “Modeling an impedance relay using a real time digital simulator” Eighth IEEE International Conference on Developments in Power System Protection, 2004 Volume 2, 5-8 April 2004 Page(s): 665 - 668 Vol.2. [13] V. C. Prasad, K. S. Prakash Rao and A. Subba Rao “Coordination Of Directional Relays Without Generating All Circuits”, IEEE Power Engineering Review, vol.11, issue 4, Apr 1991, pp. 584-590. [14] Douglas A. Jackson “Tools and techniques for area relay coordination studies”, 57th Annual Conference on Protective Relay Engineers, 30 Mar-1 Apr 2004, pp. 220 – 246. [15] Timo Keil and Johann Jäger, “Advanced Coordination Method for Overcurrent Protection Relays Using Nonstandard Tripping Characteristics”, IEEE Transaction Power Delivery, Jan. 2008, pp. 52-57. [16] H. Zeineldin, E. F. El-Saadany and M. A. Salama, “Optimal Coordination of Directional Overcurrent Relay Coordination”, proceedings of IEEE Power Engineering Society General Meeting, 12-16 June 2005, pp. 1101–1106. [17] V. V. Bapeswara Rao and K. Sankara Rao, “Computer aided coordination of directional relays: determination of break points “, IEEE transactions on power delivery, 1988, vol. 3, no. 2, pp. 545-548. [18] Farzad Razavi, Hossein Askarian Abyaneh, Majid Al-Dabbagh, Reza Mohammadi and Hossein Torkaman, “A new comprehensive genetic algorithm method for optimal overcurrent relays coordination”, Electric Power Systems Research, Volume 78, Issue 4, April 2008, Pages 713-720. [19] C. W. So and K. K. Li, “Time coordination method for power system protection by evolutionary algorithm”, IEEE Transactions on Industry Applications, Sep/Oct 2000, Vol.: 36, Issue: 5, pp.: 1235-1240. [20] M. Kezunovic, “Intelligent systems in protection engineering”, Proceedings of International Conference on Power System Technology, 12/04/2000 – 12/07/2000, Volume: 2, pp. : 801-806.
141

[21] Sunil Palla, Anurag K Srivastava and Noel N. Schulz, “Hardware in the Loop Test for Relay Model Validation”, Proceedings of IEEE Electric Ship Technologies Symposium (ESTS), May 21-23, 2007, Arlington, Virginia, USA. [22] Jian Wu, Yong Cheng, Anurag K. Srivastava, Noel N. Schulz and Herbert L. Ginn III, “Hardware in the loop test for power system modeling and simulation”, PSCE 2006, Oct. 29-Nov. 1, Atlanta, Georgia, USA. [23] Ankush Saran, Pamavathy Kankanala, Anurag K. Srivastava and Noel N. Schulz, “Designing and Testing Protective Overcurrent Relay using Real Time Digital Simulation”, Grand Challenges in Modeling & Simulation, Edinburgh, Scotland, June16th-19th, 08. [24] J. Lewid Blackburn, Protective Relaying: Principle and Application, Second Edition, 1997, Bothell, Washington. [25] http://sv61dm9.rrc.mb.ca/janaj/oc_protection.htm [26] SEL relay Instructional Manual, Available on website: http://www.selinc.com. [27] Ankush Saran, Chengfeng Zhang, Anurag K.Srivastava and Noel N.Schulz, “Hardware in the Loop Simulation Using Overcurrent Relay and RTDS” at IEEE- PES Transmission & Distribution Conference and Exposition, Illinois, Chicago, 21st-23rd April, 08. [28] Y. Huang, “Fast Reconfiguration Algorithm Development for Shipboard Power Sytems,” Masters Thesis, Department of Electrical and Computer Engineering, Mississippi State University, Mississippi State, 2005. [29] M. Kezunovic and M. McKenna, “Real-time digital simulator for protective relay testing”, IEEE Computer Applications in Power, Vol. 7, Issue 3, July 1994, pp. 30- 35. [30] J. Wu and N. N. Schulz, “Experimental Design for Remote Hardware-In-The-Loop testing”, Proceedings of ASNE Reconfiguration and Survivability Symposium, Jacksonville, Florida, Feb. 2005. [31] W. Ren and M. Steurer, “Progress and challenges in Real Time Hardware-in-the- Loop simulation of Integrated Ship Power System”, Proceeding of IEEE power Engineering Society General Meeting, 12-16 June, 2005, pp. 534-537. [32] Ankush Saran, Anurag K. Srivastava and Noel N. Schulz “Modeling and Simulation of Shipboard Power System Protection Schemes using Coordination of Overcurrent Relay”, IEEE Electric Ship Technologies Symposium, 2009, Baltimore, Maryland, April 20th,-April 22nd, 09.
142

[33] GE relay instruction manuals available on website: http://www.gedigitalenergy.com. [34] LabVIEW instruction manual available on website: http://www.ni.com/labview/ [35] http://sv61dm9.rrc.mb.ca/janaj/differential_protection.htm [36] Daxa Patel, “Modeling and Testing of an Overcurrent relay using VTB and VTB- RT”, M.S thesis, Dept of Electrical and Computer Engineering, Mississippi State University, Mississippi, 2006. [37] Edmund. O. Schweitzer III, and Daqing Hou, “Filtering For Protective Relays”,
Proceedings of the 47th
Annual Georgia Tech Protective Relay Conference, Atlanta, Georgia, April 28-30, 1993. [38] Sunil Palla, Ankush Saran, Anurag K. Srivastava and Noel N. Schulz “Real Time Power System Simulation using RTDS and NI PXI”, North American Power Symposium (NAPS) 2008, Calgary, Canada, September 28th -Oct 1st, 08. [39] Karen L. Butler-Purry, Gayatri R. Damle, N.D.R. Sarma, Fabian Uriarte and Derek Grant “Test Bed for Studying Real-Time Simulation and Control for Shipboard Power Systems”, IEEE Electric Ship Technologies Symposium, May 2007 Page(s): 434 - 437. [40] Jeffrey Travis “LabVIEW for Everyone”, Second Edition, 2002 Prentice Hall PTR, Prentice-Hall, Inc. [41] S. Ayasun, S. Vallieu, R. Fischl and T. Chmielewski, “Simulation-Stimulation Interface for Hardware in-the-Loop Studies,” Proceedings of the MED POWER, Athens, Greece, November 2003. [42] Yujie Zhang, Jimena Bastos, Noel N. Schulz and Daxa Patel, “Modeling and Testing of Protection Devices for SPS using MATLAB/Simulink and VTB,” Proceedings of the IEEE Electric Ship Technologies Symposium, Arlington, VA, June 2007 [43] Yujie Zhang and Jimena L. Bastos and Noel N. Schulz, “Model-based Design of a Protection Scheme for Shipboard Power Systems”, PES general meeting, Pittsburgh, PA July 2008. [44] Oluwaseun Adeyemi Amoda “Development of an Adaptive Protection Scheme for Shipboard Power Systems”, M.S Thesis, Department of Electrical and Computer Engineering, Aug-2007.
143
[45] Introduction to LabVIEW course- Six Hours http://www.csee.umbc.edu/~plusquel/415/labview/LV_Intro_Six_Hours.pdf
[46] http://sv61dm9.rrc.mb.ca/janaj/impedance_protection.htm
[47] Ankush Saran, Anurag K. Srivastava and Noel N. Schulz, “Modeling and Simulation of Shipboard Power System Protection Schemes”, Electric Ship Research and Development Consortium (ESRDC) Industry Workshop 2009, Starkville, Mississippi, 26th-29th May 09. [48] Elmore A. Walter, Protective Relaying Theory and Applications: Theory and Applications , Second Edition, CRC Press, 2003. [49] P. J. Mccleer and M. Mir, “A New Techniques of Differential Relaying the Differential Relay”, IEEE Transactions on Power Apparatus and Systems, Oct 1982, Volume PAS-101, issue 10, pp 4164-4170.
[50] J. Duncan Glover and Mulukutla S. Sarma, Power System Analysis and Design, Third Edition, 2002, Wadsworth Group, Thompson Learning, Inc.
144