Antisolvent crystallization: Model identification, experimental validation and dynamic simulation
11
Chemical Engineering Science 63 (2008) 5457--5467 Contents lists available at ScienceDirect Chemical Engineering Science journal homepage: www.elsevier.com/locate/ces Antisolvent crystallization: Model identification, experimental validation and dynamic simulation S. Mostafa Nowee a , Ali Abbas a, ∗ , Jose A. Romagnoli b a School of Chemical and Biomolecular Engineering, University of Sydney, Australia b Department of Chemical Engineering, Louisiana State University, USA ARTICLE INFO ABSTRACT Article history: Received 31 July 2008 Accepted 1 August 2008 Available online 7 August 2008 Keywords: Antisolvent crystallization Population balance Kinetics Parameter identification Particle size Pharmaceuticals This paper is concerned with the development, simulation and experimental validation of a detailed antisolvent crystallization model. A population balance approach is adopted to describe the dynamic change of particle size in crystallization processes under the effect of antisolvent addition. Maximum likelihood method is used to identify the nucleation and growth kinetic models using data derived from controlled experiments. The model is then validated experimentally under a new solvent feedrate profile and showed to be in good agreement. The resulting model is directly exploited to understand antisol- vent crystallization behavior under varying antisolvent feeding profiles. More significantly, the model is proposed for the subsequent step of model-based optimization to readily develop optimal antisolvent feeding recipes attractive for pharmaceutical and chemicals crystallization operations. © 2008 Elsevier Ltd. All rights reserved. 1. Introduction Crystallization is a widely used technique in solid–liquid separa- tion processes. The driving force in crystal formation is supersatura- tion. The trend of supersaturation generation during the process has a direct and significant role on crystal characteristics such as size, mor- phology, and purity. Keeping the supersaturation constant during a crystallization operation has been a long-standing technique for ar- guably optimal operation (Jones and Mullin, 1974; Mullin and Nyvlt, 1971). Cooling and solvent evaporation are two ways of achieving supersaturation control. In the last decade, salting-out as a means to induce supersaturation has been drawing more attention. In this method, a secondary solvent known as antisolvent or precipitant is added to the solution resulting in the reduction of the solubility of the solute in the original solvent and consequently generating a su- persaturation driving force. The rate of supersaturation generation in antisolvent crystallization is highly dependent on the antisolvent addition rate. Antisolvent crystallization is an advantageous method where the substance to be crystallized (solute) is highly soluble, has solubility that is a weak function of temperature, is heat sensitive, or unstable in high temperatures (Doki et al., 2002). This technique is an energy-saving alternative to evaporative crystallization, if the antisolvent can be separated at low (energy) costs. Disadvantages of antisolvent crystallization include its high-dependence on mixing, * Corresponding author. Fax: +61 2 9351 2854. E-mail address: [email protected] (A. Abbas). 0009-2509/$ - see front matter © 2008 Elsevier Ltd. All rights reserved. doi:10.1016/j.ces.2008.08.003 for instance, where poor mixing regimes exist, high local supersatu- ration at antisolvent induction zones exists leading to excess primary nucleation consequently resulting in fine crystal particle formation that easily tend to agglomerate (Takiyama et al., 1998). The strive to understand antisolvent crystallization phenom- ena and to develop systematic operational policies towards crystal size control have been the interest of many recent and overly ex- perimental investigations. Studies looking at the effect of various operating conditions are numerous. The process of the salting-out precipitation of cocarboxylase hydrochloride from its aqueous solu- tion by addition of acetone was studied by Budz et al. (1986). They found that the crystallization may be remarkably improved after careful selection of operating parameters viz. seeding, agitation and acetone dosage rate. Takiyama et al. (1998) investigated the effect of different concentrations of aqueous and antisolvent solutions on crystal shape and distribution. The main variable they studied was supersaturation. They proposed a mechanistic formulation in finding the relation between nucleation and supersaturation. Other works considered antisolvent concentration and feed rate effects on final crystal habit (Doki et al., 2002; Holmback and Rasmuson, 1999; Kaneko et al., 2002; Kim et al., 2003; Kitamura and Nakamura, 2002; Kitamura and Sugimoto, 2003; Oosterhof et al., 1999a; Taboada et al., 2000; Yu et al., 2005). A study of the salting-out precipitation process was made to obtain fine particle size by varying initial su- persaturation (Toth et al., 2005). It was shown that the process was heavily dependent on initial supersaturation and it was possible to produce particles with mean sizes that varied within a wide range. The effect of seeding at constant supersaturation was investigated
-
Upload
independent -
Category
Documents
-
view
0 -
download
0
Transcript of Antisolvent crystallization: Model identification, experimental validation and dynamic simulation
Chemical Engineering Science 63 (2008) 5457 -- 5467
Contents lists available at ScienceDirect
Chemical Engineering Science
journal homepage: www.e lsev ier .com/ locate /ces
Antisolventcrystallization:Model identification,experimentalvalidationanddynamicsimulation
S. Mostafa Noweea, Ali Abbasa,∗, Jose A. RomagnolibaSchool of Chemical and Biomolecular Engineering, University of Sydney, AustraliabDepartment of Chemical Engineering, Louisiana State University, USA
A R T I C L E I N F O A B S T R A C T
Article history:Received 31 July 2008Accepted 1 August 2008Available online 7 August 2008
Keywords:Antisolvent crystallizationPopulation balanceKineticsParameter identificationParticle sizePharmaceuticals
This paper is concerned with the development, simulation and experimental validation of a detailedantisolvent crystallization model. A population balance approach is adopted to describe the dynamicchange of particle size in crystallization processes under the effect of antisolvent addition. Maximumlikelihood method is used to identify the nucleation and growth kinetic models using data derived fromcontrolled experiments. The model is then validated experimentally under a new solvent feedrate profileand showed to be in good agreement. The resulting model is directly exploited to understand antisol-vent crystallization behavior under varying antisolvent feeding profiles. More significantly, the model isproposed for the subsequent step of model-based optimization to readily develop optimal antisolventfeeding recipes attractive for pharmaceutical and chemicals crystallization operations.
© 2008 Elsevier Ltd. All rights reserved.
1. Introduction
Crystallization is a widely used technique in solid–liquid separa-tion processes. The driving force in crystal formation is supersatura-tion. The trend of supersaturation generation during the process has adirect and significant role on crystal characteristics such as size, mor-phology, and purity. Keeping the supersaturation constant during acrystallization operation has been a long-standing technique for ar-guably optimal operation (Jones and Mullin, 1974; Mullin and Nyvlt,1971). Cooling and solvent evaporation are two ways of achievingsupersaturation control. In the last decade, salting-out as a meansto induce supersaturation has been drawing more attention. In thismethod, a secondary solvent known as antisolvent or precipitant isadded to the solution resulting in the reduction of the solubility ofthe solute in the original solvent and consequently generating a su-persaturation driving force. The rate of supersaturation generationin antisolvent crystallization is highly dependent on the antisolventaddition rate. Antisolvent crystallization is an advantageous methodwhere the substance to be crystallized (solute) is highly soluble, hassolubility that is a weak function of temperature, is heat sensitive,or unstable in high temperatures (Doki et al., 2002). This techniqueis an energy-saving alternative to evaporative crystallization, if theantisolvent can be separated at low (energy) costs. Disadvantages ofantisolvent crystallization include its high-dependence on mixing,
* Corresponding author. Fax: +61293512854.E-mail address: [email protected] (A. Abbas).
0009-2509/$ - see front matter © 2008 Elsevier Ltd. All rights reserved.doi:10.1016/j.ces.2008.08.003
for instance, where poor mixing regimes exist, high local supersatu-ration at antisolvent induction zones exists leading to excess primarynucleation consequently resulting in fine crystal particle formationthat easily tend to agglomerate (Takiyama et al., 1998).
The strive to understand antisolvent crystallization phenom-ena and to develop systematic operational policies towards crystalsize control have been the interest of many recent and overly ex-perimental investigations. Studies looking at the effect of variousoperating conditions are numerous. The process of the salting-outprecipitation of cocarboxylase hydrochloride from its aqueous solu-tion by addition of acetone was studied by Budz et al. (1986). Theyfound that the crystallization may be remarkably improved aftercareful selection of operating parameters viz. seeding, agitation andacetone dosage rate. Takiyama et al. (1998) investigated the effectof different concentrations of aqueous and antisolvent solutionson crystal shape and distribution. The main variable they studiedwas supersaturation. They proposed a mechanistic formulation infinding the relation between nucleation and supersaturation. Otherworks considered antisolvent concentration and feed rate effects onfinal crystal habit (Doki et al., 2002; Holmback and Rasmuson, 1999;Kaneko et al., 2002; Kim et al., 2003; Kitamura and Nakamura, 2002;Kitamura and Sugimoto, 2003; Oosterhof et al., 1999a; Taboada etal., 2000; Yu et al., 2005). A study of the salting-out precipitationprocess was made to obtain fine particle size by varying initial su-persaturation (Toth et al., 2005). It was shown that the process washeavily dependent on initial supersaturation and it was possible toproduce particles with mean sizes that varied within a wide range.The effect of seeding at constant supersaturation was investigated
5458 S. Mostafa Nowee et al. / Chemical Engineering Science 63 (2008) 5457 -- 5467
in antisolvent crystallization of paracetamol from a water–acetonemixture (Yu et al., 2006).
Since these kinds of systems are complex due to three (orsometimes more) components interacting with each other in twophases, some thermodynamic and mass transfer studies are essen-tial. Ho-Gutierrez et al. (1994) plotted solubility and phase diagramsfor the two ternary systems of polyethylene glycol and aque-ous solutions of sodium sulphate and sodium chloride. Oosterhofet al. (1999b) also investigated different antisolvents for sodiumcarbonate–water system and they found a correlation between saltsolubility and water–antisolvent mixture decomposition at constanttemperature.
Unlike most works that study inorganic solute crystallization byorganic antisolvents, Holmback and Rasmuson (1999) and Yu et al.(2005) considered organic solutions and water as second solvent.Size and morphology of benzoic acid crystals from ethanol–watersystem were investigated by Holmback and Rasmuson (1999) whovaried the feed and bulk solution composition and feed rate. Theyobserved that supersaturation mainly governs the mean size whilesolvent composition has significant effect on the crystal shape. Ag-glomeration and habit of paracetamol crystals were the focus of thestudy by Yu et al. (2005) who varied the agitation speed and fee-drate. In their study they concluded that low agitation speed andhigh feed rate will result in excessive nucleation due to high localsupersaturation leading to highly agglomerated product with lowermean size.
In some other works antisolvent crystallization was applied inthe production of anhydrous crystals. For instance, Oosterhof et al.(2001) studied production of anhydrous sodium carbonate at roomtemperature using ethylene glycol and diethylene glycol as antisol-vents. Unlike conventional crystallization methods that cannot pro-duce anhydrous sodium carbonate (due to its instability in aqueoussolutions at temperatures lower than boiling point of saturated sodaash solution), their method incorporating antisolvent showed suc-cess in doing so.
Zhou et al. (2006) have carried out concentration controlledseeded antisolvent crystallization of a pharmaceutical compoundusing an algebraic equation for the solubility as a function of sol-vent. The main objective of their feedback concentration controlsystem was to keep the supersaturation low and constant. For this,different constant supersaturation values were investigated andtheir influence over nucleation discussed. In addition, they presentsimulation results investigating the antisolvent crystallization ofparacetamol.
Nonoyama et al. (2006) also present a simulation study on seededsolvent crystallization of an active pharmaceutical ingredient (API)by water addition to original solution. The model they incorporateneglects nucleation, breakage and agglomeration, and only consid-ers a size independent growth kinetic derived from experimentalstudies. Their results show a prevention of nucleation of undesiredpolymorph by keeping supersaturation at a certain level.
Few crystallization works with emphasis on particle size controlhave been carried out using gas as the antisolvent. Such processesare becoming more and more attractive because of economical andmore importantly environmental objectives. Tai and Cheng (1998)investigate the saturation behavior of solutes, and the growth ofcrystals in the gas antisolvent crystallization (GAS) process. It is pos-sible to tune and regulate the high pressures (needed to solubilizethe gas antisolvent) or the gas antisolvent addition rate in order toachieve the desired particle size and/or size distribution. Muhrer etal. (2002) provide a simplified model of the GAS crystallization pro-cess that describes the vapour–liquid equilibrium as well as particleformation and growth. From their experiments, they identify differ-ent patterns of behavior in terms of antisolvent addition rates andthey are also able, through these findings, to tune the product aver-age particle size and size distribution to a large extent. They validate
the developed model and suggest its use as a tool to design andoptimize GAS recrystallization processes.
In spite of all the previous works, there still exists a big gap inthe systematic control of the product crystal size and other proper-ties in antisolvent mediated crystallization. Model-based optimiza-tion to determine optimal antisolvent crystallization strategies arepoised to fill this gap and as far as the authors are aware, are notcurrently found in the literature. The first step towards model-basedoptimal strategies is model development. This is the concern of thispaper, in which we present extensions to previously developedmod-els (Abbas, 2003; Nowee et al., 2007), and address antisolvent ef-fects and interactions. The model which is based on the populationbalance theory is used in optimization-based parameter estimationto arrive at solubility and kinetic sub-models. Finally, the developedmodel is experimentally validated and exploited in simulation stud-ies with the aim to understand antisolvent crystallization behaviorand the control of particle size. The use of the model for optimiz-ing the feedrate and thus operation of antisolvent crystallization ispresented in a sequel to this paper (Nowee et al., 2008).
2. Model development
An appropriate approach for modeling the crystallization pro-cess is the statistical mechanical formulation proposed by Hulburtand Katz (1964). A population balance is employed and accounts forthe evolution of crystal particles across temporal and size domains.For a crystallization system with crystal growth assumed to be non-dispersed and independent of crystal size and where agglomerationand attrition are considered negligible, the population balance equa-tion (PBE) simplifies to
�n(L, t)�t
= −G�n(L, t)
�L+ B − n(L, t)
VdVdt
(1)
where n(L, t) is the number density of crystals, t is time, L is thecharacteristic crystal size, V is the suspension volume, G is the growthrate of the crystals and B is the nucleation rate, which is equal tozero for all sizes but the first. It follows that
B = B0�(L) (2)
where B0 is the nucleation rate and �(L) is the Dirac delta function. Aset of operating equations for the ternary solvent–solute–antisolventcrystallization is needed. We firstly define the mass fraction of eachcomponent as
xi = mi∑mi
(3)
and without loss of generality, xi and mi are the mass fraction andmass of the ith component respectively. For our case, the numberof components, i, is 3 and so x1, x2 and x3 are the primary solvent,solute and antisolvent mass fractions, respectively, and similarlym1,m2 and m3 are the primary solvent, solute and antisolvent masses,respectively.
Changes in suspension volume are evaluated by
dVdt
= dVLdt
+ dVSdt
(4)
In Eq. (4), the liquid phase volume, VL, is given by
VL =∑
mi�
(5)
where � is the solution density, while the solute phase volume isgiven by
VS = V�v∫ ∞
0nL3 dL (6)
S. Mostafa Nowee et al. / Chemical Engineering Science 63 (2008) 5457 -- 5467 5459
where �v is the crystal volume shape factor. Accordingly the numer-ator of Eq. (4) bears the antisolvent mass addition term as well astotal solute mass in liquid phase.
The mass balance, after Rawlings et al. (1993), for the solute massaccumulation, is incorporated as
dm2dt
= −3V�c�vG∫ ∞
0nL2 dL (7)
where �c is the crystal density. The concentration of the solute, C, isthen defined as
C = m2VL
(8)
Solution density, �, and volume mean size of particles, L, both beingmeasured experimental variables are introduced to the model as:
L =∫n(L, t)L4 dL∫n(L, t)L3 dL
(9)
� = (A0 + A1x2 + A2x3 + A3x2x3 + A4x2x23)
× e(A5(x3/x1)+A6(x3/x1)2) (10)
The density–concentration correlation (Eq. (10)) is adopted fromGalleguillos et al. (2003) who experimentally determined the set ofconstant coefficients (Ai) for the NaCl–water–ethanol mixture whichis used in this study as the model antisolvent crystallization system.
The set of equations above representing the antisolvent crystal-lization model was solved in gPROMS environment (Process Sys-tems Enterprise Ltd., UK) using backward finite discretization acrossthe size domain, transforming the PBE into a set of ordinary dif-ferential equations. The solubility and kinetic sub-models for theNaCl–water–ethanol system are discussed in the next sections.
3. Solubility model identification
Knowledge of the equilibrium condition (solubility) of the crys-tallization system is crucial to the control of the particle size.We develop a model describing the solubility of the NaCl in thesolvent–antisolvent mixture based on experimental solubility data(Yeo et al., 2007). This data corroborates with other data presentedelsewhere for the same ternary system (Farelo et al., 2004). Thismodel describing the saturated concentration dependence on sol-vent concentration in solute-free mixture is shown in Eq. (11):
C∗ = (1 − z3)(K − z3)
C∗water (11)
where C∗ is the molality of solute in the mixture and C∗water is molal-
ity of solute in pure water and has a value of 33.80g/100g of waterat constant temperature 25 ◦C. K, like C∗
water is constant at constanttemperature and is equal to 0.83094. z3 is the mass fraction of anti-solvent in solute-free mixture.
4. Kinetic model identification
Limited work has been presented in the literature on the model-ing and identification of antisolvent crystallization kinetics. No com-prehensive studies are available that addressmodel-based identifica-tion in this field. The most relevant research addressing the antisol-vent kinetics of nucleation and growth seems to be that of Mydlarzand Jones (1989, 1990). In Mydlarz and Jones (1989), an extensiveexperimental study is carried out with over 130 experiments con-ducted leading to the determination and rigorous analysis of thegrowth kinetics of potassium sulphate antisolvent crystallization inaqueous 2-propanol solutions. A power law model is shown to rep-resent well the overall growth rate. In Mydlarz and Jones (1990),
they develop kinetic models for mixed suspension mixed productremoval (MSMPR) crystallization. Their growth rate model is size de-pendent while its kinetic parameters are functions of antisolvent towater weight ratio. In yet another work, the same authors (Mydlarzand Jones, 1991) consider agglomeration kinetics in addition to nu-cleation and growth. Later, Nyvlt (1992) mathematically investigateda kinetic model for nucleation rate. His model is a function of growthrate and supersaturation that depends on antisolvent addition rate.Nyvelt's conclusion suggests that the antisolvent addition should beslow in the early stages of the batch and increase proportionally withthe crystal surface area. Granberg et al. (1999) substantiate Nyvelt'sresults in their study of paracetamol antisolvent crystallization. Theypresent results of nucleation experiments showing that the higherthe initial supersaturation is, the higher is the rate of supersatura-tion decay, suggesting that conditions of higher initial supersatura-tion generate larger total growing crystal surface area. Granberg etal. (1999) propose a relation between the surface energy and thesolubility to describe the nucleation kinetics. Such kinetic model de-velopments are rare in the literature and present two opportunities;the first is to repostulate the mechanisms behind such complex ki-netic phenomena while the second is to develop systematic methodsfor the determination of the kinetic parameters.
In this study, we start by incorporating a growth kinetic formu-lation proposed by Linnikov (2006) who neglected the effect of sec-ondary nucleation and implemented seed addition. Seeding is notconsidered in the current study, and so a nucleation kinetic modelis needed. Such a nucleation model is not available in the literature,however kinetics for cooling crystallization of sodium chloride asreported by Akal et al. (1986) are initially used. Together, the nucle-ation kinetics of Akal et al. (1986) and growth kinetics of Linnikov(2006) are referred to as `Literature' kinetics in the rest of the paperand are represented by the following equations:
B = kb�CbMT (12)
G = k′g�Ce−E/RT (13)
where �C is the supersaturation, kb and b are the nucleation rateparameters, MT is the magma density, k′
g and E are growth rateparameters. However, the growth model structure used in this studydiffers subtly from Eq. (13) and is proposed as
G = kgSg (14)
where the term k′g e
−E/RT in Eq. (13) is lumped into a new parame-ter kg . We can do this since the temperature of the process remainsconstant throughout. S is the supersaturation term which could bechosen to be absolute or relative supersaturation. Finally, the expo-nent g is introduced to the model. In this growth rate power lawmodel structure, the parameters kg and g may have a constant valueor may be defined as functions of antisolvent mass fraction in solute-free mixture (z3):
kg = k0 + k1z3 + k2z23 (15)
g = g0 + g1z3 (16)
The kinetic sub-model (Eqs. (12) and (14)–(16)) contains a set ofparameters that needs to be identified via a parameter estimationstep. Essentially the parameter estimation problem is an optimiza-tion one where the model is fitted to the experimental data. Onceparameters are estimated, the identified model may be used for pre-dictive simulation analysis where the various operational variablesmay be studied, and for optimization and control scheme develop-ment. Initial works in crystallization parameter estimation relied onpopulation density data fitting (Chen and Larson, 1985). A common
5460 S. Mostafa Nowee et al. / Chemical Engineering Science 63 (2008) 5457 -- 5467
method presented throughout literature is the use of the analyti-cal solution of the PBE along with experimental data from MSMPRcrystallizers. This method is limited because (1) samples need to bedrawn from the MSMPR at steady-state conditions which may bedifficult to achieve, (2) estimates of parameters made from steady-state data would not be suitable for the description of the varyingdynamics occurring during the batch time, and (3) nonlinearities inthe size data may appear in some systems which do not obey Mc-Cabe's �L law. In recent years, rigorous parameter estimation meth-ods have been employed in crystallization kinetics identification butof all techniques, posing the estimation as an optimization problemhas been regarded as most relevant (Rawlings et al., 1993; Mignonet al., 1996). Non-linear optimization techniques such as maximumlikelihood are now available paving the way for more efficient esti-mation and with the advances in power of modern computers, opti-mizationmethods are becomingmore prevalent in the literature. Themathematical background behind these techniques is intricate andthere are several text available detailing the mathematical deriva-tions (Bard, 1974; Beck and Arnold, 1977; Leonard and Hsu, 1999)for the reader to refer to.
The crystallization model described in Sections 2–4 consists ofa coupled set of non-linear integro-differential equations and canbe represented by Y(t) = [L(t),�(t)] being the differential outputvariables—mean size and solution density, respectively, U(t)= [F(t)]being the time-varying input variable which is the feed rate of anti-solvent, and � being the vector of parameters to be identified whichin this case is the set [kb, kg , b, g] when considering kg and g to holdconstant values, or the set [kb, k0, k1, k2, b, g0, g1] when consideringkg and g to be functions of antisolvent mass fraction in solute-freemedia. We can then represent the model as follows:
f (Y(t),U(t),�) = 0 (17)
Eq. (17) is accompanied by a set of initial conditions. Measured vari-ables from experiments are essential in the parameter estimationexercise and are denoted by the vector Y(t) = [L(t), �(t)]. The max-imum likelihood criterion that describes the highest probability ofthe model predicting the real data is given by the following objectivefunction:
�(k,�)=M2ln(2�)+1
2mink,�
⎛⎜⎝
�∑i=1
�i∑j=1
ij∑k=1
⎡⎣ln(2
ijk)+Yijk−Yijk
2ijk
⎤⎦
⎞⎟⎠ (18)
where M is the total number of measurements taken during all ex-periments, �, �i and ij are, respectively, the number of experiments,the number of variables measured in the ith experiment and thenumber of measurements of the jth variable in the ith experiment,2ijk is the variance of the kth measurement of variable j in experi-
ment i. When the error structure of the data is known, 2ijk can be
described by any of a number of models available (Process SystemEnterprise Ltd., 2001).
In previous works, we successfully applied this method to theidentification of ammonium sulfate kinetics for crystallizations un-der cooling mode of operation (Abbas and Romagnoli, 2007; Noweeet al., 2007). The same method is applied here with differences be-ing modifications in the current model as well as in the experimen-tal conditions to describe antisolvent crystallization under constanttemperature. Here again the implementation of the maximum like-lihood optimization is carried out using the gEST facility in gPROMS.The kinetic parameter set that provides the highest probability ofthe model predicting the real data is identified.
5. Experimental
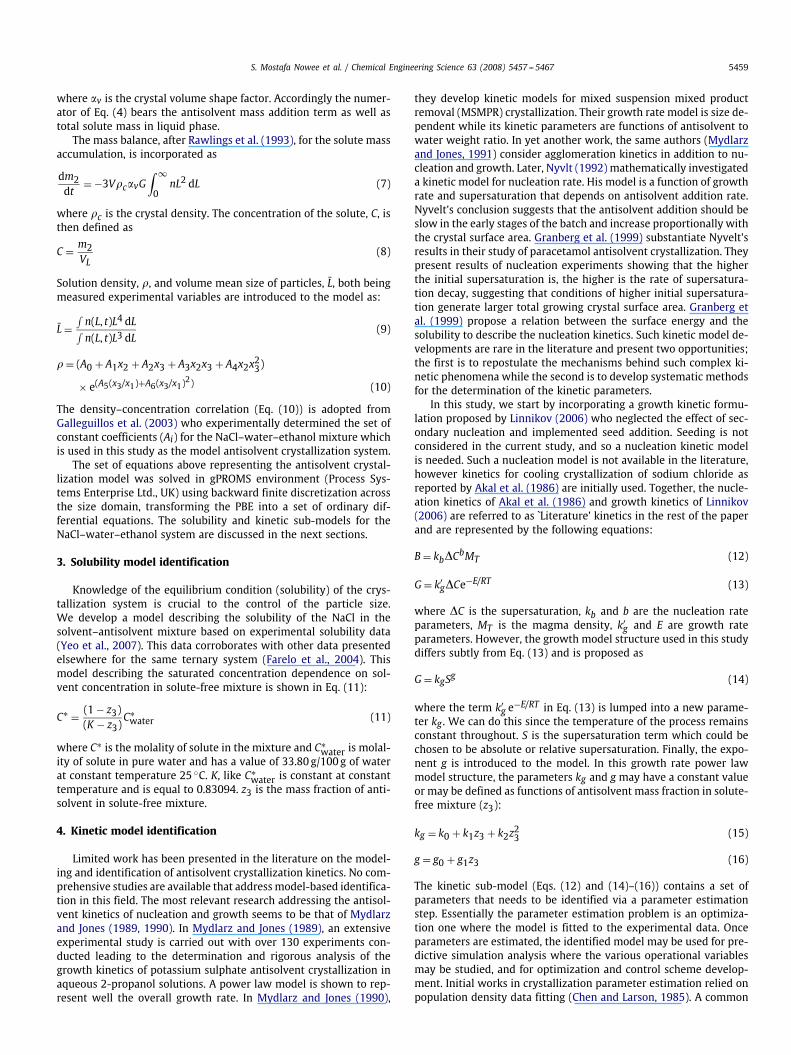
For the estimation step and model refinement, three experimentswere conducted under antisolvent feeding conditions. Fig. 1 showsthe schematic of the experimental apparatus, instrumentation andcontrol system used. In all experiments, purified water by a Milli-Qsystem was used. The purities of sodium chloride (NaCl) salt (Merck)and ethanol (Merck) used in the experiments were 99.5% and 99.9%,respectively.
Ethanol was added to the aqueous NaCl solution using a cali-brated digital dosing pump (Grundfos, Denmark). The ethanol ad-dition profile was implemented and controlled from within a dis-tributed control system (DCS) environment (Honeywell, USA). Tem-perature was controlled, at 25 ◦C for all experiments, using a Pt100thermocouple connected to heating/cooling circulator (Lauda, Ger-many). Particle chord length was measured in situ every 2 s us-ing focused beam reflectance measurement (FBRM) probe (Mettler-Toledo Lasentec Products, USA). Infrequent samples were removediso-kinetically from the crystallizer for offline particle size and den-sity measurements. Particle size was measured using Mastersizer2000 particle size analyzer (Malvern Instruments, UK) while den-sity was measured using a density meter (Anton Paar DMA 5000,Austria). Samples were filtered using a syringe microfilter prior todensity measurements. The concentration of the solution was in-ferred from the density reading using the correlation of Galleguilloset al. (2003). The FBRM signal was converted to 4–20mA signals us-ing an eight-channel analog output PCI card inserted in the FBRM
Fig. 1. Experimental setup. A: crystallization vessel, B: temperature control system,C: Pt100 thermocouple, D: ethanol addition line, E: pump, F: ethanol reservoir, G:FBRM probe, H: analog output card, I: FBRM control computer, J: DCS station, K:controller I/O terminals, L: DCS server, M: feed profile to pump.
S. Mostafa Nowee et al. / Chemical Engineering Science 63 (2008) 5457 -- 5467 5461
computer. This was then connected to the DCS for data monitoringand archiving.
6. Results and discussion
6.1. Model identification and kinetic parameter analysis
A series of experiments were conducted with the aim to generatedata to be used in the estimation of the parameters of nucleation andgrowth kinetic models. Either of the parameter sets �1 = [kb, kg , b, g]and �2 = [kb, k0, k1, k2, b, g0, g1] was determined during an estima-tion calculation depending on which of the kinetic model structurespresented in Section 4 was being used. This was possible from datagathered from four experiments under three constant antisolventfeeding profiles—one experiment at a feedrate of 194mlh−1, two ata medium rate of 98.4mlh−1 and one at a lower rate of 50mlh−1.We took a further step here beyond the literature kinetics and inves-tigated a number of structural changes to the growth kinetic model(Eq. (14)). The following four cases were examined:
• Model 1: The literature kinetic model, where, growth kinetic modelis a function of absolute supersaturation (�C) and the parametersof growth (kg and g) are constant.
• Model 2: Growth kinetic model is a function of relative supersat-uration (�C/C∗) and the parameters of growth (kg and g) are con-stant.
• Model 3: Growth kinetic model is a function of absolute supersat-uration (�C) and the parameters of growth are functions (Eqs. (10)and (11)) of antisolvent mass fraction in solute-free mixture.
Time (min)
0
Mea
n Si
ze (
mic
ron)
0
20
40
60
80
100
120
140
Model 1Model 2Model 3Model 4Experiment
Time (min)
Cso
lute
(gr
/Ltr
)
0
50
100
150
200
250
300Model 1Model 2Model 3Model 4Experiment
605040302010 0 605040302010
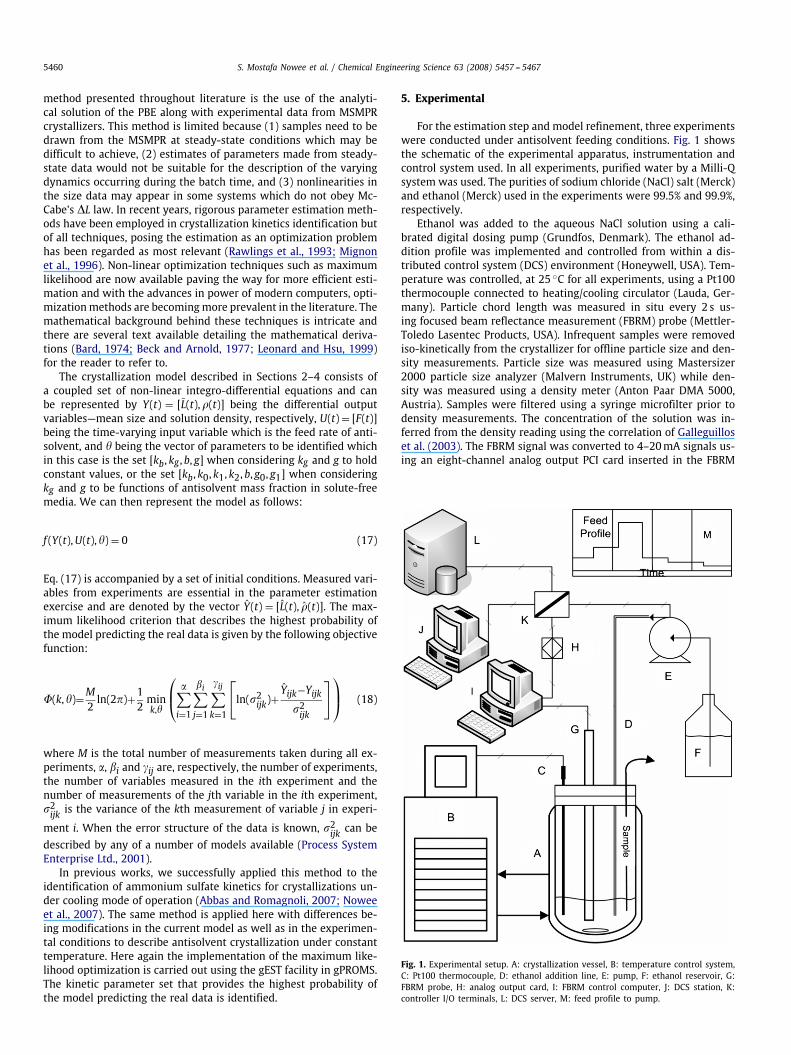
Fig. 2. Results of Experiment 1 at antisolvent addition of 194mlh−1. Overlay plots of experimental mean size (left) and solution concentration (right) against modelpredictions using the different kinetic models.
Time (min)
0
Mea
n Si
ze (
mic
ron)
0
20
40
60
80
100
120
140
Model 1Model 2Model 3Model 4Experiment
Time (min)
Cso
lute
(gr
/Ltr
)
0
50
100
150
200
250
300Model 1Model 2Model 3Model 4Experiment
12010080604020 0 12010080604020
Fig. 3. Results of Experiment 2 at antisolvent addition of 98.4mlh−1. Overlay plots of experimental mean size (left) and solution concentration (right) against modelpredictions using the different kinetic models.
• Model 4: Growth kinetic is a function of relative supersatu-ration (�C/C∗) and the parameters of growth are functions(Eqs. (15) and (16)) of antisolvent mass fraction in solute-freemixture.
Temporal mean size data from the Mastersizer and concentrationdata inferred from the density meter were necessary in this estima-tion step. The results of each of the four experiments are displayedin Figs. 2–5 against the data from the identified kinetic models ofeach of the four models above.
The estimation activities for all models were executed success-fully and parameter values obtained are displayed in Table 1. Thegoodness of the fits varies across the four models, yet all can bedeemed satisfactory. This is more so for the concentration profiledata. As for the mean size profiles, it can be visually observed fromthe overlay plots that Model 4 offers, in general a better fit, closelyfollowed by Model 3. This is corroborated by the estimation residualvalues (Table 1) showing a relatively lower residual error in the caseof Model 4 in comparison to the other three models. Model 4 andits corresponding estimated parameters is favored and is adopted ina subsequent experimental validation exercise presented in Section6.2. Both Models 3 and 4, in contrast to Models 1 and 2, carry growthrate coefficients with functionality of antisolvent mass fraction. Thissuggests (since these two models offer better fits) the significance ofincluding antisolvent mass fraction in the growth kinetics. Models 3and 4 differ in their formulation of the supersaturation term, but noprofound effect of this difference can be observed in the fits, exceptthat in the early stages of the process, Model 4 mean size profilealways rises more rapidly. This suggests that the two supersatura-tion formulations employed differ with respect to their effect on
5462 S. Mostafa Nowee et al. / Chemical Engineering Science 63 (2008) 5457 -- 5467
Time (min)
0
Mea
n Si
ze (
mic
ron)
0
20
40
60
80
100
120
140
Model 1Model 2Model 3Model 4Experiment
Time (min)
Cso
lute
(gr
/Ltr
)
0
50
100
150
200
250
300Model 1Model 2Model 3Model 4Experiment
120100806040 0 1201008060402020
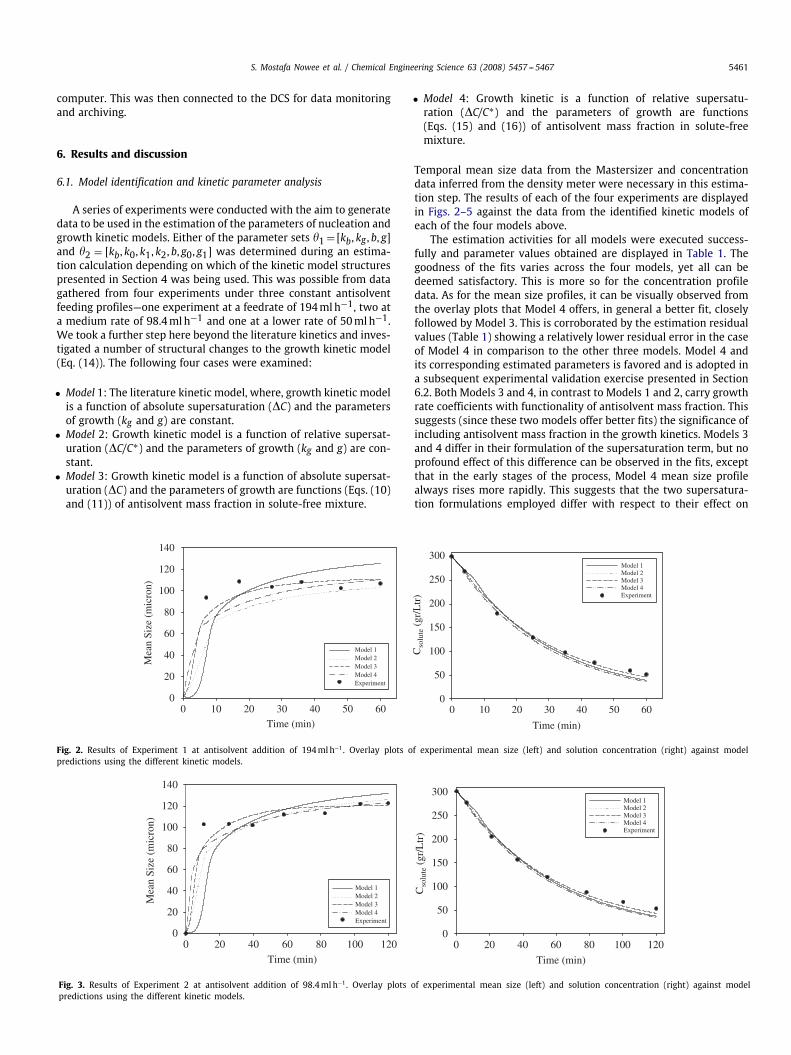
Fig. 4. Results of Experiment 3 at antisolvent addition of 98.4mlh−1. Overlay plots of experimental mean size (left) and solution concentration (right) against modelpredictions using the different kinetic models.
Time (min)0
Mea
n Si
ze (
mic
ron)
0
20
40
60
80
100
120
140
160
180
Model 1Model 2Model 3Model 4Experiment
Time (min)
Cso
lute
(gr
/Ltr
)
0
50
100
150
200
250
300Model 1Model 2Model 3Model 4Experiment
20015010050 0 20015010050
Fig. 5. Results of Experiment 4 at antisolvent addition of 50mlh−1. Overlay plots of experimental mean size (left) and solution concentration (right) against model predictionsusing the different kinetic models.
Table 1Values of the estimated parameters for the different growth kinetic model structuresalong with the estimation residual values for each model
Parameter Model 1 Model 2 Model 3 Model 4
bn 3.464 1.494 1.937 0.9655kb 2.11E + 07 2.12E + 07 9.66E + 06 9.68E + 06g 2.576 0.2302kg 3.10E − 05 7.67E − 07g0 1.051 0.8006g1 4.875 0.7379k0 1.86E − 05 9.88E − 05k1 0 −0.00241k2 0 0.01681
Residual value 61971 2113 2681 100
nucleation activities in the early stages of the process. The exact na-ture of this is worthy of further investigation. The weaker models,i.e. Models 1 and 2, deviate more from the experimental data. Model1 almost always overpredicts the mean size in the later phases of theprocess, but there is some consistency in this, that is the absoluteoverprediction decreases for decreasing constant feedrate of the an-tisolvent. Similar consistency is observed for Model 2, but this timethere is underprediction at the higher constant antisolvent feedrateand this absolute underprediction moves to become an overpredic-tion for the lower feedrate experimental data. In any case, the ex-clusion of the antisolvent mass fraction from the growth kinetics asis done in Models 1 and 2, reduces the goodness of their fits. Outof all the models, the fit of Model 1 behaves the worst at the earlytimes of the process in the form of severe underprediction to the data
Size (μ)0.1
Vol
ume
Perc
enta
ge
0
2
4
6
8
10 Model 1Model 2Model 3Model 4Experimental
10001001 10
Fig. 6. End of run product PSD overlay plot for Experiment 1 at antisolvent additionrate of 194mlh−1 against model predictions using the different kinetic models.
under all feedrates tested. Further a sigmoidal shape to this modelis observed in the beginning which may be explained by the higherorders estimated for the kinetic exponents (see Table 1).
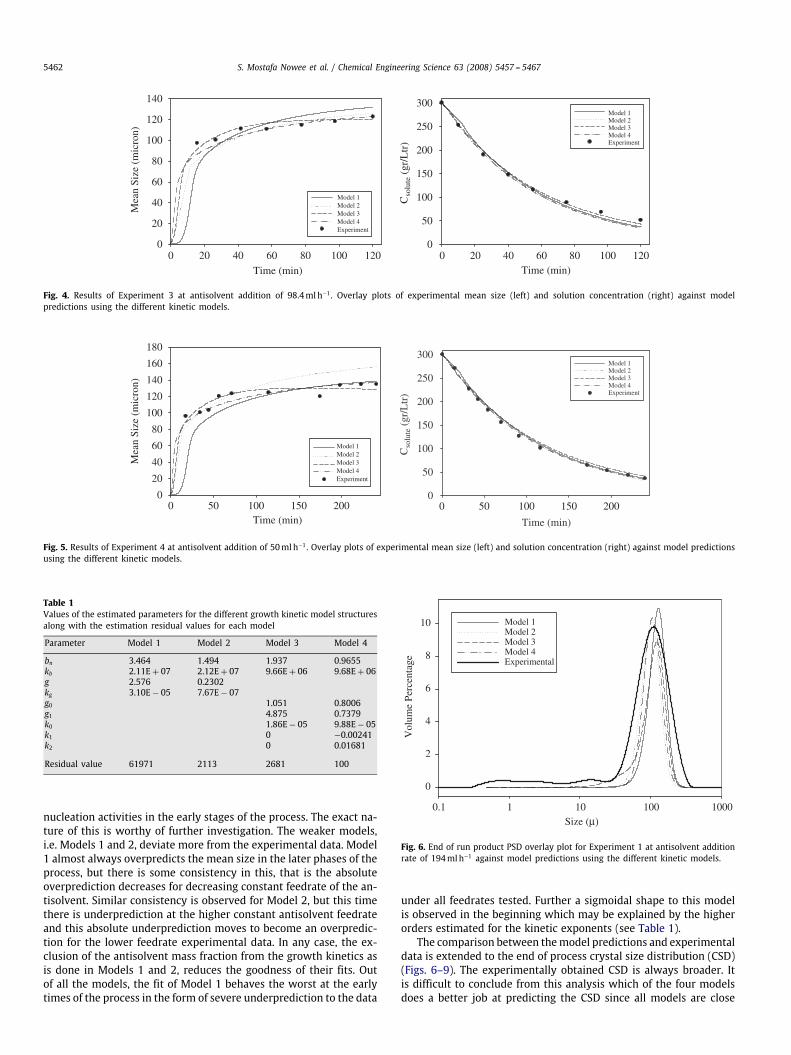
The comparison between themodel predictions and experimentaldata is extended to the end of process crystal size distribution (CSD)(Figs. 6–9). The experimentally obtained CSD is always broader. Itis difficult to conclude from this analysis which of the four modelsdoes a better job at predicting the CSD since all models are close
S. Mostafa Nowee et al. / Chemical Engineering Science 63 (2008) 5457 -- 5467 5463
Size (μ)0.1
Vol
ume
Perc
enta
ge
0
2
4
6
8
10 Model 1Model 2Model 3Model 4Experimental
1000100101
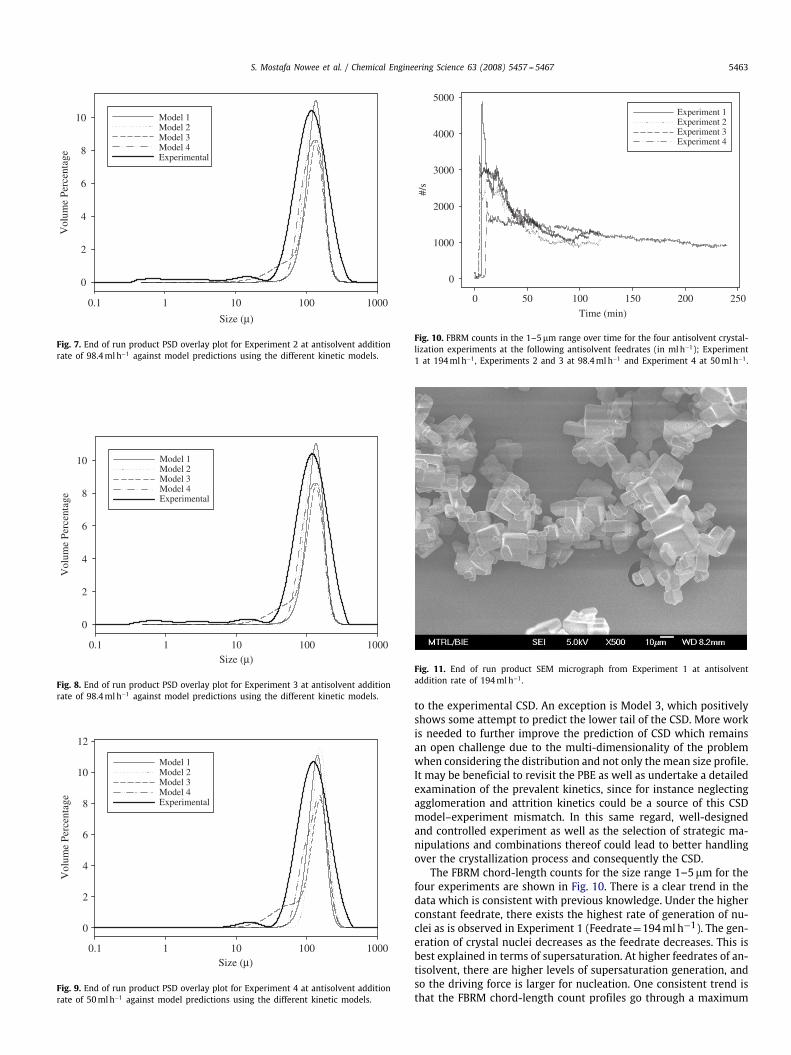
Fig. 7. End of run product PSD overlay plot for Experiment 2 at antisolvent additionrate of 98.4mlh−1 against model predictions using the different kinetic models.
Size (μ)0.1
Vol
ume
Perc
enta
ge
0
2
4
6
8
10 Model 1Model 2Model 3Model 4Experimental
1000100101
Fig. 8. End of run product PSD overlay plot for Experiment 3 at antisolvent additionrate of 98.4mlh−1 against model predictions using the different kinetic models.
Size (μ)0.1
Vol
ume
Perc
enta
ge
0
2
4
6
8
10
12
Model 1Model 2Model 3Model 4Experimental
1000100101
Fig. 9. End of run product PSD overlay plot for Experiment 4 at antisolvent additionrate of 50mlh−1 against model predictions using the different kinetic models.
Time (min)
0
#/s
0
1000
2000
3000
4000
5000Experiment 1Experiment 2Experiment 3Experiment 4
25020015010050
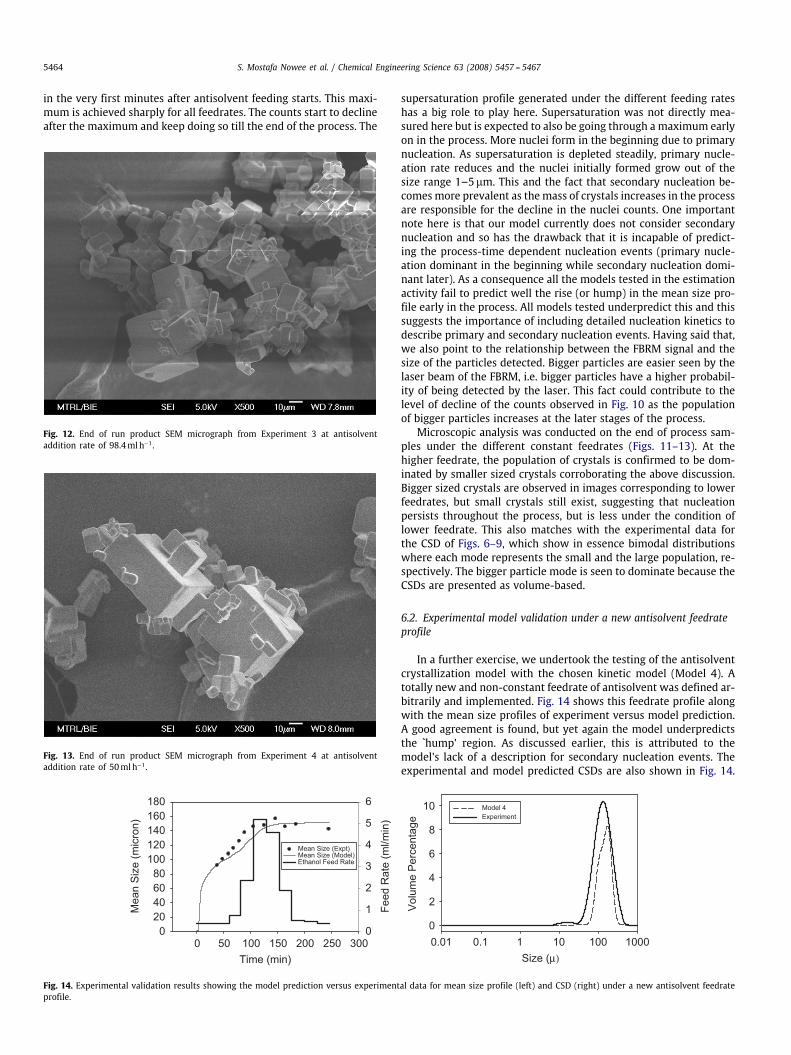
Fig. 10. FBRM counts in the 1–5�m range over time for the four antisolvent crystal-lization experiments at the following antisolvent feedrates (in mlh−1); Experiment1 at 194mlh−1, Experiments 2 and 3 at 98.4mlh−1 and Experiment 4 at 50mlh−1.
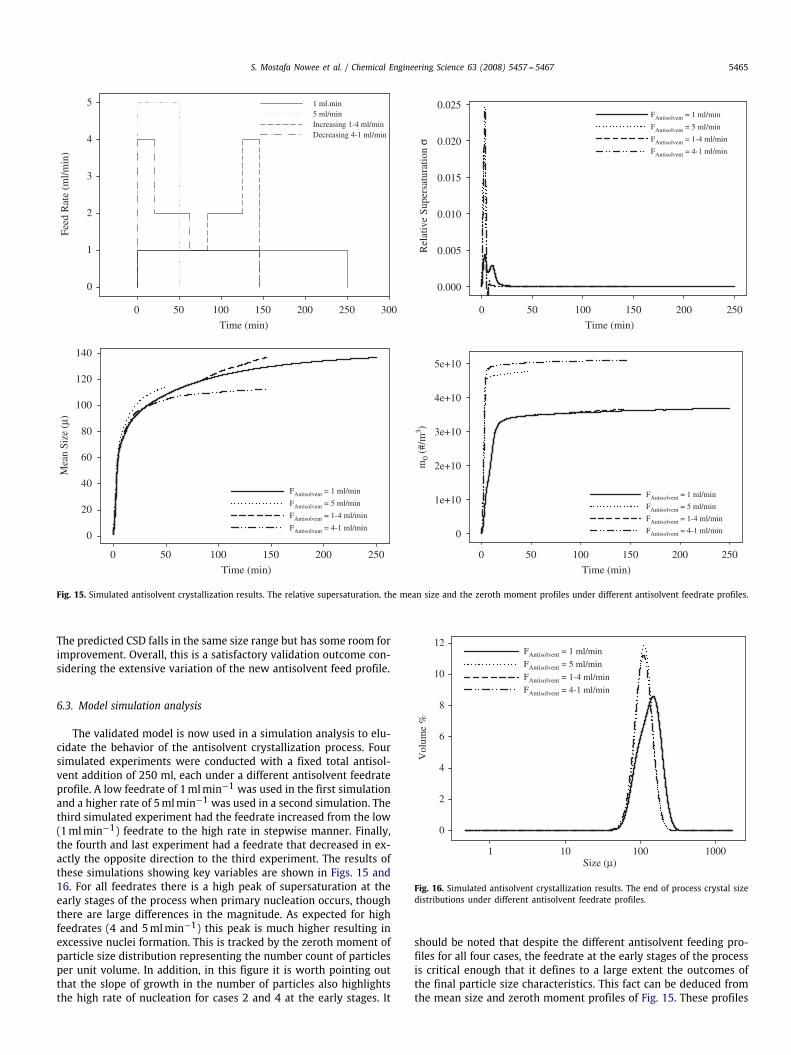
Fig. 11. End of run product SEM micrograph from Experiment 1 at antisolventaddition rate of 194mlh−1.
to the experimental CSD. An exception is Model 3, which positivelyshows some attempt to predict the lower tail of the CSD. More workis needed to further improve the prediction of CSD which remainsan open challenge due to the multi-dimensionality of the problemwhen considering the distribution and not only themean size profile.It may be beneficial to revisit the PBE as well as undertake a detailedexamination of the prevalent kinetics, since for instance neglectingagglomeration and attrition kinetics could be a source of this CSDmodel–experiment mismatch. In this same regard, well-designedand controlled experiment as well as the selection of strategic ma-nipulations and combinations thereof could lead to better handlingover the crystallization process and consequently the CSD.
The FBRM chord-length counts for the size range 1–5�m for thefour experiments are shown in Fig. 10. There is a clear trend in thedata which is consistent with previous knowledge. Under the higherconstant feedrate, there exists the highest rate of generation of nu-clei as is observed in Experiment 1 (Feedrate=194mlh−1). The gen-eration of crystal nuclei decreases as the feedrate decreases. This isbest explained in terms of supersaturation. At higher feedrates of an-tisolvent, there are higher levels of supersaturation generation, andso the driving force is larger for nucleation. One consistent trend isthat the FBRM chord-length count profiles go through a maximum
5464 S. Mostafa Nowee et al. / Chemical Engineering Science 63 (2008) 5457 -- 5467
in the very first minutes after antisolvent feeding starts. This maxi-mum is achieved sharply for all feedrates. The counts start to declineafter the maximum and keep doing so till the end of the process. The
Fig. 12. End of run product SEM micrograph from Experiment 3 at antisolventaddition rate of 98.4mlh−1.
Fig. 13. End of run product SEM micrograph from Experiment 4 at antisolventaddition rate of 50mlh−1.
Time (min)0
Mea
n S
ize
(mic
ron)
020406080
100120140160180
Feed
Rat
e (m
l/min
)
0
1
2
3
4
5
6
Mean Size (Expt)Mean Size (Model)Ethanol Feed Rate
Size (μ)0.01
Vol
ume
Per
cent
age
0
2
4
6
8
10 Model 4Experiment
30025020015010050 10001001010.1
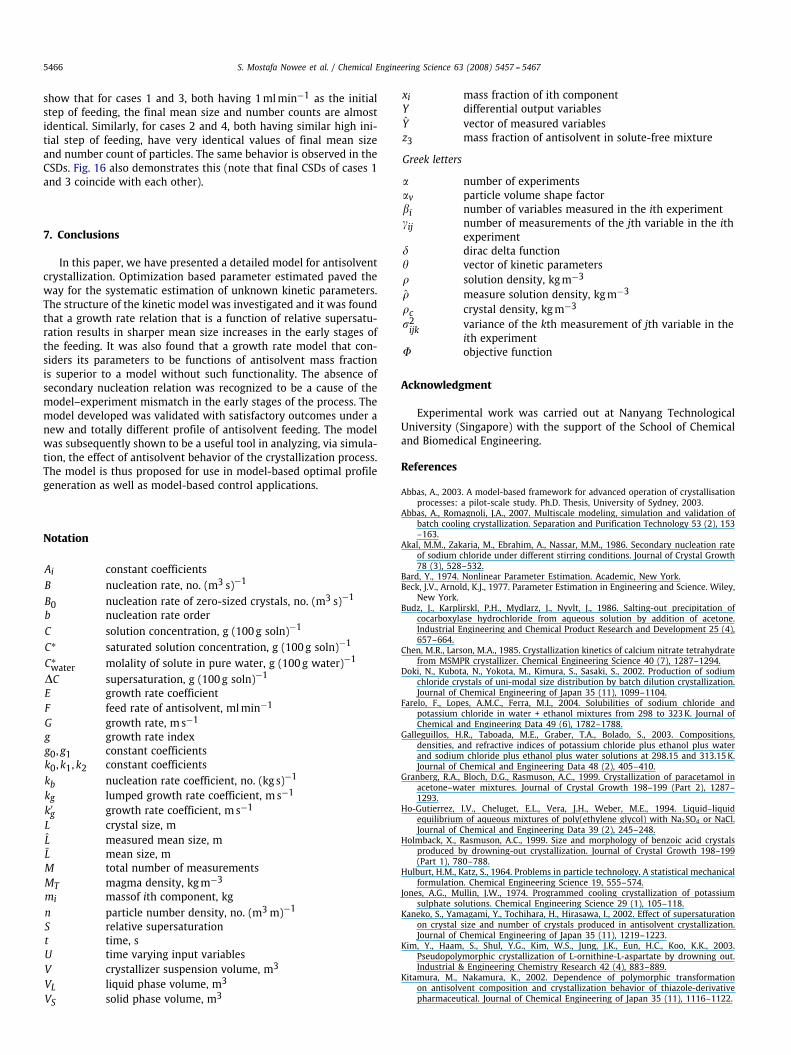
Fig. 14. Experimental validation results showing the model prediction versus experimental data for mean size profile (left) and CSD (right) under a new antisolvent feedrateprofile.
supersaturation profile generated under the different feeding rateshas a big role to play here. Supersaturation was not directly mea-sured here but is expected to also be going through a maximum earlyon in the process. More nuclei form in the beginning due to primarynucleation. As supersaturation is depleted steadily, primary nucle-ation rate reduces and the nuclei initially formed grow out of thesize range 1–5�m. This and the fact that secondary nucleation be-comesmore prevalent as themass of crystals increases in the processare responsible for the decline in the nuclei counts. One importantnote here is that our model currently does not consider secondarynucleation and so has the drawback that it is incapable of predict-ing the process-time dependent nucleation events (primary nucle-ation dominant in the beginning while secondary nucleation domi-nant later). As a consequence all the models tested in the estimationactivity fail to predict well the rise (or hump) in the mean size pro-file early in the process. All models tested underpredict this and thissuggests the importance of including detailed nucleation kinetics todescribe primary and secondary nucleation events. Having said that,we also point to the relationship between the FBRM signal and thesize of the particles detected. Bigger particles are easier seen by thelaser beam of the FBRM, i.e. bigger particles have a higher probabil-ity of being detected by the laser. This fact could contribute to thelevel of decline of the counts observed in Fig. 10 as the populationof bigger particles increases at the later stages of the process.
Microscopic analysis was conducted on the end of process sam-ples under the different constant feedrates (Figs. 11–13). At thehigher feedrate, the population of crystals is confirmed to be dom-inated by smaller sized crystals corroborating the above discussion.Bigger sized crystals are observed in images corresponding to lowerfeedrates, but small crystals still exist, suggesting that nucleationpersists throughout the process, but is less under the condition oflower feedrate. This also matches with the experimental data forthe CSD of Figs. 6–9, which show in essence bimodal distributionswhere each mode represents the small and the large population, re-spectively. The bigger particle mode is seen to dominate because theCSDs are presented as volume-based.
6.2. Experimental model validation under a new antisolvent feedrateprofile
In a further exercise, we undertook the testing of the antisolventcrystallization model with the chosen kinetic model (Model 4). Atotally new and non-constant feedrate of antisolvent was defined ar-bitrarily and implemented. Fig. 14 shows this feedrate profile alongwith the mean size profiles of experiment versus model prediction.A good agreement is found, but yet again the model underpredictsthe `hump' region. As discussed earlier, this is attributed to themodel's lack of a description for secondary nucleation events. Theexperimental and model predicted CSDs are also shown in Fig. 14.
S. Mostafa Nowee et al. / Chemical Engineering Science 63 (2008) 5457 -- 5467 5465
Time (min)
0
Feed
Rat
e (m
l/min
)
0
1
2
3
4
5 1 ml.min5 ml/minIncreasing 1-4 ml/minDecreasing 4-1 ml/min
Time (min)
0
Rel
ativ
e Su
pers
atur
atio
n σ
0.000
0.005
0.010
0.015
0.020
0.025FAntisolvent = 1 ml/min
FAntisolvent = 5 ml/min
FAntisolvent = 1-4 ml/min
FAntisolvent = 4-1 ml/min
Time (min)
0
Mea
n Si
ze (
μ)
0
20
40
60
80
100
120
140
FAntisolvent = 1 ml/min
FAntisolvent = 5 ml/min
FAntisolvent = 1-4 ml/min
FAntisolvent = 4-1 ml/min
Time (min)
0
m0
(#/m
3 )
0
1e+10
2e+10
3e+10
4e+10
5e+10
FAntisolvent = 1 ml/min
FAntisolvent = 5 ml/min
FAntisolvent = 1-4 ml/min
FAntisolvent = 4-1 ml/min
30025020015010050 25020015010050
25020015010050 25020015010050
Fig. 15. Simulated antisolvent crystallization results. The relative supersaturation, the mean size and the zeroth moment profiles under different antisolvent feedrate profiles.
The predicted CSD falls in the same size range but has some room forimprovement. Overall, this is a satisfactory validation outcome con-sidering the extensive variation of the new antisolvent feed profile.
6.3. Model simulation analysis
The validated model is now used in a simulation analysis to elu-cidate the behavior of the antisolvent crystallization process. Foursimulated experiments were conducted with a fixed total antisol-vent addition of 250 ml, each under a different antisolvent feedrateprofile. A low feedrate of 1mlmin−1 was used in the first simulationand a higher rate of 5mlmin−1 was used in a second simulation. Thethird simulated experiment had the feedrate increased from the low(1mlmin−1) feedrate to the high rate in stepwise manner. Finally,the fourth and last experiment had a feedrate that decreased in ex-actly the opposite direction to the third experiment. The results ofthese simulations showing key variables are shown in Figs. 15 and16. For all feedrates there is a high peak of supersaturation at theearly stages of the process when primary nucleation occurs, thoughthere are large differences in the magnitude. As expected for highfeedrates (4 and 5mlmin−1) this peak is much higher resulting inexcessive nuclei formation. This is tracked by the zeroth moment ofparticle size distribution representing the number count of particlesper unit volume. In addition, in this figure it is worth pointing outthat the slope of growth in the number of particles also highlightsthe high rate of nucleation for cases 2 and 4 at the early stages. It
Size (μ)1
Vol
ume
%
0
2
4
6
8
10
12FAntisolvent = 1 ml/min
FAntisolvent = 5 ml/min
FAntisolvent = 1-4 ml/min
FAntisolvent = 4-1 ml/min
10 1000100
Fig. 16. Simulated antisolvent crystallization results. The end of process crystal sizedistributions under different antisolvent feedrate profiles.
should be noted that despite the different antisolvent feeding pro-files for all four cases, the feedrate at the early stages of the processis critical enough that it defines to a large extent the outcomes ofthe final particle size characteristics. This fact can be deduced fromthe mean size and zeroth moment profiles of Fig. 15. These profiles
5466 S. Mostafa Nowee et al. / Chemical Engineering Science 63 (2008) 5457 -- 5467
show that for cases 1 and 3, both having 1mlmin−1 as the initialstep of feeding, the final mean size and number counts are almostidentical. Similarly, for cases 2 and 4, both having similar high ini-tial step of feeding, have very identical values of final mean sizeand number count of particles. The same behavior is observed in theCSDs. Fig. 16 also demonstrates this (note that final CSDs of cases 1and 3 coincide with each other).
7. Conclusions
In this paper, we have presented a detailed model for antisolventcrystallization. Optimization based parameter estimated paved theway for the systematic estimation of unknown kinetic parameters.The structure of the kinetic model was investigated and it was foundthat a growth rate relation that is a function of relative supersatu-ration results in sharper mean size increases in the early stages ofthe feeding. It was also found that a growth rate model that con-siders its parameters to be functions of antisolvent mass fractionis superior to a model without such functionality. The absence ofsecondary nucleation relation was recognized to be a cause of themodel–experiment mismatch in the early stages of the process. Themodel developed was validated with satisfactory outcomes under anew and totally different profile of antisolvent feeding. The modelwas subsequently shown to be a useful tool in analyzing, via simula-tion, the effect of antisolvent behavior of the crystallization process.The model is thus proposed for use in model-based optimal profilegeneration as well as model-based control applications.
Notation
Ai constant coefficientsB nucleation rate, no. (m3 s)−1
B0 nucleation rate of zero-sized crystals, no. (m3 s)−1
b nucleation rate orderC solution concentration, g (100g soln)−1
C∗ saturated solution concentration, g (100g soln)−1
C∗water molality of solute in pure water, g (100g water)−1
�C supersaturation, g (100g soln)−1
E growth rate coefficientF feed rate of antisolvent, mlmin−1
G growth rate, ms−1
g growth rate indexg0, g1 constant coefficientsk0, k1, k2 constant coefficientskb nucleation rate coefficient, no. (kg s)−1
kg lumped growth rate coefficient, ms−1
k′g growth rate coefficient, ms−1
L crystal size, mL measured mean size, mL mean size, mM total number of measurementsMT magma density, kgm−3
mi massof ith component, kgn particle number density, no. (m3m)−1
S relative supersaturationt time, sU time varying input variablesV crystallizer suspension volume, m3
VL liquid phase volume, m3
VS solid phase volume, m3
xi mass fraction of ith componentY differential output variablesY vector of measured variablesz3 mass fraction of antisolvent in solute-free mixture
Greek letters
� number of experiments�v particle volume shape factor�i number of variables measured in the ith experimentij number of measurements of the jth variable in the ith
experiment� dirac delta function� vector of kinetic parameters� solution density, kgm−3
� measure solution density, kgm−3
�c crystal density, kgm−3
2ijk variance of the kth measurement of jth variable in the
ith experiment� objective function
Acknowledgment
Experimental work was carried out at Nanyang TechnologicalUniversity (Singapore) with the support of the School of Chemicaland Biomedical Engineering.
References
Abbas, A., 2003. A model-based framework for advanced operation of crystallisationprocesses: a pilot-scale study. Ph.D. Thesis, University of Sydney, 2003.
Abbas, A., Romagnoli, J.A., 2007. Multiscale modeling, simulation and validation ofbatch cooling crystallization. Separation and Purification Technology 53 (2), 153–163.
Akal, M.M., Zakaria, M., Ebrahim, A., Nassar, M.M., 1986. Secondary nucleation rateof sodium chloride under different stirring conditions. Journal of Crystal Growth78 (3), 528–532.
Bard, Y., 1974. Nonlinear Parameter Estimation. Academic, New York.Beck, J.V., Arnold, K.J., 1977. Parameter Estimation in Engineering and Science. Wiley,
New York.Budz, J., Karplirskl, P.H., Mydlarz, J., Nyvlt, J., 1986. Salting-out precipitation of
cocarboxylase hydrochloride from aqueous solution by addition of acetone.Industrial Engineering and Chemical Product Research and Development 25 (4),657–664.
Chen, M.R., Larson, M.A., 1985. Crystallization kinetics of calcium nitrate tetrahydratefrom MSMPR crystallizer. Chemical Engineering Science 40 (7), 1287–1294.
Doki, N., Kubota, N., Yokota, M., Kimura, S., Sasaki, S., 2002. Production of sodiumchloride crystals of uni-modal size distribution by batch dilution crystallization.Journal of Chemical Engineering of Japan 35 (11), 1099–1104.
Farelo, F., Lopes, A.M.C., Ferra, M.I., 2004. Solubilities of sodium chloride andpotassium chloride in water + ethanol mixtures from 298 to 323K. Journal ofChemical and Engineering Data 49 (6), 1782–1788.
Galleguillos, H.R., Taboada, M.E., Graber, T.A., Bolado, S., 2003. Compositions,densities, and refractive indices of potassium chloride plus ethanol plus waterand sodium chloride plus ethanol plus water solutions at 298.15 and 313.15K.Journal of Chemical and Engineering Data 48 (2), 405–410.
Granberg, R.A., Bloch, D.G., Rasmuson, A.C., 1999. Crystallization of paracetamol inacetone–water mixtures. Journal of Crystal Growth 198–199 (Part 2), 1287–1293.
Ho-Gutierrez, I.V., Cheluget, E.L., Vera, J.H., Weber, M.E., 1994. Liquid–liquidequilibrium of aqueous mixtures of poly(ethylene glycol) with Na2SO4 or NaCl.Journal of Chemical and Engineering Data 39 (2), 245–248.
Holmback, X., Rasmuson, A.C., 1999. Size and morphology of benzoic acid crystalsproduced by drowning-out crystallization. Journal of Crystal Growth 198–199(Part 1), 780–788.
Hulburt, H.M., Katz, S., 1964. Problems in particle technology. A statistical mechanicalformulation. Chemical Engineering Science 19, 555–574.
Jones, A.G., Mullin, J.W., 1974. Programmed cooling crystallization of potassiumsulphate solutions. Chemical Engineering Science 29 (1), 105–118.
Kaneko, S., Yamagami, Y., Tochihara, H., Hirasawa, I., 2002. Effect of supersaturationon crystal size and number of crystals produced in antisolvent crystallization.Journal of Chemical Engineering of Japan 35 (11), 1219–1223.
Kim, Y., Haam, S., Shul, Y.G., Kim, W.S., Jung, J.K., Eun, H.C., Koo, K.K., 2003.Pseudopolymorphic crystallization of L-ornithine-L-aspartate by drowning out.Industrial & Engineering Chemistry Research 42 (4), 883–889.
Kitamura, M., Nakamura, K., 2002. Dependence of polymorphic transformationon antisolvent composition and crystallization behavior of thiazole-derivativepharmaceutical. Journal of Chemical Engineering of Japan 35 (11), 1116–1122.
S. Mostafa Nowee et al. / Chemical Engineering Science 63 (2008) 5457 -- 5467 5467
Kitamura, M., Sugimoto, M., 2003. Antisolvent crystallization and transformationof thiazole-derivative polymorphs—I: effect of addition rate and initialconcentrations. Journal of Crystal Growth 257 (1–2), 177–184.
Leonard, T., Hsu, J.S.J., 1999. Bayesian Methods: An Analysis for Statisticians andInterdisciplinary Researchers. Cambridge University Press, Cambridge, U.K.
Linnikov, O.D., 2006. Spontaneous crystallization of sodium chloride fromaqueous–ethanol solutions. Part 1. Kinetics and mechanism of the crystallizationprocess. Crystal Research and Technology 41 (1), 10–17.
Mignon, D., Manth, T., Offermann, H., 1996. Kinetic modelling of batch precipitationreactions. Chemical Engineering Science 51 (11), 2565–2570.
Muhrer, G., Lin, C., Mazzotti, M., 2002. Modeling the gas antisolvent recrystallizationprocess. Industrial & Engineering Chemistry Research 41 (15), 3566–3579.
Mullin, J.W., Nyvlt, J., 1971. Programmed cooling of batch crystallizers. ChemicalEngineering Science 26 (3), 369–377.
Mydlarz, J., Jones, A.G., 1989. Growth and dissolution kinetics of potassium-sulfatecrystals in aqueous 2-propanol solutions. Chemical Engineering Science 44 (6),1391–1402.
Mydlarz, J., Jones, A.G., 1990. Potassium sulfate water–alcohols systems: compositionand density of saturated solutions. Journal of Chemical and Engineering Data 35(2), 214–216.
Mydlarz, J., Jones, A.G., 1991. Crystallization and agglomeration kinetics during thebatch drowning-out precipitation of potash alum with aqueous acetone. PowderTechnology 65 (1–3), 187–194.
Nonoyama, N., Hanaki, K., Yabuki, Y., 2006. Constant supersaturation controlof antisolvent-addition batch crystallization. Organic Process Research &Development 10 (4), 727–732.
Nowee, S.M., Abbas, A., Romagnoli, J.A., 2007. Optimization in seeded coolingcrystallization: a parameter estimation and dynamic optimization study.Chemical Engineering and Processing 46 (11), 1096–1106.
Nowee, S.M., Abbas, A., Romagnoli, J.A., 2008. Model-based optimal strategies forcontrolling particle size in antisolvent crystallization operations. Crystal Growth& Design 8 (8), 2698–2706.
Nyvlt, J., 1992. Batch salting-out crystallization. Chemical Engineering and Processing31 (1), 39–42.
Oosterhof, H., Geertman, R.M., Witkamp, G.J., van Rosmalen, G.M., 1999a. The growthof sodium nitrate from mixtures of water and isopropoxyethanol. Journal ofCrystal Growth 198–199 (Part 1), 754–759.
Oosterhof, H., Witkamp, G.J., van Rosmalen, G.M., 1999b. Some antisolvents forcrystallisation of sodium carbonate. Fluid Phase Equilibria 155 (2), 219–227.
Oosterhof, H., Witkamp, G.J., Van Rosmalen, G.M., 2001. Antisolvent crystallizationof anhydrous sodium carbonate at atmospheric conditions. A.I.Ch.E. Journal 47(3), 602–608.
Process System Enterprise Ltd., 2001. gPROMS Advanced User Guide, UK.Rawlings, J.B., Miller, S.M., Witkowski, W.R., 1993. Model identification and control of
solution crystallization processes: a review. Industrial & Engineering ChemistryResearch 32 (7), 1275–1296.
Taboada, M.E., Graber, T.A., Asenjo, J.A., Andrews, B.A., 2000. Drowning-outcrystallisation of sodium sulphate using aqueous two-phase systems. Journal ofChromatography, B: Biomedical Sciences and Applications 743 (1+2), 101–105.
Tai, C.Y., Cheng, C.S., 1998. Supersaturation and crystal growth in gas antisolventcrystallization. Journal of Crystal Growth 183 (4), 622–628.
Takiyama, H., Otsuhata, T., Matsuoka, M., 1998. Morphology of NaCl crystalsin drowning-out precipitation operation. Chemical Engineering Research andDesign 76 (A7), 809–814.
Toth, J., Kardos-Fodor, A., Halasz-Peterfi, S., 2005. The formation of fine particlesby salting-out precipitation. Chemical Engineering and Processing; PneumaticConveying and Handling of Particulate Solids 44 (2), 193–200.
Yeo, P., Abbas, A., Foddi, O., Romagnoli, J.A., 2007. In-situ measurement of NaClsolubility in mixed solvent system using laser-based measurement, submittedfor publication.
Yu, Z.Q., Tan, R.B.H., Chow, P.S., 2005. Effects of operating conditions onagglomeration and habit of paracetamol crystals in antisolvent crystallization.Journal of Crystal Growth 279 (3–4), 477–488.
Yu, Z.Q., Chow, P.S., Tan, R.B.H., 2006. Seeding and constant-supersaturationcontrol by ATR-FTIR in antisolvent crystallization. Organic Process Research &Development 10 (4), 717–722.
Zhou, G.X., Fujiwara, M., Woo, X.Y., Rusli, E., Tung, H.H., Starbuck, C., Davidson, O., Ge,Z., Braatz, R.B., 2006. Direct design of pharmaceutical antisolvent crystallizationthrough concentration control. Crystal Growth & Design 6 (4), 892–898.