Elementary Students' Understanding of Geometrical ... - ERIC
Upload
independentCategory
view
3download
0
1
A SIMULATION TOOL FOR GEOMETRICAL ANALYSIS AND OPTIMIZATION
OF FUEL CELL BIPOLAR PLATES. DEVELOPMENT AND VALIDATION
Alfredo Iranzo*a, Felipe Rosab, Eduardo Lópezb, Fco Javier Pinoc, Luis Valverdea,
Pablo Bermejoa
aAICIA, ESI, Camino Descubrimientos s/n, 41092 Sevilla, Spain, [email protected]
bINTA, 21130 Mazagón (Huelva), Spain, [email protected], [email protected]
cEscuela Sup. Ingenieros, Camino Descubrimientos s/n, 41092 Sevilla, Spain, [email protected]
*Corresponding author: Tel. (+34) 954 487471. Fax. (+34) 954 487247
ABSTRACT
Bipolar plates (BPs) are one of the most important components in Proton Exchange
Membrane Fuel Cells (PEMFC) due the numerous functions they perform. The
objective of the research work described in this paper is to develop a simplified and
validated method based on Computational Fluid Dynamics (CFD), aimed to the analysis
and study of the influence of geometrical parameters of BPs in the operation of a cell. A
complete sensibility analysis of the influence of dimensions and shape of the BP can be
obtained through a simplified CFD model without including the complexity of other
components of the PEMFC. This model is compared with the PEM Fuel Cell Module of
the FLUENT software, which includes the physical and chemical phenomena relevant
in PEMFCs. Results with both models regarding the flow field inside the channels and
local current densities are obtained and compared. The results show that it is possible to
use the simple model as a standard tool for geometrical analysis of BPs, and results of a
sensitivity analysis using the simplified model are presented and discussed.
2
KEYWORDS
Fuel Cell, Simulation Tool, Bipolar Plate, Computational Fluid Dynamics.
1. INTRODUCTION
Bipolar Plates are very significant devices in the operation of fuel cells as final
performance and cost will depend on the design of this component. The current design
of BPs consists of machining channels with rectangular section. One of the main
functions of BPs is to distribute the reactant gases in a homogeneous way over the
catalytic surface. Hence, channel dimensions and flow field designs have an important
influence in the global efficiency of the cell. It is therefore necessary to analyse how the
BPs geometry affects the performance of a fuel cell, in particular regarding pressure
drop, water management and fuel consumption [1,2].
Software tools are widely used to evaluate the flow behaviour in the channels of BPs. In
this paper, a simplified CFD model aimed to the analysis of geometrical influence of
BPs in fuel cell is presented and validated against results provided by a more
sophisticated tool, the PEMFC Module of FLUENT software. This CFD tool models the
electrochemistry, mass and current continuity, liquid water generation and transport,
membrane humidification, electric losses, energy evacuation and other phenomena [3].
Therefore it constitutes an appropriate tool to validate the assumptions of the simplified
model developed by AICIA. The objective of this paper is to verify that the simplified
model is an appropriate tool to study how the BP design influences the PEMFC
efficiency. The model is used to perform a sensitivity analysis of channel dimensions
and flow field configurations, and the results obtained are discussed.
3
2. SOLUTION METHOD AND MODEL DESCRIPTION
The simplified CFD model is designed for steady state operation and isothermal
conditions, and supplies information about the influence of BPs geometry without
including the complex phenomena that occur in the MEA. The model solves the
continuity and momentum equations and has been successfully used to optimize BPs
geometry [4,5].
In order to compare the results from the developed simplified model and the FLUENT
PEMCF Module, a bipolar plate design have been established and solved with both
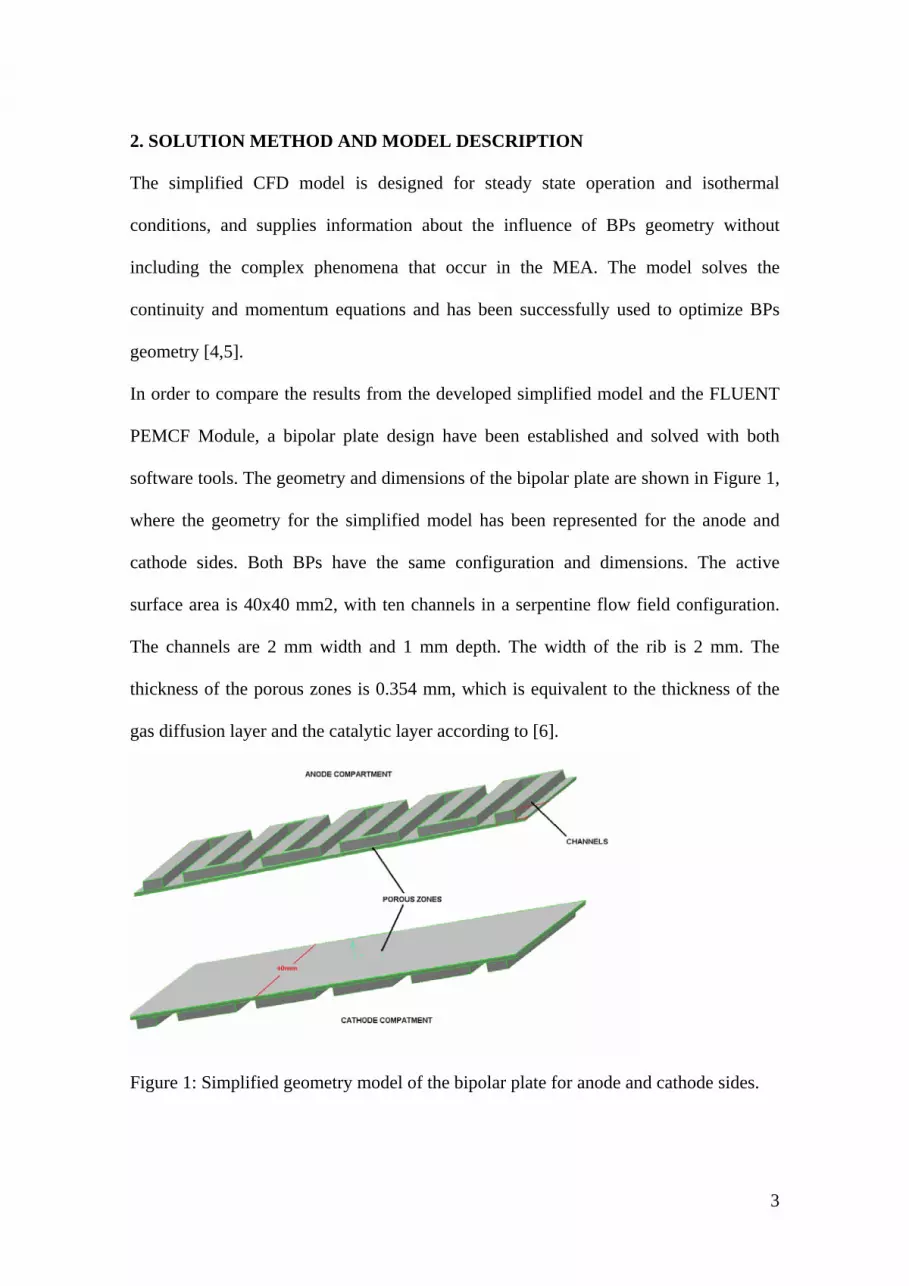
software tools. The geometry and dimensions of the bipolar plate are shown in Figure 1,
where the geometry for the simplified model has been represented for the anode and
cathode sides. Both BPs have the same configuration and dimensions. The active
surface area is 40x40 mm2, with ten channels in a serpentine flow field configuration.
The channels are 2 mm width and 1 mm depth. The width of the rib is 2 mm. The
thickness of the porous zones is 0.354 mm, which is equivalent to the thickness of the
gas diffusion layer and the catalytic layer according to [6].
Figure 1: Simplified geometry model of the bipolar plate for anode and cathode sides.
4
2.1. Model assumptions
The simplified model is based on two main assumptions:
First, that the current density generated in anode side is proportional to the hydrogen
velocity in the consumption direction in the anode catalytic layer. This assumption
allows for the calculation of the distribution of current density over the anode electrode
surface, from the gas velocity distribution.
Secondly, that the current density generated in both sides (anode and cathode) are
identical for corresponding locations in the anode and cathode catalytic layers. This
assumption is used to calculate the current density of cathode side.
The methodology used to perform an analysis is the following. First, the anode side
model is created and solved, and the gas velocity in the consumption direction at the
electrode surface is stored and used to calculate the corresponding oxygen consumption
in the cathode side model [4,5]. Here, the described model assumptions are used. Then,
the cathode side model is defined with the calculated boundary conditions and finally
solved. By using this approach, parametric analysis and BPs geometry optimization can
be performed in a straightforward manner.
2.2. Anode compartment model
The base case for the validation work consists of an anode BP model and the
corresponding cathode BP model, with a serpentine flow field design with one inlet and
one exit, and 1 mm width channels. Below the channels a porous zone (GDL or Gas
Diffusion Layer) with a viscous resistance is modelled. The outlet of the GDL region,
corresponding to the catalytic layer, accounts for the hydrogen consumption by
5
imposing the gas consumption. The layer thickness and transport properties are defined
according to the literature [6,7].
Using this model as a base case a detailed analysis of the geometry of the BP can be
performed, as different modifications of the flow-field design can be compared
(serpentine, parallel, pin type, etc.) The effect of varying the dimensions of the channels
and ribs can also be analysed.
2.3. Cathode compartment model
The model for the cathode side is geometrically identical to the anodic model. However,
boundary conditions are different and new physical phenomena such as water removal
and multiphase flow must be considered.
The cathode side model consists of three main control volumes: channels, GDL and
catalytic layer. GDL and catalytic layer are included in order to model oxygen
consumption and water production [8]. The layer thickness and transport properties are
defined according to the literature [6,7].
2.4. Boundary Conditions
Anode consumption and anode channel inlet: For validation purposes the anode
reactant consumption and channel inlet mass flows are calculated according to typical
operating conditions. Current density of PEM fuel cells varies between 2000 and 7000
A m-2. In order to determine the consumption an average current density of 5000 A m-2
is imposed, and using an experimental ‘voltage-current curve’ a voltage of 0.64 V has
then been established. The power density of the cell is therefore 3.78 kW m-2. Currently
a fuel cell needs around 1.0 Nm3 of pure hydrogen to produce 1.8-1.9 kW, while around
6
30% or 40% is lost in the operation. Thus, a hydrogen consumption of 1.05E-7 kg s-1 is
considered. It is established that all the hydrogen entering in the cell is consumed, so
1.05E-7 kg s-1 of hydrogen must be introduced. By using a psychometric chart of the
hydrogen-water vapour mixture the absolute humidity depending on the inlet
temperature is obtained, obtaining the gas mixture mass flow at the anode inlet, 2.36E-7
kg s-1.
Cathode consumption and cathode channel inlet: The oxygen consumption rate is
calculated from the hydrogen consumption densities calculated in the analysis of the
anodic compartment. By applying the overall reaction that takes place on the catalytic
layer, the according stoichiometric consumption densities of oxygen are obtained. The
quantity of necessary humidified air to consume the stoichiometric oxygen is then
calculated. An excess of 2.5 of oxidizing gas at the inlet is imposed, a value typically
used for ensuring water removal.
Liquid water generation
In order to model the water removal without including the complex physical phenomena
within the cell, the liquid water generated is imposed to appear over the channel-GDL
interface, and it is defined as a volumetric source of liquid water proportional to the
oxygen consumption rate.
3. MODEL VALIDATION As described in Section 2, the simplified model has been developed using two main
assumptions. In this section, this model is compared against the PEM Fuel Cell Module
of FLUENT in order to verify the appropriateness of the assumptions.

7
The first assumption considers that the current density is proportional to the gas velocity
in the consumption direction over the anode-electrode surface. In order to verify this a
magnitude K(x,y) is created in the FLUENT PEMFC Module results, and defined as the
ratio between the gas velocity in the consumption direction and the current density in
the anode catalytic layer. K(x,y) should be constant for all the points (x,y) on the
working surface. Figure 2 shows the distribution of both magnitudes over the electrode
surface. The current density distribution -at the left- shows that most of the consumption
starts in the middle of the hydrogen path until the outlet. Something similar can be
noticed in the gas velocity distributions.
Figure 2: Distribution of current density (left) and z-velocity (right) over the anode
electrode surface. FLUENT PEMFC Module results.
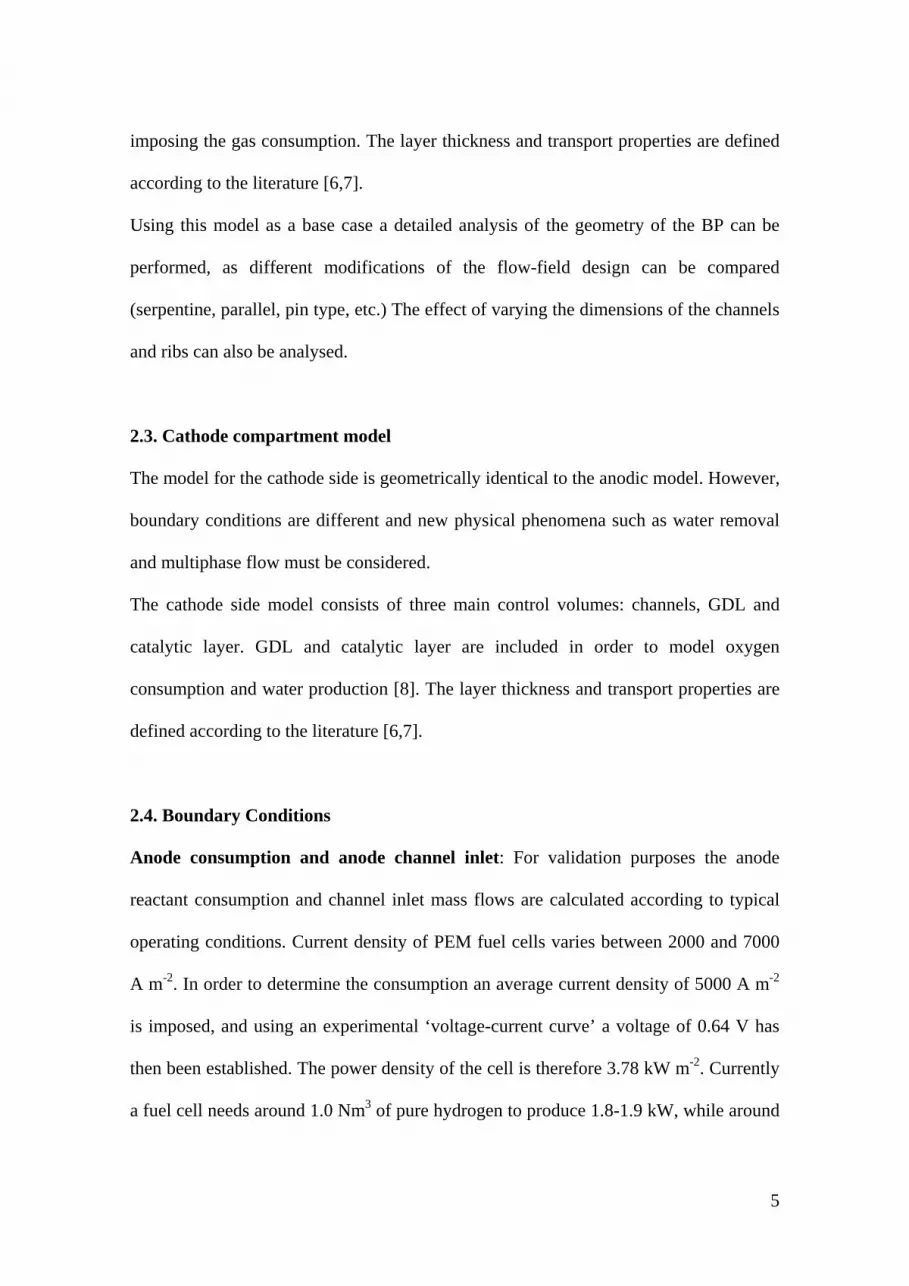
The distribution of K(x,y) divided by its mean value (K Km-1) is represented in Figure 3.
An important dependency of K(x,y) with the location is observed, especially at the inlet
zone. Therefore it is not possible to affirm that the assumption is valid, but as can be
seen in Figure 3, velocities over the consumption surface are in general an excellent
parameter to analyse the utilisation of the whole area of MEA.
8
Figure 3: Distribution of K(x,y) Km-1 over the anode electrode surface. FLUENT
PEMFC Module results.
The second assumption is used to calculate the real oxygen consumption on the cathode
compartment. The oxygen consumed locally can be calculated from local current
density over anode electrode surface, as it is established that distributions on both the
anode and cathode electrode surfaces are identical.
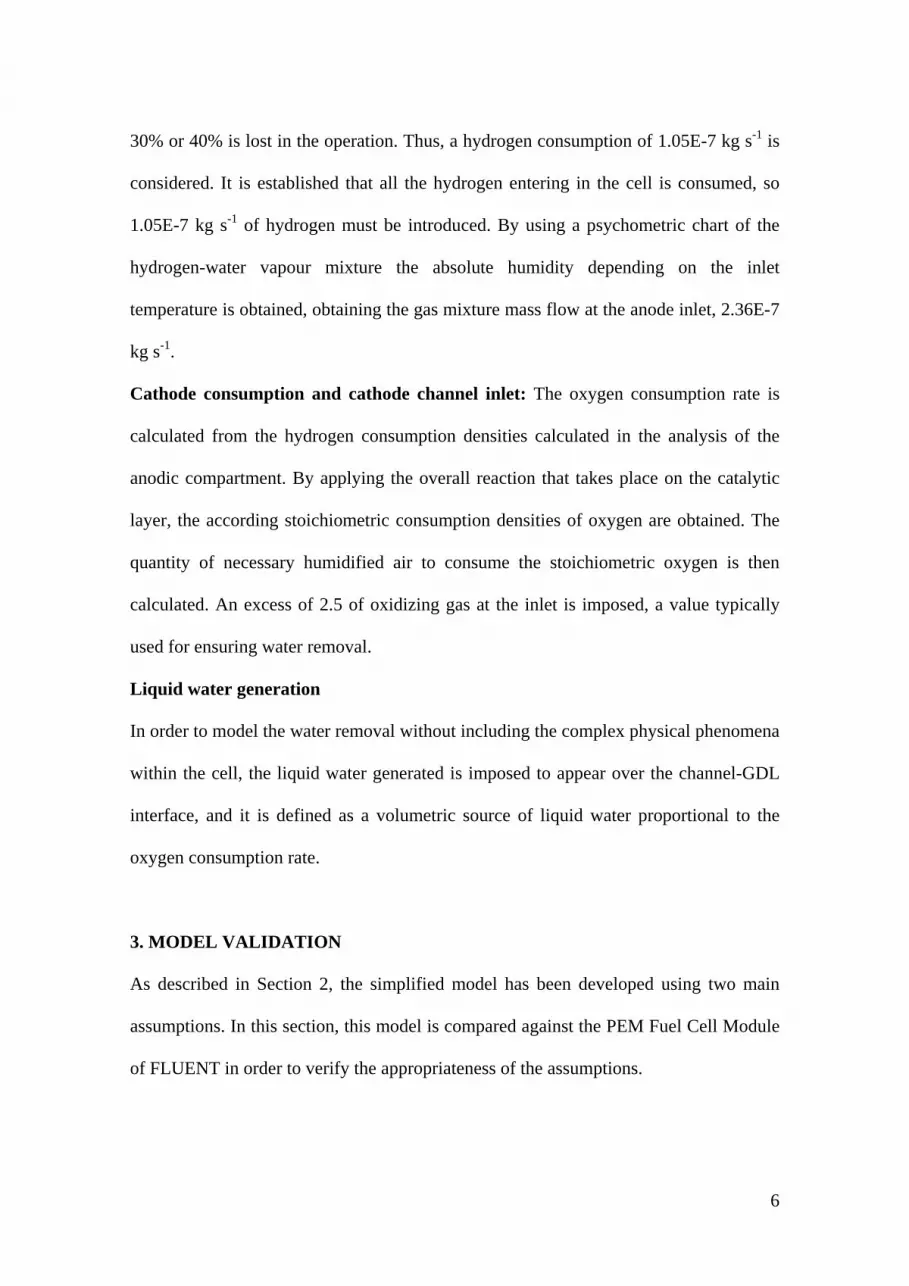
In order to verify this, the current densities in both surfaces are calculated using the
PEMFC Module of FLUENT, and the function h(x,y) is created and defined as the ratio
between the anode current density and the cathode current density. The values of h for
every location (x,y) must be the unity. Figure 4 represents this magnitude. Maximum
and minimum values are 1.008 and 0.992, respectively. Hence, it is verified that for
every point of the active surface, the values of current densities in both electrode
surfaces, can be considered to be identical.
9
Figure 4: Distribution of h(x,y) over the anode electrode surface. FLUENT PEMFC
Module results.
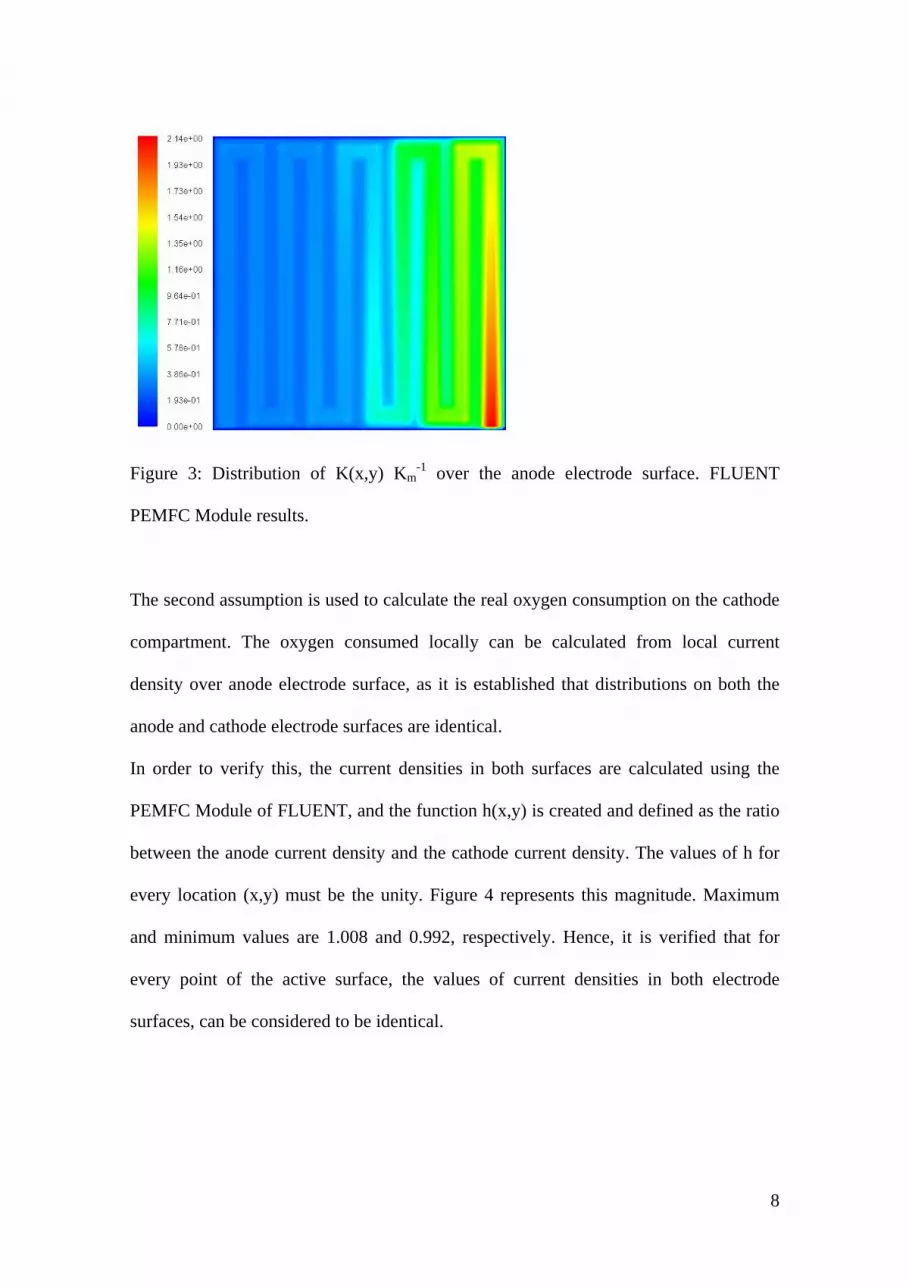
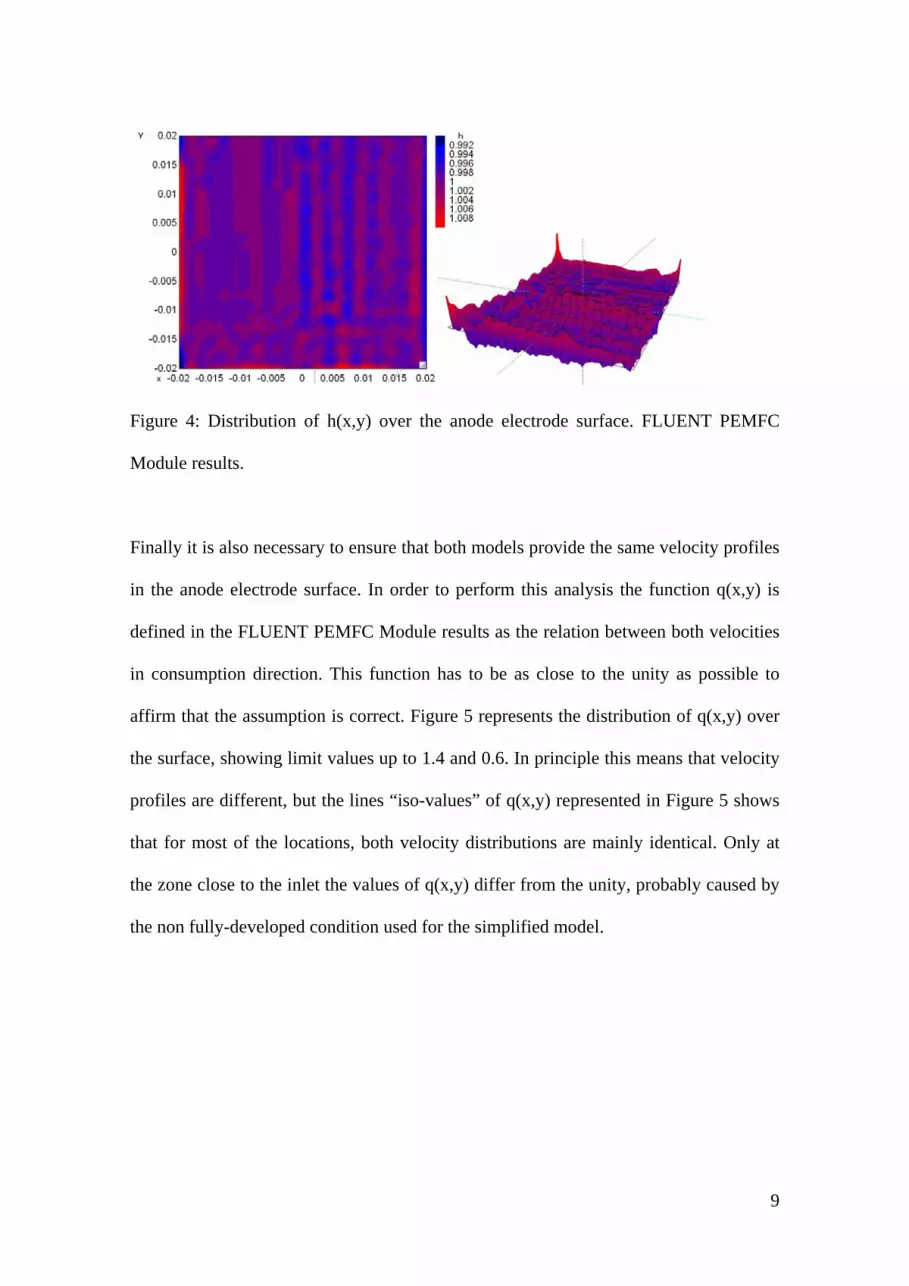
Finally it is also necessary to ensure that both models provide the same velocity profiles
in the anode electrode surface. In order to perform this analysis the function q(x,y) is
defined in the FLUENT PEMFC Module results as the relation between both velocities
in consumption direction. This function has to be as close to the unity as possible to
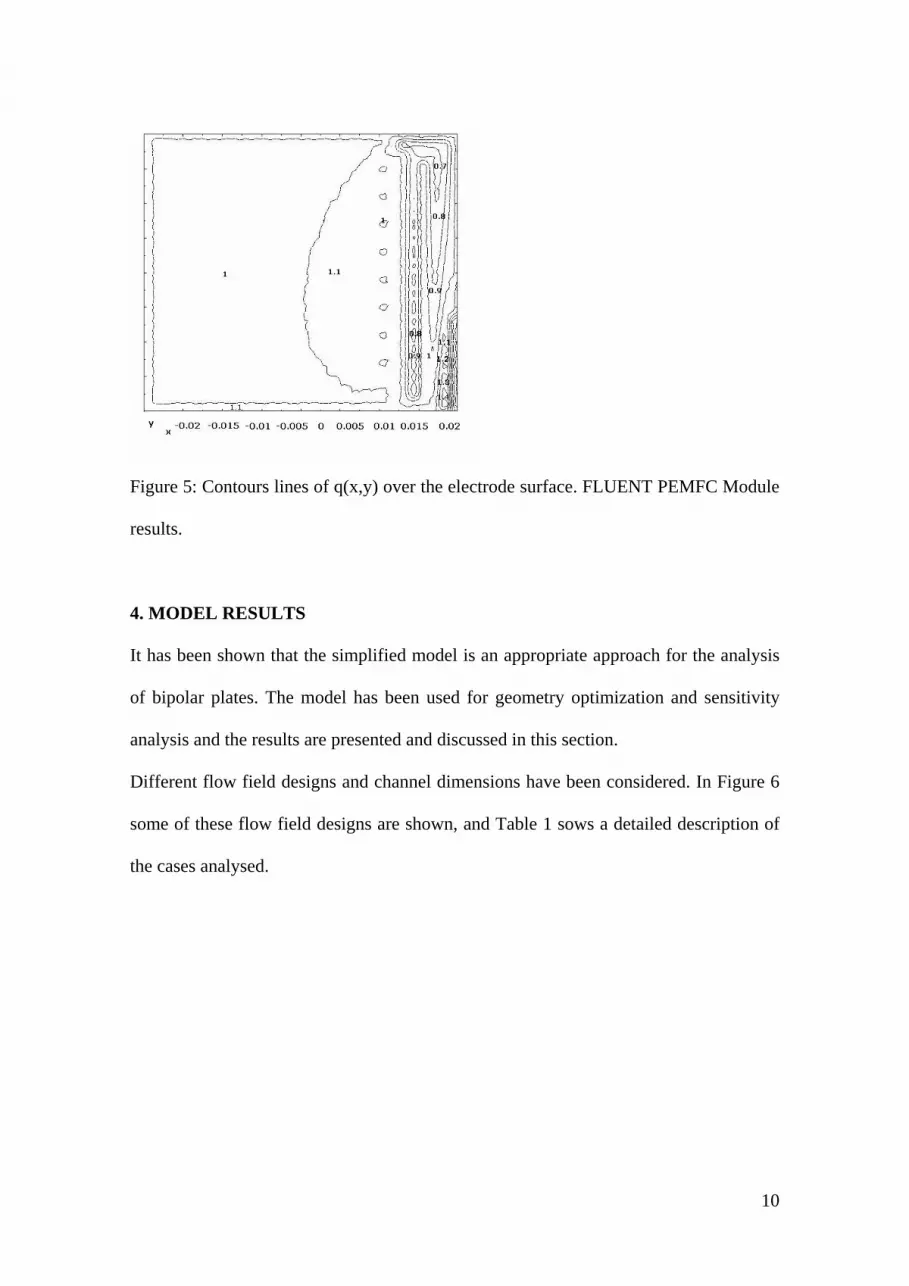
affirm that the assumption is correct. Figure 5 represents the distribution of q(x,y) over
the surface, showing limit values up to 1.4 and 0.6. In principle this means that velocity
profiles are different, but the lines “iso-values” of q(x,y) represented in Figure 5 shows
that for most of the locations, both velocity distributions are mainly identical. Only at
the zone close to the inlet the values of q(x,y) differ from the unity, probably caused by
the non fully-developed condition used for the simplified model.
10
Figure 5: Contours lines of q(x,y) over the electrode surface. FLUENT PEMFC Module
results.
4. MODEL RESULTS
It has been shown that the simplified model is an appropriate approach for the analysis
of bipolar plates. The model has been used for geometry optimization and sensitivity
analysis and the results are presented and discussed in this section.
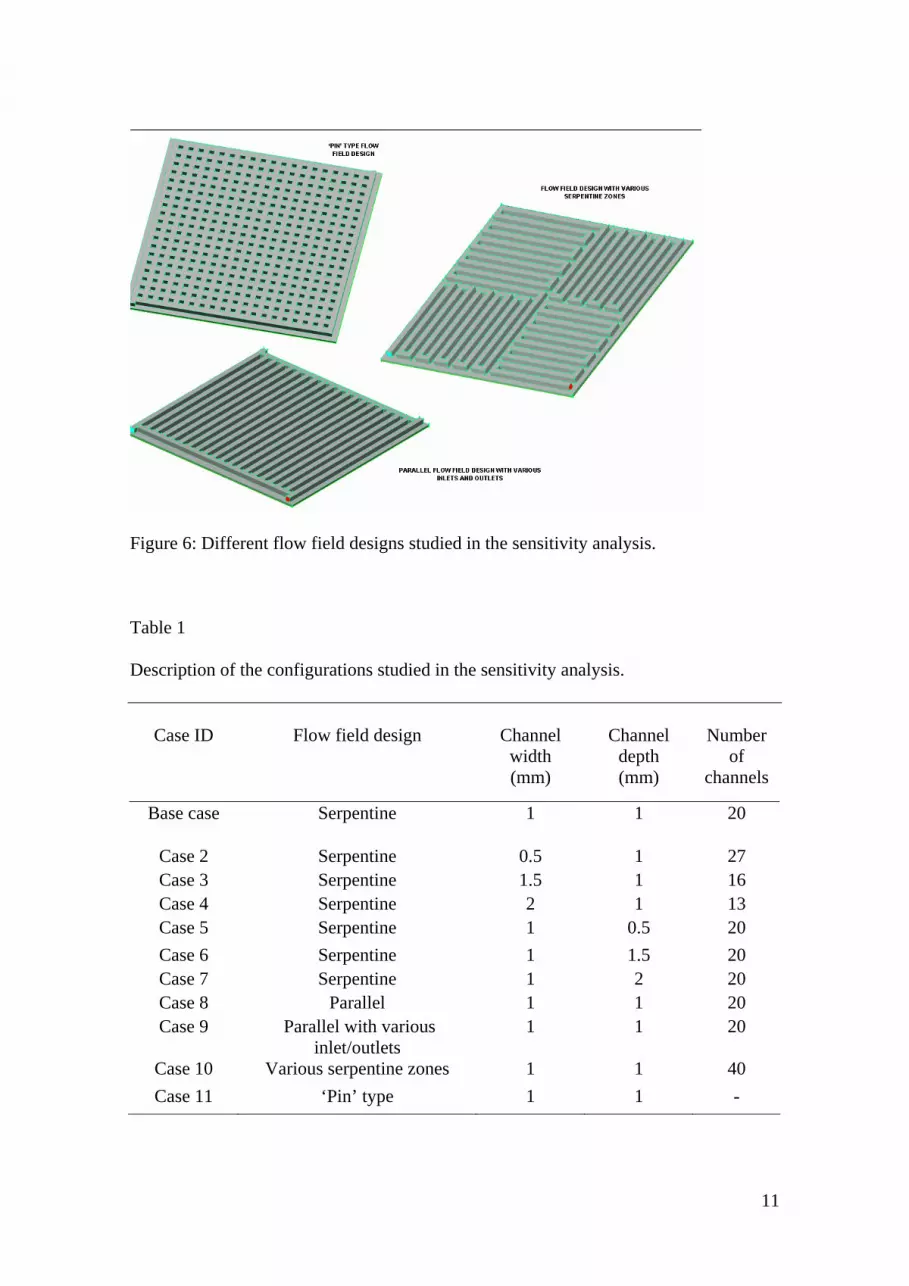
Different flow field designs and channel dimensions have been considered. In Figure 6
some of these flow field designs are shown, and Table 1 sows a detailed description of
the cases analysed.
11
Figure 6: Different flow field designs studied in the sensitivity analysis.
Table 1
Description of the configurations studied in the sensitivity analysis.
Case ID Flow field design Channel
width (mm)
Channel depth (mm)
Number of
channels
Base case Serpentine 1 1 20
Case 2 Serpentine 0.5 1 27 Case 3 Serpentine 1.5 1 16 Case 4 Serpentine 2 1 13 Case 5 Serpentine 1 0.5 20 Case 6 Serpentine 1 1.5 20 Case 7 Serpentine 1 2 20 Case 8 Parallel 1 1 20 Case 9 Parallel with various
inlet/outlets 1 1 20
Case 10 Various serpentine zones 1 1 40 Case 11 ‘Pin’ type 1 1 -
12
4.1. Sensitivity Analysis of Channel Dimensions
First, the effect of the main channel dimensions haven been studied by comparing the
results obtained from the different cases with the base case.
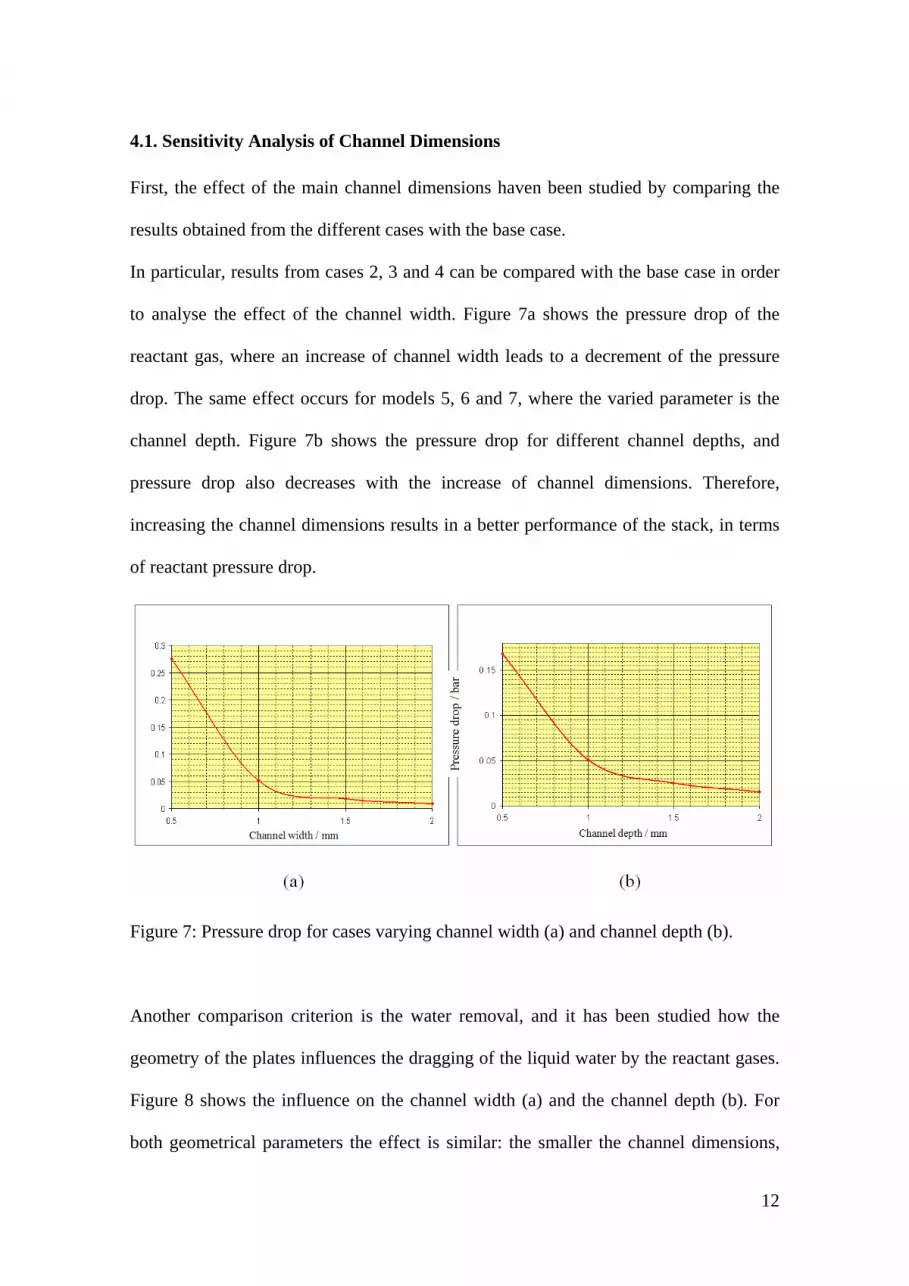
In particular, results from cases 2, 3 and 4 can be compared with the base case in order
to analyse the effect of the channel width. Figure 7a shows the pressure drop of the
reactant gas, where an increase of channel width leads to a decrement of the pressure
drop. The same effect occurs for models 5, 6 and 7, where the varied parameter is the
channel depth. Figure 7b shows the pressure drop for different channel depths, and
pressure drop also decreases with the increase of channel dimensions. Therefore,
increasing the channel dimensions results in a better performance of the stack, in terms
of reactant pressure drop.
Figure 7: Pressure drop for cases varying channel width (a) and channel depth (b).
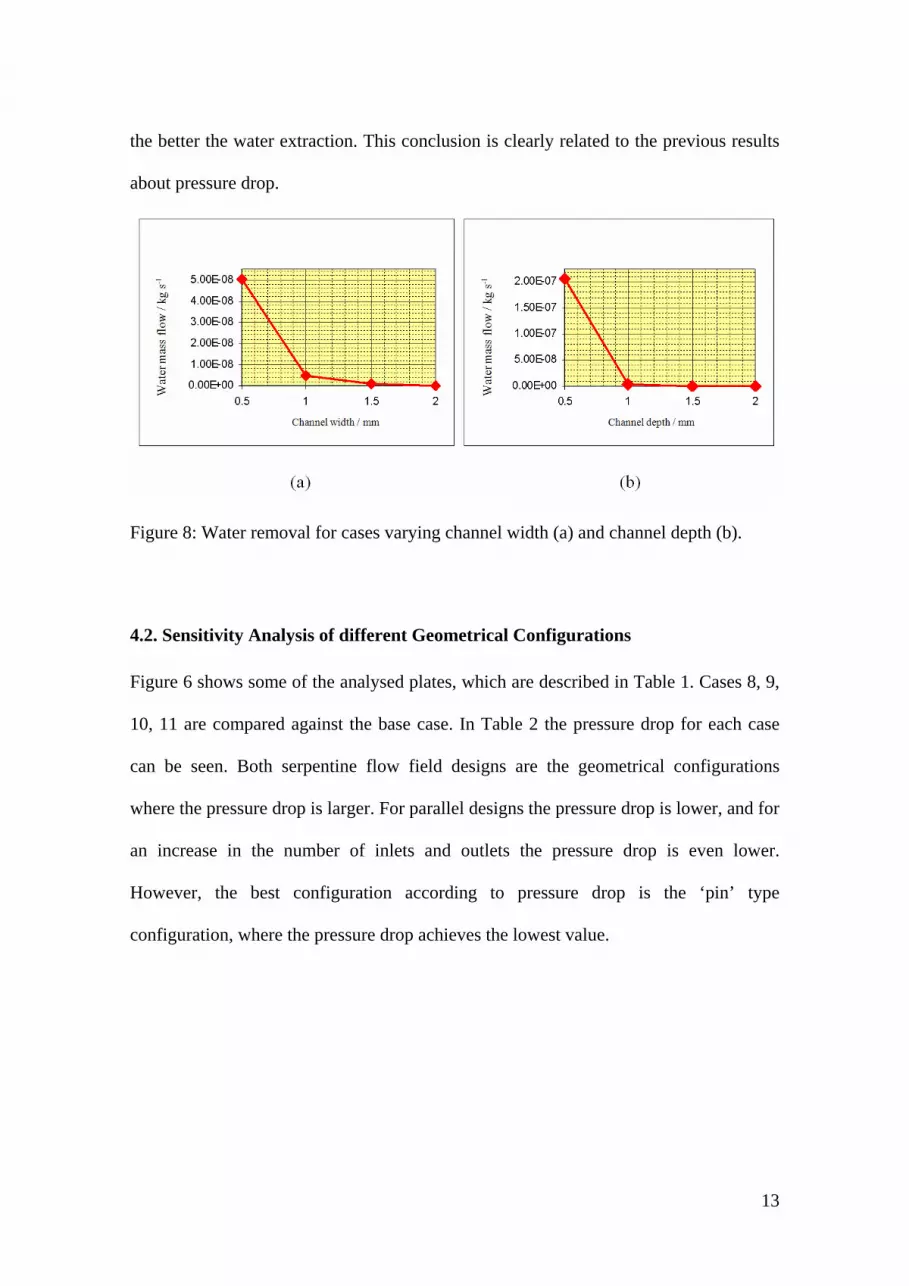
Another comparison criterion is the water removal, and it has been studied how the
geometry of the plates influences the dragging of the liquid water by the reactant gases.
Figure 8 shows the influence on the channel width (a) and the channel depth (b). For
both geometrical parameters the effect is similar: the smaller the channel dimensions,
13
the better the water extraction. This conclusion is clearly related to the previous results
about pressure drop.
Figure 8: Water removal for cases varying channel width (a) and channel depth (b).
4.2. Sensitivity Analysis of different Geometrical Configurations
Figure 6 shows some of the analysed plates, which are described in Table 1. Cases 8, 9,
10, 11 are compared against the base case. In Table 2 the pressure drop for each case
can be seen. Both serpentine flow field designs are the geometrical configurations
where the pressure drop is larger. For parallel designs the pressure drop is lower, and for
an increase in the number of inlets and outlets the pressure drop is even lower.
However, the best configuration according to pressure drop is the ‘pin’ type
configuration, where the pressure drop achieves the lowest value.
14
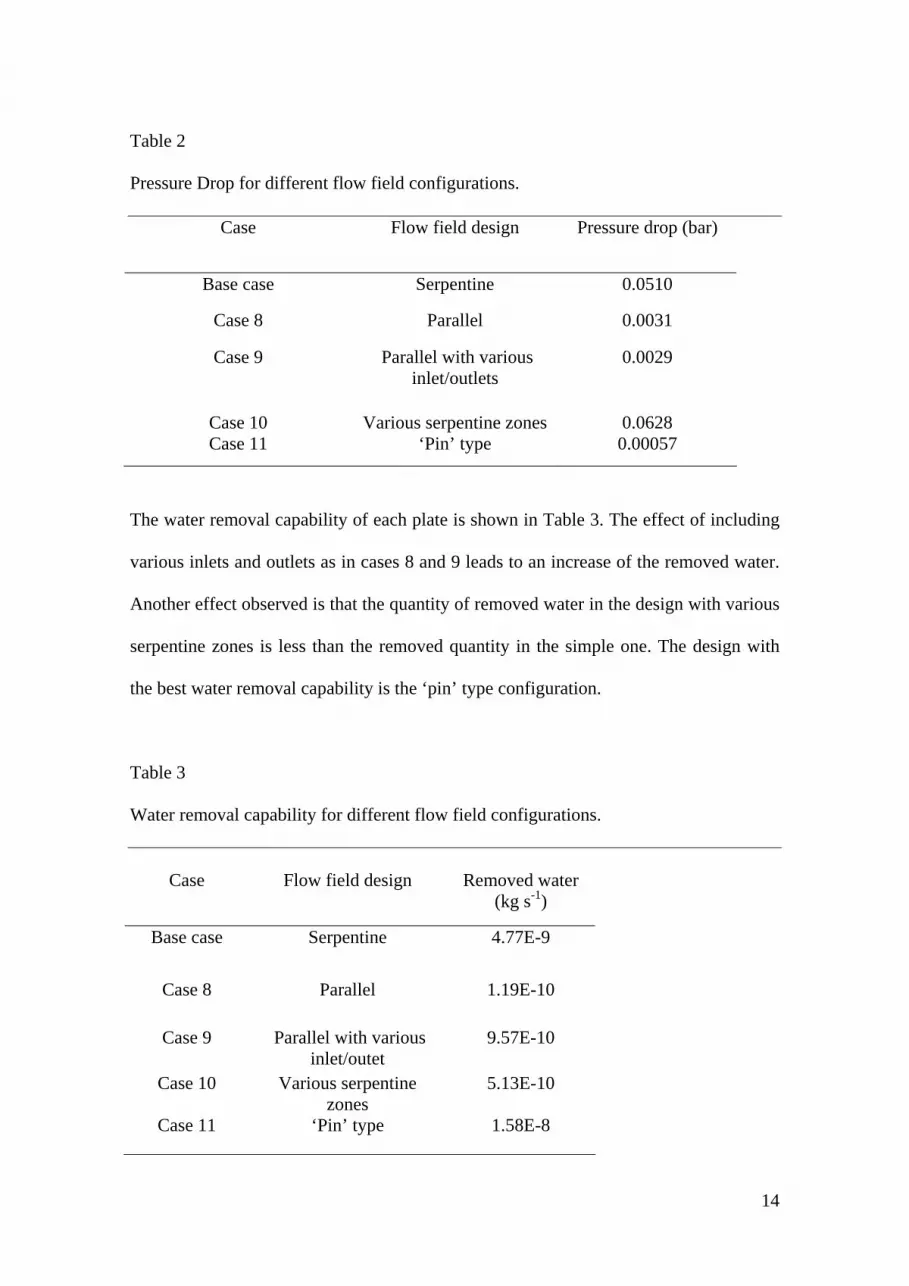
Table 2
Pressure Drop for different flow field configurations.
Case Flow field design Pressure drop (bar)
Base case Serpentine 0.0510
Case 8 Parallel 0.0031
Case 9 Parallel with various inlet/outlets
0.0029
Case 10 Various serpentine zones 0.0628 Case 11 ‘Pin’ type 0.00057
The water removal capability of each plate is shown in Table 3. The effect of including
various inlets and outlets as in cases 8 and 9 leads to an increase of the removed water.
Another effect observed is that the quantity of removed water in the design with various
serpentine zones is less than the removed quantity in the simple one. The design with
the best water removal capability is the ‘pin’ type configuration.
Table 3
Water removal capability for different flow field configurations.
Case Flow field design Removed water
(kg s-1)
Base case Serpentine 4.77E-9
Case 8 Parallel 1.19E-10
Case 9 Parallel with various inlet/outet
9.57E-10
Case 10 Various serpentine zones
5.13E-10
Case 11 ‘Pin’ type 1.58E-8
15
5. CONCLUSIONS
The objective of this paper is to validate the simplified CFD fuel cell model developed
by AICIA. The model is aimed to analyse the influence of the geometry and dimension
of BPs in the operation of the cell. The way to verify the accuracy and feasibility of this
model consists of ensuring that the used hypotheses are correct, and in order to analyse
these hypotheses the Model of PEM fuel cell of Fluent is used.
The results shows that the simplified model provide the same velocity profiles than the
PEMFC Model implemented in FLUENT, with some differences in the zones close to
the channel inlet. The second assumption of equality of current density distribution has
been also correctly verified. However, it is not possible to validate the first assumption.
The analysis of the relation between current density and velocity in consumption
direction reveals that this magnitude is not constant in every point of the electrode
surface. Despite this, the model can be used with confidence for the analysis of the
influence of the geometry of the BPs, and the velocity distribution over the anode
electrode surface is an appropriate index to evaluate the homogeneity of the use of the
area of the MEA.
According to the results obtained with the simplified model for different BPs
geometries, reduced channel dimensions increases pressure drop and improve water
removal. Various flow field designs of plates have been tested and it can be observed
that including various inlets and outlets decreases the pressure drop and improves water
management. The serpentine flow field design is in general less favourable, and the

16
‘pin’ type is an appropriate design according to the comparison criteria analysed in this
study.
6. ACKNOWLEDGMENTS
This Project has been founded by INTA.
7. REFERENCES
[1] X. Li, I. Sabir, International Journal of Hydrogen Energy, 30 (2005) 359-371.
[2] W. Sun, B.A. Peppley, K. Karan, Journal Power Sources, 144 (2005) 42-53.
[3] FLUENT 6.2 Documentation. Fluent Inc., Lebanon, New Hampshire (2005).
[4] J.J. Martínez, F.J. Pino, F. Rosa, 16th World Hydrogen Energy Conference (2006).
[5] J.J.Martínez, F. Rosa, F.J. Pino, 2nd European Hydrogen Energy Conference (2005).
[6] S. Um, C.Y. Wang, Journal Power Sources, 125 (2004) 40–51.
[7] D. Natarajan, T.V. Nguyen, Jounal Power Sources, 115 (2003) 66-80.
[8] U. Pasaogullari, C.Y. Wang. Journal of Polymer Electrolyte Fuel Cells, (2004).
Copyright © 2022 FDOKUMEN