Real-Time Diagnosis of Soil Solution of Cucumber ... - JIRCAS
7
Real-Time Diagnosis of Soil Solution of Cucumber in Protected Cultivation Using Compact Nitrate Ion-Meter Kazuo ROPPONGI and Haruhito YAMAZAKI Department of Horticultural Environment, Saitama Horticultural Experiment Station (Kuki, Saitama, 346 Japan) Abstract To develop a technique for efficiently managing fertilizer application for cucumbers in protected cultivation, real-time diagnosis of the soil solution was examined by using simple instruments to obtain the nitrate content of the soil solution as an indicator. As a result, since the value of the nitrate content measured in the soil solution using a compact nitrate ion- meter was comparable to the value measured by the phenolsulfuric acid method, it became possible to use a compact nitrate ion-meter to measure the nitrate content of the soil solution in the field. Also, based on the relation between the nitrate content of the soil solution and the yield of cucumber fruit, to secure stable production, the nitrate content in the soil solution should range from 400 to 800 mg・L -1 during the harvest period for semi-forcing and retarding cultures. Discipline: Soils, fertilizers and plant nutrition Additional key words: semi-forcing culture, retarding culture JARQ 32, 15-21 (1998) Introduction Most of the fruit vegetables are cultivated in green- houses, where they are subjected to the application of large amounts of fertilizers and there is no leach- ing of nutrients from natural rainfall. The combi- nation of these effects leads to the accumulation of nutrients over the optimum quantity in the soil. Therefore, during the cultivation period, accurate management of fertilization requires that the soil nutrients be maintained appropriately. For accurate management of fertilization, it is essential to develop methods for real-time soil diag- nosis to determine the nutrient conditions of soil in the field and to apply fe rtilizers when necessary. Recently, kits for measuring the nitrate content in soil as well as tools for collecting the soil solution have been developed and are available commercially 2 > for use during the cultivation period. Then, by determing the standard value of nitrate for accurate management of fertilization, fertilizer can be applied efficiently, based on real-time soil diagnosis. In the present study, for cucumbers in protected cultiva- tion, the nitrate content in the soil solution of plots with a different quantity of nitrogen was measured for real-time diagnosis. Based on the relation be- tween the nitrate content in the soil solution and the cucumber yield, the nitrate content in the soil solution required to achieve stable production was determined. Experimental methods 1) Outline of cultivation, design of experimental plots Tests on cucumbers in semi-forcing or retarding culture were carried out in a greenhouse of Saitama Horticulture Experiment Station in 1993. Cucum- bers were planted on February 16 for semi-forcing culture and August 30 for retarding culture. To con- trol the growth, the primary scaffold branch was pinched back at the 21st node and the lateral branch at the 3rd node, and from the time of planting to the end of harvest, the plants were irrigated at inter- vals of 10 days. For semi-forcing culture, heaters were used from the time of planting in February to May, and minimum night-time temperatures were maintained at above 13 °C . For both semi-forcing and retarding cultures, the top ventilator was opened whenever the temperatures inside the house reached 28 °C. Harvest in semi-forcing culture was started on April I. The harvest period lasted for 90 days from April to June. Harvest in retarding culture
-
Upload
khangminh22 -
Category
Documents
-
view
1 -
download
0
Transcript of Real-Time Diagnosis of Soil Solution of Cucumber ... - JIRCAS
Real-Time Diagnosis of Soil Solution of Cucumber in Protected Cultivation Using Compact Nitrate Ion-Meter
Kazuo ROPPONGI and Haruhito YAMAZAKI
Department of Horticultural Environment, Saitama Horticultural Experiment Station(Kuki, Saitama, 346 Japan)
Abstract
To develop a technique for efficiently managing fertilizer application for cucumbers in protected cultivation, real-time diagnosis of the soil solution was examined by using simple instruments to obtain the nitrate content of the soil solution as an indicator. As a result, since the value of the nitrate content measured in the soil solution using a compact nitrate ion-meter was comparable to the value measured by the phenolsulfuric acid method, it became possible to use a compact nitrate ion-meter to measure the nitrate content of the soil solution in the field. Also, based on the relation between the nitrate content of the soil solution and the yield of cucumber fruit, to secure stable production, the nitrate content in the soil solution should range from 400 to 800 mg・L-1 during the harvest period for semi-forcing and retarding cultures.
Discipline: Soils, fertilizers and plant nutritionAdditional key words: semi-forcing culture, retarding culture
JARQ 32, 15-21 (1998)
Introduction
Most of the fruit vegetables are cultivated in greenhouses, where they are subjected to the application of large amounts of fertilizers and there is no leaching of nutrients from natural rainfall. The combination of these effects leads to the accumulation of nutrients over the optimum quantity in the soil. Therefore, during the cultivation period, accurate management of fertilization requires that the soil nutrients be maintained appropriately.
For accurate management of fertilization, it is essential to develop methods for real-time soil diagnosis to determine the nutrient conditions of soil in the field and to apply fertilizers when necessary.
Recently, kits for measuring the nitrate content in soil as well as tools for collecting the soil solution have been developed and are available commercially2>
for use during the cultivation period. Then, by determing the standard value of nitrate for accurate management of fertilization, fertilizer can be applied efficiently, based on real-time soil diagnosis. In the present study, for cucumbers in protected cultivation, the nitrate content in the soil solution of plots with a different quantity of nitrogen was measured for real-time diagnosis. Based on the relation be-
tween the nitrate content in the soil solution and the cucumber yield, the nitrate content in the soil solution required to achieve stable production was determined.
Experimental methods
1) Outline of cultivation, design of experimental plots
Tests on cucumbers in semi-forcing or retarding culture were carried out in a greenhouse of Saitama Horticulture Experiment Station in 1993. Cucumbers were planted on February 16 for semi-forcing culture and August 30 for retarding culture. To control the growth, the primary scaffold branch was pinched back at the 21st node and the lateral branch at the 3rd node, and from the time of planting to the end of harvest, the plants were irrigated at intervals of 10 days. For semi-forcing culture, heaters were used from the time of planting in February to May, and minimum night-time temperatures were maintained at above 13°C. For both semi-forcing and retarding cultures, the top ventilator was opened whenever the temperatures inside the house reached 28°C. Harvest in semi-forcing culture was started on April I. The harvest period lasted for 90 days from April to June. Harvest in retarding culture
16
started in September 30 and the harvest period lasted for 60 days from October to November.
The lest plots consisted of a standard plot, a plot with nitrogen application 0.5 times that of the standard plot (hereafter referred to as N 0.5 plot), a plot with nitrogen application 1.5 times that of the standard plot (hereafter referred lo as N I .5 plot), and, to simplify topdressing, a plot with coated fertilizer nitrogen of 140-day type (hereafter referred to as CFN plot) and compound fertilizer as basal application.
Topdressing on the standard plot, N 0.5 plol, N 1.5 plot was carried out 4 times at intervals of 3 weeks after the beginning of harvest in semi-forcing culture, 3 times at intervals of 3 weeks after the beginning of harvest in retarding culture.
Topdressing in semi-forcing culture was conducted on April I, April 21, May JO, June I, and in retarding culture on October l, October 20, November 10. Also, the quantity of nitrogen or potassium used for each topdressing in semi-forcing culture was 50 kg,ha- 1 and in retarding culture 33 - 34 kg,ha- 1•
The design of the test plots is shown in Table I and the schedule of cultivation is given in Table 2.
JARQ 32(1) 1998
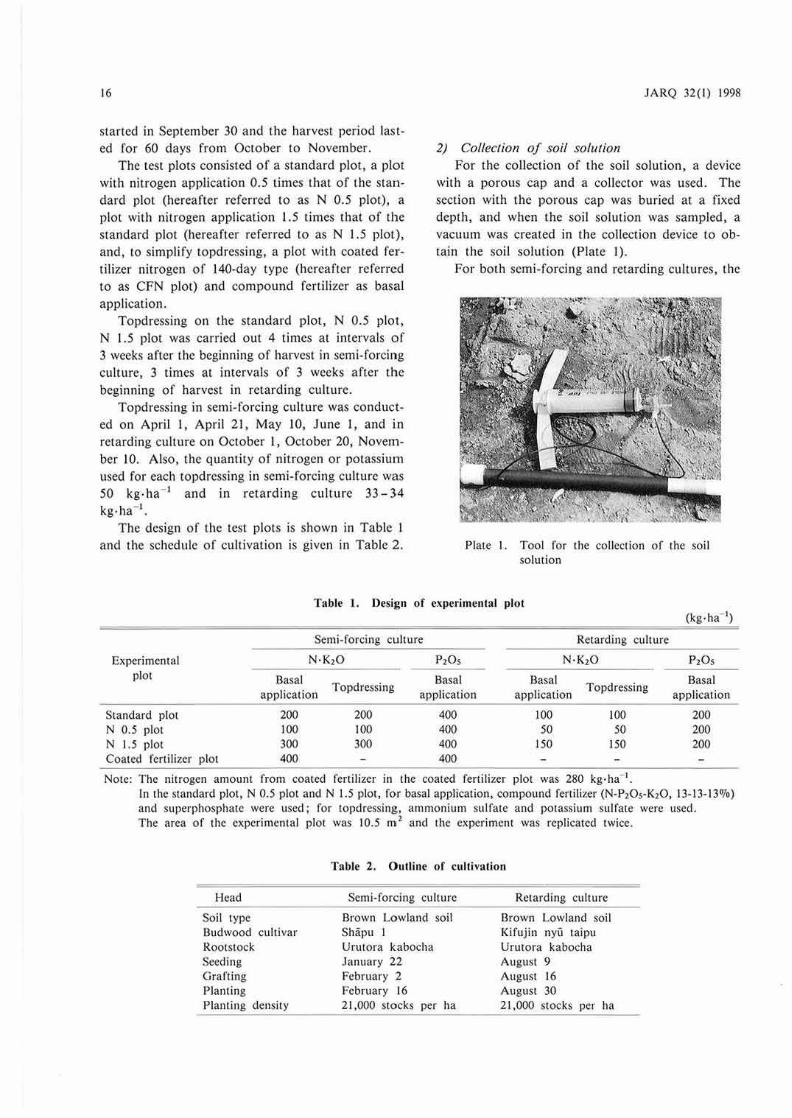
2) Collection of soil solution For the collection of the soil solution, a device
with a porous cap and a collector was used. The section with the porous cap was buried at a fixed depth, and when the soil solution was sampled, a vacuum was created in the collection device to obtain the soil solution (Plate 1).
For both semi-forcing and retarding cultures, the
Plat~ I. Tool for the collecrion of the soil solution
Table 1. Design of cx1ierimen1nl plot
Experimenral plo1
Srandard plot N 0.5 plo1 N 1.5 plo1 Coated fertilizer plot
Semi-forcing cuhure
Basal applica1 ion
200 100 300 400
Topdressing
200 100 300
Basal application
400 400 400 400
Basal application
100 50
150
Retarding cuhure
Topdressing
100 50
150
Note: The ni1rogen amount from coated fertilizer in the coated ferti lizer p lot was 280 kg· ha- •.
Basal application
200 200 200
In the standard plot, N 0.5 plot and N 1.5 plot, for basal application, compound fertilizer (N-P20 5-K20, 13-13- 13%) and superphosphate were used; for topdressing, ammonium sulfate and potassium sulfate were used. The area of the experimenta l plot was 10.5 m 2 and the experiment was replicaied twice.
Head
Soil type Budwood cultivar Roo!Sloek Seeding Grafting Planting Planting density
Table 2. Outline of culti vation
Semi-forcing culture
Brown Lowland soil Shapu I Uru tora kabocha January 22 February 2 February 16 21,000 stocks per ha
Rerarding culture
Brown Lowland soil Kifujin nyii taipu Urutora kabocha August 9 August 16 AuguSI 30 21,000 stocks per ha
K. Roppo11gi & H. Yamawki: Real-Time Diagnosis of Soil Sol111io11 of Cucumber Using Nim,re lo11-Me1er 17
soil solution was collected at a depth of 15 cm for I to 2 days after irrigation, at interval.s of 10 days. The nitrate content of the soil solution was measured by the phenol sulfuric acid method. At the same time, for real-time diagnosis, the nit rate content was determined with a compact nitrate ion-meter.
3) Preparation of pe1iole juice of cucumber Within 2 to 3 days after the collection of the
soil solution, the petioles from the 14th through 16th nodes in cucumber true leaf were collected and cut into sections approximately 2 cm long. T hese were t hen pressed with a garlic press to obtain the petiole juice, and Lhe nitrate content in the juice was measured using the phenol sulfuric acid method.
Results and discussion
I) Condilions for collection of soil solzaion and simple method to measure the nitrate content
fn order to determine the conditions for the collection of the soil solution, the porous cap was inserted at positions 5, 10, 15, and 20 cm from the surface layer and the nitrate content increased with the proximity to the surface layer (Table 3). Taking into consideration both the root zone and the position where the soil solution can be readily collected, it was considered that collection at a depth of IS cm from the surface layer was t he most appropriate. The soil solution per plot should be collected from
Table 3.
5 cm
2,170 (1,442)
Nitrate content of soil solution at each depth
10 cm
1,7 10 ( 322)
15 cm
1,320 ( 287)
20 cm
1,090 ( 259)
Note: ( ) indicates standard deviation. The soil solution was collected in the nitrate standard plot from March 3 tO March 17. Nitrate content in Table 3 is the average value in 5 zones at each depth. The nitrate content was measured with a compact nitrate ion-meter.
Table 4. Nilralc content of soil solution in
Experimental plot 2 3 4 5
Standard plot 1.700 990 2,200 590 1,300 N 0.5 plot 530 320 260 850 290
3 posi tions LO avoid sampling errors (Table 4). Also, 3 or 4 days after irrigation, the soil pF
reaches a value of more than 1.8 and it is no longer possible to collect the soil solution using a porous cup, while the soil pF decreases below 1.2 immediately after irrigation . It was therefore considered that the optimum time for the collection of the soil solution was I to 2 days after irrigation when the soil pF was in the range of 1.6- 1.8 .
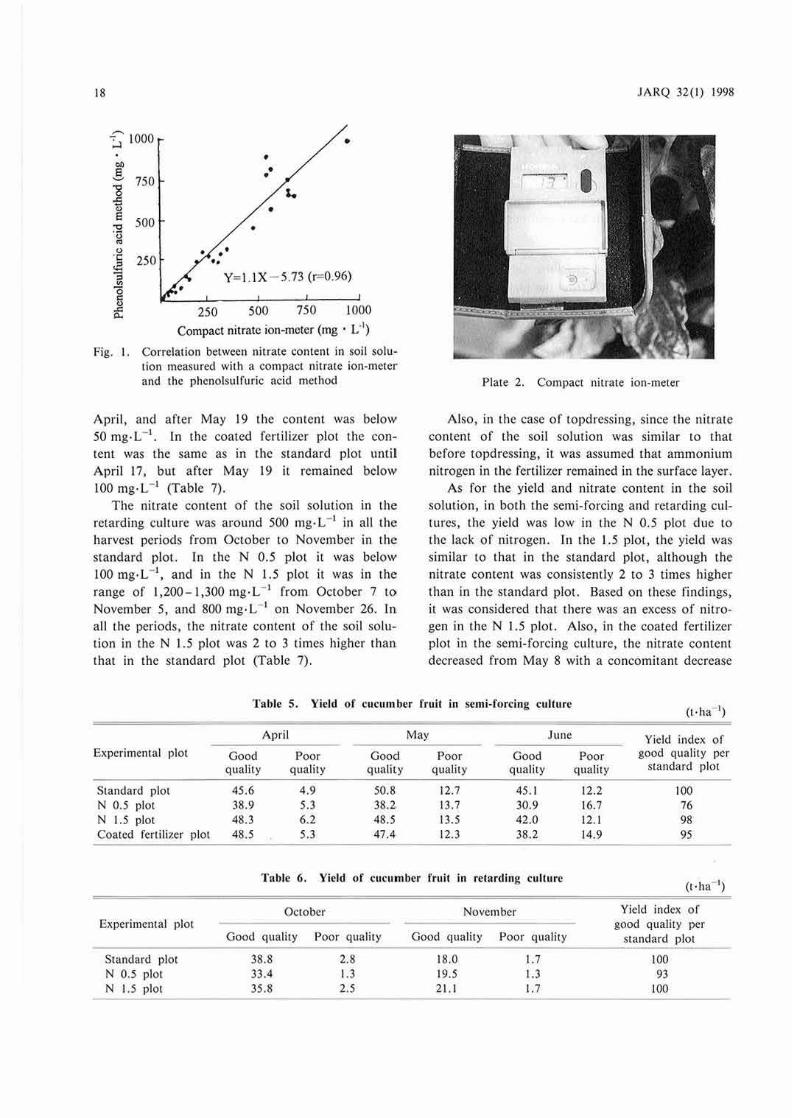
Measured values using a compact nitrate ionmeter, which is a convenient method to measure the nitrate content of the soil solution, were compared with measured values using the phenol sulfuric acid method. A significant correlation was observed between the 2 methods (Fig. I, Plate 2). The use of the compact nitrate ion-meter was found to be a simple and convenient method of measurement. The kit used measures the test solution that drips down from above a nitrate electrode, after correction with the calibration nuid. Measurements require 2 to 3 min.
2) Yield of cucumber fruit and nitrate content in soil solution
The yield of cucumber in the standard plot in semi-forcing culture was constant each month from Apri l in t he early harvest period to June in the late harvest period, the total yield being 142 t·ha- 1
. In the N 1.5 plot, the yield was 980/o of that in the standard plot, against 760'/o in the N 0 .5 plot. T he yield was 95% in the coated ferti lizer plot. In the retarding culture, in the standard plot and N 1.5 plot an identical yield of 57 t,ha- •, was recorded while in the N 0.5 plot, the yield was 93% that of the standard plot (Tables 5 and 6).
The ni trate content of the soil solution in the standard plot in the semi-forcing culture remained in the range of 500 to 1,000 mg· L- 1
, while in the N 1.5 plot, it ranged between 2,000 and 2,500 mg· L - • from April 7 to May 28. In all the periods the content was 2 to 3 times higher than in the standard plot. In the N 0.5 plot the nitrate content was low in the early harvest period of
each collection zone at a depth of JS cm (mg· L~1)
6 7 8 9 Average Standard deviation
860 1,900 990 1,400 1,330 497 580 260 330 420 470 185
Note: The soil solution was collected from March 3 to March 10. Nitrate content was measured with a compact nitrate ion-meter.
18
~ 1000
CJ)
8 ....... 750 "8 -5 ., 8 500 "O ·c:; "' 0 ·c:: !5 :, "'
250
0 !l
.::: 0.. 250
• • •
Y=I.IX - 5.73 (r=0.96)
500 750 1000
Compact nitrate ion-meter (mg • L'1)
Pig. 1. Correlation between nitrate conten t in soil solution measured with a compact nitrate ion-meter and the phenolsulfuric acid method
Apri l, and afte r May 19 the content was below 50 mg·L- 1
• In the coated fertilizer plot the content was the same as in the standard plot until April 17, but after May 19 it remained below 100 mg· L - i (Table 7).
The nitrate content of the soil solution in the retarding cul ture was around 500 mg·L- 1 in all the harvest periods from October to November in the standard plot. In the N 0.5 plot it was below 100 mg· L - 1
, and in the N 1.5 plot it was in the range of J,200- 1,300 mg-L- 1 from October 7 to November 5, and 800 mg·L- 1 on November 26. In all the periods, the nitrate content of the soil solution in the N I .5 plot was 2 to 3 times higher than that in the standard plot (Table 7).
JARQ 32(1) 1998
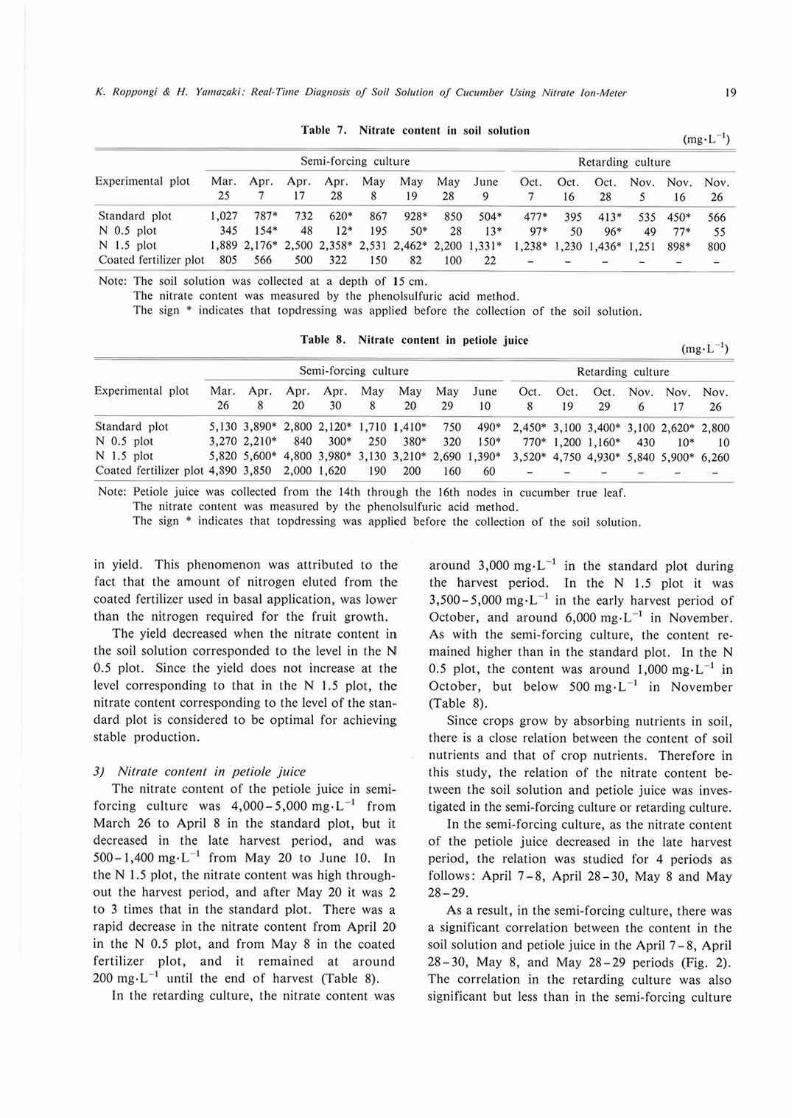
Plate 2. Compact nitrate ion-meter
Also, in the case of topdressing, since the nitrate content of the soil solution was similar to that before topdressing, it was assumed that ammonium nitrogen in the fertilizer remained in the surface layer.
As for the yield and nitrate content in the soil solution, in both the semi-forcing and retarding cultures, the yield was low in the N 0 .5 plot due to the lack of nit rogen . ln the I .5 plot, the yield was similar to that in the standard plot, allhough the nitrate content was consistently 2 to 3 times higher than in the standard plot. Based on these findings, it was considered that there was an excess of nitrogen .in the N 1.5 plot. Also, in the coated fertilizer plot in the semi-forcing culture, the nitrate content decreased from May 8 with a concomitant decrease
T able S. Yield of cucumber fruit in semi-forcing culture
Experimental plot
Standard plot N 0.5 plot N 1.5 plot Coated fertil izer plot
Experimemal plot
Standard plot N 0.5 plot N 1.5 plot
April May June
Good Poor Good Poor Good quality quality quality quality quali ty
45.6 4.9 50.8 12.7 45.1 38.9 5.3 38.2 13.7 30.9 48.3 6.2 48.5 13.5 42.0 48.5 5.3 47.4 12.3 38.2
Table 6. Yield of cucumber fruit in retarding culture
October
Good quali ty Poor quality
38.8 33.4 35.8
2.8 1.3 2.5
November
Good quality Poor qua lity
18.0 19.5 21.1
I. 7 l.3 1.7
Poor quality
12.2 16.7 12.1 14.9
Yield index of good quality per
standard plot
100 76 98 95
Yield index of good quality per
standard plot
100 93
100
K. Roppongi & H. Y<1111";.aki: Re/ti· Time Di(lg11osis of Soil Solt11io11 of Cucumber Using Nim11e !011-Me1e1· 19
Table 7. Nitrate content in soil solution
Semi-forcing culture Retarding culture
Experimental plot Mar. Apr. Apr. Apr. May May May June Oct. Oct. Oct. Nov. Nov. Nov. 25 7 17 28 8 19 28 9 7 16 28 5 16 26
Siandard plot 1,027 787* 732 620* 867 928· 850 504* 477• 395 413* 535 450* 566 N 0.5 plot 345 154* 48 12* 195 so• 28 13* 97* 50 96• 49 77• 55 N 1.5 plot 1,889 2, 176* 2,500 2,358* 2,531 2,462* 2,200 1,331* l,238• 1,230 1,436* 1,251 898* 800 Coated fertilizer plot 805 566 500 322 150 82 100 22
Note: The soil solution was collected at a depth of J 5 cm. The nitrate content was measured by the phenolsulfuric acid method. The sign • indicates that topdressing was applied before the collection of the soil solution.
Table 8. Nitrate contenl in petiole juice
Experimental plot Mar. Apr. 26 8
Semi-forcing culture
Apr. Apr. 20 30
May 8
May 20
May 29
June 10
Oct. 8
Retarding culture
Oct. 19
Oct. 29
Nov. Nov. 6 17
Nov. 26
Standard plot 5, 130 3.890* 2,800 2,120* J,710 1,410* 750 490* 2,450* 3,100 3,400· 3.100 2,620* 2,800 150* 770* 1,200 I, l 60* 430 I 0* I 0
1,390* 3,520* 4,750 4,930* 5,840 5,900* 6,260 60
N 0.5 plot 3,270 2,210* 840 300* 250 380* 320 N 1.5 plot 5,820 5,600* 4,800 3,980* 3,130 3,210* 2,690 Coated fertilizer plot 4,890 3,850 2,000 l ,620 190 200 160
Note: Petiole juice was collected from the 14th through the 16th nodes in cucumber true leaf. The nitrate content was measured by the phenolsulfuric acid method. The sign • indicates that topdressing was applied before the collection of the soi l solut ion .
in yield. This phenomenon was attributed to the fact that the amount of nitrogen eluted from the coated fertilizer used i.n basal application, was lower than the nitrogen required for the fruit growth.
The yield decreased when the nitrate content in the soil solution corresponded LO the level in the N 0.5 plot. Since the yield does not increase at the level corresponding to that in the N 1.5 plot, the nitrate content corresponding to the level or the standard plot is considered to be optimal for achieving stable production.
3) Nitrate content in petiole juice The nitrate content of the petiole juice in semi~
forcing culture was 4,000-5,000 mg·L- 1 from March 26 to Apri l 8 in the standard plot, but it decreased in the late harvest period, and was. 500-1,400mg·L- 1 from May 20 to June IO. In the N 1.5 plot, the nitrate content was high throughout the harvest period, and after May 20 it was 2 to 3 times that in the standard plot. There was a rapid decrease .i.n the nitrate content from April 20 in the N 0.5 plot, and from May 8 in the coated fertilizer plot, and it remained at around 200 mg-L _, until the end of harvest (Table 8).
In the retarding culture, the nitrate content was
around 3,000 mg-L - , in the standard plot du.ring the harvest period. ln the N 1.5 plot it was 3,500-5,000 mg·L- 1 in the early harvest period of October, and around 6,000 mg· L- 1 in November. As with the semi-forcing culture, the cont.ent remained higher than in the standard plot. In the N 0.5 plot, the content was around 1,000 mg·L- 1 in October, but below 500 mg·L- 1 in November (Table 8).
Since crops grow by absorbing nutrients in soil, there is a close relation bet ween the content of soil nutrients and that of crop nutrients. Therefore in this study, the relation of the nitrate content between the soil solution and petiole juice was investigated in the semi-forcing culture or retarding culture.
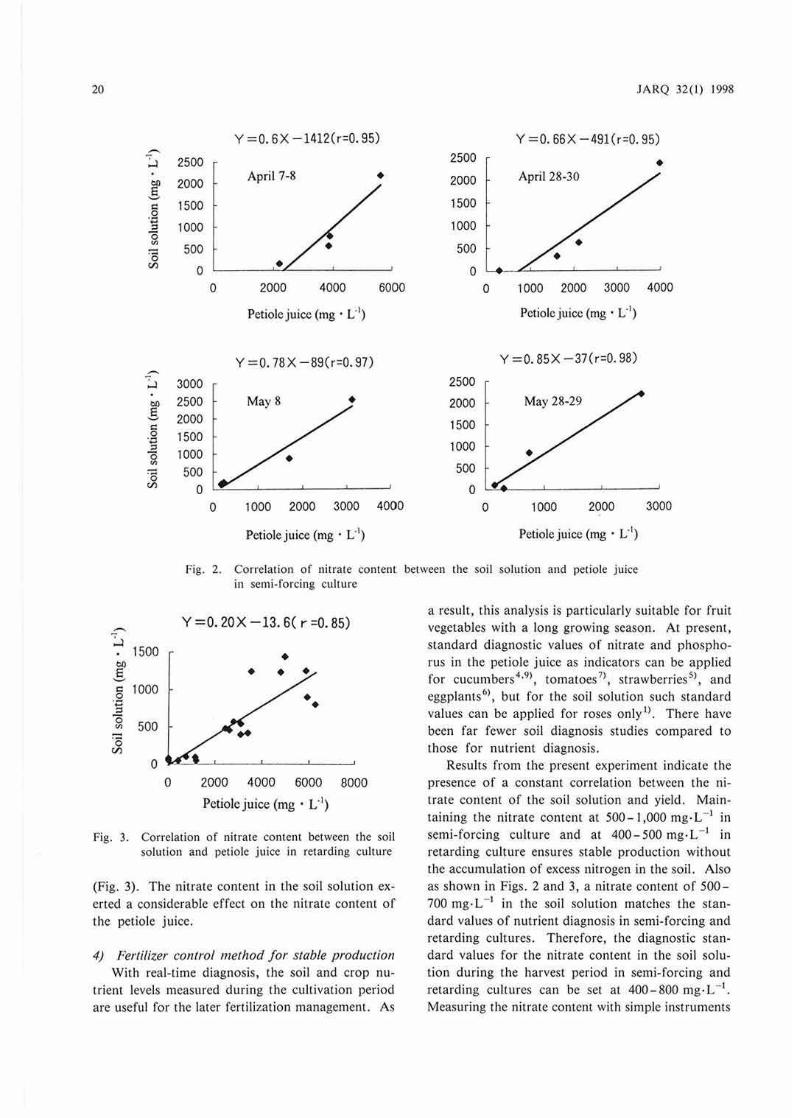
In the semi-forcing culture, as the nitrate content of the petiole juice decreased i.n the late harvest period, the relation was studied for 4 periods as follows: April 7 - 8, April 28 - 30, May 8 and May 28-29.
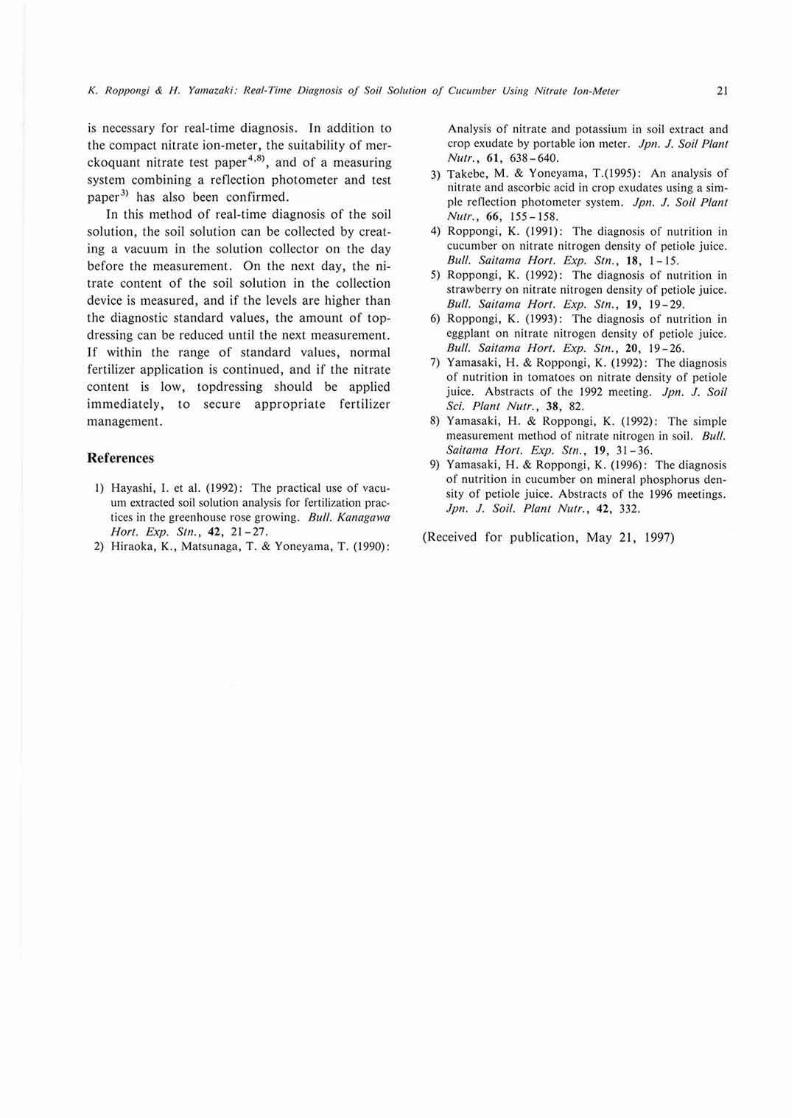
As a result, in the semi-forcing culture, there was a significant correlation between the content in the soil solution and petiole juice in the April 7 - 8, April 28-30, May 8, and May 28-29 periods (Fig. 2). The correlation in the retarding culture was also significant but less than in the semi-forcing culture
20 JARQ 32(1} 1998
Y =O. 6X-1412(r=O. 95) Y =O. 66X-49l(r=O. 95) ,...,. 2500 ~ 2500 •
2000 April 7-8 • 2000 April 28-30 co
E ._, 1500 C 1500
0 ·.:i
1000 1000 :, 0 en
500 500 ·s (/)
0 • 0 0 2000 4000 6000 0 1000 2000 3000 4000
Petiole juice (mg · L'1) Petiole juice (mg · L"1)
Y=O. 78X-89(r=0.97) Y =O. 85X -37(r=O. 98) .-.. ~ 3000 2500
co 2500 • 2000 May 28-29 5 2000 1500 C 0 1500 ·a
1000 :, 1000 0
"' 500 ·o 500 (/)
0 0 0 1000 2000 3000 4000 0 1000 2000 3000
Petiole juice (mg · L"1) Petiole juice (mg · L'1)
Fig. 2. Correlat ion of ni trate content between the soi l solution and petiole juice in semi-forcing culture
~
~ Cj)
E ._, C 0
·.:i :,
0 "' ]
r/'J
1500
1000
500
0
Y=O. 20X-13. 6( r =0.85)
0 2000 4000 6000 8000
Petiole juice (mg · L'1)
Fig. 3. Correlation of nitrate coment between the soil solut ion and petiole juice in retarding culture
(Fig. 3). The nitrate content in the soil solution exerted a considerable effect on the nitrate content or the petiole juice.
4) Fertilizer control method for stable production With real-time diagnosis, the soil and crop nu
trient levels measured during the cultivation period are useful for the later fertilization management. As
a result, this analysis is particularly suitable for fruit vegetables with a long growing season. Al present, standard diagnostic values of nitrate and phosphorus in the petiole juice as indicators can be applied for cucumbers4
·9>, tomatoes 7>, strawberries5>, and eggplants6>, but for the so.ii solution such standard values can be applied for roses on1y1>. There have been far fewer soil diagnosis studies compared to those for nutrient diagnosis.
Results from the present experiment indicate the presence of a constant correlation between the nitrate content of the soil solution and yield. Maintaining the nitrate content at 500 -1 ,000 mg·L- 1 in semi-forcing culture and at 400 -500 mg·L- 1 in retarding culture ensures stable production without the accumulation of excess nitrogen in the soil. Also as shown in Figs. 2 and 3, a nitrate content of 500-700 mg· L - i in the soil solution matches the standard values of nutrient diagnosis in semi-forcing and retarding cultures. Therefore, the diagnostic standard values for the nitrate content in the soil solution during the harvest period in semi-forcing and retarding cultures can be set at 400-800 mg· L - t.
Measuring the nitrate content with simple instruments
K. Roppougi & H. Yamawki: Real-Time Diagnosis of Soil Sohuion of Cucumber Using Nitrate Ion-Merer 21
is necessary for real-time diagnosis. In addilion to
the compact nitrate ion-meter, the suitability of merckoquant nit rate test paper4
•8>, and or a measuring system combining a reflection photometer and test paper3> has also been confirmed.
In this method or real-Lime diagnosis or the soil solution, the soil solution can be collected by creaii1,g a vacuum in the solution collector on the day before the measurement. On the next day, the nitrate content of the soil solution in the collection device is measured, and if the levels are higher than the diagnostic standard values, the amount of topdressing can be reduced until the next measurement. 1r within the range of standard values, normal rertilizer application is continued, and if the nitrate content is low, topdressing should be applied immediately, LO secure appropriate rertilizer management.
References
I) Hayashi, l. et al. (1992): The practical use of vacuum extracted soil solution analysis for fertilization practices in the greenhouse rose growing. 8111/. Ka11agawa Horr. Exp. Shi. , 42, 21-27.
2) Hiraoka, K., Matsunaga, T. & Yoneyama, T. (1990):
Analysis of nitrate and potassium in soil extract and crop exudate by portable ion meter. Jpn. J. Soil Plant Milr., 61, 638-640.
3) Takebe, M . & Yoneyama, T.(1995): An analysis of nitrate and ascorbic acid in crop cxudates using a simple renection photometer system. Jpn. J. Soil Pl(lnt Nlllr., 66, 155-158.
4) Roppongi, K. (1991): The diagnosis of nutrition in cucumber on nitrate nitrogen density of petiole juice. Bull. Saitama Hort. Exp. Stn., 18, l- 15.
5) Roppongi, K. {1992): The diagnosis of nutrition in strawberry on nitrate nitrogen density of petiole juice. Bull. Sttitama Hort. Exp. SIii., 19, 19 -29.
6) Roppongi, K. (1993): The diagnosis of nutrition in eggplant on nitrate nitrogen density of pciiole juice. 811/I. Saitama Hori. Exp. S111., 20, 19-26.
7) Yamasaki, H. & Roppongi, K. (1992): The diagnosis of nutrition in tomatoes on nitrate density of petiole juice. Abstracts of the 1992 meeting. Jpn. J. Soil Sci. Plant Nutr., 38, 82.
8) Yamasaki, H. & Roppongi, K. (1992): The simple measuremelll method of nitrate nitrogen in soil. Bull. S(li/(lf/la Hort. Exp. Stn., 19, 31-36.
9) Yamasaki, H. & Roppongi, K. ( 1996): The diagnosis of nutrition in cucumber on mineral phosphorus den· shy of petiole juice. Abstracts of the 1996 meetings. Jpn. J. Soil. Plall/ Nutr. , 42, 332.
(Received for publication, May 2l. 1997)