Effective management of sea cucumber fisheries and the ...
182
A study of sea cucumber fisheries and bêchedemer production in the western South Pacific Effective management of sea cucumber fisheries and the bêche-de-mer trade in Melanesia: bringing the industry under rational control Final Report April 2013 A report prepared by Nautilus Consultants on behalf of the Secretariat of the Pacific Community
-
Upload
khangminh22 -
Category
Documents
-
view
0 -
download
0
Transcript of Effective management of sea cucumber fisheries and the ...

A study of sea cucumber fisheries and bêche-‐de-‐mer production in the western South Pacific
Effective management of sea cucumber fisheries and the bêche-de-mer trade in Melanesia: bringing the industry under rational control
Final Report
April 2013
A report prepared by Nautilus Consultants
on behalf of the Secretariat of the Pacific Community

A study of sea cucumber fisheries and bêche-‐de-‐mer production in the western South Pacific
Team Leader and lead author Crick Carleton Co-‐authors John Hambrey Hugh Govan Paul Medley in-‐country correspondents Jeff Kinch (PNG) Len Rodwell (SOL) Francis Hickey (VAN) Ravinesh Ram (FIJ) Poasi Ngaluafe (TON)
Nautilus Consultants Ltd
www.nautilus-‐consulants.co.uk crick@nautilus-‐consultants.co.uk

A study of sea cucumber fisheries and bêche-‐de-‐mer production in the western South Pacific
Contents
Executive Summary ......................................................................................................................... v
1 Introduction ........................................................................................................................... 1
1.1 Context .................................................................................................................................. 1
1.2 The study brief ....................................................................................................................... 2
1.3 Report layout ......................................................................................................................... 3
2 An introduction to the sea cucumber industry ........................................................................ 4
3 Analysing regional BdM production ........................................................................................ 9
4 Examination of potential production ..................................................................................... 18
5 Approaches to the management of sea cucumber fisheries ................................................... 24
5.1 Status and pressures ............................................................................................................ 24
5.2 Management response ........................................................................................................ 24
5.3 Stock assessment ................................................................................................................. 26
5.4 Regulations and potential harvest control rules (HCRs) ...................................................... 27
5.5 Broader measures ................................................................................................................ 30
5.6 Implementation ................................................................................................................... 30
6 Fiscal, economic and trade measures ..................................................................................... 32
6.1 Informing policy ................................................................................................................... 32
6.2 Resource access ................................................................................................................... 35
6.3 Production and export caps ................................................................................................. 38
6.4 Cost recovery and economic incentives .............................................................................. 40
6.5 Monitoring, control and surveillance, and measures to discourage IUU fishing and trade 43
7 A sea cucumber / BdM sector management framework ........................................................ 45
7.1 Sea cucumber management experience ............................................................................. 45
7.2 Reinforcing management through trade information ......................................................... 47
7.3 Establishing precautionary export caps and, by extension, target catches ......................... 48
7.4 Management framework conclusions and recommendations ............................................ 49
8 Opportunities for regional cooperation ................................................................................. 54
9 References ............................................................................................................................ 56
A study of sea cucumber fisheries and bêche-‐de-‐mer production in the western South Pacific
Annex 1 – Country BdM sector profiles Annex 2 – Country trade and data systems Appendices
Appendix 01 Terms of Reference Appendix 02 Field work schedule Appendix 03 List of interviewees Appendix 04 Common names Appendix 05 BdM prices Appendix 06 Evolution of BdM prices Appendix 07 Key characteristics of BdM Appendix 08 Country exports Appendix 09 Illustration of valuation of BdM exports under different assumptions Appendix 10 Indices of encounterability Appendix 11 15 yr average production by Province by species Appendix 12 15 yr average species mix Appendix 13 15 yr average wet weight Appendix 14 Shallow water areas and other provincial stats Appendix 15 15 yr average value Appendix 16 Main species, by value, per province Appendix 17 Prelim stock assessment Appendix 18 Priority roles for CBRM Appendix 19 Description of processing and trade structure Appendix 20 Overview of BdM industry Appendix 21 Sources of quantitative information on species, volume and values

A study of sea cucumber fisheries and bêche-‐de-‐mer production in the western South Pacific
Page | v
Executive Summary
The bêche-‐de-‐mer (BdM) industry Coastal and island communities in many of the Pacific Islands Countries and Territories (PICTs) derive significant cash income from the harvesting of sea cucumber and its transformation to bêche-‐de-‐mer (BdM). These dried products are consolidated in-‐country by BdM traders who export consignments to the main Asian market entrepôts.
Demand for BdM continues to grow in line with the growth of China’s and other Asian economies, but supplies cannot keep pace with this demand, and a “boom and bust” pattern of exploitation is no longer appropriate to the needs of this market. With tens of thousands of isolated coastal and island households dependent on this trade for a significant proportion of their regular cash income requirement there is also a strong political rationale to improved management of these fisheries and this trade.
The study This study is focused on the BdM industries in four Melanesian countries and one Polynesian country – Papua New Guinea (PNG), the Solomon Islands (SOL), Vanuatu (VAN), Fiji (FIJ) and Tonga (TON). The study is part of an initiative by ACIAR1 implemented by SPC2, and responds to concerns raised by Melanesian country leaders through the Melanesian Spearhead Group (MSG), and more broadly by the Heads of Fisheries of PICTs through the SPC.
The South Pacific BdM trade is a multi-‐million dollar marine product trade; in capture fishery terms second only to the significantly larger tuna trade. There is wide recognition that the persistent over-‐exploitation of sea cucumber resources is substantially depressing the overall potential of this trade. This situation is being further exacerbated by a lack of transparency in the management and practice of this trade and, where moratoria have been imposed, to significant Illegal, Unreported and Unregulated (IUU) fishing and trading activity. This has provided fertile ground for petit corruption, and where moratoria are in place has required very significant increases in the resources that governments have had to deploy to keep a lid on illegal activity.
Accordingly this study is in the form of a scoping study to identify courses of action that can be taken forward. Its focus is five-‐fold:
• Profiling of the current and historic structure, operation and scale of sea cucumber harvesting and BdM production and export in the five countries under study;
• Estimation of the scale of revenues being foregone as a result of persistent over-‐exploitation and the “boom and bust” nature of these fisheries;
• Identification of fiscal and trade tools that could be used to better control the production and trade of BdM;
1 The Australian Centre for International Agricultural Research 2 The Secretariat of the Pacific Community

A study of sea cucumber fisheries and bêche-‐de-‐mer production in the western South Pacific
Page | vi
• Identification of how management regimes could be strengthened to encourage the greater sustainable exploitation of these fragile resources and to boost income to peripheral coastal and island communities; and
• Identification of the potential for regional cooperation3 in strengthening management and increasing the revenues that can be derived from these fisheries and the trade in BdM.
Production Sea cucumbers comprise a large and diverse group of organisms that are found in most marine environments, and are typically deposit feeders, extracting biological nutrients coating sediment or other surfaces; some are plankton feeders. Of 1400 species known to science some 60 species are widely traded from Pacific waters. Some 35 of these species of sea cucumber are found in the waters of Melanesia, of which 21 species make up over 90 per cent of the volume of trade of BdM from this area, and eight of these species make up over seventy-‐five per cent of the value of such trade – and at a more local level, usually three or four of these species make up three-‐quarters of value.
Different sea cucumber species command quite different prices, and the combination of the state of exploitation of the local resource and the value of BdM derived from that resource dictates fishing patterns and effort, with fishers tending to focus on the most cost-‐effective resource / species at any given time. The two main fishing methods are reef gleaning and free diving. It is the free divers that have greater control over the direction of their effort; reef gleaning activity – whether for shellfish, sea cucumber or octopus, etc. – is much less discriminate.
We have compiled export data from each of the countries, providing a long-‐run series for BdM exports as a generic category and shorter-‐run series for exports by species. Where data have allowed, we have also compiled production series by species by Province or District.
Figure 1: Exports of BdM from the five countries under study, 1986 to 2012, tonnes dried weight
Source: Fisheries Department statistics -‐ PNG, SOL, VAN, FIJ, TON – summarised in Appendix 8
3 With a particular focus on the member countries of the Melanesian Spearhead Group (MSG)

A study of sea cucumber fisheries and bêche-‐de-‐mer production in the western South Pacific
Page | vii
From the available data it is clear that in a general sense the recent BdM trade developed dramatically from a low level across the 1970s to an early first peak in the late 1980s. This was followed by a distinct fall-‐off in production, followed by a second peak in the late 1990s, early 2000s. Nesting below these overall trends are the independent “boom and bust” cycles of the local fisheries, none of which are exactly the same.
Taken together, in 2006, regional (the five countries under study) exports of BdM were about 930 t, representing a current buy-‐in value of some USD 15.8 million. In subsequent years the fisheries of PNG, the Solomon Islands and Vanuatu were closed to allow stock recovery, and to compensate for previous excessive harvests. The Tonga fishery was opened, but was all but exhausted by the end of 2012. The Fiji fishery has remained open, but harvests have been well below those achieved in the 1980s and 1990s. In the years 2007 to 2012, the five countries under study actually exported an average of some 600 t of BdM per year, whereas under precautionary management we suggest this could have been closer to 1,000 t per year, and with a significantly higher value.
Peak production is not a very good indication of production capacity. Instead we have taken a fifteen year average as being more representative (illustrated). We have also sought to determine a “signature” species mix by given area – based on statistical data, where available, but otherwise extrapolated from quantitative and anecdotal evidence.
Figure 2 -‐ Consolidated 15-‐year (1996-‐2012) average export volume, by species (t BdM dried weight) & estimated current in-‐country purchase value (USD millions) for the five countries under study
Source: national Fishery Department statistics
Note – value is the price paid by an exporter to a producer for finished product
We have also estimated the current value of a harvest of this scale and species mix at the prices typically paid by in-‐country traders for finished dried product. Summed across the fifteen year time

A study of sea cucumber fisheries and bêche-‐de-‐mer production in the western South Pacific
Page | viii
series, but using current purchase prices4, this translates into notional revenue generation of some USD 160 million5.
We estimate that if these resources had been managed on a more precautionary basis that moved exploitation away from the “boom and bust” cycle, medium-‐run revenues derived from the BdM trade would be as much as double those that have been achieved -‐ up to USD 330 million at current values. This is based on the reversing of various characteristics that plague current production:
• Serial over-‐exploitation of resources means that the stocks of each species are below the size of stock that would yield Maximum Sustainable Yield (MSY) and/or Maximum Economic Yield (MEY) – which is likely to impact negatively on reproduction and stock recruitment, and thus on stock biomass
• Because fishers focus on harvesting the largest individuals of each species available to them, and most stocks have been over-‐exploited, there is a preponderance of smaller sized individuals in the populations of each species – a truncated population structure – which translates into lower value BdM
• Because greater fishing effort tends to be focused on these higher value species, and the stocks of these species are not given sufficient time to recover, the average size of individuals available tends to steadily decrease over time – a shift in modal value to a smaller size – and thus command lower values
• As the availability of high value species decreases, so effort on lower value species increases – as a result the relative value of BdM exports tends to decrease over time as the mix of species sold tends towards lower value species
• Process management and the general quality of BdM processing are not good; greater care and attention is given to processing the high value species such as white teatfish and sandfish, but overall up to 30 per cent of value is lost due to poor processing.
In the medium term it is projected that more precautionary management would result in sea cucumber harvests and BdM production equivalent to the average of recent harvests, but this would be achieved each and every year, the mix would shift towards higher value species, and the value of individual BdM would be improved because more sea cucumbers would be harvested at larger sizes. In addition, if greater care and attention were paid to the quality of processing, a further uplift in value of between 10 and 20 per cent could be achieved (i.e. in practice it would not be possible to reverse all losses due to poor processing).
In the longer term, better management of each species stock will allow the rebuilding of stocks at the local level, and this in turn will allow larger volumes of each species to be harvested on a sustainable basis.
Under a “boom and bust” exploitation system revenues from sea cucumber harvesting go up and down between years, and are normally accompanied by serial over-‐exploitation. Accordingly revenues to the communities go up and down and are unpredictable. In most of the countries under study this has resulted in fisheries having to be closed for multiple years (5-‐10 years) – when
4 Prices derived from price data provided by traders interviewed, from their price lists, and from government 5 Reflecting changes over time in terms of species mix and average size of animals harvested as fisheries follow the boom and bust cycle

A study of sea cucumber fisheries and bêche-‐de-‐mer production in the western South Pacific
Page | ix
communities receive no BdM revenues at all. Under a sustainable management regime, revenues are maintained year on year.
The overall recommendation arising from the study is that every effort should be made to move from a “boom and bust” basis of exploitation to a more precautionary and sustainable steady state pattern of exploitation. This requires that stocks be allowed to recover, and that any subsequent exploitation needs to be at more precautionary levels. The following actions are proposed to achieve this.
Improving control and enforcement Current management regimes include many relevant and appropriate controls, but application is inconsistent, and thus ineffective (either stakeholders are not aware of the standards they should be upholding, or the ruling standards are not enforced). As a result, monitoring systems do not yield the data that could better inform the appropriate harvest levels. The failure to utilise available data for management purposes means that the data is under-‐valued, and thus less effort is used to collect it and to ensure that it is accurate. And even where data is good, it is not acted upon. A failure to control the levels of exploitation, or to set exploitation levels at sustainable levels, has resulted in persistent over-‐exploitation, which in turn has resulted in the necessity of closing fisheries to allow the stocks to recover. Where fisheries have been closed, the intended impact of such action has been undermined by substantial increases in IUU fishing and export. A number of actions are proposed to reverse these conditions.
Combating illegal activity
Recommendation 167 -‐ As a matter of management objective, sea cucumber fisheries and BdM supply chains should be managed in such a way as to preclude the need to close a fishery; closing a fishery incurs significant additional monitoring, control and surveillance (MCS) costs, and forces the trade underground.
Recommendation 2 -‐ Use of Underwater Breathing Apparatus (UBA) gear should continue to be outlawed, and management resources should be focused on achieving full compliance with this; the primary target of such fishing is white teatfish, and opportunities for identifying UBA caught white teatfish through the supply chain (on the basis of local intelligence) should be explored.
Data
Recommendation 3 -‐ As part of efforts to remove the conditions where illegal activity and petit corruption can thrive, each country should make clear and unambiguous annual declarations on industry performance over the preceding period, and on government expectations and regulatory / administrative framework governing industry performance for the subsequent period.
6 Note: in the following, a couple of recommendations are repeated under different section heads so as to maintain the logic of arguments presented 7 Note: a word search on “Recommendation X” will take the reader to the point in the report where the issue is discussed in more detail

A study of sea cucumber fisheries and bêche-‐de-‐mer production in the western South Pacific
Page | x
Recommendation 4 -‐ It is normally a condition of export, buyer and processor licenses that data should be provided to fishery managers to assist in management; these conditions should be enforced and systematically collected, collated and analysed.
Recommendation 5 -‐ Data collected by Customs and Fisheries Departments should, within the limits of the law and commercial confidentiality, be shared one with the other.
Recommendation 6 -‐ Data provision should as a minimum link to the Province of harvest.
Recommendation 7 -‐ Export packing lists should nominate the species and average size of product in each bag, and this should be verified by sample weighings at point of inspection prior to shipment; these data to be used to monitor changes in the size distribution of species harvested and exported and for use in assessing stock condition and strength.
Cost recovery
Recommendation 8 -‐ A valid commercial invoice, nominating fob value8 per species and product size / quality should be required as part of export documentation, and subject to verification – it is this value that is used in the calculation of an export levy9.
Recommendation 9 -‐ Exporters should also routinely provide Fisheries Departments, in confidence, with a schedule of prices used in the purchase of finished BdM from buyers and fishermen – this provides an alternate basis for calculation of an export levy.
Recommendation 10 -‐ The cost of a BdM export license should be raised significantly to better reflect the value of this trade, recoup some of the costs of management, to discourage small-‐scale operators, and to discourage the practice of patronage within the sector10.
Recommendation 11 -‐ The eligibility criteria for export licenses should be narrowed and deepened to exclude operations where the risk of non-‐compliance is high – including greater scrutiny of the integrity and background of the principals and partners of the business owners.
Recommendation 12 -‐ The primary (i.e. excluding small-‐scale household and village based consolidators) BdM buyers and processors operating at a Provincial level should be required to hold a buyer / processor license, a condition of which requires the provision of monthly species based throughput data, including details of source fishery (already a requirement of license in some countries, already specified in database structures, but not consistently collated).
Management framework: the need for an adaptive management system The BdM Management Plans that are already in operation, and the revisions currently in draft, form a sound and coherent basis to sector management. Weaknesses in dissemination and compliance
8 The price at which the importer has agreed to buy the product from the exporter, expressed as fob (Free On Board) price 9 Note that revenues derived from export levies are channelled to general government revenues rather than to fisheries management 10 A corollary of this is that licensing authorities need to be more inquisitive as to where company funding comes from, and who controls (makes the decisions in) the company

A study of sea cucumber fisheries and bêche-‐de-‐mer production in the western South Pacific
Page | xi
are evident, but the main shortcoming is the absence of any clear mechanism for adaptive management – decisions for future action that respond to the evidence from the effects of past action.
Central to this is the fact that managers do not have the wherewithal to assess stock size – only whether a particular resource is thought to be under-‐ or over-‐exploited. This greatly limits the advice they can give. The pragmatic response is thus to use a combination of tools that encourage conservative behaviour and moderate exploitation on the basis of the observed impacts of past behaviour, but more needs to be done in this area.
The following are the four key elements required in an effective management system for sea cucumber:
1. Engagement of resource users in contributing to the setting of overall national harvest targets and standard regulations; and developing and agreeing local harvest control rules in broad conformity with these national targets.
2. Incentives and disincentives to promote compliance at all levels, including thorough inspections and economic incentives at the point of export.
3. Information relating to the implementation of harvest control rules, and the impact on the stock, effectively monitored and analysed at local, provincial and national (export) level; and fed back into the management process.
4. Agreed response mechanisms at national and local level should data analysis suggest stock decline or improvement.
While some of these elements appear in existing national plans and frameworks, few countries have all of these elements in place.
Local harvest control rules might include, as well as implementation of existing minimum size restrictions, a restricted harvesting season, and protected areas / no-‐fishing zones or some combination of these; national / provincial harvest limits and rules might include provincial or national annual production / export quotas.
Incentives might include peer pressure at the local level, fines / confiscation of product at intermediate trade and export level, and graduated export levies, with higher rates for more valuable / vulnerable species.

A study of sea cucumber fisheries and bêche-‐de-‐mer production in the western South Pacific
Page | xii
Stock status monitoring using trade data11 (an approach successfully explored as part of this study-‐ see Appendix 17) will be crucial to monitoring success and adjusting harvest control rules in an effective and timely manner in response to improved or declining stock health.
Gaining agreement on response mechanisms prior to their implementation should greatly facilitate implementation and reduce opportunities for corruption.
Recommendation 13 –Each government should ensure that all four key elements for an effective management system are in place and serve as the backbone for national sea cucumber management strategies and plans.
Recommendation 14 – Where engagement with stakeholders has not already been done a process of engagement should be undertaken to a) share understanding of the value of BdM and potential returns from a well-‐managed fishery; b) discuss the need for, and key elements of, an effective management system; c) agree on local harvest control rules compatible with those established at national level.
Information flow and data transfer
Recommendation 15 – As a contribution to improved transparency and public disclosure, government should prepare and publish (in English and relevant local languages) an annual compendium on BdM sector rules, performance, and expectations, and make this readily available to traders, intermediaries, fishermen, community leaders – using a wide range of media and dissemination routes.
Recommendation 16 -‐ Whilst it is recognised that the capacity of Provincial administrations to support industry management is limited, it is important that they play their part – through licensing, through data collation and analysis, and through industry contact; to this end, all principal Province based buyers / processors should be licensed, and license conditions should include the provision of monthly purchase information.
Recommendation 17 -‐ Compliance with Provincial quotas should be monitored through data provided at point of export, supported by purchase data provided at national and Provincial levels as conditions of license.
Recommendation 18 -‐ Fishing communities will necessarily be responsible for managing local sea cucumber exploitation, and should be supported in this task with the
11 More conventional species-‐based stock assessment modelling is difficult for sea cucumbers, since details of spatial distribution, growth rate and recruitment are not readily available. In the absence of conventional stock assessment modelling there is no clear consensus on stock recovery rates and what might constitute precautionary levels of fishing mortality. Whilst fishery independent surveys of resource density are widely used to assess under-‐ or over-‐exploitation, they cannot be readily converted to estimates of biomass (which would require multiplication of density figures by habitat area, but sea cucumber distribution is not narrowly limited by habitat type). Test modelling of production time-‐series data (export data), using a bio-‐economics sub-‐model to estimate likely changes in the underlying fishing effort, suggests that estimates of MSY and key stock management reference points can be derived, the impacts of different Harvest Control Rules (HCRs) can be assessed, and this information can provide a useful addition to any adaptive management regime.

A study of sea cucumber fisheries and bêche-‐de-‐mer production in the western South Pacific
Page | xiii
development and dissemination of simple questionnaires12 (for measuring changes in average size of sea cucumbers, and capturing other stock status information – on a qualitative and quantitative basis).
Estimation of stock status and precautionary export caps that limit exploitation
Unfortunately, most stocks of sea cucumber in most parts of the countries under study are considered to be over-‐exploited -‐ hence the situation where it has been necessary to put in place moratoria across the region. As yet there is no tried and tested management system that can deliver long-‐term sustainable exploitation of this mixed species resource. The main reasons for this are that this a very valuable but also open access fishery, there are next to no barriers to entry to the fishery, it is difficult to define stocks (not least it is difficult to model and predict stock recruitment), it is difficult to measure stock condition, and it is difficult to predict the impact of management measures on future stock condition. Management using a handful of sensible measures as part of an adaptive management regime is the responsible and only way to proceed. Taking into consideration the need to sustain coastal livelihoods (of which earnings from sea cucumber harvesting are particularly important) and to make the most of market conditions, continuing to support a boom and bust harvesting regime is not a responsible action. What is required is that harvesting (and thus exporting) levels are substantially reduced -‐ as a means of re-‐building stocks, and then exploiting at long-‐term sustainable levels. It is thus essential that upper limits are placed on how much of each species is harvested and exported as part of any adaptive management regime. Until such time as the setting of such limits can be based on sound and verifiable scientific assessment, precautionary caps need to be established – we would argue at the national and provincial levels – based on best available information.
Recommendation 19 -‐ We are of the view that national per species precautionary export caps, monitored at the point of export, should be established as a means of moderating fishing and purchasing behaviour that leads to instances of local over-‐exploitation of resources; whilst it is recognised that not all the requisite sources of information are currently available, these caps should be set through a process of stakeholder engagement, and based on historical export levels, evidence of under-‐ / over-‐exploitation, stock modelling, examination of the impact of different HCRs, and changes in the size composition of harvests; these should form an integral part of an adaptive management regime; since a number of these data sources are not currently available, further work will be required to develop the necessary information on which export caps can be determined.
Recommendation 20 – Bearing in mind that most stocks are currently in poor, over-‐exploited condition, stock recovery strategies13 need to be put in place in each country – typically a combination of a period of fishery closure, followed by the setting of graded precautionary export caps that contribute to any stock recovery strategy – and bearing in
12 Some question the benefits of form-‐filling and data collation at the community level – arguing that this acts as a disincentive to improved community based management; there are, however, simple qualitative and quantitative techniques that can be readily incorporated into existing community management systems (see for example Kinch 2004 & Friedman et al 2008); we suggest that these should be developed and tested as part of a distinct applied research thread. 13 These need to be established through a process of dialogue between government and trade and fishing stakeholders, particularly given known current weaknesses in consensus as to how to assess stock strength and condition
A study of sea cucumber fisheries and bêche-‐de-‐mer production in the western South Pacific
Page | xiv
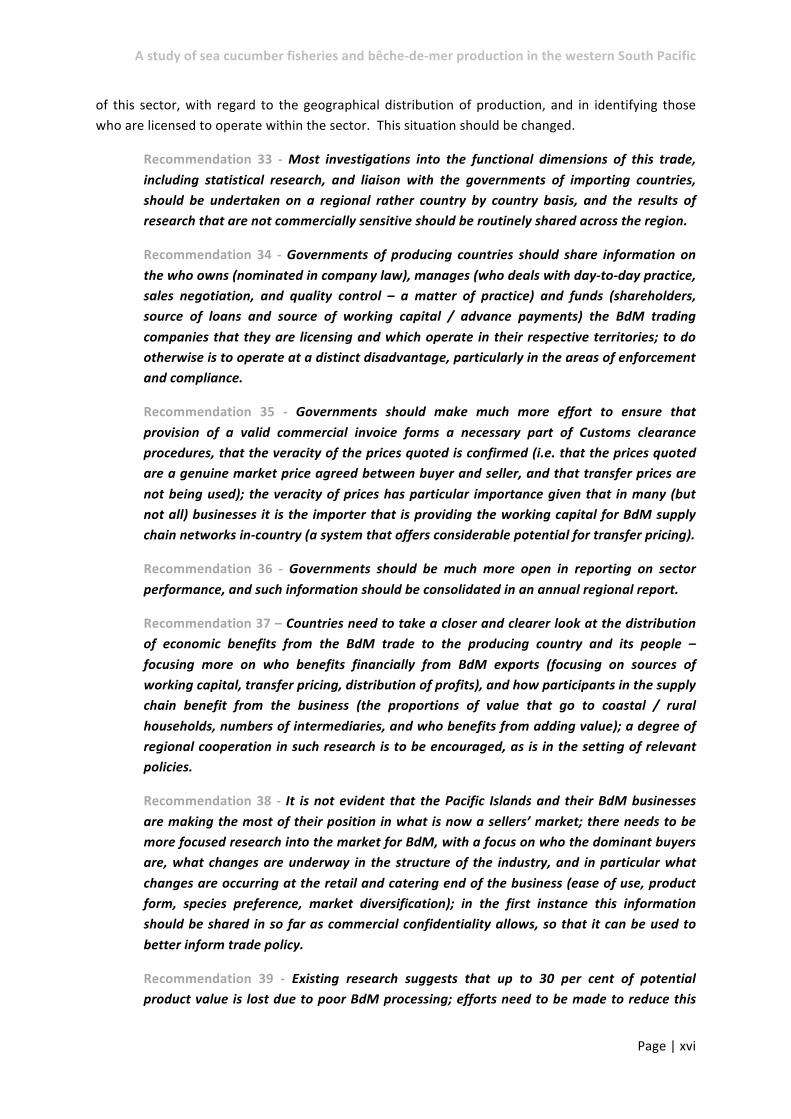
mind that relatively little is known about the stock recovery time needed for different species under different circumstances14.
Recommendation 21 – We are of the view that the same processes of setting precautionary export caps should be extended to the Provincial level; these can become more science-‐based as the capacity of government to inspect and monitor trade and exports improves and as information on the status of stocks improves.
Recommendation 22 -‐ To facilitate setting of precautionary export caps, and ultimately science-‐based exploitation targets, each country should start with revisiting review of the availability and accuracy of data on harvest / production (building on the information already collated as part of this study, plus the results of dive surveys, and information from fishing communities and BdM buyers and traders).
Recommendation 23 -‐ More precautionary export caps should be set for the higher value species, many of which tend to be slower growing15 or longer lived, and have been subjected to higher, more focused and more persistent fishing effort.
Recommendation 24 -‐ In most Provinces and countries three or four sea cucumber species dominate the value of local production, suggesting that the monitoring of stock status, determination of MSY, and implementation of quota ceilings and harvest control rules should focus first on these species – top of this list are sandfish, white-‐teatfish and lolly fish16; these core species should form the focus of initial follow-‐on research work.
Recommendation 25 -‐ Confidence in the estimation of stock status and reference points could be strengthened using additional information on changes in the average size or the size mix of harvests / Provincial production – which can be derived from the sampling of export shipments, and also by capturing community based information through completion of simple fisher survey questionnaires.
Recommendation 26 -‐ Confidence in the estimation of stock status and reference points could also be strengthened using information on the areas of different habitats existing within each Province – building on the valuable work already developed within the Reefbase Pacific project and the Millennium Coral Reef Mapping project; this is not, and should not be treated as, a precise process – instead the focus of research should be on finding simple but effective ways of using habitat area data as a means of supporting stock assessments / biomass estimates.
Recommendation 27 – Minimum size limits are in place in all countries studied, but Harvest Control Rules (HCRs) should be developed to encourage fishers to shift effort onto other species once the average size of animals falls below a given threshold (a threshold
14 There is evidence that some stocks can recover over relatively short periods of time (5 to 10 years), whilst in some instances it is evident that stocks still have not recovered after several decades (Battaglene & Bell 2004) – much undoubtedly depends on spawning densities, larval settlement patterns, and levels of recruitment to commercially exploited populations 15 The highest value species, sandfish, is known to be relatively fast-‐growing 16 Note that in terms of trade records, a number of species may be erroneously lumped together as lollyfish

A study of sea cucumber fisheries and bêche-‐de-‐mer production in the western South Pacific
Page | xv
well above the legal minimum size limits); examination of the impact of such rules can be explored using appropriate modelling (see footnote 10 & Appendix 16).
Recommendation 28 -‐ It would be helpful to explore if different harvest control rules could be developed for each of free diving and reef gleaning fishing methods.
Compliance and managing supply chain risk
Recommendation 29 -‐ Regular meetings should be convened between government, industry and fishermen to discuss sector management and performance; this appears to be a rarity at present.
Recommendation 30 – As a means of controlling fishing effort, fishing communities should be encouraged to limit fishing to short periods of time only (a matter of days or weeks per year), and probably distinguishing between free diving and reef gleaning fisheries; to avoid a free-‐for-‐all, closed seasons should also be set at the national level, but these can revisited as part of the adaptive management regime.
Recommendation 31 -‐ Given that BdM fishing, processing and trade will be proscribed for at least part of any year, care will need to be taken to discourage the licensing of opportunist BdM export businesses that simply shift from one national jurisdiction to another as stocks are exhausted, and instead favour those businesses that are there for the long-‐haul – committed to a process of co-‐management.
Recommendation 32 -‐ Use of UBA gear should continue to be outlawed for sea cucumber harvesting, and control resources focused on achieving full compliance with this17; the primary target of such fishing is white teatfish and opportunities for identifying UBA caught white teatfish through the supply chain should be explored (relying mainly on following up on local intelligence on the use of illegal gear).
Opportunities for regional cooperation Trade in BdM is an international business, with product sourced from all over the globe; but at the centre of this trade are a relatively small number of wholesale importers concentrated in locations such as Hong Kong, Guangzhou, Singapore and parts of Malaysia. Exporters in different countries are in touch with each other – directly and via their importing customers – and share knowledge and experience. In addition, funding of buying and exporting operations is often provided by the main importers, who thus have considerable knowledge of and involvement in these businesses, and who may encourage joint ownership of operations in different countries.
In managing this trade and these fisheries, governments operate at a disadvantage if they do not understand the structure and operation of this business, and if they do not also share information with other producer countries in similar situations to their own.
Extending this argument further, it is evident that many of the problems facing the industry are in part the result of or compounded by unnecessary secrecy with regard to the scale and performance
17 It should be noted that UBA gear is legally allowed to be used for collecting fish and invertebrates for the aquarium trade
A study of sea cucumber fisheries and bêche-‐de-‐mer production in the western South Pacific
Page | xvi
of this sector, with regard to the geographical distribution of production, and in identifying those who are licensed to operate within the sector. This situation should be changed.
Recommendation 33 -‐ Most investigations into the functional dimensions of this trade, including statistical research, and liaison with the governments of importing countries, should be undertaken on a regional rather country by country basis, and the results of research that are not commercially sensitive should be routinely shared across the region.
Recommendation 34 -‐ Governments of producing countries should share information on the who owns (nominated in company law), manages (who deals with day-‐to-‐day practice, sales negotiation, and quality control – a matter of practice) and funds (shareholders, source of loans and source of working capital / advance payments) the BdM trading companies that they are licensing and which operate in their respective territories; to do otherwise is to operate at a distinct disadvantage, particularly in the areas of enforcement and compliance.
Recommendation 35 -‐ Governments should make much more effort to ensure that provision of a valid commercial invoice forms a necessary part of Customs clearance procedures, that the veracity of the prices quoted is confirmed (i.e. that the prices quoted are a genuine market price agreed between buyer and seller, and that transfer prices are not being used); the veracity of prices has particular importance given that in many (but not all) businesses it is the importer that is providing the working capital for BdM supply chain networks in-‐country (a system that offers considerable potential for transfer pricing).
Recommendation 36 -‐ Governments should be much more open in reporting on sector performance, and such information should be consolidated in an annual regional report.
Recommendation 37 – Countries need to take a closer and clearer look at the distribution of economic benefits from the BdM trade to the producing country and its people – focusing more on who benefits financially from BdM exports (focusing on sources of working capital, transfer pricing, distribution of profits), and how participants in the supply chain benefit from the business (the proportions of value that go to coastal / rural households, numbers of intermediaries, and who benefits from adding value); a degree of regional cooperation in such research is to be encouraged, as is in the setting of relevant policies.
Recommendation 38 -‐ It is not evident that the Pacific Islands and their BdM businesses are making the most of their position in what is now a sellers’ market; there needs to be more focused research into the market for BdM, with a focus on who the dominant buyers are, what changes are underway in the structure of the industry, and in particular what changes are occurring at the retail and catering end of the business (ease of use, product form, species preference, market diversification); in the first instance this information should be shared in so far as commercial confidentiality allows, so that it can be used to better inform trade policy.
Recommendation 39 -‐ Existing research suggests that up to 30 per cent of potential product value is lost due to poor BdM processing; efforts need to be made to reduce this
A study of sea cucumber fisheries and bêche-‐de-‐mer production in the western South Pacific
Page | xvii
economic loss, through focused training of processor households and, where feasible, more centralised processing (at village and provincial levels), and increased focus on process control; any such intervention should be coordinated at a regional level [see Appendix 19].
Box 1 -‐ Research priorities
r Develop Bayesian18 statistical treatment of PNG species export data to arrive at better modelling of sea cucumber stocks and MSY estimates, and the impact of different types of HCR on stock conditions
r Develop rule of thumb guidelines for village communities on improved management of sea cucumber resources – (i) focused on free-‐diving fisheries, and (ii) focused on reef gleaning fisheries; not only covers crude mapping of resource disposition, seasonality, etc., but how to develop and apply local HCRs, how to determine size of animals, and how to trigger the move-‐on rule
r Research the structure of the trade in Hong Kong and Guangzhou – including prices, company structures, and trade financing
r Research changes in preferences of catering and retailing sectors – species preferences by region, size preference, emergence of new product forms (part-‐dried, pre-‐prepared, boil-‐in-‐the-‐bag, frozen)
r Get to grips with why salt is not used in western Melanesia
r Develop more detailed stock models and management advice for most important species – white teatfish, black teatfish, lolly, snakefish, red surf fish
r Extend habitat maps of Melanesian countries to enable more detailed biomass estimates linking density survey data with biomass per species
r Develop a simple prompt sheet and accompanying methodology for determining when a move-‐on rule should be applied in sea cucumber harvesting management (combines crude resource mapping, quantitative or subjective capture of changes in size distribution of harvests of main species, and interpretation of responses to prompt sheet)
r Prepare best practice BdM inspection and data capture guidelines for Fisheries and Customs Officers
18 Bayesian statistics -‐ statistical methods that assign probabilities or distributions to events or parameters based on experience or best guesses before experimentation and data collection, and that apply Bayes' theorem to revise the probabilities and distributions after obtaining experimental data

A study of sea cucumber fisheries and bêche-‐de-‐mer production in the western South Pacific
Page | xviii
Box 2 -‐ Action plan
r Measures to aid stock recovery in each country – mainly moratoria, but also how to manage exploitation and export when moratoria lifted, or in the absence of moratoria (e.g. Fiji) – requires national meetings between managers, scientists, fishermen and traders to discuss a tabled proposal
r Drafting and publishing – within the next twelve months -‐ of national BdM sector performance reports, based on a common contents sheet and format across the MSG (if not further) – based on and extending the data amassed within this consultancy; the purpose of this exercise is to show the historical and current scale, structure and activity of this sector across the value chain -‐ fishing communities, intermediaries, traders; needs governments to compile, analyse, and, where appropriate, to tidy up, historic data sets
r Establishment of national and provincial interim export caps – by species – for each country, based on historical export record, density surveys, and discussions between managers, fishermen and trade
r Compile a regional database of all companies involved in BdM exporting (name, corporate form, capitalisation, when export licenses held, record of volume and value of BdM exported), including details of affiliations and associates of owners, advisors and managers, source of funding (balance of advances from importers, shareholding, borrowings, working capital)
r Regularisation of the data capture, data recording, and data sharing protocols operated by relevant Fisheries Departments and Customs Departments – requires representatives of both departments in each country to sit down and work through what is possible and what is not possible
r Customs and Fisheries Departments to review and upgrade the protocols for pre-‐shipment inspections, data capture (of purchases, packing lists, manifests, inspections) – leading to drafting and publication of a best practice manual
A study of sea cucumber fisheries and bêche-‐de-‐mer production in the western South Pacific
Page | 1
1 Introduction
1.1 Context
Sea cucumber fisheries are the second most valuable capture-‐based (after tuna) export fishery in the South Pacific, yet their sustainable management has proved an intractable problem over the years. In years of peak exploitation, production has been valued at over USD 50 million, but in poor years the value has been only a small fraction of this. With better management, combined with today’s higher prices, the fishery could be worth more – but this potential wealth and income to coastal and island communities is being lost due to persistent over-‐fishing and the wild swings in productivity that over-‐exploitation causes.
Market demand currently exceeds global supplies, and prices, particularly of the more sought after species of sea cucumber are on the rise. Far from strengthening the position of sea cucumber fishers, the lure of easy money, combined with pressure on the local trade from the main importers, is encouraging poor practices and poor management, which is making the situation worse. In four of the five countries forming the focus of this study, sea cucumber fisheries are or have been closed for between five and ten years at a time to allow recovery. Yet even before they are reopened, inappropriate manoeuvrings by business people and civic leaders has or is undermining the recovery efforts, and stocks are due to plummet again – and will take still longer to recover to harvestable levels than the last time.
It could be argued that this is simply “business as usual” – a valuable renewable resource is rising in value, and a range of people, from peripheral small-‐scale fishing communities to business people and politicians, seeking to make a quick profit from this unfolding opportunity. But there are five elements to the current circumstances surrounding this fishery and trade that are particularly disturbing:
• The stocks are so run down that in each boom and bust cycle they yield less than half the volume of product than they used to, and this yield falls further with every new cycle19.
• Sea cucumbers play an important role in maintaining the health of many marine habitats, cleaning and aerating expanses of mud, sand and reef; where they are absent or in low numbers, ecosystem structure and function is altered, changes in the structure of reef communities can occur and overall productivity (of food fish and shellfish) is compromised, the physical protection of the shore line afforded by reef systems is reduced, and the nutrient recycling capacity of these environmental complexes is impaired.
• The high value now placed on prime sea cucumber product is encouraging fishers and their households to focus on this activity at the expense of subsistence and other revenue generating activities, and encouraging their greater dependence on imported foodstuffs and other household items – requiring that they earn still more from harvesting sea cucumbers.
• The market makers, particularly import businesses in Hong Kong and mainland China (centred on Guangzhou), have searched the globe for new sources of product and, in each case, local fishers have been encouraged to harvest as much of the resource as possible, resulting in stock collapse; the market makers are struggling to find the new sources of
19 Prior to the 1990s, exploitation in the 1800s and 1900s involved extracting as much as possible over a short period (the equivalent of clear-‐felling a forest) and then allowing long periods for recovery; from the 1990s onwards, stocks have still been over-‐exploited, but there has been no effective recovery period

A study of sea cucumber fisheries and bêche-‐de-‐mer production in the western South Pacific
Page | 2
supply they require, and so we are entering a period when the rate of increase in the volume of global supplies will steadily fall – simply moving on to new sources of supply is now an untenable business strategy over the medium-‐term.
• The extent to which those involved in sea cucumber trading can make substantial short-‐term profit in return for very limited investment and at low risk, combined with lax or non-‐existent control on exploitation and trade, and an absence of transparency, supports corrupt practices and illegal activity as a range of influential players seek to opportunistically profit from these circumstances; it has not been, and is still not, in the interests of these traders and other players to regularise the sea cucumber business and to bring it under more considered and responsible management.
These are corrosive influences with effects and impacts that go far beyond the sea cucumber industry:
• the heightened role that the income from sea cucumber fishing and processing is having in the local coastal and island economies in rural locations across the South Pacific is undermining efforts towards more responsible management;
• it is also challenging the traditional authority and decision-‐making processes of community leaders, and in some instances is altering attitudes towards subsistence farming and fishing;
• the lack of transparency and incidents of petit corruption are undermining public trust in government institutions, policy, politicians and the rule of law.
Bringing the sea cucumber industry under responsible and sustainable management is of the utmost importance. The key elements of such management are well known – but it is the practicalities of putting them in place that is problematic; not just how to do it, but how to monitor and enforce it. A key difficulty is the matter of how to break or moderate the “boom and bust” cycle that is so typical of this industry. But the changing dynamics of the industry is also of some relevance. A more considered, strategic and coordinated approach to managing this supply could greatly strengthen this position, to the distinct benefit of national economies and rural coastal and island communities. These form the focus of this study.
1.2 The study brief
It is intended that this study raise the profile of sea cucumber fisheries in Papua New Guinea, the Solomon Islands, Fiji, Vanuatu and Tonga, by highlighting the potential economic returns from a sustainable fishery, and the wealth lost through inadequate management. The study is part of an initiative by ACIAR managed by SPC, and builds on long-‐term work undertaken by SPC, and combines this with inputs and resources from its member countries, other technical organisations, and individual experts.
The aim of the initiative is to launch more effective approaches to the management of sea cucumber fisheries in the region with an initial focus on Melanesia. The current study is to provide the foundation for a programme of future work – guided by field work, drawing on other information and experience, and building on and adding to the considerable published research record. The study is to identify economic measures that can be used at the national level to promote sustainable management of the resource and generate revenue to support monitoring and enforcement action. It is also to determine areas in which collaboration between neighbouring island countries could strengthen management and enhance economic returns.

A study of sea cucumber fisheries and bêche-‐de-‐mer production in the western South Pacific
Page | 3
The study Terms of Reference were endorsed in late April 2012 at a meeting of the Fisheries Technical Advisory Committee of the Melanesian Spearhead Group (MSG) and again at an informal consultation with the Heads of Fisheries in June 2012 (which recommended the inclusion of Tonga in the research). The Terms of Reference for the study are shown as Appendix 1 to this report.
1.3 Report layout The report is laid out in seven main sections, supported by country profiles (Annexes 1 & 2), and twenty-‐one data appendices. The first section, Chapter 2, provides a brief overview of the sea cucumber and bêche-‐de-‐mer industry so as to allow better interpretation of subsequent analysis. Chapter 3 draws on the available data to quantify and describe historic production. And this forms the basis of analysis described in Chapter 4 to as to the levels of production that could be achieved under more conservative and sustainable management. Chapter 5 examines the different approaches to the management of sea cucumber fisheries. Chapter 6 looks at the fiscal and economic measures that could be put in place to better manage and control production – combining fiscal, regulatory and enforcement measures – systems that are, in general, independent of the specific BdM industry management strategy applied, and which complement other stock / fishery management approaches. In Chapter 7 we examine what might constitute an improved framework for BdM management incorporating elements of fishery, supply chain and trade management. In Chapter 8 we look briefly at opportunities for regional initiatives and cooperation that could strengthen sector management and boost market revenues.
References cited in the text and appendices are listed in Chapter 9.
Annex 1 provides thumbnail sketches of the BdM industry in each country. Annex 2 focuses on the inter-‐relationship between geography and industry structure, data sources and sector scale, and how the industry is managed.
Supporting this analysis and discussion is a substantial range of Appendices (1-‐21). The underlying data used in the analysis is presented in appendices, together with descriptions of the key characteristics of the various species of sea cucumber that figure most significantly in this trade.
A study of sea cucumber fisheries and bêche-‐de-‐mer production in the western South Pacific
Page | 4
2 An introduction to the sea cucumber industry Bêche-‐de-‐mer (BdM) is the trade name for dried sea cucumber. Used as a generic term it refers to the cooked and dried form of some 60 commercially traded species of sea cucumber. Sea cucumbers are a group of soft-‐bodied sand and reef living detritus feeders most commonly found in relatively shallow marine environments down to depths of some 30m.
As the price of bêche-‐de-‐mer has increased over the years the product has taken on the characteristics of a delicacy, and is now commonly served as a centre-‐piece in ceremonial meals – for Chinese New Year, weddings, and formal occasions. It is also used as an ingredient in other dishes, and it is used in powder form as an ingredient in Chinese medicines.
Different species of sea cucumbers inhabit a wide range of habitats and niches present across the coastal shallows and reef systems – from mud substrates through sand, to coral debris to the insides, tops and outer sides of reef systems. Those existing on particulate substrates ingest and clean particles of any biological material – and by recycling this substrate they play a particularly important role in aerating and turning-‐over this material. Those on harder substrates tend to cycle particulate matter found on the hard surfaces and in crevices, and again play a significant role in maintaining the health and vitality of reef systems.
Whilst 35 sea cucumber species are traded across Melanesia, our examination of production and export records suggests that 21 species make up more than 90 per cent of production volume, and eight of these species make up over three quarters of production value (see Appendix 4). Production and trade in sea cucumber and bêche-‐de-‐mer is typically reported in generic terms, and most commonly in terms of product weight – i.e. dried (less than 5 per cent moisture content) bêche-‐de-‐mer. When expressed in value terms it is widely recognised that bêche-‐de-‐mer made from different species command different prices, but inconsistencies in the recording of harvests, production and trade by species means that such value differentiation is not typically transcribed to quantification of overall BdM production. This creates the illusion of homogeneity, when in fact the fisheries and supply chains are much more complex.
Some of the most valuable sea cucumber species can be found, in a healthy population, at densities of 10 to 30 per hectare – e.g. white teatfish, prickly redfish and surf redfish – whereas lower value species can be found at several hundred or indeed several thousand per hectare, e.g. snakefish and lolly fish (see Appendix 7). The former species will be typically harvested by free divers (diving to depths of some 20m), whereas the latter are more commonly harvested through shallow water gleaning (walking the reefs at low tide). Specimens found in deeper water are sometimes harvested using “bombs” – basically a weighted barbed spike on a cord that is dropped from the surface to impale a sea cucumber. Some fishers use scuba or hookah gear to harvest sea cucumbers, allowing fishers to stay longer underwater, and to work at greater depths. This type of fishing is widely discouraged, and is illegal in Melanesian countries20. Not only is it extremely dangerous (deaths and paralysis from diving accidents are common), but it results in the harvesting of much larger proportions of mature adults of any given species – and adversely impacts spawning and stock recovery.
20 Though Fiji has in recent years issued a limited number of licenses for the harvesting of sea cucumber using UBA gear

A study of sea cucumber fisheries and bêche-‐de-‐mer production in the western South Pacific
Page | 5
Sea cucumber harvesting most typically follows a “boom and bust” pattern of exploitation. But the more heavily a stock is fished, the longer it takes for it to recover to healthy levels (and sometimes stocks can take several decades to recover, if they recover at all). If a stock is fished down again before it has fully recovered, then the harvested volume and average size of animals harvested is diminished. Underpinning this relationship is the fact that most sea cucumbers are broadcast spawners, with a pelagic larval stage where animals are carried by sea currents for up to 20 days (i.e. there is a limit to how far currents can carry these larvae from source) before settling on suitable (often shallow water) substrate. Stock recovery is dependent on their being a sufficient concentration of spawning adults present, that larvae find suitable substrate to settle on, and that a sufficient proportion of young survive long enough to recruit to the adult and commercially exploited population. This means that populations are particularly susceptible to local extinction due to over-‐fishing, and because many of the islands covered in this study are separated by very deep waters, recruitment from one shallow water area to another across such stretches of open ocean are all but impossible.
Table 1 – the main sea cucumber species traded in the Western Central Pacific
code common name scientific name
purchase price USD/kg dried1
value grp2
av. t/yr BdM3
SF sandfish Holothuria scabra $90 H 70 WTF white teatfish Holothuria fuscogilva $84 H 159 GSF golden sandfish Holothuria lessoni + $60 M -‐ BTF black teatfish Holothuria whitmaei $53 M 29 GF greenfish Stichopus chloronotus $50 M 19 PRF prickly redfish / pineapple fish Thelenota ananas $45 M 30 BF deepwater blackfish / Panning’s blackfish Actinopyga palauensis $45 M 1 DRF deep water redfish Actinopyga echinites $45 M 8 SRF surf redfish Actinopyga mauritiana $39 M 45 BF blackfish / hairy blackfish Actinopyga miliaris $20 L 26 CF curryfish Stichopus herrmanni $20 L 53 STF stonefish Actinopyga lecanora $20 L 18 TF tigerfish / leopard fish Bohadschia argus $20 L 74 SNF snakefish Holothuria coluber $16 L 86 PNF peanutfish / dragonfish / warty Stichopus horrens $14 L 7 CHF chalkfish / brownspotted sandfish Bohadschia similis * $14 L 48 BSF brown sandfish Bohadschia vitiensis * $14 L 3 FF flowerfish / orange fish / ripple fish Pearsonothuria graeffei $14 L 97 AMF amberfish Thelenota anax $14 L 48 LF lollyfish / reef lolly fish Holothuria atra $11 VL 182 ETF elephant trunkfish Holothuria fuscopunctata $11 VL 42 PKF pinkfish Holothuria edulis $6 VL 18 Notes
1 the estimated price at which A-‐grade dried product was bought from producers (Appendices 5 & 6) 2 product grouped by price bracket – H high; M medium; L low; VL very low
3 the average amount of dried product of each species exported each year, based on production over 15 years (incorporating periods when fisheries closed), 1996 to 2012
A study of sea cucumber fisheries and bêche-‐de-‐mer production in the western South Pacific
Page | 6
+ Golden sandfish has previously been classified as H. scabra var. versicolor but has recently been re-‐classified as a separate species (Kinch et al 2008) * species with taxonomy due to be reviewed (Kinch et al 2008) – B. similis now renamed B. marmorata (Uthicke et al 2010)
The range of species that make up the BdM trade from the countries under study (PNG, SOL, VAN, FIJ, TON) is shown in Table 1. The listing is organised according to the estimated 2012 value at which prime A-‐grade dried BdM is purchased in-‐country from producers / buyers, expressed in USD/kg. Key characteristics of these sea cucumbers are presented in Appendix 2 where features such as size, weight, depth range, preferred habitat, ratios of wet to dried, etc. are presented.
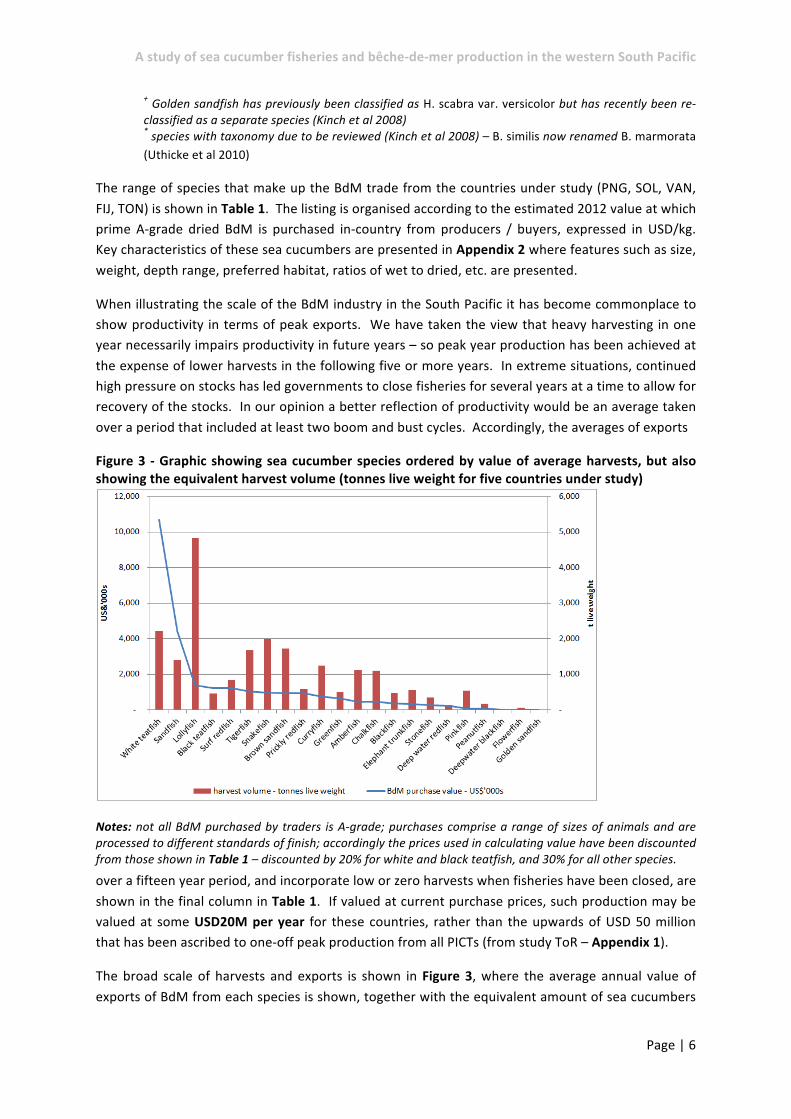
When illustrating the scale of the BdM industry in the South Pacific it has become commonplace to show productivity in terms of peak exports. We have taken the view that heavy harvesting in one year necessarily impairs productivity in future years – so peak year production has been achieved at the expense of lower harvests in the following five or more years. In extreme situations, continued high pressure on stocks has led governments to close fisheries for several years at a time to allow for recovery of the stocks. In our opinion a better reflection of productivity would be an average taken over a period that included at least two boom and bust cycles. Accordingly, the averages of exports
Figure 3 -‐ Graphic showing sea cucumber species ordered by value of average harvests, but also showing the equivalent harvest volume (tonnes live weight for five countries under study)
Notes: not all BdM purchased by traders is A-‐grade; purchases comprise a range of sizes of animals and are processed to different standards of finish; accordingly the prices used in calculating value have been discounted from those shown in Table 1 – discounted by 20% for white and black teatfish, and 30% for all other species.
over a fifteen year period, and incorporate low or zero harvests when fisheries have been closed, are shown in the final column in Table 1. If valued at current purchase prices, such production may be valued at some USD20M per year for these countries, rather than the upwards of USD 50 million that has been ascribed to one-‐off peak production from all PICTs (from study ToR – Appendix 1).
The broad scale of harvests and exports is shown in Figure 3, where the average annual value of exports of BdM from each species is shown, together with the equivalent amount of sea cucumbers

A study of sea cucumber fisheries and bêche-‐de-‐mer production in the western South Pacific
Page | 7
harvested. The largest biomass harvested is of the low value lolly sea cucumber. The second highest biomass harvested is of the very high value white teatfish. Behind these are the low value snakefish, tigerfish and brown sandfish, and the very high value sandfish. This latter species is different from the other species in that its habitat preference is quite narrow – generally limited to shallow water (<20m) with fine mud and sand substrate, including seagrass beds, with high nutrient levels; they can also tolerate reduced salinity (20 ppt) for short periods and so are sometimes found in brackish water (Agudo 2006 and Preston 1993). As a result its distribution across the region is not even. Additionally, where it is found, it can be found in large numbers, and its high price tag is such that it can be very easily over-‐fished.
These figures are shown in disaggregated form (disaggregated by country and by species) in Table 2.

A study of sea cucumber fisheries and bêche-‐de-‐mer production in the western South Pacific
Page | 8
Table 2 -‐ 15 year average BDM exports per country, by species, 1998 to 2012 – expressed in tonnes of dried BdM; plus estimated current purchase value21
15 year average exports -‐ t dried BdM value at current purchase prices – USD million
PNG SOL VAN FIJ TON PNG SOL VAN FIJ TON Sandfish 75 (16%) 1 (1%) 1 (6%) -‐ 0 (0%) $3.59 $0.03 $0.03 $0.00 $0.01 White teatfish 96 (21%) 30 (18%) 1 (6%) 22 (8%) 4 (7%) $4.31 $1.37 $0.06 $0.98 $0.17 Golden sandfish -‐ -‐ -‐ -‐ -‐ $0.00 $0.00 $0.00 $0.00 $0.00 Black teatfish 11 (2%) 5 (3%) 1 (6%) 8 (3%) 2 (4%) $0.27 $0.11 $0.02 $0.20 $0.04 Greenfish 10 (2%) 0 (0%) 1 (6%) 5 (2%) 1 (2%) $0.24 $0.01 $0.02 $0.13 $0.02 Prickly redfish 23 (5%) 0 (0%) 0 (0%) 6 (2%) 1 (2%) $0.48 $0.01 $0.00 $0.13 $0.02 Deepwater blackfish -‐ 1 (1%) 0 (0%) -‐ -‐ $0.00 $0.01 $0.00 $0.00 $0.00 Deep water redfish 0 (0%) 3 (2%) 0 (0%) 3 (1%) 0 (0%) $0.00 $0.07 $0.00 $0.06 $0.00 Surf redfish 23 (5%) -‐ 3 (17%) 6 (2%) 6 (11%) $0.41 $0.00 $0.05 $0.10 $0.10 Blackfish 8 (2%) 4 (2%) 0 (0%) 10 (4%) 1 (2%) $0.07 $0.03 $0.00 $0.10 $0.01 Curryfish 36 (8%) 4 (2%) -‐ 14 (5%) 1 (2%) $0.34 $0.03 $0.00 $0.13 $0.01 Stonefish -‐ 4 (2%) -‐ 5 (2%) 3 (6%) $0.00 $0.04 $0.00 $0.05 $0.03 Tigerfish 34 (7%) 5 (3%) 1 (1%) 25 (9%) 5 (9%) $0.32 $0.05 $0.00 $0.23 $0.05 Snakefish 10 (2%) 9 (5%) 1 (1%) 44 (16%) 10 (19%) $0.07 $0.06 $0.01 $0.32 $0.07 Peanutfish -‐ 5 (3%) -‐ -‐ 0 (0%) $0.00 $0.03 $0.00 $0.00 $0.00 Chalkfish 21 (4%) 8 (5%) -‐ 14 (5%) 2 (4%) $0.13 $0.05 $0.00 $0.09 $0.01 Flowerfish 2 (0%) -‐ 0 (0%) 0 (0%) 0 (0%) $0.01 $0.00 $0.00 $0.00 $0.00 Brown sandfish 36 (8%) 23 (14%) 4 (22%) 19 (7%) 4 (7%) $0.24 $0.15 $0.02 $0.13 $0.03 Amberfish 22 (5%) 6 (4%) 0 (0%) 16 (6%) 2 (4%) $0.15 $0.04 $0.00 $0.11 $0.01 Lollyfish 32 (7%) 45 (27%) 4 (22%) 66 (24%) 10 (19%) $0.17 $0.24 $0.02 $0.34 $0.05 Elephant trunkfish 21 (4%) 7 (4%) 0 (0%) 8 (3%) 2 (4%) $0.11 $0.04 $0.00 $0.04 $0.01 Pinkfish 8 (2%) 5 (3%) 0 (0%) 3 (1%) 0 (0%) $0.02 $0.01 $0.00 $0.01 $0.00 Total 467 164 18 274 54 $10.94 $2.38 $0.26 $3.15 $0.66
average unit value of exports -‐ USD/kg dried BdM $23/kg $15/kg $14/kg $12/kg $12/kg Source: exports by species from National Department of Fisheries statistics; values from trader interviews (see Appendices 5 & 6)
21 Purchase value refers here to the price paid by the main exporters to fishermen, processors, buyer intermediaries for grade “A” fully processed BdM
A study of sea cucumber fisheries and bêche-‐de-‐mer production in the western South Pacific
Page | 9
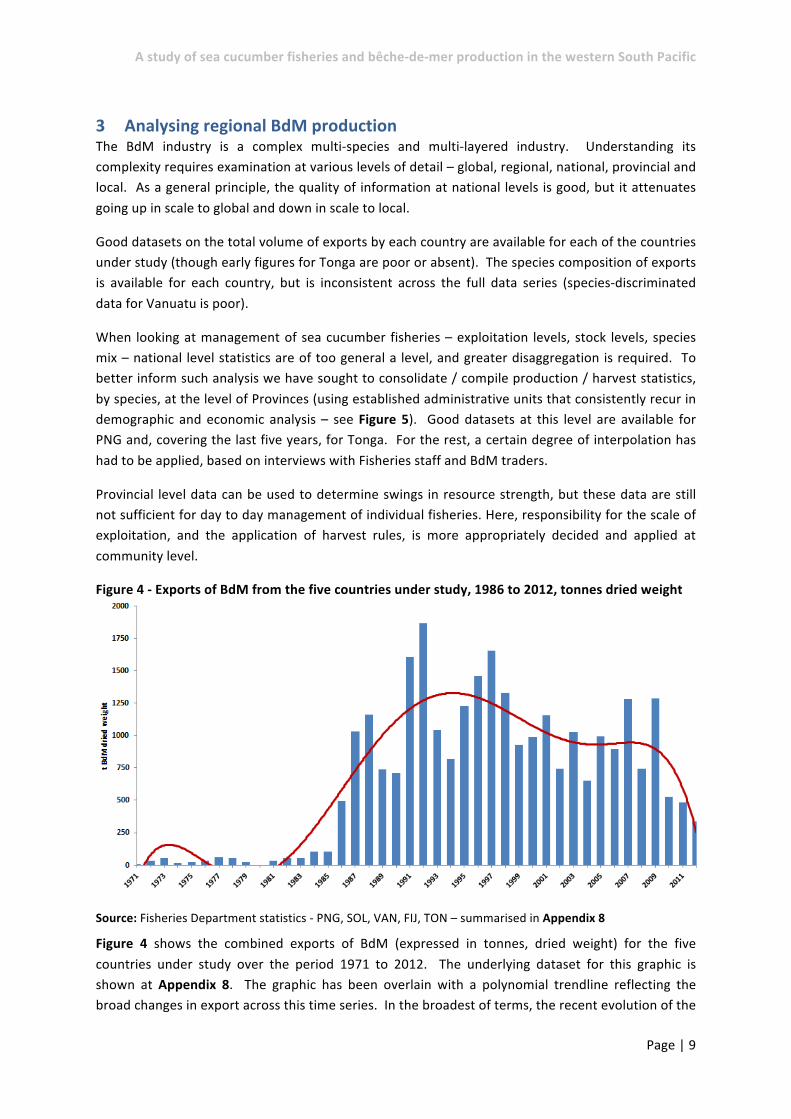
3 Analysing regional BdM production The BdM industry is a complex multi-‐species and multi-‐layered industry. Understanding its complexity requires examination at various levels of detail – global, regional, national, provincial and local. As a general principle, the quality of information at national levels is good, but it attenuates going up in scale to global and down in scale to local.
Good datasets on the total volume of exports by each country are available for each of the countries under study (though early figures for Tonga are poor or absent). The species composition of exports is available for each country, but is inconsistent across the full data series (species-‐discriminated data for Vanuatu is poor).
When looking at management of sea cucumber fisheries – exploitation levels, stock levels, species mix – national level statistics are of too general a level, and greater disaggregation is required. To better inform such analysis we have sought to consolidate / compile production / harvest statistics, by species, at the level of Provinces (using established administrative units that consistently recur in demographic and economic analysis – see Figure 5). Good datasets at this level are available for PNG and, covering the last five years, for Tonga. For the rest, a certain degree of interpolation has had to be applied, based on interviews with Fisheries staff and BdM traders.
Provincial level data can be used to determine swings in resource strength, but these data are still not sufficient for day to day management of individual fisheries. Here, responsibility for the scale of exploitation, and the application of harvest rules, is more appropriately decided and applied at community level.
Figure 4 -‐ Exports of BdM from the five countries under study, 1986 to 2012, tonnes dried weight
Source: Fisheries Department statistics -‐ PNG, SOL, VAN, FIJ, TON – summarised in Appendix 8
Figure 4 shows the combined exports of BdM (expressed in tonnes, dried weight) for the five countries under study over the period 1971 to 2012. The underlying dataset for this graphic is shown at Appendix 8. The graphic has been overlain with a polynomial trendline reflecting the broad changes in export across this time series. In the broadest of terms, the recent evolution of the

A study of sea cucumber fisheries and bêche-‐de-‐mer production in the western South Pacific
Page | 10
fisheries has been low-‐level exploitation through the 1970’s, steady growth of exploitation in the 1980s reaching a peak in the early 1990s. Harvests dropped off after this but a secondary, lower level, peak was reached in the mid-‐2000s. Concerns about widespread over-‐fishing of stocks resulted in the subsequent closure of fisheries in the Solomon Islands, Vanuatu and PNG (the Tongan fishery was closed from 1997). In the late 2000s, with most fisheries subject to moratorium, regional production is being provided by Fiji and Tonga only22 – and in both these countries stocks are now thought to be over-‐exploited, and reduced fishing pressure will be required in future years to allow for stock recovery23.
The build-‐up of interest in BdM over the last 25 years can be largely ascribed to the growth of demand from China as its economy has grown and income levels have risen. As supplies from the traditional sources of BdM have reduced, so the trade has actively sought out new sources of supply – but in turn these too have been over-‐exploited (Purcell et al 2012a & To & Shea 2012). The overall result has been substantial upward pressure on market prices, typically a two to three-‐fold increase over the last seven years for lower value species, and a four or five-‐fold increase for higher value species – which in the case of the higher value species converts to very significant increases in dollar terms – purchase prices paid to local processors for finished BdM rising from USD20/kg to USD80/kg over this period. In addition to this, however, it is clear from the data that the volume of white teatfish harvested from the region has been kept high – we would suggest as a result of continued over-‐fishing of this species in response to the high prices paid, including the resorting to the illegal use of UBA gear (though given limited legality in the case of Fiji). This leads us to suggest that the disproportionate rise in prices for high value species is a result of both supply and demand factors, but with greater emphasis on changes in demand.
Such price changes are illustrated in Appendix 6. This information has been drawn together from the various product purchase price points that traders, Fisheries Departments and fishers have been able to give to the researchers. These prices refer to those prices paid by main traders / exporters for prime quality fully dried BdM. Lower prices are paid for poorly processed product, part processed product, and small sized product. A quick comparison of the trend lines added to these price points24 indicates that, not unexpectedly, the dollar increase for the higher priced species has been substantially greater than for low priced species. This is a major incentive for buyers and exporters to encourage fishermen to focus on exploiting these high value species – attractive because these are low volume high markup products. But high volume low markup products, such as lollyfish -‐ predominantly harvested through reef gleaning -‐ have particular merit from a socio-‐economic perspective. These price graphs have been used to inform the estimation of 2012 prices used in putting a value to the BdM exports. Note that these prices are not the same as export prices25 which are more difficult to establish with any confidence.
A predictable result of these very significant value increases has been that price has become the major determinant of fishing activity, with, for some, sea cucumber fishing offering much better
22 Note that New Caledonia, not included in this study, is a significant regional BdM producer and exporter 23 The Tonga fishery has been closed again as from the beginning of 2013 24 We have been able to collate a number of price points, but these are neither sufficient nor definitive, and further discussion with traders on these issues is encouraged 25 fob (free on board – equivalent to ex factory) prices agreed between exporter and importer

A study of sea cucumber fisheries and bêche-‐de-‐mer production in the western South Pacific
Page | 11
returns on effort than fishing for finfish, harvesting and processing copra, or seeking work as a casual labourer.
Over the period illustrated in Figure 4 prices have strengthened, so whilst traded volume has weakened, in dollar terms the overall value of production has broadly increased. But the mix of species harvested has shifted to lower value species, the overall volume of harvests and exports is substantially down, and for many species the average size of individuals harvested is also down. The recent scale and quality of harvests are not as good as they were, and even with “rest” periods stocks are not returning to the same levels as were found in 1980s.
Figure 5 shows the same dataset disaggregated by country. It should be noted that, towards the end of this period, a number of country fisheries have been subject to moratorium, as follows:
• the Tongan fishery was closed for ten years between 1998 and 2007; • the Solomon Islands fishery has been closed since 2006 (albeit with partial openings in
response to the hardship in some areas of the country arising from the 2007 tsunami event); • the fishery in Vanuatu has been closed since 2008; • that in PNG has been closed since 2009; • the Fijian fishery has not been closed over the last two decades of this time series.
Each closure has been a considered management response to evidence of significant over-‐exploitation of the main sea cucumber stocks.
Figure 5 -‐ Export volume of BdM, 1986-‐2012, tonnes of product (dried) weight
The data series for PNG, Fiji, the Solomon Islands and Vanuatu are continuous across this time period. For Tonga the data series is incomplete, and best estimates have been inserted to complete the series (shown in red in Appendix 8).
As might be expected given its geographic scale, production levels from PNG are consistently the highest amongst the countries under study. This is followed by Fiji and the Solomon Islands.

A study of sea cucumber fisheries and bêche-‐de-‐mer production in the western South Pacific
Page | 12
Production from Tonga in 2008 and 2009 exceeded that in Fiji for those years, but it is clear that despite the ten year moratorium in Tonga, and the setting of what were considered at the time to be conservative provincial fishing quotas (but can now be shown to be wildly over-‐optimistic), the fishery has all but been fished-‐out over the course of two seasons (see also Annex 2).
Examination of data at the provincial level indicates that no two Provinces show boom and bust cycles in alignment with each other. Further, this remains true if we take the examination down to the level of fluctuations in harvests by species by Province. This is illustrated in Figure 6, where the purchase volume of BdM deriving from Milne Bay Province, PNG, is graphed for the period 1989 to 2009, by species.
Here it is evident that much effort was put into harvesting sandfish in the early period of this time series, and harvests quickly dropped off. It is only some ten or so years later that harvests have once again built up. By the late 1990s white teatfish and lollyfish have clearly become the main targets of fishing effort, and no doubt increasing effort and technology combinations have been deployed to keep the white teatfish harvests coming – but, it is surmised, taking ever greater proportions of the diminishing white teatfish stock. High harvests of black teatfish, greenfish, prickly redfish, tigerfish and brown sandfish accompany this upsurge in white teatfish harvests in 1999, 2000 and 2001, but these harvests quickly tail off as the resource becomes depleted. As with sandfish, though a base level of harvests have continued to be made of at least some of these species, it is several years before harvests have improved. To compensate, there is then renewed focus on curry fish, stonefish, tigerfish, amberfish and pinkfish.
Taking this message forward we have compiled data at provincial level for all Provinces – based on actual data for PNG and Tonga, and interpolated data for the other countries. Figure 6 shows the layout of Provincial / District boundaries. Production by Province is shown in Figure 7, where the reported volume of BdM exports over the fifteen years 1997 to 2011 has been averaged, and then valued based on a representative species mix for that Province drawn from available records (originating data is shown in Appendices 11 to 13). The value of production is shown on the basis of the species categories of high value, medium value and low value (see Table 1). The total average value of production per year (where the average incorporates years when a moratorium was in place) was USD 14 million at current prime grade buy-‐in prices. The roundel on the far left (PNG Western Province) represents a value of just over USD 1.0 million, and the largest roundel (PNG Milne Bay Province) represents USD 2.9 million. High value BdM production contributes proportionately more to provincial income in the west of the region compared to the east – and in this context it should be stressed that the high value category refers to production from only two species of sea cucumber -‐ sandfish and white teatfish.
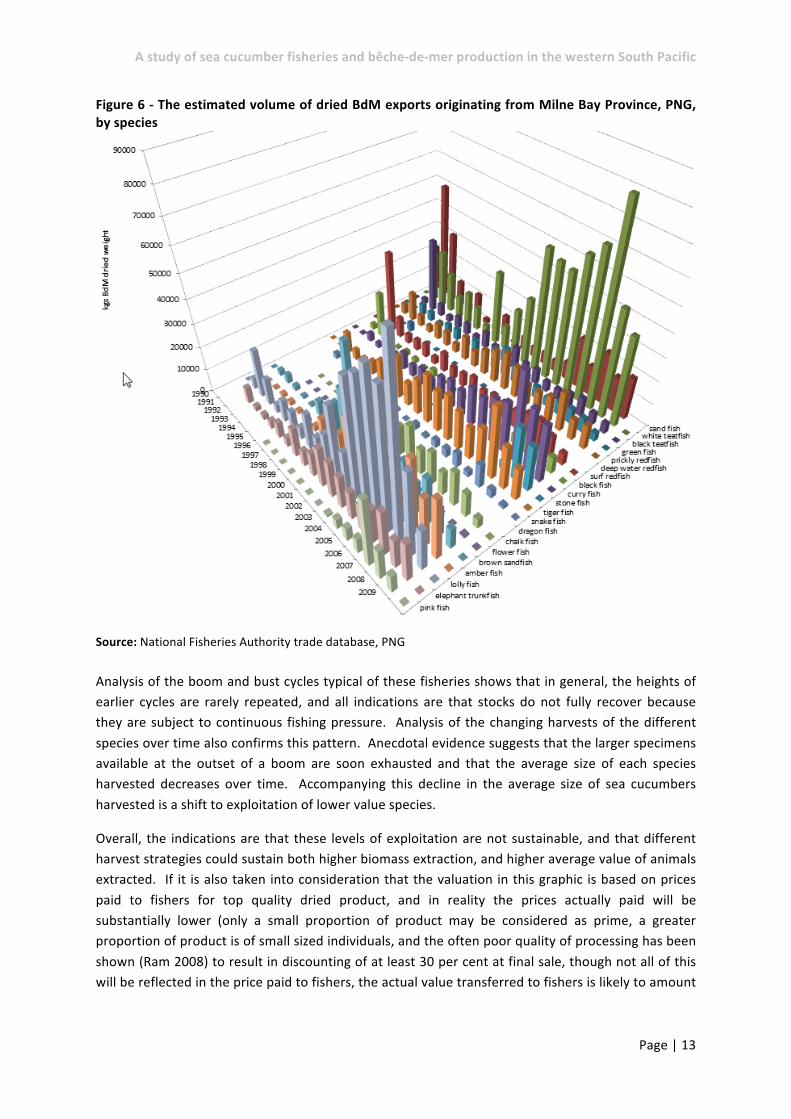
A study of sea cucumber fisheries and bêche-‐de-‐mer production in the western South Pacific
Page | 13
Figure 6 -‐ The estimated volume of dried BdM exports originating from Milne Bay Province, PNG, by species
Source: National Fisheries Authority trade database, PNG
Analysis of the boom and bust cycles typical of these fisheries shows that in general, the heights of earlier cycles are rarely repeated, and all indications are that stocks do not fully recover because they are subject to continuous fishing pressure. Analysis of the changing harvests of the different species over time also confirms this pattern. Anecdotal evidence suggests that the larger specimens available at the outset of a boom are soon exhausted and that the average size of each species harvested decreases over time. Accompanying this decline in the average size of sea cucumbers harvested is a shift to exploitation of lower value species.
Overall, the indications are that these levels of exploitation are not sustainable, and that different harvest strategies could sustain both higher biomass extraction, and higher average value of animals extracted. If it is also taken into consideration that the valuation in this graphic is based on prices paid to fishers for top quality dried product, and in reality the prices actually paid will be substantially lower (only a small proportion of product may be considered as prime, a greater proportion of product is of small sized individuals, and the often poor quality of processing has been shown (Ram 2008) to result in discounting of at least 30 per cent at final sale, though not all of this will be reflected in the price paid to fishers, the actual value transferred to fishers is likely to amount

A study of sea cucumber fisheries and bêche-‐de-‐mer production in the western South Pacific
Page | 14
to between half and two thirds of this generous valuation – i.e. between USD 17 million and USD 22 million.
Figure 7 -‐ Division of area according to existing administrative boundaries
1 Western (Fly) 13 Milne Bay 25 Sanma 2 Gulf 14 AR Bougainville 26 Penama 3 Central 15 Choiseul 27 Malampa 4 Sandaun (West Sepik) 16 Western 28 Shefa 5 East Sepik 17 Isabel 29 Tafea 6 Madang 18 Central 30 Western 7 Manus 19 Guadalcanal 31 Northern 8 West New Britain 20 Rennel & Belona 32 Central 9 East New Britain 21 Malaita 33 Eastern 10 New Ireland 22 Makira-‐Ulawa 34 Vava'u 11 Morobe 23 Temotu 35 Haapai 12 Oro (Northern) 24 Torba 36 Tongatapu
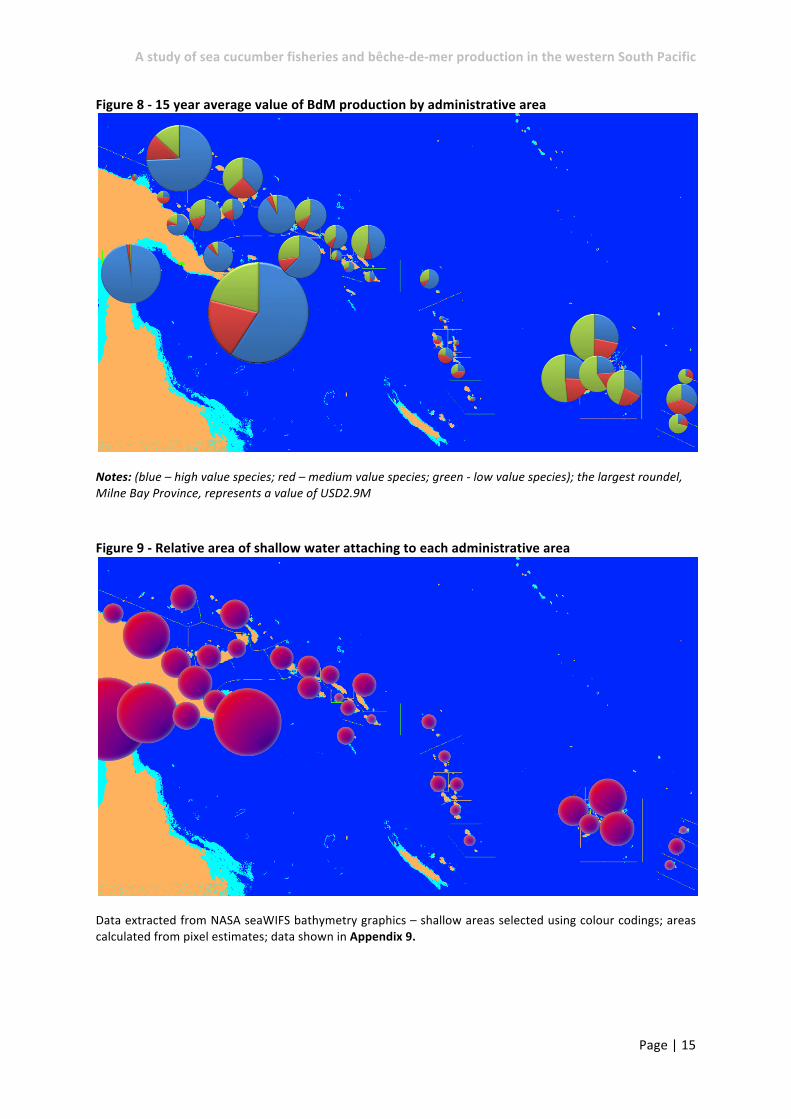
A study of sea cucumber fisheries and bêche-‐de-‐mer production in the western South Pacific
Page | 15
Figure 8 -‐ 15 year average value of BdM production by administrative area
Notes: (blue – high value species; red – medium value species; green -‐ low value species); the largest roundel, Milne Bay Province, represents a value of USD2.9M
Figure 9 -‐ Relative area of shallow water attaching to each administrative area
Data extracted from NASA seaWIFS bathymetry graphics – shallow areas selected using colour codings; areas calculated from pixel estimates; data shown in Appendix 9.

A study of sea cucumber fisheries and bêche-‐de-‐mer production in the western South Pacific
Page | 16
As something of a checkback exercise, we have estimated the area of shallow water (<20 m) attaching to each Province. These data are listed in Appendix 14, and illustrated graphically in Figure 9. This shows good general correlation with the data in Figure 8, with some possible aberrations evident with respect to PNG, possibly to do with the process of reallocation of product erroneously logged against Port Moresby26 (Port Moresby is home to the largest BdM exporters, but is itself not a production area). Figures 10 & 11 show the ratio of harvested biomass and value of production to the area of shallow water, with the species divided roughly by free dived harvests (the deeper water species – crudely estimated as white teatfish down to blackfish), gleaned harvests (shallow water species, crudely estimated as curryfish down to pinkfish), and separately for sandfish / golden sandfish27 (see also Appendix 10).
Figure 10 -‐ Sea cucumber harvest allocated by shallow water area for different target fisheries
Figure 10 indicates the anomalous nature of the Tongan fishery – very high exploitation relative to the available shallow water area. Also, there are comparable high levels of exploitation per unit area for gleaning species between the Solomon Islands and Fiji Provinces, but this is not so for Papua New Guinea (it is conjectured that in PNG there is less area suitable for gleaning). Figure 11 once again emphasises the anomalous nature of exploitation in Tonga (where it is assumed that exploitation levels are several times that which might be considered sustainable), but also shows the particularly high relative value of free dived product in the Provinces of Manus, PNG, and Western, Solomon Islands (the causes of which warrant further investigation).
An additional feature derived from examination of these datasets is that, in most Provinces, over seventy-‐five per cent of the value of harvests is down to between four and six dominant species. These dominant species per Province are shown in Appendix 16. White teatfish is dominant in all Provinces, and sandfish is dominant in those Provinces where it is fished. These high value species
26 This is an issue that the NFA database managers should be able to clarify once the source of export product has been corrected for data held in the inter-‐Provincial database 27 Note, the harvesting of sandfish has been banned in all countries for much of the last decade, except in PNG

A study of sea cucumber fisheries and bêche-‐de-‐mer production in the western South Pacific
Page | 17
are also often joined by surf redfish and black teatfish -‐ two other species often caught by free diving. For species mostly harvested through reef gleaning, lolly and snakefish appear most often.
The fact that most Provinces are economically dependent on only a few species of sea cucumbers suggests that focusing management intervention on these few species could provide dividends.
Figure 11 -‐ Value of harvested sea cucumber allocated by shallow water area for different target fisheries
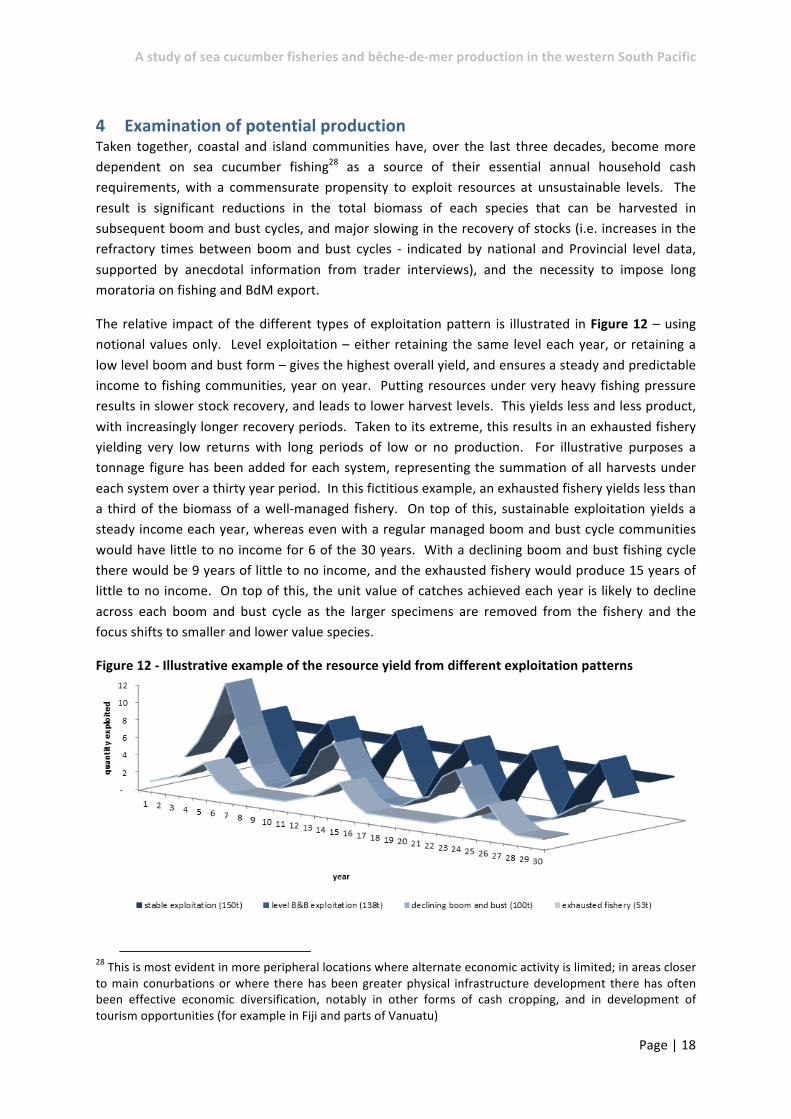
A study of sea cucumber fisheries and bêche-‐de-‐mer production in the western South Pacific
Page | 18
4 Examination of potential production Taken together, coastal and island communities have, over the last three decades, become more dependent on sea cucumber fishing28 as a source of their essential annual household cash requirements, with a commensurate propensity to exploit resources at unsustainable levels. The result is significant reductions in the total biomass of each species that can be harvested in subsequent boom and bust cycles, and major slowing in the recovery of stocks (i.e. increases in the refractory times between boom and bust cycles -‐ indicated by national and Provincial level data, supported by anecdotal information from trader interviews), and the necessity to impose long moratoria on fishing and BdM export.
The relative impact of the different types of exploitation pattern is illustrated in Figure 12 – using notional values only. Level exploitation – either retaining the same level each year, or retaining a low level boom and bust form – gives the highest overall yield, and ensures a steady and predictable income to fishing communities, year on year. Putting resources under very heavy fishing pressure results in slower stock recovery, and leads to lower harvest levels. This yields less and less product, with increasingly longer recovery periods. Taken to its extreme, this results in an exhausted fishery yielding very low returns with long periods of low or no production. For illustrative purposes a tonnage figure has been added for each system, representing the summation of all harvests under each system over a thirty year period. In this fictitious example, an exhausted fishery yields less than a third of the biomass of a well-‐managed fishery. On top of this, sustainable exploitation yields a steady income each year, whereas even with a regular managed boom and bust cycle communities would have little to no income for 6 of the 30 years. With a declining boom and bust fishing cycle there would be 9 years of little to no income, and the exhausted fishery would produce 15 years of little to no income. On top of this, the unit value of catches achieved each year is likely to decline across each boom and bust cycle as the larger specimens are removed from the fishery and the focus shifts to smaller and lower value species.
Figure 12 -‐ Illustrative example of the resource yield from different exploitation patterns
28 This is most evident in more peripheral locations where alternate economic activity is limited; in areas closer to main conurbations or where there has been greater physical infrastructure development there has often been effective economic diversification, notably in other forms of cash cropping, and in development of tourism opportunities (for example in Fiji and parts of Vanuatu)
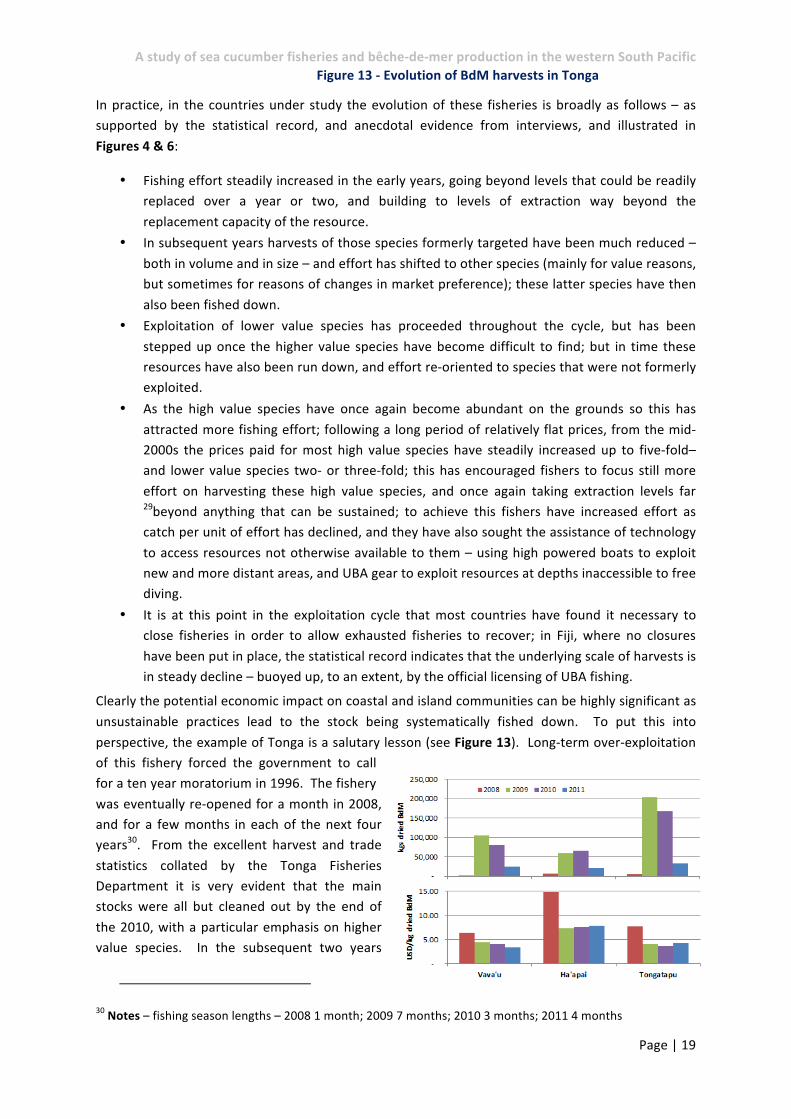
A study of sea cucumber fisheries and bêche-‐de-‐mer production in the western South Pacific
Page | 19
In practice, in the countries under study the evolution of these fisheries is broadly as follows – as supported by the statistical record, and anecdotal evidence from interviews, and illustrated in Figures 4 & 6:
• Fishing effort steadily increased in the early years, going beyond levels that could be readily replaced over a year or two, and building to levels of extraction way beyond the replacement capacity of the resource.
• In subsequent years harvests of those species formerly targeted have been much reduced – both in volume and in size – and effort has shifted to other species (mainly for value reasons, but sometimes for reasons of changes in market preference); these latter species have then also been fished down.
• Exploitation of lower value species has proceeded throughout the cycle, but has been stepped up once the higher value species have become difficult to find; but in time these resources have also been run down, and effort re-‐oriented to species that were not formerly exploited.
• As the high value species have once again become abundant on the grounds so this has attracted more fishing effort; following a long period of relatively flat prices, from the mid-‐2000s the prices paid for most high value species have steadily increased up to five-‐fold– and lower value species two-‐ or three-‐fold; this has encouraged fishers to focus still more effort on harvesting these high value species, and once again taking extraction levels far 29beyond anything that can be sustained; to achieve this fishers have increased effort as catch per unit of effort has declined, and they have also sought the assistance of technology to access resources not otherwise available to them – using high powered boats to exploit new and more distant areas, and UBA gear to exploit resources at depths inaccessible to free diving.
• It is at this point in the exploitation cycle that most countries have found it necessary to close fisheries in order to allow exhausted fisheries to recover; in Fiji, where no closures have been put in place, the statistical record indicates that the underlying scale of harvests is in steady decline – buoyed up, to an extent, by the official licensing of UBA fishing.
Clearly the potential economic impact on coastal and island communities can be highly significant as unsustainable practices lead to the stock being systematically fished down. To put this into perspective, the example of Tonga is a salutary lesson (see Figure 13). Long-‐term over-‐exploitation of this fishery forced the government to call for a ten year moratorium in 1996. The fishery was eventually re-‐opened for a month in 2008, and for a few months in each of the next four years30. From the excellent harvest and trade statistics collated by the Tonga Fisheries Department it is very evident that the main stocks were all but cleaned out by the end of the 2010, with a particular emphasis on higher value species. In the subsequent two years
30 Notes – fishing season lengths – 2008 1 month; 2009 7 months; 2010 3 months; 2011 4 months
Figure 13 -‐ Evolution of BdM harvests in Tonga
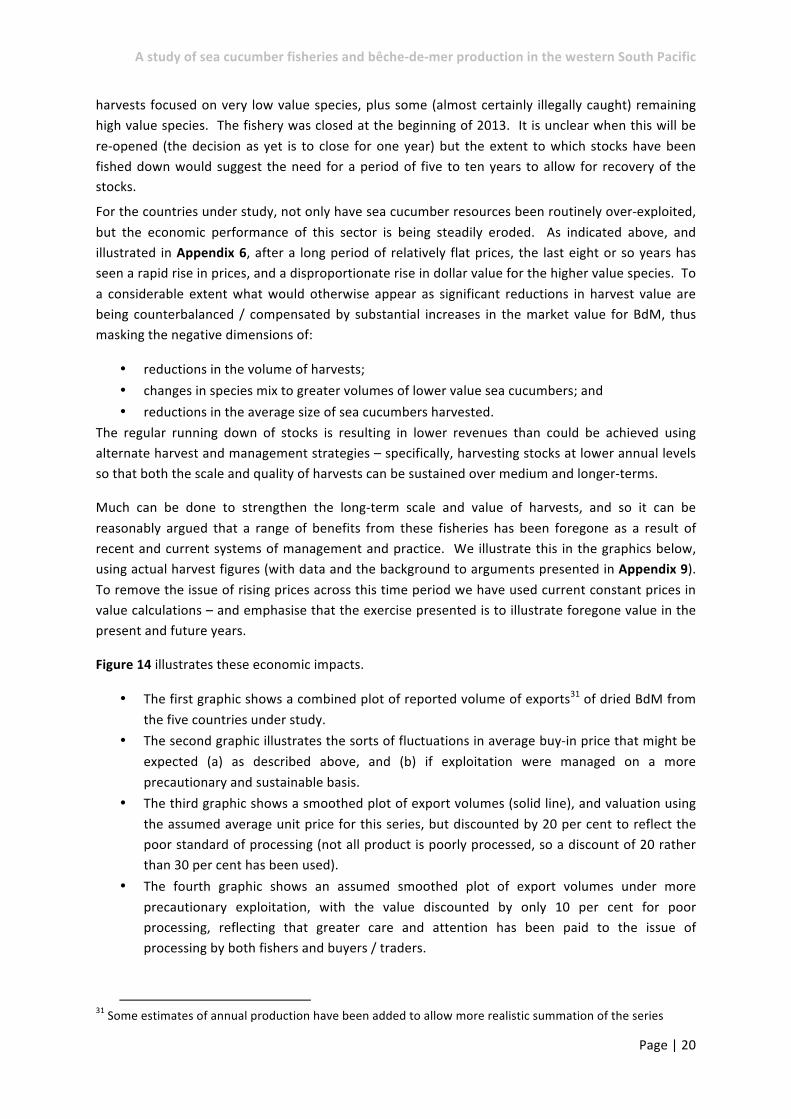
A study of sea cucumber fisheries and bêche-‐de-‐mer production in the western South Pacific
Page | 20
harvests focused on very low value species, plus some (almost certainly illegally caught) remaining high value species. The fishery was closed at the beginning of 2013. It is unclear when this will be re-‐opened (the decision as yet is to close for one year) but the extent to which stocks have been fished down would suggest the need for a period of five to ten years to allow for recovery of the stocks.
For the countries under study, not only have sea cucumber resources been routinely over-‐exploited, but the economic performance of this sector is being steadily eroded. As indicated above, and illustrated in Appendix 6, after a long period of relatively flat prices, the last eight or so years has seen a rapid rise in prices, and a disproportionate rise in dollar value for the higher value species. To a considerable extent what would otherwise appear as significant reductions in harvest value are being counterbalanced / compensated by substantial increases in the market value for BdM, thus masking the negative dimensions of:
• reductions in the volume of harvests; • changes in species mix to greater volumes of lower value sea cucumbers; and • reductions in the average size of sea cucumbers harvested.
The regular running down of stocks is resulting in lower revenues than could be achieved using alternate harvest and management strategies – specifically, harvesting stocks at lower annual levels so that both the scale and quality of harvests can be sustained over medium and longer-‐terms.
Much can be done to strengthen the long-‐term scale and value of harvests, and so it can be reasonably argued that a range of benefits from these fisheries has been foregone as a result of recent and current systems of management and practice. We illustrate this in the graphics below, using actual harvest figures (with data and the background to arguments presented in Appendix 9). To remove the issue of rising prices across this time period we have used current constant prices in value calculations – and emphasise that the exercise presented is to illustrate foregone value in the present and future years.
Figure 14 illustrates these economic impacts.
• The first graphic shows a combined plot of reported volume of exports31 of dried BdM from the five countries under study.
• The second graphic illustrates the sorts of fluctuations in average buy-‐in price that might be expected (a) as described above, and (b) if exploitation were managed on a more precautionary and sustainable basis.
• The third graphic shows a smoothed plot of export volumes (solid line), and valuation using the assumed average unit price for this series, but discounted by 20 per cent to reflect the poor standard of processing (not all product is poorly processed, so a discount of 20 rather than 30 per cent has been used).
• The fourth graphic shows an assumed smoothed plot of export volumes under more precautionary exploitation, with the value discounted by only 10 per cent for poor processing, reflecting that greater care and attention has been paid to the issue of processing by both fishers and buyers / traders.
31 Some estimates of annual production have been added to allow more realistic summation of the series

A study of sea cucumber fisheries and bêche-‐de-‐mer production in the western South Pacific
Page | 21
Fig 14 – Illustration of valuation of BdM exports under different assumptions
Plot of regional exports of BdM (t, dried weight) – taken from export statistics for the five countries under study
Likely average unit buy-‐in price at today’s prices (USD/kg dried weight) – i.e. price reflects changes in species mix and size; red – over-‐exploitation; blue – sustainable exploitation
Smoothed production curve under current over-‐exploited scenario; solid line is production (t, dried weight) left hand axis; dotted line is value, including 20% discount for poor processing (USD’000s) right hand axis
Smoothed production curve under sustainable scenario; solid line is production (t, dried weight) left hand axis; dotted line is value, including 20% discount for poor processing (USD’000s) right hand axis

A study of sea cucumber fisheries and bêche-‐de-‐mer production in the western South Pacific
Page | 22
Overall, this exercise suggests that more sustainable management32 might yield 10 per cent less in export volume, but 25 per cent more in export value without processing discount (valued at buy-‐in price), and some 50 per cent more if the processing discount is applied. Limited to the time series covering the last fifteen years (representing a period of stability -‐ stock condition, though weakened, has been more consistent), the difference is still greater – about a 5 per cent increase in volume over the period, but an 80 per cent increase in value without the processing discount, and a 100 per cent increase in value with the processing discount. Using constant prices (based on current buy-‐in prices), this suggests that income to coastal and island communities would have ranged from between USD 24 million at the highest peak in the late 1990s, down through about USD 12 million a year to a current level of some USD 4 million (though remembering that this incorporates reduced production where three of the five fisheries are closed – compensating measures for earlier over-‐exploitation). Under the more precautionary and sustainable scenario described above, this would translate into annual value of between USD 16 million and USD 22 million (rather than the USD 4 million to USD 12 million referred to above).
Across the most recent fifteen year time series, this translates into revenue generation of some USD 160 million under current circumstances, and USD 320 million under more precautionary management and improved standards of processing. Clearly the difference is huge. But it also comes with other distinct advantages [expressed through Recommendation 1]:
• under the more precautionary management there is no need for moratoria, coastal and island communities can generate income from sea cucumber harvesting and processing each and every year, and the harvesting regime becomes more predictable – for fishers, communities, managers, traders, and the market; bearing in mind that many of these fisheries are currently over-‐exploited and/or in recovery this more stable management regime would need to be preceded by period of managed stock recovery;
• the pressure to engage in IUU fishing is arguably less, and the processes by which IUU fishing can be detected and disincentives applied become that much easier;
• more consistent and predictable levels of income are also likely to provide greater incentive for coastal and island communities to take increased control over their fisheries;
• the Provincial focus that has been utilised in our analysis is also likely to provide impetus for significant improvement in the capacity of Provinces to manage and monitor this and other coastal fisheries.
This alternate management regime presents very significant benefits to coastal and island communities, and to Provincial and national administrations. And even the raised costs of sector management and administration are balanced by resource use and economic improvements well beyond the BdM sector.
32 It should be stressed that this analysis is based primarily on the trade record, albeit with some recognition of biological processes; in terms of determining a biologically sustainable level of exploitation, key data (size distribution of animals, and the area over which they exist) that would allow the calculation of stock size, biomass, and MSY are missing – except in the work currently being undertaken in Vanuatu, where stock assessments are being prepared on a small-‐area basis (Leopold et al 2013 and Duvauchelle 2010); as an alternate approach to modelling stock size, condition and MSY we have undertaken preliminary modelling of the trade and value record – with encouraging results (see Appendix 17), and are of the strong view that this warrants further work; the figures emerging from this modelling, which was based on the trade series for Milne Bay, bear credible similarity to exploitation levels proposed by the NFA, but we would caution that further work needs to be undertaken to bring these approaches together in support of a single fishery management proposal

A study of sea cucumber fisheries and bêche-‐de-‐mer production in the western South Pacific
Page | 23
On this basis, in 2006, regional harvests were about 930 t, representing a current value of some USD 15.8 million. Under a more moderate exploitation regime, our estimation is that the harvest volume could have been in the order of 850 t, representing a current value of some USD 18.4 million. In subsequent years, the fisheries of PNG, the Solomon Islands and Vanuatu were closed to allow stock recovery, and to compensate for previous excessive harvests. The Tonga fishery was opened, but was all but exhausted by the end of 2012. The Fiji fishery has remained open, but harvests have been well below those achieved in the 1980s and 1990s. In the years 2007 to 2012, the five countries under study actually exported an average of some 600 t of BdM per year, whereas under precautionary management this would have been closer to 1,000 t per year, and increased annual revenues by some USD 13 million.
A study of sea cucumber fisheries and bêche-‐de-‐mer production in the western South Pacific
Page | 24
5 Approaches to the management of sea cucumber fisheries This section offers a brief introduction to global experience in the management of sea cucumber fisheries including a brief assessment of the strengths and weaknesses of alternative approaches, and opportunities to reinforce implementation of these approaches through economic and fiscal measures.
5.1 Status and pressures Experience of sea cucumber fisheries management in the Pacific and globally has been reviewed and summarized by Kinch et al (2008), Purcell et al (2011), and Anderson et al (2011). Many of the management issues are also addressed in FAO (2012) and have been touched on in earlier sections of this report. According to these and other studies, the key management issues include the following.
There are significant problems associated with the management of sea cucumber species, with many / most showing the signs of over-‐exploitation:
• 38% of sea cucumber fisheries globally are currently over-‐exploited (Purcell et al 2011) -‐ many of these in the Pacific;
• regional assessments have revealed that population declines from overfishing occurred in 81% of sea cucumber fisheries, average harvested body size declined in 35%, harvesters moved from near-‐ to off-‐shore regions in 51%, and from high-‐ to low-‐value species in 76%, of fisheries;
• thirty-‐eight per cent of sea cucumber fisheries remained unregulated, and illegal catches were of concern in half (Anderson et al 2011).
Pressure on fisheries in recent years has been increasingly intense, associated with:
• increasing access to markets and high prices since the 1980s; • increased use of boats allowing for exploitation of previously virgin stock; • poverty coupled with aspiration (for example drive to earn school fees)33 -‐ such that there is
an incentive to fish even when density is extremely low; CPUE in parts of PNG has been estimated as low as 1 in 10 hours (Purcell et al 2009)
Furthermore, sea cucumbers are highly vulnerable to over-‐exploitation, being:
• sedentary shallow water animals and readily accessible for harvesting; • long lived, slow to mature, broadcast spawners dependent on minimum density for
successful reproduction (the “Allee effect”); • mixed species fisheries -‐ where target species dip below commercial densities, fishers still
fish -‐ primarily for other species, but continue nonetheless to catch previous target species, pushing it further below viability, and possibly towards local extinction.
5.2 Management response A wide range of management instruments have been applied – mediated through customary marine tenure, provincial and national government initiatives, aid projects and NGO organisations. They
33 Stock depletion and over-‐exploitation has been shown to be correlated with low human development index and poor enforcement of regulations (Purcell et al 2011)

A study of sea cucumber fisheries and bêche-‐de-‐mer production in the western South Pacific
Page | 25
have included size limits, gear restrictions, spatial and temporal closures, quotas and marine reserves.
Use of different management measures in sea cucumber fisheries worldwide has been reviewed by Purcell et al 2009, and the frequency of use of these measures is summarized in Table 3.
Table 3 -‐ Use of different management tools in sea cucumber fisheries worldwide (after Purcell et al 2009)
Management tool Proportion of sea cucumber fisheries
moratoria 39% gear restrictions 39% minimum size limits 34% catch quotas 28% fleet controls (numbers or size of vessels) 22% rotational harvest strategies (industrial fisheries only) 5%
Broadly speaking these have failed to curb overfishing. The main reasons relate to the powerful drivers and the ease of over-‐exploitation as described above, as well as more practical issues of limited funds and lack of enforcement, especially where large numbers of widely dispersed fishers are involved (the prevailing conditions found in the study area). Limited knowledge and understanding, corruption, and conflicts of interest between different levels and agencies of government, politicians and private sector are also important.
As reported in previous sections, this management failure has led to crisis management in the form of moratoria, which have been introduced in many countries in the Pacific and elsewhere, including Solomon Islands, Fiji, Papua New Guinea, Tonga, Vanuatu, Commonwealth of the Northern Mariana Islands, Costa Rica, mainland Ecuador, Egypt, India, Mauritius, Mayotte (France), Panama, mainland Tanzania and Venezuela (Purcell 2010). Despite these extreme measures populations of some species have failed to recover, and there are examples from the past where there has been no recovery even 50 years after fishing stopped (Battaglene & Bell 2004), and local extinctions have been reported (Friedman et al 2011).
There are, however, some examples of what appear to be sustainable sea cucumber fisheries, and Purcell et al (2011) -‐ based on a global review -‐ concluded that success related to a number of factors including enforcement capacity, number of species harvested, fleet (vessel) controls, limited entry controls, and rotational closures. It is unclear, however, that these factors apply to the small scale and disparate sea cucumber fisheries in Melanesia.
There is also a widespread view – especially so in the Pacific Islands -‐ that more effective management will depend on empowering local management systems with help / support / advice from central government fisheries services, though instances of the successful achievement of this are limited. According to Purcell et al 2009 co-‐management systems existed in just 12% of sea cucumber fisheries (Fiji, Galapagos Islands, Kenya, Madagascar, Mexico (Pacific coast), Niue, Samoa, Saudi Arabia and Tuvalu) though a greater emphasis is widely anticipated amongst fishery managers. There is a substantial literature on this subject and well established basic principles (e.g. Cinnera et al 2009; Castilla & Defeo 2001; Charles & Wilson 2009; Gutiérrez et al 2011). Given the very strong

A study of sea cucumber fisheries and bêche-‐de-‐mer production in the western South Pacific
Page | 26
drivers of over-‐fishing, however, and the high vulnerability of sea cucumber to over-‐exploitation, it is clear that empowerment of local communities is likely to be only one part of a more comprehensive approach to regulating and managing sea cucumber exploitation.
It is notable that the use of fiscal and economic tools to reinforce fisheries management is hardly referred to in the literature on sea cucumber management; and indeed is little discussed in the general fisheries management literature, except in relation to quota valuation and trading.
5.3 Stock assessment One of the weaknesses of management to date has been the lack of clear relationship between the state of the stock and management response. This relates in large part to the difficulties of stock assessment, which in turn is related to:
• the number of species involved; • the difficulty of larvae identification; • cryptic juveniles; • the difficulty of tagging soft bodied animals; • no clear age weight relationship; and • difficulties in establishing recruitment to the spawning stock.
Young and adult sea cucumbers (excluding juveniles) are, however, relatively easy to find, measure / weigh and count, and size distributions and density mapping by species is relatively straightforward. Estimating potential productivity from habitat mapping coupled with some biological characteristics may offer a way forward, but is complicated by the limited availability of habitat maps, and the fact that the relative distribution of different sea cucumber species is not clearly delimited by habitat. Nonetheless, the combination of habitat mapping and density survey might allow for rough estimates of productivity and stock status (see for example, Hamel et al 2010; Hajas 2011; Skewes et al 2010; Skewes et al 2006; Skewes et al 2004; Preston & Lokani 1990) and possibly modelling estimates of target reference points.
In Melanesia the health of stocks has been periodically monitored through surveys focused on recording the densities of the different species in different habitats. Over time these data have been used to come up with threshold values of what might be considered indicators of a healthy stock.
Data on CPUE by species may also be readily collected, and this might be put together with information on size frequency to generate better stock estimates. CPUE may, however, be problematic: fishers strategically change species according to relative abundance (cost of capture) and relative price. There are also differences in fishing methods, habitats fished, and fishers may also target other species such as Trochus. Data on CPUE is therefore unlikely to be consistent or comparable. But since CPUE could be relatively easily measured at the community level, it could be used as a local ‘trigger point’ for enforcement of the move-‐on strategy.
As part of this study we have, however, explored the potential use of species trade data (an index of catch) and value data (a proxy for effort) as a means of assessing stock size and MSY (using a methodology adapted from Vasconcellos & Cochrane 2005). Acceptable model fitting was achieved, yielding estimates of stock size, MSY and the likely impacts of different Harvest Control Rules – see Appendix 17. Our conclusion is that this is a valid and practical means of estimating key stock parameters where good time series trade data is available discriminated by species. With further

A study of sea cucumber fisheries and bêche-‐de-‐mer production in the western South Pacific
Page | 27
work, and particularly the development and testing of a more sophisticated probability (Bayesian) model, it is felt that this would provide a valuable and quantitatively-‐based addition to the information available for managing these fisheries. The value of such modelling could only be further strengthened where additional data-‐sets were available indicating the size composition of exports, and the spatial distribution of each species (linking to habitat data).
5.4 Regulations and potential harvest control rules (HCRs) Depending on the information available and the management institutions in place, general restrictions or more specific harvest rules or targets for the country, district, lagoon, reef, etc. may be set.
Density limits Minimum viable population density has been discussed as a possible HCR. Bell et al (2008) review the limited research on minimum viable densities for successful fertilization in sea cucumbers, and speculate that the “threshold densities to avoid depensation for most tropical sea cucumbers will be in the range of 10 to 50 individuals ha-‐1 over substantial areas, depending on species and location”. Purcell (2009) suggests the following rules of thumb: <100/ha = low; <30/ha = near critical for population maintenance. Higher target densities based on target reference points would depend on more sophisticated stock assessment models (SPC working density thresholds, developed through its coordination of fishery independent density surveys, are shown in Appendix 7).
The objective of any such HCR would be to maintain a minimum viable density to ensure recruitment.
This kind of rule would have to be implemented through strong and effective community based management. There are, however, limited opportunities to reinforce compliance to any such density-‐related rule through fiscal or economic measures, or inspections at trading or export stations, and their effectiveness would rely heavily on local or community based management.
Reserve areas/geographic closures Reserves or MPAs are widely discussed as a possible way forward. Based on analysis of the movements of sandfish, Purcell & Kirby (2006) suggest that reserves of a couple of hundred hectares would probably be sufficient for preserving and promoting breeding populations of sea cucumbers, giant clams and trochus, and that these could serve as sources of larvae for fished sites.
Rotational closures have been used, for example, in Washington State in the US, based on a six month fishing season, limited entry, and a rotation of harvest between four areas to give the resource a 3.5 year period for reproduction. The effectiveness of rotational reserves for slow growing species has, however, been questioned by some authors (for example, Cohen & Foale 2012). Furthermore, most Pacific Island coastal communities tend to harvest from relatively small areas, where the use of rotational closures may be impractical. Protected areas may also be associated with compensation schemes – but these can be difficult to apply, and controversial.
Seasonal closures/open seasons The limited movement of these organisms and other life cycle characteristics is such that there is limited rationale for seasonal closure to protect spawning stock (e.g. breeding aggregations) or vulnerable juveniles. A limited nationally or regionally coordinated open season may, however,
A study of sea cucumber fisheries and bêche-‐de-‐mer production in the western South Pacific
Page | 28
serve as a simple rough measure to limit total catch and to maximise product availability at times of highest demand.
From the perspective of monitoring and enforcement at the point of export (where product concentration occurs and where MCS resources can be most easily focused) it would be difficult to police the situation where different parts of a country were subject to different open and closed seasons. But it remains the case that at the local level most sea cucumber resources could be rationally exploited in relatively short periods of time – and conversely could be easily over-‐fished if fishing activity was not constrained. In this context pulse fishing offers a more appropriate means of controlling fishing effort (a measure examined by Friedmann et al 2011). Activity at the community level could be restricted to a few short fishing seasons, each lasting a matter of days or weeks.
Whilst there is no obvious rationale for having a closed season to protect spawning stock, allowing buyers and exporters the opportunity to do business across the year is likely to undermine more local management measures, and add to the costs of MCS, and should be seen as non-‐precautionary. Thus there may be some opportunities here to promote compliance through cost effective measures at trading stations or points of export. Clearly, trading outside the season would raise questions (though the ability to hold over BdM within the supply chain makes strict policing of closed seasons at the point of export difficult). It is for this reason that the use of national closed seasons should be accompanied by the application of export caps, per species – as a means of making stock-‐piling and contravention of other controls less commercially attractive. Accordingly it is for the purposes of controlling trading rather than fishing activity that it is recommended that national closed seasons should be maintained – ideally lasting between six and nine months or more.
Tonga limits fishing to a short season of three months, though in the five years that this has been applied this restriction has been subject to significant variation. Fishing in the Solomon Islands and Vanuatu has also been subject to some degree to seasonal closures.
Simple bans on, for example, fishing at night have also been introduced for some fisheries.
Rotational closures have also been advocated – where a proportion of the stock / habitat is fished on a regular cycle allowing stocks to rebuild between harvests. This may be more difficult to implement in respect of small local fisheries and policing may be expensive.
Size limits Sea cucumbers generally become sexually mature when they reach significant size and there is some limited data available on this issue (Conand 1993). This suggests simple size rules relating to groups might be feasible – for example fresh weight limits.
Minimum legal weights and lengths per species are already in placed in each country under study. For example (from Appendix 7):
kgs – wet weight prickly redfish 3.5 white teatfish 2.5

A study of sea cucumber fisheries and bêche-‐de-‐mer production in the western South Pacific
Page | 29
curryfish 2.1 elephant trunk 2.0 golden sandfish 1.4 surf redfish 0.85
deepwater redfish 0.4
In principle inspecting consignments for size at key trading posts and/or at the point of export should be possible (it is already covered by legislation, but only rarely put into practice), and economic disincentives (taxes or fines) should be applicable. It has been suggested that it is difficult to identify species once processed, and thus control at processor / export species level may be difficult. Against this, however, is the counter-‐argument that identification skills can be readily acquired using well developed guides on species identification (for example Purcell et al 2012, and various SPC identification sheets and posters).
Gear bans Some countries implement bans on the use of scuba or hookah in order to protect a reservoir of larger animals in deeper water. Gear bans are not amenable to reinforcement at national level but should be relatively easy to implement at local or provincial level through confiscation of gear.
Catch targets / quotas Quotas may be set for individuals, families, boats, communities, lagoons, provinces or even countries, and may be implemented as bag limits, total quantity limits or as management targets to be achieved through other means. Given that some species are both more valuable and more vulnerable from a biological perspective, targeted measures to protect these species through species harvest or trade quotas or bans rather than full blown moratoria may be attempted, but compliance is less easily assured. Controls at point of export have been applied with a fair degree of success (all export shipments are required to be accompanied by comprehensive documentation, and subject to inspection), but it has been clearly shown that not all BdM is exported through formal channels (experiences in PNG and the Solomon Islands). Tonga and PNG have previously sought to set Provincial harvest quotas – Tonga by species, PNG by high and low value species categories – but neither has to date been effectively applied.
Setting appropriate limits to the catch from a sea cucumber fishery as a whole or in respect of particular species is difficult given the limited state of knowledge of population dynamics and stock productivity. Also “high-‐density patches are the first to be targeted by fishers in a fishery regulated by catch or effort limits, making management measures such as total allowable catch (TAC) inappropriate in the fisheries for these species” (Castilla & Defeo 2001). To be more effective, a TAC would necessarily have to be accompanied by several HCRs, including a move-‐on rule (for example, once catch rates or observed densities per species fall below threshold levels, fishers need to move on to other grounds).
Notwithstanding these reservations, a global review suggests that quotas work (Costello et al 2008). Furthermore, modelling based on various datasets – catches, size distribution, density, prices – can certainly assist in this area, and can be further supported from practice (operation of an adaptive management regime), and more subjective survey information (fishermen’s / trader’s views on catch per unit effort; average sizes caught; abundance).

A study of sea cucumber fisheries and bêche-‐de-‐mer production in the western South Pacific
Page | 30
In Tonga and PNG information on habitat distribution and species density has been used to set annual catch quotas, either by species or by value group. Unfortunately such quota setting has never been effectively applied, undermined by either ad hoc changes to the length of fishing seasons or simply not backed up with monitoring and enforcement (though in the latter case, in PNG, quota setting does appear to have encouraged some degree or restraint amongst exporters). But the bottom line is that in neither case has this process proved effective in that stocks have continued to show evidence of over-‐exploitation. Nonetheless, the process of setting species or species group quotas is still considered to contribute to effective and informed management, albeit that the levels need to be set at substantially lower levels if sustainability aspirations are to be met.
A review of past exploitation and export levels, by species, and where possible by Province, suggests that a reasoned basis for establishment of national and provincial annual production / export quota ceilings can be presented. Preliminary work to fit a predictive model to the available information – using in the first instance export quantities by species and price differentials – suggests that further modelling, incorporating more biological data (abundance, population structure), should be able to provide additional support for and confidence in the setting of provincial quotas.
Given the largely sessile nature of these organisms, the limited range of larval dispersion and recruitment to commercial stocks, and the very local nature of exploitation, the setting of quotas is not a precise activity, and whilst it should provide a useful control at national and Provincial levels, it would be inappropriate to extend this particular system to the local level. What is proposed is that local communities be encouraged to set and apply harvest control rules (HCRs) based on changes in the average size of sea cucumbers harvested – shifting effort between stocks or stock groups, and where feasible using area closures.
5.5 Broader measures Re-‐stocking and stock enhancement offer some opportunities to re-‐establish depleted fisheries. This is likely to be very expensive, however, unless the resulting stock is then subject to a highly effective management regime. In other words, effective management would be a pre-‐condition for cost effective stocking, not vice versa.
Limits to entry, including restricted allocation of quota (individual quota) are likely to be controversial for a small scale fishery with very broad participation such as sea cucumber. It is also likely to be very difficult to implement unless a particular community with very strong ties and well established and respected local authority systems decides to implement such a system. This is unfortunate insofar as ITQ systems represent the classic mechanism by which market and economic incentives are used to promote improved fisheries management.
5.6 Implementation There are three key elements to effective implementation of harvest control rules:
• reduce the drivers to over-‐exploitation; • agree on practical and effective harvest control rules; and • strengthen compliance through legal and financial incentives and disincentives.
Practical and effective HCRs will be highly fishery and context dependent, and will normally need to be agreed at local, provincial or national levels. Their efficacy will also depend on the extent to which they can be reinforced through information, education, regulation and economic incentives.

A study of sea cucumber fisheries and bêche-‐de-‐mer production in the western South Pacific
Page | 31
To date rather little attention has been paid to manipulating the drivers of over-‐exploitation or using fiscal and economic measures to promote compliance. Opportunities to introduce such measures are addressed in the following sections.
On balance, most of the measures discussed would be all the more effective if combined with limited fishing seasons (input control), controls on fishing methods (input control), minimum size restrictions (output control), and more effective monitoring of supply chain throughput (output control).
A study of sea cucumber fisheries and bêche-‐de-‐mer production in the western South Pacific
Page | 32
6 Fiscal, economic and trade measures Sector management can be substantially improved through the use of a variety of fiscal, economic and trade tools – as a means of regulation, as a means of providing incentive or disincentive to certain behaviour, and as a means for providing the environment within which market forces can encourage and maintain discipline. Such tools can also be used to support and/or deliver on particular policy objectives, including the potential to recoup all or part of the costs of management and regulation.
In the following section we discuss these tools under four distinct headings:
• Information and its veracity – informing policy and practice • Limiting resource access as a means of encouraging economic as well as biological
optimisation -‐ input controls & output controls • Cost recovery mechanisms, and a sub-‐set of fiscal incentives to specific behaviour
patterns and policy objectives. • Providing disincentives to non-‐compliance and illegal behaviour (MCS and anti IUU
actions)
6.1 Informing policy
Information
At the heart of defining, monitoring and adjusting fiscal, economic and trade measures is access to good and dependable information – on the participants in the trade, trade throughput, composition, quality, value, export flow (source and destination) and on the structure of the supply chain. All the countries studied have well developed trade data collection systems in place, but data is collected inconsistently, it is not routinely used for management purposes, and as such limited attention is paid to quality and relevance. This is a lost opportunity, and can be corrected with the application of very little in the way of additional resources. [Further information on trade structure and data systems is described, by country, at Annex 2, and in Appendices 19, 20 & 21].
Much valuable information that can be obtained from trade datasets, as such datasets provide a potent basis for management of both the BdM trade but also sea cucumber exploitation. Some attempt has been made to use harvest quotas as a management tool in both PNG and Tonga, but in both cases there has been little effort applied to follow up on the application of this tool, and the available data sets have not really been exploited for management purposes.
This is a lost opportunity, especially as these data are already routinely collected by both Fishery and Customs Departments in each country, but in virtually all cases the data collection processes are not applied to their fullest extent.
• Tonga has the most extensive data collection system, greatly facilitated by its centralisation of processing and trade through the issuing of a small number of processor and exporter licenses [though it should be pointed out that this is a model that cannot be widely applied across the region]. Nonetheless, these data are not routinely used for management purposes, and the number of licenses and the length of open seasons have been regularly subverted under commercial and political pressure. In the Tonga example, the island quotas set for each species can be seen to have been set too high if it is a sustainable exploitation pattern that is being sought from a policy perspective. What has actually happened is that a

A study of sea cucumber fisheries and bêche-‐de-‐mer production in the western South Pacific
Page | 33
boom and bust cycle has been condensed into a three to four year period, and a long period will now be required to allow stocks to recover (all the longer now because the most recent fishing seasons have been further extended, and illegal hookah fishing of deep water teatfish has not been closed down).
• In the case of PNG (where the fishery remains closed), data collection has been very thorough, but has not been routinely used for management purposes. Purchase, export and inter-‐Provincial transfer data are routinely collated, but these data are not resolved to provide a comprehensive picture of fishing, processing and trading activity – crucially the inter-‐Provincial dataset is not used to correct the export dataset (about forty per cent of exports are registered inaccurately as originating from Port Moresby, but no fishing of sea cucumber takes place there)34. Given the sheer physical scale and diversity of the country, and the very limited administrative resources available at Provincial level for sea cucumber / BdM data collection, inspections and management, the coverage and detail of the information held is very impressive. And it is all the more so, where both the NFA and Customs are the only authorities in the region to require that all export documentation also includes a copy of the commercial invoice covering an export shipment, detailing the company that is importing the product, and the fob prices governing the transaction. This enables the authorities to monitor price changes, but also to identify where prices are being manipulated, and where transfer pricing is being used. It should also be noted that a joint NFA and exporter trade mission was mounted to Hong Kong and Guangzhou a couple of years after the moratorium had been put in place, for the purposes of monitoring the trade at the market end, and to determine the scale of illegal exports of product from PNG to China. This is the only example of fishery managers making enquiries at the market end (though it should be noted that in 2011/12, a research mission to the Chinese markets was undertaken on behalf of the governments of Fiji, Tonga and Kiribati35 (Purcell et al 2012).
The major weaknesses identified in the collection and collation of trade and harvest data are that data collection protocols are not applied consistently, and the checking and analysis of data is not undertaken routinely (a process that would allow the information to be used for management purposes, but which would also expose inconsistencies and errors). Crucially data are not routinely collected in the Solomons, Vanuatu and Fiji on purchases, by species, and by Province, despite the fact some processors, buyers and traders do provide such disaggregated data. Taken to its extreme, in Tonga processors provide monthly returns that identify the species and quantities of sea cucumber purchased, and include who the purchase was made from, and where the sea cucumber was caught or what village the fishermen came from; PNG employs a similar system. These data are not used to assess exploitation patterns – which could allow local communities much greater informed control on their activities. Similar data is collected in Vanuatu, but it applies to only a few
34 There has been regular discussion within CITES (the Convention on International Trade in Endangered Species of Wild Fauna and Flora), including in its latest 2013 Conference of the Parties (CoP) meeting, on the possible listing of some sea cucumber species under CITES Appendix III, where governments in exporting countries would need to provide stock and exploitation information that would support a Non Detriment Finding; this necessarily would require the sort of well-‐developed statistical collection already in place in Tonga and PNG 35 Purcell S et al (2012) Improving income of Pacific island fishers through better post-‐harvest processing of sea cucumber: scoping study

A study of sea cucumber fisheries and bêche-‐de-‐mer production in the western South Pacific
Page | 34
per cent of total supplies, and no information is given on a species basis – all purchases are simply listed as BdM. As a result, other than headline data, little if any of this information can be used to any productive purpose.
In a further twist, it is not always that a national Customs Department will share its data on BdM exports with the Fisheries Administration, and so there are countries where fisheries managers do not have a full and current handle on the scale of fishing and export activity, and worse, either operate using partial information, or hold and utilise a significantly different, and conflicting, dataset to that held by the Customs Department.
Transparency The long and the short of it is that as long as data is hidden from view, and is incomplete and unprocessed, management of the sea cucumber fisheries and exports will continue to be subject to commercial and political pressures that result in activity that is at odds with established policies and plans and, more importantly, sustainability of the resource and continued revenue generation. What is required is for the industry, and its workings, to be exposed to the bright light of day where everyone can see it. This will help scotch the behind closed doors deals that seem all too prevalent within this fishery, reduce the incidence of IUU fishing and export, and provide the improved information on which Provincial and community managers and fishers can better manage their activities. The fact that these data are already collected by Fisheries and Customs Departments across the region, and that the Fisheries Departments are already mandated to collect data by species and by Province, means that there should be little to prevent the collation and publishing of data and its analysis. It may require some minor reallocation of resources in terms of applying existing rules and collating and analysing data, but, as is argued in later sections, this involves little change in institutional structures and finances, yet could generate many millions of dollars in additional revenues to coastal and island communities and the national economies.
Conclusions r In each of the countries under study there is a great deal of secrecy about the sea cucumber and
BdM industry – who is licensed to export, who is licensed to buy, how much of each species of sea cucumber / BdM has been caught / shipped in each year, whether there are limits to the tonnage of each species that can be exported, and even details of national policy and the management measures in place, etc.; such secrecy is unproductive and unnecessary and provides the very conditions where illegal activity and petit corruption can flourish – each country should make clear and unambiguous annual declarations on industry performance over the preceding period, and on government expectations and rules governing industry performance in the subsequent period [Recommendation 3, Recommendation 15 & Recommendation 36].
r Fishery and supply chain data is undervalued, and is not generally used for management and control purposes; and accordingly insufficient attention is given to the accuracy, consistency and depth of information collected – this needs to be urgently remedied [Recommendation 17].
r Customs Departments in each country require the Fishery Department to certify inspection of BdM shipments prior to export, but they do not always share with the Fishery Department shipment information that they necessarily collect and which would be useful in managing the industry – within the limits of the law and commercial confidentiality, these two departments need to rationalise their respective needs and practices [Recommendation 5].

A study of sea cucumber fisheries and bêche-‐de-‐mer production in the western South Pacific
Page | 35
r Exporters do not always nominate / declare the species composition of the shipments they are making – it is essential that they do so, and it is essential that this information is made available to Fishery Departments [Recommendation 7].
6.2 Resource access
Licensing
One of the main categories of economic control is limiting access to the resource and to product.
In such a widely dispersed and small-‐scale fishery as sea cucumber harvesting, combined with very limited management and administrative resources, and primary reliance on traditional customary management at the local level, licensing fishermen is problematic. Licensing of small numbers of fishing vessels has been applied in other jurisdictions (e.g. the Torres Strait fishery – see Skewes 2012), but this is not a viable management procedure in the countries under study.
More practical is the licensing of businesses that handle product as it is moved along the supply chain, and where quantities of product become concentrated – those involved in the export trade, intermediary buyers, and possibly also processors where such activity is centralised (this is not the case in most countries, Tonga being the main exception).
In each of the countries studied the main businesses involved in the BdM trade are required to hold a business license and a specific BdM export license. There are clear eligibility criteria that each business is required to meet, but it is relatively easy for almost any trading business to meet these criteria – i.e. in most countries these eligibility criteria do not provide a basis for allocation of access to product. Instead, licenses are issued more on the basis of representation and influence with the key decision-‐makers in processes that are neither restrictive nor transparent. Where BdM management policy has suggested that export licenses should be limited in number, exercise of the role of influence has been all the greater, and considerable commercial and political pressure has often been exerted to encourage more licenses to be issued than policy dictates. This is not an effective means of restricting resource access.
Application of a more discerning set of eligibility criteria that are more evidently restrictive, that not all companies can easily meet, that are more clearly aligned with policy objectives, and that encourage competition for the limited number of licenses available, would be considerably more effective. PNG has developed such a set of criteria, and other countries might seek to adopt and further development these criteria.
Tonga has made a policy decision to centralise BdM processing, and has done so through the issuing of a small number of processing licenses. This has proved effective, and appropriate in the context of Tonga’s particular scale, geography, and socio-‐economic conditions. In general this is not an appropriate step for other countries, though it is evident that most exporters and larger Provincial buyers in other countries are engaged to one degree or another in centralised processing (most evident in Fiji). But it is also the case that in Tonga, in all but a very few cases, the processors have become synonymous with the main exporters. Where there may be some merit to issuing a separate Provincial processor or buyer license is in being able to place a legal requirement on the main trade intermediaries to submit monthly purchase records. Again, most countries do require such record provision, but this policy is applied inconsistently – greatly undermining the value of such data.
Sector business structures
Ethnicity In an extension of the issue of restrictive licensing is the issue of who actually owns and controls the companies that are so licensed. It is evident that in the countries under study the BdM export trade

A study of sea cucumber fisheries and bêche-‐de-‐mer production in the western South Pacific
Page | 36
is considered as synonymous with the Chinese. This focus on ethnicity is unhelpful and masks key underlying characteristics of the functionality of the industry. Crucially, whilst the main consumers of BdM are Chinese, there is nothing intrinsic to this industry that requires businesses to be owned, managed or operated by individuals of Chinese origin or fluent in Mandarin or Cantonese. There are many BdM businesses in these countries that are owned or partnered by ethnic Chinese, whether nationals of those countries or permitted to work in those countries. But there are just as many successful BdM businesses that do not have a Chinese connection, and there are plenty of businesses owned and operated by indigenous nationals, and others with partners from South Korea, Taiwan, Malaysia and Australia. The ethnicity of the owners of these businesses is not a defining characteristic of these businesses.
There is also nothing intrinsic in the processing of BdM that requires Chinese technicians or processors. Yet in the example of Tonga – one of only two countries under study where the fisheries are not currently subject to moratorium36 – the predominant source of processing labour is Chinese nationals brought in specifically for that purpose. Again, there is nothing specific to this industry that supports this – and in most established businesses, it is nationals of the specific country that undertake both fishing and processing.
What is central to the organisation of the BdM trade is that the main final markets for product lay in mainland China, with key entrepôts in Guangzhou, Hong Kong and Singapore, and to a lesser degree Sydney. Being able to converse with trading partners in their own language is a necessary skill, and an inability to do so puts a trader at something of a disadvantage – though this can be overcome through the use of interpreters, or through the use of an alternate international trading language, such as English. English as a trading language is in common usage in Singapore and Hong Kong (and increasingly so, also in Guangzhou), and the means of the upholding of laws of contract and commerce are more dependable and straightforward in Hong Kong and Singapore jurisdictions. In recognition of this, most BdM businesses that do not have a Chinese-‐speaking manager on staff prefer to trade through intermediaries in Hong Kong and Singapore.
Financing
It is also the case that buying and consolidating enough product to make up a container shipment requires considerable finance. Most, but by no means all, traders seek up-‐front funding from their trading partners – i.e. importers in Guangzhou, Hong Kong and Singapore. This is readily extended, and forms a normal part of this type of trade. But it can also provide a point of leverage or pressure on an exporter. Most BdM export traders are well established and have been dealing with the same importers for ten years or more, and the respective parties have been able to build up considerable trust one with the other. But as the growing disparity between supply and demand becomes more evident, and there are no new sources of supply, importers have become more aggressive in their pursuit of product, and some, most notably those based in Guangzhou, have resorted to financing and staffing their own supply operations in producing countries, typically sending family members or relatives to head up such operations. Again, there is nothing new in such arrangements, but it sits oddly in the countries under study, where most traders (with the key exception of Tonga, where the fishery was closed for an extended period of ten years) have been engaged in the BdM business for ten years or more, and some for 25 years or more. It is these recent entrants that are changing the nature of the trade, seeking to establish a foothold by offering higher prices (i.e. reducing their potential margins), taking product off the hands of fishers earlier in the supply chain (i.e. fishers do not have to apply so much work to obtain a cash reward), and buying small, poor quality and undersized product (product that traditionally the more established traders would have rejected). These businesses have been allowed to promote these practices through processes of patronage – they need a local partner, and a powerful / influential figure, to represent their interests and secure
36 Subsequently closed as from the beginning of 2013

A study of sea cucumber fisheries and bêche-‐de-‐mer production in the western South Pacific
Page | 37
the necessary permits. The different countries have shown different abilities to block such development.
Resilience and continuity
Most BdM traders in PNG have been in the business for some considerable time, but it came as a considerable shock to them when the government imposed the current moratorium in 2009. A proportion of them had other business interests to fall back on, but many did little more than trade in a little bit of Mother of Pearl (MoP) and sharkfin. Under the circumstances, these business people had to quickly identify and establish themselves in other business areas – many extending into trading in frozen seafish. In the Solomon Islands, most BdM traders were already established general traders when the moratorium was imposed; in this country, the greater effect would have been felt in the provinces amongst the many intermediary buyers that were suddenly out of a job. In Vanuatu, once the moratorium was put in place some traders simply went out of business, whilst others could fall back on existing alternate businesses. No moratorium has yet been imposed in Fiji, but the ten-‐year long moratorium in Tonga meant that virtually no-‐one involved in the trade before the moratorium was around to pick up the trade again when the moratorium was lifted. And it is this phenomenon that poses one of the key risks in strategies that necessarily involve the periodic imposition of moratoria – skills and business relationships that have been developed over many years are lost, and bad practices proliferate during moratoria as the industry goes underground and other less scrupulous businessmen develop and manage the illegal trade – most evident, for example, in PNG and the Solomon Islands.
It is important, therefore, that when licensing BdM export trading companies, careful consideration is given to drawing up eligibility criteria that more clearly restrict eligibility to the types of business that the national (and possibly also regional) policy seeks to encourage. In the process of confirming eligibility, licensing authorities should be encouraged to make deeper enquiry into who controls these companies, how they are financed, and how they can demonstrate that they are not engaged in any form of transfer pricing37. It is evident that most licensing authorities are not aware of the extent of inter-‐relationship between businesses in the main exporting countries, and between these exporters and the key importers on the main entrepôts. This is an area of investigation that might benefit from some dedicated research, possibly on a regional basis.
Raising the cost of an export licence may also be a means of discouraging application from less serious businesses (usually short-‐term and small-‐scale operators). If also combined with more transparent systems for the allocation of systems, these higher prices might also discourage the situation where local front men are paid significant one-‐off sums in return for their ability to influence decision-‐making and the obtaining of a licence, but otherwise play little role in the day to day management of the business.
Conclusions r All BdM exporters are required to hold a valid export license, and as a condition of this license
are required to provide monthly or per shipment data on all purchases, by species and by origin of product; the provision of this information is variable and inconsistent, and this undermines the value of all other data collected; further, exporters are allowed to log the origin of product to non-‐producing / fishing area – authorities need to ensure that all exporters provide
37 Transfer pricing typically seeks to declare on commercial invoices, manifests and Customs declarations sale prices that are substantially below the value of the product – as a means of reducing the scale of any export levies that may attach to the export, and as a means of artificially returning profits to the importing rather than the exporting country. Transfer pricing is most commonly found in trade arrangements where the importer is a major direct or indirect investor in the exporting company, through shareholding, trade financing or provision of working capital.
A study of sea cucumber fisheries and bêche-‐de-‐mer production in the western South Pacific
Page | 38
comprehensive purchase returns, by species and by fishing area (by Province) [Recommendation 4, Recommendation 6 & Recommendation 16].
r Some exporters provide details of the average size of single species BdM in each bag shipped, but most do not; some Fisheries Departments take weighed samples from bags shipped, but this is inconsistent, and most do not – this is an exceptionally valuable source of information on resource condition, and provides concrete evidence that bags or product are positively inspected prior to export shipment, and this should become standard practice at point of export [Recommendation 7].
r In most countries export licenses are issued to any applicant business that meets a minimum set of conditions, and in recent years many licenses have been issued to new businesses that have no prior experience and do not have an established trading base or record in the country of license, and there appears to be a higher incidence amongst these companies of the supporting or otherwise condoning buying practices that encourage unsustainable harvesting and the purchasing of undersize sea cucumbers and BdM – the eligibility criteria for export licenses should be narrowed and deepened to exclude operations that unlikely to fully comply with license conditions; in addition, there should much greater scrutiny of the integrity and background of the principals and partners of the business owners [Recommendation 11 & Recommendation 26].
r To facilitate strengthening of the management of sea cucumber fishing and BdM production at the Provincial, and to facilitate the provision of accurate data on supply chain throughput – the primary (i.e. excluding small-‐scale household and village based consolidators) BdM buyers and processors operating at a Provincial level should be required to hold a buyer / processor license, a condition of which requires the provision to the Province of monthly species based throughput data, including details of source fishery [Recommendation 12 & Recommendation 16].
6.3 Production and export caps
Export caps as an economic measure
The main management issue with sea cucumber fisheries is persistent over-‐exploitation. One of the key drivers for such behaviour is the value of this resource, and the ease with which it can be converted into cash. Downstream intermediaries -‐ buyers, processors, exporters, importers -‐ all profit from the conversion to and trading of BdM. The extent to which they can profit from this business also drives these intermediaries to encourage the flow of more product along the supply chain, and thus contributes to over-‐exploitation of resources. Capping such throughput provides a potent means of putting the brakes on such behaviour, and also encourages other forms of profit optimisation – for example focusing on quality over volume.
Despite the evidence that, using currently available information, it is very difficult to derive a numerical basis for determining sustainable levels of exploitation, there is a wide range of signals that resources are routinely over-‐exploited, and that this is in part reflected in the boom and bust variations in export volumes. Moderating export levels is a simple means of encouraging more responsible and sustainable behaviour at the point of first hand sale, and allows the various involved parties – fishermen and buyers – to modify their behaviour to maximise revenue / profits within this overall volume constraint. It is inherently an economic tool as it operates as a constraint on business.
The tool is itself an economic instrument, and whilst it would be appropriate that this cap was set at the same level as a stock management tool, such as a catch quota intended to maintain a stock at a
A study of sea cucumber fisheries and bêche-‐de-‐mer production in the western South Pacific
Page | 39
predetermined target reference point, its origin is not the same. As described elsewhere governments do not have the resources to micro-‐manage exploitation at the local level, sea cucumber stocks are not easily amenable to management at scale (spawning and recruitment patterns and stock boundaries are difficult to establish), and local over-‐fishing can lead to local extinctions. So as a sensible economic measure to encourage forethought and responsible resource use, and as a precautionary measure to restrain over-‐exploitation (bearing in mind that many communities will ignore such restraint), putting an upper limit on exports serves both resource managers and business constituencies, and can be relatively easily and predictably policed. The setting of export caps should be on a per species basis, and wherever possible should be informed by information on stock management requirements. Crucially, however, export caps should be put in place even where no clear stock management information is available – as a precautionary measure. Such caps can be periodically (every few years) reset on the basis of feedback on stock conditions. Insofar as supply chains include concentration and management at the provincial level, it is appropriate that such export caps be set at the province level as a further means of encouraging more efficient resource use, but also discouraging local over-‐exploitation.
Allocating export caps
In the early years of operation of export caps it is appropriate that they are operated as a global limit – i.e. all the different licensed exporters are allowed to buy whatever volumes they wish as long as the sum of all purchases and resultant exports does not exceed the export caps that have been set. This will, of course, require effective monitoring of supply chain throughputs and exports – at national and provincial levels.
Once this system has bedded in, and particularly where it has been possible to give added credibility to the setting of export caps through links to evidence on stock status and whether or not stocks are over-‐ or under-‐exploited, consideration could be given to allocating export quota on a competitive basis – i.e. individual species and provincial quota would be offered to the highest bidder. This would allow the government to generate revenues from the process, and allow those licensed companies bidding for quota to further optimise their businesses. But complicating any such procedure would be the issue of pricing, providing potential for the development of local monopolies. Because of this drawback, any detailed examination of auctioning options should be put off until well into the future, and notably until such time as the BdM industry has been brought under demonstrably stable and consistent management.
An alternate to the auctioning of access to raw material is the possibility of auctioning finished product to importers. Under these arrangements, for example, a season’s production – bringing together product from a number of licensed exporters – could be sold by auction, as a means of extracting the best possible price from importers. Again, this requires that a well-‐established and well-‐ordered industry is in operation, that enough importers can be attracted to such auctions, and that sufficient checks can be put in place to prevent price fixing or, where it does occur, to be able to identify it. This is a complex and potentially very risky area of commerce, and it can be argued that the stable management of this industry, in any of the countries under study, it still in its infancy – and it is too early to consider this type of option further.
Building competition for raw material
Another possibility is to arrange for the auctioning of product at the local or provincial level, as a means of encouraging greater standardisation of pricing around what the market can bear. In this case product could be brought by fishermen or communities to a local trading centre or provincial centre and offered for sale to buyers through a government run auction process. This gets over the present situation where the more isolated communities have difficulty attracting the attention of one buyer for their product, let alone getting a number of buyers to compete for product.

A study of sea cucumber fisheries and bêche-‐de-‐mer production in the western South Pacific
Page | 40
The convening of monthly (in season) auctions for first-‐boil and finished product looks attractive in theory, but if communities can get product to such local centres, then they already have the opportunity to seek competitive pricing from the few buyers that would be located there. Plus governments are notoriously poor at organising and managing relatively limited throughput auctions such as these. It is evident that in the last ten years boat transport from even the most isolated communities to provincial centres has become more commonplace, and fishermen and coastal households increasingly opt to bring produce direct to buyers, rather than waiting for buyers to come to them, combining such trips with shopping and other business.
Conclusions r As an economic measure to encourage the more efficient use of resources, maximisation of
quality and value, and to ensure a predictable and steady stream of BdM product, annual national per species export caps should be set for the BdM trade as a means of constraining exporter access to product. Such caps should ideally be set in line with catch limits (set on the basis of stock management and status), but in the absence of clear science-‐based catch limits, export caps should be set as a precautionary measure to limit system throughput, and be based on historic changes in trade volumes, and adjusted downwards where there are any indications that resources are being over-‐exploited – local falls in availability of product, depressed throughput, drops an average size of BdM, falling catch per unit effort. Per species export caps should be set as a precautionary measure, even where there is no consensus on the status of sea cucumber stocks and harvest limits; where possible such export caps should be sub-‐divided at the provincial level so as to even out supply [Recommendation 17 & Recommendation 19].
r Only licensed exporters should be allowed to export BdM, and compliance with both provincial and national caps will be monitored at point of export and on the basis of purchase records. Whilst it might be possible to allocate access to product through the auctioning of export quota, this requires that management of the sector is regularised, and brought under ordered and steady control. This is not the condition of the sector at present, and it is argued that it will be many years before a clear statement can be made that the sector is under effective management. Only at this time should any consideration be given to the possibility of auctioning access rights. No further consideration should be given to the possibility of auctioning of export quota to licensed exporters until such time as the industry is under effective management – at least ten years in the future.
r It might be possible to increase the prices paid to producers through local auctions, bringing buyers together to compete for product. Given recent improvements in the ease and frequency of sea transport from peripheral locations to provincial centres, and evidence that more producers are bringing product to these centres for direct sale to buyers and licensed exporters, compounded by the risks and added costs associated with government mediated auctions, the idea of provincial auctions should be dismissed as likely to be ineffective and unnecessary. As a generality, no further consideration should be given to the organising of provincial BdM auctions as a means of increasing buyer competition for raw material (first boil BdM) (though more work could be done to establish and communicate the link between supply chain structure and prices paid to fishermen and village processors).
6.4 Cost recovery and economic incentives Actual and potential mechanisms for cost recovery include:
• Export levy on product value;

A study of sea cucumber fisheries and bêche-‐de-‐mer production in the western South Pacific
Page | 41
• Licensing of exporters; • Licensing of processors; and • Access charges.
Some of these charges could also be adapted to reinforce improved stock management.
Export levy At present, most governments recoup some of the costs associated with management of this fishery through a levy on export value. Because governments make limited effort to determine the actual value at which BdM is traded (with the clear exception of PNG), this levy is based on quantity, times a notional value. In all too many cases, these notional values are out of date and represent only a small proportion of actual export values (for example in Tonga). In most countries, this system needs to be revisited with the intention of ensuring that the revenues achieved remain realistic in the context of market value and the policy intentions of the levy.
Revenues are also achieved through the processes of licensing. Again, both the license fee and the extent of its application are inconsistent and not always effective. A key example of this is the situation where licenses need to be held by nationals of the country, but the businesses are in practice being operated by foreign nationals – who essentially pay the national for securing the relevant permit (and often the national has little to nothing further to do with the business). This is counter-‐productive – with a private individual receiving a cash payment which rationally should have gone into government coffers.
This was the case in Tonga, where a limited number of processing and export licenses were made available, and only to locally registered companies. Early on in this process, license fees were low, and individuals of power and influence were able to access them and effectively sell them on for particularly high values. When the cost of an export trader permit was subsequently increased ten-‐fold, traders struggled to meet both the payment to the individual securing the permit and the cost of the permit, and so have subsequently found alternate lower cost operating models that do not incorporate high pay-‐offs for intermediaries. It will pay governments dividends to have much more visible and transparent systems for the issuing of permits, to deal more directly with issues of local and foreign ownership, and to be much more inquisitive about the ownership of these businesses – not just who owners are, but what this ownership means in the context of the BdM trade and the retention of revenues and profits within the producing country.
The basis by which an export levy is applied needs to be standardised, and needs to bear close relationship to the market value of the product. In most of the countries under study the export levy is applied on the basis of notional export value, since governments either have limited access to or little confidence in the prices declared in Customs documentation. Given the rapid increases in the value of BdM in recent years, these notional values have not been altered in line with these price increases. We would argue strongly that any levies should be commensurate with the actual value of the product being exported, and that governments make more effort to establish what this value is. In the first instance effort should be focused on ensuring that the values declared in Customers documentation are the true values at which the product is traded. At the very least Customs and Fisheries should require that a detailed commercial importer invoice forms and essential part of Customs export documentation, that this information is checked, and that this sort of price information is compared across invoices, and potentially between collaborating countries.

A study of sea cucumber fisheries and bêche-‐de-‐mer production in the western South Pacific
Page | 42
Independently of this process, there needs to be clearer assessment of the policy purpose that is being addressed in taking an export levy. In most cases the argument presented is that it is a means of getting the industry to contribute to the costs of sector management, monitoring and control. But then the scale of levy appears to be somewhat arbitrarily set. This needs to be revisited, with a clearer presentation of both the scale of costs that are / might be incurred in the management of the BdM sector, and the costs structure along the BdM value chain.
Levies are often seen as unfair, and it is important that the revenue earned from such levies is recycled into fisheries management and/or into the fishing communities. Siphoning off this revenue into central government coffers will reduce respect for the measures in place and encourage evasion.
Using levy as incentive Variable levies could be deployed as a means of encouraging desired behaviour. Aside from the problem of persistent over-‐fishing, there are a number of related issues where variable levies could be deployed. A key issue is that in over-‐exploited fisheries fishermen have little option but to seek to catch and sell smaller sized animals. Similarly, for higher value species where demand outstrips supply, the high prices on offer at final market may encourage buyers and exporters to buy not just smaller sized sea cucumbers and BdM, but to buy under-‐sized animals.
Assuming that minimum legal size limits are retained in each country’s BdM management plan, and taking as a given that greater effort should be made to identify and prosecute trading in under-‐sized animals, another management control could be to apply a levy per piece of BdM exported. For example a levy of USD1 per piece of white teatfish BdM exported would discourage exporters from shipping smaller sized BdM – instead, if the levy is set at the right level, it would encourage them to try and buy and sell only large white teatfish BdM. Such a levy could be applied to all species, or only to those species considered to be under threat of over-‐exploitation.
A secondary positive effect of such a policy would be increased pressure on Customs and Fisheries Departments to inspect and sample weigh each export shipment – action that is already encompassed in BdM management plans, but which is not universally or consistently applied at present. This means that monitoring and control of this trade would be increased, and that the average size of shipments would be actively monitored and recorded – data that would help greatly in assessing the impact of export caps, informing the adjustment of export caps, and contributing to stock assessment modelling and the setting of catch limits.
One of the difficulties in applying such a levy is choosing the right value to levy against each species. Put the levies too high and it will only encourage traders to work around the system, set them too low and they will have little impact on behaviour. To better gauge what is an appropriate level, more work will need to be done on determining the structure of the BdM value chain, and assessing what level of levy would impact sufficiently on profits to encourage improved buying behaviour.
Conclusions r All BdM production (excepting in PNG) is subject to a management levy collected at point of
export through an ad valorem tariff; since most countries do not require that provision of a valid commercial invoice is a prerequisite of Customs clearance, the export fob price is not typically available to Customs authorities, and so cannot be used as the basis of the ad valorem tariff;

A study of sea cucumber fisheries and bêche-‐de-‐mer production in the western South Pacific
Page | 43
instead a notional export value is used to calculate the payment, but this is often a poor reflection of market value – authorities should require, as a matter of good practice, exporters to provide a valid commercial invoice as part of Customs clearance, but they should also routinely provide a schedule of prices used in the purchase of finished BdM from buyers and fishermen – one or other of these values should be used as the basis of calculation of the management or cost recovery tariff [Recommendation 8 & Recommendation 9].
r All BdM exporters are required to hold a valid export license, usually issued annually on payment of a fee; this fee is usually set at a relatively low amount; there is good rationale for limiting the number of export licenses issued as a means of stimulating competition, but setting a low license fee encourages unproductive side-‐deals intended to facilitate preferential access to licenses, and also allows some licenses to be taken up by very small-‐scale exporters – the fee accompanying the issuing of export licenses should be significant [Recommendation 10].
r Setting license fees, export levies and variable per-‐species levies needs to be based on a better understanding of the costs and revenues inherent in the BdM value chain; this will require further research work to construct appropriate models of the value chain, and to investigate the likely impacts of different tariffs. Once established, it will still be necessary to monitor changes in the costs and revenue structure of the value chain, and this will need to become a normal component of BdM management. Further research work should be undertaken into the costs and revenues associated with the BdM value chain [Recommendation 37].
r Consideration should be given to applying a per piece levy on different species of BdM – as a means of encouraging traders to preferentially export only larger specimens of nominated species. The level at which such a levy is set is not a simple matter, but when set appropriately it could yield many benefits to overall management of the BdM trade [Recommendation 25].
6.5 Monitoring, control and surveillance, and measures to discourage IUU fishing and trade
Fishery closures force the trade underground
It is evident that significant quantities of BdM are being exported illegally in PNG and the Solomon Islands whilst these fisheries are closed. It is also evident from reports received from inspectors in PNG that significantly increased control and surveillance resources have had to be deployed in an effort to discourage and curtail such activity. The evidence (from inside the country and through discussions with traders in Hong Kong and mainland China) suggests that illegal shipments continue to be made – with some evidence that this is being hidden in amongst bulk exports, such as timber, rubber, etc., and being taken out in personal luggage. This is considered to be a direct result of the closure of these fisheries.
For a variety of reasons – combining socio-‐economic considerations and market conditions -‐ there is strong logic behind seeking to shift sea cucumber harvesting from a boom and bust cycle to a more level and predictable year on year fishery. But it is also evident that closure of at least some fisheries simply leads to the trade going underground as communities and exporters seek to generate cash income and profits from this trade. Not only does this mean that stocks are being over-‐fished, but also that this is being done outside the law, and outside the control of managers (who are thus unable to capture any data on the quantities, sources and destination of such trade). Further still, closure of the PNG fishery has meant that the government has had to significantly increase surveillance expenditure. All in all it is preferable that as a matter of policy governments seek to keep these fisheries open, whilst also seeking to bring them under sustainable and stable management.

A study of sea cucumber fisheries and bêche-‐de-‐mer production in the western South Pacific
Page | 44
Fishing with UBA gear
In all countries under study the harvesting of sea cucumber using UBA gear is banned, though in Fiji in recent years a small number of licenses have been issued to allow UBA harvesting of sea cucumber. But in all these countries illegal harvesting of sea cucumber using UBA gear is taking place – focusing on those resources found in waters beyond that routinely accessible through free diving. A particular focus of such activity is the harvesting of white teatfish.
Throughout the region there have been and continue to be regular diving accidents, resulting in the deaths of fishermen, and the paralysing of fishermen. Particularly high incidents of accidents associated with UBA harvesting of sea cucumber are evident in Fiji.
These deeper water sea cucumber resources are considered to provide an essential reservoir of adult breading stock of key species, and exploitation of these stocks is thought to adversely impact recruitment and re-‐stocking of over-‐exploited shallower water areas. This is particularly so with the very high value white teatfish, though there has been little focused research undertaken to confirm this. On balance, not only should the existing bans of the use of UBA gear in sea cucumber harvesting be maintained, but increased effort should be invested in enforcing such bans. In the case of Fiji we would argue strongly that the current policy of licensing UBA harvesting should be reversed.
Conclusions r The imposition of moratoria creates circumstances where illegal activity will increase – in terms
of harvesting, stock-‐piling and exporting BdM, requiring that governments commit significantly greater resources to identifying and prosecuting illegal activity; at one and the same time, coastal and island communities forego income, which can create hardship – as a matter of management objective, sea cucumber fisheries and BdM supply chains should be managed in such a way as to preclude the need to close a fishery – i.e. stocks should be rebuilt and then managed on a more conservative basis [Recommendation 1].
r Use of UBA gear in exploiting sea cucumber resources is banned in all the countries under study, and limited use of the gear is licensed in Fiji; despite these limitations, UBA gear is widely used in sea cucumber fishing, and diving accidents related to this are all too common, including deaths and paralysis – use of UBA gear should continue to be outlawed, and control resources focused on achieving full compliance with this; the primary target of such fishing is white teatfish and opportunities for identifying UBA caught white teatfish through the supply chain should be explored [Recommendation 2 & Recommendation 32].
A study of sea cucumber fisheries and bêche-‐de-‐mer production in the western South Pacific
Page | 45
7 A sea cucumber / BdM sector management framework
7.1 Sea cucumber management experience The record of successful management of bêche-‐de-‐mer fisheries is not good. With ever growing demand for bêche-‐de-‐mer, primarily emanating from China and other Far Eastern economies, the incentives to harvest remain strong, with local stock-‐piling and continued fishing rumoured to take place in some countries, despite moratoria.
The focus of this study is not to re-‐work existing thinking, but to explore additions to such thinking, with an emphasis on exploration of economic and trade theory and practice. Accordingly, the study explores issues associated with the structure and operation of the bêche-‐de-‐mer supply chain, and exploration of whether economic tools in common usage in other areas of fisheries management, but not as yet greatly used in managing sea cucumber fisheries and trade, can provide the discipline and incentives needed to moderate the boom and bust nature of these fisheries and allow fishing communities to make rather more of this resource than is currently the case. It would be naïve to suggest that there is a single or simple solution to management of these fisheries, but there are certainly better ways of management than are currently practiced, and drawing on available economic tools – whether from fisheries economics or from market / trade economics – can only assist in examining options.
The over-‐riding influences on management of sea cucumber fisheries and the BdM trade will undoubtedly remain the extent to which the activities of local fishers can be brought within and influenced by a local management regime. It is here that local conditions, traditions and influences will dictate what management systems can work in practice, and particularly given that practical management and control of sea cucumber fisheries will be a local affair. Whilst trade / supply chain rules and interventions are amenable to application at a national and regional level, fishery management, given the ease with which the resource can be locally over-‐exploited, will be a much more a local affair. But it is also the case that these local fishery management regimes are influenced by practices of neighbouring and nearby communities. This is not a situation where the idea of “one size fits all” will apply, but the situation may be amenable to the use of exemplars of good and best practice – where the successes (and failings) of one or two examples of community fishery can be communicated to other communities. Likewise, it may be feasible to identify sets of criteria that may suggest a community is more amenable to the application of one set of tools than to another.
With discipline, localised fisheries can be effectively and profitably managed. It is reasonably straightforward to monitor sea cucumber stocks, and population dynamics are amenable to simple stock modelling. Accordingly stock monitoring and management really needs to be done on a local, small-‐area basis. This necessary focus on local management means that, even with the best will in the world, there is wide variation in the application of any management system, and wide variation in the design of systems appropriate to the place, culture and the ruling social and political dynamics. This is not a situation unique to sea cucumber fisheries, but has particular significance given the sheer scale of the value of this export industry and the fact that it disproportionately benefits rural households. A key output of the study is to emphasise that as much as half the potential value of trade in BdM is being lost through mismanagement.

A study of sea cucumber fisheries and bêche-‐de-‐mer production in the western South Pacific
Page | 46
But it is clear that for many, if not most, fisheries, the incentives to quickly deplete stocks far outweigh the disincentives – these resources are treated unrealistically as a no-‐cost cash crop. Such a boom and bust strategy might have greater credibility if the benefits of the strategy were evenly distributed across adjacent coastal and island communities, but in practice it is more usual that benefits go to a smaller group of individuals looking for short-‐term gains. Such behaviour represents significant foregone economic benefit -‐ a loss of some significance to local coastal communities as well as to the economy as a whole.
A number of contributing factors have also contrived to discourage effective and transparent management of this sector:
• There is not the political will to move to a more precautionary management regime • There remains too many vested interests (political and commercial) in ensuring that
management of sea cucumber fishing and BdM production and trade does not proceed on a rational basis
• Management policies and their application are routinely subverted for personal gain • The above generate a culture in which the closer analysis of production and trade data is
discouraged • In each of the countries under study the machinery of government is overly centralised, and the
capacities of administrations outside capital cities is poorly developed, starved of funding, and generally under-‐resourced – any management at Provincial level is broadly ineffectual; this is not a set of circumstances specific to fisheries or to the sea cucumber / BdM sector, but it does mean that without this necessary link between central government and the practicalities of fisheries and BdM production, national sea cucumber / BdM management policies are effectively irrelevant38
• This set of circumstances means that effective management of the sector rests with village heads and with the commercial operators – village heads do have access to traditional customary management systems, but decision-‐making is easily subverted by the entreaties of commercial operators to ignore traditional precaution, a course of action given added incentive through the rapid rise in the prices paid for product, and many/most rural coastal and island communities have few alternate sources of income
• Not all commercial operators are irresponsible – indeed most are more interested in the medium term than in short-‐term gains that adversely impact the medium-‐term prognosis; but the recent rise in BdM prices has encouraged (with the sanction of politicians and senior government officials) an influx of traders to the sector that are very much more focused on short-‐term gain, and are happy and willing to cut corners; their presence has forced the more established and more conservative traders to change their practices to remain competitive, adopting less precautionary practices – all changes that do not bode well for the future of the sector
• Controlling the export of BdM does not rank highly in the work of national Customs officers, and they do not have special expertise or training in dealing with this trade; export of BdM is still considered a relatively minor trade item in each of the five countries under study, and amongst politicians and the general public there is little awareness that the lowest value BdM can have a
38 Further support for co-‐management between Provincial governments and coastal communities is advocated – with outline conditions and action points presented in Appendix 18
A study of sea cucumber fisheries and bêche-‐de-‐mer production in the western South Pacific
Page | 47
value some twenty times less than the highest value BdM; accordingly, opportunities for error and abuse are considerable – and all the greater where the level of cooperation between Fisheries and Customs Departments is not as open as it should be.
As should be very evident, most of the above impediments concern issues of governance – and the subversion or undermining of relatively straightforward management and control systems that most would consider self-‐evident. Below we explore how some of these impediments might be tackled and removed.
7.2 Reinforcing management through trade information
Monitoring trade throughput The basic set of management tools applied to sea cucumber fisheries has been discussed in Chapter 5. The key to reinforcing the implementation of some of these measures lies in the marketing and distribution chain.
All countries require BdM traders / exporters to be licensed; some require intermediary buyers / traders to be licensed – either at national or Provincial levels. Where processing is organised around central processors (Tonga and Fiji, and to an extent in Vanuatu, Solomon Islands and PNG) these businesses also need to be licensed in a separate process to export licensing.
It is evident that the minimum size restrictions applied in each country are, peculiarly, not widely known in fishing circles, and so size controls are mainly applied by traders / exporters. But it is evident that most traders / buyers will vary what they consider legal according to supply and market conditions, and very limited production / process inspection systems mean that purchase and export of BdM that does not comply with national restrictions is rarely detected, sanctioned or confiscated.
Another key group of management tools applied to traders is the mandatory submission of purchase records, packing lists, and shipping manifests. These key management measures have not been applied consistently or comprehensively across the countries, but they do provide an important formality to the trade and an example of visible oversight, and as such act as a deterrent to over-‐harvesting and mis-‐management, and a potential tool to enhance compliance with quota or size restrictions. Unfortunately, there is little to suggest that these measures have been used effectively as a tool of active and adaptive management.
Further, analysis of historic production and trade data by species and by Province suggests that for any given Province, the fishery could be controlled by closely monitoring harvests of between one and four species. This could be more finely tuned if catches are segregated between reef gleaning and free diving.
Actual and potential data errors We have pulled together the data sets available through national governments, trying to achieve consistency in allocation of production / exports by species and by Province, but the data comes with its own set of challenges. We have sought to limit the potential for error, but there are issues of allocation that still present problems.
We place considerable confidence in the headline generic BdM exports from each country, and this indicates average production of 1,000 t in dry weight over each of the last fifteen years. But when it comes to the datasets held by each country’s Fisheries Department dealing with catch composition
A study of sea cucumber fisheries and bêche-‐de-‐mer production in the western South Pacific
Page | 48
by species (used to inform the data used in Appendices 11, 12 & 13), the datasets are more variable. Those for Tonga, PNG and Fiji are particularly accurate, Solomon Islands less so, and the figures available for Vanuatu are poor. Still more problems apply when species data are allocated by Province. Despite the species accuracy of PNG data, because of misallocation of exports to the capital Port Moresby, there is potential for error in our allocation of those exports to Provinces on a pro rata basis. The NFA does have the wherewithal though its inter-‐provincial movement dataset, which needs to be reviewed as a matter of urgency. Allocations of production by species, by province, for the Solomon Islands, Vanuatu and Fiji are based on limited anecdotal information provided by traders. The potential for error here is considerable. Further review of these figures by the major traders should yield more dependable data.
A check-‐back of production by Province against the area of shallow water per Province (a crude indicator of potential productivity – see Appendix 10) suggests that there many need to be corrections made with respect to production from the islands around the Bismarck Sea in PNG, and adjustment in allocation of production between Western and Northern Districts in Fiji. Better definition of species composition with respect to the western provinces of the Solomon Islands would also be helpful.
We have also made some crude assumptions with respect to the degree to which product is poorly processed, and the proportions of production that are small or otherwise not of “A” grade. The bases of our assumptions are conservative, and supported by available information (Ram 2008 and illustrated in Appendix 19), limited though that is. It is unlikely that there is data already collected that would allow further clarification in these figures – except access to the detailed records of traders, which is unlikely to be provided. Extending data collection to cover the average size of BdM of individual species in individual bags would be most helpful in this regard. It is sometimes collected in Tonga through the sampling of bags when shipments are inspected by Fisheries staff as part of the process leading to the issuing of a Fisheries Certificate; similar systems are in place in other countries, but rarely applied. These data are not currently analysed, but such records continue to be held within administrative files. This situation should be remedied; and other countries should be encouraged to adopt similar inspection procedures and data collection protocols.
7.3 Establishing precautionary export caps and, by extension, target catches As matters stand, at the beginning of 2013 the stock situation in each country is as follows:
• the PNG resources should be improving (particularly for the faster growing species) after four years of closure (though this is dependent more on rates of recruitment than on lapsed time) – though IUU fishing is proving problematic in various parts of the country, they have recently extended their moratorium for another three years;
• the Solomon Islands fisheries have been mostly closed for at least four out of the last seven years, and stocks should be in recovery – though there has been significant IUU fishing;
• the Vanuatu fisheries have been closed for five years, but it has recently been announced that they are to remain closed for a further five years;
• the Fiji fisheries remain open, but stocks are widely held to be in poor condition; • the Tonga fishery has just been closed following five years of heavy exploitation and all stocks
are considered to be in poor condition.
A study of sea cucumber fisheries and bêche-‐de-‐mer production in the western South Pacific
Page | 49
It should be noted that the Vanuatu and Solomon Islands fishing areas have been the subject of detailed density surveys. In the case of Vanuatu it is understood that the surveys suggest that species densities remain below those considered compatible with a healthy stock. In the case of the Solomon Islands, survey results are still to be published.
In 2006 PNG introduced a Provincial quota system, setting two export caps per Province, one covering high value species and second covering low value species. These caps approximated to the peaks volumes of historical exports – and should be considered as excessive. An export cap closer to the historical average exports (15 year average of 450 t) would seem more appropriate – i.e. at 380 t, some 60 per cent of those values put forward in the 2006 management plan. By our reckoning this would yield, over time, the same volume of harvests (it would avoid the busts and fishery closures), but comprising a more valuable mix of species and individuals of greater average size – and thus greater value.
For the Solomon Islands, matters are more complex. The application of some form of Provincial export cap (which could be monitored at point of export) would go some considerable way to moderating local over-‐exploitation, but weak Provincial infrastructures, and limited capacity at Provincial level, greatly limit government influence at Provincial level, and place responsibility for moderating exploitation on community leaders and fishers themselves. An annual export cap of about 140 t (15 year average is 165 t) would encourage a focus on quality rather than quantity, and generate predictable year on year at levels well above those currently available. As more information became available on the biological characteristics of stocks and harvesting levels, so these export caps might be modified over time. It is of note that of all the countries under study, the Solomon Islands presents the most difficult and intractable BdM management problem.
Vanuatu has very limited sea cucumber resource capacity, and given its distance from other islands, and thus its reduced likelihood of recruitment from outside sources, these resources are very sensitive to over-‐exploitation. Following a period of recovery39, we would suggest that an export cap of no more than 20t per year be established (15 year average is 18 t per year). In view of the smaller scale of this industry, the Fishery Department is exploring the practicality of setting fishery specific production quotas, but for the time being the fishery remains subject to moratorium.
The sea cucumber resources of Fiji have been heavily exploited over a long period of time. Stocks need to recover, either through the imposition of a moratorium, or through drastically reduced production. A target export cap of 200 t of dried BdM (15 year average is 275 t) would seem appropriate, but a substantially lower ceiling might be necessary in the shorter term.
The Tonga fishery is exhausted and needs time to recover. Once recovered, a substantially lower export cap of no more than 60 t of BdM per year (15 year average, including 10 year moratorium, is 55 t) needs to be introduced.
7.4 Management framework conclusions and recommendations The foregoing suggests a complex picture with a wide range of management interventions and suggested harvest control rules, substantial difficulty in promoting or enforcing these mechanisms at local level; substantial data collection at various points in the supply chain, but limited analysis and
39 As of March 2013 it has been decided to keep this fishery closed for a further five years
A study of sea cucumber fisheries and bêche-‐de-‐mer production in the western South Pacific
Page | 50
feedback into management; and very little attempt to reinforce local or provincial management measures through checks and balances at the point of export. Given the relatively limited total volume of this high value product, and therefore the relative ease with which trade depot and/or export inspection of consignment could be done, this is a lost opportunity.
The BdM Management Plans that are already in operation, and the revisions currently in draft, form a sound and coherent basis to sector management. Weaknesses in dissemination and compliance are evident, but the main shortcoming is the absence of any clear mechanism for adaptive management – decisions for future action that respond to the evidence from the effects of past action.
The following are the four key elements required in an effective management system for sea cucumber:
1. Engagement of resource users in contributing to the setting of overall national harvest targets and standard regulations; and developing and agreeing local harvest control rules in broad conformity with these national targets.
2. Incentives and disincentives to promote compliance at all levels, including thorough inspections and economic incentives at the point of export.
3. Information relating to the implementation of harvest control rules, and the impact on the stock, effectively monitored and analysed at local, provincial and national (export) level; and fed back into the management process.
4. Agreed response mechanisms at national and local level should data analysis suggest stock decline or improvement.
While some of these elements appear in existing national plans and frameworks, few countries have all of these elements in place.
Local harvest control rules might include minimum size for valuable or threatened species; a restricted harvesting season; protected areas/no-‐fishing zones or some combination of these. National/provincial harvest limits and rules might include provincial or national annual quota; size limits for valuable/rare species.
Incentives might include peer pressure at local level; fines/confiscation of product at intermediate trade and export level; and graduated export levy with higher rates for more valuable/vulnerable species.
Stock status monitoring using trade data will be crucial to monitoring success and adjusting harvest control rules in an effective and timely manner in response to improved or declining stock health.
Gaining agreement on response mechanisms prior to their implementation should greatly facilitate implementation and reduce opportunities for corruption.
More specifically:
r With assistance from SPC draft BdM Management Plans have been developed for each of the countries under study, drawing together best practice from these and other countries, and building in broad compatibility between country plans – this process should be continued to the point where BdM Management Plans are adopted and gazetted in each country.
A study of sea cucumber fisheries and bêche-‐de-‐mer production in the western South Pacific
Page | 51
r Existing sea cucumber management plans should be reviewed, and revised where appropriate, to ensure that all four key elements of an effective management system are in place [Recommendation 13].
r The main elements of management are technical measures, including minimum sizes (wet and dry), prohibitions on use of certain gears, and some degree of closed season – these are all appropriate, and should be given greater weight by increased effort to promulgate policy and management details to fishing and supply chain interests [Recommendation 13].
r It is an important component of the management of this fishery sector that all stakeholders are informed and up-‐to-‐date on not just the management rules, but also on sector performance – to this end it is important that all stakeholders have ready access, in one form or another (reports, posters, audio books, booklets, video), to information on the past performance of the sector and expectations for the coming year, as disseminated annually by the Fisheries Department [Recommendation 3 & Recommendation 15].
r It is important that any management regime should be adaptive, and responsive to new information; accordingly key elements of the regime should be reviewed, and technical measures restated, on an annual basis – to inform this process, much greater use should be made of the production and throughput data generated as conditions of production and export licenses, and more formal arrangements should be established to facilitate information gathering, debate and discussion between fishery managers and fishermen, processors and exporters [Recommendation 14].
r It is not possible given the huge number of largely peripheral fishing communities involved in harvesting sea cucumber and processing BdM to prescribe or in most cases even advise on sea cucumber fishery management at the community level; instead it will be up to fishermen and the traditional resource managers to manage their affairs – to assist and support them in such activity more effort needs to be put into helping them capture details of changes in the average size of each species harvested by communities through the development of simple sample questionnaire procedures, backed up by some simple sampling formats and data gathering formats [Recommendation 18].
r Provincial production quotas have been set and used in the sea cucumber fisheries and BdM production of PNG and Tonga; these have been relatively successful in capping production, but it is clear that the species / group quotas have been set at too high a level – we are of the view that setting and monitoring Provincial quotas at the point of export is an appropriate and valuable management tool, and that there is sufficient information available to set precautionary species quotas at the Provincial level on an annual basis; accordingly each country should work towards introducing such a system, starting with a revisiting of the availability and accuracy of data on harvest / production (building on the information already collated as part of this study, plus the results of dive surveys, and information from fishing communities and BdM buyers and traders) [Recommendation 19 & Recommendation 21].
r We have been able to fit a predictive model to sample data (see Appendix 17) – which produces a sufficient closeness of fit to warrant further work, with a fair conviction that useful guidance on management will result -‐ to take matters forward, in the first instance there is a requirement that the quality of the data be revisited – the PNG Provincial data needs cleaning up; Fiji data needs working up to generate a longer data set (the data already exists within the database); it may be possible to work with the Solomon Islands data, data quality

A study of sea cucumber fisheries and bêche-‐de-‐mer production in the western South Pacific
Page | 52
is not so good; the Tonga data set is very detailed but probably covers too short a time period; the Vanuatu data is inconsistent and incomplete [Recommendation 19 & Recommendation 22].
r Information on MSY and likely stock status can be used, with care and caveats, to inform the setting of Provincial quota ceilings; other information that can be used is the outcomes of dive surveys, and the history of exploitation at the species level – confidence in the estimation of stock status and reference points could be strengthened using additional information on changes in the average size or the size mix of harvests / Provincial production – which can be derived from the sampling of export shipments, and also by capturing community based information through completion of simple fishermen survey questionnaires [Recommendation 18, Recommendation 20 & Recommendation 25].
r Determination of Provincial species quota ceilings would be greatly assisted were reasonably detailed habitat maps to be made available at the Provincial label; these data in themselves could not be used to determine productivity and carrying capacity, but could productively contribute to work to improving the accuracy of modelling – the Reefbase Pacific project provides the primary grounding for such work, and extension of its coverage is to be encouraged; how best these data could be incorporated into improved BdM sector management should be further explored [Recommendation 26].
r In most countries management of sea cucumber fishing involves, to one degree or another, a closed season, and this practice is to be encouraged; but at the community level it is evident that in many if not most areas annual catch quotas could be harvested over a period of weeks only – accordingly, communities should be encouraged to limit fishing to short periods of time only; such a management system could be incorporated with rotating closed areas, and distinction between free diving and reef gleaning fisheries [Recommendation 30].
r A corollary of closed seasons is that there will be times in the year when BdM buyers and traders will not be able to handle product (which could amount to 3 months a year as in PNG, or nine months a year as in Tonga); under such circumstances either staff will have to be laid off or directed to other business activities – in this context we do not think that businesses that are solely dependent on the BdM trade are compatible with precautionary sustainable management of this sector, rather BdM processing / trading should form a part of a diversified business, and this characteristic should be a material consideration when examining eligibility when issuing licenses [Recommendation 11].
r Analysis of historic production indicates that in any one Province commonly the harvests of three or four species of sea cucumber account for upwards of three quarters of BdM export value for that Province – this suggests that the monitoring of stock status, determination of target reference point, and implementation of harvest and export caps and harvest control rules should focus first on these species – top of this list are sandfish, white-‐teatfish and lolly fish [Recommendation 23 & Recommendation 24].
r The two dominant fishing methods employed in exploitation of sea cucumbers are reef gleaning and free diving; catch profiles using these two methods tend to be quite different – it would be helpful to explore if different harvest control rules could be developed for these different fishing methods [Recommendation 28].
r Use of UBA gear in exploiting sea cucumber resources is banned in all the countries under study, and limited use of the gear is licensed in Fiji; despite these limitations, UBA gear is widely used in sea cucumber fishing, and diving accidents related to this are all too common,

A study of sea cucumber fisheries and bêche-‐de-‐mer production in the western South Pacific
Page | 53
including deaths and paralysis – use of UBA gear should continue to be outlawed, and control resources focused on achieving full compliance with this; the primary target of such fishing is white teatfish and opportunities for identifying UBA caught white teatfish through the supply chain should be explored [Recommendation 2].
r The fact that a small number of species dominate the value of sea cucumber harvests suggests that management of fishing effort at the village / community level could be driven by simple harvest control rules relating to the average size of the animals of any one of these species landed – the harvest control rule would encourage fishermen to shift effort onto other species once the average size of animals falls below a given threshold [Recommendation 27].
r There is currently sufficient species discriminated export data available on which to base precautionary export caps at national levels and in most cases at Provincial level; overall, such caps should be set at no more than 80 per cent of the 15 year production / export averages, and should, at a minimum, be set to cover high and low value sea cucumber -‐ more precautionary export caps should be set for the higher value species, many of which are both slower growing, and have been subjected to higher, more focused and more persistent fishing effort; in this context, specific stock recovery strategies will need to be developed and put in place for Tonga, Fiji and the Solomon Islands, where most stocks may be considered as being in an over-‐exploited state [Recommendation 20].
A study of sea cucumber fisheries and bêche-‐de-‐mer production in the western South Pacific
Page | 54
8 Opportunities for regional cooperation
There are a number of areas where the adoption of common standards, or where joint activity through regional cooperation would be helpful. For the Melanesian countries, an initiative through the Melanesian Spearhead Group (MSG) would yield dividends.
r Trade in BdM is an international business, with product sourced from all over the globe; but at the centre of this trade are a relatively small number of wholesale importers concentrated in locations such as Hong Kong, Guangzhou and Singapore; exporters in different countries are in touch with each other – directly and via their import customers – and share knowledge and experience; in addition, funding of buying and exporting operations is often provided by the main importers, who thus have considerable knowledge and involvement of these businesses, and who may encourage joint ownership of operations in different countries – it is appropriate that governments of producing countries share information on the beneficial ownership of the BdM trading companies that they are licensing and which operate in their respective territories; to do otherwise is to operate at a distinct disadvantage, particularly in the areas of enforcement and compliance [Recommendation 34].
r Extending this argument further, it is evident that many of the problems facing the industry are in part the result of or compounded by unnecessary secrecy with regard to the scale and performance of this sector, the geographical distribution of production, and those who are licensed to operate within the sector – it makes sense that governments should be much more open in reporting on sector performance, and that such information should be consolidated in an annual regional report [Recommendation 36].
r Statistics on the import of BdM to Hong Kong (To & Shea 2012 and summarised in Appendix 20) are well developed and accurate (those relating to mainland China less so), and show that for some countries of origin rather more product is logged into Hong Kong than is logged out of the exporting country; a particular case in point is the imbalance between exports from PNG and imports to Hong Kong, most evident during the current PNG moratorium (and corroborated by a research mission by government and trade representatives from PNG to Hong Kong and Guangzhou) – it makes sense that most investigations into the functional dimensions of this trade, including statistical research, and liaison with the governments of importing countries, be undertaken on a regional rather country to country basis, and that the results of research that are not commercially sensitive should be routinely shared across the region [Recommendation 33].
r The traditional core of BdM exporting countries is the Philippines, Indonesia, PNG, Solomon Islands and Fiji, and whilst in recent years their dominance of supplies has waned, they are still responsible for upwards of 50 per cent of global tropical supplies; their position in global supplies has weakened because of persistent over-‐exploitation resulting in reduced productivity, but the opportunities to source from elsewhere are also diminishing as those resources become over-‐exploited, which means that producers should be trading into a “sellers” market – it is not evident that the Pacific Islands and their BdM businesses are making the most of this situation; in the first instance governments should make much more effort to ensure that provision of a valid commercial invoice forms a necessary part of Customs clearance procedures, and that the information so provided is used by governments, and that the veracity of the prices quoted is confirmed (i.e. that the prices quoted are a genuine market price agreed between buyer and

A study of sea cucumber fisheries and bêche-‐de-‐mer production in the western South Pacific
Page | 55
seller, and that transfer prices are not being used); this information should be shared in so far as commercial confidentiality allows, so that it can be used to better inform trade policy; the veracity of prices has particular importance given that in many (but not all) businesses it is the importer that is providing the working capital for BdM supply chain networks in-‐country [Recommendation 8 & Recommendation 35].
r In a further development of this market position, some investigation should be made into the opportunities for auctioning BdM product, either by country or on a regional basis, as a means of achieving higher prices for the sale of product (and thus higher revenues to national governments through taxes and tariffs, and higher revenues to fishing communities and trade intermediaries) – this is a complex area of analysis, not least where there is evidence of close buyer / seller linkages, and where the market can be relatively easily rigged (where effective monopolies exist, or where apparently independent businesses are not so independent); it might also form a part of examination of the development of truly indigenous BdM processing and exporting companies (many of the new wave of BdM exporters include partners that have very close ties with BdM importers, to the extent that many could be reasonably conceived as operating subsidiaries of those companies) [Recommendation 38].

A study of sea cucumber fisheries and bêche-‐de-‐mer production in the western South Pacific
Page | 56
9 References
Agudo, Natacha (2006) Sandfish hatchery techniques; ACIAR / SPC / Worldfish
Anderson, Sean C, Joanna Mills Flemming, Reg Watson, Heike K Lotze. Serial exploitation of global sea cucumber fisheries (2011). Fish and Fisheries Volume 12, Issue 3, pages 317–339, September 2011
Battaglene S.C. & Bell J.D. (2004). The restocking of sea cucumbers in the Pacific Islands. p. 109–132. In: Bartley D.M. and Leber K.M. (eds). Case studies in marine ranching. FAO Fishery Technical Paper, FAO, Rome.
Bell, Johann D., Steven W. Purcell, Warwick J. Nash (2008). Restoring small-‐scale fisheries for tropical seacucumbers. Ocean & Coastal Management. Volume 51, Issues 8–9, 2008, Pages 589–593
Bell, Johann D., Natacha N. Agudo, Steven W. Purcell, Pascal Blazer, Mateo Simutoga, Dominique Pham, Luc Della Patrona (2007) Grow-‐out of sandfish Holothuria scabra in ponds shows that co-‐culture with shrimp Litopenaeus stylirostris is not viable. Aquaculture Volume 273, Issue 4, 20 December 2007, Pages 509–519
Castilla, JC O Defeo (2001) Latin American benthic shellfisheries: emphasis on co-‐management and experimental practices. Rev Fish Biol Fish, 11 (2001), pp. 1–30
Cinnera, Joshua E., Andrew Wamukotab, Herilala Randriamahazoc, Ando Rabearisoa (2009). Toward institutions for community-‐based management of inshore marine resources in the Western Indian Ocean. Marine Policy Volume 33, Issue 3, May 2009, Pages 489–496
Cohen, Philippa J., Simon J. Foale (2012). Sustaining small-‐scale fisheries with periodically harvested marine reserves. Marine Policy Available online 2 June 2012
Costello, C, D Steven, J Lynham (2008) Can catch shares prevent fisheries collapse? Science, 321 (2008), pp. 1678–1681
Day J (2008). The need and practice of monitoring, evaluating and adapting marine planning and management—lessons from the Great Barrier Reef Marine Policy, 32 (5) (2008), pp. 823–831
Duvauchelle, Cécile (2010) Développement d’un guide méthodologique de suivi de la pêcherie d’holothuries « gris » Holothuria scabra dans le lagon nord-‐ouest de Nouvelle-‐Calédonie; Mémoire de fin d’études Spécialisation halieutique d’Agrocampus Ouest; IRD Noumea, Nouvelle Caledonie
Džeroski, Sašo, Darrin Drumm (2003). Using regression trees to identify the habitat preference of the seacucumber (Holothuria leucospilota) on Rarotonga, Cook Islands. Ecological Modelling Volume 170, Issues 2–3, 15 December 2003, Pages 219–226
Foale Simon (1998). Assessment and management of the trochus fishery at West Nggela, Solomon Islands: An interdisciplinary approach. Ocean & Coastal Management Volume 40, Issues 2–3, August 1998, Pages 187–205.
Foale, S. (2008) Appraising the resilience of trochus and other nearshore artisanal fisheries in the Western Pacific; SPC Trochus Information Bulletin #14 – July 2008
Friedman, Kim, Hampus Eriksson, Emmanuel Tardy, Kalo Pakoa (2011) Management of sea cucumber stocks: patterns of vulnerability and recovery of sea cucumber stocks impacted by fishing; Fish and Fisheries; Volume 12, Issue 1, pages 75–93, March 2011
Friedman K., Purcell S., Bell J. and Hair C. (2008). Sea cucumber fisheries: a manager’s toolbox. ACIAR Monograph No. 135, 32 pp.

A study of sea cucumber fisheries and bêche-‐de-‐mer production in the western South Pacific
Page | 57
Gutiérrez NL, R Hilborn, O Defeo (2011) Leadership, social capital and incentives promote successful fisheries Nature, 470 (2011), pp. 386–389
Hamel, Mélanie A., Serge Andréfouët (2010) Using very high resolution remote sensing for the management of coral reef fisheries: Review and perspectives. Marine Pollution Bulletin Volume 60, Issue 9, September 2010, Pages 1397–1405
Hamel, Jean-‐François, Chantal Conand, David L. Pawson, Annie Mercier (2001) The sea cucumber Holothuria scabra (Holothuroidea: Echinodermata): Its biology and exploitation as Beche-‐de-‐mer; Advances in Marine Biology, Volume 41, 2001, Pages 129–223
Hasan MH (2005). Destruction of a Holothuria scabra population by overfishing at Abu Rhamada Island in the Red Sea. Marine Environmental Research Volume 60, Issue 4, October 2005, Pages 489–511
Hickey, F.R. & Johannes R.E. (2002) Recent Evolution of Village-‐based Marine Resource Management in Vanuatu -‐ in SPC Traditional Marine Resource Management and Knowledge Information Bulletin 14:8-‐21, Noumea, New Caledonia
Hilborn, R, K Stokes, T Smith, LW Botsford, M Mangel, J Orenzans et al (2004). When can marine reserves improve fisheriesmanagement? Ocean Coast Manage, 47 (2004), pp. 197–205
Johannes R.E. & Hickey F.R. (2004). Evolution of village-‐based marine resource management in Vanuatu between 1993 and 2001. Coastal Region and Small Island papers 15. Paris, UNESCO, 48 p. Available online at http://www.unesco.org/csi/wise/indigenous/vanuatu1.htm (last accessed April 2013).
Kinch, J. (2004). Sustainable Artisanal Beche-‐de-‐mer Fisheries through the Incorporation of Socio-‐economic Considerations in the Development of Community-‐based Fisheries Management Plans in the Trobriand Islands, Papua NewGuinea. Project Review Report-‐AMC/NRI-‐Trobriands – Review of ACIAR Project (FIS/1999/038)
Kinch, J.; Purcell, S.; Uthicke, S.; Friedman, K. (2008). Population status, fisheries and trade of sea cucumbers in the Western Central Pacific. In V. Toral-‐Granda, A. Lovatelli and M. Vasconcellos. Sea cucumbers. A global review of fisheries and trade. FAO Fisheries and Aquaculture Technical Paper. No. 516. Rome, FAO. pp. 7–55.
Lee, Jessica, Maria Byrne, Sven Uthicke (2008). The influence of population density on fission and growth of Holothuria atra in natural mesocosms. Journal of Experimental Marine Biology and Ecology Volume 365, Issue 2, 31 October 2008, Pages 126–135
Le Gallic, Bertrand (2008). The use of trade measures against illicit fishing: Economic and legal considerations. Ecological Economics Volume 64, Issue 4, 1 February 2008, Pages 858–86
Léopold, Marc, Nathaniel Cornuet, Serge Andréfouët, Zaccharie Moenteapo, Cécile Duvauchelle, Jason Raubani, Jayven Ham and Pascal Dumas (2013a) Managing sea cucumber fisheries using stock biomass estimates and spatial catch quotas: experience from New Caledonia and Vanuatu; paper to SPC HoF8 meeting, Noumea, New Caledonia, 2013
Léopold, Marc, Jennifer Beckensteiner, Jeremie Kaltavara, Jason Raubani, Sophie Caillon (2013b) Community-‐based management of near-‐shore fisheries in Vanuatu: What works?; Marine Policy 42 (2013) 167–176
Lincoln-‐Smith, M.P., K.A. Pitt, J.D. Bell, and B.D. Mapstone (2006) Using impact assessment methods to determine the effects of a marine reserve on abundances and sizes of valuable tropical invertebrates. Canadian Journal of Fisheries and Aquatic Sciences, 63, (6) pp. 1251-‐1266.

A study of sea cucumber fisheries and bêche-‐de-‐mer production in the western South Pacific
Page | 58
Muthiga, N.A., J.A. Kawaka, S. Ndirangu (2009) The timing and reproductive output of the commercial seacucumber Holothuria scabra on the Kenyan coast. Estuarine, Coastal and Shelf Science Volume 84, Issue 3, 20 September 2009, Pages 353–360
Okey, Thomas A, Stuart Banks, Abraham F Born, Rodrigo H Bustamante, Mónica Calvopiña, Graham J Edgar, Eduardo Espinoza, José Miguel Fariña, Lauren E Garske, Günther K Recke, Sandie Salazar, Scoresby Shepherd, Veronica Toral-‐Granda, Petra Wallem (2004). A trophic model of a Galápagos subtidal rocky reef for evaluating fisheries and conservation strategies. Ecological Modelling Volume 172, Issues 2–4, 1 March 2004, Pages 383–401
Paltzat, D.L., C.M. Pearce, P.A. Barnes, R.S. McKinley (2008). Growth and production of California seacucumbers (Parastichopus californicus Stimpson) co-‐cultured with suspended Pacific oysters (Crassostrea gigas Thunberg). Aquaculture Volume 275, Issues 1–4, 31 March 2008, Pages 124–137
Preston G. (1993). Chapter 11: Bêche-‐de-‐mer. Pp. 371–407 in ‘Inshore marine resources of the South Pacific: information for fishery development and management’, ed. by A. Wright and l. Hill. FFA/USP Press: Fiji.
Preston G & P Lokani (1990) Report of a survey of sea cucumber resources of Ha’apai, Tonga; Inshore Fisheries Research Report, SPC
Purcell S, P Ngaluafe & K Tamuera (2012a) Improving income of Pacific island fishers through better post-‐harvest processing of sea cucumber: scoping study; ACIAR small research project PARDI/2010/004; 57pp
Purcell, S.W., Samyn, Y. & Conand, C. (2012b) Commercially important sea cucumbers of the world; FAO Species Catalogue for Fishery Purposes. No. 6. Rome, FAO. 2012. 150 pp. 30 colour plates.
Purcell, Steven W, Annie Mercier, Chantal Conand, Jean-‐Francois Hamel, M Veronica Toral-‐Granda, Alessandro Lovatelli & Sven Uthicke (2011) Sea cucumber fisheries: global analysis of stocks, management measures and drivers of overfishing
Purcell, S.W. (2010). Managing sea cucumber fisheries with an ecosystem approach. Edited/compiled by Lovatelli, A.; M. Vasconcellos and Y. Yimin. FAO Fisheries and Aquaculture Technical Paper. No. 520. Rome, FAO. 2010. 157p.
Purcell, Steven W., Hugues Gossuin, Natacha S. Agudo (2009). Status and management of the sea cucumber fishery of La Grande Terre, New Caledonia. STUDIES AND REVIEWS | 1901. Zoneco/Worldfishcenter
Purcell, Steven W., David S. Kirby (2006). Restocking the sea cucumber Holothuria scabra: Sizing no-‐take zones through individual-‐based movement modelling. Fisheries Research Volume 80, Issue 1, August 2006, Pages 53–61
Ram, Ravinesh (2008) Impacts of Harvest and Post Harvest Processing Methods on Quality and Value of Bêche-‐de-‐mer in Fiji Islands; MSc Thesis, University of the South Pacific, Fiji
Ramofafia, Christain, Timothy P. Foyle, Johann D. Bell (1997). Growth of juvenile Actinopyga mauritiana (Holothuroidea) in captivity. Aquaculture Volume 152, Issues 1–4, 1 June 1997, Pages 119–128
Reyes-‐Bonilla, Héctor, Marıa Dinorah Herrero-‐Pérezrul (2003). Population parameters of an exploited population of Isostichopus fuscus (Holothuroidea) in the southern Gulf of California, México Fisheries Research Volume 59, Issue 3, 3 January 2003, Pages 423–430.
Simos, Theo (2011) Understanding the beche-‐de-‐mer value chain (Tonga and Fiji) – a presentation on part of the Pacific Agribusiness Research for Development Initiative (PARDI) research into the BdM
A study of sea cucumber fisheries and bêche-‐de-‐mer production in the western South Pacific
Page | 59
industry, made to the Asia-‐Pacific Sea Cucumber Aquaculture Symposium, SPC, Noumea, February 2011
Skewes T, N Murphy, I McLeod, E Dovers, C Burridge, W Rochester (2010) Torres Strait Hand Collectables, 2009 survey: Sea cucumber; CSRO National Flagships, AFMA
Skewes T, S Taylor, D Dennis, M Haywood, A Donovan (2006) Sustainability Assessment of the Torres Strait Sea Cucumber Fishery; Torres Strait Research Program; CRC-‐TS Task Number: T1.4
Skewes T, D Dennis, A Koutsoukos, M Haywood, T Wasserberg, M Austin (2004) Stock survey and sustainable harvest strategies for Torres Strait beche-‐de-‐mer; Torres Strait Research Program; AFMA Project Number: R01/1345
Slater, Matthew J., Alexander G. Carton (2007). Survivorship and growth of the seacucumber Australostichopus (Stichopus) mollis (Hutton 1872) in polyculture trials with green-‐lipped mussel farms. Aquaculture Volume 272, Issues 1–4, 26 November 2007, Pages 389–398
Slater, Matthew J., Andrew G. Jeffs, Alexander G. Carton (2009) The use of the waste from green-‐lipped mussels as a food source for juvenile seacucumber, Australostichopus mollis. Aquaculture Volume 292, Issues 3–4, 15 July 2009, Pages 219–224
To A. W.L. & S. K.H. Shea (2012) Patterns and Dynamics of Bêche-‐de-‐mer Trade in Hong Kong and Mainland China: Implications for Monitoring and Management; TRAFFIC Bulletin Vol. 24 No 2 (2012) 65-‐76
Uthicke, S., Byrne, M., & Conand, C. (2010). Genetic barcoding of commercial Beche-‐de-‐mer species (Echinodermata: Holothuroidea). Molecular Ecology Resources, 10: 634–646
Vannuccini, Stefania (2004) Sea cucumbers: a compendium of fishery statistics; in FAO Fisheries Technical Paper 463 -‐ Advances in sea cucumber aquaculture and management – ed. by Alessandro Lovatelli, Chantal Conand, Steven Purcell, Sven Uthicke, Jean-‐François Hamel, Annie Mercier
Vasconcellos, M. and Cochrane, K. (2005) Overview of World Status of Data-‐Limited Fisheries: Inferences from Landings Statistics -‐ Fisheries Assessment and Management in Data-‐Limited Situations. Alaska Sea Grant College Program. AK-‐SG-‐05-‐02, 2005.
Wen, Jing, Chaoqun Hu, Lvping Zhang, Peng Luo, Zhe Zhao, Sigang Fan, Ting Su (2010) The application of PCR–RFLP and FINS for species identification used in seacucumbers (Aspidochirotida: Stichopodidae) products from the market. Food Control Volume 21, Issue 4, April 2010, Pages 403–407
Wu, Zhongchen, Lin Tao, Pengyan Zhang, Ping Li, Qianqian Zhu, Yong Tian, Guiqiang Du, Maoshui Lv, Tianlin Yang (2010) Diffuse reflectance mid-‐infrared Fourier transform spectroscopy (DRIFTS) for rapid identification of dried sea cucumber products from different geographical areas Original Research ArticleVibrational Spectroscopy, Volume 53, Issue 2, 20 July 2010, Pages 222-‐226
Zhou, Yi, Hongsheng Yang, , Shilin Liu, Xiutang Yuan, Yuze Mao, Ying Liu, Xinling Xu, Fusui Zhang (2006). Feeding and growth on bivalve biodeposits by the deposit feeder Stichopus japonicus Selenka (Echinodermata: Holothuroidea) co-‐cultured in lantern nets. Aquaculture Volume 256, Issues 1–4, 15 June 2006, Pages 510–520

Page | 1
Annex 1 -‐ Country profiles
Tonga
Tonga is a very small country – population and land area. The most extensive reef systems are in the middle Province of Ha’apai; fewer reefs are evident in the more rocky north at Vava’u, and more muddy ecosystems dominate on the southern islands of Tongatapu and Eua.
The BdM resource was exhausted in the 1990s and closed in 1997 for a period of ten years. Because the island groups are so small, it is feasible to centralise processing, buying fresh / live sea cucumber directly from fishermen. Firewood is available on each of the island groups, but space is limiting, and there has been some concern that if fishermen processed their own sea cucumber the smell would be problematic.
A further consideration is that there is no history of customary rights over the marine environment – all reefs, etc., are essentially in crown ownership – i.e. all marine resources are common property, and there is open access.
The management regime requires that fishermen, processors and exporters are licensed. The original idea was to limit the number of processor and exporter licenses to 3 of each per island group. In practice this was never adhered to and, under pressure, government has in the past issued far more processing and exporter licences than this.
Total allowable catches, per island group and per species, have been set – taking into consideration former production levels and the results of repeat resource surveys. The quotas have been varied year to year to reflect changed conditions (through consultation with fishermen and industry, plus some input from resource surveys).
The fishing season has been restricted to three months per year (typically July, August and September), but this has been varied between years (only open for one month in first year, and then seven months in the second year), with decision-‐making subject to both political and commercial pressure. Processors and exporters are given a month after closure to complete processing and clear stock.
Each processor is required to submit buying records on a weekly basis. Each export shipment requires inspection and ratification by Fisheries, quarantine, and customs personnel – including a detailed packing list with details of species and weight. The government levies a 5% ad valorem duty on export value – calculated on the basis of a standardised imputed value (rather than the commercial value on the shipping manifest).
Tonga maintains a simple but effective BdM database, written in MSAccess, that records purchases and exports information, and cross checks exports against relevant licensing and authorisations. The resultant dataset provides pretty comprehensive information on the fishery, excluding illegal catches and shipments (which in the greater scheme of things are probably not that significant).

Page | 2
The fishery was opened for 1 month in 2008, 7 months in 2009, 3 months in 2010, 4 months in 2011, and 3 months in 2012. The statistics clearly show that the high value species were fished down in the first three years, which coincided with the issuing of a large number of processing and exporter licenses (many taken out by the more prominent members of society). Exploitation can be seen to have then shifted to large volumes of the lower valued species, and anecdotal information suggests that the smaller sizes predominated in landings.
All processing is undertaken using salt. Typically the process involves a first boiling, a drying, a second boiling, a salting, a drying and then a third boiling and drying. The technology employed ranges from upright and split oildrums over wood fires plus copra dryers and drying in the open and/or in polytunnels, to boiling in stainless steel cookers over kerosene, and drying through a combination of kerosene fired kilns and airdrying on wracks (in and/or out of polytunnels).
The purchase and export trade figures suggest that this fishery should have been closed after three years. Instead, and under pressure from commercial interests, the fishery has remained open for a further two years (and at the last moment, this year’s season has been extended a further three months, i.e. doubling its length). The value of exports from these last two years has been substantially lower than previous years, and the volumes of high value species have been very small. It is certain that keeping the fishery open for a further two years has severely compromised the reproductive health of the main high value species (white teat fish, red surf fish, black teat fish and stonefish), and it is all but inevitable that the fishery will now need to be rested / closed for a longer period of time than would otherwise have been necessary.
In 2011 the license fee for an export license was raised from about TOP$3,000 to TOP$30,000 (USD17,000). Far fewer licenses were sold on this basis (lack of interest from foreign buyers, who would be expected to both pay for the license and pre-‐finance that season’s raw material purchases; lack of interest conjectured to have less to do with higher costs, more to do with most of the high value resource having been already harvested), and for 2012 it is clear that a number of processors / exporters are struggling to handle the volume of product necessary to recoup license and capital costs.
In general the management plan in place for the country has worked well in formalising and controlling exploitation, production and export, but it has clearly failed to stop the fishing down of the stocks. A combination of low exporter license fees in the early years of the plan and a failure to restrict / control the number of exporter licenses issued has meant that a very few high ranking Tongans have profited substantially – not from the harvesting, processing and exporting of BdM, but from accessing and effectively selling-‐on (to foreign interests) the export licenses.
The one other management problem is that there is a large relatively shallow coral platform making up the southern part of the Ha’apai province. There are no islands in this area (i.e. local monitoring of the area is low to zero). It is fairly clear (though formally unsubstantiated) that this platform is illegally fished for BdM using hookah and scuba gear – usually by Tongan fishermen operating from boats organised by the key exporters. The main target species being harvested from this area is white teat fish. The fact that at the end of the 2012 season most processors are still salting down large white teat fish (five years after this modern fishery was opened, and white teat fish heavily targeted) would suggest that at least some of this product is the result of illegal scuba / hookah fishing. As a slow growing

Page | 3
species, and with densities on the grounds taken to a significant low point, it is likely to be some considerable time before this resource recovers, if it does so at all.
Good points – by species and by Province TACs; good data capture; restricted fishing season; under the local circumstances, centralised processing is workable; high cost of an export license.
Poor points – substantial political and commercial influence; failure to limit licenses; inconsistency in season lengths; indecision over length of season and closure of the fishery; failure to control illegal hookah / scuba harvesting.
Page | 4
Papua New Guinea
PNG is a huge country, in contrast to the other Melanesian countries, with enormous island resources. It represents 15 of the 38 provincial / district divisions that are used in this study and, even then, each province has a population five to ten times greater than those in the other countries.
Here, what was probably a Province-‐based fishery system has become centralised around the PNG National Fisheries Authority (NFA), established relatively recently as a means of directing tuna access revenue and royalties away from central government coffers and into exclusively fisheries work. This is an entirely positive move in ring-‐fencing fishery revenues, but has the distinct disadvantage of over-‐centralisation, and a ruling focus on things to do with tuna.
Clearly the NFA is under considerable government / political pressure to distribute / apply these financial resources to local PNG issues -‐ as in coastal fisheries. This is indeed what it is doing, but this perhaps does not work well with a particularly centralised structure located in Port Moresby.
Its key link to the Provinces is through a Memorandum of Agreement (MoA) with Provincial Governments in which it will distribute financial resources to Provincial Fisheries Offices for the provision of certain services. This is supported by NFA Provincial Liaison staff (in Port Moresby), and control & enforcement, and audit & certification, staff capable of deploying in the Provinces. To a large degree, the services nominated in the MoA are provided by Provincial Fisheries Offices, but it is hardly a recipe for development of long-‐term and effective fishery management or development capacity at the Provincial level, particularly given the cash-‐strapped nature of most Provincial Governments (though there is currently a political move to shift greater responsibility, and resources, to the Provinces).
This said, PNG has probably invested more resources – time and money – into the monitoring, research, and study of the beche-‐de-‐mer resource and trade than any other Pacific Island country.
PNG has arguably the largest production capacity of all the PICTs, with production distributed across the country, but with the highest production in Milne Bay Province (mixed species), Western Province (sandfish), Madang (mixed), Manus (mixed), New Ireland (mixed) and West New Britain (mixed).
The sheer scale of the country means that distribution logistics are long distance and more complex than in other countries. Licenced exporters are located in the capitals of each of the main producing provinces. Most of these will export on their own behalves, but some will also act as agents for national companies located in Port Moresby, or will sell product to these companies in Port Moresby. On this basis, exports are made directly from such ports as Daru (Western Province), Port Moresby (Capital District), Alotau (Milne Bay Province), Madang (Momase Province), Lae (Morobe) and Kokopo (East New Britain).
Each of these licensed exporters supports a network of buyers operating in one or more Provinces. In turn these buyers may themselves operate another level of buyers, extending right the way down to individual villages. All of these buyers compete to purchase product
Page | 5
from fishermen, change prices offered according to circumstances (degree of competition, level of supplies, level of demand, timing, etc.). In some cases these buyer networks are committed to particular exporters, but in many if not most cases the buyers themselves play the market, offering all or some product to the highest bidder on the day, even where a buyer or exporter further up the chain has advanced funds or equipment as a means of cementing loyalty. In some circumstances, for example in the island Provinces, the exporters or the large buyers send out collection boats to go round the island villages to secure product, linking to their agents in these villages. Again, if the price is not right, these village agents may withhold product and sell to a higher payer. Where these larger-‐scale buying trips are being undertaken, boats / buyers need to take large sums of cash, and so often take along armed escorts to protect the cash, and later to protect the bagged BdM (which is almost as good as cash, given the state of the market).
Where BdM fishermen are located close to a provincial town or a large buyer, they will generally sell sea cucumber that has been boiled once (and thus which will require further processing by the buyer). More distant communities will generally only sell fully or more fully processed product. This product will need to be graded and some re-‐processed at the premises of the exporters. An influx of new exporting companies with little to no former involvement in PNG and/or this industry sector, and little if any investment in facilities and infrastructure in their areas of proposed activity and trade, has in at least some cases led to a distinct change in the nature of the buying. The most insidious element in these changes is the encouragement of fishermen to favour short-‐term gain over more responsible and more conservative decision-‐making.
The PNG fishery has undoubtedly been around for a century and more, but the modern systematic record series only begins in the early 1990s, going forward to the present. This forms a part of the comprehensive and sophisticated data capture infrastructure designed and managed by NFA. This records production throughout the 1990s as being very modest (in all likelihood production volumes were higher than those recorded), but things took off in the late 1990s and built up quickly to a particularly high peak in the mid-‐2000s – largely driven by the significantly raised prices offered by Asian markets. This situation was considered to be unsustainable, and so the decision was taken to close the fishery as from 2010. It has yet to be re-‐opened.
A most recent BdM management plan has been in place since 2002, and it replaced a previous plan. This focuses on licensing exporters, monitoring exports, purchases and inter-‐Provincial transfers, restricting licenses, and setting Total Allowable Catches (TACs) per Province split between generic high and low value categories. Purchase and export records – on paper and in the field -‐ are monitored by NFA audit and enforcement divisions, and interventions are made on the basis of the analysis of records, and on the basis of intelligence of illegal activity received from other enforcement agencies (police, customs) and from Provinces, villages and the trade.
The system works passably well, though whilst information on the scale and nature of the trade is transmitted up to NFA in Port Moresby there is little indication of a reverse movement of information. Accordingly, there is limited active management or adaptation of this trade by government administrations – and limited capacity to signal to all and sundry when TACs are being exceeded. This is complicated further by the issue of inter-‐Provincial transfers. These are actively monitored (exporters are required to request permission from NFA to make such a transfer), but there is significant delay in the consolidation of such data,
Page | 6
and thus in the calculation of actual production per Province. Inter-‐Provincial transfers are necessary to allow product to be consolidated at the main points of export.
Leakages to the system are considered to be significant, particularly since the fishery has been closed (indeed NFA enforcement indicates that it spends far more resources monitoring and enforcing the BdM closure than on any other national fishery). Major leakages are thought to take place across the borders with West Papua – west from Western Province in the south and from Sanduan (West Sepik) Province in the north – and in association with the export of other commodities (timber, rubber, etc.) where BdM is secreted amongst bulk cargo exports. Some leakages of indeterminate size may take place between AR Bougainville and the Solomon Islands, but this is also a two-‐way channel, given the official closure of the Solomon Island fishery. Further though, it is thought that substantial quantities of BdM are exported in personal luggage and effects (a large Asian – Chinese, Malay -‐ population is present working on various large scale development projects – and it is conjectured that many of these send out small quantities of BdM on a regular basis).
The enforcement section of NFA has been able to raise cases against illegal operators, but in all too many cases the fines handed down by the courts have been low and insufficient to act as an effective deterrent to further illegal activity. In particular, those Chinese and Malays associated with such activity – as individuals and as business partners – have generally escaped major censure. In an effort to strengthen deterrence, NFA has moved to the application of Summary Administrative Panels (SAPs), which broadly allow the NFA to apply Administrative Fines for offences without automatic recourse to the courts (though these can probably still be contested through the courts, though this does not often seem to be the case).
Consolidated export statistics for the country indicate that over fifty per cent of all export value lies with six high value species of BdM, with a wide range of other, and generally lower value, species making up the remainder. But a Province by Province analysis indicates some wide variation in the mix of species harvested, with the island Provinces harvesting a wider range of species. In part this is a function of the prevalence of mangrove / estuarine / mud bank habitats associated with mainland Provinces – habitats that favour sandfish and some low value species, but which are not suitable for most other high value species. Thus Western Province, for example, is a major producer of sandfish (the highest value sea cucumber), but produces little else.
A new BdM Management Plan is under consideration. The main changes being proposed are that buyer licenses will be re-‐introduced, and that more authority and responsibility is passed down to the Provinces and to the villages / local communities. In preparation for this, consultations have been undertaken at Provincial / community level, and with Provincial and industry representatives, though the extent and depth of such consultation seems to have been limited. Also, given the all but total absence of extension capacity at Provincial level, and the very large and dispersed nature of fishing communities within each Province, the overall impression is that high level policy and planning greatly underestimates the scale of the challenge of this policy shift – even though this does appear to be an absolutely essential move in fisheries management if appropriate and adaptive management of the BdM (and other) fishery and trade is to take place, and enforcement costs are to be reduced.

Page | 7
Whilst PNG embraces a wide range of different language groups (over 800 distinct languages / dialects extant in recent times) and customs, community-‐based management of marine areas and resources does not appear to be a common or traditional management pattern. In contrast, custom rights to particular marine areas and resources does appear to be well grounded, and vigorously defended – but it appears that little equivalent effort is invested in controlling exploitation or activities of fishermen within that customary title. Accordingly, a move towards the introduction of community-‐based management or of co-‐management at the community level appears to be both alien and a major challenge (in many of not most regions). The dividends across rural society from such a move could be considerable – not just affecting BdM exploitation and production – but it should be re-‐emphasised that the scale of this policy shift towards subsidiarity1 appears to be grossly under-‐estimated.
Overall, the PNG BdM management system may be deemed to have failed in that it has been necessary to close the fishery for an indeterminate period of time. Mitigating circumstances are simply the scale of managing such a diverse and large scale rurally based fishery – most of it taking place in the extreme peripheral villages and islands of the country. This is not helped, however, by an over-‐centralised management system, and a poorly developed Provincial fishery management / extension capacity.
Good points: licensing of exporters; good paper trailing of buying and exporting; upper limits to exploitation per Province; substantial research and investigation into the operations of the sector; significant resources applied to enforcement
Poor points: over-‐centralisation of monitoring, decision-‐making and management; weak Provincial fishery infrastructure; failure to transmit in a timely fashion the results of data and policy analysis; relatively poor levels of engagement between government, industry and fishermen / fishing communities; highly variable quality of processing; no use of salt in processing; little incentive on exporters, buyers, village councils and fishermen to apply restraint in the amount and nature of sea cucumbers that are taken from the sea.
1 Subsidiarity is where the passing down of the responsibility for management to the lowest appropriate level of society – a move away from central top-‐down management, to more dispersed bottom-‐up management (moving more of the responsibilities and obligations of management to provinces, districts, villages, special interest groups, households, and eventually individuals).

Page | 8
Vanuatu
Vanuatu is a complex of some 80 islands lying in a north south orientation broadly to the east of a subduction oceanic trench. Islands are of volcanic origin, many with hilly or mountainous interiors, and with sharp coastal fall-‐offs. A characteristic of this geography is that most reef systems hold tight to the shoreline, providing limited habitat for sea cucumbers, and the country’s beche-‐de-‐mer production capacity is accordingly the lowest amongst the countries under study.
There are exceptions to this typology, and this is where beche-‐de-‐mer production is centred – the smaller islands to the north and south of the group, the more central island of Efate, which is a broadly lower lying island, with some lagoons and offshore islets, the east coasts costs of the other two larger islands, Malekula and Santo, and the Maskelyne Islands lying just to the southeast of Malekula (and reputedly the most focused of producing areas).
Rapid escalation in the level of extraction of sea cucumber across the 1990s and early 2000s led to the closure of the fishery at the end of 2007. It was due to reopen in January 2013. The closure was then extended another five years until January 1st 2018, citing a lack of sufficient recovery of BdM stocks.
The country has in the order of 790 villages or settlements. Port Vila on Efate island is the capital, and the second urban centre is Luganville on the island of Santo. BdM exports are made from both of these commercial ports, and the commercial structure of the BdM industry is centred around these two urban centres. Small-‐scale agents2, buyers and simple points of contact are located in and around the main producing areas. When villages have produced sufficient quantities of BdM to interest a buyer, a buyer will typically then visit the village / region, negotiate a price, pay in cash, and take the product back to base – shipping it by sea, or in more remote areas, or for small quantities, flying it back to base. Here the product is sorted and graded, and almost inevitably some degree of re-‐processing is required.
On Efate, with a much more developed economy and road system, the logistics of purchasing are simpler, and trucks can be sent out to buy / pick-‐up product, and indeed in some circumstances product is bought wet (for example one company produces small quantities of a dietary supplement / pharmaceutical product that incorporates extract of sea cucumber in its formulation). Similarly, fishermen are also better able to take finished product to Port Vila for sale to the highest bidder. But as a counter to the facility of better logistics, much of the coastline of Efate (and increasingly Santo) has been alienated for plantation, tourism and residential development, and so there is arguably less ready access to the sea and its resources, plus there are greater alternate economic opportunities open to the people of Efate. Accordingly sea cucumber harvesting and processing may not be as attractive an option as it has formerly been.
By contrast, the people of the Maskelyne Islands, a group of small offshore islands just off southeast Malekula are more dependent on the sea and its resources. Whilst villages and
2 Some of these agents resident in villages continue to secretly purchase BdM and other marine products during periods when a village has closed its fishery, and this undermines management of the resource; this is an area of governance where the Fisheries Department could productively work more closely with traditional community leaders.
Page | 9
villagers have land holdings on the mainland where they can tend gardens, etc., these are some considerable distance from the islands, and so the role of marine resources still dominates the local culture (and the people of these islands still retain a canoe sailing tradition). Here there are few alternate opportunities for income generation. To a lesser extent, a similar situation applies for some of the people of the smaller high islands to the north and to a lesser degree to the south of the country who are economically and geographically peripheral, and have much greater limitations on ways to raise cash.
A halfway house exists on some of the other islands, where there has been recent improvement in roads, shipping and communications (as well as greater agriculture diversification), meaning that villagers have easier access to urban facilities and employment, and are also more able to ship or take product to market. This is the case on east Santo, and to a lesser extent on Malekula.
Traditional culture largely dominates on the islands, with over a hundred different cultural-‐linguistic groups found. Common threads in these customs are that all land is typically held under customary tenure, and this includes shallow water and reef systems extending to the outer reef edge. In this type of system so typical of Melanesia, land and reef systems are held in ownership by families, extended families, clans and tribes. Whilst decisions with regard to management are typically in the hands of a chief or clan leader, they necessarily reflect some degree of consensus amongst the various rights holders. Due to the extensive alienation of land, and massive depopulation and migration associated with the colonial period, the tenure of many areas, including reefs, is sometimes in dispute. These disputes often result in the undermining of resource management efforts until a dispute can be resolved.
The existence of this type of system has two key consequences:
• the downside is that disputed areas may suffer from resource management issues, and
• the upside is that village or clan chiefs have considerable authority and exercise this authority in the informed management of the land and marine resources under their control, including adopting and enforcing government regulations.
In the context of marine resources, this latter power is exercised by the opening and closing of fishing areas through systems of tabus, usually reflecting a compromise between precautionary resource management and the cultural and socio-‐economic needs of the community, most typically evident in the form of feasting (for key events in a community’s calendar -‐ deaths, marriages, church ceremonies), but also where a community needs to raise moneys for important but subsidiary needs that can only be settled in cash (school fees and imported goods such as building materials for churches, sugar and dry goods, boats, engines, and fuel). The dominant economic form practised in communities is subsistence and barter agriculture, reef gleaning and fishing. This is supplemented by wage earning (copra and other agriculture products including kava and cacao, timber, government) and increasingly from small-‐scale tourism ventures. The relative balance between subsistence and cash transactions is shifting towards the latter, and this change is faster and more advanced the closer a community is to an urban or economic centre.
In Vanuatu traditional marine tenure systems form the foundation of village-‐based marine resource management. Typical management strategies include areas, seasonal or species specific closures, permanent closures, and the banning of certain types of gear, or the banning of certain types of gear in certain areas and/or seasons. For sea cucumber fisheries
Page | 10
this can mean that sea cucumber fishing is effectively closed until it is specifically opened, and/or that certain areas are placed in permanent or temporary reserve and off limits. It should also be said that where chiefly authority or controls are weak, such fisheries may be relatively unrestricted – with the key caveat that this does not extend to fishing by people who do not have rights to exploit that area, and any such inroads will be actively rebuffed.
Previous cooperative management programmes to communicate improved marine resource management and to support customary management were introduced by the Fisheries Department in the early 1990s. Early work focused on the management of trochusand green snail exploitation. In the mid-‐1990s the work of a local NGO (Wan Smolbag Theatre) promoted improved turtle management and gradually diversified to other resources, including bêche-‐de-‐mer. This has led to the emergence of a network of village-‐based marine wardens who monitor and encourage responsible resource management with the support of village leaders. The Vanuatu Cultural Centre has also actively promoted the strengthening of traditional resource management through its fieldworker network. This network is linked closely with traditional leaders throughout the archipelago and promotes sustainable use of resources balanced with socio-‐economic needs.
The Fisheries Department has adopted the strategy of supporting NGO and other partners to promote marine resource conservation while the extension services primarily prioritise development initiatives. There is one Rural Fisheries Development Officer stationed in each of the Provinces; they are, however, poorly resourced and given the area they are meant to cover their capacity remains limited. There are, however, at least a couple of current AusAID funded programmes promoting entrepreneurship in rural agriculture and fisheries, as well as a JICA livelihoods programme amongst other activities that support extension type activity.
In Vanuatu this traditional system of village-‐based management operates widely and to considerable effect3 – albeit largely independently of government (and at great savings to government budgets). The government system is highly centralised around the Fisheries Department – based in Port Vila, with an outlier in Luganville. Vanuatu is divided into six Provinces, but Provincial government is generally weak, under-‐funded and under-‐resourced. The Government of Vanuatu does have a well-‐developed sea cucumber management plan (currently under revision), but the contents of this plan have not been effectively communicated to the Provinces or to village communities to date. Most people are aware that the fishery is officially closed since 2008, but few have been aware that there are minimum size limits introduced since 2005 on what can be caught or processed. But even the weight of these messages is obscured by periodic, highly public and widely publicised rumours (with some foundation) that the government has extended long-‐term leases or even monopolies to outside interests for the exploitation of sea cucumbers. And many, and particularly the more peripheral, communities remain hard-‐up for cash and are tempted to continue to harvest and process sea cucumber, regardless of the ban. Such harvests can be discretely shipped out of Vanuatu in one way or another – particularly given the increasing scale of marine traffic in and around the islands.
In terms of the trade, in its heyday in the 1990s, there were about five exporters / re-‐processors in Port Vila and three exporters / re-‐processors in Luganville. Most, but not all, of
3 In addition, a number of communities have found that the incidence of ciguatera fish poisoning has occurred after fishing out the local BdM stocks, and for this reason, village leaders have placed a tabu on harvesting them for this reason (Johannes and Hickey 2004).

Page | 11
these had strong Asian connections (long-‐established local Asian trading houses), but more recently there was evidence of more opportunist activity, with Asian entrepreneurs actively seeking to set-‐up and access local bêche-‐de-‐mer product – though this has not been as evident as elsewhere in the study area. As also indicated in other countries, the more established (and to some extent more diversified) traders consider the new wave of opportunistic traders showing interest in the Vanuatu BdM trade as being problematic -‐ on the basis that the new entrants are not committed to the business, they are only in it for a quick profit, they subvert established relationships and practices buying what the more established traders would not have bought in the past, and generally playing fast and loose in “flashing the cash” in village communities. To remain competitive, the more established traders generally have to follow suit if they wish to stay in business.
Exporters / re-‐processors require to hold an annually-‐renewed Fish Export and Processing Establishment License from the Fisheries Department, and go through the normal formalities to document goods for export – including securing a valid Fisheries Department Export Approval form, and submitting an appropriate packing list identifying species, weight and value of BdM being exported. Exporters / re-‐processors are also required to submit a monthly purchases listing – showing purchases by species, weight, and location of harvest, however, this does not always happen. As matters stand today, data-‐sets compiled and held by the Fisheries Department are incomplete, lacking discrimination by species from both purchase records and export records. Customs documentation is held by Customs, but is not shared with the Fisheries Department. The Central Statistics Department can provide headline data on the quantity of BdM exported, but does not discriminate the trade at a higher level of detail, despite it supposedly having access to the Customs export database. As a result, data interpretation can be misleading, and is clearly not used for BdM sector management – at a national level, let alone at a Provincial or local level.
Overall, the five year moratorium has been broadly held to. A number of the former traders have all but disappeared, and the rest have found commercial ventures, or resumed former business activities.
But the Fishery Department has issued at least two “research” licenses. One to an expatriate Fijian who has been involved in the Vanuatu BdM business for some time. He is experimenting with the production of dried and frozen value added BdM products. Another has been given to Unicorn Pacific Corporation, a local company owned by a long term beche-‐de-‐mer trader who had formerly worked the Queensland BdM trade. It is reported that they only purchase lollyfish, primarily from around Efate. This company manufactures and exports a dietary supplement, TBL12, currently being trialled as a possible treatment for multiple myeloma. So far there is no information available on what is expected of these research licenses, and no written information has been asked for or provided to the Fisheries Department by either company.
In addition, there are persistent rumours that one Asian company has been given a long-‐term (said to be 50 years) lease to restock sea cucumber resources on the island of Malekula and allowing it to exclusively harvest the product, and that another Asian business has been licensed to harvest and export product on the island of Efate. Such developments, if true, are irregular, are at odds with established policy, and are counter national and especially local, interests.
As matters stand, the fishery is supposed to re-‐open at the beginning of 2013, but the government announced an additional five year moratorium to allow stocks to recover until
Page | 12
1st January, 2018. A revised Sea Cucumber Management Plan is in the final stages of development, but alongside this a two year research programme into the status of local sea cucumber stocks and management is only now a little over half way through.
Good points: it is considered that traditional reef tenure and management systems continue to work in many rural communities and to contribute effectively to sea cucumber management; the five year sea cucumber harvesting closure has, in general, been upheld well; the harvest potential of Vanuatu is small, and so there has been rather less pressure to break the moratorium than is evident in other countries; the Fishery Department is exploring an innovative approach to local area sea cucumber resource assessment and management, pioneered in Northern Province, New Caledonia, that may prove helpful to Vanuatu although it may place a considerable financial burden on the Department to implement (and we caution that it is unlikely to be scalable to countries with larger resource potential).
Poor points: The capacity of the Fisheries Department or its Provincial representatives to manage the sea cucumber fishery is limited in the extreme; the collection of trader and export data and collation for management purposes needs there is inconsistent decision-‐making with respect to the management and exploitation of this fishery, including possible (and largely uninformed) political interference; closure of the fishery has disadvantaged many peripheral communities in the country, some of whom have little alternate opportunities for meeting their cash needs; the quality of BdM processing by fishing communities is recognised as highly variable (in part as a result of lack of knowledge, and the absence of any relevant training or guidance) so the value of the resource may be increased through further training in consistently producing high quality product.
Page | 13
Solomon Islands The Solomon Islands comprises a number of large mountainous islands primarily arrayed around The Slot, a wide open sea channel oriented west northwest to east southeast from Bougainville down towards the outlier islands of the country’s Eastern Province. Long a BdM producer, going back at least a couple of hundred years, significant production is centred around the islands of New Georgia, Choiseul and Santa Isabel, and outlier production from Ontong Java atoll to the north of the island chain and the Temotu islands to the east (and to the north of Vanuatu). To give an indication of the scale of the country, from one end of the country to the other is about 1800 kms.
The country is relatively sparsely populated, but with numerous small settlements all around its coastline (the exception is the island of Malaita, which has substantial inland as well as coastal populations). All towns are small, and road systems are limited in spread, and poorly developed; the main modes of transport are by sea (by small ferries, and by small outboard powered fibreglass boats – regionally known as banana boats).
There is wide cultural diversity across the islands, with marked differences in the structure of society and in the rules of inheritance. The common features are that there is well established customary ownership and management of land (and coastal reefs and waters) along broad kinship lines (individuals do not have sole inalienable property rights), and strong associated customs and power hierarchies. Households participate in an essentially subsistence and barter economy. Whilst wage earning opportunities are limited, most households do require some cash income. To meet this there are some economic opportunities through public service, a plantation economy, and small-‐scale trading – otherwise there is a requirement to produce a surplus from gardening, reef gleaning and fishing. It is of note that the country has some of the most extensive lagoon systems in the Pacific (Morovo lagoon), offering significant fishing opportunities, but also many of the islands are steep sided and have very limited reef systems.
In the late 1950s, I-‐Kiribati from the southern Gilbert Islands, and some from the previously resettled Phoenix Islands, were resettled to Gizo, Titiana and Wagina Islands in Western Province in the Solomon Islands. I-‐Kiribati are an atoll and sea-‐going people, skilled in fishing. The resettled I-‐Kiribati are effectively landless and, with markedly different traditions and societal structures to those in the Western Province and other parts of the Solomon Islands, they are very dependent on wage earning employment – and fishing. Since I-‐Kiribati have no custom access to reefs and coastal areas, their activities are typically in conflict with the interests of custom owners of reefs and coastal areas – and this is a constant source of friction and tension. I-‐Kiribati are involved in sea cucumber harvesting and BdM production, but they, of necessity, work outside the established power structures of Solomon Islands societies, and little effort has been made to formally incorporate this sector of society into local systems of marine and fishery management.
It is also of note that whilst government is centralised around the Parliament and the capital Honiara, and Provincial authorities are generally weak and under-‐resourced, the structure and organisation of society and the economy is strongly decentralised and fragmented.
All the above characteristics impact directly on the structure and organisation of the BdM business. All exports are through Honiara, where the main traders are located. But the long distances from producer to export point make it impractical to centralise processing, and so these traders do little more than receive, check, and ship finished product. Even in the Provinces, poor transport infrastructure, and the isolation of many fishing communities, means that primary and often full processing is necessarily undertaken within the fishing
Page | 14
communities, and the trading networks needed to bring together the finished BdM for shipment to Honiara are extended, multi-‐layered and complex, and there are many small-‐scale intermediaries in these networks. Buyer networks extend right across the producing areas, and to secure supply lines buyers often need to resort to the offer of inducements to villages and fishermen -‐ a high risk strategy in such extended supply chains where loyalties to any one buyer may be fragile. Accordingly transaction costs can be high, and the networks of allegiances very changeable. All of this tends to mean that those buyers that consolidate supplies for shipment to traders in Honiara are ill-‐equipped to finance these operations – operations that invariably require considerable upfront expenditure – and so they are very reliant on the main Honiara traders to provide the working capital.
Fishing methods employed tend to be fairly unsophisticated, mainly reef gleaning, supplemented by free diving from canoes and boats. But the Solomon Islands supports some of the best wreck and reef diving in the Pacific, with, for example, a diving tourism hotspot in the Western Province. Despite it being illegal, there is every likelihood that some of the higher value species – such as white teat fish – are harvested by locals using scuba gear.
The sea cucumber resource base in the Solomon Islands is good – a good range of species and high quality unpolluted marine environment. But it has been heavily and regularly exploited across the years. Provincial government capacity to impact on improved fishery management is weak to non-‐existent. eNGOS have been very active in the Solomon Islands, seeking to strengthen traditional fishery tenure and management systems. Such work has, however, tended to be overly focused on a small number of communities / locations where inputs have been delivered for a decade or more. This has the advantage of continuity, but the weakness of limited development transfer – if the support model works, then it should be rolled out to other communities; if it does not work, then it should be scrapped. On balance then, development effort in shoring up traditional fishery management systems is not only weak, but also patchy at best.
Efforts to control sea cucumber exploitation have focused on technical measures (primarily minimum size legislation), with heavy reliance on community management systems to rein in excessive exploitation, and the buyer systems to respect minimum size legislation. Given real limits to opportunities for local generation of cash income – including a state of over-‐exploitation of other marine income staples such as trochus and Mother of Pearl – disproportionate pressure has been put on sea cucumber resources, further compromised by the substantial rises in the traded value of BdM. Stepped up monitoring of sea cucumber resource strength has shown that most stocks are in poor condition (based on snorkel / dive surveys of species densities) and over-‐exploited. This led the government to close this fishery in 2005 as a conservation / recovery measure. Unfortunately in 2007 a tsunami event affecting coastal populations in Western and Choiseul Provinces caused considerable hardship, and the temporary re-‐opening of sea cucumber fisheries for these Provinces was used as a means of addressing this situation. This encouraged traders and other coastal communities to take advantage of the situation, and considerable harvesting was undertaken, despite the moratorium on fishing still being in place. The country-‐wide moratorium was then re-‐established, but it is evident that harvesting and exporting has continued despite being illegal.
As with PNG, illegal exports have been possible alongside commodity shipments such as timber and palm oil, possibly also via international tuna fishing and reefer vessels operating in Solomon Islands waters, and across borders – for example through Bougainville. Illegal fishing, processing, buying and export is difficult to monitor and control at the best of times, but the very limited resources and priority given to these tasks makes it all but impossible. Economically hard-‐pressed communities continue to exploit sea cucumber resources even

Page | 15
though the resources are quite evidently already over-‐exploited, the practice is illegal, and such activity can greatly delay stock recovery. At least some BdM buyers and traders are also happy to facilitate this illegal trade – even though recent years has seen the very public exposure of illegal shipments (linked to possible political interference), and the issue has become politically incendiary. It can be concluded that the imposition of moratoria is not a sustainable management tool – even though it is effective in cutting back exploitation. Ways need to be found to control exploitation through improved customary / traditional management and the improved monitoring of the supply chain so that it does not become necessary to impose moratoria. Coastal communities need to be able to take some cash income from BdM production in each and every year, but they must not become over dependent on what is still a finite and easily over-‐exploited resource.
The situation with Ontong Java (also known as Lorde Howe atoll – not island) is slightly different from the rest of the Solomon Islands. Ontong Java, a Polynesian Outlier, is very large atoll complex (the atoll extends to some 57kms by 50kms) lying some 400kms to the north of the main island chain, and considered a part of Malaita Province. There is very little dry land, and opportunities for anything more than subsistence gardening are effectively zero, and the only items that can be traded for cash are time-‐stable marine products – trochus, bêche-‐de-‐mer and Mother of Pearl. Ontong Java has a long history of producing bêche-‐de-‐mer, with product stock-‐piled until sufficient is available to warrant a shipment to Honiara. Ontong Javanese are considered to be particularly proficient in processing BdM, and have traditionally managed exploitation of their sea cucumber stocks on a passably sustainable basis – recognising that heavy exploitation one year will lead to much reduced harvests in the following years.
In the early 2000s some Ontong Javanese fishermen developed a simple dredge or beam trawl for use in the harvesting of sea cucumber. This is very effective at harvesting certain types of sea cucumber, but it is also a particularly destructive form of fishing, damaging most elements of the sea bed and benthic systems. It was, nevertheless, quickly taken up by other atoll fishermen, and sea cucumber exploitation and BdM production escalated greatly, to the point where the resultant massive increase in income to the atoll functionally altered the otherwise very conservative economy of the atoll. Households took on substantial debt, on the basis that future BdM income would allow them to pay off that debt. The implementation of the moratorium in 2005 put a sudden halt to such activity, and created significant hardship. Not only did the atoll dwellers have to go back to subsistence agriculture (they had become dependent on imported food staples, such as rice), but many moved to Honiara to engage in wage earning there so that they could return funds to the atoll (the reverse of the situation applying on a few years before). These reverses in atoll fortunes could not be more stark – and illustrate all too clearly the situation repeated across the region where sea cucumber harvesting can now yield greater economic returns that most other forms of rural activity, including fishing.
Good points: sea cucumber harvesting plays a significant role in providing cash income in hundreds of coastal communities; traditional marine tenure systems remain largely intact throughout the country; there is a wide range of commercial sea cucumber species found throughout the islands
Poor points: traditional marine management systems are easily subverted by the lure of cash; the ability of Provincial and national administrations to police the BdM trade is minimal, compounded by distance and poor transport infrastructure; there is no effective regulation of the trade at Provincial levels, only in the capital, Honiara; there is recurrent illegal activity and export, allegedly with political connivance.
Page | 16
Fiji
Fiji comprises two large rock (high) islands, plus a large number of smaller islands – notably the Yasawas at the boundary of a shallow sea linking the two main islands on their western sides, and the Lau Group lying to the east and south east of the main islands. There is also a Polynesian Outlier north of the main islands called Rotuma.
Relative to the other countries under study Fiji has a well-‐developed and diversified economy. On the two main islands, roads infrastructure is well developed, though the quality of road surfaces is variable. Sea communication between the main islands and between them and the largest of the other islands is good, and links between the outer islands and the two main islands are fair and improving. The country has twelve conurbations with populations in excess of 5,000, with most located on the main island of Viti Levu. The main economic hubs are Suva (Central Division), the capital, and Lautoka (Western Division), centre of the country’s sugar industry. Nadi (Western Division) is where the international airport is located, and lies at the centre of the country’s network of tourism resorts. The country’s main trade port is at Suva, with a minor secondary port at Lautoka.
Fiji has been exporting BdM on and off for over two hundred years. Sea cucumber is harvested through reef gleaning in all parts of the country, augmented by product caught through free diving – particularly focused to the west of the main islands, and in the Lau Group. The use of UBA gear for harvesting sea cucumber is banned, but in recent years the government has issued a small number of licenses to operators allowing them to harvest using UBA gear. This sanctions the harvesting of sea cucumbers at depths inaccessible under normal free diving conditions, but the practice has also resulted in a number of diving-‐related deaths and numerous cases of bends-‐induced paralysis.
BdM exports are channelled almost exclusively through Suva – where the main export traders and processors are located. Well-‐developed road and ferry infrastructure covering much of the country allows for an established BdM trade structure based around a number of buyer / processor businesses strategically located in / near producing areas. These could export directly, but the main businesses tend out of preference to feed their product through to key exporters in Suva, and thus form part of long-‐standing, stable, buyer networks. On this basis, regional buyer / processor businesses are located at Suva, Nadi, Lautoka, Ba, Labasa, Ravie-‐Ravei, Vunisea, Levuka. In most cases such businesses are independent operators, but have fixed arrangements to supply particular Suva traders. Given the relatively well established transport systems, these trader networks tend to be very flat – producer to buyer to Suva trader, with no intermediaries. There are also a number of substantially smaller scale traders – mainly based in and around Suva.
Management of Fiji’s coastal waters is subject to traditional area-‐based marine tenure and village administration systems – goligoli (customary fishing rights area) and mateqali (Fijian kinship group) – and fishing is based around reef gleaning and free diving, and conducted on a family basis, or involving groups of friends (diving from boats). UBA diving arrangements can be a little more formal (based on the larger levels if investment in vessel and gear), and conducted on a more commercial basis. Fishing is also undertaken by Fijians of Indian origin who do not have customary reef tenure. They tend to operate on an exclusively commercial basis, and work with the owners’ permission in Fijian customary areas, or work outside these

Page | 17
areas. It is not clear to what extent they are involved in sea cucumber harvesting, tending rather to focus on fishing finfish for the market.
Processing of sea cucumber has been traditionally undertaken by fishing households. For those located close enough to buyers to be able to carry “first boil” / semi part-‐dried product to them, most fishermen elect to do so; indeed many also take live / green sea cucumber to such buyers, leaving it to the buyer to undertake all processing. Accordingly, most buyer networks engage to one degree or another in central processing, and their premises are equipped accordingly. Where this occurs, this affords the processor greater control over process and quality. Much product, particularly that in the outer islands, is processed to finished product (5 per cent water content) at the household level. Process control and quality is much more variable, and most processing is done over open wood fires. In this context it is notable that individual households tend to operate independently from each other, and are reluctant to pool resources to achieve economies of scale or improve process management. Where central processing is undertaken, a fair proportion of salt is used in BdM production, though not as much as is used in processing in Tonga.
It is all but inevitable that some degree of reprocessing is undertaken by the main export businesses. The larger companies invest considerable time and resources in managing quality control – in part spurred on by the results of research undertaken by Ravinesh Ram of USP (Ram 2008) who demonstrated that poor process management and quality control resulted in significant economic loss within the sector.
Management of the fishery is through technical measures (minimum sizes), but with day to day control vested in traditional village / goligoli management systems. Of the five countries under study, this is the only country that has not considered necessary to impose a moratorium to allow stock recovery. This is not indicative that the resource is less heavily exploited than in other countries. Indeed anecdotal evidence suggests that the quality of the fishery has steadily deteriorated over time with the species mix shifting to lower value species, and the average sizes of sea cucumber harvested in decline. UBA diving to harvest deeper water stocks is widely considered counter-‐productive in the long term as it removes important reservoirs of mature breeding adults – most particularly of white teatfish.
Licensing and data collection systems are well-‐established, backed up by a well-‐developed Provincial fisheries administrative infrastructure. There is also a well-‐developed network of communities, researchers and NGOs involved in coastal livelihoods and associated marine management brought together as the Fiji Locally-‐Managed Marine Area (FLMMA) Network http://lmmanetwork.dreamhosters.com/fiji
Good points: The customary resource management systems work well in exerting systems of control over fishing, though in virtually all cases sea cucumber stocks are over-‐exploited; there are strong buyer networks feeding into a small number of Suva-‐based exporters, allowing for a stable and streamlined supply chain, improved process and quality management, and the use of salt in processing – a potential downside is that the industry is dominated by a small number of large exporters, though overall there are many exporters.
Poor points: Official sanction of UBA is resulting in high and unacceptable incidences of diving-‐related accidents; at the same time this activity is exploiting breeding reservoirs of high value species that is likely to adversely impact future recruitment and stock strength; long-‐term over-‐exploitation of resources has resulted in long-‐term decline in the volume and

Page | 18
value of exports, compensated to a degree by the short-‐sighted sanctioning of deeper water resources through use of UBA gear.

!""#$%&%'%()*"+,-%+,./#%."/%/.+.%0-0+#10%
!"#$ %&''&()*+$ ,&-*./0$ /#1&/.2$ %&,-2$ &*$ ."#$ &/+3*)23.)&*3'$ 2./-,.-/#$ &%$ ."#$ )*4-2./05$ ."#$ 43.3$ ."3.$ )2$,&''#,.#4$ &*$ ."#$ )*4-2./05$ ."#$ 2,3'#$ 3*4$ 4)2./)6-.)&*$ &%$ 1/&4-,.)&*5$ 3*4$ ."#$ 73*3+#7#*.$ 202.#7$ )*$1'3,#8$$!&$+)9#$2&7#$2#*2#$&%$1/&1&/.)&*3').05$234%5$2"&(2$."#$.)7#$2#/)#2$&%$*3.)&*3'$#:1&/.2$&%$;4<8$
=&''#,.)&*$ &%$ #:1&/.$ 43.3$ 60$ ,&-*./)#2$ 3.$ ."#$ 21#,)#2$ '#9#'$ 4$ *&.$ %-''0$ ,&71/#"#*2)9#5$ 3*4$ 2&$ 3$1/&1&/.)&*$ &%$ #:1&/.2$ )2$ *#,#223/)'0$ *&7)*3.#4$ 32$ ."#$ +#*#/),$ ,3.#+&/0$ &%$ 6>,"#?4#?7#/$ @$ 32$ 2##*$ )*$2&7#$&%$."#$%)+-/#2$2"&(*$6#'&(8$$
6)"4.%
A$7&/3.&/)-7$(32$1-.$)*$1'3,#$)*$."#$!&*+3$2#3$,-,-76#/$%)2"#/0$/-**)*+$%/&7$BCCD$.&$EFFD8$$A$%)2"#/0$73*3+#7#*.$1'3*$(32$34&1.#4$)*$EFFD$3*4$."#$%)2"#/0$&1#*#4$%&/$3$&*#$7&*."$./)3'$1#/)&4$)*$EFFG8$$H*$2-62#I-#*.$0#3/2$ ."#$ %)2"#/0$(32$&1#*#4$%&/$D$7&*."2$ )*$EFFC5$J$7&*."2$ )*$EFBF5$K$7&*."2$ )*$EFBB5$3*4$L$7&*."2$)*$EFBE8$$!"#$%)2"#/0$"32$6##*$,'&2#4$&*,#$3+3)*$32$%/&7$."#$6#+)**)*+$&%$EFBJ8$
7"/*0+,-%0+,*8+*,#%
!&*+3$ )2$ 3$ /#'3.)9#'0$ 273''$ ,&-*./0$ ()."$ 3$ 1&1-'3.)&*$ )*$ ."#$ &/4#/$ &%$ BFF5FFF$ 1#&1'#8$ $ H.$ ')#2$ .&$ ."#$(#2.#/*$#4+#$&%$."#$4##1$&,#3*),$!&*+3$!/#*,"5$3*4$,&71/)2#2$."/##$73)*$ )2'3*4$+/&-12$@$."#$/3)2#4$,&/3'$1'3.%&/7$&%$."#$M393N-$+/&-1$)*$."#$*&/."5$."#$/#'3.)9#'0$%#/.)'#$%'3.$)2'3*42$&%$!&*+3.31-$3*4$O-3$.&$."#$2&-."5$3*4$."#$')*#$&%$273''$63//)#/$)2'3*42$'0)*+$3'&*+$."#$#32.#/*$%/)*+#2$&%$3*$#:.#*2)9#$2"3''$/##%$
234%5%'%9$:),+0%);%</=%>+%/,3#/%?#34@+A%5BCDE&D5&%
$
F)*,8#G$2##$A11#*4):$G$

platform located between these other two groups, the Ha’apai Group. Tonga also has small outlier islands to its north and south that significantly extend the area covered by its Exclusive Economic Zone.
Underlying differences in the physical geography of the three main groups is such that the mix of sea cucumber resources found around each island group is different and distinct. Responding to this, the 2007 Bêche-‐de-‐Mer Management Plan sought to control exploitation by a combination of limited export licenses, centralised processing, and species export quotas, allocated on a per Province basis. In principal, three central processing and three export trading licenses were to be issued per Province. Whilst this system was not precisely adhered to from the outset, it has nonetheless dictated the core structure of the industry. All harvested sea cucumber has to be sold to one of the few licensed processors in each group. These processors in turn sell finished product to licensed export traders. The intention was that both processors and export traders would be required to operate within the species quotas set for each Province, but this has never been realistically applied.
The introduction of central processing has been effective, and has been possible because of the relatively small distances involved in getting product to the processing stations. Raw material is acquired either by processors buying from fishermen at the point of landing, or fishermen carrying raw material to the processors.
Exports are made through both Nuku’alofa and Neiafu.
Data sources
What has been harvested, processed and exported is recorded through the submission of monthly raw material purchase records on the part of the processors, and detailed packing lists submitted by exporters on a per shipment basis. Such statistics returns are consolidated within a centrally held database.
All purchase and export records are detailed by species of sea cucumber. Most purchase records show who has supplied product on a daily basis, including how much they have been paid. Such per purchase records do not always indicate the species purchased. Some processors include details of which village or fishing area the catches have originated from. Only headline data are recorded in the Fishery Department’s database.
With respect to export data, Customs clearance requires completion of documentation that includes a packing list, inspection certificate from the Fisheries Department, shipping manifest, and inspection certificate from the Customs Department. BdM details are required to be given by species and by weight. Fisheries Department inspections sometimes include sample weighings, but this is not applied consistently.
Documentation is required to include a statement of the commercial value of the export, but this is rarely provided on a per species basis, and is not routinely recorded in the Fisheries Department database. Instead, a cost recovery levy is exacted against all shipments based on a standard, per species, notional value computed by the Fisheries Department. This value is not always equivalent to the actual value of the exported product.

The data that Tonga holds on the evolution of the sea cucumber fishery and BdM trade over the years 2008 to 2012 is extremely good. It documents the rise and fall of the fishery, with data discriminated by species, by province, and by company, plus there is more detail available in the individual monthly and shipment returns than has been collated in the national databases or analysed. These datasets provide an excellent platform for further study of the interface between fishery management, licensing, fiscal incentives and commercial activity.
BdM scale and geographic distribution
The few historical figures that exist for Tonga exports suggest volumes of between 30 and 60t dry weight during the mid-‐1990s. Each of the other countries under study had peak production in the late or early 1990s, and again in the late 1990s. Assuming similar trade behaviour for Tonga, and bearing in mind that over-‐exploitation in the 1980s and 1990s was such as to warrant imposition of a ten year moratorium on this fishery, it is speculated that historic peaks in the late 1980s and early 1990s might have been in the order of 80t, dry weight. After a ten year moratorium, BdM exports for 2009 and 2010 were about 340t in each year, falling off to 80t for 2011. Higher value, and larger sized, sea cucumbers dominated harvests and exports in the first two years. Much lower value species have dominated exports in 2011 and 2012.
Of the three main island groups, the lowest production volume originates from the northern group of Vava’u (population <16,000). Higher value reef species dominate in the species mix. Some very small volumes of sandfish were harvested in the early years, but quickly exhausted (and harvesting of sandfish has been subsequently banned). The largest volumes of product originate from Tongatapu (population 77,000) where the lower value species of lolly and snakefish dominate in the species mix. The Ha’apai group (population <6,000) draws harvests from the largest sea area – a very large coral platform covered by down to 20m of water. This typically yields significant quantities of relatively high value species. Periodic harvests are also made from the northern outlier islands.
Two physico-‐geographic characteristics dominate the patterns of exploitation.
• In the Ha’apai group the geography is such that the Fishery Department cannot deploy the sorts of resources needed to monitor and control exploitation in this area, and it is widely understood that UBA gear is used, illegally (all UBA gear is banned for sea cucumber harvesting), to exploit high value resources that are difficult to access through free diving or through the use of sea cucumber “bombs” (weighted hooks, dropped from the surface on the end of string / rope). It is thought that UBA fishing expeditions are most often financed, organised and operated from Tongatapu, and focus, amongst others, on the harvesting of white teatfish.
• By contrast, the island of Tongatapu has a large human population and extensive shallow waters to its front (northern coast), shallow enough to support significant reef gleaning activity targeting shellfish and sea cucumber. In addition, there are a number of fine sediment shallow lagoons, some of which support high densities of sea cucumber. As a result, Tongatapu is the source of very large volumes of low value sea cucumber, such as lolly and snakefish.
Management
Prior to the re-‐opening of this fishery in 2007 a well thought through bêche-‐de-‐mer Management Plan was drafted and put into practice. At the core of the management plan is the issuing of small numbers of separate central processing and exporting licenses, backed up by short fishing seasons, and minimum

harvest size controls. In addition, it was intended that export caps would be set for each island group, by species, but this has never been implemented.
Despite the management plan being constructed in such a way as to accommodate and respond to prevailing conditions, all the evidence suggests that resources have once again being harvested at unsustainable levels. Pressure from commercial operators to facilitate high levels of resource exploitation has been translated through political influence to management decisions that have increased the number of the licenses issued and extended the duration of harvesting seasons beyond those advised by fishery professionals. As a result, the resource has been quickly fished down -‐ a situation that has once again brought about the closure of the fishery. This situation was avoidable, and can reasonable be argued to have delivered short turn gain to a small number of people (primarily the license holders) against the loss of long-‐run modest but steady income to fishing households.
For Tonga, the establishment of central processing as a core structural framework for the industry works well. Some elements of this have also been adopted in Fiji, but as a general model it cannot be easily scaled up, or applied to coastal communities where household income is particularly low / marginal (since the value added derived from processing forms and important source of additional income to such households).
Why it works in Tonga is because of the relatively small numbers of households involved, the short distances involved, and the fact that most island households, whilst not rich, could be considered well-‐off relative to, for example, households in Melanesian countries. Tonga does generally fare well in terms of its HDI (Human Development Index), with high household income levels relative to neighbouring countries. Indeed it could be suggested that many households gain more from remittances from family members working in, for example, New Zealand, than they would make from harvesting sea cucumber.
But it was also the intention that there would be differentiation between the businesses that held processing licenses, and those holding export licenses. In practice these are now largely one and the same, though the retention of separate licensing and license conditions for these two activities continues to have merit.
Where things have gone awry relates to the particular hierarchical structure of society in Tonga, and thus where business is disproportionately subject to the influence of hereditary power. The intention to issue small numbers of BdM processing and exporting licenses was undermined at the outset. Licenses could only be issued to companies owned and operated by Tongan nationals, whilst the interest in processing and exporting BdM rested predominantly with Chinese businesses located outside the country, and with their (largely Chinese) representatives inside the country. This has particular relevance to Tonga given that the last ten years or more has seen a very significant increase in the number of mainland Chinese entering the country (and in time taking Tongan citizenship), with most corner shops and supermarkets now operated, if not also owned, by Chinese. To secure access to business licenses, such Chinese business interests almost inevitably have to seek the support of Tonga power-‐brokers – and this has been the case with the BdM industry.
But the mechanics of this are further complicated by the fact that the BdM fishery only operates for a few months a year. So unless its owners and operators have other sources of income outside the BdM season, this is not a sustainable business model. And this is made still more precarious by the length of

."#$;4<$2#32&*$*&.$6#)*+$1/#4),.36'#8$$V")'2.$."#$)*.#*.)&*$(32$.&$')7).$."#$2#32&*$.&$."/##$7&*."2$1#/$0#3/5$,&77#/,)3'$3*4$1&').),3'$ )*%'-#*,#$(32$36'#$ .&$3,")#9#$#:.#*2)&*$.&$D$7&*."2$ )*$EFFC5$3*4$."#*$3+3)*$.&$K$3*4$L$7&*."2$)*$EFBB$3*4$EFBE$/#21#,.)9#'0$?$4#21).#$6/&34$-*4#/2.3*4)*+$."3.$60$EFBB$."#$%)2"#/)#2$(#/#$3'/#340$&9#/?#:1'&).#48$
!"#$&-.,&7#$"32$6##*$."3.$7&/#$'),#*2#2$(#/#$)22-#4$)*$EFFG$."3*$."#$<3*3+#7#*.$U'3*$2.)1-'3.#45$32$=")*#2#$ )*.#/#2.2$ 9)#4$ ()."$ #3,"$ &."#/$ .&$ 3,,#22$ .")2$ -*#:1'&).#4$ /#2&-/,#5$ 3*4$ ,&-'4$ 1/&7)2#$ ")+"$/#(3/4$.&$!&*+3*$)*.#/7#4)3/)#2$("&$,&-'4$2#,-/#$."#$*#,#223/0$'),#*2#28$$<&2.$&%$."#$1/&%).$(32$.3X#*$&-.$&%$.")2$%)2"#/0$)*$EFFG$3*4$EFFC8$$A.$."#$#*4$&%$EFFC$."#$+&9#/*7#*.$2-62.3*.)3''0$)*,/#32#4$."#$,&2.$&%$ 3*$ #:1&/.$ '),#*2#5$ 6-.$ 60$ .")2$ .)7#$ 7&2.$ &%$ ."#$ 1/&%).$ "34$ 6##*$ .3X#*$ &-.$ &%$ ."#$ %)2"#/05$ %#(#/$&9#/2#32$=")*#2#$6-2)*#22#2$(#/#$)*.#/#2.#4$)*$3,,#22)*+$."#$/#2&-/,#5$3*4$."&2#$6-2)*#22#2$2##X)*+$.&$.3X#$ -1$ '),#*2#2$ ,&-'4$ *&$ '&*+#/$ 3%%&/4$ .&$73X#$ ")+"$ 1307#*.2$ .&$ )*.#/7#4)3/)#2$ @$ )*$ %3,.$ I-).#$ ."#$/#9#/2#5$."#0$"34$.&$(&/X$9#/0$"3/4$.&$#:./3,.$."#$632#$,&2.$."#$ '),#*2#$%/&7$."#$%)2"#/05$#*,&-/3+)*+$."#7$.&$1-.$0#.$7&/#$1/#22-/#$&*$."#$+&9#/*7#*.$.&$#:.#*4$."#$%)2")*+$2#32&*5$3*4$3'2&$1/&9)4)*+$."#,&*4).)&*2$("#/#$93/)&-2$13/.)#2$7)+".$6#$#*,&-/3+#4$.&$)*,/#32#$)''#+3'$%)2")*+$3,.)9).08$$$$$$
234%&%'%6)"4.%#$:),+0%);%</=%>+%/,3#/%?#34@+AK%J-%0:#83#0K%&DDLE&D55%
$
Y&-/,#g$!&*+3$[)2"#/)#2$\#13/.7#*.$!"#"$%&%$_2#3$,-,-76#/a$43.3632#$

PNG The PNG fishery has been closed since 2009 in a response to declining catches and poor recovery of stocks.
Industry structure The trade in PNG is organised around a small number (<20) (relative to the size of the country) of licensed traders. Each operates networks of agents – in villages, towns, etc. – who either buy on behalf of these agents, or otherwise secure supplies from fishermen, households and villages. The traders either advance money to their agents so that they may buy product, or they periodically send out a collecting boat, with funds (and sometimes armed guards), to visit local representatives to negotiate the purchase of product from communities (and agents). With improved sea and road transport, many fishermen and fishermen groups increasingly prefer to bring their product direct to the Provincial centres for sale.
A large proportion of product is exported from Port Moresby through those main national traders that are based in Port Moresby. These also support networks of agents across the country, as well as buying product from other traders in the Provincial main towns. Other exports are made through Provincial ports – e.g. Alotau, Lae, Madang, Daru and Buka – particularly given the increase in container vessel movements through these ports, and direct links to routes south to Australia, and north to Hong Kong and Japan.
Data sources
The National Fisheries Authority and the Provincial Fisheries Departments monitor the trade through the collation of monthly purchasing returns from each trader, and details of each export shipment. Each trader wishing to ship product between Provinces is also required to submit a record of what is being shipped. In addition, periodic household and fishing surveys are undertaken.
As a result, PNG has a very good long-‐run data series on exports by species, quantity and fob price. This information is available on a Province by Province basis, but a large proportion of entries to the database are of exports allocated as originating in Port Moresby, which supports no fishing. The inter-‐Provincial transfers dataset should provide a means of correcting for this misallocation, but this is not routinely used to do this. The purchases dataset provides a useful cross check on overall export and Provincial allocations, but it is not always clear how different product forms have been captured in the data set (wet product, first boil / 50% water content, finished product / <5% water content).
All this said, the PNG dataset provides the best available data of all the countries under study.
BdM scale and geographic distribution
Relative to the other countries in this study PNG is huge, and its BdM production is also huge. PNG export volume and value peaked in the early 1990s at 620t dried weight, again in 1997 at 680t, and again in 2007 at 790t. In each case peak production was followed immediately by a sharp fall in production. The value of a typical year of exports is estimated, at current buy-‐in prices (discounted to
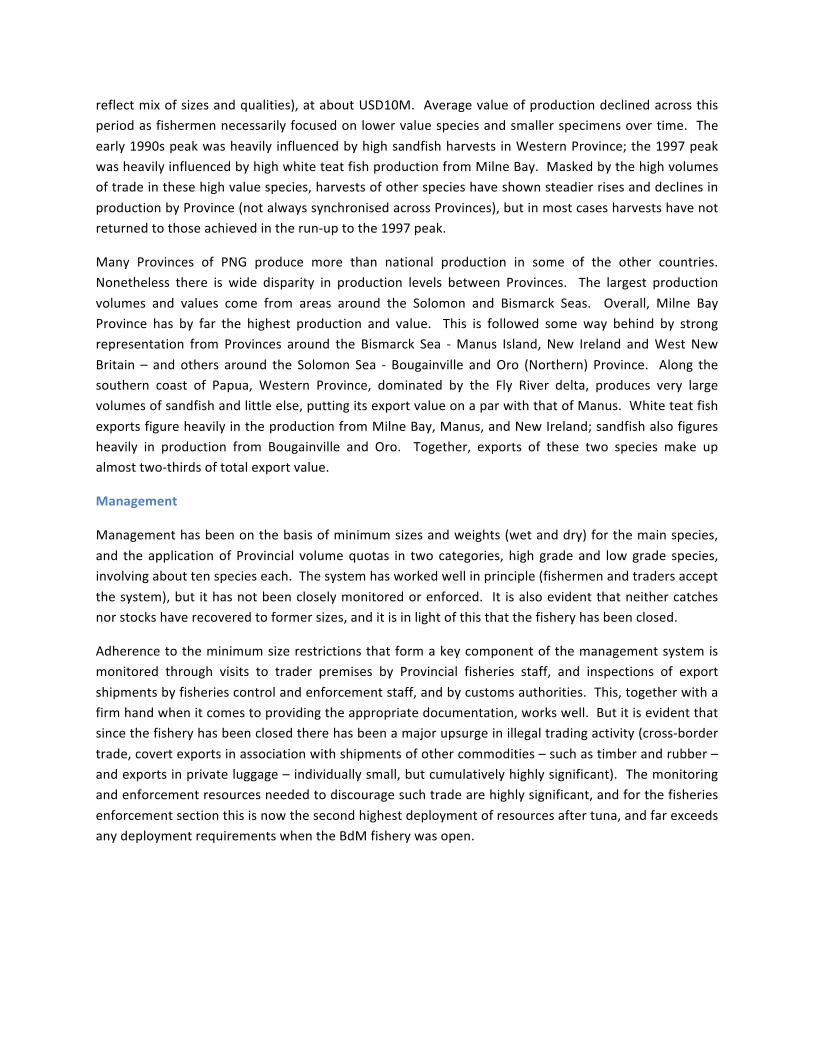
reflect mix of sizes and qualities), at about USD10M. Average value of production declined across this period as fishermen necessarily focused on lower value species and smaller specimens over time. The early 1990s peak was heavily influenced by high sandfish harvests in Western Province; the 1997 peak was heavily influenced by high white teat fish production from Milne Bay. Masked by the high volumes of trade in these high value species, harvests of other species have shown steadier rises and declines in production by Province (not always synchronised across Provinces), but in most cases harvests have not returned to those achieved in the run-‐up to the 1997 peak.
Many Provinces of PNG produce more than national production in some of the other countries. Nonetheless there is wide disparity in production levels between Provinces. The largest production volumes and values come from areas around the Solomon and Bismarck Seas. Overall, Milne Bay Province has by far the highest production and value. This is followed some way behind by strong representation from Provinces around the Bismarck Sea -‐ Manus Island, New Ireland and West New Britain – and others around the Solomon Sea -‐ Bougainville and Oro (Northern) Province. Along the southern coast of Papua, Western Province, dominated by the Fly River delta, produces very large volumes of sandfish and little else, putting its export value on a par with that of Manus. White teat fish exports figure heavily in the production from Milne Bay, Manus, and New Ireland; sandfish also figures heavily in production from Bougainville and Oro. Together, exports of these two species make up almost two-‐thirds of total export value.
Management
Management has been on the basis of minimum sizes and weights (wet and dry) for the main species, and the application of Provincial volume quotas in two categories, high grade and low grade species, involving about ten species each. The system has worked well in principle (fishermen and traders accept the system), but it has not been closely monitored or enforced. It is also evident that neither catches nor stocks have recovered to former sizes, and it is in light of this that the fishery has been closed.
Adherence to the minimum size restrictions that form a key component of the management system is monitored through visits to trader premises by Provincial fisheries staff, and inspections of export shipments by fisheries control and enforcement staff, and by customs authorities. This, together with a firm hand when it comes to providing the appropriate documentation, works well. But it is evident that since the fishery has been closed there has been a major upsurge in illegal trading activity (cross-‐border trade, covert exports in association with shipments of other commodities – such as timber and rubber – and exports in private luggage – individually small, but cumulatively highly significant). The monitoring and enforcement resources needed to discourage such trade are highly significant, and for the fisheries enforcement section this is now the second highest deployment of resources after tuna, and far exceeds any deployment requirements when the BdM fishery was open.

234%P%'%MNO%#$:),+0%);%</=K%+%/,3#/%?#34@+K%J-%0:#83#0K%5BBD%+)%&DDB%
$
F)*,8#G$UWQ$W3.)&*3'$[)2"#/)#2$A-."&/).0$;4<$43.3632#$

Vanuatu The Vanuatu fishery has been closed since 2008 following increasing evidence of over-‐exploitation. This moratorium has been recently further extended to 2018.
Industry structure
The physical geography of Vanuatu is such that most of its main islands have steeply shelving coastlines, with reef systems close in to the land. Accordingly the area of shallow water habitat potentially available to sea cucumber populations is limited, and the sea cucumber fishery is correspondingly small in volume.
The economy is dominated by subsistence agriculture, accompanied on some islands by large plantation agriculture. There are few economic centres, and road infrastructure is poorly developed. The two points of export in the country are Port Vila and Luganville – which form the bases for a small number of exporters. Traders support their networks of agents, primarily at village level. Rather than advance funds to these agents for the purchase of product, it is more common for agents to simply secure access to commercially interesting quantities of product and then to call in the trader who then flies or ships to the island to negotiate the purchase and take the product back to Luganville or Port Vila. Accordingly supply chains tend to be very short. And given that such purchases may only amount to 50 or 100kgs of product, whereas in most other countries the trade benefits from at least some economies of scale, in Vanuatu exporters are keen to take on more of the added value processes.
Data sources
There are only a small number of licensed exporters – a maximum of four or five in Port Vila and two or three in Luganville. A condition of license is that the traders submit records of all purchases, and comply with normal documentation requirements associated with export shipments. These are submitted to the Fisheries offices in either Port Vila or Luganville, according to which location is the port of export. Accordingly the Fisheries Department holds datasets covering purchases and exports. These records are supposed to itemise purchases and exports by species, weight and source, but the datasets are incomplete and inconsistent, and it is not clear the extent to which the data from the Fisheries Office in Luganville is incorporated into the dataset held in Port Vila.
Export documentation requires that exporters provide a packing list (usually bags of BdM by species), and a manifest (total quantity of each species, together with total commercial value – ideally disaggregated by species). It must also be accompanied by a certificate of inspection by the Fisheries Department. In Port Vila it is this latter document that provides the information that is entered into the Fisheries Department export dataset. Customs in Port Vila does not exchange any of the data it extracts from the other documentation with the Fisheries Department, and it is not clear what level of export data from Customs is shared with Central Statistics.
All in all there is great inconsistency between the various datasets and the export figures quoted in different documents. Headline export figures are certainly indicative, but the confidence that can be placed in them is questionable. There are indications of species make-‐up from some data held on both

Port Vila and Luganville datasets, but these are limited and may not be representative of overall supplies. No data are held on what island or Province supplies originate from, even though at least some traders nominate which villages, or islands, or individual fishermen that product has been purchased from (even if this does not nominate the particular species mix purchased).
All in all, the data availability with respect to the Vanuatu sea cucumber and BdM industry is very confused.
BdM scale and geographic distribution
Vanuatu BdM exports have varied from between some 5t and a peak of 66t dried weight per year. There is evidence of peak production across the early 1990s.
Most product derives from the Maskaleynes, the east coasts of Malekula and Santo and from the island of Efate and nearby smaller islands. The smaller islands to the north and south of the country produce good quality high value BdM, but in small quantities.
Cues on species distribution derived from talking to traders suggest reasonable proportions of white teat, black teat, surf red fish and giant or reef lolly (assumed to refer to larger lolly fish found in deeper and more exposed areas), particularly on the more exposed eastern coasts. On the more protected reefs and reef flats more common along the westerly coasts, greenfish, lolly and brown sandfish, with tiger fish found in the higher water exchange areas associated with lagoon entrances.
Management
A draft management plan has been produced, and incorporates minimum sizes, limited fishing seasons, and licensing of exporters. In addition it seeks to limit exploitation on the basis of stock assessment based catch quotas, and emphasis is also placed on encouraging traditional community based management of fisheries linked to the use of closed areas, and the opening and closing of other areas as resource assessments dictate.
An on-‐going programme of small-‐area stock surveys linked to detailed habitat mapping has indicated that at the end of 2012 most stocks have not recovered to a level commensurate with a return to exploitation. As a result, the decision has been made to extend the moratorium a further five years through to 2018. During this time work will continue with the programme of small-‐area stock surveys and the estimation of catch quotas per area per species.
Whilst it is widely recognised that this approach requires the input of considerable government and scientist expertise, given the relatively small size of the Vanuatu sea cucumber resource-‐base this is considered workable. Further development of this management system will be piloted. Nonetheless, it is not considered that this sort of approach is scalable to the size of fisheries in place in such locations as PNG and Solomon Islands -‐ though it might offer some guidance for the setting of catch limits in Fiji and Tonga.

Solomon Islands The Solomon Islands fishery has been closed since 2006, though it has been opened periodically since then to counter rural hardship – originally following a tsunami event associated with an 8.1 magnitude earthquake near Gizo, capital of the Western Province, in 2007, but subsequently in response to political representations from outlying Provinces.
Industry structure
Honiara lies at the centre of the BdM export industry but, as with Port Moresby in PNG, it does not lie in a sea cucumber harvesting area (little sea cucumber is harvested in the Province of Guadalcanal), and so fishing and processing take place in the other Provinces. Since Honiara is the only port of export it is the Honiara BdM traders that sit at the centre of the industry. Each operates a network of buyers and agents. These buyers are usually located in the main economic centres in the Provinces, and it is they that have established and maintain their networks of agents within each Province. The buyers typically rely on the Honiara traders to finance their operations, and in turn they can offer inducements to their agents to identify and secure sources of product – paying cash up front, or advancing goods (food, materials, etc.), that can be handed on to villages and fishermen households.
The Solomon Islands is also a large country, though not on the scale of PNG. Its islands are, however, spread out, its economy predominantly rural and subsistence, interspersed with plantation cultivation. There are also relatively few significant economic centres outside Honiara. Roads infrastructure on most islands is poor to non-‐existent and marine transport predominates. Accordingly the work of buyers and agents is not always straightforward, and so the agents’ networks can be complex and multi-‐layered. This also means that there are many agents that operate on their own account – consolidating product for onward sale to Provincial buyers, either as freelance buyers, or as trade store owners.
Almost all catches are processed to first boiling and drying to 50% water content at village level by fishermen and their associated households. For the more isolated communities, processing is taken to full drying, but for the rest it is the Provincial buyers and their intermediaries that take the product to its final dried form. There is a presumption that product arriving in Honiara is fully processed, but it is still quality checked, and some re-‐processing / drying is inevitable.
Data sources
Exports of BdM can only be shipped by licenses businesses. A condition of such licensing is that exporters submit their exports for inspection by officers of the Fisheries Department, and provide a packing list showing the species and quantity of exports. Exporters are expected to submit details of which Provinces they source their product from, but this is not assiduously followed up. The Fisheries Department does collate such information, but it offers a far from complete picture of supplies, and there is no discrimination in the data by species.
As a result there is a reasonable ten-‐year dataset covering exports by species and volume, and a somewhat less complete data set of production per Province. This means that allocation of catches by

species by Provinces comes with a caution on accuracy – though indications on this have been secured from interviews with traders.
It should also be noted that there has been substantial disruption to the BdM trade across the 2000s following the civil disturbances that affected the capital in the early 2000s, and the slow re-‐building of the economy in subsequent years, plus the impacts of the tsunami event that affected Western and other Provinces in 2007 and subsequent years. This has not only affected the normal catching, buying and exporting of sea cucumber and BdM, but has also impacted on the institutions of government, including the capacities of the national and Provincial Fisheries Departments.
BdM scale and geographic distribution
National production peaked in the early 1990s at about 700t dry weight. It achieved a mini-‐peak in 1998 (380t) and again in 2003 (410t), with sharp slumps in between. The value of a typical year of exports is estimated, at current buy-‐in prices, at about US$5M. Average value of BdM declined across this period as fishermen were forced to focus effort on lower value species as the availability of higher value species declined. The fishery was closed following the 2004 peak when there was wide concern that resources were over-‐exploited, and stocks were not recovered or recovering.
It was selectively opened for periods in subsequent years, allowing communities to “cherry pick” available resources – as in the relatively indiscriminate harvesting of higher value species – which will have provided useful income to these communities, but further delayed recovery of these resources.
A number of Provinces compete for top spot in the production tables -‐ Malaita (mainly Ontong Java1 but also northern Malaita), Choiseul, Western, and Isobel, followed some way behind by Temotu and Central, then Makira. It is conjectured that the shifting in top spot between years is indicative that species stocks are being serially exhausted at different times in different Provinces. Unfortunately, in the absence of more precise Provincial production data it is not possible to better track these changes.
The main species exploited at a national level are, in volume terms, white teat fish (high value), lolly fish (low value) and brown sandfish (low value). The main white teat producers are Western, Ontong Java (part of Malaita Province) and Choiseul. Ontong Java is also the only producer of chalkfish, which forms an increasingly large proportion of its catches.
Management
Management is by minimum size and weight, wet and dry, by species. Government fishery monitoring and enforcement resources are very limited, and minimal at Provincial level. Accordingly the industry is subject to very limited management at Provincial level, and almost all interaction is focused on Honiara, where exports take place. Fishery personnel are responsible for inspecting BdM at exporters’ premises prior to shipment. Specific shipments are also subject to inspection by Customs – who are also responsible for ensuring compliance with all documentary requirements – a minimum of packing list, manifest, and a certificate of compliance from the Fishery Department. 1 Ontong Java is a large atoll outlier some 250km north of the island chain that forms the core of the country
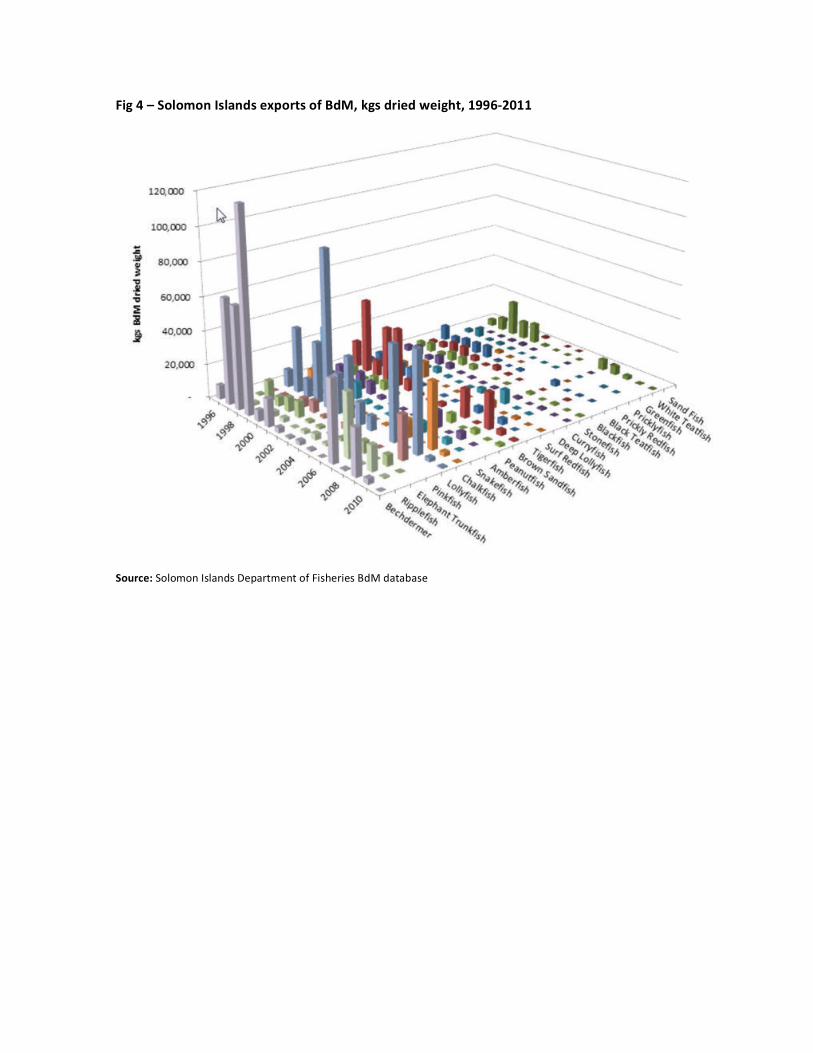
234%R%'%F)I)1)"%70I."/0%#$:),+0%);%</=K%S40%/,3#/%?#34@+K%5BBTE&D55%%
$
F)*,8#G$Y&'&7&*$H2'3*42$\#13/.7#*.$&%$[)2"#/)#2$;4<$43.3632#$

Fiji No moratorium has been applied to the Fiji sea cucumber fishery, which has remained open continuously since the early 1980s. Harvesting and export of sandfish is banned.
Industry structure
Fiji comprises two main islands, both of which encompass mountains and river systems that move sediment down to coastal plains and estuaries. To the north west of these two main islands is an extensive area of relatively shallow water and reef systems bounded by in part by the Yasawa chain of islands. To the east and south east of the two main islands lies the Lau Group, a spread of several hundred coral islands, each surrounded by a relatively narrow lagoon and barrier reef.
Viti Levu the larger and southernmost of the two main islands is the most economically developed, several substantial urban complexes, and with a good peripheral road system. Vanua Levu, the northern main island, is less developed, with fewer towns and poorer road system. Infrastructure on all but the biggest of the other islands is poor.
The country is divided into four administrative Divisions – Central (population 340,000), Western (320,000), Northern (136,000), and Eastern (39,000).
Sea cucumber harvesting takes place throughout Fiji, derived from extensive reef gleaning, and free diving fisheries. In recent years some operators have been licensed to harvest using UBA gear. The main exporters are located in Suva, Central District, with a few others in Nadi, Western District. Given the significant size of the country, and the significant distances between production areas, product tends to be consolidated at exporter premises through a two stage process, first being collected at a regional centre, and then passed on to the main exporters. The regional collectors tend to be independent companies, but ones with long-‐term linkage to specific export companies in Suva and/or Nadi. The regional collectors source product through networks of buyers and established linkage to fishing groups and villages. On this basis, regional collectors are located at Lautoka, Labasa, Ba, Rave Rave, Vunisea and Levuka, and the exporters in Nadi and Suva also operate as regional collectors in their own rights. Harvesting from the Lau Group islands is usually held on the islands until sufficient quantity is collected to warrant transfer by ferry to Suva or to one of the other regional centres. Occasionally buyers travel to the islands to collect product, but as shipping services have improved, this practice is less common.
For harvesters operating within up to an hour’s bus or taxi distance to a regional collector, product is often brought direct to the buyer (often combining sea cucumber sales with a visit to the market or shops). Under these circumstances product is either brought to the regional centres as part-‐processed (first boil), or as “green” (raw) product. Where harvesters are located further afield, sea cucumber processing is more often completed within the fishing community. This is particularly so for harvesters in the Lau Group. Necessarily, most regional buyers and the main exporters also operate as central processors – processing raw sea cucumber, completing the processing of part-‐processed product, and re-‐processing / finishing dried BdM to improve presentation and quality.

Exports are made through the main commercial port of Suva, and the secondary commercial port of Lautoka.
Data sources
Exporters are required to hold valid business and export licenses. Exporters are required to submit monthly details of purchases, and to complete normal Customs clearance requirements for export shipments, including provision of packing lists and a certificate of inspection from the Fisheries Department. These data are collated by the Fisheries Department in their central export database.
Data submissions are listed by species, by product weight, and by value. They are not typically listed by Division or point of harvest. Data is recorded by company, by shipment, and by export destination.
Historical datasets are good, and by species data is available for at least 15 years.
BdM scale and geographic distribution
Fiji production peaked in 1988 at 720t dried weight, and again in 1997 at 880t. Subsequent peaks were at much lower levels -‐ 2005 at 380t, and 2011 at 400t. Average product export across the last fifteen years has been 274t, with white teat fish, lolly, snakefish and tigerfish figuring prominently.
Figures currently available do not provide a clear guide on the geographic distribution of production, but it is generally taken that most product derives from fisheries to the west and between the two main islands. The products of reef gleaning derive from fisheries right around the two main islands, and product from the outer islands is focused disproportionately on harvests from free diving, and more recently supplemented by harvests from UBA diving.
Licensed use of UBA gear in recent years to harvest sea cucumbers in areas less accessible to free diving is thought to have boosted harvests of the higher value species, such as white teatfish, but it is also widely believed that all sea cucumber resources are over-‐exploited, and this particularly so for higher value species.
Management
The main elements of the management regime focus on licensed exporters, minimum harvest and export sizes by species, and restricted harvest seasons.
Traditional management systems exist throughout the islands, and are deployed with differing degrees of success. These focus on area management, and the opening and closing of areas to fishing as deemed most appropriate. Despite these systems, exploitation levels for a wide range of species and resources appear to exceed the capacity of the stocks to recover, and catch rates have decreased over time.
Considerable government and NGO support has been given to encourage and strengthen the role of traditional management systems in community based management of coastal resources, and this has resulted in the collation of a considerable array of locally specific information on sea cucumber harvests,

/#2&-/,#$4#*2).)#25$3*4$,3.,"$1#/$-*).$#%%&/.8$ $A..#71.2$"39#$6##*$734#$.&$ )*,&/1&/3.#$ .")2$ )*.&$ '&,3'$4#,)2)&*?73X)*+5$ 6-.$ )713,.2$ "39#$ 6##*$ 93/)36'#8$ $ O%%&/.2$ ,&*.)*-#$ .&$ 6#$ 734#$ .&$ 2.3*43/4)2#$ 3*4$4##1#*$43.3$,&''#,.)&*$3*4$3*3'02)28$
A$/#9)2#4$<3*3+#7#*.$U'3*$)2$)*$4#9#'&17#*.$3*4$)2$,-//#*.'0$-*4#/$/#9)#(8$
234%V%'%23U3%#$:),+0%);%</=K%+)""#0%/,3#/%?#34@+K%&DDL%+)%&D5&%
$
F)*,8#G$[)e)$[)2"#/0$\#13/.7#*.$./34#$43.3632#$_EFBE$43.3$)2$%&/$."/##$I-3/.#/2$."#$0#3/$&*'0a$
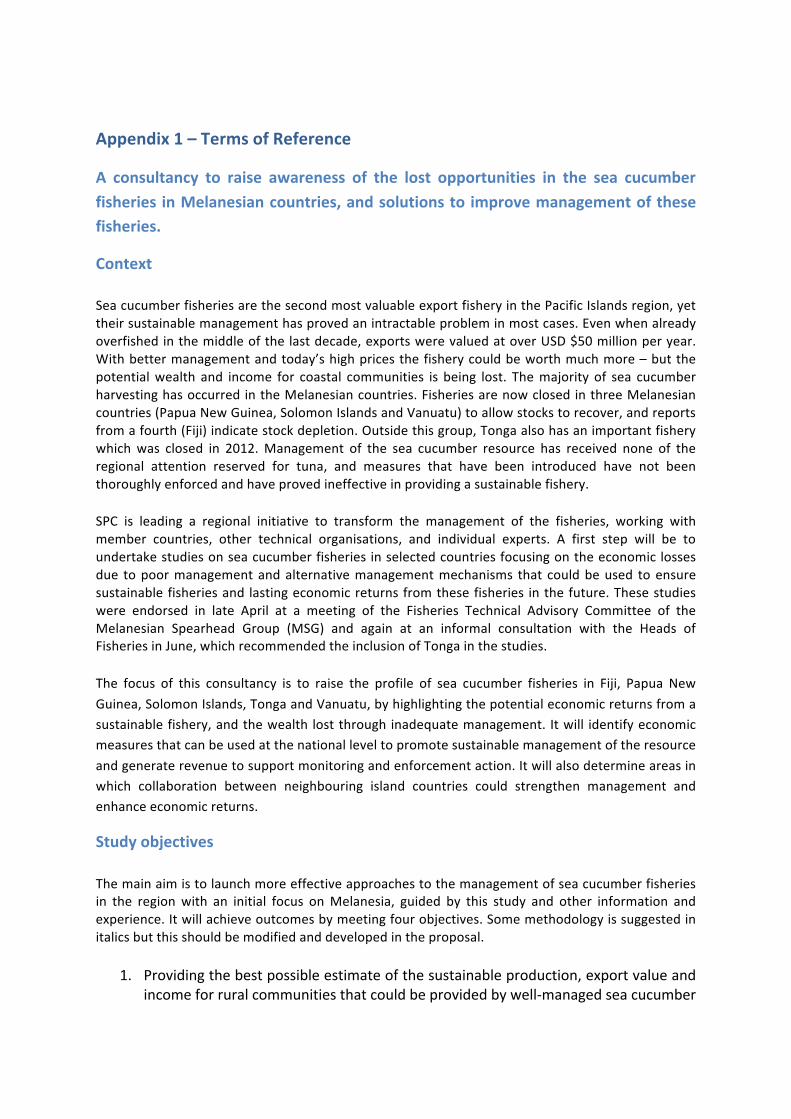
Appendix 1 – Terms of Reference
A consultancy to raise awareness of the lost opportunities in the sea cucumber fisheries in Melanesian countries, and solutions to improve management of these fisheries.
Context
Sea cucumber fisheries are the second most valuable export fishery in the Pacific Islands region, yet their sustainable management has proved an intractable problem in most cases. Even when already overfished in the middle of the last decade, exports were valued at over USD $50 million per year. With better management and today’s high prices the fishery could be worth much more – but the potential wealth and income for coastal communities is being lost. The majority of sea cucumber harvesting has occurred in the Melanesian countries. Fisheries are now closed in three Melanesian countries (Papua New Guinea, Solomon Islands and Vanuatu) to allow stocks to recover, and reports from a fourth (Fiji) indicate stock depletion. Outside this group, Tonga also has an important fishery which was closed in 2012. Management of the sea cucumber resource has received none of the regional attention reserved for tuna, and measures that have been introduced have not been thoroughly enforced and have proved ineffective in providing a sustainable fishery.
SPC is leading a regional initiative to transform the management of the fisheries, working with member countries, other technical organisations, and individual experts. A first step will be to undertake studies on sea cucumber fisheries in selected countries focusing on the economic losses due to poor management and alternative management mechanisms that could be used to ensure sustainable fisheries and lasting economic returns from these fisheries in the future. These studies were endorsed in late April at a meeting of the Fisheries Technical Advisory Committee of the Melanesian Spearhead Group (MSG) and again at an informal consultation with the Heads of Fisheries in June, which recommended the inclusion of Tonga in the studies.
The focus of this consultancy is to raise the profile of sea cucumber fisheries in Fiji, Papua New Guinea, Solomon Islands, Tonga and Vanuatu, by highlighting the potential economic returns from a sustainable fishery, and the wealth lost through inadequate management. It will identify economic measures that can be used at the national level to promote sustainable management of the resource and generate revenue to support monitoring and enforcement action. It will also determine areas in which collaboration between neighbouring island countries could strengthen management and enhance economic returns.
Study objectives
The main aim is to launch more effective approaches to the management of sea cucumber fisheries in the region with an initial focus on Melanesia, guided by this study and other information and experience. It will achieve outcomes by meeting four objectives. Some methodology is suggested in italics but this should be modified and developed in the proposal.
1. Providing the best possible estimate of the sustainable production, export value and income for rural communities that could be provided by well-‐managed sea cucumber

fisheries in each of the 5 countries, thus demonstrating the wealth that is being lost through current management problems.
2. Providing a number of options for the use of fiscal and economic measures to promote improved management of the resource, their potential costs and benefits, and the capacity to raise revenue for enforcement of management measures;
3. Providing an examination of the extent to which management measures may be enhanced by regional cooperation and proposing mechanisms to allow this to be effective.
4. Outline the key elements of a management framework for the sea cucumber fishery, combining fiscal, regulatory and enforcement measures.
Expected Outputs
A detailed technical report of around 50 pages on the analyses and findings covering the four objectives listed above, including a section on each of the 5 countries; and
A 4-‐page draft policy brief in clear non-‐technical language for decision makers.

Appendix 2 – Field work schedule (Sep-‐Nov 2012)

Appendix 3 – People interviewed
Fiji
Government • Suresh Chand, Pricipal Fisheries Officer, Fisheries Dept., Suva • Harry Bola, Head of Licensing, Fisheries Dept., Suva • Shalendra Singh, Fishery Statistician
Industry • Mawi Jimi, Foreman, BdM processor / exporter, Flysha, Suva • Malato Watisoko, Foreman, BdM processor / exporter, Star Dragon, Suva • Joni, fisherman, Lau Group • village leaders, Ucunivanua village, Tailevu • village leaders, Naisausau village, Tailevu • village leaders, village near Lami
NGOs /academics • Ravinesh Ram, Assistant Lecturer, School of Marine Sciences, USP, Suva • Joeli Veitayaki, Associate Professor, School of Marine Studies, USP, Suva • Pio Radikedike, Community Facilitator, School of Marine Studies, USP, Suva • Apisai Bogiva, Community Facilitator, School of Marine Studies, USP, Suva • Bob Gillett, GPA Consultants, Suva
Regional institutions • Jens Kruger, Team Leader, Oceanography, SOPAC
Papua New Guinea
Government • Jeff Kinch, Principal, National Fisheries College, Kavieng • Laban Gisawa, Fisheries Management, NFA, Port Moresby • Ludwig Kumoru, Fisheries Management, NFA, Port Moresby • Luanah Yaman, Fisheries Management, NFA, Port Moresby • Vakuru Bola, Statistician -‐ Licensing & Information Unit, NFA, Port Moresby • Rosemary Simon, Data Management Officer, NFA, Port Moresby • Sai Ugufa, BdM Survey Assistant, NFA, Port Moresby • Matilda Kepang-‐Pahina, BdM Survey Assistant, NFA, Port Moresby • Philip Polon, Fisheries Manager, NFA, Port Moresby • Noan Pakop, Monitoring, Control & Surveillance, NFA, Port Moresby • Nathan Bellepuna, Provincial Fishery Advisor, Alotau • Jane Bagita, Provincial Fishery Officer, Alotau • Johnny Saragine, Provincial Fishery Officer, Alotau • Leka Pitoi, Provincial Support Coordinator, NFA, Port Moresby • Boltan Towok, Provincial Liaison, NFA, Port Moresby
Industry • Eugine Shultz, BdM processor / exporter, Kavieng
• Mabisa Landu, Wamomo, BdM processor / exporter, Port Moresby • Niel Stanton, Managing Director, Nako Marine, BdM processor / exporter, Alotau • Ruben Nigu, Manager, Nako Marine, BdM processor / exporter, Alotau • Raymond Choong, Manager, AsiaPac, BdM processor / exporter, Alotau • Paul Moabi, fisherman, Brooker Islands, Milne Bay Province • Valentine, fisherman, Trobriand Islands • John Chung, owner / manager, United Fisheries, BdM processor / exporter, Port
Moresby • Palina, foreman, United Fisheries, BdM processor / exporter, Port Moresby
NGOs /academics • Johan Aini, Head, Island Awareness, Kavieng • Paul Lokani, Fisheries Consultant, PNG • Tim McIntosh, Logistics Manager, SIL (Summer Institute of Linguistics) International,
Alotau
Vanuatu
Government • Jason Raubani, Manager, Management & Policy Division, Fisheries Dept., Port Vila • Richard Donald, Fishery Statistician, Fisheries Dept., Port Vila
• Christopher Kalna Arthur, Reef Check Coordinator, Fisheries Dept., Port Vila • Pascal Dumas, Research Manager, IRD, Fisheries Dept., Port Vila • Marc Leopold, Fisheries Scientist, Biocomplexity of coral reef ecosystems, IRD, Fisheries
Dept., Port Vila • Sompert Gereva, Principal Fisheries Biologist, Fisheries Dept., Port Vila • Graham Nimoho, Principal Extension Officer, Fisheries Dept., Port Vila • Nelson Obed, Head of Fisheries, Santo • Jimmy Rantes, PermSec, Trade & Industry, Port Vila • Harold Moli, Lands & Surveys, Port Vila • Ben Tokal, Statistician, Economic Section, Office of National Statistics, Port Vila
Industry • Charly Valentine, BdM processor / exporter, Efate • Arnold Chan, Manager, Hong Shell, Port Vila • James Yi, BdM processor / exporter, Santo • chief at Port Olry village Santo • Chinese trader Santo • Sam Grant, Unicorn Pacific Corp., Port Vila • Peter, fisherman, Unicorn Pacific Corp, Efate • Jack, foreman, Unicorn Pacific Corp., Port Vila
NGOs /academics • Francis Hickey, consultant / advisor, Vanua-‐Tai
Regional institutions • Peni Sikivou, Director, Economic & Social Development Division (ESDD), Melanesian
Spearhead Group Secretariat, Port Vila

Solomon Islands
Government • Titus Pidiri, Licensing Officer, Fisheries Dept., Honiara • Chris Romofafia, PermSec Fisheries, Honiara • Robert ****, Statistician, Fisheries Dept., Honiara • William Abuinao, Compliance Officer, Fisheries Dept., Honiara • Steve Lindsay, Coastal Fisheries specialist, SIMROS NZAid project
Industry • Antonio Lee, Manager, Solfish, marine trading company (part of Lee Kwok Kuen
Enterprises), Honiara • Wei Chung Zen, BdM exporter, NanHigh, Honiara • Jerry Sun, BdM exporter, Oceanic International, Honiara • fisher households, Ontong Java community, Honiara • Joseph Rozema, BdM processor / exporter, FV High Process, Honiara
NGOs /academics • Anne Maree Schwartz, Advisor, WorldFish Centre, Honiara • Delvene Boso, Country Manager, WorldFish Centre, Honiara • Richard Hamilton, Senior Melanesai Scientist, The Nature Conservancy (TNC), Honiara
Regional institutions • Bryan Scott, Fisheries IUU Liaison Officer,DEVfishII, SPC
Tonga
Government • Poasi Fale Ngaluafe, Senior Fisheries Officer, Fisheries Dept., Tongatapu • Otineli Fisi'ikava, Fisheries Technical Officer, Vava'u • Ioane Finau, Fishery Assistant, Vava'u • Tenita 'Ahoafi, Fisheries License Officer, Tongatapu • Customs & quarantine staff, Vava'u • Akosita Leakowa, Fisheries Assistant, Vava'u • Lavinia Viapowa, Fisheries IT, Tongatapu
Industry • Chin Choe, Owner, BdM processor / exporter, South Pacific Resources, Tongatapu • De Feng Mo, BdM processor / exporter, Nuku'alofa • August Hoeft, BdM processor / exporter, TongaSun, Vava'u • Sun Shaojun, BdM processor / exporter, TongaSun, Vava'u • brother of Gina Guo, BdM processor / exporter, Vava'u • Ziang Qing Shong, BdM process / exporter, Tongatapu
NGOs /academics • David *****, volunteer coordinator, Tonga • Richard Arthur, marine products quarantine consultant (Canada-‐based) • Phil Forbes, resident, Ha'apai Group

New Caledonia
NGOs /academics • Steven Purcell, Lectuere/ Researcher, Development Coordinator, National Marine
Science Centre, Coffs Harbour, Australia
Regional institutions • Mike Batty, Director of Fisheries, SPC • Michael Sharp, Fisheries Development Officer (Economics), SPC • Ian Bertram, Coastal Fisheries Science and Management Adviser, SPC • Kalo Pakoa, Fisheries Scientist (Invertebrates), SPC • Scott Pontifax, GIS specialist (Census & Surveys) SPC • Phil Bright, SPC POPgis • Aymeric Desurmont, Fisheries Information Officer, SPC • Etuati Ropeti, Coastal Fisheries Management Officer, SPC
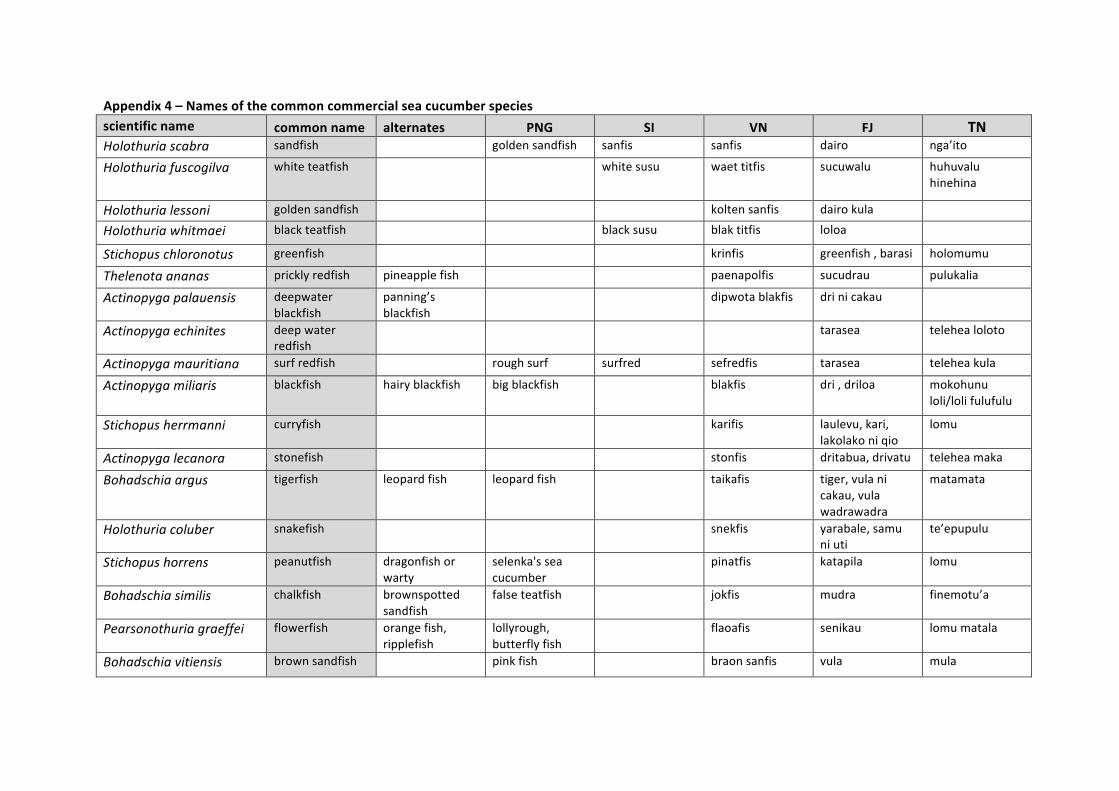
Appendix 4 – Names of the common commercial sea cucumber species scientific name common name alternates PNG SI VN FJ TN Holothuria scabra sandfish golden sandfish sanfis sanfis dairo nga’ito
Holothuria fuscogilva white teatfish white susu waet titfis sucuwalu huhuvalu hinehina
Holothuria lessoni golden sandfish kolten sanfis dairo kula
Holothuria whitmaei black teatfish black susu blak titfis loloa
Stichopus chloronotus greenfish krinfis greenfish , barasi holomumu
Thelenota ananas prickly redfish pineapple fish paenapolfis sucudrau pulukalia
Actinopyga palauensis deepwater blackfish
panning’s blackfish
dipwota blakfis dri ni cakau
Actinopyga echinites deep water redfish
tarasea telehea loloto
Actinopyga mauritiana surf redfish rough surf surfred sefredfis tarasea telehea kula
Actinopyga miliaris blackfish hairy blackfish big blackfish blakfis dri , driloa mokohunu loli/loli fulufulu
Stichopus herrmanni curryfish karifis laulevu, kari, lakolako ni qio
lomu
Actinopyga lecanora stonefish stonfis dritabua, drivatu telehea maka
Bohadschia argus tigerfish leopard fish leopard fish taikafis tiger, vula ni cakau, vula wadrawadra
matamata
Holothuria coluber snakefish snekfis yarabale, samu ni uti
te’epupulu
Stichopus horrens peanutfish dragonfish or warty
selenka's sea cucumber
pinatfis katapila lomu
Bohadschia similis chalkfish brownspotted sandfish
false teatfish jokfis mudra finemotu’a
Pearsonothuria graeffei flowerfish orange fish, ripplefish
lollyrough, butterfly fish
flaoafis senikau lomu matala
Bohadschia vitiensis brown sandfish pink fish braon sanfis vula mula

Thelenota anax amberfish giant bêche-‐de-‐mer
ambafis basi, 4 corner mokohunu saianiti
Holothuria atra lolly fish -‐ reef lolifis loli ni cakau
Holothuria atra lollyfish biglolly lolifis loliloli loli
Holothuria fuscopunctata elephant trunkfish
trunkfish elefenfis tinani dairo, dairo ni toba
elefanite
Holothuria edulis pinkfish smallbelly pinkfis loli piqi loli pingiki
Notes
• for a number of species the trade distinguishes between animals that have grown in protected areas and animals grown in area subject to currents and water movement – in the latter instance the animals need to hold on to the substrate, and so have a rougher underside
• in the case of lollyfish, those found on reefs have rougher bottoms and tend to be larger – to the extent that some traders distinguish between “reef” lolly and “inshore” lolly
• another example is that tigerfish are commonly associated with the entrances to lagoons, but not in main current areas
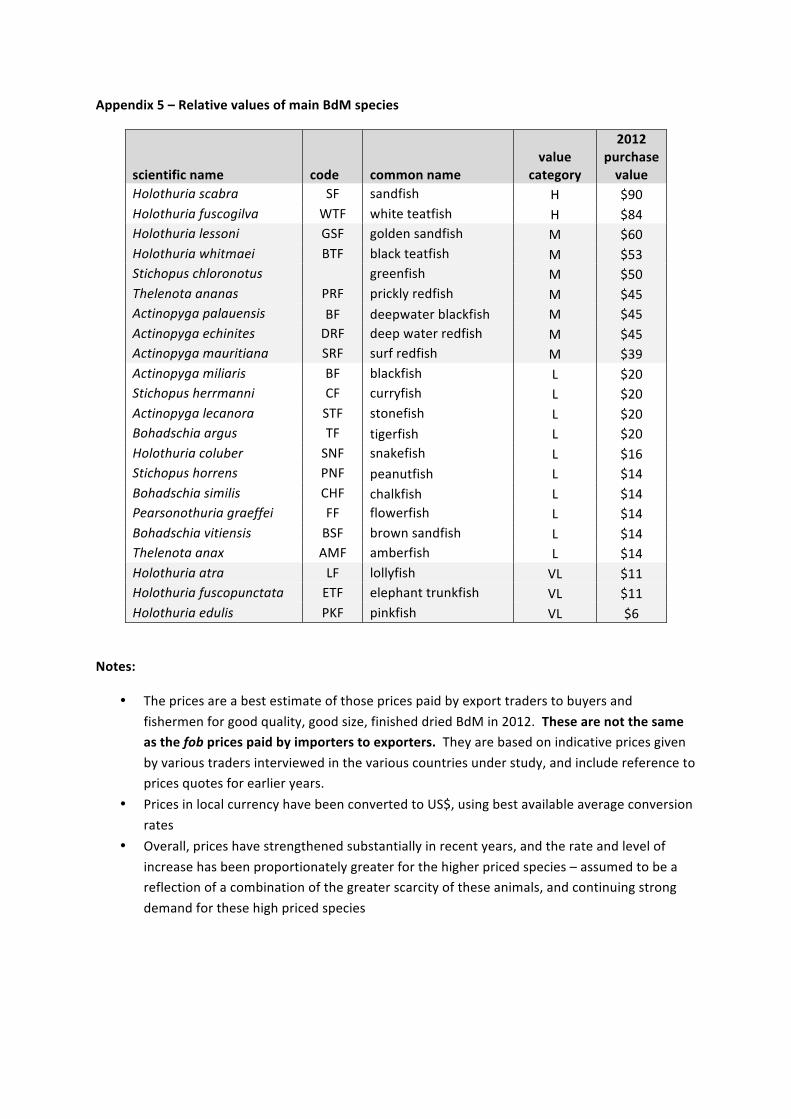
Appendix 5 – Relative values of main BdM species
scientific name code common name value
category
2012 purchase value
Holothuria scabra SF sandfish H $90 Holothuria fuscogilva WTF white teatfish H $84 Holothuria lessoni GSF golden sandfish M $60 Holothuria whitmaei BTF black teatfish M $53 Stichopus chloronotus
greenfish M $50
Thelenota ananas PRF prickly redfish M $45 Actinopyga palauensis BF deepwater blackfish M $45 Actinopyga echinites DRF deep water redfish M $45 Actinopyga mauritiana SRF surf redfish M $39 Actinopyga miliaris BF blackfish L $20 Stichopus herrmanni CF curryfish L $20 Actinopyga lecanora STF stonefish L $20 Bohadschia argus TF tigerfish L $20 Holothuria coluber SNF snakefish L $16 Stichopus horrens PNF peanutfish L $14 Bohadschia similis CHF chalkfish L $14 Pearsonothuria graeffei FF flowerfish L $14 Bohadschia vitiensis BSF brown sandfish L $14 Thelenota anax AMF amberfish L $14 Holothuria atra LF lollyfish VL $11 Holothuria fuscopunctata ETF elephant trunkfish VL $11 Holothuria edulis PKF pinkfish VL $6
Notes:
• The prices are a best estimate of those prices paid by export traders to buyers and fishermen for good quality, good size, finished dried BdM in 2012. These are not the same as the fob prices paid by importers to exporters. They are based on indicative prices given by various traders interviewed in the various countries under study, and include reference to prices quotes for earlier years.
• Prices in local currency have been converted to US$, using best available average conversion rates
• Overall, prices have strengthened substantially in recent years, and the rate and level of increase has been proportionately greater for the higher priced species – assumed to be a reflection of a combination of the greater scarcity of these animals, and continuing strong demand for these high priced species

Appendix 6 – Indicative buy-‐in1 prices for dried BdM, based on reported prices from various traders, fishermen and Fisheries Departments
(horizontal axis is years 2005 to 2012; vertical axis is USD0 to USD100/kg, dried weight)
1 The buy-‐in price is the price paid by the main exporters to fishermen, processors and buyer intermediaries for grade “A” finished dried BdM
x4.4
x1.9
x10.0 x4.5 x4.6 x5.5
x4.1 x3.3 x9.0
x2.4 x1.6 x1.3

Note: interpolation of curves where limited data points are available has been made on the basis of previously reported value rankings
x2.3 x1.9 x3.3 x2.9
x3.7 x5.0 x3.3 x3.0
x2.7 x2.3

Appendix 7 –Key characteristics, by species – including legal minimum weight and sizes, wet and dry
habitat distribution depth rang
e
density
threshold
common
leng
th, w
et
leng
th at 1
st
maturity
minim
um legal
size
common
weigh
t, wet
minim
um legal
weigh
t
body
wall
minim
um legal
leng
th, d
ry
minim
um legal
weigh
t, dry
minim
um legal
pieces / kg
dried weigh
as
a prop
ortio
n of
wet weigh
t
wall thickne
ss
to weigh
t
wall thickne
ss
to drie
d leng
th
wet wet wet wet wet wet dry dry dry
m no. cm cm cm kg kg mm cm g no. % ratio ratio Sandfish Inner reef flats of fringing reefs,
lagoon-‐islets 0–15 1200 22 16 0.3 6 5%
0.20
White teatfish
Outer barrier reefs and passes, also on shallow seagrass beds
0–40 28 42 32 35 2.4 2.5 12 15 200 5 8% 0.05
0.80
Golden sandfish
645 30 22 1.1 1.4 7 10 70 15 5% 0.06
0.70
Black teatfish
Reef flats, slopes and shallow seagrass beds
0–20 207 37 26 25 1.7 2.4 12 15 168 6 8% 0.07
0.80
Greenfish Reef flats and upper slopes, mostly on hard substrates
0–15 878 18 20 0.1 0.3 2 10 9 115 fragile 3% 0.20
0.20
Prickly redfish
Reef slopes and near passes, hard bottoms with large rubble and coral patches
0–25 27 45 30 30 2.5 3.5 15 15 175 6 5% 0.06
1.00
Deepwater blackfish
20 0.4 10 22 45 6% -‐
Deep water redfish
Reef flats of fringing and lagoon-‐islet reefs, rubble reefs and compact flats
0–12 20 12 0.3 0.4 7 22 45 6% 0.23
Surf redfish Outer reef flats and fringing reefs, mostly in the surf zone
0–20 27 20 22 20 0.3 0.85 6 10 47 22 6% 0.20
0.60
Blackfish Reef flats of fringing and lagoon-‐islet reefs, never found on barrier reefs
0–10 400 25 20 0.4 0.5 6 10 28 37 6% 0.15
0.60
Curryfish Seagrass beds, rubble and sandy-‐muddy bottoms
0–25 40 35 27 30 1.0 2.1 8 15 84 14 fragile 4% 0.08
0.53
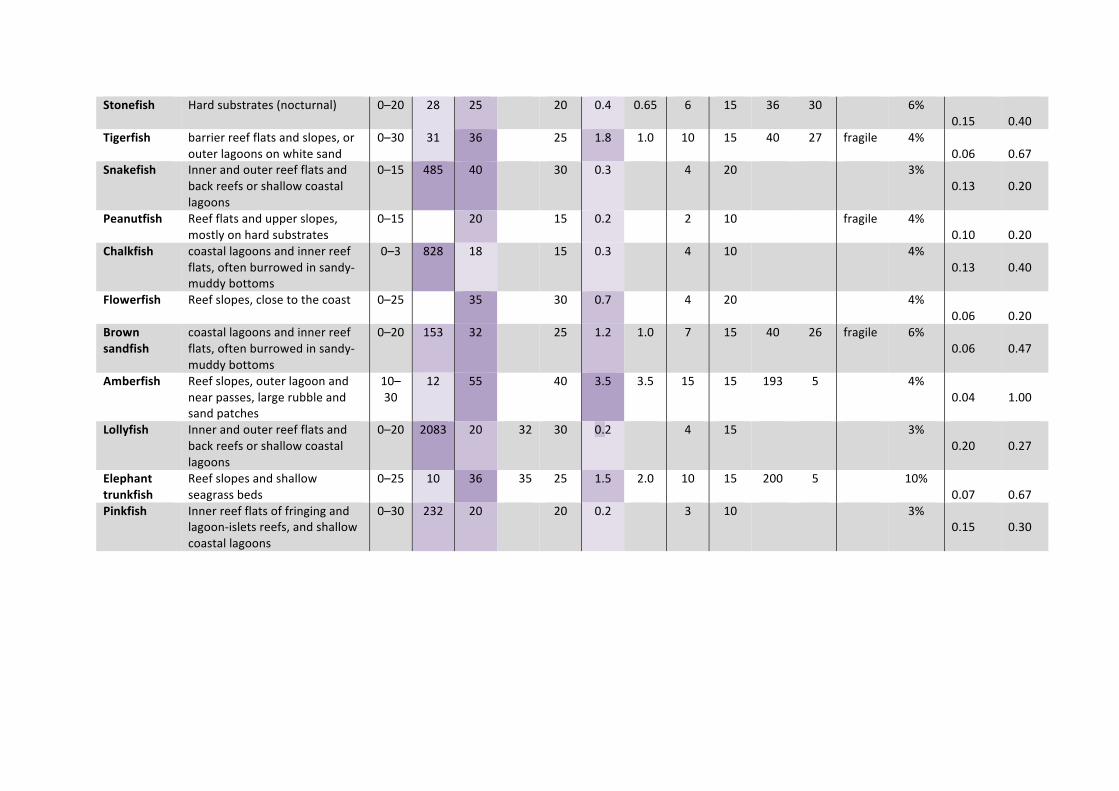
Stonefish Hard substrates (nocturnal) 0–20 28 25 20 0.4 0.65 6 15 36 30 6% 0.15
0.40
Tigerfish barrier reef flats and slopes, or outer lagoons on white sand
0–30 31 36 25 1.8 1.0 10 15 40 27 fragile 4% 0.06
0.67
Snakefish Inner and outer reef flats and back reefs or shallow coastal lagoons
0–15 485 40 30 0.3 4 20 3% 0.13
0.20
Peanutfish Reef flats and upper slopes, mostly on hard substrates
0–15 20 15 0.2 2 10 fragile 4% 0.10
0.20
Chalkfish coastal lagoons and inner reef flats, often burrowed in sandy-‐muddy bottoms
0–3 828 18 15 0.3 4 10 4% 0.13
0.40
Flowerfish Reef slopes, close to the coast 0–25 35 30 0.7 4 20 4% 0.06
0.20
Brown sandfish
coastal lagoons and inner reef flats, often burrowed in sandy-‐muddy bottoms
0–20 153 32 25 1.2 1.0 7 15 40 26 fragile 6% 0.06
0.47
Amberfish Reef slopes, outer lagoon and near passes, large rubble and sand patches
10–30
12 55 40 3.5 3.5 15 15 193 5 4% 0.04
1.00
Lollyfish Inner and outer reef flats and back reefs or shallow coastal lagoons
0–20 2083 20 32 30 0.2 4 15 3% 0.20
0.27
Elephant trunkfish
Reef slopes and shallow seagrass beds
0–25 10 36 35 25 1.5 2.0 10 15 200 5 10% 0.07
0.67
Pinkfish Inner reef flats of fringing and lagoon-‐islets reefs, and shallow coastal lagoons
0–30 232 20 20 0.2 3 10 3% 0.15
0.30

Appendix 8 – Annual exports of BdM from the five countries under study
year PNG SOL VAN FIJ TON
1971 5 1972 33 1973 54 1974 18 1975 20 1976 29 4 1977 5 39 17 1978 6 34 15 1979 1 10 11 1980 1981 11 8 15 1982 23 17 16 1983 8 9 6 33 1984 5 44 3 53 1985 20 14 2 66 2 1986 119 134 4 229 10 1987 192 146 12 640 40 1988 203 147 15 717 80 1989 195 87 39 365 50 1990 239 119 2 323 30 1991 626 622 27 319 10 1992 656 715 66 403 25 1993 500 316 43 149 35 1994 209 285 66 197 61 1995 445 219 48 454 60 1996 596 113 42 666 45 1997 505 203 48 862 35 1998 679 254 25 369 1999 395 376 18 141 2000 554 161 26 246 2001 485 375 38 245 1 2002 389 178 8 171 2003 488 409 25 104 2004 491 28 14 115 1 2005 577 21 9 378 2006 612 0 8 258 2007 790 223 15 236 2008 500 8 -‐ 219 15 2009 534 213 -‐ 167 370 2010 4 14 -‐ 195 313 2011 -‐ 4 -‐ 398 79 2012 -‐ 35 -‐ 250 50
Notes:
• figures in red are best estimates by the consultants; • purple shaded years indicated when moratoria were in place
Sources:
• PNG -‐ Lindohlm, 1978; DFMR, no date; Wright, 1986 cited in Kailola with Lokani, no date; Lokani and Kubohojam, 1993; Lokani,1990; Myint, 1996; National Fisheries Authority 2-‐-‐7-‐12;
• Solomon Islands – FAO; James, 1977; Gaudechoux, 1993; Leqata, 2004; Division of Fisheries and Marine Resources 2004 to 2012;
• Vanuatu – FAO; Preston, 1993; 1996-‐2004 from Amos, Resource Profiles 2005; whole time series – 2012 draft BdM Management Plan
• Fiji – FAO; Preston, 1993; Gaudechoux, 1993; Qalovaki, 2006; Fish Dept 2005-‐11 • Tonga – FAO; Tonga Ministry of Fisheries, 1995;
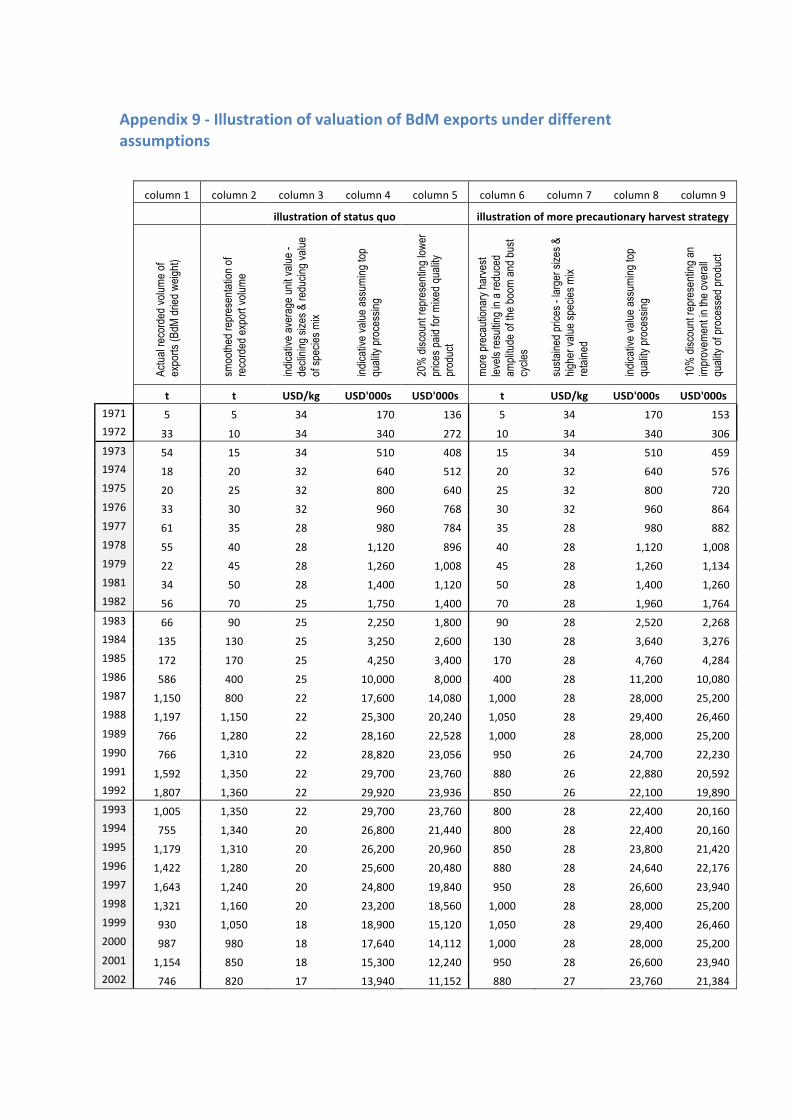
Appendix 9 -‐ Illustration of valuation of BdM exports under different assumptions
column 1 column 2 column 3 column 4 column 5 column 6 column 7 column 8 column 9
illustration of status quo illustration of more precautionary harvest strategy
Actu
al re
cord
ed v
olum
e of
ex
ports
(BdM
drie
d w
eigh
t)
smoo
thed
repr
esen
tatio
n of
re
cord
ed e
xpor
t vol
ume
indi
cativ
e av
erag
e un
it va
lue
- de
clin
ing
size
s &
redu
cing
val
ue
of s
peci
es m
ix
indi
cativ
e va
lue
assu
min
g to
p qu
ality
pro
cess
ing
20%
dis
coun
t rep
rese
ntin
g lo
wer
pr
ices
pai
d fo
r mix
ed q
ualit
y pr
oduc
t
mor
e pr
ecau
tiona
ry h
arve
st
leve
ls re
sulti
ng in
a re
duce
d am
plitu
de o
f the
boo
m a
nd b
ust
cycl
es
sust
aine
d pr
ices
- la
rger
siz
es &
hi
gher
val
ue s
peci
es m
ix
reta
ined
indi
cativ
e va
lue
assu
min
g to
p qu
ality
pro
cess
ing
10%
dis
coun
t rep
rese
ntin
g an
im
prov
emen
t in
the
over
all
qual
ity o
f pro
cess
ed p
rodu
ct
t t USD/kg USD'000s USD'000s t USD/kg USD'000s USD'000s
1971 5 5 34 170 136 5 34 170 153 1972 33 10 34 340 272 10 34 340 306 1973 54 15 34 510 408 15 34 510 459 1974 18 20 32 640 512 20 32 640 576 1975 20 25 32 800 640 25 32 800 720 1976 33 30 32 960 768 30 32 960 864 1977 61 35 28 980 784 35 28 980 882 1978 55 40 28 1,120 896 40 28 1,120 1,008 1979 22 45 28 1,260 1,008 45 28 1,260 1,134 1981 34 50 28 1,400 1,120 50 28 1,400 1,260 1982 56 70 25 1,750 1,400 70 28 1,960 1,764 1983 66 90 25 2,250 1,800 90 28 2,520 2,268 1984 135 130 25 3,250 2,600 130 28 3,640 3,276 1985 172 170 25 4,250 3,400 170 28 4,760 4,284 1986 586 400 25 10,000 8,000 400 28 11,200 10,080 1987 1,150 800 22 17,600 14,080 1,000 28 28,000 25,200 1988 1,197 1,150 22 25,300 20,240 1,050 28 29,400 26,460 1989 766 1,280 22 28,160 22,528 1,000 28 28,000 25,200 1990 766 1,310 22 28,820 23,056 950 26 24,700 22,230 1991 1,592 1,350 22 29,700 23,760 880 26 22,880 20,592 1992 1,807 1,360 22 29,920 23,936 850 26 22,100 19,890 1993 1,005 1,350 22 29,700 23,760 800 28 22,400 20,160 1994 755 1,340 20 26,800 21,440 800 28 22,400 20,160 1995 1,179 1,310 20 26,200 20,960 850 28 23,800 21,420 1996 1,422 1,280 20 25,600 20,480 880 28 24,640 22,176 1997 1,643 1,240 20 24,800 19,840 950 28 26,600 23,940 1998 1,321 1,160 20 23,200 18,560 1,000 28 28,000 25,200 1999 930 1,050 18 18,900 15,120 1,050 28 29,400 26,460 2000 987 980 18 17,640 14,112 1,000 28 28,000 25,200 2001 1,154 850 18 15,300 12,240 950 28 26,600 23,940 2002 746 820 17 13,940 11,152 880 27 23,760 21,384
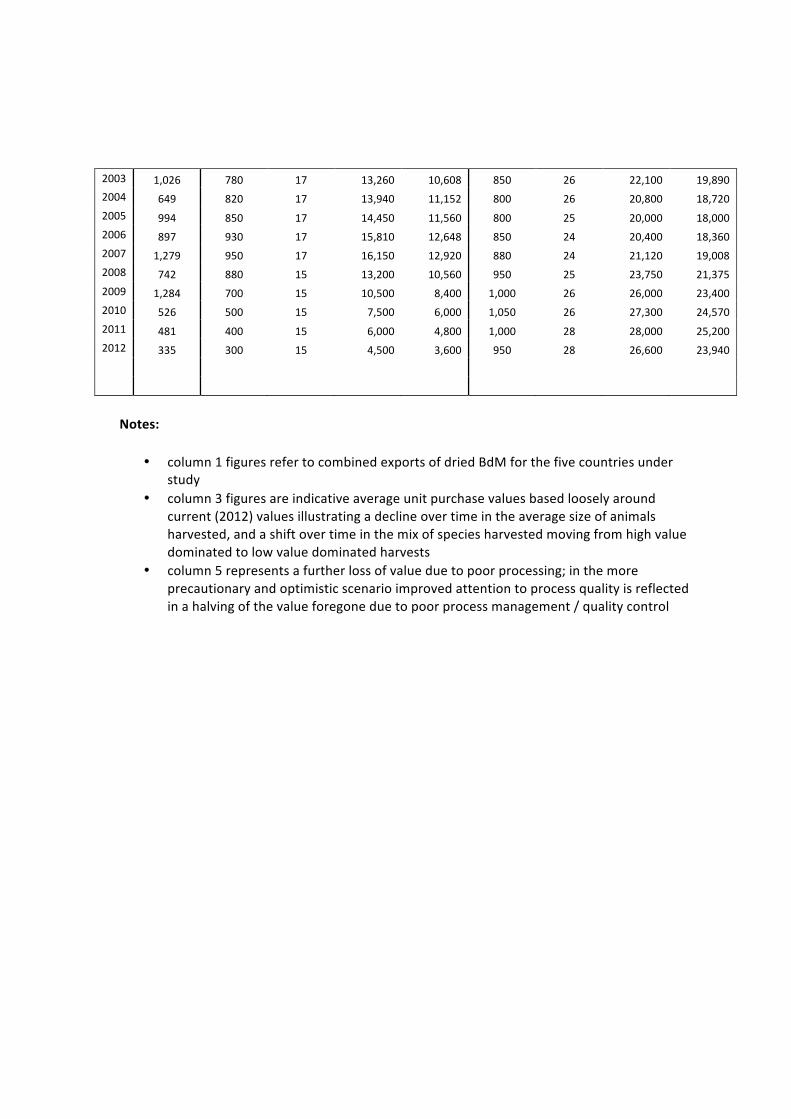
2003 1,026 780 17 13,260 10,608 850 26 22,100 19,890 2004 649 820 17 13,940 11,152 800 26 20,800 18,720 2005 994 850 17 14,450 11,560 800 25 20,000 18,000 2006 897 930 17 15,810 12,648 850 24 20,400 18,360 2007 1,279 950 17 16,150 12,920 880 24 21,120 19,008 2008 742 880 15 13,200 10,560 950 25 23,750 21,375 2009 1,284 700 15 10,500 8,400 1,000 26 26,000 23,400 2010 526 500 15 7,500 6,000 1,050 26 27,300 24,570 2011 481 400 15 6,000 4,800 1,000 28 28,000 25,200 2012 335 300 15 4,500 3,600 950 28 26,600 23,940
Notes:
• column 1 figures refer to combined exports of dried BdM for the five countries under study
• column 3 figures are indicative average unit purchase values based loosely around current (2012) values illustrating a decline over time in the average size of animals harvested, and a shift over time in the mix of species harvested moving from high value dominated to low value dominated harvests
• column 5 represents a further loss of value due to poor processing; in the more precautionary and optimistic scenario improved attention to process quality is reflected in a halving of the value foregone due to poor process management / quality control

Appendix 10 – Indices of encounterability, value and effort Figs 1 to 4 present an overview of the interplay between the different species – in terms of value, size and abundance; features that greatly influence the harvesting choices made by fishermen. These features have been used to inform simulations of production under different management strategies (Chapter 4), based on the historic record of BdM production and export (Chapter 3).
The interplay between volume and value is a key determinant of fishermen behaviour – which can be expressed in terms of two characteristics -‐ the likelihood of encountering a sea cucumber in a particular area, and the value that each harvested individual represents. Since we are not able to definitively ascribe sea cucumber species to particular areas of habitat in each country (we do not have the detailed habitat maps that this would require, and whilst sea cucumber species may prefer particular habitats, each in practice is found over a range of habitats), we have to make do with indicators of abundance. These are illustrated in Figs 2 & 3.
Fig 2 shows the likely value ascribed to encountering specimens of each species where the stock of each species is at or above a density considered to be representative of a healthy stock (the threshold density1). In a perfect world one would expect the encounterability value to show a similar distribution to that of actual harvests. That this is not so is indicative of the fact that, supported by anecdotal evidence, stocks have been heavily exploited across this time period, and for much of this period may be considered to have been over-‐fished. In addition, sea cucumbers are not uniformly distributed throughout each habitat zone, but are more often than not found in clumps – so if you find one sea cucumber, you are more likely to find others of that species nearby. Encounterability will also be impacted by the growth rates of individual sea cucumber species – some take seven years to get to harvestable size, other a couple of years. Fig 3 shows the value that may be ascribed to harvesting a single typically sized individual of each species -‐ harvesting, processing and then selling to a trader.
A number of conclusions can be drawn from the illustrations:
• white teatfish is clearly the most valuable of sea cucumber – the focus of both fishermen and trader attention
• sandfish and golden sandfish are highly sought after, but since they have a very narrow habitat range compared to other sea cucumbers (found in fine mud associated with estuaries and mangrove) they are not target species in most fisheries; [note -‐ golden sandfish, only recently re-‐classified as a separate species to sandfish (and thus not separated out in historical data series), grows to a larger size than sandfish]
• prime target high value species are white teatfish, black teatfish, prickly redfish and sandfish / gold sandfish
• lolly and snakefish, two of the lowest unit value sea cucumbers, play crucial roles in the harvest mix – probably reflecting the fact that they are easily harvested by reef gleaning, and they are fast growing and can be found in high density clumps
1 These thresholds have been developed over many years based on the results of dive and snorkel surveys initiated by SPC

• “bread and butter” harvests focus mainly on lolly, snakefish, brown sandfish, curryfish, chalkfish, tigerfish and amberfish.

Fig 2 – Average value of exports, plus an indicator of the value of encounterability of sea cucumbers when fishing
Note
The index of encounterability captures the relative value of sea cucumber in a fixed area of seabed, based on the threshold density expected in a healthy stock (noting this does not include metrics to cover the fact that not all species are found in one area, and species tend to be concentrated in relatively defined areas)
Fig 3 – Average value of annual harvests, plus value ascribed to harvesting a typically sized individual of each species
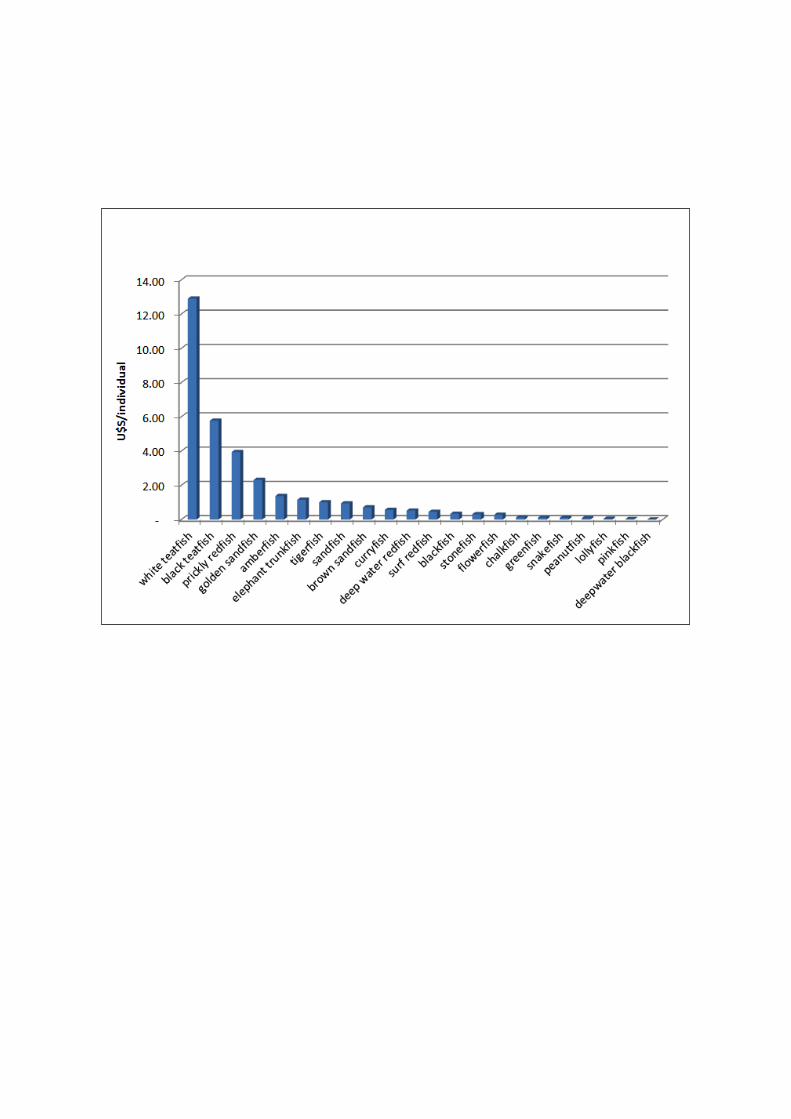
Fig 4 – The typical value of a single processed BdM – another indicator of the incentive to harvest specimens of each species

Appendix 11– Indicative production of dried BdM, based on 15 years data, by Province, by species (kgs, dried weight)
1 2 3 4 5 6 7 8 9 Province Western (Fly) Gulf Central Sandaun (W Sepik) East Sepik Madang Manus West New
Britain East New Britain
main town Daru Kerema Port Moresby Vanimo Wewak Madang Lorengau Kimbe Kokopo
Sandfish 30,813
8 64 9,079 1,618 623 White teatfish 990
127 299 20,743 1,789 1,325
Black teatfish 5
44 94 2,375 116 362 Greenfish 104 40 94 1,343 47 185 Prickly redfish -‐ 66 101 2,099 400 296 Deepwater blackfish Deep water redfish -‐ -‐ -‐ -‐ -‐ 12 Surf redfish 1,108 166 1,033 3,684 4,316 709 Blackfish -‐ 18 13 422 50 42 Curryfish 880 -‐ 295 7,016 3,767 1,233 Stonefish -‐ Tigerfish -‐ 16 247 6,052 1,921 1,268 Snakefish -‐ -‐ 131 1,959 1,622 311 Peanutfish -‐ Chalkfish -‐ -‐ 82 2,303 257 392 Flowerfish -‐ -‐ 67 25 815 271 Brown sandfish -‐ -‐ 177 5,413 2,195 911 Amberfish -‐ 1 153 172 383 392 Lollyfish -‐ 71 882 3,300 5,116 2,008 Elephant trunkfish -‐ 17 79 1,027 214 238 Pinkfish -‐ 1 39 23 6,942 68 33,899 -‐ -‐ -‐ 575 3,850 67,034 31,568 10,646

10 11 12 13 14 15 16 17 18 Province New Ireland Morobe Oro (Northern) Milne Bay AR Bou-‐gainville Choiseul Western Isabel Central main town Kavieng Lae Popon-‐detta Alotau Arawa Gizo
Sandfish 2,143 1,400 5,557 5,181 11,866 157 266 97 19 White teatfish 6,841 1,039 1,761 52,350 684 7,735 15,737 4,295 654 Black teatfish 579 73 113 5,866 396 1,160 2,623 477 93 Greenfish 65 48 195 7,387 50 98 165 60 12 Prickly redfish 994 199 248 16,441 216 95 161 59 11 Deepwater blackfish 116 197 119 14 Deep water redfish -‐ -‐ -‐ -‐ -‐ 967 1,311 596 164 Surf redfish 2,830 268 522 5,411 691 -‐ -‐ -‐ -‐ Blackfish 214 111 139 5,915 168 1,160 1,189 716 187 Curryfish 6,878 323 578 11,933 189 1,160 1,177 716 187 Stonefish 1,160 1,274 716 187 Tigerfish 2,195 295 535 18,081 914 1,160 1,968 716 187 Snakefish 3,673 77 106 1,066 97 1,934 2,623 1,335 234 Peanutfish 1,547 1,967 529 140 Chalkfish 1,931 209 1,016 12,615 37 -‐ -‐ -‐ -‐ Flowerfish 351 116 -‐ -‐ -‐ -‐ -‐ -‐ -‐ Brown sandfish 6,100 562 29 16,809 1,189 5,415 9,180 3,353 514 Amberfish 892 1,086 46 16,863 332 1,364 2,312 1,193 234 Lollyfish 460 287 1,002 15,880 313 10,056 18,359 6,863 1,449 Elephant trunkfish 1,051 474 157 15,457 108 1,934 2,669 1,193 234 Pinkfish 534 38 -‐ -‐ -‐ 1,266 2,146 781 153 37,730 6,606 12,004 207,257 17,249 38,482.93 65,323.09 23,812.59 4,673.67

19 20 21 22 23 24 25 26 27 Province Guadal-‐canal Rennel &
Belona Malaita Makira-‐
Ulawa Temotu Torba Sanma Penama Malampa
main town Honiara Auki Lata Sola Luganville Saratamata Lakatoro
Sandfish 26 0 240 26 62 -‐ 60 30 270 White teatfish 634 8 7,683 650 3,347 90 160 50 432 Black teatfish 63 1 1,182 65 456 36 80 60 324 Greenfish 16 0 149 16 38 18 60 30 324 Prickly redfish 16 0 145 16 37 6 20 10 54 Deepwater blackfish 19 0 177 20 76 6 20 10 54 Deep water redfish 190 2 591 195 304 6 20 10 54 Surf redfish -‐ -‐ -‐ -‐ -‐ 48 400 50 972 Blackfish 190 2 1,071 195 276 12 40 20 108 Curryfish 190 2 1,061 195 273 -‐ -‐ -‐ -‐ Stonefish 190 2 1,148 195 296 -‐ -‐ -‐ -‐ Tigerfish 253 4 1,774 325 457 6 60 30 162 Snakefish 444 5 3,546 455 851 36 120 60 216 Peanutfish 253 3 1,311 260 338 -‐ -‐ -‐ -‐ Chalkfish -‐ -‐ 10,637 -‐ -‐ -‐ -‐ -‐ -‐ Flowerfish -‐ -‐ -‐ -‐ -‐ -‐ 20 10 54 Brown sandfish 1,014 11 8,273 910 2,138 6 480 300 1,350 Amberfish 317 4 1,773 325 536 6 20 10 54 Lollyfish 2,028 25 14,774 2,145 4,564 300 360 280 810 Elephant trunkfish 258 3 1,773 265 619 6 20 10 54 Pinkfish 253 3 1,773 260 498 18 60 30 108 6,354.00 75.42 59,080.83 6,518.05 15,165.83 600 2,000 1,000 5,400
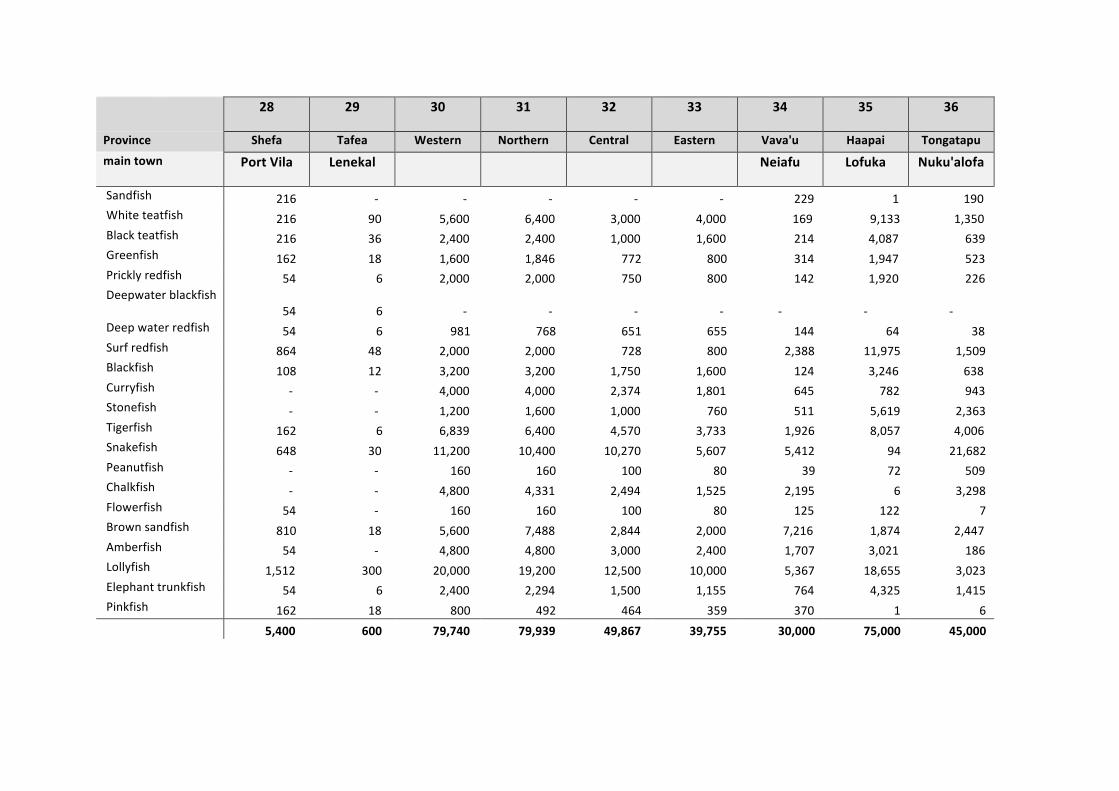
28 29 30 31 32 33 34 35 36
Province Shefa Tafea Western Northern Central Eastern Vava'u Haapai Tongatapu
main town Port Vila Lenekal Neiafu Lofuka Nuku'alofa
Sandfish 216 -‐ -‐ -‐ -‐ -‐ 229 1 190 White teatfish 216 90 5,600 6,400 3,000 4,000 169 9,133 1,350 Black teatfish 216 36 2,400 2,400 1,000 1,600 214 4,087 639 Greenfish 162 18 1,600 1,846 772 800 314 1,947 523 Prickly redfish 54 6 2,000 2,000 750 800 142 1,920 226 Deepwater blackfish
54 6 -‐ -‐ -‐ -‐ -‐
-‐
-‐
Deep water redfish 54 6 981 768 651 655 144 64 38 Surf redfish 864 48 2,000 2,000 728 800 2,388 11,975 1,509 Blackfish 108 12 3,200 3,200 1,750 1,600 124 3,246 638 Curryfish -‐ -‐ 4,000 4,000 2,374 1,801 645 782 943 Stonefish -‐ -‐ 1,200 1,600 1,000 760 511 5,619 2,363 Tigerfish 162 6 6,839 6,400 4,570 3,733 1,926 8,057 4,006 Snakefish 648 30 11,200 10,400 10,270 5,607 5,412 94 21,682 Peanutfish -‐ -‐ 160 160 100 80 39 72 509 Chalkfish -‐ -‐ 4,800 4,331 2,494 1,525 2,195 6 3,298 Flowerfish 54 -‐ 160 160 100 80 125 122 7 Brown sandfish 810 18 5,600 7,488 2,844 2,000 7,216 1,874 2,447 Amberfish 54 -‐ 4,800 4,800 3,000 2,400 1,707 3,021 186 Lollyfish 1,512 300 20,000 19,200 12,500 10,000 5,367 18,655 3,023 Elephant trunkfish 54 6 2,400 2,294 1,500 1,155 764 4,325 1,415 Pinkfish 162 18 800 492 464 359 370 1 6 5,400 600 79,740 79,939 49,867 39,755 30,000 75,000 45,000

Appendix 12 – Indicative species mix, by Province, based on historical harvesting patterns
1 2 3 4 5 6 7 8 9 Province Western
(Fly) Gulf Central Sandaun (W
Sepik) East Sepik Madang Manus West New
Britain East New Britain
main town Daru Kerema Port Moresby
Vanimo Wewak Madang Lorengau Kimbe Kokopo
Sandfish 91% 1% 2% 14% 5% 6%
White teatfish 3% 22% 8% 31% 6% 12%
Black teatfish 0% 8% 2% 4% 0% 3%
Greenfish 0% 7% 2% 2% 0% 2%
Prickly redfish 11% 3% 3% 1% 3%
Deepwater blackfish
Deep water redfish 0%
Surf redfish 3% 29% 27% 5% 14% 7%
Blackfish 3% 0% 1% 0% 0%
Curryfish 3% 8% 10% 12% 12%
Stonefish
Tigerfish 3% 6% 9% 6% 12%
Snakefish 3% 3% 5% 3%
Peanutfish
Chalkfish 2% 3% 1% 4%
Flowerfish 2% 0% 3% 3%
Brown sandfish 5% 8% 7% 9%
Amberfish 0% 4% 0% 1% 4%
Lollyfish 12% 23% 5% 16% 19%
Elephant trunkfish 3% 2% 2% 1% 2%
Pinkfish 0% 1% 0% 22% 1%

10 11 12 13 14 15 16 17 18 Province New Ireland Morobe Oro
(Northern) Milne Bay AR Bou-‐
gainville Choiseul Western Isabel Central
main town Kavieng Lae Popon-‐detta Alotau Arawa Gizo
Sandfish 6% 21% 46% 2% 69% 0% 0% 0% 0% White teatfish 18% 16% 15% 25% 4% 20% 24% 18% 14% Black teatfish 2% 1% 1% 3% 2% 3% 4% 2% 2% Greenfish 0% 1% 2% 4% 0% 0% 0% 0% 0% Prickly redfish 3% 3% 2% 8% 1% 0% 0% 0% 0% Deepwater blackfish 0% 0% 1% 0% Deep water redfish 3% 2% 3% 4% Surf redfish 8% 4% 4% 3% 4% Blackfish 1% 2% 1% 3% 1% 3% 2% 3% 4% Curryfish 18% 5% 5% 6% 1% 3% 2% 3% 4% Stonefish 3% 2% 3% 4% Tigerfish 6% 4% 4% 9% 5% 3% 3% 3% 4% Snakefish 10% 1% 1% 1% 1% 5% 4% 6% 5% Peanutfish 4% 3% 2% 3% Chalkfish 5% 3% 8% 6% 0% Flowerfish 1% 2% Brown sandfish 16% 9% 0% 8% 7% 14% 14% 14% 11% Amberfish 2% 16% 0% 8% 2% 4% 4% 5% 5% Lollyfish 1% 4% 8% 8% 2% 26% 28% 29% 31% Elephant trunkfish 3% 7% 1% 7% 1% 5% 4% 5% 5% Pinkfish 1% 1% 3% 3% 3% 3%

19 20 21 22 23 24 25 26 27 Province Guadal-‐
canal Rennel & Belona
Malaita Makira-‐Ulawa
Temotu Torba Sanma Penama Malampa
main town Honiara Auki Lata Sola Luganville Saratamata Lakatoro
Sandfish 0% 0% 0% 0% 0% 3% 3% 5% White teatfish 10% 10% 13% 10% 22% 15% 8% 5% 8% Black teatfish 1% 1% 2% 1% 3% 6% 4% 6% 6% Greenfish 0% 0% 0% 0% 0% 3% 3% 3% 6% Prickly redfish 0% 0% 0% 0% 0% 1% 1% 1% 1% Deepwater blackfish 0% 0% 0% 0% 1% 1% 1% 1% 1% Deep water redfish 3% 3% 1% 3% 2% 1% 1% 1% 1% Surf redfish 8% 20% 5% 18% Blackfish 3% 3% 2% 3% 2% 2% 2% 2% 2% Curryfish 3% 3% 2% 3% 2% Stonefish 3% 3% 2% 3% 2% Tigerfish 4% 5% 3% 5% 3% 1% 3% 3% 3% Snakefish 7% 7% 6% 7% 6% 6% 6% 6% 4% Peanutfish 4% 4% 2% 4% 2% Chalkfish 18% Flowerfish 1% 1% 1% Brown sandfish 16% 14% 14% 14% 14% 1% 24% 30% 25% Amberfish 5% 5% 3% 5% 4% 1% 1% 1% 1% Lollyfish 32% 33% 25% 33% 30% 50% 18% 28% 15% Elephant trunkfish 4% 4% 3% 4% 4% 1% 1% 1% 1% Pinkfish 4% 4% 3% 4% 3% 3% 3% 3% 2%

28 29 30 31 32 33 34 35 36
Province Shefa Tafea Western Northern Central Eastern Vava'u Haapai Tongatapu
main town Port Vila Lenekal Neiafu Lofuka Nuku'alofa
Sandfish 4%
1% 0% 0% White teatfish 4% 15% 7% 8% 6% 10% 1% 12% 3% Black teatfish 4% 6% 3% 3% 2% 4% 1% 5% 1% Greenfish 3% 3% 2% 2% 2% 2% 1% 3% 1% Prickly redfish 1% 1% 3% 3% 2% 2% 0% 3% 1% Deepwater blackfish 1% 1% Deep water redfish 1% 1% 1% 1% 1% 2% 0% 0% 0% Surf redfish 16% 8% 3% 3% 1% 2% 8% 16% 3% Blackfish 2% 2% 4% 4% 4% 4% 0% 4% 1% Curryfish 5% 5% 5% 5% 2% 1% 2% Stonefish 2% 2% 2% 2% 2% 7% 5% Tigerfish 3% 1% 9% 8% 9% 9% 6% 11% 9% Snakefish 12% 5% 14% 13% 21% 14% 18% 0% 48% Peanutfish 0% 0% 0% 0% 0% 0% 1% Chalkfish 6% 5% 5% 4% 7% 0% 7% Flowerfish 1% 0% 0% 0% 0% 0% 0% 0% Brown sandfish 15% 3% 7% 9% 6% 5% 24% 2% 5% Amberfish 1% 6% 6% 6% 6% 6% 4% 0% Lollyfish 28% 50% 25% 24% 25% 25% 18% 25% 7% Elephant trunkfish 1% 1% 3% 3% 3% 3% 3% 6% 3% Pinkfish 3% 3% 1% 1% 1% 1% 1% 0% 0%

Appendix 13 – Wet weight equivalent of average (over fifteen years) production per Province (kgs)
1 2 3 4 5 6 7 8 9 Province Western
(Fly) Gulf Central Sandaun (W
Sepik) East Sepik Madang Manus West New
Britain East New Britain
main town Daru Kerema Port Moresby
Vanimo Wewak Madang Lorengau Kimbe Kokopo
Sandfish 12,369 -‐ -‐ -‐ 1,585 3,742 259,287 22,361 16,561 White teatfish -‐ -‐ -‐ -‐ -‐ -‐ -‐ -‐ -‐ Black teatfish 58 -‐ -‐ -‐ 550 1,173 29,682 1,453 4,521 Greenfish 3,454 -‐ -‐ -‐ 1,333 3,149 44,759 1,578 6,159 Prickly redfish -‐ -‐ -‐ -‐ 1,313 2,025 41,972 7,995 5,910 Deepwater blackfish -‐ -‐ -‐ -‐ -‐ -‐ -‐ -‐ -‐ Deep water redfish -‐ -‐ -‐ -‐ -‐ -‐ -‐ -‐ 218 Surf redfish 20,143 -‐ -‐ -‐ 3,023 18,782 66,988 78,473 12,891 Blackfish -‐ -‐ -‐ -‐ 307 223 7,028 826 698 Curryfish 21,995 -‐ -‐ -‐ -‐ 7,370 175,397 94,178 30,824 Stonefish -‐ -‐ -‐ -‐ -‐ -‐ -‐ -‐ -‐ Tigerfish -‐ -‐ -‐ -‐ 390 6,179 151,294 48,033 31,697 Snakefish -‐ -‐ -‐ -‐ -‐ 4,354 65,302 54,054 10,372 Peanutfish -‐ -‐ -‐ -‐ -‐ -‐ -‐ -‐ -‐ Chalkfish -‐ -‐ -‐ -‐ -‐ 2,049 57,582 6,427 9,795 Flowerfish -‐ -‐ -‐ -‐ -‐ 1,687 626 20,370 6,783 Brown sandfish -‐ -‐ -‐ -‐ -‐ 2,945 90,220 36,584 15,187 Amberfish -‐ -‐ -‐ -‐ 26 3,815 4,291 9,566 9,809 Lollyfish -‐ -‐ -‐ -‐ 2,374 29,394 109,999 170,528 66,949 Elephant trunkfish -‐ -‐ -‐ -‐ 170 786 10,271 2,139 2,383 Pinkfish -‐ -‐ -‐ -‐ 31 1,290 764 231,399 2,275

10 11 12 13 14 15 16 17 18 Province New Ireland Morobe Oro
(Northern) Milne Bay AR Bou-‐
gainville Choiseul Western Isabel Central
main town Kavieng Lae Popon-‐detta
Alotau Arawa Gizo
Sandfish 42,860 27,996 111,134 103,624 237,328 3,137 5,318 1,935 379 White teatfish 85,511 12,985 22,011 654,378 8,546 96,689 196,708 53,682 8,181 Black teatfish 7,238 918 1,412 73,325 4,956 14,503 32,785 5,965 1,169
Greenfish 2,174 1,613 6,492 246,244 1,652 3,251 5,511 2,005 393 Prickly redfish 19,887 3,982 4,963 328,811 4,330 1,898 3,217 1,171 229
Deepwater blackfish -‐ -‐ -‐ -‐ -‐ 2,110 3,577 2,169 255 Deep water redfish -‐ -‐ -‐ -‐ -‐ 17,580 23,843 10,845 2,975
Surf redfish 51,453 4,866 9,499 98,386 12,568 -‐ -‐ -‐ -‐ Blackfish 3,559 1,845 2,310
98,576
2,798 19,338 19,810 11,929 3,117
Curryfish 171,947 8,083 14,461 298,335
4,715
29,007 29,418 17,894 4,675
Stonefish -‐ -‐ -‐ -‐ -‐ 21,096 23,158 13,014 3,400 Tigerfish 54,866 7,382 13,385 452,036 22,841 29,007 49,208 17,894 4,675 Snakefish 122,419 2,578 3,528 35,539 3,224 64,459 87,426 44,489 7,791 Peanutfish -‐ -‐ -‐ -‐ -‐ 38,676 49,177 13,235 3,506 Chalkfish 48,270 5,219 25,398 315,382 913 -‐ -‐ -‐ -‐
Flowerfish 8,786 2,904 -‐ -‐ -‐ -‐ -‐ -‐ -‐ Brown sandfish 101,667 9,364 482 280,145 19,819 90,243 152,995 55,885 8,570
Amberfish 22,301 27,142 1,156 421,585 8,307 34,090 57,795 29,823 5,843 Lollyfish 15,330 9,574 33,386 529,342 10,428 335,189 611,982 228,757 48,306
Elephant trunkfish 10,509 4,741 1,567 154,573 1,077 19,338 26,692 11,929 2,337 Pinkfish 17,806 1,277 -‐ -‐ -‐ 42,194 71,534 26,029 5,100
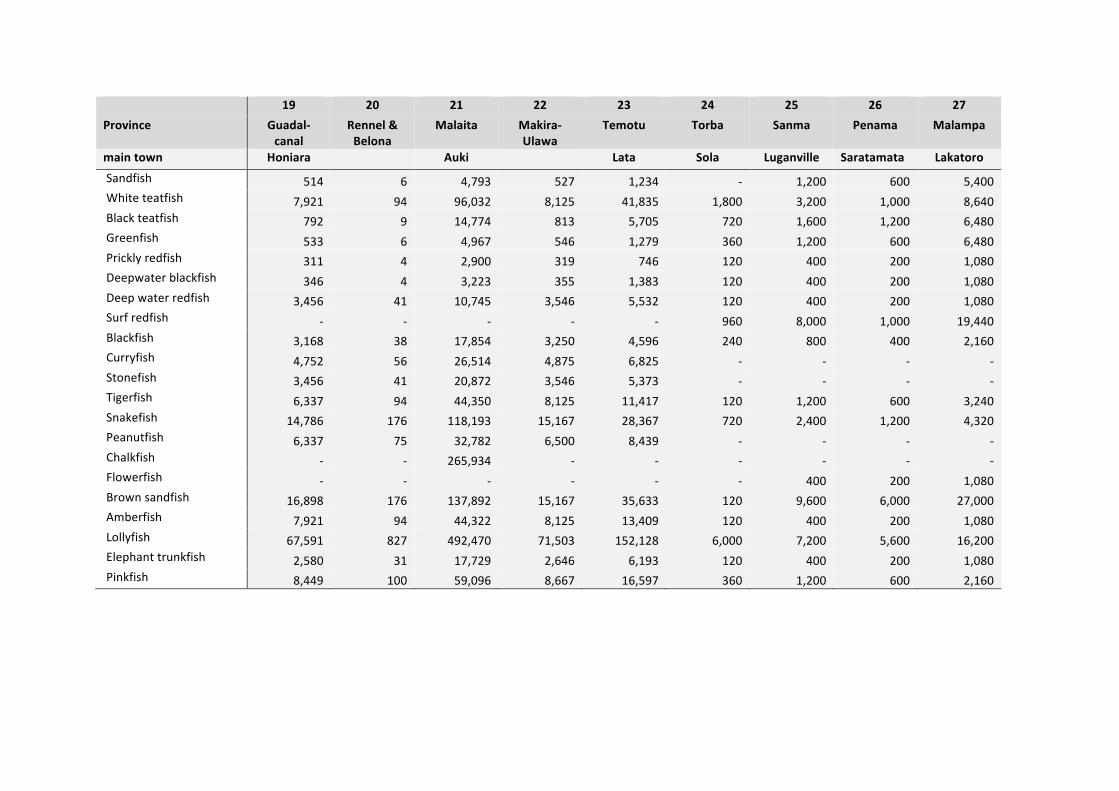
19 20 21 22 23 24 25 26 27 Province Guadal-‐
canal Rennel & Belona
Malaita Makira-‐Ulawa
Temotu Torba Sanma Penama Malampa
main town Honiara Auki Lata Sola Luganville Saratamata Lakatoro
Sandfish 514 6 4,793 527 1,234 -‐ 1,200 600 5,400 White teatfish 7,921 94 96,032 8,125 41,835 1,800 3,200 1,000 8,640 Black teatfish 792 9 14,774 813 5,705 720 1,600 1,200 6,480 Greenfish 533 6 4,967 546 1,279 360 1,200 600 6,480 Prickly redfish 311 4 2,900 319 746 120 400 200 1,080 Deepwater blackfish 346 4 3,223 355 1,383 120 400 200 1,080 Deep water redfish 3,456 41 10,745 3,546 5,532 120 400 200 1,080 Surf redfish -‐ -‐ -‐ -‐ -‐ 960 8,000 1,000 19,440 Blackfish 3,168 38 17,854 3,250 4,596 240 800 400 2,160 Curryfish 4,752 56 26,514 4,875 6,825 -‐ -‐ -‐ -‐ Stonefish 3,456 41 20,872 3,546 5,373 -‐ -‐ -‐ -‐ Tigerfish 6,337 94 44,350 8,125 11,417 120 1,200 600 3,240 Snakefish 14,786 176 118,193 15,167 28,367 720 2,400 1,200 4,320 Peanutfish 6,337 75 32,782 6,500 8,439 -‐ -‐ -‐ -‐ Chalkfish -‐ -‐ 265,934 -‐ -‐ -‐ -‐ -‐ -‐ Flowerfish -‐ -‐ -‐ -‐ -‐ -‐ 400 200 1,080 Brown sandfish 16,898 176 137,892 15,167 35,633 120 9,600 6,000 27,000 Amberfish 7,921 94 44,322 8,125 13,409 120 400 200 1,080 Lollyfish 67,591 827 492,470 71,503 152,128 6,000 7,200 5,600 16,200 Elephant trunkfish 2,580 31 17,729 2,646 6,193 120 400 200 1,080 Pinkfish 8,449 100 59,096 8,667 16,597 360 1,200 600 2,160
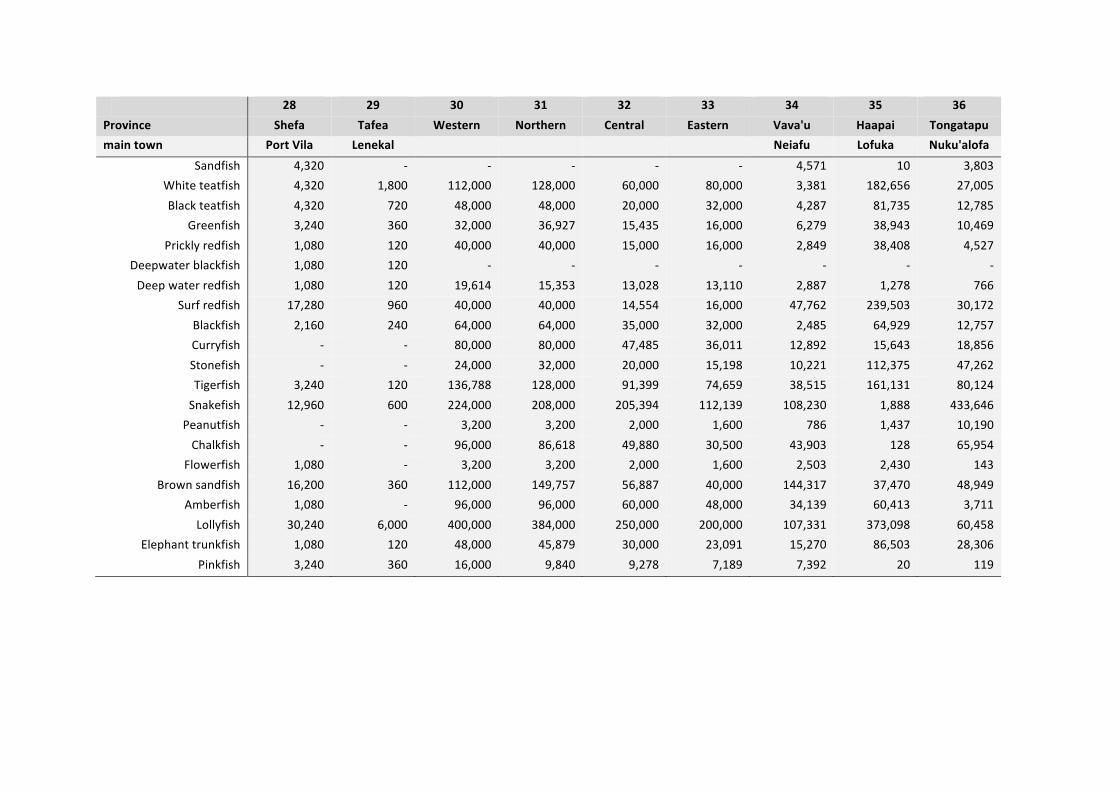
28 29 30 31 32 33 34 35 36 Province Shefa Tafea Western Northern Central Eastern Vava'u Haapai Tongatapu main town Port Vila Lenekal Neiafu Lofuka Nuku'alofa
Sandfish 4,320 -‐ -‐ -‐ -‐ -‐ 4,571 10 3,803 White teatfish 4,320 1,800 112,000 128,000 60,000 80,000 3,381 182,656 27,005 Black teatfish 4,320 720 48,000 48,000 20,000 32,000 4,287 81,735 12,785
Greenfish 3,240 360 32,000 36,927 15,435 16,000 6,279 38,943 10,469 Prickly redfish 1,080 120 40,000 40,000 15,000 16,000 2,849 38,408 4,527
Deepwater blackfish 1,080 120 -‐ -‐ -‐ -‐ -‐ -‐ -‐ Deep water redfish 1,080 120 19,614 15,353 13,028 13,110 2,887 1,278 766
Surf redfish 17,280 960 40,000 40,000 14,554 16,000 47,762 239,503 30,172 Blackfish 2,160 240 64,000 64,000 35,000 32,000 2,485 64,929 12,757 Curryfish -‐ -‐ 80,000 80,000 47,485 36,011 12,892 15,643 18,856 Stonefish -‐ -‐ 24,000 32,000 20,000 15,198 10,221 112,375 47,262 Tigerfish 3,240 120 136,788 128,000 91,399 74,659 38,515 161,131 80,124 Snakefish 12,960 600 224,000 208,000 205,394 112,139 108,230 1,888 433,646 Peanutfish -‐ -‐ 3,200 3,200 2,000 1,600 786 1,437 10,190 Chalkfish -‐ -‐ 96,000 86,618 49,880 30,500 43,903 128 65,954
Flowerfish 1,080 -‐ 3,200 3,200 2,000 1,600 2,503 2,430 143 Brown sandfish 16,200 360 112,000 149,757 56,887 40,000 144,317 37,470 48,949
Amberfish 1,080 -‐ 96,000 96,000 60,000 48,000 34,139 60,413 3,711 Lollyfish 30,240 6,000 400,000 384,000 250,000 200,000 107,331 373,098 60,458
Elephant trunkfish 1,080 120 48,000 45,879 30,000 23,091 15,270 86,503 28,306 Pinkfish 3,240 360 16,000 9,840 9,278 7,189 7,392 20 119
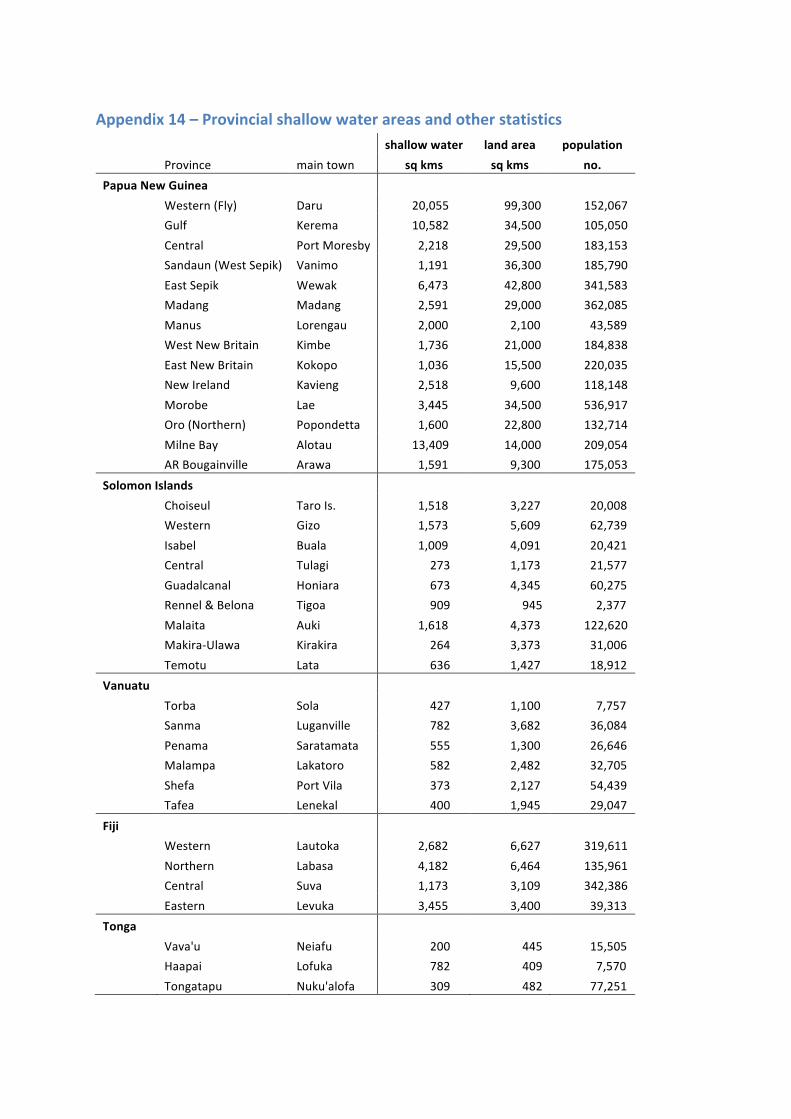
Appendix 14 – Provincial shallow water areas and other statistics
shallow water land area population
Province main town sq kms sq kms no.
Papua New Guinea
Western (Fly) Daru 20,055 99,300 152,067
Gulf Kerema 10,582 34,500 105,050
Central Port Moresby 2,218 29,500 183,153
Sandaun (West Sepik) Vanimo 1,191 36,300 185,790
East Sepik Wewak 6,473 42,800 341,583
Madang Madang 2,591 29,000 362,085
Manus Lorengau 2,000 2,100 43,589
West New Britain Kimbe 1,736 21,000 184,838
East New Britain Kokopo 1,036 15,500 220,035
New Ireland Kavieng 2,518 9,600 118,148
Morobe Lae 3,445 34,500 536,917
Oro (Northern) Popondetta 1,600 22,800 132,714
Milne Bay Alotau 13,409 14,000 209,054
AR Bougainville Arawa 1,591 9,300 175,053
Solomon Islands
Choiseul Taro Is. 1,518 3,227 20,008
Western Gizo 1,573 5,609 62,739
Isabel Buala 1,009 4,091 20,421
Central Tulagi 273 1,173 21,577
Guadalcanal Honiara 673 4,345 60,275
Rennel & Belona Tigoa 909 945 2,377
Malaita Auki 1,618 4,373 122,620
Makira-‐Ulawa Kirakira 264 3,373 31,006
Temotu Lata 636 1,427 18,912
Vanuatu
Torba Sola 427 1,100 7,757
Sanma Luganville 782 3,682 36,084
Penama Saratamata 555 1,300 26,646
Malampa Lakatoro 582 2,482 32,705
Shefa Port Vila 373 2,127 54,439
Tafea Lenekal 400 1,945 29,047
Fiji
Western Lautoka 2,682 6,627 319,611
Northern Labasa 4,182 6,464 135,961
Central Suva 1,173 3,109 342,386
Eastern Levuka 3,455 3,400 39,313
Tonga
Vava'u Neiafu 200 445 15,505
Haapai Lofuka 782 409 7,570
Tongatapu Nuku'alofa 309 482 77,251

Notes:
Shallow water area has been crudely extracted from low resolution NASA seaWIFS bathymetry graphics – from http://reefgis.reefbase.org/datadefinitions.aspx?group=RGWRSSEAWIFS – broadly equivalent to a depth contour of 20m
Land area taken from
Population data from

Appendix 15 – Average (over fifteen years) value of exports, valued at estimated 2012 Grade A prices paid by exporters for finished product (US$’000s)
1 2 3 4 5 6 7 8 9
Province Western (Fly)
Gulf Central Sandaun (W Sepik)
East Sepik Madang Manus West New Britain
East New Britain
main town Daru Kerema Port Moresby
Vanimo Wewak Madang Lorengau Kimbe Kokopo
Sandfish $2,773 $1 $6 $817 $146 $56
White teatfish $83 $11 $25 $1,738 $150 $111
Black teatfish $0 $2 $5 $126 $6 $19
Greenfish $5 $2 $5 $67 $2 $9
Prickly redfish $3 $5 $94 $18 $13
Deepwater blackfish
Deep water redfish $1
Surf redfish $43 $7 $40 $144 $169 $28
Blackfish $0 $0 $8 $1 $1
Curryfish $18 $6 $140 $75 $25
Stonefish
Tigerfish $0 $5 $118 $38 $25
Snakefish $2 $31 $25 $5
Peanutfish
Chalkfish $1 $32 $4 $5
Flowerfish $1 $0 $11 $4
Brown sandfish $2 $76 $31 $13
Amberfish $0 $2 $2 $5 $5
Lollyfish $1 $10 $37 $57 $22
Elephant trunkfish $0 $1 $11 $2 $3

Pinkfish $0 $0 $0 $39 $0
total value $2,922 $27 $116 $3,443 $779 $345
average unit value/kg $86 $47 $30 $51 $25 $32

10 11 12 13 14 15 16 17 18 Province New Ireland Morobe Oro
(Northern) Milne Bay AR Bou-‐
gainville Choiseul Western Isabel Central
main town Kavieng Lae Popon-‐detta Alotau Arawa Gizo
Sandfish $193 $126 $500 $466 $1,068 $14 $24 $9 $2 White teatfish $573 $87 $148 $4,387 $57 $648 $1,319 $360 $55 Black teatfish $31 $4 $6 $311 $21 $62 $139 $25 $5 Greenfish $3 $2 $10 $369 $2 $5 $8 $3 $1 Prickly redfish $44 $9 $11 $735 $10 $4 $7 $3 $1 Deepwater blackfish $5 $9 $5 $1 Deep water redfish $43 $59 $27 $7 Surf redfish $111 $10 $20 $212 $27 Blackfish $4 $2 $3 $118 $3 $23 $24 $14 $4 Curryfish $138 $6 $12 $239 $4 $23 $24 $14 $4 Stonefish $23 $25 $14 $4 Tigerfish $43 $6 $10 $354 $18 $23 $38 $14 $4 Snakefish $57 $1 $2 $17 $2 $30 $41 $21 $4 Peanutfish $22 $28 $7 $2 Chalkfish $27 $3 $14 $177 $1 Flowerfish $5 $2 Brown sandfish $85 $8 $0 $235 $17 $76 $128 $47 $7 Amberfish $12 $15 $1 $236 $5 $19 $32 $17 $3 Lollyfish $5 $3 $11 $177 $3 $112 $205 $77 $16 Elephant trunkfish $12 $5 $2 $173 $1 $22 $30 $13 $3 Pinkfish $3 $0 $7 $12 $4 $1
total value $1,347 $291 $750 $8,204 $1,238 $1,161 $2,151 $674 $121 average unit value/kg $36 $44 $62 $40 $72 $30 $33 $28 $26

19 20 21 22 23 24 25 26 27 Province Guadal-‐
canal Rennel & Belona
Malaita Makira-‐Ulawa
Temotu Torba Sanma Penama Malampa
main town Honiara Auki Lata Sola Luganville Saratamata Lakatoro
Sandfish $2 $0 $22 $2 $6 $5 $3 $24 White teatfish $53 $1 $644 $54 $280 $8 $13 $4 $36 Black teatfish $3 $0 $63 $3 $24 $2 $4 $3 $17 Greenfish $1 $0 $7 $1 $2 $1 $3 $2 $16 Prickly redfish $1 $0 $6 $1 $2 $0 $1 $0 $2 Deepwater blackfish $1 $0 $8 $1 $3 $0 $1 $0 $2 Deep water redfish $8 $0 $26 $9 $14 $0 $1 $0 $2 Surf redfish $2 $16 $2 $38 Blackfish $4 $0 $21 $4 $6 $0 $1 $0 $2 Curryfish $4 $0 $21 $4 $5 Stonefish $4 $0 $22 $4 $6 Tigerfish $5 $0 $35 $6 $9 $0 $1 $1 $3 Snakefish $7 $0 $55 $7 $13 $1 $2 $1 $3 Peanutfish $4 $0 $18 $4 $5 Chalkfish $149 Flowerfish $0 $0 $1 Brown sandfish $14 $0 $116 $13 $30 $0 $7 $4 $19 Amberfish $4 $0 $25 $5 $7 $0 $0 $0 $1 Lollyfish $23 $0 $165 $24 $51 $3 $4 $3 $9 Elephant trunkfish $3 $0 $20 $3 $7 $0 $0 $0 $1 Pinkfish $1 $0 $10 $1 $3 $0 $0 $0 $1 total value $142 $2 $1,434 $146 $473 $18 $60 $25 $178 average unit value/kg $22 $22 $24 $22 $31 $29 $30 $25 $33
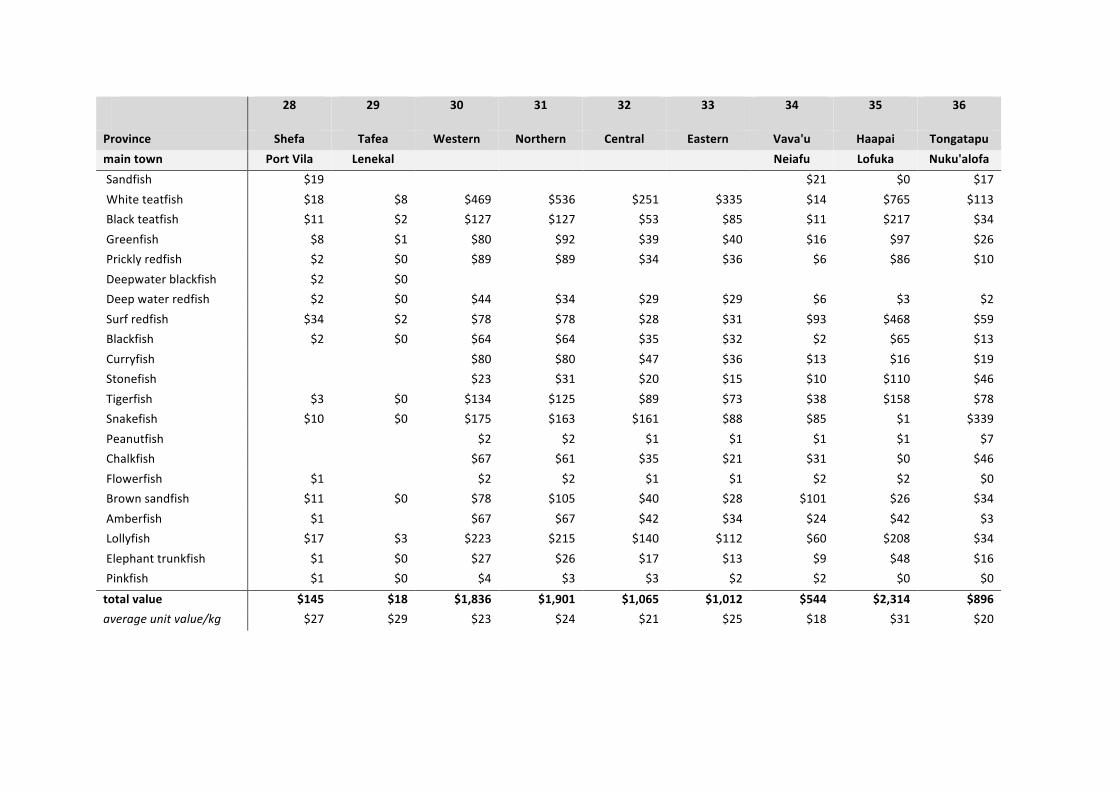
28 29 30 31 32 33 34 35 36
Province Shefa Tafea Western Northern Central Eastern Vava'u Haapai Tongatapu main town Port Vila Lenekal Neiafu Lofuka Nuku'alofa Sandfish $19 $21 $0 $17 White teatfish $18 $8 $469 $536 $251 $335 $14 $765 $113 Black teatfish $11 $2 $127 $127 $53 $85 $11 $217 $34 Greenfish $8 $1 $80 $92 $39 $40 $16 $97 $26 Prickly redfish $2 $0 $89 $89 $34 $36 $6 $86 $10 Deepwater blackfish $2 $0 Deep water redfish $2 $0 $44 $34 $29 $29 $6 $3 $2 Surf redfish $34 $2 $78 $78 $28 $31 $93 $468 $59 Blackfish $2 $0 $64 $64 $35 $32 $2 $65 $13 Curryfish $80 $80 $47 $36 $13 $16 $19 Stonefish $23 $31 $20 $15 $10 $110 $46 Tigerfish $3 $0 $134 $125 $89 $73 $38 $158 $78 Snakefish $10 $0 $175 $163 $161 $88 $85 $1 $339 Peanutfish $2 $2 $1 $1 $1 $1 $7 Chalkfish $67 $61 $35 $21 $31 $0 $46 Flowerfish $1 $2 $2 $1 $1 $2 $2 $0 Brown sandfish $11 $0 $78 $105 $40 $28 $101 $26 $34 Amberfish $1 $67 $67 $42 $34 $24 $42 $3 Lollyfish $17 $3 $223 $215 $140 $112 $60 $208 $34 Elephant trunkfish $1 $0 $27 $26 $17 $13 $9 $48 $16 Pinkfish $1 $0 $4 $3 $3 $2 $2 $0 $0
total value $145 $18 $1,836 $1,901 $1,065 $1,012 $544 $2,314 $896 average unit value/kg $27 $29 $23 $24 $21 $25 $18 $31 $20

Appendix 16 – Main species, by purchase value, per Province, contributing >75 % to overall Provincial value
1 2 3 4 5 6 7 8 9 Province Western
(Fly) Gulf Central Sandaun (W
Sepik) East Sepik Madang Manus West New
Britain East New Britain
main town Daru Kerema P Moresby Vanimo Wewak Madang Lorengau Kimbe Kokopo
Sandfish 1 5 2 3 2 White teatfish 1 2 1 2 1 Black teatfish Greenfish Prickly redfish 3 Deepwater blackfish Deep water redfish Surf redfish 2 1 3 1 3 Blackfish Curryfish 4 4 5 Stonefish Tigerfish 4 Snakefish Peanutfish Chalkfish Flowerfish Brown sandfish Amberfish Lollyfish 3 5 6 Elephant trunkfish Pinkfish
total value $2,922 $27 $116 $3,443 $779 $345
average unit value/kg $86 $47 $30 $51 $25 $32
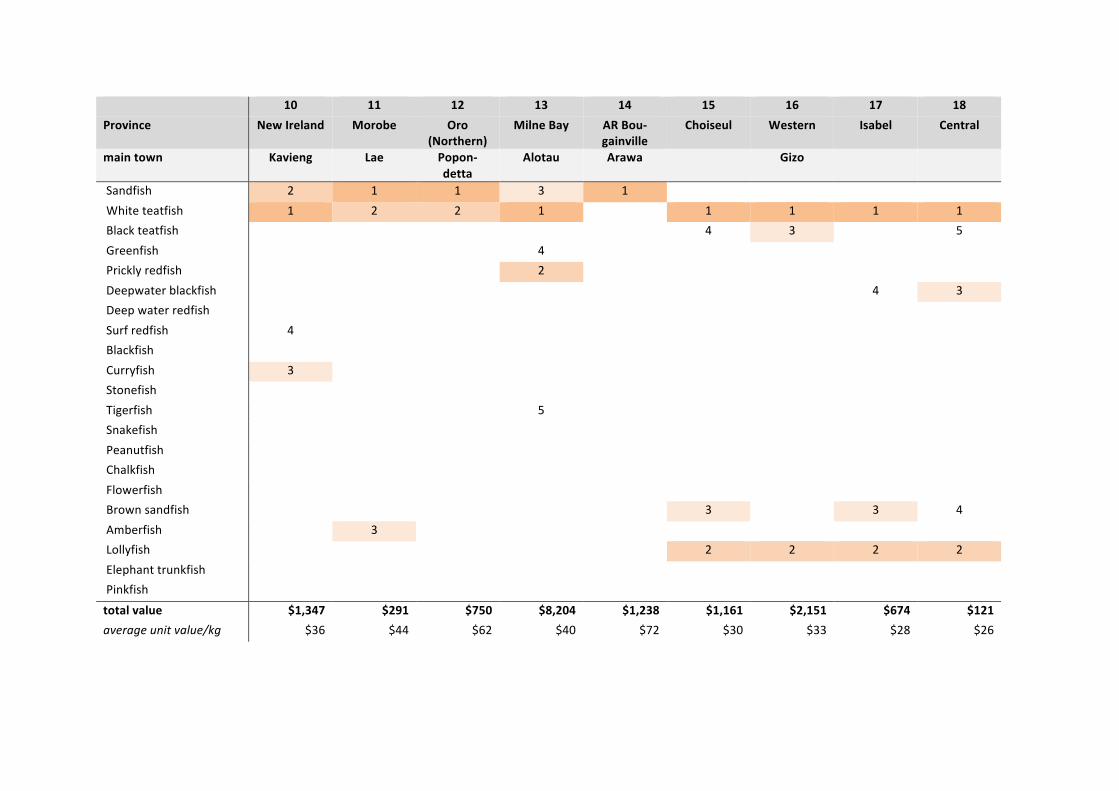
10 11 12 13 14 15 16 17 18 Province New Ireland Morobe Oro
(Northern) Milne Bay AR Bou-‐
gainville Choiseul Western Isabel Central
main town Kavieng Lae Popon-‐detta
Alotau Arawa Gizo
Sandfish 2 1 1 3 1 White teatfish 1 2 2 1 1 1 1 1 Black teatfish 4 3 5 Greenfish 4 Prickly redfish 2 Deepwater blackfish 4 3 Deep water redfish Surf redfish 4 Blackfish Curryfish 3 Stonefish Tigerfish 5 Snakefish Peanutfish Chalkfish Flowerfish Brown sandfish 3 3 4 Amberfish 3 Lollyfish 2 2 2 2 Elephant trunkfish Pinkfish
total value $1,347 $291 $750 $8,204 $1,238 $1,161 $2,151 $674 $121 average unit value/kg $36 $44 $62 $40 $72 $30 $33 $28 $26

19 20 21 22 23 24 25 26 27 Province Guadal-‐
canal Rennel & Belona
Malaita Makira-‐Ulawa
Temotu Torba Sanma Penama Malampa
main town Honiara Auki Lata Sola Luganville Saratamata Lakatoro
Sandfish 4 5 3 White teatfish 1 1 1 1 1 1 2 1 2 Black teatfish 3 5 3 5 Greenfish Prickly redfish Deepwater blackfish 4 4 4 Deep water redfish Surf redfish 4 1 6 1 Blackfish Curryfish Stonefish Tigerfish 6 6 6 Snakefish 5 5 5 Peanutfish Chalkfish 3 Flowerfish Brown sandfish 3 3 4 3 3 3 2 4 Amberfish Lollyfish 2 2 2 2 2 2 4 Elephant trunkfish Pinkfish total value $142 $2 $1,434 $146 $473 $18 $60 $25 $178 average unit value/kg $22 $22 $24 $22 $31 $29 $30 $25 $33
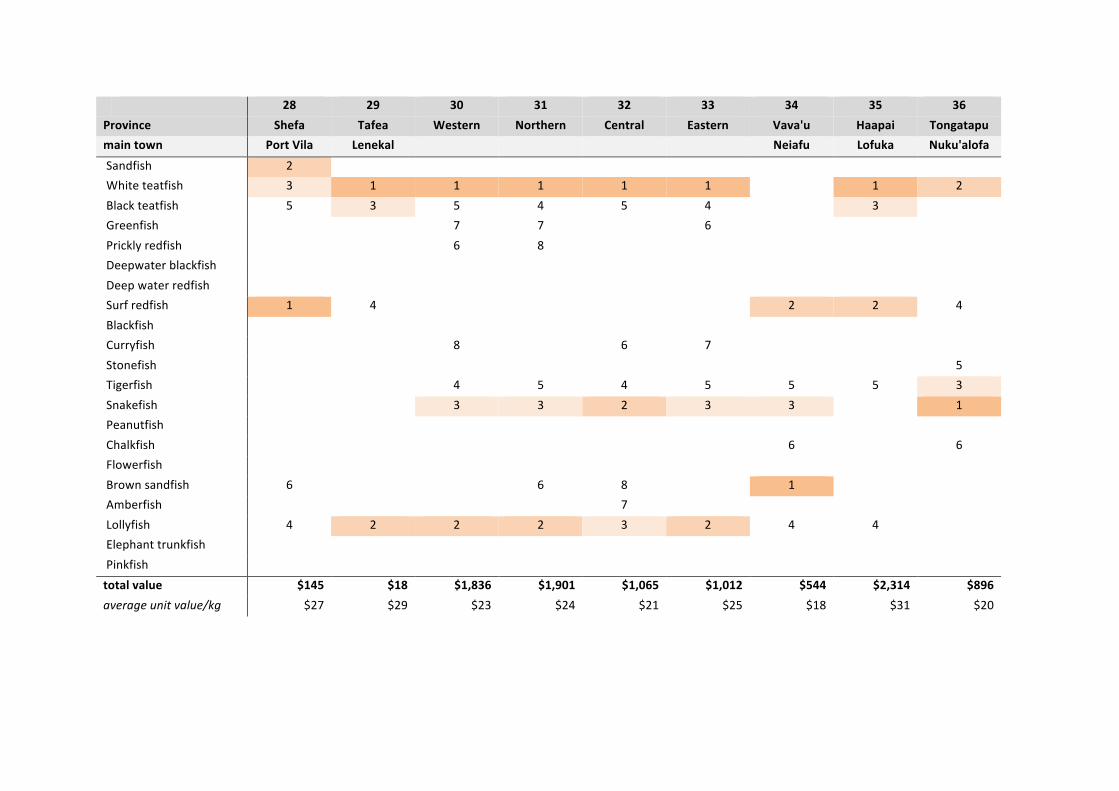
28 29 30 31 32 33 34 35 36 Province Shefa Tafea Western Northern Central Eastern Vava'u Haapai Tongatapu main town Port Vila Lenekal Neiafu Lofuka Nuku'alofa
Sandfish 2 White teatfish 3 1 1 1 1 1 1 2 Black teatfish 5 3 5 4 5 4 3 Greenfish 7 7 6 Prickly redfish 6 8 Deepwater blackfish Deep water redfish Surf redfish 1 4 2 2 4 Blackfish Curryfish 8 6 7 Stonefish 5 Tigerfish 4 5 4 5 5 5 3 Snakefish 3 3 2 3 3 1 Peanutfish Chalkfish 6 6 Flowerfish Brown sandfish 6 6 8 1 Amberfish 7 Lollyfish 4 2 2 2 3 2 4 4 Elephant trunkfish Pinkfish total value $145 $18 $1,836 $1,901 $1,065 $1,012 $544 $2,314 $896 average unit value/kg $27 $29 $23 $24 $21 $25 $18 $31 $20

Fig 1 Probability density functions for revenue (top) and stock status (bottom) 2005 – 2009 estimates (solid line) and 2010-‐2019 projections (dotted line) for Milne Bay Province. Projections under different levels of catch control from no control (far left), catches limited to best estimate MSY and to 0.5 MSY and catches limited to MSY unless the stock is estimated to be depleted, in which catches are limited to 75% of the replacement yield (far right). The past estimates 2005-‐09 are unaffected by the harvest control rule and remain the same in each case, but projection will change. Revenues (catch*price summed over species) is fixed data for 2005-‐09 and therefore represented by horizontal line. Stock status combines the status of all species into a single density function, so the modes tend to represent different species.
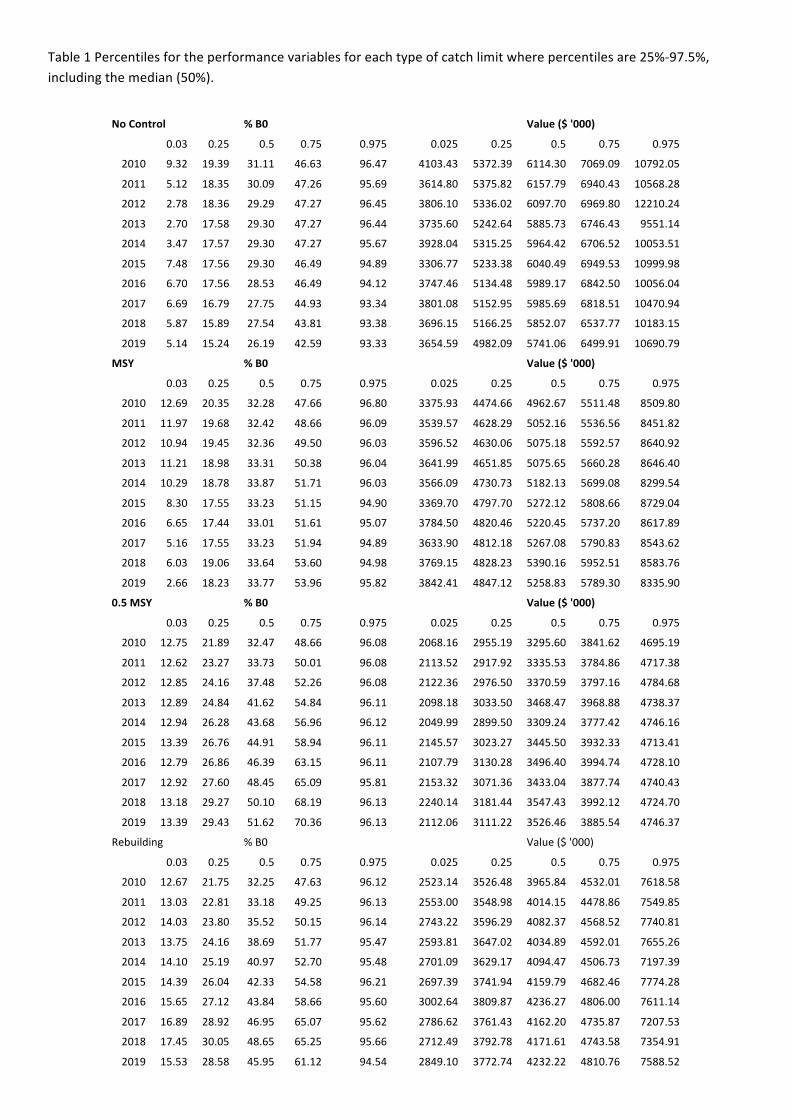
Table 1 Percentiles for the performance variables for each type of catch limit where percentiles are 25%-‐97.5%, including the median (50%).
No Control
% B0
Value ($ '000)
0.03 0.25 0.5 0.75 0.975
0.025 0.25 0.5 0.75 0.975
2010 9.32 19.39 31.11 46.63 96.47
4103.43 5372.39 6114.30 7069.09 10792.05
2011 5.12 18.35 30.09 47.26 95.69
3614.80 5375.82 6157.79 6940.43 10568.28
2012 2.78 18.36 29.29 47.27 96.45
3806.10 5336.02 6097.70 6969.80 12210.24
2013 2.70 17.58 29.30 47.27 96.44
3735.60 5242.64 5885.73 6746.43 9551.14
2014 3.47 17.57 29.30 47.27 95.67
3928.04 5315.25 5964.42 6706.52 10053.51
2015 7.48 17.56 29.30 46.49 94.89
3306.77 5233.38 6040.49 6949.53 10999.98
2016 6.70 17.56 28.53 46.49 94.12
3747.46 5134.48 5989.17 6842.50 10056.04
2017 6.69 16.79 27.75 44.93 93.34
3801.08 5152.95 5985.69 6818.51 10470.94
2018 5.87 15.89 27.54 43.81 93.38
3696.15 5166.25 5852.07 6537.77 10183.15
2019 5.14 15.24 26.19 42.59 93.33
3654.59 4982.09 5741.06 6499.91 10690.79
MSY
% B0
Value ($ '000)
0.03 0.25 0.5 0.75 0.975
0.025 0.25 0.5 0.75 0.975
2010 12.69 20.35 32.28 47.66 96.80
3375.93 4474.66 4962.67 5511.48 8509.80
2011 11.97 19.68 32.42 48.66 96.09
3539.57 4628.29 5052.16 5536.56 8451.82
2012 10.94 19.45 32.36 49.50 96.03
3596.52 4630.06 5075.18 5592.57 8640.92
2013 11.21 18.98 33.31 50.38 96.04
3641.99 4651.85 5075.65 5660.28 8646.40
2014 10.29 18.78 33.87 51.71 96.03
3566.09 4730.73 5182.13 5699.08 8299.54
2015 8.30 17.55 33.23 51.15 94.90
3369.70 4797.70 5272.12 5808.66 8729.04
2016 6.65 17.44 33.01 51.61 95.07
3784.50 4820.46 5220.45 5737.20 8617.89
2017 5.16 17.55 33.23 51.94 94.89
3633.90 4812.18 5267.08 5790.83 8543.62
2018 6.03 19.06 33.64 53.60 94.98
3769.15 4828.23 5390.16 5952.51 8583.76
2019 2.66 18.23 33.77 53.96 95.82
3842.41 4847.12 5258.83 5789.30 8335.90
0.5 MSY
% B0
Value ($ '000)
0.03 0.25 0.5 0.75 0.975
0.025 0.25 0.5 0.75 0.975
2010 12.75 21.89 32.47 48.66 96.08
2068.16 2955.19 3295.60 3841.62 4695.19
2011 12.62 23.27 33.73 50.01 96.08
2113.52 2917.92 3335.53 3784.86 4717.38
2012 12.85 24.16 37.48 52.26 96.08
2122.36 2976.50 3370.59 3797.16 4784.68
2013 12.89 24.84 41.62 54.84 96.11
2098.18 3033.50 3468.47 3968.88 4738.37
2014 12.94 26.28 43.68 56.96 96.12
2049.99 2899.50 3309.24 3777.42 4746.16
2015 13.39 26.76 44.91 58.94 96.11
2145.57 3023.27 3445.50 3932.33 4713.41
2016 12.79 26.86 46.39 63.15 96.11
2107.79 3130.28 3496.40 3994.74 4728.10
2017 12.92 27.60 48.45 65.09 95.81
2153.32 3071.36 3433.04 3877.74 4740.43
2018 13.18 29.27 50.10 68.19 96.13
2240.14 3181.44 3547.43 3992.12 4724.70
2019 13.39 29.43 51.62 70.36 96.13
2112.06 3111.22 3526.46 3885.54 4746.37
Rebuilding
% B0
Value ($ '000)
0.03 0.25 0.5 0.75 0.975
0.025 0.25 0.5 0.75 0.975
2010 12.67 21.75 32.25 47.63 96.12
2523.14 3526.48 3965.84 4532.01 7618.58
2011 13.03 22.81 33.18 49.25 96.13
2553.00 3548.98 4014.15 4478.86 7549.85
2012 14.03 23.80 35.52 50.15 96.14
2743.22 3596.29 4082.37 4568.52 7740.81
2013 13.75 24.16 38.69 51.77 95.47
2593.81 3647.02 4034.89 4592.01 7655.26
2014 14.10 25.19 40.97 52.70 95.48
2701.09 3629.17 4094.47 4506.73 7197.39
2015 14.39 26.04 42.33 54.58 96.21
2697.39 3741.94 4159.79 4682.46 7774.28
2016 15.65 27.12 43.84 58.66 95.60
3002.64 3809.87 4236.27 4806.00 7611.14
2017 16.89 28.92 46.95 65.07 95.62
2786.62 3761.43 4162.20 4735.87 7207.53
2018 17.45 30.05 48.65 65.25 95.66
2712.49 3792.78 4171.61 4743.58 7354.91
2019 15.53 28.58 45.95 61.12 94.54
2849.10 3772.74 4232.22 4810.76 7588.52
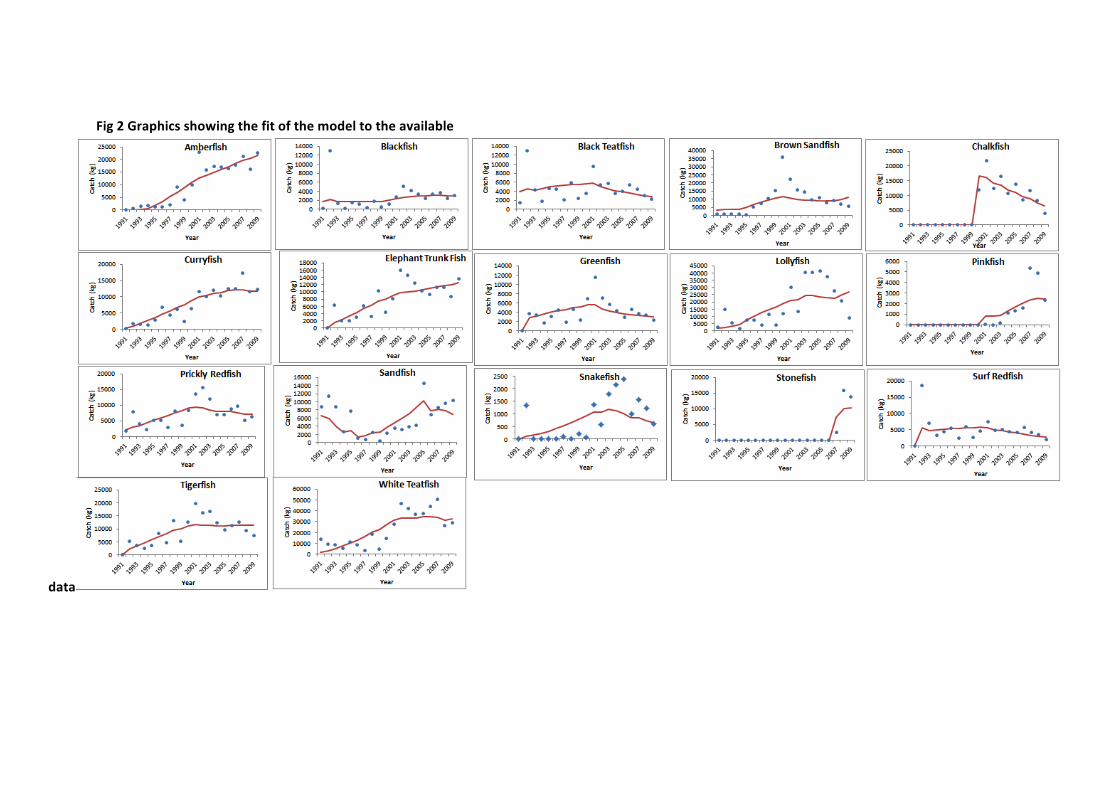
Fig 2 Graphics showing the fit of the model to the available
data
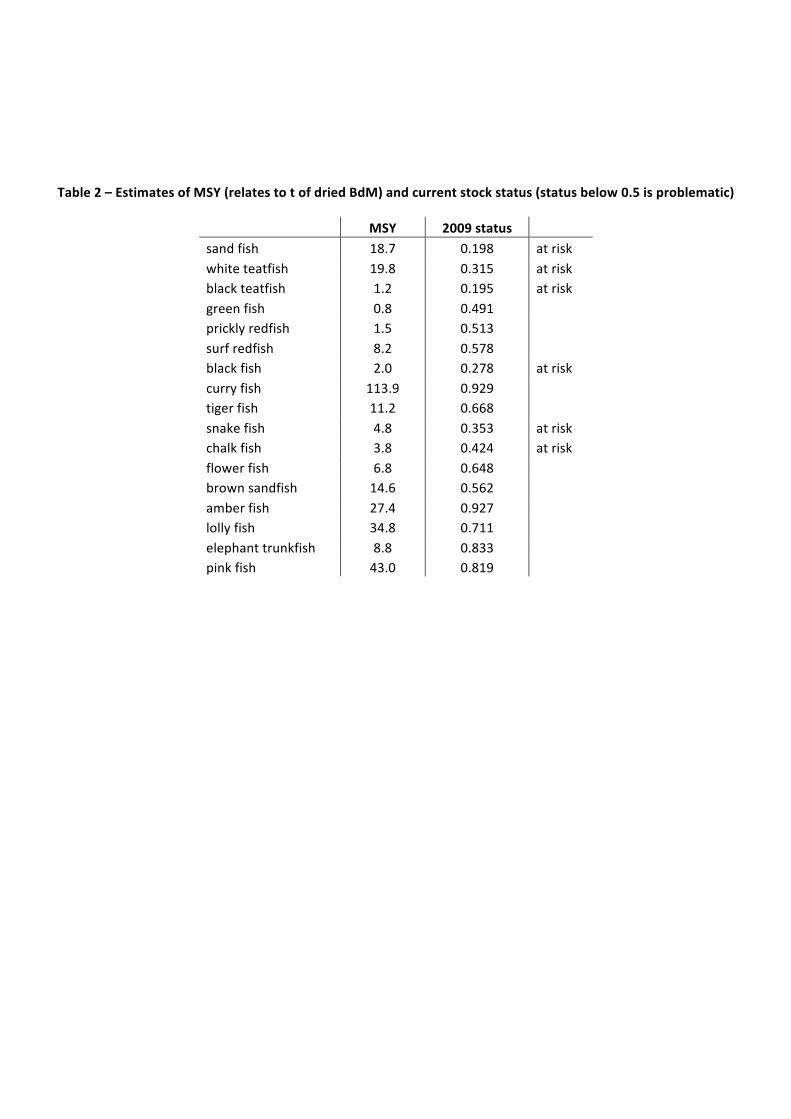
Table 2 – Estimates of MSY (relates to t of dried BdM) and current stock status (status below 0.5 is problematic)
MSY 2009 status
sand fish 18.7 0.198 at risk white teatfish 19.8 0.315 at risk black teatfish 1.2 0.195 at risk green fish 0.8 0.491
prickly redfish 1.5 0.513 surf redfish 8.2 0.578 black fish 2.0 0.278 at risk
curry fish 113.9 0.929 tiger fish 11.2 0.668 snake fish 4.8 0.353 at risk
chalk fish 3.8 0.424 at risk flower fish 6.8 0.648
brown sandfish 14.6 0.562 amber fish 27.4 0.927 lolly fish 34.8 0.711 elephant trunkfish 8.8 0.833 pink fish 43.0 0.819
Appendix 17 -‐ Preliminary Stock Assessment An exploratory stock assessment was conducted on the catch data. Although only landings information is available, the data show very significant contrast with dramatic increases and declines in the landings of species. We looked at using these observations to estimate reference points for these fisheries, such as MSY, as well as developing a platform to test potential harvest control rules through simulation.
The approach that was adopted follows that of Vasconcellos and Cochrane (2005), who used a bioeconomics sub-‐model to estimate likely changes in the underlying fishing effort so that the model fits to catch time series. By this nature, this approach greatly increases the uncertainty in the stock assessment, but should still be able to provide the basis for conducting a risk analysis.
To take advantage of additional information, this model was re-‐formulated to fit to 17 species data simultaneously. Clearly, there is some switching of fishing effort directed among species dependent on the price and catchability. This process is modelled dynamically by allowing exploitation levels to transfer between stocks based on their value and level of depletion.
The model is very simple. The biological population model is the logistic (Schaefer), which requires an unexploited stock size (carrying capacity) and rate of increase parameters for each species. The transfer of effort between stocks is governed by a set of simultaneous linear difference equations which require an overall rate of transfer and a relative value parameter for each species. In addition, there are two “opportunity cost” parameters which govern the transfer of overall effort into and out of these fisheries.
A risk analysis was developed to test possible management controls for their robustness to the considerable uncertainties surrounding these fisheries. For the purposes of risk analysis, the model should ideally be fitted using Bayesian techniques. Unfortunately there was insufficient time to complete this, so a simpler “bootstrap” technique was used to estimate the uncertainty for the risk analysis.
The fitted model was used in projections for Milne Bay province for simple harvest controls rules that might be used. Available controls for the simulations are limited by the available data. Therefore only different types of catch limits were applied. Any effective management control will need to limit catches, but this might achieved in a variety of ways, such as effort limits, minimum size, closed areas and closed seasons. In this case only the effect of such controls on total catch weight was considered.
The projections incorporated parameter uncertainty for the 17 species as well as random catch variation estimated from the data. Part of the evaluation of a harvest control rule should be to measure its performance in coping with this uncertainty. All projections were limited to 10 years for this analysis and for this assessment only 550 stochastic projections could be completed in the time available.
Results and discussion
Two simple measures of performance were used to integrate information across species (Fig. 1).

1. The catch revenue (sum over species of catch*price) represents the fisher income, but does not account for costs. This will tend to overestimate the value of the fishery when the stock is depleted and catching costs are high.
2. The stock status is the current biomass as a proportion of the unexploited stock biomass (B0). In this model, MSY is at 50% B0. Because several species need to be considered, a measure of overall performance can combine these species into single measures based on the probability that any stock is overfished or by averaging the stock status across stocks, for example.
In this preliminary analysis, four harvest control rules were considered. These were projections with no control, and three alternative levels of catch control. Catches were limited to the “best estimate” MSY, and 50% of this value, which might be considered highly precautionary. Finally, a more sensible control was considered, where stocks considered “not overfished” from the assessment, were limited to catches at the MSY level, whereas stocks that were overfished (B2009 < 50% B0) were subjected to a fixed catch limited based on 75% replacement yield for the best fit model to allow 10 years to rebuild.
None of the harvest control rules considered were dynamic in the sense of monitoring and responding to the outcome, where the control is adjusted dependent on variables monitoring the status of the stock. This type of rule would be recommended if possible.
In general, risks of depletion are much higher with no controls (Fig. 1), with significant probability that some stocks could be depleted to very low levels. However, blanket reductions in catch may improve status, but would result in significant reductions in income and are unlikely to be acceptable.
The most effective harvest control rule includes the rebuilding, which should prevent stocks being depleted to very low levels. However, even in this case, rebuilding to MSY is not guaranteed mainly because MSY and replacement yield cannot be well estimated for these stocks. It is also noticeable any catch limit has a probability of being above the true MSY level, at which point it becomes ineffective. Setting the catch limit lower will decrease the chance of overfishing, but with significant loss in potential fishing opportunities. With low opportunity costs, the predicted revenue is likely to be related to the fisher income and over a 5 year period this is likely to be highest if no controls are applied. Relying fixed static catch limits by themselves is therefore unlikely to be successful.
Reference
Vasconcellos, M. and Cochrane, K. (2005) Overview of World Status of Data-‐Limited Fisheries: Inferences from Landings Statistics. Fisheries Assessment and Management in Data-‐Limited Situations. Alaska Sea Grant College Program. AK-‐SG-‐05-‐02, 2005.

Appendix 18 – Identification of priority requirements to support Provincial and local marine resource management Priority co-‐management activities and roles of government and communities in a community-‐based fisheries management system for Melanesia. The activities are listed in numerical order of priority and minimum essential activities are marked by *
Activity1 Government / province Community / local Notes
Information provision
1. Recognize and promote importance of local and traditional knowledge, tenure systems and governance institutions*
2. Ensure scientific/best practice information and advice is available to all fishing communities. This includes understanding of national/sub-‐national rules and their rationale*
3. Develop and maintain systems to ensure information flow and feedback between communities and government agencies as well as within communities (this will likely involve use of decentralized subnational/provincial approaches and community agents)
4. Record and prioritize feedback on emerging issues, community management activities and salient results or experiences
5. Maintain centralized and accessible records on licenses, exports, prices, markets landings and other useful information for management decisions
6. Specific surveys, stock assessments and support to community monitoring where these are vital to the success of community management or national policy priorities.
1. Community maintains, uses and develops (where necessary) local and traditional knowledge, tenure systems and governance institutions*.
2. Community performs local observations and issue identification
3. Community information collection and recording,(or more systematic monitoring in the rare cases where this is appropriate)
a. Government and partners need to determine the most useful advice and information to be provided to communities based on best available information, experience and national policy. This information should reach all coastal communities and cost effective strategies to achieve this will need to be developed suitable to the local context.
b. Cost intensive research and surveys should kept to a minimum and only carried out where essential to address a stock crisis or a particular emerging issue. Such research should be robustly designed with outside advice as appropriate and the results shared with the communities in a prompt and clear fashion.
c. The feedback systems allow early detection of emerging issues and form the basis for prioritization of remaining departmental budgets to address specific fisheries issues. Feedback also allows assessment of the extent that communities are attempting to address issues, the severity of these and on that basis whether the communities warrant further potential interventions such as increased market access, FADs or seaweed farming.
Management (Formulation, dissemination and implementation of management policy and rules)
1. Secure and maintain political will and support [communicating the importance of inshore fisheries and the role of community governance to national government]*
2. Provide / develop national and sub-‐national policy frameworks with clear objectives and in longer term, enabling legislation and institutions, based on experiences and feedback from community and other stakeholders*
3. Promote, advise on or support community implementation
1. Discuss and gauge state of resources over time and highlight any emerging negative trends in the light of traditional knowledge and outside advice and experience*
2. Implement, track and modify simple community rules as and if appropriate to address priority identified problems and
a.

of management measures (eg temporary closures, or fishing rules where communities have not set up their own) based on prioritized requests and community need and commitment
4. Support decentralized positions including provincial/subnational staff and networks, community agents/ wardens/ authorized officers to fulfill key roles
5. Coordination and liaison between local and other levels and across sectors to ensure ecosystem approach
6. Address specific priority fisheries problems including potential access to higher cost Fisheries projects such as FADs or increased access to markets which depend on functioning community management
community objectives/purposes* 3. Representation of issues,
objectives and progress to other communities, levels of government or stakeholders to promote improved practice between communities and inform national and sub-‐national policy.
Monitoring and enforcement
1. Monitor and enforce at central locations including marketing of illegal fish, import and sale of illegal fishing gear, export quotas, activities and practices of middle-‐men, size restrictions and license conditions*
2. Training and support of local wardens or honorary officers as well as their nearest liaisons in Fisheries and Police departments*
3. Liaise with police and courts to build well informed and proactive enforcement networks or partnership
4. Enforcement or conflict management support where possible for issues that exceed community capacity such as poaching from foreign vessels
5. Engage community leaders to identify and control BdM trader agents living in communities purchasing BdM during closed seasons
1. Monitor and enforce restrictions to access of community fishing areas*
2. Enforce any local rules that may apply*
3. Promote compliance with national/sub-‐national rules*
4. Assess, record and communicate management outcomes and major enforcement issues with designated government or network liaison*
5. Review fisheries management measures against objectives periodically*
6. Review and revise or strengthen management institution as appropriate to ensure traditional systems are adapted to modern context if need be.
a. The licensing of inshore fisheries will need to be addressed but for the moment national context and issues may require a country by country approach not fitted to this general matrix.
b. Communities may wish to assess the status of their management using observation or more complex monitoring approaches. The selection of approaches will depend on need, sustainability and available support.
1. Main groups of standard fisheries management activities based on Arnason et al. 1999
In a nutshell – government role becomes much more facilitator and support service provider while communities take on the bul of problem identification, rule setting and enforcement activities and crucially this is based on their own needs. Communities with bigger problems would be expected to consider more action. Responsibility is shifted to communities in the first instance for their own livelihoods – if their genuine attempts are insufficient then government can use its limited resources to support most urgent cases further.

References and sources: G. Baines, S. Jupiter, J. Comley, E. Rupeni, C. Carleton, M. Leopold, SI MFMR staff, Vanuatu FD staff, Fiji FD staff, Pomeroy and Rivera-‐Guieb 2006, Abdullah et al 1998, Brown et al 2005, MRAG – Fiji and Vanuatu, Arnason et al 1999, Johannes & Hickey, 2004, Kuperan et al 2008, Apia Policy, Govan et al. 2011
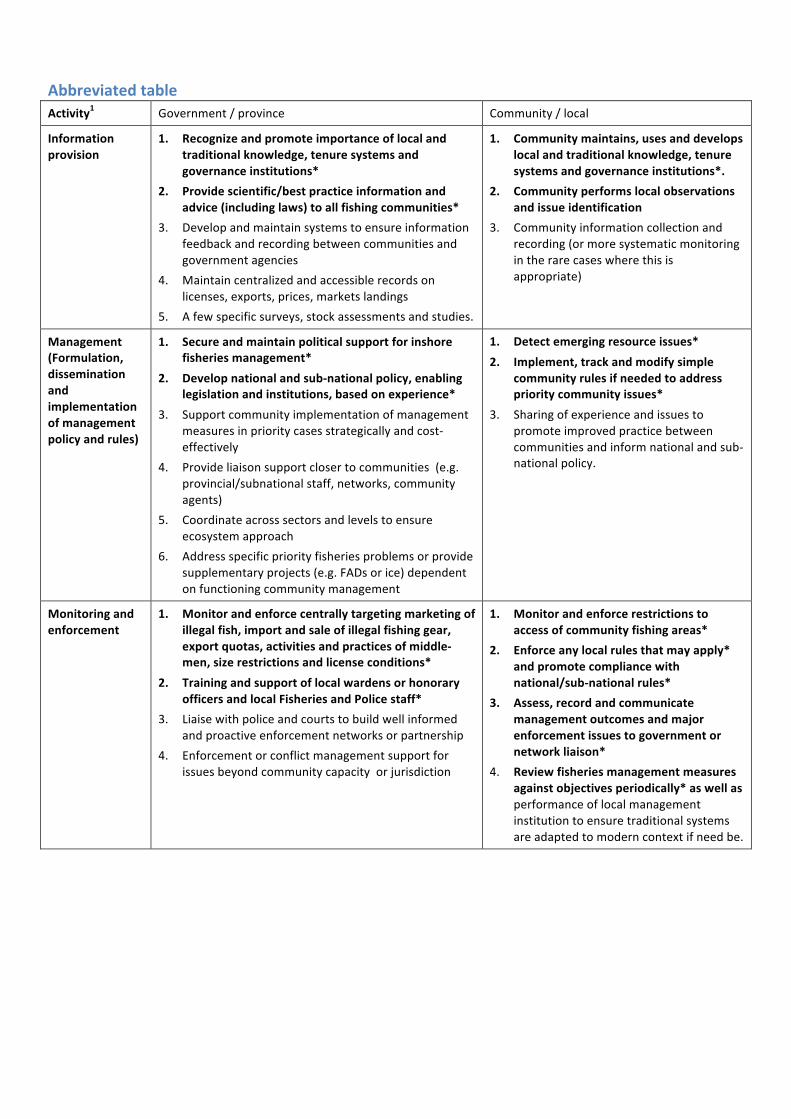
Abbreviated table Activity1 Government / province Community / local
Information provision
1. Recognize and promote importance of local and traditional knowledge, tenure systems and governance institutions*
2. Provide scientific/best practice information and advice (including laws) to all fishing communities*
3. Develop and maintain systems to ensure information feedback and recording between communities and government agencies
4. Maintain centralized and accessible records on licenses, exports, prices, markets landings
5. A few specific surveys, stock assessments and studies.
1. Community maintains, uses and develops local and traditional knowledge, tenure systems and governance institutions*.
2. Community performs local observations and issue identification
3. Community information collection and recording (or more systematic monitoring in the rare cases where this is appropriate)
Management (Formulation, dissemination and implementation of management policy and rules)
1. Secure and maintain political support for inshore fisheries management*
2. Develop national and sub-‐national policy, enabling legislation and institutions, based on experience*
3. Support community implementation of management measures in priority cases strategically and cost-‐effectively
4. Provide liaison support closer to communities (e.g. provincial/subnational staff, networks, community agents)
5. Coordinate across sectors and levels to ensure ecosystem approach
6. Address specific priority fisheries problems or provide supplementary projects (e.g. FADs or ice) dependent on functioning community management
1. Detect emerging resource issues* 2. Implement, track and modify simple
community rules if needed to address priority community issues*
3. Sharing of experience and issues to promote improved practice between communities and inform national and sub-‐national policy.
Monitoring and enforcement
1. Monitor and enforce centrally targeting marketing of illegal fish, import and sale of illegal fishing gear, export quotas, activities and practices of middle-‐men, size restrictions and license conditions*
2. Training and support of local wardens or honorary officers and local Fisheries and Police staff*
3. Liaise with police and courts to build well informed and proactive enforcement networks or partnership
4. Enforcement or conflict management support for issues beyond community capacity or jurisdiction
1. Monitor and enforce restrictions to access of community fishing areas*
2. Enforce any local rules that may apply* and promote compliance with national/sub-‐national rules*
3. Assess, record and communicate management outcomes and major enforcement issues to government or network liaison*
4. Review fisheries management measures against objectives periodically* as well as performance of local management institution to ensure traditional systems are adapted to modern context if need be.
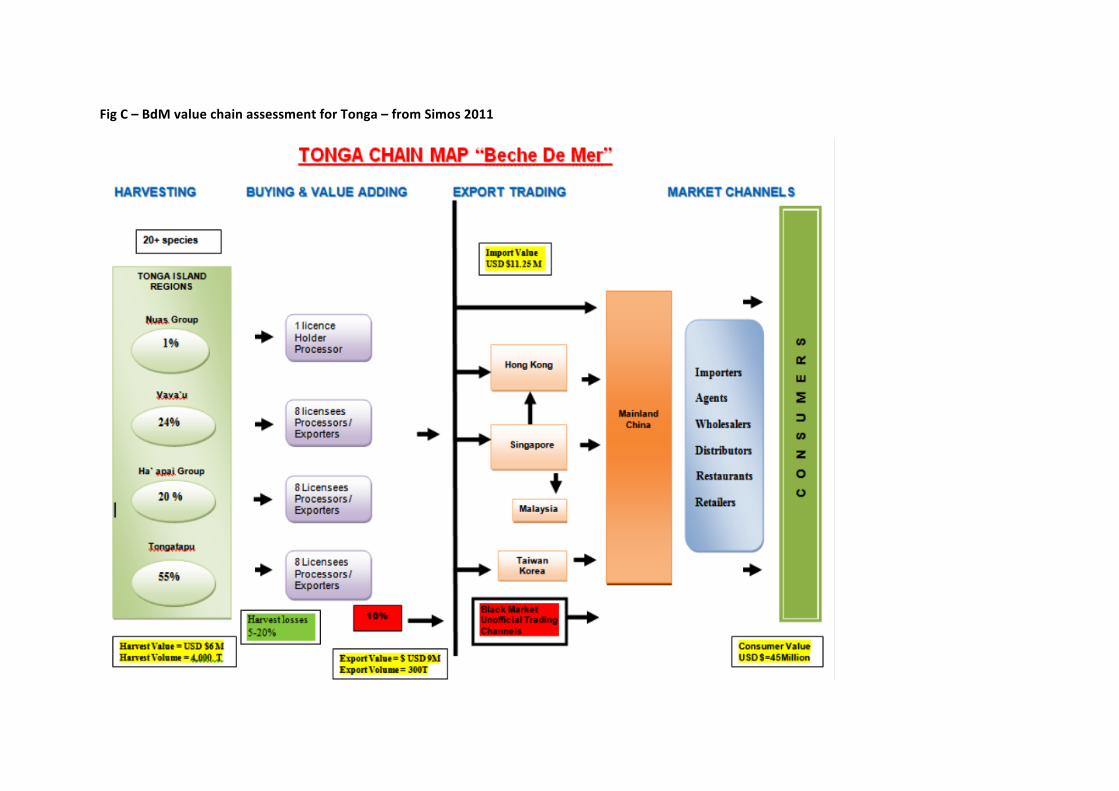
Fig C – BdM value chain assessment for Tonga – from Simos 2011
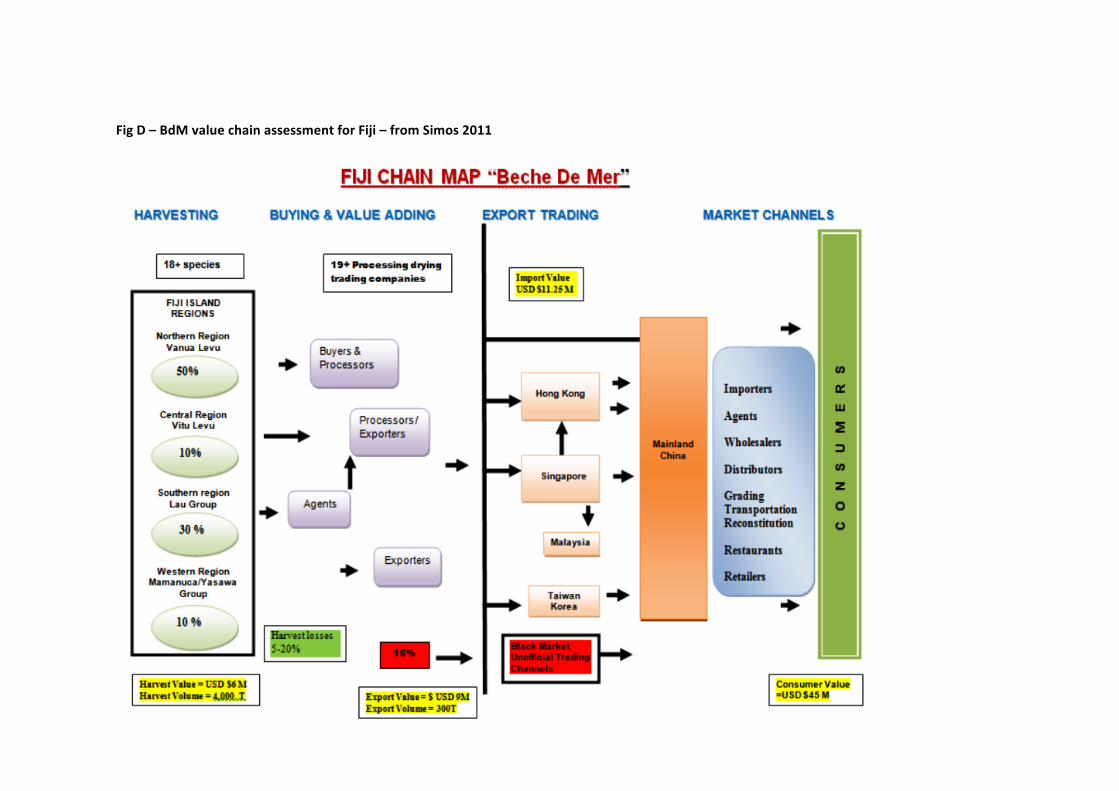
Fig D – BdM value chain assessment for Fiji – from Simos 2011

Appendix 19 – Overview of sea cucumber processing and distribution logistics
Basic processing Sea cucumber are found in shallow to medium depth waters, and are amenable to capture or collection through reef gleaning, free diving and UBA (underwater breathing apparatus – scuba or hookah) assisted diving. With respect to free diving, a practical distinction in terms of impact can also be applied between the use of simple traditional boats and canoes and more complex vessels – the key difference being the distance that can be readily covered in a day’s fishing.
Once captured some species of sea cucumber are boiled and subsequently gutted ready for several cycles of drying and boiling. Specific instructions apply for each species, and these need to be followed closely to maintain the market value of the final product. For some species that are particularly fragile to handle alternate processing avenues are advised, involving early procedures to toughen the skin and flesh.
First boiling causes the flesh of the sea cucumber to contract and to change form from a “gelatinous” to a more “solid” state. There are three key consequences of this action – enzymatic and bacterial breakdown of the flesh is temporarily halted; the product becomes more compact and rigid; the product is easier to handle. To achieve this requires different boiling times for different species and for different sizes of animals, and the boiling requires considerable care and attention – most notably it is not technically “boiling” but “simmering”, with the liquid held at temperatures well below boiling point (water should be at a temperature that allows one to hold a finger in the water for two seconds). More aggressive boiling will result in the flesh breaking up and the skin separating. These instructions are of particular importance for some species with particularly fragile skin, and which will fall apart or damage if handled roughly. This “tightening up” process can be enhanced by cooling the product quickly once removed from the pot by dropping animals into cold water.
Any water retained within the sea cucumber tube is removed (by squeezing -‐ or for some species by cutting and gutting) and product then dried (in the sun and/or in a kiln) for a day or more. Typically this will bring the water content of the product down to about 50 per cent.
Subsequent processing differs between species, but typically involves at least one further boiling and drying cycle. The objective is to bring water content down to between 2 and 5 per cent, and the latter stages of processing focus on ensuring uniform drying throughout the product, and achieving a pleasing shape to the product – a regular shape (usually straight or slightly curved form) with a clean and undamaged surface.
Whereas formerly most product was smoke dried, today the market preference is for air dried product (i.e. where wood is used as the heat source, the drying chamber needs to be separated from the wood smoke). Other energy sources now commonly used in fuelling the drying process are gas, kerosene and electricity.
A variation in overall processing is the use of salt. Salt can reduce enzymatic breakdown, is a natural bactericide, and changes the conformation of protein molecules in a slightly different way to that achieved through heat treatment (for example through boiling). It can also “lock” small amounts of

water in such a way as to make it unavailable to normal biological breakdown processes. This has merit at the end of the drying process when water content is down to only a few per cent – further reducing the propensity of the product to spoil. One possible drawback to this final element is that if product is then stored in a high humidity environment, the product may absorb additional water from the environment (salt is deliquescent – absorbs water) making the product soft and more likely to spoil. The nature and extent of this problem is not clear, but processors in Tonga and Fiji use salt in all/most of their processing, whilst processors in Solomon Islands and Papua New Guinea consider salt to produce really bad and low value product. This latter view may be because of high ambient humidity (though this is not clear), and/or it may be because salt can be used as a means of processing product that is already badly deteriorated, and thus can be viewed by importers as a sign of poor rather than good processing practice.
Shelf life, process management and trading points Set against the above backdrop, there are some species of sea cucumber that have delicate skin, and which require processing of some sort within 12 hours of capture. Most other sea cucumbers can be held alive in the sea or in seawater for a few days (i.e. processing can be delayed), but once they are dead they need to be cooked within 24 to 36 hours in order to maintain product quality [and -‐ where dead sea cucumbers are kept together for some time, skin to skin contact between sea cucumbers can result in skin discoloration that can be retained through processing, resulting in a lower value product].
Once sea cucumber has gone through first boiling and drying to about 50 per cent water content, the product is stable for a matter of a few weeks. When product has been dried to a water content of a few per cent, it can be stored in a dry environment for several months. Under these circumstances, salted product will keep better than unsalted product.
The visual quality of a dried product can be improved during the latter stages of drying by either re-‐boiling to allow product to be straightened, and/or by cleaning in warm water to remove sand, dirt and salt. Product that has been badly or wrongly cut during gutting cannot be improved, and product where processing has resulted in breaks in the skin (for example through aggressive boiling, or drying at too high a temperature, or case hardening causing uneven drying) cannot be improved.
Almost all traders involved with getting product from the point of capture to the point of export will necessarily engage to one degree or another in some form of processing. The exception is where a middleman simply facilitates the transfer of ownership from X to Y (essentially simply a financial transaction), usually accompanied by the movement of product from A to B (a logistics transaction). Most often sea cucumber is traded after first boiling and drying to 50 per cent water content only. The buyer then continues the processing to finished product at his premises. Where fishing takes place far from an economic centre, fishermen and their families take processing through to the fully dried product. Conversely, where fishing takes place close to an economic centre it is sometimes the case that traders will preferentially opt to buy all or part their intake as wet product and do all the processing themselves.
In the more peripheral locations of all the Melanesian countries under study, the fishing communities take the processing through to fully dried. In most other locations product is sold after first. In Tonga, all processing is undertaken by a small number of licensed businesses that buy all their raw material direct from fishermen as fresh wet product.

At a Provincial level in PNG, Solomons, and Fiji product is consolidated by Provincial traders. These traders sort and grade product by species, size and quality, and undertake any processing required. At the very least they will improve product value through re-‐drying, and through selective cleaning and straightening. Some of these will export on their own behalf (either from their nearest port, e.g. PNG has several export ports, or through the main national port, e.g. Honiara in the Solomon Islands), but in most cases will supply to a larger trader based in the capital or main town (Port Moresby, Honiara, Suva). These central traders will also engage in some, but usually limited, processing, in re-‐grading and in improving value.
Because of the smaller volumes involved in the Vanuatu industry, all buying is undertaken by central traders located in Port Vila and Luganville, who will visit producing areas to buy only once a reasonable quantity has been put together by or has been committed to the buyer’s local representative.
For the larger countries in the study there can be as many as four to six links in the supply chain – fishermen to family processors to local agent, possibly to a second local agent, to a provincial agent / trader, to a national trader / exporter. At each link in the chain the buyer will take a margin for his efforts, and will also add some value to the product. But in each case, for a particular product the export price will be broadly comparable across the trade. Accordingly, in the longest chains there will be six businesses / businessmen taking a margin out of this export price, and as a result they will only be able to pay the producer, the fisherman, a lower price than if the chain were shorter. As intra-‐ and inter-‐island transport has become more readily available, and cheaper, so it is now increasingly common for fishermen and fishermen groups to carry their own product to a local economic centre to sell their product there, rather than sell it at a lower price to intermediaries. In doing so they absorb the cost of transport, their time (labour), and the extra time it takes to get product to market, but get a higher market price for their product. But the buyer will need to accommodate the extra costs of taking part-‐processed product to final product – some aspects of which would otherwise have been undertaken by the intermediaries. And because the supply chains in different areas and for different fishermen are of different lengths, it is not feasible that all fishermen will get the same first-‐hand price for their product.
The following table shows the main BdM trading points and export ports for each country under study.
Sea cucumber / BdM trading centres and export ports
Country Economic centre Port PNG Lorengau, Kavieng, Kokopo, Alotau, Daru, Lai,
Madang, Port Moresby, Buka Lei, Madang, Alotau, Port Moresby
Solomon Islands Waghina, Noro, Buala, Auki, Ontong, Lata, Honiara Honiara Vanuatu Port Vila, Luganville Port Vila, Luganville Fiji Lambasa, Ba, Lautoka, Nadi, Suva, Levuka Suva, Lautoka Tonga Neiafu, Pa’angai, Nuku’alofa Neiafu, Nuku’alofa
Processing and product innovations Whilst in the not-‐so-‐distant past BdM processing was invariably conducted at or near the point of capture, today an increasing proportion of catches is traded as part-‐processed product, with processing to a finished product conducted by Provincial buyers. For the more isolated and

peripheral fishing communities, this option remains unavailable, and processing to finished product is undertaken at the household or village level, and finished product held until a sufficient quantity is available to interest a buyer, and in some instances to cover the transport costs to take the product to a buyer or buyers.
At the household or village level, processing involves boiling product in a metal container over an open fire – either a cooking pot, or a split or upright oil drum. After gutting – as appropriate to the particular species and size of animal -‐ product is then dried on a wire mesh over an open fire, and subsequently dried in sunlight. Some product is subjected to a further one or two boilings alternated with fire and sun-‐drying. Throughout these processes, process control tends to be weak and inconsistent. As a result, boiling is often too vigorous, drying is often uneven, and at too high a heat. Case hardening often occurs (outer layer dries too quickly, blocking moisture from inside the product migrating to the outer surface), the outer surface of the BdM is damaged, and product is misshapen. All these factors tend to mean that an unnecessarily low quality of product is eventually made available to buyers, and buyers tend to discount value accordingly.
Some buyers and traders have sought to improve the quality of product made available to them by fishermen and processor households – distributing and encouraging the use of better boiling pots, different designs of dryer, the use of alternate heat sources (such as kerosene), and the application of improved process management. In almost all cases where this has been tried, the fickle nature of fishermen (or their over-‐riding pursuit of the highest prices) has meant that any trader encouraging such change has been unable to recoup his outlay. Crucially fishermen have been easily seduced into selling this higher quality product to other buyers / traders – to buyers/ traders that can offer higher prices, since they have not had the outlay costs that the other trader has had. Clearly, if quality is to be improved, independent actions by individual traders is not a practical development route.
But over time buyers / traders have become more involved in finishing the processing of product, and thus are able to apply economies of scale, and invest in more sophisticated equipment and processes. It is worthy of note that the particular set of circumstances applying in Tonga has allowed it to take the step of requiring that all BdM is processed in central facilities – allowing the introduction of a greater level of process sophistication than elsewhere, though even here there is wide variation across the industry. Key innovations have been the move to smokeless drying (at its simplest an adaptation of copra driers, separating the heat sources from the product). There is also wider use of kerosene (usually arrays of burners supplied by kerosene under pressure, but also the use of simple standalone domestic kerosene burners) in controlling both boiling and drying operations, and in some cases processors also deploy gas (propane or butane) and electricity as the energy source for drying (in kilns, but increasingly in powering hot air blowers).
Drying frames range from the crude to purpose-‐built electric drying kilns where product is dried in stacks of plastic trays. Solar drying tends to be very basic, with product laid out on tarpaulins and turned at regular intervals – and usually covered when it rains, and returned to storage overnight. But some have developed increasingly sophisticated solar dyers – mainly based around a standard polytunnel. Removal of moisture is controlled by different forms of ventilation, and in some an earthen floor has been replaced by a concrete thermal mass that is able to build up and retain heat during the day, and release this at night, so extending the drying process to 24 hours a day.
In Tonga and Fiji, coarse salt is widely used in BdM processing. In Vanuatu, Solomon Islands and PNG, the use of salt is actively avoided – but a clear understanding of the rationale behind this is not available. Great care is taken by all processors in the handling and processing of white teatfish, and it can be reasonably argued that the general quality of processing of this species is particularly high (reflecting its high market value). Considerable attention is also given to the processing of sandfish and other higher value species. In Tonga and Fiji salt is most heavily used in the processing of white teatfish, which are typically left to cure in dry salt for several days during processing.
With the higher value species becoming scarcer on the ground, attention has shifted to the processing of lower value species. There is some evidence that the market is responding to the changes in availability of high and low value species, and different geographical regions are favouring different species, with some favouring lower value species than would have been the case in the past. The wider acceptance of lolly fish and snake fish are a case in point. But in addition, there are also very early moves to develop and market ready to cook products suitable for use in restaurant and household kitchens. A typical such product is partially rehydrated frozen vacuum packed product, but there is some experimentation with other forms of ready to cook product; some of this experimentation is taking place in the countries under study – with a particular focus on adding value to what would otherwise be very low value product.
Associated with the above is some evidence of moves towards process systems that are more appropriate to a food product – whereas to date BdM processes are more akin to those used for non-‐food product, for example the preparation of shell for the MoP and trochus button trades. In this context we have seen boiling undertaken in stainless steel restaurant grade electric cookers, product handling on stainless steel cutting tables, and drying in electric kilns on plastic trays. Products ranging from whole fully dried to part rehydrated whole and cut form, some in vacuum packs and others in boil-‐in-‐the-‐bag catering and retail formats. Further work in this area could yield significant returns, though it is difficult to see how others could be prevented or slowed from copying any innovations developed.

Fig A -‐ Source of losses in value when sea cucumber processed to BdM by fishermen and village processors
Source: Ravinesh Ram, USP – Ram R (2008) Impacts of Harvest and Post Harvest Processing Methods on Quality and Value of Bêche-‐de-‐mer in Fiji Islands; MSc Thesis, University of the South Pacific, Fiji

Fig B -‐ Source of losses in value when sea cucumber processed to BdM by marine product export agents
Source: Ravinesh Ram, USP – Ram R (2008) Impacts of Harvest and Post Harvest Processing Methods on Quality and Value of Bêche-‐de-‐mer in Fiji Islands; MSc Thesis, University of the South Pacific, Fiji

Appendix 20 – General background to the BdM trade and Western Pacific producers
Evolution of production and trade A small number of species have been traditionally consumed in oriental cuisine – a few traditionally harvested from the temperate waters of the North West Pacific (two or three species), and others harvested from tropical South and South East Asia (half a dozen species). Up to the early nineteenth century bêche-‐de-‐mer consumed in China and other Far Eastern countries would have originated from nearby coasts, augmented to a degree with product from South East Asia brought back by the Chinese trading fleets (largely confined to the Indo-‐Pacific region).
But in the early parts of the nineteenth century the scale and nature of this trade took on quite a different form as western traders broadened the geographical scope of sourcing operations. With major expansion of global sea trade in the early nineteenth century, and the development of a western taste for tea, traders sought commodities that could be traded in exchange for tea (and other Chinese manufactures). Bêche-‐de-‐mer was one such commodity, and sourcing operations quickly expanded across the Indian and western Pacific Oceans. Bêche-‐de-‐mer was a long shelf life commodity that could be harvested and processed in isolated tropical locations and transported to entrepôt ports such as Manila, Singapore, Makassar (modern day Ujung Pandang), Bombay (modern day Mumbai), and Sydney for later trade and shipment to market in China (Canton, and later Hong Kong). Trading infrastructures were already well established across South and South East Asia, but expansion into the western central Pacific was facilitated by the development of industrial scale whaling, with the British and American whaling fleets needing to seek provisions from the many islands that they sailed close to during voyages typically lasting a year or more. In time re-‐provisioning agents (a mix of entrepreneurs and opportunists – beachcombers) were put ashore to organise supplies and identify the sourcing of goods that could be traded for manufactures (cloth, iron, pottery, etc.). Bêche-‐de-‐mer was one such commodity (along with turtle shell and mother of pearl). As a result the more traditional sources of bêche-‐de-‐mer from Indonesia and the Philippines were augmented by supplies from Fiji, the northern islands of PNG, and the Solomon Islands.
Production of bêche-‐de-‐mer grew very slowly across the nineteenth and most of the twentieth century. Only with the opening up of the Chinese economy – for example the establishment of the Shenzhen Special Economic Zone (SEZ) in 1980 (located between Hong Kong and Guangzhou (formery Canton)), and later the Shanghai SEZ in 1992 – did per capita income show marked increase, and it is from the late 1980s /early 1990s that the current expansion of bêche-‐de-‐mer production took place. To support this expansion, significant new sources of bêche-‐de-‐mer have appeared over the last twenty years – for example from Madagascar, Maldives and Sri Lanka, and to a degree Kiribati – but supplies from each source have quickly peaked and fallen away. Today, core consistent production of tropical bêche-‐de-‐mer remains much the same as has been the case for the last two hundred years – Philippines, Indonesia, Papua New Guinea, Solomon Islands, and Fiji.
“Including catches of sea cucumbers in countries where they are eaten, the total global catch of sea cucumbers is in the order of 100 000 tonnes of live animals annually (considering that some trade statistics are not dried animals; c.f. Vannuccini, 2004). At the beginning of the new millennium,

about 6 000 tonnes of processed (i.e. mostly dried) animals were exported to Asian markets, worth over USD130 million (Vannuccini, 2004).” Purcell 2010.
Fig 1 illustrates the relative scale of imports to Hong Kong over the period 1996 to 2011. As one of the two largest importing centres for BdM (Hong Kong and Guangzhou), these figures for Hong Kong give some idea of the mix of sources of product, and how this has changed over recent years. Note that some of this product will have been re-‐exported to mainland China, and some to other parts of the world.
Market / production interplay Even in these early days of the trade, the harvesting and production of BdM followed a boom and bust cycle, with the intense harvesting of sea cucumbers from one area being followed by many fallow years when stocks were allowed to recover. This sort of cycle has been repeated ever since. But in the last twenty years the system has altered subtly but significantly; the rise in market prices for bêche-‐de-‐mer has encouraged coastal communities to continue to harvest sea cucumber resources long beyond that point where fishing would have previously been halted to allow for resource recovery. Fuelled by burgeoning demand from China, growing dependence on a cash market in peripheral Pacific island communities, and most recently by a wave of more aggressive and opportunist trade intermediaries looking for short-‐term profits, stocks are being exploited sub-‐optimally on a “boom and bust” basis, many more species of sea cucumber are being exploited than would have been the case twenty-‐five or thirty years ago, the average size of animals being harvested has reduced significantly, and in relative terms the average value of harvests has fallen as less valuable species comprise larger proportions of harvests. As currently constituted, sea cucumber harvesting is now unsustainable in virtually all those areas where it is practiced. In
Fig 1 – Imports of BdM to Hong Kong, 1996 to 2011
Source: adapted from To & Shea 2012
Note: Exports from the Solomon Islands and Tonga will be incorporated in the category “other” – for example, total exports from these two countries were 158t in 1996, and 583t in 2009

Melanesia this has led to the enforced closure of fisheries in PNG, Solomon Islands and Vanuatu to allow stocks to recover; in Tonga this fishery was closed for a period of ten years up until 2007.
Despite new waves of sea cucumber production from such places as the cold water northeast Pacific and northwest Atlantic, from the eastern Indian Ocean, and Pacific coast of South America, it is becoming evident that there are not sufficient resources of sea cucumber to satisfy market demand – primarily driven by the growing wealth of Chinese consumers. On the one hand this will inevitably mean that prices will continue to rise, but on the other a degree of product substitution will occur – consumers will opt to spend their money on alternate products (instead of putting sea cucumber at the centre of a ceremonial meal, some will opt for another type of delicacy; instead of paying very high prices for the most prized bêche-‐de-‐mer, some will opt for a lower cost alternate sea cucumber species). It is already evident that a degree of regional specialisation is taking place, with different parts of China showing preference for different species of sea cucumber. It is also evident that a degree of experimentation is underway in providing sea cucumber / bêche-‐de-‐mer in alternate product forms – re-‐hydrated and ready to cook packs; frozen, chilled and dried forms; pre-‐cut – in slices, in strips; in compound forms – stuffed and pre-‐cut.
Falling global supply The bottom line is that there is only so much sea cucumber in the world. For arguments sake let us assume that by the late 1990s global harvests of sea cucumber were about 200,000t per year, wet weight1 – 50,000t of temperate water product (from China, Japan, South Korea, US and Canada), and 150,000t of tropical water product (southern China, Vietnam, other South East, East Africa and the South Pacific). The 50,000t of temperate water species could, possibly, be sustained – harvesting was subject to effective management, including close controls. But the 150,000t of tropical harvests comprised product from traditional areas where stocks were being rapidly fished down to sub-‐optimal levels, never to return to former levels (i.e. being fished at less than fifty per cent of former levels, and still on a boom and bust basis), and other product from new fisheries (notably new areas in the eastern Indian Ocean, South America, and Pacific island groups to the east and north of the traditional harvest areas of Melanesia). For these tropical fisheries these harvest levels were being sustained by exploiting new areas, with production from traditional areas falling from one boom and bust cycle to the next boom and bust cycle. Inevitably, over time the tropical harvest volumes are going to decline, lower value and smaller sized sea cucumber will make up larger proportions of the harvest mix, and the revenue from this resource will fall (even as prices increase). And at the extreme, consumers will not pay the ever increasing prices that tighter supplies would suggest, and will instead opt to buy something else – a substitute product – or forego the purchase altogether.
There are two main ways out of this conundrum. The most obvious one is to bring the harvesting of tropical sea cucumbers on to a sustainable basis – re-‐grow stocks and harvest them on a more modest but consistent basis, i.e. move away from the boom and bust cycle. This is easier said than done, as will be explored later in this report – though the main impediment is probably political will. The second is to boost production through aquaculture. Here, though hatchery production for some species has been proven, there remain problems with grow-‐out, and we are not aware of any business producing adult sea cucumber operating profitably or at scale. The main impediment here 1 This is a generous assessment of global production (available figures are none too clear on production and traded volume, with widescale confusion over what is dried and what is wet weight); at a generalised conversion rate of 20:1 wet to dry ratio, this is equivalent to 10,000t of dried BdM. to wet weight
is technological – and even if the technology is sorted, it is likely to be many years before production at scale can be achieved.
Sea cucumber fishing methods in the Indo-‐Pacific Tropical sea cucumber is harvested along two distinct patterns – reef gleaning (where men, women and children search in shallow water for shellfish and sea cucumber), and diving (where men dive in deeper water to retrieve animals from the sea bed). Dive fishing is traditionally conducted from simple wooden canoes and other small vessels, usually propelled by oar, and sometimes assisted by sail. The use of larger and engine powered vessels has latterly become more common and allows fishermen to travel to more distant grounds. Accordingly different forms of dive fishing can be identified according to the geographical range that can be covered in a day’s fishing. Dive fishing normally refers to free diving. Some fishing is conducted using Underwater Breathing Apparatus (UBA), usually a hookah setup, or using scuba gear. Use of UBA gear for sea cucumber fishing is banned across Melanesia. Over the last few years some UBA fishing has been licensed in Fiji. In other Melanesian countries some sea cucumber is fished illegally using UBA fishing – particularly when targeting white teat fish.
Where motor assisted vessels are used, and where UBA gear is used, operating costs are significant and fishermen have to catch much larger volumes or overall values of sea cucumber than those free diving from simple canoes.
BdM and household economics Most coastal households across Melanesia participate in a predominantly subsistence economy – growing or catching much of their own food requirements, and bartering product to secure other household material requirements. Melanesian culture is strongly influenced by a form of communal ownership of land and coastal resources (more precisely resource use decisions are made on the basis of a combination of affinity to place and extent of clan and family ties). Also personal possession of goods and chattels is much less clear-‐cut than in most “western” cultures, with a much greater sense of sharing between close family and clan members. Of great significance in both communal ownership and material possession is the complex network of obligations and responsibilities between peoples built up on the basis of closeness of relationship, gifting, and the establishment of favours – to the extent that a person’s wealth might be better measured by the favours that he or she can call on, secured in part by the goods and services that he or she has been able to give away.
In today’s world most coastal households across Melanesia require some cash income, small though this might be, to pay for certain goods (usually purchases of household essentials, equipment and some types of food) and services (schooling, medical costs, transport, etc.). This is usually acquired through paid labour (copra production, forestry, rubber, oil palm) and/or the production and sale of surpluses (products of gardening or fishing). Harvesting of sea cucumber and its processing to bêche-‐de-‐mer forms a part of the annual cycle of cash generation, and labour is allocated to fishing, gardening, wage earning, according to requirements and according to the relative return of such activities. For example, reef gleaning and gardening provide food for the table, as well as product for sale; sea cucumber harvesting, copra production, and other forms of primary and secondary production generate cash income, but can return at different levels according to the effort expended, market conditions, and time of year.

In the last five to ten years the raised prices paid for BdM are such that returns from sea cucumber harvesting have generally exceeded those from copra production and even, in some cases, those from fishing for the market. Today, with still higher prices paid for BdM, returns to sea cucumber harvesting far exceed copra (despite recent rises in copra prices) and fishing. An overall result of these changed positions is that coastal households have become ever more dependent on harvesting sea cucumber as their primary source of cash income (and thus are more affected when moratoria are put in place), and that some communities have been encouraged by the improved access to cash income to shift their predominantly subsistence lifestyle more towards the cash economy (a particularly extreme example of this was the extent to which the islanders of Ontong Java became dependent on BdM income2 in the early 2000s and gave up much traditional subsistence agriculture). Others have been encouraged to harvest resources well beyond that which would have been acceptable a few decades ago – adversely impacting the extent and timing of future income streams; and still others have felt encouraged enough to exploit sea cucumber resources illegally, for example when moratoria are in place.
An indirect impact of the raised potential to get cash from sea cucumber harvesting is that fishermen and their families are less enthusiastic about processing the sea cucumber to BdM, seeing that the return on effort is less. As a result fishermen are happy, where systems allow, to sell product to trade intermediaries for a lower price as either part-‐processed or as fresh.
Global supply systems The markets for sea cucumber and bêche-‐de-‐mer have always been centred around China and Chinese settlements – so coastal China, Hong Kong, Formosa (now Taiwan), Singapore, and the Malay Peninsula. In more modern times, to this may be added more widespread consumption across the whole of mainland China (including 70 city areas with populations of over 1 million, and another 15 city areas with populations in excess of 5 million), plus centres of Chinese population in Vancouver, Toronto, New York and London. In addition, sea cucumber is consumed in Japanese cuisine (tends to focus on the Japanese sea cucumber, Stichopus japonicus, eaten raw as sashimi or sunomono), and in Chinese cuisine in South Korea eaten by South Koreans.
For short supply chains product is typically distributed in “heavy” forms -‐ live or wet; fresh, chilled or frozen; salted or otherwise pickled. Over longer distances, product is more typically distributed as dried product – dried to below 5 per cent water content. It is this latter category that is described within the trade as bêche-‐de-‐mer.
The main producers of “heavy” product are mainland Japan (mainly for the Japanese market), China, South Korea and Taiwan. Some warm water species of sea cucumber harvested along the coasts of southern China and the coast of Vietnam are also shipped in “heavy” form. In the last ten to fifteen years industrial scale harvesting of cold water sea cucumber has been undertaken along the Alaskan coast of the US, the Pacific and Atlantic coasts of Canada, and from Iceland -‐ with product shipped frozen to China. For virtually all other sea cucumber harvests, product is shipped in its dried form.
2 Christensen A.E. (2010) Marine gold and atoll livelihoods: the rise and fall of the bêche-‐de-‐mer trade on Ontong Java, Solomon Islands; PhD thesis

The main producers of dried product are Indonesia and the Philippines, followed by Papua New Guinea, Solomon Islands and Fiji in the South Pacific, and Madagascar, the Maldives and Sri Lanka in the Indian Ocean.
This geographical distribution of sea cucumber production is broadly reflected in the sixty year time series of production and trade data collated by FAO. But because not all countries show sea cucumber as a separate catch (it is often lumped in with many other species under miscellaneous marine invertebrates), overall production is underestimated. But this is further complicated by the fact that some countries submit production figures in terms of dried weight, when production should be expressed in live weight equivalent -‐ some ten to twenty times greater than the dried
weight. Confusion is also evident in the trade statistics – where again some countries express trade in terms of product weight, and others in terms of live weight equivalent. It is not a simple matter to disaggregate such statistics – even for one year, let alone across the time series. What can be said is that production statistics for Melanesia are expressed in dried weight, though there appears to be some confusion when it comes to the trade statistics.
Fig 2 – Production, 1950 to 2010, tropical regions, tonnes wet weight
Source: FAO FishSTAT+
Appendix 21 -‐ Sources of production and trade information In each country under study it is a requirement that for authorisation of the shipment each export shipment is accompanied by a minimum set of paperwork – a clearance certification from the relevant Fisheries Department, a detailed packing list, a commercial manifest, and a Customs clearance form. Details of this documentation are as follows:
• The clearance certificate from the Fisheries Department should typically list the species and weight of BdM being shipped, and ideally contain details of product size, quality, and weight (usually derived inspection of some or all bags, plus a sample weighing of product – weight, and number of individual BdM). It may also contain details of the geographic origin of product.
• The packing list may be a simplified version of the Fisheries Department clearance document, or may provide more or less detail, but with greater emphasis on the physical packages being shipped.
• The commercial manifest lists the product by weight and by value, with details of the exporter, the importer and ports of exit and entry.
• The Customs clearance form is completed once the shipment has been physically inspected, checked against documentation, and all documentation complete and in order.
In addition to the above, some countries require that documentation is accompanied by a commercial invoice from the importer, listing the exporter, the importer, and a detailed product list with quantities and values (the price that will be paid by the importer to the exporter).
For fishery management purposes, some countries require that processors and/or traders / exporters make monthly submissions of all purchases from fishermen or from intermediaries. These list who the purchase has been made from, and details of species, by data, by weight or number of units, by value, and by point or origin (a village or a fishing ground). Details of size, quality and product form (live, wet gutted, first boil, fully dried) may also be given.
The result of this is that the Fisheries and Customs Departments in each country hold and update databases on sea cucumber / BdM production and export. The detail and accuracy of this information varies between countries, and the datasets held by Fisheries and Customs often differ in structure and content, and Customs data are not always shared with Fisheries.
Of the five countries under study Papua New Guinea has by far the most comprehensive data going back many years, and differentiated by species and by Province. This is followed by Tonga, though this dataset only realistically covers the period from 2007 when the fishery was re-‐opened after a ten-‐year closure. Again, this dataset has good differentiation by species and by Province, and by production and export. Fiji and the Solomon Islands have good export data, differentiated by species, but there is no consistent differentiation by District / Province, or by production. Vanuatu holds datasets for both production and exports, but these are incomplete, at times inconsistent, and only a small proportion of entries differentiate by species and Province.