Real Economic Convergence – European and National Dimension
22
Agricultural Economics and Rural Development, New Series, Year VI, no. 2, p. 159–180, 2009 Filon TODEROIU Institute of Agricultural Economics, Romanian Academy [email protected]; [email protected] REAL ECONOMIC CONVERGENCE – EUROPEAN AND NATIONAL DIMENSIONS ABSTRACT The effects of European integration upon the support to economic and social development in the EU Member States, upon the convergence process and bridging up the gaps between the Member States represents a field of particular interest, both for researchers and for practioners. In Romania, the governmental policy with regard to the economic-social convergence seems to have a relatively diffuse formulation, being rather included in the regional development policy, for which the Convergence Program 2008–2011 was designed. It is considered that the complex economic-social convergence process from any country or community of states can be approached from two main perspectives: as stage of convergence fulfillment and as intensity of the convergence fulfillment process. The general statistical analysis of the economic convergence process is based upon two relevant sets of indicators: economic structure indicators and economic performance indicators. Very illustrating for the development gap to be recovered by convergence is the fact that out of the 15 regions with the lowest development level from EU-27, six regions are from Romania (Center – 38%, North-West – 36%, South-East – 33%, South-Muntenia – 32%, South-West Oltenia – 30%, North- East – 25%). Starting from the theoretical concepts related to the regional economic convergence, generating social cohesion, and the system of related measurement indicators system, the paper intends to present the state of things in this field in the European Union, on the basis of certain macro- economic or demo-economic quantitative evaluations, from which certain tendencies in the regional convergence evolution can be identified. The second level of regional economic convergence methodology application targets Romania’s real economy, namely two important sectors: the industrial non-financial – banking SMEs and agriculture. Key words: real convergence, regional competitiveness, regional disparity, regional density. JEL Classification: B41; F15; F43; L25; R11. 1. INTRODUCTION Agriculture and food issue has been, and continues to be – from this perspective – of global and European interest, both as such and also considered as a subsystem of other challenges at world scale (globalization, poverty, sustainable development, competitiveness, etc.) and more recently, the financial and economic crisis under way.
-
Upload
independent -
Category
Documents
-
view
0 -
download
0
Transcript of Real Economic Convergence – European and National Dimension

Agricultural Economics and Rural Development, New Series, Year VI, no. 2, p. 159–180, 2009
Filon TODEROIU Institute of Agricultural Economics, Romanian Academy [email protected]; [email protected]
REAL ECONOMIC CONVERGENCE – EUROPEAN AND NATIONAL DIMENSIONS
ABSTRACT
The effects of European integration upon the support to economic and social development in the EU Member States, upon the convergence process and bridging up the gaps between the Member States represents a field of particular interest, both for researchers and for practioners. In Romania, the governmental policy with regard to the economic-social convergence seems to have a relatively diffuse formulation, being rather included in the regional development policy, for which the Convergence Program 2008–2011 was designed.
It is considered that the complex economic-social convergence process from any country or community of states can be approached from two main perspectives: as stage of convergence fulfillment and as intensity of the convergence fulfillment process.
The general statistical analysis of the economic convergence process is based upon two relevant sets of indicators: economic structure indicators and economic performance indicators.
Very illustrating for the development gap to be recovered by convergence is the fact that out of the 15 regions with the lowest development level from EU-27, six regions are from Romania (Center – 38%, North-West – 36%, South-East – 33%, South-Muntenia – 32%, South-West Oltenia – 30%, North-East – 25%).
Starting from the theoretical concepts related to the regional economic convergence, generating social cohesion, and the system of related measurement indicators system, the paper intends to present the state of things in this field in the European Union, on the basis of certain macro-economic or demo-economic quantitative evaluations, from which certain tendencies in the regional convergence evolution can be identified.
The second level of regional economic convergence methodology application targets Romania’s real economy, namely two important sectors: the industrial non-financial – banking SMEs and agriculture.
Key words: real convergence, regional competitiveness, regional disparity, regional density.
JEL Classification: B41; F15; F43; L25; R11.
1. INTRODUCTION
Agriculture and food issue has been, and continues to be – from this perspective – of global and European interest, both as such and also considered as a subsystem of other challenges at world scale (globalization, poverty, sustainable development, competitiveness, etc.) and more recently, the financial and economic crisis under way.

Filon Toderoiu 2 160
The European economic area – already enlarged to 27 countries – has the particularity that agriculture and food “consumes” the main portion of the Community budgetary “pie” and it requires adjustment reforms, both to the rigours of the international trade formulated by the WTO, as well as to the real convergence requirements of the European economies.
The general regional economic convergence level in Romania largely depends on the agri-food sector performance, also measured by the significant diminution of the territorial discrepancies between the endowment with resources and production factors and the results, as it known that one of the main particularities of agriculture, i.e. the territorial zonality of agro-pedo-climatic suitability rarely makes the spatial distribution of production zones (supply) coincide with that of the consumption centers (demand) of agri-food commodities.
Starting from these premises, any development strategy on medium or long term, which targets the increase of Romania’s economy competitiveness and regional convergence, cannot overlook the presence and future of the agri-food sector, as important subsystem of national economy.
Starting from the theoretical concepts related to the regional economic convergence, generating social cohesion, and the system of related quantifying indicators, the paper intends to present the current situation in the European Union in this field, on the basis of certain macro-economic evaluations or quantitative demo-economic evolutions, from which certain tendencies in the regional convergence evolution can be identified. The second level of regional economic convergence methodology application targets Romania’s real economy, namely two important sectors: the industrial non-financial – banking SMEs and agriculture respectively.
2. MATERIAL AND METHOD
2.1. Problem of ontogenesis
The research on the effects of the European integration upon the support to economic and social development in the EU Member States, upon the convergence process and narrowing the disparities between the Member States represents a field of special interest, both for the academics and for the practitioners1.
Briefly, for the programming period 2007–2013, the economic and social cohesion policy of the European Union has at its disposal a budget of 308 billion Euros (about 35 % of total Community budget), targeting three main objectives:
• Convergence, which is allocated 251 billion Euros (81.5% of the structural funds), addressed to the regions from the EU Member States with a GDP/capita under the limit of 75 % of the Community and to the regions falling into the so-
1 See Zaman, Gh., Georgescu, G. (2009), „Structural fund absorption: a new challenge for Romania”, în: Romanian Journal of Economic Forecasting (RJEF), Nr. 1, pp 138–154;

3 Real Economic Convergence – European and National Dimension 161
called “statistical effect” of the EU average change, as a result of the accession of new countries;
• Regional competitiveness and employment, for which 49 billion Euros are allocated (16 % of the structural funds), targeting the regions that are not eligible under the convergence objective;
• European territorial cooperation, with 8 billion Euros (2.5 % of the structural funds), targeting the transnational, cross-border and inter-regional cooperation.
In Romania, the governmental policy on the economic-social convergence has a relatively diffuse formulation, being rather included in the regional development policy, for which the Convergence Program 2008–20112 stipulates two objectives, namely:
• diminution of the existing regional disequilibria, by stimulating competitiveness increase and the revitalization of the less-favoured areas.
• a balanced regional development, by correlating the national public sectoral development policies with the public local development policies: infrastructure and transportation, employment increase, rural development, education and health, environment.
2.2. Methods
By means of the indicators available from the ESA-95 data, the regional convergence of the economic activity can be revealed by three different modalities3. The first, which is the simplest one, presupposes measuring the absolute discrepancy between the maximum level and the minimum level of GDP/capita at NUTS-2 regional level. The second approach is to estimate the share of the population living in the regions, which reveals the levels of GDP/capita compared to the EU-27 average. The third method is to calculate the regional GDP dispersion at NUTS-2 level, which is a derived indicator that Eurostat has calculated since 2007.
The convergence process can be relevantly measured by certain statistical indicators in time referring to homogeneity, concentration, polarization, entropy, complementarity4.
2 See: The Convergence Program 2008–2011, Romania’s Government, May 2009, 79 p. Its updated form was based upon the EC Regulation No.1055 / 2005 which amends EC Regulation Nr.1466/1997 on increasing the monitoring of budgetary situation and the coordination of economic policies. In conformity with the EC requirements, the third edition of the Convergence Program complies with the methodology regarding the contents and format of the Convergence and Stability Programs, adopted by the Ecofin Council on October 10, 2005. At the same time, it takes into consideration the “European Council Opinion”, recommending to set more restrictive budgetary targets for the next years and to revise the public expenditure structure. The Government formulated the priorities in conformity with the international evolutions, by designing measures for economic growth relaunching and stimulation. These adjustment measures at national level are coordinated with the provisions of the European Economic Recovery Plan.
3 See Krueger A (2009) “Narrowing speed in regional GDP”, Eurostat Statistics in focus, 75, p. 8. 4 See: Pecican, E. St. (2009), „Indicatori privind convergenţa reală şi aplicaţiile acestora”, în
Iancu, A. (coord.) „Convergenţa economică”, Ed. Academiei Române, Bucureşti, pp 11–43.

Filon Toderoiu 4 162
It is considered that the complex economic-social convergence process in any country or community of states can be approached from two perspectives: on one hand, as stage of convergence fulfillment and on the other hand, as intensity of the convergence fulfillment process.
The convergence fulfillment stage can be measured by a “panel” of five groups of indicators:
• referring to dispersion (simple – amplitude and deviation) and synthetic indicators (dispersion, mean square deviation – also named σ convergence – variation coefficient and mean linear deviation). The more these statistical indicators have the tendency to decrease, the more pregnant is the convergence process.
• referring to the concentration level (Gini, Gini-Struck coefficients, Gini-Lorenz coefficient and curb, Herfindahl coefficient, Theil index). The tendency to zero of these concentration coefficients expresses the existence of an “equity”, equilibrium, proportionality state between the distribution of resources and the distribution of the results.
• referring to the polarization level (concentration coefficient variant); • referring to multidimensionality (human development index – HDI); • referring to complementarity, by which a mutually beneficial economic
cooperation potential is signaled out. The intensity of the convergence fulfillment process can be measured by a
“panel” of five indicators (β regression and convergence analysis; co-integrated series; transition probability matrix; test for spatial dependence; territorial econometrics; unequal economic growth).
It is considered that the statistical analysis of regional performances targets the economic growth in terms of economic structures, innovation and economy of knowledge, accessibility, environment and risk prevention.
The new economic growth theory represents a significant advance compared to the neo-classical models in which, for a given population, there is an optimal savings rate (and hence an investment rate) that determines the long-term equilibrium of GDP per capita.
In the last years, a current of opinion5 appeared according to which the economic growth is a transitory process of adjusting the moment from which the cumulative factor (capital) exceeds the decreasing marginal income.
The empirical analysis of regional convergence and of the economic growth determinants can be deepened on the basis of two main theoretical approaches, referring to a common vision on the technological change for growth:
• the first one refers to the “new growth theory” (in regional sense); • the second one, based on the (neo)Schumpeterian (or evolutionist) vision
of economic growth.
5 Vezi: „Policy guidelines for regions falling under the new competitiveness...”, Vol. I, Statistical analysis, Csil Milano, dec. 2005.

5 Real Economic Convergence – European and National Dimension 163
The European integration process represented a good ground for testing the above-mentioned theories:
• firstly, by convergence existence, which was disputable for quite a long time (with regard to the dynamics of GDP/capita indicators after 1980, different studies produced non-unanimous results);
• secondly, while heterogeneity increased in the EU Member States, increased dissimilitudes appeared inside the countries, which suggest that polarized development appeared in Europe (see the concept of “convergence club”, introduced by Quah6).
The general statistical analysis of the economic convergence process is based upon two sets of relevant indicators:
• economic structure indicators: o population; o population density; o share of employment in the primary sector; o share of employment in the manufacturing sector; • economic performance indicators: o GDP/capita, in PPS; o unemployment rate; o GDP real growth rate (in constant prices); o GDP real growth rate / employed person. In recent years, the focus has been increasingly laid on the importance of
regional competitiveness, while signaling out certain worrying tendencies related to the competitive advantage, both in global and local context, the subject being even on the “top of the list” at the level of European policies formulation. The new Lisbon Agenda requires that “EU should mobilize all the relevant national and Community resources – the social cohesion policy inclusively” and openly declares that a stronger assuming of this Strategy objectives is possible only by the involvement of the local and regional players, as well as of the social partners.
The intervention of the new circumstances of the financial-economic crisis in the valorization of the competitive advantages at national level further highlights the role of local factors and economic initiative in the general economic development of a country. In this context, the sector of the small and medium-sized enterprises (SMEs) represents an essential “segment” of the modern developed economies.
It is generally considered that the regional economic environment is shaped by three groups of factors that influence the entrepreneurial spirit, namely macro – climate, micro – climate – specific factors and factors specific to each individual in part (GEA 2007).
6 Quah, D. T. (1996), “Regional convergence clusters across Europe”, European Economic, Review, vol. 40.

Filon Toderoiu 6 164
The theoretical constructions increasingly combine the macro aspects of the industrial policies with the regional aspects of the economy of the industrial agglomerations. In other words, the regional competitiveness policy plays a new greater role, by focusing upon the regions with the highest competitiveness growth.
Regardless of its definition, the competitiveness is usually linked to tangible results, such as the steady productivity growth, high real wages and standard of living, as well as innovating processes with driving effect. The necessary conditions for competitiveness investigation at national level can be common to those at regional level, although for the latter, certain usual constraints – mobility of production factors, trade barriers, absorption of macroeconomic shocks – are incomparably more relaxed.
The regional competitiveness can be defined as the ability of a region, and hence of its public authorities, to maintain the local basis of economic entities (firms, enterprises, etc.) and qualified labour and to attract foreign investments.
Although it is stated that there is no universally accepted definition of regional competitiveness, this concept attempts to measure the economic prosperity level of regions7; this approach is based upon constructing a set of indicators and then comparing the results by regions, in order to measure the success obtained by each region. The utility of this exercise resides in finding out whether these main factors of success can be also attracted in the less performing regions8.
The information support of the study consists of the data on the enterprise statistics (by CAEN activities, by regions and by size classes), the relevant direct
7 The gross domestic products (GDP) per capita is one of the most representative indicators of regional competitiveness; it measures the general development level as well as the living standard in a region. It is also frequently used as a partial expression of productivity in a region, and in practice there are enough arguments for such an interpretation. For example, GDP/capita decomposition into a multiplying aggregate of other four component factors, each of them having a specific economic interpretation. (see www.gea.org.ro, 2007). It is worth mentioning that the most important indicators in GDP/capita growth are the first three, i.e. GDP/total number of working hours (labour productivity), total number of working hours/total employees and total employees/active population (employment rate); the fouth indicator – active population/total population represents the so-called demographic component (activity rate), usually less relevant on the short and medium term (see Vincze 2002).
8 See GEA 2007 where the employment rate dispersion method is frequently used in regional competitiveness measurement. This is zero when the employment rates within the region (urban – rural) are identical and it increases when there is a positive modification in the employment differences by residence areas (urban – rural). At the same time, the intra-regional dispersion (variation) is given by the expression Di below and it expresses the weighted variation of the employment rates by residence areas (urban – rural), divided by the employment rate at the level of investigation unit (the region), being defined by the relation:
Di = )}/()])([({yx
iyi
yi
iyixi
∑∑ , where: xi = employed population aged 15–64 years from the
region / environment i; yi = total population aged 15–64 years from the region / environment i; x and y = means of variables xi şi yi; yx = employment rate at the level of investigation unit, i.e.
∑∑ yixi .

7 Real Economic Convergence – European and National Dimension 165
indicators for the SMEs economic sector targeting: the number of SMEs and of employees, turnover and gross investments.
Out of the six possible correlations between the four above-mentioned primary indicators, we consider that only three derived indicators present an increased relevance: number of employees per SME (labour endowment); turnover per SME (economic power of enterprise); turnover per employee (labour productivity).
The first method quantifying the convergence towards social cohesion of regional economic development is based upon determining the regional dispersion (D) of a derived indicator, expressed as its percentage in the national average, according to the following formula:
D = [100Y1∑ −
n
iYyi
Ppi ] (1), where:
D = regional dispersion of the derived indicator “y”9; yi = derived indicator “y” in the region “i”; Y = national average of derived indicator “y”; pi = regional level of the weighting indicator “p”; P = national level of the weighting indicator “p”. The second method quantifying the regional convergence refers to the
determination of the regional disparity index (RDI) of a derived indicator versus its national average, according to the following formula:
RDI = 100( )
N
Yyi
Y
n
i2^
1 ∑ −⋅ (2), where:
RDI = regional disparity index of the derived indicator10; N = number of regions of the country.
3. RESULTS AND DISCUSSIONS
3.1. The economic convergence in EU – macroeconomic evaluations
The ten Central and East-European countries (EU-10) are considered small open economies. As a group, they account for 21 % of the EU-27 population and 11 % of the GDP in EU-27 (measured in PPS)11.
9 2009 edition of the “MittelstandsMonitor 2009” is dedicated to the three great themes: Microfinancing the establishment of SMEs; Dynamics in the innovating behaviour of SMEs; Patent activities of SMEs.
10 Eurostat, Statistik kurz gefasst, Nr. 31 / 2008, Unternehmen nach Groessenklassen – Ueberblick ueber KMU in der EU.
11 See: von Hagen, J., Siedschlag, I., 2008, “Managing capital flows Europe”, in ADB Institute disc. Paper 103.

Filon Toderoiu 8 166
The smallest among them (Estonia, Latvia, Lithuania, Slovenia, Slovakia and Bulgaria) are comparable, from the point of view of their economy size, to Luxemburg, while the Czech Republic, Hungary and Romania are similar, as regards their economy size, to Ireland, and Poland is similar to Netherlands. At the European standards, Luxemburg, Ireland and Netherlands are thus small open economies (Graph 1).
Source: own calculations, on the data base from von Hagen, J., Siedschlag, I., (2008), ADB Institute, Disc. Paper 103
1,6
0,2
1,3
0,3 0,4
4,1
0,70,4
0,6
1,6
0,3
1,3
4,3
0
0,5
1
1,5
2
2,5
3
3,5
4
4,5
CZ EE HU LV LT PL SK SI BG RO LU IE NL
(%)
Share in GDP (EU-27 = 100)FIT_IEA_1009
Graph 1. Size convergence of the East-European economies, 2007.
The commercial opening, measured as share of total foreign trade of goods and services in GDP, in the EU-10 countries, is close to that of the countries from the euro area in Romania and Poland and much higher in the remaining countries from EU-10. (Graph 2).
Source: own calculations, on the data base from von Hagen, J., Siedschlag, I., (2008), ADB Institute, Disc. Paper 103
148,8
169,3
155,1
108,6
129,4
81,9
176
139,1
147
76,9 79,2
70
90
110
130
150
170
CZ EE HU LV LT PL SK SI BG RO Euro
(%)
Foreign Trade / GDP (%)FIT_IEA_1009
Graph 2. External commercial convergence of the East-European economies, 2007.

9 Real Economic Convergence – European and National Dimension 167
In the year 2006, the gross fixed capital formation (GFCF), as share in GDP, ranged from 21.9 % (Hungary) to 25.0 % (Czech Republic, Slovakia, Slovenia, Bulgaria) and over 30 % (Estonia and Latvia). These investment rates are high, comparable to the euro area average, of only 21.1 %. Given that in these countries (EU-10), the income/capita is low, it is expected that in the predictable future the investment rates will continue to be high (Graph 3).
Source: own calculations, on the data base from von Hagen, J., Siedschlag, I., (2008), ADB Institute, Disc. Paper 103
25,1
33,8
21,9
34,4
23,1
20
26,425,8 26,2
24,6
21,1
19
21
23
25
27
29
31
33
35
CZ EE HU LV LT PL SK SI BG RO Euro
(%)
GFCF / GDP (%)FIT_IEA_1009
Graph 3. Investment convergence in the East-European economies, 2007.
In the last decade, the EU-10 countries experienced a strong process of real convergence to EU, in terms of GDP/capita and productivity. The average yearly growth rate of GDP/capita of the EU-10 group of countries was 3.6 % in the period 1997–2001 and 5.4% in the period 2002–2006, while the growth rates in the euro area were 2.8 % and 1.5 % respectively. The highest rates were noticed in the three Baltic countries in the past decade (6.2 % in the period 1997–2001 and 9.0 % in the period 2002–2006). It is worth mentioning that in the last five years, the real growth maintained its vigour in the EU-10 countries, while it decreased in the euro area.
A significant negative correlation was noticed between the GDP/capita in the year 1997 and the average yearly growth rates in the period 1997–2006, where countries with an initially low level of income per capita experienced growth rates higher than in the rich countries. The three Baltic countries, as well as Bulgaria and Romania, which have the lowest level of income / capita, are expected to continue to have the highest growth rates among the EU-27 Member States.
The labour productivity increase in the last decade, measured as GDP gain / employee, was much higher in EU-10 compared to the euro area. The highest growth rates were found again in the Baltic countries. There is an obvious tendency for the labour productivity levels to include countries with an initially low level of productivity imposed by high growth rates, compared to the countries with a high level from the euro area.

Filon Toderoiu 10 168
3.2. The regional economic convergence – Quantitative demo-economic evaluations
In the year 2006, the regional GDP (NUTS-2) per capita (expressed in Purchasing Power Standards – PPS) experienced great differences among the 275 regions of the EU-27 (plus Croatia and FYROM), the level gap ranging from 336% (Inner London) to 25% (North-East Region, Romania)12.
Very illustrating for the development gap to be recovered by convergence is the fact that out of the 15 regions with the lowest development level from EU-27, six regions are from Romania (Center – 38%, North-West – 36%, South-East – 33%, South-Muntenia – 32%, South-West Oltenia – 30%, North-East – 25%). As order of size, the GDP/capita ranged from 79400 PPS (Inner London) to 5800 PPS (region North-East, Romania), compared to the EU average of 23600 PPS.
The determination of the maximum value / minimum value range reveals that this discrepancy decreased, from the multiplying factor 16.0 / 1.0 (2001) to the multiplying factor 13.6 / 1.0 (2006). The main reason for such an obvious decrease was the accelerated economic development in Bulgaria and Romania. As this methodological approach takes into consideration only the extreme values of the distribution, it is clear that a large part of the mutations (translations) between regions remain unrevealed.
For a more accurate evaluation of the economic convergence, the development regions can be grouped into classes, according to the GDP/capita (in PPS). This makes it possible to reveal the share of the population living in the countries taken into consideration (EU-27 plus Croatia and FYROM), in richer or less rich regions and how this share evolved. In fact, the convergence among regions made visible progress in the period 2001–2006.
Thus, the share of the population living in the regions where GDP/capita is under the limit of 75 % of the EU–27 average decreased from 28.5 % to 25.2 %. At the same time, the share of the population in the regions with GDP/capita over the limit of 125 % was down from 23.0 % to 20.1 %. By the translations (mutations) from “the leader” to “the lagger” of distribution, the share of the population in the medium range (GDP/capita from 75 % to 125 % of the EU-27 average) significantly increased from 48.5 % to 54.7 %, corresponding to an increase of 35 million people.
In spite of the overall visible progress of the economic convergence, by comparing the three-year averages 1999–2001 and 2004–2006, is can be noticed that only 5 of the 275 regions exceeded the limit of 75 % of the EU-27 average (one region from Greece, Spain, Poland, Romania and the United Kingdom); these regions are populated by 16 million people (3.8 % of the population from the 29 countries taken into consideration). At the same time, the GDP/capita in four regions decreased again under the limit of 75 % (two Italian regions and on region from France and one region from Greece), with a total population of 5 million people (about 1.1 % of the population from the 29 countries).
12 See “Eurostat Jahrbuch der Regionen 2009”, European Commission, ISSN 1830–9690.

11 Real Economic Convergence – European and National Dimension 169
Table 1 Shares of the population with residence in more or less economically developed regions
(%) 2001 2006 > 125 % of the EU-27 average = 100 23.0 20.1 > 110–125 % of the EU-27 average = 100 16.0 16.5 > 90–110 % of the EU-27 average = 100 22.7 24.9 > 75–90 % of the EU-27 average = 100 9.8 13.3 < 75 % of the EU-27 average = 100 28.5 25.2 < 50 % of the EU-27 average = 100 15.3 11.5
Source: Eurostat Jahrbuch der Regionen 2009.
Putting together the two above-mentioned economic evolutions, it results that by the economic development in the period 1999–2006, the population from the regions with GDP/capita over 75 % of the EU-27 average increased by about 10.6 million people (Table 1).
These results in the range close to the important limit of 75 % for the regional policy permit to advance the supposition that the economically weaker regions benefited only to a less extent from the EU convergence process in the first half of this decade.
However, a more accurate analysis reveals that many regions with a GDP/capita under 75 % of the EU-27 average made significant progress. Thus, the population who lives in the regions with a GDP/capita under 50 % of the EU-27 average decreased by almost 25% in the period 2001–2006, from 15.3 % to 11.5 %.
On the other hand, with regard to the 20 EU regions that have the weakest economic performance, where 7.5 % of the population lives, it can be mentioned that this group advanced in the investigated period (2001–2006), i.e. its GDP/capita was up from 28.2 % to 33.2 % of the Community average of this indicator, also by the contribution of the strong economic recovery process from Bulgaria and Romania.
3.3. Regional convergence evolution trends in EU-27
The regional convergence evolution in time can be also investigated by applying method (1) for the determination of the average regional dispersion of GDP/capita (in PPS), for a relevant period (1995–2005).13
The analysis of the “behaviour” in time of the regional dispersion of GDP/capita for the period 1995–2005 permits the identification of relevant evolutions:
• In the year 1995, the average dispersion of regional GDP/capita ranged from minimum 10.4 % (in Sweden) to maximum 31.4 % (Hungary); this reached 15.5 % and 40.0 % after one decade.
13 See: “Verteilung des regionalen BIP je Beschaeftigten als Prozentsatz des nationale Durchschnitt”, Eurostat, 2008. It is worth mentioning that, except for Cyprus, all the other 26 EU Member States calculated and systematically reported the data on the regional dispersion of the general economic development level for the period 2000–2005. At the same time, 18 countries out of the 27 calculated this indicator for the whole reference period (1995–2005).

Filon Toderoiu 12 170
• If we take the intermediary year 2000 as reference, since when the quasi-totality of the Central and East-European countries experienced steady economic growth, the investigated indicator featured a variability range from minimum 3.4 % (in Malta) to maximum 46.8 % (in Latvia); after five years of economic development, this indicator reached 4.1 % (Malta) and 51.3 % (Latvia).
• In the year 2005, as compared to 2000, only in seven countries from EU-27 (Belgium, Spain, France, Italy, Austria, Finland and United Kingdom), the regional dispersion of GDP/capita featured diminution, ranging from 0.1 % (in Belgium and the United Kingdom) to 2.5 % (in Spain). The significance of this trend is that the economic growth process led to a general diminution of gaps at the level of development regions compared to the national averages, i.e. we have a real regional economic convergence, generating economic-social cohesion.
• In a panel of six Member States (Romania, the Czech Republic, Hungary, Slovakia, Germany and France), the economic development from the period 1995–2005 was accompanied, contrary to expectations, by an increase of regional disparities of regional GDP/capita (Graph 4). Romania stands out in this respect, where the average regional dispersion increased from 12.8 % (1995) to 31.9 % (2005), i.e. a yearly growth rate of regional disparities of 9.56 %. This strong trend of economic divergence manifestation in the territory outstrips by far the situation of other East-European countries (the Czech Republic – 4.23 %, Hungary – 2.45%, Slovakia – 1,79 %) or of West-European countries (Germany – 0.32 % and France – 0.27 %).
Source: own calculations, on the data from Eurostat "Verteilung des regionalen BIP je Einw. als % des nat. BIP je Einw., EU - 27, 2000-2005
10
15
20
25
30
35
40
1995 1996 1997 1998 1999 2000 2001 2002 2003 2004 2005
( % )
Romania Czech Rep. Hungary Slovak Rep. Germany FranceFIT_IEA_0809
Graph 4. Average regional dispersion of regional GDP/capita, in certain EU countries.
Taking Romania as reference term, in three representative years with statistical coverage (1995, 2000 and 2005), it should be noticed that at the beginning of the investigated period (1995), only in two countries (Lithuania and Sweden) the average regional dispersion of GDP/capita was lower than in Romania (Graph 5).

13 Real Economic Convergence – European and National Dimension 171
Source: own calculations, on the data from Eurostat "Verteilung des regionalen BIP je Einw. als % des nat. BIP je Einw., EU - 27, 2000-2005
0,000
0,500
1,000
1,500
2,000
2,500
Belgium
Czech
Rep
.
German
y
Irelan
dSpain
France
Italy
Lithuan
ia
Hungary
Netherl
ands
Austria
Portu
gal
Roman
ia
Sloven
ia
Slovak
ia
Finland
Sweden
United K
ingdom
( Rom
ania
= 1
)
1995 2000 2005FIT_IEA_0909
Graph 5. Average regional dispersion of GDP/capita, 1995–2000–2005 (Romania = 1).
The relatively fast rise of the regional economic divergence in Romania, in the period 1996–2005, resulted in the situation where, in the years 2000 and 2005, the quasi-totality of investigated countries had lower average regional dispersion levels of the GDP/capita compared to Romania.
The regional economic convergence, measured by different synthetic macroeconomic indicators, should and can be explained, be it partially, through the intermediary of micro-economic indicators, referring to entities from the real economy. As in the modern, strongly industrialized economies, the SME sector has a majority share in the national production and labour employment.14
3.4. The regional convergence in real economy – the case of SMEs from Romania.
Preliminary to the application of the two methods presented in the methodological chapter, certain direct (primary) and derived indicators were selected, the analysis of which enables the identification of factors with disturbing action upon the economic activity of SMEs in our country. We refer here to the indicators regarding the absolute real turnover (by regions and size classes), average real turnover by SME (by classes); SMEs density (in 1000 inhabitants).
As potential indicator of economic performance, the absolute real turnover (resulting from the utilization of implicit GDP price deflator) per total SMEs
14 See: Toderoiu, F., “Competitivitatea IMM-urilor sub spectrul crizei economice – o perspectivă regională”, paper presented at the “Spiru Haret” University, Câmpulung Muscel, 16.05.2008. The SMEs in EU-27 account for about 99.8 % of the number of enterprise, 67.1 % of the labour force and 57.6 % of GVA, while in Romania the same shares reached 99.5 %, 60.8 % and 48.4%.

Filon Toderoiu 14 172
steadily increased in the period 1998–2007, to reach 1.787 (Table 2.2), with regional difference indices ranging from 1.398 (in R21 – North-East) to 2.217 (in R32 – Bucharest Ilfov).
Table 2
Real turnover of the SMEs in Romania, by development regions, 1998–2007 (1998=1)
MacroReg_1 MacroReg_2 MacroReg_3 MacroReg_4 Total R11= NV R12=C R21=
NE R22=
SE R31= S-M
R32= B-IF
R41= SV-O
R42=V
1998 1.000 1.000 1.000 1.000 1.000 1.000 1.000 1.000 1.000 1999 1.032 0.915 1.151 1.021 0.956 0.898 1.089 1.156 1.065 2000 1.095 1.022 1.252 1.002 1.071 0.957 1.164 1.142 1.089 2001 1.144 1.120 1.223 1.089 1.033 0.956 1.311 1.095 1.078 2002 1.219 1.198 1.360 1.243 1.150 1.043 1.279 1.163 1.284 2003 1.277 1.258 1.389 1.302 1.208 1.108 1.343 1.186 1.375 2004 1.449 1.413 1.608 1.458 1.404 1.214 1.559 1.219 1.587 2005 1.465 1.425 1.567 1.310 1.370 1.348 1.637 1.199 1.558 2006 1.605 1.553 1.732 1.316 1.416 1.472 1.875 1.329 1.673 2007 1.787 1.727 1.917 1.398 1.518 1.556 2.217 1.423 1.778
Source: Own calculations, on the basis of data from the Territorial Statistics 2008, NIS.
The fact that the region R21 North-East features the slowest dynamics of the real turnover confirms the bi-univocal relation between the general economic development level of the region and the SME sectoral economy, in contrast with the region Bucharest Ilfov, where the proximity of a large pole of solvent demand and consumption market (the capital city) represents an economic driving factor.
From structural perspective (by size classes), the real turnover of SMEs features even more contradictory dynamics in the period 1998 – 2007 (Table 3).
Table 3
Real turnover of SMEs in Romania, by size classes, 1998–2007 (1998 = 1)
TOTAL 0–9 10–49 50–249 250 + 1998 1.000 1.000 1.000 1.000 1.000 1999 1.032 1.019 1.054 1.120 1.002 2000 1.095 1.068 1.355 1.378 0.927 2001 1.144 1.042 1.399 1.611 0.950 2002 1.219 1.148 1.517 1.723 0.986 2003 1.277 1.207 1.769 1.978 0.913 2004 1.449 1.382 1.952 2.307 1.032 2005 1.465 1.360 2.004 2.392 1.029 2006 1.605 1.486 2.247 2.723 1.080 2007 1.787 1.724 2.507 3.056 1.164
Source: Own calculations, on the basis of data from the Territorial Statistics 2008, NIS.

15 Real Economic Convergence – European and National Dimension 173
The slower dynamics of the real turnover value in the large-sized SMEs (250+) might be explained, be it partially, by the fact that the activity of the large enterprises, inherited from the command economy period, down in number, “melted down” in the transition period, into two size classes, more mobile and adaptable, i.e. the medium sized SMEs (50–249) and the small-sized SMEs (10–49), which had considerably higher indices compared to the aggregate average (3.056 and 2.507 respectively).
The SMEs economic power (partially expressed by the average real turnover per enterprise), analyzed from the structural point of view, features dynamics lower than the previous indicator, both overall (only 13.2 % increase in 2007 as compared to 1998), and by size classes – from 10.2 % in micro-enterprises (0–9 employees) to 113.8 % in the medium-sized SMEs (50–249 employees) (Table 4).
Table 4
Average real turnover per SME in Romania, by size classes, 1998–2007
(1998 = 1) TOTAL 0–9 10–49 50–249 250 + 1998 1.000 1.000 1.000 1.000 1.000 1999 1.031 1.022 1.007 1.078 1.139 2000 1.133 1.128 1.152 1.251 1.143 2001 1.174 1.100 1.124 1.378 1.197 2002 1.222 1.184 1.191 1.420 1.261 2003 1.158 1.122 1.269 1.564 1.142 2004 1.163 1.122 1.354 1.758 1.305 2005 1.072 1.004 1.273 1.781 1.360 2006 1.101 1.031 1.286 1.983 1.465 2007 1.132 1.104 1.314 2.138 1.582
Source: Own calculations, on the basis of data from the Territorial Statistics 2008, NIS.
The growth rate of the average real turnover per SME, higher in the medium and large-sized enterprises, seems to be the result, at least partially, of the so-called “economies of scale” effect upon labour productivity.
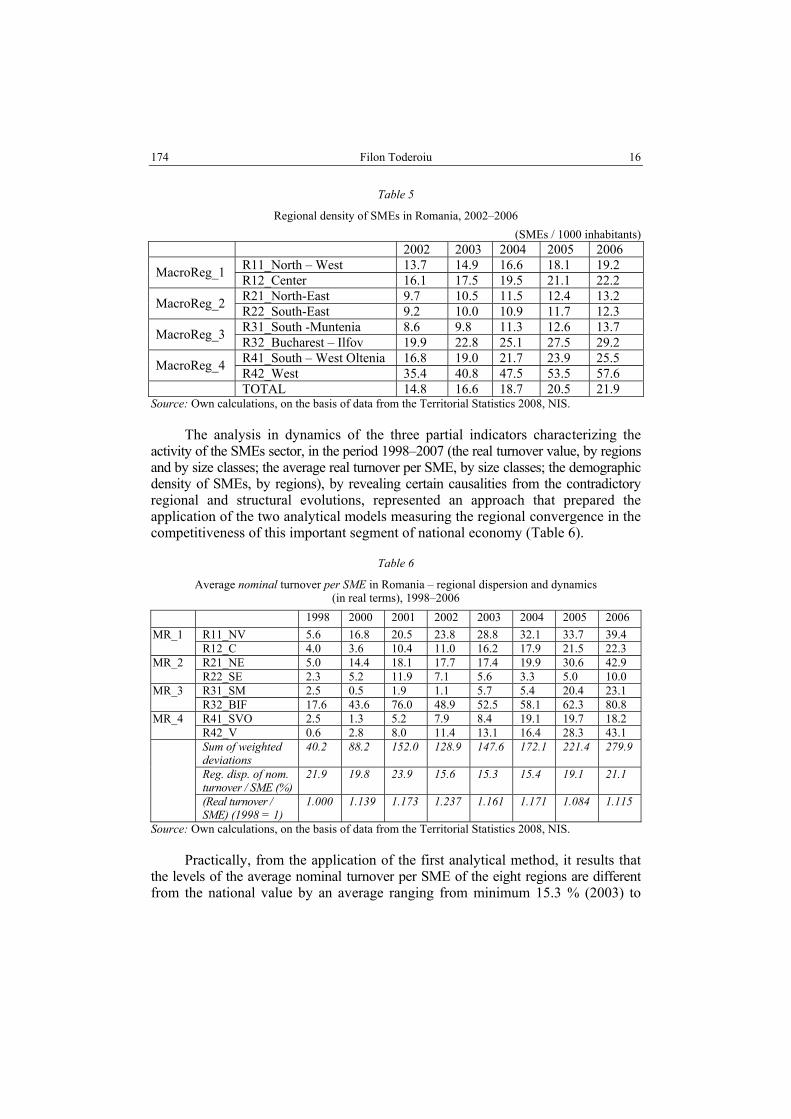
The number of SMEs in 1000 inhabitants, reference indicator on the potential supply of commodities and services, on the one hand, and of occupational alternatives generating private and public incomes, on the other hand, features high variability in the period 2002–2006, both by regions and as modification rate (Table 5).
It can be noticed that in five out of the eight development regions, the decreasing order of the demographic density of SMEs in the year 2006 is identical to that in 2002. The placing of the three regions with lower general economic development level and with more pregnant agrarian character on the last three positions reconfirms, in our opinion, the presumption that in the poor regions the business environment seems to be less stimulating for the establishment of SMEs.
Filon Toderoiu 16 174
Table 5
Regional density of SMEs in Romania, 2002–2006 (SMEs / 1000 inhabitants)
2002 2003 2004 2005 2006 R11_North – West 13.7 14.9 16.6 18.1 19.2 MacroReg_1 R12_Center 16.1 17.5 19.5 21.1 22.2 R21_North-East 9.7 10.5 11.5 12.4 13.2 MacroReg_2 R22_South-East 9.2 10.0 10.9 11.7 12.3 R31_South -Muntenia 8.6 9.8 11.3 12.6 13.7 MacroReg_3 R32_Bucharest – Ilfov 19.9 22.8 25.1 27.5 29.2 R41_South – West Oltenia 16.8 19.0 21.7 23.9 25.5 MacroReg_4 R42_West 35.4 40.8 47.5 53.5 57.6
TOTAL 14.8 16.6 18.7 20.5 21.9 Source: Own calculations, on the basis of data from the Territorial Statistics 2008, NIS.
The analysis in dynamics of the three partial indicators characterizing the activity of the SMEs sector, in the period 1998–2007 (the real turnover value, by regions and by size classes; the average real turnover per SME, by size classes; the demographic density of SMEs, by regions), by revealing certain causalities from the contradictory regional and structural evolutions, represented an approach that prepared the application of the two analytical models measuring the regional convergence in the competitiveness of this important segment of national economy (Table 6).
Table 6
Average nominal turnover per SME in Romania – regional dispersion and dynamics (in real terms), 1998–2006
1998 2000 2001 2002 2003 2004 2005 2006 R11_NV 5.6 16.8 20.5 23.8 28.8 32.1 33.7 39.4 MR_1 R12_C 4.0 3.6 10.4 11.0 16.2 17.9 21.5 22.3 R21_NE 5.0 14.4 18.1 17.7 17.4 19.9 30.6 42.9 MR_2 R22_SE 2.3 5.2 11.9 7.1 5.6 3.3 5.0 10.0 R31_SM 2.5 0.5 1.9 1.1 5.7 5.4 20.4 23.1 MR_3 R32_BIF 17.6 43.6 76.0 48.9 52.5 58.1 62.3 80.8 R41_SVO 2.5 1.3 5.2 7.9 8.4 19.1 19.7 18.2 MR_4 R42_V 0.6 2.8 8.0 11.4 13.1 16.4 28.3 43.1 Sum of weighted deviations
40.2 88.2 152.0 128.9 147.6 172.1 221.4 279.9
Reg. disp. of nom. turnover / SME (%)
21.9 19.8 23.9 15.6 15.3 15.4 19.1 21.1
(Real turnover / SME) (1998 = 1)
1.000 1.139 1.173 1.237 1.161 1.171 1.084 1.115
Source: Own calculations, on the basis of data from the Territorial Statistics 2008, NIS.
Practically, from the application of the first analytical method, it results that the levels of the average nominal turnover per SME of the eight regions are different from the national value by an average ranging from minimum 15.3 % (2003) to

17 Real Economic Convergence – European and National Dimension 175
maximum 23.9 % (2001) in the period 1998–2006, with oscillating evolutions throughout the period (decreasing trend in the period 1998–2003 and increasing trend in the period 2004–2006).
The conclusion that can be drawn from this evolution in time of the regional dispersion of the average nominal turnover per SME may be that the economic growth process must be also accompanied by a regional convergence of this indicator, as support to improved social cohesion in the territorial development. The previous consideration is confirmed by the evolution, in overall national economy, of the regional dispersion (D) and of the regional disparity index of GDP / capita (RDI) in the period 2002–2006 (Table 7).
Table 7
GDP/capita in Romania – regional dispersion (D) and the regional dispersion index (RDI), 2002–2006
2002 2003 2004 2005 2006 Reg. GDP dispersion/capita (D, %) 23.5 23.5 23.0 26.7 27.2 Reg. Disparity Index of GDP/capita (RDI, %) 38.8 38.2 38.2 45.1 44.9 Reg. GDP/capita (PPS) 6033.2 6505.1 7404.4 7878.2 9078.8
Source: Own calculations, on the basis of data from the Territorial Statistics 2008, NIS.
It can be noticed that a relative increase of GDP/capita of 50.5 % obtained in four years (2002–2006), was accompanied by a slight increasing tendency of the regional divergence of the economic development level, measured by the two methods. Thus, the level of the regional GDP/capita is different from its national value by an average dispersion (D) ranging from minimum 23.0 % (2004) to maximum 27.2 % (2006) in the period 2002–2006 (Graph 6).
Source: own calculations, on the date base from Teritorial Statistics 2008, INS;
22,5
27,5
32,5
37,5
42,5
2002 2003 2004 2005 2006
( % )
5500,0
6000,0
6500,0
7000,0
7500,0
8000,0
8500,0
9000,0
9500,0
( PPS
/ ca
pita
)
Var. Coeff. of Dispersion of reg. PIB (%) Reg. Disparity Index (%) Reg. GDP / capita (PPS)
FIT_IEA_1009
Graph 6. Correlation between the economic growth and the regional convergence in real economy.

Filon Toderoiu 18 176
Thus, at macro-economic level, even under the background of a steady economic growth process in the period 2002–2006, the slight increasing trend of regional cohesion in the period 2002–2004 (decreasing D and RDI), is followed by a regressive trend of this qualitative characteristic of development, in the period 2005–2006 (increasing D and RDI).
3.5. Regional convergence in real economy – the case of agriculture in Romania
As land is one of the main components of the so-called fundamental economic “trinities” (labour – land – capital), the approach to the internal regional convergence, applied to agriculture, as main activity in the rural area, comes to complete the “picture” and the manifest tendencies in the general economic convergence process, generating social cohesion.
Among the indicators on the basis of which the quantification of the convergence process in agriculture is attempted, by applying the same methodology, in a first instance land productivity was chosen, measured by the agricultural output value (recalculated in comparable prices 2007) per agricultural hectare.
In this context, we consider it useful to briefly present the dynamics of agricultural production in the period 1989–2007, both total production and the production in the private sector. (Graph 7).
Source: own calculations, on the date base from TEMPO-Online, INS, 2009;
0,900
1,000
1,100
1,200
1,300
1,400
1,500
1,600
1,700
1989 1990 1991 1992 1993 1994 1995 1996 1997 1998 1999 2000 2001 2002 2003 2004 2005 2006 2007
(200
0 =
1)
0,200
0,400
0,600
0,800
1,000
1,200
1,400
1,600
1,800
(200
0 =
1)
Agric. Output Value - total Agric. Output Value - cropsAgric. Output Value - livestocks Agric.Output Value - priv.ownership - totalAgric.Output Value - priv.ownership - crops Agric.Output Value - priv.ownership - livestocksFIT_IEA_1109
Graph 7. Agricultural production dynamics in Romania, 1989–2007 (2000 = 1).
The value of total agricultural output in the year 2007 was by about 5.7 % lower than in the year 1989; throughout the investigated period, four intervals with decreased values were found, at different yearly rates (1.07 % in 1990–1991, 13.3 % in 1992, 3.61 % in 1997–2000 and 9.86 % in 2005–2007), and two intervals of

19 Real Economic Convergence – European and National Dimension 177
production increase (3.98 % in 1993–1996 and 10.7 % in 2001–2004). The crop production experienced both stronger decrease and more intense increase in the same 18-year period.
It is interesting to notice that the agricultural production in the private sector had growth rates higher than the aggregate and decrease rates lower than the aggregate; the intensity differences of the modifications can be explained, among others, by the presumed quality gap of production management between the private and the public sector. The economic convergence process was quantified on the basis of agriculture with reference to the period 1994–2007, for which relevant statistical data exist at the level of development regions and counties.
The particularity of agriculture, in general, and of the crop production, in particular, to be much more dependent on the weather conditions compared to other branches of national economy can be revealed on the basis of the variation coefficient, which reached 11,87 % in the mentioned period, ranging from minimum 9.15 % (in the region R12 – Center) to maximum 21.58 % (in the region R41 – South-West).
Under the background of a yearly average variation of agricultural land productivity of 10.44 % (measured by the agricultural output value, in 2007 prices, per agricultural hectare), the average regional dispersion of this convergence indicator had different values, from minimum 10.66 % (1997) to maximum 15.82 % (2002) (Graph 8).
Source: own calculations, on the date base from TEMPO-Online, INS, 2009;
1,700
1,900
2,100
2,300
2,500
2,700
2,900
1994 1995 1996 1997 1998 1999 2000 2001 2002 2003 2004 2005 2006 2007
Tsd.
RO
N '0
7 / H
a ag
rico
l)
10,00
11,00
12,00
13,00
14,00
15,00
16,00
( % )
Nat. Average of Land Productivity Variation Coeff. of regional DispersionFIT_IEA_1109
Graph 8. Land productivity and its regional dispersion variation, 1994–2007.
It is worth mentioning the almost symmetrically opposed “behaviour” of the two indicators, as in the periods characterized by land productivity growth the regional convergence increases (or in other words the regional divergence decreases), while in the periods when productivity decreases, the regional dispersion increases.

Filon Toderoiu 20 178
4. CONCLUSIONS AND OPENINGS
1. In Romania, the governmental policy related to the economic-social convergence has a relatively diffused formulation, being somehow subordinated to the regional development policy, for which the Convergence Program 2008 – 2011 envisages two objectives: diminution of the current regional disequilibria and a balanced regional development.
2. The complex economic-social convergence process in any country or community of states can be approached from two perspectives: as stage of convergence fulfillment and as intensity of the convergence fulfillment process.
3. The general statistical analysis of the convergence process is based upon two sets of relevant indicators: economic structure indicators and economic performance indicators.
4. The regional economic environment is shaped by three large groups of factors that influence the entrepreneurial spirit, more exactly by macro-climate specific factors, micro-climate specific factors and factors specific to each individual in part.
5. The regional competitiveness attempts to measure the economic prosperity level of regions, by constructing a set of indicators and then, by comparing the results by regions, in order to quantify the success achieved by each region in part.
6. In the decade 1996–2006, the Central and East-European countries experienced a strong real convergence to the EU, in terms of GDP/capita and productivity.
7. The regional GDP/capita (expressed in PPS) was considerably different, in the year 2006, in the 275 regions of the EU-27; the gap ranged from 336% (Inner London) to 25% (North-East region, Romania).
8. With all the visible economic convergence progress, by comparing the three-year averages 1999–2001 and 2004–2006, it was found out that only 5 of the 275 regions exceeded the limit of 75 % of the EU-27 average (among which one region from Romania).
9. The group of the less economically developed 20 regions of EU-27, where 7.5 % of the population lived, advanced in the investigated period (2001–2006), in the sense that its GDP/capita was up from 28.2 % to 33.2 % of the Community average of this indicator, also as a consequence of the strong economic recovery process in Bulgaria and Romania.
10. In a panel of six Member States from EU-27 (Romania, the Czech Republic, Hungary, Slovakia and France), the economic development in the period 1995–2005 was accompanied, contrary to expectations, by a process of regional disparities increase of regional GDP/capita.
11. In Romania, the average regional dispersion increased from 12.8 % (1995) to 31.9 % (2005), which means a yearly growth rate of regional disparities

21 Real Economic Convergence – European and National Dimension 179
of 9.56 %. This strong tendency of economic divergence manifestation in the territory outstrips by far the situation of other East-European countries.
12. The relatively fast increase of the regional economic divergence in Romania, in the period 1996–2005, led to the situation that in the years 2000 and 2005, the quasi-totality of the countries taken into consideration had average regional dispersion levels of the GDP/capita lower than Romania.
13. The placing of the three regions with lower general economic development level and with a more pregnant agrarian character (North-East, South-East and South-Muntenia) on the last three positions of the decreasing hierarchy of the SMEs density / 1000 inhabitants reconfirms, in our opinion, the presumption that in the poor regions the business environment seems to be less stimulating for the establishment of small and medium-sized enterprises.
14. By applying the first analytical method, it results that the levels of the average nominal turnover per SME in the eight regions differ from its national value, in the period 1998–2006, by an average ranging from minimum 15.3 % (2003) to maximum 23.9 % (2001), with oscillating evolutions in this period (decreasing trend in the period 1998–2003 and increasing trend in the period 2004–2006).
15. The behaviour in time of the regional dispersion of the average nominal turnover per SME can reveal that the economic growth process should be accompanied by a regional convergence of this indicator, as true support of an improved social cohesion in the territorial development.
16. At macroeconomic level, even under the background of a steady economic growth in the period 2002–2006, the slight tendency towards an increased regional cohesion in the period 2002–2004 (decreasing D and RDI) is followed by a regressive trend of this qualitative characteristic of development, in the period 2005–2006 (increasing D and RDI).
17. For the quantification of the convergence process in agriculture, land productivity was first taken into consideration, measured by the agricultural output value (recalculated in comparable 2007 prices) per agricultural hectare.
18. The value of total agricultural output in 2007 was by about 5.7 % lower than in 1989; throughout the period, this indicator decreased in four periods, by different yearly rates (1.07 % in 1990–91, 13.3 % in 1992, 3.61 % in 1997–2000 and 9.86 % in 2005–07), and it increased in two periods (3.98 % in 1993–96 and 10.7 % in 2001–04).
19. Under the background of an average yearly variation of agricultural land productivity of 10.44 %, the average regional dispersion of this convergence indicator experienced various levels, ranging from minimum 10.66 % (1997) to maximum 15.82 % (2002).
20. It is worth mentioning the almost symmetrically opposite “behaviour” of the two indicators, in the sense that in the periods when land productivity increased, the regional convergence also increased (or in other words the regional
Filon Toderoiu 22 180
divergence decreased), while in the periods when productivity decreased, the regional dispersion increased.
REFERENCES
1. Krueger A. (2009), “Narrowing speed in regional GDP”, Eurostat Statistic in focus. 2. Pecican, E. St. (2009), “Indicatori privind convergenţa reală şi aplicaţiile acestora”, în Iancu, A.,
(coord.) “Convergenţa economică”, Ed. Academiei Române, Bucureşti. 3. Quah, D. T. (1996), “Regional convergence clusters across Europe”, European Economic Review, vol.
40. 4. Vincze, M. (2002), Regional competitiveness in Romania, Working Paper, World Bank, Bucharest 5. von Hagen, J., Siedschlag, I., 2008, “Managing capital flows Europe”, in ADB Institute Discussion
Paper, 103. 6. Zaman, Gh., Georgescu, G. (2009), “Structural fund absorption: a new challenge for Romania”, în:
Romanian Journal of Economic Forecasting (RJEF), Nr. 1, pp 138–154. 7. *** ”Policy guidelines for regions falling under the new new competitiveness...”, Vol. I, Statistical
analysis, Csil Milano, dec. 2005. 8. *** Programul de Convergenta 2008–2011, Guvernul Romaniei, Mai 2009. 9. *** Observatory of European SMEs – Analytical Report, Flash Eurobarometer 196, May 2007. 10. *** MittelstandsMonitor 2009, IfMF, Bonn. 11. *** Eurostat, Statistik kurz gefasst, Nr. 31/2008, Unternehmen nach Groessenklassen – Ueberblick
ueber KMU in der EU. 12. *** Carta Albă a IMM – urilor din România 2008. 13. *** GEA 2007, Manual de Evaluare a Competitivităţii Regionale. 14. *** Eurostat Regional Yearbook 2008. 15. *** Regional Disparities and per capita GDP in 1995–2005, în European Economy, Nr. 1/2009. 16. *** Eurostat Jahrbuch der Regionen 2009”, European Commission, ISSN 1830–9690.