ReadMON: A Portable Readout System for the CERN PH ...
8
1700 IEEE TRANSACTIONS ON NUCLEAR SCIENCE, VOL. 65, NO. 8, AUGUST 2018 ReadMON: A Portable Readout System for the CERN PH-RADMON Sensors Isidre Mateu , Maurice Glaser, Georgi Gorine , Student Member, IEEE, Michael Moll , Giuseppe Pezzullo, and Federico Ravotti, Member, IEEE Abstract— PH-RADMON sensors are extensively used for radi- ation monitoring in the large hadron collider (LHC) experiments. Here, ReadMON, a dedicated and portable readout system for non-LHC applications, is presented. The system is able to source currents up to 32 mA and measure voltages up to 125 V, covering the full operational range of all dosimeters onboard the PH-RADMON sensor. Thus, the total measurement range of the system goes from 0.01 Gy to hundreds of kilogray total ionizing dose, and from few 10 10 to 10 15 n eq /cm 2 1-MeV neutron equivalent fluence. Different tests have been carried out at CERN IRRAD facility to prove the system concept and analyze its performance. Errors of only a few percent with respect to the readout done with a commercial source-measuring unit were found. Index Terms— Dosimetry, radiation monitoring, readout systems. I. I NTRODUCTION M ONITORING of the total ionizing dose (TID) and 1-MeV neutron equivalent fluence (eq) is performed at CERN large hadron collider (LHC) experiments using a series of dosimeters integrated on a unique carrier printed cir- cuit board (PCB) known as PH-RADMON sensor [1] (Fig. 1). All the dosimeters show excellent reproducibility and have been calibrated in different radiation environments. As a result of these tests, a set of calibration curves have been defined for each type of device [2]. Depending on the required range and sensitivity of the measurement, the sensor can be equipped with different devices: RadFETs for the TID measurement and silicon p-i-n diodes to monitor eq. Tables I and II summarize different dosimeters that will be referred in this paper, together with their main operational characteristics. In the case of RadFETs, the expected radiation fields have been taken into account in choosing the most appropriate devices for CERN applications [1]. If the RadFET is operated under zero bias, the thickness of the gate oxide layer plays a crucial role in the probability of recombination of the generated electron– hole pairs within the oxide and hence in the device response to different linear energy transfer (LET) radiations [3]. Manuscript received September 29, 2017; revised December 1, 2017; accepted December 1, 2017. Date of publication December 18, 2017; date of current version August 15, 2018. This work was supported by the European Union’s Horizon 2020 Research and Innovation Program under Grant 654168. The authors are with the Experimental Physics Department, CERN, CH-1211 Geneva, Switzerland (e-mail: [email protected]; [email protected]; [email protected]; [email protected]; [email protected]; [email protected]). Color versions of one or more of the figures in this paper are available online at http://ieeexplore.ieee.org. Digital Object Identifier 10.1109/TNS.2017.2784684 Fig. 1. PH-RADMON sensor consists in a carrier PCB mounting up to 11 devices (RadFETs and/or p-i-n diodes, temperature sensors, and test resistors). TABLE I CHARACTERISTICS AND READOUT PARAMETERS FOR THE p-i-n DIODES TABLE II CHARACTERISTICS AND READOUT PARAMETERS FOR THE RADFETs Thus, the Radiation Experiments and Monitors (REM) dosime- ters, with thin-gate-oxide layers (130 or 250 nm), show the best response for variable LET radiation, up to doses of 10 5 Gy. On the other hand, to achieve a better sensitivity for doses below 10 Gy, the Laboratory of Analysis and Architecture of Systems (LAAS) dosimeter (with a gate oxide thickness of 1600 nm) has been chosen. In the case of p-i-n diodes, the devices were also selected to cover different This work is licensed under a Creative Commons Attribution 3.0 License. For more information, see http://creativecommons.org/licenses/by/3.0/
-
Upload
khangminh22 -
Category
Documents
-
view
0 -
download
0
Transcript of ReadMON: A Portable Readout System for the CERN PH ...
1700 IEEE TRANSACTIONS ON NUCLEAR SCIENCE, VOL. 65, NO. 8, AUGUST 2018
ReadMON: A Portable Readout System for theCERN PH-RADMON Sensors
Isidre Mateu , Maurice Glaser, Georgi Gorine , Student Member, IEEE, Michael Moll ,Giuseppe Pezzullo, and Federico Ravotti, Member, IEEE
Abstract— PH-RADMON sensors are extensively used for radi-ation monitoring in the large hadron collider (LHC) experiments.Here, ReadMON, a dedicated and portable readout system fornon-LHC applications, is presented. The system is able to sourcecurrents up to 32 mA and measure voltages up to 125 V,covering the full operational range of all dosimeters onboardthe PH-RADMON sensor. Thus, the total measurement rangeof the system goes from 0.01 Gy to hundreds of kilogray totalionizing dose, and from few 1010 to 1015 neq/cm2 1-MeV neutronequivalent fluence. Different tests have been carried out at CERNIRRAD facility to prove the system concept and analyze itsperformance. Errors of only a few percent with respect to thereadout done with a commercial source-measuring unit werefound.
Index Terms— Dosimetry, radiation monitoring, readoutsystems.
I. INTRODUCTION
MONITORING of the total ionizing dose (TID) and1-MeV neutron equivalent fluence (�eq) is performed
at CERN large hadron collider (LHC) experiments using aseries of dosimeters integrated on a unique carrier printed cir-cuit board (PCB) known as PH-RADMON sensor [1] (Fig. 1).All the dosimeters show excellent reproducibility and havebeen calibrated in different radiation environments. As a resultof these tests, a set of calibration curves have been defined foreach type of device [2]. Depending on the required range andsensitivity of the measurement, the sensor can be equippedwith different devices: RadFETs for the TID measurementand silicon p-i-n diodes to monitor �eq. Tables I and IIsummarize different dosimeters that will be referred in thispaper, together with their main operational characteristics.In the case of RadFETs, the expected radiation fields have beentaken into account in choosing the most appropriate devices forCERN applications [1]. If the RadFET is operated under zerobias, the thickness of the gate oxide layer plays a crucial rolein the probability of recombination of the generated electron–hole pairs within the oxide and hence in the device responseto different linear energy transfer (LET) radiations [3].
Manuscript received September 29, 2017; revised December 1, 2017;accepted December 1, 2017. Date of publication December 18, 2017; date ofcurrent version August 15, 2018. This work was supported by the EuropeanUnion’s Horizon 2020 Research and Innovation Program under Grant 654168.
The authors are with the Experimental Physics Department,CERN, CH-1211 Geneva, Switzerland (e-mail: [email protected];[email protected]; [email protected]; [email protected];[email protected]; [email protected]).
Color versions of one or more of the figures in this paper are availableonline at http://ieeexplore.ieee.org.
Digital Object Identifier 10.1109/TNS.2017.2784684
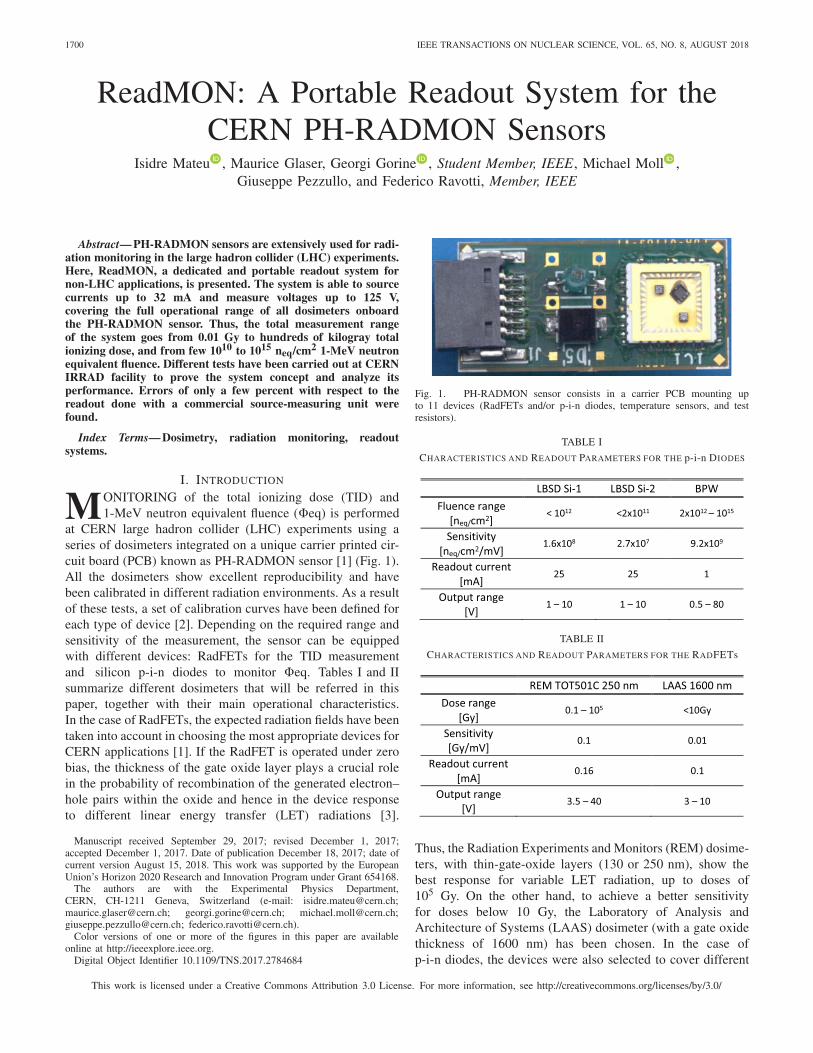
Fig. 1. PH-RADMON sensor consists in a carrier PCB mounting upto 11 devices (RadFETs and/or p-i-n diodes, temperature sensors, and testresistors).
TABLE I
CHARACTERISTICS AND READOUT PARAMETERS FOR THE p-i-n DIODES
TABLE II
CHARACTERISTICS AND READOUT PARAMETERS FOR THE RADFETs
Thus, the Radiation Experiments and Monitors (REM) dosime-ters, with thin-gate-oxide layers (130 or 250 nm), show thebest response for variable LET radiation, up to doses of105 Gy. On the other hand, to achieve a better sensitivityfor doses below 10 Gy, the Laboratory of Analysis andArchitecture of Systems (LAAS) dosimeter (with a gate oxidethickness of 1600 nm) has been chosen. In the case ofp-i-n diodes, the devices were also selected to cover different
This work is licensed under a Creative Commons Attribution 3.0 License. For more information, see http://creativecommons.org/licenses/by/3.0/

MATEU et al.: PORTABLE READOUT SYSTEM FOR CERN PH-RADMON SENSORS 1701
ranges of operation. Provided the readout currents are theones indicated in Table I, the long base silicon diode (LBSD)sensor is capable of measuring fluence below 1012 neq/cm2
with a sensitivity of 1.6 × 10⁸ neq/cm2/mV, while the BPWdevice can monitor levels up to 1015 neq/cm2 with a sensitivityof 9.2 × 10⁹ neq/cm2/mV.
More than 250 PH-RADMON sensors have been installedin the LHC experiments since 2006. In order to fulfill therequirement of integrating the radiation field intensities invarious detector control systems (DCS) of the experiments,distributed readout systems, based on specific hardware (oftenimposed by the DCS architecture chosen by the experimentsthemselves), are needed for their readout [4]. This results incomplex system architectures. Moreover, often, the maximumoutput value dose or fluence that can be measured with thesesystems is limited by the maximum rail voltage of the powersupply (dimensioned to cope with the radiation expected inthe area where the sensor is installed), rather than from thedevice itself, qualified and calibrated up to higher voltages(e.g., higher radiation levels).
Besides the LHC, PH-RADMON sensors are regularly sup-plied to other experiments (inside but also outside CERN [5]).In those cases, the users can set up their own readout sys-tem or use the sensors in a passive mode, i.e., without activereadout [1]. This implies removing it from the experimentand moving it to a laboratory with the appropriate readoutequipment. For these applications, a compact and portablereadout unit, which could be provided to the users togetherwith the sensors, is of clear interest.
The development of such system, the PH-RADMON reader(ReadMON), is ongoing within the Irradiation Facilities Teamin the Experimental Physics Department at CERN [6]. Theproject is in an advanced phase, with already a consolidateddesign and a few assembled prototypes. The unit is able toexploit the full range of all the above-mentioned dosimeters,thus featuring a total measurement range from 0.01 Gy to hun-dreds of kilogray in TID, and from few 1010 to 1015 neq/cm2
in �eq. In order to maintain the total uncertainty of the finaldosimetry measurement below 15%, we set as a goal that theoverall contribution of the readout system to this uncertaintyshould be lower than 5%. Besides its natural application asa dosimetry reference for high energy physics experimentsand/or irradiation facilities, this system could also be ofinterest in other fields where radiation monitoring is required,such as nuclear [7], industry [8], medical therapy [9], [10]or material testing. Last, but not least, the performance ofthis full dosimetry system makes it also attractive for possiblequalification in space applications.
As a proof of concept, one prototype was tested atCERN IRRAD proton facility [11] in 2016 and another oneis currently under test in the GIF++ Gamma IrradiationFacility [12]. Further tests are also ongoing in IRRAD usinga more sophisticated test bench, which allows a quantitativeassessment of the system performance. The results of thetests carried out in IRRAD, preceded by a general descrip-tion of the developed ReadMON unit, are presented in thispaper.
Fig. 2. ReadMON architecture. The system is based on an Arduino YUNmicrocontroller board with Ethernet and Wi-Fi connectivity. A dc–dc converterprovides the readout current dosimeter, and a monitor signal proportionalto the readout voltage. A switching module allows selecting the specificdosimeter to be read out from up to eight PH-RADMON sensors.
II. READMON CONCEPT
A. Readout Principle
The measurable effect of ionizing radiation in a RadFET isa shift of the transistor gate threshold voltage as a consequenceof the buildup of positive charge in the gate oxide [13]. Thiseffect is observable even at zero gate bias of the transistor, thusallowing it to be read out as a two-terminal device. By simplyinjecting a controlled current, the shift in threshold voltagecan be measured. All the RadFET dosimeters qualified forusage in the LHC experiments were calibrated for zero-biasoperation.
p-i-n diode dosimeters exploit instead the decrease in con-ductivity of the intrinsic silicon layer, or base, with increasingparticle fluence. This effect is due to the creation of permanentdefects in the silicon lattice, which act as recombinationcenters for minority carriers in the semiconductor [14]. Thedecrease in conductivity (i.e., increase of resistance) translatesinto a positive shift of the measured voltage when applying acurrent pulse in the forward bias direction.
Since both p-i-n diodes and RadFETs share the samereadout principle (measurement of the output voltage wheninjecting a current pulse on a two terminal device), the samecurrent source can be used for the readout of both devices.However, the optimal currents for the readout of every singledevice as well as the range of measured voltages vary signifi-cantly from one device to another, as shown in Tables I and II.These optimal currents are defined, in the case of the RadFETs,as the current at which the thermal effects on the outputvoltage are minimized; in the case of p-i-n diodes, as the onethat maximizes the voltage drop on the diode base, and thus,the sensitivity to resistance changes [1].
B. System Architecture
The ReadMON architecture is shown in Fig. 2. It relieson an Arduino YUN microcontroller board, which includestwo microprocessors and is equipped with Ethernet and Wi-Fiinterfaces.
1702 IEEE TRANSACTIONS ON NUCLEAR SCIENCE, VOL. 65, NO. 8, AUGUST 2018
The first microprocessor (ATmega32u4) runs the readoutsequence by controlling the rest of the ReadMON elec-tronics through the microcontroller input–output terminals.The main element of this electronics is a dc–dc converter(1/8AA12 model from Ultravolt) equipped with a feedbackloop enabling it to function as a current source, which isused to supply the readout current to each dosimeter. A 16-bitdigital to analog converter is used by the microprocessor tocontrol two input signals of the dc–dc converter: one to set avoltage limit, and the other to select the current to be sourced.Conversely, a 16-bit analog to digital converter (ADC) sam-ples two output signals (monitors) which are proportional,respectively, to the current and voltage supplied by the dc–dcconverter. The measurement of the dosimeter output is finallygiven by this voltage monitor signal.
Dosimeters are read out one at a time, and two multiplexinglevels are needed to connect the dc–dc converter output toa specific channel: the first level selects one among eightPH-RADMON sensors, while the second selects one among11 channels onboard the sensor (the 12th channel being thecommon ground). A typical RADMON board is equippedwith a temperature sensor, a test resistor, and up to ninedosimeters. Thus, in total, the system can address up to72 single dosimeters, eight test resistors, and eight temperaturesensors,
The second microprocessor (Atheros AR9331) runs aLinux distribution in which an application programming inter-face (API) is implemented. Using simple HTTP requests,the user is able to configure the acquisition settings andretrieve the data, thus allowing the flexibility to integrate theReadMON in more complex data acquisition systems. For thesimplest case of a stand-alone system, a built-in web interfaceis under development. The data can be stored locally in thesecure digital memory card and/or in a remote database.
C. System Capabilities
The exploitation of the full operational range of allPH-RADMON dosimeters (Tables I and II) was the driver forthe choice of the dc–dc converter. The chosen unit fulfills therequirement, as it can source a current up to 32 mA, with avoltage limit of 125 V. This broad range in current and voltagemakes the ReadMON compatible with other commerciallyavailable sensors [15], [16], as well as new ones based ondifferent technologies [17].
The stabilization time is defined here as the time neededfor the current delivered by the output of the dc–dc converterto reach a value within 5% of the final voltage after a suddenchange of the current setting. The 5% threshold is establishedin order to keep the total uncertainty of the measurementreasonably low, as explained in Section I.
The stabilization time sets the lower limit for the currentpulse duration and is important in the case of p-i-n diodessince keeping these devices under bias too long time during thereadout leads to a loss of signal due to self-heating effects [18].For RadFET devices, the current pulse has to be long enoughto minimize the “drift up” of the output voltage [19].
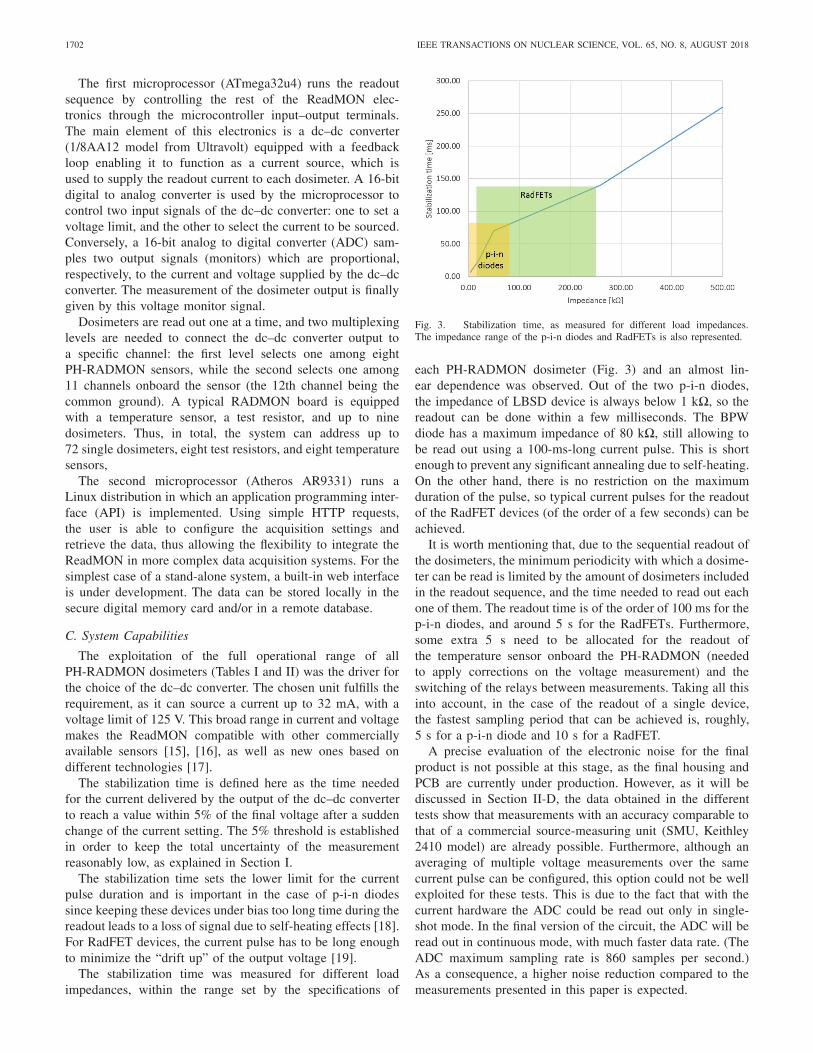
The stabilization time was measured for different loadimpedances, within the range set by the specifications of
Fig. 3. Stabilization time, as measured for different load impedances.The impedance range of the p-i-n diodes and RadFETs is also represented.
each PH-RADMON dosimeter (Fig. 3) and an almost lin-ear dependence was observed. Out of the two p-i-n diodes,the impedance of LBSD device is always below 1 k�, so thereadout can be done within a few milliseconds. The BPWdiode has a maximum impedance of 80 k�, still allowing tobe read out using a 100-ms-long current pulse. This is shortenough to prevent any significant annealing due to self-heating.On the other hand, there is no restriction on the maximumduration of the pulse, so typical current pulses for the readoutof the RadFET devices (of the order of a few seconds) can beachieved.
It is worth mentioning that, due to the sequential readout ofthe dosimeters, the minimum periodicity with which a dosime-ter can be read is limited by the amount of dosimeters includedin the readout sequence, and the time needed to read out eachone of them. The readout time is of the order of 100 ms for thep-i-n diodes, and around 5 s for the RadFETs. Furthermore,some extra 5 s need to be allocated for the readout ofthe temperature sensor onboard the PH-RADMON (neededto apply corrections on the voltage measurement) and theswitching of the relays between measurements. Taking all thisinto account, in the case of the readout of a single device,the fastest sampling period that can be achieved is, roughly,5 s for a p-i-n diode and 10 s for a RadFET.
A precise evaluation of the electronic noise for the finalproduct is not possible at this stage, as the final housing andPCB are currently under production. However, as it will bediscussed in Section II-D, the data obtained in the differenttests show that measurements with an accuracy comparable tothat of a commercial source-measuring unit (SMU, Keithley2410 model) are already possible. Furthermore, although anaveraging of multiple voltage measurements over the samecurrent pulse can be configured, this option could not be wellexploited for these tests. This is due to the fact that with thecurrent hardware the ADC could be read out only in single-shot mode. In the final version of the circuit, the ADC will beread out in continuous mode, with much faster data rate. (TheADC maximum sampling rate is 860 samples per second.)As a consequence, a higher noise reduction compared to themeasurements presented in this paper is expected.
MATEU et al.: PORTABLE READOUT SYSTEM FOR CERN PH-RADMON SENSORS 1703
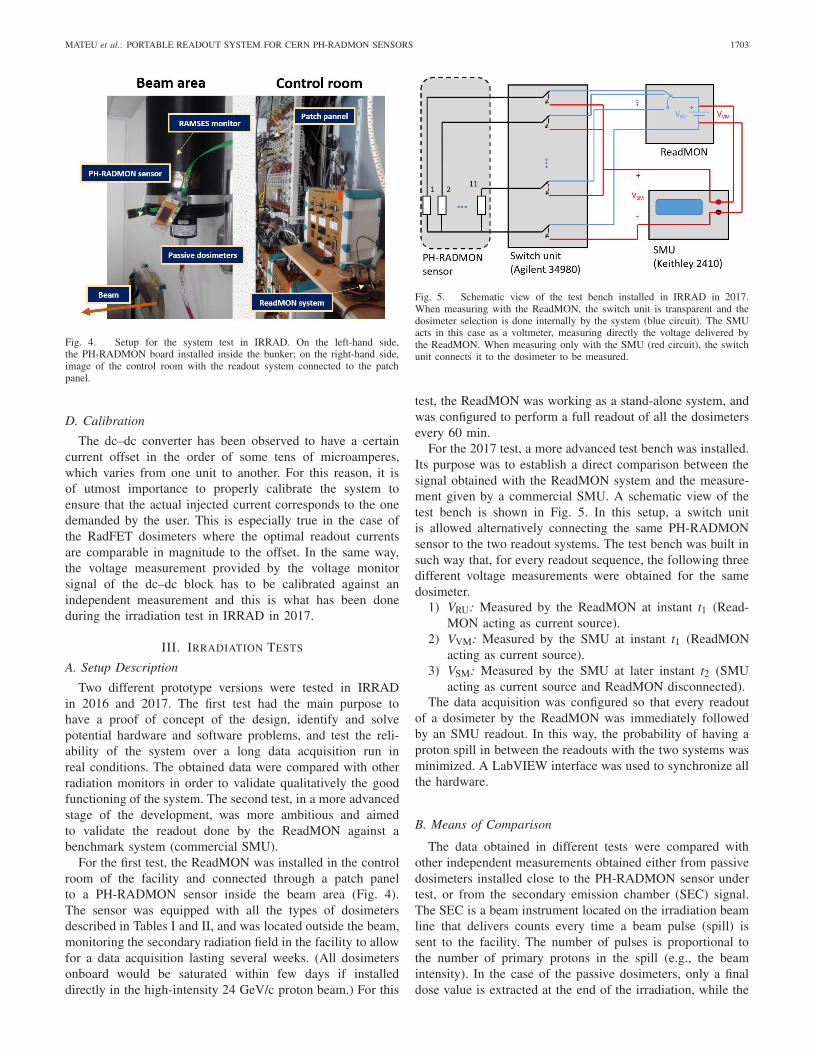
Fig. 4. Setup for the system test in IRRAD. On the left-hand side,the PH-RADMON board installed inside the bunker; on the right-hand side,image of the control room with the readout system connected to the patchpanel.
D. Calibration
The dc–dc converter has been observed to have a certaincurrent offset in the order of some tens of microamperes,which varies from one unit to another. For this reason, it isof utmost importance to properly calibrate the system toensure that the actual injected current corresponds to the onedemanded by the user. This is especially true in the case ofthe RadFET dosimeters where the optimal readout currentsare comparable in magnitude to the offset. In the same way,the voltage measurement provided by the voltage monitorsignal of the dc–dc block has to be calibrated against anindependent measurement and this is what has been doneduring the irradiation test in IRRAD in 2017.
III. IRRADIATION TESTS
A. Setup Description
Two different prototype versions were tested in IRRADin 2016 and 2017. The first test had the main purpose tohave a proof of concept of the design, identify and solvepotential hardware and software problems, and test the reli-ability of the system over a long data acquisition run inreal conditions. The obtained data were compared with otherradiation monitors in order to validate qualitatively the goodfunctioning of the system. The second test, in a more advancedstage of the development, was more ambitious and aimedto validate the readout done by the ReadMON against abenchmark system (commercial SMU).
For the first test, the ReadMON was installed in the controlroom of the facility and connected through a patch panelto a PH-RADMON sensor inside the beam area (Fig. 4).The sensor was equipped with all the types of dosimetersdescribed in Tables I and II, and was located outside the beam,monitoring the secondary radiation field in the facility to allowfor a data acquisition lasting several weeks. (All dosimetersonboard would be saturated within few days if installeddirectly in the high-intensity 24 GeV/c proton beam.) For this
Fig. 5. Schematic view of the test bench installed in IRRAD in 2017.When measuring with the ReadMON, the switch unit is transparent and thedosimeter selection is done internally by the system (blue circuit). The SMUacts in this case as a voltmeter, measuring directly the voltage delivered bythe ReadMON. When measuring only with the SMU (red circuit), the switchunit connects it to the dosimeter to be measured.
test, the ReadMON was working as a stand-alone system, andwas configured to perform a full readout of all the dosimetersevery 60 min.
For the 2017 test, a more advanced test bench was installed.Its purpose was to establish a direct comparison between thesignal obtained with the ReadMON system and the measure-ment given by a commercial SMU. A schematic view of thetest bench is shown in Fig. 5. In this setup, a switch unitis allowed alternatively connecting the same PH-RADMONsensor to the two readout systems. The test bench was built insuch way that, for every readout sequence, the following threedifferent voltage measurements were obtained for the samedosimeter.
1) VRU: Measured by the ReadMON at instant t1 (Read-MON acting as current source).
2) VVM: Measured by the SMU at instant t1 (ReadMONacting as current source).
3) VSM: Measured by the SMU at later instant t2 (SMUacting as current source and ReadMON disconnected).
The data acquisition was configured so that every readoutof a dosimeter by the ReadMON was immediately followedby an SMU readout. In this way, the probability of having aproton spill in between the readouts with the two systems wasminimized. A LabVIEW interface was used to synchronize allthe hardware.
B. Means of Comparison
The data obtained in different tests were compared withother independent measurements obtained either from passivedosimeters installed close to the PH-RADMON sensor undertest, or from the secondary emission chamber (SEC) signal.The SEC is a beam instrument located on the irradiation beamline that delivers counts every time a beam pulse (spill) issent to the facility. The number of pulses is proportional tothe number of primary protons in the spill (e.g., the beamintensity). In the case of the passive dosimeters, only a finaldose value is extracted at the end of the irradiation, while the
1704 IEEE TRANSACTIONS ON NUCLEAR SCIENCE, VOL. 65, NO. 8, AUGUST 2018
SEC data being logged continuously allow for a comparisonduring the whole acquisition period.
Different passive dosimeters were used in the tests:Gafchromic film (GaF) [20], radio-photoluminescentglass (RPL) [21], and polymer-alanine detector (PAD) [22].GaF being a polymer has a higher sensitivity to neutrons,which are the predominant particle in the secondary radiationfield of IRRAD, while PAD gives a dose measurementequivalent to that of tissue. The dose measured by theRadFETs is expected to be closer to the one measured bythe RPL, which has a material composition and radiationresponse similar to silicon for highly energetic particles.
C. Calibration Procedure
As it has been discussed in Section II-D, the dc–dc converterneeds to be calibrated in terms of injected current and readoutvoltage. This was not taken into account for the first test inIRRAD, where the interest was centered mainly in demon-strating the working principle of the system. For the secondtest, the test bench described in Fig. 5 was also used forthe calibration of the ReadMON prior to the test. To do so,different resistor values, which covered the range of impedancevalues of different PH-RADMON dosimeters, were used. Thecalibration was done in three steps as follow.
1) The SMU was used to accurately measure each resistorvalue (R).
2) With the ReadMON acting as the current source, a cor-rection curve, VVM versus VRU, was built.
3) The information on the resistor value and the voltageallowed to calculate the real current delivered by the unitand construct a second correction curve for the currentsetting (Iset versus VVM/R).
In both cases, the calibration curves were fit with sim-ple linear equations. In view of the results presentedin Sections III-D and III-E, it seems reasonable to explore thepossibility of having different calibration parameters depend-ing on the region of operation of the system.
D. Influence of Temperature
The readout of all dosimeters was performed by inject-ing the current defined in Tables I and II, which minimizethe effect of temperature variations on the output voltage.Moreover, the temperature in the IRRAD facility is controlledaround 21 °C. Thus, errors due to temperature variations onall acquired data are expected to be negligible.
E. Results
In order to qualitatively assess the correct functioning ofthe system, the data obtained from the first test in IRRADin 2016 were compared against the radiation field intensitymeasured by the SEC.
A very good agreement between the dose and fluence valuesmeasured by the ReadMON and the SEC signal trend wasfound in the ranges of operation of all dosimeters. All thedata were converted from voltage to dose or fluence using thecalibration curves established in [1]. As an example, the dose
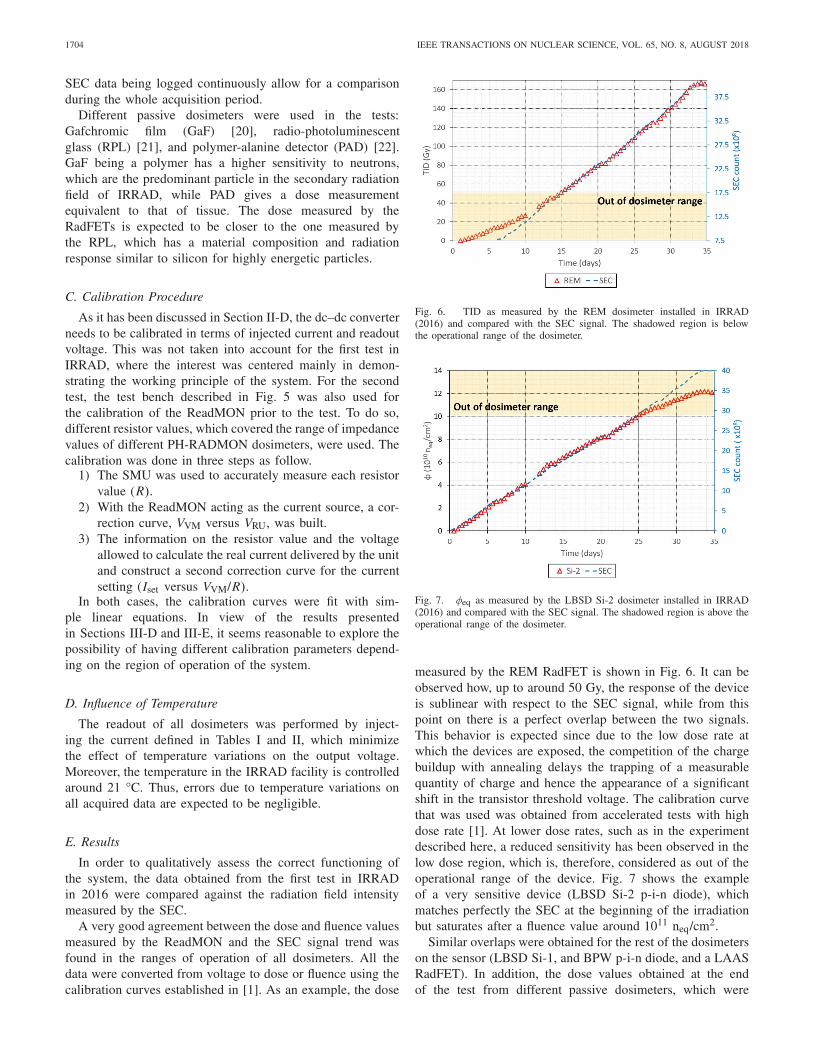
Fig. 6. TID as measured by the REM dosimeter installed in IRRAD(2016) and compared with the SEC signal. The shadowed region is belowthe operational range of the dosimeter.
Fig. 7. φeq as measured by the LBSD Si-2 dosimeter installed in IRRAD(2016) and compared with the SEC signal. The shadowed region is above theoperational range of the dosimeter.
measured by the REM RadFET is shown in Fig. 6. It can beobserved how, up to around 50 Gy, the response of the deviceis sublinear with respect to the SEC signal, while from thispoint on there is a perfect overlap between the two signals.This behavior is expected since due to the low dose rate atwhich the devices are exposed, the competition of the chargebuildup with annealing delays the trapping of a measurablequantity of charge and hence the appearance of a significantshift in the transistor threshold voltage. The calibration curvethat was used was obtained from accelerated tests with highdose rate [1]. At lower dose rates, such as in the experimentdescribed here, a reduced sensitivity has been observed in thelow dose region, which is, therefore, considered as out of theoperational range of the device. Fig. 7 shows the exampleof a very sensitive device (LBSD Si-2 p-i-n diode), whichmatches perfectly the SEC at the beginning of the irradiationbut saturates after a fluence value around 1011 neq/cm2.
Similar overlaps were obtained for the rest of the dosimeterson the sensor (LBSD Si-1, and BPW p-i-n diode, and a LAASRadFET). In addition, the dose values obtained at the endof the test from different passive dosimeters, which were

MATEU et al.: PORTABLE READOUT SYSTEM FOR CERN PH-RADMON SENSORS 1705
TABLE III
RESULTS OF THE PASSIVE DOSIMETERS INSTALLED IN IRRAD IN 2016
Fig. 8. Comparison of raw voltages obtained with the ReadMON andan SMU, for the LAAS and Si-1 dosimeters onboard the RADMON sensorinstalled in IRRAD (2017).
exposed together with the PH-RADMON sensor, are sum-marized in Table III. A reasonably good agreement is foundbetween the final dose measured by the REM RadFET, 170 Gy,and the one obtained from the RPL dosimeter (205 Gy), which,as already discussed, is the one expected to give the closestdose to silicon. The outcome of this test was very encouraging.The working principle of the system was proven, and itsreliability over more than one month of data acquisition wasverified. Moreover, a basic analysis of the data showed consis-tent results with respect to the IRRAD beam instrumentationand the passive dosimetry measurements performed in parallel.However, it was still necessary to quantify the accuracy andprecision of the readout performed by the system. For thisreason, the second setup currently installed in IRRAD allowsto benchmark the ReadMON readout with the one performedby an SMU.
Fig. 8 shows the comparison of the raw voltages measuredby the ReadMON (VRU) and the SMU (VSM) for a Si-1p-i-n diode and a LAAS RadFET over around 75 days ofacquisition. Similar agreement was observed for the readoutof a BPW p-i-n and a REM RadFET, also onboard the sensor.The gaps in the data correspond to interruptions that occurredduring the data taking, which were related to problems with theLabVIEW software or to power cuts. There was no data lossdue to a malfunctioning of the ReadMON during the wholedata taking period.
In order to assess the quality of the voltage calibrationcarried out before the start of the test, Fig. 9 details the
Fig. 9. Voltage error in the measurement given by the ReadMON. The erroris calculated with respect to the voltage measured by the SMU acting as avoltmeter.
distribution of the error in the voltage measurement providedby the ReadMON. This error is defined as
εV (%) =(
VRU − VVM
VVM
)× 100
where VRU and VVM are the voltage measurements defined.Three dosimeters are represented in Fig. 9: REM, Si-1,
and LAAS. The BPW device is not included since its outputvoltage changed very little throughout the test. (The measuredradiation field intensity was lower than the BPW sensitivityin the measurement location.) For the REM and LAAS, verynarrow distributions with close to zero mean (below 0.2%)are observed. For the Si-1 dosimeter, a larger spread in theerror appears, with values ranging from 0.3% to 3%. The timeevolution of this error revealed that the higher values appearedin the beginning of the irradiation, when the impedance of theSi-1 diode is very low (of the order of ohms). To understandthis effect, a careful characterization using low-impedanceresistors was carried out, with results showing a loss oflinearity of the voltage monitor signal for load impedancesbelow 1 k�. This effect will be minimized in the futureby using a more refined calibration of the dc–dc converteroutput.
Finally, in order to evaluate the accuracy of the measurementin terms of dose or fluence, the error on the ReadMON dataafter conversion to the corresponding units was calculated withrespect to the one obtained using the SMU. That is
εS(%) =(
SRU − SSM
SSM
)× 100
where SRU refers to the TID or �eq obtained withthe ReadMON unit and SSM refers to the measurementobtained using the SMU. Fig. 10 shows that the errordistributions for all tested dosimeters fall well within theinitial 5% goal.
The fact that εS is larger than εV is to be expected. Indeed,εS accounts for different contributions, only one of whichis εV . Additional sources of error summing up in εS are, forexample, the statistical fluctuation on the voltage delivered

1706 IEEE TRANSACTIONS ON NUCLEAR SCIENCE, VOL. 65, NO. 8, AUGUST 2018
Fig. 10. Dose or fluence error in the measurement given by theReadMON. The error is calculated with respect to the independent measure-ment performed by the SMU.
Fig. 11. Most recent prototype of the ReadMON system. All hardware isintegrated on the same PCB, which then will be fit in a metal enclosure. Finaldimensions of the whole device will be approximately 20 × 15 × 10 cm.
by the sensor, the error on the current delivered by thesystem, etc.
IV. CONCLUSION
The development of a new readout system for thePH-RADMON sensors used at CERN and in particular inthe LHC experiments has been presented, together with theresults of two different tests in IRRAD. Further tests for thevalidation of the system are ongoing in both IRRAD andGIF++ facilities. The tests done so far have already shownthat the system could be used in a real application whereonline dosimetry measurements are needed. The data obtainedwith the RADMON reader diverge only slightly from the onesobtained with a high precision commercial SMU.
The aim of this paper is to provide the high-energy physicscommunity, but also other fields where radiation monitoringis a need, with a compact, portable dosimetry system capableof exploiting the full measurement range of the RADMONdosimeters. This will make it a versatile system covering awide range both in terms of �eq (1010–1015 neq/cm2) and TID
(0.1–105Gy), with high sensitivity. Moreover, the wide rangeof current and voltage that can be supplied by the systemmakes it a suitable candidate for the readout of other sensorsbeyond the RADMON project. The final system will include aweb interface, making it possible to be used as a stand-alonedosimetry measurement device, but will also be provided withan API, thus making it easy to integrate it as a part of morecomplex data acquisition systems.
All the data presented in this article were obtained dur-ing still a development phase of the readout system, withthe different prototypes being built reusing old versions ofthe circuits, interconnected with some modifications built onbreadboards. Now a final architecture is consolidated and hasbeen recently implemented in a unique PCB (Fig. 11). ThisPCB will then be integrated into a metal enclosure to provideshielding from electromagnetic interference. In parallel, thetest bench used for the last tests in IRRAD will be furtherimproved adding a direct measurement of the readout cur-rent. In addition, the assessment of the system performanceat different temperatures, with tests in a climatic chamber,is foreseen. Last but not least, the software part of the projectwill be further developed in view of arriving to a final productready to be exploited by the users.
ACKNOWLEDGMENT
The authors would like to thank M. Ugur Kılıç from METU,Ankara, Turkey, for his contribution to this paper, and thecolleagues of the IRRAD Team, CERN, Geneva, Switzerland.for reviewing this paper.
REFERENCES
[1] F. Ravotti, “Development and characterisation of radiation monitoringsensors for the high energy physics experiments of the CERN LHCaccelerator,” Ph.D. dissertation, Dept. Electron., Univ. Montpellier II,Montpellier, France, 2006.
[2] F. Ravotti, M. Glaser, and M. Moll. (2005). Sensor catalogue data com-pilation of solid-state sensors for radiation monitoring. CERN, Geneva,Switzerland. [Online]. Available: http://cdsweb.cern.ch/record/835408
[3] R. L. Pease, M. Simons, and P. Marshall, “Comparison of pMOSFETtotal dose response for Co-60 gammas and high-energy protons,” IEEETrans. Nucl. Sci., vol. 48, no. 3, pp. 908–912, Jun. 2001, doi: 10.1109/23.940131.
[4] F. Ravotti et al. (2005). TOTEM on-line radiation monitoring system.CERN, Geneva, Switzerland. [Online]. Available: https://edms.cern.ch/document/874945
[5] C. Aidala et al., “The PHENIX forward silicon vertex detector,” Nucl.Instrum. Methods Phys. Res. A, Accel. Spectrom. Detect. Assoc. Equip.,vol. 755, pp. 44–61, Aug. 2014. [Online]. Available: https://doi.org/10.1016/j.nima.2014.04.017
[6] CERN Irradiation Facilities. Accessed: Sep. 28, 2017. [Online].Available: https://ep-dep-dt.web.cern.ch/irradiation-facilities
[7] B. Camanzi and A. G. Holmes-Siedle, “The measurement of ultra-high radiation environments: Accelerators and nuclear fusion reactors,”presented at the RADECS, 2006.
[8] R. Edgecock, “Industrial application of accelerators,” STFC-RutherfordAppleton Lab., Oxfordshire, U.K., Tech. Rep., 2016. [Online]. Available:https://indico.cern.ch/event/569698/
[9] A. B. Rosenfeld, “Electronic dosimetry in radiation therapy,” Radiat.Meas., vol. 41, pp. S134–S153, Dec. 2006.
[10] V. Gracanin et al., “A convenient verification method of theentrance photo-neutron dose for an 18 MV medical linac usingsilicon p-i-n diodes,” Radiat. Meas., vol. 106, pp. 391–398,Nov. 2017.
[11] F. Ravotti, B. Gkotse, M. Moll, and M. Glaser, “IRRAD: The new24GeV/c proton irradiation facility at CERN,” in Proc. AccApp,Washington, DC, USA, 2015, pp. 182–187. [Online]. Available:http://accapp15.org/wp-content/data/index.html

MATEU et al.: PORTABLE READOUT SYSTEM FOR CERN PH-RADMON SENSORS 1707
[12] D. Pfeiffer et al., “The radiation field in the Gamma Irradiation Facil-ity GIF++ at CERN,” Nucl. Instrum. Methods Phys. Res. A, Accel.Spectrom. Detect. Assoc. Equip., vol. 866, pp. 91–103, Sep. 2017.[Online]. Available: https://arxiv.org/abs/1611.00299
[13] A. Holmes-Siedle and L. Adams, Handbook of Radiation Effects.Oxford, U.K.: Oxford Science Publications, 2002.
[14] J. M. Swartz and M. O. Thurston, “Analysis of the effect of fast-neutronbombardment on the current-voltage characteristic of a conductivity-modulated p − i − n diode,” J. Appl. Phys., vol. 37, no. 2, pp. 745–755,Jan. 1966.
[15] M. S. Andjelkovic, G. S. Ristic, and A. B. Jakšic, “Using RADFETfor the real-time measurement of gamma radiation dose rate,” Meas.Sci. Technol., vol. 26, no. 2, p. 025004, 2015, doi: 10.1088/0957-0233/26/2/025004.
[16] REM Oxford Ltd., Oxford, United Kingdom. REM Data Sheet—RFTDAT-CC10—Rev W. Accessed: Sep. 28, 2017. [Online]. Available:http://www.ee.nmt.edu/~anders/courses/ee521s12/radfet_datasheet.pdf
[17] G. Gorine et al., “Ultra high fluence radiation monitoring technologiesfor the future circular collider at CERN,” presented at the RADECS,2017.
[18] V. Nagarkar, G. Entine, P. Stoppel, L. Cirignano, andP. Swinehart, “Solid state neutron dosimeter for space appli-cations,” IEEE Trans. Nucl. Sci., vol. 39, no. 4, pp. 966–970,Aug. 1992.
[19] A. G. Holmes-Siedle and L. Adams, “The mechanisms of small instabil-ities in irradiated MOS transistors,” IEEE Trans. Nucl. Sci., vol. NS-30,no. 6, pp. 4135–4140, Dec. 1983.
[20] Ashland Advanced Materials, Bridgewater, NJ, USA. GafchromicRadiochromic Dosimetric Films by Ashland Advanced Materials.Accessed: Sep. 28, 2017. [Online]. Available: http://www.gafchromic.com
[21] F. Coninckx, H. Schönbacher, M. Tavlet, G. Paic, and D. Razem,“Comparison of high-dose dosimetry systems for radiation damagestudies in collider detectors and accelerators,” Nucl. Instrum. Meth-ods Phys. Res. B, Beam Interact. Mater. At., vol. 83, pp. 181–188,Oct. 1993.
[22] M. P. R. Waligórski, G. Danialy, K. S. Loh, and R. Katz, “The responseof the alanine detector after charged-particle and neutron irradiations,”Appl. J. Radiat. Appl. Instrum. A, Appl. Radiat. Isotopes, vol. 40,nos. 10–12, pp. 923–933, 1989.