Understanding performance tuning - CERN
55
Computer Architecture and Performance Tuning Understanding performance tuning Andrzej Nowak CERN openlab CERN School of Computing 2009
-
Upload
khangminh22 -
Category
Documents
-
view
0 -
download
0
Transcript of Understanding performance tuning - CERN

Computer Architecture and Performance Tuning
Understanding performance tuning
Andrzej Nowak
CERN openlab
CERN School of Computing 2009

Andrzej Nowak – CERN openlab
Understanding Performance Tuning
2
Contents
1. Software performance tuning in general
2. Drilling down on performance figures
3. Perfmon2 as an example of a performance monitoring framework
4. Pfmon abilities and usage
In this talk, we focus on x86_64 processors (Intel Core and friends, AMD Athlon/Barcelona, etc)

Understanding Performance Tuning
3 Andrzej Nowak – CERN openlab
Performance tuning in general

Andrzej Nowak – CERN openlab
Understanding Performance Tuning
4
Improving application performance
Question #1 – “Why is it SOOOOOO SLOW?”
Upgrading hardware
Removing common bottlenecks
New CPU, new hard drive, more memory
New, new, new…
Replacing whole software components
Replacing shared or external libraries
Improving existing code
Performance monitoring will give you the answer
It allows you to find the things you could change in your setup to improve performance

Andrzej Nowak – CERN openlab
Understanding Performance Tuning
5
The free ride is over
Andrzej Nowak – CERN openlab
Understanding Performance Tuning
6
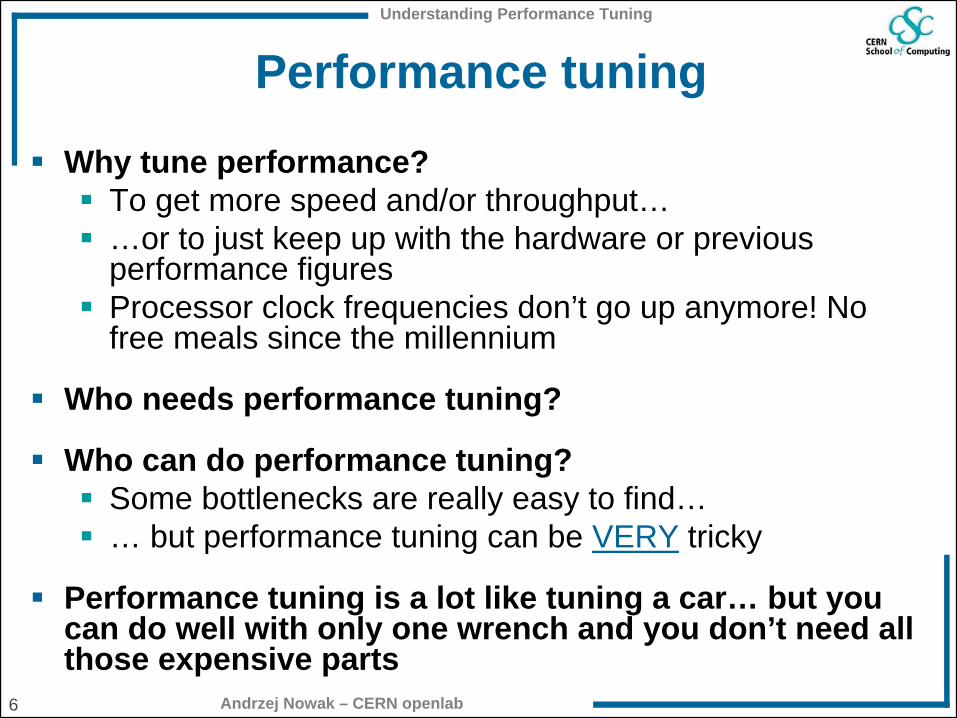
Performance tuning
Why tune performance?
To get more speed and/or throughput…
…or to just keep up with the hardware or previous performance figures
Processor clock frequencies don’t go up anymore! No free meals since the millennium
Who needs performance tuning?
Who can do performance tuning?
Some bottlenecks are really easy to find…
… but performance tuning can be VERY tricky
Performance tuning is a lot like tuning a car… but you can do well with only one wrench and you don’t need all those expensive parts
Andrzej Nowak – CERN openlab
Understanding Performance Tuning
7
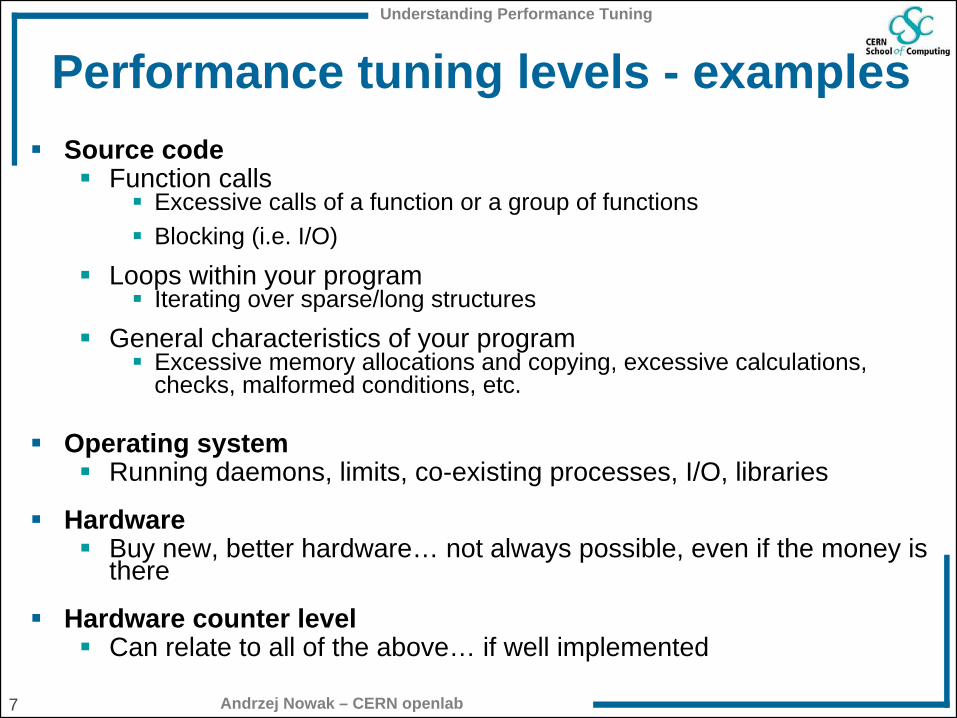
Performance tuning levels - examples
Source code
Function calls
Excessive calls of a function or a group of functions
Blocking (i.e. I/O)
Loops within your program
Iterating over sparse/long structures
General characteristics of your program
Excessive memory allocations and copying, excessive calculations, checks, malformed conditions, etc.
Operating system
Running daemons, limits, co-existing processes, I/O, libraries
Hardware
Buy new, better hardware… not always possible, even if the money is there
Hardware counter level
Can relate to all of the above… if well implemented

Andrzej Nowak – CERN openlab
Understanding Performance Tuning
8
Popular performance tuning software (1)
gprof
Flat profiles, call lists
Recompilation needed
oprofile
Flat profiles
Kernel driver needed
PIN, Valgrind
Instrumentation / Synthetic software CPU
Simulate such characteristics as cache misses and branch mispredictions, memory space usage, function call relationships
pfmon / perfmon2
Low level access to counters
No recompilation needed
Kernel patch needed today, but will be a part of the standard Linux kernel

Andrzej Nowak – CERN openlab
Understanding Performance Tuning
9
Popular performance tuning software (2)
Intel products:
VTune, PTU – very powerful
Thread Checker, Thread Profiler – for multithreading
VTune in Linux requires a precompiled kernel module
HP Caliper

Andrzej Nowak – CERN openlab
Understanding Performance Tuning
10
Platform tuning and debugging
Sometimes tuning the application is not enough, or not the right thing to do
Traditional tools: iostat, netstat, vmstat, pmap
More advanced tools: strace, ltrace, SystemTap, utrace
Great paper from IBM: “Linux Performance and Tuning Guidelines”
Quote: “IBM has embraced Linux”
http://www.redbooks.ibm.com/abstracts/redp4285.html

Andrzej Nowak – CERN openlab
Understanding Performance Tuning
11
Common sense tips
Know your system
Look for bottlenecks and understand them
Use and understand the tools
Change one thing at a time
Will other components be able to keep up with this change?
Keep a good log of your activities and conditions
Performance tuning is an iterative process
Understanding Performance Tuning
12 Andrzej Nowak – CERN openlab
Common performance figuresAnd how to interpret them

Andrzej Nowak – CERN openlab
Understanding Performance Tuning
13
Performance monitoring in hardware
Most modern CPUs are able to provide real-time statistics concerning executed instructions…
…via a Performance Monitoring Unit (PMU)
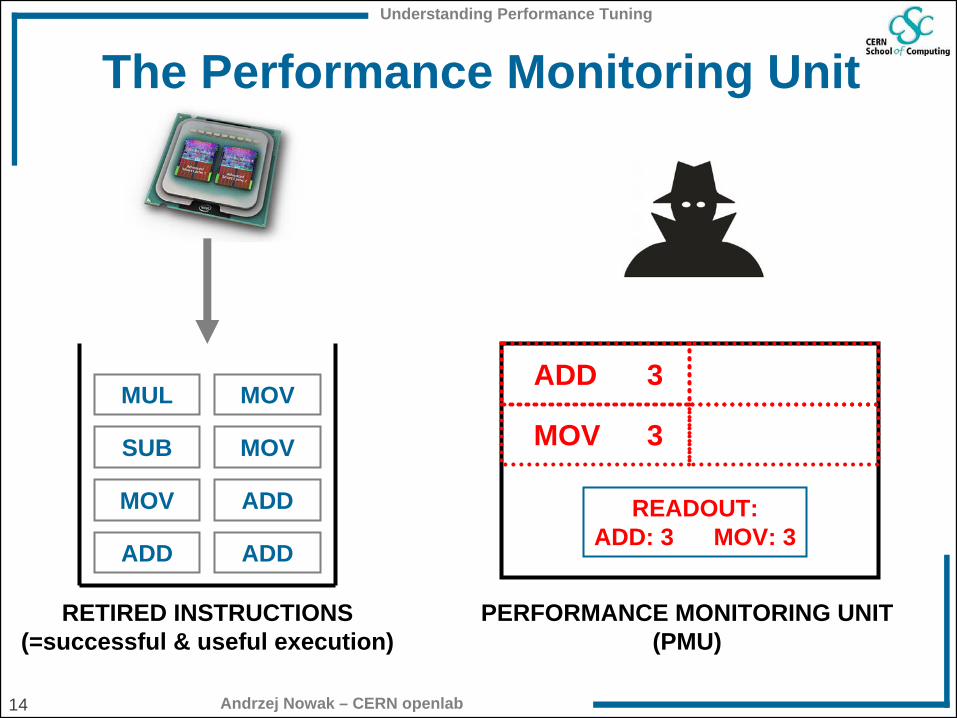
The PMU is spying in real time on your application! (and everything else that goes through the CPU)
Limited number of “sentries” (counters) available, but they are versatile
Recorded occurrences are called events
Typically on modern Intel CPUs:
2-4 universal counters (#0, #1 (#2, #3))
3 specialized counters (#16, #17, #18)
Additional 8 “uncore” counters
Andrzej Nowak – CERN openlab
Understanding Performance Tuning
14
The Performance Monitoring Unit
RETIRED INSTRUCTIONS(=successful & useful execution)
PERFORMANCE MONITORING UNIT(PMU)
ADD
ADDADD
ADDMOV
MOVSUB
MOVMUL3
MOV 3
READOUT:ADD: 3 MOV: 3

Andrzej Nowak – CERN openlab
Understanding Performance Tuning
15
Basic information about your program Recap
The amount of:
instructions executed
processor cycles spent on the program
transactions on the bus
The amount/percentage of:
memory loads and stores
floating point operations
vector operations (SIMD)
branch instructions
cache misses
Andrzej Nowak – CERN openlab
Understanding Performance Tuning
16
Advanced information about your program
The amount and type of:
micro-ops executed
SIMD instructions executed
resource stalls within the CPU
Cache access characteristics
A rich set on Intel Core CPUs
Demand
Requests (missed / hit / total / exclusive or shared / store or read)
Lines modified / evicted / prefetched

Andrzej Nowak – CERN openlab
Understanding Performance Tuning
17
Derived events
Too much information available?
Low level and fine grained events can be combined to produce ratios (so called “derived events”)
Extensive information:
Intel Manual 248966-016 “Intel 64 and IA-32 Architectures Optimization Reference Manual”
AMD CPU-specific manuals, i.e. #32559 “BIOS and Kernel Developer’s Guide for AMD NPT Family 0Fh Processors”

Andrzej Nowak – CERN openlab
Understanding Performance Tuning
18
A word for the future
Mapping performance monitoring data onto your source code and environment requires care and experience

Andrzej Nowak – CERN openlab
Understanding Performance Tuning
19
The CPI figure and its meaning
CPI – cycles per instruction
Thanks to multiple execution ports (superscalar architecture), more than one instruction can be executed per cycle
In Intel Core 2 CPUs, CPI can go as low as 0.25 = 4 instructions per cycle
CPI above 1.0 is not impressive
The ratio of the number of CPU cycles spent on a program to the number of program instructions retired by the CPU
CYCLES / INSTRUCTIONS
This figure illustrates the CPU usage efficiency, but, like all ratios, can be tricky to interpret

Andrzej Nowak – CERN openlab
Understanding Performance Tuning
20
Cache misses
If the requested item is not in the polled cache, the next level has to be consulted (cache miss)
Significant impact on performance
Formula:LAST LEVEL CACHE MISSES / LAST
LEVEL CACHE REFERENCES
Tips:
A L2 cache hit ratio below 95% is considered to be catastrophic! (=5% miss)
Usually the figure should be above 99%
The overall cache miss rate might be low (misses / total instructions), but the resource stalls figure might be high; always check the cache miss percentage
Data request
L1
L2
L3

Andrzej Nowak – CERN openlab
Understanding Performance Tuning
21
Cache miss demo
Assuming 20% of the instructions are loads and 3% of L2 misses…
~35% cycles wasted, program runs ~60% slower!
} profiledsection
50 cycles of work (incl. L1 consultations/misses)
50 cycles of work with one L2 cache miss
50 cycles of no work

Andrzej Nowak – CERN openlab
Understanding Performance Tuning
22
Cache miss impact graph
1% 2% 3% 4% 5% 10% 20%
5%
20%
50%
0%
200%
400%
600%
800%
1000%
1200%
% o
f orig
inal
runt
ime
L2 cache misses (%)
Memory loads (% of cycles)
L2 Cache miss impact (simplified)

Andrzej Nowak – CERN openlab
Understanding Performance Tuning
23
False sharing
Thread 1
tab[0]++;
tab[0]++;
Thread 2
tab[1]++;
tab[1]++;
L2 cache
int global_tab[2];
MACHINE_NUKES:MEM_ORDER

Andrzej Nowak – CERN openlab
Understanding Performance Tuning
24
Branch prediction
Branch prediction is a process inside the CPU which determines whether a conditional branch in the program is anticipated by the hardware to be taken or not
Typically: prediction based on history
The effectiveness of this hardware mechanism heavily depends on the way the software is written
The penalty for a mispredicted branch is usually severe (the pipelines inside the CPU get flushed and execution stalls for a while)

Andrzej Nowak – CERN openlab
Understanding Performance Tuning
25
Branch prediction ratios
The percentage of branch instructions
BRANCH INSTRUCTIONS / ALL INSTRUCTIONS
The percentage of mispredicted branches
MISPREDICTED BRANCHES / BRANCH INSTRUCTIONS
The number of correctly predicted branches is typically very high (80%+), up to 99%

Andrzej Nowak – CERN openlab
Understanding Performance Tuning
26
Floating point operations
Often a significant portion of work of an application
May be accelerated using SSE (SIMD)
Related events on the Intel Core microarchitecture:
“traditional” x87 FP ops
Packed/Scalar single computational SIMD
Packed/Scalar double computational SIMD
SIMD micro-ops
Non computational SIMD instructions can also be counted

Andrzej Nowak – CERN openlab
Understanding Performance Tuning
27
Relating to code (1)
CPI problems
Doing too many operations?
Large latency instructions in the code?
Using vector instructions?
Cache misses, false sharing
Memory access characteristics
Data structures and their layout
Does your program fit in the cache?
Help the hardware prefetcher!

Andrzej Nowak – CERN openlab
Understanding Performance Tuning
28
Relating to code (2)
Many mispredicted branches
Is there a way to restructure the code?
Is there a way to make the “ifs” more predictable?
Rearranging conditions and loops
Too many jumps / function calls?
Excessive floating point operations
Does everything need to be calculated?
Could some results be reused?

Andrzej Nowak – CERN openlab
Understanding Performance Tuning
29
Relating to code (3)
Performance optimization is a time-consuming task, so design your program with performance in mind!
What hardware will it run on?
What architecture will it run on?
Is it 64-bit compatible?
Will it use vector computing? What width?
Will it use multiple cores?
Will it use multiple sockets?
Will it use multiple nodes?
What if any of the above changes? Is it scalable?
Scalable designs and high performance are friends
Understanding Performance Tuning
30 Andrzej Nowak – CERN openlab
Perfmon2 & pfmonA real-world performance monitoring framework example… and some hints for the exercises
Andrzej Nowak – CERN openlab
Understanding Performance Tuning
31
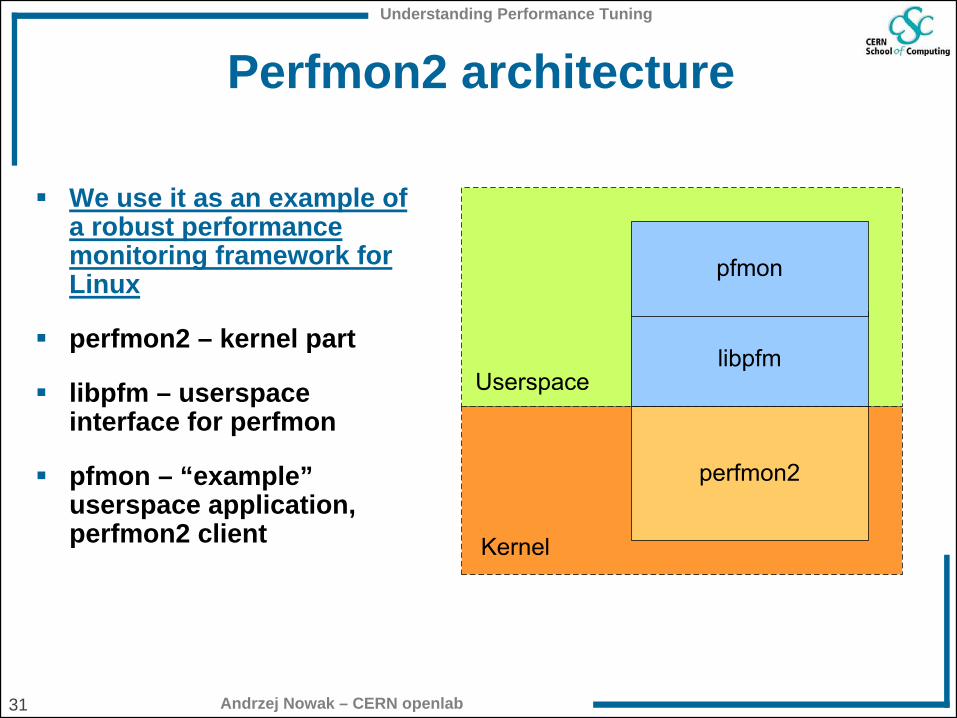
Perfmon2 architecture
We use it as an example of a robust performance monitoring framework for Linux
perfmon2 – kernel part
libpfm – userspace interface for perfmon
pfmon – “example” userspace application, perfmon2 client

Andrzej Nowak – CERN openlab
Understanding Performance Tuning
32
Perfmon2
Resides in the kernel
Currently available as a kernel patch
Very basic functionality: basically read and write
Candidate to be merged into the Linux kernel mainline
No guarantees – it might never be merged
Support for numerous architectures:
x86, x86-64, ia64, PowerPC, Cell / PS3, MIPS, SPARC
Supported in Red Hat since a long time (which is the base for Scientific Linux)

Andrzej Nowak – CERN openlab
Understanding Performance Tuning
33
Pfmon overview
Console based interface to libpfm/perfmon2
Provides convenient access to performance counters
Wide range of functionality:
Counting events
Sampling in regular intervals
Flat profile
System wide mode
Triggers
Different data readout “plug-ins” (modules) available

Andrzej Nowak – CERN openlab
Understanding Performance Tuning
34
Events
Many events in the CPU can be monitored
A comprehensive list is dependent on the CPU and can be extracted from the manufacturer’s manuals
On some CPUs (i.e. Intel Core), some events have bit- masks which limit their range, called “unit masks” or “umasks”
Example: instructions retired: all / only loads / only stores
In pfmon:
Getting a list of supported events: pfmon –l
Getting information about an event: pfmon –i eventname

Andrzej Nowak – CERN openlab
Understanding Performance Tuning
35
Basic modes
Counting
Example: How many instructions did my application execute?
Example: How many times did my application have to stop and wait for data from the memory?
Sampling
Reporting results in “regular” intervals
Example: every 100’000 cycles record the number of SSE operations since the last sample
Profiling
Example: how many cycles are spent in which function?
Example: how many cache misses occur in which function?
Example: which code address is the one most frequently visited? (looking for hotspots)

Andrzej Nowak – CERN openlab
Understanding Performance Tuning
36
Counting example
1. Specify interesting eventsi.e. INSTRUCTIONS_RETIRED
2. Build the command linepfmon –e INSTRUCTIONS_RETIRED ls /xyz
3. Run and obtain results181992 INSTRUCTIONS_RETIRED
Step numbers don’tcorrespond to the list above

Andrzej Nowak – CERN openlab
Understanding Performance Tuning
37
Multiplexing
Multiplexing allows monitoring of more events than there are available counters
Specify sets of events by repeating the –e switch
Enable multiplexing by using --switch-timeout=NUM
Pfmon will automatically switch the monitored set on the PMU after the given timeout (in ms)
Specify separate sets by repeating the –e switch

Andrzej Nowak – CERN openlab
Understanding Performance Tuning
38
Sampling example
1. Specify interesting events and the reference eventi.e. UNHALTED_CORE_CYCLES (ref), INSTRUCTIONS_RETIRED
2. Build the command linepfmon -e UNHALTED_CORE_CYCLES,INSTRUCTIONS_RETIRED --long-
smpl-periods=26670 --smpl-module=compact /bin/ls
3. Run and obtain results (next page)
Step numbers don’tcorrespond to the list above

Andrzej Nowak – CERN openlab
Understanding Performance Tuning
39
Profiling example1. Specify the reference event
i.e. UNHALTED_CORE_CYCLES
2. Build the command linepfmon -e UNHALTED_CORE_CYCLES --long-smpl-periods=10000 --resolve-
addresses --smpl-per-function /bin/ls
3. Run and obtain results (next page)
Step numbers don’tcorrespond to the list above

Understanding Performance Tuning
40 Andrzej Nowak – CERN openlab
More advanced performance monitoring concepts

Andrzej Nowak – CERN openlab
Understanding Performance Tuning
41
Following execution and threading chains
You might need to monitor across numerous types of execution splits
pthreads
forks
exec calls
Pfmon options:
--follow-all
--follow-fork
--follow-pthread
--follow-exec
Childprocess (2)
ParentProcess (1)
Childprocess (3)
Childprocess 4
pfmon
Result1
Monitored domain
Result2
Result3 Result4
Andrzej Nowak – CERN openlab
Understanding Performance Tuning
42
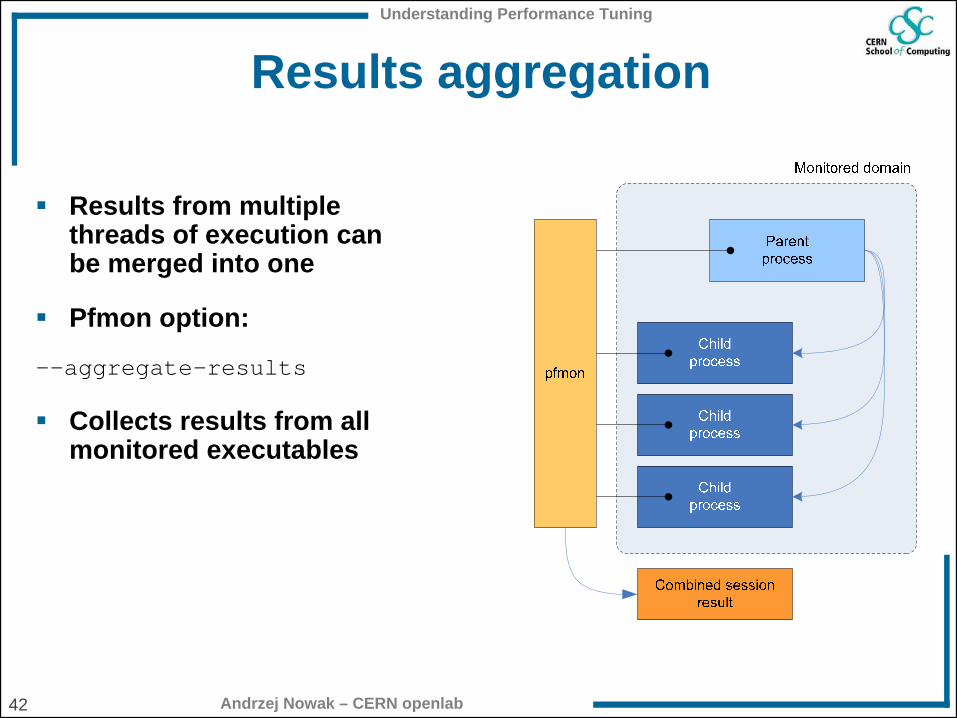
Results aggregation
Results from multiple threads of execution can be merged into one
Pfmon option:
--aggregate-results
Collects results from all monitored executables

Andrzej Nowak – CERN openlab
Understanding Performance Tuning
43
Triggers
A concept which enables monitoring to start or stop automatically
Trigger types:
Code
Data
A symbol name…
i.e. “foobar”
…or an address
i.e. 0x8103b91e
!
Limitation: in pfmon symbol names are available only within the first binary
Code Data

Andrzej Nowak – CERN openlab
Understanding Performance Tuning
44
System wide monitoring
In system wide mode all processes are monitored on a specific set of CPUs
In pfmon root access is not needed
Pfmon switch: --system-wide
Useful pfmon options:
Timeout (-t, results reported in regular intervals)
Kernel mode (explained on the next slide)
Aggregation (--aggregate-results)
Multiplexing (--switch-timeout)
Both counting and profiling are possible
Used at CERN in a pilot project w/ pfmon in multiplexing mode
Running in the background on some batch machines

Andrzej Nowak – CERN openlab
Understanding Performance Tuning
45
Monitoring levels
4 privilege levels:
Userlevel (3) – default (-u)
Kernel level (0) – useful for kernel debugging in system wide mode (-k)
Other levels: 1, 2
cnt %self %cum code addr symbol
448 35.50% 35.50% 0xffffffff8103b91e __do_softirq+0x45<kernel> (idle,0)
278 22.03% 57.53% 0xffffffff8100a47b mwait_idle+0x3f<kernel> (idle,0)
77 6.10% 63.63% 0xffffffff8127e229 _spin_unlock_irq+0x9<kernel> (idle,0)
Kernel level monitoring example in pfmon (system wide):

Andrzej Nowak – CERN openlab
Understanding Performance Tuning
46
Q & A

Andrzej Nowak – CERN openlab
Understanding Performance Tuning
47
BACKUP
Resources:
http://cern.ch/openlab
http://sf.net/projects/perfmon2
http://perfmon2.sourceforge.net (documentation)
http://perfmon2.sourceforge.net/pfmon_usersguide.html
http://www.intel.com (manuals)
http://cern.ch/andrzej.nowak (gpfmon)
http://ltp.sourceforge.net/tooltable.php (Linux Test Tools)
Intel Software Products:
VTune, Thread checker, Thread Profiler: http://intel.com/software
PTU: http://softwarecommunity.intel.com/articles/eng/1437.htm
HP Caliper
http://h21007.www2.hp.com/portal/site/dspp

Andrzej Nowak – CERN openlab
Understanding Performance Tuning
48
BACKUP - enabling different modes in pfmon
Different modes are triggered by the presence of certain command line switches
Counting
default mode
Sampling
--smpl-module=compact, --smpl-module=detailed
Profiling
--long-smpl-period=NUM
Andrzej Nowak – CERN openlab
Understanding Performance Tuning
49
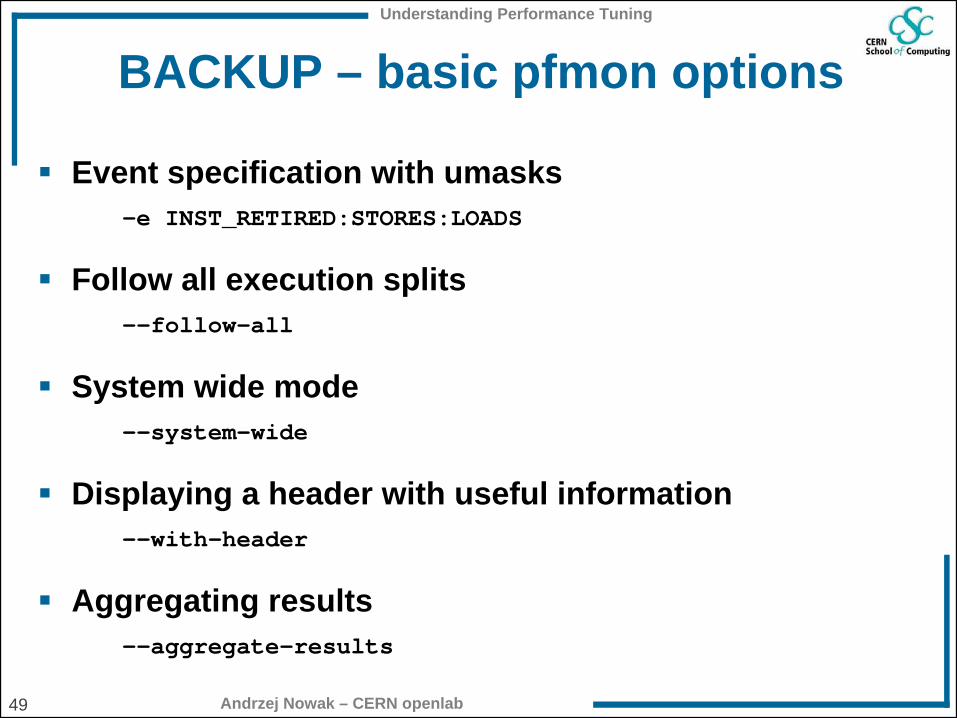
BACKUP – basic pfmon options
Event specification with umasks
–e INST_RETIRED:STORES:LOADS
Follow all execution splits
–-follow-all
System wide mode
–-system-wide
Displaying a header with useful information
–-with-header
Aggregating results
–-aggregate-results

Andrzej Nowak – CERN openlab
Understanding Performance Tuning
50
BACKUP – output formatting
EU counter format (--eu-c)
1.567.123 instead of 1567123
US counter format (--us-c)
1,567,123 instead of 1567123
Hex counter format (--hex-c)
0xdeadbeef instead of 3735928559
Show execution time (--show-time)
real 0h00m00.252s user 0h00m00.000s sys 0h00m00.000s
Suppress monitored command output (--no-cmd-output)

Andrzej Nowak – CERN openlab
Understanding Performance Tuning
51
BACKUP – advanced pfmon options
Specifying triggers
–-trigger-code-start-address=...–-trigger-code-stop-address=...–-trigger-data-start-address=...–-trigger-data-start-address=...
Multiplexing
–e EVENT1,EVENT2,… -e EVENTa,EVENTb,… --switch- timeout=NUM
Andrzej Nowak – CERN openlab
Understanding Performance Tuning
52
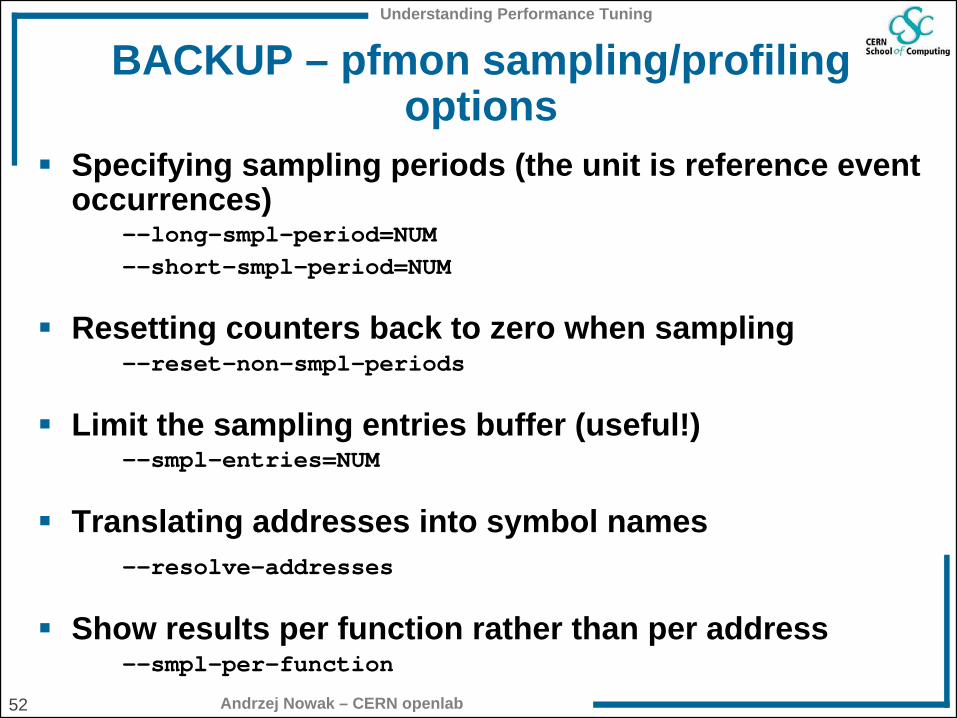
BACKUP – pfmon sampling/profiling options
Specifying sampling periods (the unit is reference event occurrences)
–-long-smpl-period=NUM–-short-smpl-period=NUM
Resetting counters back to zero when sampling
–-reset-non-smpl-periods
Limit the sampling entries buffer (useful!)
–-smpl-entries=NUM
Translating addresses into symbol names
–-resolve-addresses
Show results per function rather than per address
–-smpl-per-function

Andrzej Nowak – CERN openlab
Understanding Performance Tuning
53
BACKUP - example sampling results (pfmon)
# description of columns:# column 1: entry number# column 2: process id# column 3: thread id# column 4: cpu number# column 5: instruction pointer# column 6: unique timestamp# column 7: overflowed PMD index# column 8: event set# column 9: initial value of overflowed PMD (sampling period)# followed by optional sampled PMD values in command line order
1 2 3 4 5 6 7 8 9 100 32442 32442 2 0x3061230d6a 0x0004d5f49c2a8e57 17 0 -26670 0x556 1 32442 32442 2 0x3061292980 0x0004d5f49c2b4851 17 0 -26670 0xd66 2 32442 32442 2 0x3061226363 0x0004d5f49c2c04dc 17 0 -26670 0x1aaa 3 32442 32442 2 0x3061010159 0x0004d5f49c2c39cb 17 0 -26670 0x6942 4 32442 32442 2 0x306126b5f0 0x0004d5f49c2c9a1c 17 0 -26670 0x171c

Andrzej Nowak – CERN openlab
Understanding Performance Tuning
54
BACKUP: gpfmon – a graphical interface for pfmon
Andrzej Nowak – CERN openlab
Understanding Performance Tuning
55
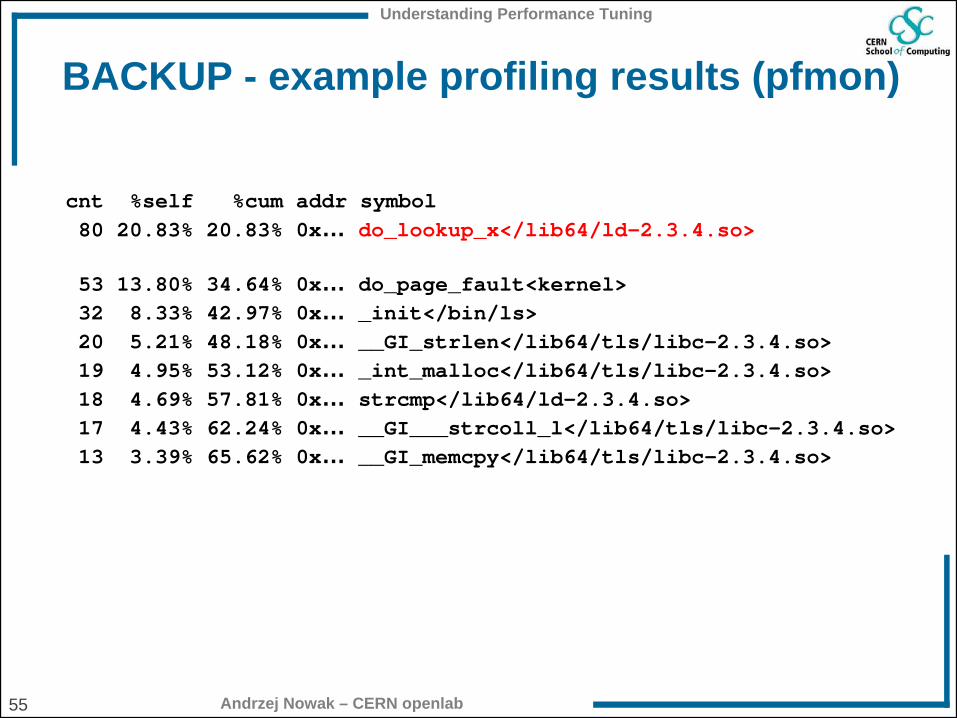
BACKUP - example profiling results (pfmon)
cnt %self %cum addr symbol80 20.83% 20.83% 0x… do_lookup_x</lib64/ld-2.3.4.so>
53 13.80% 34.64% 0x… do_page_fault<kernel>32 8.33% 42.97% 0x… _init</bin/ls>20 5.21% 48.18% 0x… __GI_strlen</lib64/tls/libc-2.3.4.so>19 4.95% 53.12% 0x… _int_malloc</lib64/tls/libc-2.3.4.so>18 4.69% 57.81% 0x… strcmp</lib64/ld-2.3.4.so>17 4.43% 62.24% 0x… __GI___strcoll_l</lib64/tls/libc-2.3.4.so>13 3.39% 65.62% 0x… __GI_memcpy</lib64/tls/libc-2.3.4.so>