RCy3: Network biology using Cytoscape from within R[version 1
18
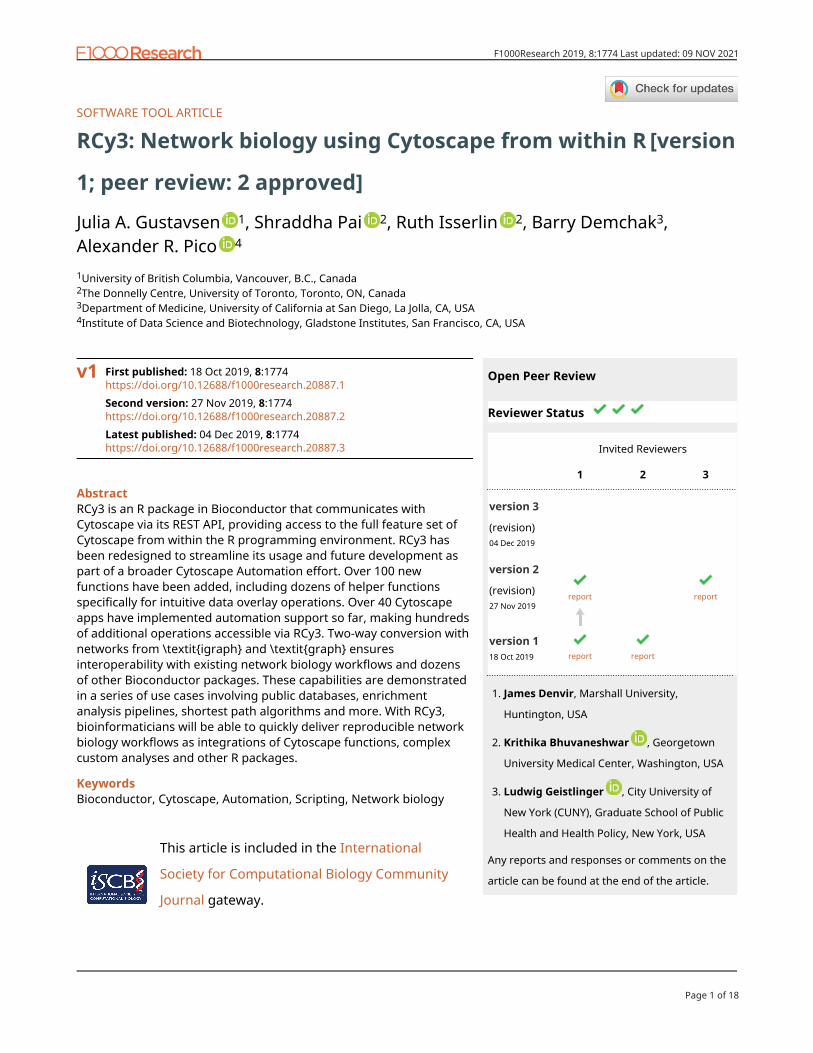
SOFTWARE TOOL ARTICLE RCy3: Network biology using Cytoscape from within R [version 1; peer review: 2 approved] Julia A. Gustavsen 1 , Shraddha Pai 2 , Ruth Isserlin 2 , Barry Demchak 3 , Alexander R. Pico 4 1 University of British Columbia, Vancouver, B.C., Canada 2 The Donnelly Centre, University of Toronto, Toronto, ON, Canada 3 Department of Medicine, University of California at San Diego, La Jolla, CA, USA 4 Institute of Data Science and Biotechnology, Gladstone Institutes, San Francisco, CA, USA First published: 18 Oct 2019, 8:1774 https://doi.org/10.12688/f1000research.20887.1 Second version: 27 Nov 2019, 8:1774 https://doi.org/10.12688/f1000research.20887.2 Latest published: 04 Dec 2019, 8:1774 https://doi.org/10.12688/f1000research.20887.3 v1 Abstract RCy3 is an R package in Bioconductor that communicates with Cytoscape via its REST API, providing access to the full feature set of Cytoscape from within the R programming environment. RCy3 has been redesigned to streamline its usage and future development as part of a broader Cytoscape Automation effort. Over 100 new functions have been added, including dozens of helper functions specifically for intuitive data overlay operations. Over 40 Cytoscape apps have implemented automation support so far, making hundreds of additional operations accessible via RCy3. Two-way conversion with networks from \textit{igraph} and \textit{graph} ensures interoperability with existing network biology workflows and dozens of other Bioconductor packages. These capabilities are demonstrated in a series of use cases involving public databases, enrichment analysis pipelines, shortest path algorithms and more. With RCy3, bioinformaticians will be able to quickly deliver reproducible network biology workflows as integrations of Cytoscape functions, complex custom analyses and other R packages. Keywords Bioconductor, Cytoscape, Automation, Scripting, Network biology This article is included in the International Society for Computational Biology Community Journal gateway. Open Peer Review Reviewer Status Invited Reviewers 1 2 3 version 3 (revision) 04 Dec 2019 version 2 (revision) 27 Nov 2019 report report version 1 18 Oct 2019 report report James Denvir, Marshall University, Huntington, USA 1. Krithika Bhuvaneshwar , Georgetown University Medical Center, Washington, USA 2. Ludwig Geistlinger , City University of New York (CUNY), Graduate School of Public Health and Health Policy, New York, USA 3. Any reports and responses or comments on the article can be found at the end of the article. Page 1 of 18 F1000Research 2019, 8:1774 Last updated: 09 NOV 2021
-
Upload
khangminh22 -
Category
Documents
-
view
1 -
download
0
Transcript of RCy3: Network biology using Cytoscape from within R[version 1
SOFTWARE TOOL ARTICLE
RCy3: Network biology using Cytoscape from within R [version
1; peer review: 2 approved]
Julia A. Gustavsen 1, Shraddha Pai 2, Ruth Isserlin 2, Barry Demchak3, Alexander R. Pico 4
1University of British Columbia, Vancouver, B.C., Canada 2The Donnelly Centre, University of Toronto, Toronto, ON, Canada 3Department of Medicine, University of California at San Diego, La Jolla, CA, USA 4Institute of Data Science and Biotechnology, Gladstone Institutes, San Francisco, CA, USA
First published: 18 Oct 2019, 8:1774 https://doi.org/10.12688/f1000research.20887.1Second version: 27 Nov 2019, 8:1774 https://doi.org/10.12688/f1000research.20887.2Latest published: 04 Dec 2019, 8:1774 https://doi.org/10.12688/f1000research.20887.3
v1
Abstract RCy3 is an R package in Bioconductor that communicates with Cytoscape via its REST API, providing access to the full feature set of Cytoscape from within the R programming environment. RCy3 has been redesigned to streamline its usage and future development as part of a broader Cytoscape Automation effort. Over 100 new functions have been added, including dozens of helper functions specifically for intuitive data overlay operations. Over 40 Cytoscape apps have implemented automation support so far, making hundreds of additional operations accessible via RCy3. Two-way conversion with networks from \textit{igraph} and \textit{graph} ensures interoperability with existing network biology workflows and dozens of other Bioconductor packages. These capabilities are demonstrated in a series of use cases involving public databases, enrichment analysis pipelines, shortest path algorithms and more. With RCy3, bioinformaticians will be able to quickly deliver reproducible network biology workflows as integrations of Cytoscape functions, complex custom analyses and other R packages.
Keywords Bioconductor, Cytoscape, Automation, Scripting, Network biology
This article is included in the International
Society for Computational Biology Community
Journal gateway.
Open Peer Review
Reviewer Status
Invited Reviewers
1 2 3
version 3
(revision)04 Dec 2019
version 2
(revision)27 Nov 2019
report report
version 118 Oct 2019 report report
James Denvir, Marshall University,
Huntington, USA
1.
Krithika Bhuvaneshwar , Georgetown
University Medical Center, Washington, USA
2.
Ludwig Geistlinger , City University of
New York (CUNY), Graduate School of Public
Health and Health Policy, New York, USA
3.
Any reports and responses or comments on the
article can be found at the end of the article.
Page 1 of 18
F1000Research 2019, 8:1774 Last updated: 09 NOV 2021
Corresponding author: Alexander R. Pico ([email protected])Author roles: Gustavsen JA: Methodology, Software, Validation, Writing – Original Draft Preparation, Writing – Review & Editing; Pai S: Conceptualization, Methodology, Software, Validation, Writing – Original Draft Preparation, Writing – Review & Editing; Isserlin R: Conceptualization, Methodology, Software, Validation, Visualization, Writing – Review & Editing; Demchak B: Conceptualization, Funding Acquisition, Project Administration, Validation, Writing – Original Draft Preparation, Writing – Review & Editing; Pico AR: Conceptualization, Funding Acquisition, Methodology, Project Administration, Resources, Software, Supervision, Validation, Visualization, Writing – Original Draft Preparation, Writing – Review & EditingCompeting interests: No competing interests were disclosed.Grant information: AP, BD, RI and SP were supported by NIGMS P41GM103504 for the National Resource for Network Biology.JAG was supported by Google Summer of Code. The funders had no role in study design, data collection and analysis, decision to publish, or preparation of the manuscript.Copyright: © 2019 Gustavsen JA et al. This is an open access article distributed under the terms of the Creative Commons Attribution License, which permits unrestricted use, distribution, and reproduction in any medium, provided the original work is properly cited.How to cite this article: Gustavsen JA, Pai S, Isserlin R et al. RCy3: Network biology using Cytoscape from within R [version 1; peer review: 2 approved] F1000Research 2019, 8:1774 https://doi.org/10.12688/f1000research.20887.1First published: 18 Oct 2019, 8:1774 https://doi.org/10.12688/f1000research.20887.1
This article is included in the Cytoscape
gateway.
This article is included in the RPackage
gateway.
This article is included in the Bioconductor
gateway.
Page 2 of 18
F1000Research 2019, 8:1774 Last updated: 09 NOV 2021
IntroductionIn the domain of biology, network models serve as useful representations of interactions, whether social, neural or molecular. Since 2003, Cytoscape has provided a free, open-source software platform for network analysis and visualization that has been widely adopted in biological and biomedical research fields1. The Cytoscape platform supports community-developed extensions, called apps, that can access third-party databases, offer new layouts, add analytical algorithms, support additional data types, and much more2,3.
In 2011, the CytoscapeRPC app was created to enable R-based workflows to exercise Cytoscape v2 function-ality via functions in the corresponding RCytoscape R package over XML-RPC communications protocols4. In 2015, the CyREST app was created to enable R-based workflows to exercise Cytoscape v3 functional-ity. This was achieved by the first version of the RCy3 R package, which re-implemented much of RCytoscape’s organization, data structures and syntax over REST communications protocols3,5.
Here, we describe version 2.0 of the RCy3 package, which is better aligned with Cytoscape’s CyREST API. We have rewritten every function, deprecated 43 functions and added over 100 new functions. This work provides a more intuitive and productive experience for Cytoscape users learning about the RCy3 package, and it posi-tions RCy3 to take advantage of future Cytoscape Automation6 development and evolution. The goal of this paper is to describe the implementation and operation of the updated RCy3 package and to provide detailed use cases relevant to network biology applications in common and advanced bioinformatics workflows.
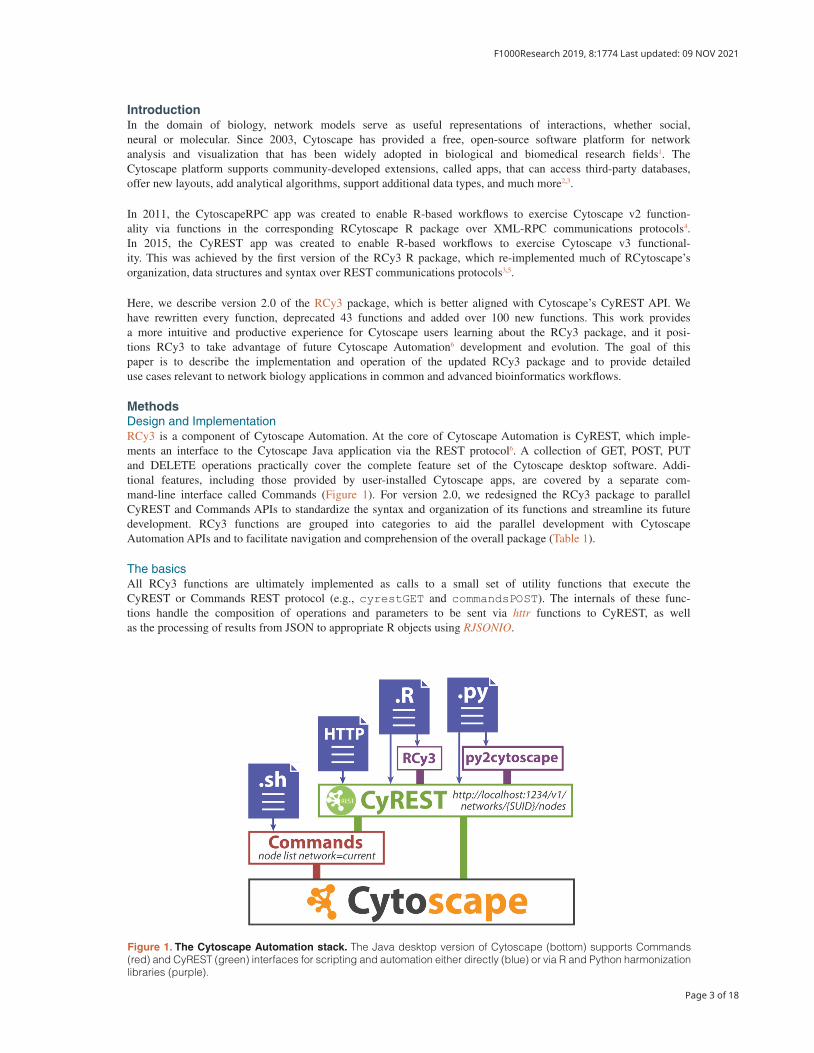
MethodsDesign and ImplementationRCy3 is a component of Cytoscape Automation. At the core of Cytoscape Automation is CyREST, which imple-ments an interface to the Cytoscape Java application via the REST protocol6. A collection of GET, POST, PUT and DELETE operations practically cover the complete feature set of the Cytoscape desktop software. Addi-tional features, including those provided by user-installed Cytoscape apps, are covered by a separate com-mand-line interface called Commands (Figure 1). For version 2.0, we redesigned the RCy3 package to parallel CyREST and Commands APIs to standardize the syntax and organization of its functions and streamline its future development. RCy3 functions are grouped into categories to aid the parallel development with Cytoscape Automation APIs and to facilitate navigation and comprehension of the overall package (Table 1).
The basicsAll RCy3 functions are ultimately implemented as calls to a small set of utility functions that execute the CyREST or Commands REST protocol (e.g., cyrestGET and commandsPOST). The internals of these func-tions handle the composition of operations and parameters to be sent via httr functions to CyREST, as well as the processing of results from JSON to appropriate R objects using RJSONIO.
Figure 1. The Cytoscape Automation stack. The Java desktop version of Cytoscape (bottom) supports Commands (red) and CyREST (green) interfaces for scripting and automation either directly (blue) or via R and Python harmonization libraries (purple).
Page 3 of 18
F1000Research 2019, 8:1774 Last updated: 09 NOV 2021
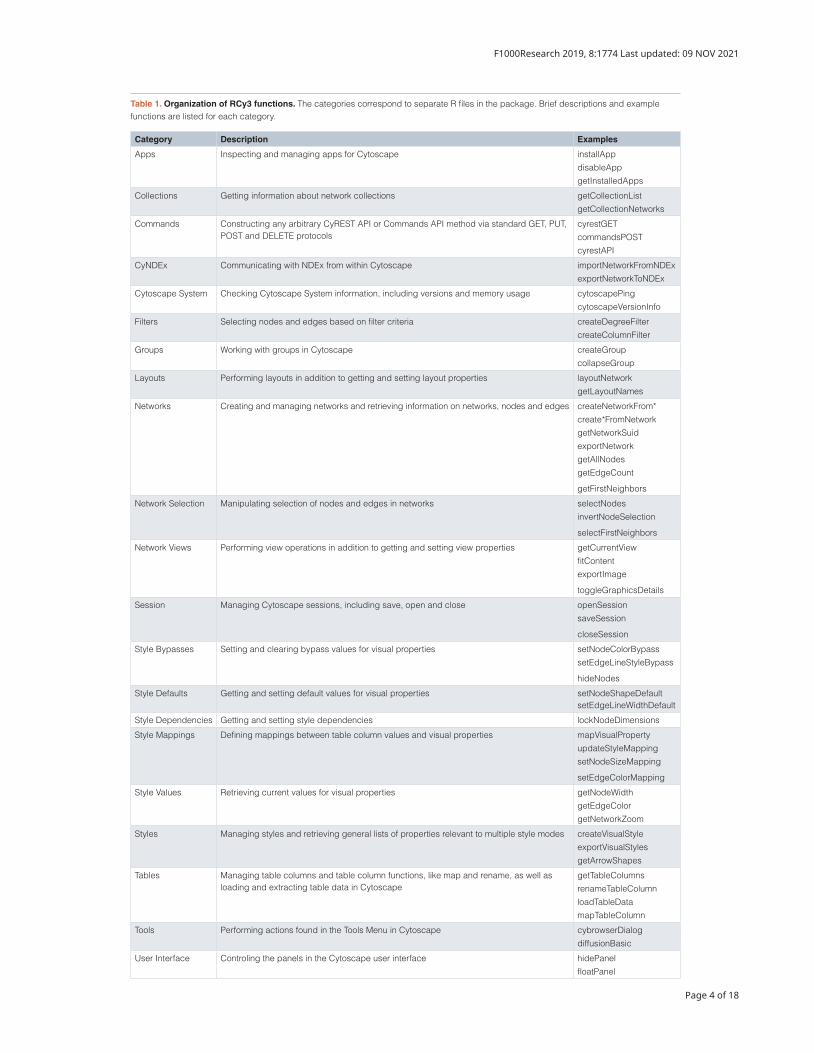
Table 1. Organization of RCy3 functions. The categories correspond to separate R files in the package. Brief descriptions and example functions are listed for each category.
Category Description Examples
Apps Inspecting and managing apps for Cytoscape installApp
disableApp
getInstalledApps
Collections Getting information about network collections getCollectionList
getCollectionNetworks
Commands Constructing any arbitrary CyREST API or Commands API method via standard GET, PUT, POST and DELETE protocols
cyrestGET
commandsPOST
cyrestAPI
CyNDEx Communicating with NDEx from within Cytoscape importNetworkFromNDEx
exportNetworkToNDEx
Cytoscape System Checking Cytoscape System information, including versions and memory usage cytoscapePing
cytoscapeVersionInfo
Filters Selecting nodes and edges based on filter criteria createDegreeFilter
createColumnFilter
Groups Working with groups in Cytoscape createGroup
collapseGroup
Layouts Performing layouts in addition to getting and setting layout properties layoutNetwork
getLayoutNames
Networks Creating and managing networks and retrieving information on networks, nodes and edges createNetworkFrom*
create*FromNetwork
getNetworkSuid
exportNetwork
getAllNodes
getEdgeCount
getFirstNeighbors
Network Selection Manipulating selection of nodes and edges in networks selectNodes
invertNodeSelection
selectFirstNeighbors
Network Views Performing view operations in addition to getting and setting view properties getCurrentView
fitContent
exportImage
toggleGraphicsDetails
Session Managing Cytoscape sessions, including save, open and close openSession
saveSession
closeSession
Style Bypasses Setting and clearing bypass values for visual properties setNodeColorBypass
setEdgeLineStyleBypass
hideNodes
Style Defaults Getting and setting default values for visual properties setNodeShapeDefault setEdgeLineWidthDefault
Style Dependencies Getting and setting style dependencies lockNodeDimensions
Style Mappings Defining mappings between table column values and visual properties mapVisualProperty
updateStyleMapping
setNodeSizeMapping
setEdgeColorMapping
Style Values Retrieving current values for visual properties getNodeWidth
getEdgeColor
getNetworkZoom
Styles Managing styles and retrieving general lists of properties relevant to multiple style modes createVisualStyle
exportVisualStyles
getArrowShapes
Tables Managing table columns and table column functions, like map and rename, as well as loading and extracting table data in Cytoscape
getTableColumns
renameTableColumn
loadTableData
mapTableColumn
Tools Performing actions found in the Tools Menu in Cytoscape cybrowserDialog
diffusionBasic
User Interface Controling the panels in the Cytoscape user interface hidePanel
floatPanel
Page 4 of 18
F1000Research 2019, 8:1774 Last updated: 09 NOV 2021
In most RCy3 functions there is an optional argument for base.url. This is the URL used by RCy3 to con-nect to the Cytoscape desktop application via CyREST, and it defaults to "http://localhost:1234/v1". The default CyREST port is 1234, and it can be changed in Cytoscape through Edit/Preferences/Proper-ties or by command-line (see CyREST setup guide). If you change the CyREST port, you should reflect the change in the base.url argument per function call or change each function’s default value using the default package.
The second most common argument in RCy3 functions is network. If left as NULL (default), the currently selected network in the Cytoscape application is referenced. Network name or SUID (session unique identi-fier) can thus be explicitly specified or inferred from the current state of the application. The current network can also be controlled and retrieved by setCurrentNetwork and getCurrentNetwork. Given a base.url and network (when needed), the majority of RCy3 functions simply validate parameters and construct arguments in order to call one of the cyrest* or commands* functions.
The commandsRun function is a special RCy3 function that allows users to directly issue commands via Cytoscape’s command-line syntax (e.g., "node l�st network�current"node l�st network�current""), including commands imple-mented by Cytoscape app developers (see Use cases). This single function can perform hundreds of opera-tions made available by both Cytoscape and automation-enabled apps. Over 40 of these RCy3-supported apps are currently registered in the Cytoscape App Store2. The cyrestAPI and commandsAPI open interactive Swagger documentation for the CyREST and Commands programmatic interfaces. Cytoscape Automation can be performed via these Swagger web pages. The same operations and parameters are supported by the cyrest* and commands* functions in RCy3. Command-line syntax can also be run from the Automation panel in Cytoscape, at manual.cytoscape.org/en/stable/Command_Tool.html.
Generic and specificThe primary goal of RCy3 is to provide wrappers for every feature made available by CyREST and Commands. However, we also have a secondary goal of providing useful and intuitive functions for common workflows in R. So, in addition to the generic functions implemented to parallel the CyREST and Commands APIs, we have also implemented sets of specific helper functions.
As an example, consider the common Cytoscape operation of mapping network data values to visual style prop-erties. CyREST has a POST endpoint for /styles/{style name}/mapp�ngs that takes a JSON data structure defining the mapping. We implemented updateStyleMapp�ng which takes a style.name and mapping arguments and sends them out via cyrestPOST. We also implemented mapV�sualProperty to help construct the mapp�ng argument. With these generic functions one can perform any of the hundreds of visual style mappings supported by Cytoscape, including new ones added in the future. However, these func-tions are not simple to use, requiring knowledge of specific property names, like "NO�E��ILL�COLOR"NO�E��ILL�COLOR"", and mapping data structures. To simplify usage for common situations, we therefore also implemented specific functions for over a dozen of the most commonly used mappings (e.g., setNodeColorMapp�ng). With autocomplete in tools like RStudio, after just typing setNode... a script author is presented with a series of intuitively named functions with obvious arguments.
Networks in RNetworks are a popular visualization option in R often implemented as graph models by igraph and Bio-condutor’s graph (i.e., graphNEL). RCy3 can create networks in Cytoscape from either igraph, graphNEL or dataframe objects (createNetwork�rom*). Likewise, igraph and graphNEL objects can be created from networks (create*�romNetwork), and dataframes from node and edge tables in Cytoscape (getTableColumns).
In the case of createNetwork�rom�ata�rames, two dataframes are accepted as arguments, one for nodes and one for edges. The nodes dataframe must include a column named "�d"�d"", and the edges data-frame must include "source"source"" and "target"target"" columns. Additional columns are imported as node and edge attributes into Cytoscape. The function can also work with just one dataframe. If a dataframe of only edges is passed to createNetwork�rom�ata�rames, then a connected network will be created with all of the nodes. If a dataframe of only nodes is passed, then a network with no connections, only nodes, will be created.
RCy3 can also import network file formats supported by Cytoscape natively (e.g., SIF, xGMML and CX7) and via user-installed apps (e.g., GPML8 and adjacency matrices). With these functions RCy3 can
Page 5 of 18
F1000Research 2019, 8:1774 Last updated: 09 NOV 2021
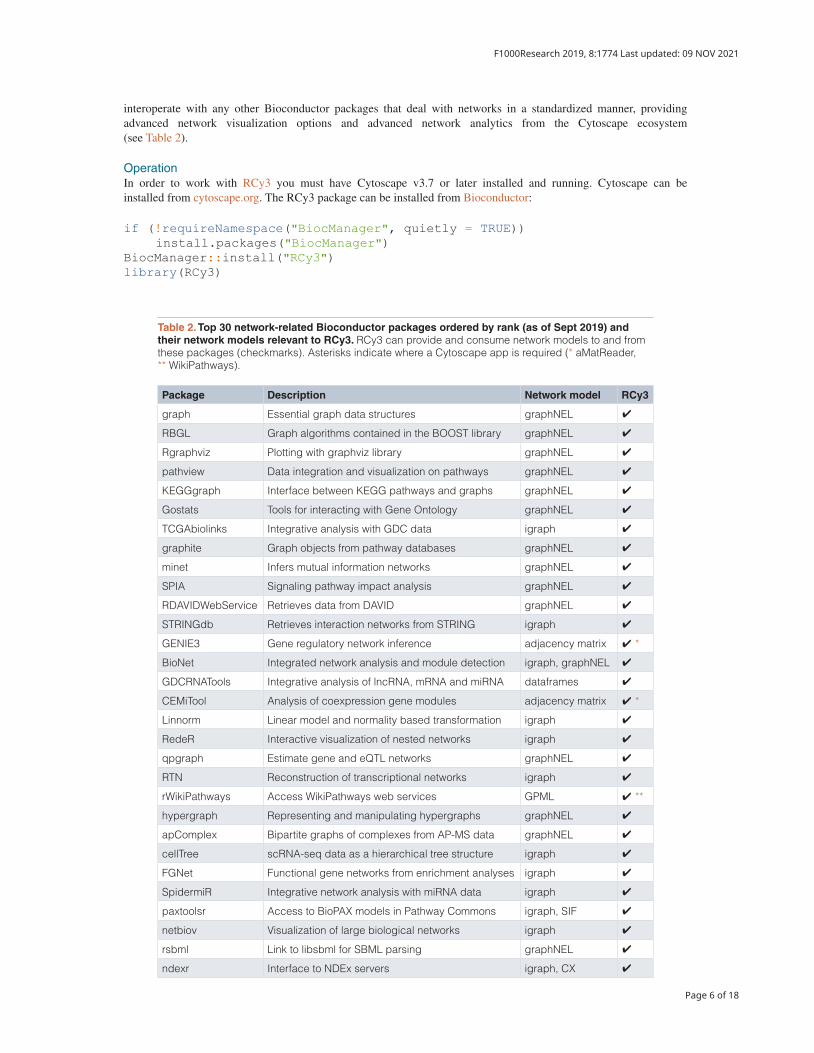
interoperate with any other Bioconductor packages that deal with networks in a standardized manner, providing advanced network visualization options and advanced network analytics from the Cytoscape ecosystem (see Table 2).
OperationIn order to work with RCy3 you must have Cytoscape v3.7 or later installed and running. Cytoscape can be installed from cytoscape.org. The RCy3 package can be installed from Bioconductor:
�f (!requ�reNamespace("B�ocManager", qu�etly � TRUE)) �nstall.packages("B�ocManager")B�ocManager::�nstall("RCy3")l�brary(RCy3)
Table 2. Top 30 network-related Bioconductor packages ordered by rank (as of Sept 2019) and their network models relevant to RCy3. RCy3 can provide and consume network models to and from these packages (checkmarks). Asterisks indicate where a Cytoscape app is required (* aMatReader, ** WikiPathways).
Package Description Network model RCy3
graph Essential graph data structures graphNEL ✔
RBGL Graph algorithms contained in the BOOST library graphNEL ✔
Rgraphviz Plotting with graphviz library graphNEL ✔
pathview Data integration and visualization on pathways graphNEL ✔
KEGGgraph Interface between KEGG pathways and graphs graphNEL ✔
Gostats Tools for interacting with Gene Ontology graphNEL ✔
TCGAbiolinks Integrative analysis with GDC data igraph ✔
graphite Graph objects from pathway databases graphNEL ✔
minet Infers mutual information networks graphNEL ✔
SPIA Signaling pathway impact analysis graphNEL ✔
RDAVIDWebService Retrieves data from DAVID graphNEL ✔
STRINGdb Retrieves interaction networks from STRING igraph ✔
GENIE3 Gene regulatory network inference adjacency matrix ✔ *
BioNet Integrated network analysis and module detection igraph, graphNEL ✔
GDCRNATools Integrative analysis of lncRNA, mRNA and miRNA dataframes ✔
CEMiTool Analysis of coexpression gene modules adjacency matrix ✔ *
Linnorm Linear model and normality based transformation igraph ✔
RedeR Interactive visualization of nested networks igraph ✔
qpgraph Estimate gene and eQTL networks graphNEL ✔
RTN Reconstruction of transcriptional networks igraph ✔
rWikiPathways Access WikiPathways web services GPML ✔ **
hypergraph Representing and manipulating hypergraphs graphNEL ✔
apComplex Bipartite graphs of complexes from AP-MS data graphNEL ✔
cellTree scRNA-seq data as a hierarchical tree structure igraph ✔
FGNet Functional gene networks from enrichment analyses igraph ✔
SpidermiR Integrative network analysis with miRNA data igraph ✔
paxtoolsr Access to BioPAX models in Pathway Commons igraph, SIF ✔
netbiov Visualization of large biological networks igraph ✔
rsbml Link to libsbml for SBML parsing graphNEL ✔
ndexr Interface to NDEx servers igraph, CX ✔
Page 6 of 18
F1000Research 2019, 8:1774 Last updated: 09 NOV 2021
Launch Cytoscape and keep it running whenever using RCy3. Confirm that you have everything installed and that RCy3 is communicating with Cytoscape via CyREST:
cytoscapeP�ng()#[1] "You are connected to Cytoscape!"
As with any R package, one can access the documentation and browse over a dozen vignettes included in the RCy3 package:
help(package�RCy3)browseV�gnettes("RCy3")
Use casesThe following sections demonstrate a variety of common and advanced network biology use cases as runnable R code snippets. The code for these use cases is also available as an online Rmd notebook and Rmd file in the Cytoscape Automation repository (see Data availability). The first set focuses on fundamental Cytoscape operations that are common to most use cases:
• Loading networks (from R objects, Cytoscape files and public databases)
• Visualizing network data
• Filtering by node degree or data
• Saving and exporting networks
Additionally, there are examples that demonstrate analytical workflows, relying not only on Cytoscape, but also on Cytoscape apps and other R packages:
• Building maps of enrichment analysis results using EnrichmentMap and AutoAnnotate
• Visualizing integrated network analysis using BioNet
• Performing advanced graph analytics using RBGL
Loading Networks. Networks come in all shapes and sizes, in multiple formats from multiple sources. The following code snippets demonstrate just a few of the myriad ways to load networks into Cytoscape using RCy3.
From R objects. . .
# �rom graph objects (graphNEL)g <- makeS�mpleGraph()createNetwork�romGraph(g)## And round-tr�p back from Cytoscape to graphg2 <- createGraph�romNetwork()
# �rom �graph objectsl�brary(�graph)�g <- �graph::make�graph("Zachary")createNetwork�romIgraph(�g)## And round-tr�p back from Cytoscape to �graph�g2 <- createIgraph�romNetwork()## Note that the Cytoscape model �nfers d�rect�onal�ty
# �rom dataframesnodes <- data.frame(�d�c("node 0","node 1","node 2","node 3"), group�c("A","A","B","B"), #categor�cal str�ngs score�as.�nteger(c(20,10,15,5)), #�ntegers str�ngsAs�actors��ALSE)edges <- data.frame(source�c("node 0","node 0","node 0","node 2"), target�c("node 1","node 2","node 3","node 3"), �nteract�on�c("�nh�b�ts","�nteracts", "act�vates","�nteracts"), #opt�onal we�ght�c(5.1,3.0,5.2,9.9), #numer�cs str�ngsAs�actors��ALSE)createNetwork�rom�ata�rames(nodes, edges)
Page 7 of 18
F1000Research 2019, 8:1774 Last updated: 09 NOV 2021
From Cytoscape-supported file formats. . .
# �rom Cytoscape sess�on f�les## W�ll erase and replace all data from current sess�on!openSess�on() # default f�le � gal��ltered.cys
# �rom local network f�les�mportNetwork�rom��le() # default f�le � gal��ltered.s�f## Supported f�le formats: SI�, GML, xGMML, graphML, CX, plus
# �rom N�Ex (https://ndexb�o.org), the network database�mportNetwork�romN�Ex("5be85817-1e5f-11e8-b939-0ac135e8bacf")## Account �nformat�on or accessKey are requ�red arguments only## when access�ng pr�vate content
From public databases via Cytoscape apps. . .
# �rom STRING (https://str�ng-db.org), start�ng w�th a l�st of genes/prote�ns�nstallApp("str�ngApp") # http://apps.cytoscape.org/apps/str�ngappgene.l�st <- c("T53","AKT1","C�KN1A")gene.str <- paste(gene.l�st, collapse � ",")str�ng.cmd <- paste("str�ng prote�n query cutoff�0.99 l�m�t�40 query", gene.str, sep � "�")commandsRun(str�ng.cmd)
# �rom W�k�Pathways (https://w�k�pathways.org), start�ng w�th a keywordl�brary(rW�k�Pathways) # �nstall from B�oconductor�nstallApp("W�k�Pathways") # http://apps.cytoscape.org/apps/w�k�pathwayskeyword <- "gl�oblastoma"gbm.pathways <- f�ndPathwaysByText(keyword)gbm.wp�d <- gbm.pathways[[1]]$�d # let’s just take the f�rst onew�k�pathways.cmd <- paste("w�k�pathways �mport-as-pathway �d", gbm.wp�d, sep � "�")commandsRun(w�k�pathways.cmd)
Visualizing data on networks. Cytoscape excels at generating publication-quality network visualization with data overlays. This vignette demonstrates just one of the hundreds of visual style mapping options using RCy3.
# Load sample networkcloseSess�on(�ALSE) # clears all sess�on data w�htout sav�ng�mportNetwork�rom��le() # default f�le � gal��ltered.s�f
# Load sample datacsv <- system.f�le("extdata","galExp�ata.csv", package�"RCy3")data <- read.csv(csv, str�ngsAs�actors � �ALSE)loadTable�ata(data,data.key.column�"name")
# Prepare data-mapp�ng po�ntsgal80Rexp.m�n <- m�n(data$gal80Rexp, na.rm � T)gal80Rexp.max <- max(data$gal80Rexp, na.rm � T)## �or a balanced color grad�ent, p�ck the largest absolute valuegal80Rexp.max.abs <- max(abs(gal80Rexp.m�n), abs(gal80Rexp.max))
# Set node color grad�ent from blue to wh�te to redsetNodeColorMapp�ng('gal80Rexp', c(-gal80Rexp.max.abs, 0, gal80Rexp.max.abs), c('#5577��','#������','#��7755'), default.color � '#999999')
Page 8 of 18
F1000Research 2019, 8:1774 Last updated: 09 NOV 2021
Filtering networks by degree and by data. Network topology and associated node or edge data can be used to make selections in Cytoscape that enable filtering and subnetworking. The filters are added to the Select tab in the Control Panel of Cytoscape’s GUI and saved in session files.
# Load demo Cytoscape sess�on f�leopenSess�on() # default f�le � gal��ltered.cysnet.su�d <- getNetworkSu�d() # get SUI� for future reference
# ��lter for ne�ghbors of h�gh degree nodescreate�egree��lter(f�lter.name � "degree filter", cr�ter�on � c(0,9), pred�cate � "IS�NOT�BETWEEN")select��rstNe�ghbors() # expand select�on to f�rst ne�ghborscreateSubnetwork(subnetwork.name � "f�rst ne�ghbors of h�gh degree nodes")
# ��lter for h�gh edge betweennesscreateColumn��lter(f�lter.name � "edge betweenness", type � "edges", column � "EdgeBetweenness", 4000, "GREATER�THAN", network � net.su�d)createSubnetwork(subnetwork.name � "h�gh edge betweenness")
Saving and exporting networks. There are local and cloud-hosted options for saving and sharing network models and images. The Cytoscape session file (CYS) includes all networks, collections, tables and styles. It retains every aspect of your session, including the size of the application window. Network and image exports include only the currently active network. Export to NDEx requires account information you can obtain from ndexbio.org. Files are saved to the current working directory by default, unless a full path is provided.
# Sav�ng sess�onssaveSess�on("MySess�on") #.cys## Leave f�lename blank to update prev�ously saved sess�on f�le
# Export�ng �mages and networksexportNetwork() #.s�f## Opt�onally spec�fy f�lename, default �s network name## Opt�onally spec�fy type: SI�(default), CX, cyjs, graphML, NN�, SI�, xGMMLexportImage() #.png## Opt�onally spec�fy f�lename, default �s network name## Opt�onally spec�fy type: PNG (default), JPEG, P��, PostScr�pt, SVG
# Export�ng to N�Ex, a.k.a. “�ropbox” for networksexportNetworkToN�Ex(username, password, TRUE)## Account �nformat�on (username and password) �s requ�red to upload## Use updateNetworkInN�Ex �f the network has prev�ously been uploaded
Building maps of enrichment analysis results. This workflow illustrates how to plot an annotated map of enrich-ment results using the EnrichmentMap Pipeline Collection of apps in Cytoscape9. An enrichment map is a net-work visualization of related genesets in which nodes are gene sets (or pathways) and edge weight indicates the overlap in member genes10. Following the construction of the enrichment map, AutoAnnotate clusters redun-dant gene sets and uses WordCloud11 to label the resulting cluster (Figure 2). The code uses the Commands interface to invoke EnrichmentMap and AutoAnnotate apps. After installing apps, run commandsAPI() to open the live Swagger documentation to browse and execute command-line syntax.
Page 9 of 18
F1000Research 2019, 8:1774 Last updated: 09 NOV 2021
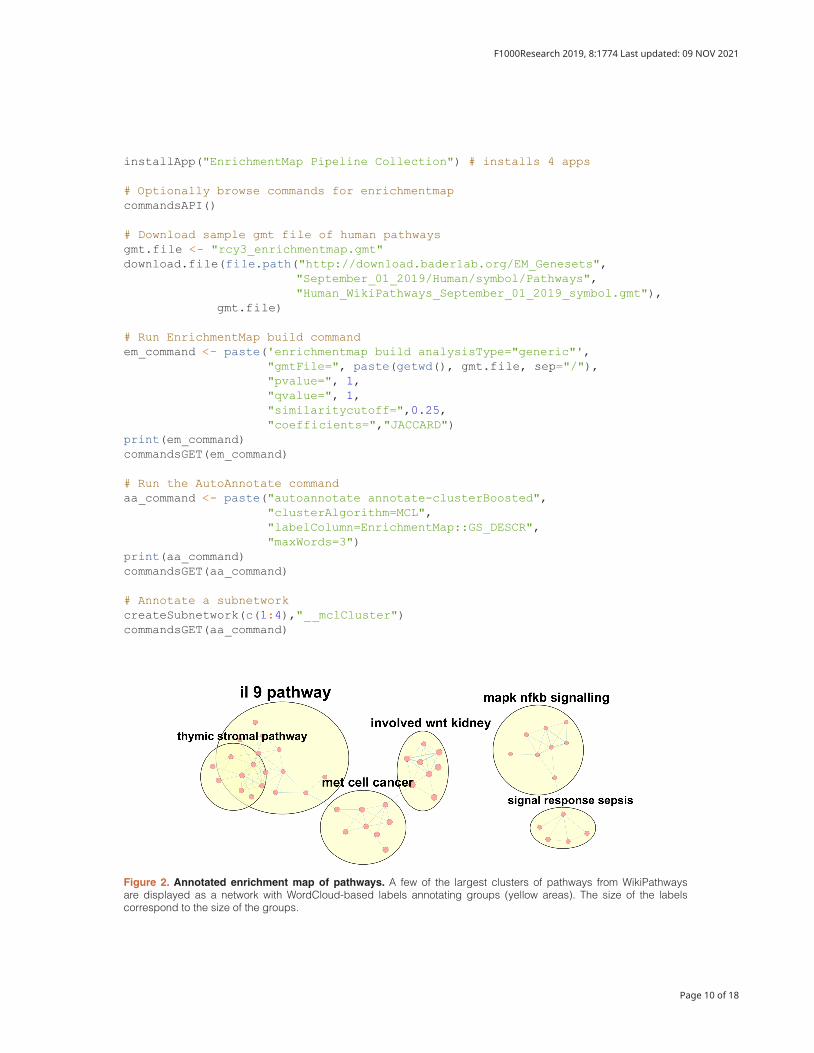
�nstallApp("Enr�chmentMap P�pel�ne Collect�on") # �nstalls 4 apps
# Opt�onally browse commands for enr�chmentmapcommandsAPI()
# �ownload sample gmt f�le of human pathwaysgmt.f�le <- "rcy3�enr�chmentmap.gmt"download.f�le(f�le.path("http://download.baderlab.org/EM�Genesets", "September�01�2019/Human/symbol/Pathways", "Human�W�k�Pathways�September�01�2019�symbol.gmt"), gmt.f�le) # Run Enr�chmentMap bu�ld commandem�command <- paste('enr�chmentmap bu�ld analys�sType�"gener�c"', "gmt��le�", paste(getwd(), gmt.f�le, sep�"/"), "pvalue�", 1, "qvalue�", 1, "s�m�lar�tycutoff�",0.25, "coeff�c�ents�","JACCAR�")pr�nt(em�command)commandsGET(em�command)
# Run the AutoAnnotate commandaa�command <- paste("autoannotate annotate-clusterBoosted", "clusterAlgor�thm�MCL", "labelColumn�Enr�chmentMap::GS��ESCR", "maxWords�3")pr�nt(aa�command)commandsGET(aa�command)
# Annotate a subnetworkcreateSubnetwork(c(1:4),"��mclCluster")commandsGET(aa�command)
Figure 2. Annotated enrichment map of pathways. A few of the largest clusters of pathways from WikiPathways are displayed as a network with WordCloud-based labels annotating groups (yellow areas). The size of the labels correspond to the size of the groups.
Page 10 of 18
F1000Research 2019, 8:1774 Last updated: 09 NOV 2021
Visualizing integrated network analysis using BioNet. The BioNet package implements analytical methods to per-form integrated network analysis, for example, of gene expression data and clinical survival data in the context of protein-protein interaction networks. Partnered with RCy3, the analytical results from BioNet can be visualized in Cytoscape with vastly more options for customization. Starting with the “Quick Start” tutorial from BioNet, we pass the results directly to Cytoscape for visualization:
l�brary(B�oNet) # �nstall from B�oconductorl�brary(�LBCL) # �nstall from B�oconductordata(dataLym)data(�nteractome)
## The follow�ng steps are from B�oNet's Qu�ck Start tutor�al:pvals <- cb�nd(t � dataLym$t.pval, s � dataLym$s.pval)rownames(pvals) <- dataLym$labelpval <- aggrPvals(pvals, order � 2, plot � �ALSE)subnet <- subNetwork(dataLym$label, �nteractome)subnet <- rmSelfLoops(subnet)fb <- f�tBumModel(pval, plot � �ALSE)scores <- scoreNodes(subnet, fb, fdr � 0.001)module <- run�astHe�nz(subnet, scores)log�C <- dataLym$d�ffnames(log�C) <- dataLym$labelplotModule(module, scores � scores, d�ff.expr � log�C)
# Us�ng RCy3 we can generate a custom v�sual�zat�on of the same output## Create network from graphNEL object and load data calculated abovecreateNetwork�romGraph(module, "module", "B�oNet")loadTable�ata(as.data.frame(scores))loadTable�ata(as.data.frame(log�C))
## Set stylessetNodeLabelMapp�ng("geneSymbol")setNode�ontS�ze�efault(18)setNodeBorderW�dth�efault(3.0)log�C.max.abs <- max(abs(m�n(log�C)), abs(max(log�C)))setNodeColorMapp�ng('log�C', c(-log�C.max.abs, 0, log�C.max.abs), c('#5577��','#������','#��7755'), default.color � '#999999')createColumn��lter("Pos�t�ve scores", "scores",c(0,max(scores)),"BETWEEN")setNodeShapeBypass(getSelectedNodes(), "ELLIPSE")
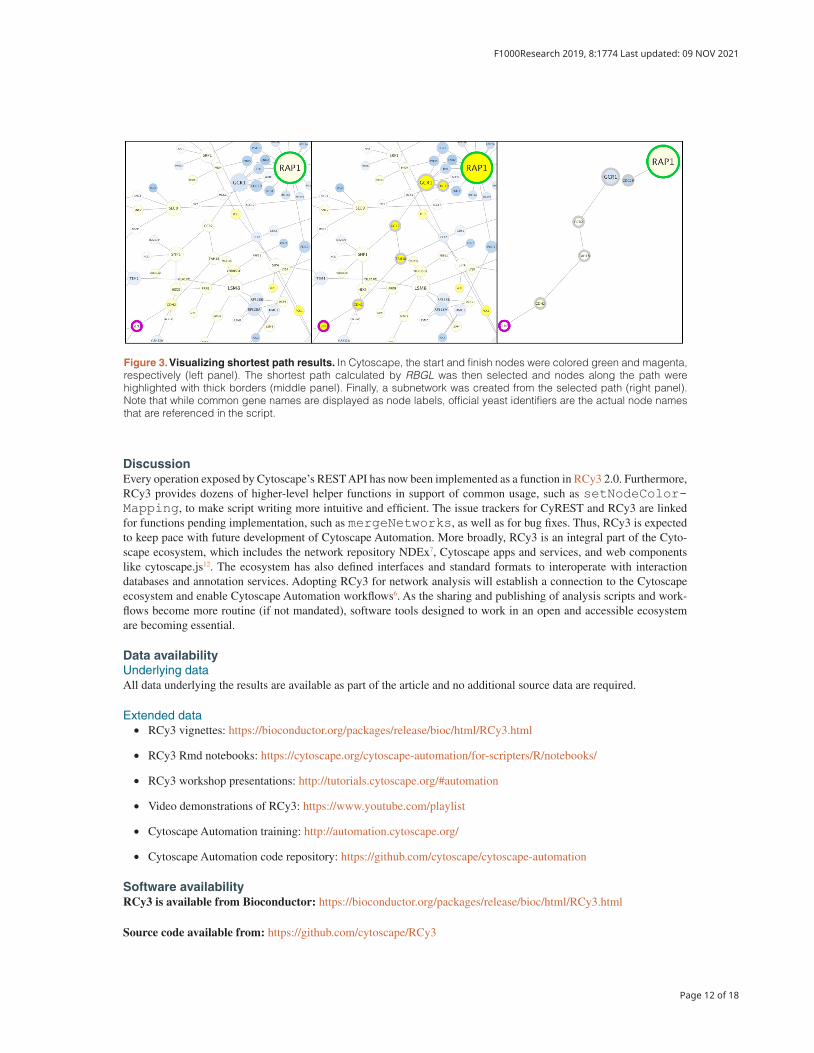
Performing advanced graph analytics using RBGL. As an interface to the BOOST library, the RBGL Bioconductor pack-age offers an impressive array of analytical functions for graphs. Here we will start with a network in Cytoscape, load it into R as a graph object, perform shortest path calculation using RBGL and then visualize the results back in Cytoscape (Figure 3).
l�brary(RBGL) # �nstall from B�oconductor# Convert a sample Cytoscape network to a graph objectopenSess�on()g <- createGraph�romNetwork()
# Ident�fy start and f�n�sh nodes (styl�ng �s opt�onal)start <- "YNL216W"f�n�sh <- "YER040W"setNodeBorderW�dthBypass(c(start,f�n�sh), 20)setNodeBorderColorBypass(start,"#00CC33")setNodeBorderColorBypass(f�n�sh,"#CC00CC")
# Use RBGL to perform shortest path calculat�onshortest <- sp.between(g, start, f�n�sh)shortest$'YNL216W:YER040W'$length#[1] 6shortest.path <- shortest$'YNL216W:YER040W'$path�deta�l
# V�sual�ze results �n CytoscapeselectNodes(shortest.path, "name")setNodeBorderW�dthBypass(shortest.path, 20)createSubnetwork() Page 11 of 18
F1000Research 2019, 8:1774 Last updated: 09 NOV 2021
DiscussionEvery operation exposed by Cytoscape’s REST API has now been implemented as a function in RCy3 2.0. Furthermore, RCy3 provides dozens of higher-level helper functions in support of common usage, such as setNodeColor-Mapp�ng, to make script writing more intuitive and efficient. The issue trackers for CyREST and RCy3 are linked for functions pending implementation, such as mergeNetworks, as well as for bug fixes. Thus, RCy3 is expected to keep pace with future development of Cytoscape Automation. More broadly, RCy3 is an integral part of the Cyto-scape ecosystem, which includes the network repository NDEx7, Cytoscape apps and services, and web components like cytoscape.js12. The ecosystem has also defined interfaces and standard formats to interoperate with interaction databases and annotation services. Adopting RCy3 for network analysis will establish a connection to the Cytoscape ecosystem and enable Cytoscape Automation workflows6. As the sharing and publishing of analysis scripts and work-flows become more routine (if not mandated), software tools designed to work in an open and accessible ecosystem are becoming essential.
Data availabilityUnderlying dataAll data underlying the results are available as part of the article and no additional source data are required.
Extended data• RCy3 vignettes: https://bioconductor.org/packages/release/bioc/html/RCy3.html
• RCy3 Rmd notebooks: https://cytoscape.org/cytoscape-automation/for-scripters/R/notebooks/
• RCy3 workshop presentations: http://tutorials.cytoscape.org/#automation
• Video demonstrations of RCy3: https://www.youtube.com/playlist
• Cytoscape Automation training: http://automation.cytoscape.org/
• Cytoscape Automation code repository: https://github.com/cytoscape/cytoscape-automation
Software availabilityRCy3 is available from Bioconductor: https://bioconductor.org/packages/release/bioc/html/RCy3.html
Source code available from: https://github.com/cytoscape/RCy3
Figure 3. Visualizing shortest path results. In Cytoscape, the start and finish nodes were colored green and magenta, respectively (left panel). The shortest path calculated by RBGL was then selected and nodes along the path were highlighted with thick borders (middle panel). Finally, a subnetwork was created from the selected path (right panel). Note that while common gene names are displayed as node labels, official yeast identifiers are the actual node names that are referenced in the script.
Page 12 of 18
F1000Research 2019, 8:1774 Last updated: 09 NOV 2021
Archived source code at time of publication: https://doi.org/10.5281/zenodo.3473421
Issue tracker: https://github.com/cytoscape/RCy3/issues
License: MIT License.
Author contributionsAP, SP and RI redesigned and implemented version 2 of RCy3. AP, JAG, SP and BD drafted the manuscript. AP, JAG, SP and RI contributed use cases.
AcknowledgmentsWe would like to acknowledge contributions by other developers on the original implementation of RCy3 by Paul Shannon, Tanja Muetze and Georgi Kolishkovski. We also greatly appreciate the input from Mark Grimes (testing), Martin Morgan (Bioconductor), and the excellent work on CyREST and Cytoscape Commands by David Otasek and John “Scooter” Morris.
References
1. Shannon P, Markiel A, Ozier O, et al.: Cytoscape: a software environment for integrated models of biomolecular interaction networks. Genome Res. 2003; 13(11): 2498–2504. PubMed Abstract | Publisher Full Text | Free Full Text
2. Lotia S, Montojo J, Dong Y, et al.: Cytoscape app store. Bioinformatics. 2013; 29(10): 1350–1351. PubMed Abstract | Publisher Full Text | Free Full Text
3. Demchak B, Otasek D, Pico AR, et al.: The Cytoscape Automation app article collection [version 1; peer review: not peer reviewed]. F1000Res. 2018; 7: 800. PubMed Abstract | Publisher Full Text | Free Full Text
4. Shannon PT, Grimes M, Kutlu B, et al.: RCytoscape: tools for exploratory network analysis. BMC Bioinformatics. 2013; 14: 217. PubMed Abstract | Publisher Full Text | Free Full Text
5. Ono K, Muetze T, Kolishovski G, et al.: CyREST: Turbocharging Cytoscape Access for External Tools via a RESTful API [version 1; peer review: 2 approved]. F1000Res. 2015; 4: 478. PubMed Abstract | Publisher Full Text | Free Full Text
6. Otasek D, Morris JH, Bouças J, et al.: Cytoscape Automation: empowering workflow-based network analysis. Genome Biol. 2019; 20(1): 185. PubMed Abstract | Publisher Full Text | Free Full Text
7. Pratt D, Chen J, Pillich R, et al.: NDEx 2.0: A Clearinghouse for Research on Cancer Pathways. Cancer Res. 2017; 77(21): e58–e61. PubMed Abstract | Publisher Full Text | Free Full Text
8. van Iersel MP, Kelder T, Pico AR, et al.: Presenting and exploring biological pathways with PathVisio. BMC Bioinformatics. 2008; 9: 399. PubMed Abstract | Publisher Full Text | Free Full Text
9. Reimand J, Isserlin R, Voisin V, et al.: Pathway enrichment analysis and visualization of omics data using g:Profiler, GSEA, Cytoscape and EnrichmentMap. Nat Protoc. 2019; 14(2): 482–517. PubMed Abstract | Publisher Full Text | Free Full Text
10. Merico D, Isserlin R, Stueker O, et al.: Enrichment map: a network-based method for gene-set enrichment visualization and interpretation. PLoS One. 2010; 5(11): e13984. PubMed Abstract | Publisher Full Text | Free Full Text
11. Oesper L, Merico D, Isserlin R, et al.: WordCloud: a Cytoscape plugin to create a visual semantic summary of networks. Source Code Biol Med. 2011; 6: 7. PubMed Abstract | Publisher Full Text | Free Full Text
12. Franz M, Lopes CT, Huck G, et al.: Cytoscape.js: a graph theory library for visualisation and analysis. Bioinformatics. 2016; 32(2): 309–311. PubMed Abstract | Publisher Full Text | Free Full Text
Page 13 of 18
F1000Research 2019, 8:1774 Last updated: 09 NOV 2021
Open Peer ReviewCurrent Peer Review Status:
Version 1
Reviewer Report 21 November 2019
https://doi.org/10.5256/f1000research.22981.r55401
© 2019 Bhuvaneshwar K. This is an open access peer review report distributed under the terms of the Creative Commons Attribution License, which permits unrestricted use, distribution, and reproduction in any medium, provided the original work is properly cited.
Krithika Bhuvaneshwar Innovation Center for Biomedical Informatics, Georgetown University Medical Center, Washington, DC, USA
This is a review of the manuscript titled "RCy3: Network biology using Cytoscape from within R". RCy3 is a Bioconductor package that communicates with Cytoscape via its REST API to build and visualize networks. This manuscript is about a re-designed/updated RCy3 package and its function and implementation. My comments are below:
The authors say "We have re-written every function". Is it backward compatible? Should existing users of the older version of the package have to make changes in their code?
○
The authors say "Over 100 new functions have been added, including dozens of helper functions specifically for intuitive data overlay operations". This is a great achievement. In addition to this statement, perhaps it would be helpful for users to summarize/compare what the main improvements are in this newer version?
○
Does this newer version include more or better (or the same) interoperability with other major packages that use RCy3? For example, exporting and importing to/from Ndex. From the example code listed in the paper, it seems there is no change in the way the interoperability works?
○
Minor comment: It is helpful to call the package RCy3 2.0 or something to note the version change? Would keeping the same name be confusing for users? Overall great work! RCy3 is one of the major packages that work with Cytoscape so very important for the R/BioC Community. Not all authors of Bioconductor and R packages take effort to update their packages, so I commend this effort. I have used RCy3 in the past and am excited to try out this newest version of the package. Is the rationale for developing the new software tool clearly explained?
Page 14 of 18
F1000Research 2019, 8:1774 Last updated: 09 NOV 2021
Yes
Is the description of the software tool technically sound?Yes
Are sufficient details of the code, methods and analysis (if applicable) provided to allow replication of the software development and its use by others?Yes
Is sufficient information provided to allow interpretation of the expected output datasets and any results generated using the tool?Yes
Are the conclusions about the tool and its performance adequately supported by the findings presented in the article?Yes
Competing Interests: No competing interests were disclosed.
Reviewer Expertise: Bioinformatics, Genomic Data Science, Translational and Precision Health Informatics
I confirm that I have read this submission and believe that I have an appropriate level of expertise to confirm that it is of an acceptable scientific standard.
Author Response 21 Nov 2019Alexander Pico, Gladstone Institutes, San Francisco, USA
Thank you for your careful review and questions. The package is not backward compatible. We in fact initially submitted it as a completely new package, but were encouraged by Bioconductor reviewers to coordinate with the original RCy3 authors and submit it as a new version of the same package, which we did. The version number is kept separate from the package name per Bioconductor and semantic versioning conventions, so we maintained the original package name. There is a vignette dedicated to upgrading scripts from the original to version 2: (https://bioconductor.org/packages/release/bioc/vignettes/RCy3/inst/doc/Upgrading-existing-scripts.html), which highlights the major differences and improvements. The original version focused on graphNEL objects, so interoperability with other graphNEL-based packages perhaps hasn’t changed. But I just now double checked the old code base and I can’t find any NDEx, igraph, data frame or adjacency matrix related functions for network interoperability in the original version.
Competing Interests: No competing interests were disclosed.
Page 15 of 18
F1000Research 2019, 8:1774 Last updated: 09 NOV 2021
Reviewer Report 31 October 2019
https://doi.org/10.5256/f1000research.22981.r55403
© 2019 Denvir J. This is an open access peer review report distributed under the terms of the Creative Commons Attribution License, which permits unrestricted use, distribution, and reproduction in any medium, provided the original work is properly cited.
James Denvir Department of Biomedical Sciences, Joan C. Edwards School of Medicine, Marshall University, Huntington, WV, USA
This article presents an R package, RCy3, designed to control and automate the network visualization software application Cytoscape. The article describes both a low-level ("generic") and a high-level ("specific") API and presents use-cases with some code samples. Overall this appears to be an API with great potential utility for the bioinformatics community, and the article presents the package clearly and with several useful and informative examples. I have a couple of minor comments and suggestions, which I hope will serve to improve the article. The abstract mentions the potential for RCy3 to deliver reproducible workflows. In my opinion, reproducibility is among the most important benefits of code/script-based workflows over workflows performed using "point and click" GUI-based applications. However, the article does not elaborate on this outside of the abstract. A couple of sentences in the discussion describing the potential for RCy3 to enhance reproducibility would be worthwhile. The article mentions that the Cytoscape App store currently lists over 40 "RCy3-supported apps". A quick note on what is needed for a third party app to be "RCy3-supported" might be pertinent here. This may be already sufficiently covered in existing publications (e.g. reference 6), in which case a simple note to that effect would suffice. The code block for the section "Building maps of enrichment analysis results" is not quite as clear as the other code blocks in the article. A comment indicating that commandsAPI() opens a web browser page (externally; at least in my environment) and comments after the print() statements showing the expected output, as in the other blocks of code, would be helpful. The uses of file.path and paste(... sep='/') are a little confusing here (to be honest, I was surprised to find these actually worked on Windows systems); brief comments added to the code might aid readability here. Is the rationale for developing the new software tool clearly explained?Yes
Is the description of the software tool technically sound?Yes
Page 16 of 18
F1000Research 2019, 8:1774 Last updated: 09 NOV 2021
Are sufficient details of the code, methods and analysis (if applicable) provided to allow replication of the software development and its use by others?Yes
Is sufficient information provided to allow interpretation of the expected output datasets and any results generated using the tool?Yes
Are the conclusions about the tool and its performance adequately supported by the findings presented in the article?Yes
Competing Interests: No competing interests were disclosed.
Reviewer Expertise: Bioinformatics.
I confirm that I have read this submission and believe that I have an appropriate level of expertise to confirm that it is of an acceptable scientific standard.
Author Response 21 Nov 2019Alexander Pico, Gladstone Institutes, San Francisco, USA
Thank you for your careful review and suggestions. We share your opinion regarding the importance of reproducibility and will add a sentence accordingly to the Discussion section. The support of automation by Cytoscape apps is indeed a major topic of reference 6; we will note that in the text as well. Regarding the code block, we will likely remove the commandsAPI() call to not surprise/distract users with a browser window opening. The use of file.path is simply to avoid a really long string, i.e., longer than the column width of this publication. The use of forward slash is in paths is a generic solution to avoid platform-specific conventions and avoid having to escape backslashes. Neither of these last two “tricks” are at all specific to RCy3, so we might just leave those as-is.
Competing Interests: No competing interests were disclosed.
Page 17 of 18
F1000Research 2019, 8:1774 Last updated: 09 NOV 2021
The benefits of publishing with F1000Research:
Your article is published within days, with no editorial bias•
You can publish traditional articles, null/negative results, case reports, data notes and more•
The peer review process is transparent and collaborative•
Your article is indexed in PubMed after passing peer review•
Dedicated customer support at every stage•
For pre-submission enquiries, contact [email protected]
Page 18 of 18
F1000Research 2019, 8:1774 Last updated: 09 NOV 2021