Rational Decision Making in Resource Allocation
25
From: Value for Money in Health Spending Access the complete publication at: http://dx.doi.org/10.1787/9789264088818-en Rational Decision Making in Resource Allocation Please cite this chapter as: OECD (2010), “Rational Decision Making in Resource Allocation”, in Value for Money in Health Spending, OECD Publishing. http://dx.doi.org/10.1787/9789264088818-6-en
Transcript of Rational Decision Making in Resource Allocation

From:Value for Money in Health Spending
Access the complete publication at:http://dx.doi.org/10.1787/9789264088818-en
Rational Decision Makingin Resource Allocation
Please cite this chapter as:
OECD (2010), “Rational Decision Making in Resource Allocation”, inValue for Money in Health Spending, OECD Publishing.http://dx.doi.org/10.1787/9789264088818-6-en

This document and any map included herein are without prejudice to the status of orsovereignty over any territory, to the delimitation of international frontiers and boundaries and tothe name of any territory, city or area.
Value for Money in Health Spending
© OECD 2010
81
Chapter 3
Rational Decision Making in Resource Allocation
Patients, providers and payers have a common interest in ensuring that health care
systems do not waste resources. Evidence-based medicine (EBM) and health
technology assessment (HTA) can help by focusing on two simple questions: does it
work, and is it worth it? This chapter explores potential efficiency gains that might
be achieved by introducing more rational decision making into clinical care and
looks at how clinical guidelines and health technology assessment can be used to
inform these decisions. It then reviews how these functions are realised in
institutions throughout the OECD.

3. RATIONAL DECISION MAKING IN RESOURCE ALLOCATION
VALUE FOR MONEY IN HEALTH SPENDING © OECD 201082
1. Introduction
Most patients assume that doctors and other health care providers are giving them
care of the highest quality possible, using the latest knowledge and most efficient
technology. Health care funders would like to think they are getting the best possible value
for their money. Both groups are often wrong. A number of studies over the past few
decades have examined the evidence concerning the medical and cost effectiveness of
treatments and techniques across a wide spectrum of health care activities. Whatever the
level of analysis, and whatever the specific concern examined, the findings are similar: you
do not always get what you pay for.
For one, higher spending on health at country level does not always correlate with
better health outcomes for the population. Likewise, there are widespread variations in
health spending by regions and even cities that appear to have no discernable impact on
health outcomes.
Patients, providers and payers have a common interest in ensuring that health care
systems do not waste resources. Evidence-based medicine (EBM) and health technology
assessment (HTA) can help by focusing on two simple questions: does it work, and is it
worth it? The first question is so simple it seems absurd, but analyses have shown that a
large percentage of medical interventions – up to a third in some cases – has questionable
benefits.1 Technology assessment (in the wide sense of drugs as well as machines and
other technical supports) asks not only whether a molecule or medical act works, but
whether it represents a significant improvement over previous methods, and if it is the
most efficient use of limited resources.
This chapter examines the potential to achieve efficiency gains by introducing more
rational decision making into clinical care. It reviews the methods for doing so: clinical
guidelines and health technology assessment. It then looks at how these functions are
realised in institutions throughout the OECD. There are many different ways to organise
these functions and countries could benefit from learning from each other’s experience.
2. The potential for enhanced efficiency
Evidence from a number of studies suggests that health systems have some room to
achieve efficiency gains.
Macroeconomic studies suggest potential efficiency gains in many countries
In a recent study (Joumard et al., 2008), the OECD estimated the impact of health care
spending on population health status, controlling for other determinants of health (income,
education, life-style factors and pollution). Taking life expectancy as the best available proxy
for population health status, panel regressions suggest that health care spending does not
provide the same value for money across OECD countries. If all countries were to become as
efficient as the best performers, people would live two additional years on average across

3. RATIONAL DECISION MAKING IN RESOURCE ALLOCATION
VALUE FOR MONEY IN HEALTH SPENDING © OECD 2010 83
OECD countries, for the same level of spending. Similar conclusions arise when using data
envelopment analysis to derive relative efficiency scores (Joumard et al., 2010).
These estimates should not be taken at face value, however: identifying health gains
that can be unambiguously attributed to the health system is challenging and many health
care services are not designed to increase length of life but instead to improve the quality of
life of patients. However, the 2008 study suggests that health spending growth contributed
by 46% to the observed increase in life expectancy of women and 39% for men in OECD
countries between 1991 and 2003, which means that “health spending matters for
longevity gains”.
International variations in medical practice cannot entirely be explained by epidemiology and uptake of innovation
Variations in medical practice have been observed both across countries and within
countries since the early 1970s (Mullan and Wennberg, 2004). Data regularly collected by
the OECD provide multiple examples of such variations across countries. For instance, the
rate of revascularisation procedures per 100 000 population ranges from 5 in Mexico to 692
in Germany (see Figure 3.1, Panel A). The consumption of anticholesterols varied from 49
defined daily doses per 1 000 people in Germany to 206 in Australia (see Figure 3.1, Panel B).
The number of MRI exams ranges from 12.7 per 1 000 population in Korea to 98.1 in Greece
(see Figure 3.1, Panel C).
Figure 3.1. International variations in medical practicePanel A. Coronary revascularisation procedures per 100 000 population, 2008
1. The statistical data for Israel are supplied by and under the responsibility of the relevant Israeli authorities. Theuse of such data by the OECD is without prejudice to the status of the Golan Heights, East Jerusalem and Israelisettlements in the West Bank under the terms of international law.
Note: Some of the variations across countries are due to different classification systems and recording practices.
Source: OECD (2010).
Percutaneous coronary interventions (PTCA and stenting)Percutaneous coronary interventions (PTCA and stenting) Coronary bypassCoronary bypass
692
559
521
455
368
310294
283 283267 267 255 252
233 232 229 220205219 204 201 199 192 187 183 175
138
50
100
200
300
400
500
600
700
800Procedures per 100 000 population
Germ
any
Belgiu
m (2
007)
Unite
d Sta
tes (2
006)
Italy
(200
7)
Norway
(200
7)
Czech
Rep
ublic
(200
7)
Icela
nd
Austri
a
Isra
el1
Esto
nia
Spain
Slove
nia
Polan
d
Denm
ark
Austra
lia (2
007)
Sweden
(200
7)
Fran
ce
Hunga
ry
Luxe
mbo
urg
(200
7)
Finlan
d
Nethe
rland
s (2
007)
New Z
ealan
d
Canad
a (2
007)
Portu
gal
Switzer
land
Irelan
d
Unite
d Kin
gdom
Mex
ico

3. RATIONAL DECISION MAKING IN RESOURCE ALLOCATION
VALUE FOR MONEY IN HEALTH SPENDING © OECD 201084
Figure 3.1. International variations in medical practice (cont.)Panel B. Anticholesterols consumption, defined daily doses per 1 000 people per day, 2000 and 2007
Source: OECD (2009).
21
14
31
29
36
26
34
27
41
81
43
57
21
59
60
78
49
70
92
102
109
110
112
118
119
125
126
131
136
146
146
169
187
206
0 50 100 150 200 250
Germany
Slovak Republic
Hungary
Spain
Sweden
Portugal
Iceland
Czech Republic
Luxembourg
OECD
France
Finland
Netherlands
Denmark
Belgium
Norway
United Kingdom
Australia
2000 2007
Defined daily doses per 1 000 people per day
Figure 3.1. International variations in medical practice (cont.)Panel C. Number of MRI exams per 1 000 population, 2008 (or latest year available)
1. Data include only exams for out-patients and private in-patients (excluding exams in public hospitals).statLink 2 http://dx.doi.org/10.1787/888932319478
0
20
40
60
80
100
MRI exams per 1 000 population
Greec
e
Unite
d Sta
tes
Icela
nd
Luxe
mbo
urg
Belgiu
m
Fran
ce
OECD
Nethe
rland
s
Denm
ark
Canad
a
Czech
Rep
ublic
Slova
k Rep
ublic
Austra
lia1
Korea
98.1 91.2
72.3
62.8
53.748.5
38.8 37.8
31.227.8
24.221.4
12.7
47.7

3. RATIONAL DECISION MAKING IN RESOURCE ALLOCATION
VALUE FOR MONEY IN HEALTH SPENDING © OECD 2010 85
These variations cannot entirely be explained by differences in the epidemiologic
context, though it certainly plays a role. Differences in the adoption of new technologies,
itself influenced by ability and willingness to pay, payment methods for providers,
manufacturers’ strategies, professional skills and preferences, are deemed to explain most
of these variations. For example, whether or not the treatment or procedure is covered by
health insurance is an important factor.
Local variations in medical practice suggest a potential for increasing the effectiveness and efficiency of health care provision
Studies on medical practice variations (MPV) also suggest that savings could be
achieved for the same level of health outcomes with a more efficient care process. Local
variations in medical practice have been observed in several OECD countries (Denmark, the
Netherlands, Norway, and Sweden) and even documented in great detail in the United
States (Mullan and Wennberg, 2004; Mulley, 2009). The Dartmouth Institute has been
providing information for many years about local practice variations and their explanatory
factors. Working on Medicare data, researchers of this Institute have shown that some
geographical areas tend to offer more care to chronically ill patients – care that yields no
added benefits and sometimes even adverse outcomes (see Figure 3.2; Dartmouth Institute,
2008; Mulley, 2009).
Such variations are found elsewhere too: studying utilisation rates of stents and
implantable cardioverter defibrillators (ICDs) in Spain in Italy, Capallero et al. (2009)
observed variations both across and within countries. In 2006, the rate of percutaneous
coronary interventions (PCIs) was 2 112 per million population in Italy and 1 276 per
million in Spain. The proportion of PCIs performed with at least one stent was slightly
higher in Spain than in Italy (96.1% against 92.5%) just like the number of stents
implanted per procedure (1.59 against 1.45). The proportion of drug-eluting stents was
similar (55% in Italy and 59% in Spain), but showed high variations across regions (from
23% to 78% in Italy and from 40% to 78% in Spain). ICD implantation rates differed both
between and within countries. In 2006, Italy reported 189 implants per million population
and Spain 60, with regional variations ranging from 39 to 285 in Italy and from 24 to 116
in Spain.
Most of those studies on MPV have tried to identify explanatory factors. In the United
States, local variations can be partly explained by differences in coverage, organisation of
care or payment methods. Researchers of the Dartmouth Institute conclude that a share of
observed practice variations is “supply sensitive” – i.e. explained by differences in supply.
For instance, regions served by organised systems of care (group practice or integrated
hospital systems) typically provide less intensive care. In countries with uniform coverage
policy, institutional features and providers’ payment schemes, other factors have been
identified, such as the influence of peers or industry, personal characteristics of physicians
(such as age, gender, initial medical education, training and aversion to uncertainty) or of
their patients (see de Jong et al., 2010; Mousques et al., 2010 for reviews).
In conclusion, if part of MPVs can be explained by socio-economic characteristics and
the health needs of different populations, another part remains unexplained and
potentially indicates inefficient use of resources.

3. RATIONAL DECISION MAKING IN RESOURCE ALLOCATION
VALUE FOR MONEY IN HEALTH SPENDING © OECD 201086
Clinical practice often deviates from effective care as defined by evidence-based medicine research
The American Institute of Medicine estimates that half of all health care is currently
provided in the United States without any evidence of its effectiveness (Institute of
Medicine, 2009). In addition, where evidence exists, health care services are not always
provided in accordance with best practice recommendations.
A study conducted by the Rand Corporation in 1998-2000 in the United States showed
that patients received only 54.9% of recommended care for a set of 439 quality indicators
defined for 30 acute and chronic conditions. Quality care indicators were based on
recommendations pertaining to screening, diagnosis, treatment and follow-up for each
condition. While more than 75% of recommended care was provided for senile cataract or
breast cancer, this percentage did not exceed 50% for ten conditions. Only 22.8% of
recommended care was provided for hip fracture and 10.5 for alcohol dependency. In many
but not all cases, non-adherence with recommended care corresponded to an underuse of
health care services (McGlynn et al., 2003).
Other studies have produced more anecdotal evidence of non-adherence to
recommended care in medical practice. For instance, in France, the High Authority in Health
(HAS) issued a recommendation about pharmaceutical treatments for hypercholestero-
lemia: initial drug treatments should only be prescribed above a certain level of LDL-
Figure 3.2. Local variations in medical practiceHostpital utilisation, prevalence of severe chronic illness,
and Medicare spending among 306 Dartmouth Atlas Regions
Note: Each dot represents one of the 306 Hospital Referral Regions in the United States. The vertical axis in each chartshows spending. The horizontal axis in the chart at left shows the intensity of in-patient care in managingchronic illness; about 65% of the variation in Medicare per capita spending is explained by the variation in use ofinpatient care (R2 = 0 .65). At right, the horizontal axis shows prevalence of severe chronic illness, which is onlyslightly correlated with Medicare per capita spending (R2 = 0.04). Prevalence of severe chronic illness accounts forabout a USD 1 500 per capita difference in spending between regions where patients are the sickest compared toregions where patients are healthiest.
Source: Dartmouth Institute (2008).
15 000
13 000
11 000
9 000
7 000
5 000
3 000
Average Part A and B Medicare reimbursementsper enrollee (2005), USD
Hospital care intensity index (deaths 2001-05)
0.25 0.75 1.25 1.75 2.25
R2 = 0.65
15 000
13 000
11 000
9 000
7 000
5 000
3 000
Average Part A and B Medicare reimbursementsper enrollee (2000-01), USD
Percent of Medicare enrollees who had chronic illnessand were within two years of death (2000-01)
0 3 6 9 12 15 18
R2 = 0.04

3. RATIONAL DECISION MAKING IN RESOURCE ALLOCATION
VALUE FOR MONEY IN HEALTH SPENDING © OECD 2010 87
cholesterol and after the failure of a diet. In 2002, more than half of patients who received a
first prescription of anticholesterol drugs had not undertaken any diet. For one-third of
patients with new treatments, the level of LDL-cholesterol had not been tested, and for
another third, drugs were prescribed in spite of a LDL-cholesterol level lower than the
recommended threshold. Similarly, antibiotics were too often prescribed for viral and
non-bacterial conditions in the 2000s. For some anxiolytics, prescribed dosages exceeded the
maximum recommended dose in one-third to one-fourth of cases, and treatment dura-
tion exceeded the recommendation in 30 to 50% of cases. As many as 500 000 patients
received a single prescription of long-term asthma treatment, which is inappropriate and
does not conform to recommendations (see Polton et al., 2007 for a summary).
Patients’ preferences are not always taken into account
The participation of well-informed patients in clinical decision making is another
promising way to improve efficiency. Sometimes, when evidence is produced about the
relative benefits and harms of alternative treatments for a given condition, no solution is
found to be superior to its alternative(s) in all respects. In such cases, clinicians and
patients have to trade-off different types of benefits and harms, with a variable level of
uncertainty for each of them. Ideally, the selection of the treatment should reflect patient
preferences, which is not always the case.
The treatment of prostatic hyperplasia is an example. A study showed that when
patients are informed through “decision aids” about the benefits and harms of surgical
treatment, the rate of surgery falls by 40% from baseline levels. The experience showed
that patients more bothered by their symptoms were more likely to choose surgery than
those who were more worried about the prospect of sexual dysfunction (Mulley, 2009). The
preference for less invasive treatment options has also been identified for some conditions,
such as back pain and osteoarthritis of the knee or the hip (Dartmouth Institute, 2008). This
suggests that the consideration of well-informed patients’ preferences may not only
increase patients’ well-being and satisfaction but has also the potential to save money in
some circumstances.
3. EBM and HTA offer opportunities to rationalise health care provision
Evidence-based medicine (EBM) and health technology assessment (HTA) have very
different origins and do not serve identical purposes, though they can both influence
health care provision.
Evidence-based medicine
EBM has been a gradual revolution in medical thinking. This movement began after
the Second World War with the application of experimental design – randomised
controlled trials (RCTs) – into medical practice. The first RCT, performed for tuberculosis by
Bradford Hill and Archie Cochrane, created a new paradigm of experimental clinical
epidemiology. This technique became widely used for the introduction of new drugs as part
of the drug regulatory process from the 1960s. However, its diffusion into the rest of
medical practice has been slower.
In the 1990s, evidence-based medicine developed into a more formal movement based
on new techniques for synthesizing RCTs into meta-analysis including comprehensive
bibliographic searches of all available literature. These techniques were first brought to
bear on obstetrics, by Sir Ian Chalmers and a team that systematically reviewed all

3. RATIONAL DECISION MAKING IN RESOURCE ALLOCATION
VALUE FOR MONEY IN HEALTH SPENDING © OECD 201088
available literature on childbirth including positions, bed rest, use of steroids, etc. What
they found was striking: many techniques long in use had no firm basis in evidence. Some
things were unequivocally wrong and others had relatively firm evidence that they worked.
This meant that some practices should be encouraged, some discouraged, and some
studied further. This realisation spawned a whole international movement known as the
Cochrane collaboration, institutions that systematically review medical literatures. There
are now several groups studying most domains of health care.
To practically implement evidence-based medicine required a new generation of
clinical protocols or guidelines. There have always been protocols in medicine. This is what
constitutes a medical textbook: a summary of knowledge in the field. In any clinical
domain, there are textbooks that lay out clinical treatments for different diseases like
myocardial infarction or stroke. Societies of specialists often put out guidelines for their
members on how to treat different diseases. The main change was that new guidelines
were developed using comprehensive reviews of medical literature, meta-analysis, and
other methods of critical appraisal.
Comparative effectiveness research (CER), recently promoted in the United States by
the 2009 American Recovery and Reinvestment Act, aims to generate and synthesise
evidence on comparative benefits and harms of alternative treatments. This is not a new
activity, since many payers and institutes, including in the United States, have been doing
such research for years. However, the additional USD 1.1 billion invested by the
government to scale up CER increases the initial government budget by 73% (Docteur and
Berenson, 2010). Just as EBM, CER’s primary goal is to inform decision making at the patient
level. Both have the potential to foster patient involvement in treatment choice, provided
that results are made available to patients. It may also be used by third-party payers to
inform decisions about coverage.
4. Health technology assessment
Health technology assessment goes one step further than EBM or CER. It does not only
try to answer the question: “does it work?” or “what works best?” but also the question: “is
it worth it?”
Health technology assessment has a different lineage through economics. It began
with cost-benefit analysis which was introduced as part of the managerial revolution in
government. It was widely used in many government departments such as the treasury
and defence and diffused into health care in the late 1970s, as a response to the pressure
of technological progress and the spread of high cost equipments. Cost-benefit analysis
was closely linked to the introduction of new technologies. The first assessments, in the
health field, were produced for CT scanners.
In 1993, Australia was the first country to use cost-effectiveness analysis for decision
making on drug coverage. It was followed by several OECD countries. The largest and most
visible example was the UK National Institute of Health and Clinical Excellence (NICE).
Any HTA process includes a systematic review of the available clinical evidence about
the benefits and harms of the technology considered (i.e. EBM, and CER when available).
But HTA usually considers a broader set of benefits – not limited to patients’ outcomes –
and often includes an economic assessment. Institutions in charge of HTA have some
latitude to define HTA method and process to reflect the preferences of their targeted
audience (an insurer, the government, the general public, etc.), though guidelines exist in
3. RATIONAL DECISION MAKING IN RESOURCE ALLOCATION
VALUE FOR MONEY IN HEALTH SPENDING © OECD 2010 89
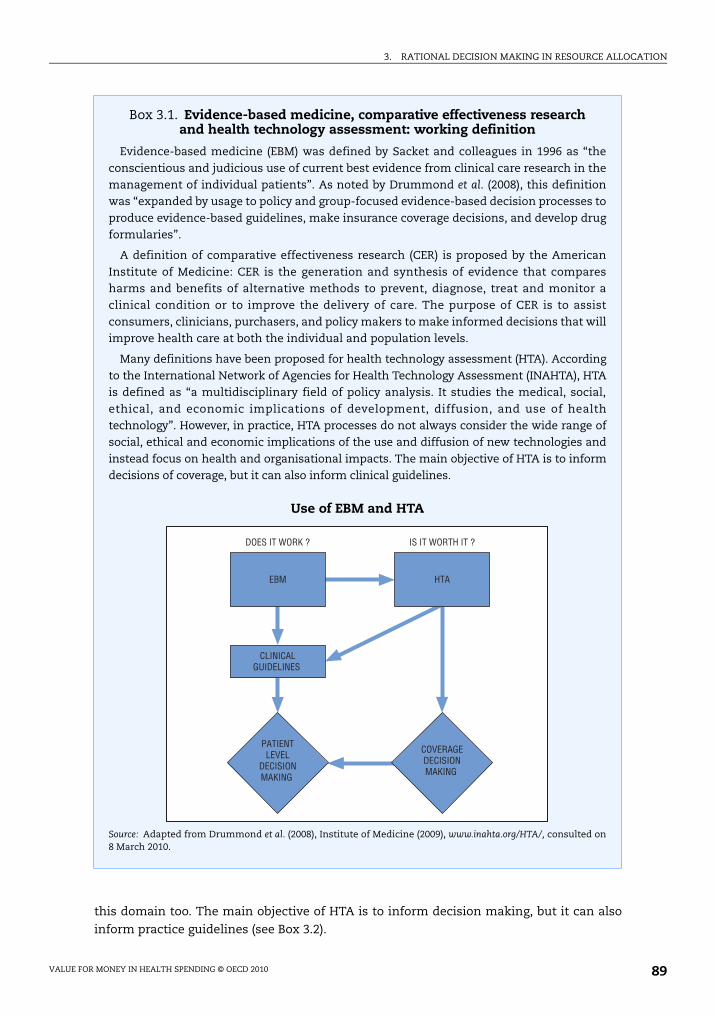
this domain too. The main objective of HTA is to inform decision making, but it can also
inform practice guidelines (see Box 3.2).
Box 3.1. Evidence-based medicine, comparative effectiveness research and health technology assessment: working definition
Evidence-based medicine (EBM) was defined by Sacket and colleagues in 1996 as “theconscientious and judicious use of current best evidence from clinical care research in themanagement of individual patients”. As noted by Drummond et al. (2008), this definitionwas “expanded by usage to policy and group-focused evidence-based decision processes toproduce evidence-based guidelines, make insurance coverage decisions, and develop drugformularies”.
A definition of comparative effectiveness research (CER) is proposed by the AmericanInstitute of Medicine: CER is the generation and synthesis of evidence that comparesharms and benefits of alternative methods to prevent, diagnose, treat and monitor aclinical condition or to improve the delivery of care. The purpose of CER is to assistconsumers, clinicians, purchasers, and policy makers to make informed decisions that willimprove health care at both the individual and population levels.
Many definitions have been proposed for health technology assessment (HTA). Accordingto the International Network of Agencies for Health Technology Assessment (INAHTA), HTAis defined as “a multidisciplinary field of policy analysis. It studies the medical, social,ethical, and economic implications of development, diffusion, and use of healthtechnology”. However, in practice, HTA processes do not always consider the wide range ofsocial, ethical and economic implications of the use and diffusion of new technologies andinstead focus on health and organisational impacts. The main objective of HTA is to informdecisions of coverage, but it can also inform clinical guidelines.
Use of EBM and HTA
Source: Adapted from Drummond et al. (2008), Institute of Medicine (2009), www.inahta.org/HTA/, consulted on8 March 2010.
EBM HTA
CLINICALGUIDELINES
PATIENTLEVEL
DECISIONMAKING
COVERAGEDECISIONMAKING
DOES IT WORK ? IS IT WORTH IT ?

3. RATIONAL DECISION MAKING IN RESOURCE ALLOCATION
VALUE FOR MONEY IN HEALTH SPENDING © OECD 201090
In OECD countries, there is a trend towards the institutionalisation of EBM2 and HTA,
as well as a trend towards an increased used of both for the production of clinical
guidelines and coverage decisions. However, countries show a high diversity in
development stages. The sections below describe briefly the current use of EBM and HTA in
OECD countries, as well as perspectives for the future.
5. The current use of technology assessment in OECD countries
Attempts have been made to draw a comprehensive picture of HTA settings and use at
the European level (Sorenson et al., 2007; Velasco-Garrido et al., 2008), as well as in other
countries (special issue of the International Journal of Technology Assessment in Health Care,
2009). A survey undertaken by the OECD in 2008-09 collected a minimum set of information
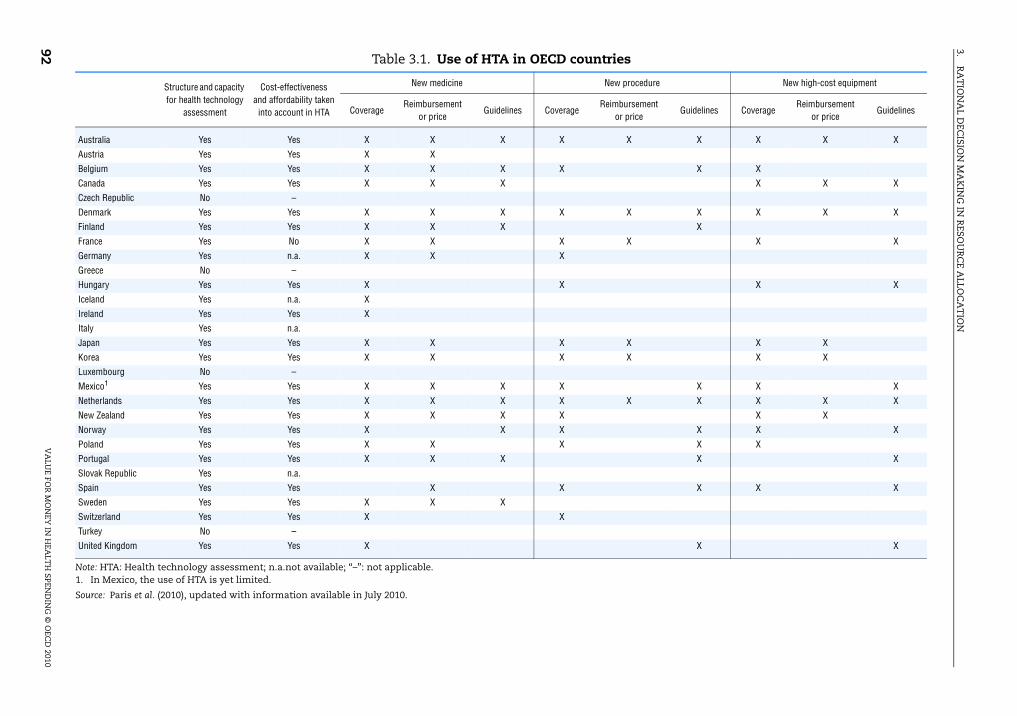
on the effective use of health technology assessment in decision making (see Table 3.1).
According to this survey, all but four countries (the Czech Republic, Greece, Luxembourg
and Turkey), reported the existence of structures or capacities for health technology
assessment. However, HTA capacities vary widely across countries.
Most countries reported that HTA is used to determine the coverage of medical
procedures, medicines and high cost equipments. In some countries, such as Portugal, HTA
is only used to determine coverage of pharmaceuticals. Many countries indicated that HTA
results are also taken into account to establish reimbursement prices, especially for drugs.
Finally, in a majority of countries, HTA is also used to produce clinical guidelines. All
countries using HTA but France reported that cost effectiveness and affordability are
considered in health technology assessment.
Institutions: status, mandate and range of activities
The first national HTA agency was created in Sweden in 19873 (see Box 3.2), followed
by many countries. Today, most OECD countries have national agencies responsible for
health technology assessment, with different institutional settings (independent or
attached to the ministry of health or national insurance), scope (in terms of technologies to
be assessed) and mandates (inform decision making, issue practice guidelines, horizon
scanning, accreditation of health care institutions). However, HTA activities are not limited
to national agencies. HTA efforts have preceded the creation of such agencies and, in
several countries, ministries in charge of health have been funding activities for decades
(e.g. Mexico). In several European countries, and in Canada, regional or hospital HTA
agencies co-exist with national agencies (Velasco-Guarrido et al., 2008). In the United
States, public payers (Medicare, the Veterans Health Administration) and private insurers
undertake HTA activities to inform formulary decisions. Korea and the Slovak Republic
have recently created HTA agencies (Kim, 2009).
Only a few OECD countries have not established national HTA agencies, among which
are the United States and Japan. In Japan, the Ministry of Health and Welfare funds HTA
activities, and the production of EBM practice guidelines are commissioned to academic
centres. Yet there is no formal link with decision making on reimbursement and pricing
(Hisashige, 2009).
Use of HTA to inform coverage decisions
In a few cases, agencies responsible for HTA are also responsible for the “appraisal” of
technology, as is the case for NICE in England and Wales or for the Swedish LFN (in charge
of assessing new drugs for coverage decisions). Most often however, their role is confined

3. RATIONAL DECISION MAKING IN RESOURCE ALLOCATION
VALUE FOR MONEY IN HEALTH SPENDING © OECD 2010 91
to scientific assessment while third-party payers, government or joint associations of
bodies make decisions.
In the pharmaceutical sector, where the use of HTA is the most developed, HTA agencies
or independent scientific institutes normally conduct the assessment while coverage
decisions remain in the hand of governments or third-party payers. In France, the High
Authority in Health (HAS) provides recommendations about the coverage of pharmaceuticals
Box 3.2. Health technology assessment in Sweden
The Swedish National Agency for Health Technology Assessment (SBU) was created in 1987, asan independent organisation. Its mandate is defined by the government: “SBU is mandatedto make scientific assessments of new and established technologies from a medical,economic, societal, and ethical perspective. The agency shall present and disseminate theseassessments so that providers of health care and others may be able to use the findings ofthe assessments. The agency shall assess how the findings have been used and whatresults have been achieved” (Jonsson, 2009).
The SBU actively disseminates the results of its assessments. Full reports, as well assyntheses for different audiences, including the general public and the internationalcommunity (English versions). The latest results are available on its website and inpharmacies. SBU organises press releases and press seminars, as well as local and nationalconferences and education programmes. Experts who participated in the assessmentprocess used to be, on a voluntary basis, appointed as “ambassadors” and travelled in thecountry to inform colleagues and other stakeholders. This process recently changed andnow, “receivers” are appointed in each county to promote the dissemination of results.Finally, assessment results are published in the Journal of the Swedish Medical Associationand in other national and international journals.
The SBU regularly evaluates the use of assessment reports in medical practice andpublishes the results of evaluations in its annual activity report. Studies have shown apositive impact of SBU reports. For instance, in accordance with SBU recommendations,the use of pre-operative routine tests has been reduced for young and healthy patients, aswell as the prescription of sick-leave for back pain, and investments in equipment for bonedensity measurement. The prescription of diuretics and beta-blockers, shown to be aseffective as newer and costlier drugs in the treatment of mild hypertension, increased afterthe publication of the SBU report. In the treatment of depression and alcohol and drugabuse, the prescription of more effective drugs increased, in accordance with SBUrecommendations.
The Pharmaceutical Benefits Board (LFN) was created in 2002, as an independent agency incharge to determine whether a drugs will be reimbursed under the nationalpharmaceutical benefit scheme. For each new drug applying for reimbursement, the LFNassesses the extent to which it satisfies three criteria: cost effectiveness (from a societalperspective); human value (i.e. absence of discrimination); and the “need and solidarityprinciple” (which can justify to prioritise treatments targeting people with the greatestneeds). The LFN has also undertaken the systematic review of several classes of drugssince 2003, which led to delisting in some occasions.
For example, the evidence assessed by the Swedish CBU on drug use among the elderlypeople is synthesised in a 28 pages document (including an English version) www.sbu.se/
upload/Publikationer/Content1/1/Drug_Consumption_among_Elderly_summary.pdf.
Source: Jonsson (2009); Moïse and Docteur (2007).
3.R
AT
ION
AL D
ECISIO
N M
AK
ING
IN R
ESOU
RC
E ALLO
CA
TIO
N
VA
LUE FO
R M
ON
EY IN
HEA
LTH
SPEN
DIN
G ©
OEC
D 2010
92 Table 3.1. Use of HTA in OECD countries
Note: HTA: Health technology assessment; n.a.not available; “–”: not applicable.1. In Mexico, the use of HTA is yet limited.
Source: Paris et al. (2010), updated with information available in July 2010.
Structure and capacity
for health technology
assessment
Cost-effectiveness
and affordability taken
into account in HTA
New medicine New procedure New high-cost equipment
CoverageReimbursement
or priceGuidelines Coverage
Reimbursement
or priceGuidelines Coverage
Reimbursement
or priceGuidelines
Australia Yes Yes X X X X X X X X X
Austria Yes Yes X X
Belgium Yes Yes X X X X X X
Canada Yes Yes X X X X X X
Czech Republic No –
Denmark Yes Yes X X X X X X X X X
Finland Yes Yes X X X X
France Yes No X X X X X X
Germany Yes n.a. X X X
Greece No –
Hungary Yes Yes X X X X
Iceland Yes n.a. X
Ireland Yes Yes X
Italy Yes n.a.
Japan Yes Yes X X X X X X
Korea Yes Yes X X X X X X
Luxembourg No –
Mexico1 Yes Yes X X X X X X X
Netherlands Yes Yes X X X X X X X X X
New Zealand Yes Yes X X X X X X
Norway Yes Yes X X X X X X
Poland Yes Yes X X X X X
Portugal Yes Yes X X X X X
Slovak Republic Yes n.a.
Spain Yes Yes X X X X X
Sweden Yes Yes X X X
Switzerland Yes Yes X X
Turkey No –
United Kingdom Yes Yes X X X

3. RATIONAL DECISION MAKING IN RESOURCE ALLOCATION
VALUE FOR MONEY IN HEALTH SPENDING © OECD 2010 93
but the government and health insurance funds make ultimate decisions. In Germany, the
Institute for Quality and Efficiency in Health Care (IQWiG) makes recommendations to the
Federal Joint Committee of Health Insurance Funds, Hospitals and Physicians (G-BA), which
issues final guidance.4 In Canada, the intergovernmental Common Drug Review, part of the
Canadian Agency for Drugs and Technology in Health, issues recommendations about the
coverage of new drugs but provincial and federal governments remain responsible for their
inclusion in the formularies of their programmes (Paris and Docteur, 2006; OECD, 2008).
Recommendations for coverage decisions do not always result in “yes or no” options.
They may suggest restricted coverage (to some indications or population sub-groups) or
“coverage with evidence development”. This last option, conditioning coverage to the
generation of further research on effectiveness, has been used increasingly, especially
when there is a high level of uncertainty about the effects of the assessed treatment.
HTA has also widely been used in OECD countries to design public health programmes
for the early detection of cancer. It allowed for example to define that systematic breast
cancer screening by mammograms only “worth it” after the age of 50. Under this age, direct
and indirect costs exceed the benefits of such programmes.
Use of HTA to establish practice guidelines
Many HTA agencies only inform coverage decisions and do not provide clinical
guidance for professionals. A few agencies, however, integrate the two functions. The
extent to which clinical guidelines condition reimbursement or are binding for physicians
varies across systems.
NICE guidance, for instance, defines what should be covered by the NHS and in which
circumstances. NICE’s clinical guidance typically restricts coverage to a target population
or to second line treatment, but guidance also defines patients’ rights to access treatments
when appropriate. In principle, clinical guidelines are thus binding for NHS practitioners.
However, there is no national programme to monitor or control professional behaviour,
since the system relies on confidence in professional judgement and economic incentives
received by Primary Care Trusts. Recently, NICE has been involved in the definition of
quality targets used in the Quality and Outcomes Framework (QOF), which provides
incentives to physicians to improve the quality of care through pay-for-performance
payments.
On the contrary, the Swedish SBU and the French HAS produce guidelines that are not
binding for health professionals. Efforts are made to promote professional adherence,
including academic detailing by health insurance funds (in France), but there is no formal
obligation to comply with guidelines. The pay-for-performance scheme recently
introduced in France includes quality targets drawn from HAS guidelines, thus providing
economic incentives to comply with these guidelines for the one-third of physicians who
participate in this programme in 2010.
The role and methods of economic evaluation
Many countries use economic evaluation in HTA, especially for recommendations
pertaining to the coverage of new drugs and technologies. Each country or agency
determines the methods to be used. Most countries compute incremental cost-
effectiveness ratios (ICERs), which indicate additional costs incurred by the new treatment
for an additional unit of benefit or outcome. Outcomes are generally measured in quality-

3. RATIONAL DECISION MAKING IN RESOURCE ALLOCATION
VALUE FOR MONEY IN HEALTH SPENDING © OECD 201094
adjusted life years (QALYs). The German Institute IQWiG, which was asked to develop its
methodology in 2007, decided to use efficiency frontiers to determine the most efficient
therapy among the set of all alternatives for which costs and benefits are known. This
method is original and may be adopted by France but it does not allow the comparison of
costs and benefits across therapeutic areas (IQWiG, 2009).
Health economists have been debating for years about methodological aspects of
economic evaluation in health (costs and outcomes to be considered, modelling and
assessing uncertainty, discount rates to be used for future costs and benefits, etc.), that are
not addressed here. Instead, the focus is on two subjects which are particularly relevant for
policy makers: should there be a single and explicit ICER threshold beyond which
technologies would not be funded? What should be the role of budget impact assessment?
Threshold or not?
In 2008, the Belgian institute KCE issued an extensive set of reflexions on the rationale
and current practice of ICER thresholds (Cleemput et al., 2008). In theory, the ICER threshold
should be the value of the ICER which maximises health gains under a budget constraint:
if payers were able to establish a league table ranking all health systems interventions
according to their (decreasing) ICER and compute budget impact for each intervention, the
ICER threshold would be the ICER of the last intervention to be funded before the
exhaustion of the available budget5. However, with the exception of the experience in the
Oregon Medicaid programme, no payer or government has ever considered the
construction of such a league table for several reasons, including the lack of information on
costs and benefits for all interventions and the fact that all interventions cannot be
considered independent. In addition, policy makers often have goals other than the
maximisation of health gains. For instance, they may favour distributional aspects (e.g.
favour interventions which will offer less “QALYs per unit cost” but for a high number of
people over a more cost-effective intervention useful for a small number of people). A
further argument against such thresholds is that it could provide incentives for
manufacturers to set prices at the highest possible level to meet the threshold criteria. All
these constraints suggest the adoption of a flexible threshold rather than a fixed one. This
is indeed the strategy usually adopted by policy makers (for NICE, the Swedish LFN and the
Canadian Common Drug Review).
Budget impact analysis
Economic evaluation may or may not include budget impact analysis (BIA), i.e. a
measurement of the prospective impact of the adoption of the assessed technology on
health care costs (or public budget). The role of BIA in decision making is often ambiguous
and not clearly defined (Niezen et al., 2009). HTA-based recommendations may incidentally
lead to cost savings, in which case BIA is always welcome. However, most often, BIA
provides estimates of the additional amount of money needed for the implementation of
an HTA recommendation (e.g. adoption of a new technology). Then, decision makers have
to consider whether the implementation of this recommendation is affordable.
BIA is not always performed and published in a transparent manner, but it is hard to
imagine that decision makers do not use it, at least for planning and budgeting purpose.
Does BIA have a role to play in HTA and decision making? Niezen et al. (2009) spell out
rationales for the consideration of BIA in decision making. First, any decision entailing
additional spending has opportunity costs: this amount of money will have to be diverted

3. RATIONAL DECISION MAKING IN RESOURCE ALLOCATION
VALUE FOR MONEY IN HEALTH SPENDING © OECD 2010 95
from other health care interventions, or from other public sector investments. BIA allows
the consideration of those opportunity costs. Second, if trade-offs have to be made within
the health systems, the loss aversion or endowment effect – i.e. the fact that people
typically value more what they do not want to lose (e.g. a reimbursed drugs that could be
delisted to supply a new one) than what they could gain (e.g. the new drugs), make policy
makers adverse to the delisting of current benefits. These preferences increase the
opportunity costs of new decisions, especially those with high budget impact. Third, when
benefits of health care interventions are assessed with a high degree of uncertainty, policy
makers may be more reluctant to engage large amounts of money. Fourth, BIA can serve
policies aiming to preserve “equal opportunity”. The fact that budget impact is small is
often mentioned to justify the reimbursement of orphan drugs which are not cost effective
(by common standards). In conclusion, budget impact cannot be ignored by decision
makers: more explicit consideration of BIA would make decisions more transparent,
though it may not be possible to establish definitive rules for joint consideration of cost
effectiveness and affordability.
Dissemination of HTA results
The publication of an HTA report is important both for transparency and for
implementation (as far as guidelines are concerned). HTA complete reports typically
include hundreds of pages of complex information compiled in a more or less friendly
manner. Consequently, HTA agencies must make efforts to disseminate information to
various stakeholders.
The minimum that HTA agencies should do is to provide a summary of the
assessment and recommendations, that professionals can easily consult and use in their
current practice. Most HTA agencies do so. However, more active strategies of
dissemination, as adopted by the SBU in Sweden (see Box 3.2), are desirable.
Communication with patients and the general public is all the more important in a
context of overwhelming information, whose quality is not always easy to assess for lay
people. Some HTA agencies publish useful information for patients and their relatives. In
the United States, the Agency for Healthcare Research and Quality (AHRQ) publishes guides
for patients in both English and Spanish on its website, as well as audio versions.6 Sixteen
guides are currently available, for instance on treating prostate cancer, antidepressant
medicines, treating high-cholesterol and osteoporosis treatments. They typically include a
description of the disease or symptoms, benefits and risks associated with alternative
treatments and prices for monthly supply of the main medications.
NICE publishes booklets on its website named “Understanding NICE guidance” and
written for NHS users. For instance, the booklet on depression in adults7 describes the usual
symptoms of depression, alternative treatments that can be supplied by the NHS for the
different degree in severity of depression, and proposes sets of questions that patients
should ask to their doctors to better understand their disease and treatment. Costs of
alternative therapies are not mentioned since all treatments are provided free of charge by
the NHS.
Monitoring of implementation
Evidence-based practice guidelines are not always binding for health professionals,
except when they determine funding by a national health system or an insurer. Third-

3. RATIONAL DECISION MAKING IN RESOURCE ALLOCATION
VALUE FOR MONEY IN HEALTH SPENDING © OECD 201096
party payers, however, should be interested to know whether recommendations produced
by HTA agencies are followed.
Third-party payers should first monitor the compliance of medical prescriptions with
conditional reimbursement clauses, where they exist. In a few cases, prior authorisation is
required for the treatment to be reimbursed, but most often, physicians are responsible for
the appropriateness of prescription. In many countries, third-party payers do not have
access to patients’ diagnoses and cannot assess whether the prescribed treatment is
adequate. However, the analysis of reimbursement claims can sometimes shed some light
about compliance with conditional reimbursement clauses. For instance, it can reveal that
the initial target population has been widened to ineligible populations.
Similarly, compliance of health professional practices with HTA-based practice
guidelines should be assessed, if only to measure the effectiveness of HTA. However, very
few countries have institutionalised systematic review of impact of HTA reports, Sweden
being one of them (see Box 3.2). In England, NICE produces and commissions reports on the
uptake of implementation of guidelines.8 More than 30 reports have been published to date
mainly using administrative data on prescription claims.
6. The impact of health technology assessment
Velasco-Garrido et al. (2008) carried out a systematic literature review on the impact of
health technology assessment, using a framework with six types of impact: awareness
(knowledge of HTA reports by stakeholders), acceptance by stakeholders, impact on the
policy process, impact on policy decisions, impact on clinical practice and outcomes
(health gains and economic impact). The following paragraphs will concentrate on three
important aspects: impact on decision making, impact on practice and impact on costs.
Impact of HTA on decision making
When HTA is conducted to inform coverage decisions, recommendations are generally
not binding for the government(s), health insurance funds or other bodies who ultimately
make decisions. For instance, in Canada, formulary decisions of provincial drug plans
generally follow recommendations from the Common Drug Review, with varying delays,
but tend to add restrictions to initial listing recommendations (McMahon et al., 2006). In
France, HAS positive recommendations for drug coverage are generally followed, while
recommendations for delisting are not always implemented or are only implemented with
a considerable delay.
Do HTA-based guidelines contribute to changes in medical practice?
In their literature review, Velasco-Garrido et al. (2008) identified 17 studies on the
impact of HTA on clinical practice, concentrated on two countries: the United Kingdom
(NICE recommendations) and Sweden. Results of these studies are mixed.
Sheldon et al. (2004) analysed the impact of 12 sets of NICE guidance produced
between 1999 and 2001 and found mixed results. In several cases, NICE did not have a
significant impact on current practice trends (e.g. wisdom tooth extraction, hearing aids,
implantable cardioverter defibrillators, prescription of zanamivir in influenza). In other
cases, the recommendation was followed by a significant change in practice (e.g. higher
prescription of Orlistat for obesity, and of taxanes for breast cancer) and/or a reduction of
practice variations (Orlistat and drugs for Alzheimer’s disease). However, in the Orlistat

3. RATIONAL DECISION MAKING IN RESOURCE ALLOCATION
VALUE FOR MONEY IN HEALTH SPENDING © OECD 2010 97
case, a closer audit showed that the drug was prescribed in accordance with the guidance
only in 12% of cases (age, BMI and weight loss). The authors concluded that professional
acceptance to published guidance largely influences their compliance.
In Sweden, impact studies conclude that SBU’s recommendations impacted medical
practice in conformity with recommendations in most cases (see Box 3.2).
HTA does not always reduce costs
The primary objective of HTA activities is to enhance the effectiveness, quality and
efficiency of health care. HTA activities can save costs when coverage of a new technology
is denied or restricted, or when guidelines recommend cheaper treatment alternatives. On
its website, NICE published a list of NICE guidance expected to reduce costs.9
However, the use of HTA does not obviously always lead to savings. In fact, empirical
estimates show that NICE’s recommendations for the adoption of new technologies have
cost the NHS an additional GBP 1.65 billion per year (Chalkidou et al., 2009).
7. The future of health technology assessment
There is no consensus among OECD countries on the use of health technology
assessment, and more specifically, economic evaluation. Several arguments, regularly
developed against its use are discussed below, along with key principles developed by an
international expert group for the improved conduct of HTA for resource allocation
decisions (see Box 3.3; and Drummond et al., 2008).
Discussing three arguments against the use of HTA and economic evaluation
The first argument against the use of HTA and CEA (cost-effectiveness analysis) is that
they do not encourage innovation in health care and may indeed compromise private
investments in R&D. In fact, the extent to which HTA will affect technological innovation,
negatively or positively, depends on methods used, especially for the valuation of
outcomes.
By using HTA and economic assessment in coverage decisions, government and
third-party payers send signals to manufacturers about the type of innovation they value
and their willingness to pay. The selection of outcomes of interest is a first type of signal.
For instance, while some HTA agencies will consider surrogate markers as reasonable
measures of outcomes,10 others will be more reluctant to do so. By making this choice
explicit, policy makers provide useful information to innovators about the type of evidence
they must produce for the adoption of their products. Similarly, when HTA agencies assess
the degree of innovativeness of a new product to inform price decisions, as is the case in
France,11 the industry receives a transparent and explicit assessment of the value
attributed to incremental (or radical) therapeutic improvements of their products. This
may help the industry to direct investments towards the most valued therapeutic areas
and the most valued incremental changes of existing therapies.
The impact of the use of the cost-effectiveness criteria on private R&D investments is
not straightforward. Vernon et al. (2005) show how firms can use cost-effectiveness
thresholds in their R&D investment decision-making process to determine a range of
expected returns on investments, according to different levels of effectiveness, price and
volume. The existence of (implicit or explicit) ICER thresholds may potentially reduce the
firm’s uncertainty about policy makers’ decisions and willingness to pay but, on the other
3. RATIONAL DECISION MAKING IN RESOURCE ALLOCATION
VALUE FOR MONEY IN HEALTH SPENDING © OECD 201098
hand, it may discourage R&D investments with low returns on investments at the given
threshold.12, 13
It is worth noting that HTA and economic assessment do not always result in negative
recommendations and indeed have in the past promoted the use of new technologies and
increased their uptake in systems otherwise under tight budget constraints (for instance in
the United Kingdom).
The second argument is that the length of HTA and CEA processes delay patients’
access to innovation. Typically, the production of an HTA report can take several years (e.g.
two to three years in Sweden for reports on the treatment of a condition which compares
several alternatives). However, in many countries, products and treatments can be
marketed and sometimes reimbursed before being assessed through an HTA process.
Access is thus not delayed in principle. This is the case in the United Kingdom, where a
new drug, for instance, can be supplied to NHS patients until NICE decides it should not
be.14 In addition, countries have the possibility to create accelerated procedures for
promising technologies. For instance, in Sweden, the SBU developed a specific programme
(Alert) to quickly review new and innovative treatments (Jonsson, 2009). Finally, third-party
payers may design special access programmes to provide immediate access to promising
treatments for patients with life-threatening diseases, pending the results of the
assessment and appraisal process. Several Canadian federal and provincial drug coverage
plans have introduced such programmes (Paris and Docteur, 2006).
The third argument is that HTA raises ethical concerns and is not accepted by the
population, especially when HTA recommendations are negative. Such decisions are often
perceived as rationing by the general public or patients and receive high attention from the
media (especially in the United Kingdom). However, budget constraints, strict or soft, entail
trade-offs. HTA just provides an opportunity to make trade-offs more explicit, rational,
consistent and equitable. This argument certainly needs to be popularised among
professionals, patients and the general public. The involvement of stakeholders in the HTA
process, its transparency, the publication of criteria considered to make final decisions
should contribute to a wider acceptability of the process and the final decisions (Gruskin
and Daniels, 2008).
Principles for good conduct and good use of HTA
Among the principles proposed for HTA good practices (Box 3.3), many have already
been adopted by several OECD countries and are consensual while others have been
subject to national adaptations. Some of these recommendations seem particularly
relevant given the current status of HTA practices in OECD countries.
The idea that HTA should include all technologies is probably one of the most
important one, with several implications. In many countries, HTA activities focus on new
drugs and costly medical devices, which are assessed against existing ones. Resource
limitations partly explain such a focus. However, HTA should ideally be extended to all
technologies (all products, diagnostics and procedures, disease management) and to the
review of existing treatments for a more rational decision-making process. Even if
countries do not need to generate HTA reports for the thousands of medical procedures
and products that are currently used, there is scope for improvement in this matter in a
number of countries. The experience from most countries is that major savings can be
achieved in existing clinical practice, not new technologies. The real savings or efficiency

3. RATIONAL DECISION MAKING IN RESOURCE ALLOCATION
VALUE FOR MONEY IN HEALTH SPENDING © OECD 2010 99
Box 3.3. Key principles for the improved conduct of HTA for resource allocation decisions
● The goal and scope of the HTA should be explicit and relevant to its use: they should be agreed by a widerange of stakeholders; the link between HTA and decision making should be explicit.
● HTA should be an unbiased and transparent exercise: HTA should be conducted by bodies independentfrom decision-making bodies, third-party payers or professional associations; HTA process andcriteria for decision making should be transparent. HTAs should be freely and publicly accessible tostakeholders.
● HTA should include all relevant technologies, i.e. drugs, devices, diagnostic procedures and treatmentstrategies, to prevent distortions in resource allocation. The current focus on drugs and newtechnologies is not ideal.
● A clear system for setting priorities for HTA should exist, to ensure cost-effective HTA activities. Forinstance, NICE selects technologies to be assessed on six criteria: burden of disease, resourceimpact, clinical and policy importance, presence of inappropriate variations in practice, potentialfactors influencing the timeliness of guidance, and likelihood of the guidance having an impact.
● HTA should incorporate appropriate methods for assessing costs and benefits: methods should beadapted to purpose and context, be transparent and consistent across assessments, and beperiodically reviewed. HTAs should be conducted by trained experts.
● HTAs should consider a wide range of evidence and outcomes: randomised clinical trials data mayneed to be completed by observational studies, surrogate endpoints must be considered andextrapolated to outcomes of interest; benefits, risks and costs must be defined broadly.Outcomes should include changes in quality of life for patients, as well as benefits for patients’relative, employers and the society. Variations in costs and benefits across population sub-groups should be assessed.
● A full societal perspective should be considered when undertaking HTA to ensure efficient resourceallocation at the level of the society.
● HTA should explicitly characterise uncertainty surrounding estimates and include sensitivity analysesand confidence intervals for results.
● HTA should consider and address issues of generalisability and transferability across patients,populations and settings of care.
● Those conducting HTAs should actively engage all key stakeholder groups, in the definition ofobjectives of HTA reports, of treatment alternatives and patient populations to be consideredand modeling. They should be given opportunities to comment HTA drafts and appeal decisions.
● Those undertaking HTA should actively seek all available data, including confidential data, thoughthis may contradict the transparency principle.
● The implementation of HTA findings should be monitored.
● HTA should be timely: ideally, HTA should follow marketing authorisation and be subject to reviewperiodically, or when new information is available.
● HTA findings need to be communicated to different decision makers, i.e. decision makers, managers ofhealth care institutions, health professionals, patients and the general public.
● The link between HTA findings and decision-making processes needs to be transparent and clearly defined.
Criteria for decision makers can legitimately differ across payers or jurisdictions, ideally theyshould be transparent.
Source: Based on Drummond et al. (2008).

3. RATIONAL DECISION MAKING IN RESOURCE ALLOCATION
VALUE FOR MONEY IN HEALTH SPENDING © OECD 2010100
gains come from rationalising the current medical practice. This means not only
discountinuing out-dated techniques that are marginally effective, but also making sure
that effective procedures and technologies are properly disseminated and used by all.
The involvement of stakeholders (producers, professionals and patients) in the HTA
process is certainly desirable. However, the involvement of these stakeholders should be
clearly defined (consultation or participation?). It is interesting to note that stakeholders’
involvement does not necessarily mean stakeholders’ “endorsement” of HTA conclusions.
In the case of NICE, manufacturers have appealed against 30% of decisions, half of which
have been upheld, in spite of their involvement in the process (Drummond et al., 2008).
Two recommendations, however, do not make consensus. First, while Drummond et al.
(2008) recommend adopting a full societal perspective in health technology assessment,
many countries only consider costs for “health care” payers. In theory, the societal
perspective should be used in order to maximise social welfare. In practice, however, the
policy mandate of people in charge of health policy is to maximise gains obtained from
health budgets or health spending. Therefore, economic evaluation often considers costs
for the public payer or for all health care payers (Johannesson et al., 2009).
Second, some countries consider that confidential data cannot be taken into account
in health technology assessment, because it would break the rule of transparency.
8. Conclusions
Rationalising health care provision is a promising way to achieve efficiency gains. The
production and dissemination of clinical guidelines, based on evidence-based medicine
(EBM), can contribute to such a rationalisation process. Health technology assessment
(HTA) can complement the use of evidence-based clinical guidelines by informing coverage
decisions to make sure that new technologies are worth it.
Conducting HTA requires information. The development of information systems,
providing data on volumes and costs of procedures performed and treatments prescribed
is a prerequisite to the development of HTA. Some countries also need to develop a skilled
workforce necessary to perform assessments.
Countries should seek more actively to monitor the implementation of HTA
recommendations, especially for guidelines. Currently, only a few HTA agencies or institutions
undertake or commission studies to monitor the impact of recommendations.
Countries that are interested can build on an already rich international collaboration
in the field of HTA. European and international networks exist and allow participants to
share experiences and skills, to produce guidelines for HTA good practice, and to co-
ordinate early detection of technologies needing assessment.15 Consumers and payers
would probably benefit from more standardised HTA methods. Though results of economic
evaluation will inevitably differ across countries – due to differences in the organisation of
care, in relative prices of various inputs, and in professional practices and epidemiological
contexts – uniform standards in data requirements would be desirable.
Institutions matter. It appears promising to combine the functions of looking at new drugs
and technologies with the development of evidence-based guidance. It is important to bring
together medical thinking about clinical effectiveness with economic thinking about cost
effectiveness and the use of economic evaluation techniques. This is leading to clinical-
economic appraisal that lies at the heart of rational decision making for health care.

3. RATIONAL DECISION MAKING IN RESOURCE ALLOCATION
VALUE FOR MONEY IN HEALTH SPENDING © OECD 2010 101
Notes
1. From a synthesis of several studies conducted in the United States, researchers concluded thatone-third or more of all procedures performed in the United States in the 1990s were ofquestionable benefit (RAND, 1998).
2. However, due to a long tradition of self-regulation of the medical profession, these activities stillrely on medical associations and colleges in several countries. For instance, in Switzerland, thepromotion of good practices for pharmaceutical prescriptions mainly rely on quality circlesgathering physicians and pharmacists (Paris and Docteur, 2007), with no intervention from thegovernment and only logistic support (for data collection) from insurers.
3. The OTA, created in 1972, was dissolved by the US Congress a few years later.
4. The German Institute for Medical Information and Documentation (DIMDI) manages HTAprogrammes, commissions HTA reports to qualified experts and maintains a database with all HTAreports, including IQWiG’s reports (see www.dimdi.de/static/en/index.html).
5. According to this definition, ICER thresholds should not exist in social security systems with nostrict budget constraints or when the societal perspective is adopted.
6. www.effectivehealthcare.ahrq.gov/index.cfm/guides-for-patients-and-consumers/, consulted on March 8,2010.
7. http://guidance.nice.org.uk/CG90/PublicInfo/pdf/English, consulted on 8 March 2010.
8. www.nice.org.uk/usingguidance/evaluationandreviewofniceimplementationevidenceernie/niceimplementationuptakecommissionedreports/nice_implementation_uptake__commissioned_reports.jsp,consulted on 8 March 2010.
9. See www.nice.org.uk/usingguidance/benefitsofimplementation/costsavingguidance.jsp.
10. Surrogate markers are sort of “intermediary measures of outcomes”. For instance, the availableevidence can show that a drug effectively lowers the cholesterol level (which is known to lowermortality risks) without demonstrating yet that it effectively reduces mortality.
11. The French HAS rates on a five-level scale a “degree of innovativeness” for each new drug, bycomparison with existing competitors. Though no formal economic assessment is conducted, thisassessment, together with the prices of existing competitors, will inform price decisions. The mostinnovative products will be granted higher “price premium”.
12. Hollis (2005) suggests that policy makers should publish ICER thresholds for orphan drugs (whichwill be typically higher than usual thresholds) to encourage firms to invest in this type of products.
13. In addition, some authors argue that ICER thresholds could encourage firms to set higher pricesthan they would have done without regulation, but without exceeding the threshold.
14. However, in such cases, providers may prefer to wait for NICE’s decision (and NHS additionalfunding) to uptake the innovation.
15. See for example: EUnetHTA (European Network for Health Technology Assessment:www.eunethta.net/); INAHTA (International Network of Public Agencies for HTA: www.inahta.org/Publications/) – INAHTA was established in 1993 and has now grown to 46 member agencies from24 countries; Euroscan Network (www.euroscan.org.uk); and Inno HTA (HTA methodology forinnovative healthcare technologies: www.inno-hta.eu/).
Bibliography
Baker L. et al. (2008), “Expanded Use of Imaging Technology and the Challenge of Measuring Value”,Health Affairs, Vol. 27, No. 6, pp. 1467-1478.
Battista, R.N. and M.J. Hodge (2009), “The ‘Natural History’ of Health Technology Assessment”,International Journal of Technology Assessment in Health Care, Vol. 25: Suppl. 1, pp. 281-284
Capallero, G., G. Fattore and A. Torbica (2009), “Funding Health Technologies in Decentralised Systems:A Comparison Between Italy and Spain”, Health Policy, Vol. 92, pp. 313-321.
Chalkidou, K. et al. (2009), “Comparative Effectiveness Research and Evidence-based Policy: Experiencefrom Four Countries”, The Milbank Quarterly, Vol. 87, No. 2, pp. 339-367.
Cleemput I. et al. (2008), “Threshold Values for Cost-effectiveness in Health Care Health TechnologyAssessment”, KCE Reports No. 100C, Belgian Health Care Knowledge Centre (KCE), Brussels.

3. RATIONAL DECISION MAKING IN RESOURCE ALLOCATION
VALUE FOR MONEY IN HEALTH SPENDING © OECD 2010102
Dartmouth Institute (2008), “An Agenda for Change: Improving Quality and Curbing Health CareSpending: Opportunities for the Congress and the Obama Administration”, A Dartmouth AtlasWhite Paper, The Dartmouth Institute for health policy and clinical practice.
de Jong, J. et al. (2010), “Do Guidelines Create Uniformity in Medical Practice?”, Social Science andMedicine, Vol. 70, pp. 209-216.
Docteur, E. and R. Berenson (2010), “How Will Comparative Effectiveness Research Affect the Quality ofHealth Care?”, Timely Analysis of Immediate Policy Issues, Urban Institute and Robert WoodJohnson Foundation.
Drummond, M. et al. (2008), “Key Principles for the Improved Conduct of Health TechnologyAssessments for Resource Allocation Decisions”, International Journal of Technology Assessment inHealth Care, Vol. 24, No. 3, pp. 244-258.
Gómez-Dantés, O. and J. Frenk (2009), “Health Technology Assessment in Mexico”, International Journalof Technology Assessment in Health Care, Vol. 25: Suppl. 1, pp. 270-275.
Gruskin S. and N. Daniels (2008), “Justice and Human Rights: Priority Setting and Fair DeliberativeProcess”, American Journal of Public Health, Vol. 98, No. 9, pp. 1573-1577.
Hisashige, A. (2009), “History of Health Care Technology Assessment in Japan”, International Journal ofTechnology Assessment in Health Care, Vol. 25: Suppl. 1, pp. 210-218.
Hollis, A. (2005), “An Efficient Reward System for Pharmaceutical Innovation”, Research Paper,Department of Economics, University of Calgary.
Institute of Medicine (2009), Initial National Priorities for Comparative Effectiveness Research, Institute ofMedicine of the National Academies, Washington.
IQWiG (2009), “General Methods for the Assessment of the Relation of Benefits to Costs”, Version 1.0,IQWiG, Köln.
Johannesson, M. et al. (2009), “Why Should Economic Evaluations of Medical Innovations Have aSocietal Perspective?”, OHE Briefing, No. 51, Office of Health Economics, London.
Jonsson, E. (2009), “History of Health Technology Assessment in Sweden”, International Journal ofTechnology Assessment in Health Care, Vol. 25, Suppl. 1, pp. 42-52.
Joumard, I., C. André and C. Nicq (2008), “Health Status Determinants: Lifestyle, Environment, HealthCare Resources and Efficiency”, OECD Economics Department Working Paper No. 627, OECDPublishing, Paris.
Joumard, I., C. André and C. Nicq (2010), “Health Care Systems: Efficiency and Institutions”, OECDEconomics Department Working Paper No. 769, OECD Publishing, Paris.
Kim, C.-Y. (2009), “Health Technology Assessment in South Korea”, International Journal of TechnologyAssessment in Health Care, Vol. 25, Suppl. 1, pp. 219-223.
McGlynn, E.A. et al. (2003), “The Quality of Care Delivered to Adults in the United States”, New EnglandJournal of Medicine, Vol. 348, No. 26, pp. 2635-2645.
McMahon, M., S. Morgan and C. Mitton (2006), “Common Drug Review: A NICE Start for Canada?”,Health Policy, Vol. 77, No. 3, pp. 339-351.
Moïse, P. and E. Docteur (2007), “Pharmaceutical Pricing and Reimbursement Policies in Sweden”,OECD Health Working Paper, No. 28, OECD Publishing, Paris.
Mousques, J., T. Renaud and O. Scemama (2010), “Is the ‘Practice Style’ Hypothesis Relevant for GeneralPractitioners? An Analysis of Antibiotics Prescription for Acute Rhinopharyngitis”, Social Scienceand Medicine, forthcoming.
Mullan, F. and J. Wennberg (2004), “Wrestling With Variation: An Interview With Jack Wennberg”, HealthAffairs, Web Exclusive, pp. VAR73-VAR80.
Mulley, A.G. (2009), “The Need to Confront Variation in Practice”, British Medical Journal, Vol. 339,pp. 1007-1009.
Niezen, M.G. et al. (2009), “Finding Legitimacy for the Role of Budget Impact in Drug ReimbursementDecisions”, International Journal of Technology Assessment in Health Care, Vol. 25, No. 1, pp. 49-55.
OECD (2005), Health Technologies and Decision Making, OECD Publishing, Paris.
OECD (2008), Pharmaceutical Pricing Policies in a Global Market, OECD Publishing, Paris.
OECD (2009), Health at a Glance – OECD Indicators, OECD Publishing, Paris.
3. RATIONAL DECISION MAKING IN RESOURCE ALLOCATION
VALUE FOR MONEY IN HEALTH SPENDING © OECD 2010 103
OECD (2010), OECD Health Data, OECD Publishing, Paris.
Paris, V. and E. Docteur (2006), “Pharmaceutical Pricing and Reimbursement Policies in Canada”, OECDHealth Working Paper, No. 24, OECD Publishing, Paris.
Paris, V. and E. Docteur (2007), “Pharmaceutical Pricing and Reimbursement Policies in Switzerland”,OECD Health Working Paper, No. 27, OECD Publishing, Paris.
Paris, V., M. Devaux and L. Wei (2010), “Health Systems Institutional Characteristics: A Survey of29 Countries”, OECD Health Working Paper, No. 50, OECD Publishing, Paris.
Polton, D., P. Ricordeau and H. Allemand (2007), “Peut-on améliorer à la fois la qualité et l’efficience dela prescription médicamenteuse? ”, Revue française des affaires sociales, Vol. 61, No. 3-4, pp. 73-86.
RAND (1998), “Assessing the Appropriateness of Care”, Rand Health Research Highlights, RandCorporation.
Sheldon, T.A. et al. (2004), “What’s the Evidence that NICE Guidance Has Been Implemented? Resultsfrom a National Evaluation Using Time Series Analysis, Audit of Patients’ Notes and Interviews”,British Medical Journal, Vol. 329, p. 999.
Sorenson, C., P. Kanavos and M. Drummond (2007), Ensuring Value for Money in Health Care: The Role ofHTA in the European Union, London School of Economics and University of York, London.
Velasco Garrido, M. et al. (2008), “Health Technology Assessment and Health Policy Making in Europe –Current Status, Challenges and Potential”, Observatory Studies Series, No. 14, WHO Regional Officefor Europe on behalf of the European Observatory of Health Systems and Policies, Copenhagen.
Vernon, J., W.K. Hughen and S.J. Johnson (2005), “Mathematical Modelling and Pharmaceutical Pricing:Analyses Used to Inform In-Licensing and Developmental Go/No-Go Decisions”, Health CareManagement Science, Vol. 8, pp. 167-179.