Contractual Allocation of Decision Rights and Incentives: The Case of Automobile Distribution
44
1 Contractual Allocation of Decision Rights and Incentives: The Case of Automobile Distribution * Benito Arruñada Universitat Pompeu Fabra Luis Garicano University of Chicago Luis Vázquez Universidad de Salamanca October 2, 1999 ABSTRACT We analyze empirically the allocation of rights and monetary incentives in automobile franchise contracts. These contracts substantially restrict the decision rights of dealers and grant manufacturers extensive contractual completion and enforcement powers, converting the manufacturers, de facto, in a sort of quasi-judiciary instance. Variation in the allocation of decision rights and incentive intensity is explained by the incidence of moral hazard in the relation. In particular, when the cost of dealer moral hazard is higher and the risk of manufacturer opportunism is lower, manufacturers enjoy more discretion in determining the performance required from their dealers and in using mechanisms such as monitoring, termination and monetary incentives to ensure such performance is provided. We also explore the existence of interdependencies between the different elements of the system. and find some complementarities between completion and termination rights, and between monitoring rights and the intensity of incentives. JEL codes: L14, L22, L81, K12 * We thank Oliver Williamson for his advice and support and Jürgen Backhaus, Judith Chevalier, Harold Demsetz, Antony Dnes, Alberto Fernández, Manuel González, Tom Hubbard, Emilio Huerta, Peter Klein, Claude Ménard, Inés Macho, Cándido Paz-Ares, two anonymous referees and numerous workshop participants for their comments and suggestions. This work has benefited from financial support by DGESIC through grant PB95-0989.
-
Upload
independent -
Category
Documents
-
view
1 -
download
0
Transcript of Contractual Allocation of Decision Rights and Incentives: The Case of Automobile Distribution
1
Contractual Allocation of Decision Rights and Incentives:The Case of Automobile Distribution*
Benito ArruñadaUniversitat Pompeu Fabra
Luis GaricanoUniversity of Chicago
Luis VázquezUniversidad de Salamanca
October 2, 1999
ABSTRACT
We analyze empirically the allocation of rights and monetary incentives in automobile
franchise contracts. These contracts substantially restrict the decision rights of dealers
and grant manufacturers extensive contractual completion and enforcement powers,
converting the manufacturers, de facto, in a sort of quasi-judiciary instance. Variation in
the allocation of decision rights and incentive intensity is explained by the incidence of
moral hazard in the relation. In particular, when the cost of dealer moral hazard is
higher and the risk of manufacturer opportunism is lower, manufacturers enjoy more
discretion in determining the performance required from their dealers and in using
mechanisms such as monitoring, termination and monetary incentives to ensure such
performance is provided. We also explore the existence of interdependencies between
the different elements of the system. and find some complementarities between
completion and termination rights, and between monitoring rights and the intensity of
incentives.
JEL codes: L14, L22, L81, K12
* We thank Oliver Williamson for his advice and support and Jürgen Backhaus, JudithChevalier, Harold Demsetz, Antony Dnes, Alberto Fernández, Manuel González, TomHubbard, Emilio Huerta, Peter Klein, Claude Ménard, Inés Macho, Cándido Paz-Ares,two anonymous referees and numerous workshop participants for their comments andsuggestions. This work has benefited from financial support by DGESIC through grantPB95-0989.
2
1. INTRODUCTION
This paper analyzes empirically the solutions provided by automobile franchising
contracts to the moral hazard problems present in franchising relations. It goes further
than the previous literature in that, rather than focusing only on the strictly “monetary”
aspects of the contracts, or only on the assignment of a particular right, it analyzes the
entire system of allocation of rights over substantive decisions and the monitoring,
punishment and reward mechanisms. The paper finds that the discretionary power of
manufacturers varies between different networks in a manner consistent with the
differential impact of moral hazard. Contracts allow more discretion to manufacturers
when the potential cost of dealer moral hazard is higher and when manufacturers’
opportunism is better controlled by their reputation.
Most of the empirical literature on contract design has focused on the strictly
“monetary” aspects of the contracts, whether dealing with compensation and incentives
in firms (see Prendergast, 1999 for a survey of this literature) or, in franchising, with
royalty rates and franchise fees (e.g. Lafontaine, 1992; Sen, 1993; Lafontaine and Shaw,
1996)1. A small but growing body of literature has studied the use of other contractual
terms. The pioneering study here is Masten and Crocker’s (1985) analysis of the use of
take or pay provisions for natural gas as an incentive mechanism. In a work more
related to ours, Gompers and Lerner (1996) systematically study the use of covenants in
venture partnership agreements, and explain the variation partly as a consequence of the
difference in the incidence of opportunistic behavior. Kaplan and Stronberg (1999) are
closest to our work in that they study the whole system of rights allocation in venture
capital contracts. In the franchising context, Dnes (1993), Mathewson and Winter 1 Rather than on the contract terms, the bulk of the empirical literature on franchisingfocuses on the choice between franchising and vertical integration. See Lafontaine andSlade (1998) for an excellent survey of this literature.
3
(1994) and Brickley (1998) have studied the use of some specific clauses and the extent
to which complementarities between them exist. However, neither the general
contractual design literature nor the franchising one have, to our knowledge, attempted
to analyze empirically the role of each element in the system of contract terms and
monetary incentives to the solution of the conflicts present in these relations, and the
interactions between the different elements of the system.
In analyzing the allocation of decision rights by these contracts, we argue that
assigning decision rights to one of the parties involves a trade-off between the risk of ex
post opportunism on the two sides. More manufacturer discretion reduces the risk of
moral hazard on the dealer side, while simultaneously intensifying the risk of
manufacturer incentive and hold-up hazards. Thus we expect manufacturer discretion to
increase with the importance of vertical and horizontal externalities and with
manufacturer reputational capital.
We make three main sets of findings. First, we find that all contracts substantially
limit the ex ante decision rights of franchisees, while granting extensive
implementation, monitoring and enforcement powers to manufacturers. In particular,
dealers must attain sales targets set by manufacturers, provide information and publicity
as required by manufacturers, and use the quantity and quality of facilities, labor and
machinery that manufacturers determine. Manufacturers also have a range of
enforcement rights (monitoring, termination and use of monetary incentives) to ensure
that these outcomes take place. We find substantial cross-brand variation on the
contractual allocation of enforcement rights to manufacturers and some, but less
important, variation in the allocation of decision rights to define ex post the content of
the contractual obligations, what for brevity we will call here “completion rights”.
Moreover, we find no within brand variation in the contracts used. All dealers of the
same network sign an identical contract, updated yearly.
Second, we find support for the hypothesis that the degree of “contractual
asymmetry” varies between the different networks in a manner consistent with the
4
differential impact of moral hazard. Manufacturers of higher quality cars and those with
larger networks enjoy more discretion over the operation of their networks, both in
terms of the completion rights and in their ability to enforce and provide incentives to
their dealers. This is consistent with the predictions of a theory relying on the cost of
(dealers’) moral hazard as the source of variation in the contracts. Moreover, older
networks assign more completion and enforcement rights to manufacturers. This may
reflect, as we suggest, the fact that longer horizons are related to higher manufacturer
reputation (allowing contracts to be more asymmetric). Also, Asian networks exhibit a
significantly lower level of centralization of rights in the manufacturer. This is
consistent with recent findings in the empirical literature about the reliance of Asian
manufacturers on non-verbal, trust based agreements (Sako and Helper, 1998;
Holmstrom and Roberts, 1998).
Third, concerning the existence of complementarities between the different elements
of the system, we find that all the rights and incentives move together in a manner
consistent with the hypothesis that the source of variation in the data is the differential
impact of moral hazard in the different networks. After controlling for common sources
of variation, part of the covariation disappears, but significant interactions are still
observed between instruments. First, the data is consistent with the existence of
complementarities between the allocation of completion and termination rights; second,
it is also consistent with the existence of complementarities between the allocation of
monitoring rights and the intensity of incentives.
The rest of the paper is structured as follows. Section 2 presents a theoretical
framework to analyze the relationship between manufacturer and automobile dealers,
the elements of the contractual solution, and the sources of variation in these elements.
Section 3 reviews the data. Section 4 presents the results and discusses them. Section 5
concludes.
5
2. ANALYTICAL FRAMEWORK
2.1. The Dealer Manufacturer Relationship in Automobile Distribution
Automobile distribution is centered on a vertical relationship between automobile
manufacturers and dealers. Manufacturers supply automobiles to dealers, write contracts
governing their relationships with them, and police the behavior of the network. Dealers
provide sales and after-sale services. In our data, each of them distributes only
automobiles for a particular manufacturer. They also provide customers with
information on new cars, which requires investment in advertising and in sales staff.
Dealers maintain brochures, showrooms, trial cars and a substantial stock of new cars to
facilitate inspection and allow for test driving and quick delivery. Moreover, they
provide complementary services by acting as insurance and finance brokers as well as
dealing with the paperwork involved in car registration. A byproduct of these services is
that dealers produce information on customer preferences, which is used by
manufacturers to plan car manufacturing. Finally, dealerships also provide the
specialized maintenance and repair services required by cars. To supply these services,
dealerships maintain specialized technicians, machines and automobile spare parts.
In relation with all these tasks, dealers make choices concerning the price of
automobiles, the level of promotional and sales services, and the level and quality of
after-sales services. The literature has identified two reasons why these choices will be
suboptimal in terms of the maximization of the total value of an integrated dealer-
manufacturer network. First, there exists a vertical externality. As, for example, Klein
and Murphy (1988) have argued, as long as the marginal return of a sale to the dealer is
only a part of the total return on an extra sale (which is the sum of both mark-ups), the
dealer chooses to sell a lower quantity of automobiles and to provide a lower
promotional and sales service level than optimal.
6
Second, the existence of horizontal externalities also leads dealers to produce
excessively low informational and promotional services. Dealers generate information
by investing in publicity and providing certain services. Consumers have incentives to
obtain information from the dealers who provide it and then acquire their car from other
dealers, who may sell at lower prices but do not provide this information. This free-
riding by dealers reduces the total supply of publicity and information, which decreases
the final demand for cars (Telser, 1960).
The task of controlling these conflicts through contracts faces two main difficulties,
related to contract completion and contract enforcement. First, uncertainty makes it
impossible to complete the contract ex ante. Instead, efficient adaptation requires that
many terms of exchange, i.e. the precise contractual obligations of the dealers, be
established and continuously revised ex post. This is the case, in particular, of the price
and number of cars to be sold by each dealer in each year, as well as their sales and
service effort. Second, enforcement of the terms of exchange so defined suffers from
the fact that many performance variables are costly to observe by the parties and are
difficult to verify by potential third party enforcers. In particular, this is the case of sales
and service effort. The sale price is also mostly unobservable because the sale of
automobiles frequently involves bargaining over price, in order to price discriminate
among buyers. Moreover, part of the payment for a new car is often the trade-in of a
used vehicle.
2.2. Contractual Design
This paper argues that the main role of the contract is to articulate mechanisms to
ensure that the dealers choices are consistent with the maximization of the entire
network value. These mechanisms are the allocation of completion and enforcement
rights to manufacturers and the consequent operation of incentives and quasi-rents to
constrain dealers’ behavior.
7
Rights Assignment. In specifying the dealers’ obligations, the contracts do not
specify the actual actions that dealers should undertake in the future. Instead, they grant
manufacturers the right to choose these actions in future moments. Thus, for example,
contracts do not determine the target sales of the dealership, the level of publicity
investment by dealers or the appropriate qualification of the sales personnel, but instead
they provide for manufacturers to determine and adjust these variables in the future.
Given that manufacturers complete in this way many dimensions of the contract, we call
these rights to determine ex post the actual content of the performance to be delivered
“completion rights”.
Contracts also assign “enforcement rights” that allow manufacturers to play a quasi-
judiciary role in ensuring that dealers fulfil their obligations, including those defined
discretionary by the manufacturers in exercise of their completion rights. Enforcement
rights include manufacturers’ rights to monitor dealers, to terminate the relationship and
to establish monetary discount mechanisms to ensure that sales and service targets are
met.
This asymmetric assignment of completion and enforcement rights involves a trade-
off between the risk of ex post opportunism on the two sides. More manufacturer
discretion in completion and enforcement reduces the risk of moral hazard on the dealer
side, while simultaneously intensifying the eventual risk of manufacturer incentive and
hold-up hazards (Williamson, 1975, 1979; Klein, Crawford and Alchian, 1978). The
latter is a real concern in end-game situations, such as when the manufacturer has bad
prospects, so that his discount rate is very high, or when technological changes require a
radical transformation of the distribution network. In these cases, it may be difficult for
third party enforcers to distinguish opportunistic from disciplinary decisions made by
the manufacturer.2 As a consequence of this trade-off, contractual asymmetry should
2 Williams (1996) however, shows that terminations by franchisers are infrequent in theUS (fewer than 4% annually) and that the conditional probability of terminationdecreases significantly as outlet performance increases, the opposite to the relationshippredicted if termination were primarily motivated by manufacturer opportunism.
8
increase with the risk of dealer moral hazard, as determined by the incidence of vertical
and horizontal externalities, and with the safeguard that the manufacturer can provide in
the form of reputation.
Direct Monetary Incentives. Most dealership networks also rely on direct monetary
discounts linked to the achievement of sales targets and the degree of customer
satisfaction as measured by client polls. As the agency literature has long argued, these
direct monetary incentive schemes may be used to align the incentives of the two parties
to the contract. In our context, the implication of the theory is that the intensity of sales
and service related monetary incentives should be higher the higher the incidence of the
relevant vertical and horizontal externalities.
Quasi Rents. As Klein and Leffler (1981) have argued, the threat of termination
together with the existence of a flow of quasi-rents may be sufficient to assure
performance in a context of repeated transactions. To this effect, the quasi-rent that the
dealer receives must be higher the lower the probability of cheating being detected and
punished and the larger the gain from cheating. Notice that, as a consequence of the
asymmetric allocation of decision rights, the level of dealers’ quasi-rents results, in our
case, not from ex ante agreements, but from ex post decisions taken by the
manufacturers.
2.3. Network Characteristics and Risk of Opportunism
Among the strategic decisions the automobile manufacturer makes are the timing of
market entry, the market positioning of the automobiles, and the extent of the dealership
network. The contract design is chosen conditional on these decisions. We argue that
these strategic choices by the manufacturer determine the scope of opportunistic
behavior on the two sides and, as a consequence, the particular combination of
contractual solutions chosen by the contract. Our empirical work aims to explain the
observed contractual variation as a consequence of the variation in these network
characteristics.
9
Assuming that entry decisions and car quality choices are exogenous from the point
of view of contract design is uncontroversial. In assuming that the network size is an
exogenous variable to the choice of contractual design, we rely on the fact that network
size is almost entirely a function of the total sales of the brand.3 We further assume that
total brand sales only enter in the contractual design choice through the dealership
structure.
As in any public good context, the larger the network size, as given by the number of
dealers in the network the more important the horizontal externality. Therefore, we
expect manufacturers to have more discretion to decide and control the behavior of
dealers in larger networks; similarly, the intensity of the monetary incentives for the
dealer should be higher the larger the dealership network. For the same reasons, we
expect dealers to earn higher quasi-rents the higher the number of dealers in the
network.
The cost of dealer opportunism also grows with the quality of the car sold. The
reason is that the unobservable sales and after-sales service is more important the higher
the quality of the car. Thus we expect manufacturers of higher quality brands to be
given more discretion on completing the contract and enforcing it. Moreover, we also
expect the intensity of sales and service related monetary incentives to be higher the
higher the quality of the car. Finally, dealer quasi-rents put in place to avoid shirking
should be higher the higher the quality of the car.
Network size and car quality may also covary with the manufacturer reputation.
First, as a number of previous studies have noted (Lafontaine, 1992; Agrawal and Lal,
1995), brand name value increases with the total number of outlets in each network,
since brand name value increases as more people are exposed to the brand. Moreover,
3 Automobile sales by each brand explains 82% of the variation in size of the dealershipnetworks. The regression results of the number of dealers on the total sales in moneyterms in 1995, with the standard errors in parenthesis, are as follows:Number of Dealers in Network i = 65.41527 + .0003265 Sales of Network,
(7.783622) (.0000341)with R2 = 0.8207.
10
the ‘externalities’ generated by an expropriatory conduct by the manufacturer also grow
with the number of dealers exposed to it. Second, the average quality of the automobiles
sold could also be correlated with the manufacturer reputational capital. Clearly,
manufacturers who sell more expensive cars incur higher costs with their customers if
the relationship with their dealers deteriorates.
Thus, due to both to the higher risk of dealer moral hazard and the lower risk of
dealer expropriation, we expect more decision rights to be allocated to the manufacturer
the larger the network and the higher the average price of the automobiles sold. This is
because both variables have the effect of increasing the risk of dealer moral hazard
(increasing the benefits of manufacturer discretion) and decreasing the probability of
expropriation (decreasing the costs of manufacturer discretion).
A third variable that will influence the balance of risk of opportunistic behavior is the
age of the network. This has few consequences for the risk of dealers’ moral hazard. It
does however have implications for the reputational capital of the manufacturer: a
longer lasting relationship allows for more reputational capital to be created, as it
increases the potential for a cooperative outcome to come about.4 As a consequence, we
expect manufacturers to be allocated more contractual rights in older networks.
Alternative hypotheses to the one we advance may be used to explain the contractual
design. One such hypotheses would argue that the variation in contract design is
essentially random variation, and that chance, rather than the scope of opportunistic
behavior, determines contractual choices. Such an explanation would not predict the
existence of any link between the assignment of decision rights and the automobile
price, the dealership size and the age of the network. Thus our data allows us to easily
differentiate this explanation from the one we offer.
A second alternative hypothesis would agree that contractual variation is systematic,
but would argue that it results from differences in the relative bargaining power of
4 We are implicitly assuming that the time a relationship has lasted is a predictor of thetime it will still last.
11
manufacturers and dealers in different networks. Explanations of this kind could be
constructed that would make some but not all of the same predictions as an explanation
in terms of the risk of opportunistic behavior. For example, if manufacturer bargaining
power increases with the length of the relationship as the specific physical and human
capital invested by dealers increases, then a bargaining power hypothesis may predict
more decision rights being granted to manufacturers in older networks.
Thus some predictions of a bargaining power-based explanation for contractual
design may coincide to the one we offer, making it difficult to differentiate bargaining
power and efficiency explanations for contractual variation. The efficiency hypothesis
and the bargaining power hypotheses part company completely, however, concerning
network profitability. An explanation based on bargaining power would predict that,
when the bargaining power of the manufacturer is larger, his ability to extract rents from
the dealer is larger. Thus if price, network size and age of the network increase
manufacturer bargaining power, they should also decrease dealer profitability, all other
things constant. On the other hand, a larger risk of opportunistic behavior by dealers
implies that higher price and larger networks are associated with larger dealer quasi
rents. Thus data on dealer profitability together with contractual data may help us to
differentiate the two hypotheses.
2.4. Complementarities and Substitutabilities Between Contractual Elements
We have argued that all elements of the contract respond to the same factors. There
exist reasons on theoretical grounds to suspect that the contract is a system of
interdependent choices, so that changes in one choice will necessarily imply changes in
the other. Not only are all elements of the contract likely to respond to the same factors,
but the inclusion of some element (e.g., more asymmetric completion) may either
require or preclude that of some other element (e.g., more or less monitoring).
As we shall see, formulating tight hypotheses about these complementarities or
substitutabilities between the different mechanisms available is fraught with problems.
12
The question of whether and to what extent these choices actually interact with each
other is an important one, however, and it ultimately requires an empirical answer.
Completion rights and the enforcement and incentive system: The basic economic
analysis of the relation between completion rights and enforcement rights can be
derived from the analysis of Milgrom and Roberts (1992: 412) and Jensen and Meckling
(1995).5 They argue that incentive intensity (in our context, the whole enforcement and
incentive system) is complementary with agent discretion. More decentralized decision
rights must lead to higher powered incentives, as agency problems become more
important the more discretion the agent has. In our context we observe manufacturer
discretion, the opposite of dealer discretion, and a complete enforcement and incentive
system, rather than simply monetary incentives. Thus, from these theories, we would
expect that the lower the manufacturer discretion in completion, the more intense must
be the incentive provided by the whole monitoring, termination and incentive systems.
An alternative hypothesis can be derived, however, by recognizing that determining
obligations without corresponding mechanisms to enforce these obligations is
meaningless. Certainly, the legal system plays a role here. But to the extent that second
party enforcement also plays an important role in these relations, more manufacturer
completion rights, which are rights to establish dealer obligations, may require more
self-enforcement rights, i.e. rights to implement monitoring and incentive systems and
to terminate the relationship. This hypothesis leads us to expect more intense
monitoring, termination and incentives the higher the manufacturer discretion in
completion.
Monitoring and termination/monetary incentives. On the relation between
monitoring and termination and monetary incentives, the main existing theoretical result
is what has come to be called (Milgrom and Roberts 1992: 226) the monitoring intensity
principle, which states that more monitoring should be undertaken the more intense are
5 While their analysis deals directly with the rights assignment within a firm, the mainideas can be readily generalized to the between firms context of the distributioncontracts we study.
13
the incentives. Translated into the contractual rights assignment in our context, we
expect monitoring to be complementary with termination and/or monetary discounts.6
Termination and monetary incentives. We expect the different incentive and
enforcement mechanisms to be substitutes: if appropriate incentives are provided
through the threat of expropriation of quasi-rents implicit in termination (Klein and
Leffler, 1981; Klein and Murphy, 1988, 1997), then explicit monetary discounts should
be less important.
Sales and service related monetary incentives. A multitasking set up, such as the one
proposed by Holmstrom and Milgrom (1994), would predict that the level of incentives
provided by different types of mechanisms is complementary. If more sales related
discounts are provided, the dealer may decrease the service effort, and service related
discounts must increase to compensate this reaction.
Empirically testing these hypotheses is fraught with problems. First, because in some
instances the theory provides ambiguous guidance about what we should find. Second,
because the empirical existence of complementarities depends on the source of variation
in the data, and the vector of choices may not be associated with respect to the changes
in the impact of moral hazard that we are exploring. And finally, because the existence
of unaccounted variables observed by the contract designers but not by the
econometrician may cause co-movements in the contractual choices when no
interactions actually exist.
In spite of these difficulties, we explore the existence of comovements in the last part
of the empirical section. The spirit of this investigation is to further our understanding
of the data and to guide further theory development, rather than to actually test any
specific hypotheses.
6 The monitoring intensity principle is derived in a world of complete contracting, butwe have no reason to believe that the sign of the prediction should be affected bywhether contracts are or not complete.
14
3. THE DATA
The empirical analysis is based on the dealership contracts of the 23 main networks
operating in Spain, which represent 99.3% of the market and all of the important
multinational firms. We complement the contractual data with data on the
characteristics of the dealerships of the different networks, including particularly the
number of dealerships, the age of the network, the price of the automobiles sold by the
network and the average profitability of the dealerships in the network, as measured by
the average return on sales.7
A first striking feature of the data is that the contracts present no variance between
dealers of the same brands. They are contracts of adhesion, updated yearly by the
manufacturer and circulated to all members of the network for their signature.8 Thus
contracts do not respond to the within brand variation in dealer’s characteristics, such as
their reputation or the time they joined the network.
All contracts assign dealers certain rights. This allocation, mostly made implicitly by
not including limiting rights in the contract, defines a core set of dealers’ rights common
to all the networks. In particular, dealers set prices of cars sold, always below the
ceilings established periodically by the manufacturers. They also decide on the quantity
and models of automobiles they order from the manufacturers. Manufacturers can
however force them to sell some models (quantity forcing), in exceptional
circumstances. Finally dealers may choose, subject to manufacturers approval, the price
of after-sale services, the tools for the after-sale service, the local marketing campaigns
and the location of the dealership.
7 See the appendix for a more extensive data collection description and the descriptivestatistics of these variables. Readers interested in a more complete description of theindividual contractual clauses should refer to Arruñada and Vázquez (1999).8 Lafontaine and Shaw (1996) find a different pattern: They observe contract terms to befixed for all those franchisees who joined at a point in time, but then stay constant forthem over time. The literature has explained this fixity as a consequence of double sidedmoral hazard (Bhattacharyya and Lafontaine, 1995) and of the cost of designingdifferent contracts (Holmstrom and Milgrom, 1987).
15
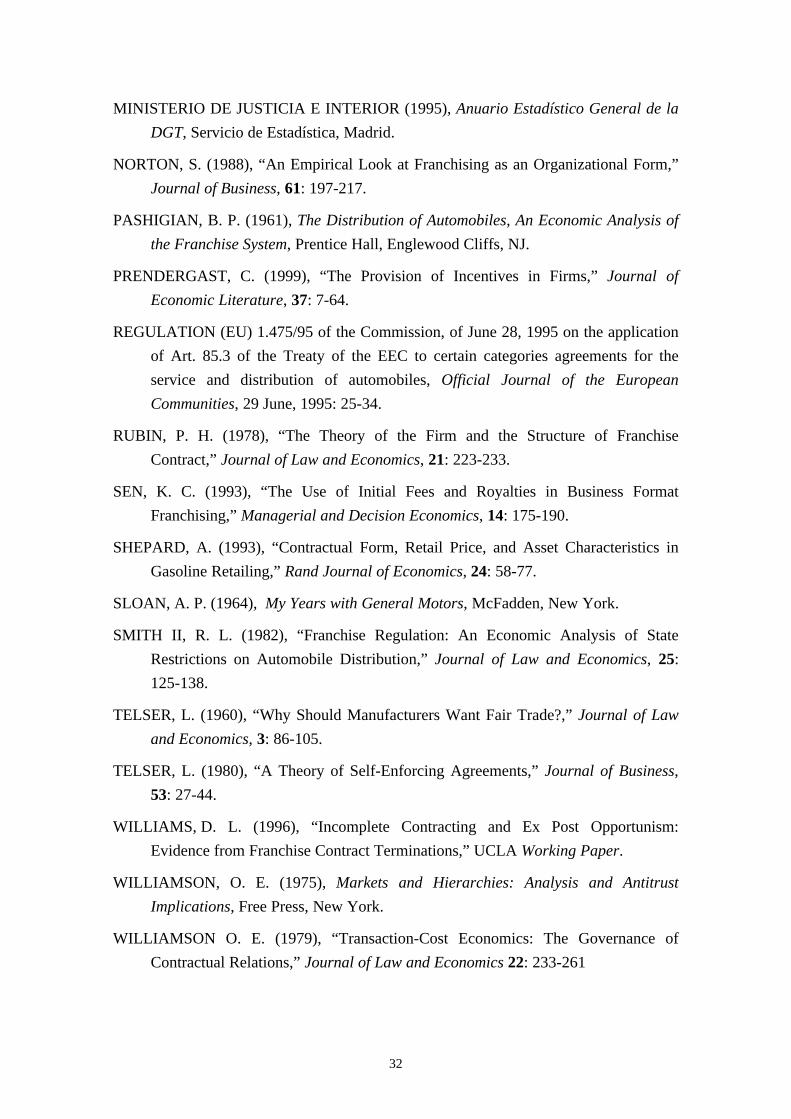
As Table 1 shows, contract variation in manufacturer completion rights between
networks is small. Of the 16 types of dealership variables that the contracts potentially
assign to manufacturers, only 4 show some variation: those affecting the level of
training of the sales force, the number of trial vehicles, the determination of a minimum
capital by the manufacturer and the right to limit dealer sales outside of his own
territory.
[Note: Table 1 here, with list of contract clauses]
All contracts assign certain monitoring rights to manufacturers. In particular, as
Table 1 shows, they are authorized to directly inspect the inputs of the dealership
(machinery, personnel, etc.) and to measure dealer performance in terms of achievement
of sales targets. Most contracts also allow dealers to monitor customer satisfaction, as
measured by polls. Finally, most manufacturers may monitor dealers financial
performance by regularly auditing their financial statements.
Concerning termination rights, all contracts explicitly assign manufacturers the right
to terminate the contracts when the dealer infringes certain duties. In particular, the
repeated breach of sales and service targets, the change in the ownership of the
dealership or the bankruptcy of the dealership are always reasons for automatic
termination. Other circumstances, such as management changes or disagreements
among partners or managers also trigger termination rights in some networks.9
A particularly salient right assigned by the contracts is the right to establish dealers’
annual sales targets. Targets are defined in terms of the market share that the dealer
must achieve in the relevant local market and then communicated to dealers in the form
of the sales volume they must achieve. They are set every year on January, relying on
forecasts elaborated by manufacturers based on historical sales data in the dealer’s
market and at the national level. The numerical target may be later revised if either the
9 The inclusion of termination at will clauses in contracts would make superfluous theenumeration of individual reasons for termination. However, both the Europeanlegislation and the general rules of the Spanish contract law substantially limit the scopefor termination at will.

16
aggregate sales of automobiles or the national market share of the brand are lower than
forecasted, providing some partial insurance for the dealers.
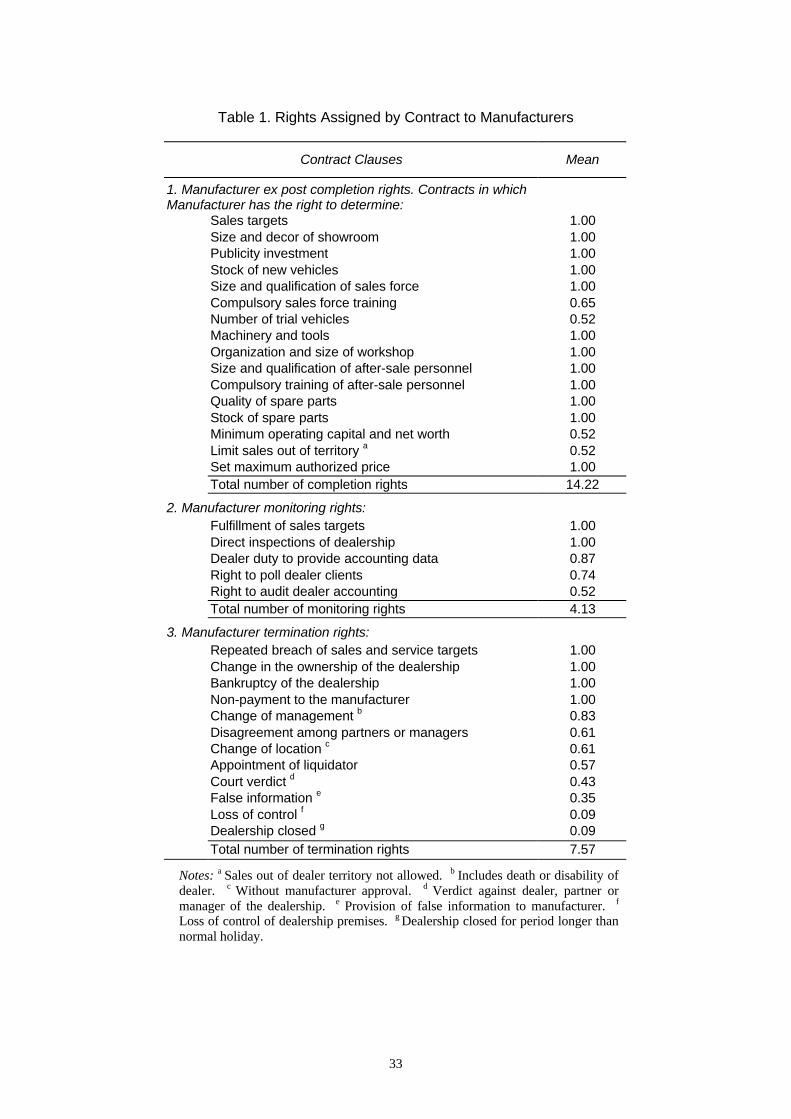
These sales targets are linked in 20 of the networks to substantial discounts on the
wholesale automobile price paid by dealers depending on the degree to which they
achieve them.10 The first row in Table 2 shows the across-network average quantity
related discounts applied to the prices of all vehicles acquired by dealers between 1993
and 1995. For example, dealers who met their annual sales targets received a mean
discount of 2.38% of the price of all the automobiles they had acquired from the
manufacturer in that year. The importance of these discounts is such that most dealers
would be unable to obtain any profits if they were not receiving them.11
Likewise, in 13 of the networks, manufacturers set service targets and dealers may
obtain discounts in accordance with customer satisfaction as measured through client
polls. Service-related discounts are smaller but also crucial to dealers’ profitability.
When customer satisfaction is highest, the mean discount on this concept that dealers
could obtain annually was 0.73% of the price of all automobiles they acquired from the
manufacturers. Note that, since the discount falls on all the units sold, the discount
increases more than proportionally with customer satisfaction.
[Note: Table 2 here, describing sales and service discounts]
Both of these discounts show a “stair-step” pattern. Reaching the next stair (for
example, selling the car that gets the dealer to 80% of his sales target) produces a
decrease in the price paid by the dealer for all of the units sold up to that level. As a
consequence of this pattern, the marginal price paid by each dealer is a decreasing
function of the number of cars sold by this particular dealer. 10 The three networks that did not use sales discounts declared in interviews that they doset and follow up sales targets, however, which they use only to impose disciplinarytermination and to justify it before third party enforcers. Thus these three networks relyexclusively on termination to provide incentives to their dealers.11 Compare the discounts with the average return on sales, which was 0.35% in 1993,0.66% in 1994, and 1.1% in 1995 (See table A2 in the Appendix A2). Note that theseROS data are in the same range as the 1997 for USA (1.4), Japan (0.4) and UK (1.5)(Dickinson, Dembkowski and Shah, 1998).
17
4. RESULTS: EXPLAINING THE JOINT ASSIGNMENT OF COMPLETION AND ENFORCEMENT
RIGHTS AND THE USE OF MONETARY INCENTIVES
In this section we test the predictions of the theory for the allocation of rights, the use
of incentives, and the existence of quasi-rents. We then go on to study the interactions
between these choices.
4.1. Cross-sectional Variation in Manufacturer Completion and Enforcement Rights:
Agency Considerations
The theory predicts that the level of discretion available to manufacturers should
increase with the risk of dealer moral hazard, as determined by the incidence of vertical
and horizontal externalities, and with the safeguard that the manufacturer can provide in
the form of reputation. We investigate here this hypothesis.
Dependent Variables. We obtained predictions from the theory in section 2
concerning the level of manufacturer discretion both in particular domains and in the
assignment of particular rights. We construct an index of the manufacturer discretion in
each particular domain by simply adding the number of rights in that domain allocated
to the manufacturer. Thus we measure allocation of completion, monitoring and
termination rights in brand i by the number of such rights assigned by the contract of
that brand to the manufacturer. We measure the discretion of the manufacturer i in
enforcement by the number of monitoring and termination rights assigned to the
manufacturer. Adding up these rights presents some problems. However, it allows us to
provide a comprehensive measure of contract asymmetry in different domains (i.e.,
completion, monitoring and termination), as the rights within each of these three
domains have a related purpose, and permits us to focus on the object of interest in this
study, namely the discretion the manufacturer has in completion, monitoring and
termination. Moreover, we check the consistency of our measure by examining the
18
variation of all of the individual rights. As we show in Section 4.4, they indeed vary in
the same direction as the aggregates.
Independent Variables. As we argued in the theory, we are interested in the effects
of three variables on the assignment of decision rights: the quality of the automobiles
sold, the number of dealerships in the network and the length of the relationship. We
proxy the quality of the automobiles by their average price. We also include in the
analysis controls for the continent of origin of the manufacturer. Here the main concern
is to take into account the fact that Asian firms are usually found to be less reliant on
formal contractual mechanisms (Sako and Helper, 1998; Holmstrom and Roberts,
1998). As a consequence, we would expect Asian dealers to assign explicitly a smaller
number of rights to the manufacturer.
Estimation. From the theory presented in section 3, the discretion of the
manufacturer is a function of the agency costs and the reputation of the manufacturer.
We run the following OLS regressions for the clauses of the different types:12
Number of Rights of type j of Manufacturer of Brand i = β0 + β1 Average Price
of Car of Brand i + β2 Number of Dealers in Network of Brand i + β3 Log
Number of Years Brand i Network is in Operation + Continent Dummies.
Since these dependent variables are count variables, and for each of them there exists
a known minimum (0 clauses of type j used by brand i) and maximum (all clauses of
type j used by brand i) number of clauses, the suitability of OLS in this context is
questionable. To ensure the validity of the results under these circumstances, we repeat
the estimation by maximum likelihood. These estimates assume that for each brand, we
observe the results of Ni trials, where a success in a trial is the presence of an individual
clause. Calling Pij the proportion of clauses of type i used in the contract by brand j, the
assumption required for this estimation method is that
Pi=F(ββx)+ε, with E(εi)=0, and Var[εi]= F(ββx)(1- F(ββx))/ni.
12 See the data appendix for the descriptive statistics of the independent variables.
19
We do present both tables, however, since the OLS estimates are easier to interpret,
and do not rely for the significance of the coefficients on the large number of
observations that the probit estimates imply. Moreover, we check for the consistency of
the results using a linear probability model estimated by weighted least squares to deal
with the heteroskedasticity that exists because of the binary nature of the data. We
estimate the probability that right i is assigned to the manufacturer for each individual
right as a function of the above variables.
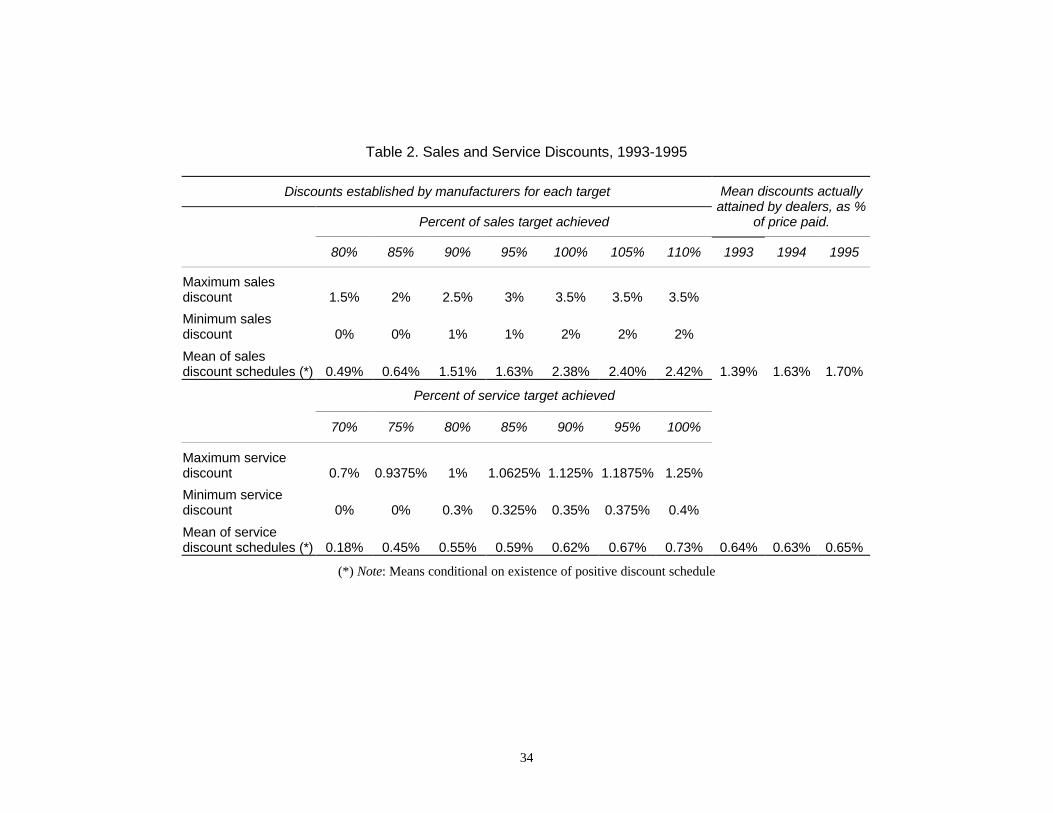
Results. We present the empirical analysis of the manufacturer discretion in Table 3.
For each discretion variable we present two specifications. The baseline specification
includes the three main proxies. The second row for each variable includes controls for
the region of origin of the manufacturer.
[Note: Table 3 here, with allocation of rights]
The effects of the price, dealer, age and Asia variables are consistent with the
predictions of the incentive theory enunciated above. They are also consistent across
specifications and across regressions, and, despite the relatively small number of
observations, they are significant in most of the regressions on the number of clauses.
The exception to this is the age coefficient, which becomes insignificant in all
regressions when the Asia control is added. Also quite remarkably, the significance of
the main explanatory variables does not decrease substantially as continent controls are
added. On their own, the average price sold, the number of dealers in the network and
the age of the network explain around 70% of the variation in the allocation of
completion rights by these contracts.
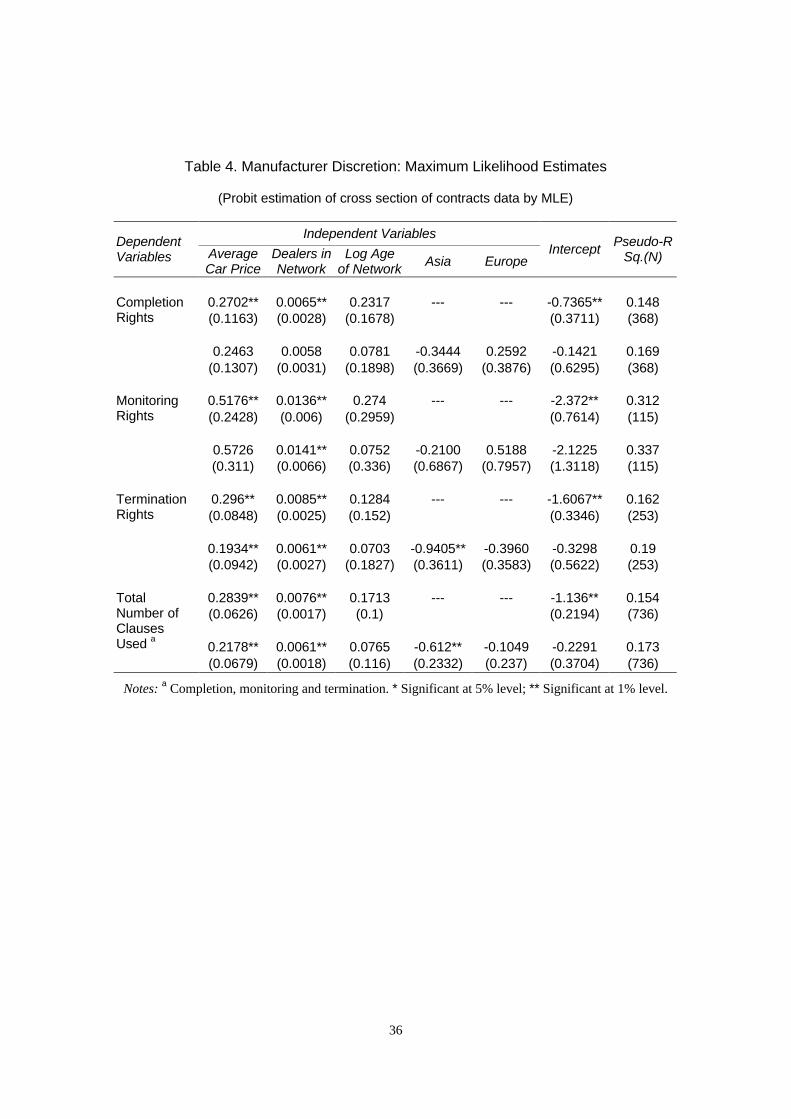
[Note: Table 4 here, with allocation of rights by MLE]
The regressors are also economically significant. An increase in price of automobiles
of one standard deviation (Pta- 1.93 m.) increases manufacturer discretion on average in
2 dimensions. Similarly, an increase of one standard deviation of the number of dealers
(65 dealers) also adds on average 2 rights to the manufacturer discretion. Finally, an
20
increase in the Log Age in one standard deviation (.88) increases manufacturer
discretion by 1 clause.
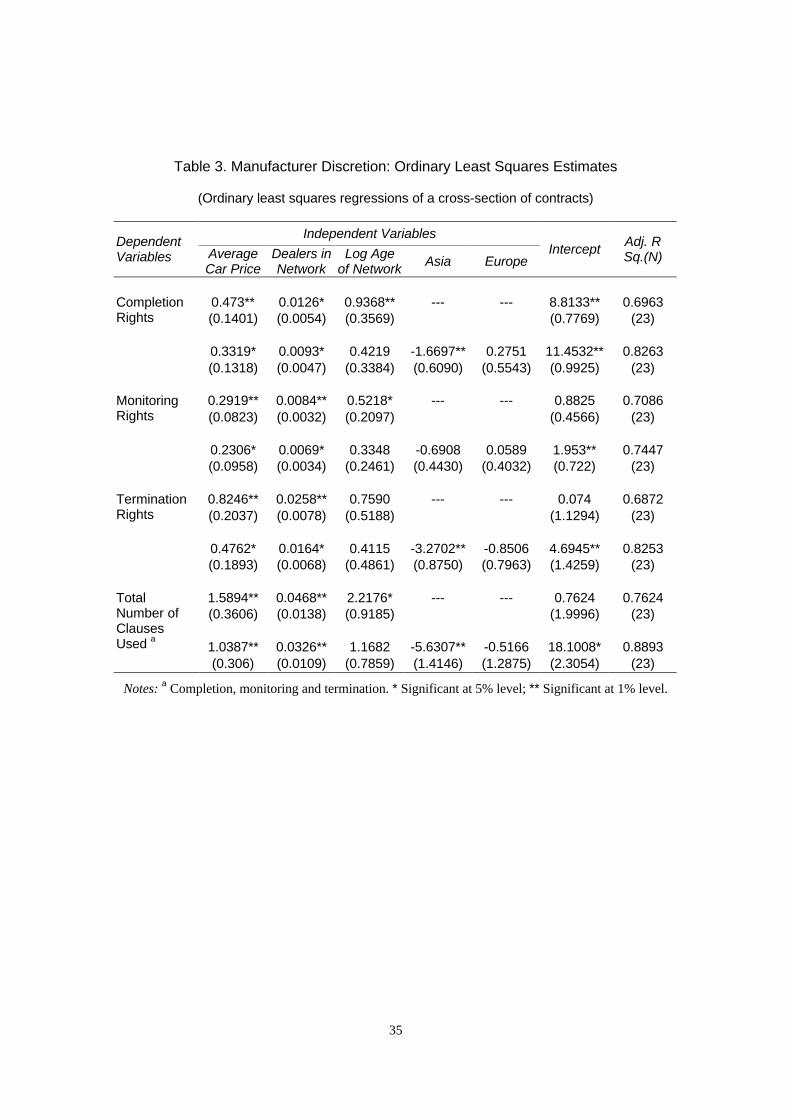
The main observation that can be derived from using MLE methods to estimate the
relation between decision rights and network characteristics as showed in Table 4 is that
the results of such a procedure are entirely consistent with those in Table 3. None of the
28 signs of the dependent variables is altered by the change in methods. Price and
number of dealerships are clear determinants of the use of each individual clause. The
age of the network still seems to be a factor, although in none of the estimates does it
enter significantly.
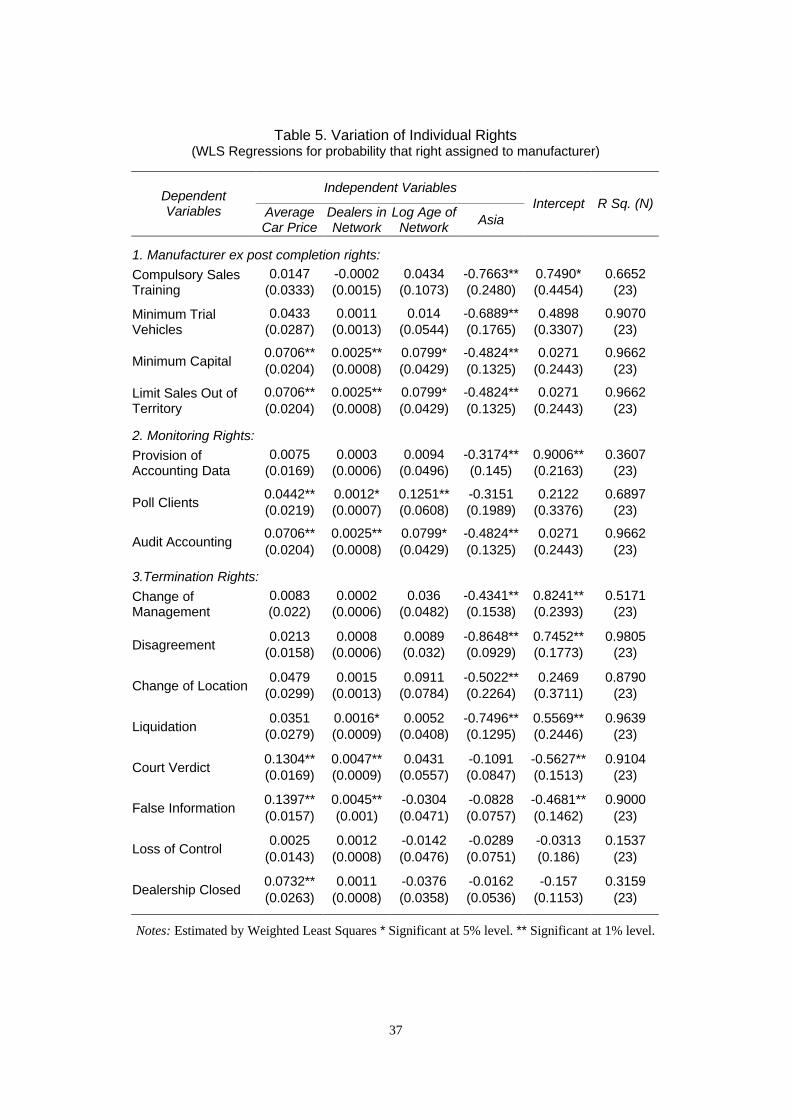
Our confidence in these results is increased by the analysis of the individual clause
variation presented in Table 5.13 The signs of the individual effects are overwhelmingly
the ones that Table 4 has led us to expect: of 60 possible signs (15 regressions times 4
independent variables), only 4 are different than in Tables 3 and 4 and all of those 4 are
insignificantly different than 0. As in Tables 3 and 4, particularly robust appear the
results on Car Price, Number of Dealers in the Network, and the Asia dummy.
[Note: Table 5 here, with variation of individual rights]
4.2. The Use of Discounts
The theory in Section 3 predicts that stronger monetary incentives should be used
when the cost of dealer opportunism is higher. Also, higher manufacturer reputation
should lead to stronger incentive intensity, as the ability of the manufacturer to
opportunistically reduce the dealer’s income is larger when discounts are a more
important component of dealers income, given the ability of the manufacturer to
manipulate sales targets.14
13 Given the relatively small sample size, we use only the Asia control, since we foundthe European control to be entirely insignificant in all of our Table 3 regressions.14 While, in the absence of price discounts, the manufacturer may influence the dealers’profitability by altering the price charged per car, this affects the entire network and
21
Dependent Variables. The discount level is in itself an imperfect measure of
incentive intensity. Provided that sales fall between the minimum and maximum
quantity of cars sold necessary to obtain a discount, a dealer faces identical incentives
and obtains the same income with higher prices paid and higher average discounts as
with lower prices and lower average discounts. For this reason, the discount range is
likely to be the best available measure of incentive intensity for a wide range of
outcomes. However, to avoid eventual conflicts between the different indicators, we
construct and use several alternative measures of incentive intensity: the use of sales
and/or service discounts, the level of each of these discounts, and the range of discounts
attainable. For both the level and range, we differentiate between sales and service
discounts.
Estimation. We use an ordered logit to estimate the relation between the use of
discounts (0, 1 if either sales or services used and 2 if both) and our independent
variables. We use a tobit to analyze the variation on the discount rages, as at their lowest
the contracts that provide lower monetary incentive intensity have 0 discounts.
[Note: Table 6 here, with intensity of monetary incentives]
Results. The most remarkable fact about Table 6 is its consistency with the results
on the contractual clauses. The same variables that explain the degree of asymmetry in
the allocation of decision rights explain here the use and intensity of the monetary
incentives provided. The coefficients are, with the exception of the Network Age and
(once) the Average Price, not statistically significant. Their signs are for the most part
entirely consistent with the theoretical predictions from section 3.
The lack of predictive power of the sale discount specifications (the second and three
sets of regressions in Table 6) is puzzling, particularly compared to the high
significance levels found in the rest of our analyses. The pseudo-R2 for these
estimations is extremely low, suggesting that the agency-related variables that explain
(since it creates a larger double marginalization problem) it has the potential to damageas much the manufacturer himself as the dealers.
22
the use of discounts fail to account for the variability of the level and range of sales
discount. Alternatively, there may exist some hidden heterogeneity in the strictness of
the sales targets across brands. If some manufacturers set very high targets, so that most
of their dealers barely achieve the lower step of the discount schedule, while other
manufacturers set low targets, so that most dealers achieve over target sales, then the
meaning of our range and level of sale discounts is different for different brands.
Figuring out whether this is the case would require knowing the ex post distribution of
discounts for different manufacturers. Regrettably, this data is not available.
4.3. Quasi-Rents
To test Klein and Leffler’s (1981) hypothesis that the flow of quasi-rents to the
dealers combined with termination provides a self-enforcing device, Table 7 presents a
panel regression of the profitability during three years of the automobile dealerships.
We use year dummies, as the observations are at substantially different points in the
cycle. Profitability is (imperfectly) proxied here by the return on sales, the standard
profitability measure in the industry.15
[Table 7 Here]
In the presence of more important agency problems the quasi-rents flow must be
larger to dissuade dealers from opportunistic behavior. Table 7 provides clear support
for this hypothesis in one instance: higher price dealerships have higher profitability, as
measured by their return on sales. The coefficient is also economically relevant, as a
standard deviation change in the price (Pta. 2 m) leads to a 6 point increase in ROS. The
other coefficients in which our study is interested are insignificantly different from 0,
although their signs are as we would expect from the theory. First, profitability
15 Caution must be used in interpreting these results. First, the short length of the panellimits the usefulness of the discussion, as the cycle could have different effects ondifferent networks. Moreover, identifying different in ROS as differences in quasi-rentsis also problematic.
23
increases with horizontal externalities, as measured by the size of the dealership
network. Second, it decreases with the age of the network.
The results of this regression also provide some additional evidence on an alternative
explanation of the data to the one we have suggested here: the possibility that the
variation in contractual asymmetry responds to the differential bargaining power of the
different automobile manufacturers. The coefficients that predict the existence of quasi-
rents are the same ones that predict the existence of asymmetry, and suggest that those
networks that have a more asymmetric position actually enjoy higher profitability. This
is not as would be predicted by an explanation of the contractual design based on the
relative bargaining power of the parties.
4.4. Complementarities and Substitutabilities
As section 2 has argued, there are reasons to believe that there exist interactions
between the different elements of the system. Table 8 presents the unconditional
correlations between each pair of decision variables. These unconditional correlations
are all positive with the exception of those between the realized quasi-rents and the rest
of the variables, suggesting that a change in any contractual variable is related with a
change in the same direction of any of the others. While Table 8 is consistent with the
existence of complementarities between contractual decision variables, it cannot help to
reject the hypothesis that each contractual choice is unrelated to any other choice.
Comovements in all the contractual variables may simply respond to movements in the
same underlying variable. As we have seen during the previous sections, it is indeed the
case that all of these variables respond to similar considerations.
[Note: Table 8 here, with unconditional correlations]
24
Two methodologies have been used by the literature to solve this problem.16 Some
authors, starting with Arora and Gambardella (1990) have tested whether the practices
are correlated, conditional on the observables. Others, notably recently Ichiniowski,
Shaw and Prennushi (1997) directly estimate a production function and then test
whether the interactions between practices are positive.
In what follows we choose to use the first approach. The reason is that we do not
have sufficient information to confidently estimate a production function for the
dealership networks, nor do we have a sufficiently narrow definition of output. The
downside of the conditional correlation measures is that, if there are variables which are
unobserved to us but observed to the firm which favor the use of some practices, we
will have upward biased estimates of the conditional correlation. It will appear that
different practices are complementary when, in fact, they are simply moving together as
a result of the impact of a third variable unknown to us.
Table 9 presents the conditional correlations between the different measures of
discretion. They have been calculated as the correlations between the residuals of the
contract regressions, the monetary incentive Tobits, and the profitability panel. Since
the estimation of the monetary incentive equations relies on non-linear MLE methods,
we use the generalized residuals proposed by Bourieroux, Monfort, Renault and
Trognon (1987).
[Note: Table 9 here, with conditional correlations]
Controlling for common sources of variation reduces the covariation from the one
that could be observed in Table 8. This suggests that part of the covariation that could
be observed was the consequence of a common response of the different contractual
elements to the same problem, namely the risk of moral hazard. The evidence points,
however, to the existence of interdependencies between some elements of the system. In
16 See Athey and Stern (1998) for an excellent discussion of the issues at stake. Thecomputationally intensive method they propose to go around this problem is, however,not applicable to our case given the size of our data set.
25
particular, Table 9 points to complementarities between completion and termination
rights, and between monitoring and incentive intensity.
The evidence on the positive conditional correlation between completion and
termination rights may suggest that manufacturer discretion in termination, a dimension
of enforcement, is present when the manufacturer also has more scope for decision
making. With the caveats on interpretation of this conditional correlation mentioned at
the end of section 2.4, this result contradicts the standard economic interpretation,
which predicted that stronger enforcement or incentive intensity should go together with
dealer discretion. The result is consistent, however, with the alternative hypothesis we
advanced, which recognizes the need for the right to establish obligations to covary with
the right to enforce those obligations.
Also, the second column of Table 9 suggests that it is indeed the case that more
monitoring intensity covaries with more incentive intensity, as measured by either any
of the monetary discounts or by termination rights. Only in one case is this correlation
significant at the 95% level,17 but four of the correlations would be significant at the
85% level. This is consistent with what the theory would lead us to predict. As moral
hazard increases, incentive provision needs to be stronger, and this implies that
monitoring intensity must increase.18
The last four rows of Table 9 present the evidence on the use of sales and service
discounts. The only coefficients that are significantly different from zero relate the level
and the range of discounts, which is of limited economic interest and suggests simply
that both are measures of incentive intensity. There is no evidence, however, for the
existence of comovements between sales and service discounts.
17 The evidence on this relation is, however, weakened by the fact that the sale discountequations present the lowest (pseudo)R2 in our whole analysis. It is easy to argue that, ifwe had been able to explain more fully the variation in the range of sale discounts thecoefficient would have been eliminated.18 Note that two of the three monitoring rights that present some variation in the data arerights to inspect variables that are relevant to the provision of sales related discounts:the right to inspect dealer accounting data and the right to audit the dealer accounting.
26
We find the results illuminating. First, there is evidence consistent with the
hypothesis that the whole system, with the possible exception of the quasi-rents, is
designed to solve a similar set of problems. Second, we find evidence of some
complementarities between the different instruments, in particular between completion
and termination rights, and between monitoring and discounts. Finally, the evidence on
the comovements of rights assignment, even after controlling for common sources of
variation, is consistent with the hypothesis that the source of variation in the data is the
differential impact of moral hazard for the different brands.
5. CONCLUSION
This paper has studied empirically the entire system of allocation of rights and
monetary incentives in franchising contracts. The system of allocation of rights does not
actually specify the terms of the performance that the parties commit to delivering.
Instead, the contracts substantially restrict the decision rights of dealers, and grant
manufacturers extensive completion and enforcement powers, converting the
manufacturers in a sort of quasi-judiciary instance.
We find that this assignment of rights and incentives is consistent with efficiency
considerations. When the cost of dealer moral hazard is higher and the risk of
manufacturer opportunism is lower as a consequence of his reputation, manufacturers
enjoy larger discretion in both determining the desired performance from the dealers in
their network and in using mechanisms such as monitoring, termination and monetary
incentives to ensure this performance is provided.
The paper has also explored the existence of interdependencies between the different
elements of the system. The use of all instruments seems to respond to the same
considerations, as the same variables influence with the same signs the use of the
different instruments. After controlling for common sources of variation, part of the
covariation disappears, but significant interactions are still observed between
27
instruments. In particular, the results are consistent with the hypothesis that contract
completion and termination rights are complements, and point in the direction of the
monitoring intensity principle, according to which monitoring and incentive intensity
are also complements.
As we have pointed out, an important aspect of the logic of the contractual and
organizational design structure we observe does not conform to the idea of a contract as
a set of vertical restrains usual in the literature (e.g. Mathewson and Winter, 1985).
Instead, the contract design assigns a set of rights to manufacturers that allow them to
behave as an internal judge in what is, after all, a relationship between two
independently-owned business.19
What, in our view, the existing theory fails to consider is the ability of the parties to
choose between the use of internal or external mechanisms of contract completion and
enforcement. The main actors in the economic transactions, the manufacturer and the
dealer in this case, have a remarkable informative advantage with respect to third
parties, judges included. Our evidence suggests that when the party with the better
information reaches a position of impartiality (safeguarded by reputation or expectations
of repeated contracting), the contractors decide that that party should act as a judge of
first instance. As such, the task of this party is to define ex post those obligations that
are hard to define ex ante, fitting the content of the exchange to the changes that have
taken place; distributing unexpected losses and gains; evaluating if each one has
fulfilled or not its obligations; and, even, imposing sanctions for breach of contract.
Our analysis has focused intentionally on examining the logic of these self-
enforcement mechanisms, such as they are articulated in the contracts. This does not
mean that legal and judicial institutions play no role. On the contrary, the contracts are
partly constrained by mandatory rules, and termination decisions are often litigated.
19 A recent survey by Masten (1998) rightly points out this tension: economic theoriesof contracting, for the most part, give little explicit attention to enforcement issues, thepresumption being that the courts will make sure that (subject only to verifiabilityconstraints) that whatever terms contracting parties arrive at are fulfilled.

28
Investigating the effect of these constraints on the contracts is a matter that we plan to
undertake in future, cross country, research.
29
REFERENCES
ARORA, A., and A. GAMBARDELLA (1990), “Complementarity and External
Linkages: the Strategies of the Large Firms in Biotechnology,” Journal of
Industrial Economics, 38: 361-379.
ARROW, K. J. (1985), “The Economics of Agency,” in J.W. Pratt and R. J. Zeckhauser,
eds. Principals and Agents: The Structure of Business, Harvard Business School
Research Colloquium series, Boston: Harvard Business School Press.
ARRUÑADA, B., and L. VÁZQUEZ (1999), “Ownership and Performance in the
Automobile Distribution Industry,” Universitat Pompeu Fabra, Economics
Working Paper, 348.
ATHEY, S., and S. STERN (1998), “An Empirical Framework for Testing Theories
about Complementarity in Organizational Design,” NBER Working Paper.
BHATTACHARYYA, S., and F. LAFONTAINE (1995), “Double-Sided Moral Hazard
and the Nature of Share Contracts,” Rand Journal of Economics, 26: 761-781.
BOURIEROUX, C., A. MONFORT, E. RENAULT, and A. TROGNON (1987),
“Generalized Residuals,” Journal of Econometrics, 34: 5-32.
BRICKLEY, J. A. (1998), “Incentive Conflicts and Contractual Restraints: Evidence
from Franchising,” University of Rochester, Bradley Policy Research Center
Working Paper.
BRICKLEY, J. A., and F. H. DARK (1987), “The Choice of Organizational Form: The
Case of Franchising,” Journal of Financial Economics, 18: 401-420.
BRICKLEY, J. A., F. H. DARK, and M. S. WEISBACH (1991), “The Economic
Effects of Franchise Termination Laws,” Journal of Law and Economics, 34: 101-
132.
CROCKER, K. J., and K. K. REYNOLDS (1993), “The Efficiency of Incomplete
Contracts: an Empirical Analysis of Air Force Engine Procurement,” Rand
Journal of Economics, 24: 126-145.
DICKINSON, J., S. DEMBKOWSKI, and C. SHAH (1998), The Future of Automobile
Distribution, Financial Times Business Ltd., London.
DNES A. W. (1996), “The Economic Analysis of Franchise Contracts,” Journal of
Institutional and Theoretical Economics, 152: 297-324.
30
FREIXAS, X., R. GUESNERIE, and J. TIROLE (1985), “Planning Under Incomplete
Information and the Ratchet Effect,” Review of Economic Studies, 52: 173-192.
GOLDBERG, P. K. (1996), “Dealer Price Discrimination in New Car Purchases:
Evidence from the Consumer Expenditure Survey,” Journal of Political Economy,
104: 622-654.
GOMPERS, P., and J. LERNER (1996), “The Use of Covenants: An Empirical
Analysis of Venture Partnership Agreements,” Journal of Law and Economics,
39: 463-499.
HARRIS, M., and A. RAVIV (1979), “Optimal Incentive Contracts with Imperfect
Information.” Journal of Economic Theory, 20: 231-259.
HOLMSTROM, B. (1979), “Moral Hazard and Observability,” Bell Journal of
Economics, 10: 74-91.
HOLMSTROM, B., and P. MILGROM (1987), “Aggregation and Linearity in the
Provision of Intertemporal Incentives,” Econometrica, 55: 303-328.
HOLMSTROM, B., and P. MILGROM (1994), “The Firm as an Incentive System,”
American Economic Review, 84: 972-991.
ICHNIOWSKI, C., K. SHAW, and G. PRENNUSHI (1997), “The Effects of Human
Resource Management Practices on Productivity,” American Economic Review,
87: 291-313.
JENSEN, M. C., and W. H. MECKLING (1995), “Specific and General Knowledge,
and Organizational Structure,” Journal of Applied Corporate Finance, 8: 2, 4-18.
KAPLAN, S. N., and P. STRÖMBERG (1999), “Financial Contracting Theory Meets
the Real World: An Empirical Analysis of Venture Capital Contracts,” Mimeo,
Graduate School of Business, The University of Chicago.
KLEIN, B. (1980), “Transaction Cost Determinants of ‘Unfair’ Contractual
Arrangements,” American Economic Review Papers and Proceedings, 70: 356-
362.
KLEIN, B. (1995), “The Economics of Franchise Contracts,” Journal of Corporate
Finance: Contracting, Governance and Organization, 2: 9-38.
KLEIN, B. (1996), “Why Hold-ups Occur: The Self-enforcing Range of Contractual
Relations,” Economic Inquiry, 34: 444-463.
KLEIN, B., and K. LEFFLER (1981), “The Role of Market Forces in Assuring
Contractual Performance,” Journal of Political Economy, 89: 615-641.
31
KLEIN, B., and L. F. SAFT (1985), “The Law and Economics of Franchise Tying
Contracts,” Journal of Law and Economics, 28: 345-361.
KLEIN, B., and K. M. MURPHY (1988), “Vertical Restraints as Contract Enforcement
Mechanisms,” Journal of Law and Economics, 31: 265-297.
KLEIN, B., and K. M. MURPHY (1997), “Vertical Integration as a Self-Enforcing
Contractual Arrangement,” American Economic Review; 87: 415-20.
KRUEGER, A. B. (1991), “Ownership, Agency and Wages: An Examination of
Franchising in the Fast Food Industry,” Quarterly Journal of Economics, 106: 75-
101.
LAFONTAINE, F. (1992), “Agency Theory and Franchising: Some Empirical Results,”
Rand Journal Economics, 23: 263-283.
LAFONTAINE, F. (1993), “Contractual Arrangements as Signaling Devices: Evidence
from Franchising,” Journal of Law, Economics, and Organization, 9: 256-289.
LAFONTAINE, F., and K. L. SHAW (1996), “The Dynamics of Franchise Contracting:
Evidence From Panel Data,” NBER Working Paper 5585.
LAFONTAINE, F., and M. E. SLADE (1998), “Incentive Contracting and the Franchise
Decision,” NBER Working Paper 6544.
LAL, R. (1990), “Improving Channel Coordination through Franchising,” Marketing
Science, 9: 299-318.
LUTZ, N. A. (1995), “Ownership Rights and Incentives in Franchising,” Journal of
Corporate Finance: Contracting, Governance and Organization, 2: 56-74.
MASTEN, S.E. (1998), “Contractual Choice,” in B. Boukaert and G. de Geest (eds.),
Encyclopedia of Law & Economics, Edward Elgar, Cheltenham and Northampton.
MASTEN, S. E., and K. J. CROCKER (1985), “Efficient Adaptation in Long-term
Contracts: Take-or-Pay Provisions for Natural Gas,” American Economic Review,
75: 1083-93.
MASTEN, S. E., and E. A. SNYDER (1993), “United States v. United Shoe Machinery
Corporation: On the Merits,” Journal of Law and Economics, 36: 33-70.
MATHEWSON, F., and R. WINTER (1985), “The Economics of Franchise Contracts,”
Journal of Law and Economics, 28: 503-526.
MATHEWSON, F., and R. WINTER (1994), “Territorial Restrictions in Franchising
Contracts” Economic Inquiry, 32: 191-192.
MARVEL, M. (1982), “Exclusive Dealing,” Journal of Law and Economics, 25: 1-25.
32
MINISTERIO DE JUSTICIA E INTERIOR (1995), Anuario Estadístico General de la
DGT, Servicio de Estadística, Madrid.
NORTON, S. (1988), “An Empirical Look at Franchising as an Organizational Form,”
Journal of Business, 61: 197-217.
PASHIGIAN, B. P. (1961), The Distribution of Automobiles, An Economic Analysis of
the Franchise System, Prentice Hall, Englewood Cliffs, NJ.
PRENDERGAST, C. (1999), “The Provision of Incentives in Firms,” Journal of
Economic Literature, 37: 7-64.
REGULATION (EU) 1.475/95 of the Commission, of June 28, 1995 on the application
of Art. 85.3 of the Treaty of the EEC to certain categories agreements for the
service and distribution of automobiles, Official Journal of the European
Communities, 29 June, 1995: 25-34.
RUBIN, P. H. (1978), “The Theory of the Firm and the Structure of Franchise
Contract,” Journal of Law and Economics, 21: 223-233.
SEN, K. C. (1993), “The Use of Initial Fees and Royalties in Business Format
Franchising,” Managerial and Decision Economics, 14: 175-190.
SHEPARD, A. (1993), “Contractual Form, Retail Price, and Asset Characteristics in
Gasoline Retailing,” Rand Journal of Economics, 24: 58-77.
SLOAN, A. P. (1964), My Years with General Motors, McFadden, New York.
SMITH II, R. L. (1982), “Franchise Regulation: An Economic Analysis of State
Restrictions on Automobile Distribution,” Journal of Law and Economics, 25:
125-138.
TELSER, L. (1960), “Why Should Manufacturers Want Fair Trade?,” Journal of Law
and Economics, 3: 86-105.
TELSER, L. (1980), “A Theory of Self-Enforcing Agreements,” Journal of Business,
53: 27-44.
WILLIAMS, D. L. (1996), “Incomplete Contracting and Ex Post Opportunism:
Evidence from Franchise Contract Terminations,” UCLA Working Paper.
WILLIAMSON, O. E. (1975), Markets and Hierarchies: Analysis and Antitrust
Implications, Free Press, New York.
WILLIAMSON O. E. (1979), “Transaction-Cost Economics: The Governance of
Contractual Relations,” Journal of Law and Economics 22: 233-261
33
Table 1. Rights Assigned by Contract to Manufacturers
Contract Clauses Mean
1. Manufacturer ex post completion rights. Contracts in whichManufacturer has the right to determine:
Sales targets 1.00Size and decor of showroom 1.00Publicity investment 1.00Stock of new vehicles 1.00Size and qualification of sales force 1.00Compulsory sales force training 0.65Number of trial vehicles 0.52Machinery and tools 1.00Organization and size of workshop 1.00Size and qualification of after-sale personnel 1.00Compulsory training of after-sale personnel 1.00Quality of spare parts 1.00Stock of spare parts 1.00Minimum operating capital and net worth 0.52Limit sales out of territory a 0.52Set maximum authorized price 1.00Total number of completion rights 14.22
2. Manufacturer monitoring rights:Fulfillment of sales targets 1.00Direct inspections of dealership 1.00Dealer duty to provide accounting data 0.87Right to poll dealer clients 0.74Right to audit dealer accounting 0.52Total number of monitoring rights 4.13
3. Manufacturer termination rights:Repeated breach of sales and service targets 1.00Change in the ownership of the dealership 1.00Bankruptcy of the dealership 1.00Non-payment to the manufacturer 1.00Change of management b 0.83Disagreement among partners or managers 0.61Change of location c 0.61Appointment of liquidator 0.57Court verdict d 0.43False information e 0.35Loss of control f 0.09Dealership closed g 0.09Total number of termination rights 7.57
Notes: a Sales out of dealer territory not allowed. b Includes death or disability ofdealer. c Without manufacturer approval. d Verdict against dealer, partner ormanager of the dealership. e Provision of false information to manufacturer. f
Loss of control of dealership premises. g Dealership closed for period longer thannormal holiday.
34
Table 2. Sales and Service Discounts, 1993-1995
Discounts established by manufacturers for each target
Percent of sales target achieved
Mean discounts actuallyattained by dealers, as %
of price paid.
80% 85% 90% 95% 100% 105% 110% 1993 1994 1995
Maximum salesdiscount 1.5% 2% 2.5% 3% 3.5% 3.5% 3.5%
Minimum salesdiscount 0% 0% 1% 1% 2% 2% 2%
Mean of salesdiscount schedules (*) 0.49% 0.64% 1.51% 1.63% 2.38% 2.40% 2.42% 1.39% 1.63% 1.70%
Percent of service target achieved
70% 75% 80% 85% 90% 95% 100%
Maximum servicediscount 0.7% 0.9375% 1% 1.0625% 1.125% 1.1875% 1.25%
Minimum servicediscount 0% 0% 0.3% 0.325% 0.35% 0.375% 0.4%
Mean of servicediscount schedules (*) 0.18% 0.45% 0.55% 0.59% 0.62% 0.67% 0.73% 0.64% 0.63% 0.65%
(*) Note: Means conditional on existence of positive discount schedule
35
Table 3. Manufacturer Discretion: Ordinary Least Squares Estimates
(Ordinary least squares regressions of a cross-section of contracts)
Independent VariablesDependentVariables Average
Car PriceDealers inNetwork
Log Ageof Network Asia Europe
Intercept Adj. RSq.(N)
0.473** 0.0126* 0.9368** --- --- 8.8133** 0.6963(0.1401) (0.0054) (0.3569) (0.7769) (23)
0.3319* 0.0093* 0.4219 -1.6697** 0.2751 11.4532** 0.8263
CompletionRights
(0.1318) (0.0047) (0.3384) (0.6090) (0.5543) (0.9925) (23)
0.2919** 0.0084** 0.5218* --- --- 0.8825 0.7086(0.0823) (0.0032) (0.2097) (0.4566) (23)
0.2306* 0.0069* 0.3348 -0.6908 0.0589 1.953** 0.7447
MonitoringRights
(0.0958) (0.0034) (0.2461) (0.4430) (0.4032) (0.722) (23)
0.8246** 0.0258** 0.7590 --- --- 0.074 0.6872(0.2037) (0.0078) (0.5188) (1.1294) (23)
0.4762* 0.0164* 0.4115 -3.2702** -0.8506 4.6945** 0.8253
TerminationRights
(0.1893) (0.0068) (0.4861) (0.8750) (0.7963) (1.4259) (23)
1.5894** 0.0468** 2.2176* --- --- 0.7624 0.7624(0.3606) (0.0138) (0.9185) (1.9996) (23)
1.0387** 0.0326** 1.1682 -5.6307** -0.5166 18.1008* 0.8893
TotalNumber ofClausesUsed a
(0.306) (0.0109) (0.7859) (1.4146) (1.2875) (2.3054) (23)
Notes: a Completion, monitoring and termination. * Significant at 5% level; ** Significant at 1% level.
36
Table 4. Manufacturer Discretion: Maximum Likelihood Estimates
(Probit estimation of cross section of contracts data by MLE)
Independent VariablesDependentVariables Average
Car PriceDealers inNetwork
Log Ageof Network Asia Europe
Intercept Pseudo-RSq.(N)
0.2702** 0.0065** 0.2317 --- --- -0.7365** 0.148(0.1163) (0.0028) (0.1678) (0.3711) (368)
0.2463 0.0058 0.0781 -0.3444 0.2592 -0.1421 0.169
CompletionRights
(0.1307) (0.0031) (0.1898) (0.3669) (0.3876) (0.6295) (368)
0.5176** 0.0136** 0.274 --- --- -2.372** 0.312(0.2428) (0.006) (0.2959) (0.7614) (115)
0.5726 0.0141** 0.0752 -0.2100 0.5188 -2.1225 0.337
MonitoringRights
(0.311) (0.0066) (0.336) (0.6867) (0.7957) (1.3118) (115)
0.296** 0.0085** 0.1284 --- --- -1.6067** 0.162(0.0848) (0.0025) (0.152) (0.3346) (253)
0.1934** 0.0061** 0.0703 -0.9405** -0.3960 -0.3298 0.19
TerminationRights
(0.0942) (0.0027) (0.1827) (0.3611) (0.3583) (0.5622) (253)
0.2839** 0.0076** 0.1713 --- --- -1.136** 0.154(0.0626) (0.0017) (0.1) (0.2194) (736)
0.2178** 0.0061** 0.0765 -0.612** -0.1049 -0.2291 0.173
TotalNumber ofClausesUsed a
(0.0679) (0.0018) (0.116) (0.2332) (0.237) (0.3704) (736)
Notes: a Completion, monitoring and termination. * Significant at 5% level; ** Significant at 1% level.
37
Table 5. Variation of Individual Rights(WLS Regressions for probability that right assigned to manufacturer)
Independent VariablesDependentVariables Average
Car PriceDealers inNetwork
Log Age ofNetwork Asia
Intercept R Sq. (N)
1. Manufacturer ex post completion rights:0.0147 -0.0002 0.0434 -0.7663** 0.7490* 0.6652Compulsory Sales
Training (0.0333) (0.0015) (0.1073) (0.2480) (0.4454) (23)
0.0433 0.0011 0.014 -0.6889** 0.4898 0.9070Minimum TrialVehicles (0.0287) (0.0013) (0.0544) (0.1765) (0.3307) (23)
0.0706** 0.0025** 0.0799* -0.4824** 0.0271 0.9662Minimum Capital
(0.0204) (0.0008) (0.0429) (0.1325) (0.2443) (23)
0.0706** 0.0025** 0.0799* -0.4824** 0.0271 0.9662Limit Sales Out ofTerritory (0.0204) (0.0008) (0.0429) (0.1325) (0.2443) (23)
2. Monitoring Rights:0.0075 0.0003 0.0094 -0.3174** 0.9006** 0.3607Provision of
Accounting Data (0.0169) (0.0006) (0.0496) (0.145) (0.2163) (23)
0.0442** 0.0012* 0.1251** -0.3151 0.2122 0.6897Poll Clients (0.0219) (0.0007) (0.0608) (0.1989) (0.3376) (23)
0.0706** 0.0025** 0.0799* -0.4824** 0.0271 0.9662Audit Accounting
(0.0204) (0.0008) (0.0429) (0.1325) (0.2443) (23)
3.Termination Rights:0.0083 0.0002 0.036 -0.4341** 0.8241** 0.5171Change of
Management (0.022) (0.0006) (0.0482) (0.1538) (0.2393) (23)
0.0213 0.0008 0.0089 -0.8648** 0.7452** 0.9805Disagreement (0.0158) (0.0006) (0.032) (0.0929) (0.1773) (23)
0.0479 0.0015 0.0911 -0.5022** 0.2469 0.8790Change of Location (0.0299) (0.0013) (0.0784) (0.2264) (0.3711) (23)
0.0351 0.0016* 0.0052 -0.7496** 0.5569** 0.9639Liquidation (0.0279) (0.0009) (0.0408) (0.1295) (0.2446) (23)
0.1304** 0.0047** 0.0431 -0.1091 -0.5627** 0.9104Court Verdict (0.0169) (0.0009) (0.0557) (0.0847) (0.1513) (23)
0.1397** 0.0045** -0.0304 -0.0828 -0.4681** 0.9000False Information
(0.0157) (0.001) (0.0471) (0.0757) (0.1462) (23)
0.0025 0.0012 -0.0142 -0.0289 -0.0313 0.1537Loss of Control
(0.0143) (0.0008) (0.0476) (0.0751) (0.186) (23)
0.0732** 0.0011 -0.0376 -0.0162 -0.157 0.3159Dealership Closed
(0.0263) (0.0008) (0.0358) (0.0536) (0.1153) (23)
Notes: Estimated by Weighted Least Squares * Significant at 5% level. ** Significant at 1% level.
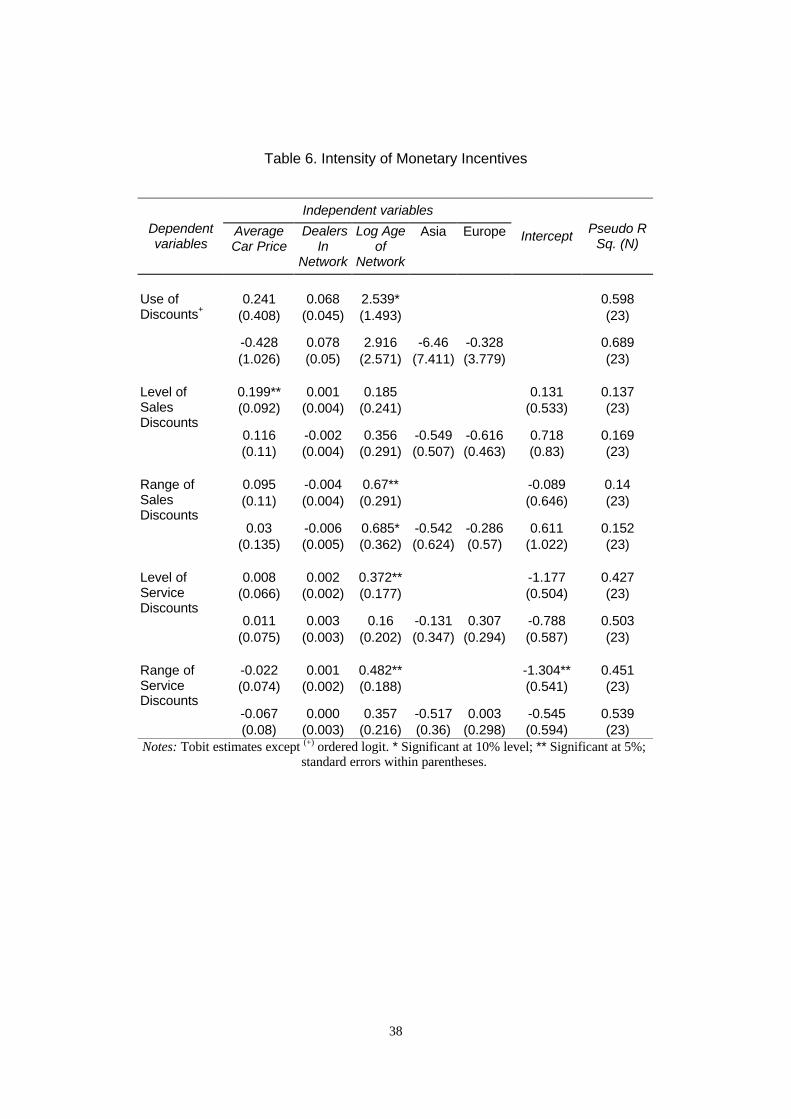
38
Table 6. Intensity of Monetary Incentives
Independent variablesDependentvariables
AverageCar Price
DealersIn
Network
Log Ageof
Network
Asia Europe Intercept Pseudo RSq. (N)
0.241 0.068 2.539* 0.598(0.408) (0.045) (1.493) (23)
-0.428 0.078 2.916 -6.46 -0.328 0.689
Use ofDiscounts+
(1.026) (0.05) (2.571) (7.411) (3.779) (23)
0.199** 0.001 0.185 0.131 0.137(0.092) (0.004) (0.241) (0.533) (23)
0.116 -0.002 0.356 -0.549 -0.616 0.718 0.169
Level ofSalesDiscounts
(0.11) (0.004) (0.291) (0.507) (0.463) (0.83) (23)
0.095 -0.004 0.67** -0.089 0.14(0.11) (0.004) (0.291) (0.646) (23)
0.03 -0.006 0.685* -0.542 -0.286 0.611 0.152
Range ofSalesDiscounts
(0.135) (0.005) (0.362) (0.624) (0.57) (1.022) (23)
0.008 0.002 0.372** -1.177 0.427(0.066) (0.002) (0.177) (0.504) (23)
0.011 0.003 0.16 -0.131 0.307 -0.788 0.503
Level ofServiceDiscounts
(0.075) (0.003) (0.202) (0.347) (0.294) (0.587) (23)
-0.022 0.001 0.482** -1.304** 0.451(0.074) (0.002) (0.188) (0.541) (23)
-0.067 0.000 0.357 -0.517 0.003 -0.545 0.539
Range ofServiceDiscounts
(0.08) (0.003) (0.216) (0.36) (0.298) (0.594) (23)Notes: Tobit estimates except (+) ordered logit. * Significant at 10% level; ** Significant at 5%;
standard errors within parentheses.
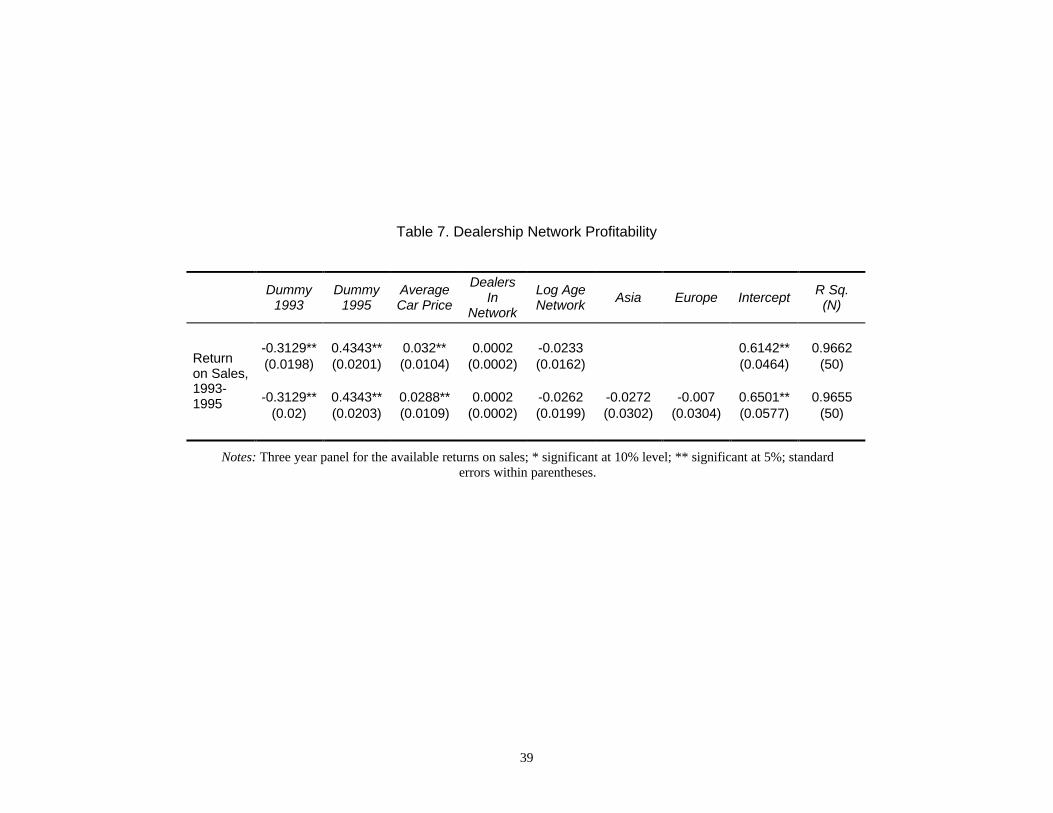
39
Table 7. Dealership Network Profitability
Dummy1993
Dummy1995
AverageCar Price
DealersIn
Network
Log AgeNetwork Asia Europe Intercept R Sq.
(N)
-0.3129** 0.4343** 0.032** 0.0002 -0.0233 0.6142** 0.9662(0.0198) (0.0201) (0.0104) (0.0002) (0.0162) (0.0464) (50)
-0.3129** 0.4343** 0.0288** 0.0002 -0.0262 -0.0272 -0.007 0.6501** 0.9655
Returnon Sales,1993-1995
(0.02) (0.0203) (0.0109) (0.0002) (0.0199) (0.0302) (0.0304) (0.0577) (50)
Notes: Three year panel for the available returns on sales; * significant at 10% level; ** significant at 5%; standarderrors within parentheses.
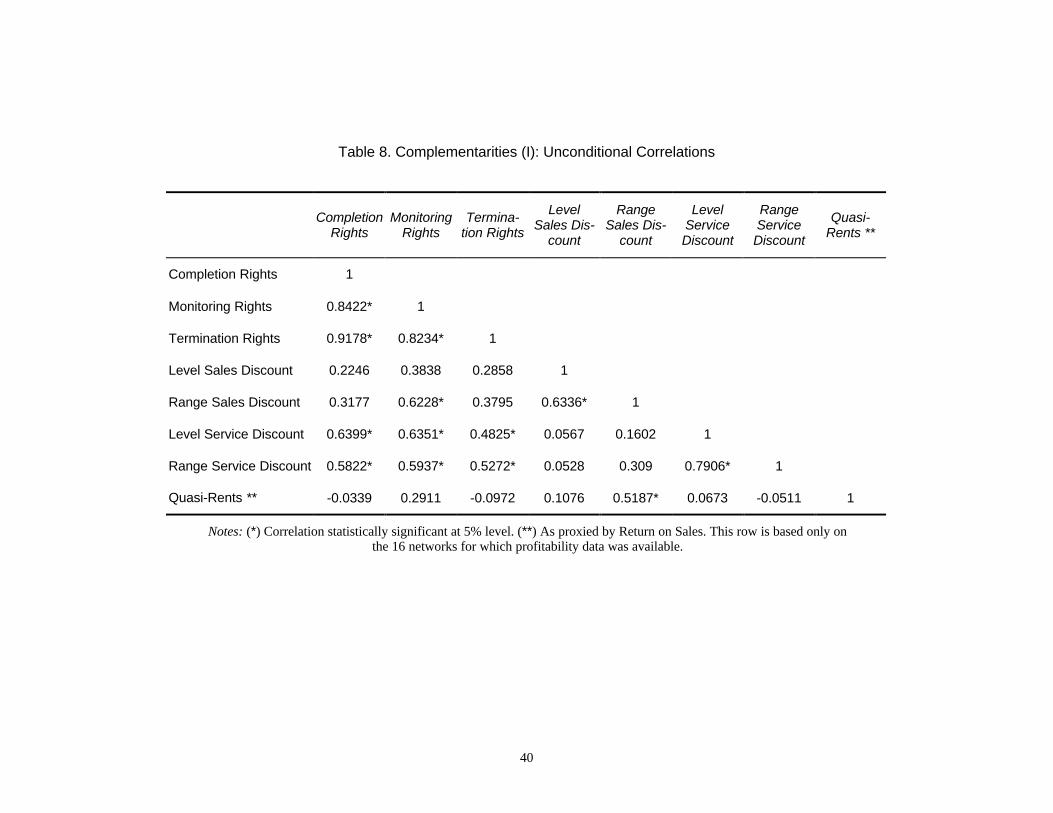
40
Table 8. Complementarities (I): Unconditional Correlations
CompletionRights
MonitoringRights
Termina-tion Rights
LevelSales Dis-
count
RangeSales Dis-
count
LevelServiceDiscount
RangeServiceDiscount
Quasi-Rents **
Completion Rights 1
Monitoring Rights 0.8422* 1
Termination Rights 0.9178* 0.8234* 1
Level Sales Discount 0.2246 0.3838 0.2858 1
Range Sales Discount 0.3177 0.6228* 0.3795 0.6336* 1
Level Service Discount 0.6399* 0.6351* 0.4825* 0.0567 0.1602 1
Range Service Discount 0.5822* 0.5937* 0.5272* 0.0528 0.309 0.7906* 1
Quasi-Rents ** -0.0339 0.2911 -0.0972 0.1076 0.5187* 0.0673 -0.0511 1
Notes: (*) Correlation statistically significant at 5% level. (**) As proxied by Return on Sales. This row is based only onthe 16 networks for which profitability data was available.
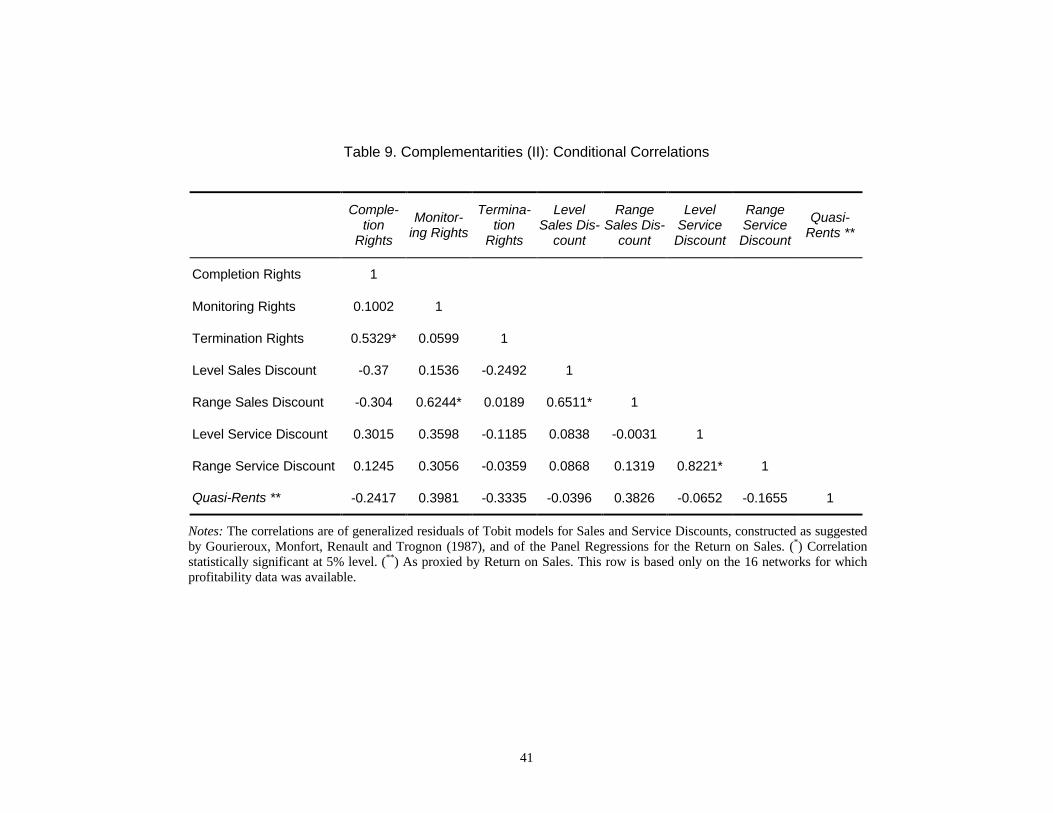
41
Table 9. Complementarities (II): Conditional Correlations
Comple-tion
Rights
Monitor-ing Rights
Termina-tion
Rights
LevelSales Dis-
count
RangeSales Dis-
count
LevelServiceDiscount
RangeServiceDiscount
Quasi-Rents **
Completion Rights 1
Monitoring Rights 0.1002 1
Termination Rights 0.5329* 0.0599 1
Level Sales Discount -0.37 0.1536 -0.2492 1
Range Sales Discount -0.304 0.6244* 0.0189 0.6511* 1
Level Service Discount 0.3015 0.3598 -0.1185 0.0838 -0.0031 1
Range Service Discount 0.1245 0.3056 -0.0359 0.0868 0.1319 0.8221* 1
Quasi-Rents ** -0.2417 0.3981 -0.3335 -0.0396 0.3826 -0.0652 -0.1655 1
Notes: The correlations are of generalized residuals of Tobit models for Sales and Service Discounts, constructed as suggestedby Gourieroux, Monfort, Renault and Trognon (1987), and of the Panel Regressions for the Return on Sales. (*) Correlationstatistically significant at 5% level. (**) As proxied by Return on Sales. This row is based only on the 16 networks for whichprofitability data was available.
42
APPENDIX: DATA SOURCES
The analysis included the contracts of Alfa Romeo, Audi, BMW, Chrysler, Citröen,
Daewoo, Fiat, Ford, Honda, Hyundai, Jaguar, Lancia, Mazda, Mercedes, Mitsubishi,
Nissan, Opel, Peugeot, Renault, Rover, Seat, Skoda, Suzuki, Toyota, Volkswagen y Volvo.
These manufacturers produced in 1994 99.3% of the total number of automobiles sold in
Spain. (Ministerio de Justicia e Interior, 1995).We complemented these contracts with 48
in-depth interviews with experts in the sector. Among these experts were the general
secretaries of the trade group of manufacturers and of dealers, ANFAC and FACONAUTO
respectively; 23 franchisees of different brands; and 23 managers of the distribution
networks of the manufacturers.
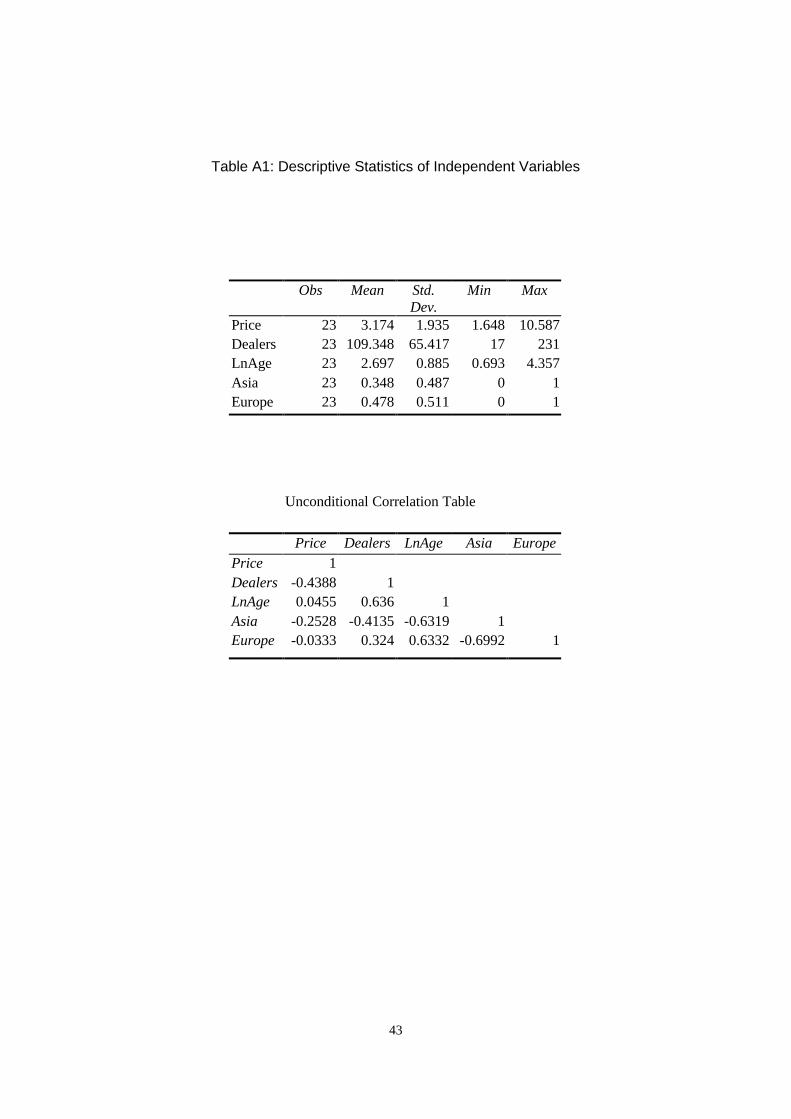
43
Table A1: Descriptive Statistics of Independent Variables
Obs Mean Std.Dev.
Min Max
Price 23 3.174 1.935 1.648 10.587Dealers 23 109.348 65.417 17 231LnAge 23 2.697 0.885 0.693 4.357Asia 23 0.348 0.487 0 1Europe 23 0.478 0.511 0 1
Unconditional Correlation Table
Price Dealers LnAge Asia EuropePrice 1Dealers -0.4388 1LnAge 0.0455 0.636 1Asia -0.2528 -0.4135 -0.6319 1Europe -0.0333 0.324 0.6332 -0.6992 1
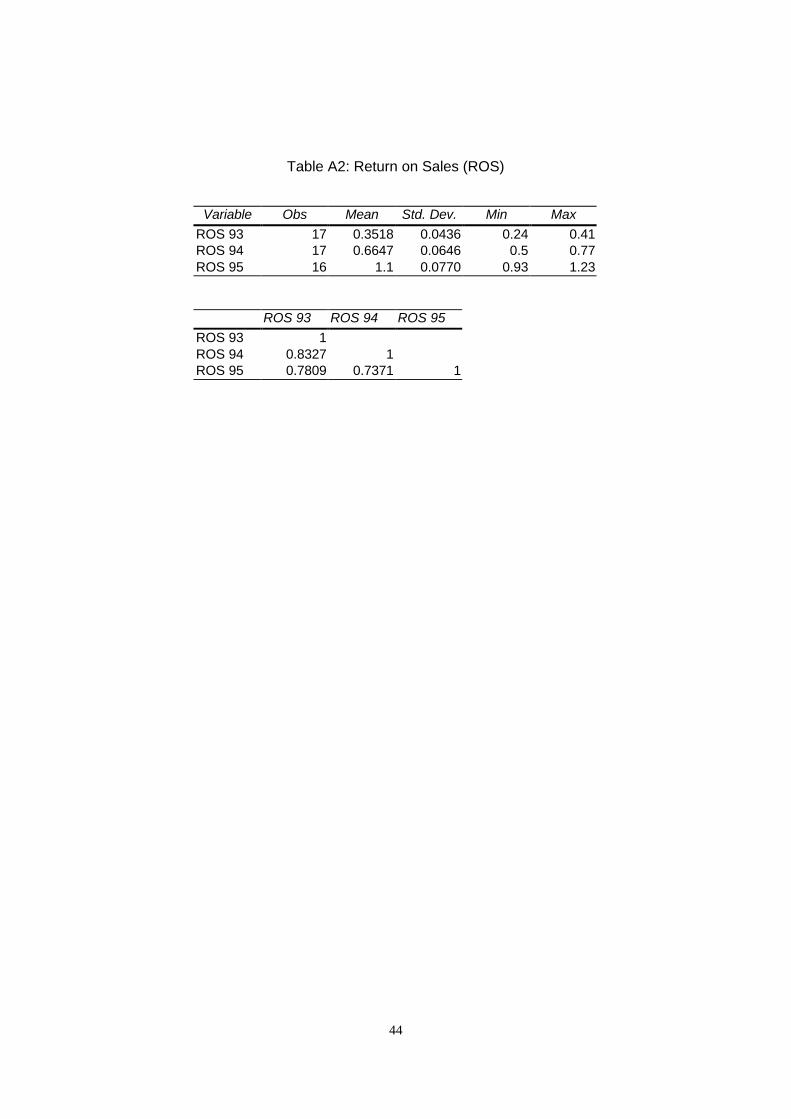
44
Table A2: Return on Sales (ROS)
Variable Obs Mean Std. Dev. Min Max
ROS 93 17 0.3518 0.0436 0.24 0.41ROS 94 17 0.6647 0.0646 0.5 0.77ROS 95 16 1.1 0.0770 0.93 1.23
ROS 93 ROS 94 ROS 95
ROS 93 1ROS 94 0.8327 1ROS 95 0.7809 0.7371 1