Rate Matrices for Analyzing Large Families of Protein Sequences
19
JOURNAL OF COMPUTATIONAL BIOLOGY Volume 8, Number 4, 2001 Mary Ann Liebert, Inc. Pp. 381–399 Rate Matrices for Analyzing Large Families of Protein Sequences C. DEVAUCHELLE, 1 A. GROSSMANN, 1;2 A. HÉNAUT, 1 M. HOLSCHNEIDER, 3 M. MONNEROT, 4 J.L. RISLER, 1 and B. TORRÉSANI 5 ABSTRACT We propose and study a new approach for the analysis of families of protein sequences. This method is related to the LogDet distances used in phylogenetic reconstructions; it can be viewed as an attempt to embed these distances into a multidimensional framework. The proposed method starts by associating a Markov matrix to each pairwise alignment deduced from a given multiple alignment. The central objects under consideration here are matrix-valued logarithms L of these Markov matrices, which exist under conditions that are compatible with fairly large divergence between the sequences. These logarithms allow us to compare data from a family of aligned proteins with simple models (in particular, continuous reversible Markov models) and to test the adequacy of such models. If one neglects uctuations arising from the nite length of sequences, any continuous reversible Markov model with a single rate matrix Q over an arbitrary tree predicts that all the observed matrices L are multiples of Q. Our method exploits this fact, without relying on any tree estimation. We test this prediction on a family of proteins encoded by the mitochondrial genome of 26 multicellular animals, which include vertebrates, arthropods, echinoderms, molluscs, and nematodes. A principal component analysis of the observed matrices L shows that a single rate model can be used as a rough approximation to the data, but that systematic deviations from any such model are unmistakable and related to the evolutionary history of the species under consideration. Key words: protein evolution, rate matrices, LogDet distances, mitochondrial evolution. 1. INTRODUCTION W e develop in this paper a new approach for analyzing large families of protein sequences. The proposed method is based upon the comparison of the Markov matrices associated with the pairwise 1 Laboratoire Génome et Informatique, Tour Evry2, Evry, France. 2 Centre de Physique Théorique, CNRS Luminy, Marseille, France. 3 Géoscience, Campus de Beaulieu, Université de Rennes 1, Rennes, France. 4 Centre de Génétique Moléculaire, CNRS Gif-sur-Yvette, France. 5 Laboratoire d’Analyse, Topologie et Probabilités, CMI, Université de Provence, Marseille, France. 381
-
Upload
univ-provence -
Category
Documents
-
view
2 -
download
0
Transcript of Rate Matrices for Analyzing Large Families of Protein Sequences
JOURNAL OF COMPUTATIONAL BIOLOGYVolume 8, Number 4, 2001Mary Ann Liebert, Inc.Pp. 381–399
Rate Matrices for Analyzing Large Families ofProtein Sequences
C. DEVAUCHELLE,1 A. GROSSMANN,1;2 A. HÉNAUT,1 M. HOLSCHNEIDER,3
M. MONNEROT,4 J.L. RISLER,1 and B. TORRÉSANI5
ABSTRACT
We propose and study a new approach for the analysis of families of protein sequences.This method is related to the LogDet distances used in phylogenetic reconstructions; it canbe viewed as an attempt to embed these distances into a multidimensional framework.The proposed method starts by associating a Markov matrix to each pairwise alignmentdeduced from a given multiple alignment. The central objects under consideration here arematrix-valued logarithms L of these Markov matrices, which exist under conditions thatare compatible with fairly large divergence between the sequences. These logarithms allowus to compare data from a family of aligned proteins with simple models (in particular,continuous reversible Markov models) and to test the adequacy of such models. If oneneglects � uctuations arising from the � nite length of sequences, any continuous reversibleMarkov model with a single rate matrix Q over an arbitrary tree predicts that all theobserved matrices L are multiples of Q. Our method exploits this fact, without relyingon any tree estimation. We test this prediction on a family of proteins encoded by themitochondrial genome of 26 multicellular animals, which include vertebrates, arthropods,echinoderms, molluscs, and nematodes. A principal component analysis of the observedmatrices L shows that a single rate model can be used as a rough approximation to thedata, but that systematic deviations from any such model are unmistakable and related tothe evolutionary history of the species under consideration.
Key words: protein evolution, rate matrices, LogDet distances, mitochondrial evolution.
1. INTRODUCTION
We develop in this paper a new approach for analyzing large families of protein sequences. Theproposed method is based upon the comparison of the Markov matrices associated with the pairwise
1Laboratoire Génome et Informatique, Tour Evry2, Evry, France.2Centre de Physique Théorique, CNRS Luminy, Marseille, France.3Géoscience, Campus de Beaulieu, Université de Rennes 1, Rennes, France.4Centre de Génétique Moléculaire, CNRS Gif-sur-Yvette, France.5Laboratoire d’Analyse, Topologie et Probabilités, CMI, Université de Provence, Marseille, France.
381
382 DEVAUCHELLE ET AL.
alignments of the sequences under consideration and allows us to analyze their compatibility with standardMarkov models.
The use of Markov chain models (which was at least implicit in the early work of Dayhoff and col-laborators [Dayhoff et al., 1972; Dayhoff et al., 1983]) was advocated by many authors in the context ofthe construction of phylogenetic trees from DNA sequences. Among them, let us quote Felsenstein (1981)and Tavaré (1986) and refer to Chapter 11 of Hillis et al. (1996) for a systematic account of the mostsigni� cant contributions. Let us also mention Müller and Vingron (2000) for a different approach, whichbears similarities with the techniques presented in this paper.
The aim of this approach is to provide a probabilistic evolution model describing a family of aligned se-quences (a multiple alignment). All sites of the sequences are treated as independent, identically distributed,random variables (see, for example, Steel [1995] and Tavaré [1986] for a discussion of the consequencesof such assumptions). In its most general form, Felsenstein’s model is based on two ingredients: a (rooted)tree, whose leaves are the considered sequences, and a family of stochastic matrices (see below for ade� nition) associated with the branches of the tree. Along each branch of the tree, a sequence is supposedto undergo an evolution governed by a Markov chain. At each node, a sequence gives rise to two differentsequences, each one continuing with its own Markov chain evolution.
These ingredients (the parameters of the model) are suf� cient to compute probabilities of all possiblemultiple alignments. The practical problem is the estimation: infer the values of the parameters from dataat hand. Felsenstein’s method is a standard maximum likelihood approach: the likelihood function (i.e.,the probability of the multiple alignment under consideration), which depends upon the parameters ofthe model, is maximized. The parameters which realize the maximum of the likelihood function are themaximum likelihood estimators and may be used for further studies. In the case of a Markov chain on atree, the parameters are the stochastic matrices and the topology of the tree.
The maximization, which is to be performed numerically, turns out to become a dif� cult problem forlarge families of sequences, and some simpli� cations are often made (see, however, Barry and Hartigan[1987] for a general discussion of “parameter rich” models). In addition, the comparison of likelihoods fordifferent tree topologies may be dif� cult (see the discussion by Adachi and Hasegawa [1992]).
The most common simpli� cation amounts to the assumption that all the stochastic matrices associatedto the branches of the tree are powers P¿ of a single stochastic matrix P, associated to some “universal”Markov chain. With such a simpli� cation, the complexity of the model and of the estimation problem isreduced considerably: for a given tree topology, the remaining parameters are now the matrix P (a 20 £ 20matrix in the case of proteins) and the exponents ¿ of all the branches, interpreted as time parameters (the“ages” of the branches). However, even with such simpli� cations, the estimation problem is still dif� cultto solve for large families (say, for families of more than 20 sequences).
A further simpli� cation consists in assuming that the Markov chain is “reversible,” which again reducesby a factor of two the number of parameters to be estimated and allows a direct connection between dataand model parameters. For this and other reasons, all models of sequence evolution used in the analysisof data—including the formalizations of Dayhoff’s pioneering work on protein sequences (Dayhoff et al.,1983)—are, as far as we know, continuous reversible single-generator Markov models.
As a preliminary to parameter estimation, one may ask to what extent the alignment data can berepresented by any continuous reversible single-generator Markov models, i.e., whether there exists sucha model that describes the data to some given degree of approximation. This is the main topic of thispaper. We develop a method which yields estimators for the parameters of continuous reversible singlegenerator Markov models when such models provide a reasonable description of alignment data andwhich gives indications of the departure from such models in the opposite case. Our method involvesa transformation of the data into a form in which an underlying continuous reversible single-generatorMarkov model is immediately apparent. While some of the machinery may be a bit involved, the basicidea is not more complicated than the use of a logarithmic scale to help determine half-lives in radioactivedecay measurements.
Starting with a multiple alignment, we consider all the pairwise alignments deduced from it. For eachalignment of two sequences x and y (denoted generically by “(x; y)”), we estimate a stochastic matrixP.x;y/ using maximum likelihood methods (which reduce in that case to simple countings). In the case ofa reversible model, all such matrices P.x;y/ provide estimates for powers P¿.x;y/ of some “universal matrix”P. And their matrix logarithms (when they exist) log P.x;y/ provide estimates for multiples ¿.x;y/Q of a
RATE MATRICES FOR ANALYZING PROTEIN SEQUENCES 383
unique matrix Q D log P called the rate matrix of the model. A linear regression (which in this caseis performed via a principal components analysis) yields estimates for the parameters ¿.x;y/ and the ratematrix Q.
Because we desire to study the adequacy of single-generator models, we do not systematically usesymmetric counting procedures: the alignments .x; y/ and .y; x/ may thus yield signi� cantly differentmatrices P.x;y/ and P.y;x/ , which is a sign of departure from the single generator situation.
Not every matrix has a logarithm, and the “logarithmability” condition will play an important role inthis paper as a restriction on the alignments that can be handled by our method. This restriction willmean, in practice, that the observed Markov matrices associated to pairwise alignments should be nottoo far from the identity. Such a restriction is apparently similar to the “one mutation” requirement madefor the construction of PAM matrices (Dayhoff et al., 1983). At this point, we should stress that theexact “logarithmability” condition, to be introduced below, is much less restrictive than the “one-mutation”requirement. In fact, the transition to logarithms incorporates the possibility of arbitrarily many mutationsat a given site, as long as they do not overwhelm the overall picture. In our experience, the breakdown of“logarithmability” is not far from the point where the alignments themselves become questionable.
Thanks to the fact that we only consider pairwise alignments, we do not have to dig into the problemof tree estimation. This is a drastic simpli� cation. The parameters ¿.x;y/ may be interpreted as “distances”between the sequences, very much in the spirit of the LogDet distances (Lockhart et al., 1994; Steel, 1995;Lake, 1994). Such distances may in turn be used for estimating a tree. However, such a tree need not becompletely consistent with the underlying model.
As a byproduct, our method also yields graphical representations for the alignments (namely, the projec-tion of the matrices from the 400-dimensional space onto the planes corresponding to the top eigenvectorsin the principal components analysis), which helps in testing the homogeneity of the family of sequencesunder consideration.
2. METHODS
2.1. From count matrices to logarithms of stochastic matrices: The nonsymetric case
Our starting point is a multiple alignment of “suf� ciently related” sequences (the criterion for “suf� -cient relatedness” is introduced below). However, we limit our investigations to the analysis of all pairsof sequences in the multiple alignment, i.e., pairwise alignments, which will be the main object underconsideration in this paper. In contrast to maximum likelihood methods (Adachi and Hasegawa, 1992;Felsenstein, 1981), we do not take into account multiple alignment information contained in columns ofthe multiple alignment.
As usual, we model a protein sequence as a sequence of letters in a � nite alphabet of size m (m D 20in our case). All the sites in the sequence are considered independent and identically distributed and aretherefore treated in the same way. Notice that we do not impose restrictions on the sites of the sequences tobe considered. Given an ordered pair of sequences (x; y) in the multiple alignment under consideration, thesites containing an indel are removed from the pairwise alignment (but not from the multiple alignment).
Given an ordered pair (x; y) of aligned sequences, we � rst consider the count matrix, denoted byC.x;y/ D fC.x;y/
ij ; i; j D 1; : : : mg. Its elements are the numbers of pairs of amino acids in the alignment:
C.x;y/ij D number of sites k where amino acid x.k/ D i and y.k/ D j : (1)
From C.x;y/ , we obtain the vectors of occurrences C.x/:
C.x/i D number of sites k where x.k/ D i: (2)
The entries of C.x;y/ and C.x/ are nonnegative integers. From these quantities, we obtain the vector offrequencies ¼ .x/ D .¼
.x/1 ; : : : ¼
.x/m ) de� ned by ¼
.x/i D C
.x/i =c.x;y/ , where c.x;y/ D
Pmi;jD1 C
.x;y/ij is the
length of the pairwise alignment (x; y). Notice that because of possible insertions–deletions, the vector of
384 DEVAUCHELLE ET AL.
frequencies ¼ .x/ of the sequence x also depends on the sequence y (for the sake of simplicity we do notintroduce a speci� c notation for that).
Finally, we also consider the matrices F.x;y/ D fF .x;y/ij ; i; j D 1; : : : mg, de� ned by
F.x;y/ D1
c.x;y/C.x;y/; (3)
and the diagonal matrices of frequencies
.x/YD diag.¼ .x//: (4)
By construction, F.x;y/ satis� esPm
i;jD1 F.x;y/ij D 1.
We shall limit ourselves here to sequences in which all amino acids are signi� cantly represented.Therefore, all the frequencies ¼
.x/i may be assumed to be nonzero; i.e., the matrices
Q.x/ are nonsingular.
We may then consider the matrix P.x;y/ DQ.x/¡1
F.x;y/ de� ned by its matrix elements
P.x;y/ij D
F.x;y/ij
¼.x/i
: (5)
Remark 1. P.x;y/ is clearly a stochastic matrix; i.e., its elements satisfy 0 · P.x;y/ij · 1 for all i, j ,
and its rows sum to unity:Pm
jD1 P.x;y/ij D 1 for all i D 1; : : : m.
It is well known that if the multiple alignments were generated using a continuous reversible Markovmodel on a binary tree, and if the lengths of the sequences are large enough, as described by Felsenstein(1981), all the matrices P.x;y/ should be close to the powers P
¿.x;y/
0 of a unique stochastic matrix P0 D eQ0 ,where Q0 is a rate matrix (see Appendix A for a de� nition). Then the question arises whether the familyof matrices P.x;y/ under consideration is compatible with such a model, up to � uctuations.
A stochastic matrix M, which may be written in the form M D eQ where Q is a rate matrix, is saidto be embeddable (see Appendix A for more details). The problem we address here is in some sensemore complex, as we want to study whether a family of stochastic matrices is jointly embeddable, in thesense that it belongs to a one-parameter continuous family e¿ Q of stochastic matrices. However, since thematrices under consideration are estimated from data, embeddability is not required in a strict sense, asstatistical � uctuations have to be taken into account.
We propose to consider the matrix logarithms of the matrices P.x;y/ . The logarithm of a matrix isformally de� ned via an in� nite power series expansion
log P D1X
kD1
.¡1/kC1
k.P ¡ 1/k : (6)
For the sake of the present discussion, it is enough to know that the expansion converges1 and may becomputed numerically as soon as the matrix P is “close enough” to the identity matrix in the followingsense: there exists a positive integer n such that
k.P ¡ 1/nk2 < 1; (7)
1The series (6) corresponds to well-known expansion for the logarithm of a number. It should be noticed, however,that the numerical series for log(x) cannot be absolutely convergent if jx ¡ 1j > 1, while the matrix series (6) canvery well converge if kP ¡ 1k2 > 1. This is because jxyj D jxjjyj for numbers, while in the case of matrices,kABk2 · kAk2kBk2, the equality is an exception.
RATE MATRICES FOR ANALYZING PROTEIN SEQUENCES 385
where 1 is the identity matrix, and the norm kMk2 of a matrix M is the square root of the sum of squares
of matrix elements of M: kMk2 DqPm
i;jD1 M2ij .
Notice that the matrix logarithm does not satisfy all the usual properties of the numerical logarithm: ingeneral, log P1P2 6D logP1 C logP2. However, the relation
log P¿ D ¿ log P
is preserved.This suggests the following de� nition.
De� nition 1. If two sequences x; y in a pairwise alignment are such that the corresponding matricesP.x;y/ and P.y;x/ admit a logarithm
L.x;y/ D logP.x;y/; L.y;x/ D log P.y;x/ (8)
we will say that x and y are suf� ciently related. Then L.x;y/ and L.y;x/ satisfy
P.x;y/ D eL.x;y/
; P.y;x/ D eL.y;x/
: (9)
According to condition (7), a suf� cient condition for x and y to be suf� ciently related is that both P.x;y/
and P.y;x/ are “close enough to the identity matrix”: there exists n 2 ZC such that
k.P.x;y/ ¡ 1/nk2 < 1: (10)
In terms of the sequences x and y under consideration, this simply means that the two sequences have notdiverged too much.
An important property is that whenever the matrix logarithms L.x;y/ are well de� ned, they are byconstruction pseudo rate matrices in the sense of Appendix A. However, they need not be rate matrices,as their off-diagonal elements are not necessarily nonnegative.
Remark 2. Notice that the estimation procedure we use here is nonsymetric: the matrices C.x;y/ andC.y;x/ constructed as in (1) need not be equal. This choice is justi� ed by the fact that these two matrices arein some cases signi� cantly different, which gives useful information about the data under consideration.This is especially true in situations where the amino acid compositions of the sequences x and y aresigni� cantly different: in such cases, one could hardly justify symmetrization.
Let us stress that this does by no means suppose that one of the sequences is an ancestor of the otherone. As we shall see later, a symmetrized counting procedure is fully justi� ed in a framework of parameterestimation for single generator reversible Markov chain models, but this is no longer true as soon asone expects departures from such models (departure from reversibility, or from the “single generator”assumption, or from both : : :).
The comparison of the matrices L.x;y/ and L.y;x/ for a given pair .x; y/ is an interesting issue, as it mayemphasize signi� cant departure from simple models. However, when different pairs are to be compared,one ends up with four a priori different matrices. It is generally simpler in such situations to consider the
average matrices L.x;y/
, de� ned by
L.x;y/ D 1
2.L.x;y/ C L.y;x//: (11)
This has the advantage of associating a single matrix to each alignment and of simplifying the analysis.This is the choice we have made in the numerical results presented in this paper. A more systematicanalysis of quartets of matrices associated to pairs of alignments will be described elsewhere.
386 DEVAUCHELLE ET AL.
2.2. Symmetrized counts
It is a common practice (see, for example, Dayhoff et al. [1972] or Müller and Vingron [2000]) to usesymmetrical count matrices: the matrices F.x;y/ are then constrained to be symmetric. Such a property,which may be justi� ed theoretically in the framework of reversible Markov chains models and practicallyfor some speci� c families of sequences, has also the advantage of simplifying considerably the numericalwork. We brie� y sketch here the main modi� cations needed for “symmetrization” and generically usematrices with “tilda” (i.e., QM instead of M) to distinguish the symmetrized versions.
The F.x;y/ matrices are replaced with QF.x;y/, de� ned by
QF .x;y/ij D #fk : x.k/ D i and y.k/ D j; or x.k/ D j and y.k/ D ig
2c.x;y/; (12)
where c.x;y/ is again the length of the alignment (x; y) and the symbol #S stands for the cardinality of theset S. Symmetrized amino acid frequencies may also be introduced, by de� ning
Q¼ .x;y/i D #fk : x.k/ D i or y.k/ D ig
2c.x;y/(13)
and introducing the matrix QQ.x;y/ D diag. Q¼ .x;y/i /, i.e., the matrix whose nondiagonal elements vanish and
whose diagonal coincides with the frequencies Q¼ .x;y/1 ; : : : Q¼ .x;y/
m . The corresponding P and L matrices read
QP.x;y/ D±
QQ.x;y/²¡1 QF.x;y/; QL.x;y/ D log QP.x;y/ : (14)
As was stressed before, such a symmetrized version is more natural if one thinks in terms of reversibleMarkov evolution. It is also fairly interesting from a more mathematical point of view, as it may be shownthat the QP matrices are symmetrizable, which makes most practical issues much simpler. Those aspects aredescribed in some details in Appendix B.1.
We shall limit our analysis here to pairs of sequences which satisfy the following “closeness” condition:
De� nition 2. Two sequences (x; y) are suf� ciently close when the corresponding matrix QF.x;y/ ispositive de� nite, i.e., has positive eigenvalues (we recall that QF.x;y/ is symmetric by construction).
Remark 3. Roughly speaking, a positive de� nite matrix is a symmetric matrix whose diagonal elementsare positive and “dominant.” In particular, if QF.x;y/ is positive de� nite, the matrix QQ.x;y/ is nonsingularand QP.x;y/ is well de� ned.
It follows from the discussion in Appendix B.1 that, given two suf� ciently close sequences, the logarithmsQL.x;y/ and QL.y;x/ of QP.x;y/ and QP.y;x/ are well de� ned thanks to equation (24), and then x and y aresuf� ciently related. Also, the corresponding QL matrices are pseudo rate matrices, as de� ned in Appendix A.
Given two suf� ciently close sequences, the corresponding matrix P.x;y/ is generally not embeddable.However, the following remarkable “weak embeddability” result states that, given a matrix QP D QP.x;y/, itspowers QP¿ for ¿ large enough are stochastic matrices:
Corollary 1. Let x; y be two suf� ciently close sequences. There exists a real number ¿0 such that, forall ¿ ¸ ¿0, the matrix . QP.x;y//¿ is a stochastic matrix.
This result is an immediate consequence of Proposition 1, which is proved in Appendix B.2. It hasimportant practical implications when it comes to comparing different matrices QP.x;y/ , as we shall see inSection 2.4.
Remark 4. This result is valid for the matrices QP.x;y/ obtained by the symmetrized counting procedure.Our numerical results suggest a similar behavior in the case of the matrices P.x;y/. We do not have a proofin the latter situation.
RATE MATRICES FOR ANALYZING PROTEIN SEQUENCES 387
2.3. Quantities proportional to “divergence”
We now address the problem of comparing suf� ciently related sequences and, therefore, the correspond-ing matrices P.x;y/ and L.x;y/. We consider a set of p pairwise alignments (x; y) of suf� ciently relatedsequences (in the sense of De� nition 1). To each pair (x; y) of sequences is associated a family of matricesF.x;y/; P.x;y/; L.x;y/; : : : ; which we would like to compare. We shall focus in particular on the L.x;y/
matrices. The simplest models suggest that the matrices L.x;y/ should be multiple of a unique matrix Q(up to � uctuations). Q is a pseudo-rate matrix and need not be a rate matrix (the de� nitions of rate andpseudo-rate matrices are given in Appendix A; suf� cient conditions for the L.x;y/ matrices to be ratematrices are discussed in Appendix B.2).
The analysis of the family of matrices L.x;y/ provides a simple way to test such simple models. Thematrices L.x;y/ may in fact be viewed as vectors in an m2 D 400-dimensional space (actually a subspaceof smaller dimension if the properties of L.x;y/ are taken into account). The parameters, i.e., the familyof “ages” ¿.x;y/ of the alignments and the rate matrix Q, may be estimated using linear regression (seealso Müller and Vingron [2000], where a maximum likelihood estimation procedure is discussed). Let usdenote globally by 2 the parameter set (the ages and the rate matrice). The problem
min2
X
.x;y/
kL.x;y/ ¡ ¿.x;y/Qk22
yields the equation
Q D 1
kQk22
P.x;y/ ¿ 2
.x;y/
X
.x;y/
hQ; L.x;y/iL.x;y/; (15)
where the norm k:k2 and the scalar product h:; :i in the space of matrices are de� ned by
hM; M0i DX
i;j
Mij M 0ij ; kMk D
sX
i;j
M2ij :
The solution is not unique (we recall that the ages ¿.x;y/ and the rate matrix Q are de� ned up to amultiplicative constant). Equation (15) states that Q is an eigenvector of the linear mapping
M !X
.x;y/
hM; L.x;y/iL.x;y/;
with eigenvalue (the top eigenvalue in fact) kQk2P
.x;y/ ¿ 2.x;y/ . We shall come back to that linear mapping
later on.In the data that we have analyzed, the L.x;y/ matrices turn out to lie essentially within a subspace of
much smaller dimension. The latter property is clearly seen from a principal component analysis of the setof matrices. We shall also see that the traces of the L.x;y/ matrices yield information close to the LogDetdistance, i.e., information relative to divergence times of sequences.
2.3.1. Principal component analysis of a family of alignments. We are interested in analyzing theposition of the matrices L.x;y/ in the space they span. This may be achieved by means of a principalcomponent analysis.
We consider a family of p alignments of related sequences, and we assume for the sake of simplicitythat there are more pairwise alignments than matrix elements; i.e., p ¸ m2 (the case p · m2 is handledanalogously). Let K denote the “matrix of all matrices” (with p rows and m2 columns), whose rows are them2 matrix coef� cients of the matrices L.x;y/ of the alignments. The principal component decompositionof K reads
K D U6VT ; (16)
388 DEVAUCHELLE ET AL.
whereP
D diag.¾1; : : : ¾m2/ is the diagonal m2 £ m2 matrix of the singular values of K , sorted indecreasing order. We assume that the singular values ¾¯ are multiplicity free. The matrix V is an orthogonalm2 £ m2 matrix, whose columns
v¯ D .V1¯ ; V2¯ : : : Vm2¯/T
form an orthonormal basis of the spaces of the L.x;y/ matrices. The vectors
u¯ D 1¾¯
Kv¯ ; ¯ D 1; : : : m2
form an orthonormal basis of an m2-dimensional subspace of the p-dimensional space of alignments.We notice that the p rows (U6/®¯ of the matrix U 6 represent the m2 coordinates of the alignmentsa D 1; : : : p in the coordinate system provided by the vectors v¯ .
Remark 5. The singular value decomposition is performed by diagonalizing the covariance matrixC D KT K . However, the latter is nothing but the matrix appearing in Equation (15), which may bewritten as
Q D 1
kQk2P
.x;y/ ¿ 2.x;y/
C Q:
When p · m2 (which is the case in the example analyzed in Section 3 below), the singular valuesdecomposition of 6 may be performed as well, with slight modi� cations in the interpretation of theresulting matrices and vectors. In that case, the p matrices L.x;y/ span a p-dimensional subspace of them2-dimensional space of pseudo rate matrices. Only p singular values ¾¯ out of the m2 are nonzero, andonly the corresponding � rst p vectors u¯ and v¯ are of interest.
In most situations we have encountered, the singular values ¾¯ have fast decay rates so that only a fewprincipal directions (i.e., a few vectors v¯ ) are necessary to account for the family of matrices.
Owing to Remark 5, the � rst principal direction, i.e., the vector v1 associated with the top principalvalue ¾1, has a special status: in a reversible Markov model, the projection of an alignment (x; y) (a pointin the p-dimensional space) onto this axis provides a measure of the divergence between the sequences inthe alignment; in other words, it measures the “age” of the considered alignment. As such, it bears somesimilarities to the so-called LogDet distance, which we describe below. The projections onto the otherprincipal directions measure the “dispersion.”
2.3.2. LogDet distance. The LogDet distance has been thoroughly studied and used in the literatureas a measure of “evolutionary distance” between sequences. Such distances are often used as inputs forphylogenetic trees estimations. The LogDet distance is based upon the following simple remark: if A andB are matrices of the form B D eA, then one has log.det.B// D tr.A/, where tr.A/ stands for the traceof the matrix A. In particular, with the same notation as before,
if P D e¿Q; then log.det.P// D ¿ tr.Q/ D ¿
mX
iD1
Qii : (17)
The precise de� nition of the LogDet distance between two sequences x; y is slightly different, as follows(see Lockhart et al. [1994], Steel [1995] and Hillis et al. [1996] for details):
d.x;y/ D ¡ logdet.F.x;y// D ¡mX
iD1
log ¼.x/i ¡ log.det.P.x;y///: (18)
Measuring the LogDet distance or, equivalently, logdet P.x;y/ for several pairwise alignments allows oneto compare the respective “ages” of the alignments, provided they can all be described by the same matricesL.x;y/ , which are all multiples ¿.x;y/Q of a single “generator” Q, or at least by “close” rate matrices Q,
RATE MATRICES FOR ANALYZING PROTEIN SEQUENCES 389
when P.x;y/ ¼ e¿.x;y/Q. In such a situation, the matrices L.x;y/ should be nearly proportional to Q, and theLogDet distance would provide an estimate for ¿.x;y/ .
Therefore, LogDet distances provide a piece of information similar to the one carried by the projectionof the matrices L.x;y/ onto the � rst principal axis in a principal component analysis.
2.4. Matrices associated with a continuous Markov chain model for sequence evolution
The methods described above are strongly inspired by Markov chain models. We brie� y describe herethe main ingredients of such models and some widely used procedures, namely maximum likelihoodestimation and LogDet correction. We then discuss the behavior of the matrices P.x;y/ and L.x;y/ in theframework of such models.
2.4.1. Maximum likelihood estimation; LogDet correction. In the simplest model, protein sequencesare assumed to consist of independent random variables taking values in a � nite state space (the m D 20amino acids) whose (identically distributed) evolutions are governed by a reversible continuous time Markovchain. The latter is completely speci� ed by a rate matrix Q (see Appendix A for de� nitions) and initialfrequencies ¼i , generally taken to be the equilibrium frequencies of the Markov chain: one writes P D eQ,P¿ D e¿Q, and the family P¿ D .¿ ¸ 0/ has a limit M as ¿ ! 1 such that Mij D ¼j for all i; j . Whenthe Markov chain is reversible, the matrix F.¿ / D 5P¿ is symmetric for all ¿ .
Given a multiple alignment, it is customary to model its evolution using a binary tree whose leaves arethe present-day sequences, whose vertices (nodes) represent ancestors, and whose edges represent Markovevolution. The parameters of the model (namely, the transition matrices and the topology of the tree) arethen estimated numerically using maximum likelihood (Felsenstein, 1981) or Bayesian methods (see, e.g.,Durbin et al. [1998]). In the simplest situation, all transition matrices are supposed to be of the form e¿Q,where ¿ is the edge length (divergence time) and where Q is a “universal” rate matrix (the generator ofthe model). The distribution of the estimators (the generator Q and the edge lengths ¿ ) is estimated bybootstrap simulations and yields indications of the signi� cance of the results. It is important to realize thatthe computational burden grows exponentially with the number of sequences, and alternative strategieshave to be used for very large families of sequences.
In a very similar context, the LogDet distance method (Lake, 1994; Lockhart et al., 1994) provideestimates for the edge lengths. It may be shown (see Tavaré, 1986) that, under the reversible Markov modelassumptions, the LogDet distances provide unbiased estimators for the edge lengths and are asymptoticallynormally distributed. We shall see below how distances similar to LogDet distances appear naturally inour context.
2.4.2. Behavior of the P and L matrices. If a reversible Markov chain is used to model a pairwisealignment (x; y) of protein sequences, one can easily show that the matrix P.x;y/ de� ned in (5) is amaximum likelihood estimator for the transition matrix P¿ of the alignment (see, for example, Lee et al.[1970] in the nonreversible case; the modi� cation for the reversible case is straightforward). If a Markovchain on a binary tree is used to describe a multiple alignment, one obtains similarly estimators for thecorresponding transition matrices.
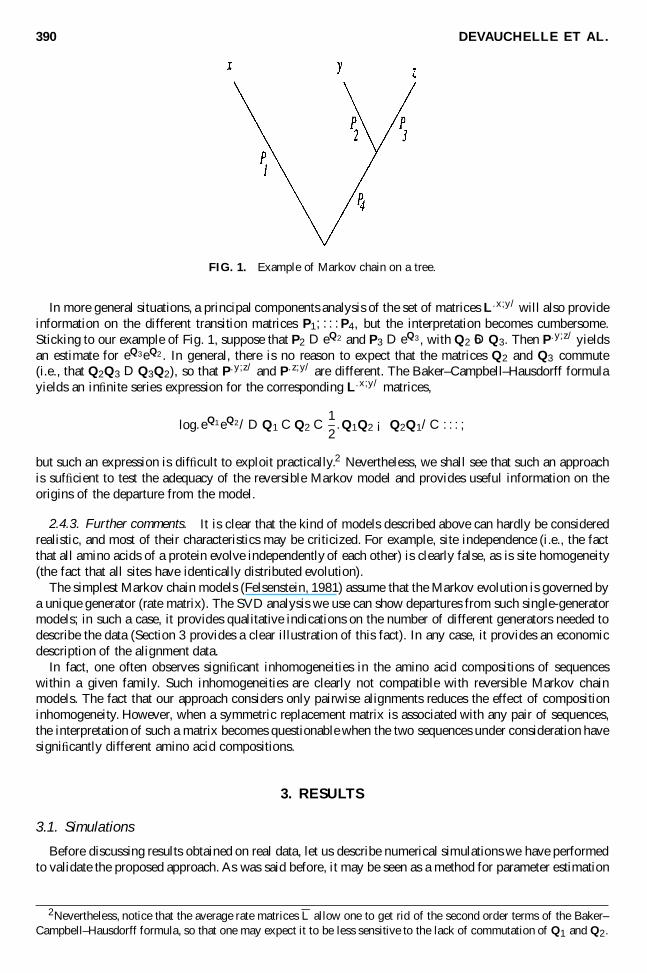
As an illustration, let us consider a simple tree associated with three sequences, say x, y, and z andcorresponding transition matrices P1, P2, P3, and P4 as indicated in Fig. 1, assumed to correspond toMarkov chains. For the sake of simplicity, we also assume that the chains are reversible. It is easily seenthat the transition matrix P.x;y/ corresponding to the alignment (x; y) yields an estimate for the matrixP1P4P2. Similarly, the transition matrix P.x;z/ corresponding to the alignment (x; z) yields an estimate forthe matrix P1P4P3, and the transition matrix P.y;z/ corresponding to the alignment (y; z) yields an estimatefor the matrix P2P3.
If we assume in addition that the matrices Pi are of the form Pi D e¿iQ, then P.x;y/ yields an estimatefor e.¿1C¿2C¿4/Q, P.x;z/ yields an estimate for e.¿1C¿3C¿4/Q, and P.y;z/ yields an estimate for e.¿2C¿3/Q. Inother words, L.x;y/ yields an estimate for .¿1 C ¿2 C ¿4/Q and so forth.
Therefore, using LogDet distances on those matrices provides estimates for the times ¿1; : : : ¿4. Inaddition, a more systematic (principal components) analysis of the matrices L.x;y/ provides an estimate forthe generator Q (see below). The numerical simulations presented in the next section provide an exampleof parameter estimation using our approach.
390 DEVAUCHELLE ET AL.
FIG. 1. Example of Markov chain on a tree.
In more general situations, a principal components analysis of the set of matrices L.x;y/ will also provideinformation on the different transition matrices P1; : : : P4, but the interpretation becomes cumbersome.Sticking to our example of Fig. 1, suppose that P2 D eQ2 and P3 D eQ3 , with Q2 6D Q3. Then P.y;z/ yieldsan estimate for eQ3eQ2 . In general, there is no reason to expect that the matrices Q2 and Q3 commute(i.e., that Q2Q3 D Q3Q2), so that P.y;z/ and P.z;y/ are different. The Baker–Campbell–Hausdorff formulayields an in� nite series expression for the corresponding L.x;y/ matrices,
log.eQ1 eQ2/ D Q1 C Q2 C 12
.Q1Q2 ¡ Q2Q1/ C : : : ;
but such an expression is dif� cult to exploit practically.2 Nevertheless, we shall see that such an approachis suf� cient to test the adequacy of the reversible Markov model and provides useful information on theorigins of the departure from the model.
2.4.3. Further comments. It is clear that the kind of models described above can hardly be consideredrealistic, and most of their characteristics may be criticized. For example, site independence (i.e., the factthat all amino acids of a protein evolve independently of each other) is clearly false, as is site homogeneity(the fact that all sites have identically distributed evolution).
The simplest Markov chain models (Felsenstein, 1981) assume that the Markov evolution is governed bya unique generator (rate matrix). The SVD analysis we use can show departures from such single-generatormodels; in such a case, it provides qualitative indications on the number of different generators needed todescribe the data (Section 3 provides a clear illustration of this fact). In any case, it provides an economicdescription of the alignment data.
In fact, one often observes signi� cant inhomogeneities in the amino acid compositions of sequenceswithin a given family. Such inhomogeneities are clearly not compatible with reversible Markov chainmodels. The fact that our approach considers only pairwise alignments reduces the effect of compositioninhomogeneity. However, when a symmetric replacement matrix is associated with any pair of sequences,the interpretation of such a matrix becomes questionable when the two sequences under consideration havesigni� cantly different amino acid compositions.
3. RESULTS
3.1. Simulations
Before discussing results obtained on real data, let us describe numerical simulations we have performedto validate the proposed approach. As was said before, it may be seen as a method for parameter estimation
2Nevertheless, notice that the average rate matrices L allow one to get rid of the second order terms of the Baker–Campbell–Hausdorff formula, so that one may expect it to be less sensitive to the lack of commutation of Q1 and Q2.
RATE MATRICES FOR ANALYZING PROTEIN SEQUENCES 391
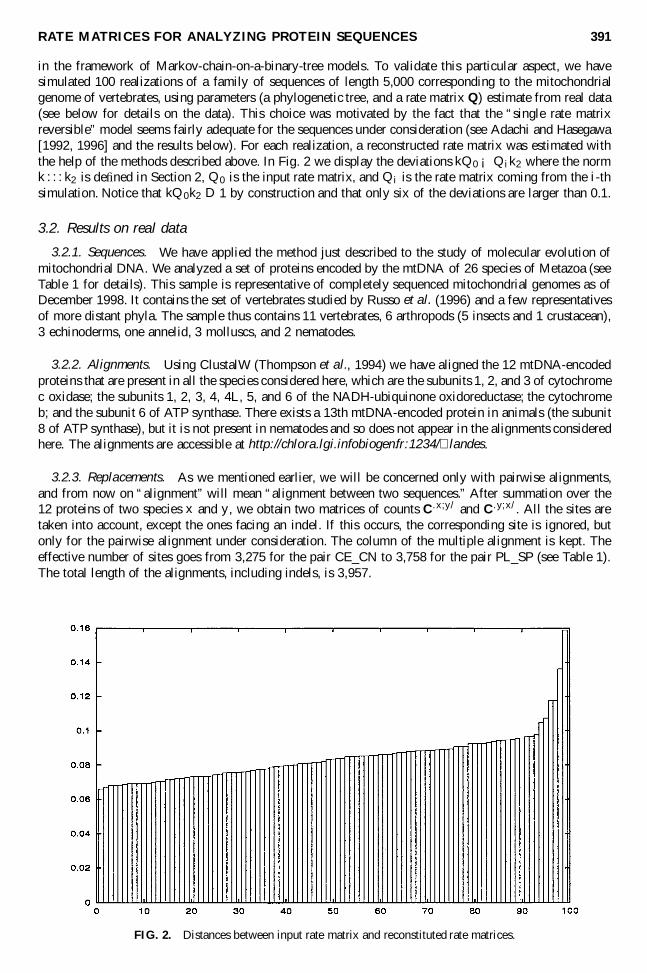
in the framework of Markov-chain-on-a-binary-tree models. To validate this particular aspect, we havesimulated 100 realizations of a family of sequences of length 5,000 corresponding to the mitochondrialgenome of vertebrates, using parameters (a phylogenetic tree, and a rate matrix Q) estimate from real data(see below for details on the data). This choice was motivated by the fact that the “single rate matrixreversible” model seems fairly adequate for the sequences under consideration (see Adachi and Hasegawa[1992, 1996] and the results below). For each realization, a reconstructed rate matrix was estimated withthe help of the methods described above. In Fig. 2 we display the deviations kQ0 ¡ Qik2 where the normk : : : k2 is de� ned in Section 2, Q0 is the input rate matrix, and Qi is the rate matrix coming from the i-thsimulation. Notice that kQ0k2 D 1 by construction and that only six of the deviations are larger than 0.1.
3.2. Results on real data
3.2.1. Sequences. We have applied the method just described to the study of molecular evolution ofmitochondrial DNA. We analyzed a set of proteins encoded by the mtDNA of 26 species of Metazoa (seeTable 1 for details). This sample is representative of completely sequenced mitochondrial genomes as ofDecember 1998. It contains the set of vertebrates studied by Russo et al. (1996) and a few representativesof more distant phyla. The sample thus contains 11 vertebrates, 6 arthropods (5 insects and 1 crustacean),3 echinoderms, one annelid, 3 molluscs, and 2 nematodes.
3.2.2. Alignments. Using ClustalW (Thompson et al., 1994) we have aligned the 12 mtDNA-encodedproteins that are present in all the species considered here, which are the subunits 1, 2, and 3 of cytochromec oxidase; the subunits 1, 2, 3, 4, 4L, 5, and 6 of the NADH-ubiquinone oxidoreductase; the cytochromeb; and the subunit 6 of ATP synthase. There exists a 13th mtDNA-encoded protein in animals (the subunit8 of ATP synthase), but it is not present in nematodes and so does not appear in the alignments consideredhere. The alignments are accessible at http://chlora.lgi.infobiogen.fr:1234/»landes.
3.2.3. Replacements. As we mentioned earlier, we will be concerned only with pairwise alignments,and from now on “alignment” will mean “alignment between two sequences.” After summation over the12 proteins of two species x and y, we obtain two matrices of counts C.x;y/ and C.y;x/. All the sites aretaken into account, except the ones facing an indel. If this occurs, the corresponding site is ignored, butonly for the pairwise alignment under consideration. The column of the multiple alignment is kept. Theeffective number of sites goes from 3,275 for the pair CE_CN to 3,758 for the pair PL_SP (see Table 1).The total length of the alignments, including indels, is 3,957.
FIG. 2. Distances between input rate matrix and reconstituted rate matrices.
392 DEVAUCHELLE ET AL.
Table 1. Set of Complete Mitochondrial Genomes Analysed
EMBLaccession
Abbr.a Scienti� c name Short name number Taxa
BT Bos taurus cow V00654 Chordata (M)b
BM Balaenoptera musculus blue whale X72204 Chordata (M)BP Balaenoptera physalus � n whale X61145 Chordata (M)MM Mus musculus house mouse J01420 Chordata (M)RM Rattus norvegicus Norway rat X14848 Chordata (M)DV Didelphis virginiana North American opossum Z29573 Chordata (M)GG Gallus gallus chicken X52392 ChordataXL Xenopus laevis African clawed frog M10217 ChordataCL Crossostoma lacustre oriental steam loach M91245 Chordata (T)c
CC Cyprinus carpio common carp X61010 Chordata (T)OM Onchorhynchus mykiss rainbow trout L29771 Chordata (T)DL Drosophila melanogaster fruit � y U37541 Arthropoda (D)d
DY Drosophila yakuba X03240 Arthropoda (D)AG Anopheles gambiae African malaria mosquito L20934 Arthropoda (D)AQ Anopheles quadrimaculatus L04272 Arthropoda (D)LM Locusta migratoria migratory locust X80245 ArthropodaAF Artemia franciscana brine shrimps X69067 ArthropodaFS Florometra sarratissima crinoid � orometra AF049132 EchinodermataSP Strongylocentrotus purpuratus purple sea urchin X12631 EchinodermataPL Paracentrotus lividus common urchin J04815 EchinodermataLT Lumbricus terrestris common earthworm U24570 AnnelidaKT Katharina tunicata black chiton U09810 MolluscaCN Cepaea nemoralis banded wood snail U23045 MolluscaAC Albinaria caerulea land snail X83390 MolluscaCE Caenorhabditis elegans nematode X54252 NematodaAS Ascaris suum pig roundworm X54253 Nematoda
aAbbr: abbreviationbM: mammaliacT: teleosteidD: diptera
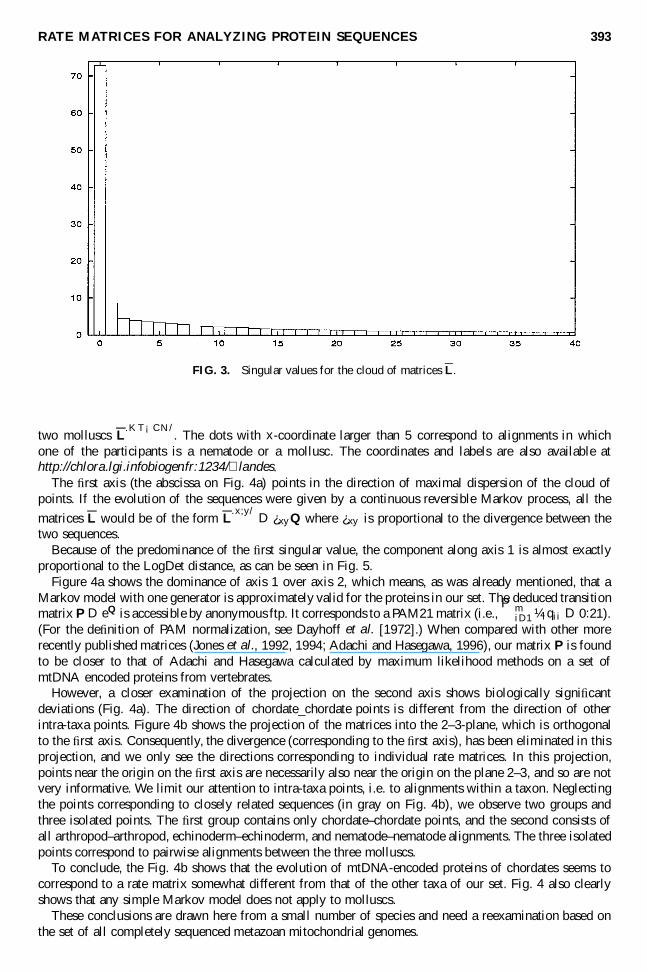
3.2.4. The matrices P, L and L. For the set of alignments under consideration, the matrices P.x;y/ canbe calculated for all the 650 D 26 ¤ 25 pairs of sequences. This means that the alignment data satisfyconditions (5) and (7). The percentage of identity of the pairwise alignments varies between 32.2 and 97.1.The majority of alignments are outside the “one mutation” limit of Dayhoff (Dayhoff et al., 1983; Joneset al., 1992) which requires at least 85% identity. However, all the matrices P.x;y/ are suf� ciently close tothe identity in the sense of (7), so that their logarithms can be calculated. As we saw before, the matrices L(or L) can be viewed as points in a space of 400 dimensions. However, this cloud of points is contained to avery good approximation in a space of much lower dimension. This can be seen by a principal componentanalysis, described in Section 2.3.1. In this paper, we chose to focus on the average rate matrices. The� rst 40 singular values (in decreasing order) are plotted in Fig. 3. The � rst one is signi� cantly larger thanthe following ones. This shows that a Markov model for protein sequences is adequate, but not very good.The matrices L are close to a half-line through the origin corresponding to a single generator. We shallnow see, however, that there are systematic deviations from this global conclusion.
3.3. SVD analysis of the matrices L
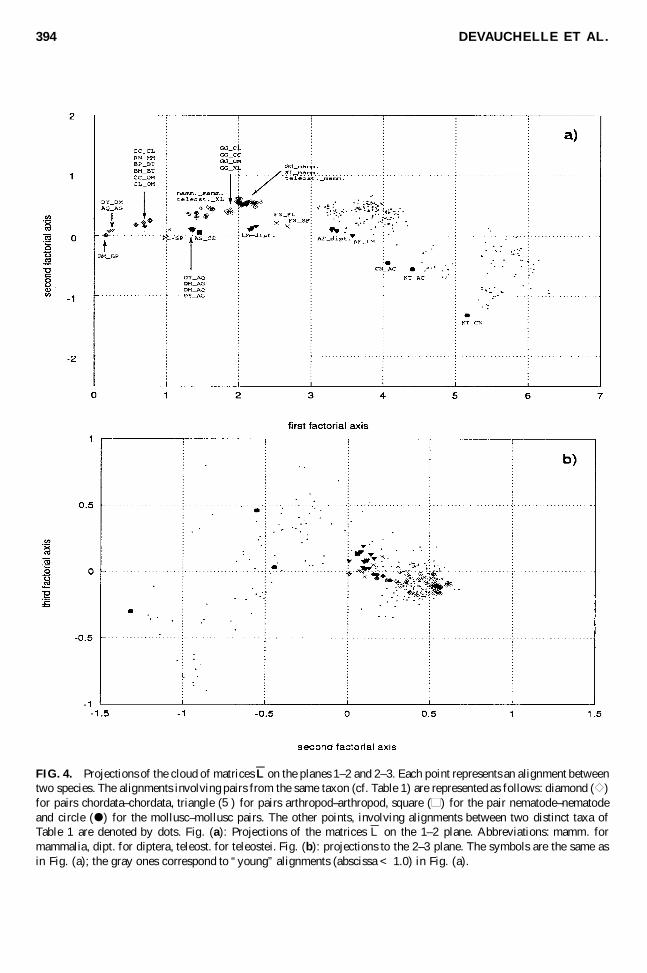
Figure 4 gives the projections of the 325 D 26 ¤ 25=2 matrices L into the 1–2-plane (Fig. 4a) andthe 2–3-plane (Fig. 4b) of the PCA. Points corresponding to alignments within a taxon are identi� ed byspeci� c symbols, and alignments involving two different taxons are represented by dots. So in Fig. 4A,the symbol furthest to the left corresponds to an alignment between two chordata and, more speci� cally,between two whales L
.BP ¡BM/. The solid circle furthest to the right describes the alignment between
RATE MATRICES FOR ANALYZING PROTEIN SEQUENCES 393
FIG. 3. Singular values for the cloud of matrices L.
two molluscs L.KT ¡CN/
. The dots with x-coordinate larger than 5 correspond to alignments in whichone of the participants is a nematode or a mollusc. The coordinates and labels are also available athttp://chlora.lgi.infobiogen.fr:1234/»landes.
The � rst axis (the abscissa on Fig. 4a) points in the direction of maximal dispersion of the cloud ofpoints. If the evolution of the sequences were given by a continuous reversible Markov process, all the
matrices L would be of the form L.x;y/ D ¿xyQ where ¿xy is proportional to the divergence between the
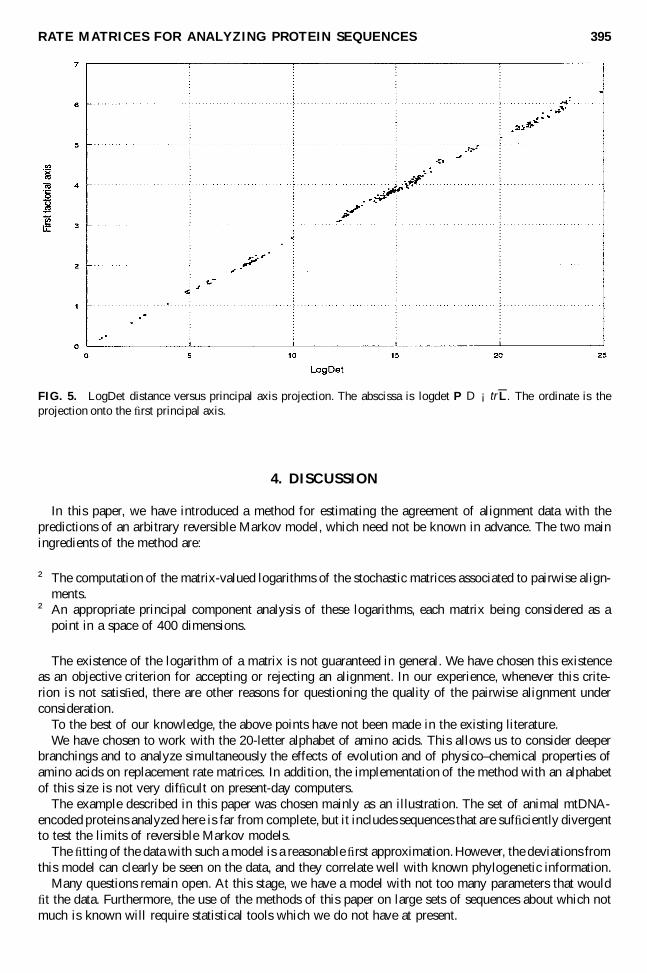
two sequences.Because of the predominance of the � rst singular value, the component along axis 1 is almost exactly
proportional to the LogDet distance, as can be seen in Fig. 5.Figure 4a shows the dominance of axis 1 over axis 2, which means, as was already mentioned, that a
Markov model with one generator is approximately valid for the proteins in our set. The deduced transitionmatrix P D eQ is accessible by anonymous ftp. It corresponds to a PAM21 matrix (i.e.,
PmiD1 ¼iqii D 0:21).
(For the de� nition of PAM normalization, see Dayhoff et al. [1972].) When compared with other morerecently published matrices (Jones et al., 1992, 1994; Adachi and Hasegawa, 1996), our matrix P is foundto be closer to that of Adachi and Hasegawa calculated by maximum likelihood methods on a set ofmtDNA encoded proteins from vertebrates.
However, a closer examination of the projection on the second axis shows biologically signi� cantdeviations (Fig. 4a). The direction of chordate_chordate points is different from the direction of otherintra-taxa points. Figure 4b shows the projection of the matrices into the 2–3-plane, which is orthogonalto the � rst axis. Consequently, the divergence (corresponding to the � rst axis), has been eliminated in thisprojection, and we only see the directions corresponding to individual rate matrices. In this projection,points near the origin on the � rst axis are necessarily also near the origin on the plane 2–3, and so are notvery informative. We limit our attention to intra-taxa points, i.e. to alignments within a taxon. Neglectingthe points corresponding to closely related sequences (in gray on Fig. 4b), we observe two groups andthree isolated points. The � rst group contains only chordate–chordate points, and the second consists ofall arthropod–arthropod, echinoderm–echinoderm, and nematode–nematode alignments. The three isolatedpoints correspond to pairwise alignments between the three molluscs.
To conclude, the Fig. 4b shows that the evolution of mtDNA-encoded proteins of chordates seems tocorrespond to a rate matrix somewhat different from that of the other taxa of our set. Fig. 4 also clearlyshows that any simple Markov model does not apply to molluscs.
These conclusions are drawn here from a small number of species and need a reexamination based onthe set of all completely sequenced metazoan mitochondrial genomes.
394 DEVAUCHELLE ET AL.
FIG. 4. Projections of the cloud of matrices L on the planes 1–2 and 2–3. Each point represents an alignment betweentwo species. The alignments involving pairs from the same taxon (cf. Table 1) are represented as follows: diamond ( e )for pairs chordata–chordata, triangle (5) for pairs arthropod–arthropod, square (h ) for the pair nematode–nematodeand circle ( d ) for the mollusc–mollusc pairs. The other points, involving alignments between two distinct taxa ofTable 1 are denoted by dots. Fig. (a): Projections of the matrices L on the 1–2 plane. Abbreviations: mamm. formammalia, dipt. for diptera, teleost. for teleostei. Fig. (b): projections to the 2–3 plane. The symbols are the same asin Fig. (a); the gray ones correspond to “young” alignments (abscissa < 1.0) in Fig. (a).
RATE MATRICES FOR ANALYZING PROTEIN SEQUENCES 395
FIG. 5. LogDet distance versus principal axis projection. The abscissa is logdet P D ¡trL. The ordinate is theprojection onto the � rst principal axis.
4. DISCUSSION
In this paper, we have introduced a method for estimating the agreement of alignment data with thepredictions of an arbitrary reversible Markov model, which need not be known in advance. The two mainingredients of the method are:
² The computation of the matrix-valued logarithms of the stochastic matrices associated to pairwise align-ments.
² An appropriate principal component analysis of these logarithms, each matrix being considered as apoint in a space of 400 dimensions.
The existence of the logarithm of a matrix is not guaranteed in general. We have chosen this existenceas an objective criterion for accepting or rejecting an alignment. In our experience, whenever this crite-rion is not satis� ed, there are other reasons for questioning the quality of the pairwise alignment underconsideration.
To the best of our knowledge, the above points have not been made in the existing literature.We have chosen to work with the 20-letter alphabet of amino acids. This allows us to consider deeper
branchings and to analyze simultaneously the effects of evolution and of physico–chemical properties ofamino acids on replacement rate matrices. In addition, the implementation of the method with an alphabetof this size is not very dif� cult on present-day computers.
The example described in this paper was chosen mainly as an illustration. The set of animal mtDNA-encoded proteins analyzed here is far from complete, but it includes sequences that are suf� ciently divergentto test the limits of reversible Markov models.
The � tting of the data with such a model is a reasonable � rst approximation.However, the deviations fromthis model can clearly be seen on the data, and they correlate well with known phylogenetic information.
Many questions remain open. At this stage, we have a model with not too many parameters that would� t the data. Furthermore, the use of the methods of this paper on large sets of sequences about which notmuch is known will require statistical tools which we do not have at present.
396 DEVAUCHELLE ET AL.
APPENDIX A: STOCHASTIC AND RATE MATRICES,THE EMBEDDING PROBLEM
A rate matrix is a square m £ m matrix Q such thatPm
jD1 Qij D 0 for all i, Qii · 0 for all i, andQij ¸ 0 for all i 6D j . A square matrix which satis� es the � rst two properties above and fails to satisfy thethird one is called a pseudo-rate matrix. A stochastic matrix (or transition matrix, or Markov matrix) is anm £ m matrix P such that 0 · Pij · 1 for all i, j and
PmjD1 Pij D 1 for all i . In general, the eigenvalues
of a transition matrix are complex numbers of modulus smaller than or equal to 1.A Markov semigroup is a family of stochastic matrices t 2 RC ! P.t / satisfying the Chapman–
Kolmogorov equation P.t /P.t 0/ D P.t C t 0/, and such that for all i, j , P .0/ij D ±ij and limt!0 P .0/ii D 1.Given a Markov semigroup, there exists a matrix Q D P0.0/ such that P.t/ D etQ and Q is a rate matrix.
It is well known (see, e.g., Freeman [1967]) that if Q is a rate matrix, then the exponentials expftQg,where t 2 RC, form a Markov semigroup. The opposite question is interesting too: given a stochastic matrixP, does there exist a corresponding Markov semigroup t ! P.t/ such that P D P.1/? or, equivalently,does there exist a rate matrix Q such that P D eQ? When this is so, the matrix P is said to be embeddableinto a Markov semigroup, or simply embeddable. Characterizations of embeddability have been given inthe case of 2 £ 2 and 3 £ 3 stochastic matrices (see Carette [1995] and references therein). For example, a2 £ 2 stochastic matrix P is embeddable if and only if its determinant is positive. To our knowledge, theproblem in arbitrary dimension is open.
Let P be a general m£m stochastic matrix and assume that the matrix logarithm L D logP of P de� nedin (6) exists. Then one may write P D eL, but L need not be a rate matrix. Letting v D .1; 1; : : : 1/T 2 Rm,we have Pv D v, so that Lv D 0. In other words,
PmjD1 Lij D 0, and L is a pseudo-rate matrix. However,
we do not necessarily have Lij ¸ 0 for all i 6D j .The analysis of the latter condition is simpler in cases where the matrix P corresponds to a reversible
Markov chain. This is discussed below.
APPENDIX B: SYMMETRIZATION AND CONSEQUENCES
B.1. Some consequences of symmetrization
A simple symmetrization procedure may yield signi� cant simpli� cations. We describe here the mathe-matical aspects of symmetrization, limiting our analysis to sequences which are suf� ciently close as de� nedin De� nition 2.
Let us then consider a pair of close sequences (x; y); for the sake of simplicity, we drop the superscript“.x;y/” in what follows. Since Q5 is nonsingular, the matrix S de� ned by
S D Q5¡1=2 QF Q5¡1=2 (19)
is a symmetric matrix. In addition, we have that
QP D Q5¡1 QF D Q5¡1=2S Q51=2:
Therefore, QP is similar to the symmetric matrix S and has the same (real) eigenvalues. Let us denote by¸1; ¸2; : : : ¸m those eigenvalues, sorted by decreasing order. Since QP is the transition matrix of a reversibleMarkov chain, it follows that ¸i 2 .0; 1] for all i , and ¸1 D 1.
Assume that all the eigenvalues ¸i are distinct from each other. Then there exists a unique (up to a sign)orthogonal matrix R such that
S D RT 3R D R¡13R; (20)
where 3 D diag.¸1; : : : ¸m/ is the diagonal form of S, and the subscript T denotes matrix transposition.We then obtain immediately
QP D Q5¡1=2RT 3R Q51=2: (21)
RATE MATRICES FOR ANALYZING PROTEIN SEQUENCES 397
The rows of the matrix R Q51=2 are the left eigenvectors of the matrix QP, and in particular, the � rst row ofR Q51=2 is the vector of frequencies .¼1; : : : ¼m/.
Once the matrices R and 3 are known, matrix-valued functions of QP may be computed easily. Forexample, the square QP2 of QP reads
QP2 D Q5¡1=2RT 32R Q51=2;
and more generally, for any positive real number ¿ , one may compute the ¿ -th power QP¿ of QP:
QP¿ D Q5¡1=2RT 3¿ R Q51=2; (22)
where 3¿ D diag.¸¿1 ; : : : ¸¿
m/ is the diagonal matrix of the ¿ -th powers of the eigenvalues of QP. Incomponents notation, we obtain
. QP ¿ /ij Dr
¼j
¼i
mX
kD1
RkiRkj ¸¿k : (23)
Another important example in what follows is the matrix-valued logarithm QL D log. QP/. QL may becomputed easily using the decomposition (21):
QL D log. QP/ D Q5¡1=2 log.S/ Q51=2 D Q5¡1=2RT log.3/R Q51=2; (24)
where log.3/ D diag.log.¸1/; : : : log.¸m// is the diagonal matrix of logarithms of eigenvalues of QP. Thematrix QL so obtained is a pseudo-rate matrix, as de� ned in Appendix A.
Remark 6. Let us stress that the above diagonalizations make all the matrix calculations (logarithms,powers, : : :) extremely ef� cient, as may be seen from (24) in the case of the logarithm, for example.
B.2. Remarks on rate and pseudo-rate matrices in the symmetrized case
As we have seen above, the logarithm QL D log QP of the transition matrix associated to a pair of closesequences is a pseudo-rate matrix; however, QL is not a rate matrix in general, so that it does not necessarilymake sense to consider matrices QP¿ as transition matrices for arbitrary positive values of ¿ . We now discussthat point in some detail.
Proposition 1. Let QP be the transition matrix associated with a pair of close sequences, with the samenotations as above. Let ¿ > 0, and let M D QP¿ .
1. The matrix element Mij is positive if and only if
¡mX
kD2
RkiRkj ¸¿k <
p¼i¼j : (25)
2. IfmX
kD2
¸¿k <
p¼i¼j ; (26)
then Mij > 0.
The proof is a consequence of the expression of the matrix element Mij (see Eq. [23]). We know that therows of R51=2 are the left eigenvectors of P , and in particular the � rst row .R51=2/i1 is proportional
398 DEVAUCHELLE ET AL.
to the vector of frequencies .¼1; : : : ¼m/T . Therefore, the � rst column of R equals .p
¼1; : : : ;p
¼m/T , andwe obtain the following expression (recall that ¸1 D 1):
Mij Dr
¼j
¼i
³p
¼i¼j CmX
kD2
RkiRkj ¸¿k
!:
The � rst part of the proposition follows directly from that expression. For the second part, we simplyobserve that, since the columns of the R matrix are orthonormal, ¡1 · Rik · 1 for all i, k. Therefore,¡
PmkD2 RkiRkj ¸¿
k ·Pm
kD2 ¸¿k , which proves the result.
The important consequence is that, since ¸k · 1 for all k ¸ 2 (with strict inequality if the top eigenvalue¸1 is nondegenerate), the function ¿ !
PmkD2 ¸¿
k is monotonically decreasing. Hence, for ¿ large enough,the suf� cient condition above is automatically ful� lled.
5. ACKNOWLEDGMENTS
We would like to thank P. Lockhart, D. Penny, M. Steel, and M. Vingron for helpful comments anddiscussions. We would also like to thank D. Cellier, S. Robin, C. Duby, and J.J. Daudin for their suggestionsabout this work.
REFERENCES
Adachi, J., and Hasegawa, M. 1992. Amino acid substitution of protein coded in mitochondrialDNA during mammalianevolution. Japan J. Genet. 67, 187–197.
Adachi, J., and Hasegawa, M. 1996. Model of amino acid substitution in proteins encoded by mitochondrial DNA. J.Mol. Evol. 42, 459–468.
Barry, D., and Hartigan, J. 1987. Statistical analysis of hominoid molecular evolution. Stat. Sci. 2, 191–210.Carette, P. 1995. Characterization of embeddable 3 £ 3 stochastic matrices with a negative eigenvalue. New York J.
Math. 1, 120–129.Dayhoff, M., Barker, W., and Hunt, L. 1983. Establishing homologies in protein sequences. Methods Enzymol. 91,
524–544.Dayhoff, M., Eck, R., and Park, C. 1972. A model of evolutionary change in proteins. Atlas of Proteins Sequence and
Structure 5, 89–99.Durbin, R., Eddy, S., Krogh, A., and Mitchison, G. 1998. Biological Sequence Analysis: Probabilistic Models of
Proteins and Nucleic Acids, Cambridge University Press, London.Felsenstein, J. 1981. Evolutionary trees from DNA sequences: A maximum likelihood approach. J. Mol. Evol. 17,
368–376.Freeman, D. 1967. Markov Chains, Holden–Day.Hillis, D., Moritz, C., and Mable, B.E. 1996. Molecular Systematics. Sinauer Associates, Sunderland, MA.Jones, D., Taylor, W., and Thornton, J. 1992. The rapid generation of mutation data matrices from protein sequences.
CABIOS 9, 275–282.Jones, D., Taylor, W., and Thornton, J. 1994. A mutation data matrix for transmembrane proteins. FEBS Letters 339,
269–275.Lake, J. 1994. Reconstructing evolutionary trees from DNA and protein sequences: Paralinear distances. Proc. Natl.
Acad. Sci. USA 91, 1455–1459.Lee, T., Judge, G., and Zellner, A. 1970. Estimating the Parameters of the Markov Probability Model from Aggregate
Time Series Data. Contribution to Economic Analysis Series, North Holland.Lockhart, P., Steel, M.A., Hendy, M., and Penny, D. 1994. Recovering evolutionary trees under a more realistic model
of sequence evolution. Mol. Biol. Evol. 11, 605–612.Müller, T., and Vingron. 2000. Modeling amino acid replacement. J. Comp. Biol. 7(6), 761–776.Russo, C.A.M., Takezaki, N., and Nei, M. 1996. Ef� ciencies of different genes and different trees-building methods
in recovering a known vertebrate phylogeny. Mol. Biol. Evol. 13, 525–536.Steel, M.A. 1995. Reconstructing evolutionary trees under a variety of Markov style models, in Tavaré S., ed., Proc.
Phylogeny Workshop, Princeton University, p. 51. DIMACS Technical Report 95-48.
RATE MATRICES FOR ANALYZING PROTEIN SEQUENCES 399
Tavaré, S. 1986. Some probabilisticand statistical problems in the analysis of DNA sequences.Lectures on Mathematicsin Life Sciences 17, 57–86.
Thompson, J., Higgins, D., and Gibson, T. 1994. Clustal W: Improving the sensitivity of progressive multiple sequencealignment through sequence weighting, position speci� c gap penalties and weight matrix choice. Nucl. Acids Res.22, 4673–4680.
Address correspondence to:Claudine Devauchelle
Laboratoire Génome et InformatiqueTour Evry 2
523 Place des Terrasses de l’Agora91034 Evry Cedex, France
E-mail: [email protected]
All in-text references underlined in blue are linked to publications on ResearchGate, letting you access and read them immediately.